2015 Employer Health Benefits Survey
Abstract
The 2016 Employer Health Benefits Survey was released September 14, 2016.
This annual survey of employers provides a detailed look at trends in employer-sponsored health coverage including premiums, employee contributions, cost-sharing provisions, and employer opinions. The 2015 survey included almost 2,000 interviews with non-federal public and private firms.
Annual premiums for employer-sponsored family health coverage reached $17,545 this year, up 4 percent from last year, with workers on average paying $4,955 towards the cost of their coverage, according to the Kaiser Family Foundation/Health Research & Education Trust 2015 Employer Health Benefits Survey. The 2015 survey includes information on the use of incentive for employer wellness programs, plan cost-sharing as well as firm offer rate. Survey results are released here in a variety of ways, including a full report with downloadable tables on a variety of topics, summary of findings, and an article published in the journal Health Affairs.
News Release
- A news release announcing the publication of the 2015 Employer Health Benefits Survey is available here.
Summary of Findings
- The Summary of Findings provides an overview of the 2015 survey results and is available under the Summary of Findings tab.
Full Report
- The complete Employer Health Benefits Survey Report includes over 200 exhibits and is available under the Report tab. The Report tab contains 14 separate sections. Users can view each section separately or download the section exhibits from the bottom of the respective section page.
Health Affairs
- The peer-reviewed journal Health Affairs has published an article with key findings from the 2015 survey: Health Benefits in 2015: Stable Trends in the Employer Market.
Web Briefing
- Coming soon: On Tuesday September 22, 2015, the Kaiser Family Foundation and the Health Research & Educational Trust (HRET) held a reporters-only web briefing to release the 2015 Employer Health Benefits Survey.
Interactive Graphic
- This graphing tool allows users to look at changes in premiums and worker contributions for covered workers at different types of firms over time: Premiums and Worker Contributions Among Workers Covered by Employer-Sponsored Coverage, 1999-2015.
Key Exhibits – Chartpack
- Over twenty overview slides from the 2015 Employer Health Benefits Survey are available as a slideshow or PDF.
Additional Resources
- Standard errors for selected estimates are available in the Technical Supplement here.
- Employer Health Benefits Surveys from 1998-2014 are available here. Please note that historic survey reports have not been revised with methodological changes.
- Researchers may request for a public use dataset by going to Contact Us and choosing “TOPIC: Health Costs.”
Researchers at the Kaiser Family Foundation, NORC at the University of Chicago, and Health Research & Educational Trust designed and analyzed the survey.
Summary of Findings
Summary Of Findings
Employer-sponsored insurance covers over half of the non-elderly population, 147 million people in total.1 To provide current information about employer-sponsored health benefits, the Kaiser Family Foundation (Kaiser) and the Health Research & Educational Trust (HRET) conduct an annual survey of private and nonfederal public employers with three or more workers. This is the seventeenth Kaiser/HRET survey and reflects employer-sponsored health benefits in 2015.
The key findings from the survey, conducted from January through June 2015, include a modest increase (4%) in the average premiums for both single and family coverage in the past year. The average annual single coverage premium is $6,251 and the average family coverage premium is $17,545. The percentage of firms that offer health benefits to at least some of their employees (57%) and the percentage of workers covered at those firms (63%) are statistically unchanged from 2014. Relatively small percentages of employers with 50 or more full-time equivalent employees reported switching full-time employees to part time status (4%), changing part-time workers to full-time workers (10%), reducing the number of full-time employees they intended to hire (5%) or increasing waiting periods (2%) in response to the employer shared responsibility provision which took effect for some firms this year. Employers continue to be interested in programs addressing the health and behaviors of their employees, such as health risk assessments, biometric screenings, and health promotion and wellness programs. Meaningful numbers of employers which offer one of these screening programs now offer incentives to employees who complete them; 31% of large firms offering health benefits provide an incentive to complete a health risk assessment and 28% provide an incentive to complete a biometric screening. A majority of large employers (200 or more workers) (53%) have analyzed their health benefits to see if they would be subject to the high-cost plan tax when it takes effect in 2018, with some already making changes to their benefit plans in response to the tax.
HEALTH INSURANCE PREMIUMS AND WORKER CONTRIBUTIONS
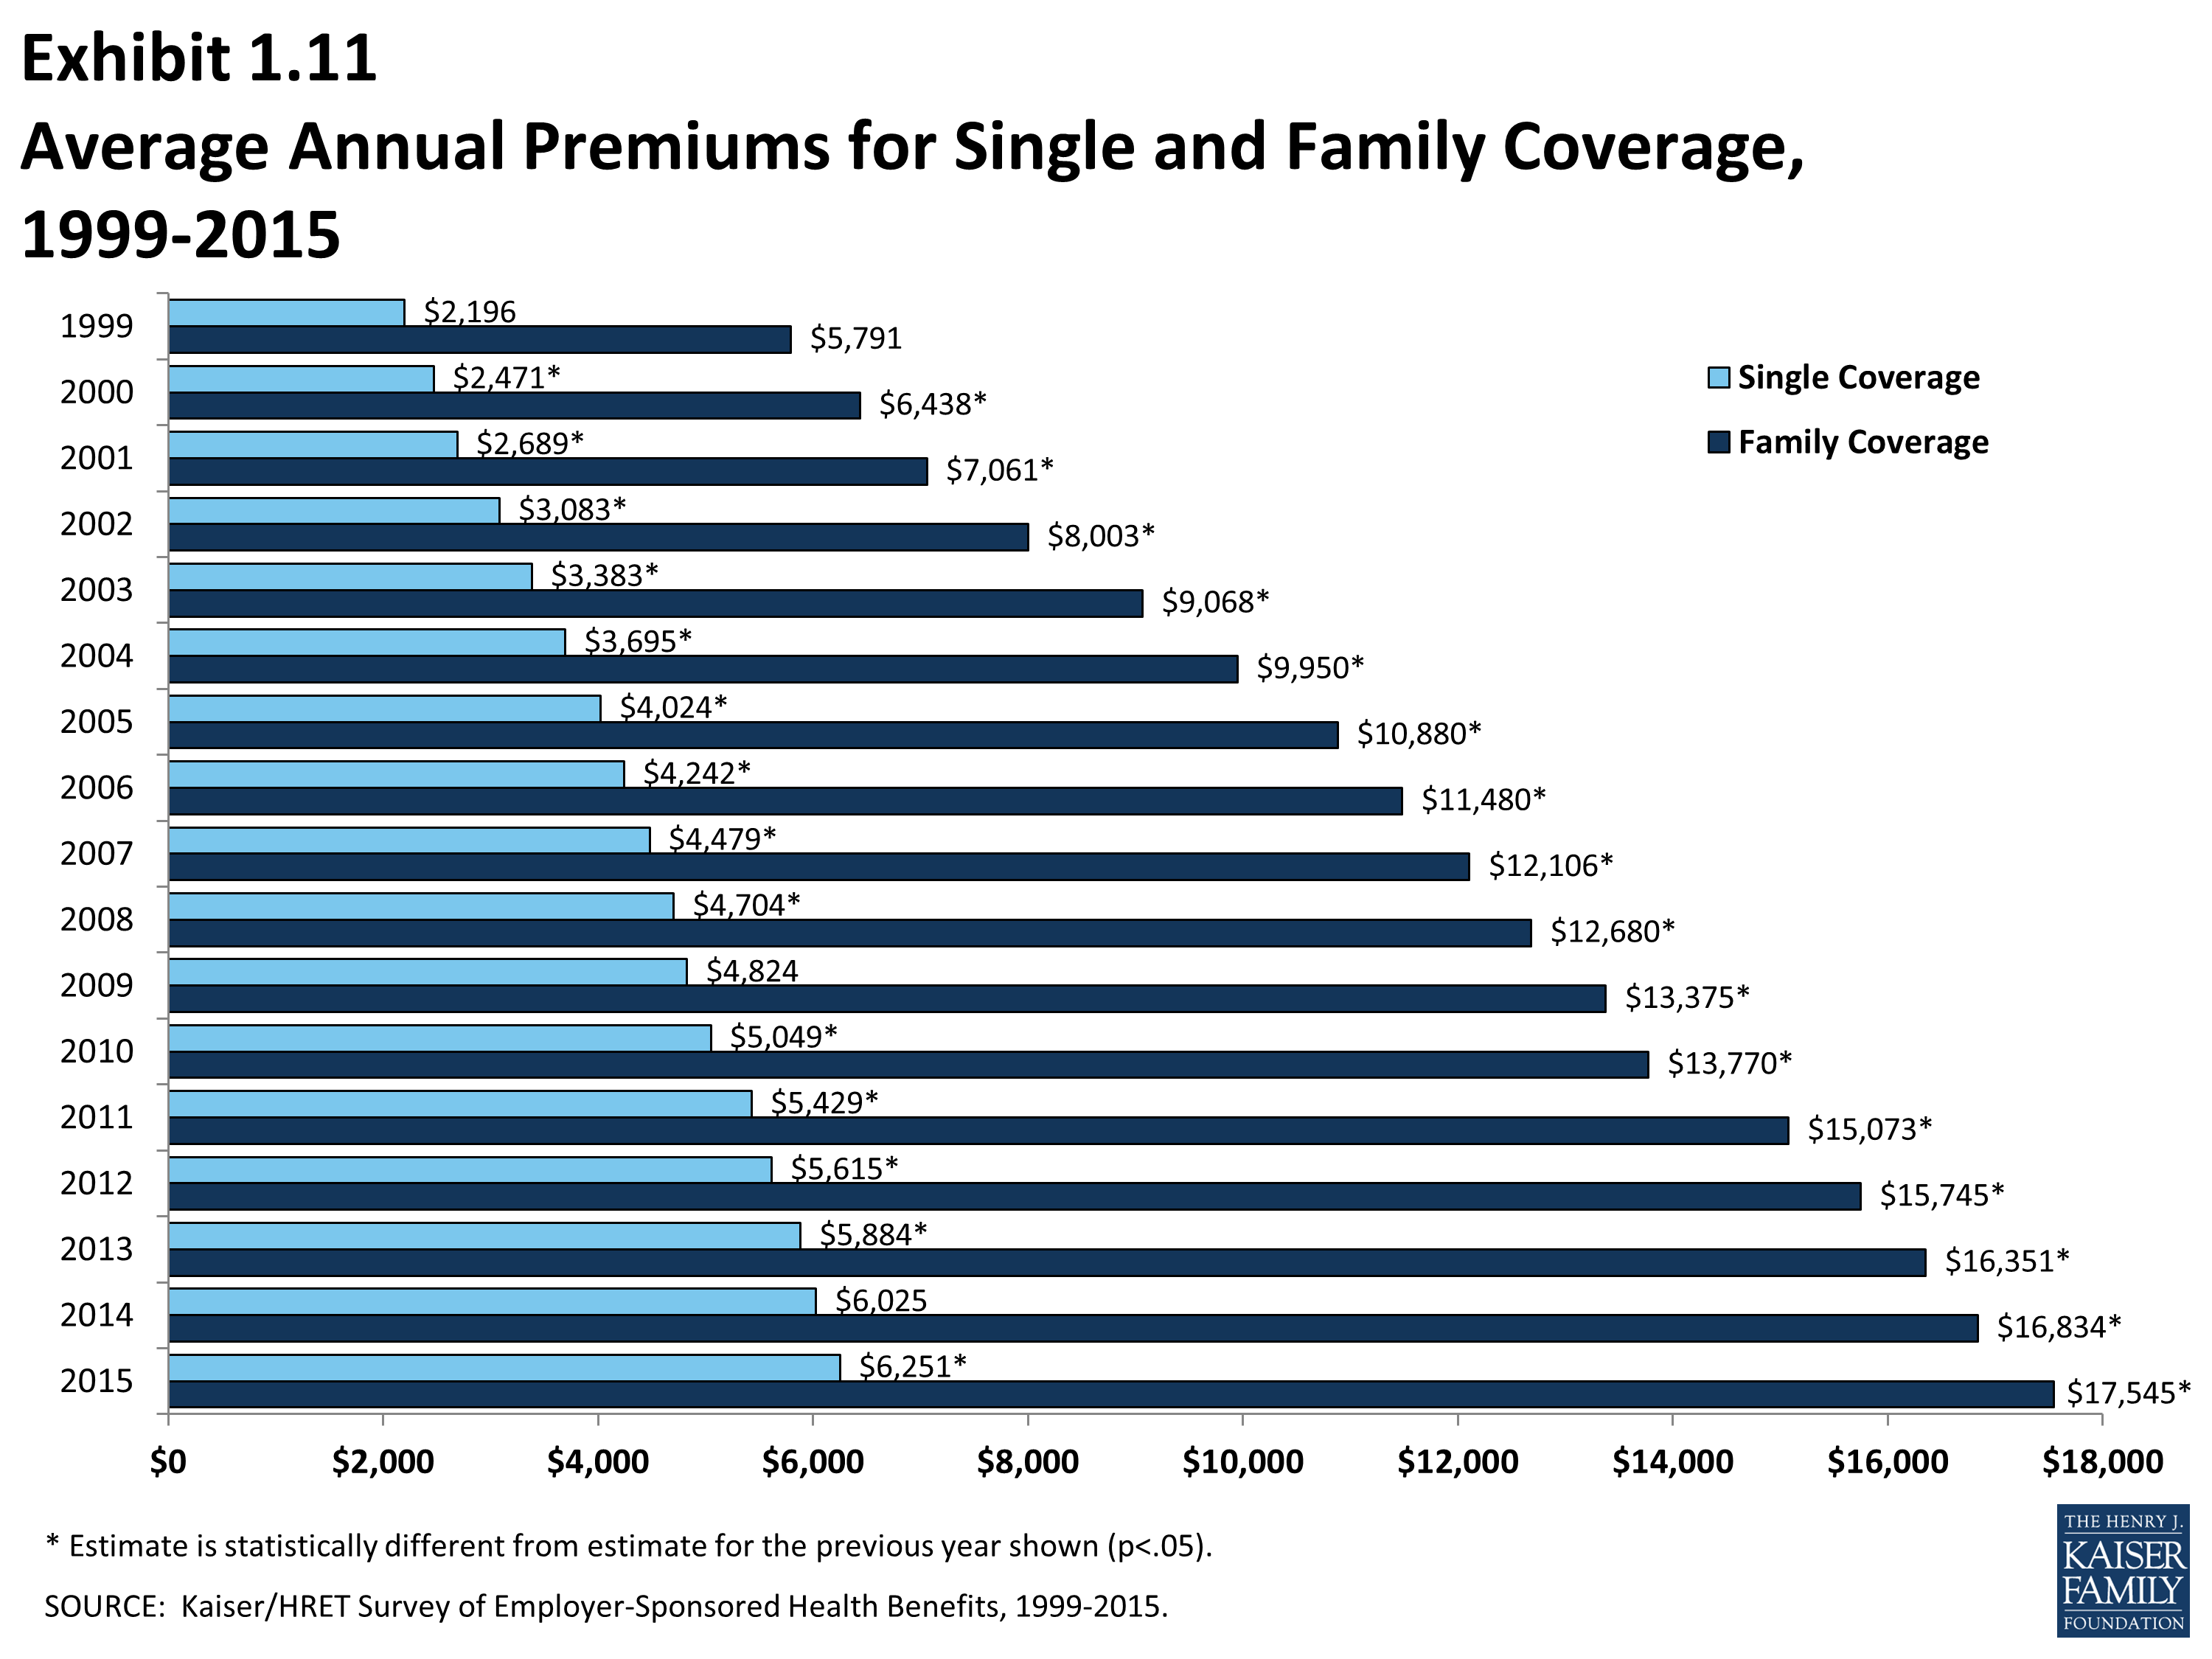
In 2015, the average annual premiums for employer-sponsored health insurance are $6,251 for single coverage and $17,545 for family coverage (Exhibit A). Each rose 4% over the 2014 average premiums. During the same period, workers’ wages increased 1.9% and inflation declined by 0.2%.2 Premiums for family coverage increased 27% during the last five years, the same rate they grew between 2005 and 2010 but significantly less than they did between 2000 to 2005 (69%) (Exhibit B).
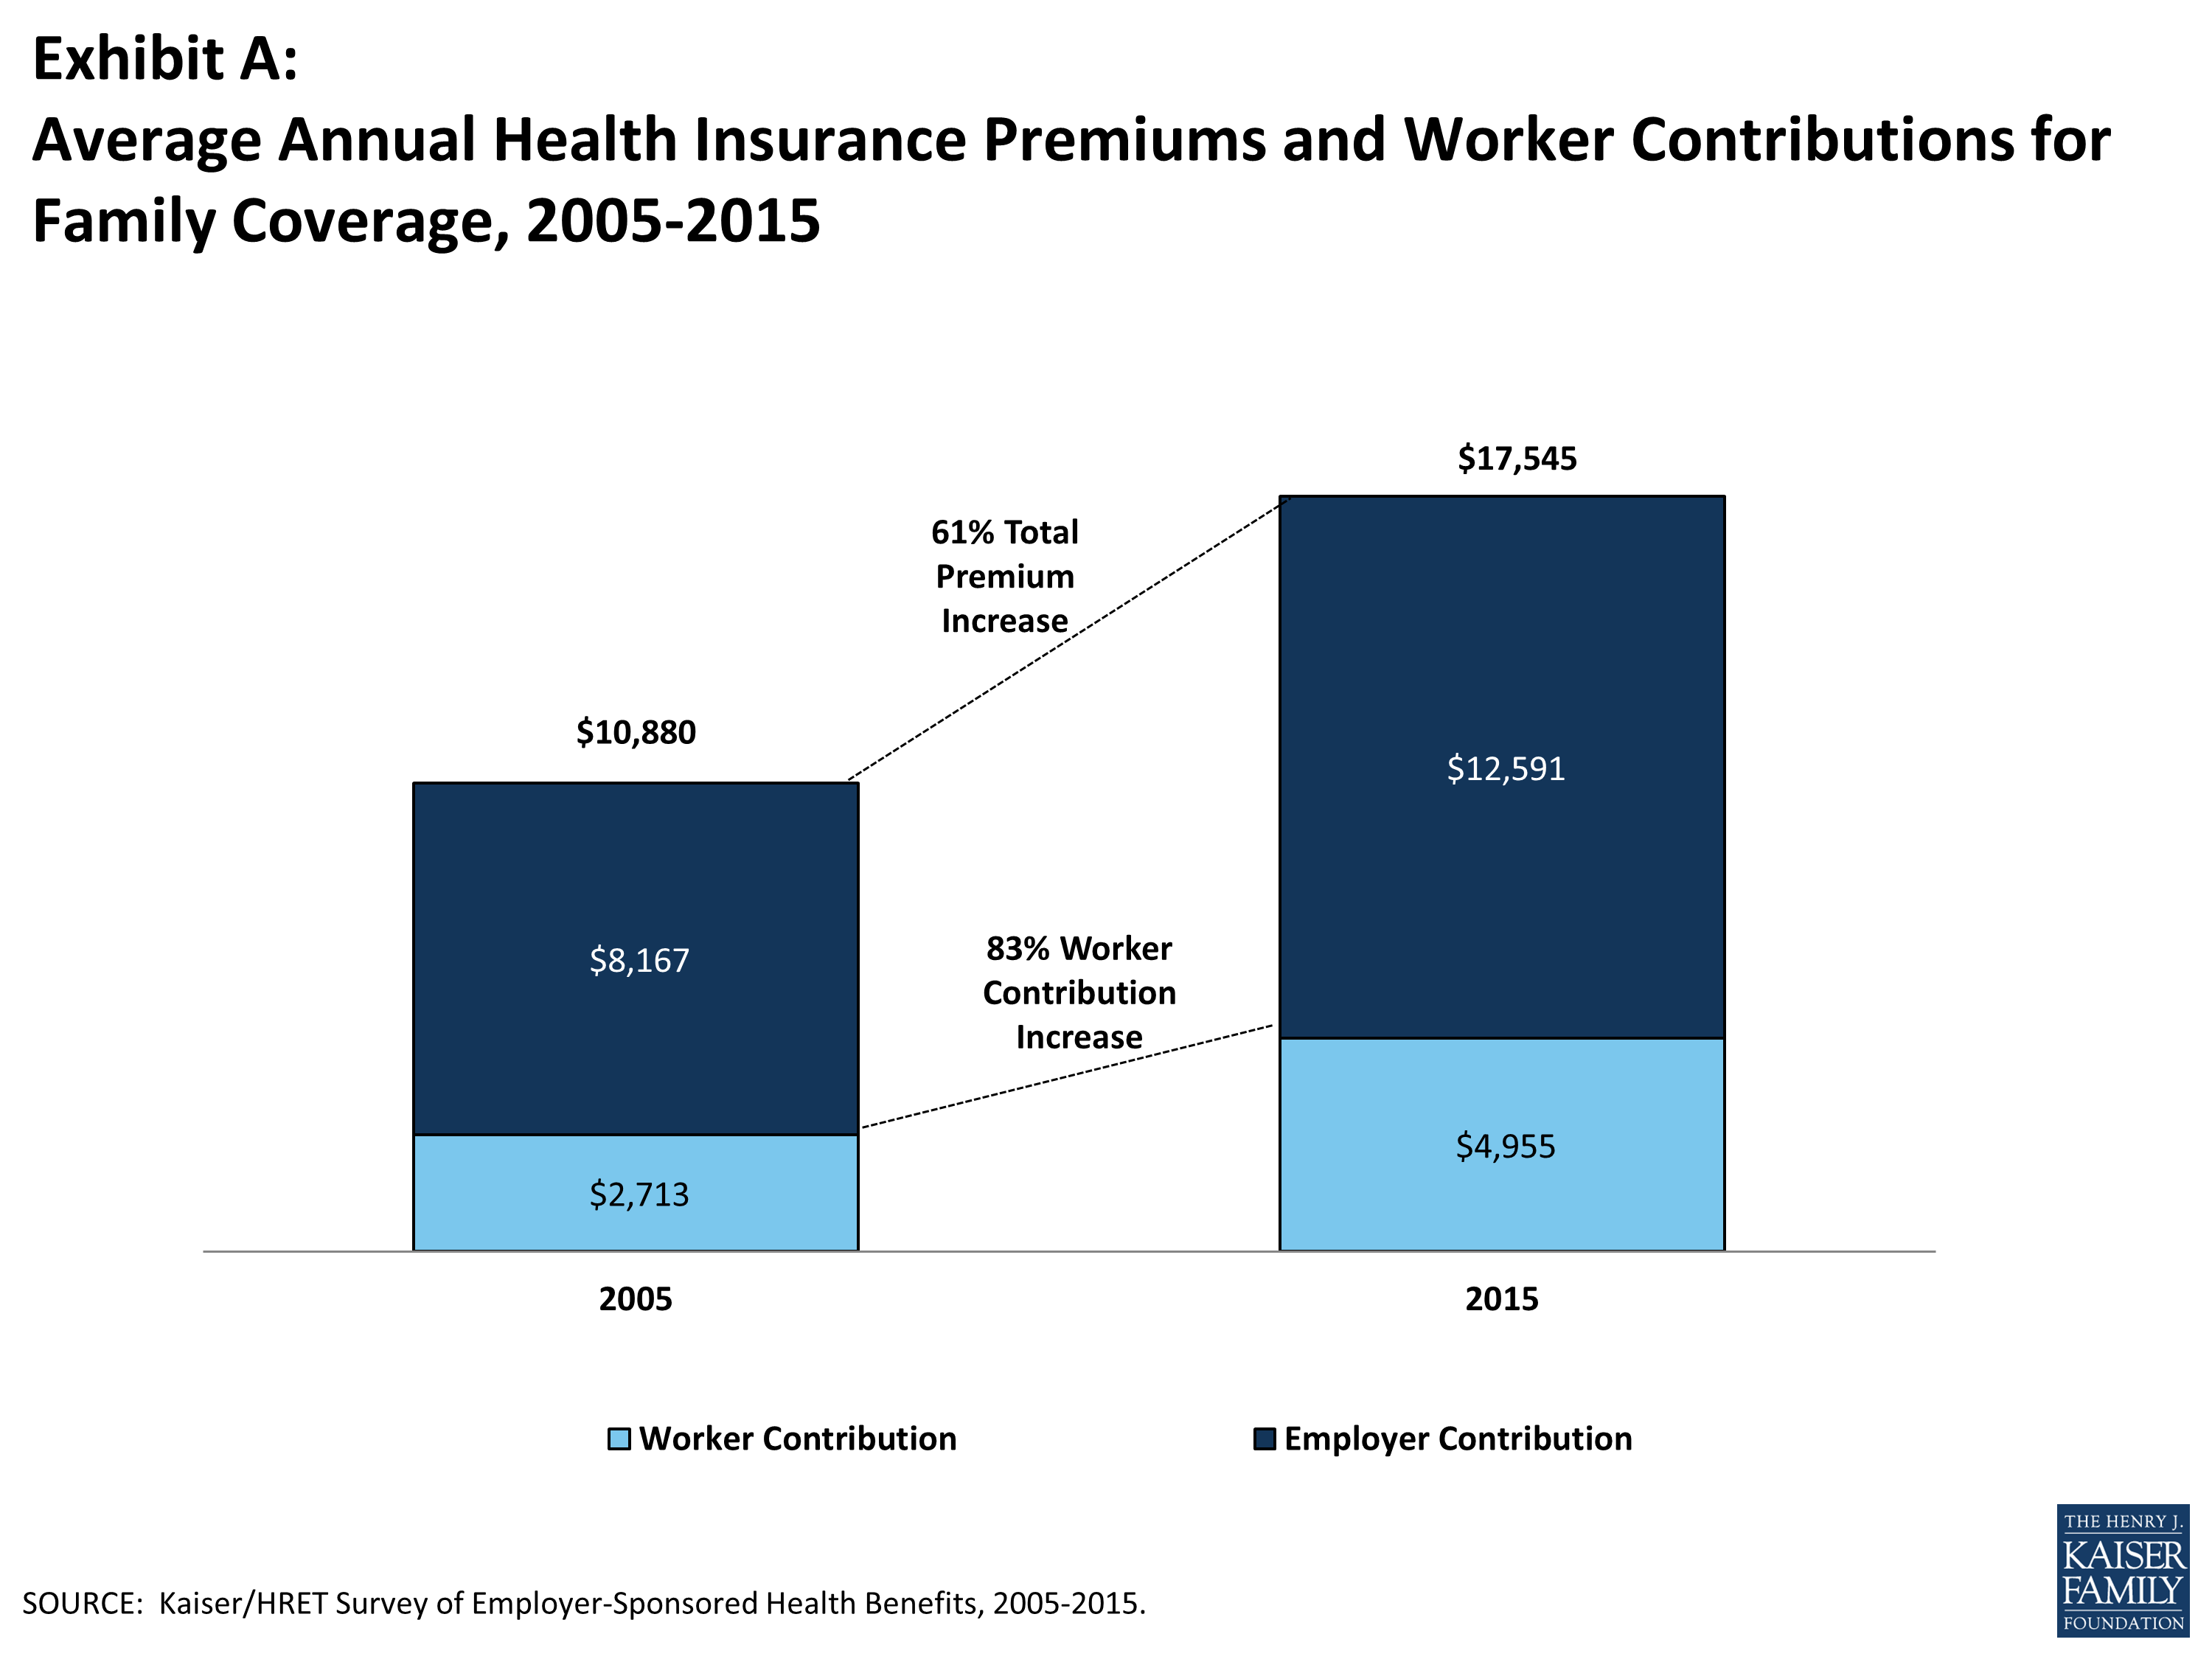
Exhibit A: Average Annual Health Insurance Premiums and Worker Contributions for Family Coverage, 2005-2015
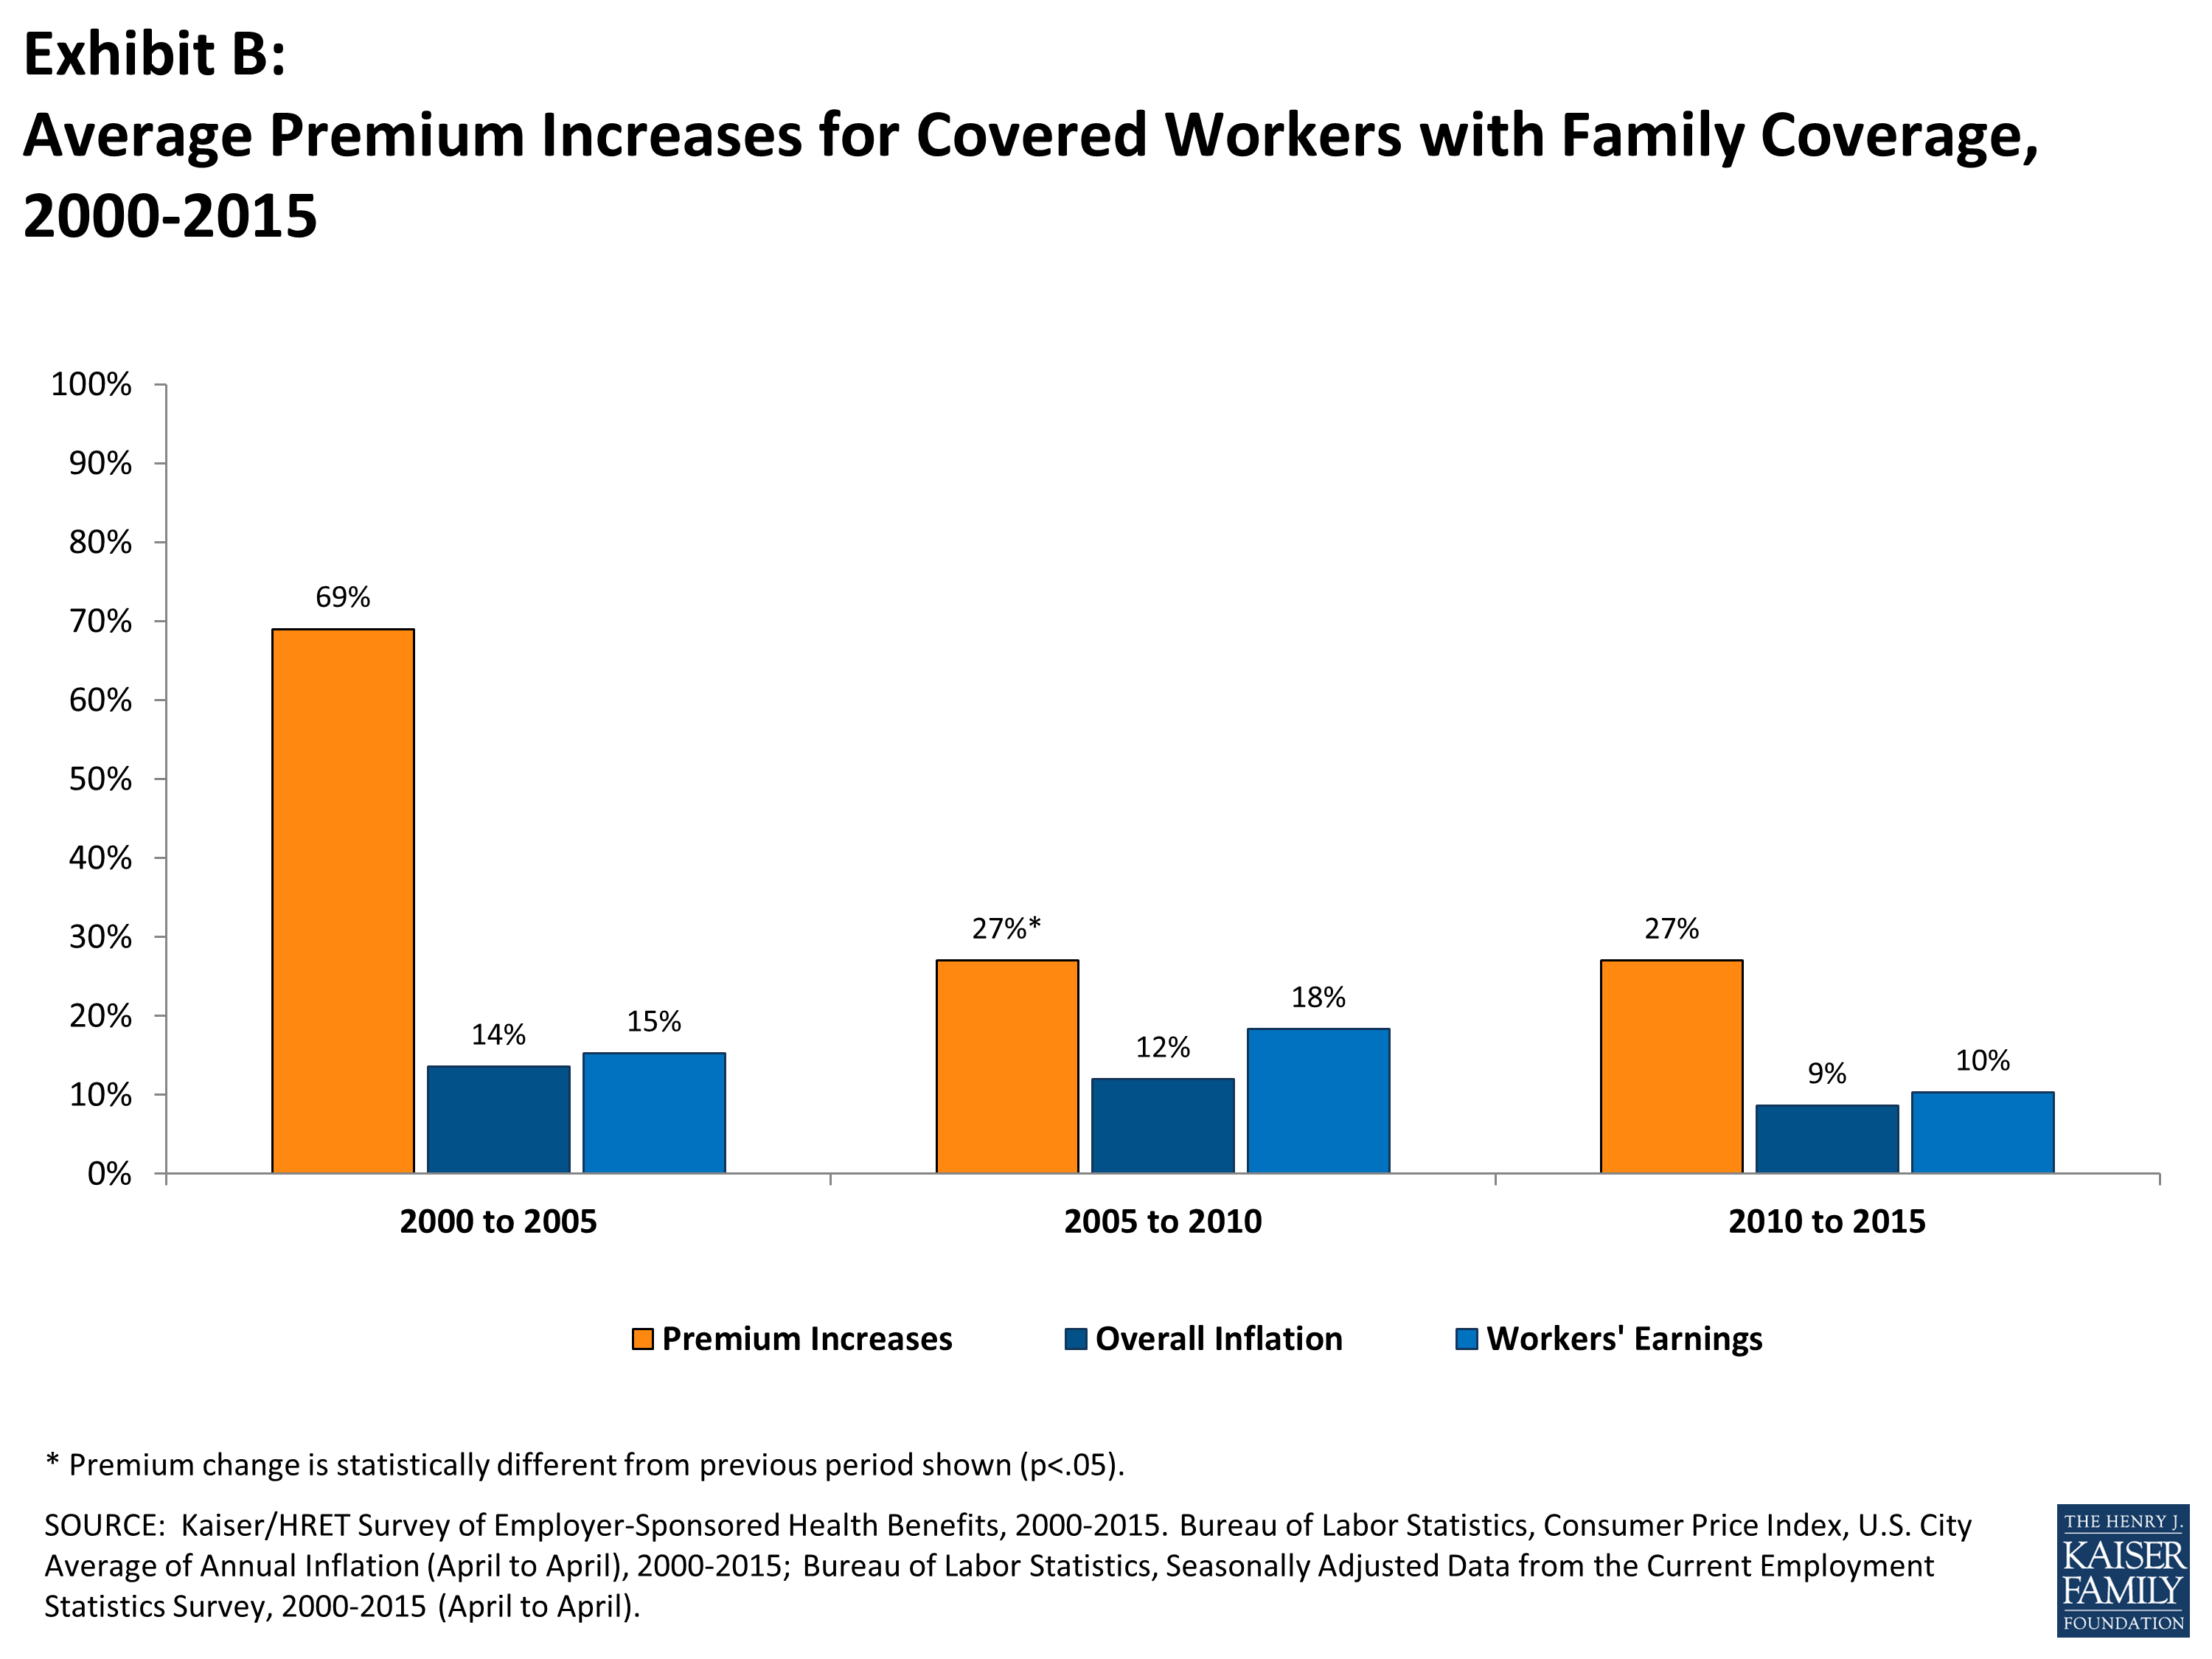
Exhibit B: Average Premium Increases for Covered Workers with Family Coverage, 2000-2015
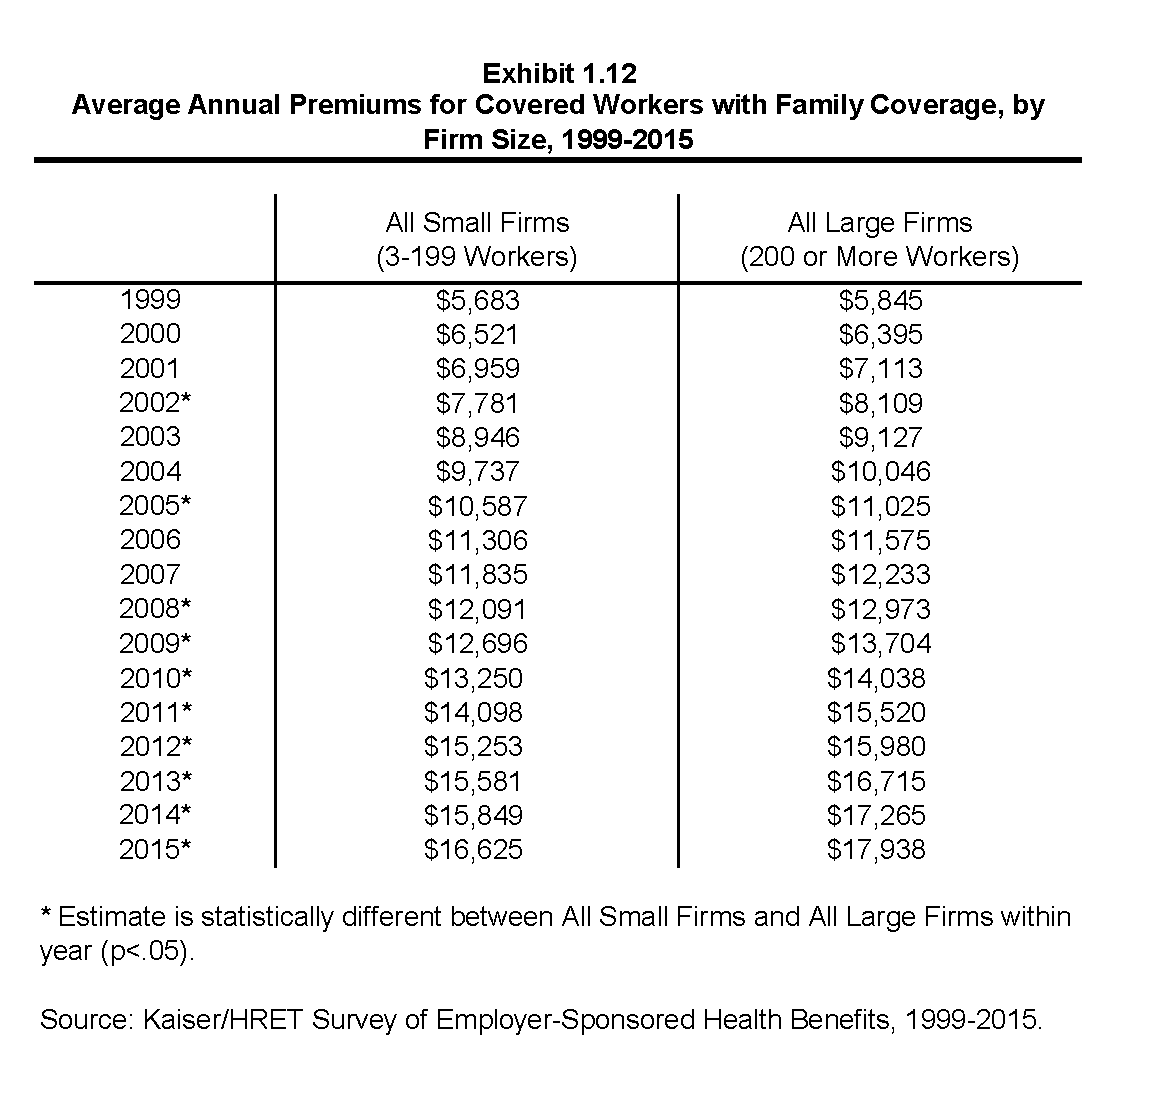
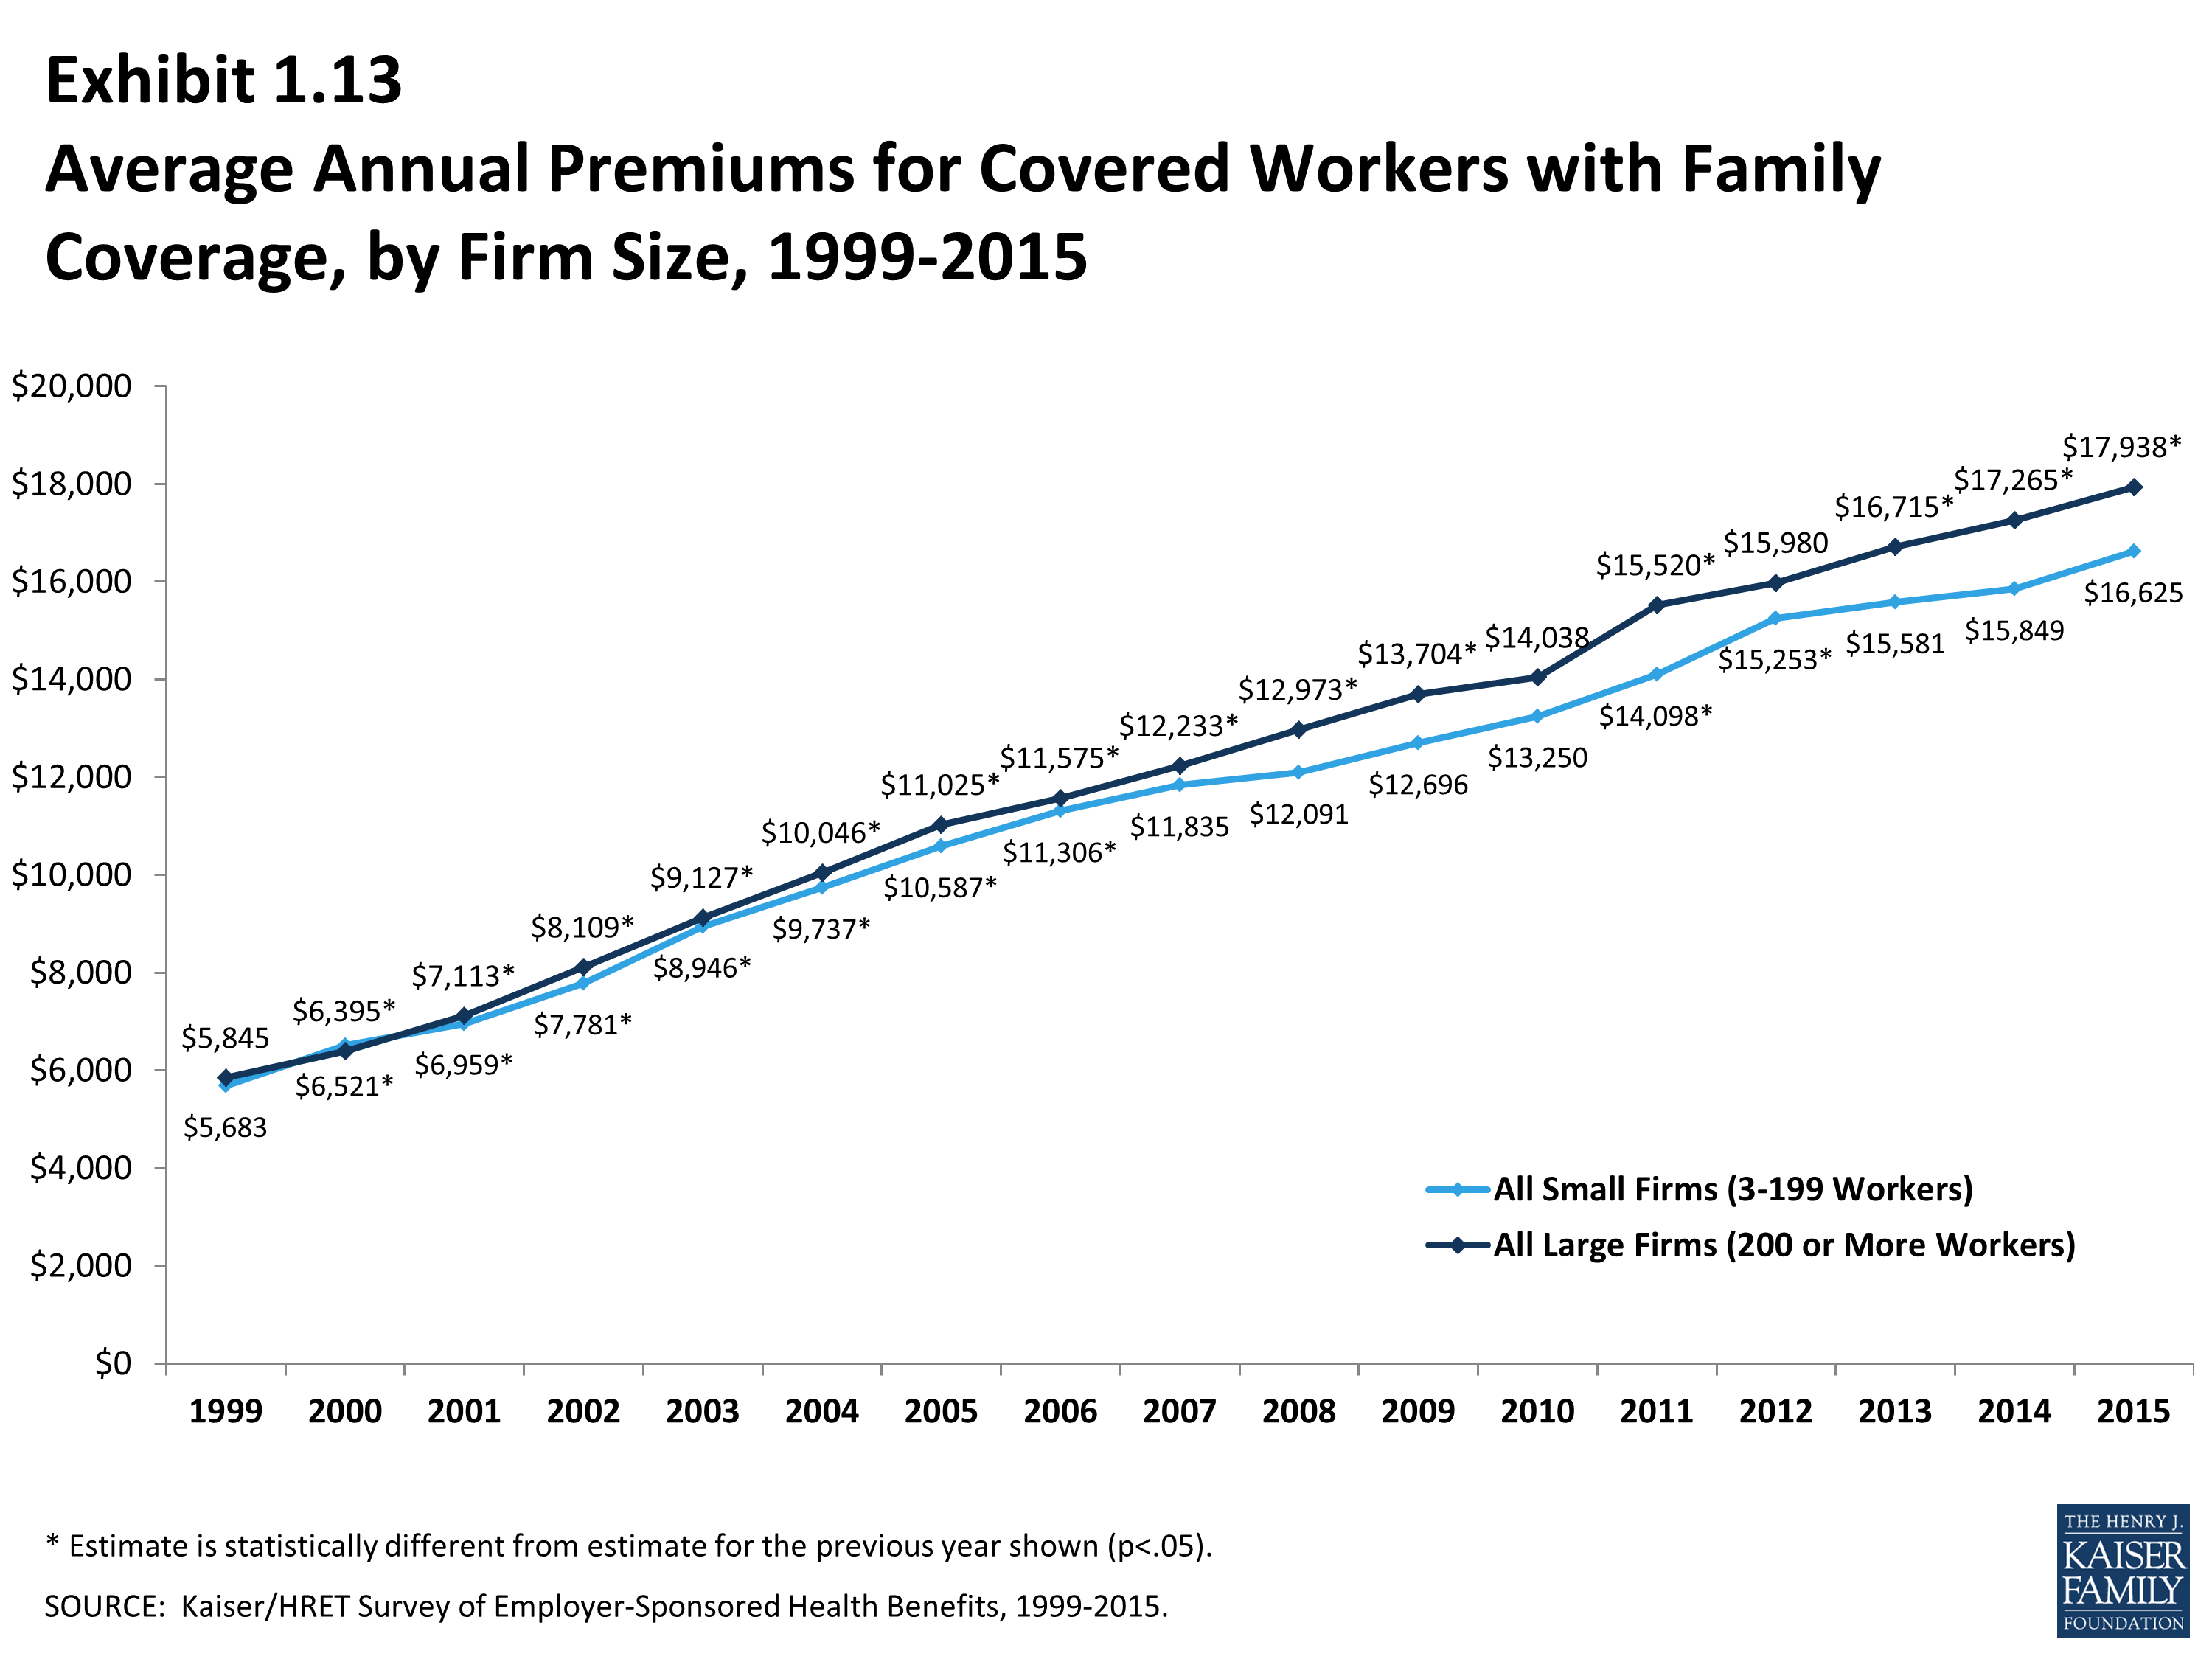
Average premiums for high-deductible health plans with a savings option (HDHP/SOs) are lower than the overall average for all plan types for both single and family coverage (Exhibit C), at $5,567 and $15,970, respectively. The average premium for family coverage is lower for covered workers in small firms (3-199 workers) than for workers in large firms (200 or more workers) ($16,625 vs. $17,938).
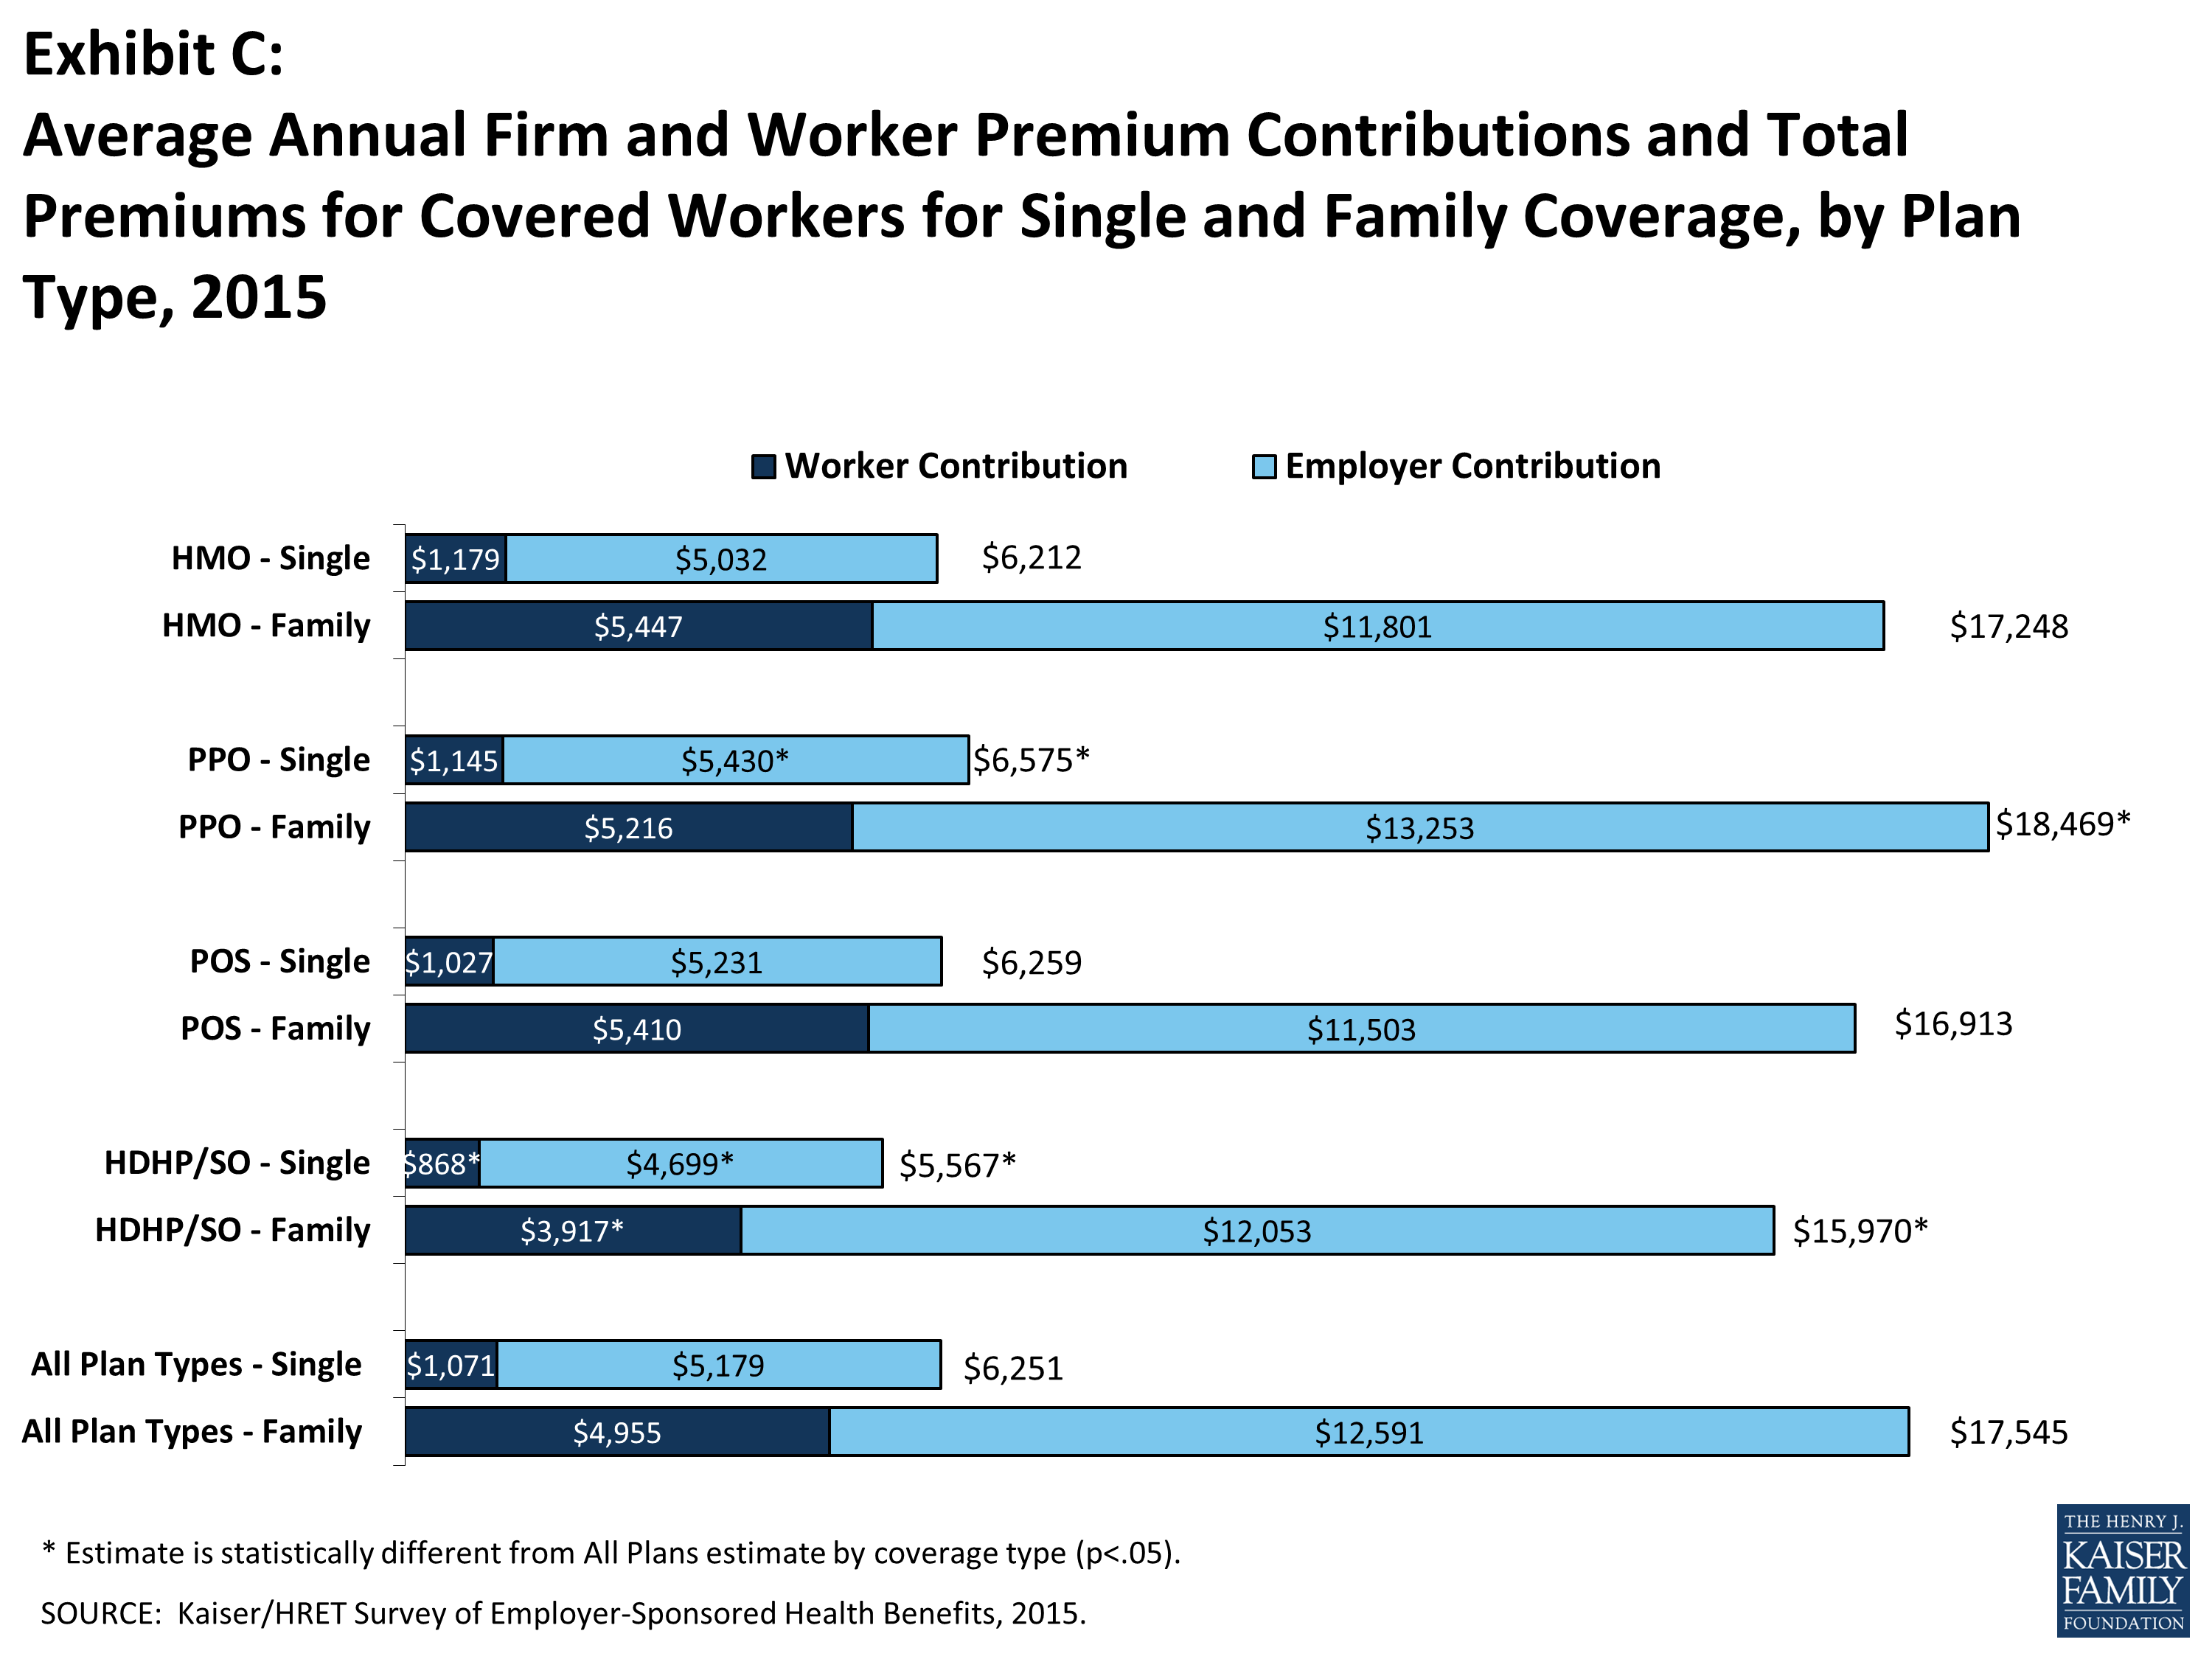
Exhibit C: Average Annual Firm and Worker Premium Contributions and Total Premiums for Covered Workers for Single and Family Coverage, by Plan Type, 2015
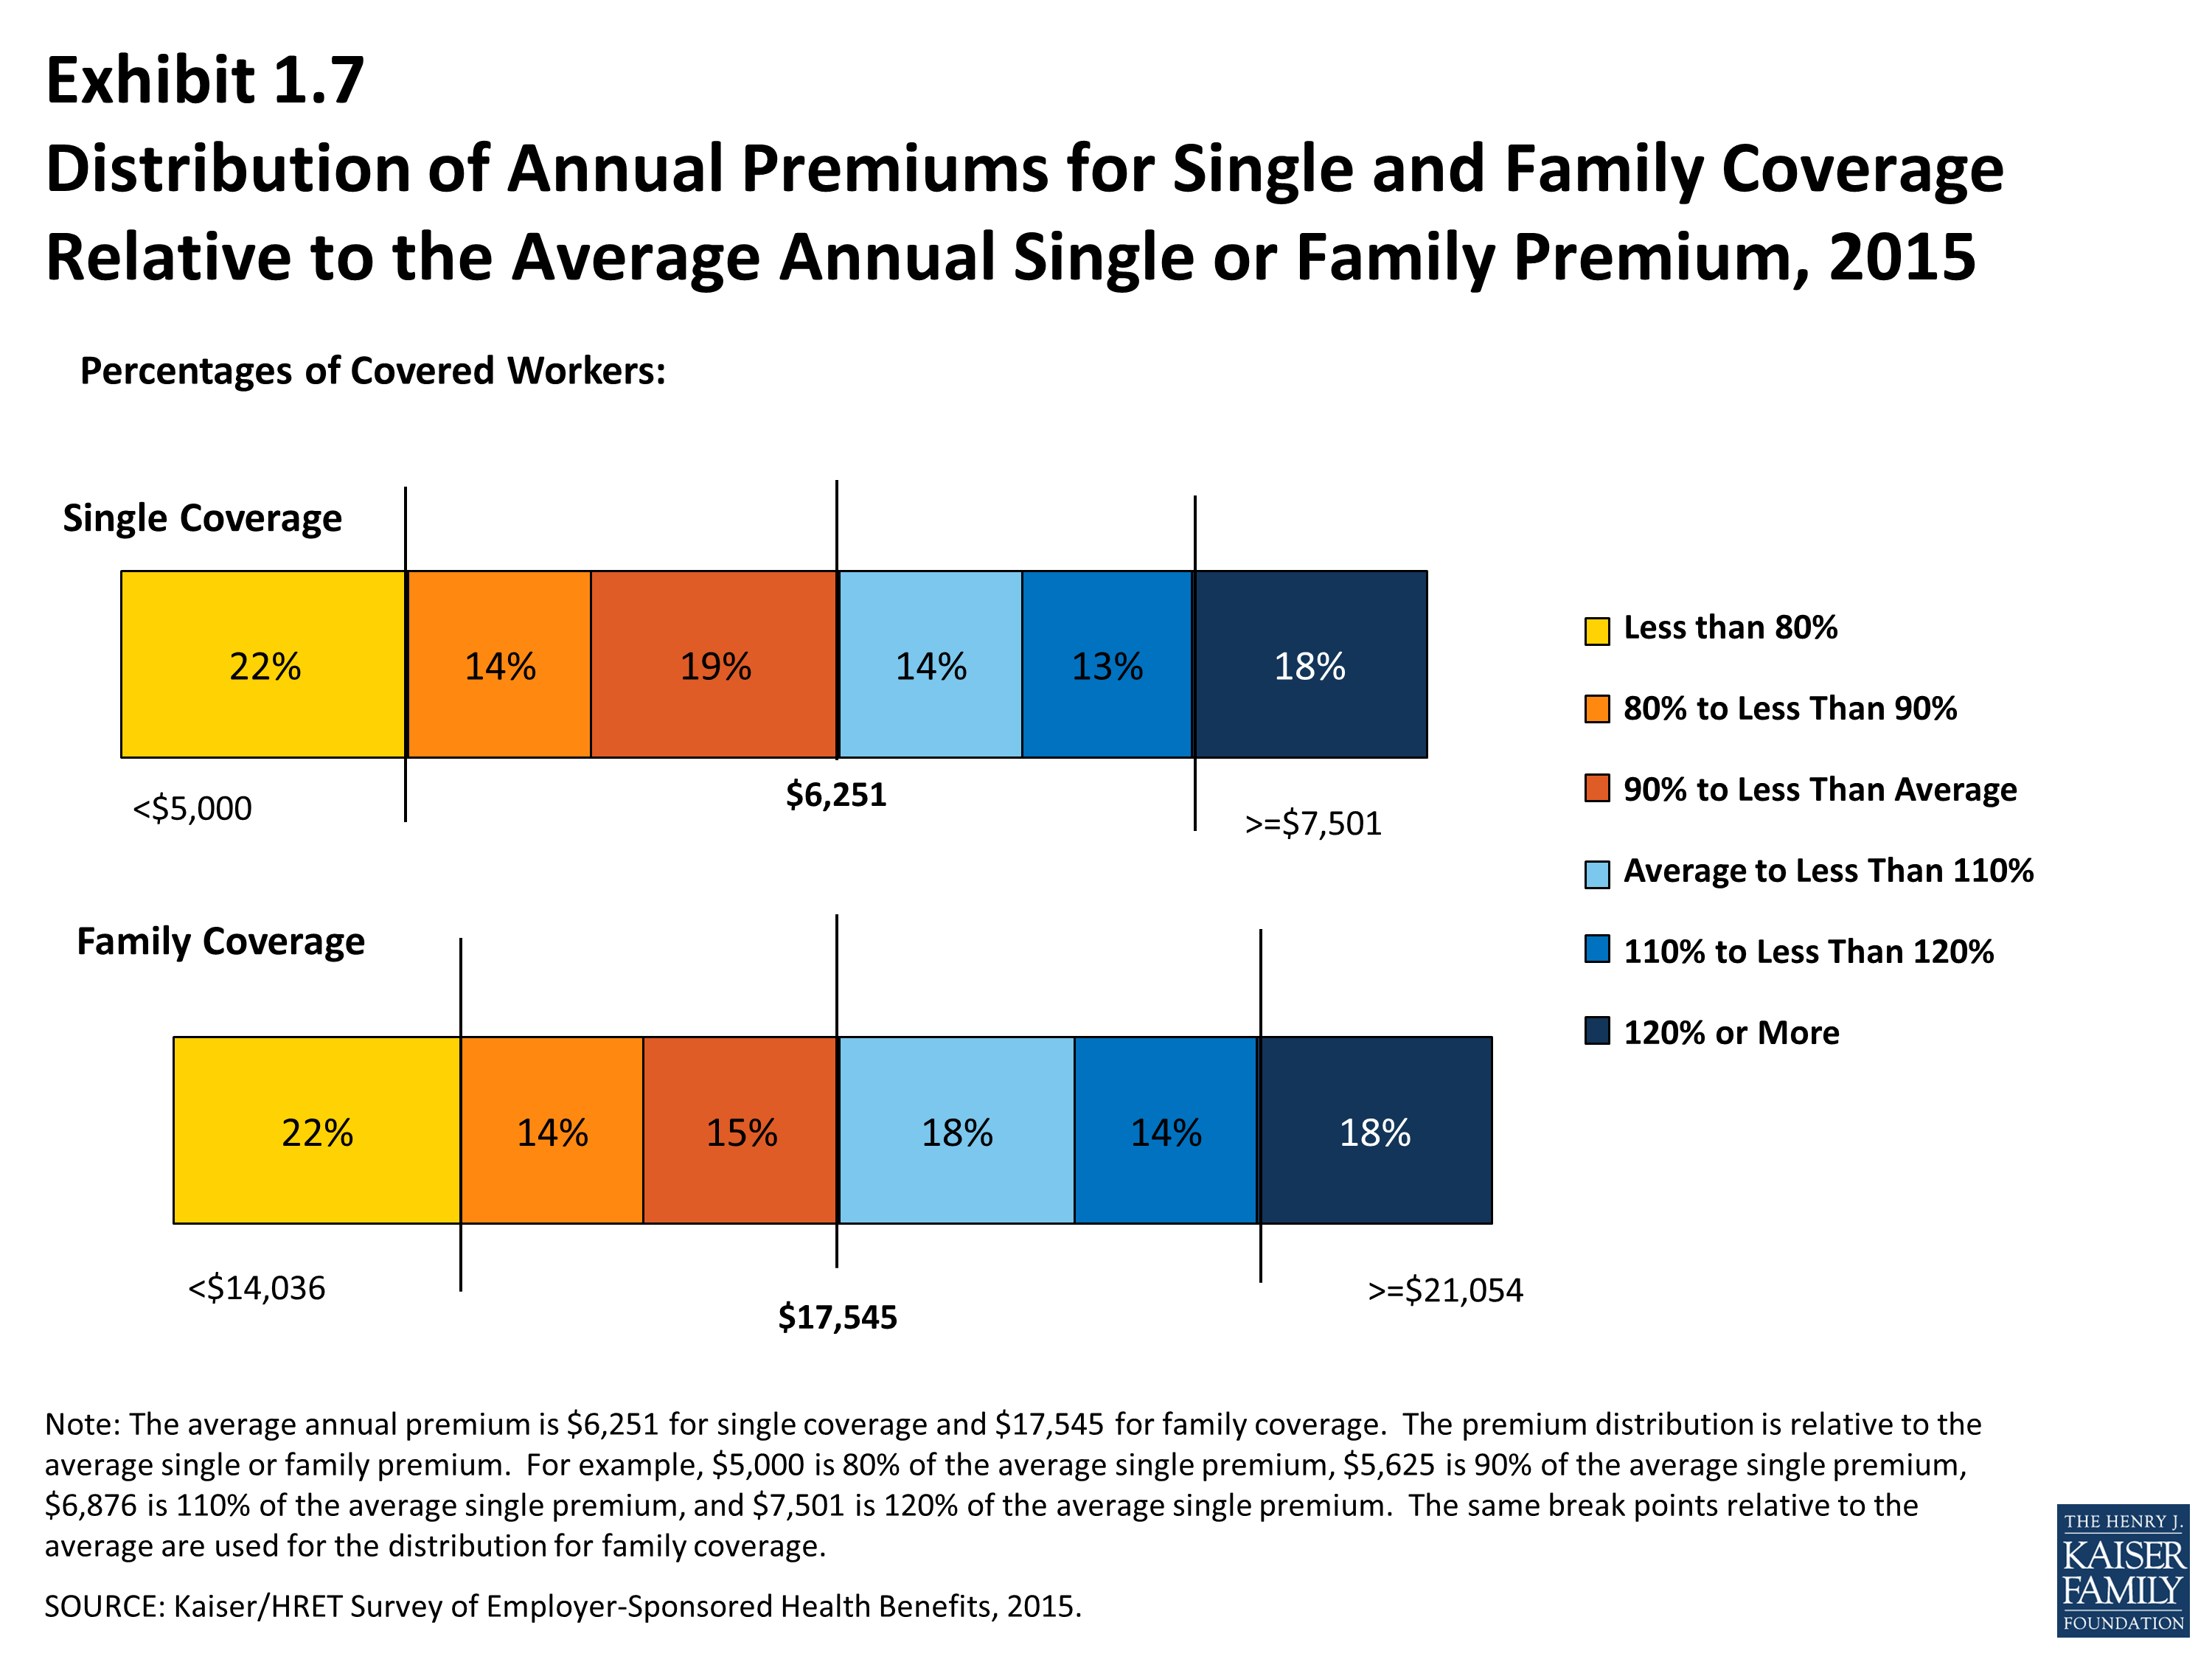
As a result of differences in benefits, cost sharing, covered populations, and geographical location, premiums vary significantly around the averages for both single and family coverage. Eighteen percent of covered workers are in plans with an annual total premium for family coverage of at least $21,054 (120% or more of the average family premium), and 22% of covered workers are in plans where the family premium is less than $14,036 (less than 80% of the average family premium). The distribution is similar around the average for single coverage premiums (Exhibit D).
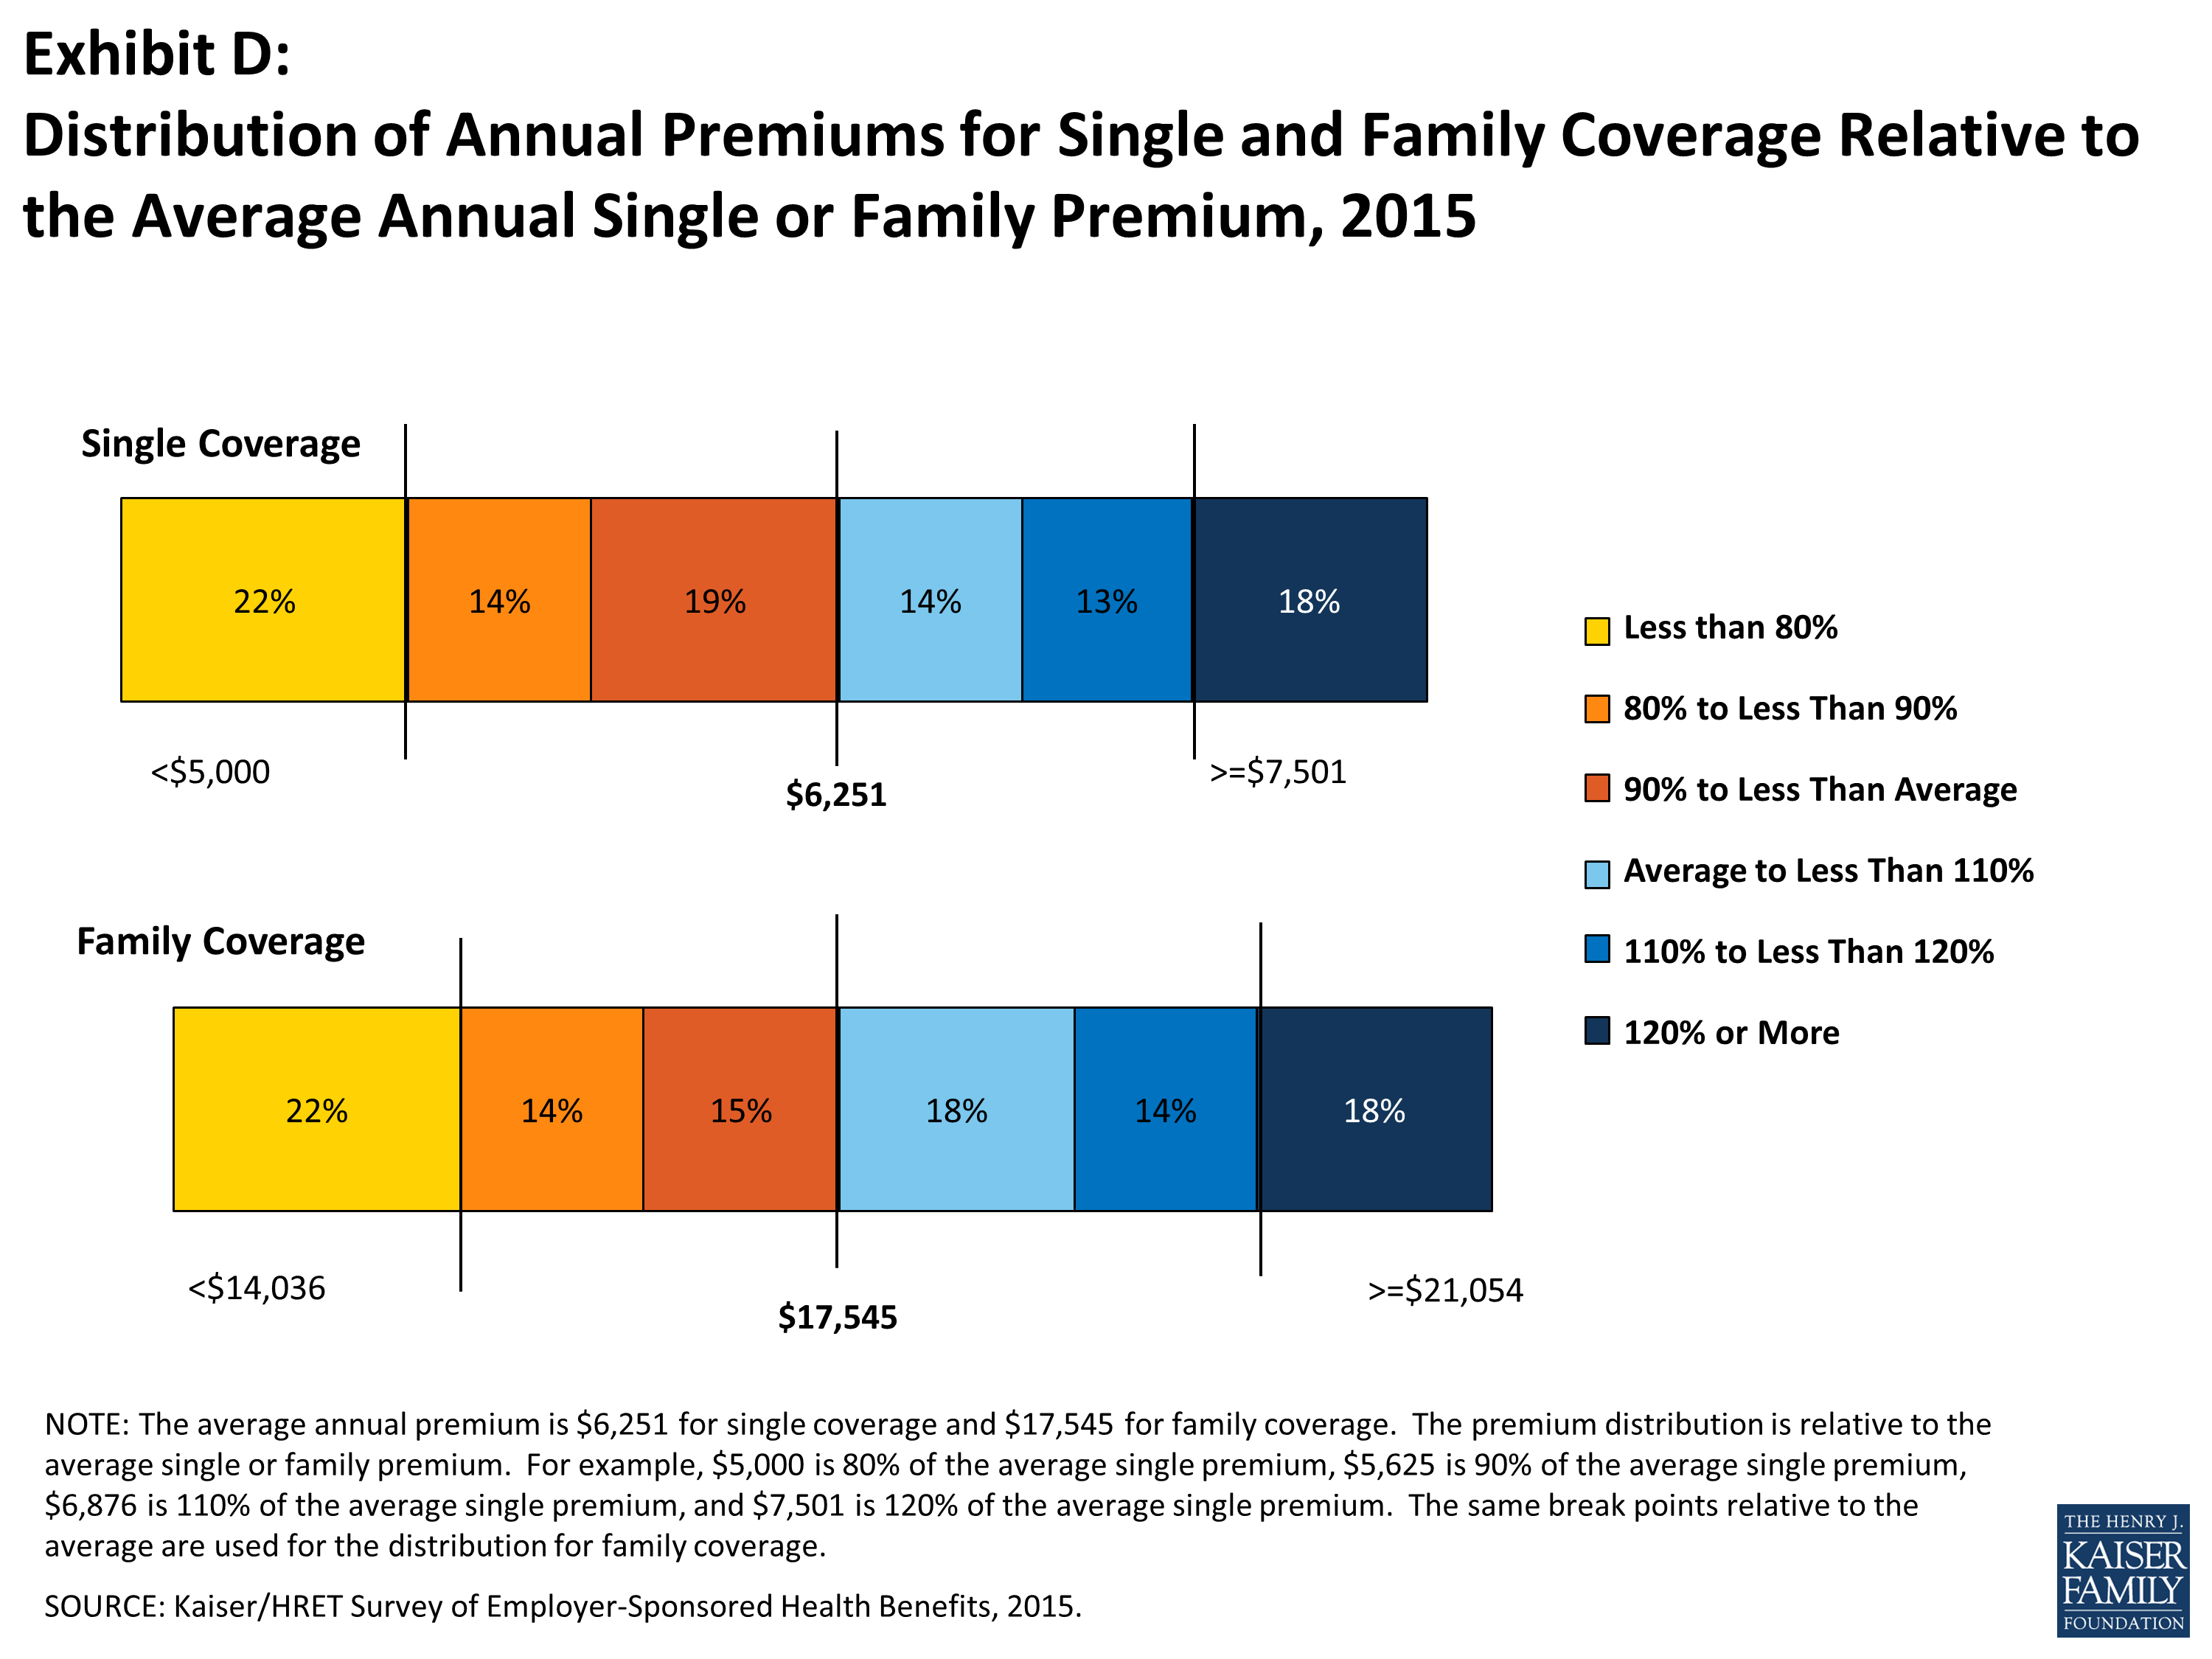
Exhibit D: Distribution of Annual Premiums for Single and Family Coverage Relative to the Average Annual Single or Family Premium, 2015
Employers generally require that workers make a contribution towards the cost of the premium. Covered workers contribute on average 18% of the premium for single coverage and 29% of the premium for family coverage, the same percentages as 2014 and statistically similar to those reported in 2010. Workers in small firms contribute a lower average percentage for single coverage compared to workers in large firms (15% vs. 19%), but they contribute a higher average percentage for family coverage (36% vs. 26%). Workers in firms with a higher percentage of lower-wage workers (at least 35% of workers earn $23,000 a year or less) contribute higher percentages of the premium for family coverage (41% vs. 28%) than workers in firms with a smaller share of lower-wage workers.
As with total premiums, the share of the premium contributed by workers varies considerably. For single coverage, 61% of covered workers are in plans that require them to make a contribution of less than or equal to a quarter of the total premium, 2% are in plans that require more than half of the premium, and 16% are in plans that require no contribution at all. For family coverage, 44% of covered workers are in plans that require them to make a contribution of less than or equal to a quarter of the total premium and 15% are in plans that require more than half of the premium, while only 6% are in plans that require no contribution at all (Exhibit E). Employers use different strategies to structure their employer contributions; 45% of small employers offering health benefits indicated that they contribute the same dollar amount for family coverage as single coverage, 34% contributed a larger dollar amount for family than single coverage, and 18% used some other approach.
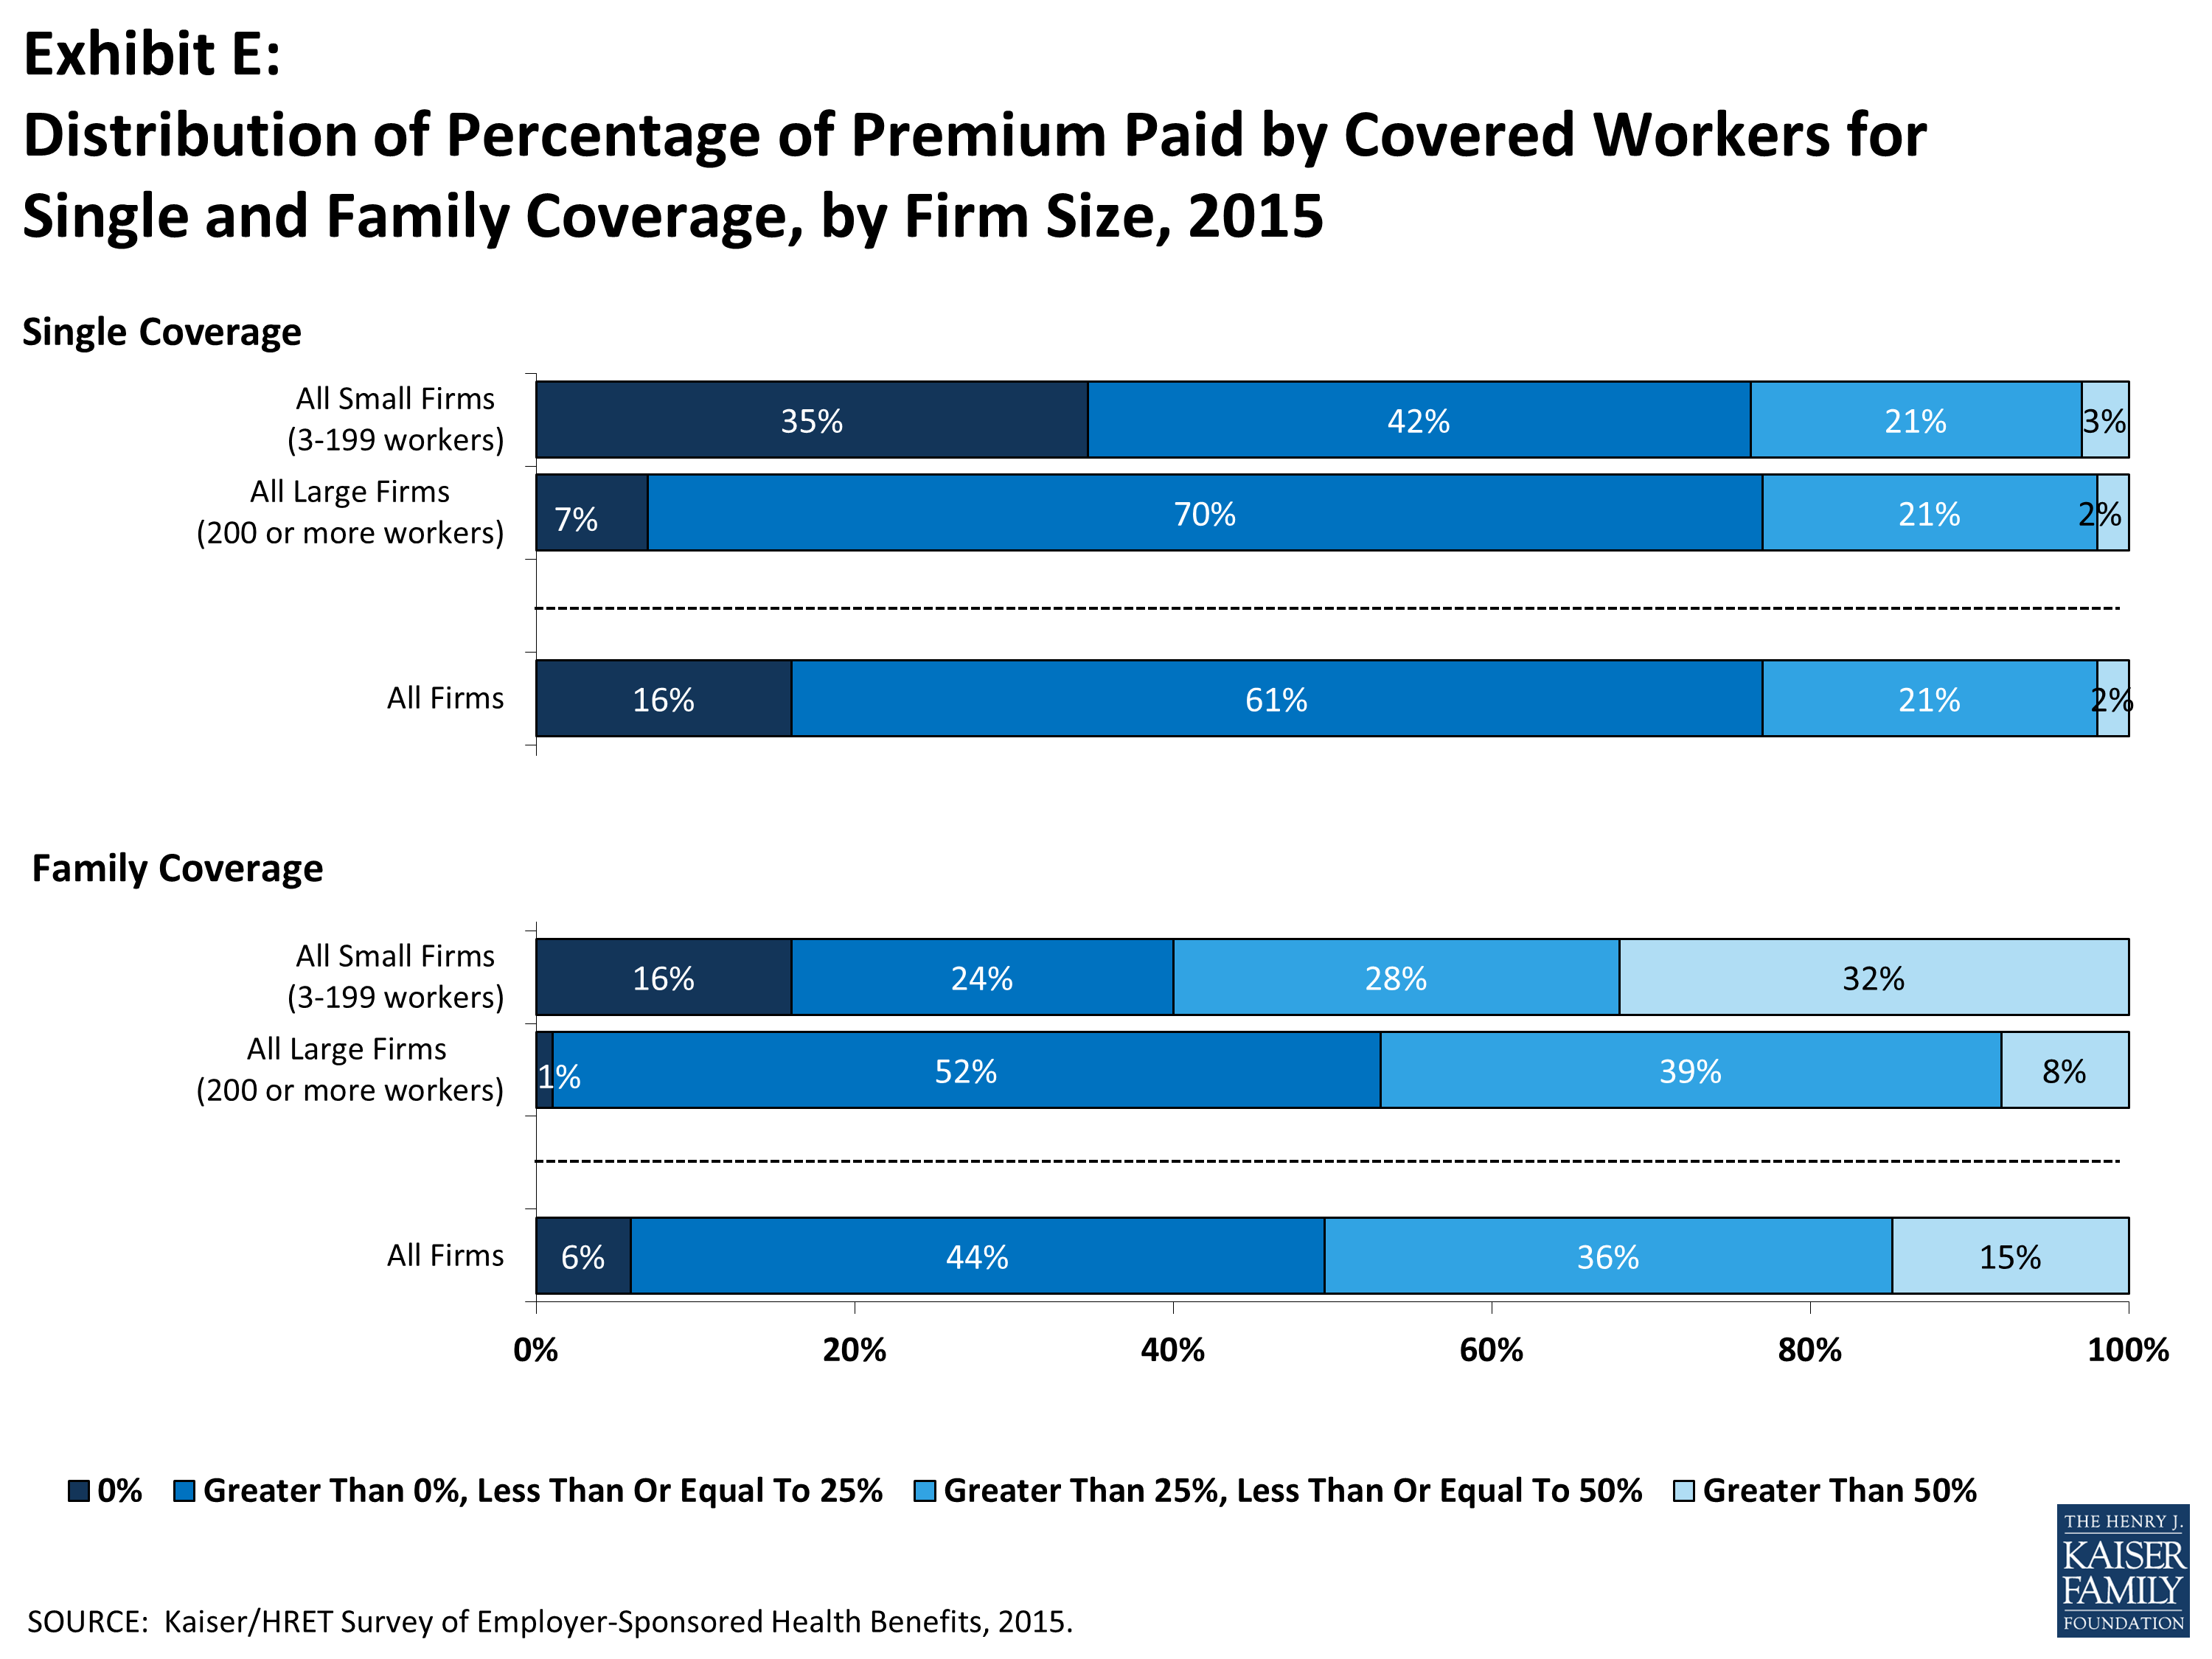
Exhibit E: Distribution of Percentage of Premium Paid by Covered Workers for Single and Family Coverage, by Firm Size, 2015
Looking at the dollar amounts that workers contribute, the average annual premium contributions in 2015 are $1,071 for single coverage and $4,955 for family coverage. Covered workers’ average dollar contribution to family coverage has increased 83% since 2005 and 24% since 2010 (Exhibit A). Workers in small firms have lower average contributions for single coverage than workers in large firms ($899 vs. $1,146), but higher average contributions for family coverage ($5,904 vs. $4,549). Workers in firms with a higher percentage of lower-wage workers have higher average contributions for family coverage ($6,382 vs. $4,829) than workers in firms with lower percentages of lower-wage workers.
PLAN ENROLLMENT
PPO plans remain the most common plan type, enrolling 52% of covered workers in 2015, although a smaller percentage than 2014. Twenty-four percent of covered workers are enrolled in a high-deductible plan with a savings options (HDHP/SO), 14% in an HMO, 10% in a POS plan, and 1% in a conventional (also known as an indemnity) plan (Exhibit F). Enrollment distribution varies by firm size; for example, PPOs are relatively more popular for covered workers at large firms than small firms (56% vs. 41%) and POS plans are relatively more popular among small firms than large firms (19% vs. 6%).
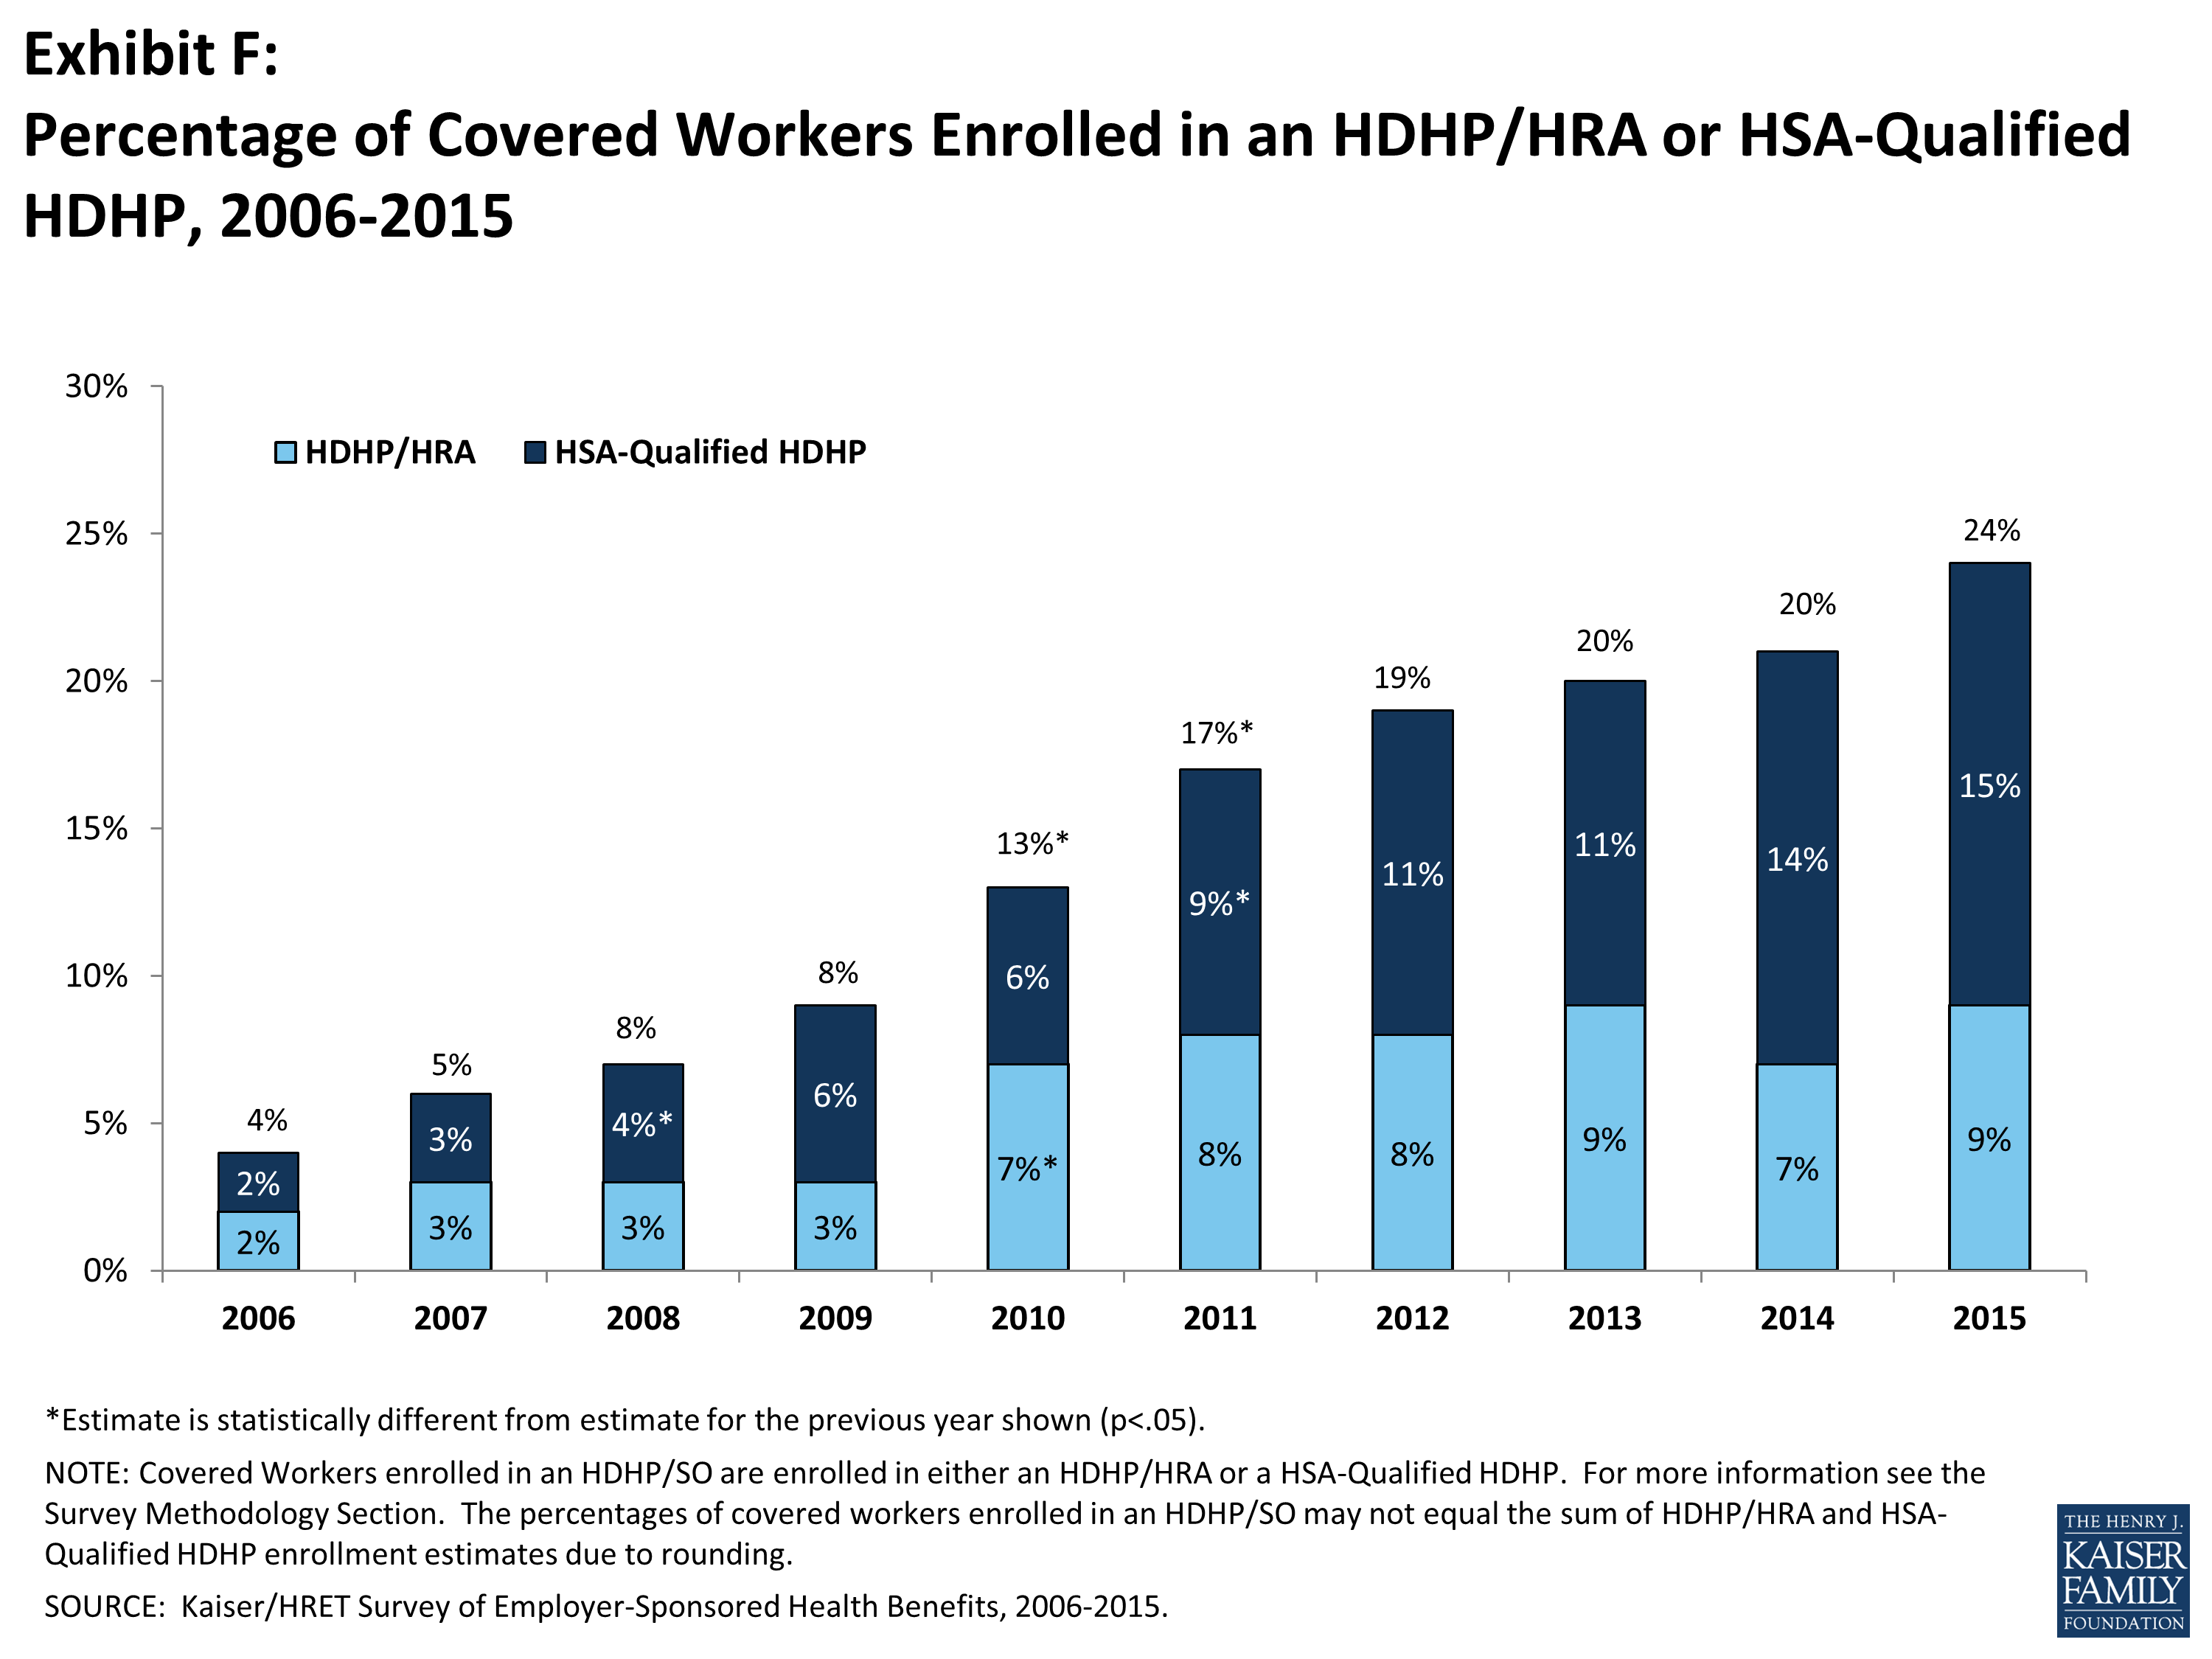
Exhibit F: Percentage of Covered Workers Enrolled in an HDHP/HRA or HSA-Qualified HDHP, 2006-2015
Almost a quarter (24%) of covered workers are enrolled in HDHP/SOs in 2015; enrollment in these plans has increased over time from 13% of covered workers in 2010. In 2015, 7% of firms offering health benefits offered a high-deductible health plan with a health reimbursement arrangement (HDHP/HRA), and 20% offered a health savings (HSA) qualified HDHP.
EMPLOYEE COST SHARING
Most covered workers face additional out-of-pocket costs when they use health care services. Eighty-one percent of covered workers have a general annual deductible for single coverage that must be met before most services are paid for by the plan. Even workers without a general annual deductible often face other types of cost sharing when they use services, such as copayments or coinsurance for office visits and hospitalizations.
Among covered workers with a general annual deductible, the average deductible amount for single coverage is $1,318. The average annual deductible is similar to last year ($1,217), but has increased from $917 in 2010. Deductibles differ by firm size; for workers in plans with a deductible, the average deductible for single coverage is $1,836 in small firms, compared to $1,105 for workers in large firms. Sixty-three percent of covered workers in small firms are in a plan with a deductible of at least $1,000 for single coverage compared to 39% in large firms; a similar pattern exists for those in plans with a deductible of at least $2,000 (36% for small firms vs. 12% for large firms) (Exhibit G).
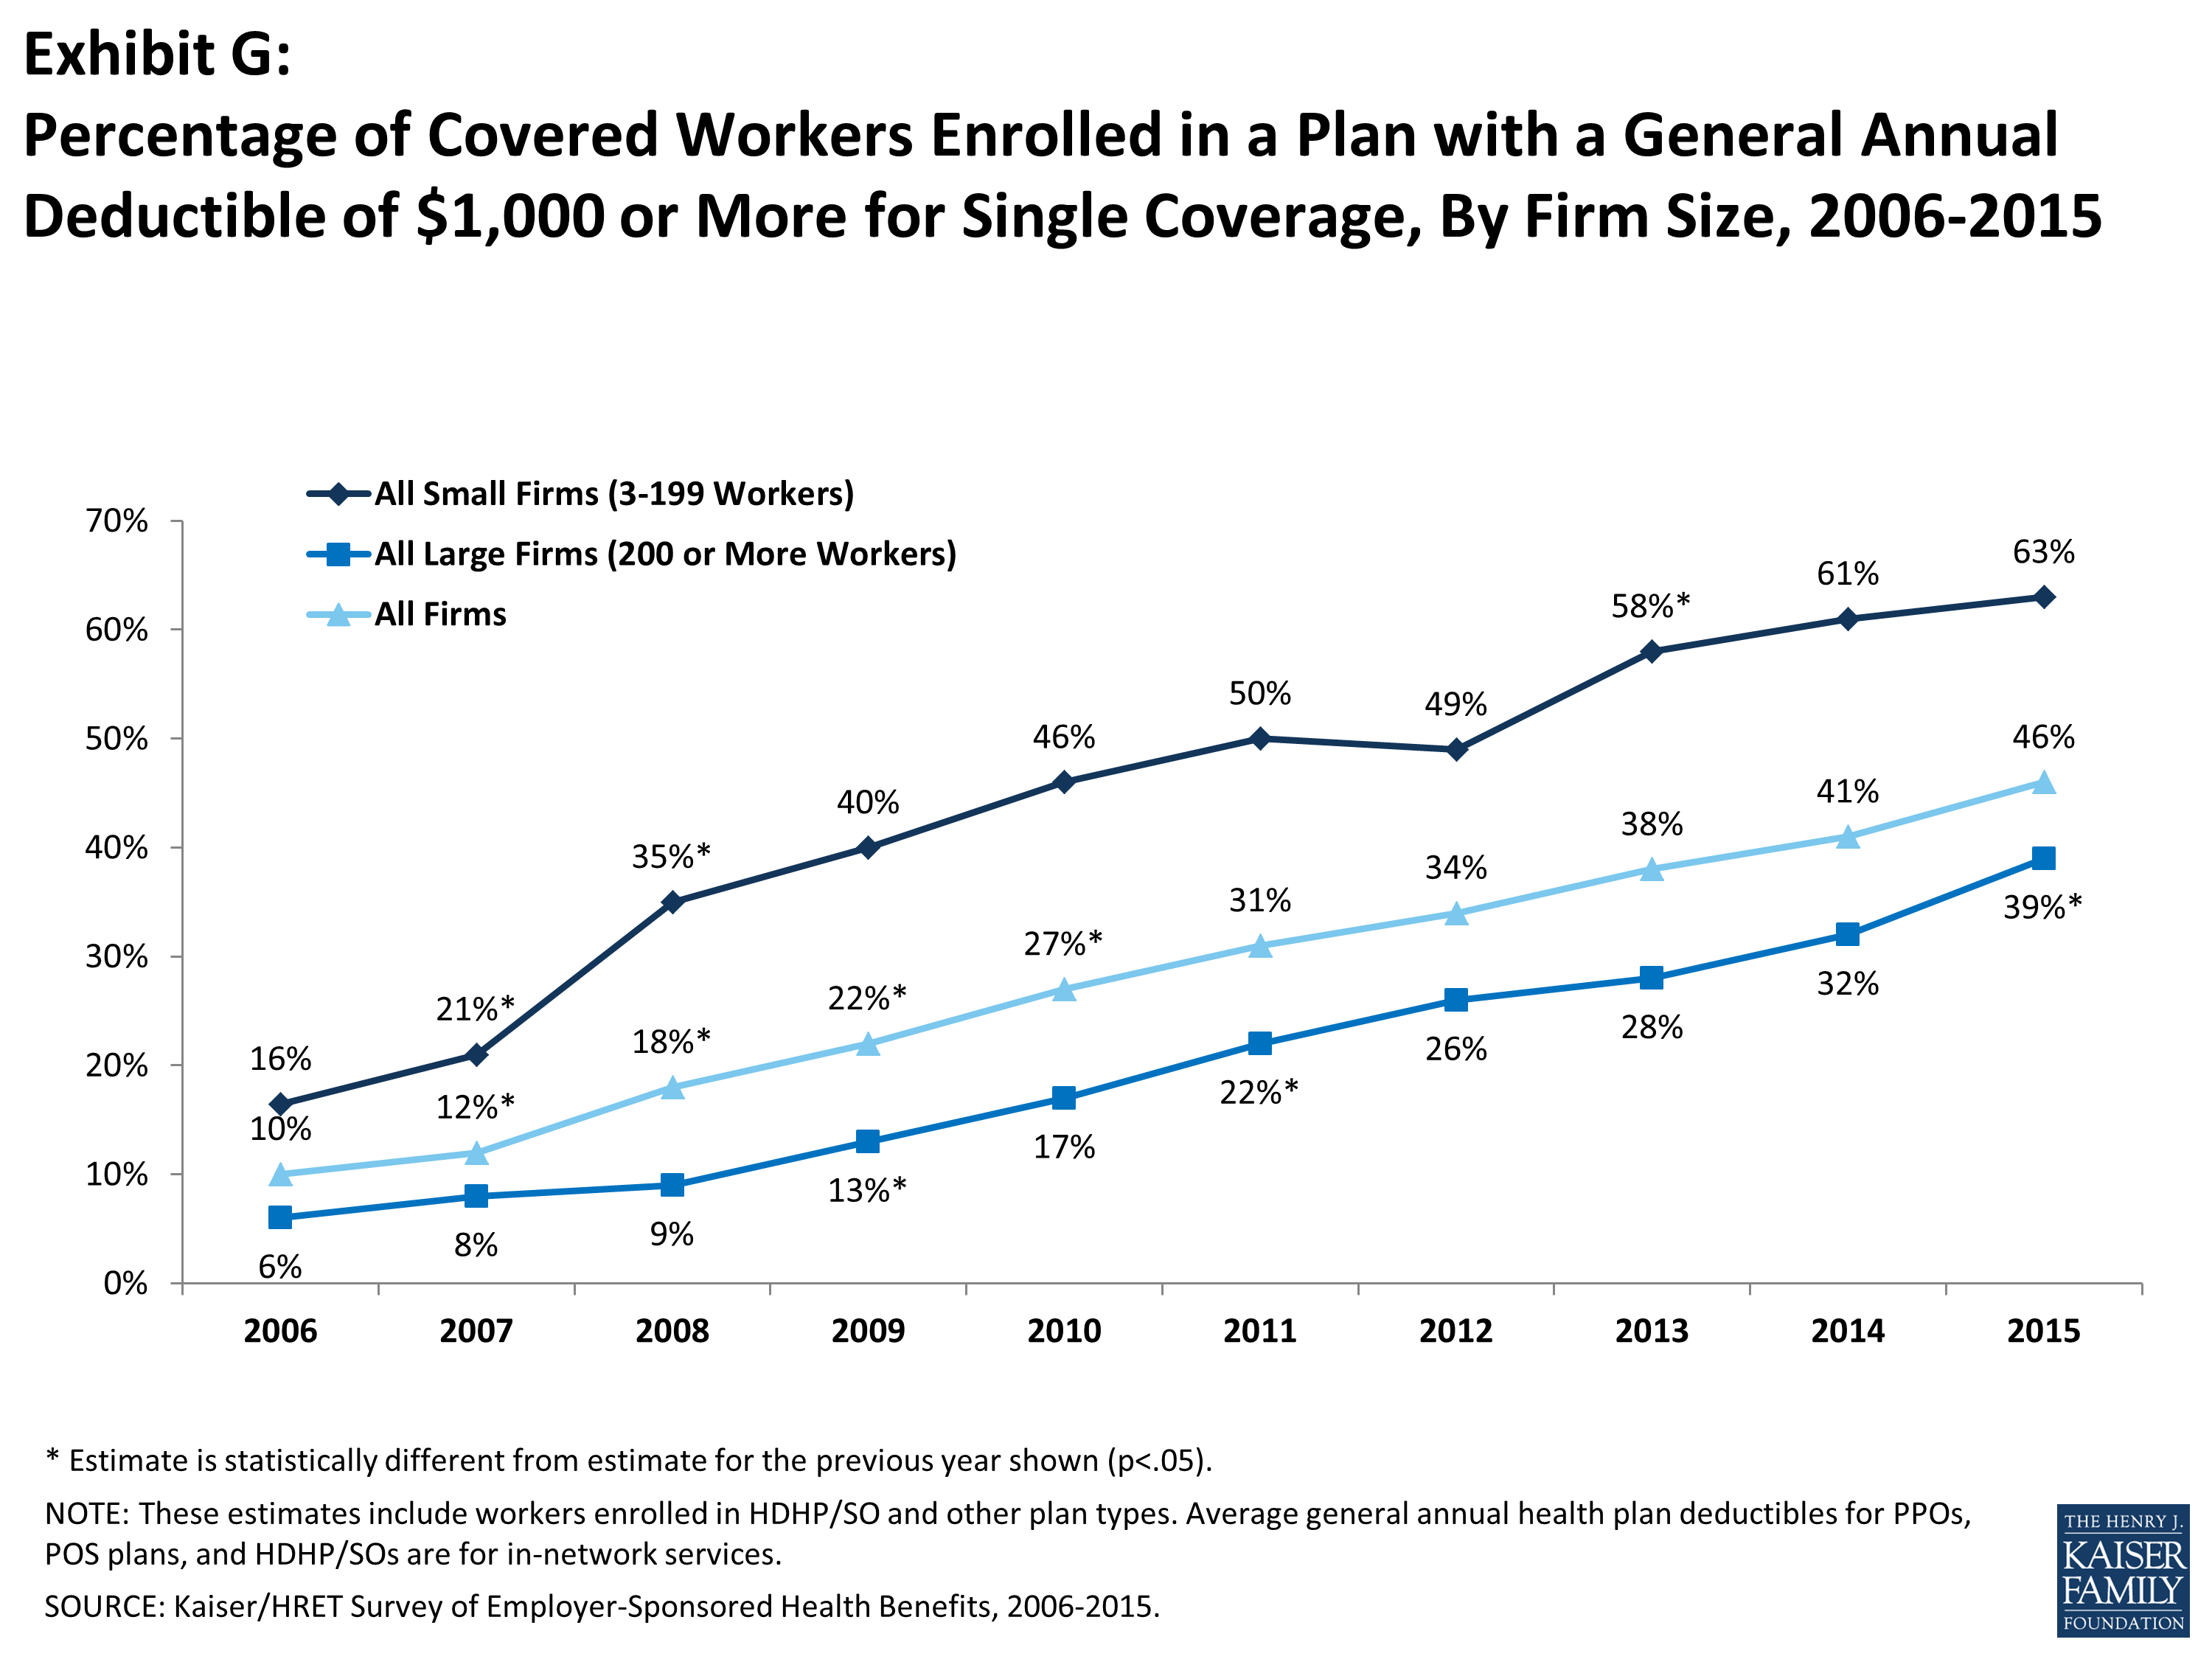
Exhibit G: Percentage of Covered Workers Enrolled in a Plan with a General Annual Deductible of $1,000 or More for Single Coverage, By Firm Size, 2006-2015
Looking at the increase in deductible amounts over time does not capture the full impact for workers because the share of covered workers in plans with a general annual deductible also has increased significantly, from 55% in 2006 to 70% in 2010 to 81% in 2015. If we look at the change in deductible amounts for all covered workers (assigning a zero value to workers in plans with no deductible), we can look at the impact of both trends together. Using this approach, the average deductible for all covered workers in 2015 is $1,077, up 67% from $646 in 2010 and 255% from $303 in 2006.
A large majority of workers also have to pay a portion of the cost of physician office visits. Almost 68% of covered workers pay a copayment (a fixed dollar amount) for office visits with a primary care or specialist physician, in addition to any general annual deductible their plan may have. Smaller shares of workers pay coinsurance (a percentage of the covered amount) for primary care office visits (23%) or specialty care visits (24%). For in-network office visits, covered workers with a copayment pay an average of $24 for primary care and $37 for specialty care. For covered workers with coinsurance, the average coinsurance for office visits is 18% for primary and 19% for specialty care. While the survey collects information only on in-network cost sharing, it is generally understood that out-of-network cost sharing is higher.
Virtually all (99%) covered workers are enrolled in a plan that covers some prescription drugs. Cost sharing for filling a prescription usually varies with the type of drug – for example, whether it is a generic, brand-name, or specialty drug – and whether the drug is considered preferred or not on the plan’s formulary. These factors result in each drug being assigned to a tier that represents a different level, or type, of cost sharing. Eighty-one percent of covered workers are in plans with three or more tiers of cost sharing. Twenty-three percent of covered workers are enrolled in a plan with four or more cost sharing tiers compared to 13% in 2010. Copayments are the most common form of cost sharing for tiers one through three. Among workers with plans with three or more tiers, the average copayments in these plans are $11 for first tier drugs, $31 for second tier drugs, $54 for third tier drugs, and $93 for fourth tier drugs. HDHP/SOs have a somewhat different cost sharing pattern for prescription drugs than other plan types; just 61% of covered workers are enrolled in a plan with three or more tiers of cost sharing, 12% are in plans that pay the full cost of prescriptions once the plan deductible is met, and 22% are in a plan with the same cost sharing for all prescription drugs.
Most covered workers with drug coverage are enrolled in a plan which covers specialty drugs such as biologics (94%). Large employers have used a variety of strategies for containing the cost of specialty drugs including utilization management programs (31%), step therapies where enrollees must first try alternatives (30%) and tight limits on the number of units administered at a single time (25%).
Twelve percent of covered workers enrolled in a plan with prescription drug coverage are enrolled in a plan with a separate annual drug deductible that applies only to prescription drugs. Among these workers, the average separate annual deductible for prescription drug coverage is $231. Five percent of covered workers are enrolled in a plan with an annual deductible for prescription drug coverage of $500 or more.
Most workers also face additional cost sharing for a hospital admission or an outpatient surgery episode. After any general annual deductible is met, 65% of covered workers have a coinsurance and 14% have a copayment for hospital admissions. Lower percentages have per day (per diem) payments (4%), a separate hospital deductible (2%), or both copayments and coinsurance (11%). The average coinsurance rate for hospital admissions is 19%. The average copayment is $308 per hospital admission, the average per diem charge is $281, and the average separate annual hospital deductible is $1,006. The cost sharing provisions for outpatient surgery are similar to those for hospital admissions, as most covered workers have either coinsurance (67%) or copayments (15%). For covered workers with cost sharing, for each outpatient surgery episode, the average coinsurance is 19% and the average copayment is $181.
Almost all (98%) covered workers are in plans with an out-of-pocket maximum for single coverage, significantly more than the 88% in 2013. While almost all workers have an out-of-pocket limit, the actual dollar limits differ considerably. For example, among covered workers in plans that have an out-of-pocket maximum for single coverage, 13% are in plans with an annual out-of-pocket maximum of $6,000 or more, and 9% are in plans with an out-of-pocket maximum of less than $1,500.
AVAILABILITY OF EMPLOYER-SPONSORED COVERAGE
Fifty-seven percent of firms offer health benefits to their workers, statistically unchanged from 55% last year and 60% in 2005 (Exhibit H). The likelihood of offering health benefits differs significantly by size of firm, with only 47% of employers with 3 to 9 workers offering coverage, but virtually all employers with 1,000 or more workers offering coverage to at least some of their employees. Ninety percent of workers are in a firm that offers health benefits to at least some of its employees, similar to 2014 (90%).
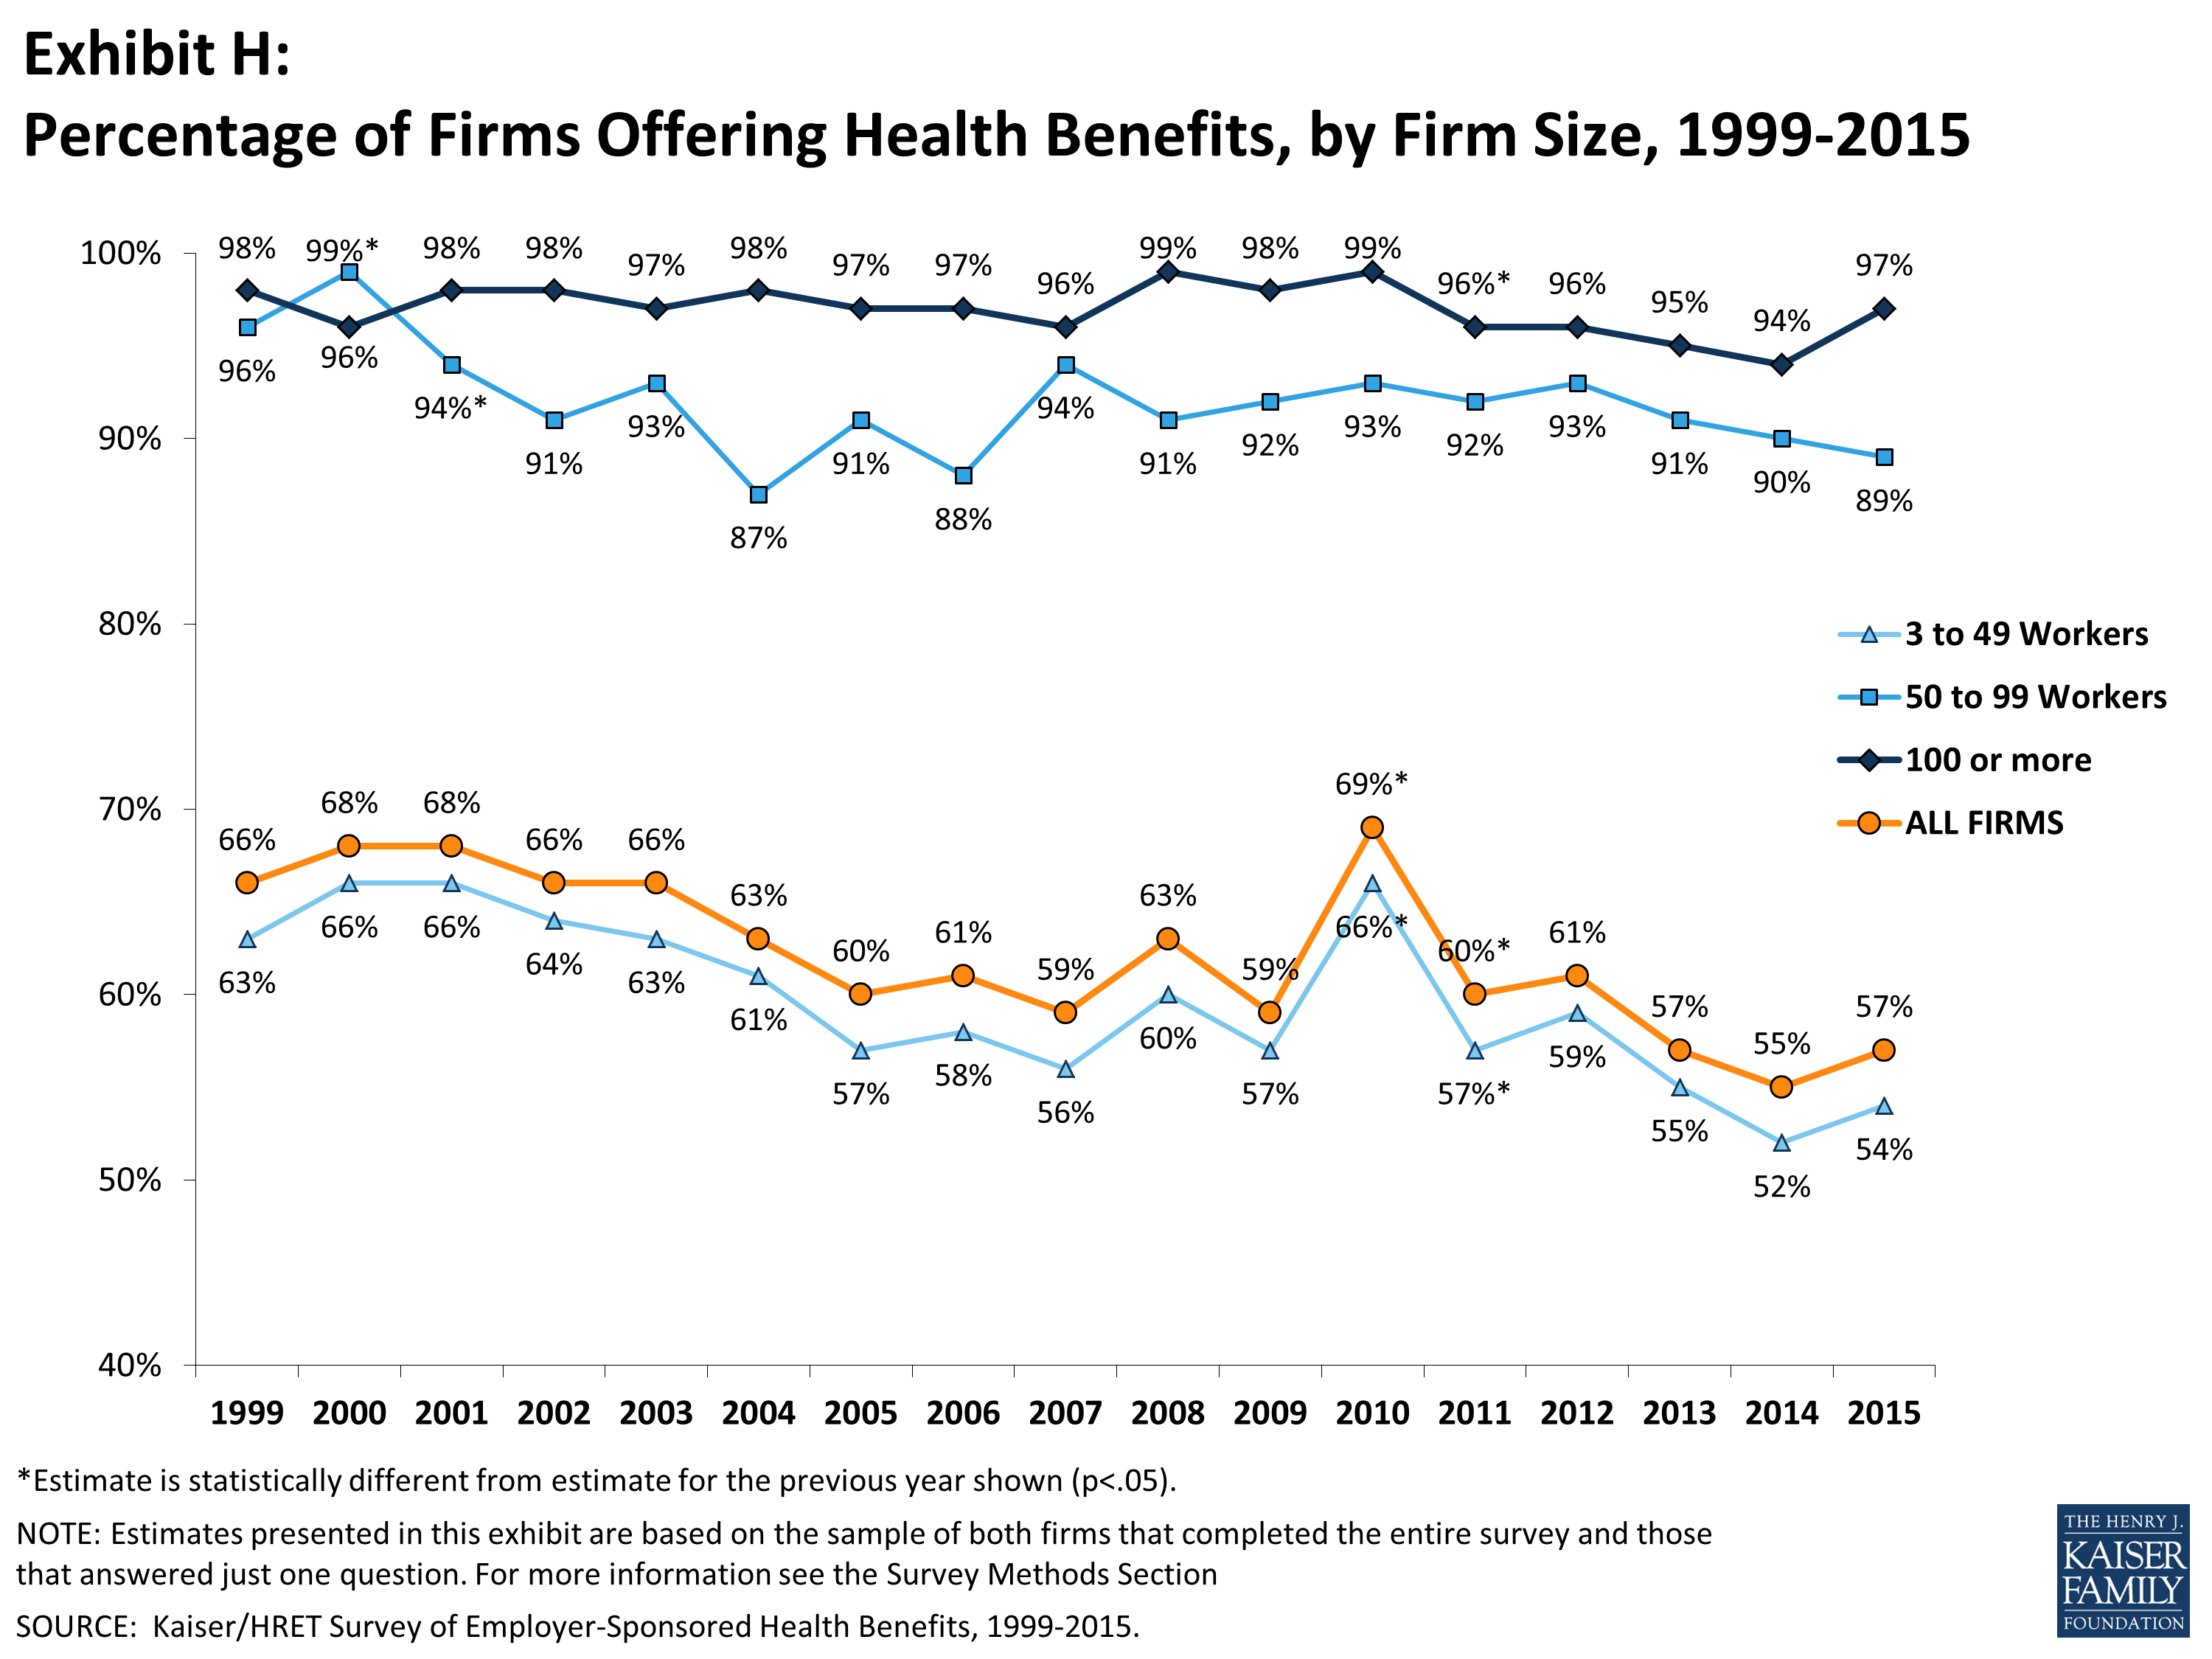
Exhibit H: Percentage of Firms Offering Health Benefits, by Firm Size, 1999-2015
Even in firms that offer health benefits, not all workers are covered. Some workers are not eligible to enroll as a result of waiting periods or minimum work-hour rules. Other workers do not enroll in coverage offered to them because of the cost of coverage or because they are covered through a spouse. Among firms that offer coverage, an average of 79% of workers are eligible for the health benefits offered by their employer. Of those eligible, 79% take up their employer’s coverage, resulting in 63% of workers in offering firms having coverage through their employer. Among both firms that offer and those that do not offer health benefits, 56% of workers are covered by health plans offered by their employer, similar to 2014 (55%).
Beginning in 2015, employers with at least 100 full-time equivalent employees (FTEs) must offer health benefits to their full-time workers that meet minimum standards for value and affordability or pay a penalty. The requirement applies to employers with 50 or more FTEs beginning in 2016. Of firms reporting at least 100 FTEs (or, if they did not know FTEs, of firms with at least 100 employees), 96% report that they offer one health plan that would meet these requirements, two percent did not and three percent reported “don’t know.” Five percent of these firms reported that this year they offered more comprehensive benefits to some workers who previously were only offered a limited benefit plan. Twenty-one percent reported that they extended eligibility to groups of workers not previously eligible because of the employer shared responsibility provision.
We asked firms reporting 50 or more FTEs (or, if they did not know how many FTEs, firms with at least 50 employees) about changes to their workforce in response to the employer requirement. Four percent reported that they changed some job classifications from full-time to part-time so employees would not be eligible for health benefits while 10% reported changing some job classifications from part-time to full-time so that they would become eligible. Four percent also reported reducing the number of full-time employees that they intended to hire because of the cost of health benefits.
RETIREE COVERAGE
Twenty-three percent of large firms that offer health benefits in 2015 also offer retiree health benefits, similar to the percentage in 2014 (25%). Among large firms that offer retiree health benefits, 92% offer health benefits to early retirees (workers retiring before age 65), 73% offer health benefits to Medicare-age retirees, and 2% offer a plan that covers only prescription drugs. Employers offering retiree benefits report interest in new ways of delivering them. Among large firms offering retiree benefits, seven percent offer them through a private exchange and 26% are considering changing the way they offer retiree coverage because of the new health insurance exchanges established by the ACA.
WELLNESS, HEALTH RISK ASSESSMENTS AND BIOMETRIC SCREENINGS
Health Risk Assessment. Employers continue to offer programs that encourage employees to identify health issues and to manage chronic conditions. A majority of larger employers now offer health screening programs including health risk assessments, which are questionnaires asking employees about lifestyle, stress or physical health, and in-person examinations such as biometric screenings. Some employers have incentive programs that reward or penalize employees for a range of activities including participating in wellness programs or meeting biometric outcomes.
Fifty percent of large employers offering health benefits provide employees with an opportunity or require employees to complete a health risk assessment. A health risk assessment includes questions about medical history, health status, and lifestyle, and is designed to identify the health risks of the person being assessed. Large firms are more likely than small firms to offer an opportunity or require employees to complete a health risk assessment (50% vs. 18%). Among firms with a health risk assessment, 62% of large firms report that they provide incentives to employees that complete the assessment. There is significant variation in the percentage of employees that complete a health risk assessment among firms; 27% of large firms with a health risk assessment report that more than three-quarters of employees complete the screening while 41% report that a quarter or less complete it.
Biometric Screening. Fifty percent of large firms and 13% of small firms offering health benefits ask or offer employee the opportunity to complete a biometric screening. Biometric screening is a health examination that measures an employee’s risk factors such as body weight, cholesterol, blood pressure, stress, and nutrition. Among large firms with biometric screening programs, 56% offer employees incentives to complete a biometric screening. Among firms with a biometric screening program and an incentive to complete it, 20% have a reward or penalty for meeting specified biometric outcomes such as achieving a target body mass index (BMI) or cholesterol level. The maximum financial value for meeting biometric outcomes ranges considerably across these firms: 16% have a maximum annual incentive of $150 or less and 28% have a maximum annual incentive of more than $1,000.
Wellness Programs. Many employers offer wellness or health promotion programs to improve their employees’ health. Eighty-one percent of large employers (200 or more workers) and 49% of small employers offer employees programs to help them stop smoking, lose weight, or make other lifestyle or behavioral changes. Of firms offering health benefits and a wellness program, 38% of large firms and 15% of small firms offer employees a financial incentive to participate in or complete a wellness program. Among large firms with an incentive to participate in or complete a wellness program, 27% of firms believe that incentives are “very effective” at encouraging employees to participate (Exhibit I).

Exhibit I: Among Large Firms (200 or more workers) Offering Health Benefits, Percentage of Firms Offering Incentives for Various Wellness and Health Promotion Activities, 2015
Disease management programs. Disease management programs try to improve the health and reduce the costs for enrollees with chronic conditions. Thirty-two percent of small employers and 68% of large employers offer disease management programs. Among firms with disease management programs, eight percent of large firms and 24% of firms with 5,000 or more workers offer a financial incentive to employees who participate.
PROVIDER NETWORKS
High Performance or Tiered Networks. Seventeen percent of employers offering health benefits have high performance or tiered networks in their largest health plan. These programs identify providers that are more efficient or have higher quality care, and may provide financial or other incentives for enrollees to use the selected providers. Firms with 1,000-4,999 workers are more likely to have a largest plan that includes a high performance or tiered network (33%) than firms in other size categories.
Narrow Networks. Some employers limit their provider networks to reduce the cost of the plan. Nine percent of employers reported that their plan eliminated hospitals or a health system to reduce cost and 7% offer a plan considered a narrow network plan. These plans typically have a provider network more limited than the standard HMO network.
Telemedicine. Telemedicine includes exchanging heath information electronically, including through smart phones or webcasts in order to improve a patient’s health. The largest health plan at 27% of large firms (2oo or more workers) offering health benefits covers telemedicine.
OTHER TOPICS
Pre-Tax Premium Contributions. Thirty-seven percent of small firms and 90% of large firms have a plan under section 125 of the Internal Revenue Service Code (sometimes called a premium-only plan) to allow employees to use pre-tax dollars to pay for a share of health insurance premiums.
Flexible Spending Accounts. Seventeen percent of small firms and 74% of large firms offer employees the option of contributing to a flexible spending account (FSA). FSAs permit employees to make pre-tax contributions that may be used during the year to pay for eligible medical expenses. The Affordable Care Act put some additional limits on FSAs, including capping the amount that could be contributed in a year ($2,550 in 2015) and limits on the use of FSA dollars for non-prescribed over the counter medications and premiums.3 Three percent of firms not offering health benefits offered an FSA in 2015.
Waiting Periods and Enrollment. With exceptions for orientation periods and variable hour employees, the ACA limits waiting periods to no more than 90 days for all group health plans.4 The average waiting period for covered workers who face a waiting period decreased from 2.1 months in 2014 to 2 months in 2015. The provision of the Affordable Care Act requiring employers with 200 or more full-time employees to automatically enroll eligible new full-time employees in one of the firm’s health plans after any waiting period has not yet taken effect. In 2015, 13% of large employers (200 or more workers) and 42% of small employers automatically enroll eligible employees.
Self-Funding. Seventeen percent of covered workers at small firms and 83% of covered workers at large firms are enrolled in plans that are either partially or completely self-funded. Overall, 63% of covered workers are enrolled in a plan that is either partially or completely self-funded, 60% of whom are covered by additional insurance against high claims, sometimes known as stop loss coverage. The percentage of covered workers at both small and large firms in self-funded plans is similar to the percentage reported in 2010.
Private Exchanges. Private exchanges are arrangements created by consultants, brokers or insurers that allow employers to offer their employees a choice of different benefit options, often from different insurers. While these arrangements are fairly new, 17% of firms with more than 50 employees offering health benefits say they are considering offering benefits through a private exchange. Twenty-two percent of employers with 5,000 or more employees are considering this option. Enrollment to this point has been modest: 2% of covered workers in firms with more than 50 employees are enrolled in a private exchange.
Professional Employment Organization. Some firms provide for health and other benefits by entering into a co-employment relationship with a Professional Employer Organization (PEO). Under this arrangement, the firm manages the day-to-day responsibilities of employees but the PEO hires the employees and acts as the employer for insurance, benefits, and other administrative purposes. Five percent of employers offering health benefits with between 3 and 499 workers offer coverage through a PEO.
Grandfathered Health Plans. The ACA exempts “grandfathered” health plans from a number of its provisions, such as the requirements to cover preventive benefits without cost sharing or the new rules for small employers’ premiums ratings and benefits. An employer-sponsored health plan can be grandfathered if it covered a worker when the ACA became law (March 23, 2010) and if the plan has not made significant changes that reduce benefits or increase employee costs.5 Thirty-five percent of firms offering health benefits offer at least one grandfathered health plan in 2015. Twenty-five percent of covered workers are enrolled in a grandfathered health plan in 2015.
EXCISE TAX ON HIGH-COST HEALTH PLANS
Beginning in 2018, employer health plans will be will be subject to an excise tax of 40% on the amount by which their cost exceeds specified thresholds ($10,200 for single coverage and $27,000 for family coverage in 2018).6 The tax is calculated with respect to each employee based on the combinations of health benefits received by that employee, including the employer and employee share of health plan premiums (or premium equivalents for self-funded plans), FSA contributions, and employer contributions to health savings accounts and health reimbursement arrangement contributions. Fifty-three percent of large firms (200 or more workers) offering health benefits have conducted an analysis to determine if they will exceed the 2018 thresholds, with 19% of these firms saying that their largest health plan would exceed the 2018 threshold. A small percentage of large employers offering health benefits report that they already have made changes to their plans’ coverage or cost-sharing requirements (13%) or switched to a lower cost plan (8%) in response to the anticipated tax (Exhibit J).
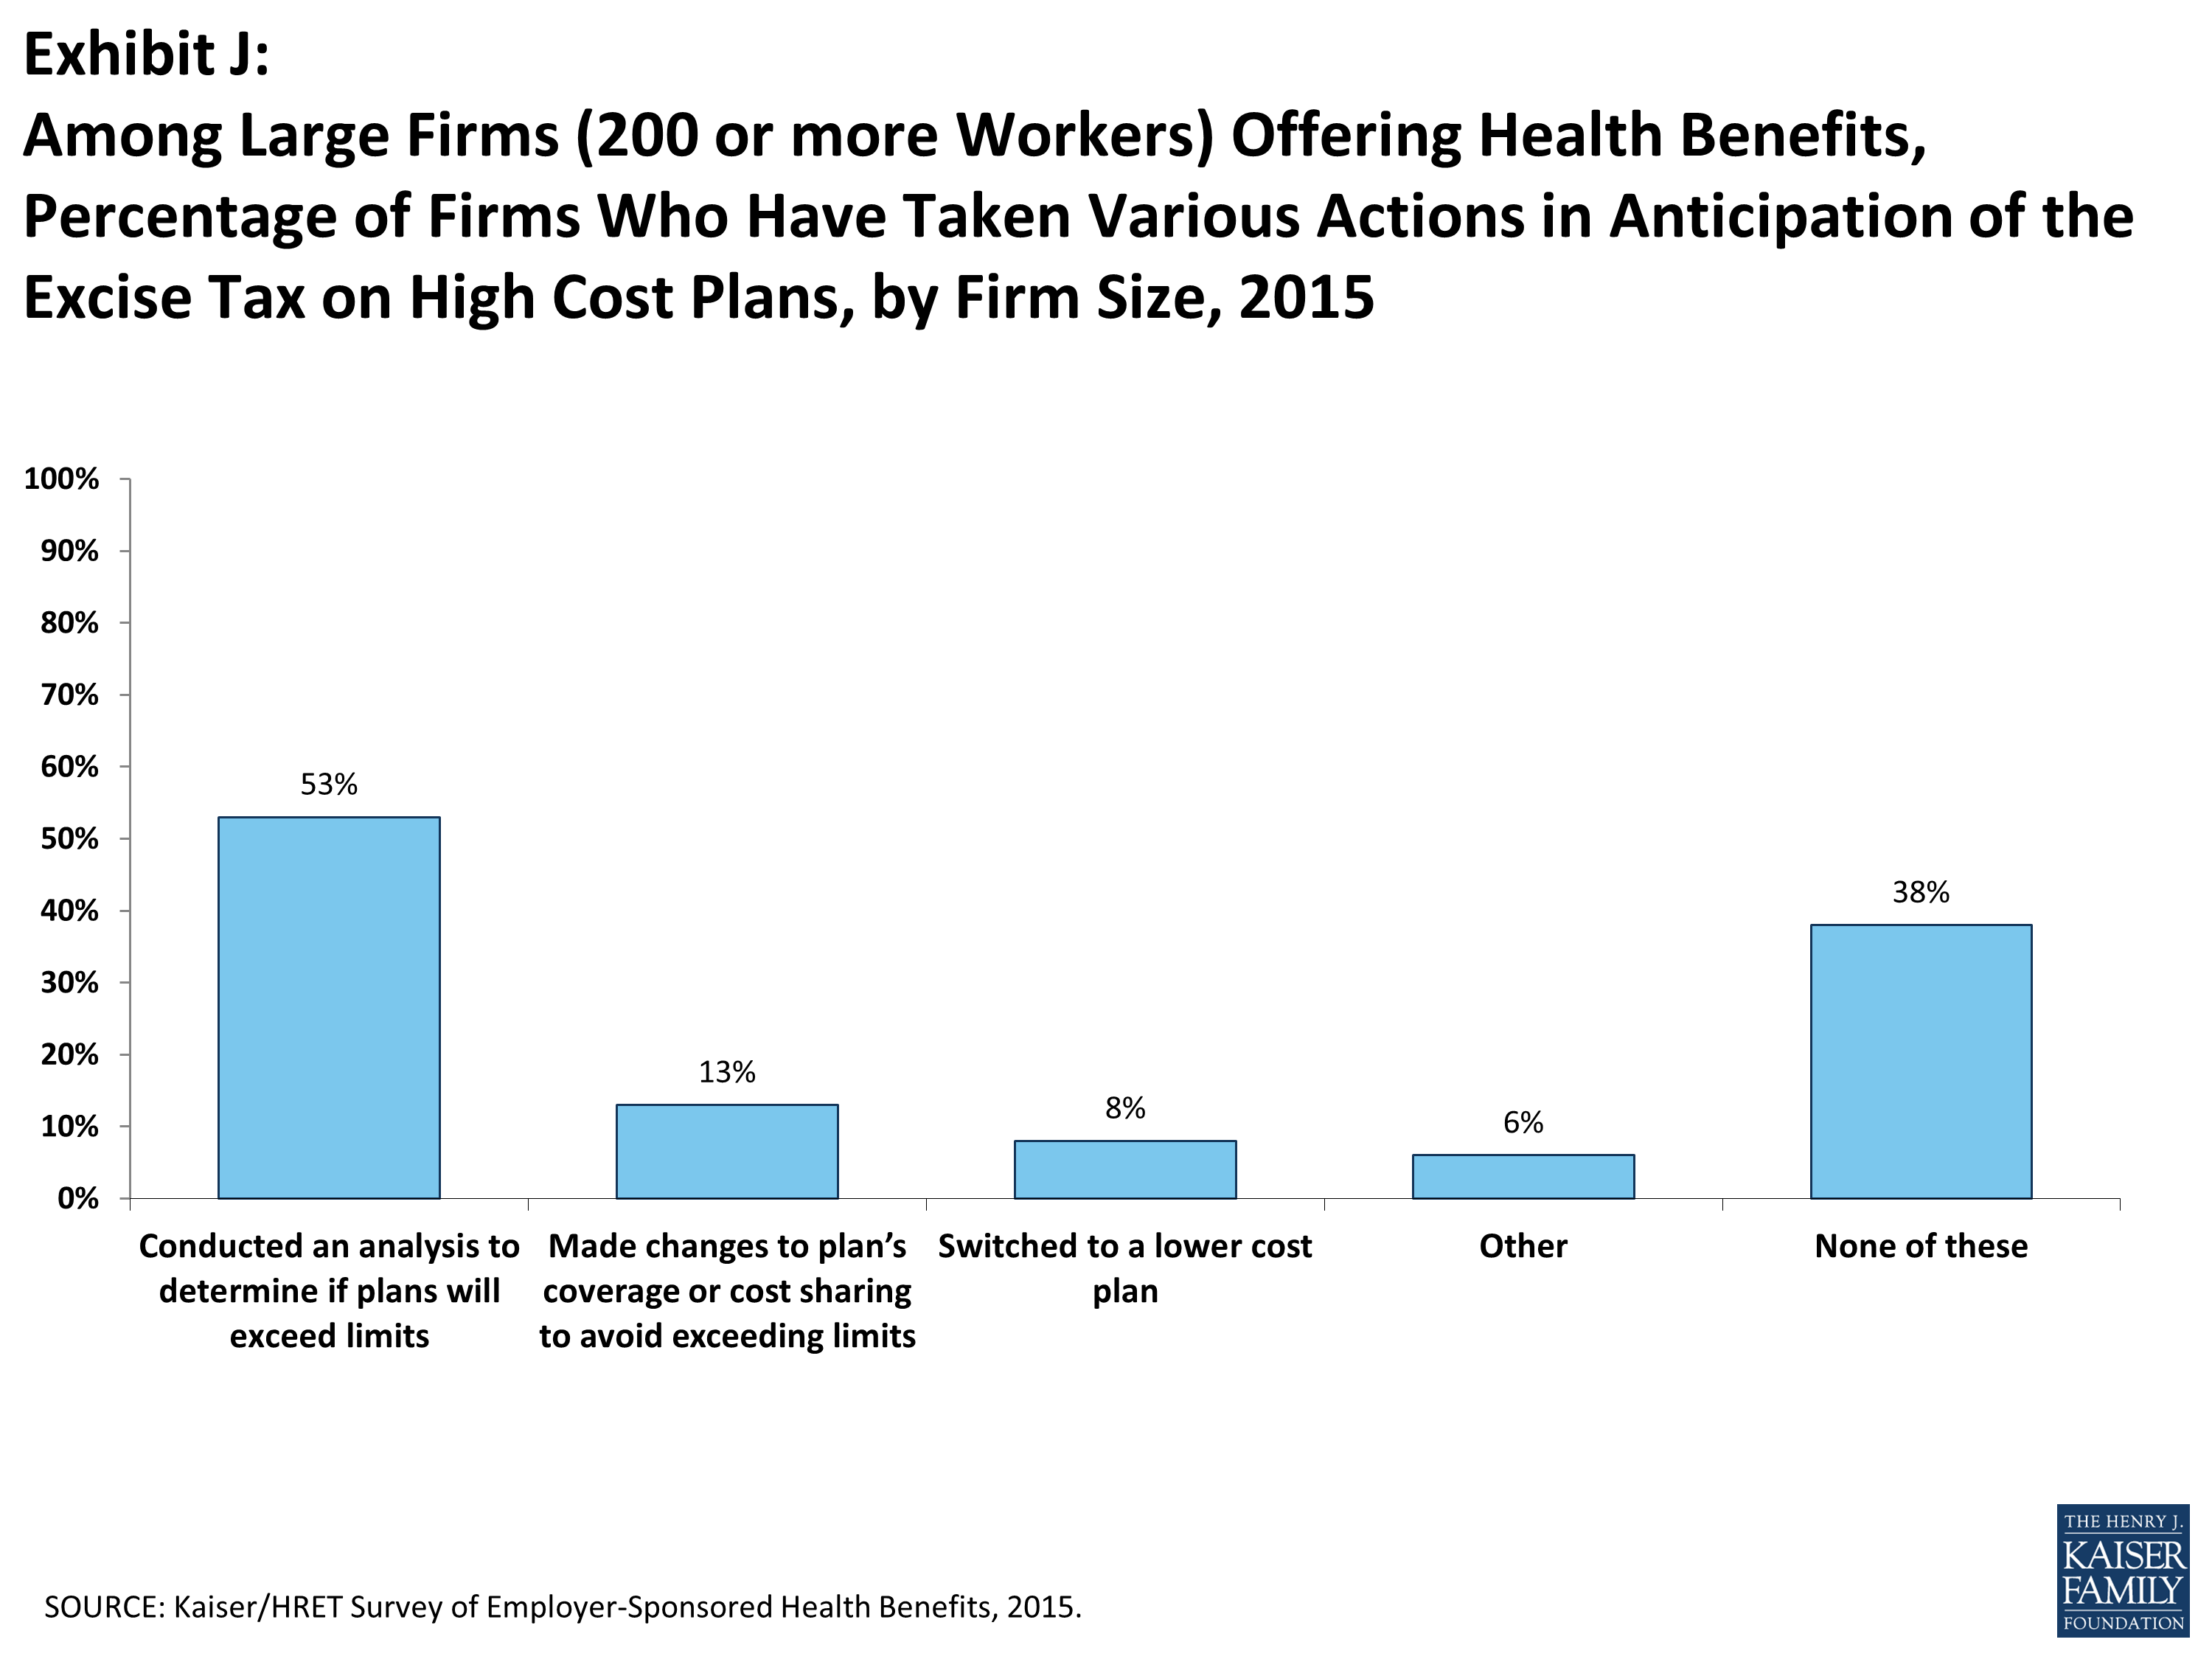
Exhibit J: Among Large Firms (200 or more Workers) Offering Health Benefits, Percentage of Firms Who Have Taken Various Actions in Anticipation of the Excise Tax on High Cost Plans, by Firm Size, 2015
CONCLUSION
The continuing implementation of the ACA has brought about a number of changes for employer-based coverage, ranging from benefits changes (such as the requirement to cover certain preventive care without cost sharing or have an out-of-pocket limit) to the requirement for larger employers to offer coverage to their full-time workers or face financial penalties. Even with these new requirements, most market fundamentals have stayed consistent with prior trends, suggesting that the implementation has not caused significant disruption for most market participants. Premiums for single and family coverage increased by 4% in 2015, continuing a fairly long period (2005 to 2015) where annual premium growth has averaged about 5%. The percentage of employers offering coverage (57%) is similar to recent years,7 as is the percentage of workers in offering firms covered by their own employer (63%). The offer and coverage rates have been declining very gradually since we have been doing the survey, with the current values generally below those we saw prior to 2005.
The stability we have seen over the last several years does not mean that no changes are occurring. Employers continue to focus on wellness and health promotion and extend their programs to assess health risk; here programs that collect personal health information and provide financial incentives for employees to undertake health programs or meet biometric targets have the potential to significantly alter how people with employer-based coverage interact with their health plan. Employers, particularly large employers, continue to show interest in private exchanges, although enrollment to date is not very large. If these exchanges succeed, they have the potential to move some of the decision-making about benefits away from employers, which could transform how employees and employers interact over benefits.
While the ACA has not transformed the market, changes are occurring and more are likely to come. Some employers report that they have modified job classifications in reaction to the employer requirement to offer benefits, with more reporting that they increased the number of jobs with full-time status than decreasing it. Additionally, five percent of large employers (200 or more workers) reported that they intend to reduce the number of full-time employees that they intend to hire because of the cost of providing health care benefits. Employers also are considering the potential impacts that the high-cost plan tax may have on their health benefits, with small percentages already taking action to lower plan costs. Over a longer period, the high-cost plan tax has the potential to cause significant changes in employer-sponsored coverage as employers and workers look for ways to keep cost increases to inflation far below the even moderate premium increases we have seen in recent years.
Whether the period of moderate premium growth will continue as the economy improves is one the biggest questions facing the employer market. Higher costs tend to follow improvements in economic growth,8 and recent increases in spending for health services will put upward pressure on premiums.9 At the same time, concerns about the high-cost plan tax will have employers and insurers looking for savings. These competing pressures may well lead to plan changes such as tighter networks, stricter management and higher cost sharing as employers and insurers struggle to contain these higher costs.
METHODOLOGY
The Kaiser Family Foundation/Health Research & Educational Trust 2015 Annual Employer Health Benefits Survey (Kaiser/HRET) reports findings from a telephone survey of 1,997 randomly selected public and private employers with three or more workers. Researchers at the Health Research & Educational Trust, NORC at the University of Chicago, and the Kaiser Family Foundation designed and analyzed the survey. National Research, LLC conducted the fieldwork between January and June 2015. In 2015, the overall response rate is 42%, which includes firms that offer and do not offer health benefits. Among firms that offer health benefits, the survey’s response rate is also 41%.
We asked all firms with which we made phone contact, even if the firm declined to participate in the survey: “Does your company offer a health insurance program as a benefit to any of your employees?” A total of 3,191 firms responded to this question (including the 1,997 who responded to the full survey and 1,194 who responded to this one question). Their responses are included in our estimates of the percentage of firms offering health coverage. The response rate for this question is 67%.
Since firms are selected randomly, it is possible to extrapolate from the sample to national, regional, industry, and firm size estimates using statistical weights. In calculating weights, we first determine the basic weight, then apply a nonresponse adjustment, and finally apply a post-stratification adjustment. We use the U.S. Census Bureau’s Statistics of U.S. Businesses as the basis for the stratification and the post-stratification adjustment for firms in the private sector, and we use the Census of Governments as the basis for post-stratification for firms in the public sector. Some numbers in the report’s exhibits do not sum up to totals because of rounding effects, and, in a few cases, numbers from distribution exhibits referenced in the text may not add due to rounding effects. Unless otherwise noted, differences referred to in the text and exhibits use the 0.05 confidence level as the threshold for significance.
For more information on the survey methodology, please visit the Methodology section at http://ehbs.kff.org/.
The Kaiser Family Foundation, a leader in health policy analysis, health journalism and communication, is dedicated to filling the need for trusted, independent information on the major health issues facing our nation and its people. The Foundation is a non-profit private operating foundation based in Menlo Park, California.
The Health Research & Educational Trust (HRET) is a private, not-for-profit organization involved in research, education, and demonstration programs addressing health management and policy issues. Founded in 1944, HRET, an affiliate of the American Hospital Association, collaborates with health care, government, academic, business, and community organizations across the United States to conduct research and disseminate findings that help shape the future of health care.
Report
Section One: Cost of Health Insurance
The average annual premiums in 2015 are $6,251 for single coverage and $17,545 for family coverage. The average single and family premiums increased 4% in the last year. The average family premium has increased 61% since 2005 and 27% since 2010. The average family premium for workers in small firms (3-199 workers) ($16,625) is significantly lower than average family premiums for workers in larger firms (200 or more workers) ($17,938).
Premium Costs for Single and Family Coverage
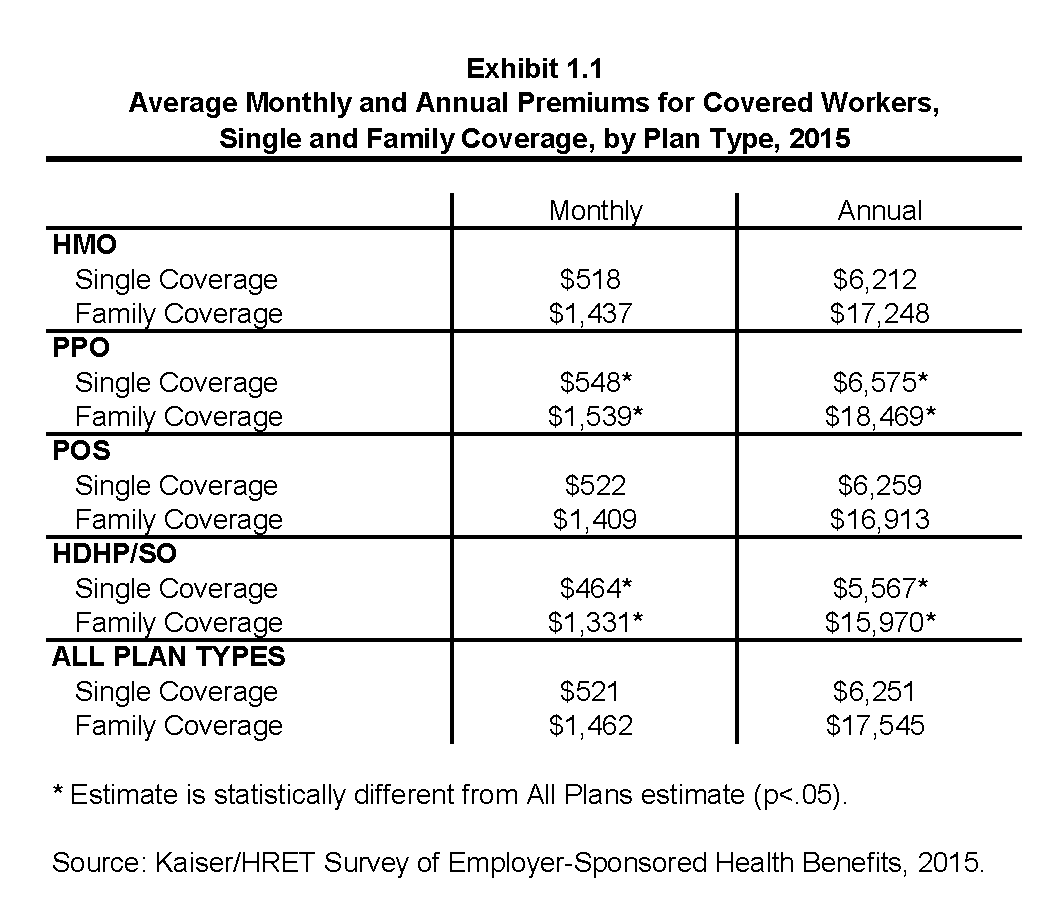
- The average premium for single coverage in 2015 is $521 per month, or $6,251 per year. The average premium for family coverage is $1,462 per month or $17,545 per year (Exhibit 1.1).
- The average annual premiums for covered workers in HDHP/SOs are lower for single ($5,567) and family coverage ($15,970) than the overall average premiums for covered workers. The average premiums for covered workers enrolled in PPO plans are higher for single ($6,575) and family coverage ($18,469) than the overall plan average. Average annual premiums for HMOs and POS plans are similar to the overall average premiums for covered workers (Exhibit 1.1).
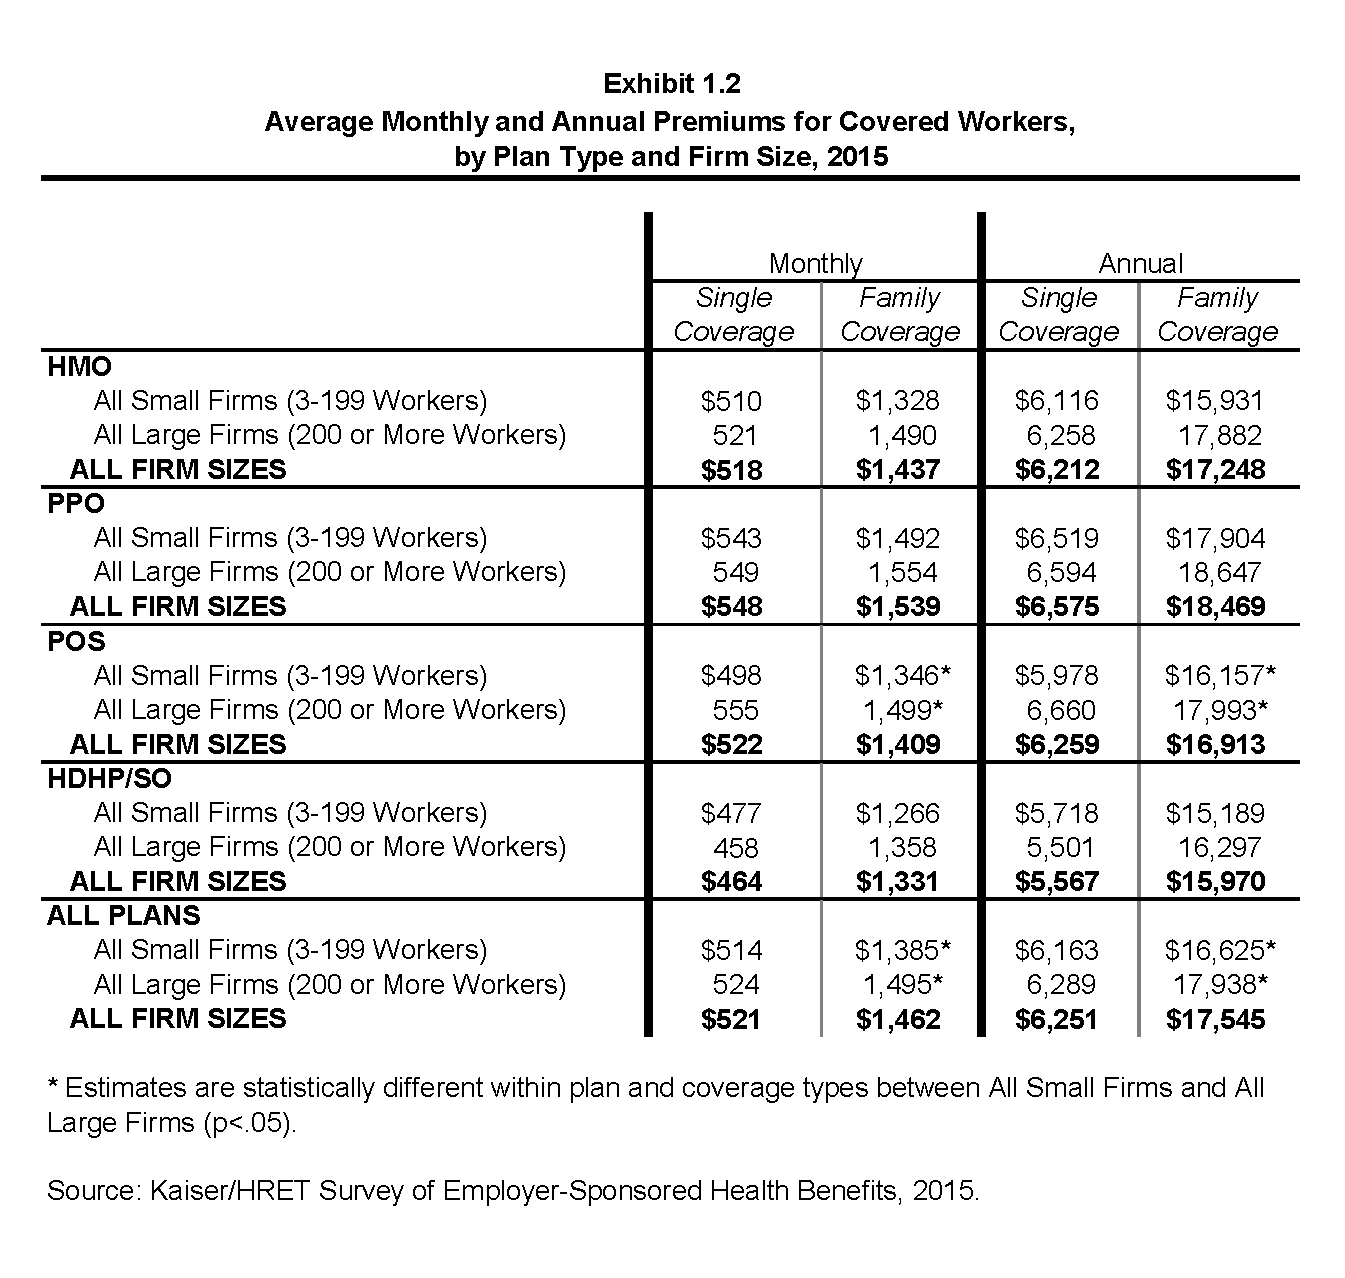
- The average annual premium for family coverage for covered workers in small firms (3-199 workers) ($16,625) is lower than the average premium for covered workers in large firms (200 or more workers) ($17,938) (Exhibit 1.2).
- Average single and family premiums for covered workers are higher in the Northeast ($6,631 and $19,074) and lower in the South ($6,052 and $16,985) than the average premiums for covered workers in all other regions (Exhibit 1.3).
- Average family premiums for covered workers employed in the retail industry ($15,801) are lower than the average premiums for covered workers in all other industries. The average family premium for covered workers employed in the health care industry is higher than the average premium for covered workers in all other industries ($19,200) (Exhibit 1.4).
- Covered workers in firms where 35% or more of the workers are age 26 or younger have lower average family premiums ($16,125) than covered workers in firms where a lower percentage of workers are age 26 or younger ($17,649) (Exhibit 1.6).
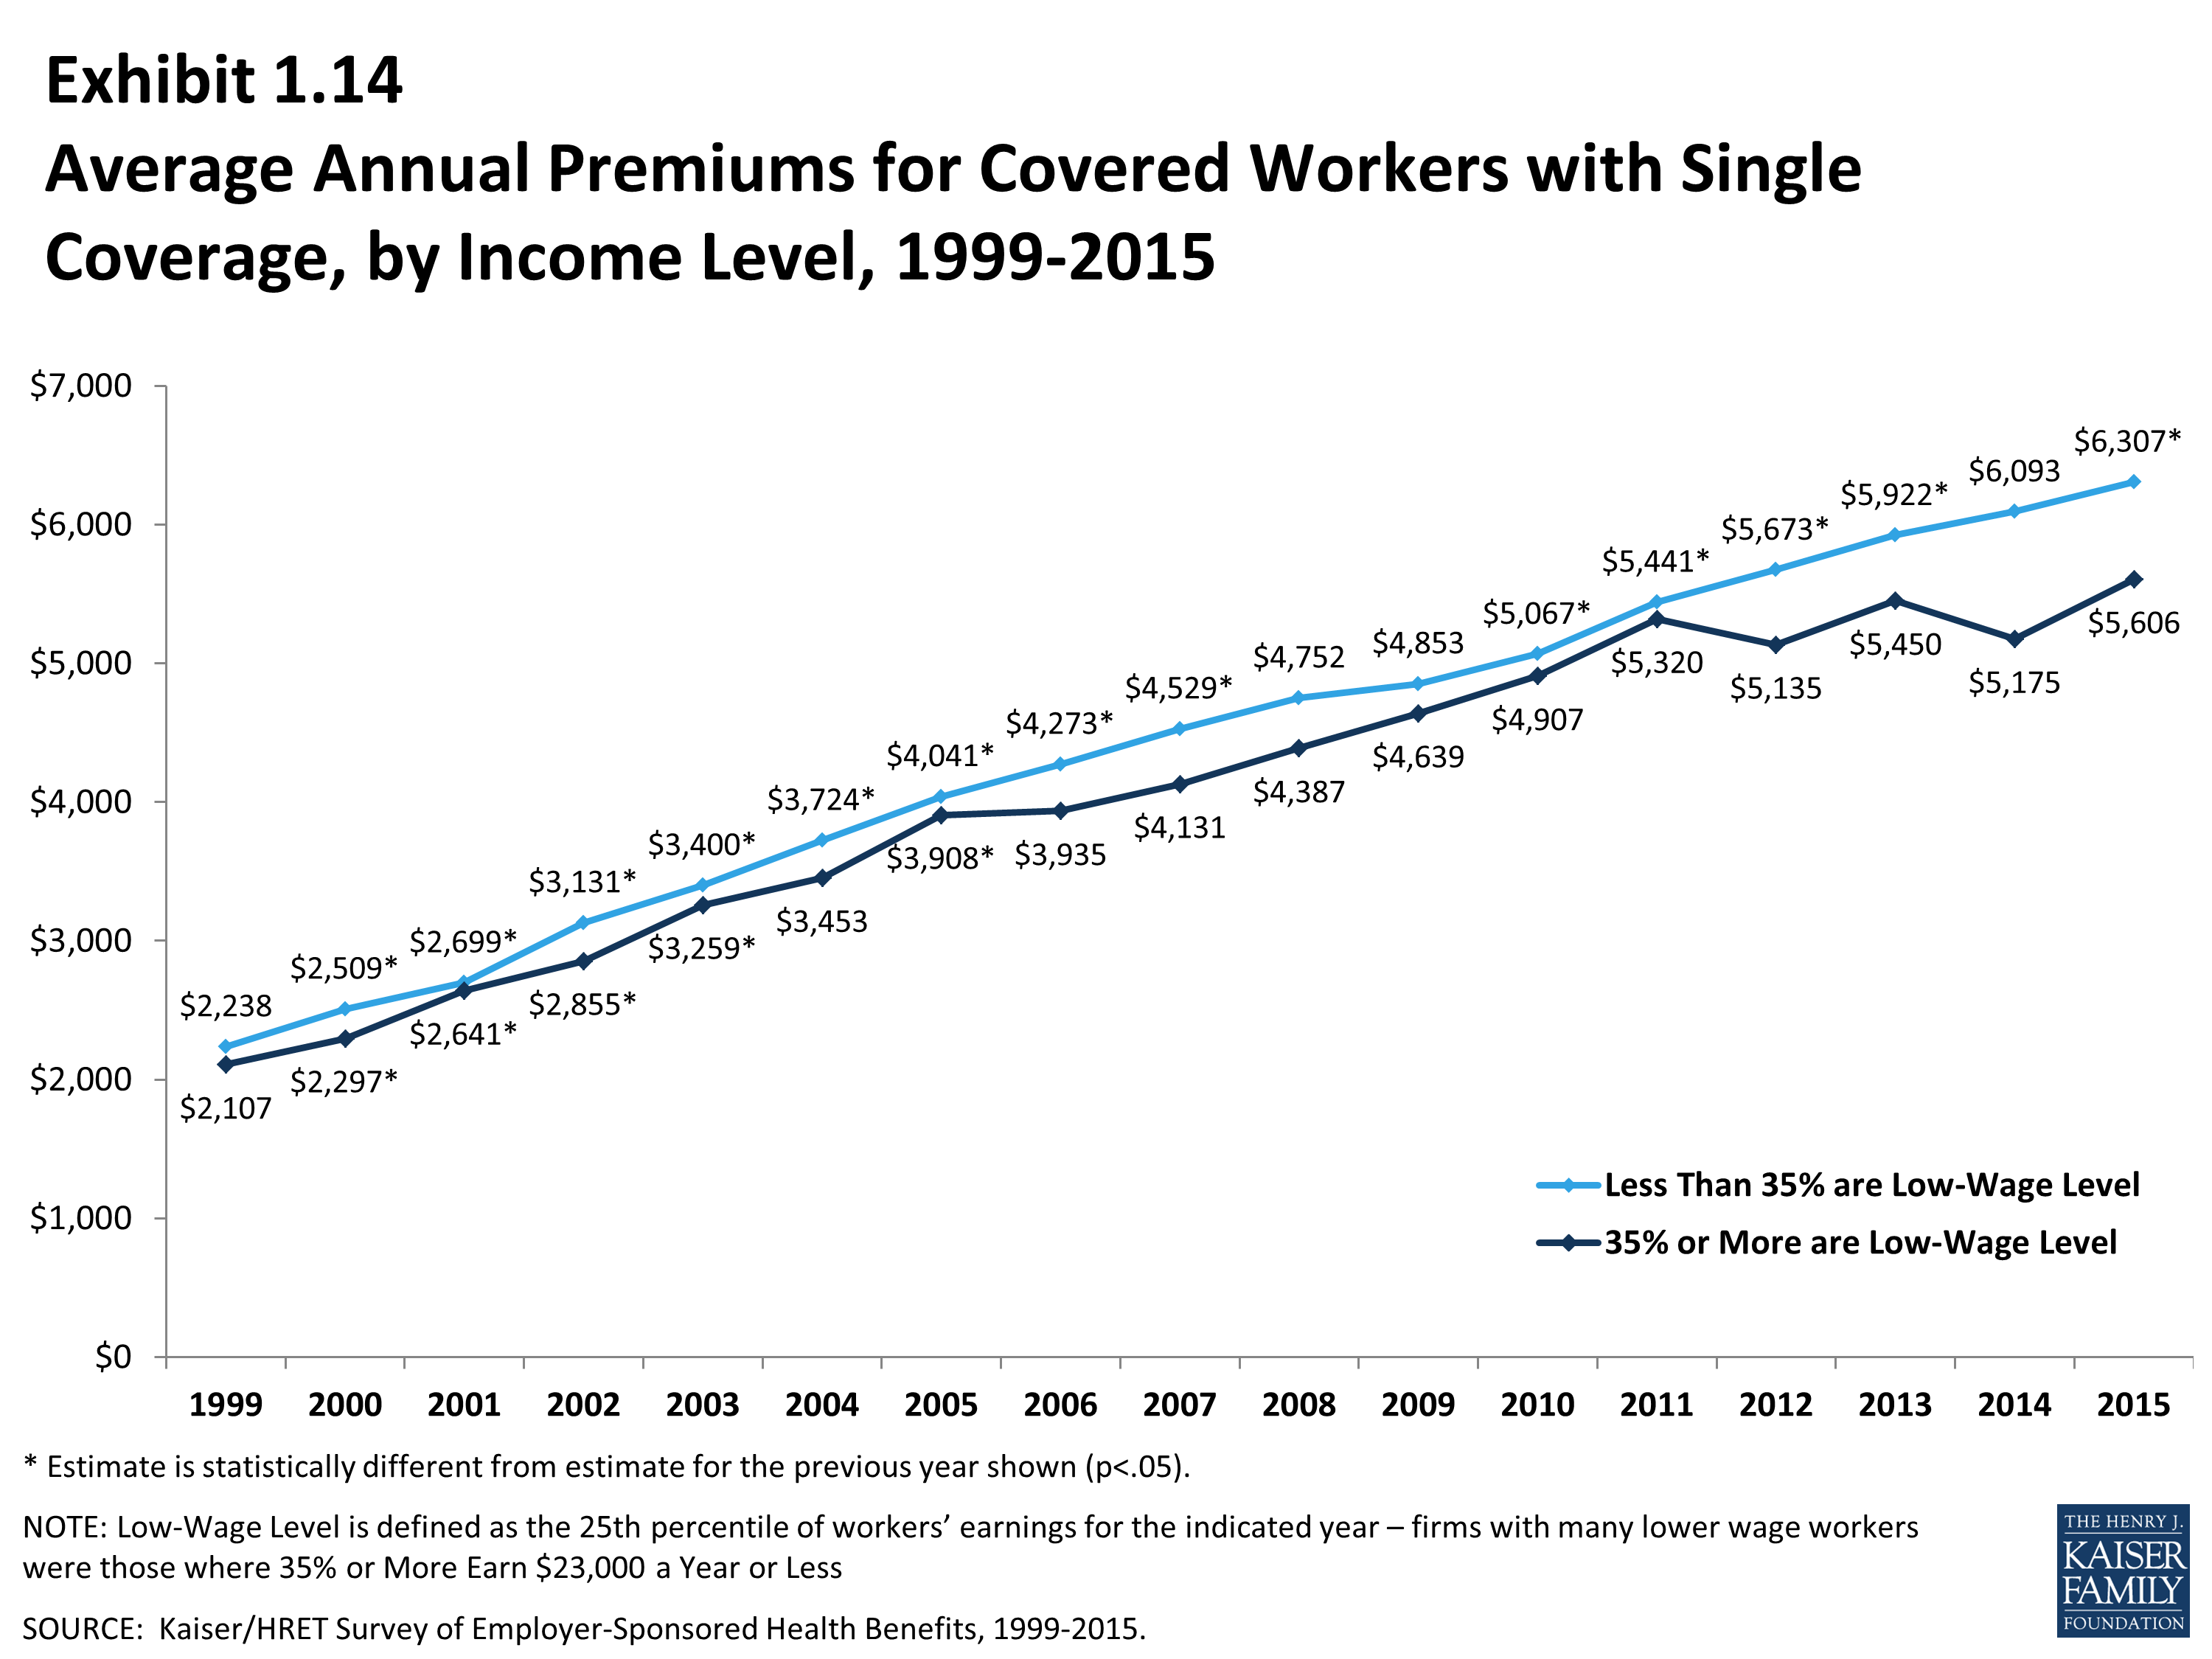
- Covered workers in firms with a large percentage of lower-wage workers (at least 35% of workers earn $23,000 per year or less) have lower average single and family premiums ($5,606 and $16,182) than covered workers in firms with a smaller percentage of lower-wage workers ($6,307 and $17,665). Covered workers in firms with a large percentage of higher-wage workers (at least 35% of workers earn $58,000 per year or more) have higher average family premiums ($18,130) than covered workers in firms with a smaller percentage of higher-wage workers ($16,923) (Exhibit 1.5) and (Exhibit 1.6).
- Covered workers in firms with some union workers have higher average premiums for single coverage and family coverage($6,508 and $18,305) than covered workers in firms without any union workers ($6,123 and $17,164).
The Distribution of Premiums
- There is considerable variation in premiums for both single and family coverage.
- Eighteen percent of covered workers are employed by firms that have a single coverage premium at least 20% higher than the average single premium, while 22% of covered workers are in firms that have a single premium less than 80% of the average single premium (Exhibit 1.7) and (Exhibit 1.8).
- For family coverage, 18% of covered workers are employed in a firm that has a family premium at least 20% higher than the average family premium, and another 22% of covered workers are in firms that have a family premium less than 80% of the average family premium (Exhibit 1.7) and (Exhibit 1.8).
- Six percent of covered workers enrolled in single coverage are in a plan with a premium of $9,000 a year or more, nearly 50% more expensive than the national average (Exhibit 1.9). Eight percent of covered workers enrolled in family coverage are in a plan with a premium of $24,000 a year or more (Exhibit 1.10).
Premium Changes Over Time
- The 2015 average single and family coverage premiums are four percent higher than the 2014 average premiums (Exhibit 1.11).
- The $17,545 average annual family premium in 2015 is 27% higher than the average family premium in 2010 and 61% higher than the average family premium in 2005 (Exhibit 1.11). The 27% premium growth in the last five years (2010 to 2015) is significantly smaller than the 69% premium growth seen between 2000 and 2005 (Exhibit 1.16).
- Premiums for both small and large firms have seen a similar increase since 2010 (25% for small and 28% for large). For small firms (3 to 199 workers), the average family premium rose from $13,250 in 2010 to $16,625 in 2015. For large firms (200 or more workers), the average family premium rose from $14,038 in 2010 to $17,938 in 2015 (Exhibit 1.13).
- The rate of growth for small firms and large firms since 2005 has been similar. Since 2005, premiums for small firms (3 to 199 workers) have increased 57% ($16,625 in 2015 vs. $10,587 in 2005), and premiums for large firms have increased 63% ($17,938 in 2015 vs. $11,025 in 2005) (Exhibit 1.13).
- For large firms (200 or more workers), the average family premium for covered workers in firms that are fully insured has grown at a similar rate to premiums for workers in fully or partially self-funded firms from 2010 to 2015 (22% for fully insured plans and 29% for self-funded firms) (Exhibit 1.17).
- The average family premium for self-funded plans is higher in 2015 than in 2014 ($17,939 vs. $17,229) (Exhibit 1.17).
Average Monthly and Annual Premiums for Covered Workers, Single and Family Coverage, by Plan Type, 2015
Average Monthly and Annual Premiums for Covered Workers, by Plan Type and Firm Size, 2015
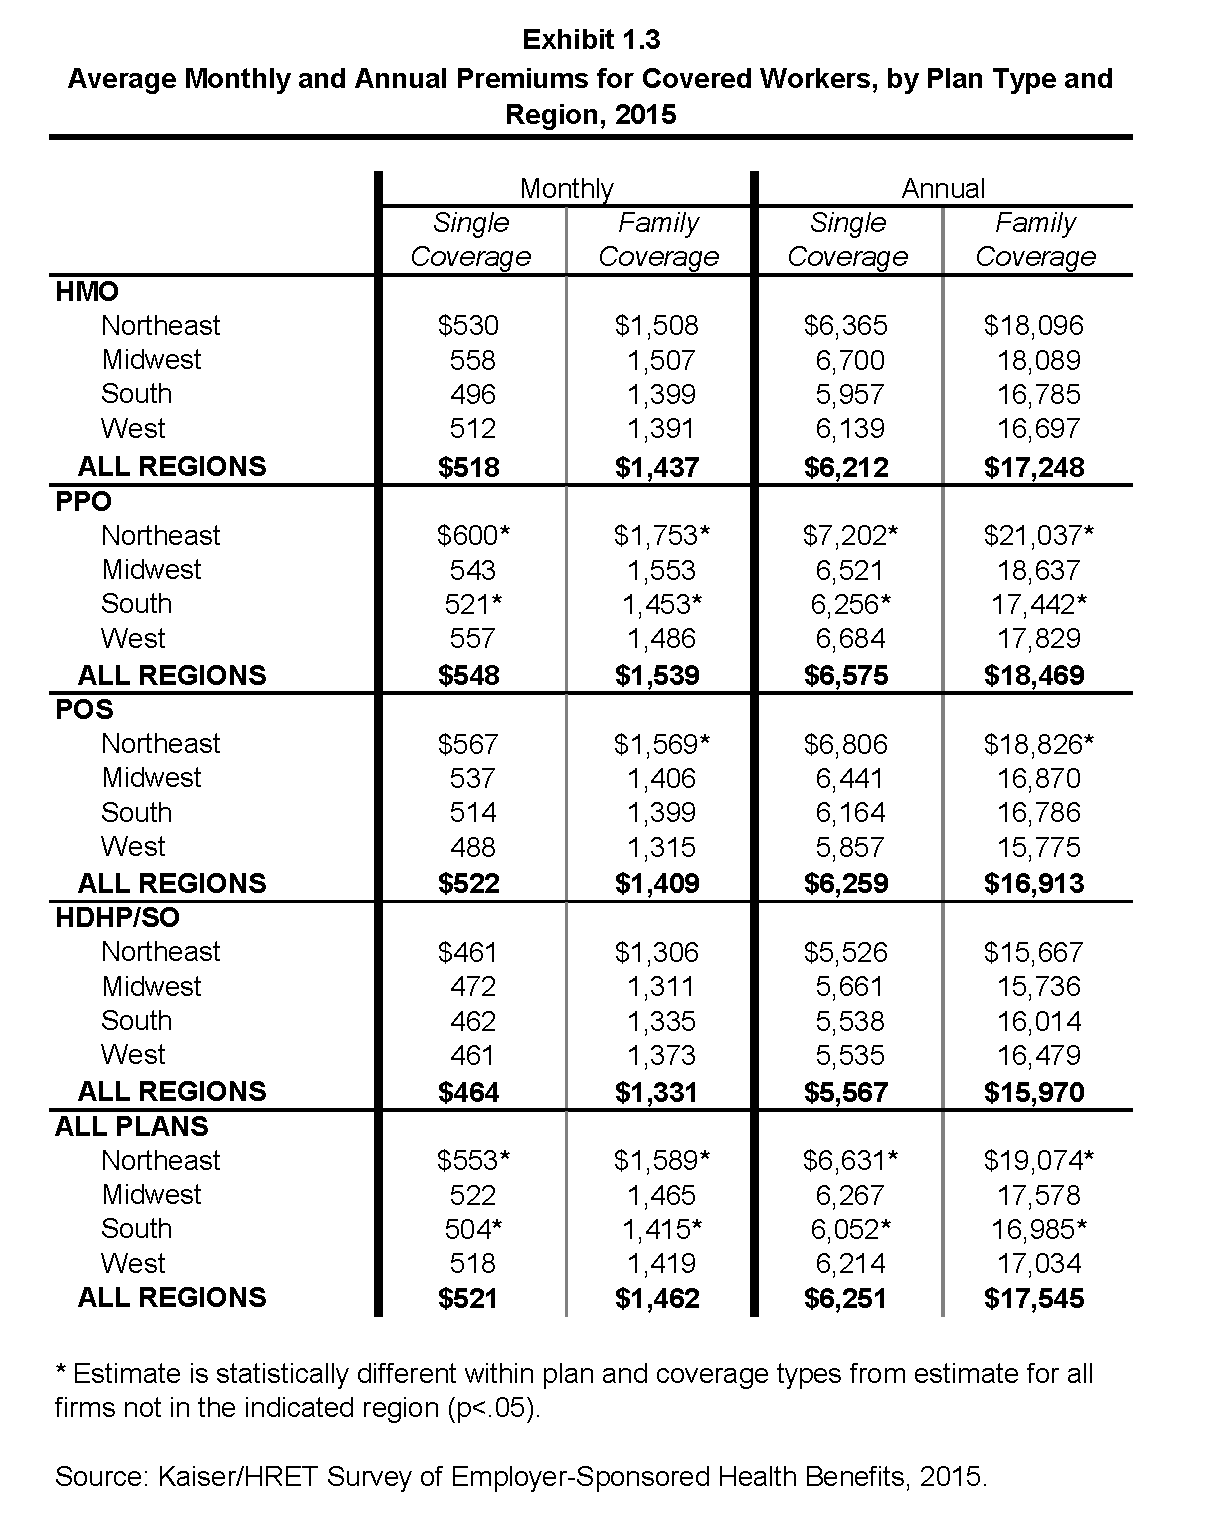
Average Monthly and Annual Premiums for Covered Workers, by Plan Type and Region, 2015
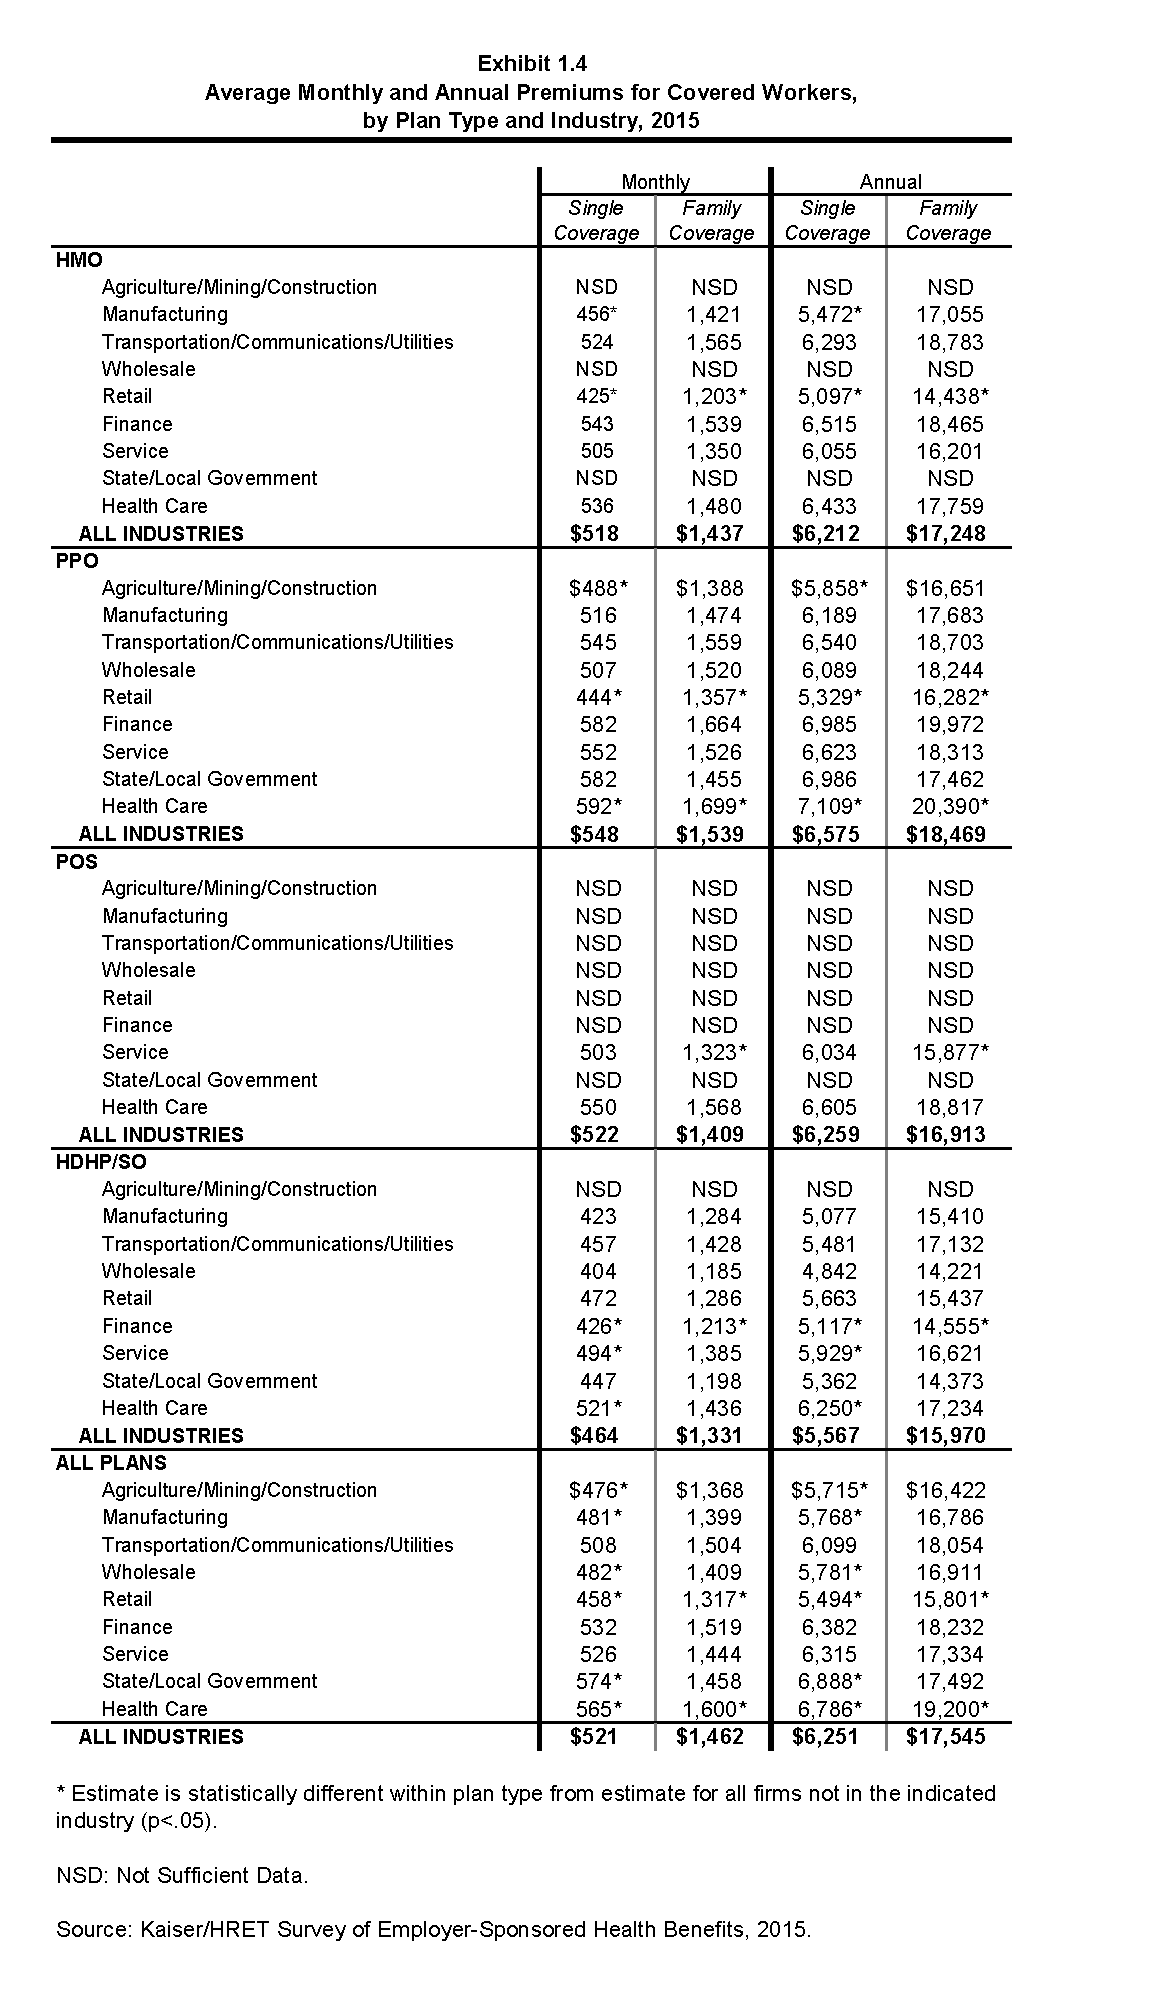
Average Monthly and Annual Premiums for Covered Workers, by Plan Type and Industry, 2015
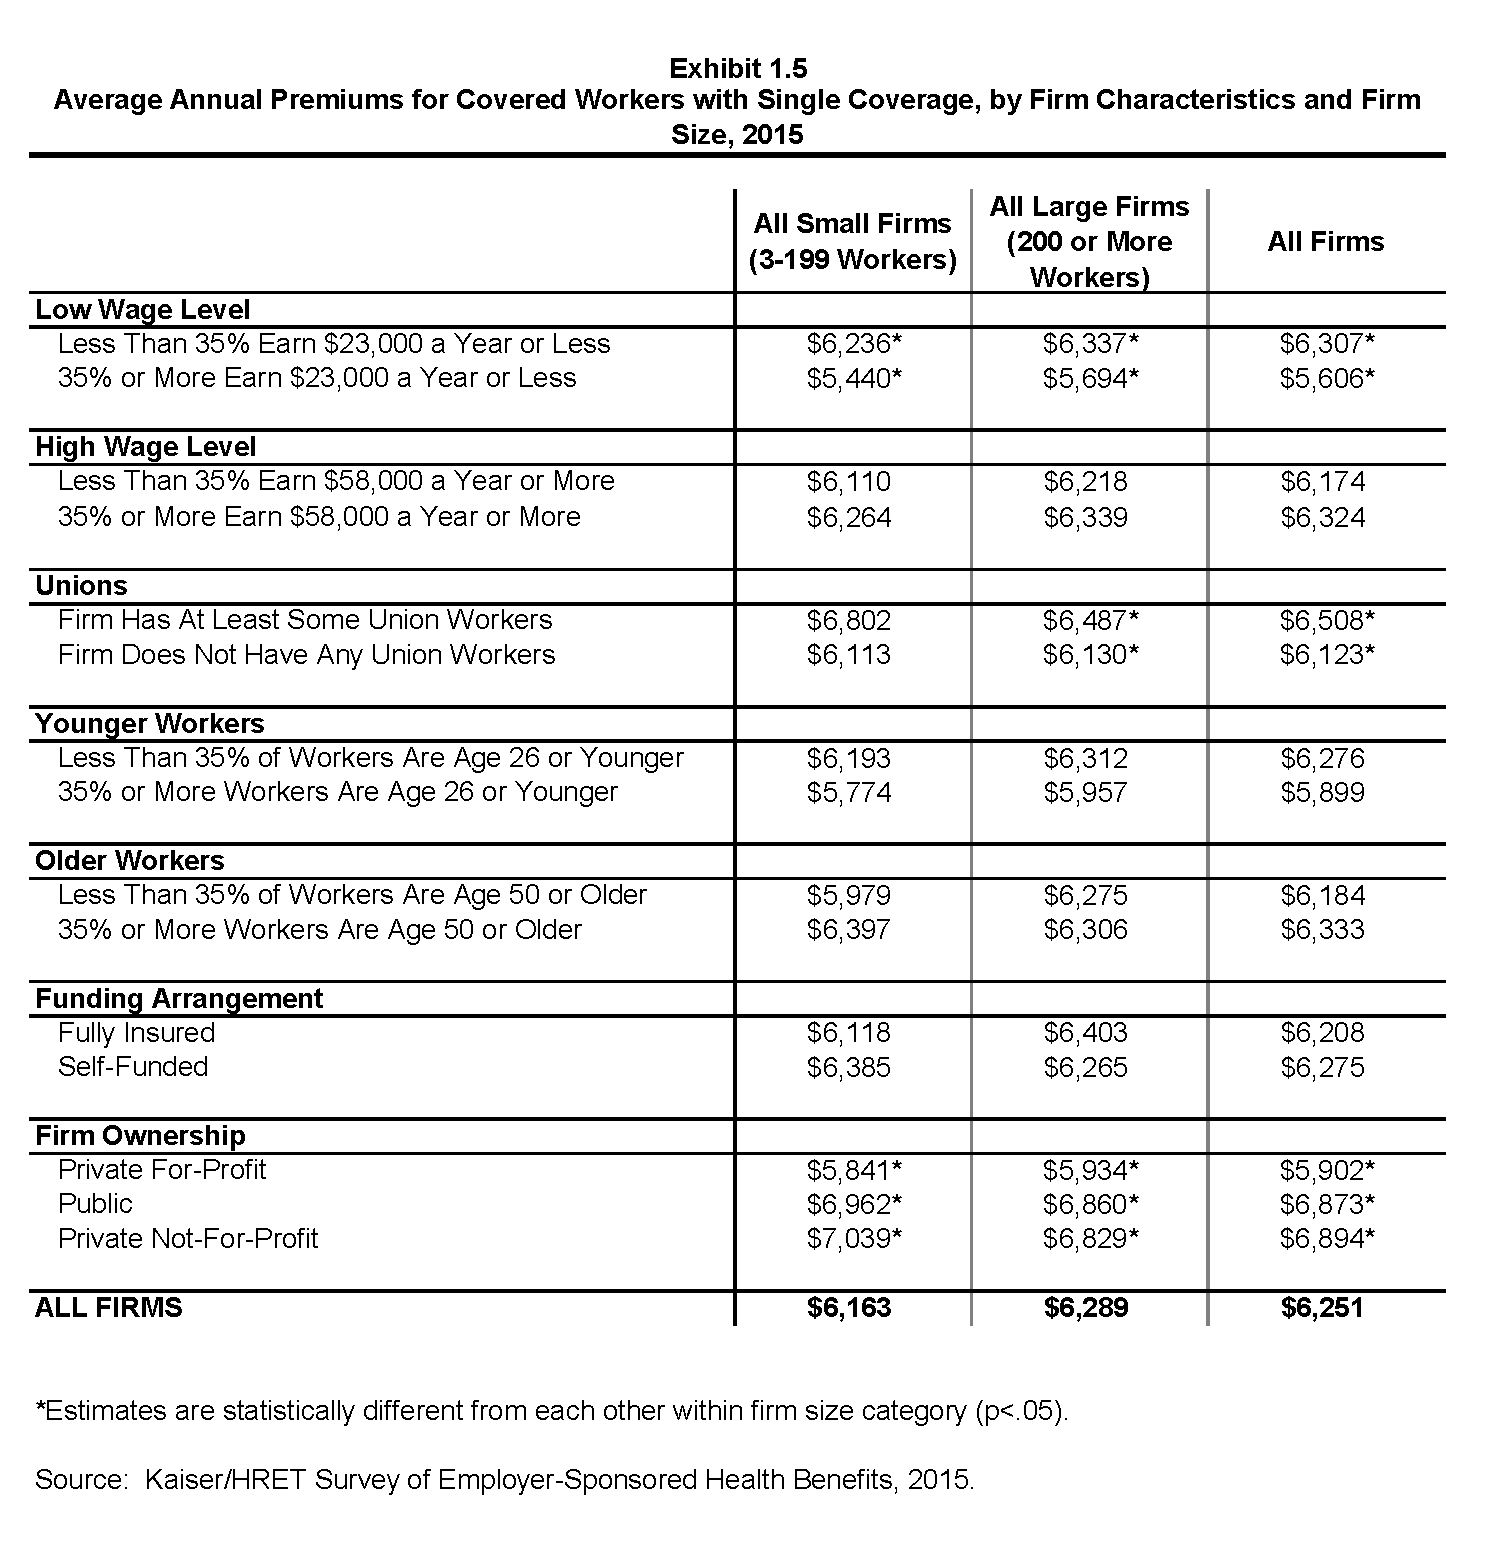
Average Annual Premiums for Covered Workers with Single Coverage, by Firm Characteristics and Firm Size, 2015
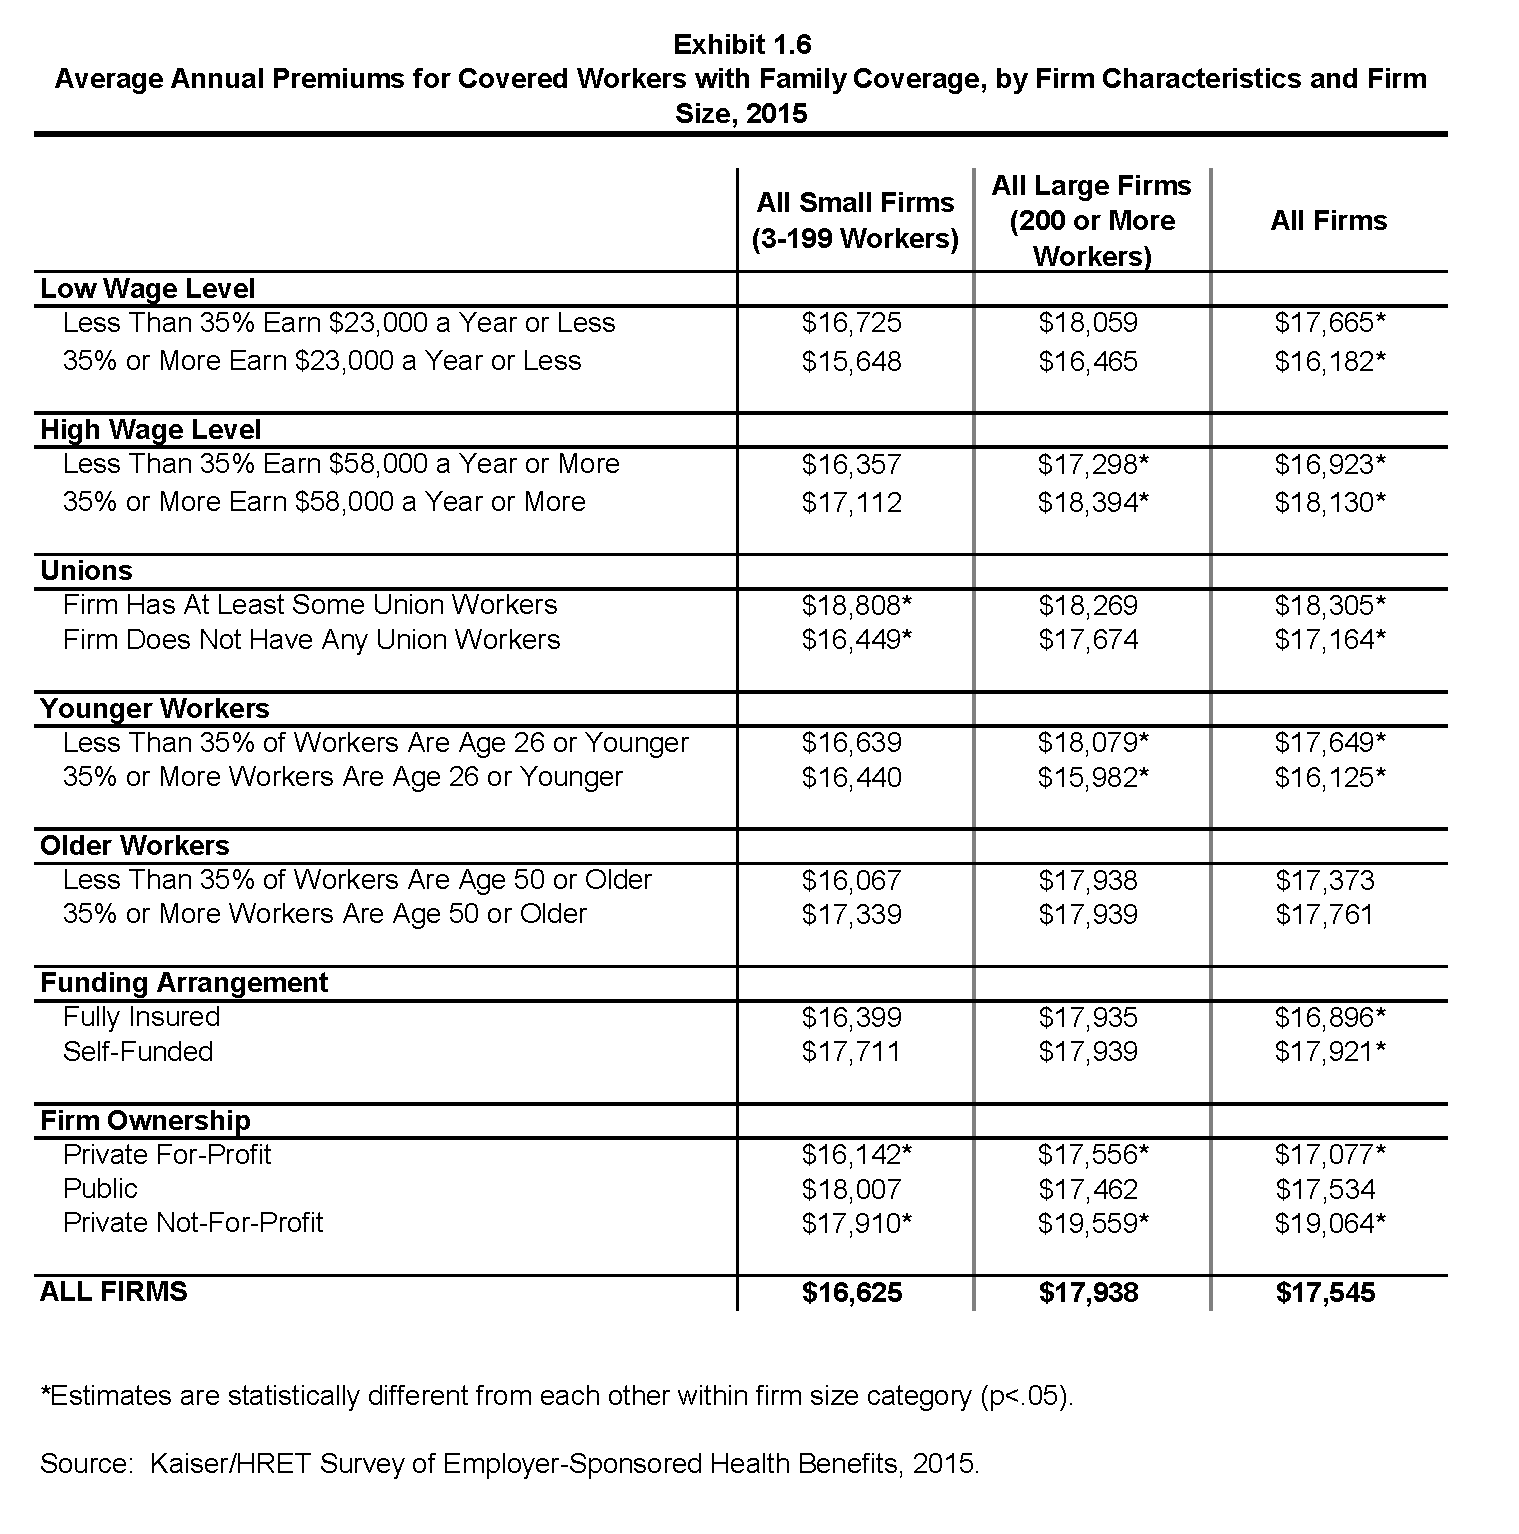
Average Annual Premiums for Covered Workers with Family Coverage, by Firm Characteristics and Firm Size, 2015
Distribution of Annual Premiums for Single and Family Coverage Relative to the Average Annual Single or Family Premium, 2015
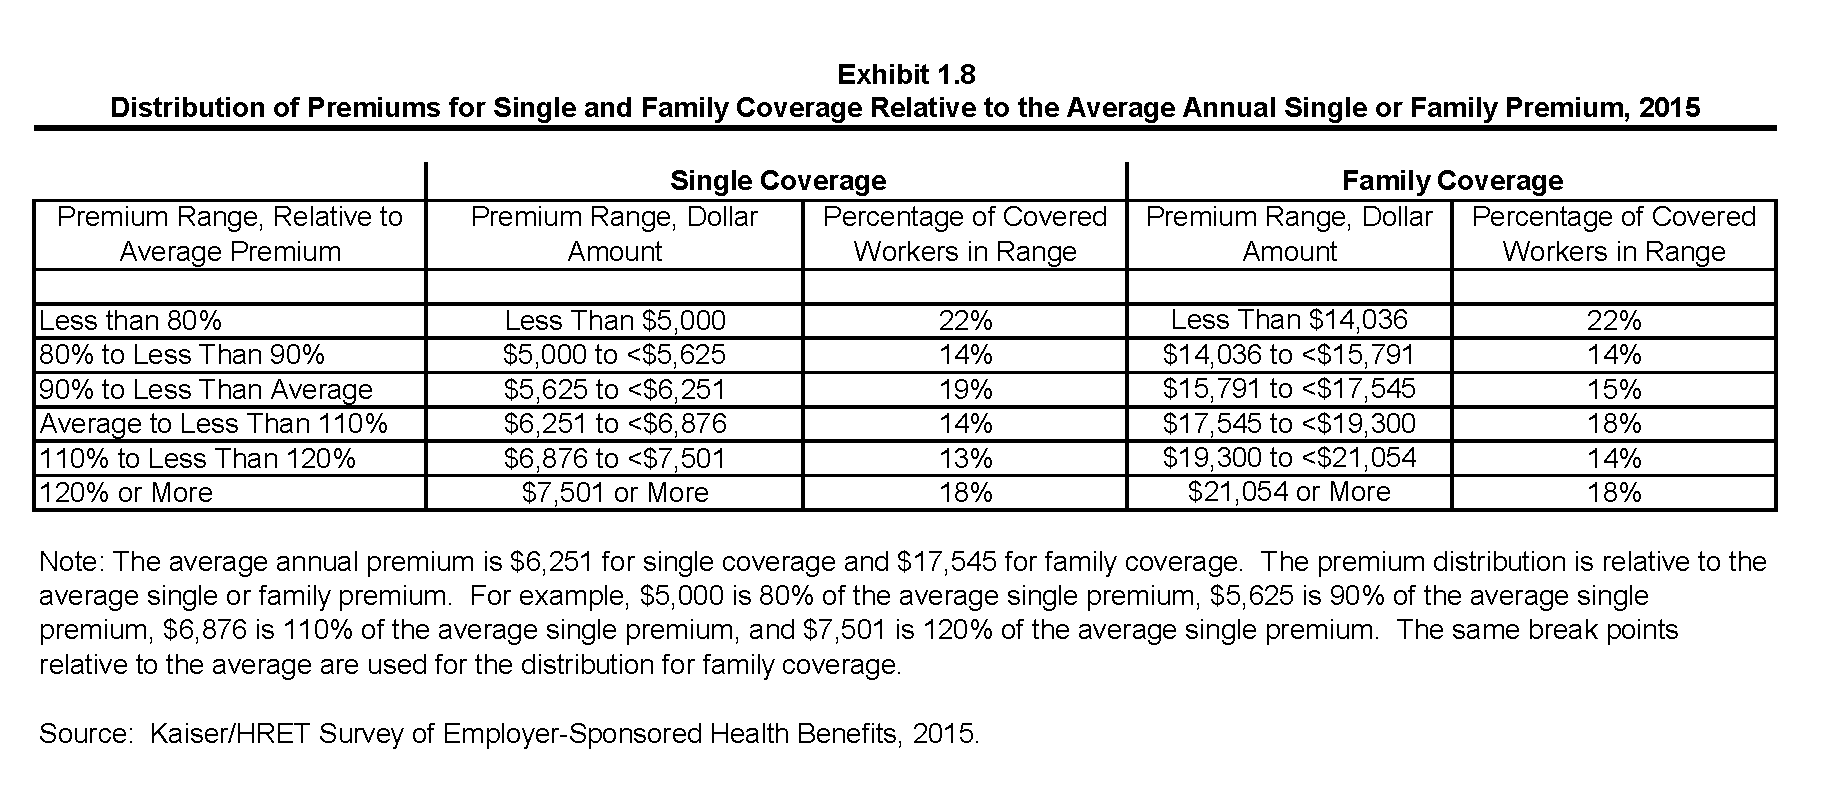
Distribution of Premiums for Single and Family Coverage Relative to the Average Annual Single or Family Premium, 2015
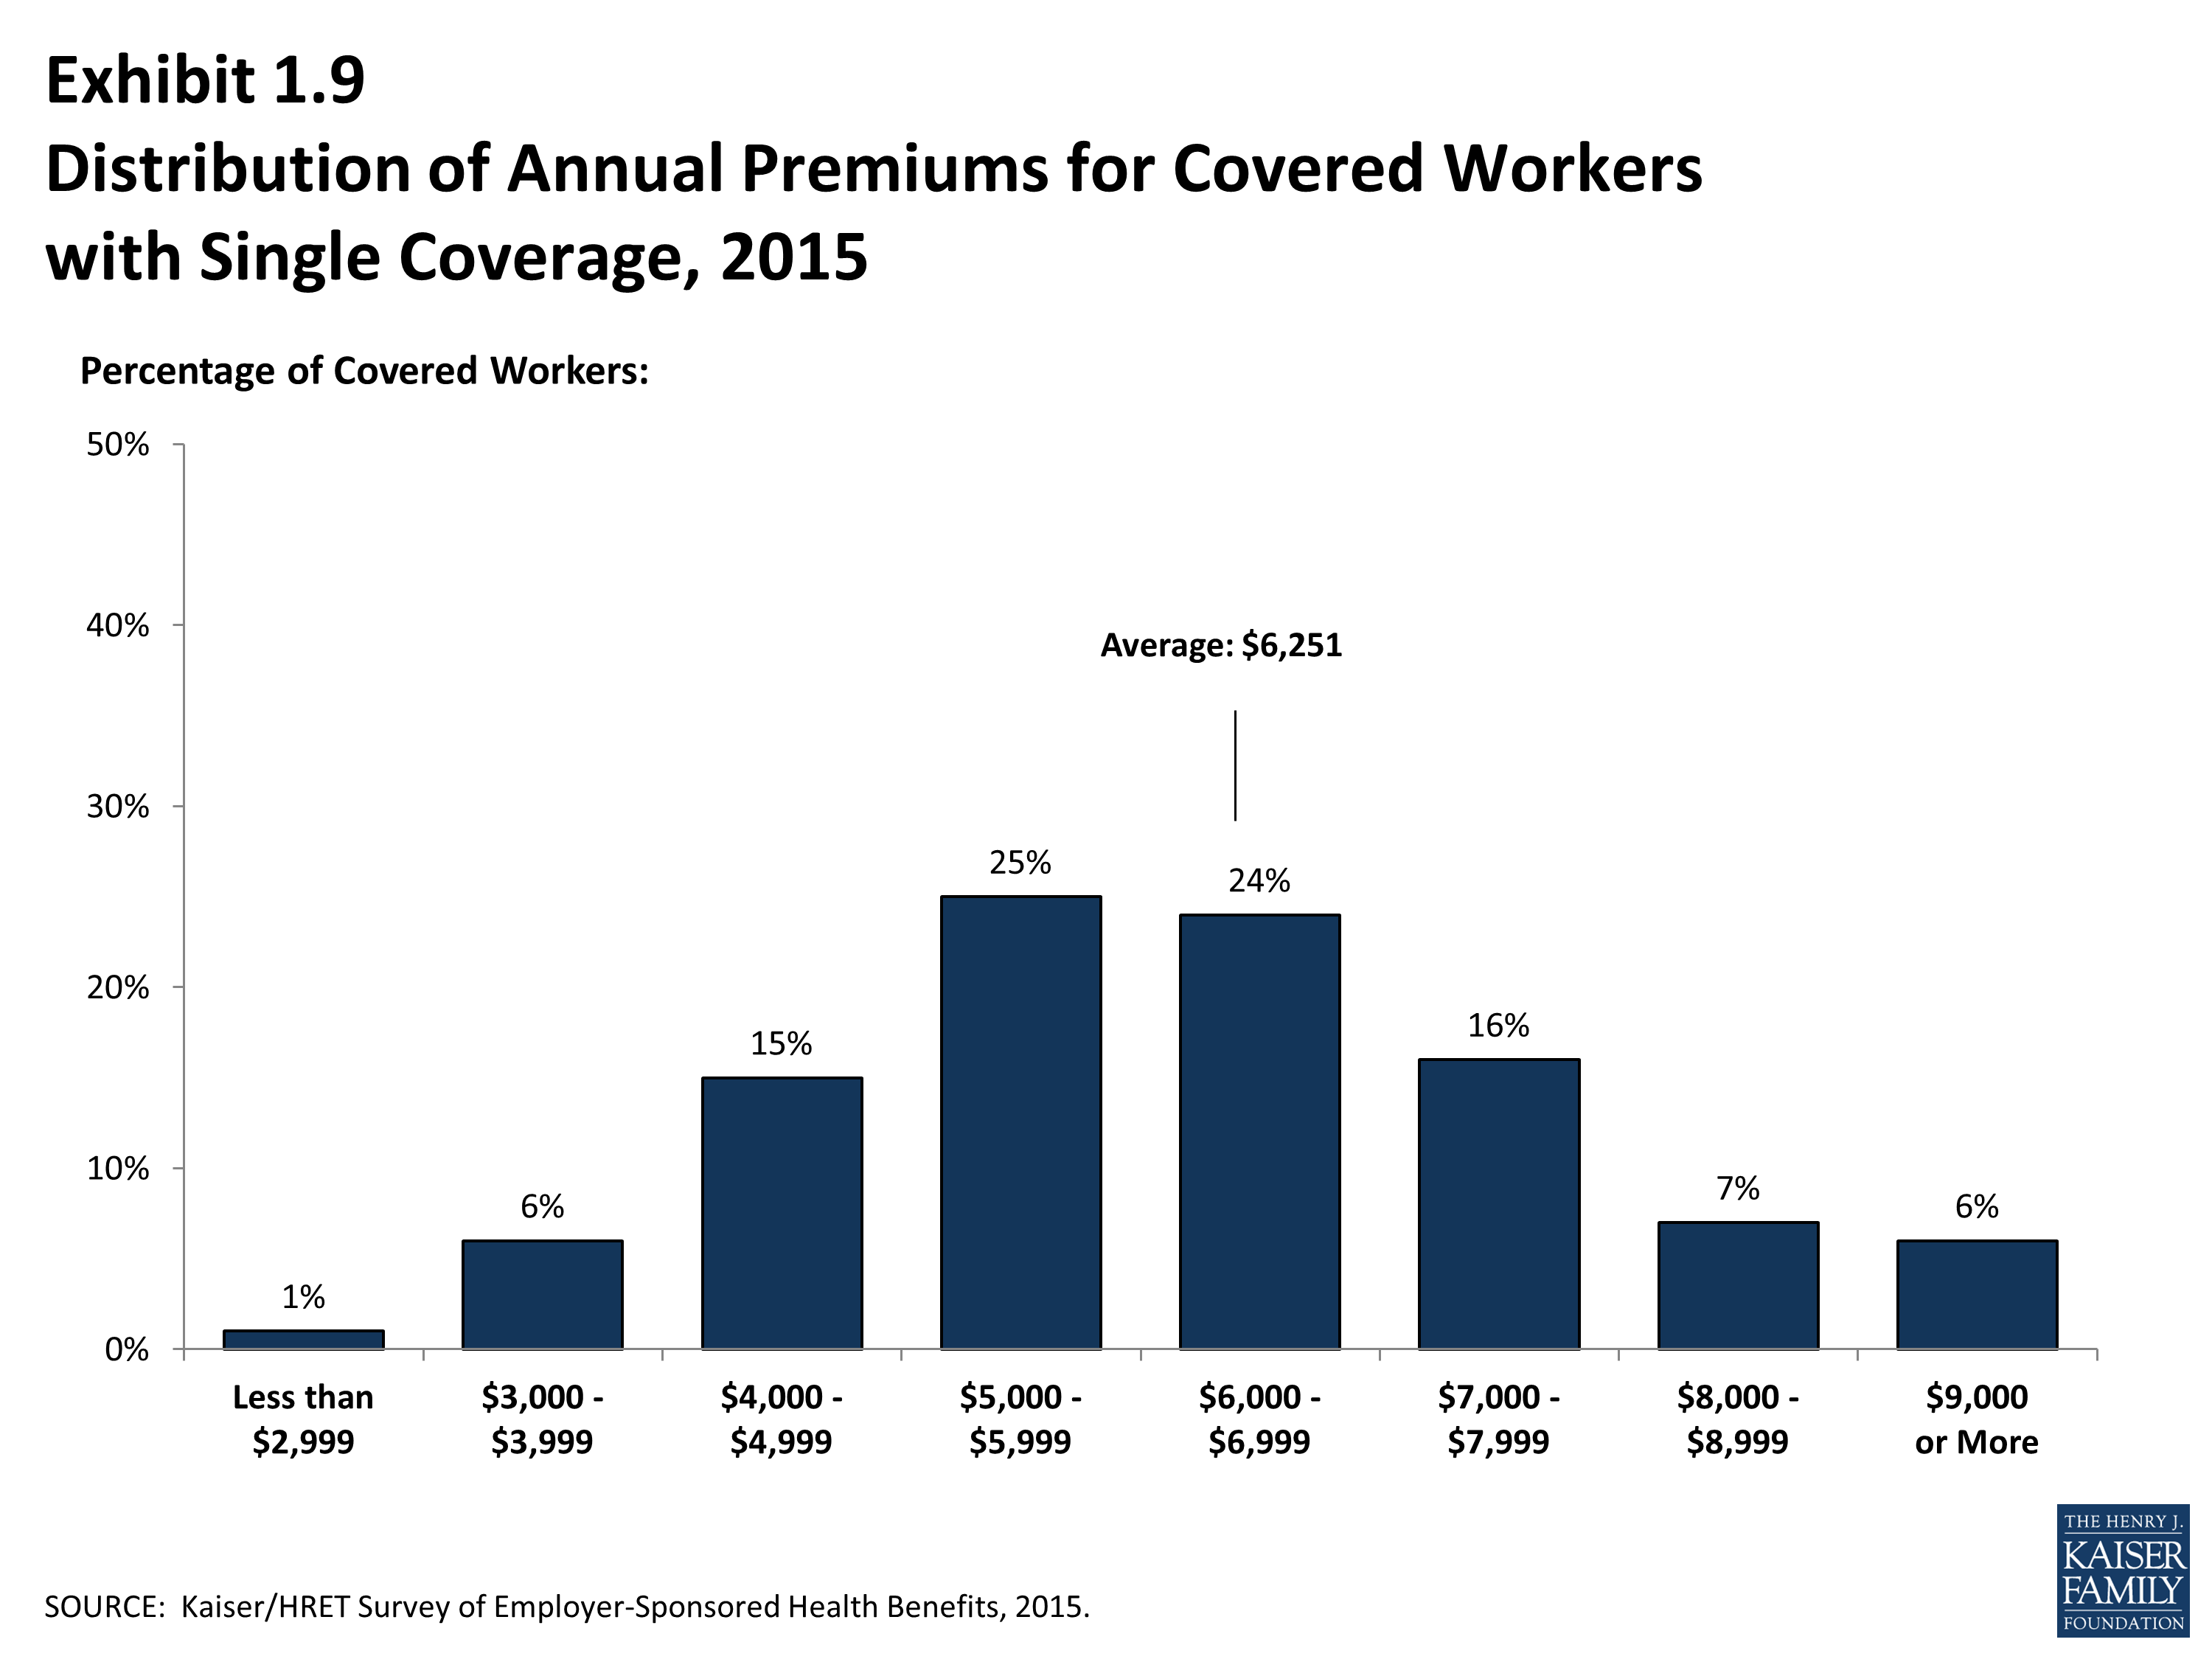
Distribution of Annual Premiums for Covered Workers with Single Coverage, 2015
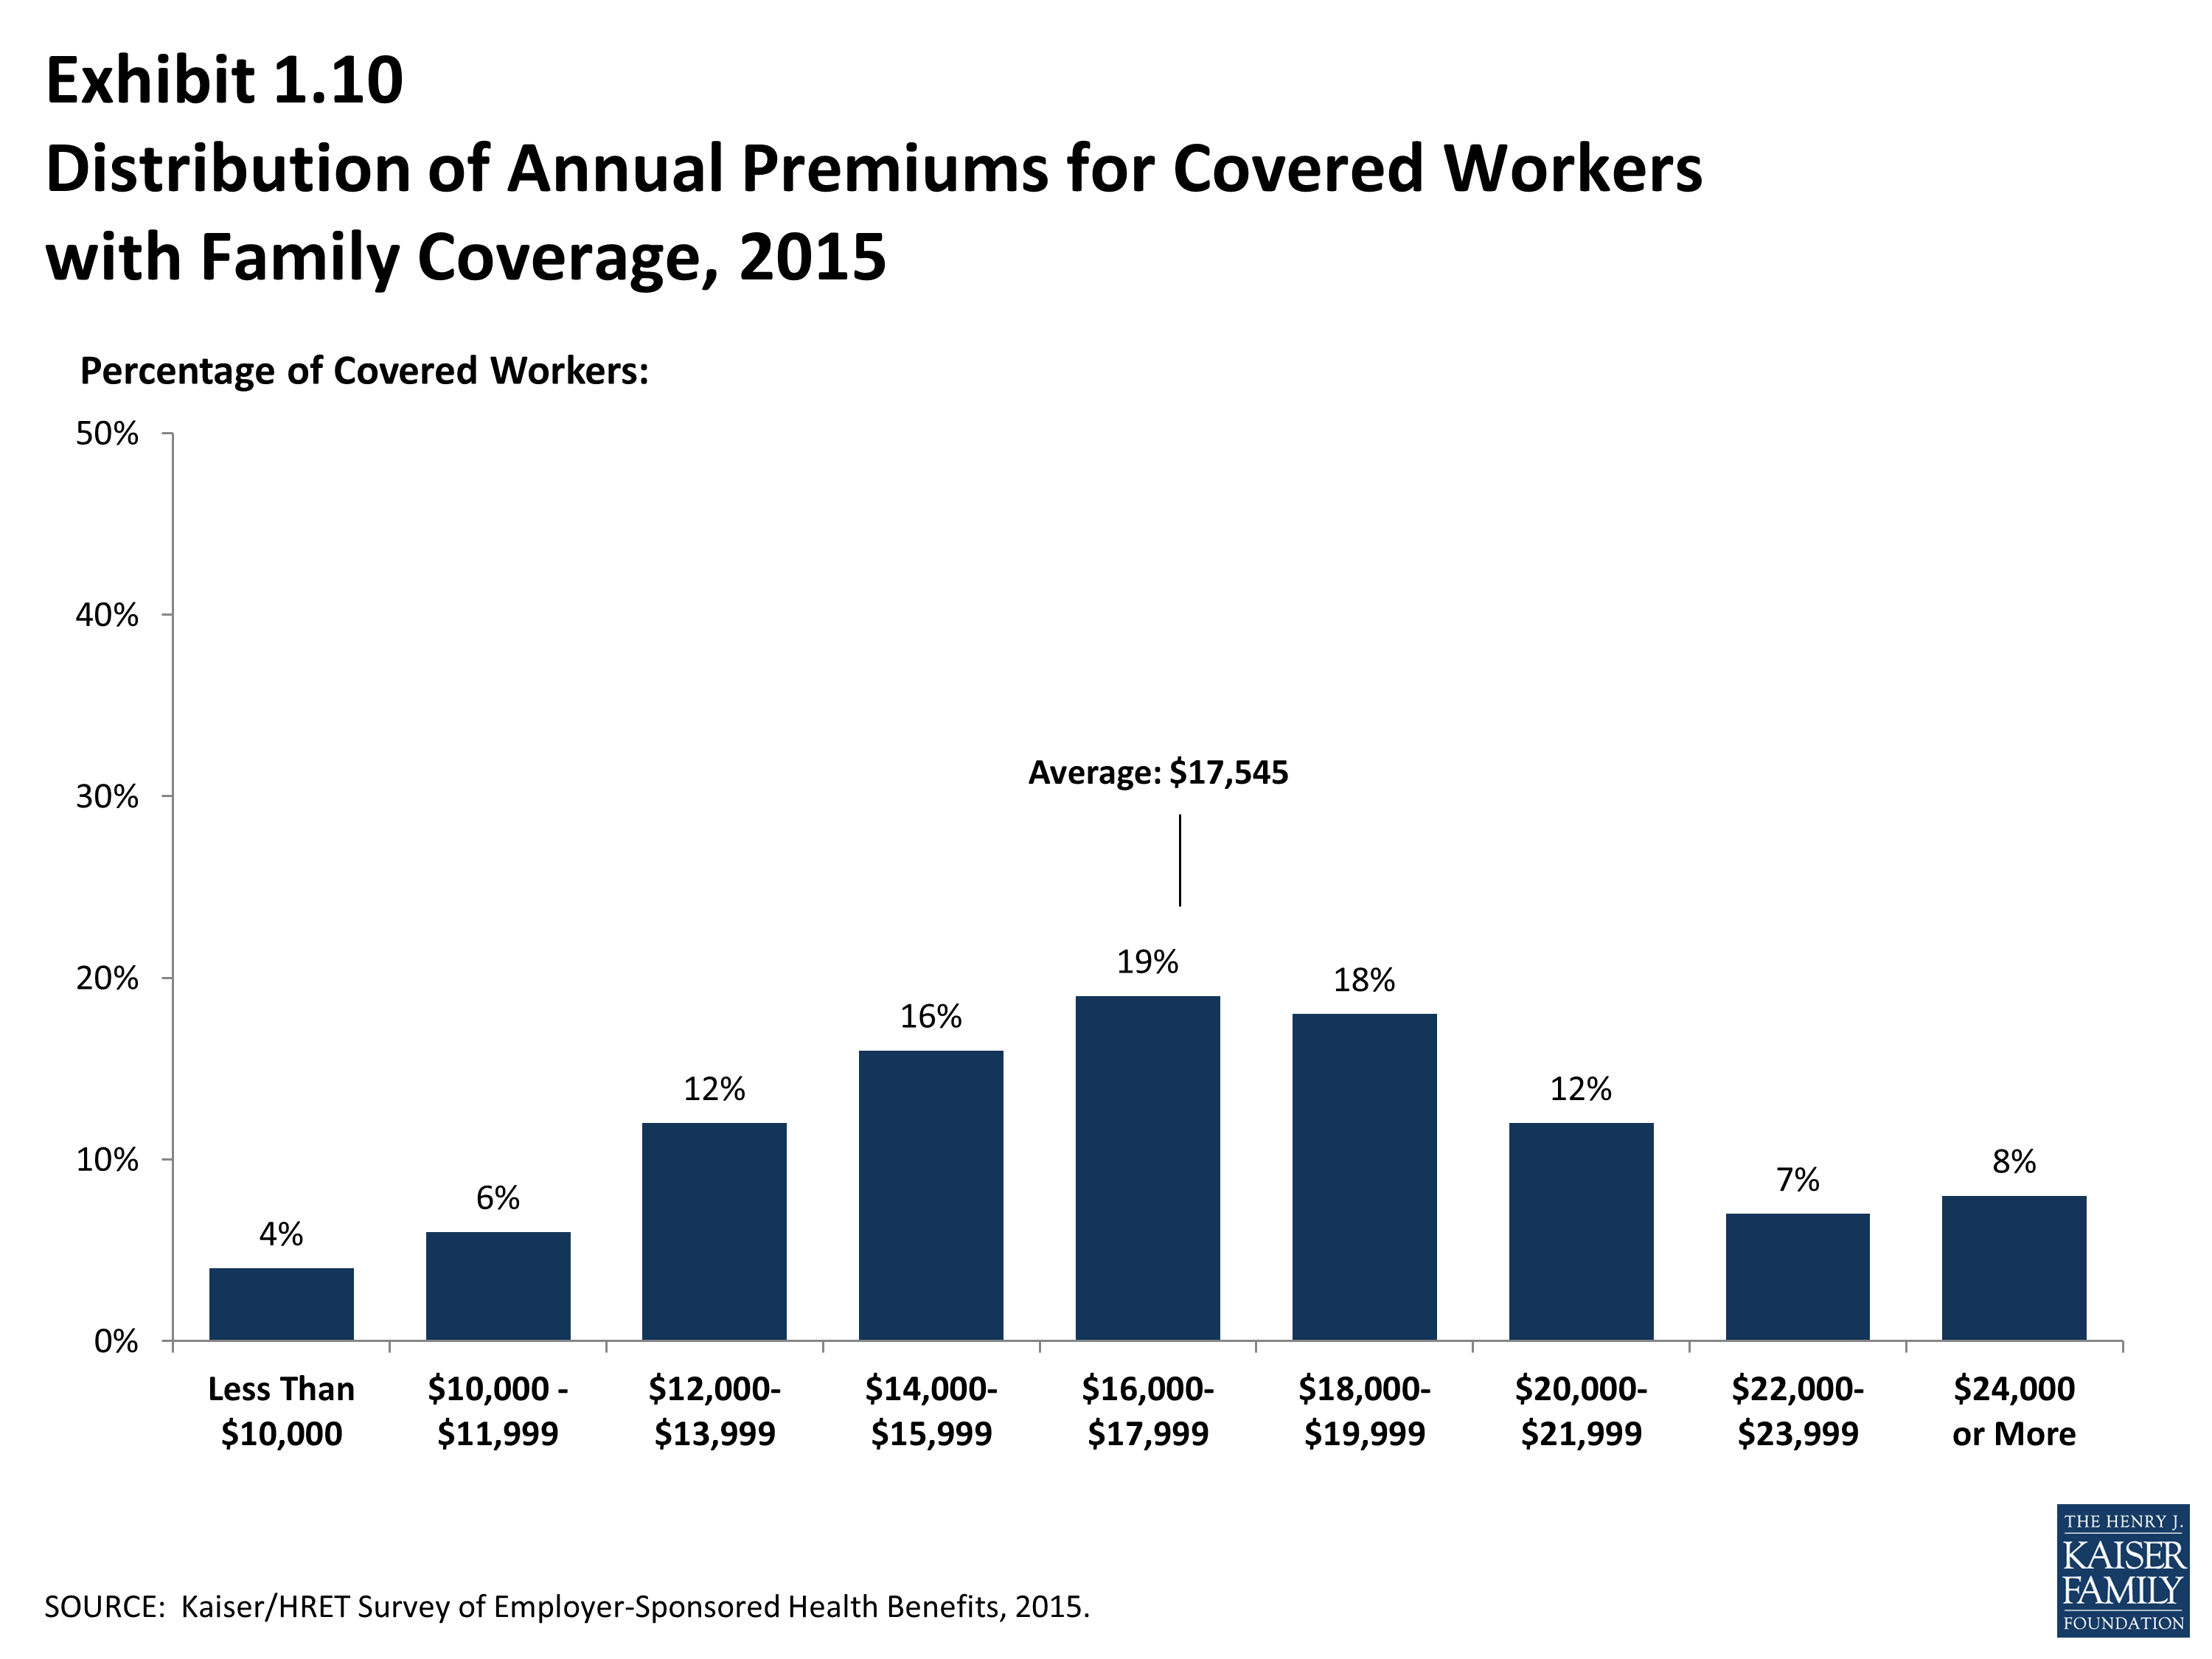
Distribution of Annual Premiums for Covered Workers with Family Coverage, 2015
Average Annual Premiums for Single and Family Coverage, 1999-2015
Average Annual Premiums for Covered Workers with Family Coverage, by Firm Size, 1999-2015
Average Annual Premiums for Covered Workers with Family Coverage, by Firm Size, 1999-2015
Average Annual Premiums for Covered Workers with Single Coverage, by Income Level, 1999-2015
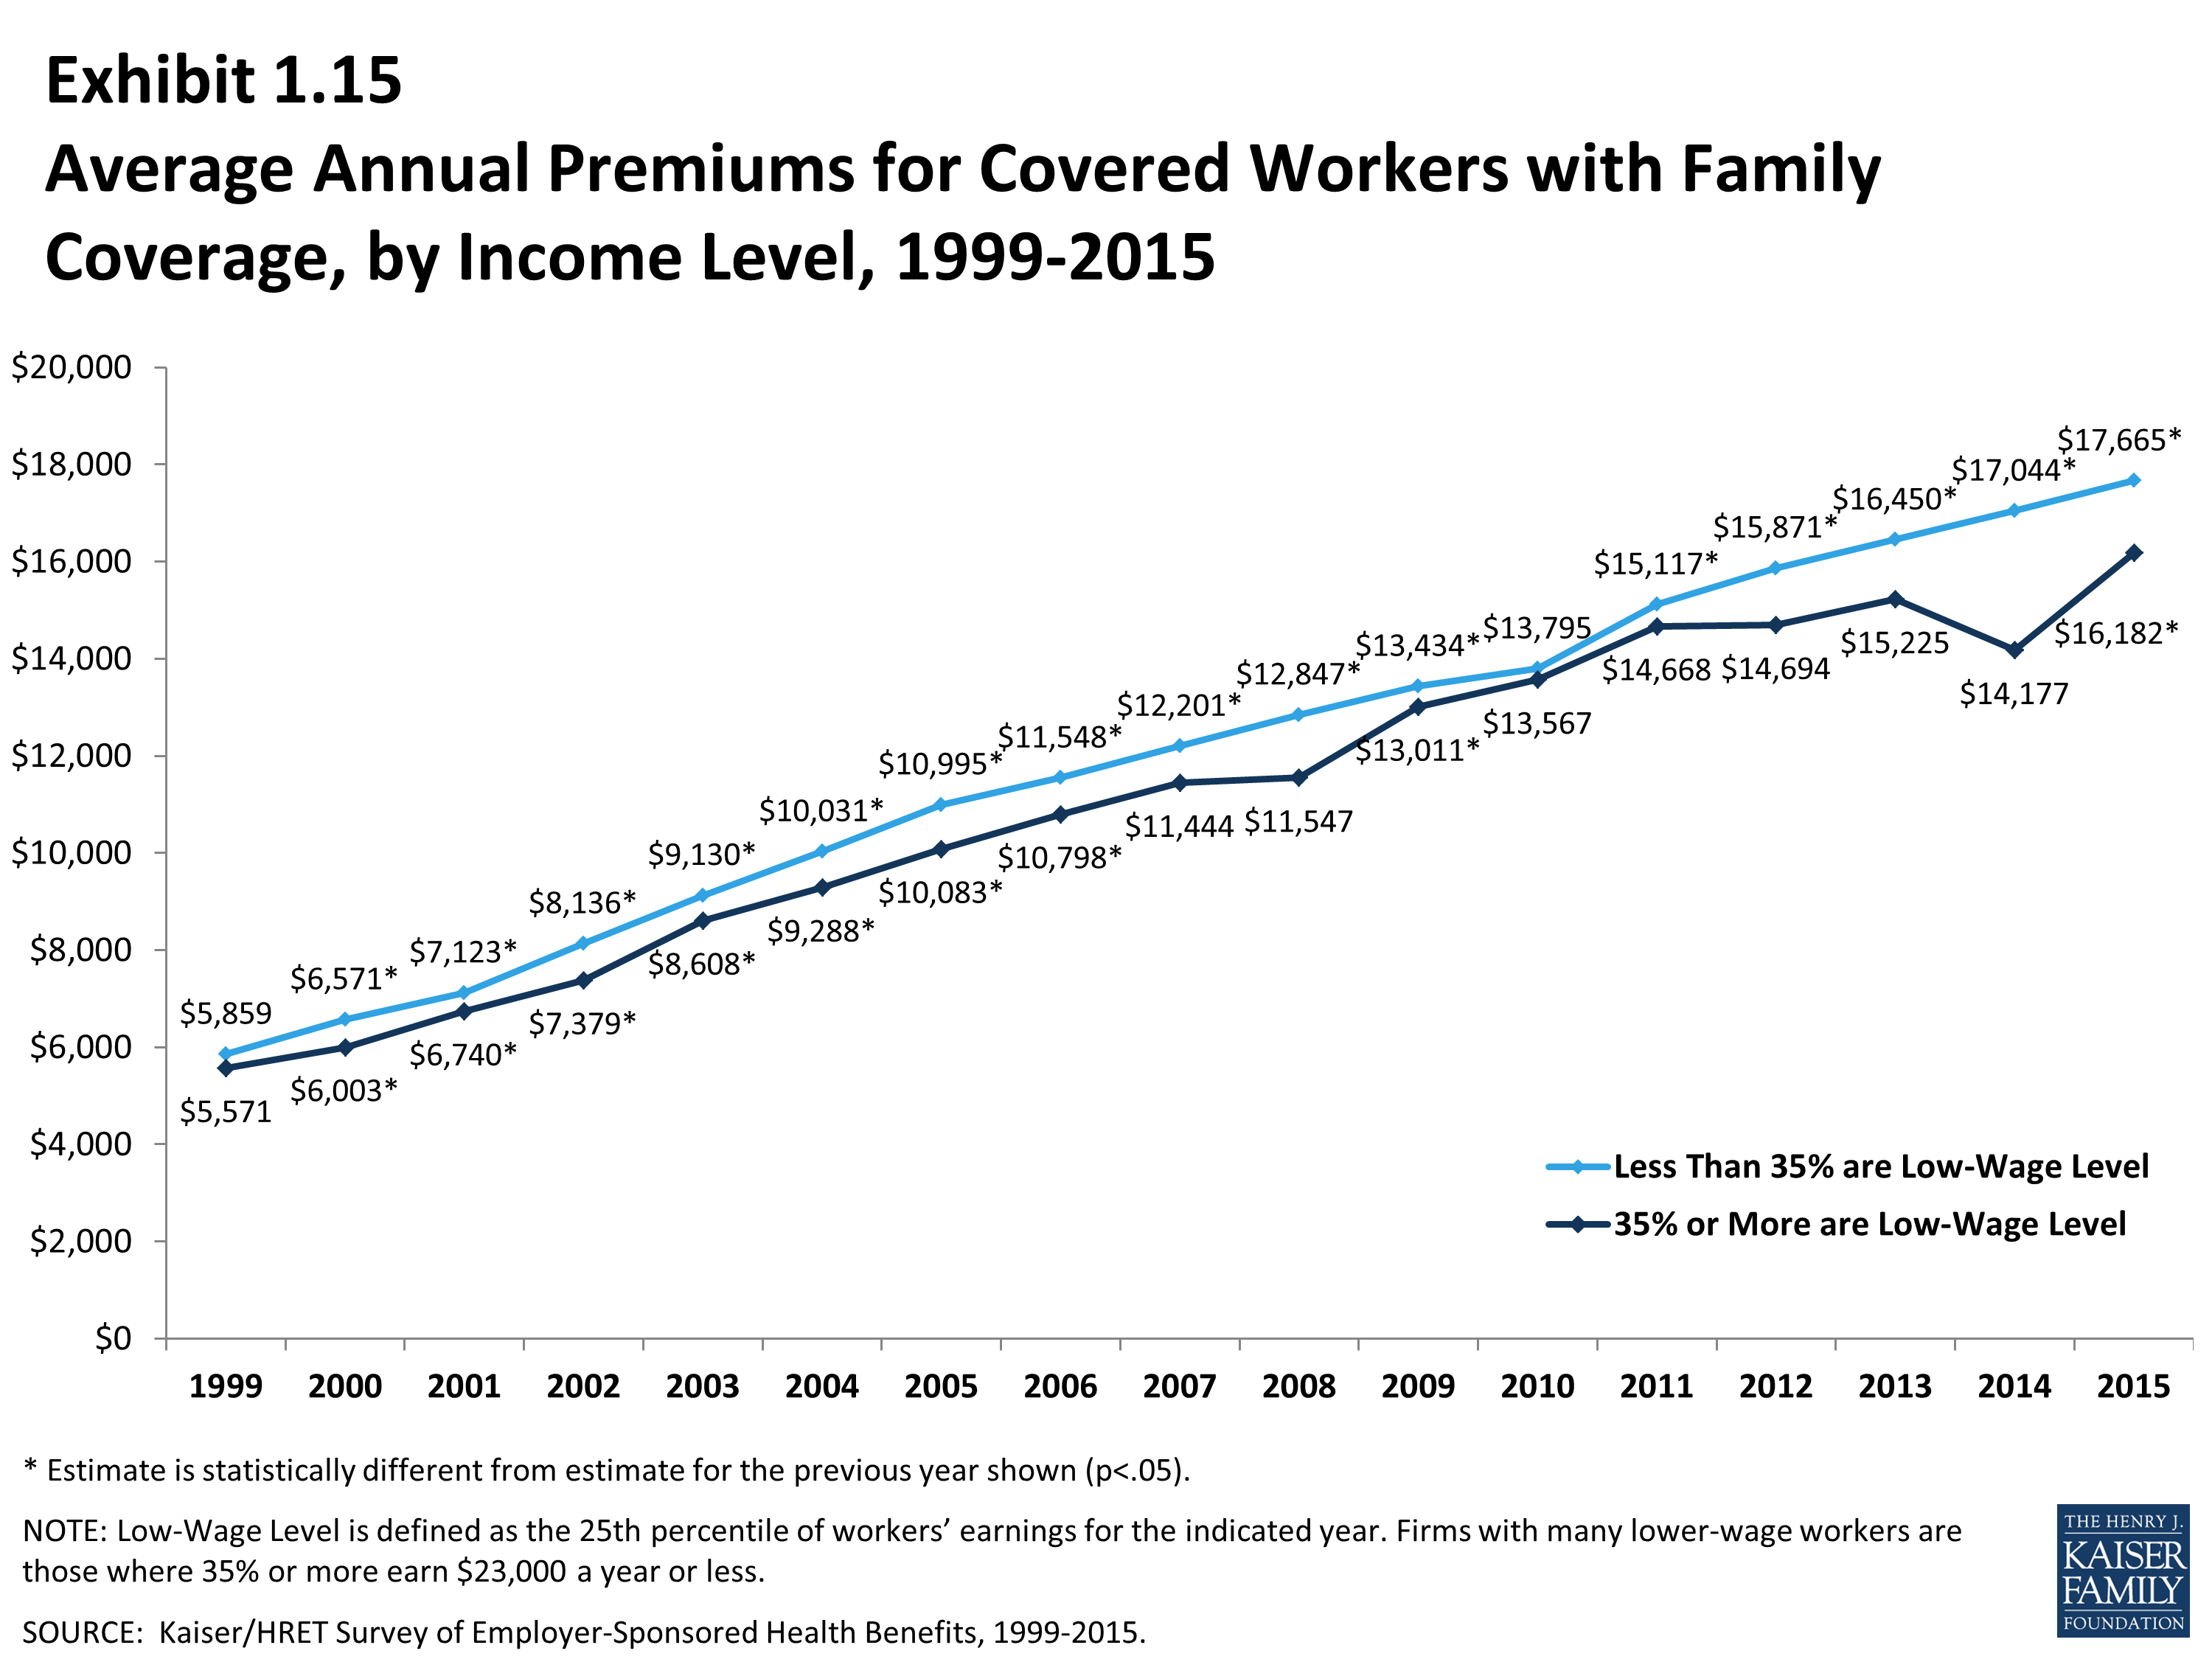
Average Annual Premiums for Covered Workers with Family Coverage, by Income Level, 1999-2015
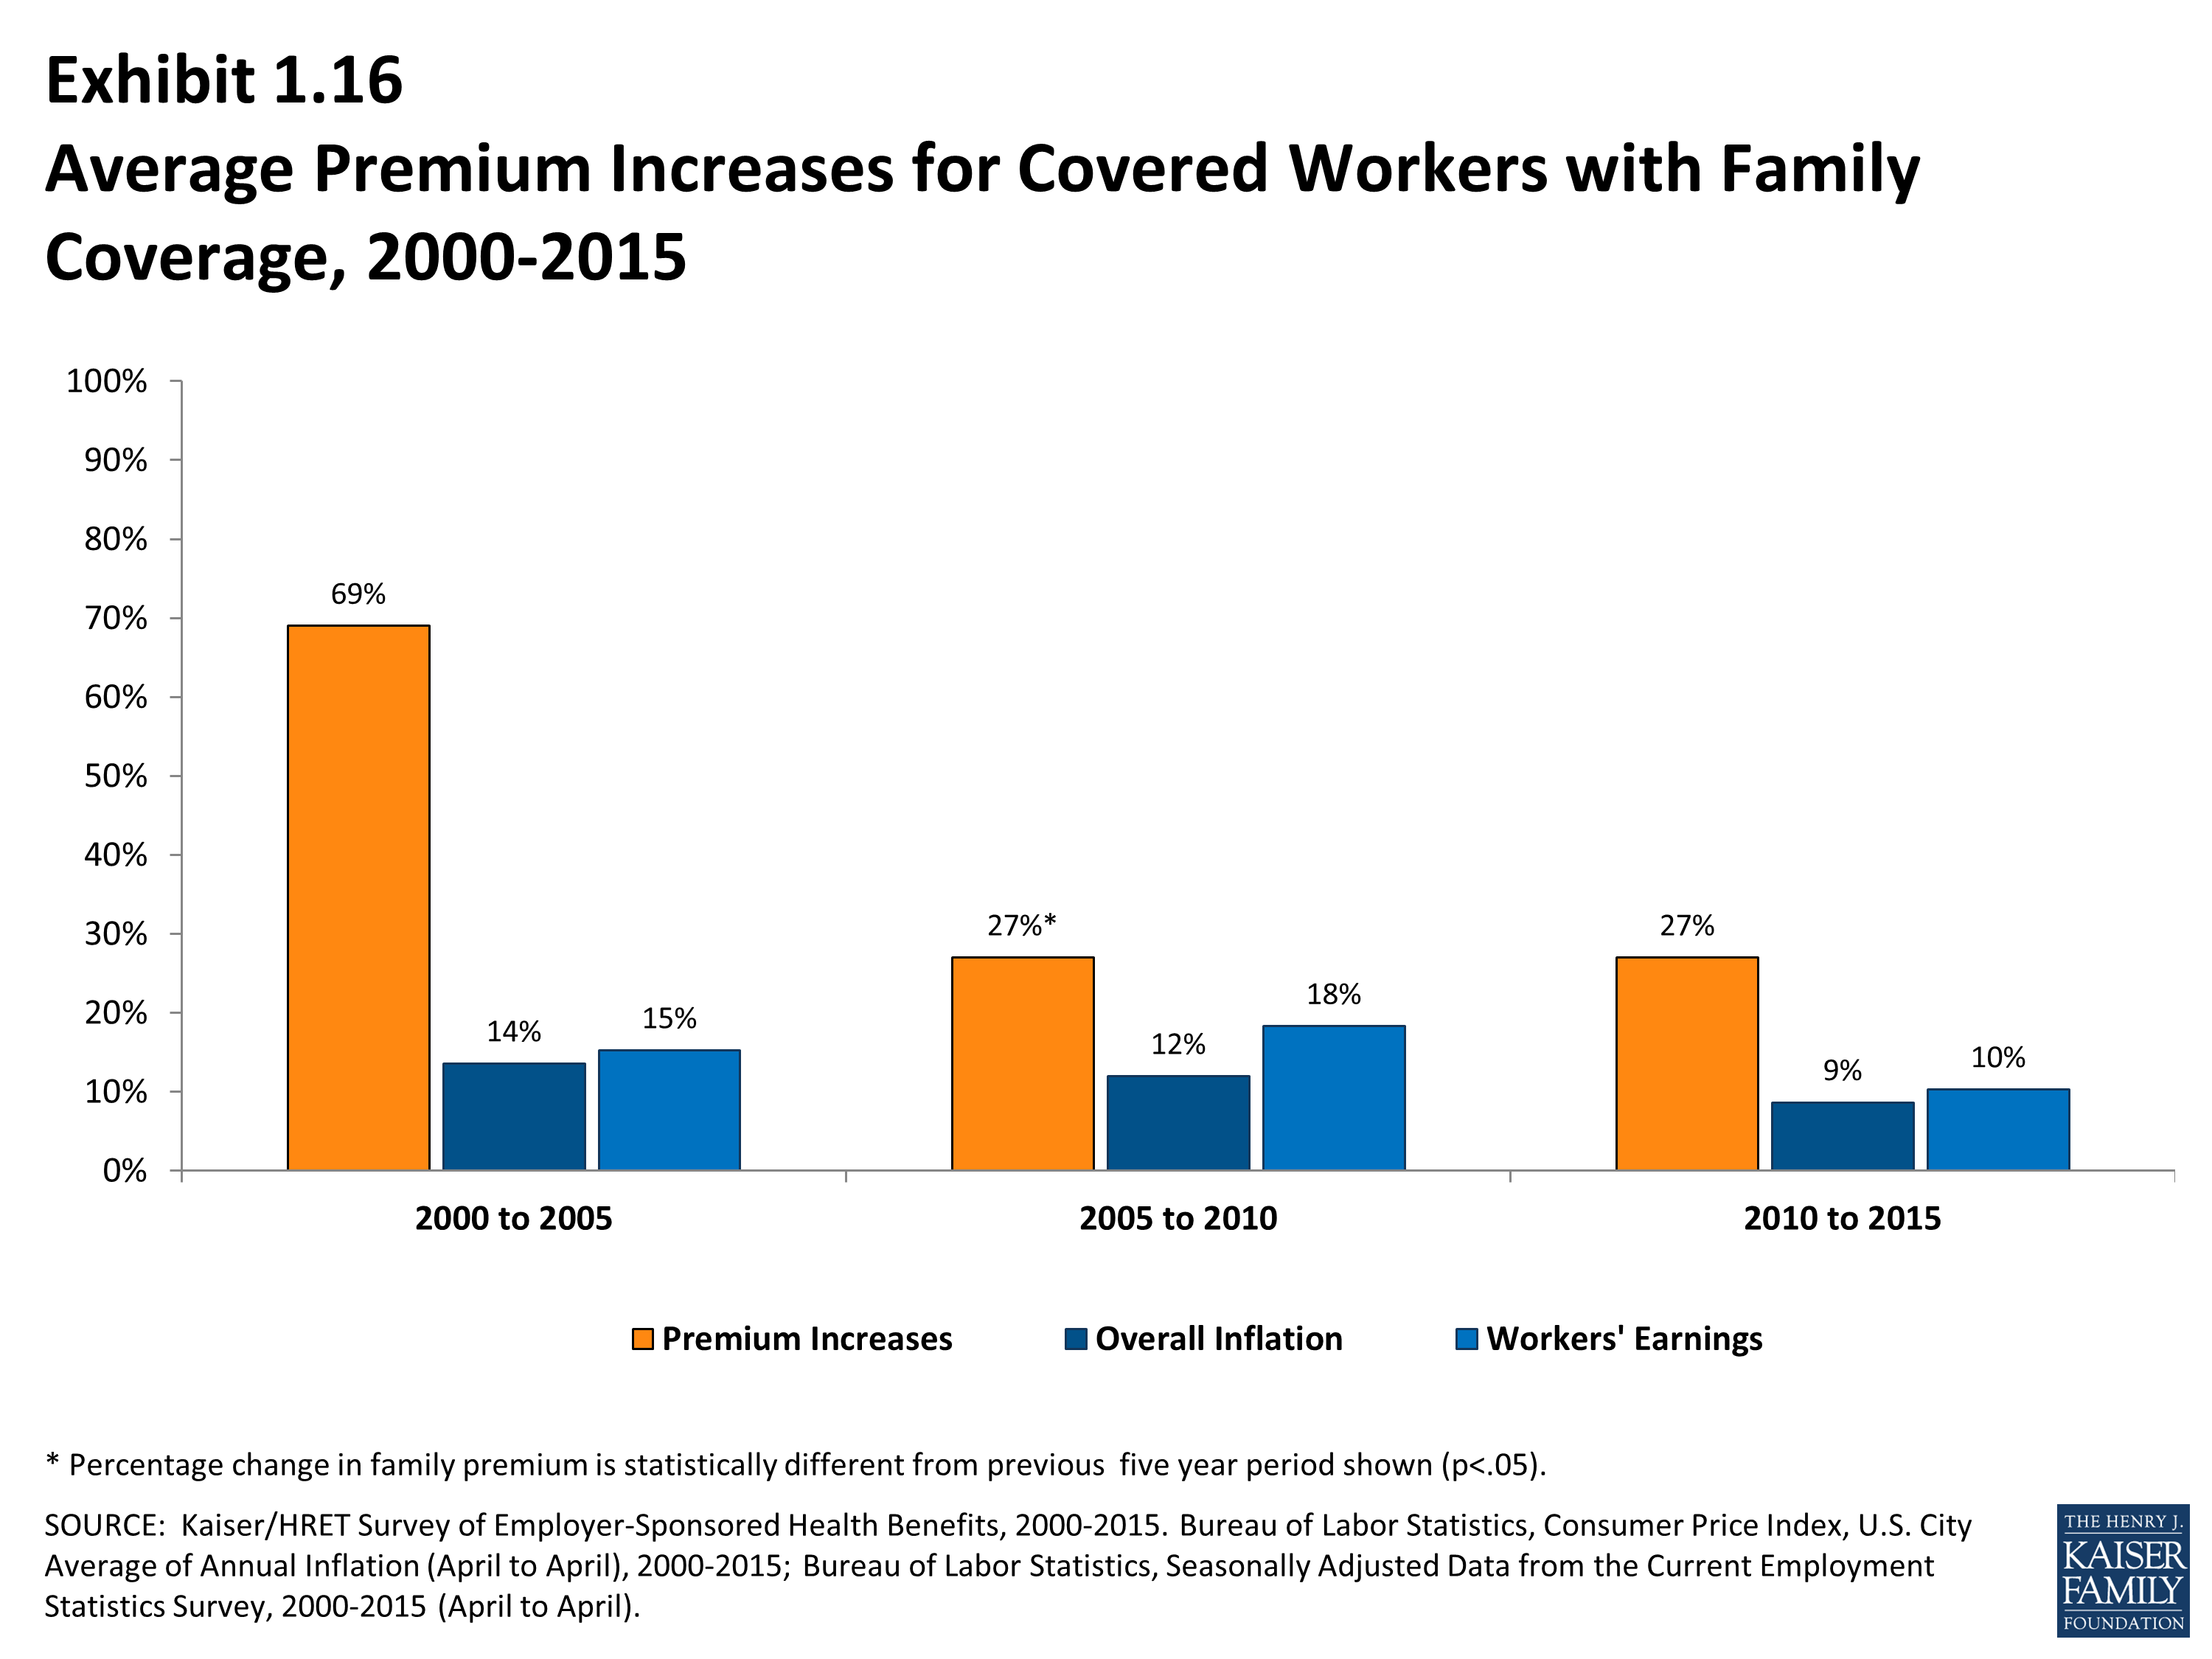
Average Premium Increases for Covered Workers with Family Coverage, 2000-2015
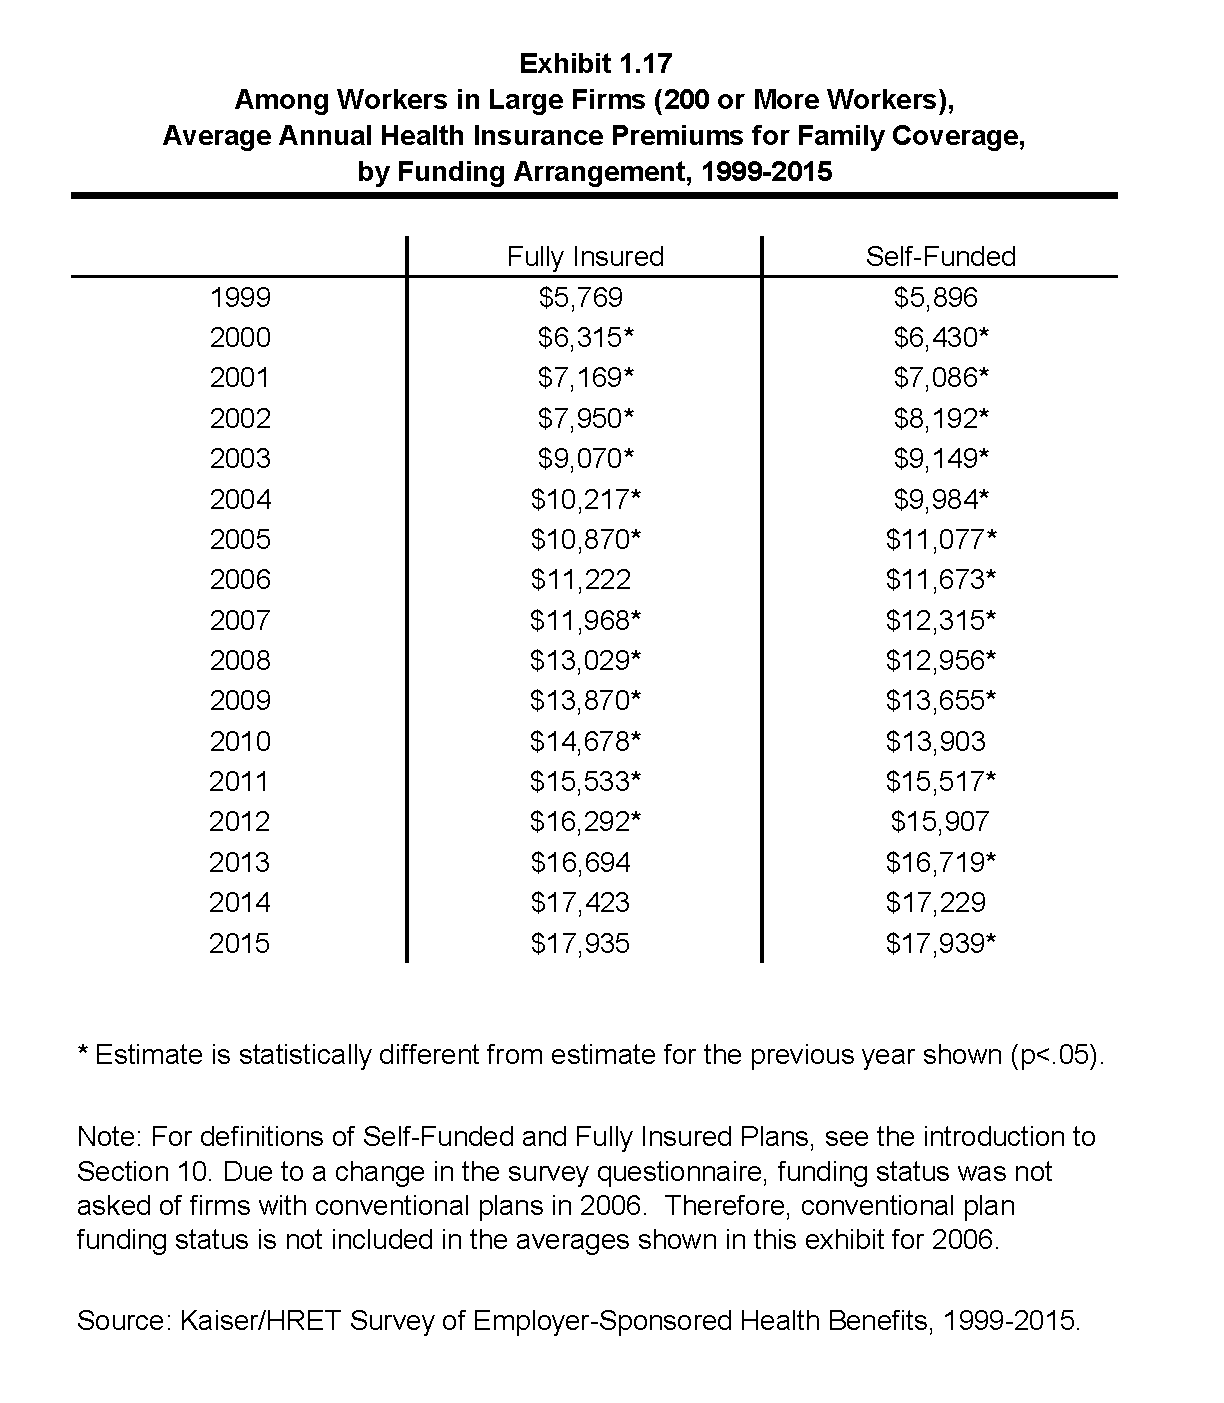
Among Workers in Large Firms (200 or More Workers), Average Annual Health Insurance Premiums for Family Coverage, by Funding Arrangement, 1999-2015
Section Two: Health Benefits Offer Rates
While nearly all large firms (200 or more workers) offer health benefits to at least some employees, small firms are significantly less likely to do so. The percentage of all firms offering health benefits in 2015 (57%) is not statistically different from the percentage of firms that offered health benefits in 2005 when 60% of firms offered coverage to at least some employees. Firms not offering health benefits continue to cite “cost” as the most important reason they do not do so. Almost all firms that offer coverage offer coverage to dependents such as children and the spouses of eligible employees.
- In 2015, 57% of firms offer health benefits, not statistically different from the 55% who reported doing so in 2014 (Exhibit 2.1).
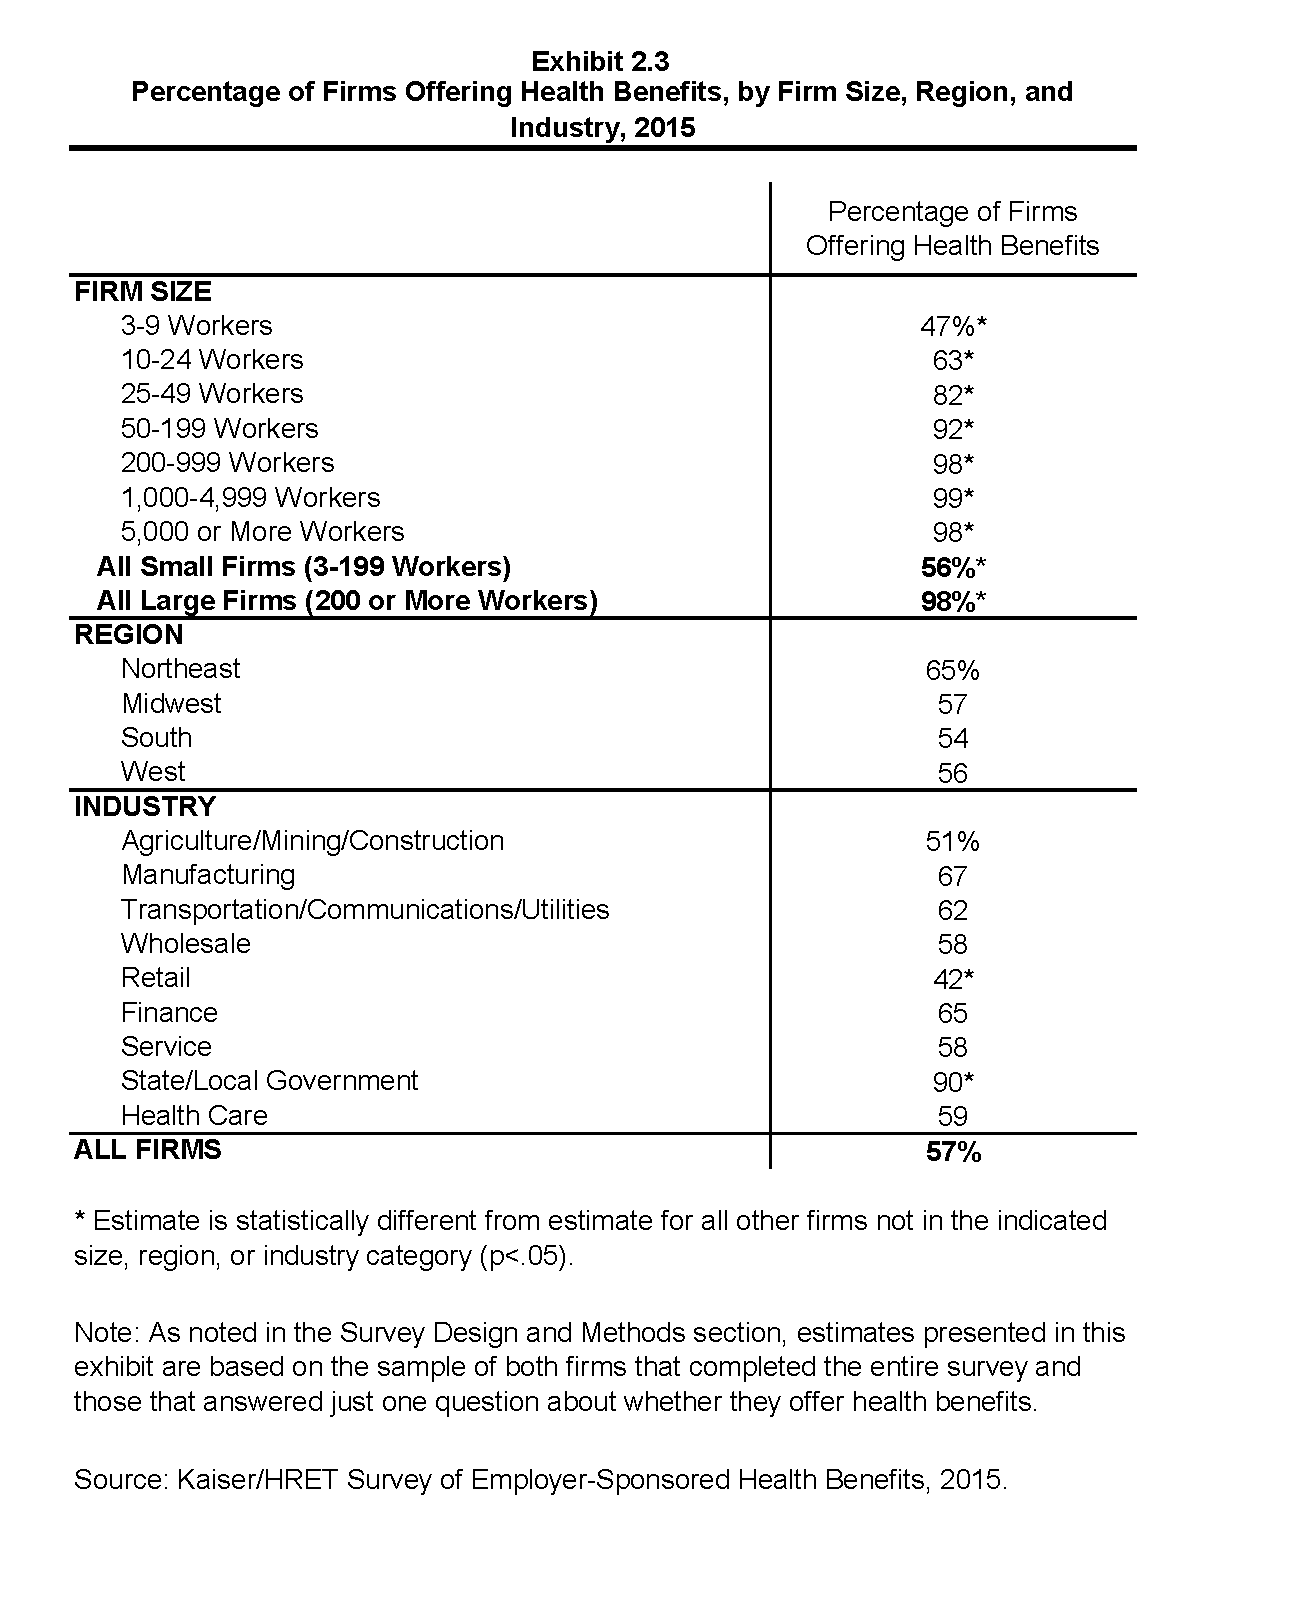
- Ninety-eight percent of large firms (200 or more workers) offer health benefits to at least some of their workers (Exhibit 2.3). In contrast, only 56% of small firms (3 to 199 workers) offer health benefits in 2015. The percentage of both small and large firms offering health benefits to at least some of their workers is similar to last year (Exhibit 2.2).
- Since most firms in the country are small, variation in the overall offer rate is driven primarily by changes in the percentages of the smallest firms (3 to 9 workers) offering health benefits. For more information on the distribution of firms in the country, see the Survey Design and Methods Section and Exhibit M1.1
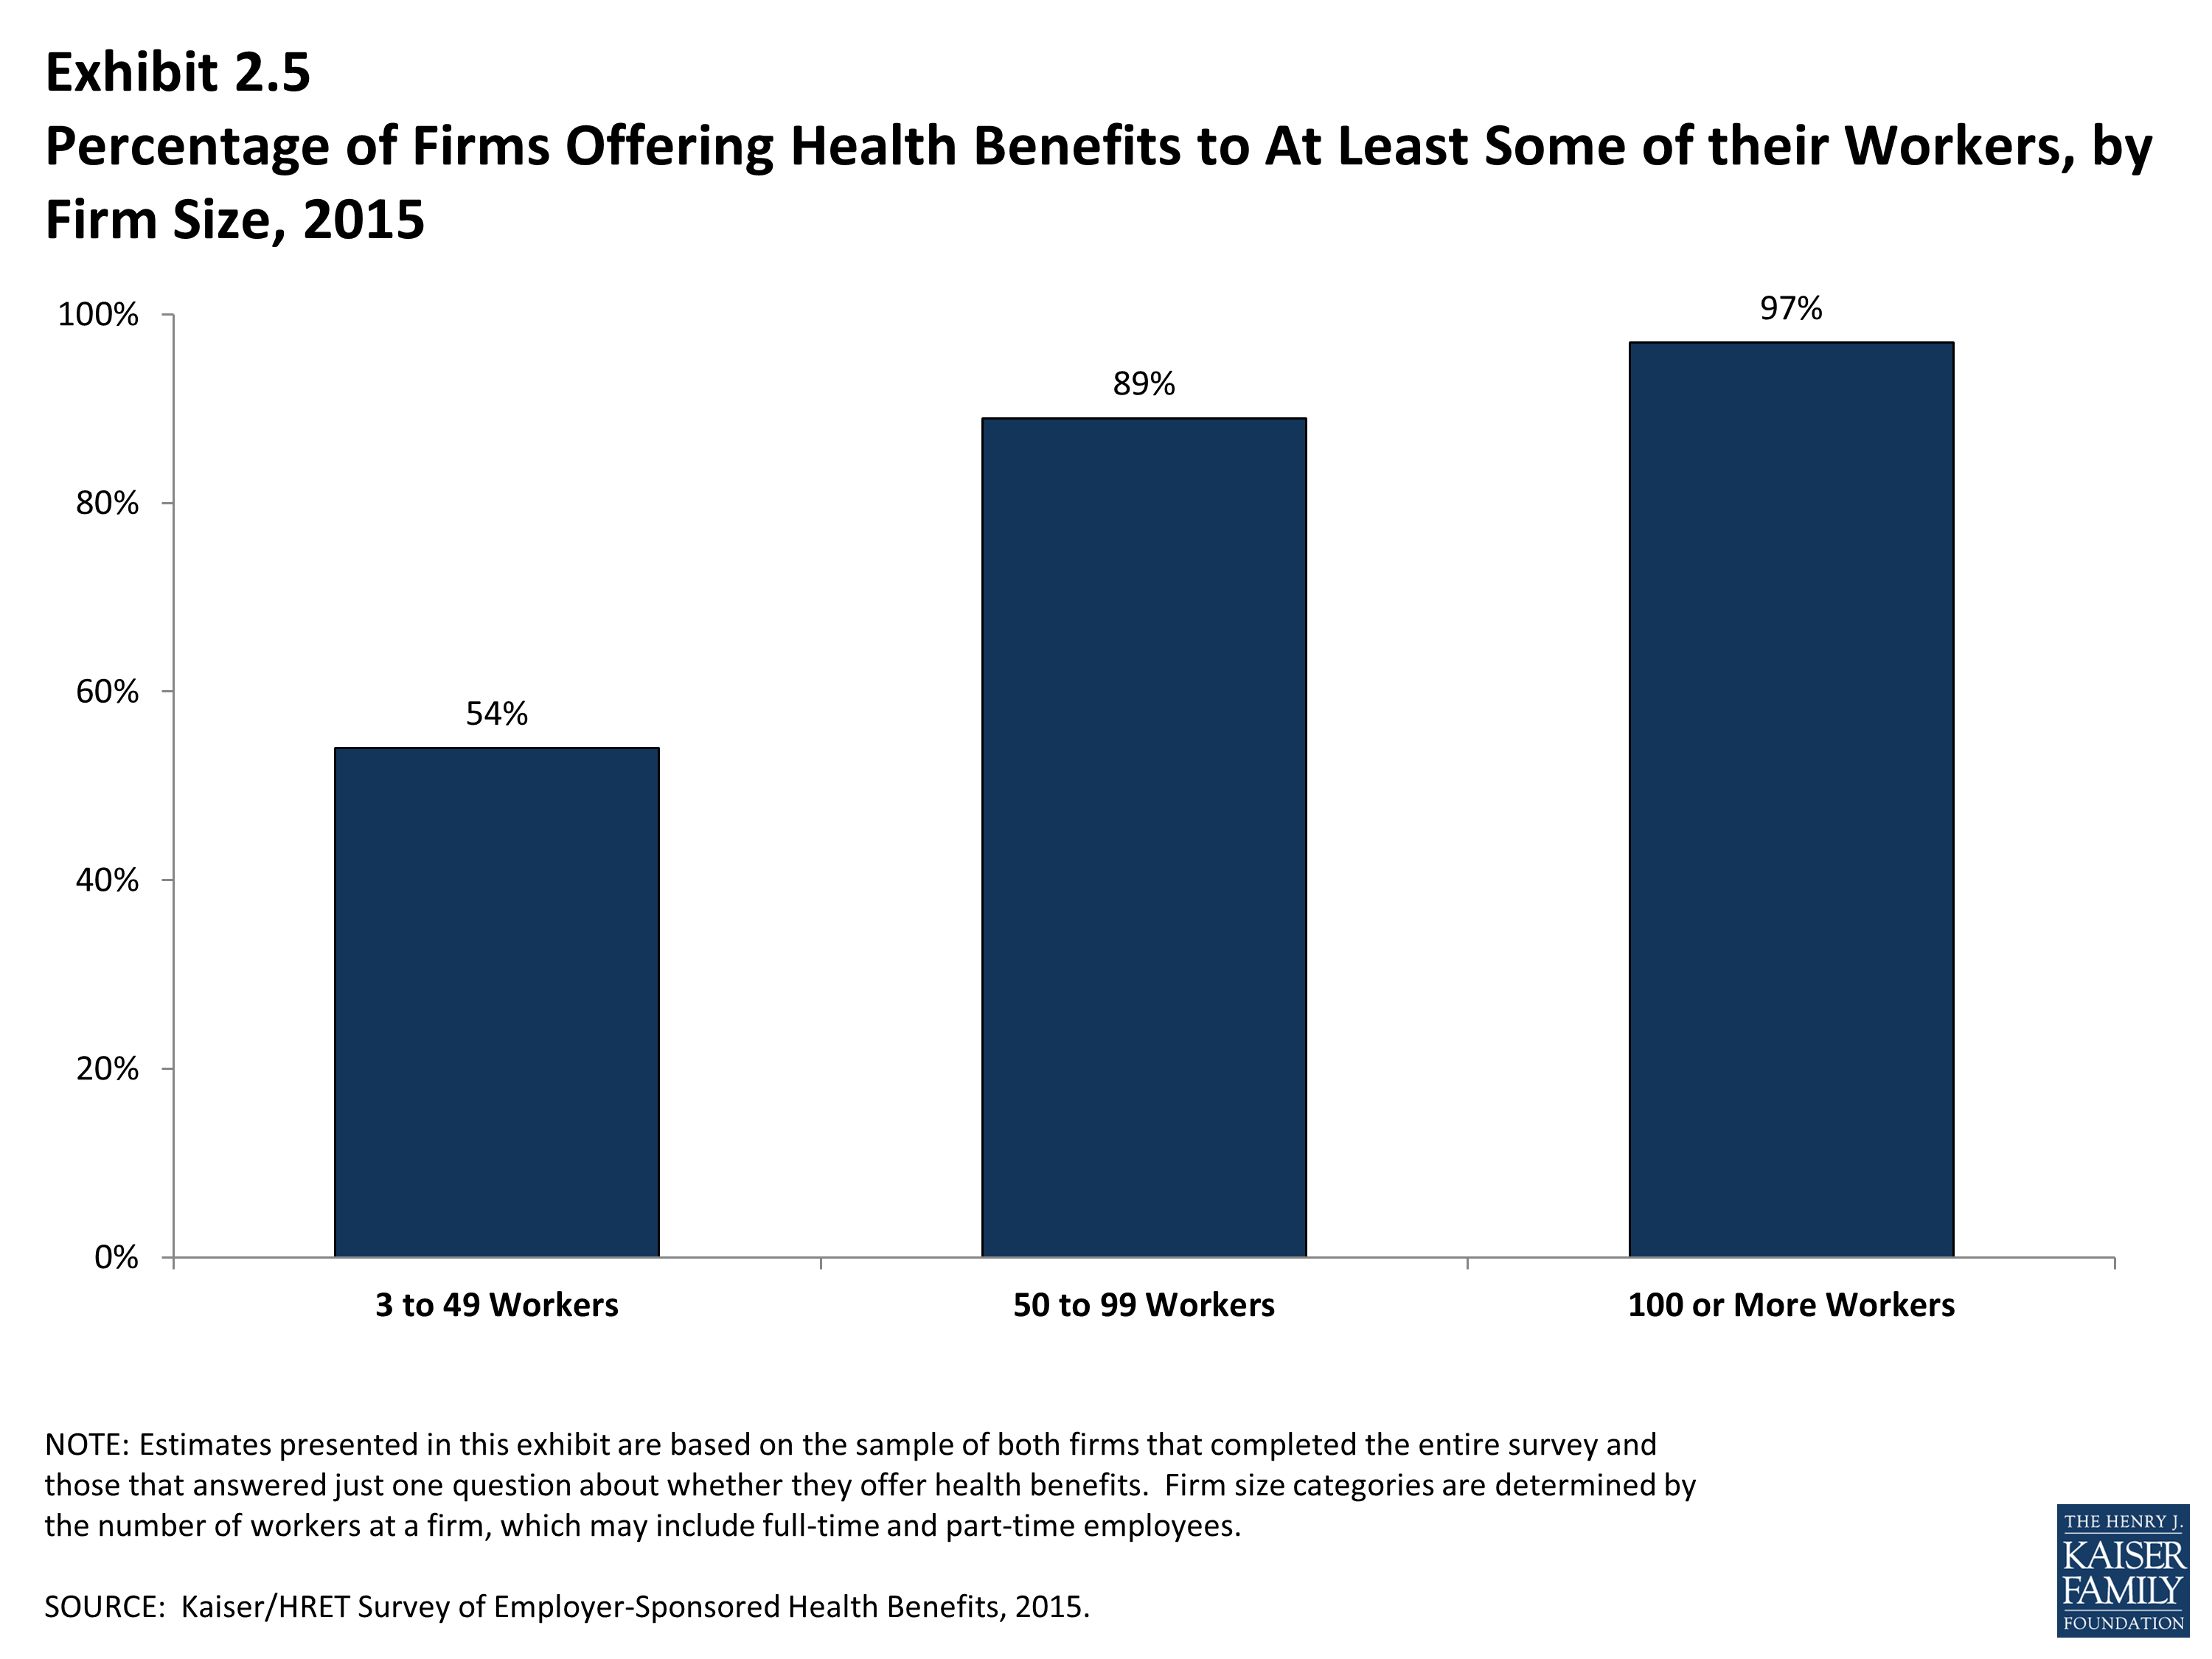
- Ninety-seven percent of firms with 100 or more employees offered health benefits to at least some of their employees in 2015. Eighty-nine percent of firms with between 50 and 99 workers offered benefits to at least some workers (Exhibit 2.5). The percentage of firms offering health benefits in each of these firm size categories is similar to last year.
- Over the 1999 to 2015 period, there has been a statistically significant decrease in the percentage of firms offering health benefits. This decline is due to changes in offer rates for small firms.
- Offer rates vary across different types of firms.
- Smaller firms are less likely to offer health insurance: 47% of firms with 3 to 9 workers offer coverage, compared to 63% of firms with 10 to 24 workers, 82% of firms with 25 to 49 workers, and 92% of firms with 50 to 199 employees (Exhibit 2.3).
- Offer rates throughout different firm size categories in 2015 remained similar to those reported in 2014 (Exhibit 2.2).
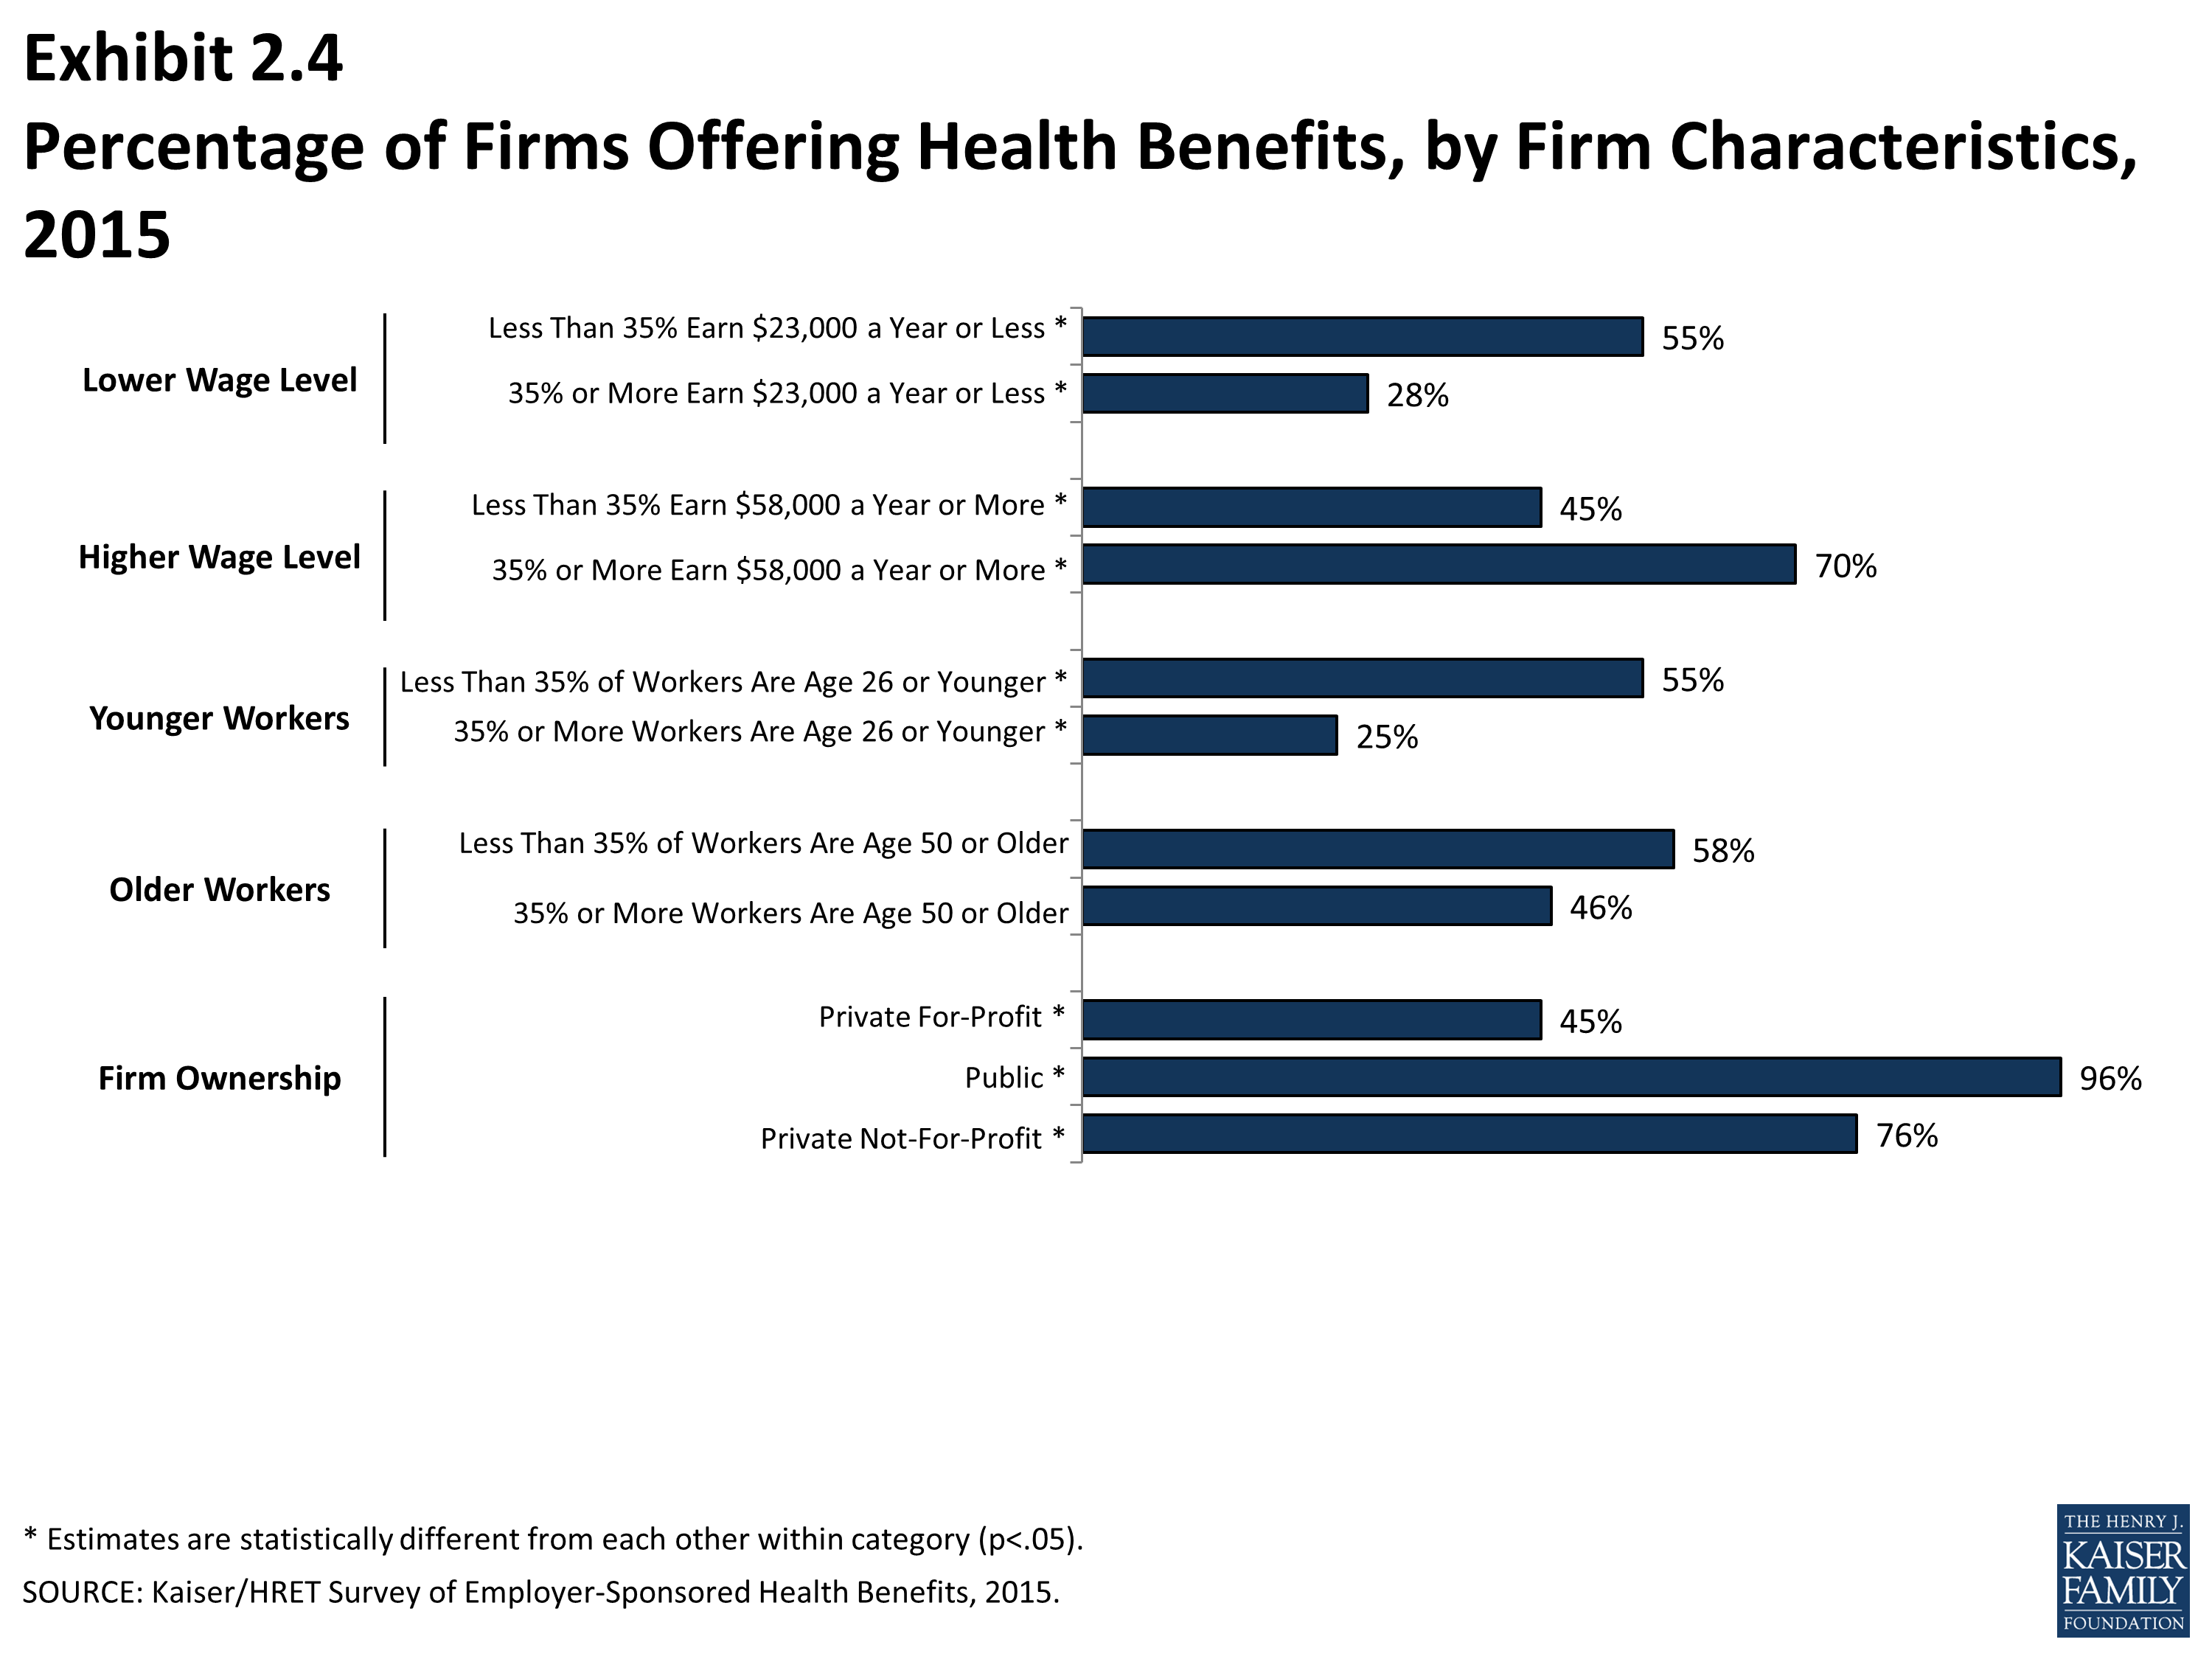
- Firms with fewer lower-wage workers (less than 35% of workers earn $23,000 or less annually) are significantly more likely to offer health insurance than firms with many lower-wage workers (55% vs. 28%) (Exhibit 2.4). The offer rate for firms with many lower-wage workers is not significantly different from the 33% reported in 2014.
- We observe a similar pattern among firms with many higher-wage workers (35% or more of workers earn $58,000 or more annually) being more likely to offer coverage to employees (70% versus 45%) (Exhibit 2.4).
- The age of the workforce correlates with the probability of a firm offering health benefits. Firms where 35% or more of their workers are age 26 or younger are less likely to offer health benefits than firms where less than 35% of workers are age 26 or younger (25% and 55%, respectively) (Exhibit 2.4). The percentage of firms with many younger workers that offer health benefits is similar to the 30% reported in 2014.
Part-Time and Temporary Workers
- Among firms offering health benefits, relatively few offer benefits to their part-time and temporary workers.
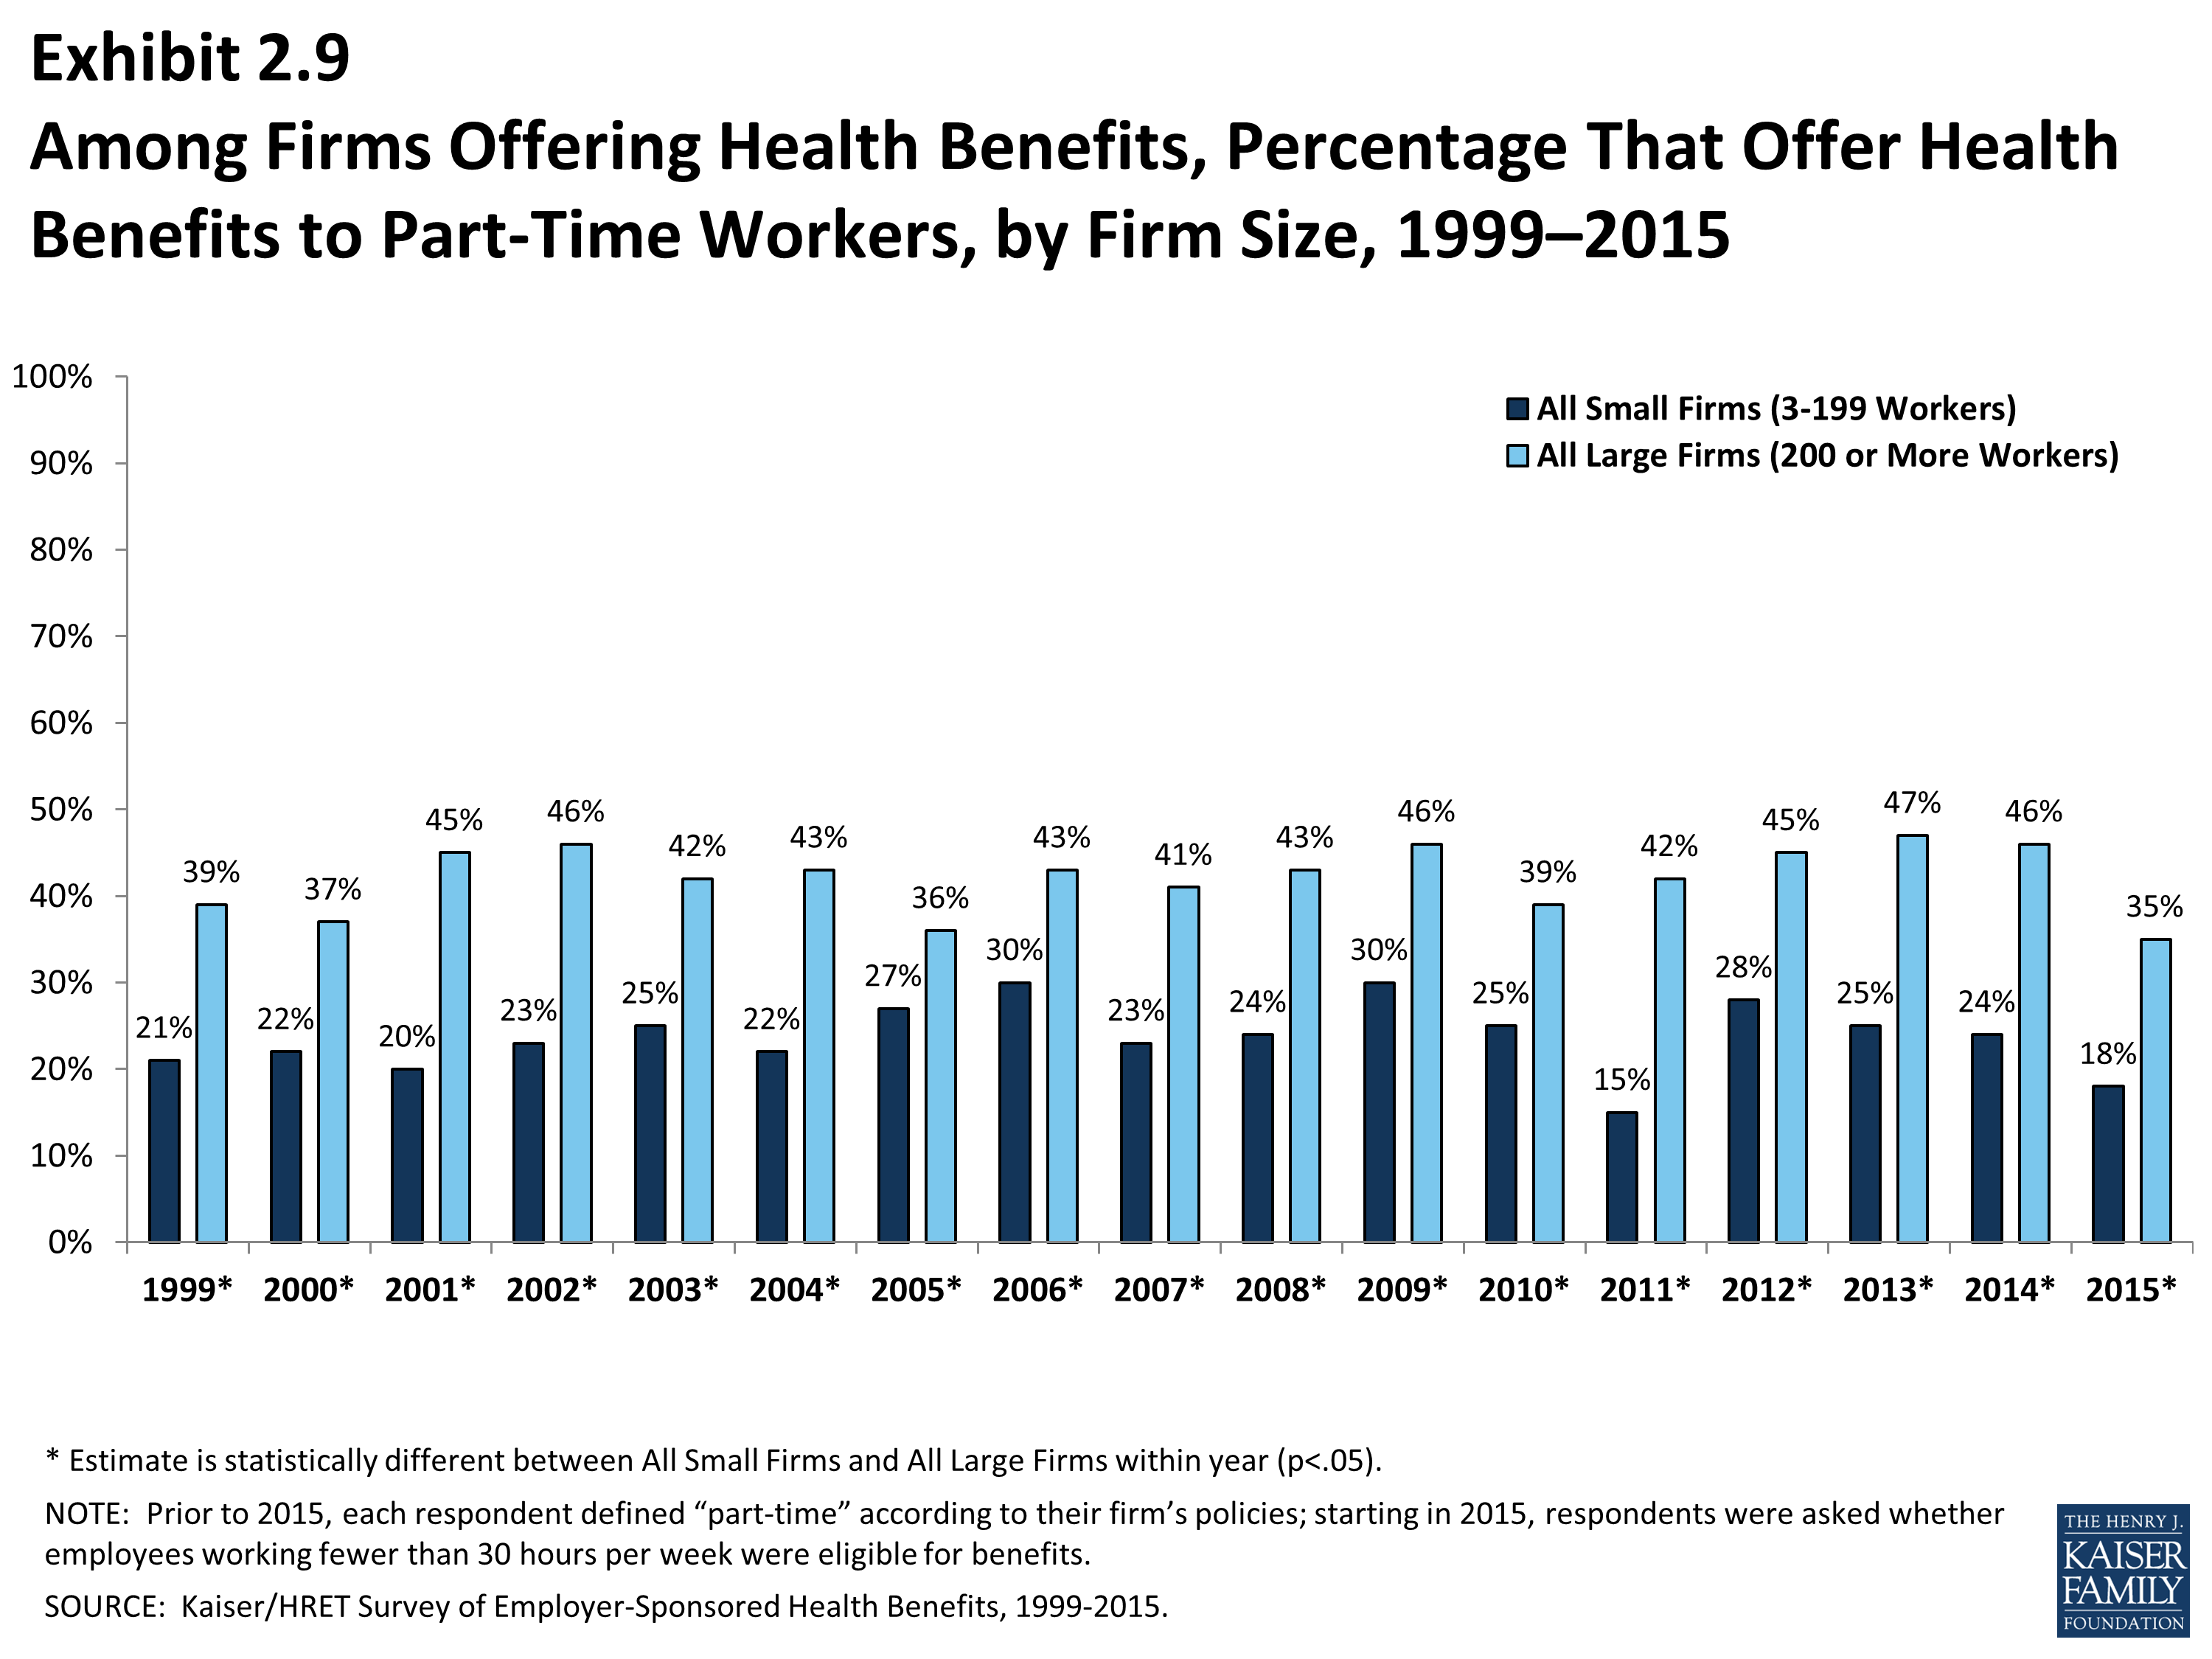
- The Affordable Care Act defines part-time workers as those who on average work fewer than 30 hours per week. The employer shared responsibility provision of the Affordable Care Act requires that large firms offer full-time employees a minimum standard of coverage or be assessed a penalty2. Beginning this year, we modified the survey to explicitly ask employers whether they offered benefits to employees working fewer than 30 hours. Our previous question did not include a definition of “part-time”. For this reason, historical data on part-time offer rates are shown but we did not test whether the differences between 2014 and 2015 were significant. Many employers may work with multiple definitions of part-time; one for their compliance with legal requirements and another for internal policies and programs.
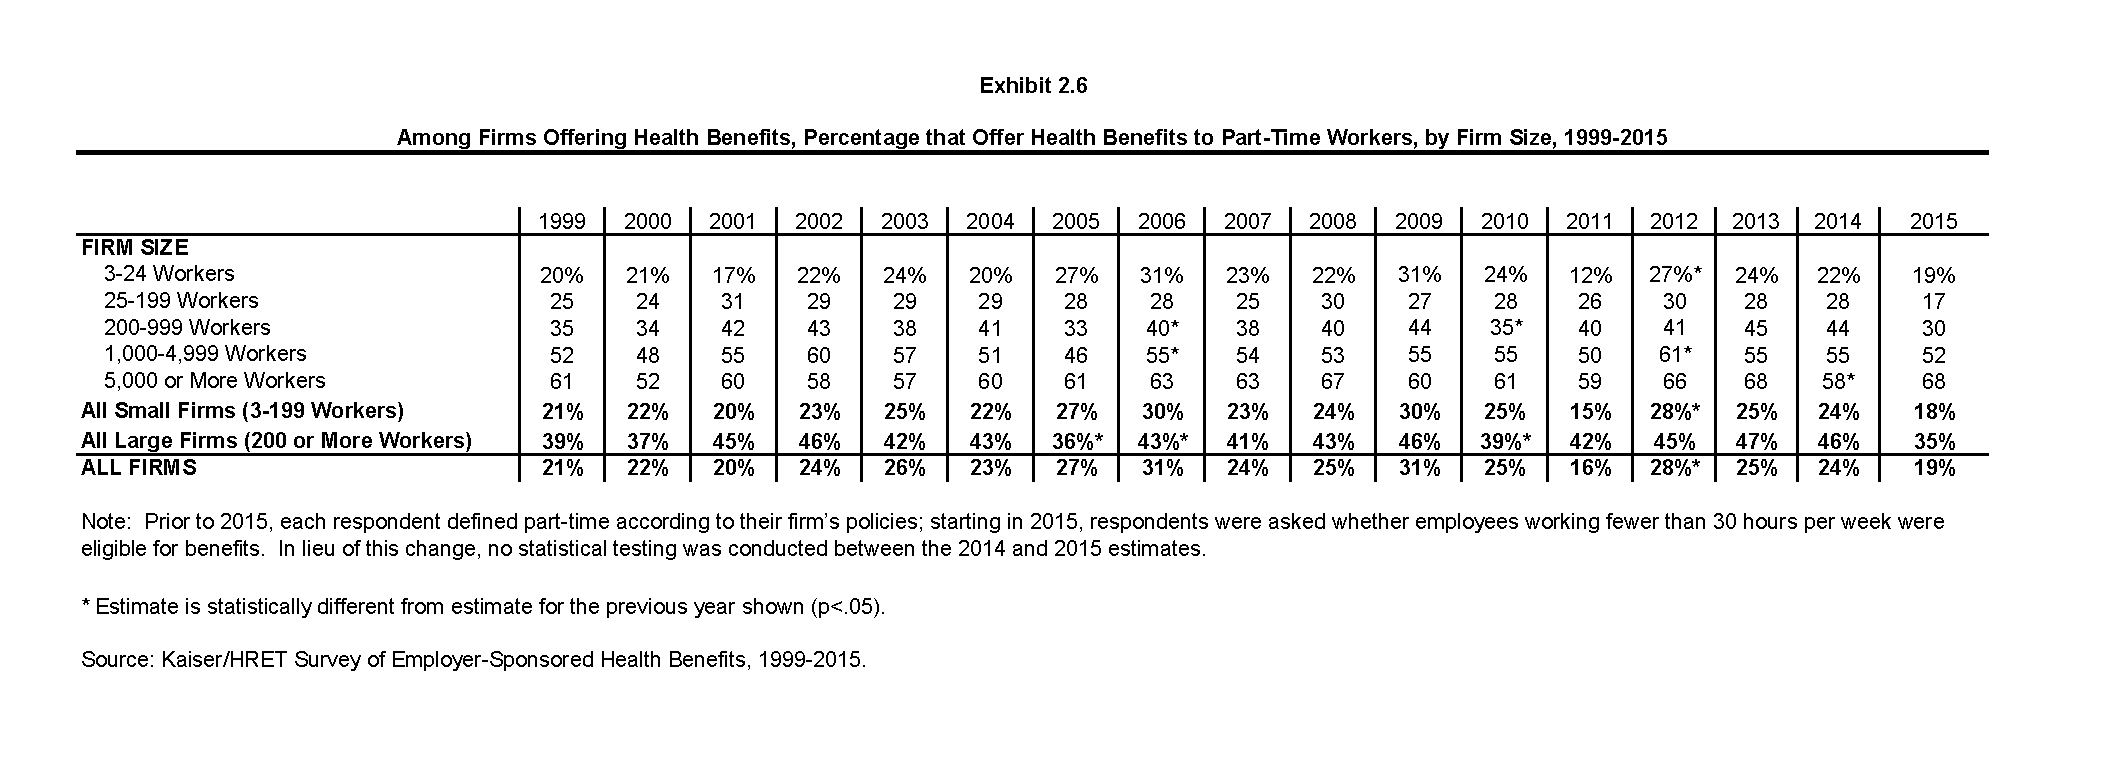
- In 2015, 19% of all firms that offer health benefits offer them to part-time workers (Exhibit 2.6). Firms with 200 or more workers are more likely to offer health benefits to part-time employees than firms with 3 to 199 workers (35% vs. 18%) (Exhibit 2.9).
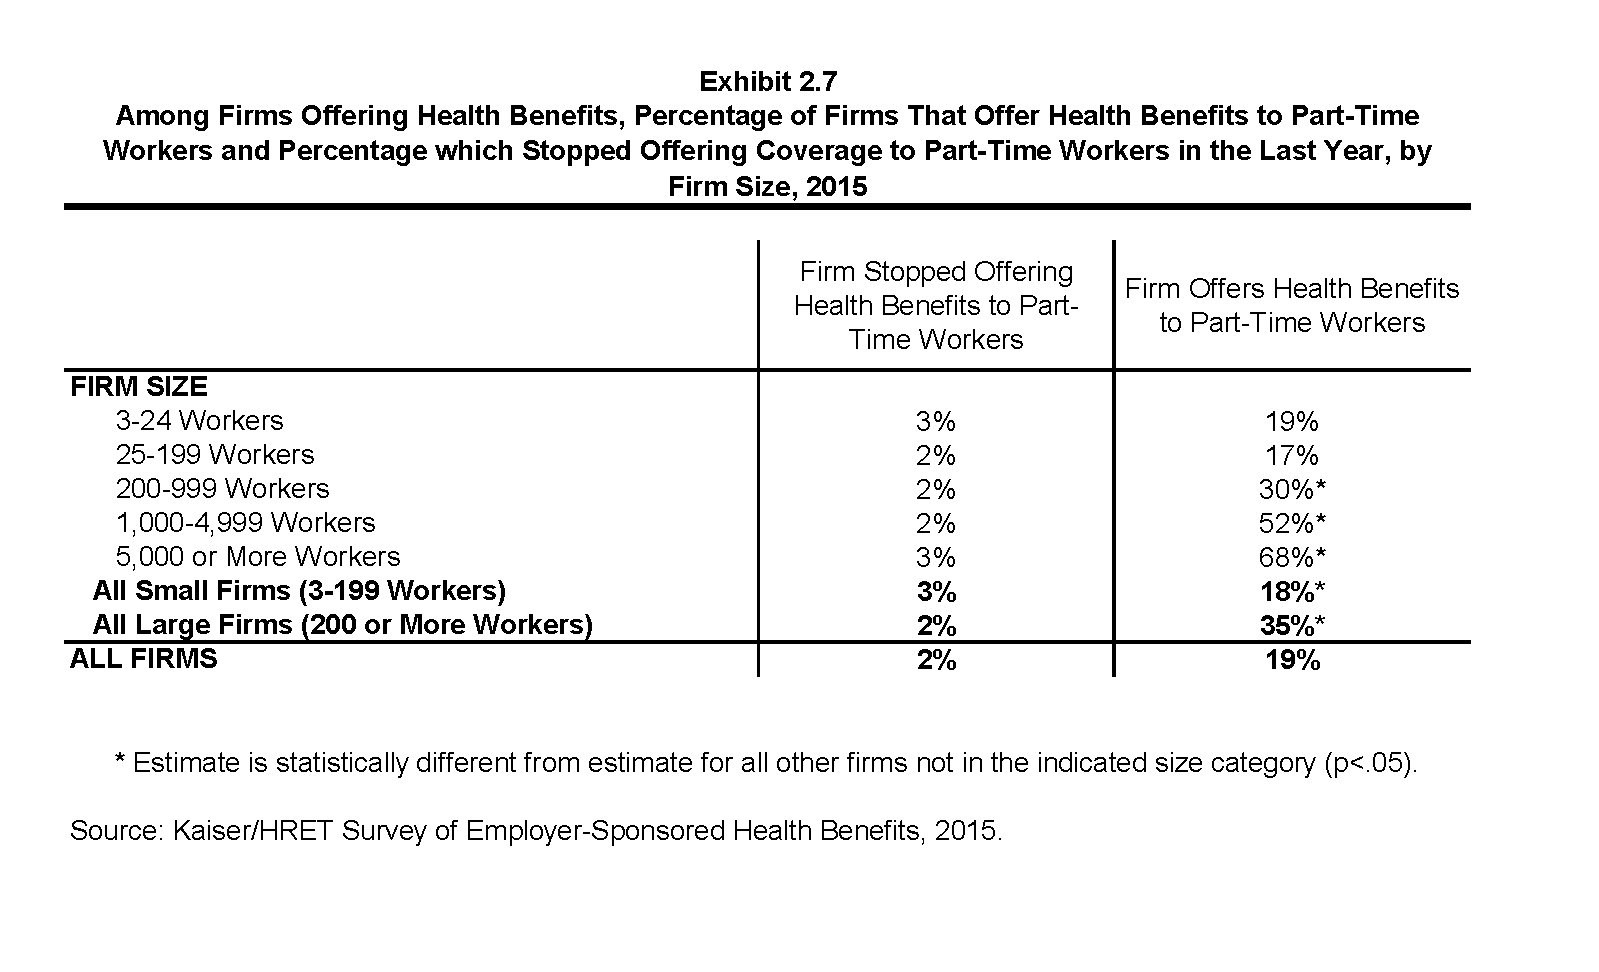
- Among firms offering health benefits to at least some employees, relatively few report that they stopped offering benefits to part-time workers in the last year (2%) (Exhibit 2.7).
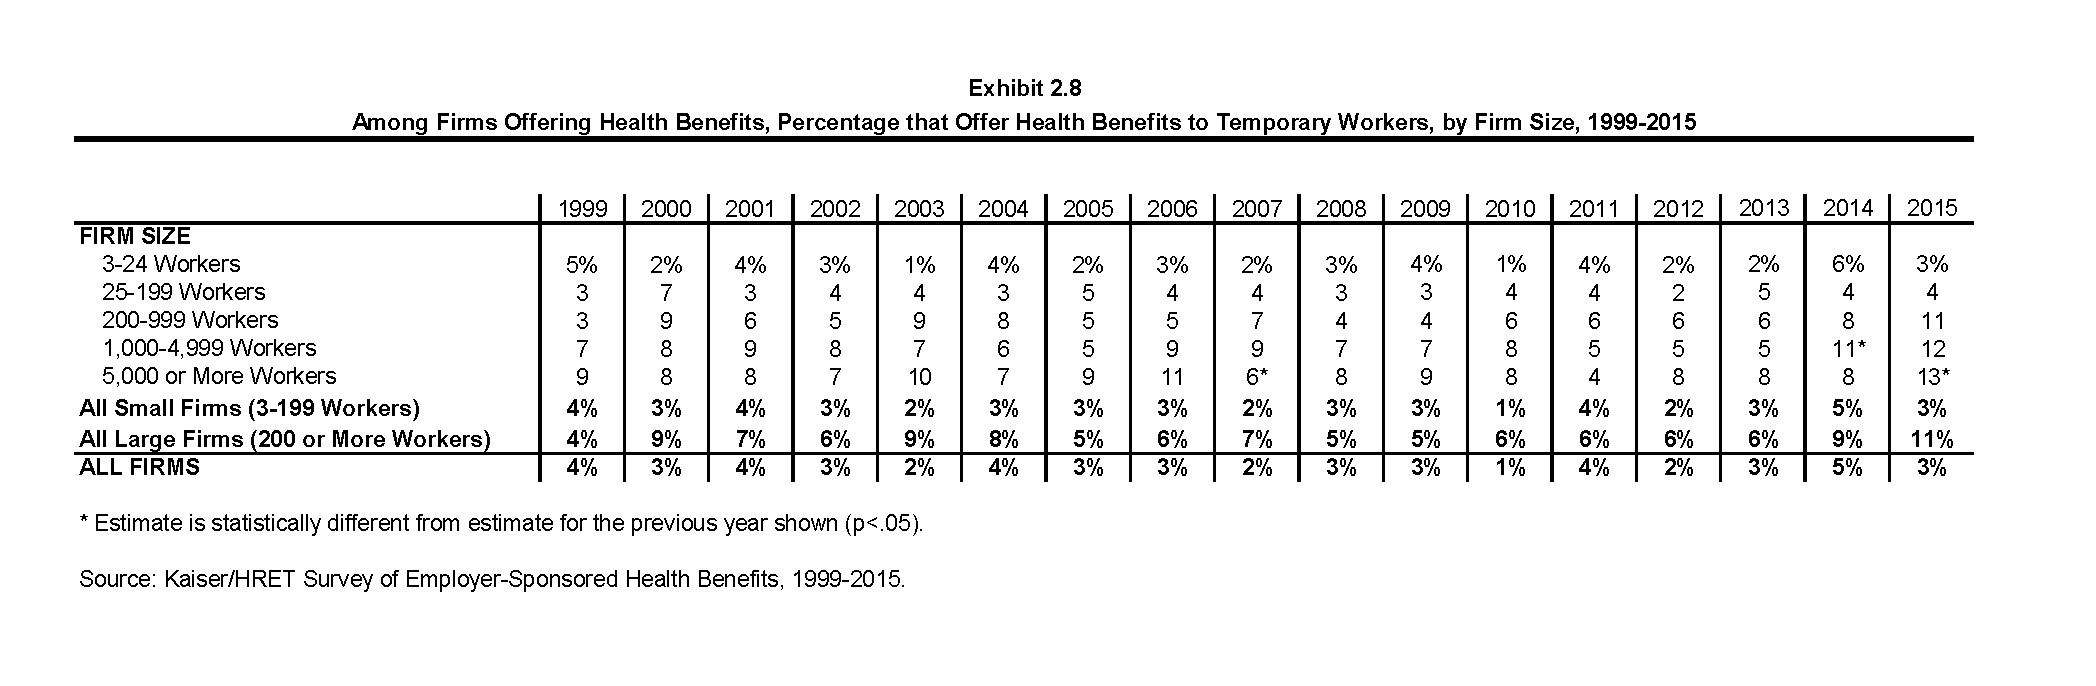
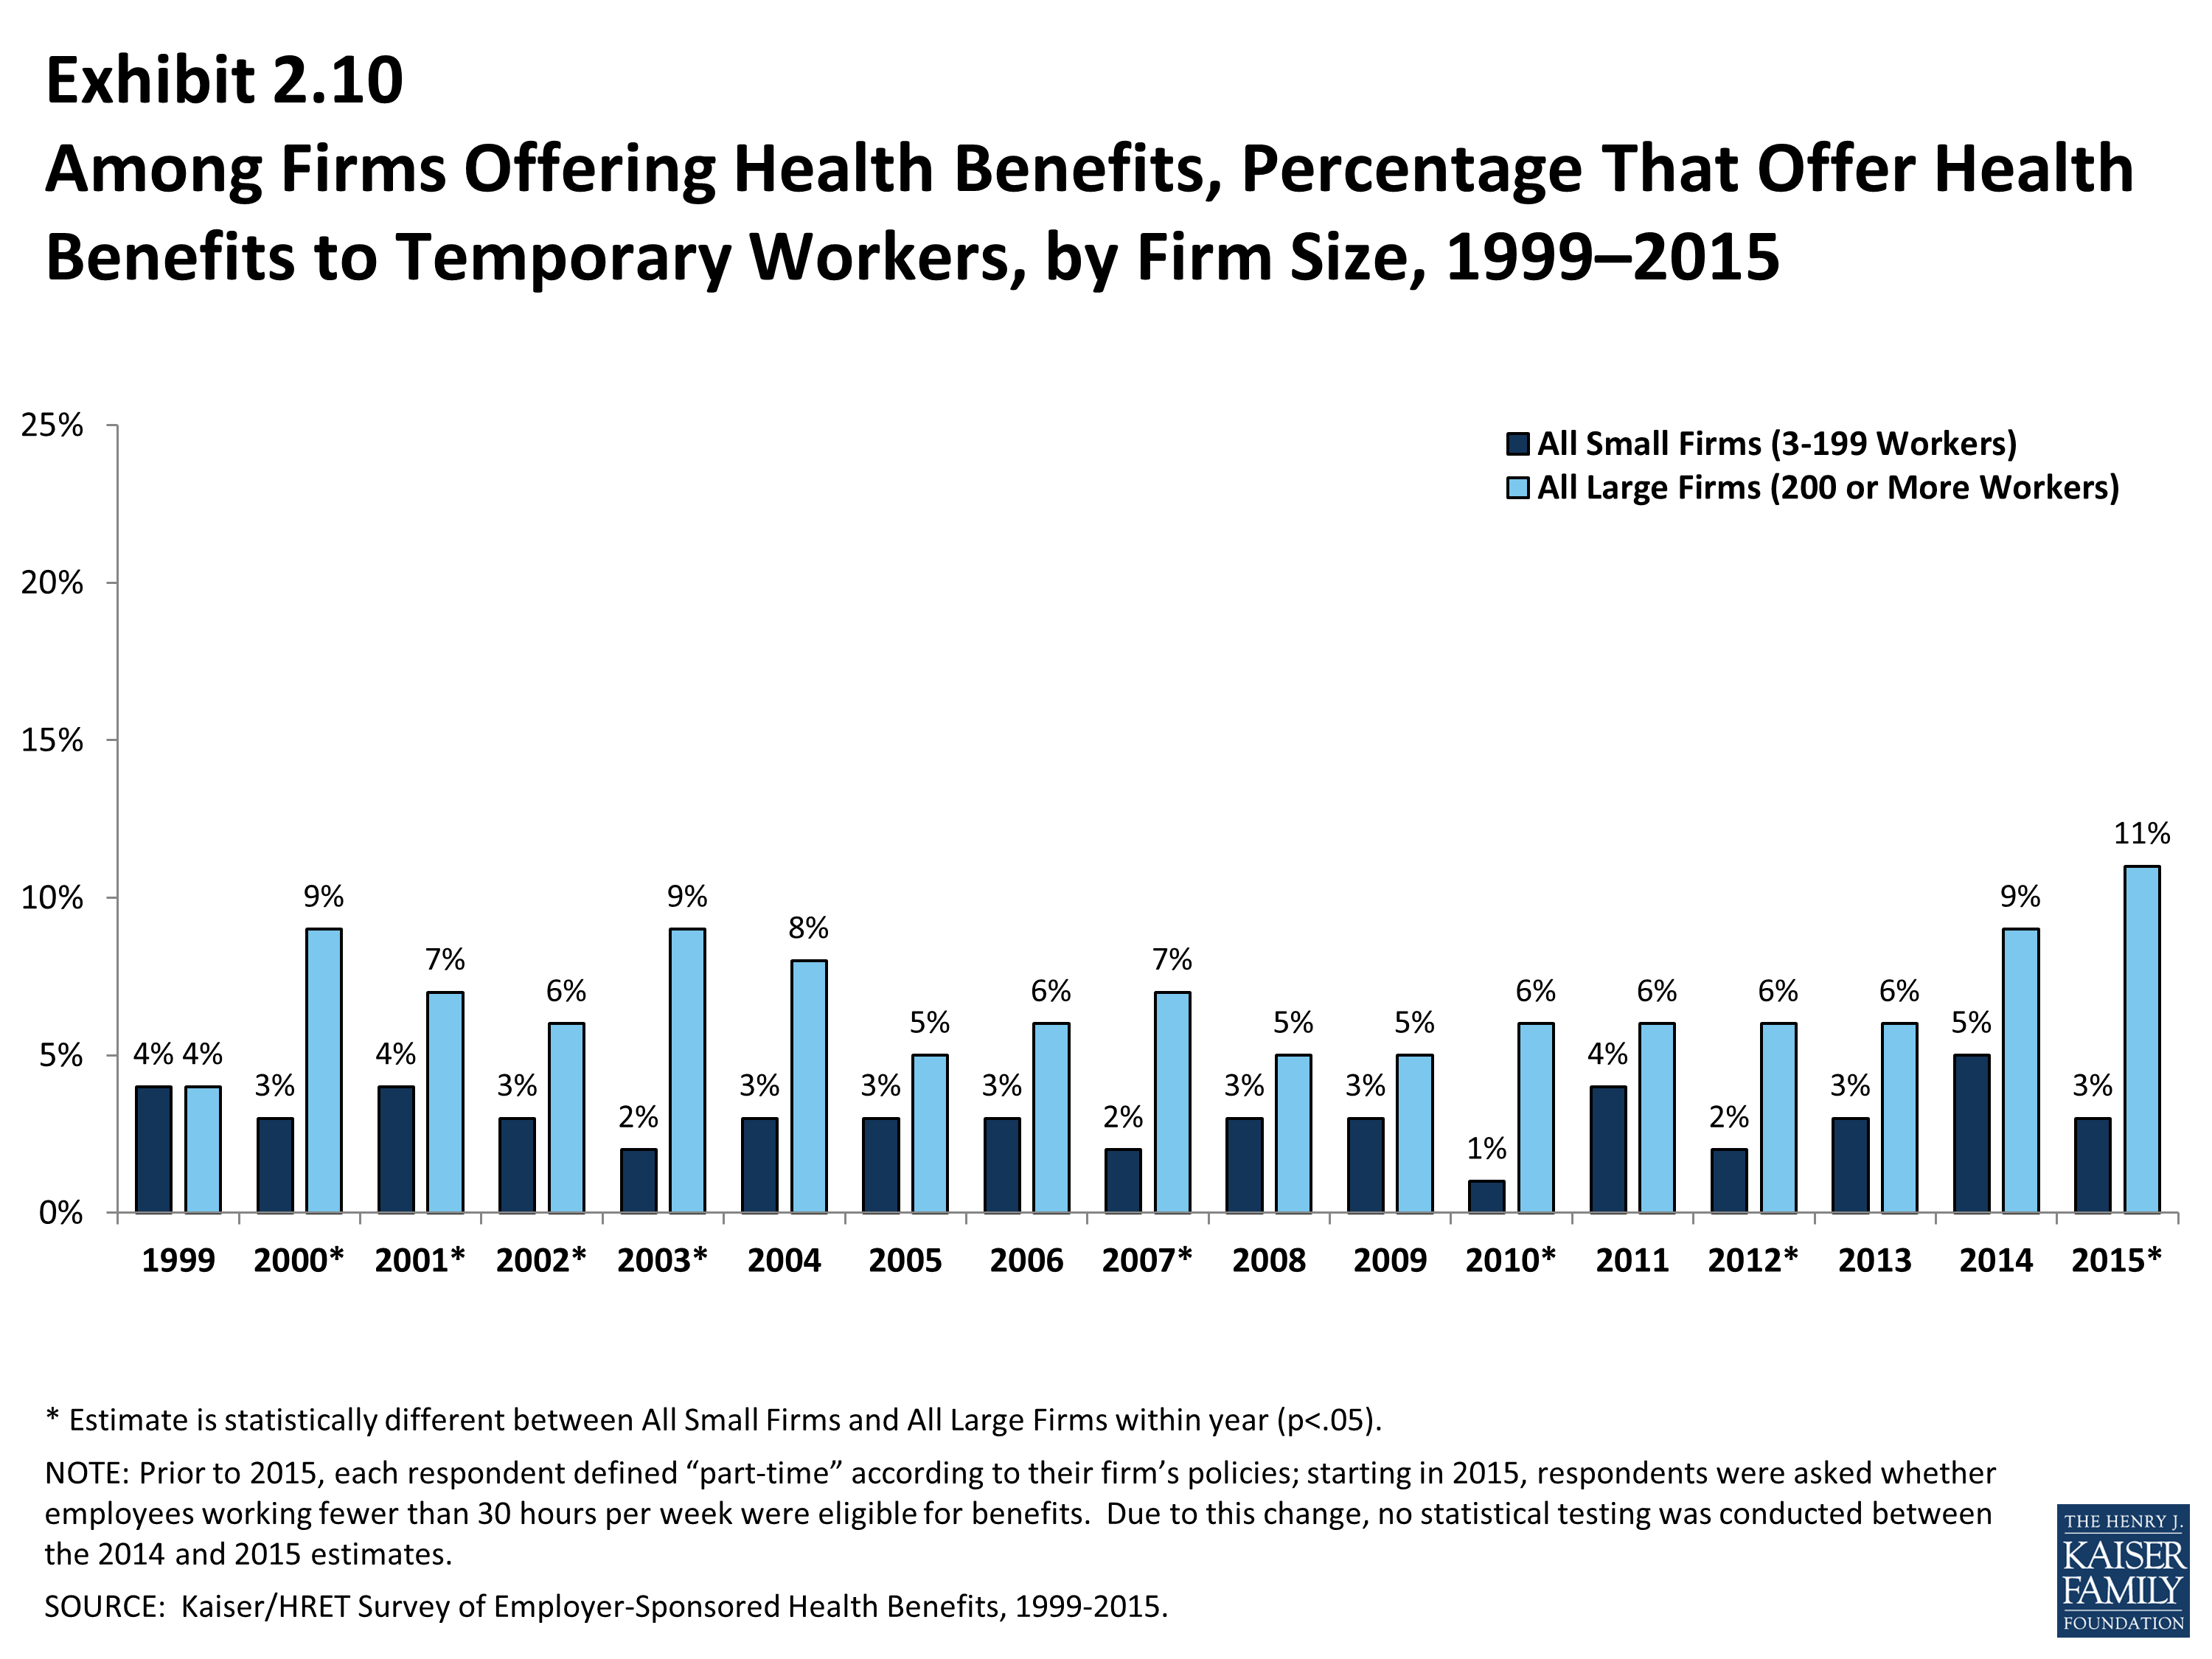
- A small percentage (3%) of firms offering health benefits offer them to temporary workers (Exhibit 2.8). More large firms (200 or more workers) offering health benefits elect to offer temporary workers coverage than small firms (11% vs. 3%) (Exhibit 2.10).
Spouses, Dependents and Domestic Partner Benefits
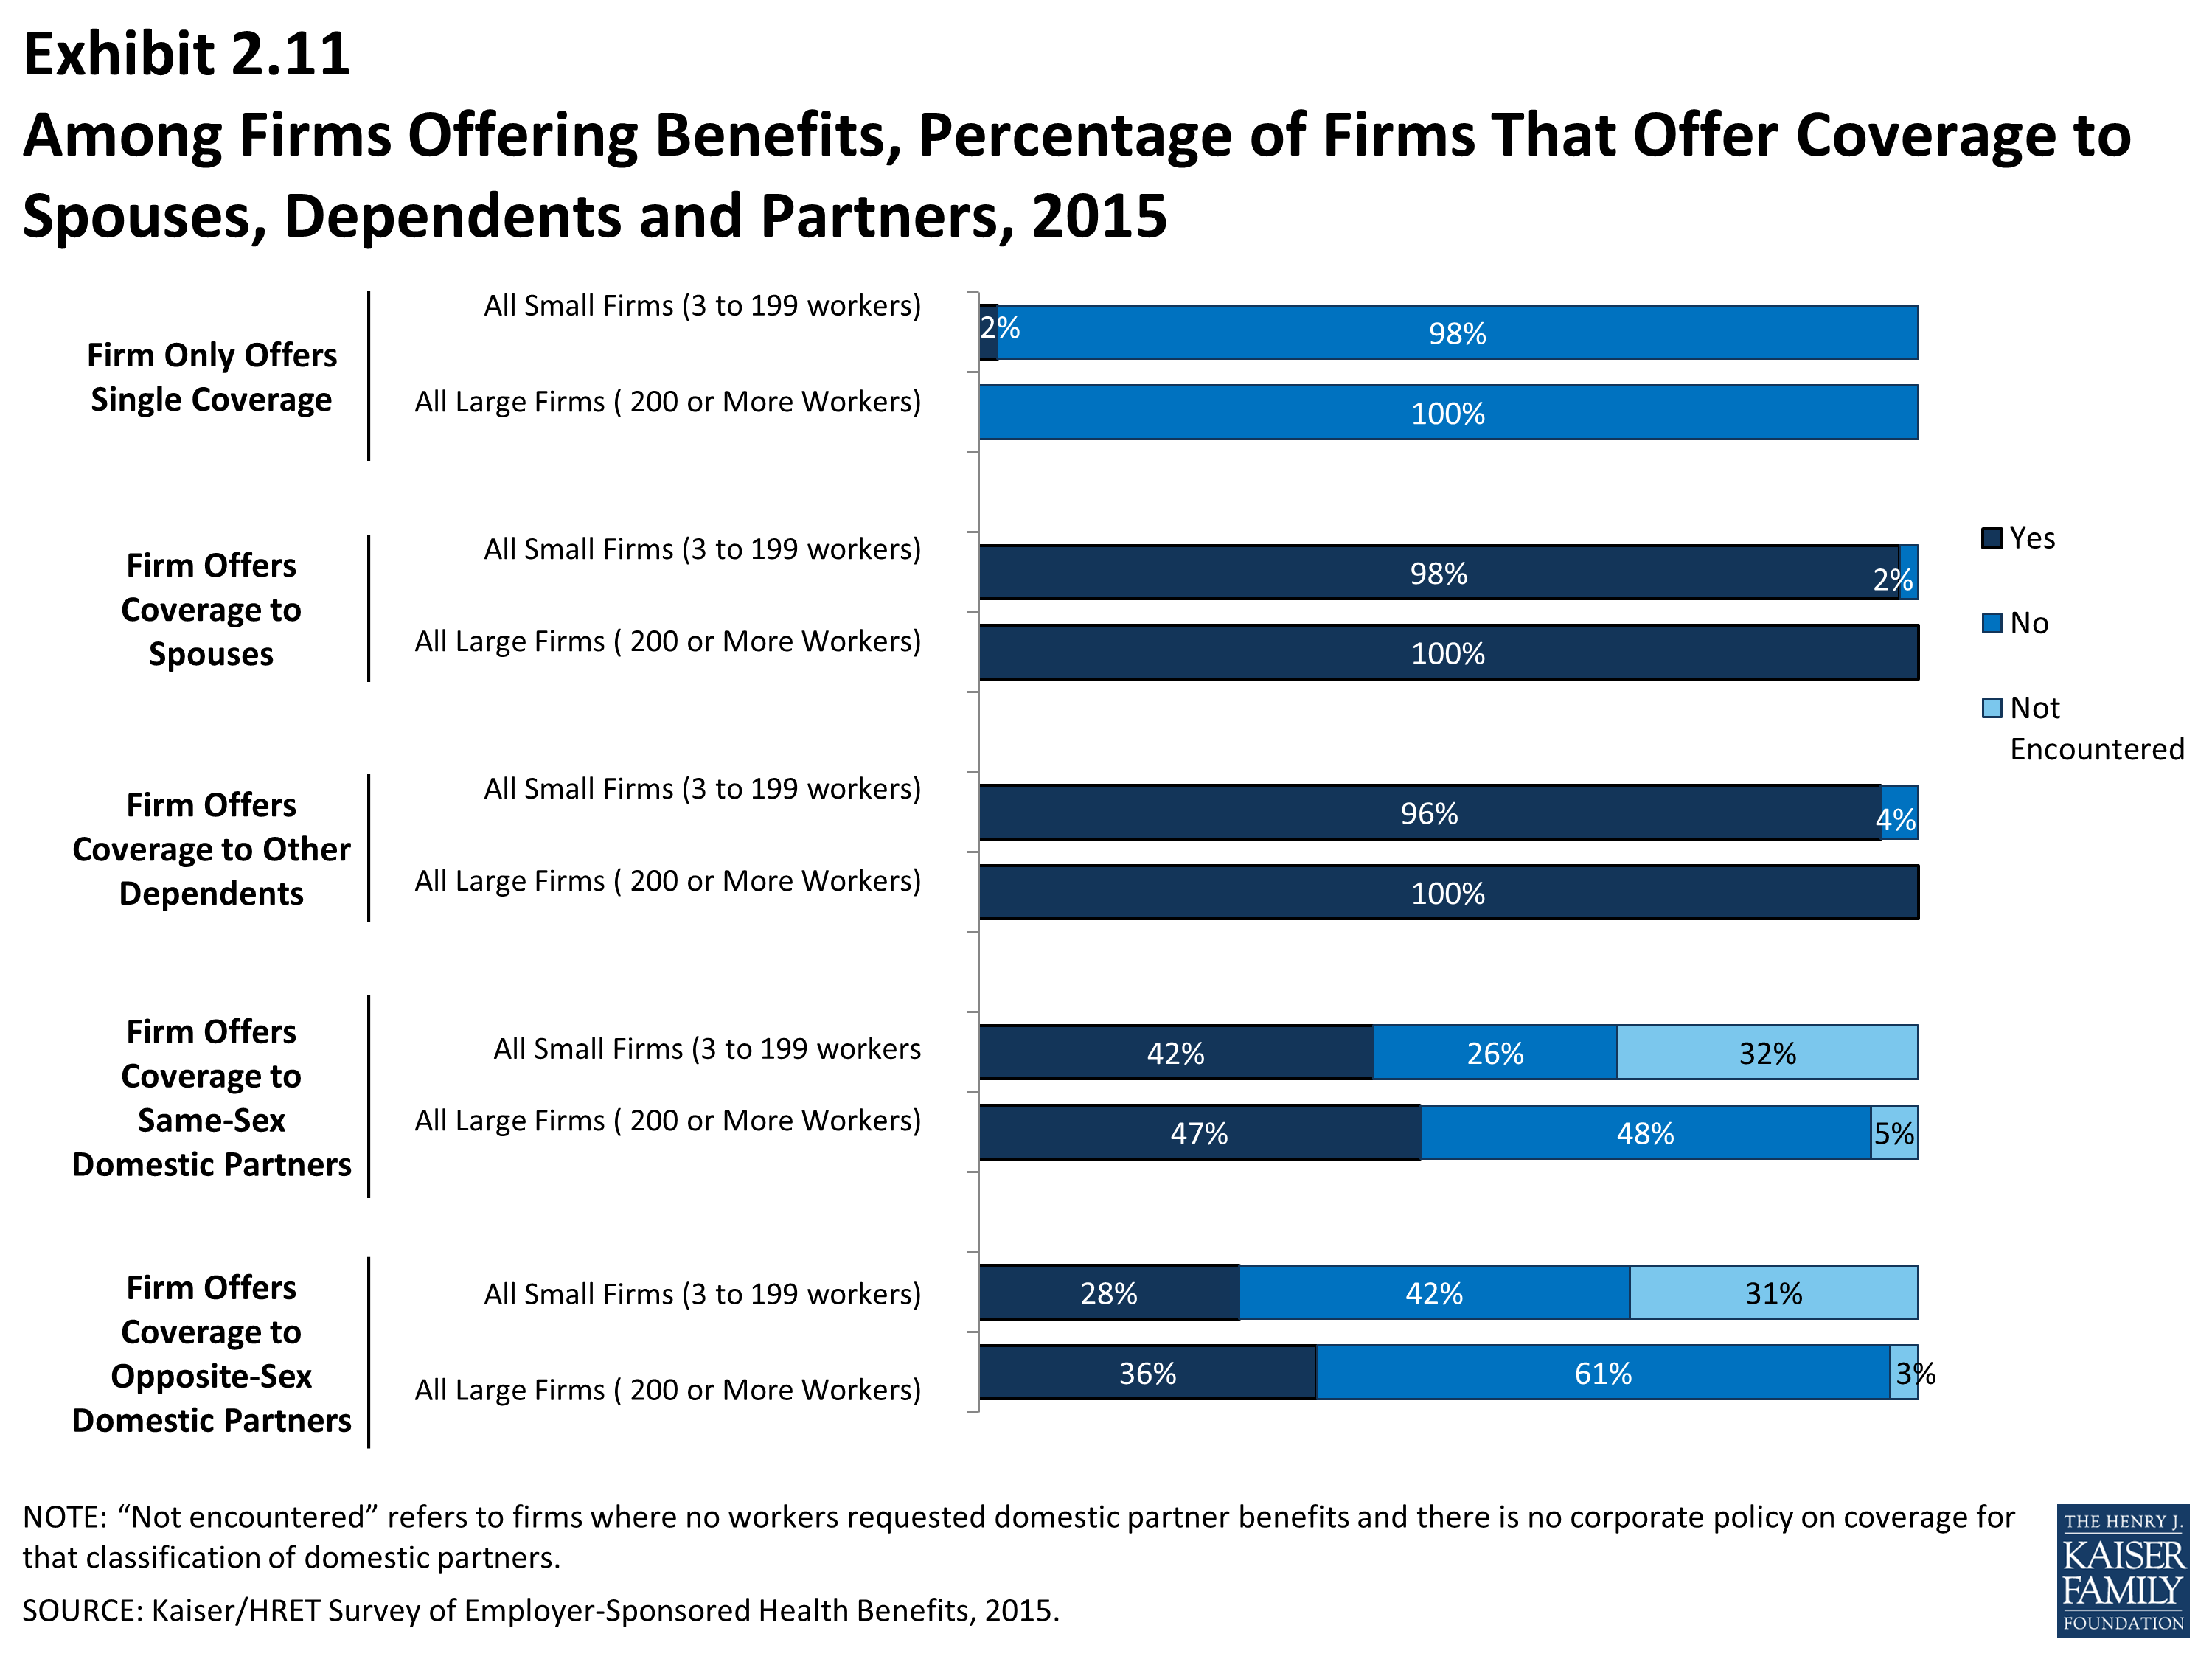
- The vast majority of firms offering health benefits offer benefits to spouses and dependents, such as children. In 2015, 98% of small firms (3 to 199 workers) and 100% of large firms offering health benefits offer coverage to spouses. Similarly, 96% of small firms and 100% of large firms offering health benefits cover other dependents, such as children. Two percent of small firms offering health benefits do not offer coverage to any dependents (Exhibit 2.11).
- This year we asked employers whether same-sex and opposite-sex domestic partners were allowed to enroll in a firm’s coverage. While definitions may vary, employers often define domestic partners as an unmarried couple who have lived together for a specified period of time. Firms may define domestic partners separately from any legal requirements a state may have, and also, employers may have a different policy in different parts of the country. Employers were asked these questions during the survey’s fielding period from January 2015 to the beginning of June 2015. Some employers may elect to change their policies for offering same-sex and opposite-sex domestic partner benefits following recent judicial decisions.
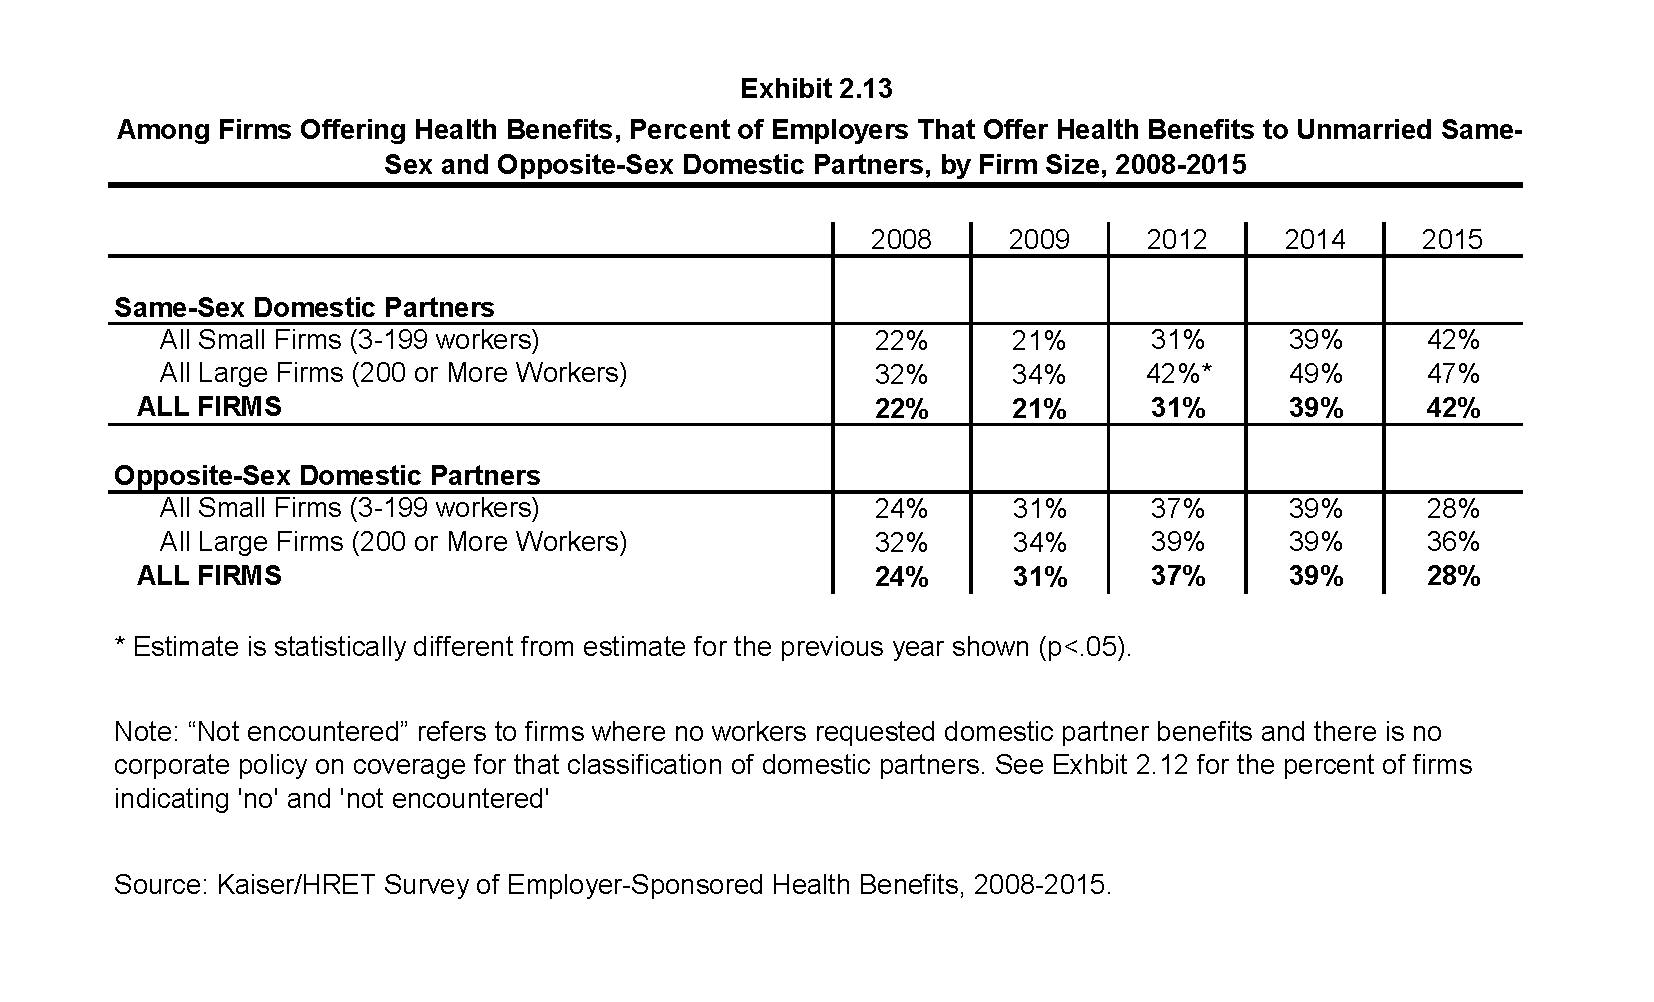
- In 2015, 28% of firms offering health benefits offered coverage to unmarried opposite-sex partners, similar to the 39% who did so in 2014. In 2015, 42% of firms offering benefits covered same-sex domestic partners, similar to the 39% who did so last year (Exhibit 2.13).
- The rates at which firms have offered domestic partner benefits have increased over a longer period of time. For example, in 2015, 39% of firms offering health benefits offered coverage to same-sex domestic partners, a significant increase from the 21% that did so in 2009 (Exhibit 2.13).
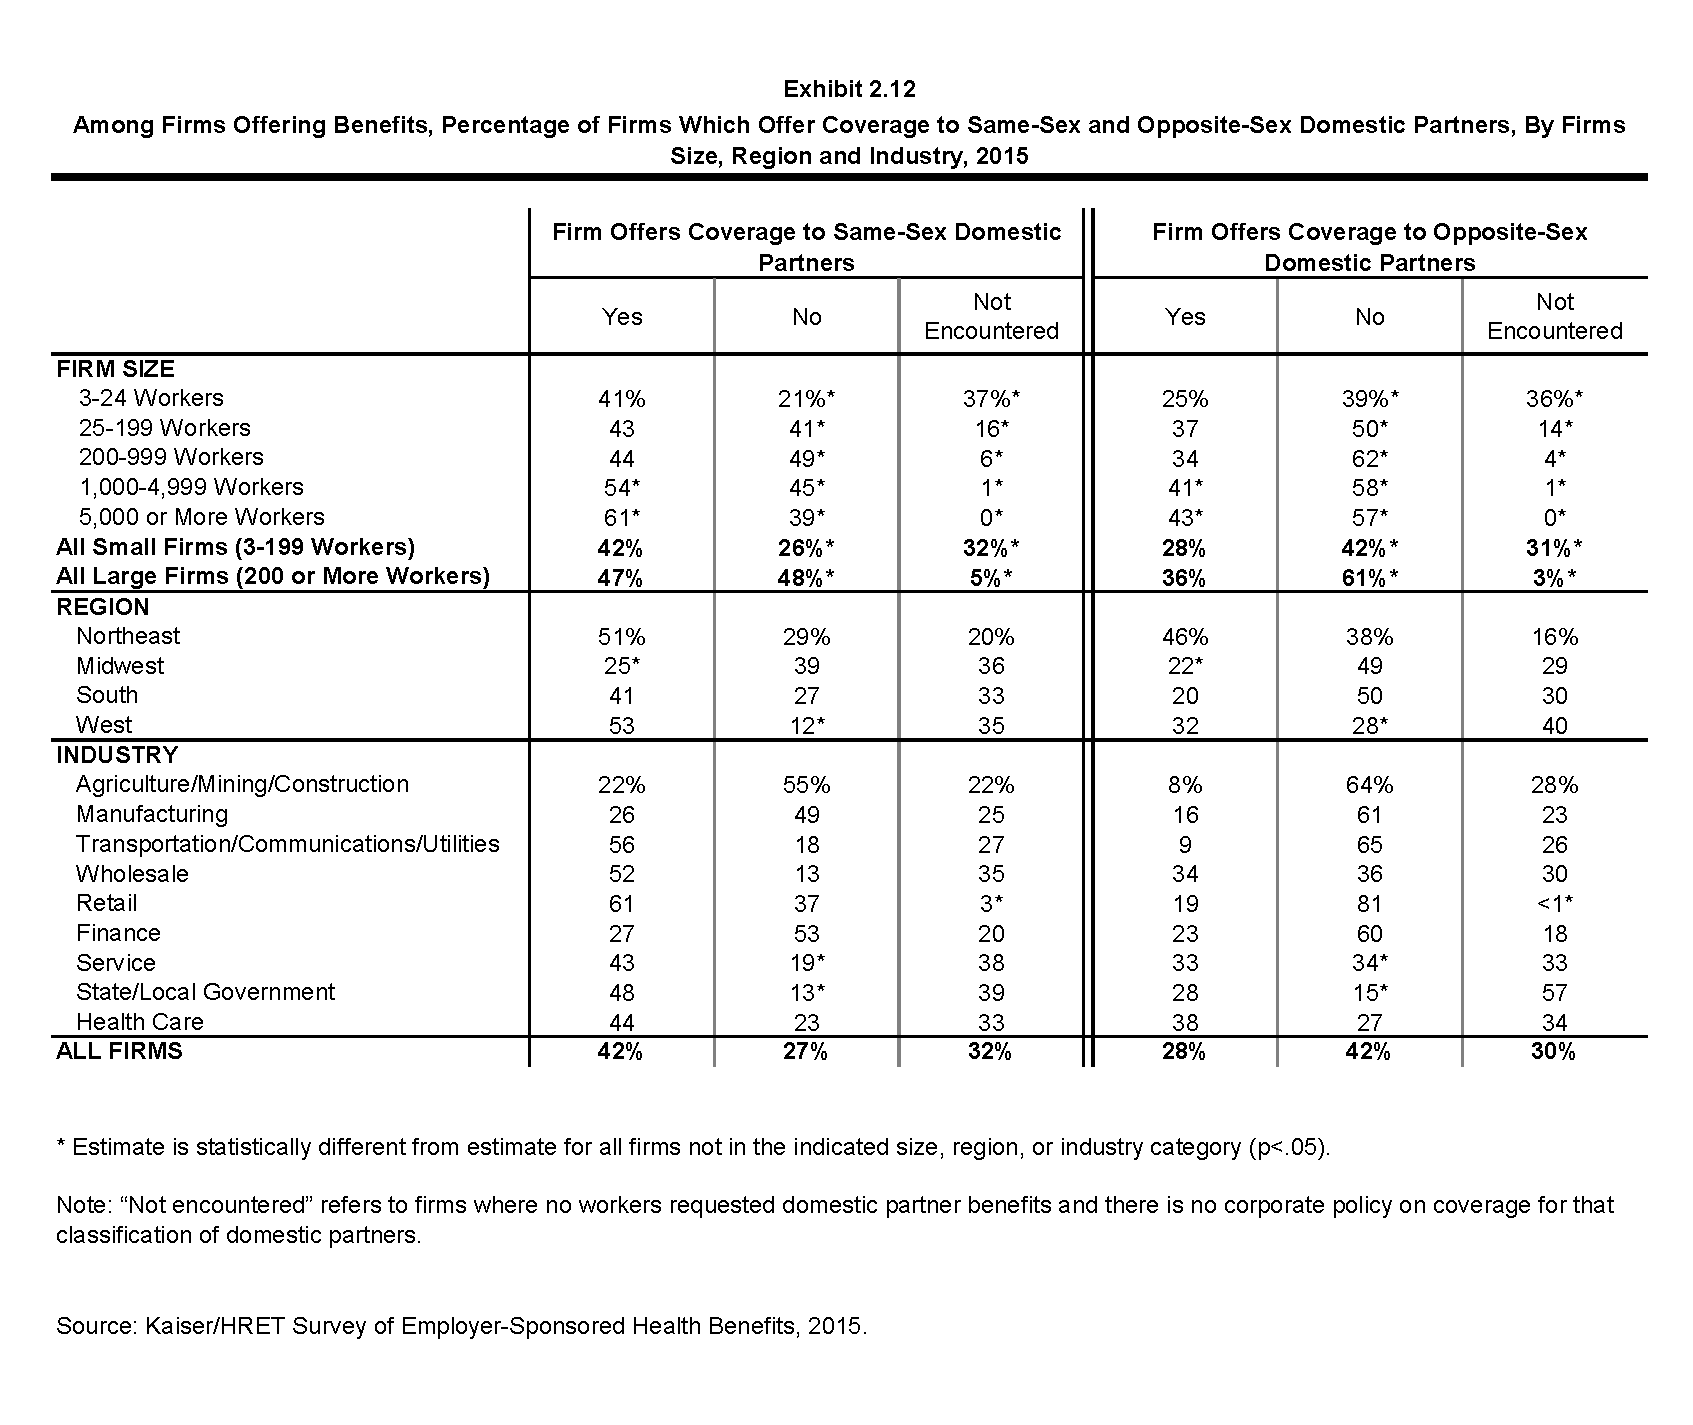
- When we ask employers if they offer health benefits to opposite or same-sex domestic partners, many firms report that they have not encountered this issue. At many small firms (3 to 199 workers), the firm may not have formal human resource policies on domestic partners simply because none of the firm’s employees have asked to cover a domestic partner. Regarding health benefits for opposite-sex domestic partners, 30% of firms report in 2015 that they have not encountered this need or that the question was not applicable. The vast majority of firms in the United States are small businesses; 61% of firms have between 3 and 9 employees and 98% have between 3 and 199 employees (Exhibit M.1). Therefore, statistics about the percentage of firms that offer domestic partner benefits are largely determined by small businesses. More small firms (31%) compared to large firms (3%) indicate that they have not encountered this need or that the question was not applicable (Exhibit 2.12). Regarding health benefits for same-sex domestic partners, 32% of firms report that they have not encountered the need or that the question was not applicable. More small firms (32%) than large firms (5%) report that they have not encountered the issue of offering benefits to same-sex domestic partners (Exhibit 2.12).
Firms Not Offering Health Benefits
- The survey asks firms that do not offer health benefits if they have offered insurance or shopped for insurance in the recent past, and about their most important reasons for not offering coverage. Because such a small percentage of large firms report not offering health benefits, we present responses for small non-offering firms (3 to 199 workers) only.
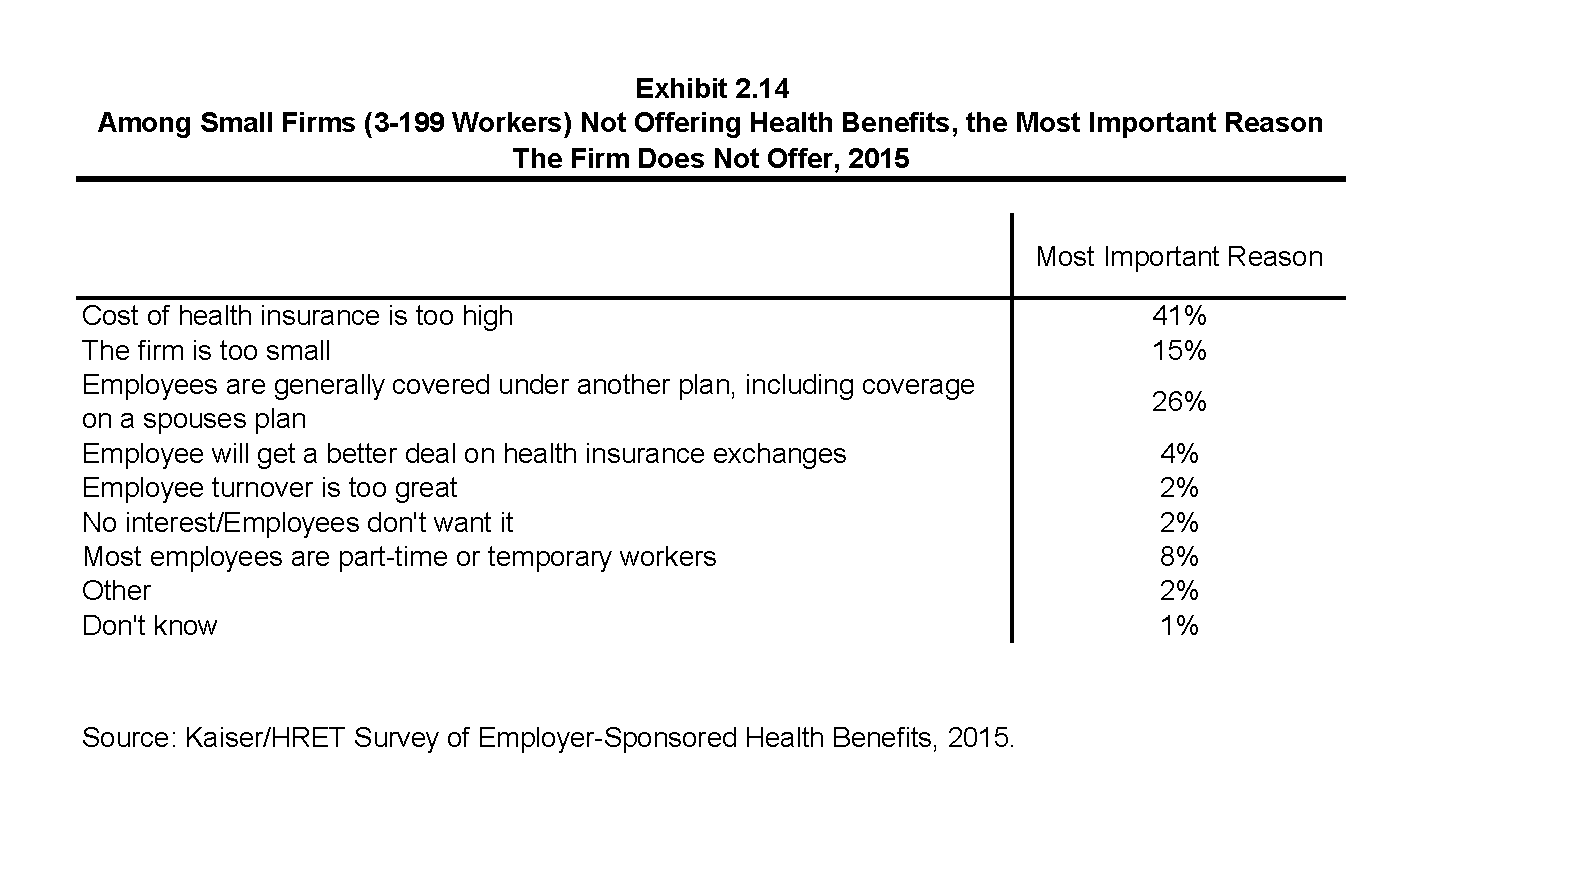
- The cost of health insurance remains the primary reason cited by firms for not offering health benefits. Among small firms (3-199 workers) not offering health benefits, 41% cite high cost as “the most important reason” for not doing so, followed by “employees are generally covered under another plan” (26%) (Exhibit 2.14). Relatively few employers indicate that they did not offer because they believe that employees will get a better deal on the health insurance exchanges (4%).
- Many non-offering small firms have either offered health benefits in the past five years, or shopped for alternative coverage options recently.
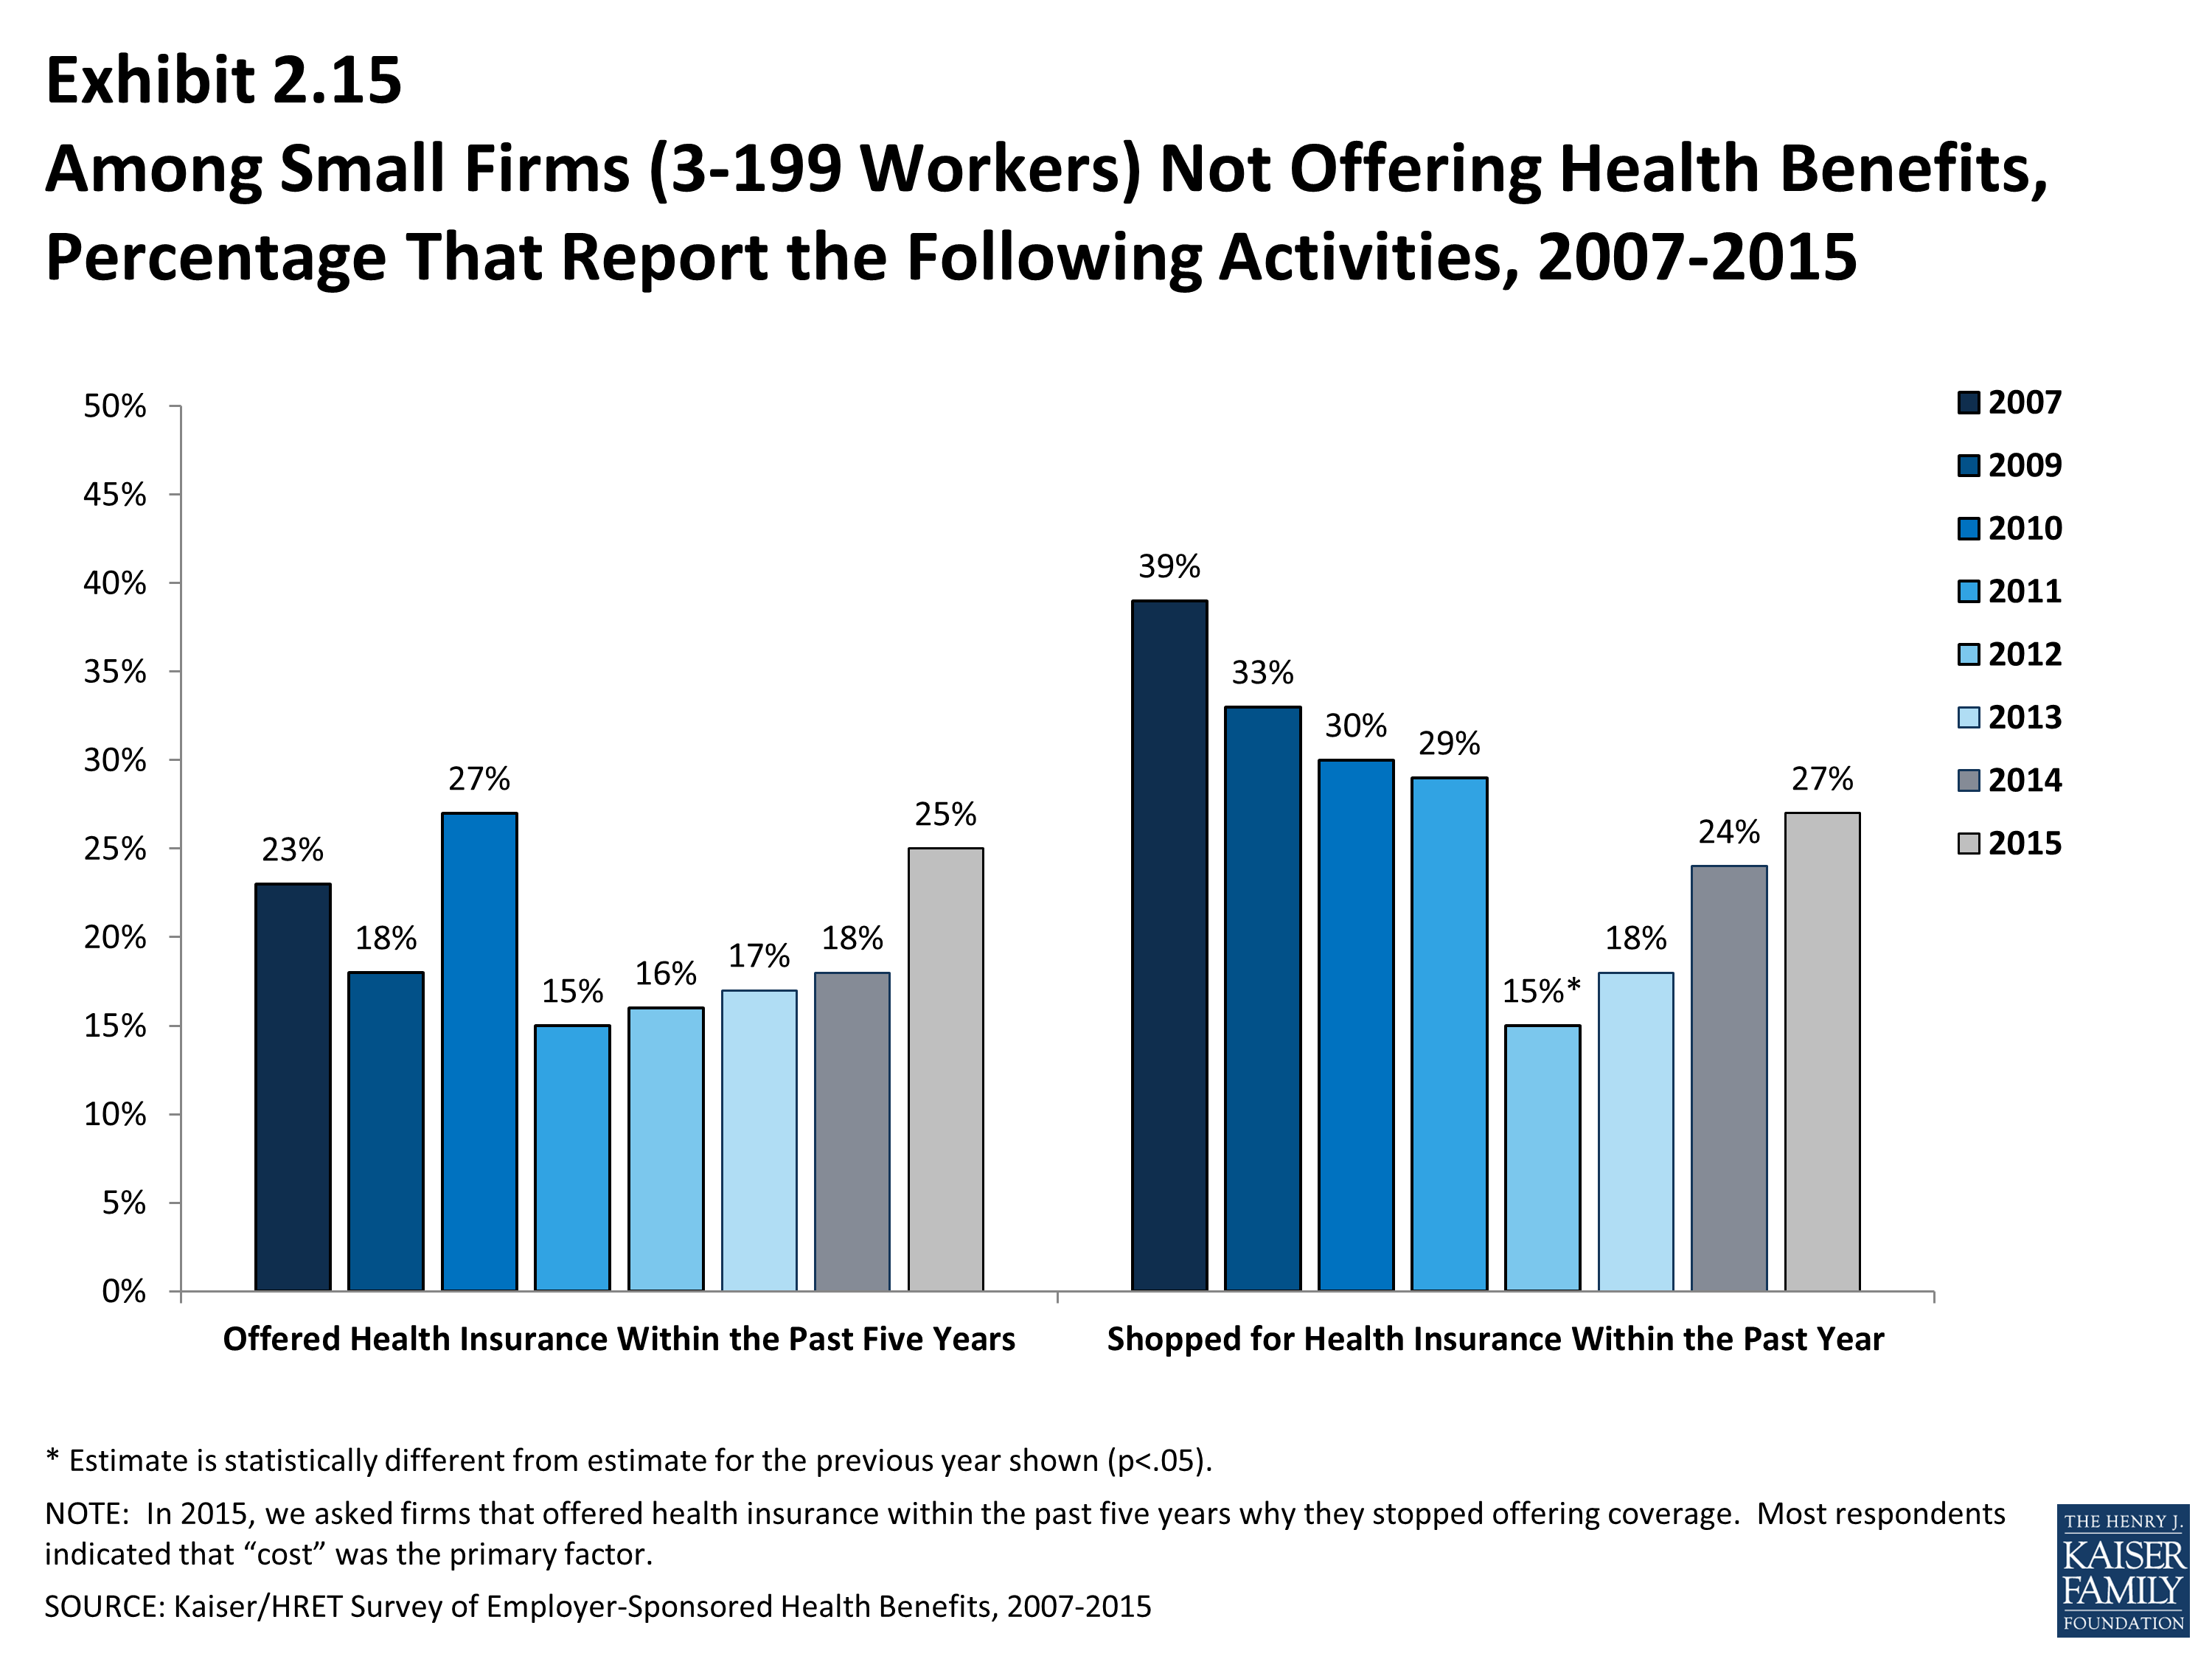
- Twenty-five percent of non-offering small firms (3 to 199 workers) have offered health benefits in the past five years, while 27% have shopped for coverage in the past year (Exhibit 2.15). The 25% of non-offering small firms which have offered coverage in the past five years is similar to the 18% reported last year.
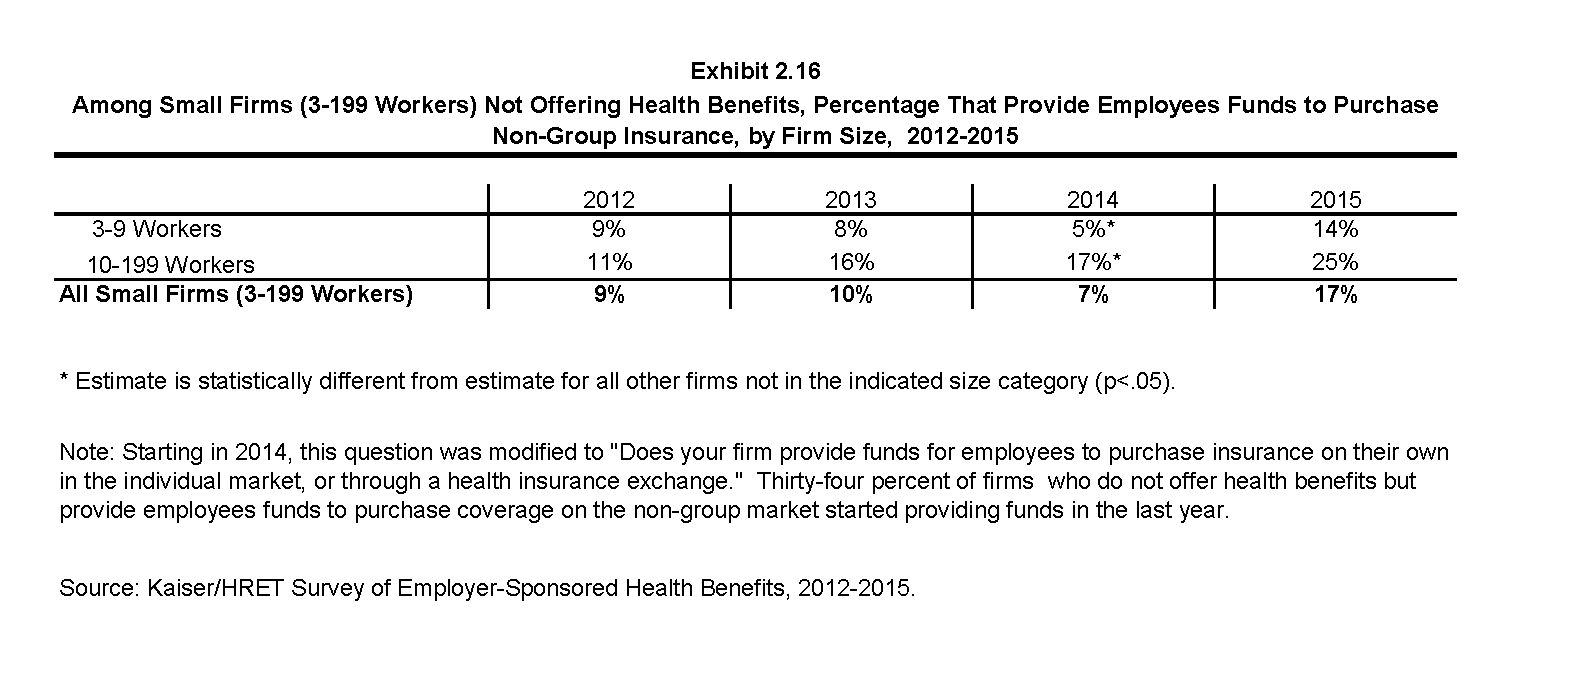
- Among non-offering small firms (3 to 199 workers), 17% report that they provide funds to their employees to purchase health insurance through the individual, also known as the non-group, market, such as on an individual health insurance marketplace (Exhibit 2.16). The percentage of small firms (3 to 199 workers) offering funds to purchase non-group coverage is significantly higher than last year (7%). The IRS has issued guidance limiting the circumstances in which employers can contribute to an employee’s non-group plan going forward3. Thirty-five percent of small firms that do not offer health benefits but provide employees funds to purchase coverage on the non-group market reported that they started providing funds in the last year.
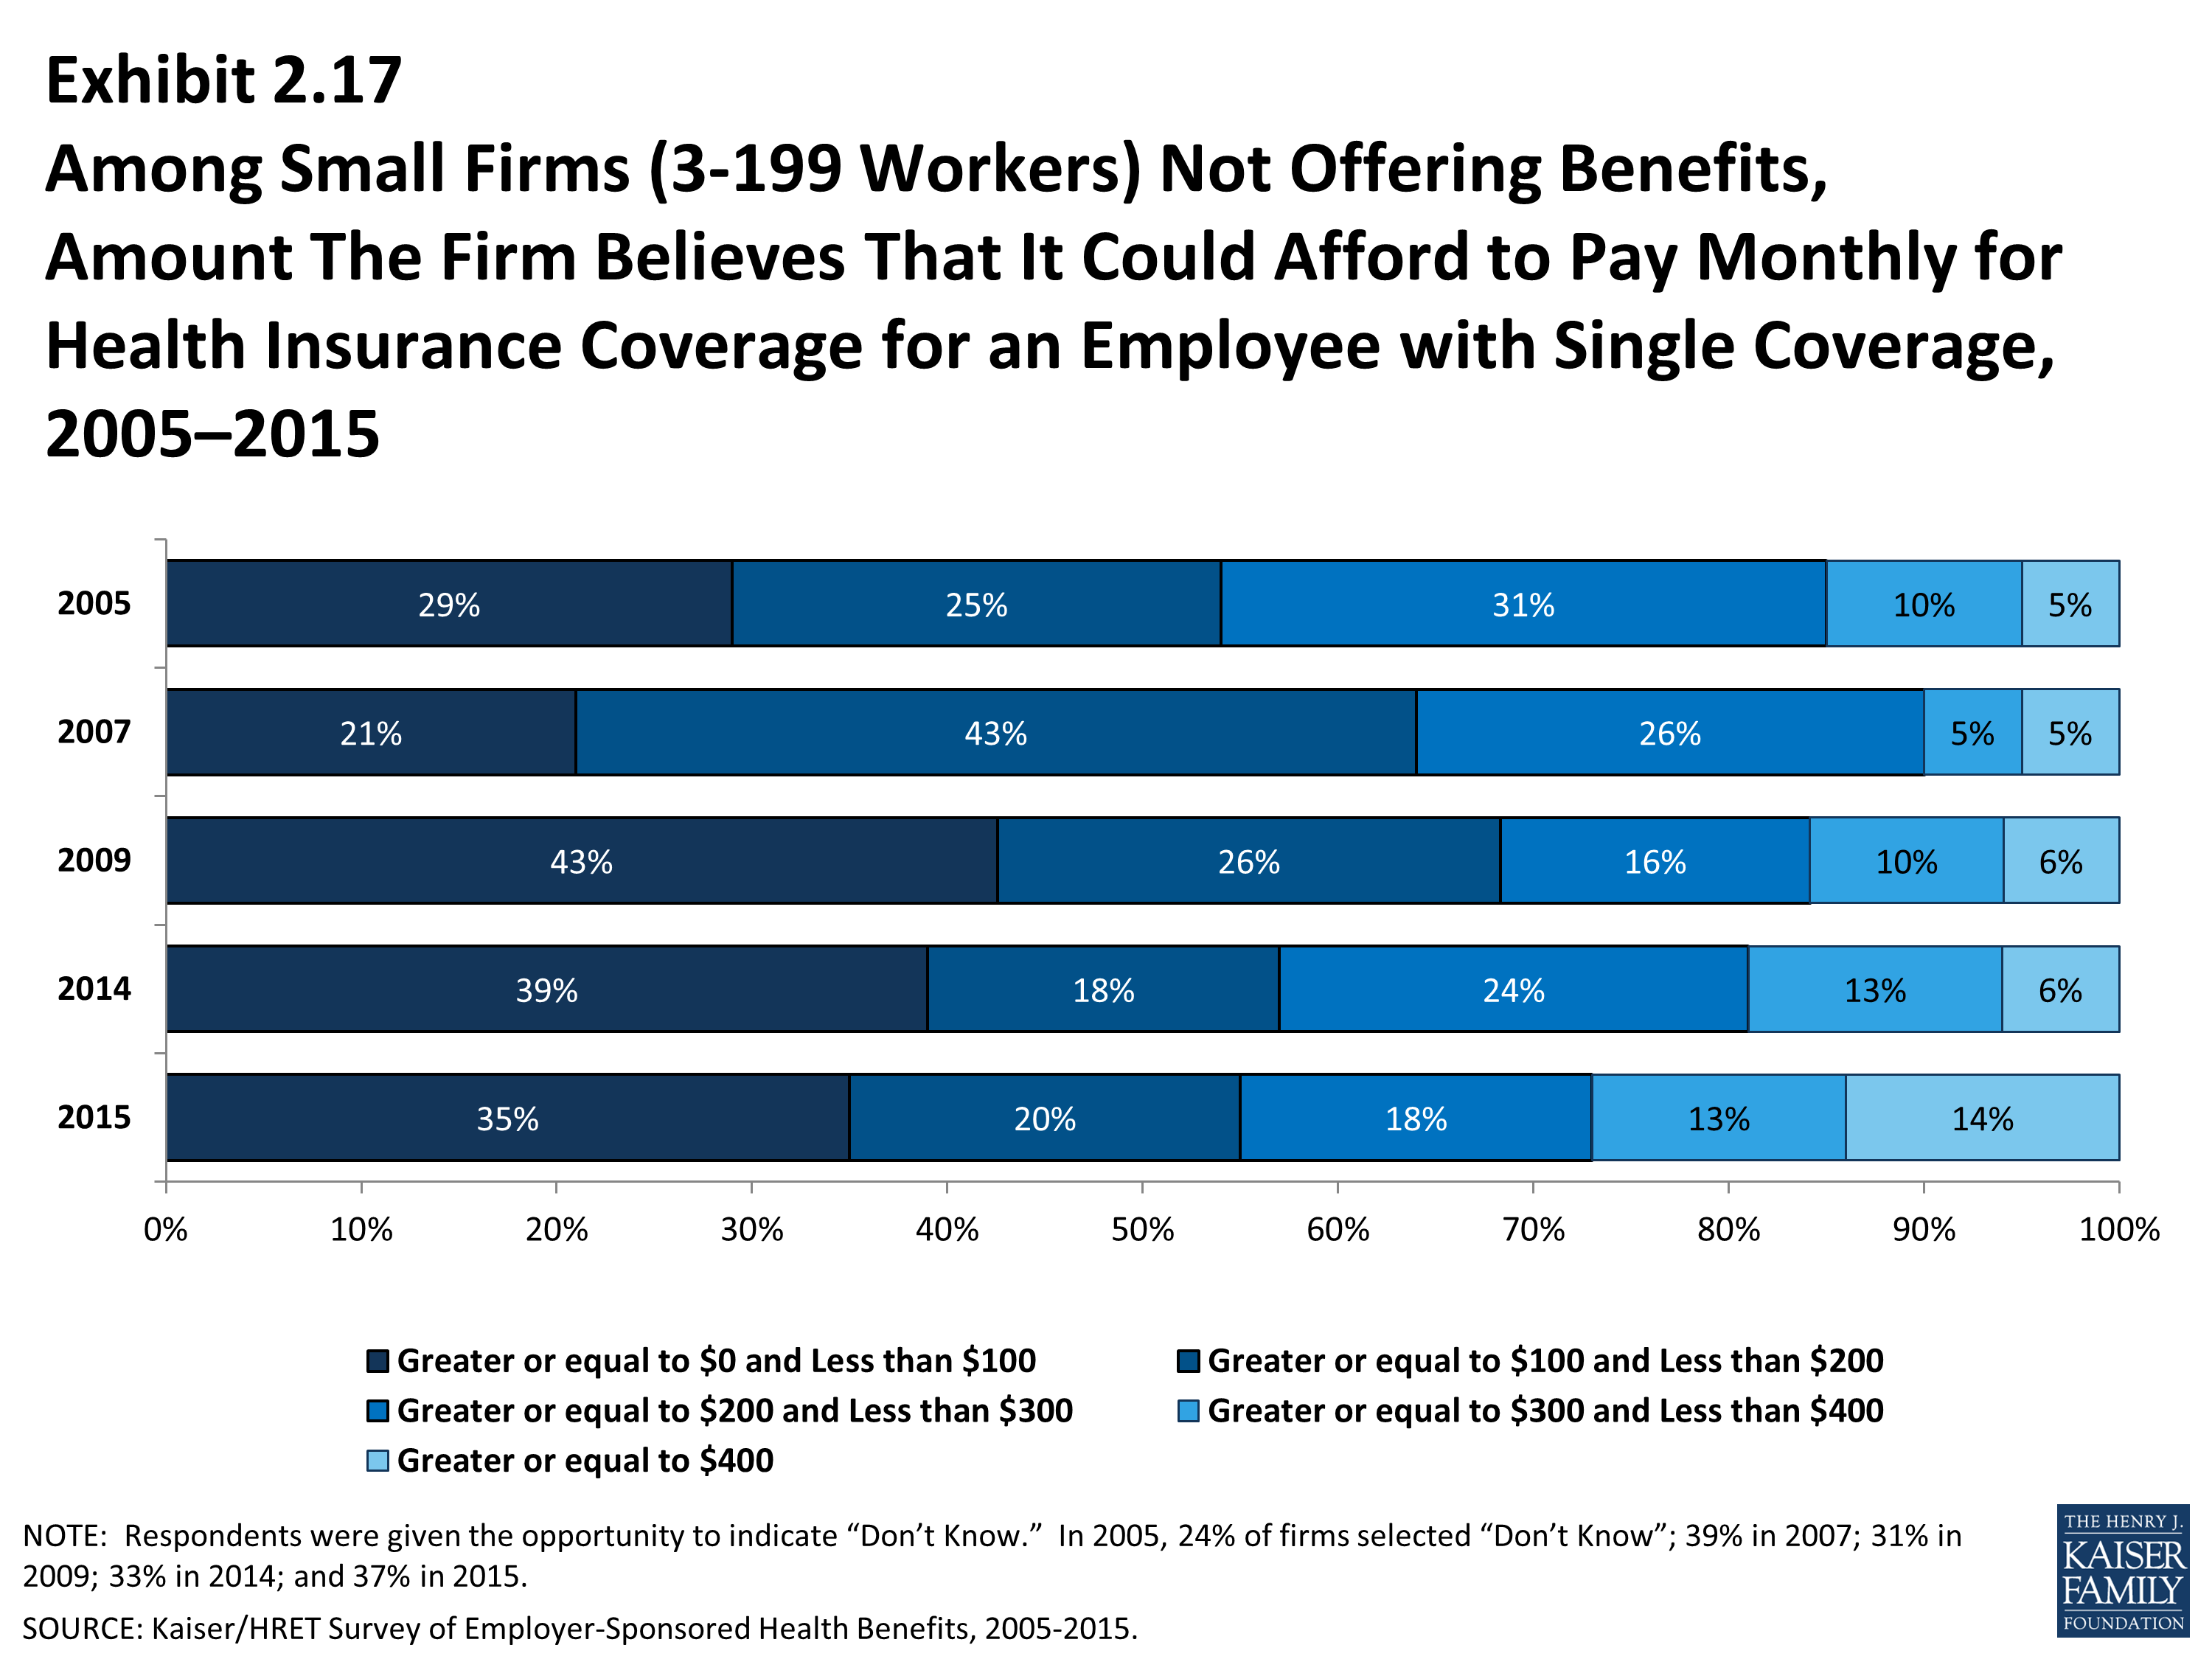
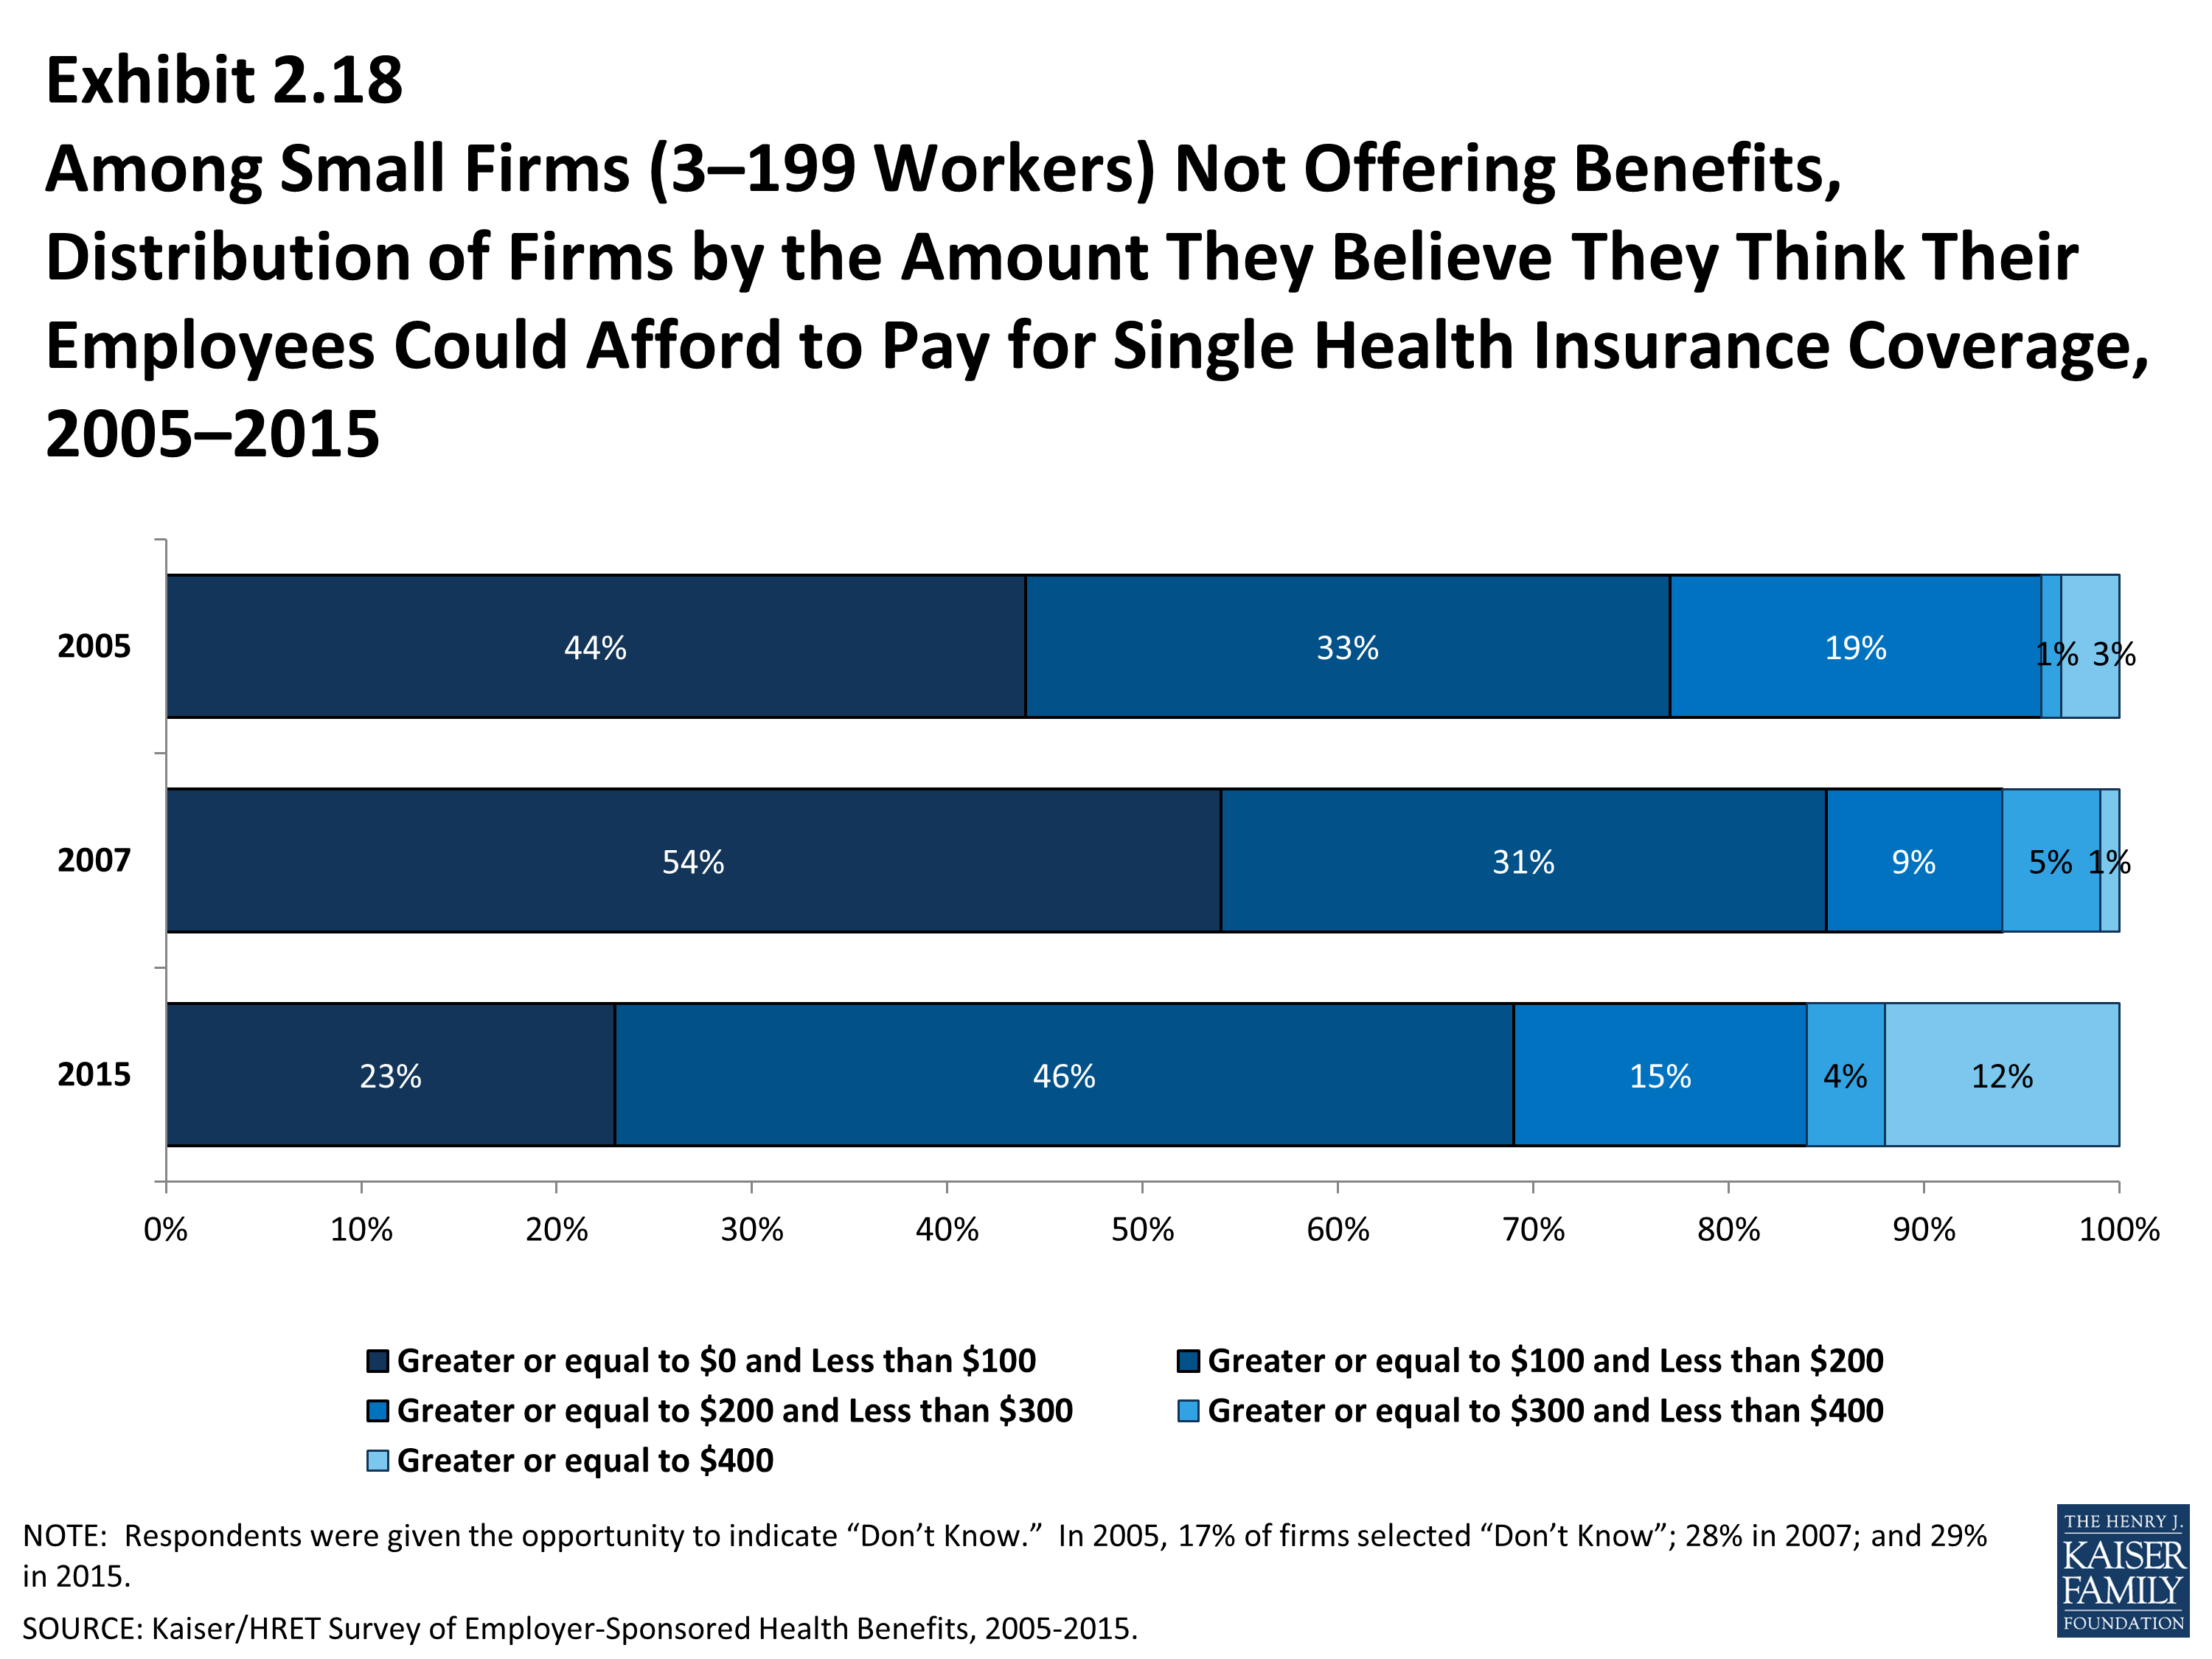
- Small firms (3 to 199 workers) not offering health insurance gave a variety of estimates regarding the amount they believe the firm could afford to pay for health insurance for an employee with single coverage. Thirty-five percent reported that they could pay less than $100 per month; 14% reported that they could pay $400 or more per month (Exhibit 2.17). Alternatively, 23% of small firms not offering health benefits believed that their employees could afford less than $100 a month for single coverage. Twelve percent of firms not offering health benefits believed that their employees could afford more than $400 or more per month (Exhibit 2.18).
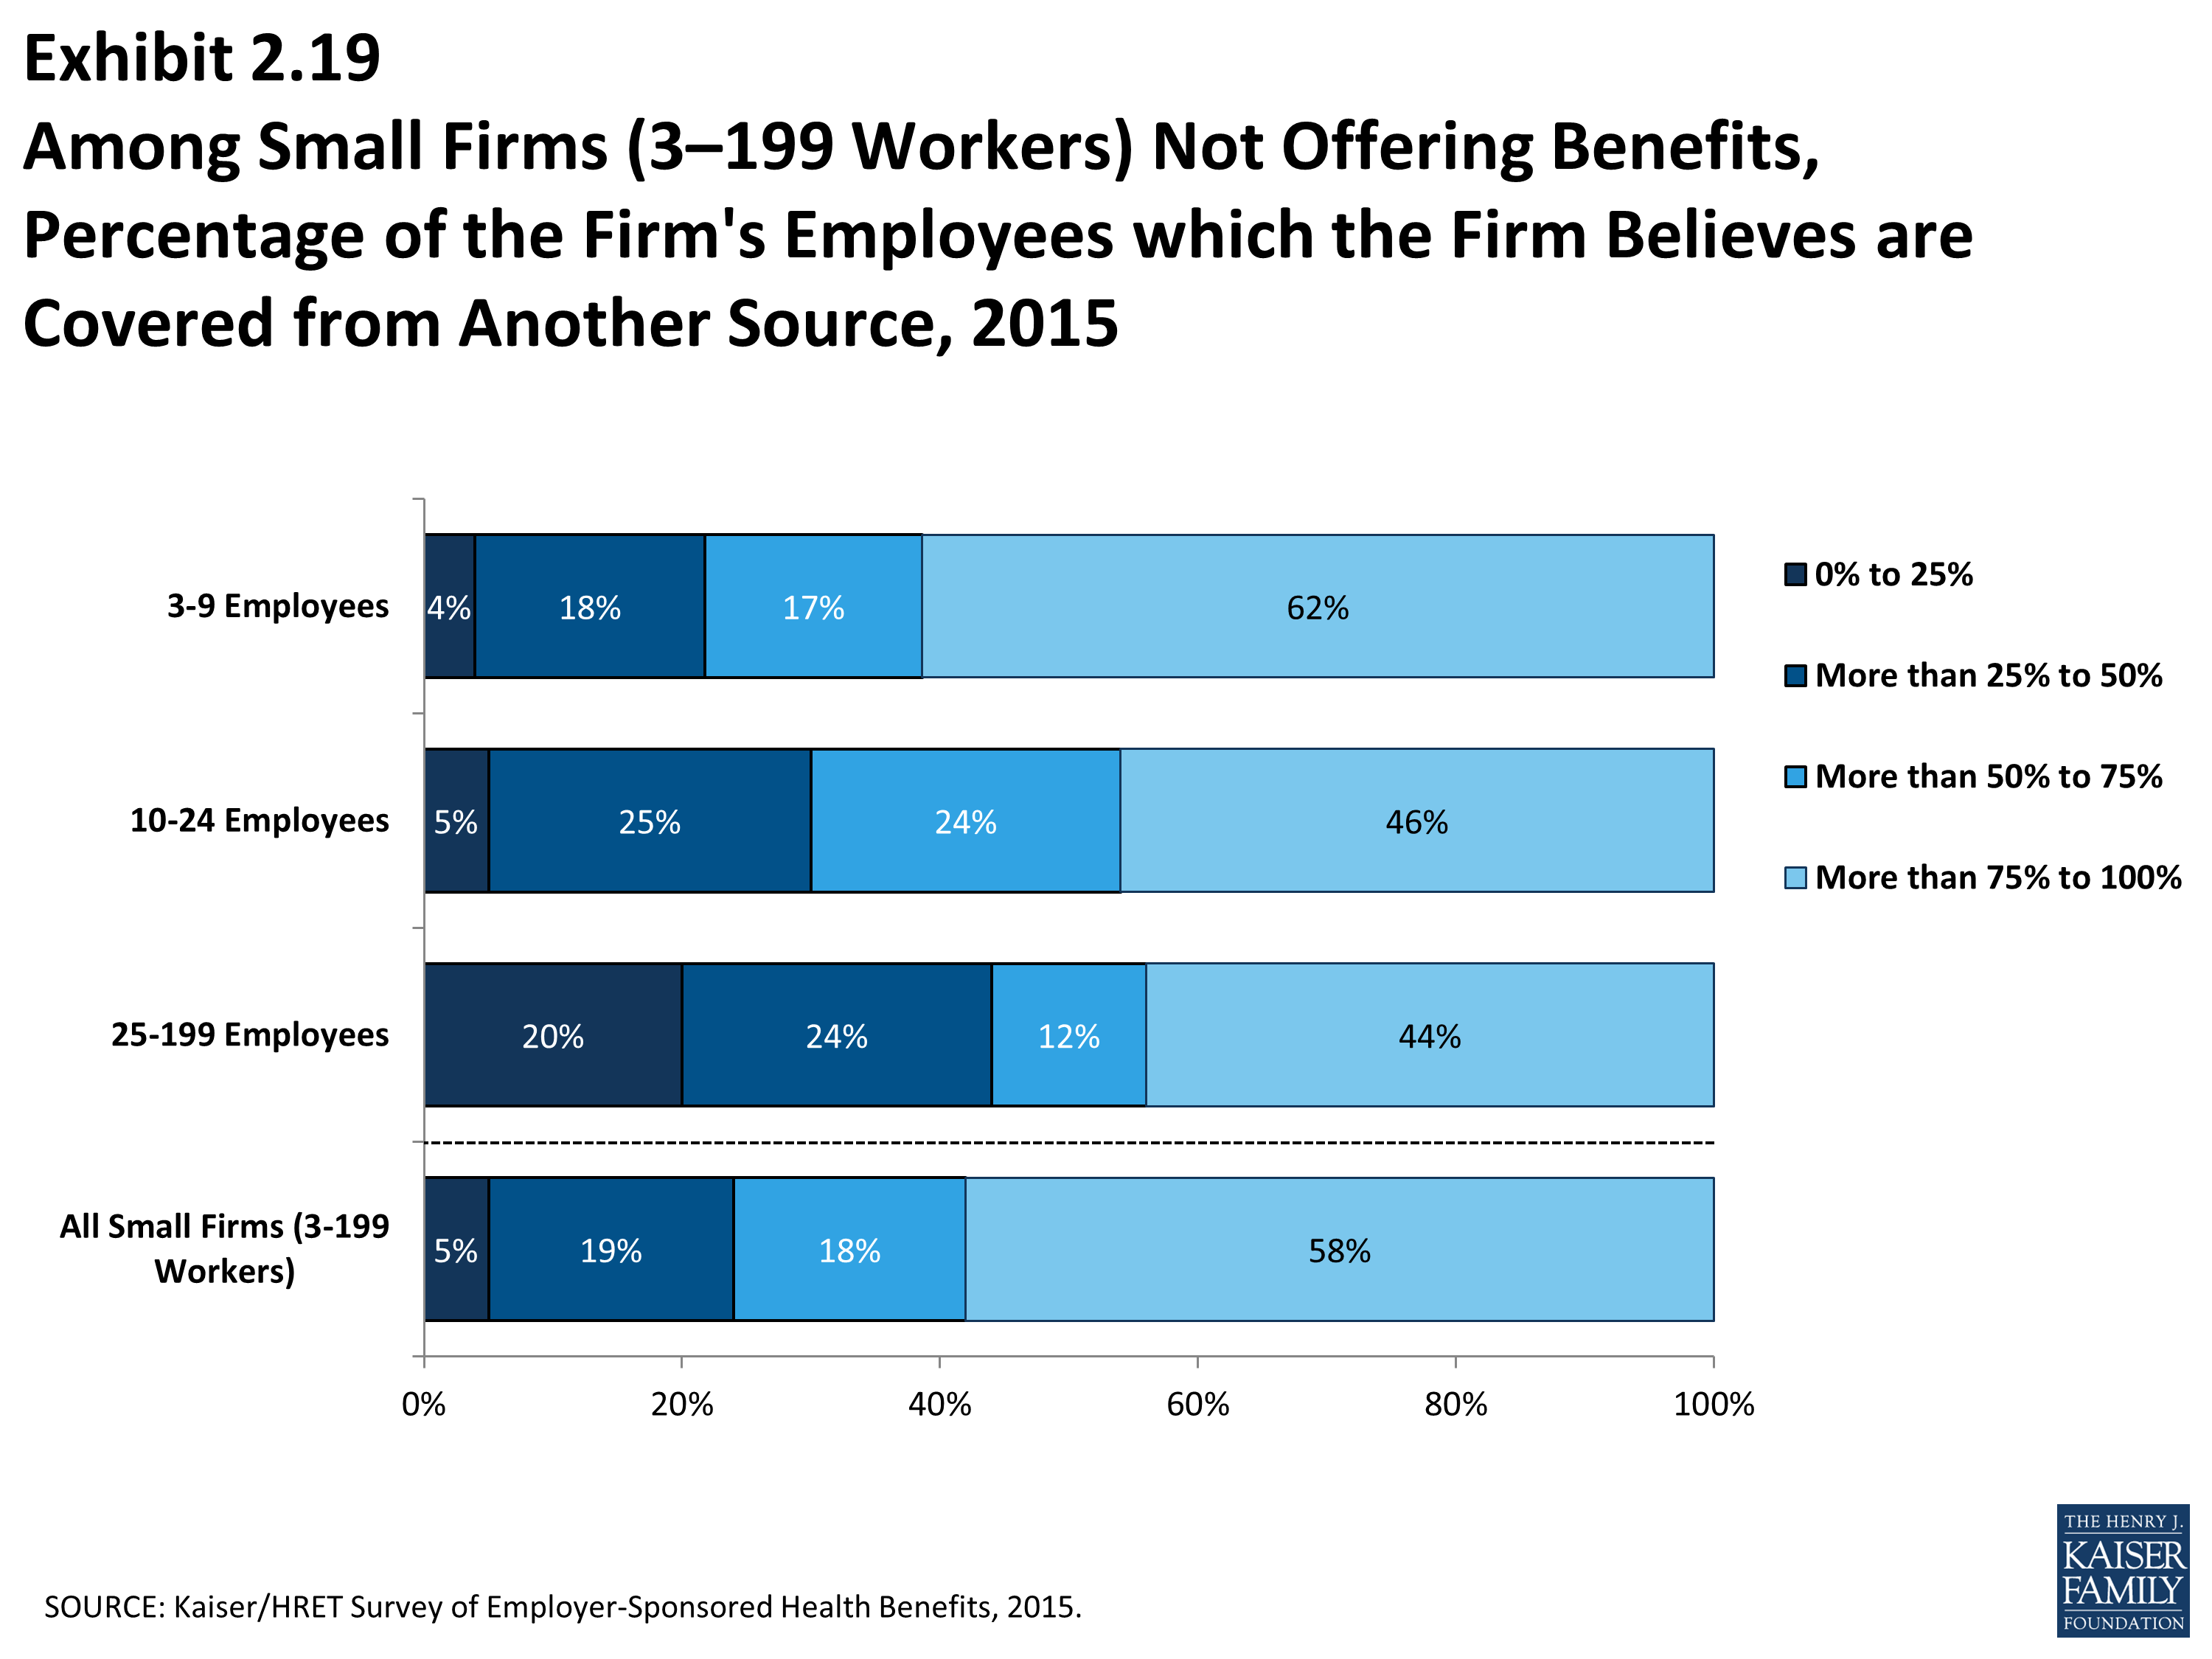
- Small firms (3 to 199 workers) not offering health benefits were asked to estimate the percentage of their employees who had coverage from another source. Employees could have a variety of other coverage options including a spouse’s plan, a public plan such as Medicaid, coverage through the health insurance exchanges or another employer’s plan. Fifty-eight percent of small employers estimated that three quarters or more of their employees were covered by another source of coverage (Exhibit 2.19).
SHOP Exchanges
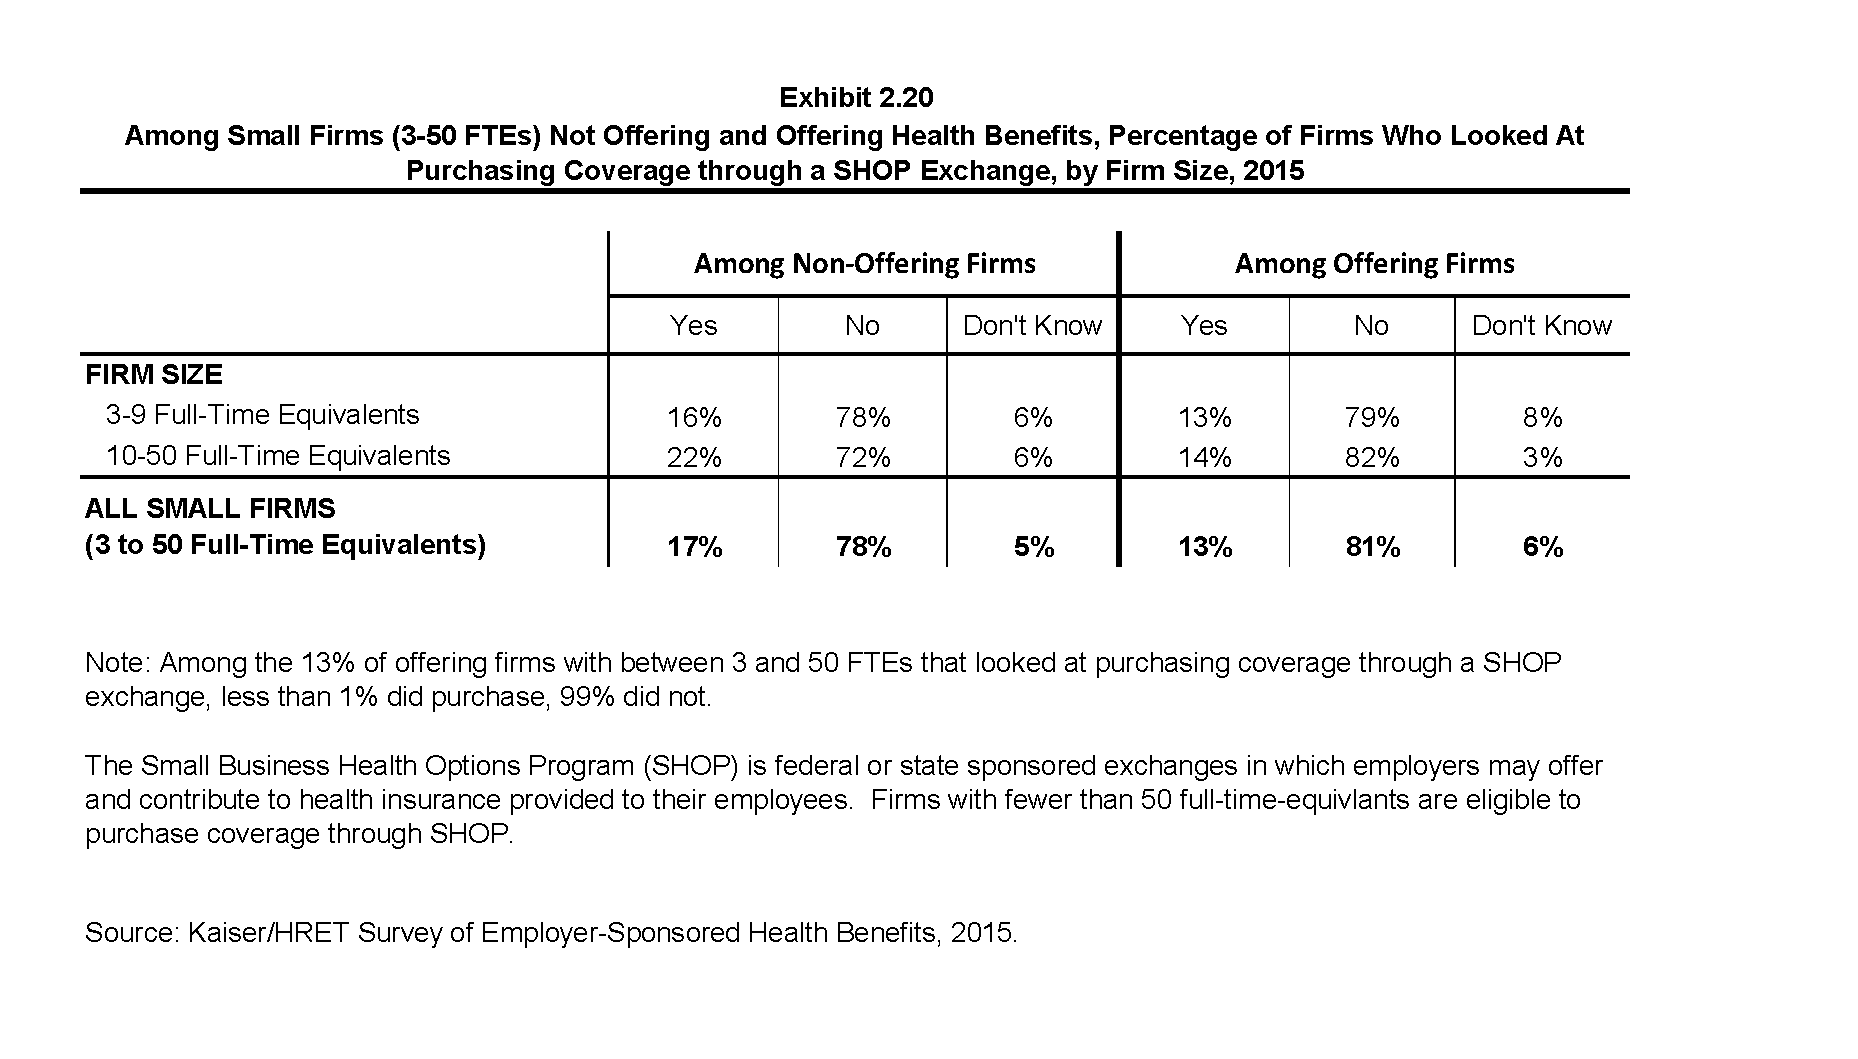
The Small Business Health Options Program (SHOP) is federal or state sponsored exchanges in which employers may offer and contribute to health insurance provided to their employees. In 2015, firms with 50 or fewer full-time equivalents are eligible to participate in a SHOP exchange. Some employers are eligible for tax credits when purchasing coverage on the exchanges.
- Seventeen percent of firms with 3 to 5o full-time equivalents who do not offer health benefits said they considered purchasing coverage on a SHOP exchange (Exhibit 2.20).
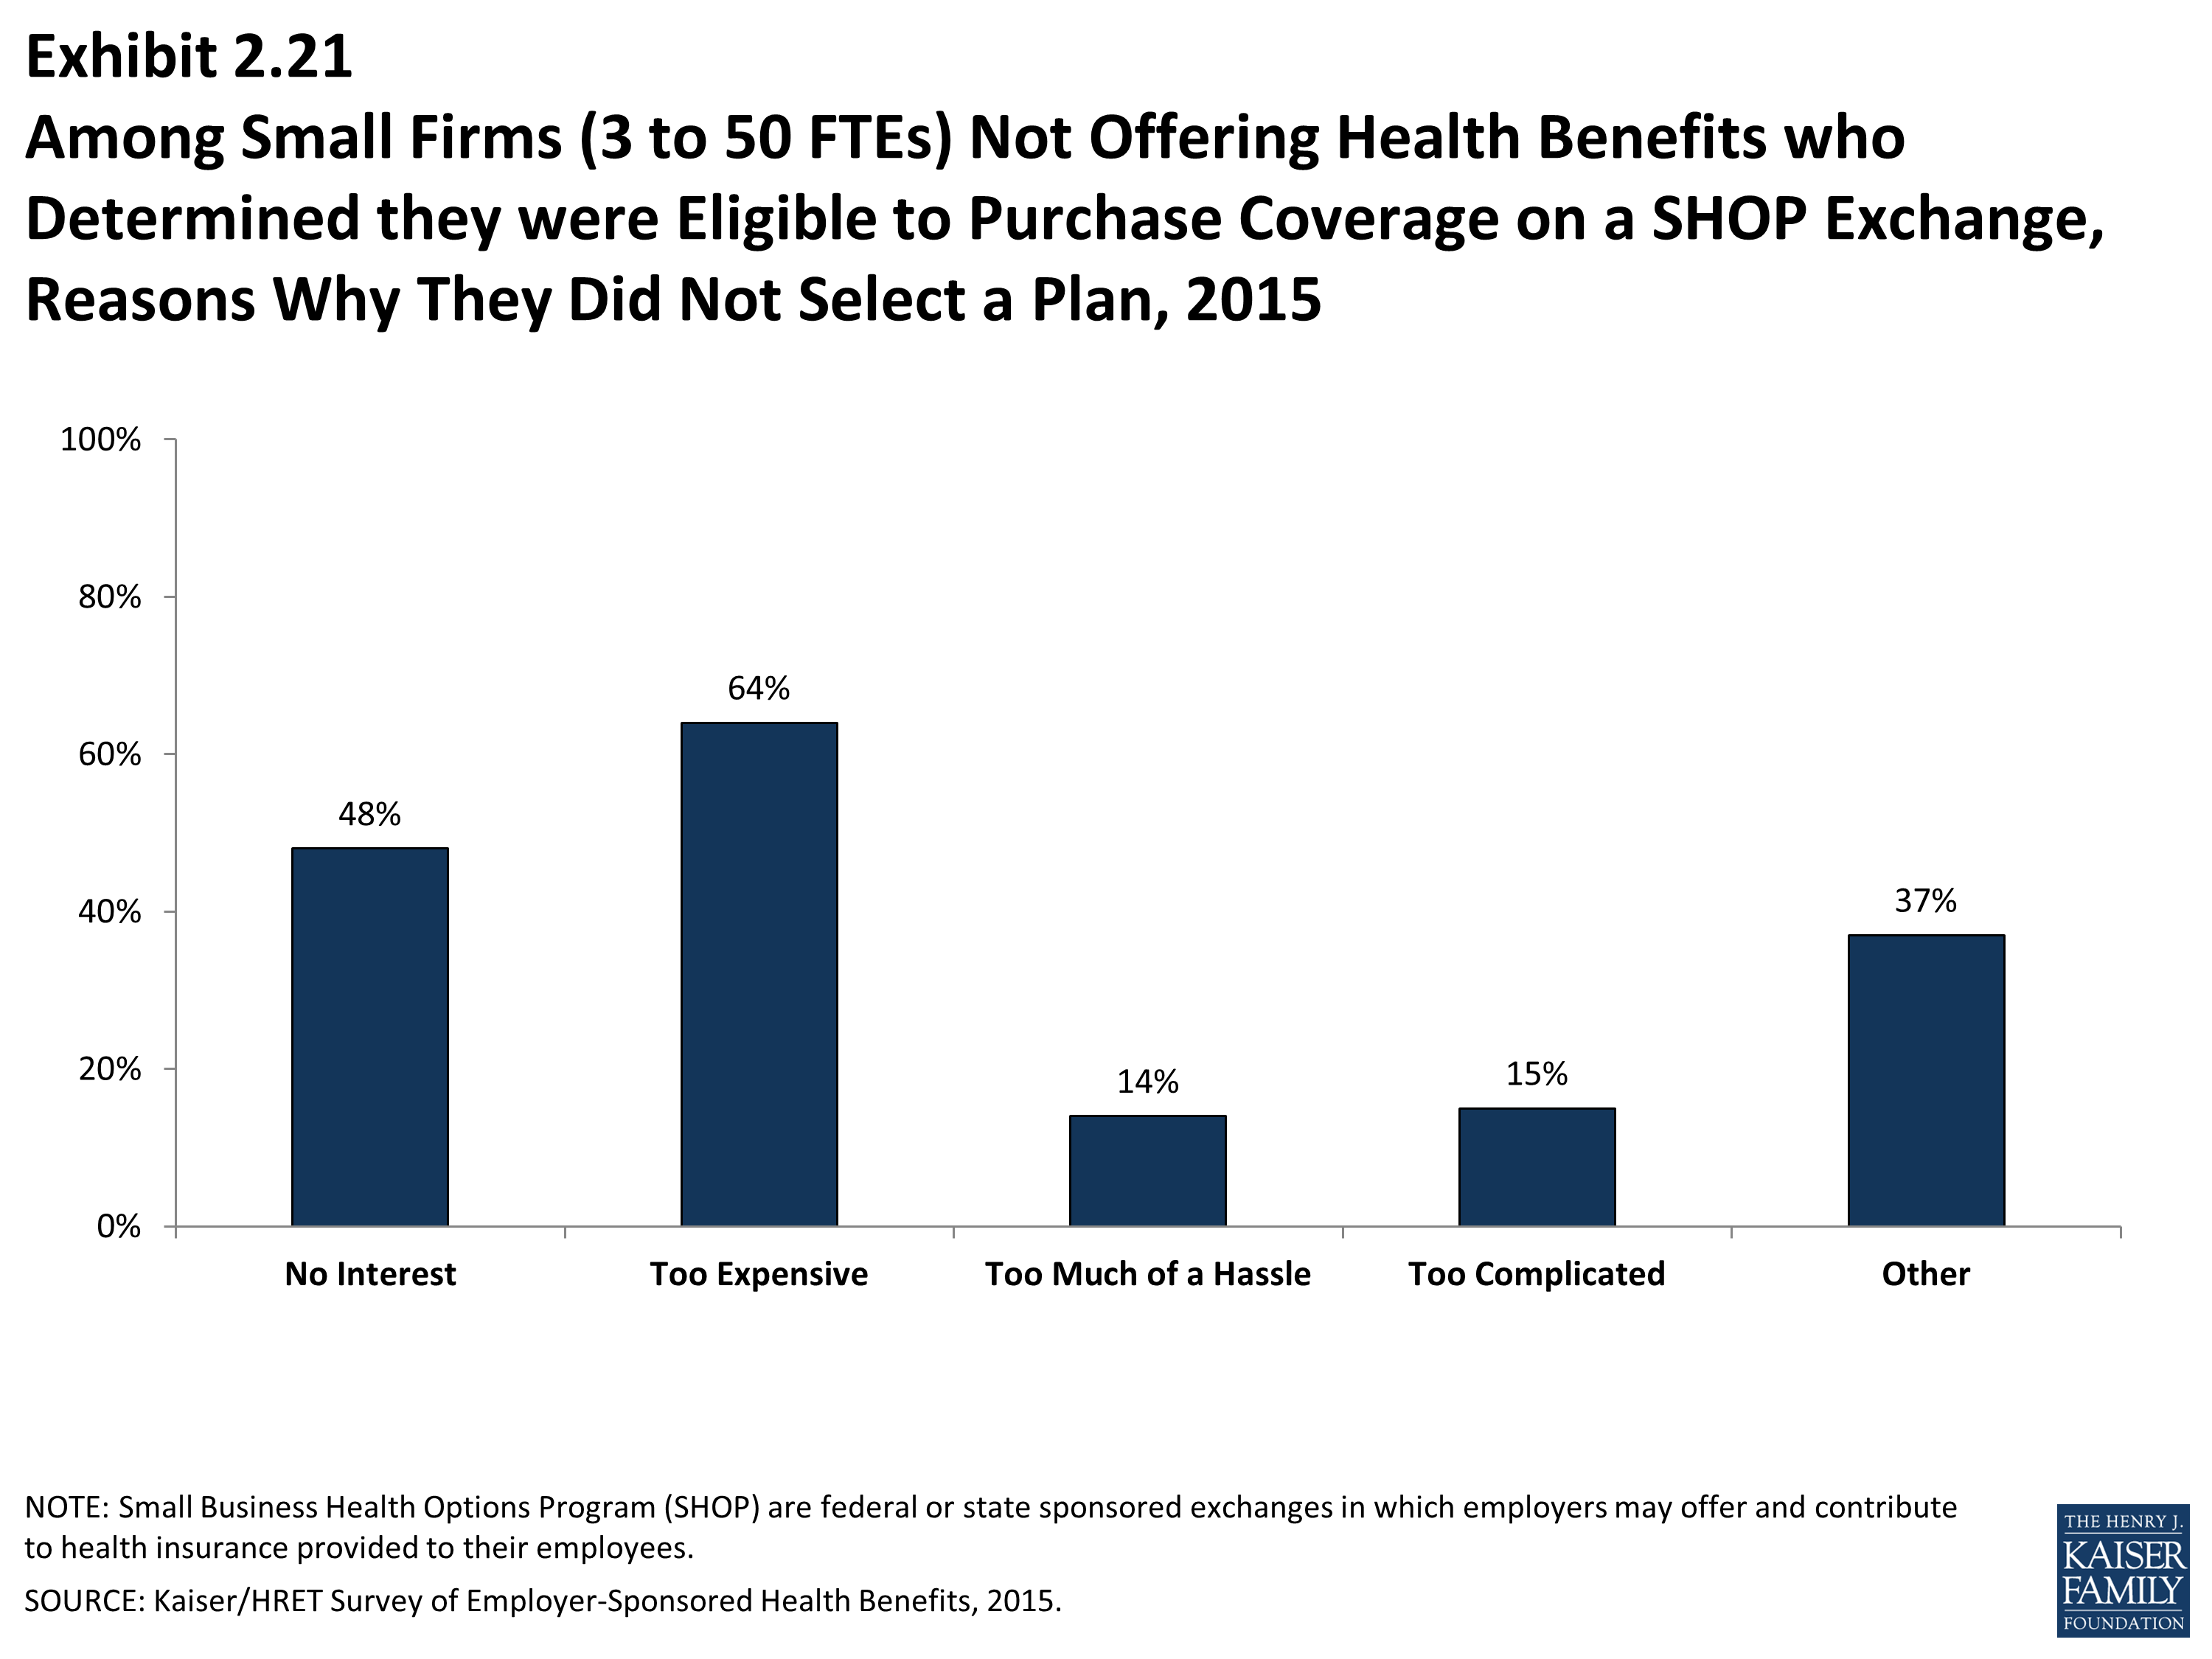
- Among non-offering firms with 5o or fewer full-time equivalents that chose not to purchase coverage on a SHOP exchange, 64% reported they did not do so because the plans were too expensive (Exhibit 2.21).
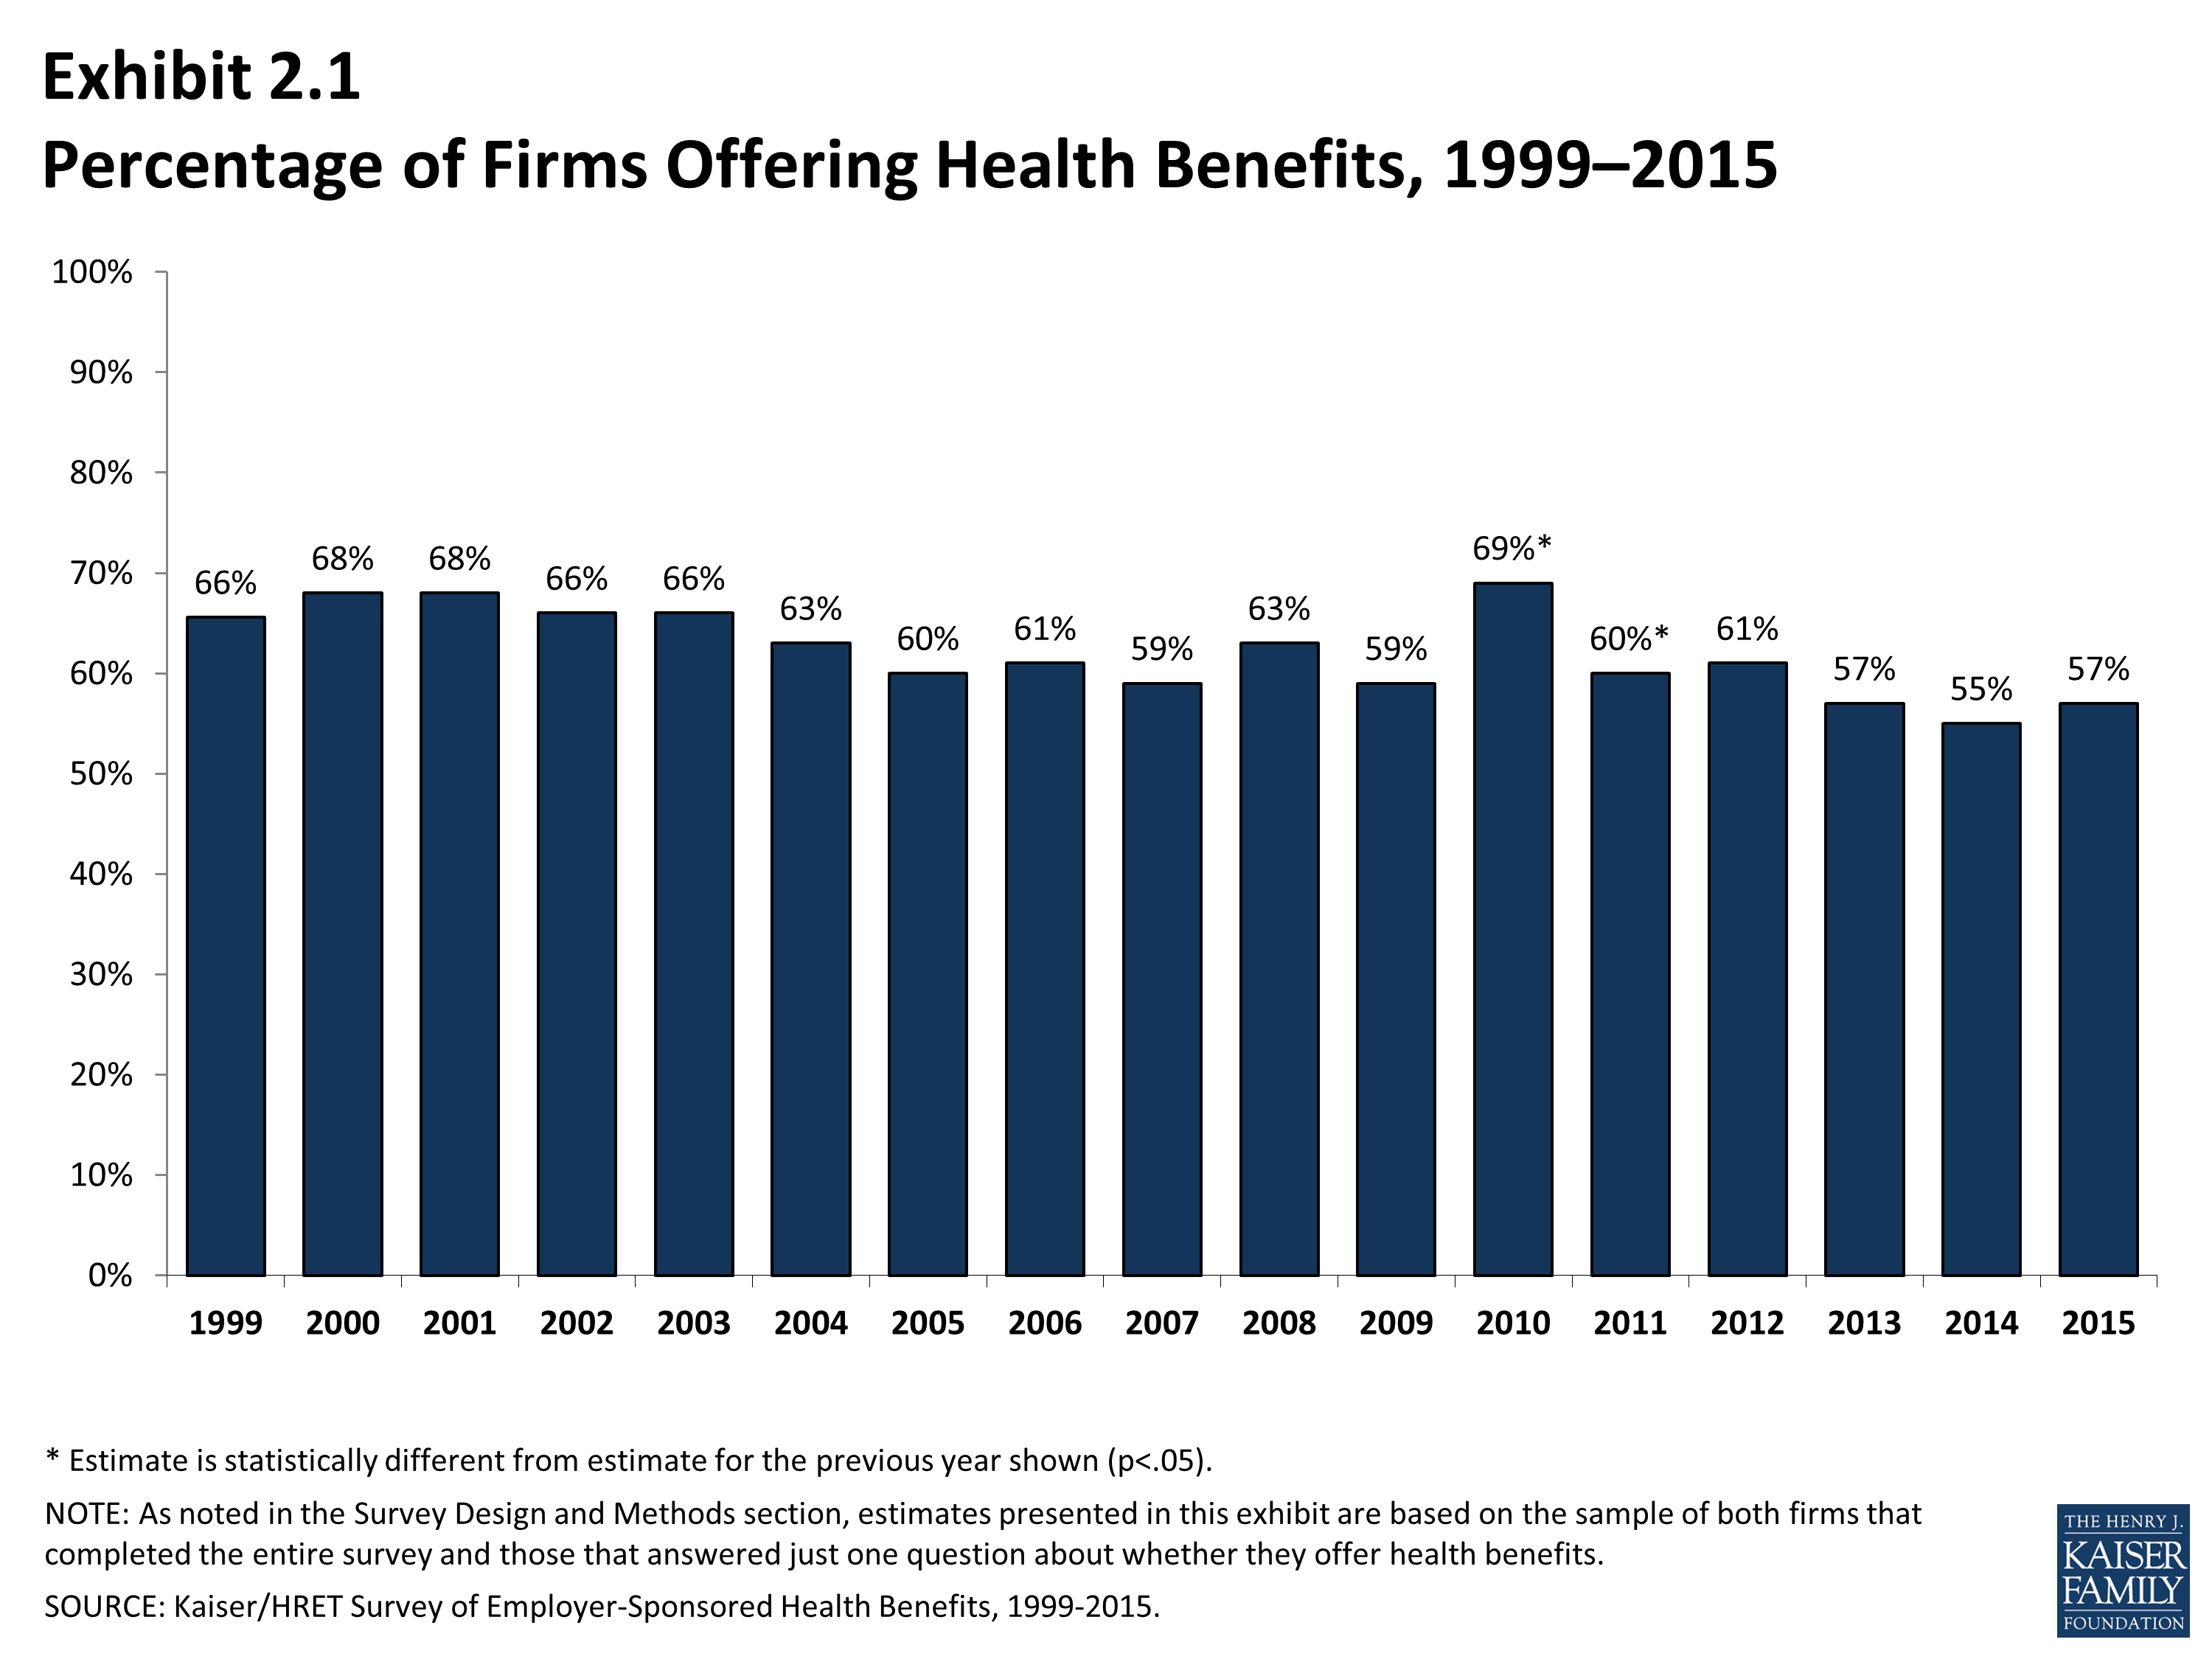
Percentage of Firms Offering Health Benefits, 1999–2015

Percentage of Firms Offering Health Benefits, by Firm Size, 1999-2015
Percentage of Firms Offering Health Benefits, by Firm Size, Region, and Industry, 2015
Percentage of Firms Offering Health Benefits, by Firm Characteristics, 2015
Percentage of Firms Offering Health Benefits to At Least Some of their Workers, by Firm Size, 2015
Among Firms Offering Health Benefits, Percentage that Offer Health Benefits to Part-Time Workers, by Firm Size, 1999-2015
Among Firms Offering Health Benefits, Percentage of Firms That Offer Health Benefits to Part-Time Workers and Percentage which Stopped Offering Coverage to Part-Time Workers in the Last Year, by Firm Size, 2015
Among Firms Offering Health Benefits, Percentage that Offer Health Benefits to Temporary Workers, by Firm Size, 1999-2015
Among Firms Offering Health Benefits, Percentage That Offer Health Benefits to Part-Time Workers, by Firm Size, 1999–2015
Among Firms Offering Health Benefits, Percentage That Offer Health Benefits to Temporary Workers, by Firm Size, 1999–2015
Among Firms Offering Benefits, Percentage of Firms Which Offer Coverage to Spouses, Dependents and Partners, 2015
Among Firms Offering Benefits, Percentage of Firms Which Offer Coverage to Same-Sex and Opposite-Sex Domestic Partners, By Firms Size, Region and Industry, 2015
Among Firms Offering Health Benefits, Percent of Employers That Offer Health Benefits to Unmarried Same-Sex and Opposite-Sex Domestic Partners, by Firm Size, 2008-2015
Among Small Firms (3-199 Workers) Not Offering Health Benefits, the Most Important Reason The Firm Does Not Offer, 2015
Among Small Firms (3-199 Workers) Not Offering Health Benefits, Percentage That Report the Following Activities, 2007-2015
Among Small Firms (3-199 Workers) Not Offering Health Benefits, Percentage That Provide Employees Funds to Purchase Non-Group Insurance, by Firm Size, 2012-2015
Among Small Firms (3-199 Workers) Not Offering Benefits, Amount The Firm Believes That It Could Afford to Pay Monthly for Health Insurance Coverage for an Employee with Single Coverage, 2005–2015
Among Small Firms (3–199 Workers) Not Offering Benefits, Distribution of Firms by the Amount They Believe They Think Their Employees Could Afford to Pay for Single Health Insurance Coverage, 2005–2015
Among Small Firms (3–199 Workers) Not Offering Benefits, Percentage of the Firm's Employees which the Firm Believes are Covered from Another Source, 2015
Among Small Firms (3-50 FTEs) Not Offering and Offering Health Benefits, Percentage of Firms Who Looked At Purchasing Coverage through a SHOP Exchange, by Firm Size, 2015
Among Small Firms (3 to 50 FTEs) Not Offering Health Benefits who Determined they were Eligible to Purchase Coverage on a SHOP Exchange, Reasons Why They Did Not Select a Plan, 2015
Section Three: Employee Coverage, Eligibility, and Participation
Employers are the principal source of health insurance in the United States, providing health benefits for about 147 million non-elderly people in America.1 Most workers are offered health coverage at work, and the majority of workers who are offered coverage take it. Workers may not be covered by their own employer for several reasons: their employer may not offer coverage, they may be ineligible for the benefits offered by their firm, they may elect to receive coverage through their spouse’s employer, or they may refuse coverage from their firm. Before eligible employees may enroll, almost three-quarters (74%) of covered workers face a waiting period, although the average length of waiting periods for covered workers with waiting periods has decreased in each of the last two years.
- Among firms offering health benefits, 63% percent of workers are covered by health benefits through their own employer (Exhibit 3.2).
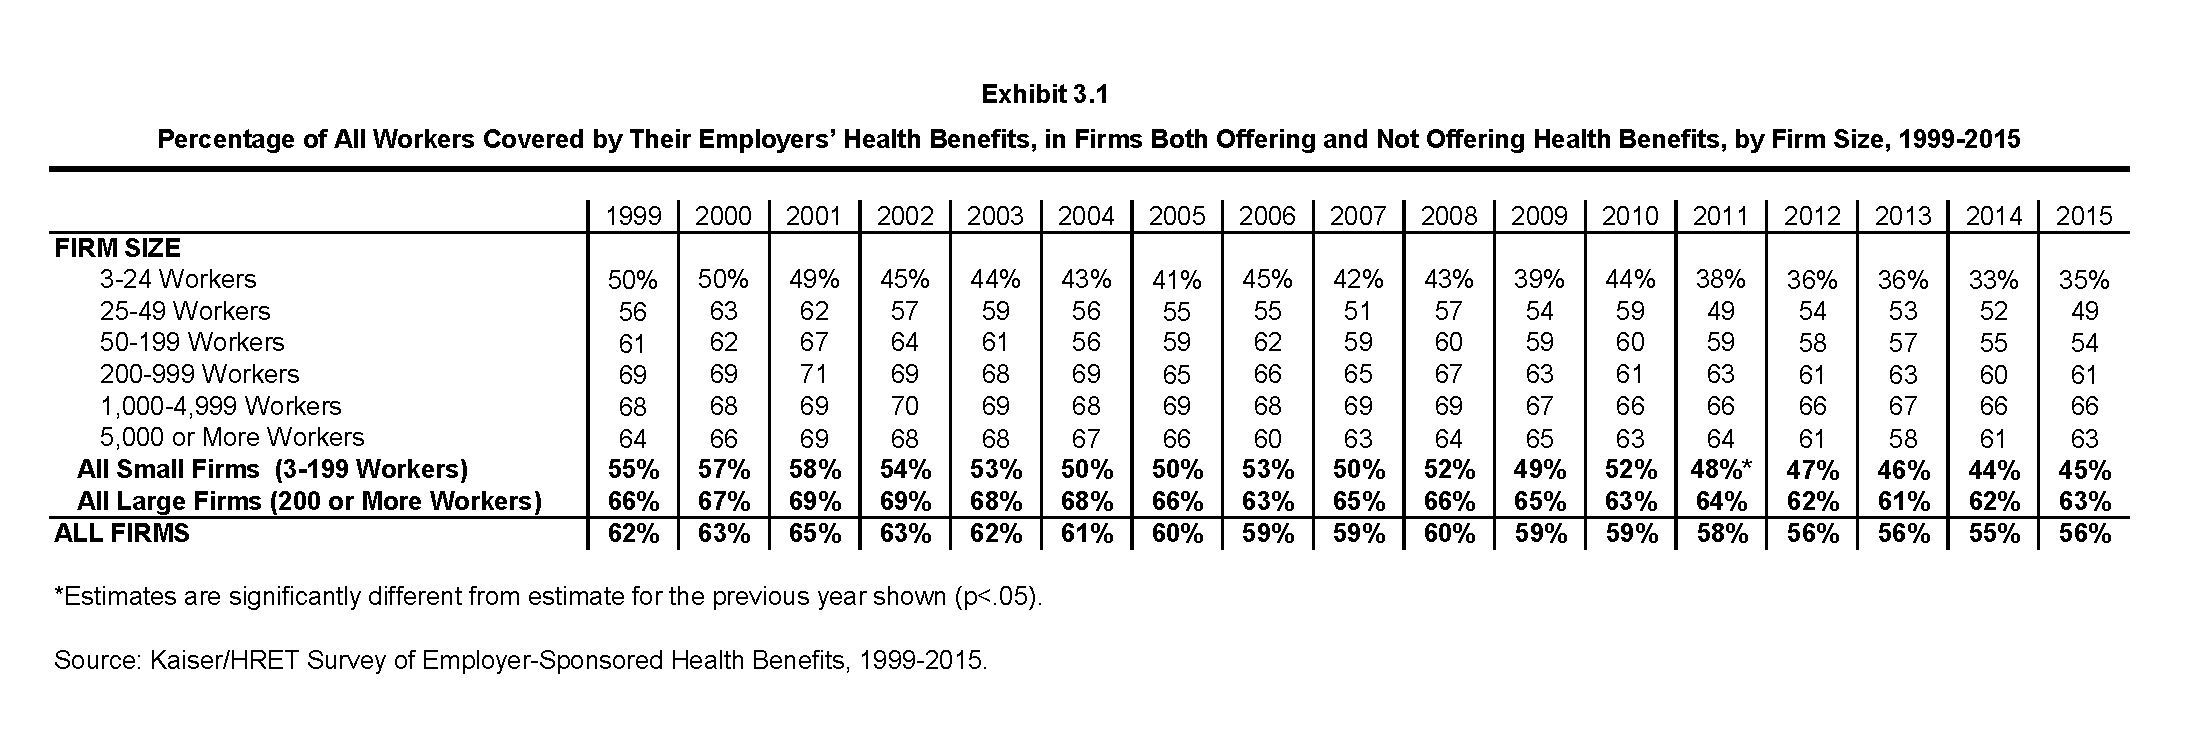
- When considering both firms that offer health benefits and those that do not, 56% of workers are covered under their employer’s plan (Exhibit 3.1).
- The coverage rates at both offering and non-offering firms has decreased over time for workers at small firms (3 to 199 workers) from 50% in 2005 to 45% in 2015. The coverage rate for large firms is statically unchanged from 66% in 2005 to 63% in 2015 (Exhibit 3.1).
Eligibility
- Not all employees are eligible for the health benefits offered by their firm, and not all eligible employees “take up” (i.e., elect to participate in) the offer of coverage. The share of workers covered in a firm is a product of both the percentage of workers who are eligible for the firm’s health insurance and the percentage that choose to take up the benefit. The percentage of workers eligible for health benefits at offering firms in 2015 is similar to last year for both small firms (3 to 199 workers) and large firms (Exhibit 3.6).
- Seventy-nine percent of workers in firms offering health benefits are eligible for the coverage offered by their employer (Exhibit 3.2).
- Eligibility varies considerably by wage level. Employees in firms with a lower proportion of low-wage workers (less than 35% of workers earn $23,000 or less annually) are more likely to be eligible for health benefits than employees in firms with a higher proportion of low-wage workers (81% vs. 65%). We observe a similar pattern among firms with many high-wage workers (35% or more of workers earn $58,000 or more annually) (89% vs. 72%) (Exhibit 3.3).
- Eligibility also varies by the age of the workforce. Those in firms with fewer younger workers (less than 35% of workers are age 26 or younger) are more likely to be eligible for health benefits than those in firms with many younger workers (82% vs. 54%) (Exhibit 3.3).
Take-up Rate
- Employees who are offered health benefits generally elect to take up the coverage. In 2015, 79% of eligible workers take up coverage when it is offered to them, similar to 80% last year (Exhibit 3.6).2
- The likelihood of a worker accepting a firm’s offer of coverage also varies with the workforce’s wage level. Eligible employees in firms with a lower proportion of low-wage workers are more likely to take up coverage (80%) than eligible employees in firms with a higher proportion of low-wage workers (35% or more of workers earn $23,000 or less annually) (71%). Similar patterns exist in firms with a larger proportion of higher-wage workers, with workers in these firms being more likely to take up coverage than those in firms with a smaller share of high-wage workers (82% vs. 76%) (Exhibit 3.4).
- Ninety percent of workers at public employers who offer health benefits take up coverage. (Exhibit 3.4).
Coverage
- The percentage of workers at firms offering health benefits that are covered by their firms’ health plan in 2015 is 63%. The coverage rate at firms offering health benefits is similar to last year for both small firms (3 to 199 workers) and large firms (Exhibit 3.6).
- There is significant variation by industry in the coverage rate among workers in firms offering health benefits. For example, only 34% of workers in retail firms offering health benefits are covered by the health benefits offered by their firm, compared to 77% of workers in finance, and 79% of workers in the transportation/communications/utilities industry category (Exhibit 3.2).
- Among workers in firms offering health benefits, those in firms with fewer low-wage workers (less than 35% of workers earn $23,000 or less annually) are more likely to be covered by their own firm than workers in firms with many low-wage workers (65% vs. 46%). A comparable pattern exists in firms with a larger proportion of high-wage workers (35% or more earn $58,000 or more annually) offering health benefits (73% vs. 55%) (Exhibit 3.5).
- Among workers in firms offering health benefits, those in firms with fewer younger workers (less than 35% of workers are age 26 or younger) are more likely to be covered by their own firm than those in firms with many younger workers (66% vs.39%) (Exhibit 3.5).
- Five percent of large firms (200 or more workers) and less than 1% of small firms indicated that they started offering a more comprehensive benefit plan in 2015 to some workers who were previously only eligible for a limited benefit plan (Exhibit 3.7).
Waiting Periods
- Waiting periods are a specified length of time after beginning employment before employees are eligible to enroll in health benefits. With some exceptions, the Affordable Care Act requires that waiting periods cannot exceed 90 days.3 For example, employers are permitted to have orientation periods before the waiting period begins which, in effect, means an employee is not eligible for coverage 3 months after hire. If an employee is eligible to enroll on the 1st of the month, after three months of employment, this survey “rounds-up” and considers the firm’s waiting period four months. For these reasons, some employers still have waiting periods exceeding the 90 day maximum.
- The percentage of covered workers who face a waiting period is similar to last year (Exhibit 3.10).
- Seventy-four percent of covered workers face a waiting period before coverage is available. Covered workers in small firms (3 to 199 workers) are more likely than those in large firms to have a waiting period (81% vs. 71%) (Exhibit 3.8).
- The average waiting period among covered workers who face a waiting period is 2 months (Exhibit 3.8). While 22% of covered workers face a waiting period of 3 months or more, workers in small firms (3 to 199 workers) generally have longer waiting periods than workers in large firms (Exhibit 3.9).
Auto Enrollment
The Affordable Care Act requires that employers with 200 or more workers automatically enroll eligible full-time workers in their health benefits after any waiting periods. The implementation of this provision has been delayed by the Department of Labor rules.4
- In 2015, 13% of large employers (200 or more workers) indicated that they automatically enrolled employees after any waiting periods are met (Exhibit 3.11).
- Small employers (3 to 199 workers) were more likely than large firms to automatically enroll eligible employees after any waiting periods (42% vs. 13%) (Exhibit 3.11).
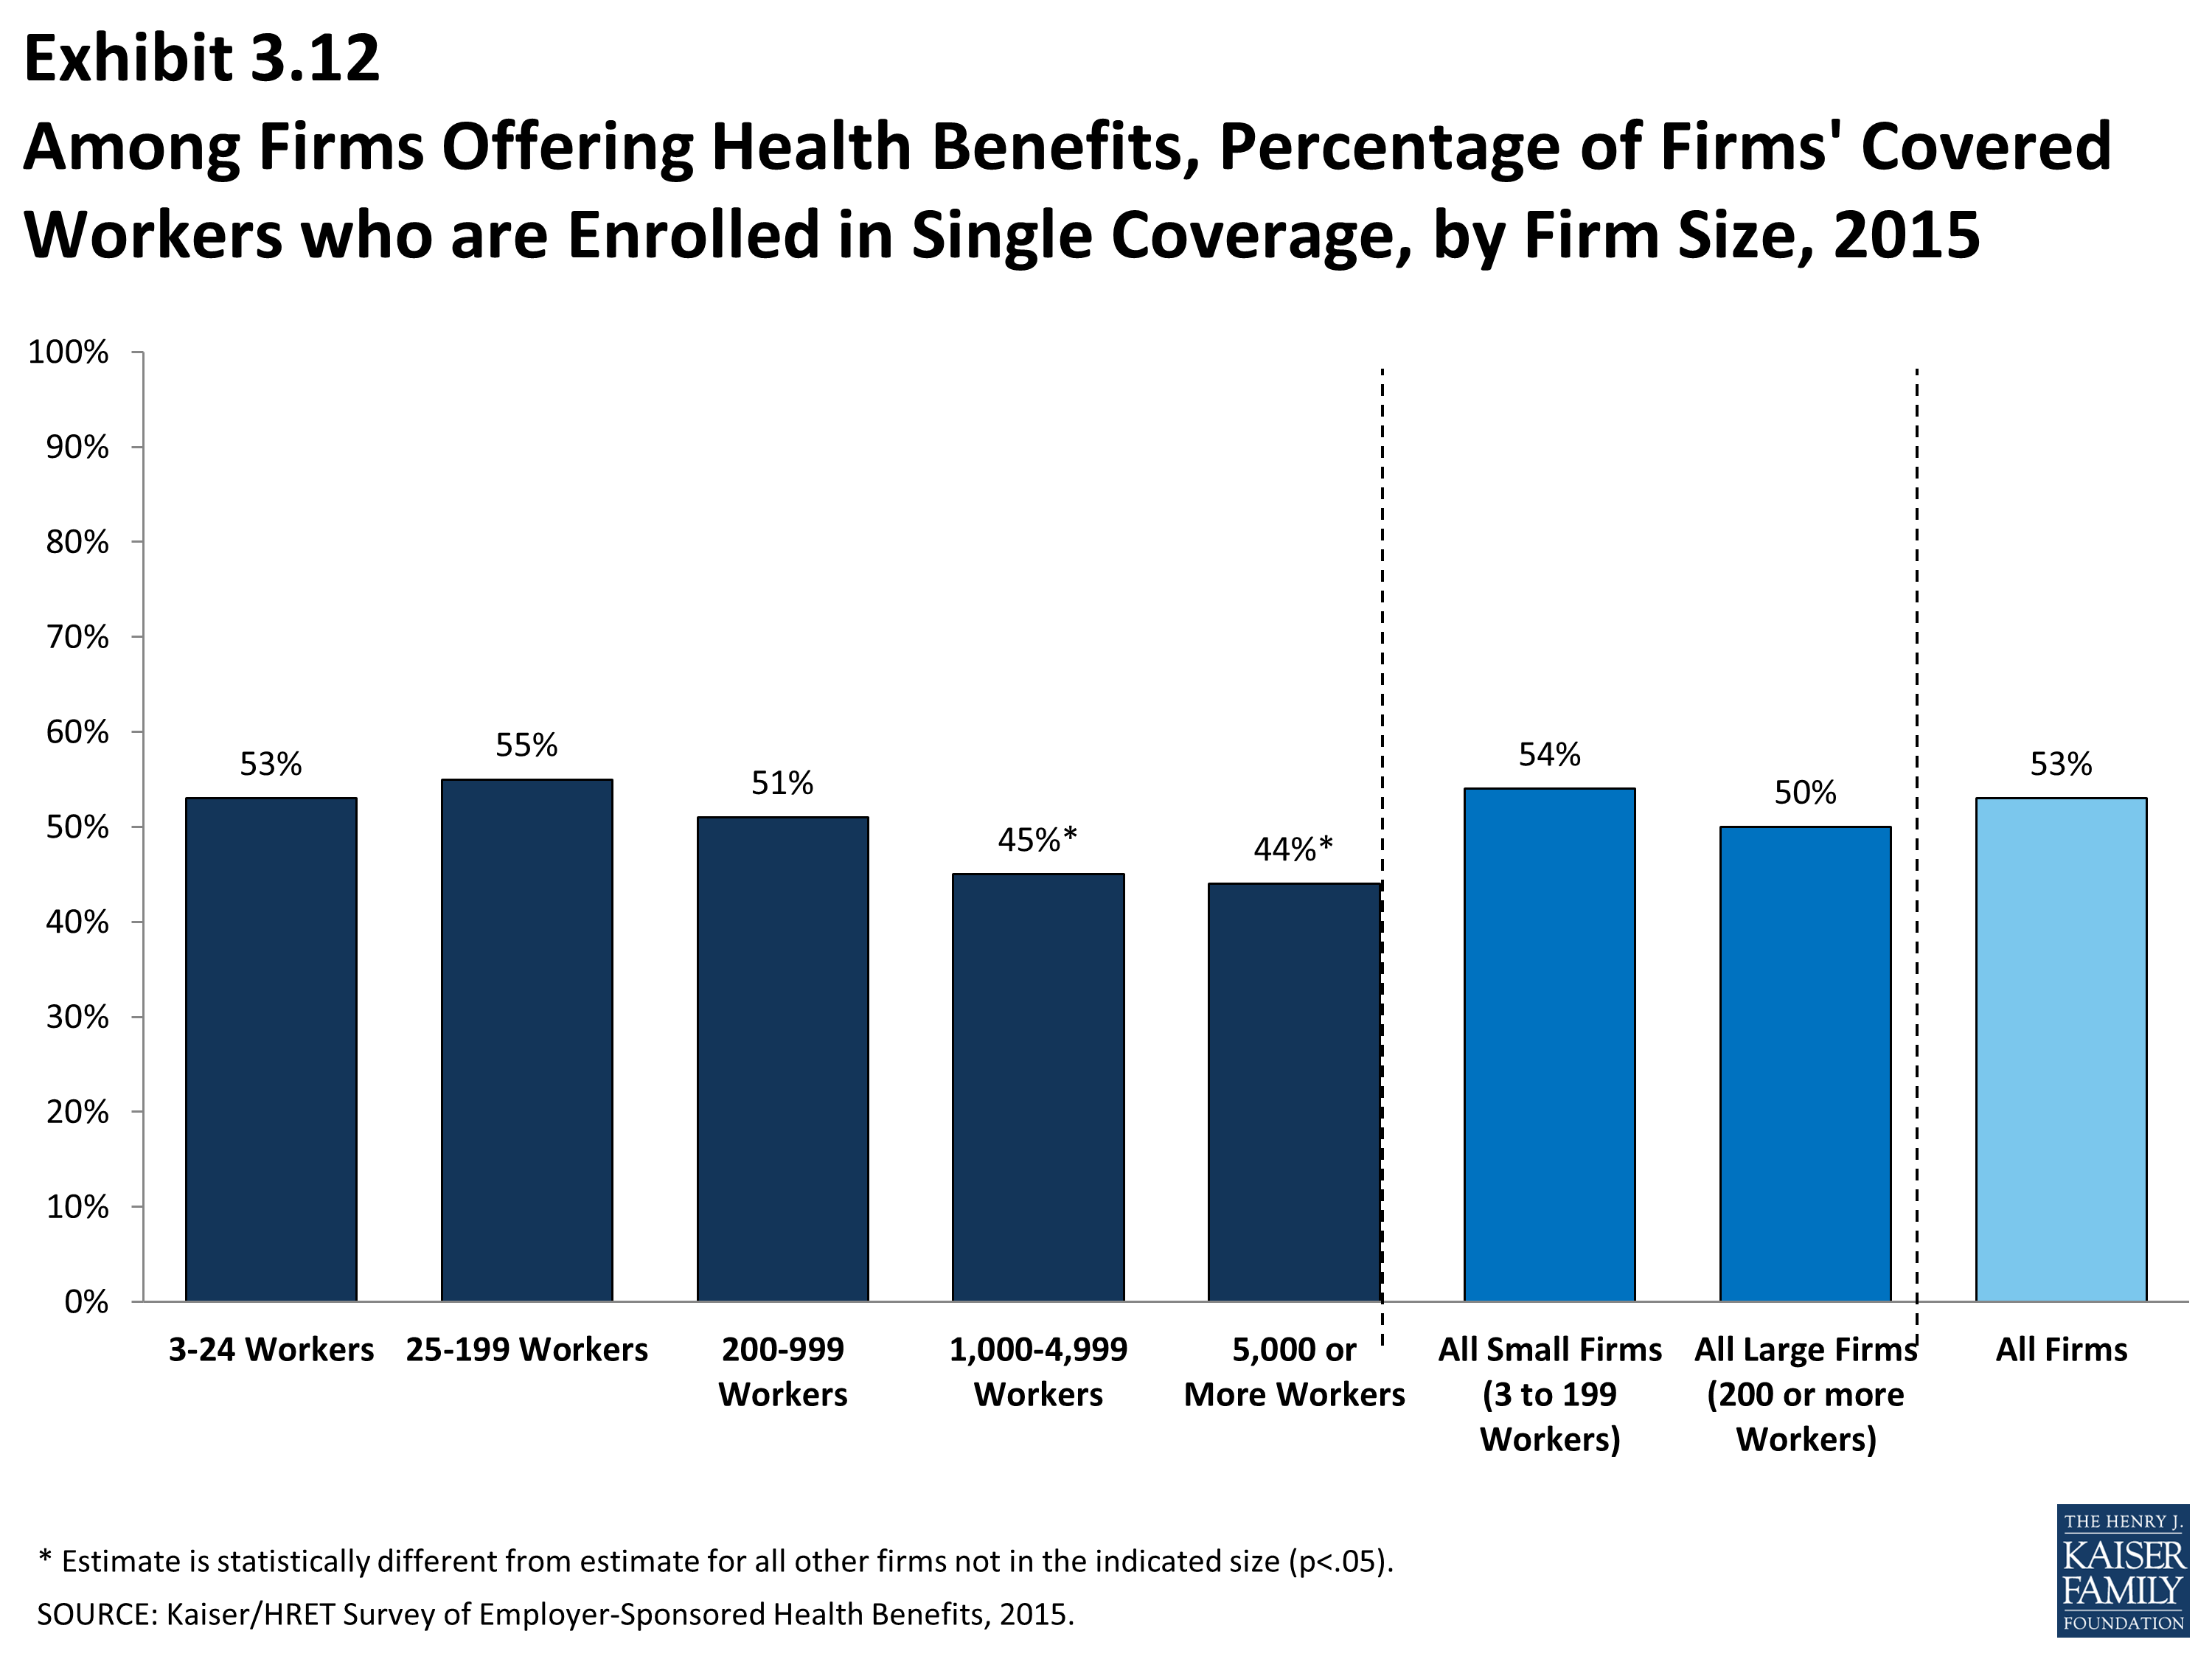
Single Coverage Enrollment
- Covered workers in small firms (3 to 99 workers) are more likely to be enrolled in single coverage than covered workers in large firms (54% vs. 44%) (Exhibit 3.12).
Percentage of All Workers Covered by Their Employers’ Health Benefits, in Firms Both Offering and Not Offering Health Benefits, by Firm Size, 1999-2015
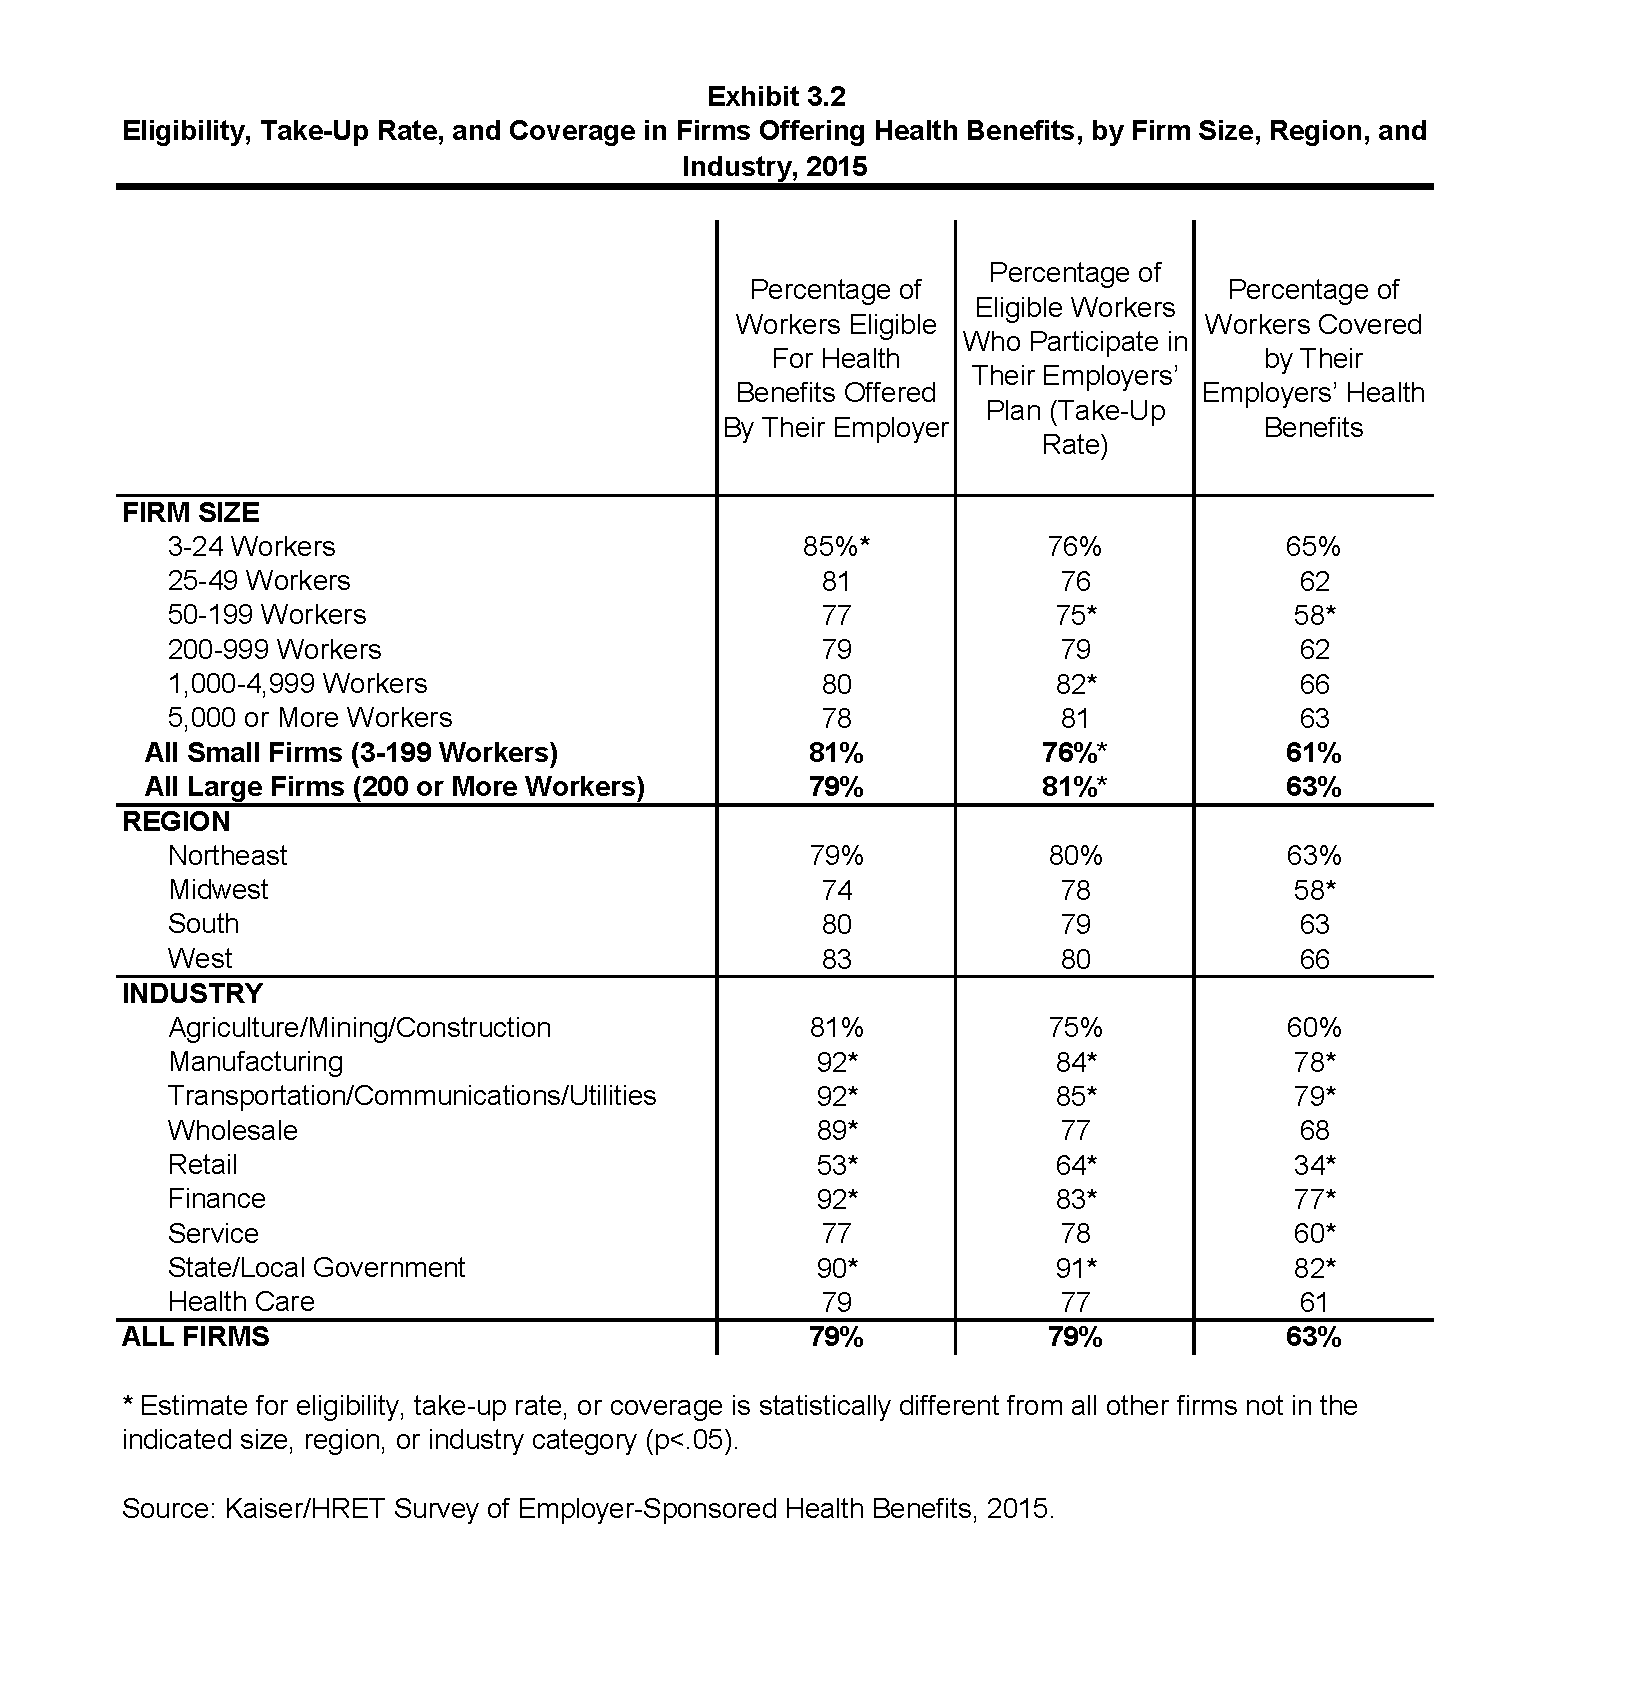
Eligibility, Take-Up Rate, and Coverage in Firms Offering Health Benefits, by Firm Size, Region, and Industry, 2015
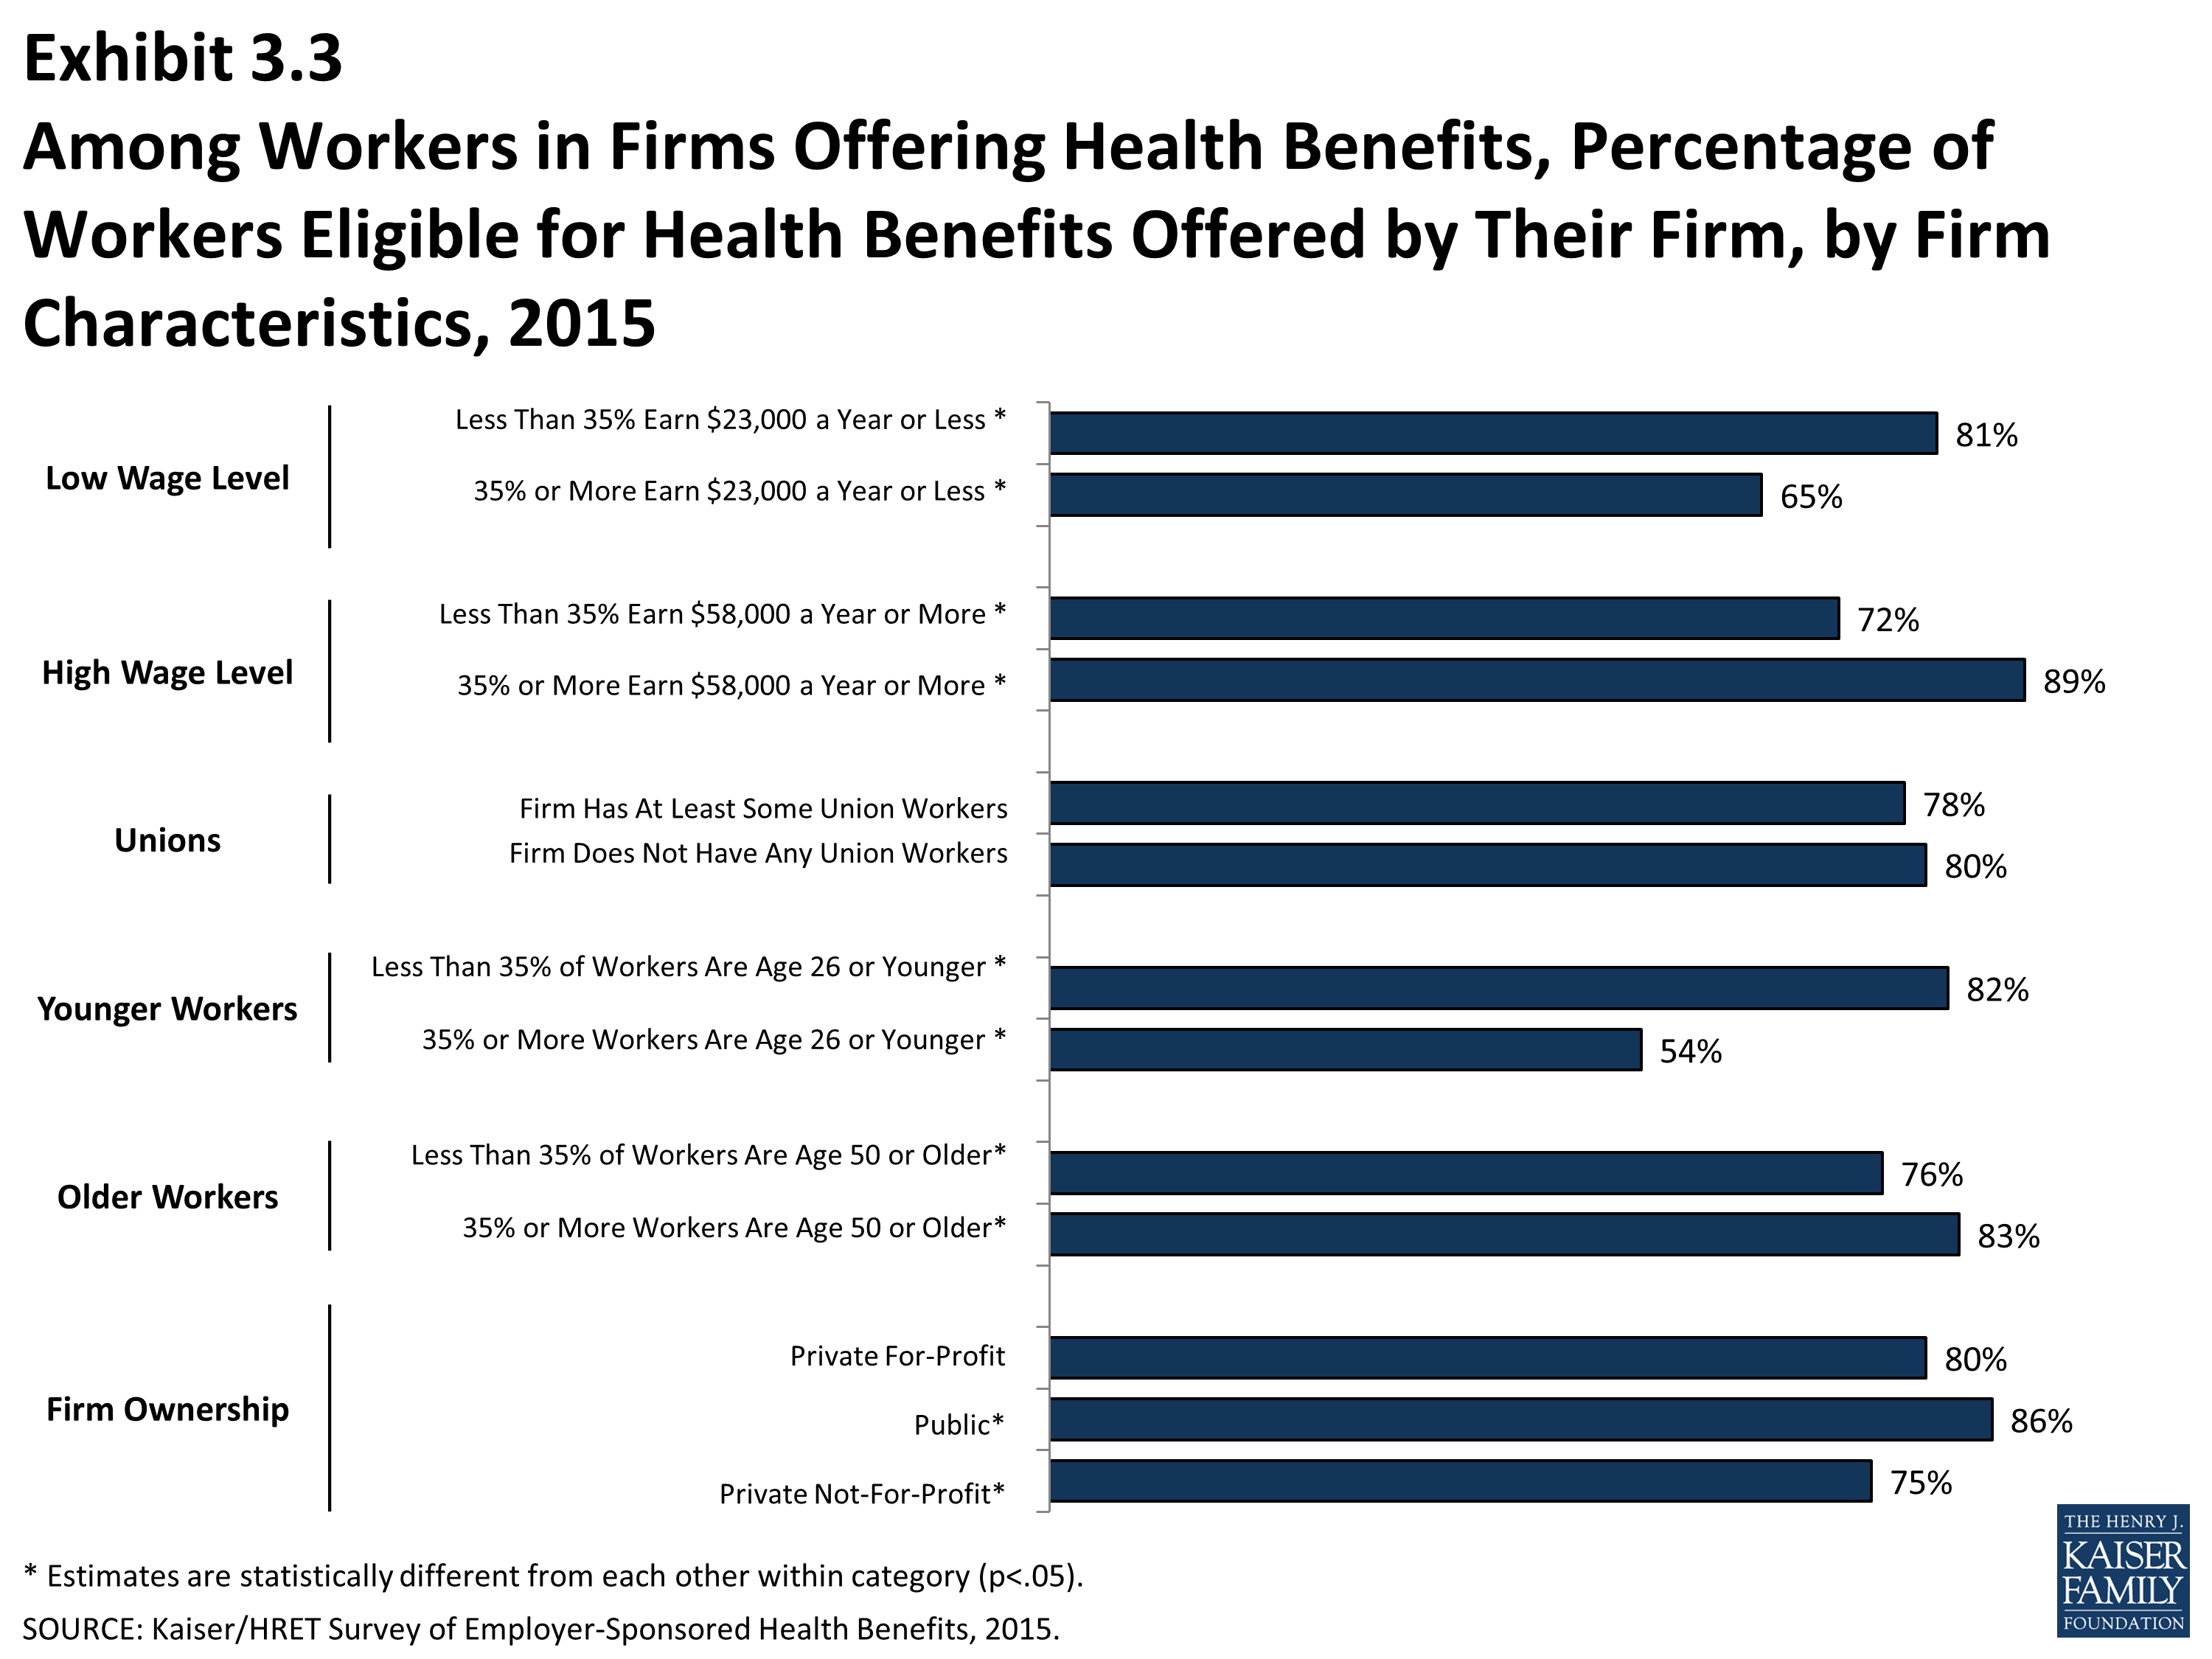
Among Workers in Firms Offering Health Benefits, Percentage of Workers Eligible for Health Benefits Offered by Their Firm, by Firm Characteristics, 2015
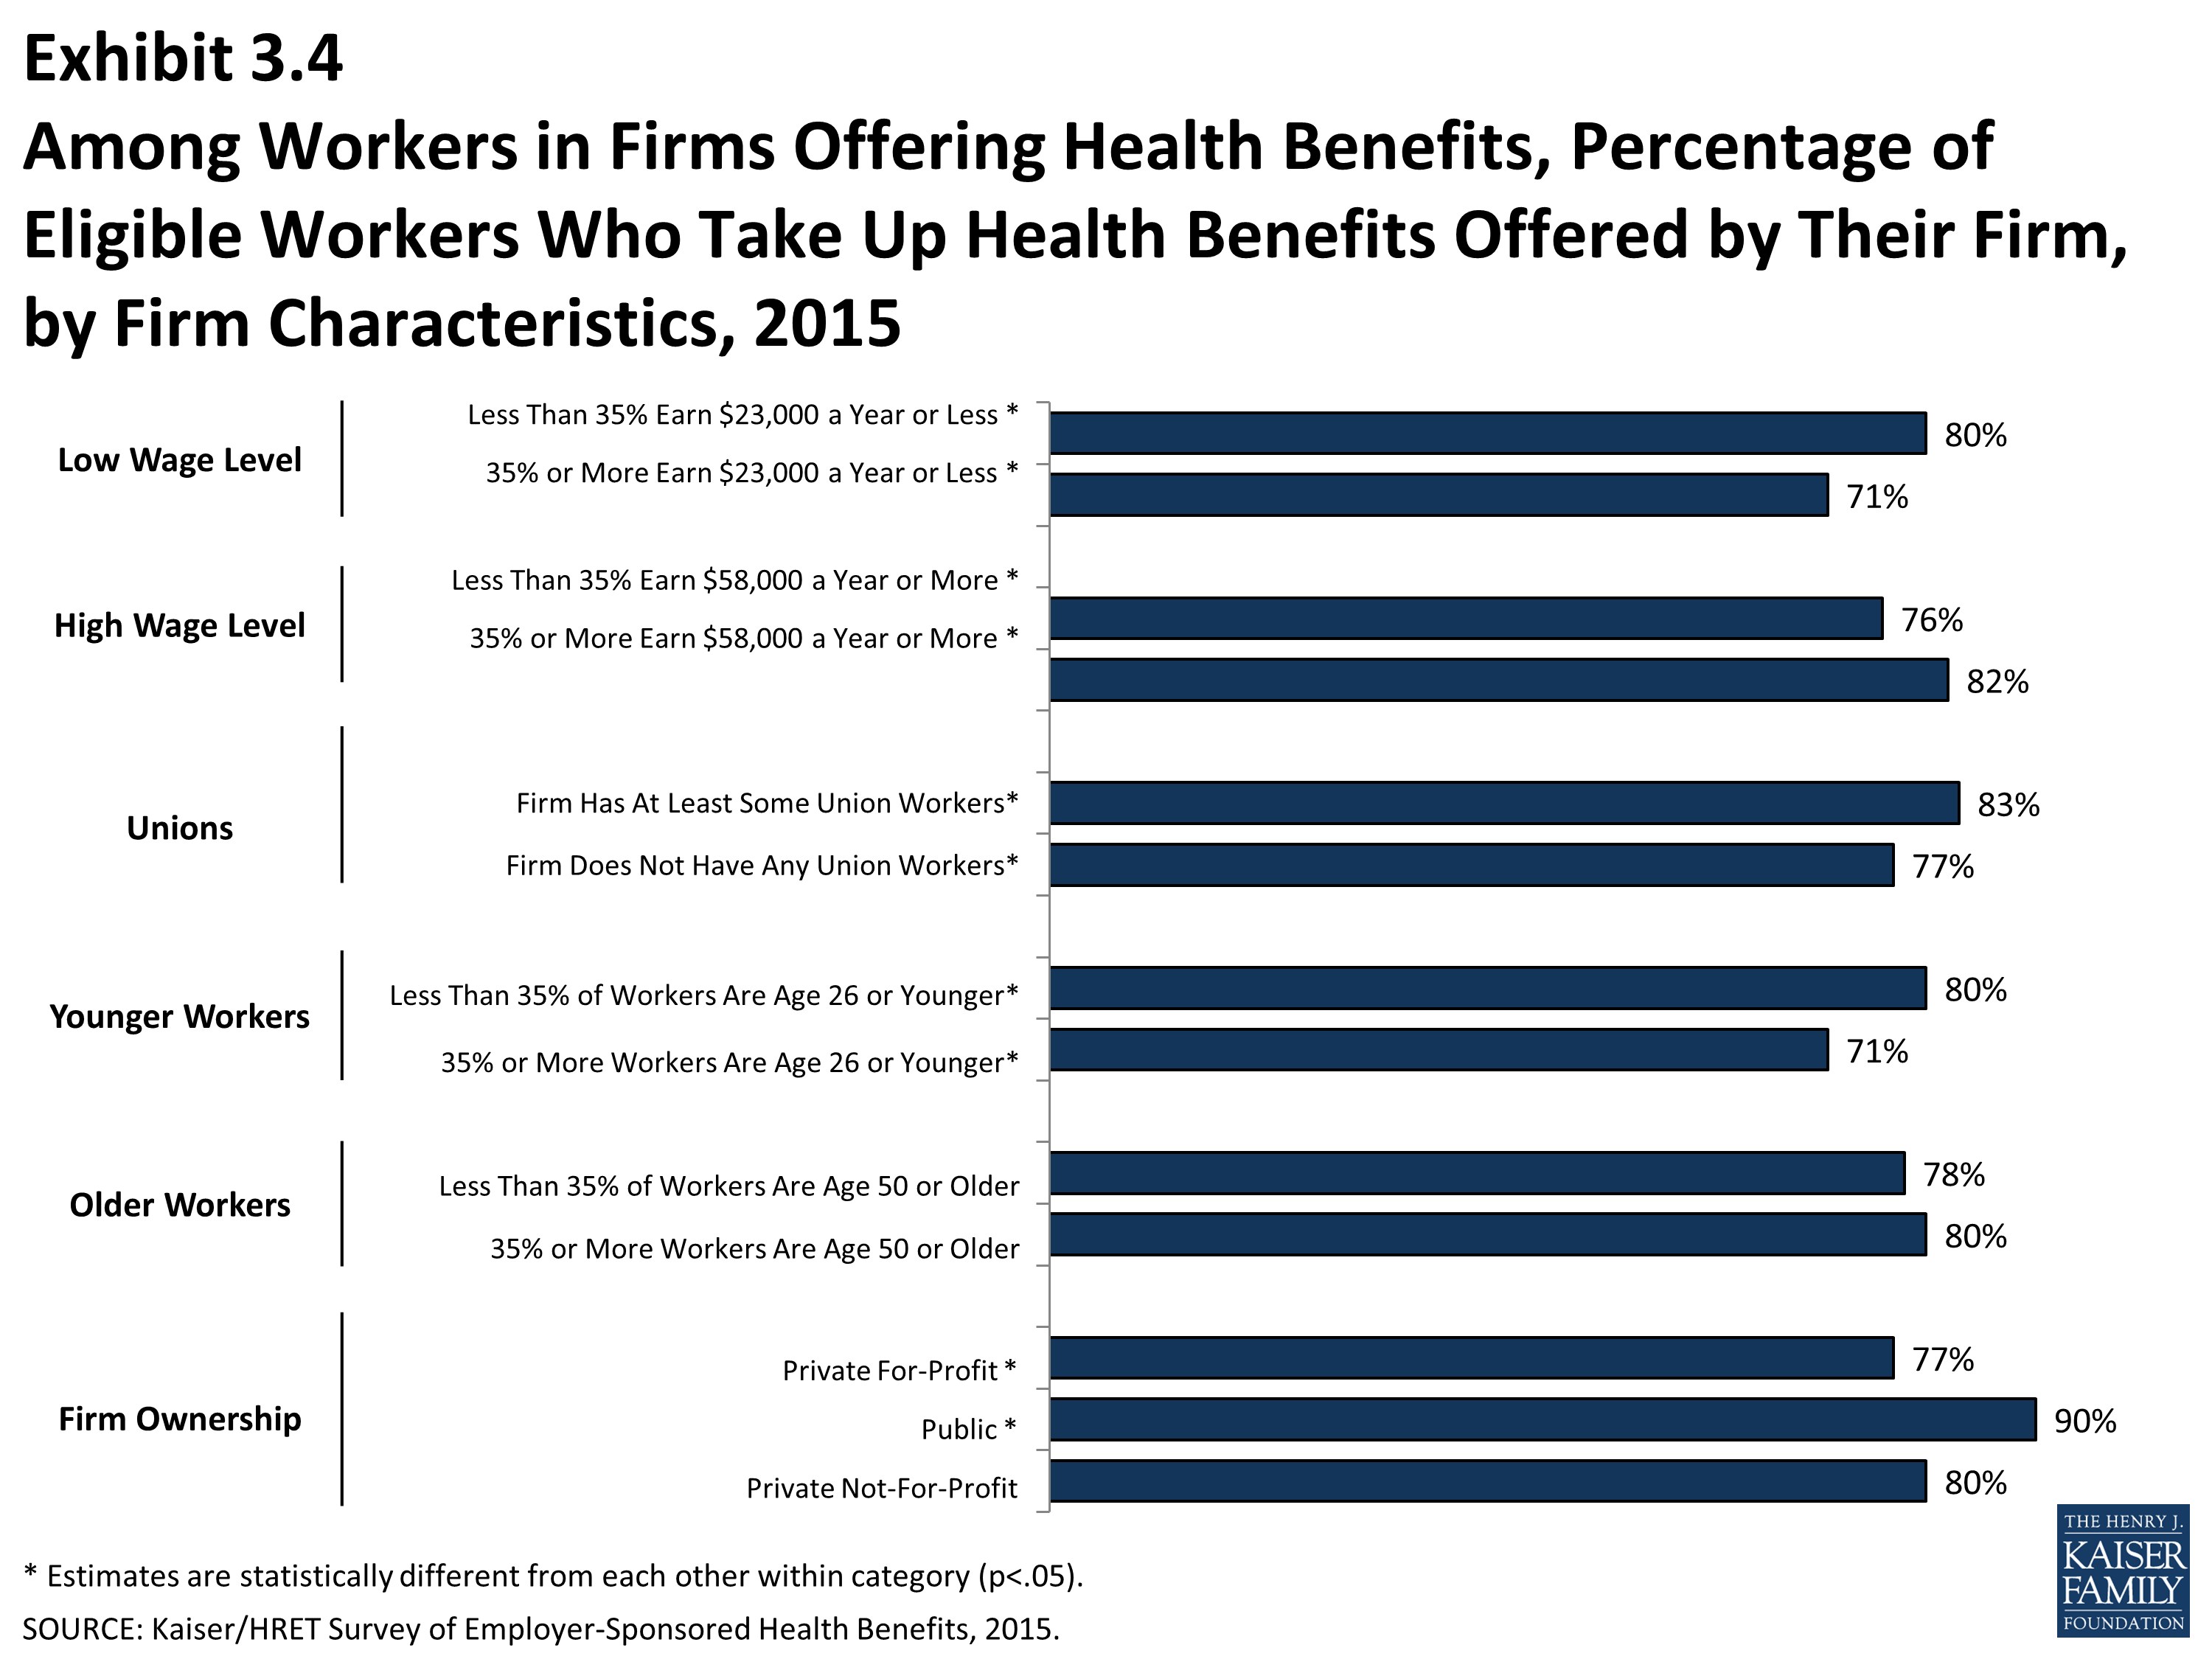
Among Workers in Firms Offering Health Benefits, Percentage of Eligible Workers Who Take Up Health Benefits Offered by Their Firm, by Firm Characteristics, 2015

Among Workers in Firms Offering Health Benefits, Percentage of Workers Covered by Health Benefits Offered by Their Firm, by Firm Characteristics, 2015
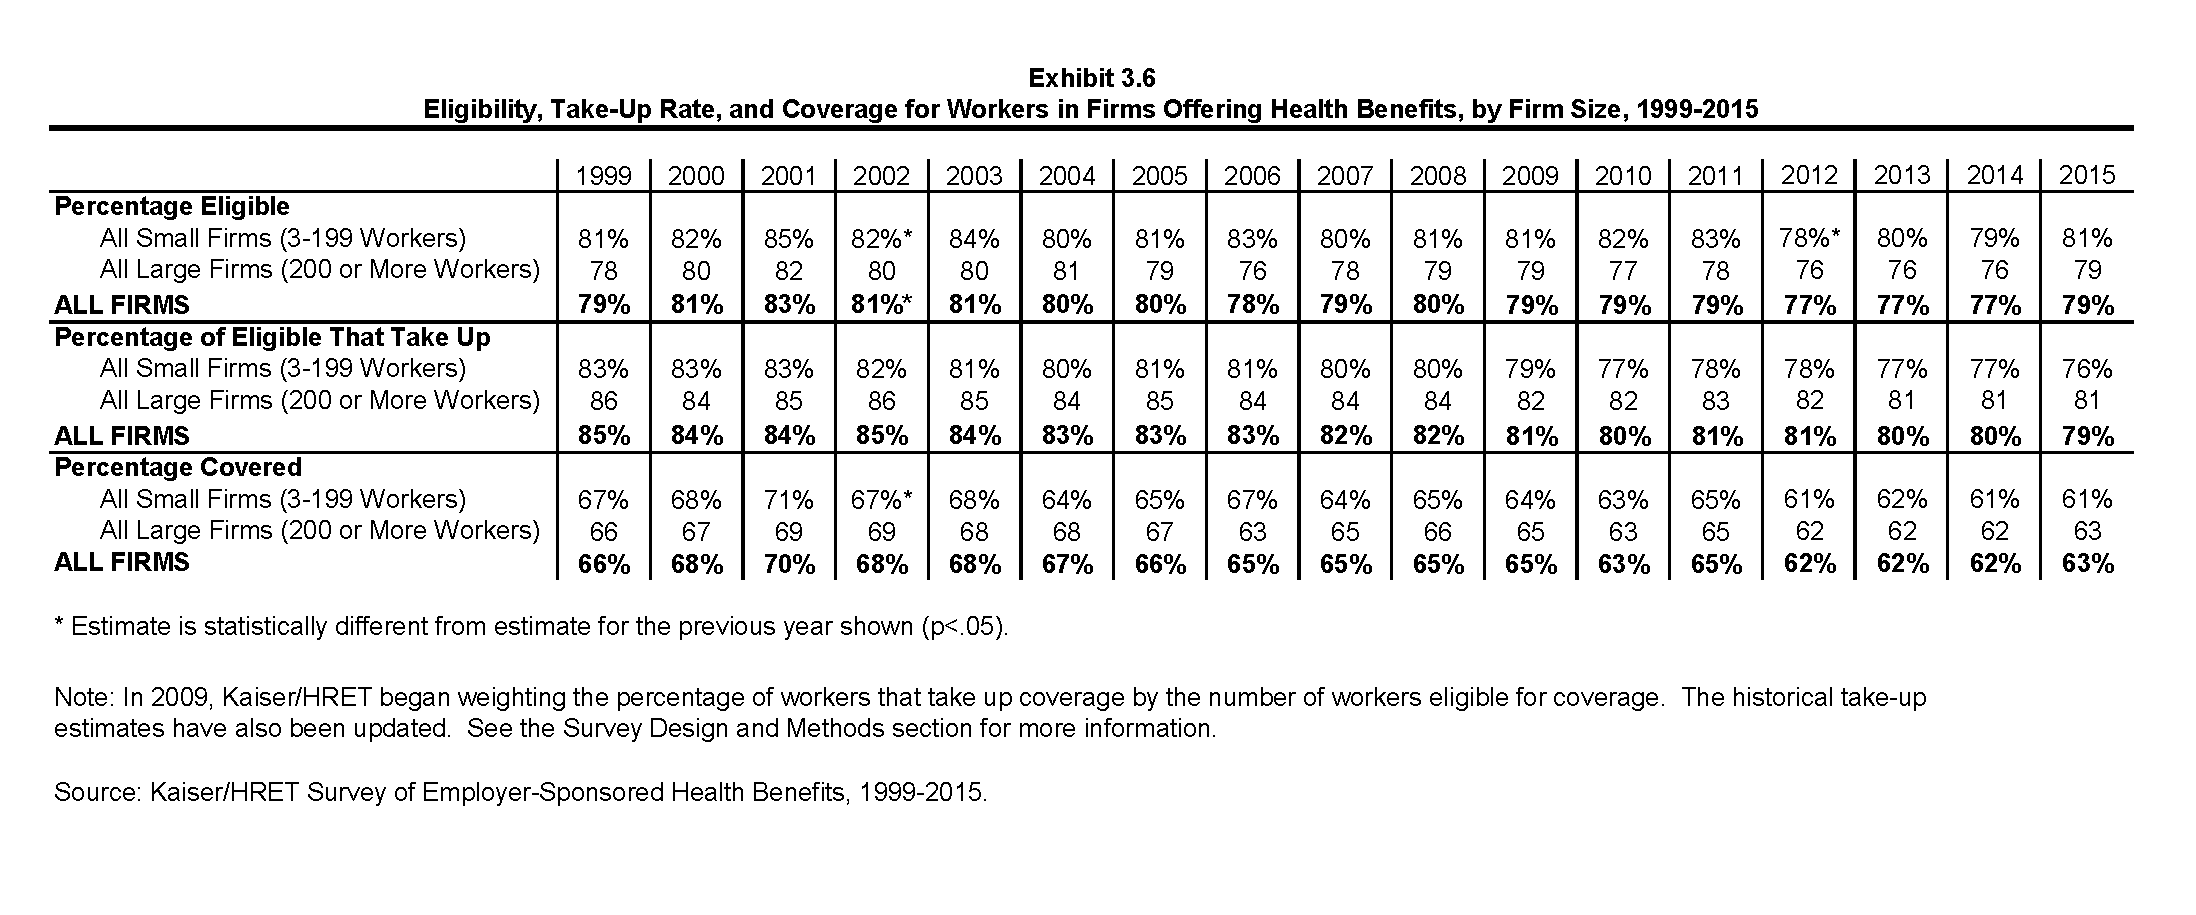
Eligibility, Take-Up Rate, and Coverage for Workers in Firms Offering Health Benefits, by Firm Size, 1999-2015
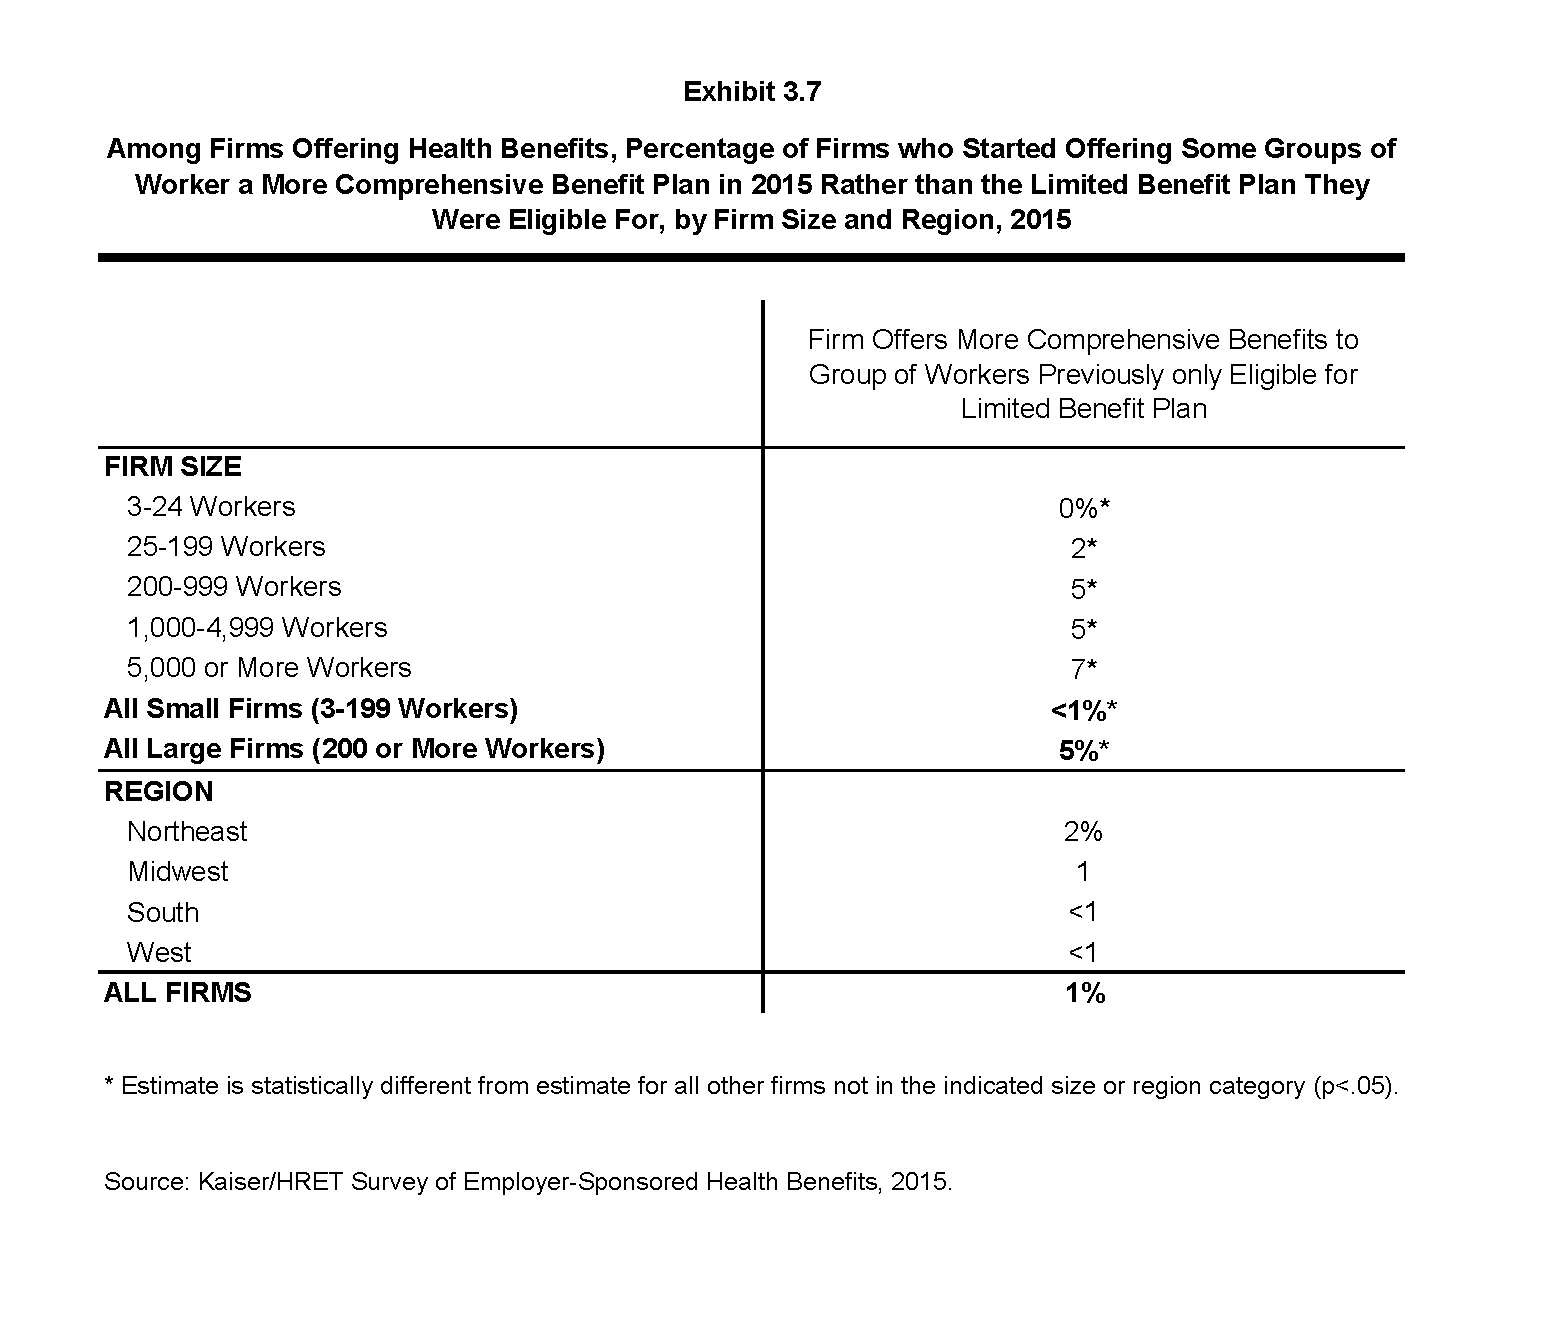
Among Firms Offering Health Benefits, The Percentage of Firms who Started Offering Some Groups of Worker a More Comprehensive Benefit Plan in 2015 Rather than the Limited Benefit Plan they were Eligible For, by Firm Size and Region, 2015

Percentage of Covered Workers in Firms with a Waiting Period for Coverage and Average Waiting Period in Months, by Firm Size, Region, and Industry, 2015
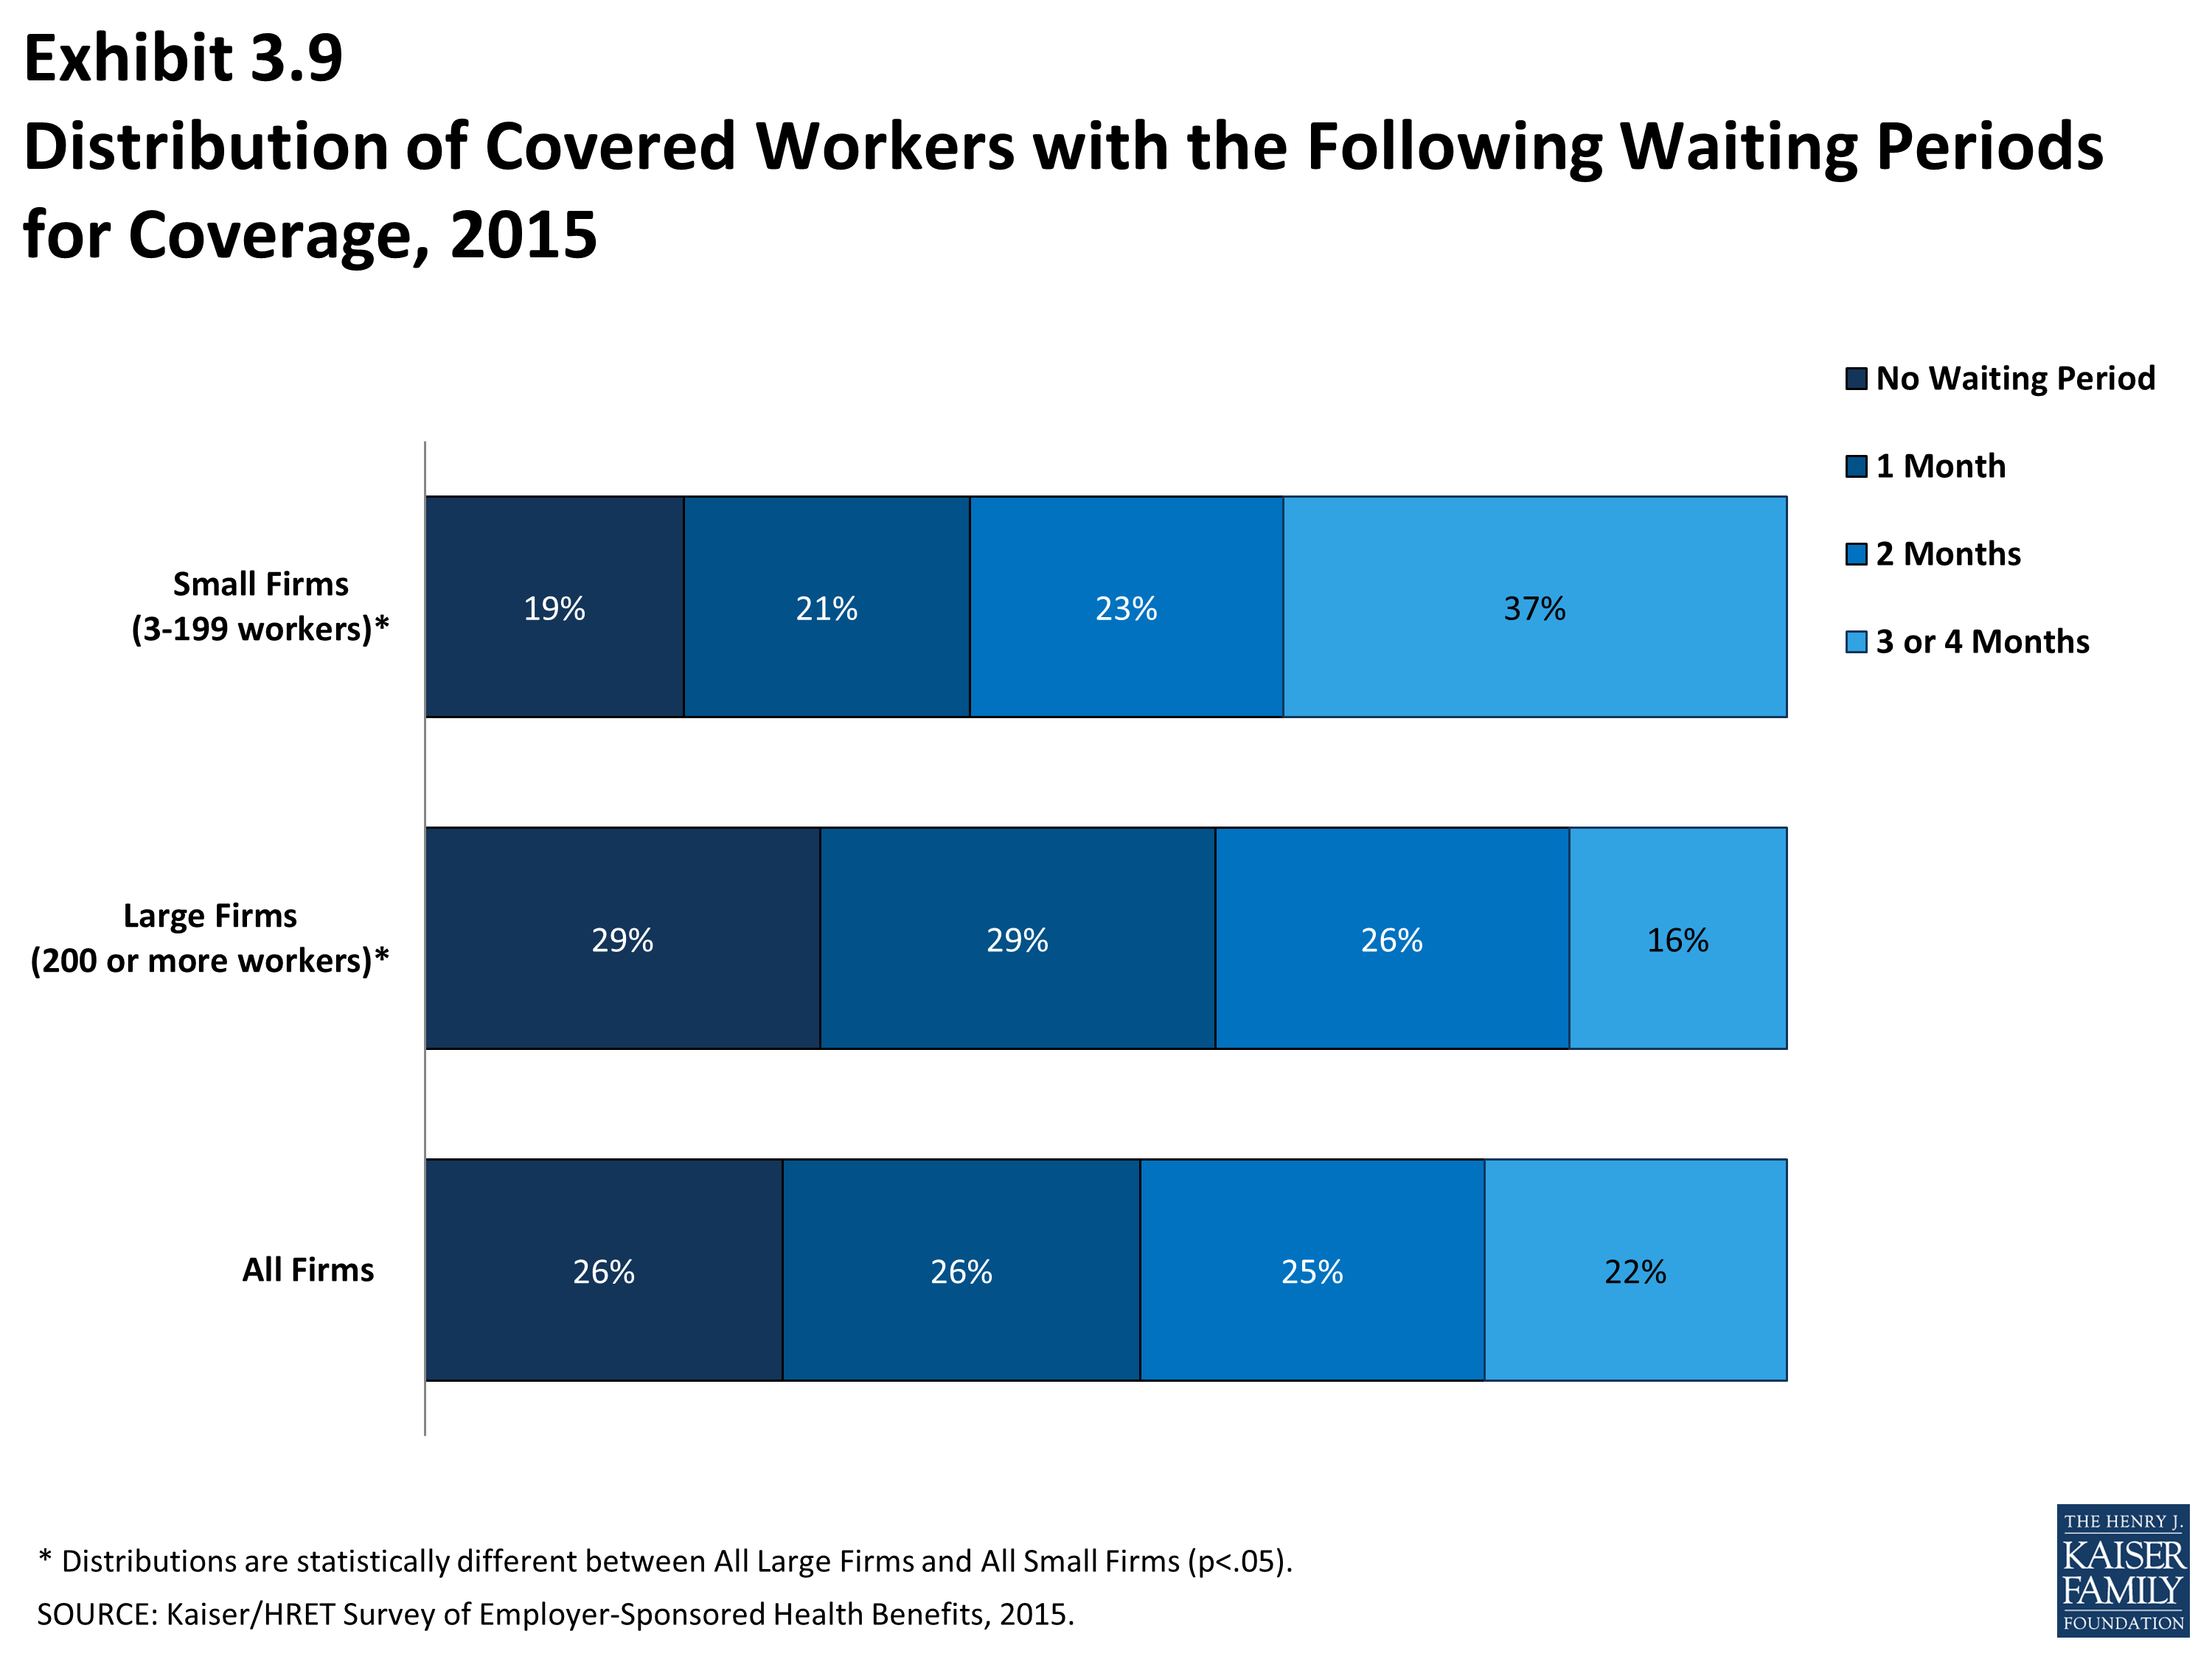
Distribution of Covered Workers with the Following Waiting Periods for Coverage, 2015
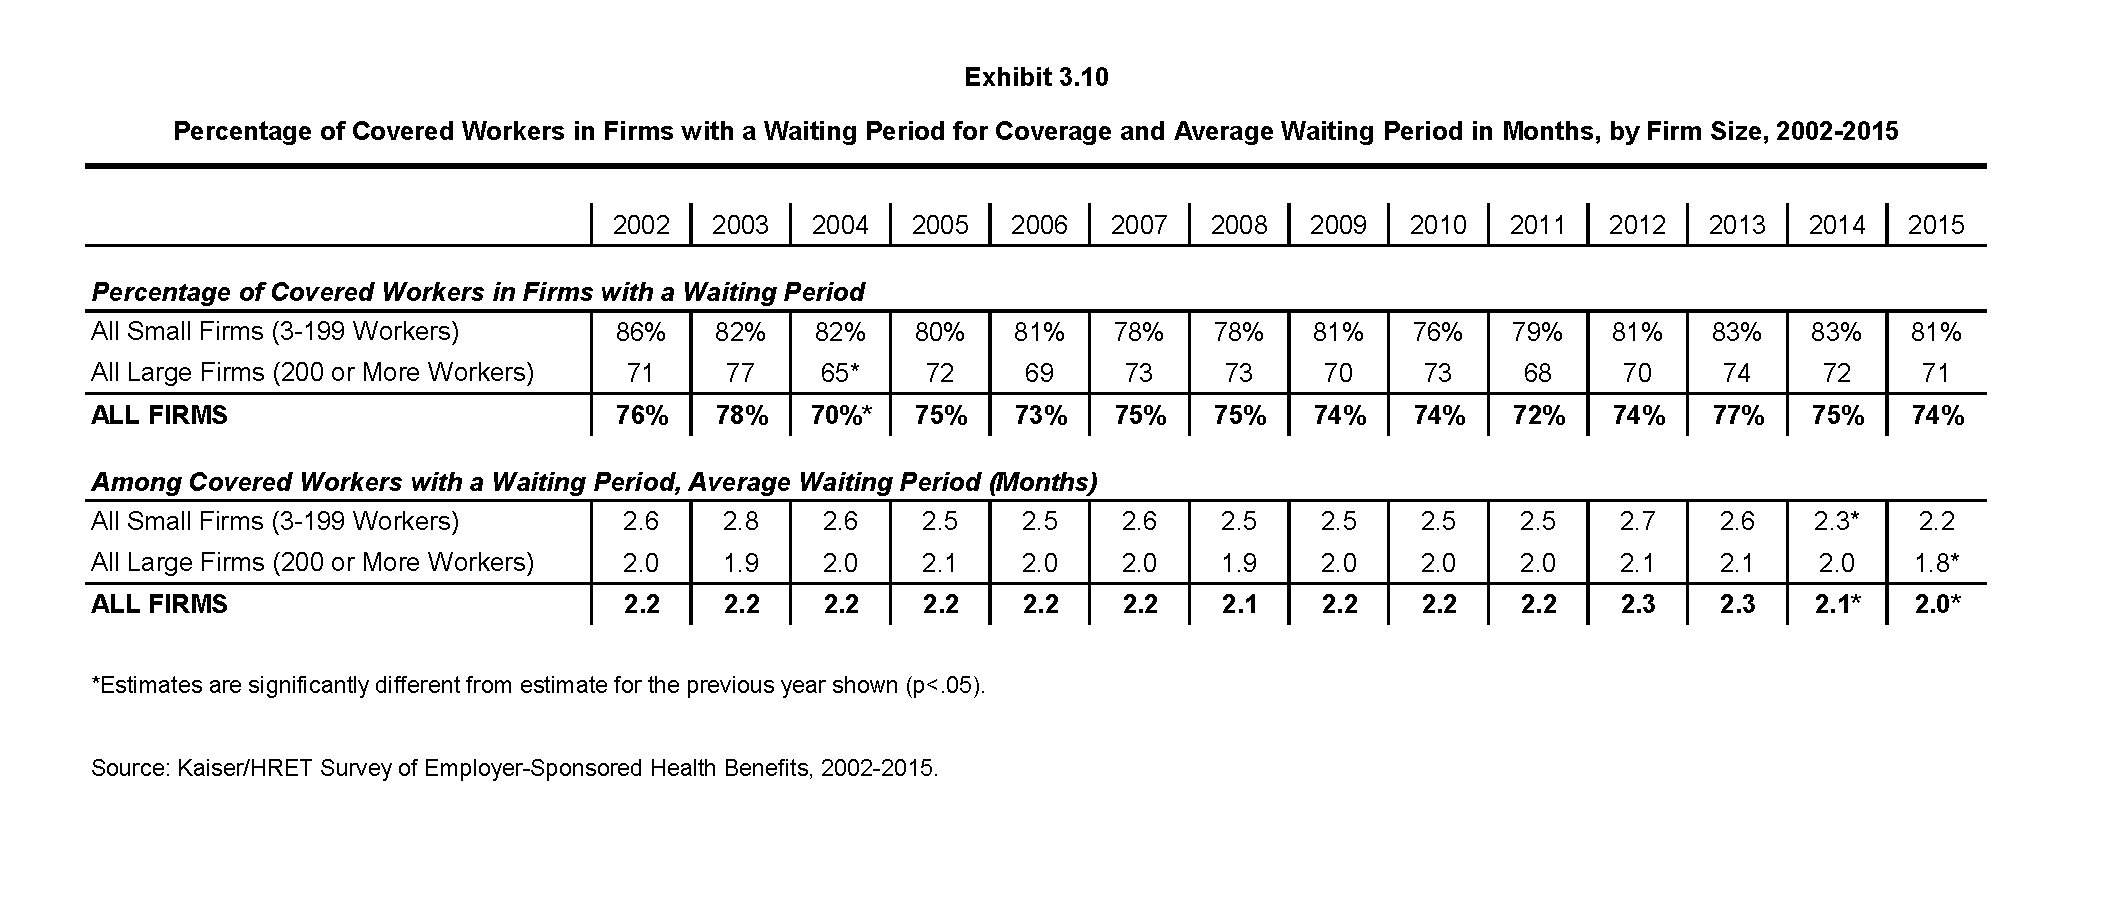
Percentage of Covered Workers in Firms with a Waiting Period for Coverage and Average Waiting Period in Months, by Firm Size, Region, and Industry, 2002-2015
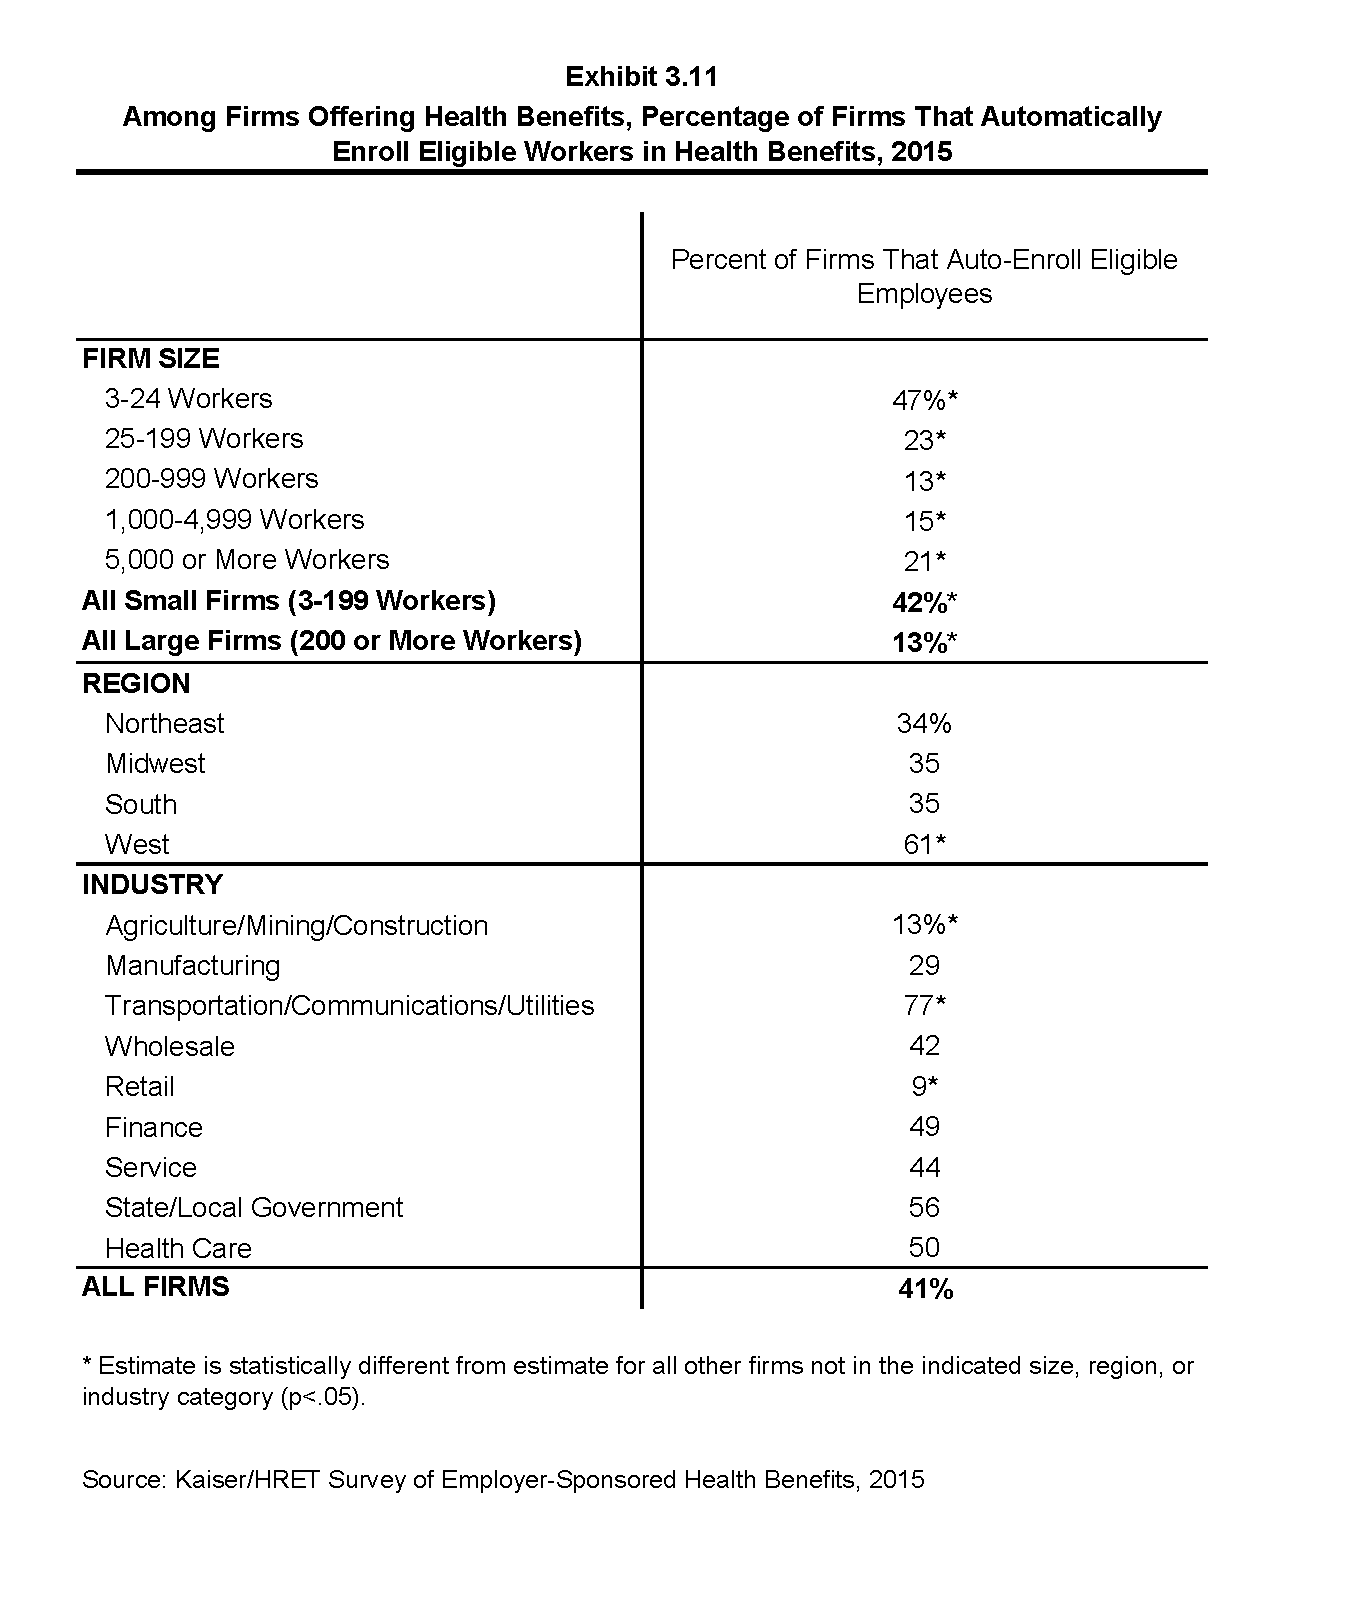
Among Firms Offering Health Benefits, Percentage of Firms Which Automatically Enroll Eligible Workers in Health Benefits, 2015
Among Firms Offering Health Benefits, Percentage of Firms' Covered Workers who are Enrolled in Single Coverage, 2015
Section Four: Types of Plans Offered
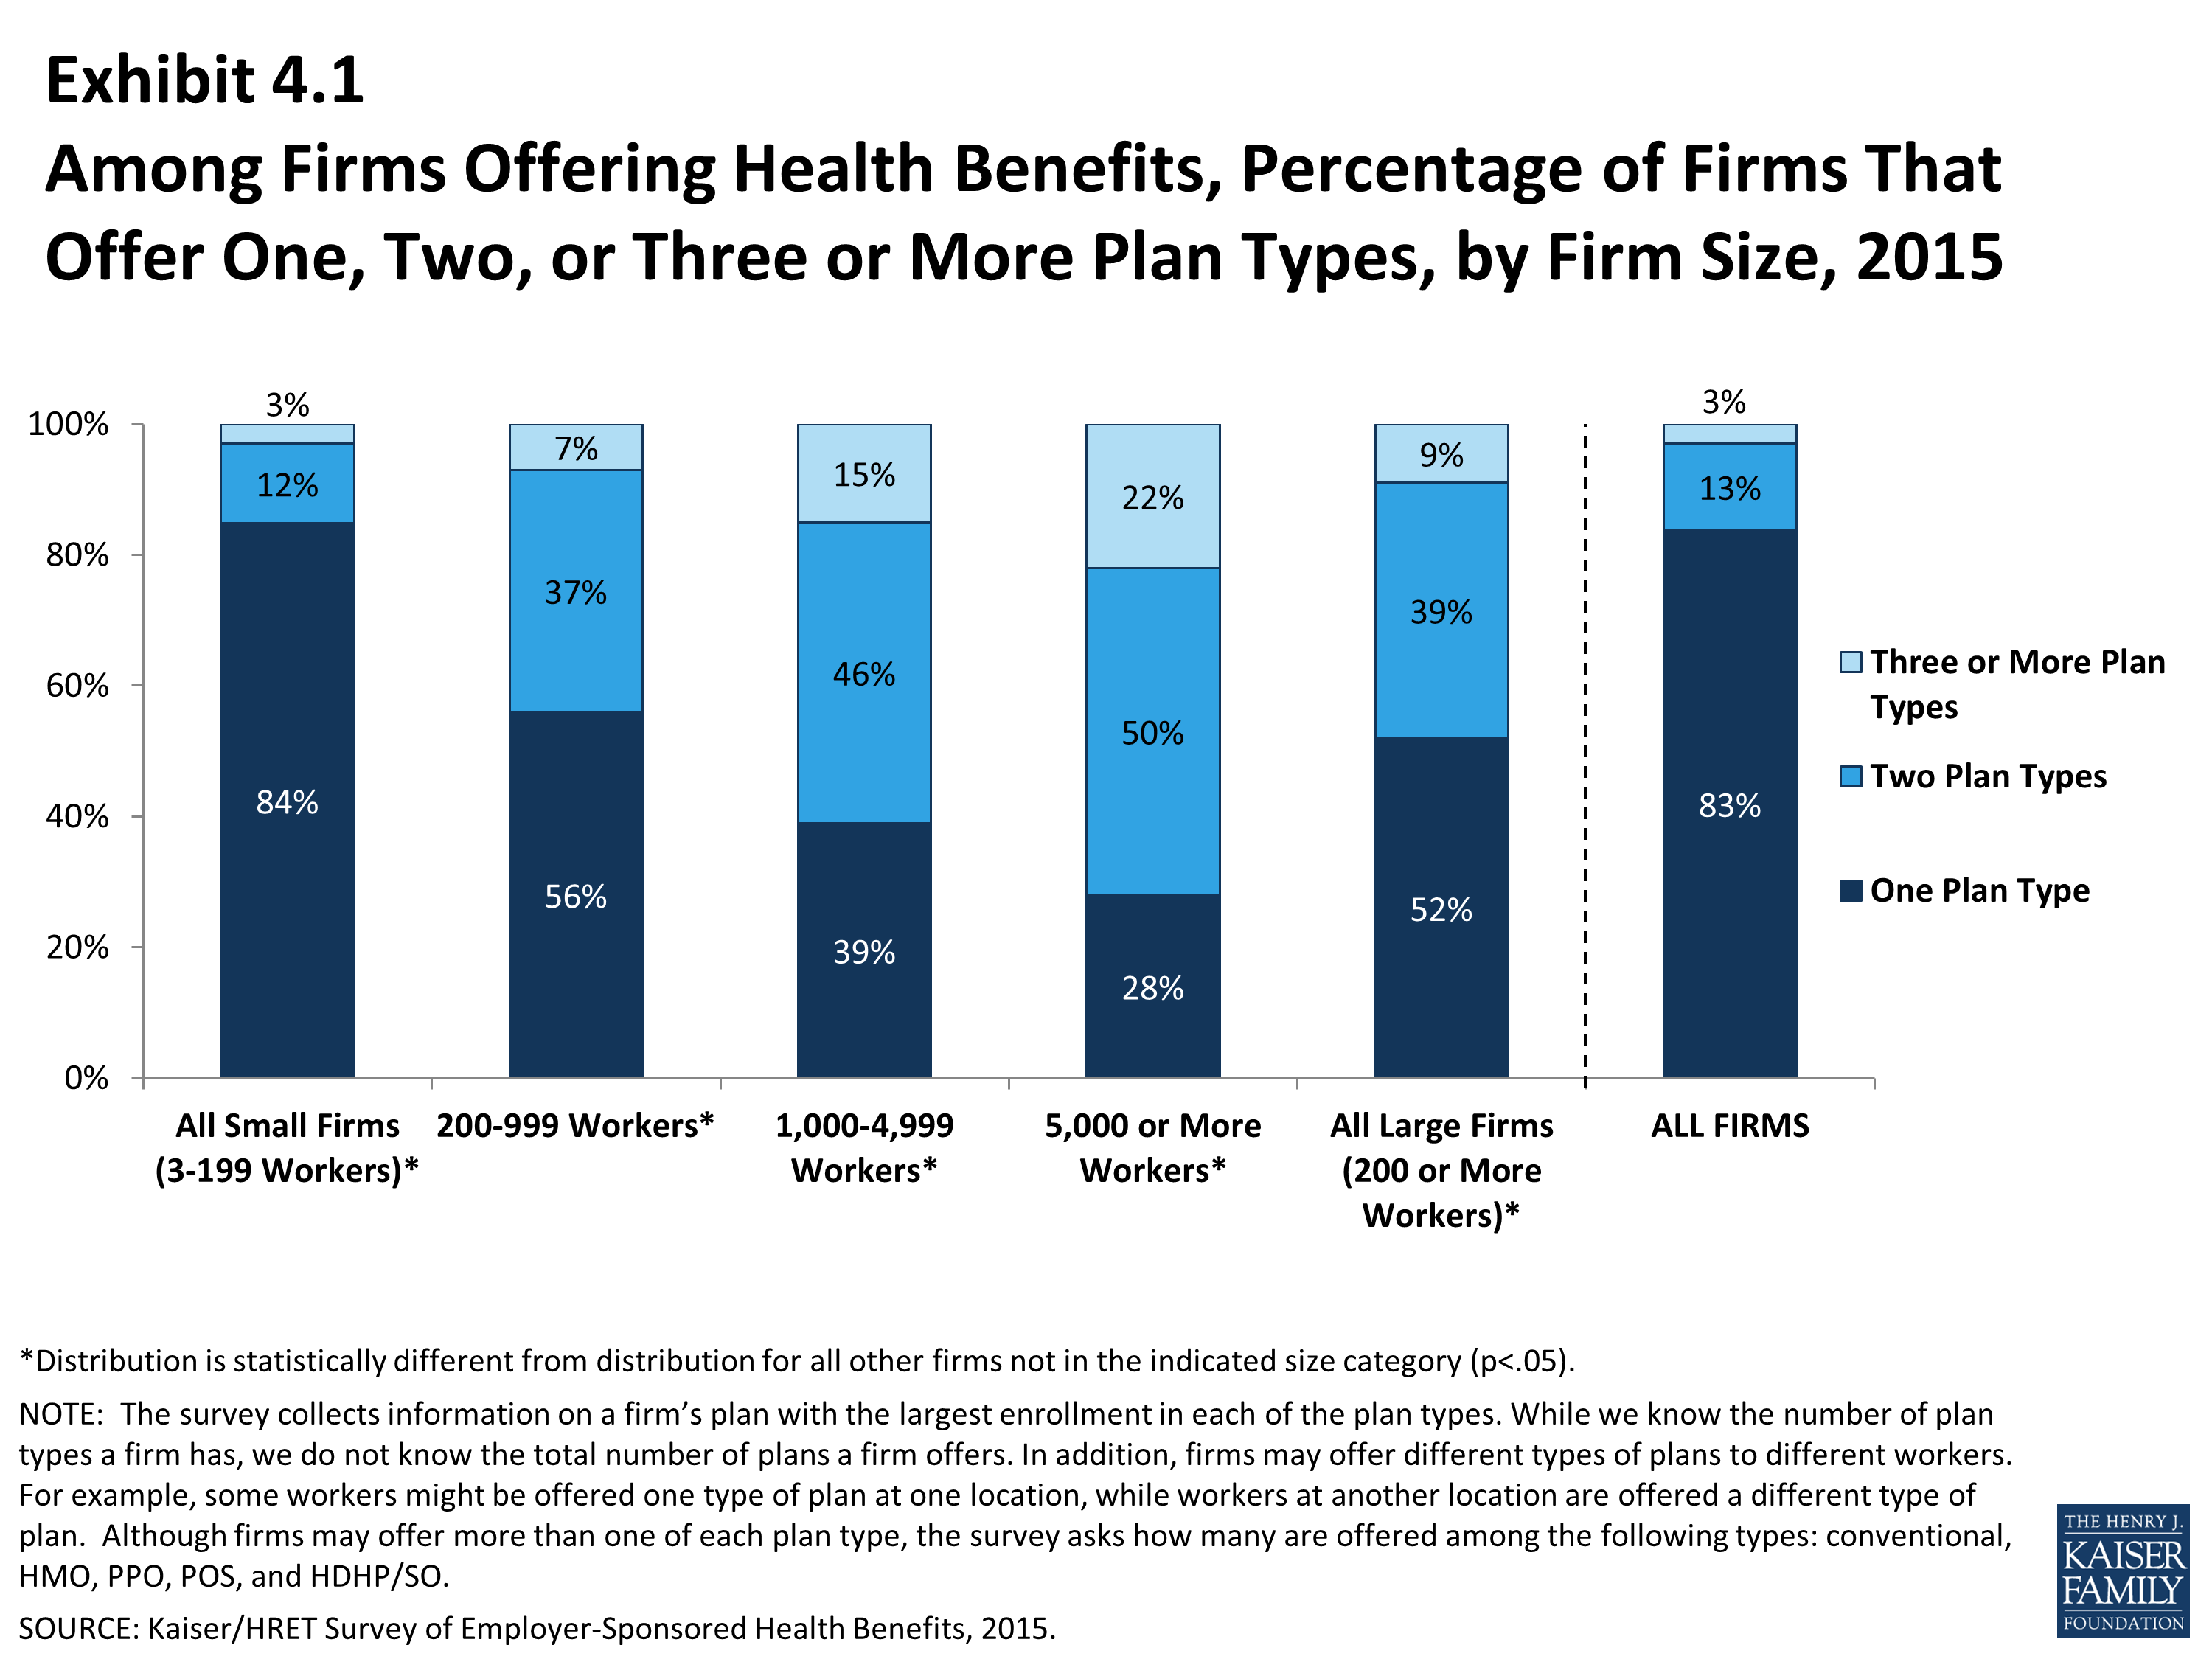
Most firms that offer health benefits offer only one type of health plan (83%) (see text box). Large firms (200 or more workers) are more likely to offer more than one type of health plan than small firms. Employers are most likely to offer their workers a PPO or HDHP/SO plan and are least likely to offer a conventional plan (sometimes known as indemnity insurance).
- Eighty-three percent of firms offering health benefits in 2015 offer only one type of health plan. Large firms (200 or more workers) are more likely to offer more than one plan type than small firms (3 to 199 workers) (48% vs. 16%) (Exhibit 4.1).
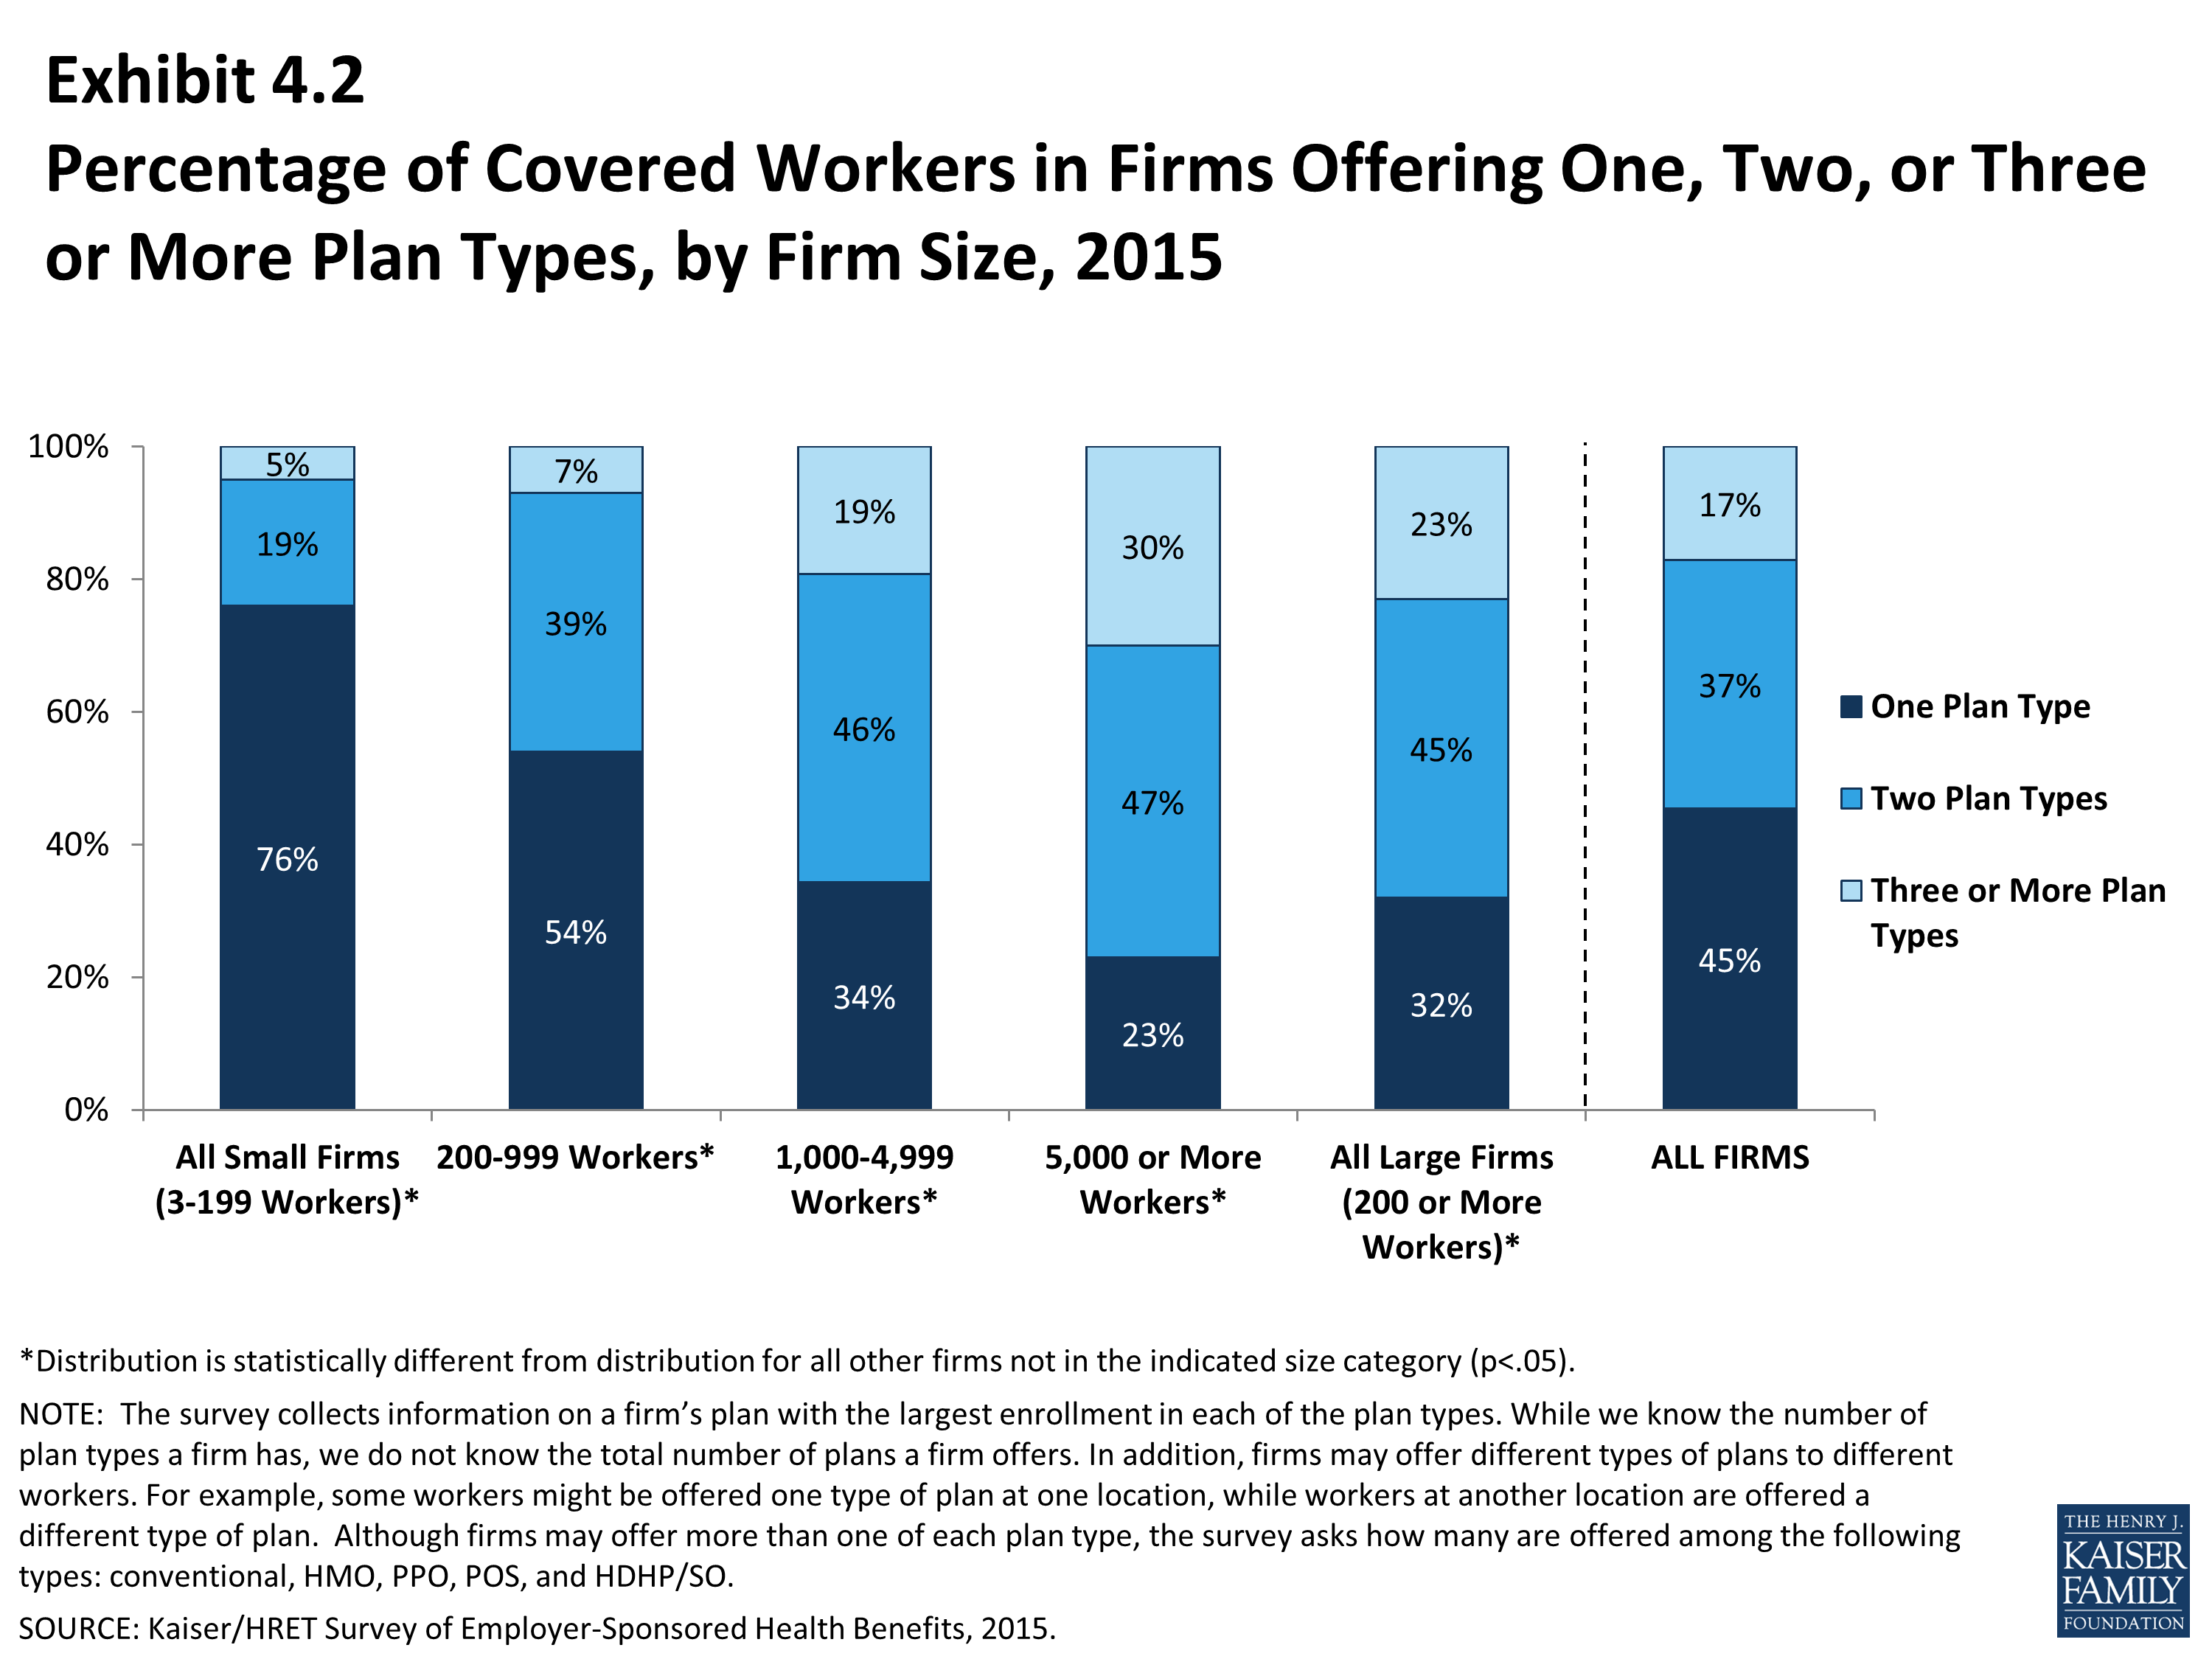
- In addition to looking at the percentage of firms that offer multiple plan types, the percentage of covered workers at firms that offer multiple plan types can also be analyzed. Over half (55%) of covered workers are employed in a firm that offers more than one health plan type. Sixty-eight percent of covered workers in large firms are employed by a firm that offers more than one plan type, compared to 24% in small firms (Exhibit 4.2).
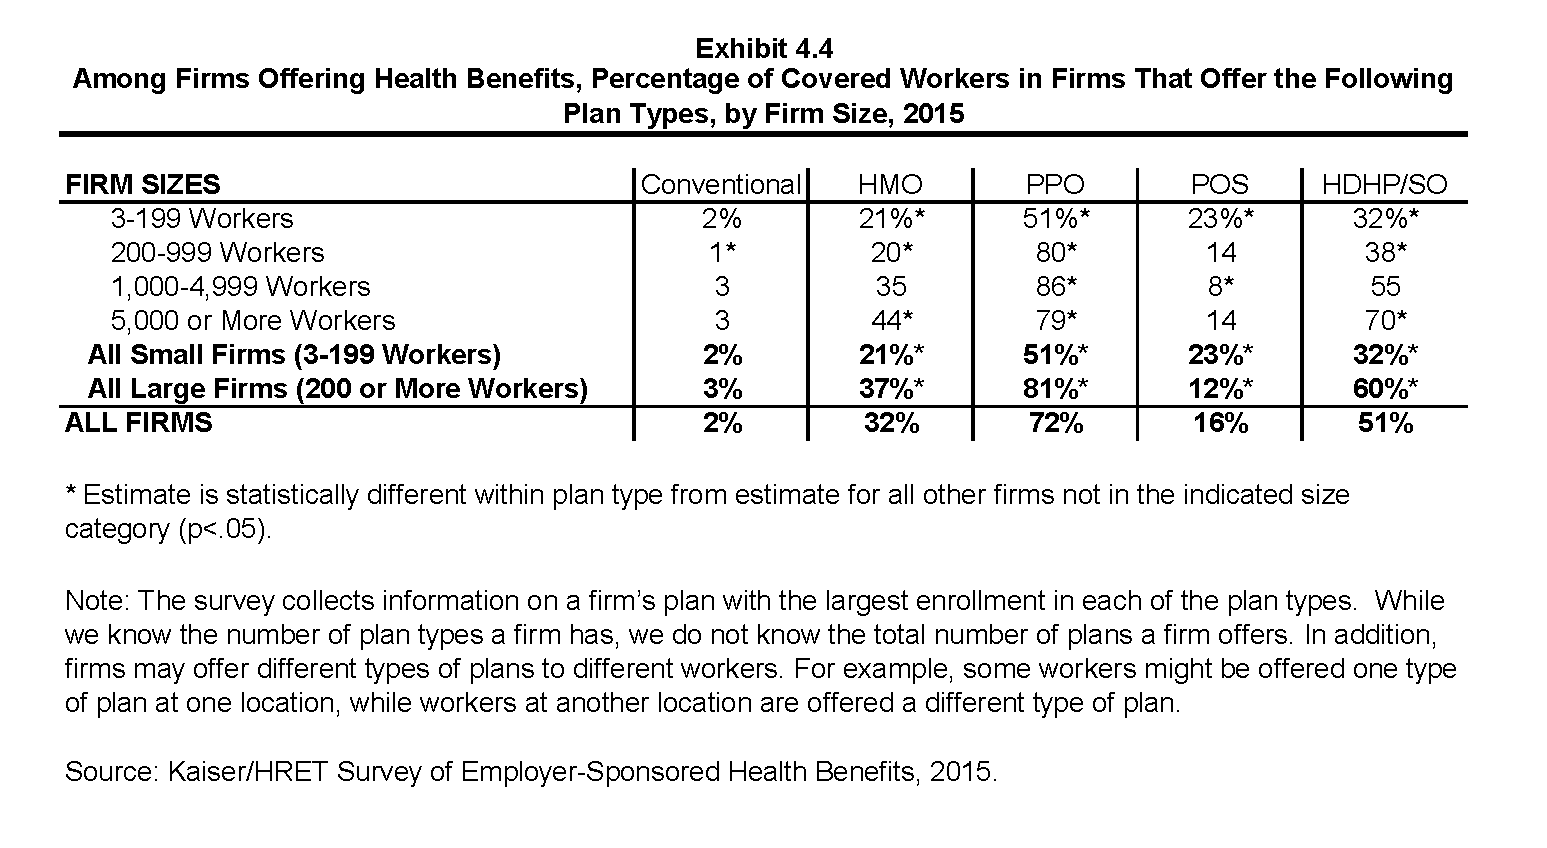
- Nearly three quarters (72%) of covered workers in firms offering health benefits work in firms that offer one or more PPO plans; 51% work in firms that offer one or more HDHP/SOs; 32% work in firms that offer one or more HMO plans; 16% work in firms that offer one or more POS plans; and 2% work in firms that offer one or more conventional plans (Exhibit 4.4).1
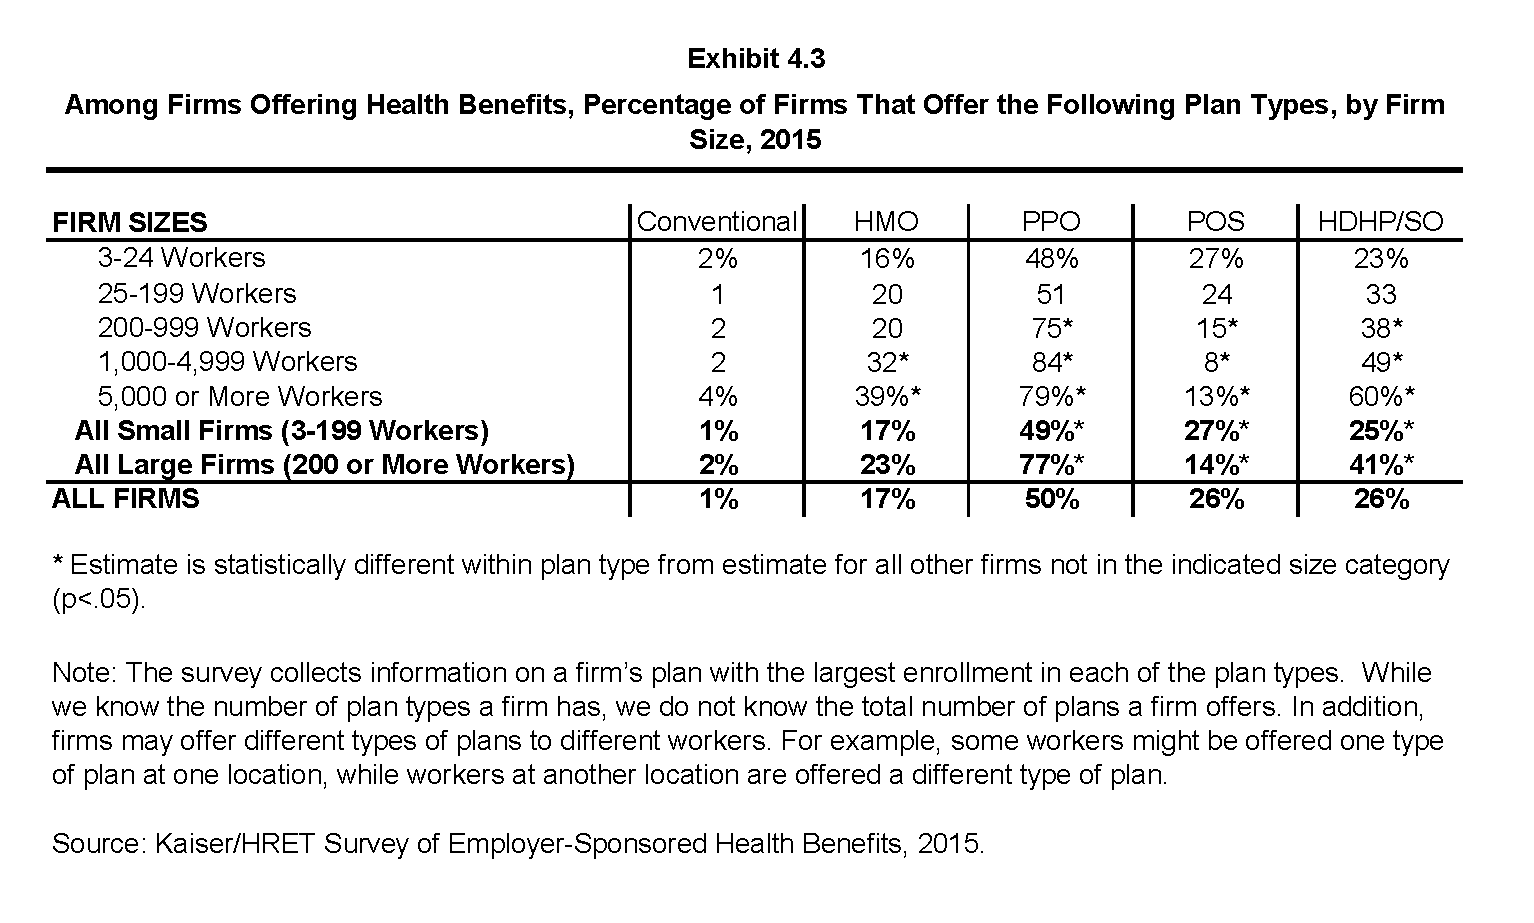
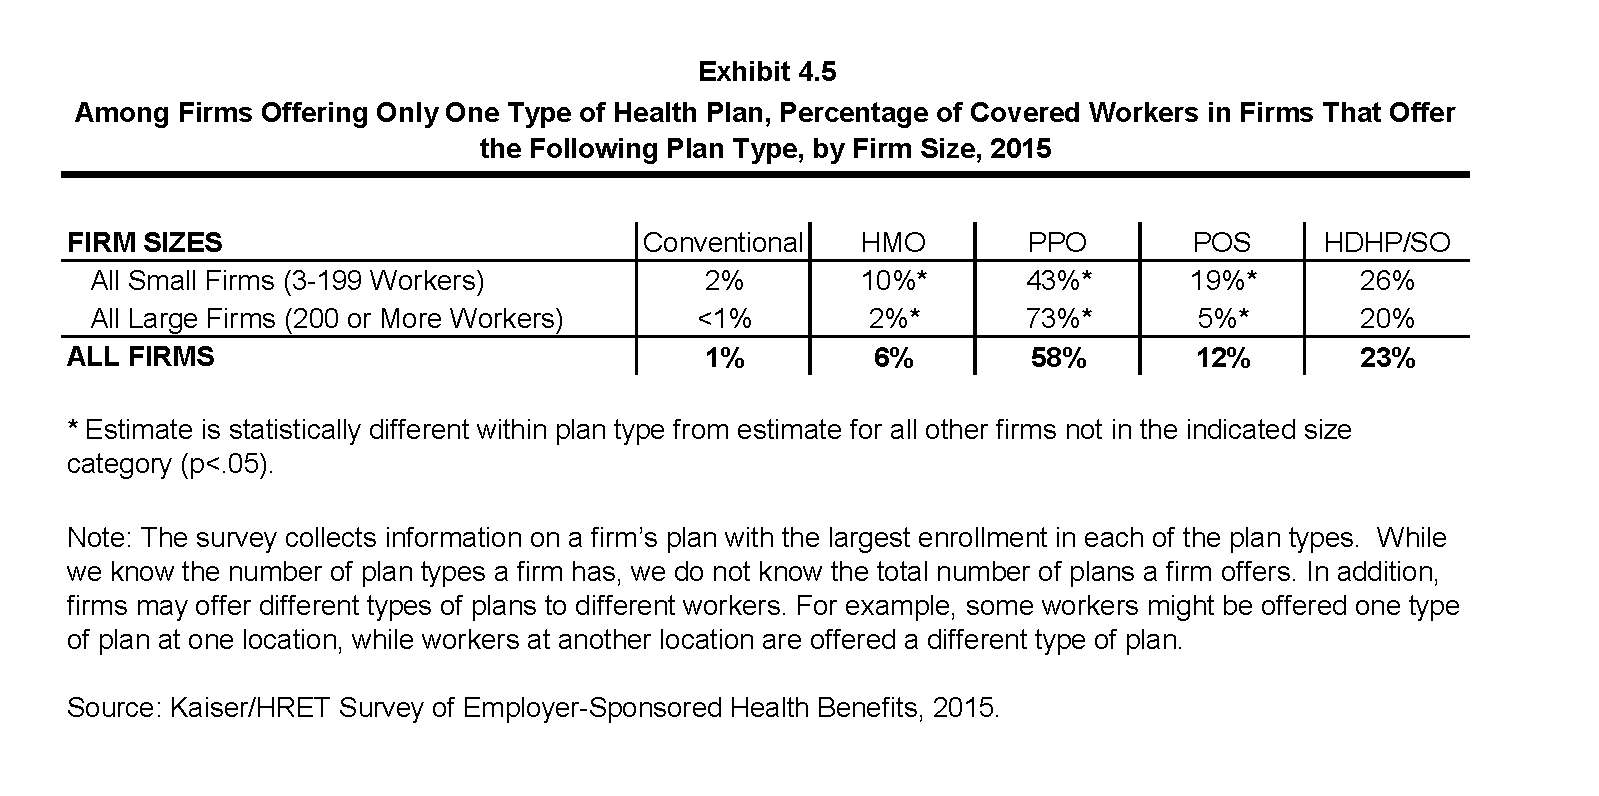
- Among firms offering only one type of health plan, large firms are more likely to offer PPO plans than small firms (73% vs. 43%), while small firms are more likely to offer HMO (10%) and POS (19%) plans than large firms (2% and 5%, respectively) (Exhibit 4.5).
- Among firms offering only one type of health plan, 23% of covered workers are in firms that only offer an HDHP/SO (Exhibit 4.5).
The survey collects information on a firm’s plan with the largest enrollment in each of the plan types. While we know the number of plan types a firm has, we do not know the total number of plans a firm offers workers. In addition, firms may offer different types of plans to different workers. For example, some workers might be offered one type of plan at one location, while workers at another location are offered a different type of plan.
HMO is health maintenance organization.
PPO is preferred provider organization.
POS is point-of-service plan.
HDHP/SO is high-deductible health plan with a savings option such as an HRA or HSA.
Among Firms Offering Health Benefits, Percentage of Firms That Offer One, Two, or Three or More Plan Types, by Firm Size, 2015
Percentage of Covered Workers in Firms Offering One, Two, or Three or More Plan Types, by Firm Size, 2015
Among Firms Offering Health Benefits, Percentage of Firms That Offer the Following Plan Types, by Firm Size, 2015
Among Firms Offering Health Benefits, Percentage of Covered Workers in Firms That Offer the Following Plan Types, by Firm Size, 2015
Among Firms Offering Only One Type of Health Plan, Percentage of Covered Workers in Firms That Offer the Following Plan Type, by Firm Size, 2015
Section Five: Market Shares of Health Plans
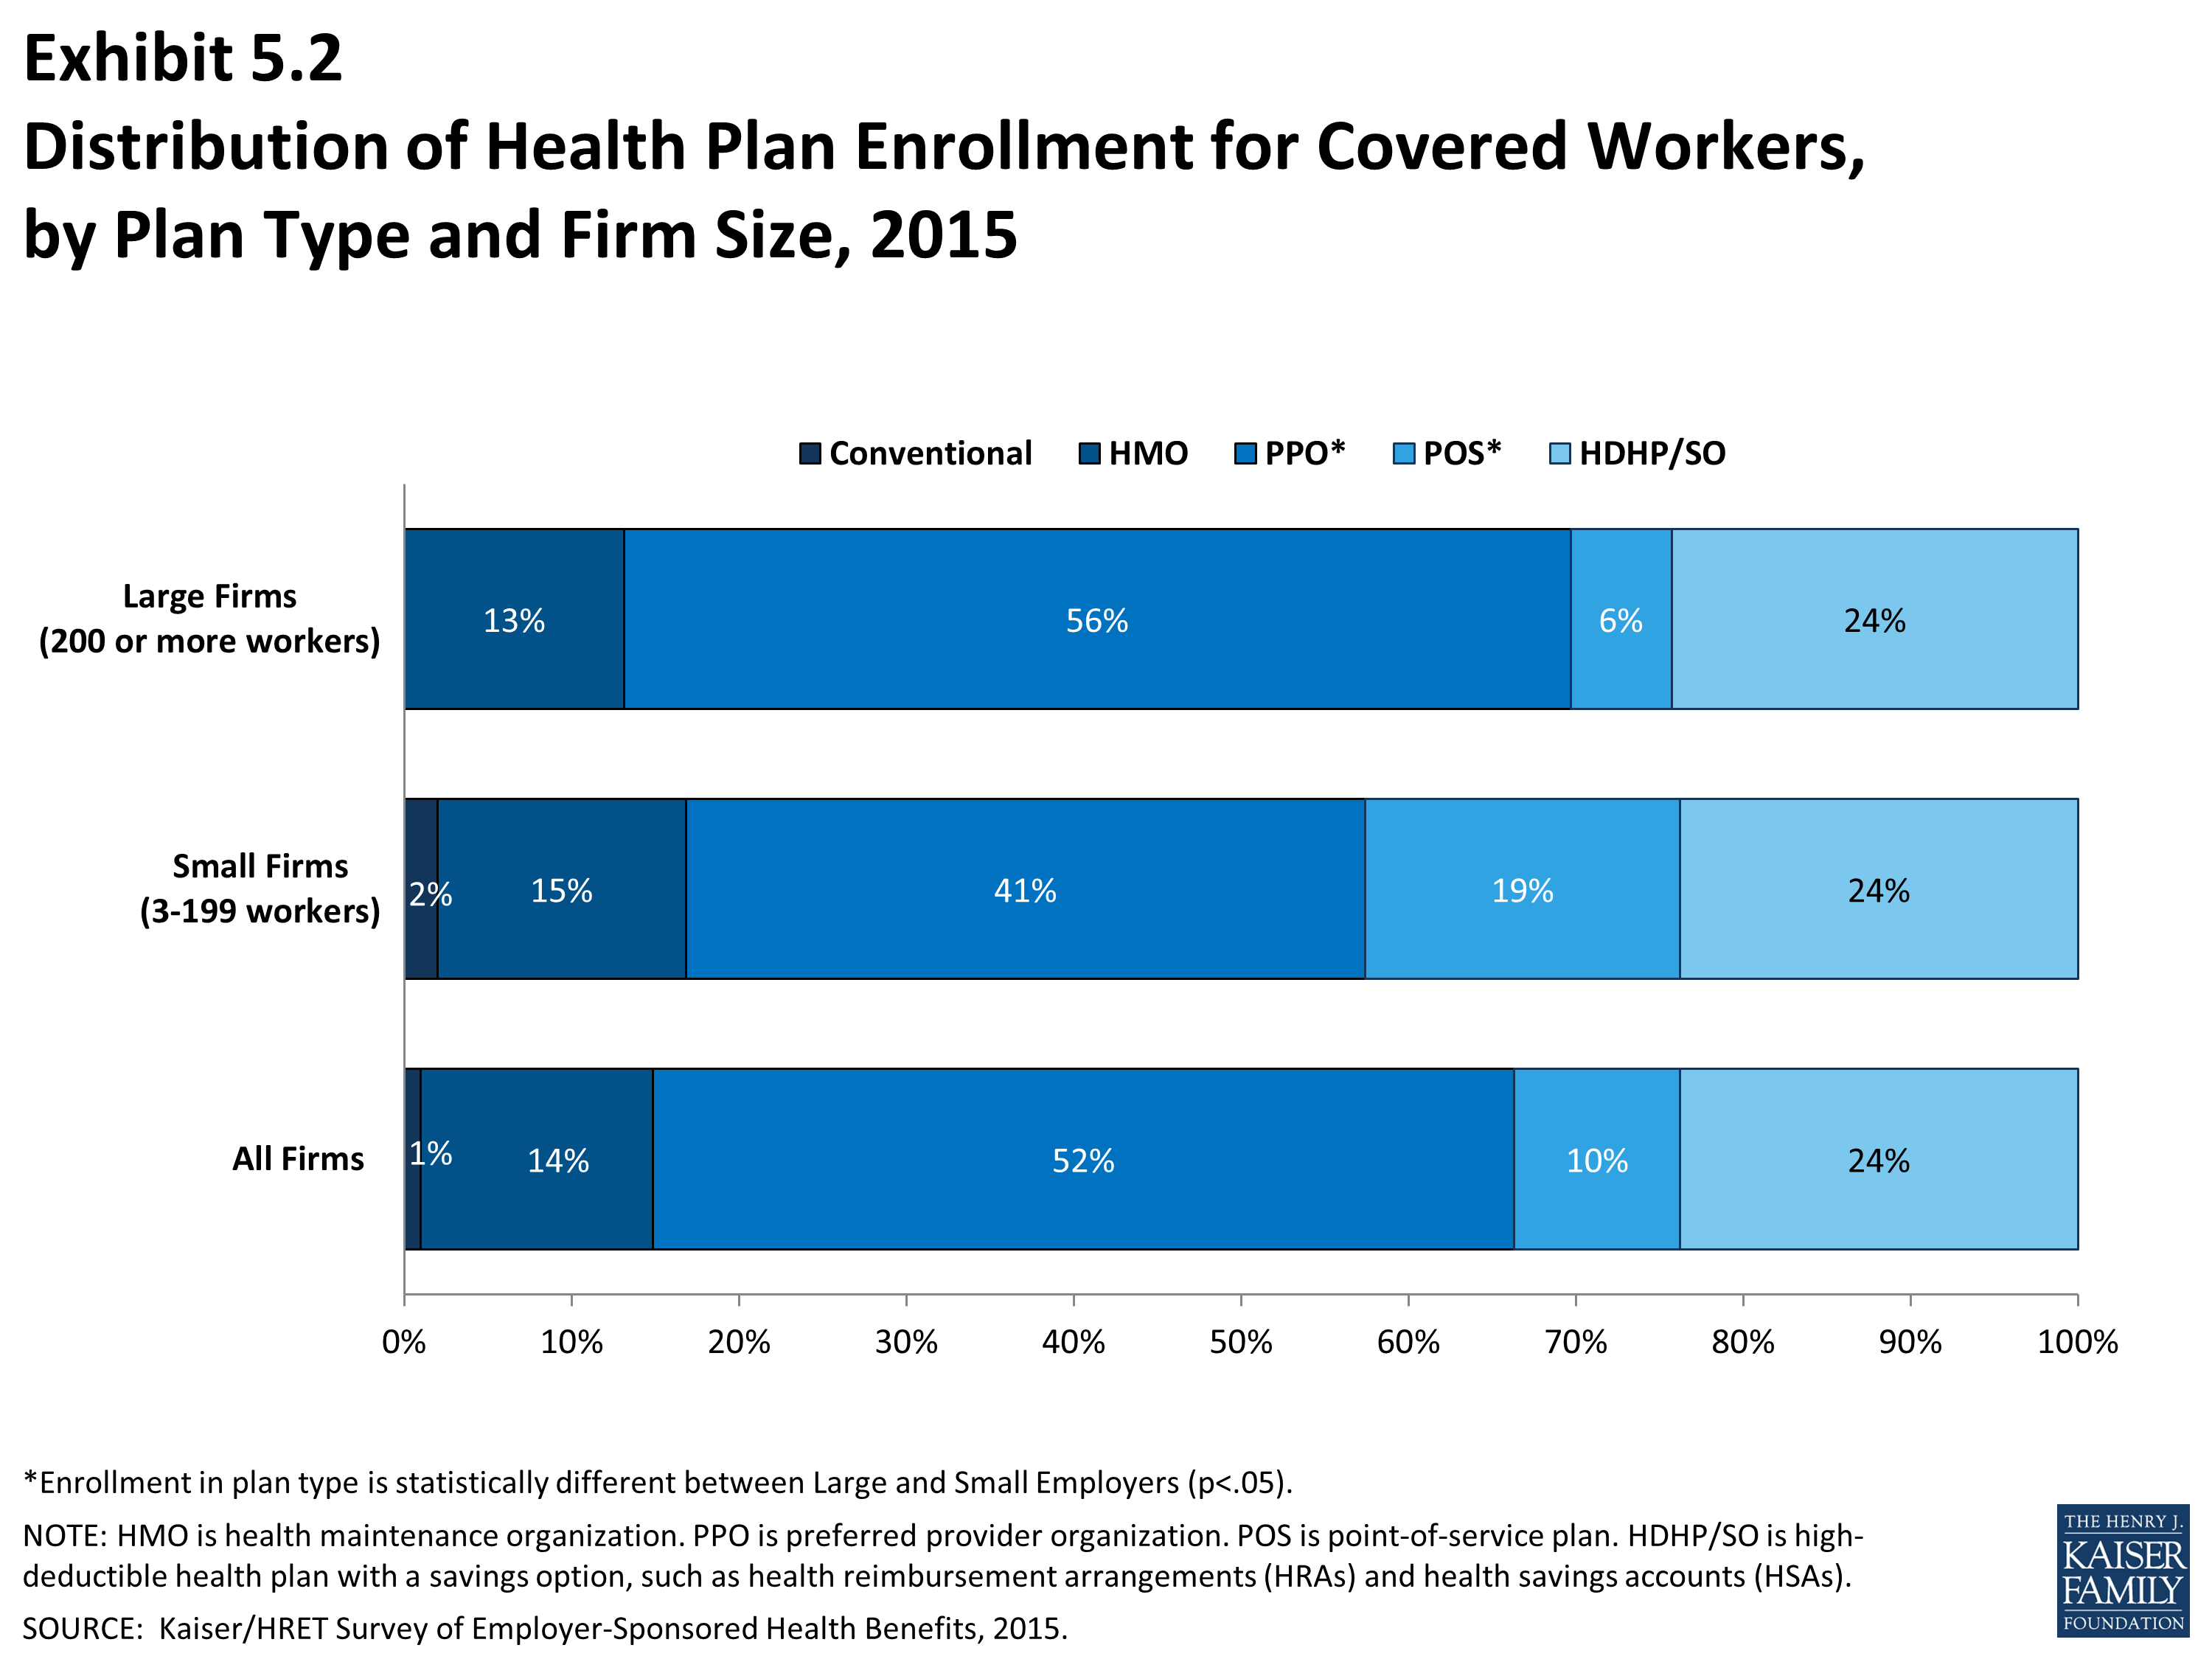
Enrollment remains highest in PPO plans, covering just over half of covered workers, followed by HDHP/SOs, HMO plans, POS plans, and conventional plans. Enrollment distribution varies by firm size: for example, PPOs are relatively more popular for covered workers at large firms (200 or more workers) than small firms (56% vs. 41%) and POS plans are relatively more popular among small firms than large firms (19% vs. 6%). While enrollment in HDHP/SO plans (24%) is statistically unchanged from 2014 (20%), it has increased from 13% in 2010. Enrollment in PPOs declined significantly from 58% in 2014 to 52% in 2015.
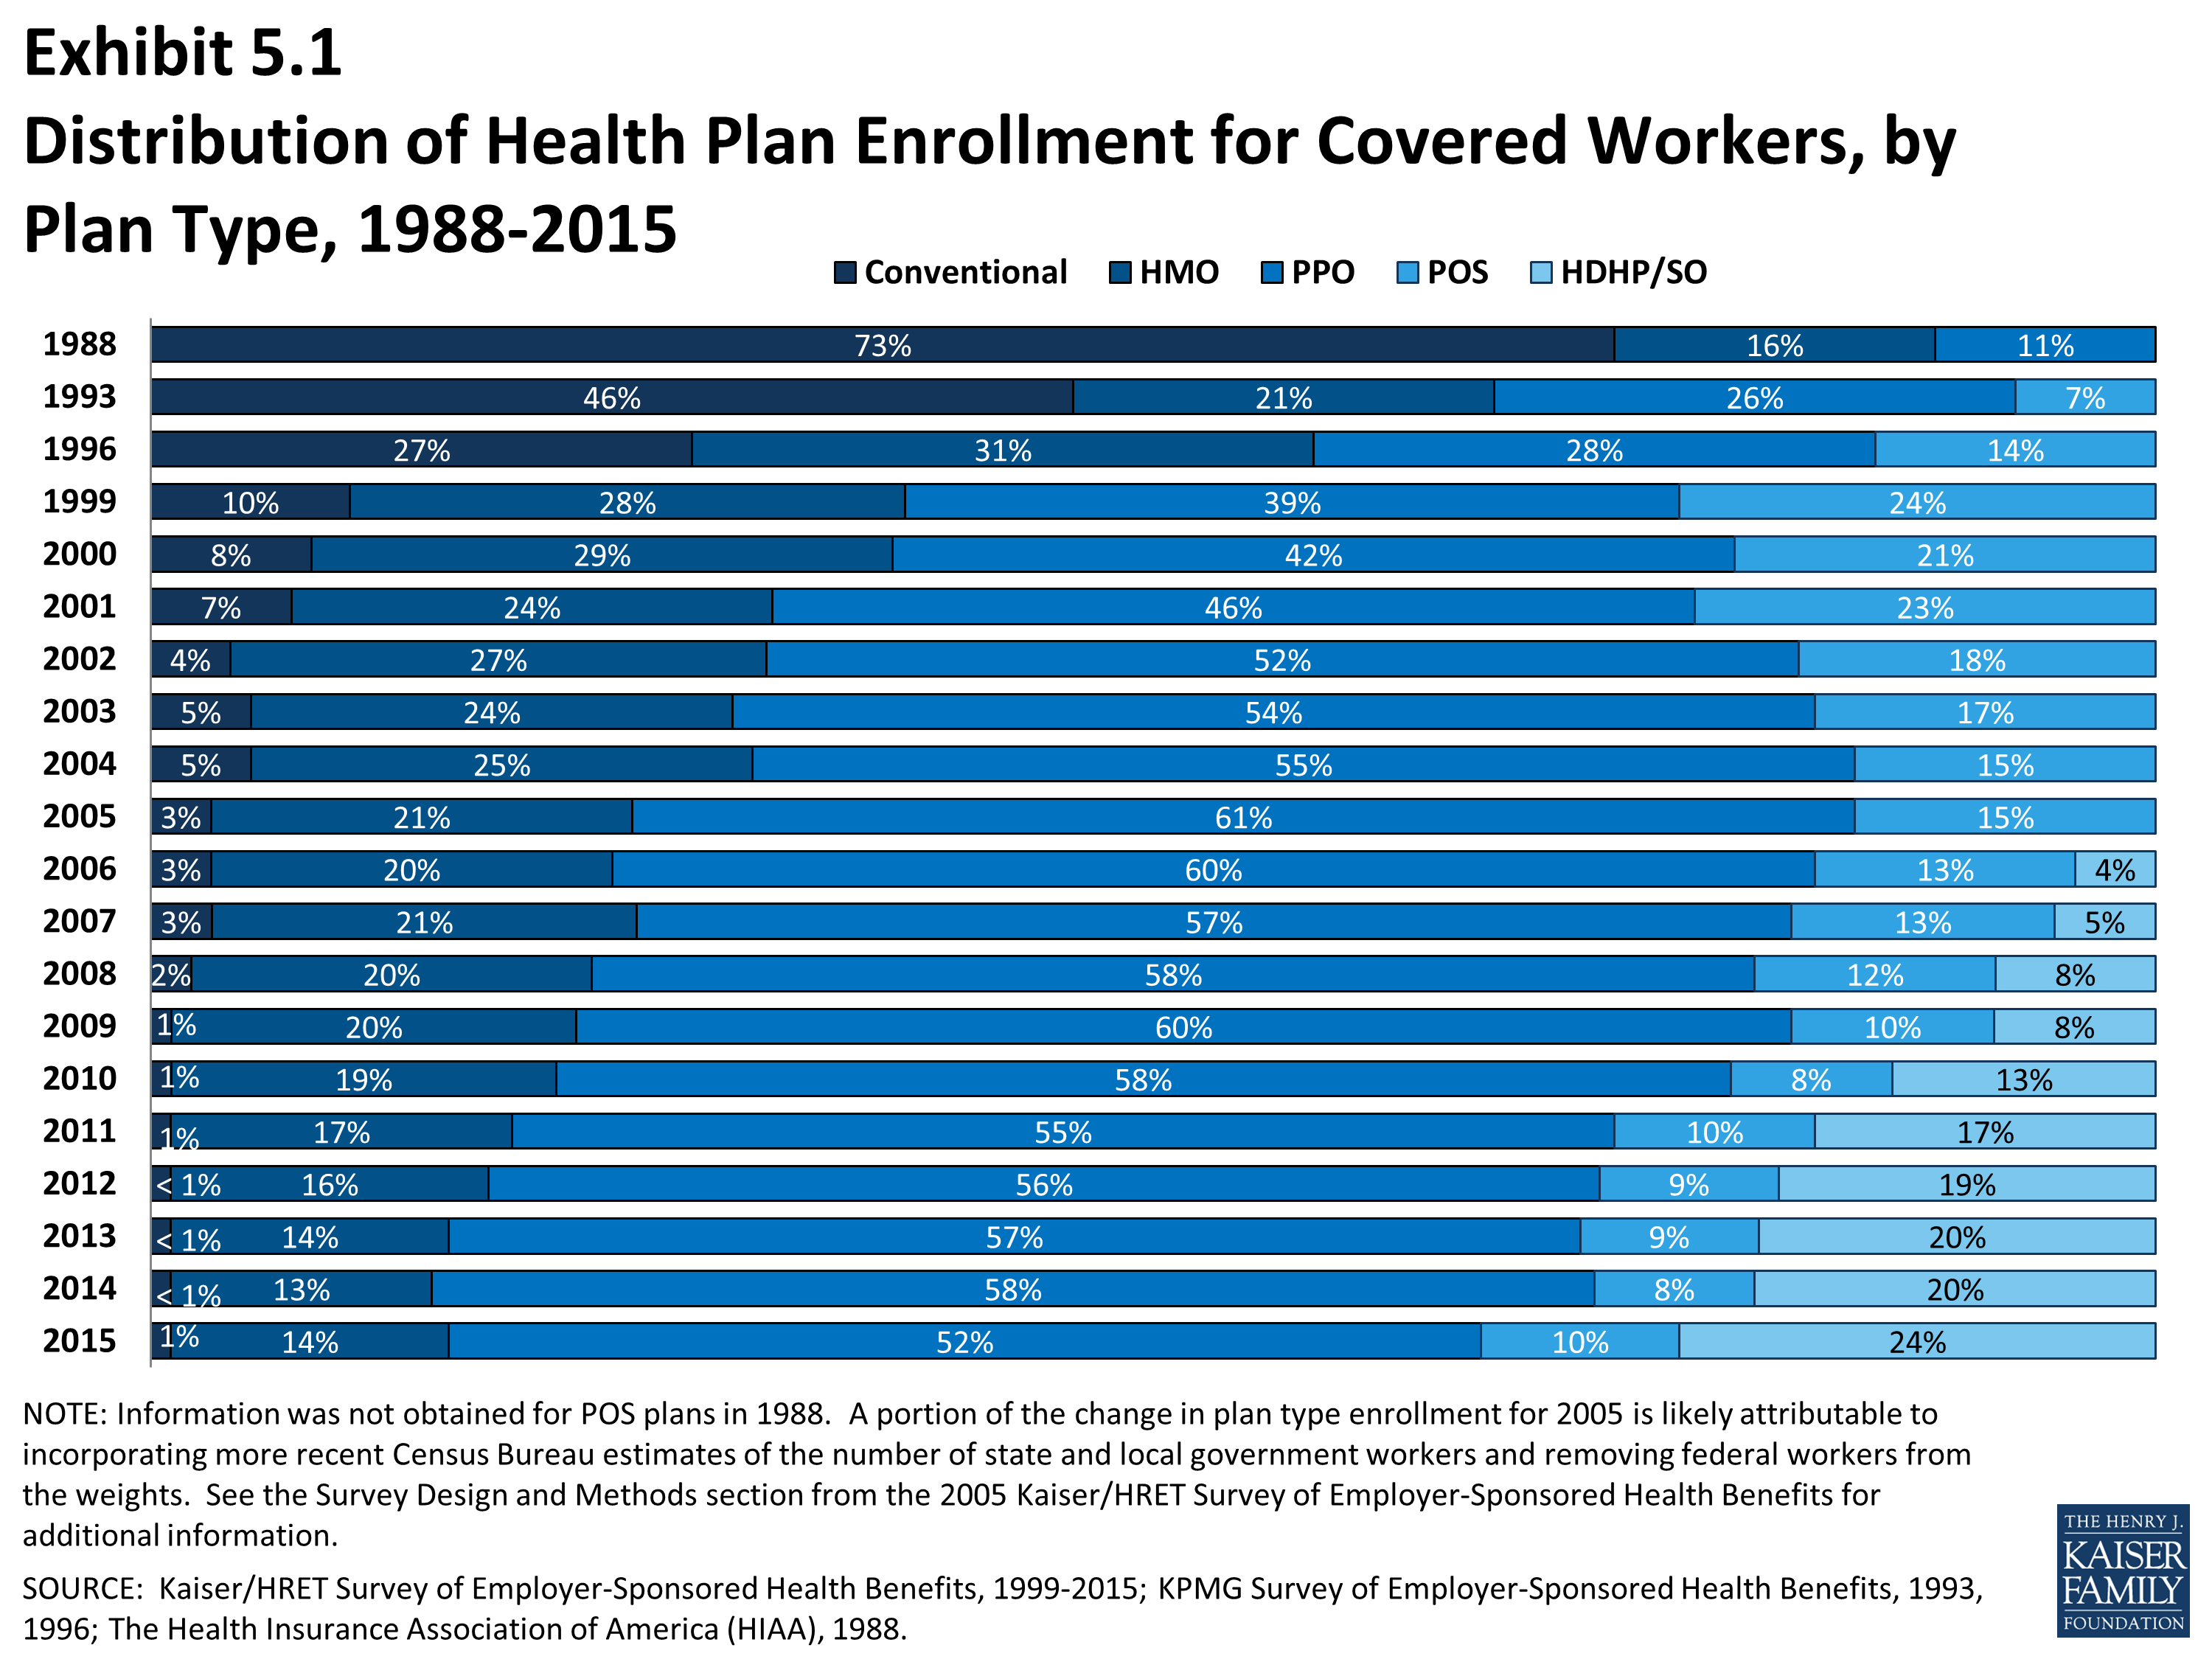
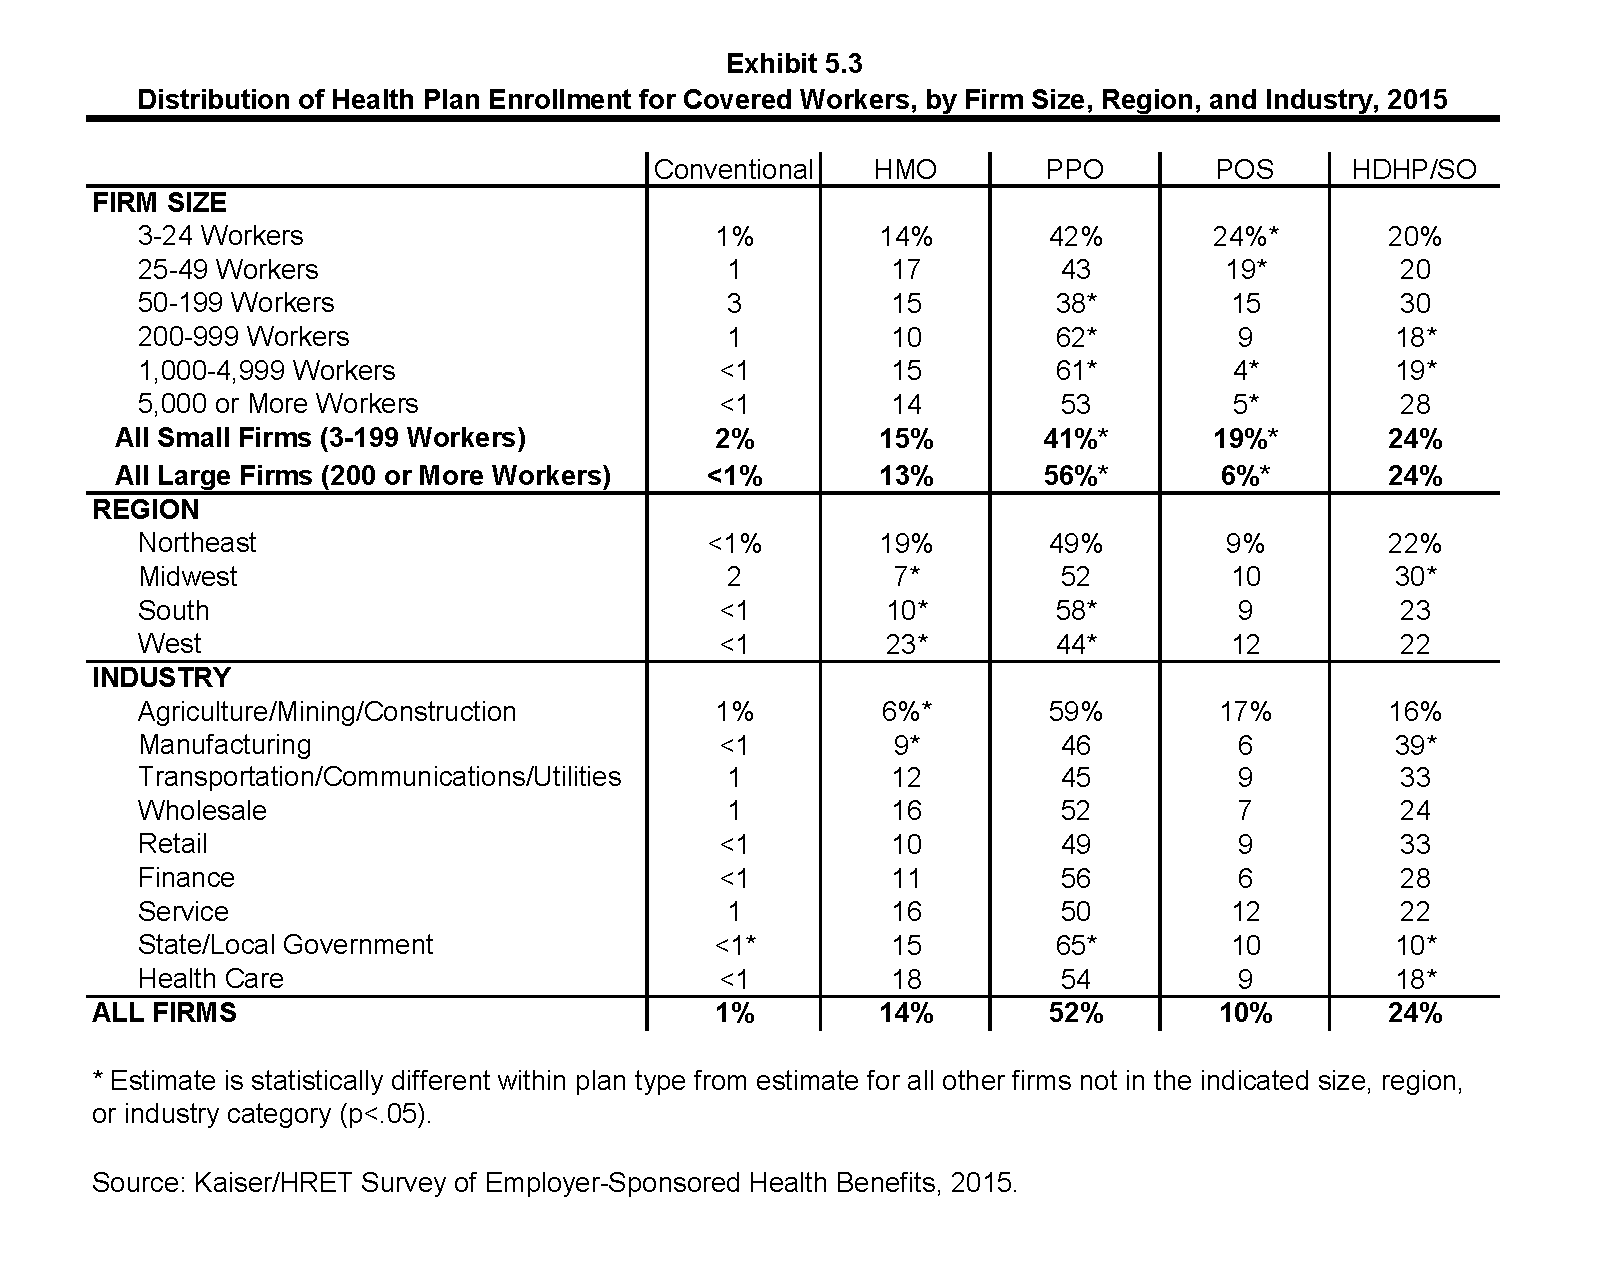
- Fifty-two percent of covered workers are enrolled in PPOs, followed by HDHP/SOs (24%), HMOs (14%), POS plans (10%), and conventional plans (1%) (Exhibit 5.1). More workers are enrolled in HDHP/SO plans than in HMOs in both small firms (3 to 199 workers) and large firms (Exhibit 5.2).
- The percentage of covered workers enrolled in HDHP/SOs in both large firms (200 or more workers) and small firms is similar to last year. Enrollment in HDHP/SOs increased significantly from 2009 to 2012 (Exhibit 5.1).
- Enrollment in HDHP/SOs is higher for covered workers employed at firms with many low-wage workers (at least 35% of workers earn $23,000 per year or less) than firms with fewer low-wage workers. Enrollment in HDHP/SOs is similar between large firms (200 or more workers) and small firms (Exhibit 5.2).
- Enrollment in HMOs is similar to 2014, but declined significantly from 3 years ago (16% in 2012) and 5 years ago (20% in 2009). PPO enrollment declined to just 52% after many years of growth or steady enrollment.
- Plan enrollment patterns vary by firm size. Workers in large firms (200 or more workers) are more likely than workers in small firms to enroll in PPOs (56% vs. 41%). Workers in small firms are more likely than workers in large firms to enroll in POS plans (19% vs. 6%) (Exhibit 5.2).
- Plan enrollment patterns also differ across regions.
- HMO enrollment is significantly higher in the West (23%) and significantly lower in the South (10%) and Midwest (7%) (Exhibit 5.3).
- Workers in the South (58%) are more likely to be enrolled in PPOs than workers in other regions; workers in the West (44%) are less likely to be enrolled in a PPO (Exhibit 5.3).
- Enrollment in HDHP/SOs is higher among workers in the Midwest (30%) than in all other regions (Exhibit 5.3).
- Plan enrollment patterns differ by industry as well.
- Covered workers in the state/local government industry (10%) and health care (18%) are significantly less likely to be enrolled in an HDHP/SO plan than covered workers in other industries (Exhibit 5.3).
Distribution of Health Plan Enrollment for Covered Workers, by Plan Type, 1988-2015
Distribution of Health Plan Enrollment for Covered Workers, by Plan Type and Firm Size, 2015
Distribution of Health Plan Enrollment for Covered Workers, by Firm Size, Region, and Industry, 2015
Section Six: Worker and Employer Contributions for Premiums
Premium contributions by covered workers average 18% for single coverage and 29% for family coverage.1 The average monthly worker contributions are $89 for single coverage ($1,071 annually) and $413 for family coverage ($4,955 annually). On average, covered workers contribute the same percentage of the premium in 2015 as they did in 2014 for both single and family coverage. There continue to be important differences by firm size and other firm characteristics: covered workers in small firms (3-199 workers) contribute a lower percentage of the premium for single coverage (15% vs. 19%) but a much higher percentage of the premium for family coverage than covered workers in large firms (200 or more employees) (36% vs. 26%).
- In 2015, covered workers on average contribute 18% of the premium for single coverage and 29% of the premium for family coverage, the same percentages reported in both 2014 and 2013 (Exhibit 6.1). These contributions have remained stable since 2010 for both single and family coverage.
- On average, workers with single coverage contribute $89 per month ($1,071 annually), and workers with family coverage contribute $413 per month ($4,955 annually) towards their health insurance premiums. Both are similar to the amounts reported in 2014 (Exhibit 6.2), (Exhibit 6.3), and (Exhibit 6.4).
- The average worker contribution in HDHP/SOs is lower than the overall average worker contributions for single coverage ($868 vs. $1,071) and family coverage ($3,917 vs. $4,955) (Exhibit 6.5).
- In addition to differences between plan types, there are differences in worker contributions by type of firm. As in previous years, workers in small firms (3-199 workers) contribute a lower amount annually for single coverage than workers in large firms (200 or more workers) ($899 vs. $1,146). In contrast, workers in small firms with family coverage contribute significantly more annually than workers in large firms ($5,904 vs. $4,549) (Exhibit 6.8).
- The average family contribution for covered workers enrolled in small firms is less than the average family contribution at large firms within each plan type (Exhibit 6.10).
- The average worker contribution for single coverage is similar to last year for both small firms (3-199 workers) and large firms (Exhibit 6.6) and (Exhibit 6.7).
Variation in Worker Contributions to the Premium
- There is a great deal of variation in worker contributions to premiums.
- Twenty-nine percent of covered workers contribute $1,500 or more annually (140% or more of the average worker contribution) for single coverage, while 15% of covered workers have an annual worker contribution of less than $643 (less than 60% of the average worker contribution) (Exhibit 6.15).
- For family coverage, 21% of covered workers contribute $6,936 or more annually (140% or more of the average worker contribution), while 20% of covered workers have an annual worker contribution of less than $2,973 (less than 60% of the average worker contribution) (Exhibit 6.15).
- The majority of covered workers are employed by a firm that contributes at least half of the premium for single and family coverage.
- Sixteen percent of covered workers with single coverage and 6% of covered workers with family coverage work for a firm that pays 100% of the premium (Exhibit 6.16).
- Covered workers in small firms (3-199 workers) are more likely to work for a firm that pays 100% of the premium for single coverage than workers in large firms (200 or more workers). Thirty-five percent of covered workers in small firms have an employer that pays the full premium for single coverage, compared to 7% of covered workers in large firms (Exhibit 6.17). For family coverage, 16% of covered workers in small firms have an employer that pays the full premium, compared to 1% of covered workers in large firms (Exhibit 6.18).
- Three percent of covered workers in small firms (3-199 workers) and 2% of covered workers in large firms (200 or more workers) contribute more than 50% of the premium for single coverage (Exhibit 6.17). For family coverage, 32% of covered workers in small firms work in a firm where they must contribute more than 50% of the premium, compared to 8% of covered workers in large firms (Exhibit 6.18).
Differences by Firm Characteristics
- The percentage of the premium paid by covered workers varies by several firm characteristics.
- For family coverage, covered workers in firms with many lower-wage workers (35% or more earn $23,000 or less annually) contribute a greater percentage of the premium than those in firms with fewer lower-wage workers (41% vs. 28%) (Exhibit 6.21). Covered workers in firms with many higher-wage workers (35% or more earn $58,000 or more a year) contribute less on average than those in firms with a lower proportion of higher-wage workers (26% vs. 33%).
- Twenty-nine percent of covered workers at firms with many lower-wage workers pay more than 50% of the premium for family coverage, in contrast to 14% at firms with fewer lower-wage workers (Exhibit 6.19).
- Looking at dollar amounts, covered workers in firms with many lower-wage workers (35% or more earn $23,000 or less annually) on average contribute $6,382 for family coverage versus $4,829 for covered workers in firms with fewer lower-wage workers (Exhibit 6.13).
- Covered workers with family coverage in firms that have at least some union workers contribute a significantly lower percentage of the premium than those in firms without any unionized workers (23% vs. 32%) (Exhibit 6.21).
- For workers with family coverage in large firms (200 or more workers), the average percentage contribution for workers in firms that are partially or completely self-funded is lower than the average percentage contributions for workers in firms that are fully insured (25% vs. 32%) (Exhibit 6.21). 2
- Covered workers in private for profit firms contribute a significantly higher percentage of the premium for single coverage (19%) than do workers in private not-for-profit firms (16%) and public organizations such as state or local governments (12%) (Exhibit 6.20).
Contribution Approaches
- Among firms offering health benefits with fewer than 20 employees, 12% contribute different dollar amounts toward premiums for different employees (Exhibit 6.26). Employers may contribute different amounts to different employees based on a variety of reasons, including workers’ age, smoking status, seniority, job title or location.
- Among small firms (3-199 workers) offering health benefits, 45% indicate that they contribute the same dollar amount for single coverage as family coverage. In contrast, over a third (35%) of small firms report that they contribute a higher dollar amount for workers enrolled in family coverage than in single coverage (Exhibit 6.27).
Changes over Time
- The amount that workers contribute to single coverage premiums has increased 76% since 2005 and 19% since 2010. Covered workers’ contributions to family coverage have increased 83% since 2005 and 24% since 2010. Over the last five years, the average worker contributions for single and family coverage have risen at a similar rate.
- Over the last ten years, the average employer contribution to both single coverage and family coverage premiums has risen faster than the average employee contribution.
- Over the last ten years, the average worker contribution for family coverage has risen at a similar rate for large firms (200 or more workers) and small firms (83% and 86% respectively).
- The average worker contribution for family coverage has risen at a similar rate for firms with many lower-wage workers (35% or more earn $23,000 or less annually) and those with fewer lower-wage workers over the past ten years (86% and 80%, respectively).
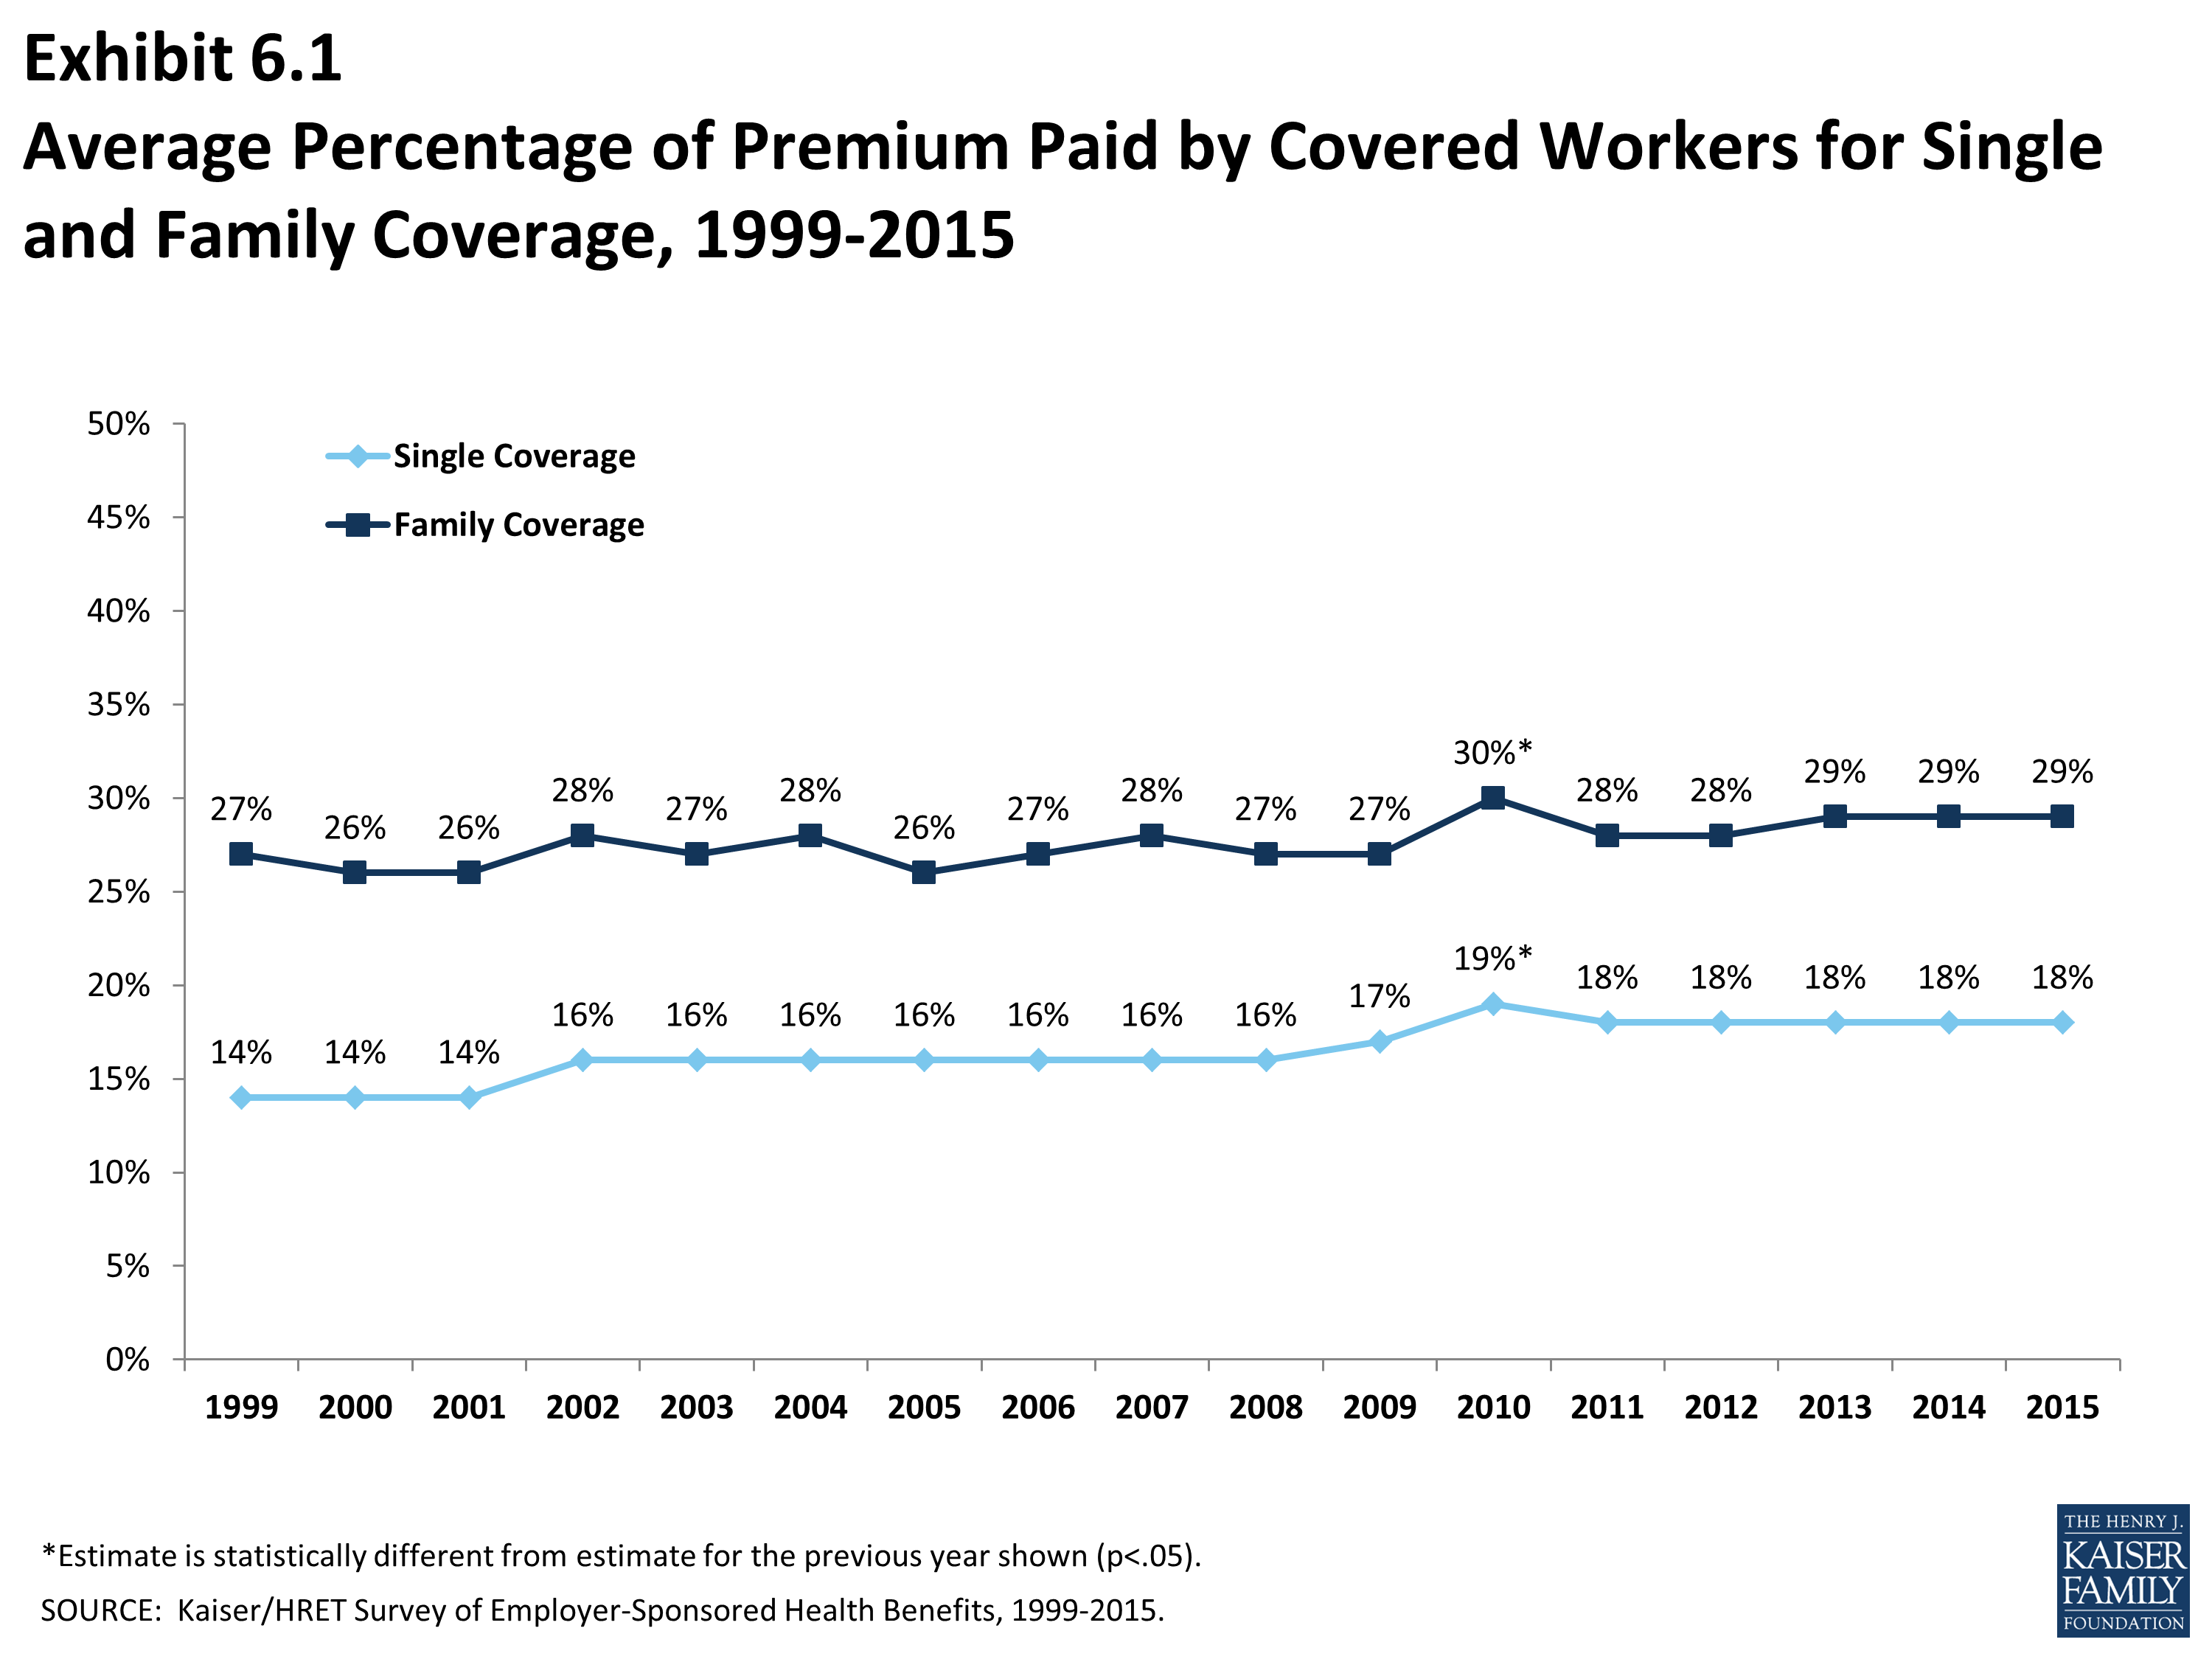
Average Percentage of Premium Paid by Covered Workers for Single and Family Coverage, 1999-2015
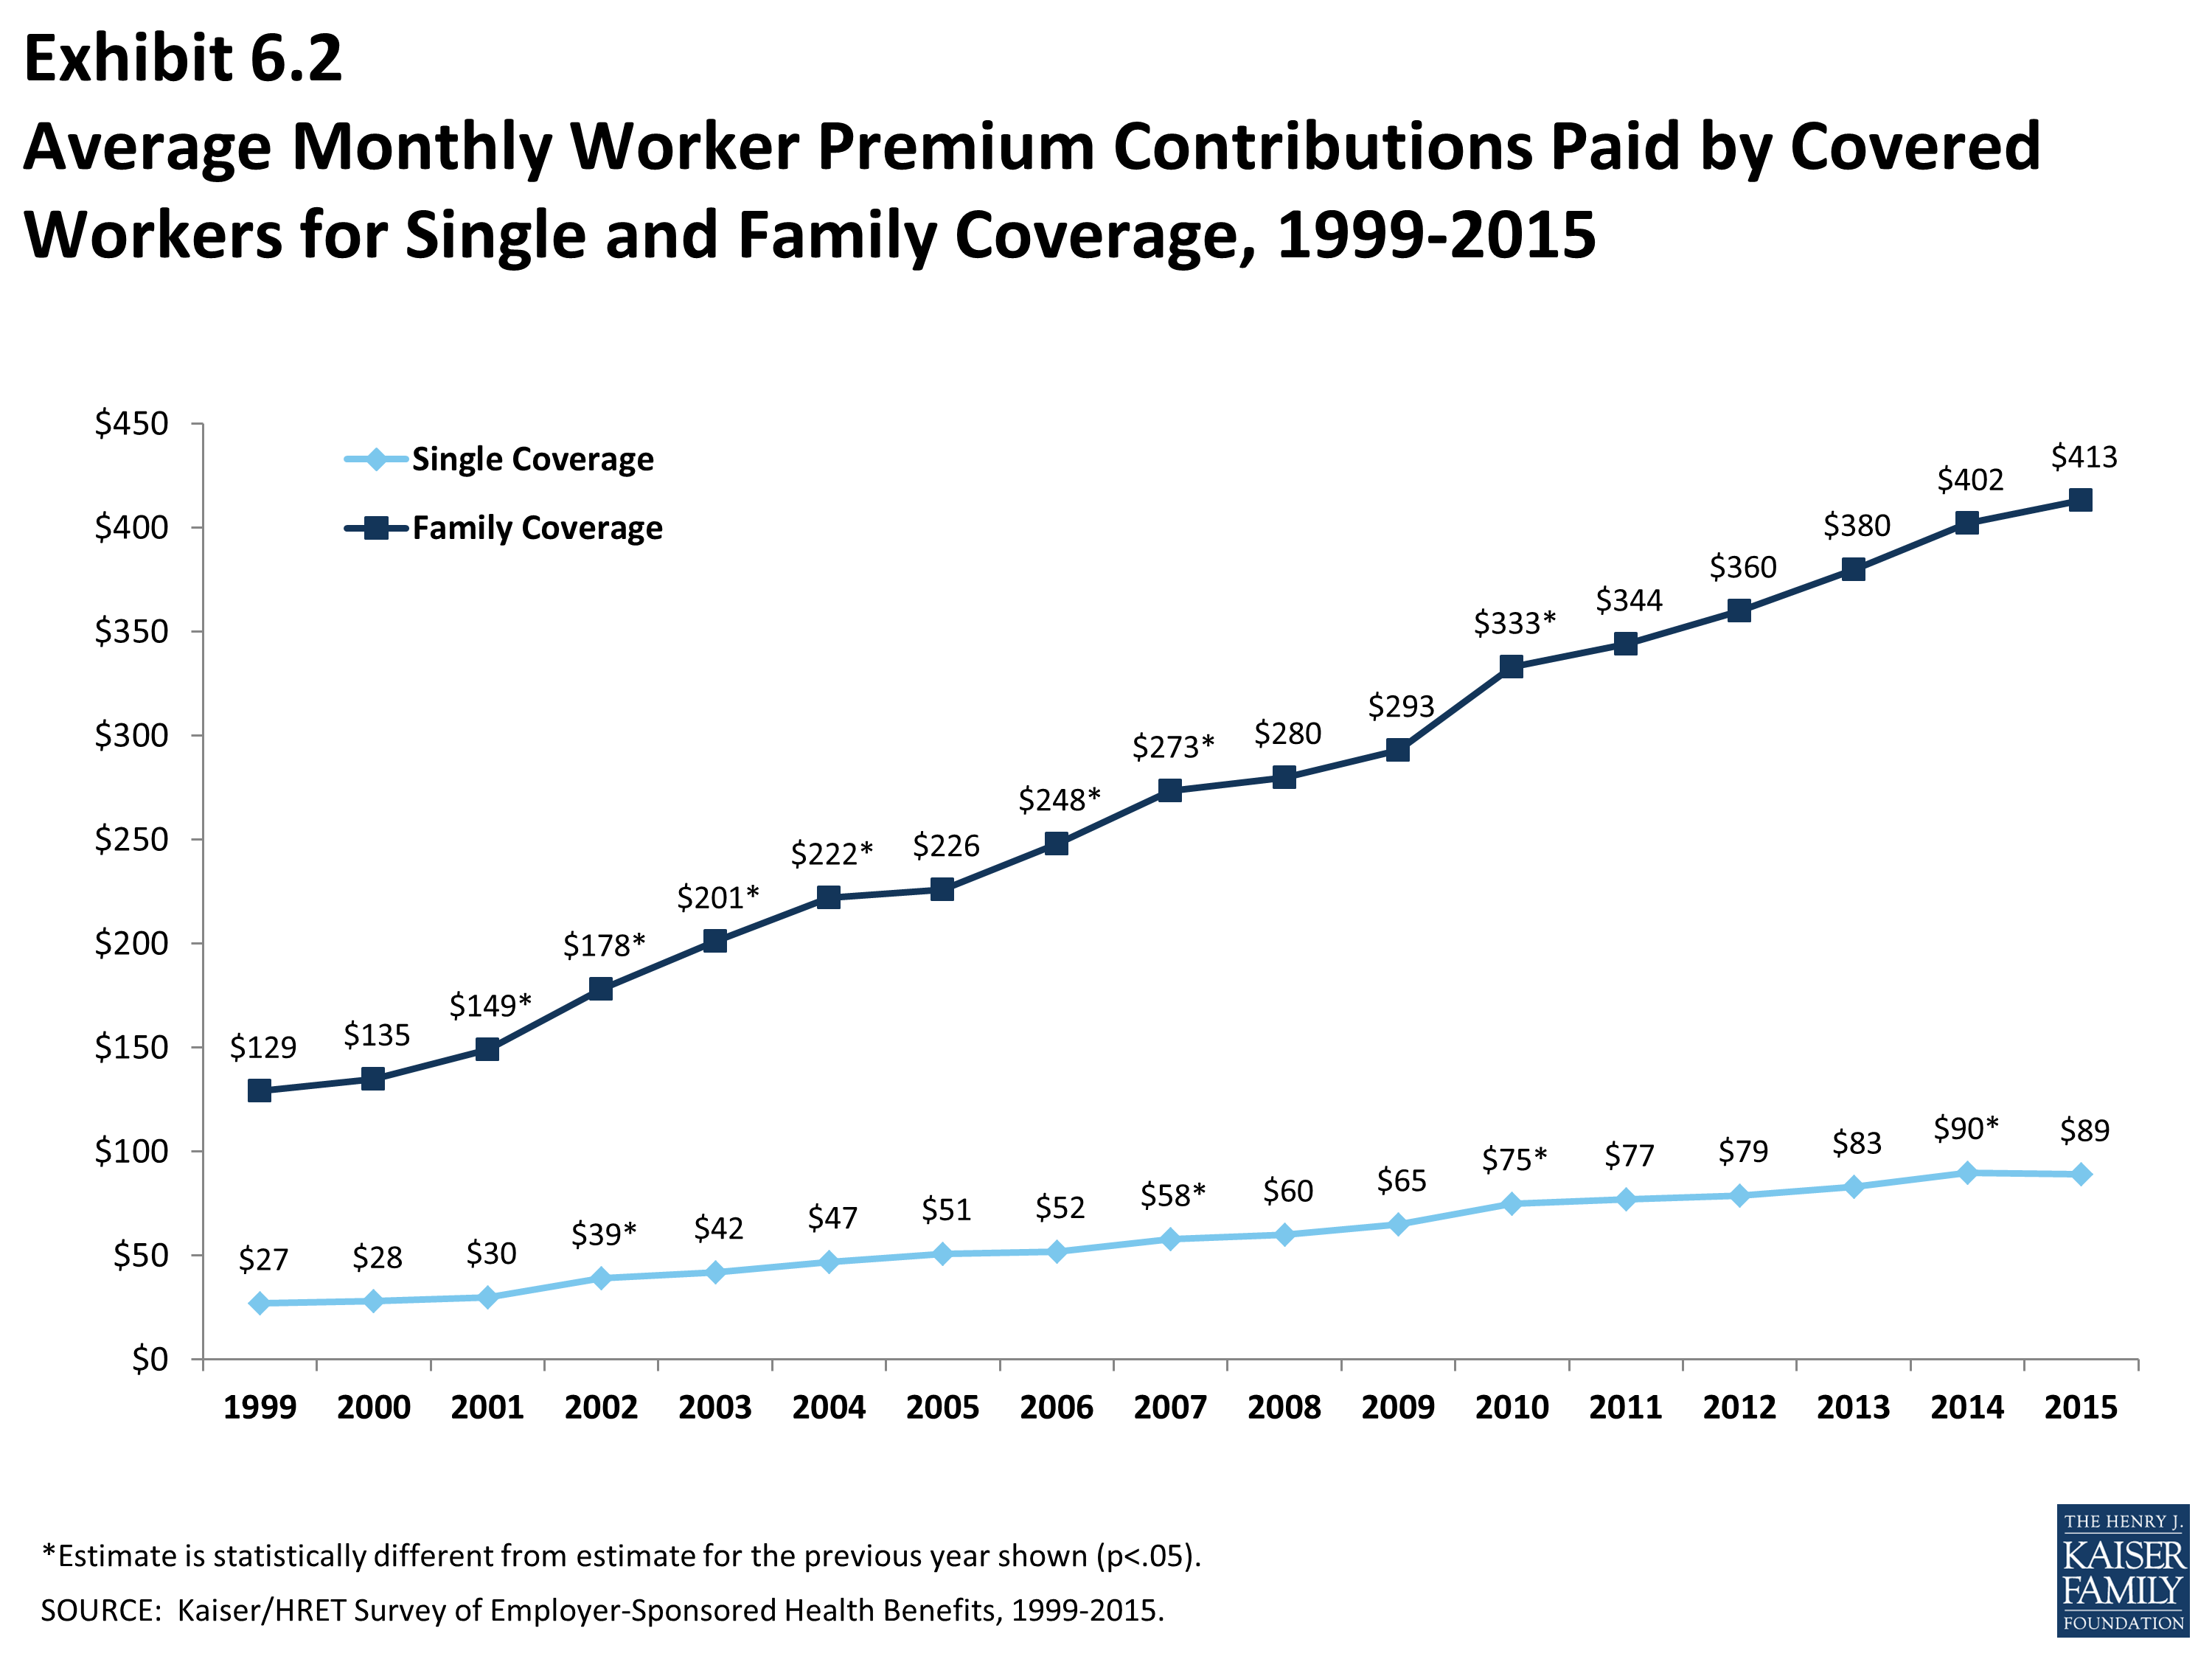
Average Monthly Worker Premium Contributions Paid by Covered Workers for Single and Family Coverage, 1999-2015
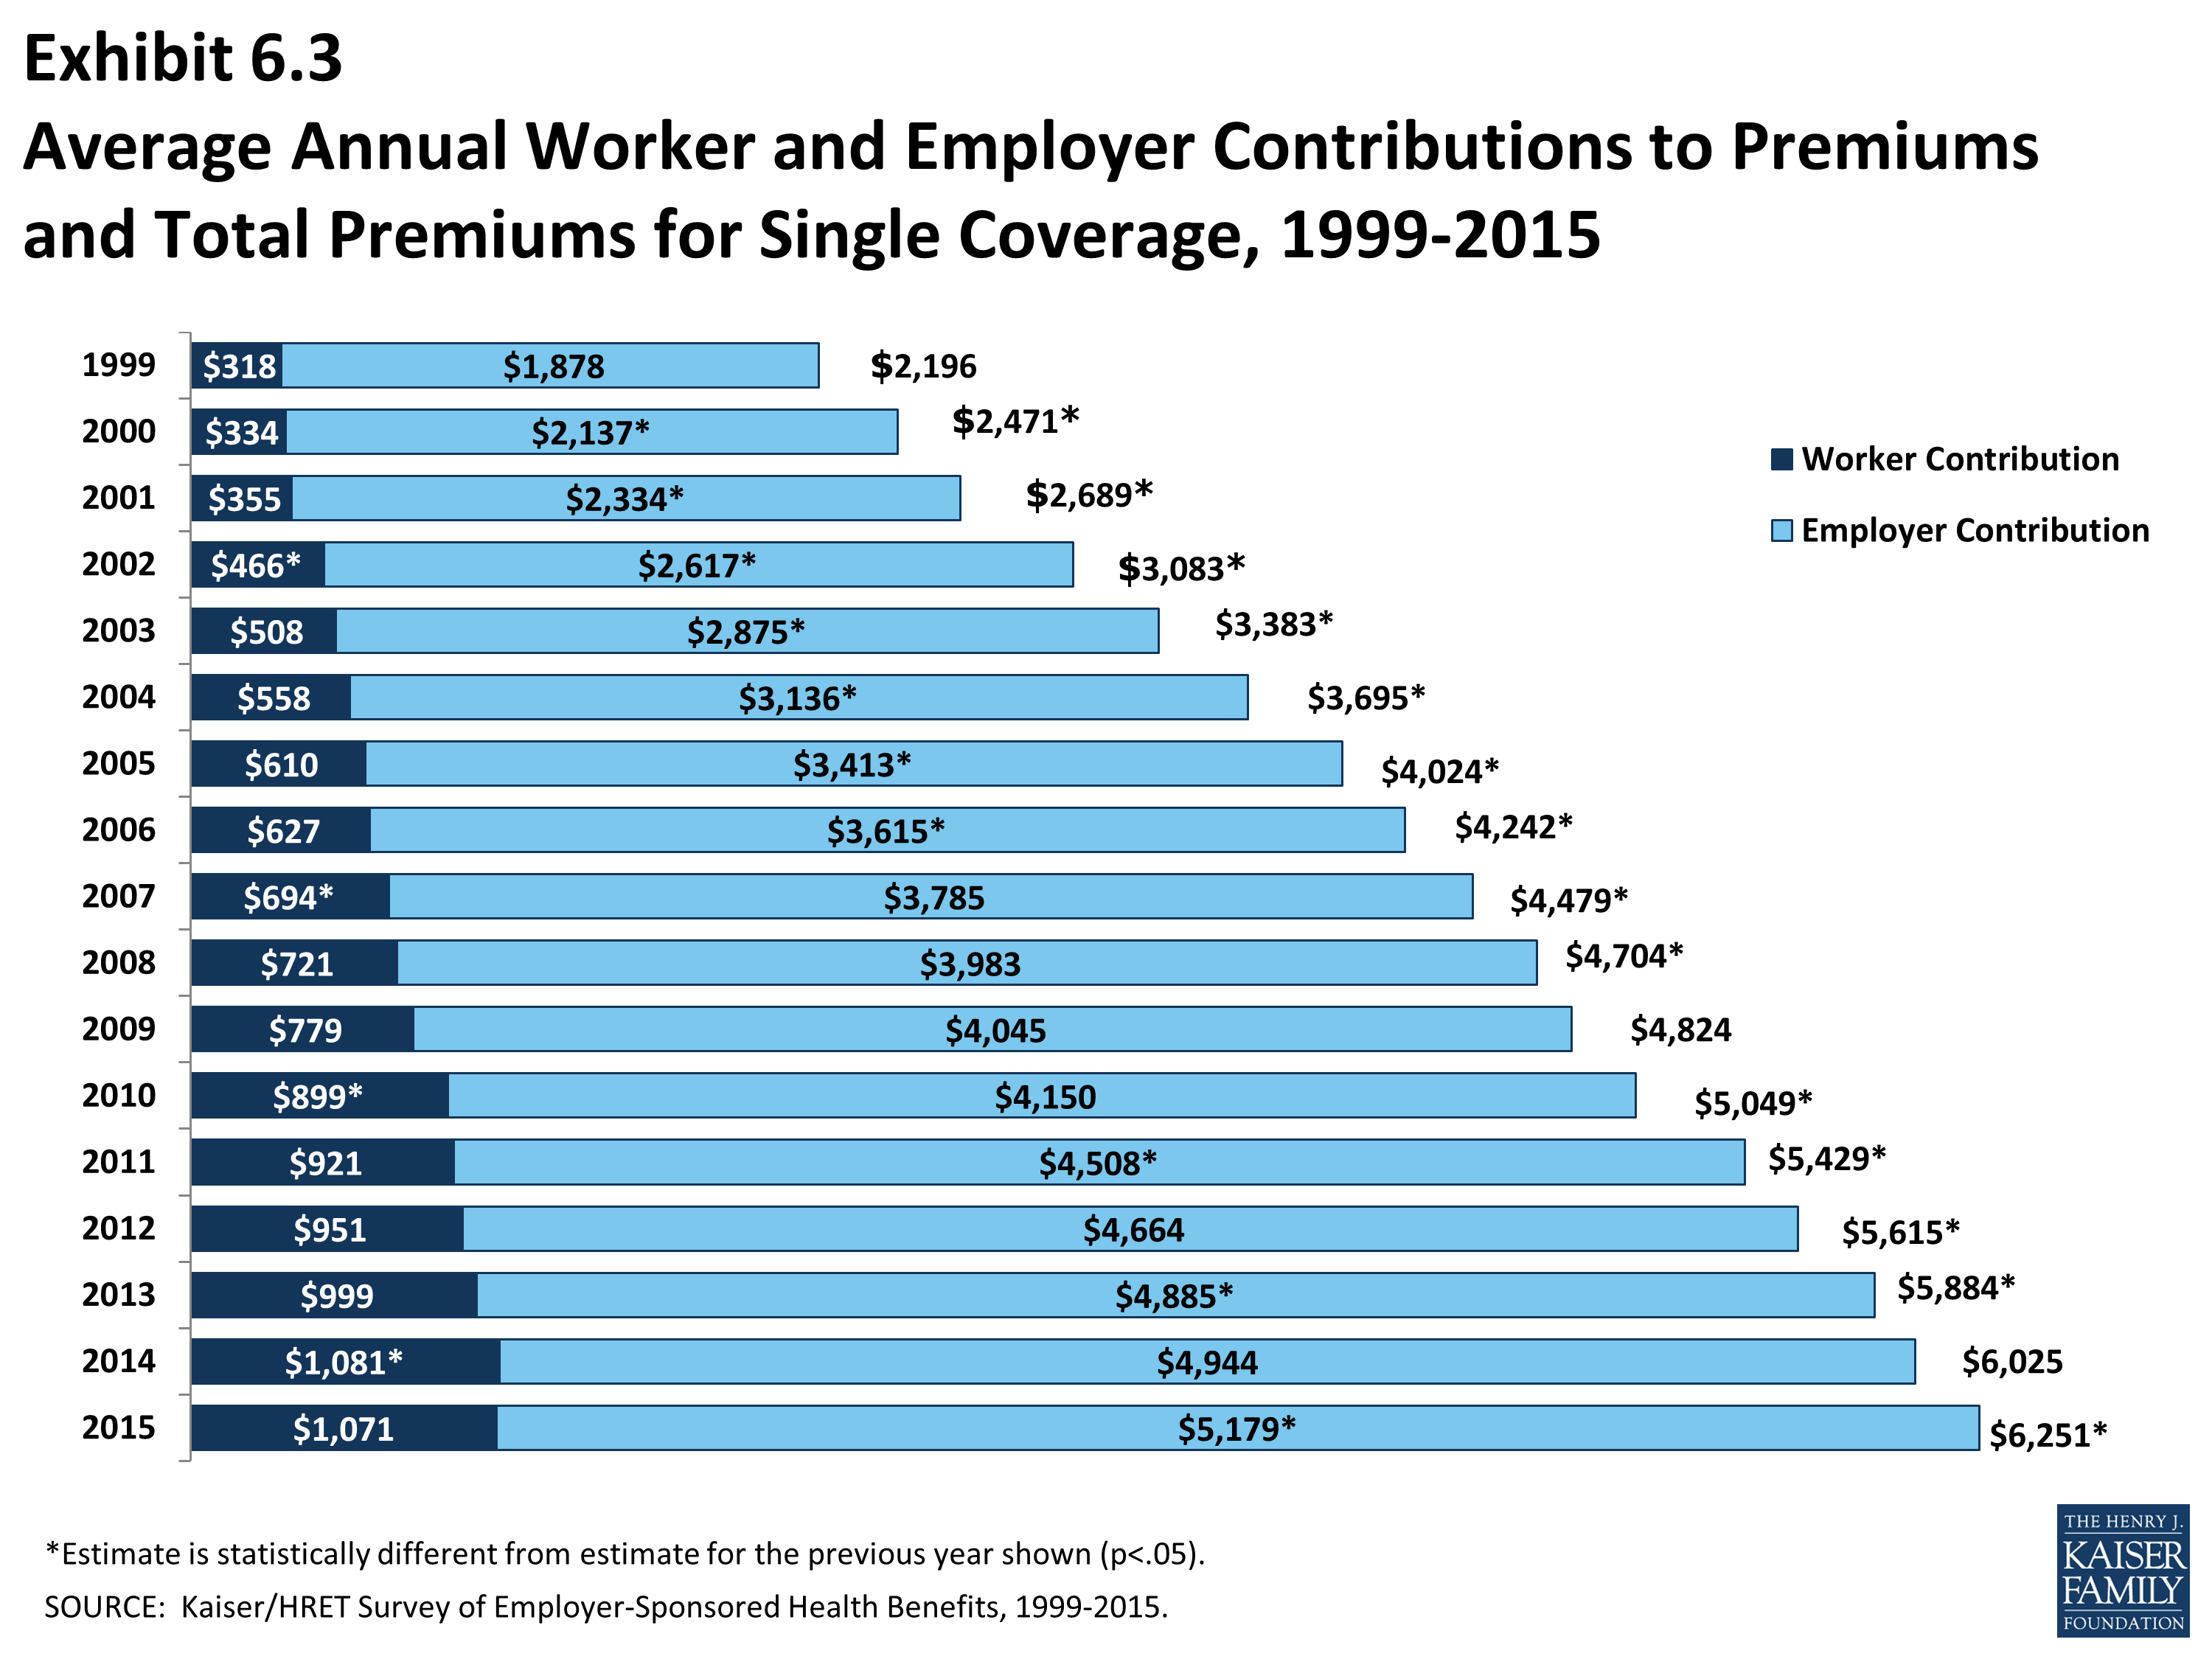
Average Annual Worker and Employer Contributions to Premiums and Total Premiums for Single Coverage, 1999-2015
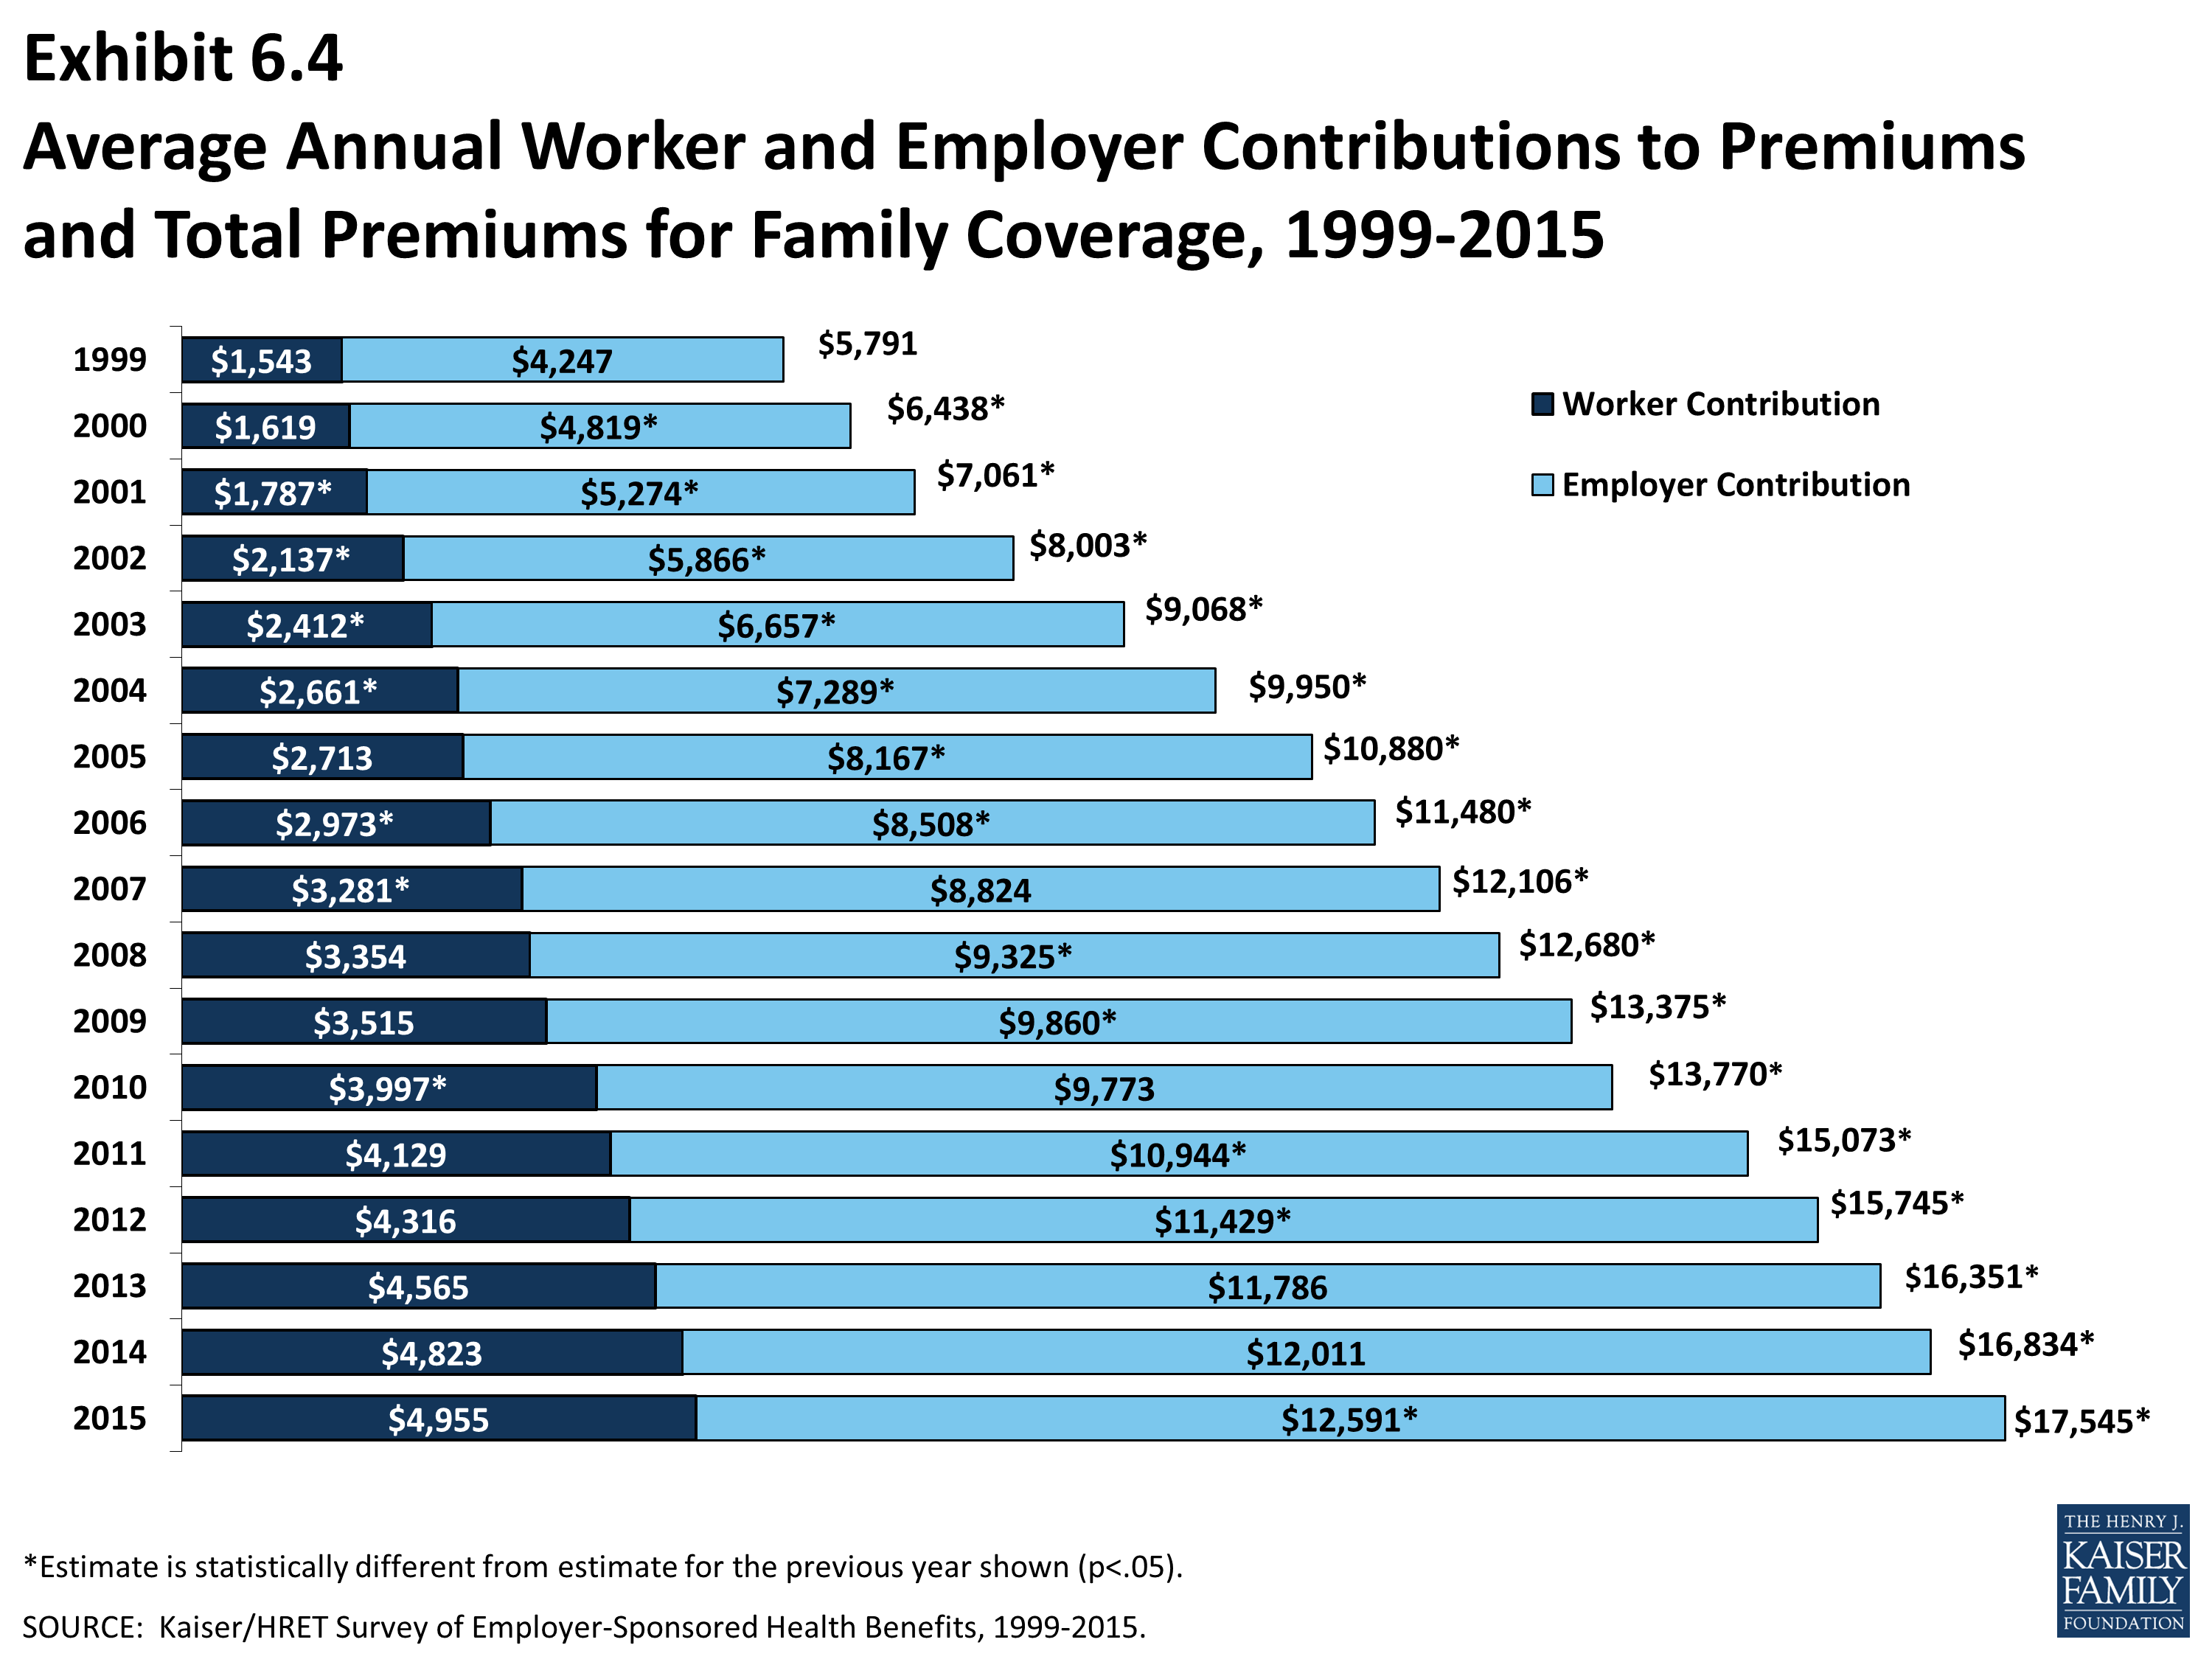
Average Annual Worker and Employer Contributions to Premiums and Total Premiums for Family Coverage, 1999-2015
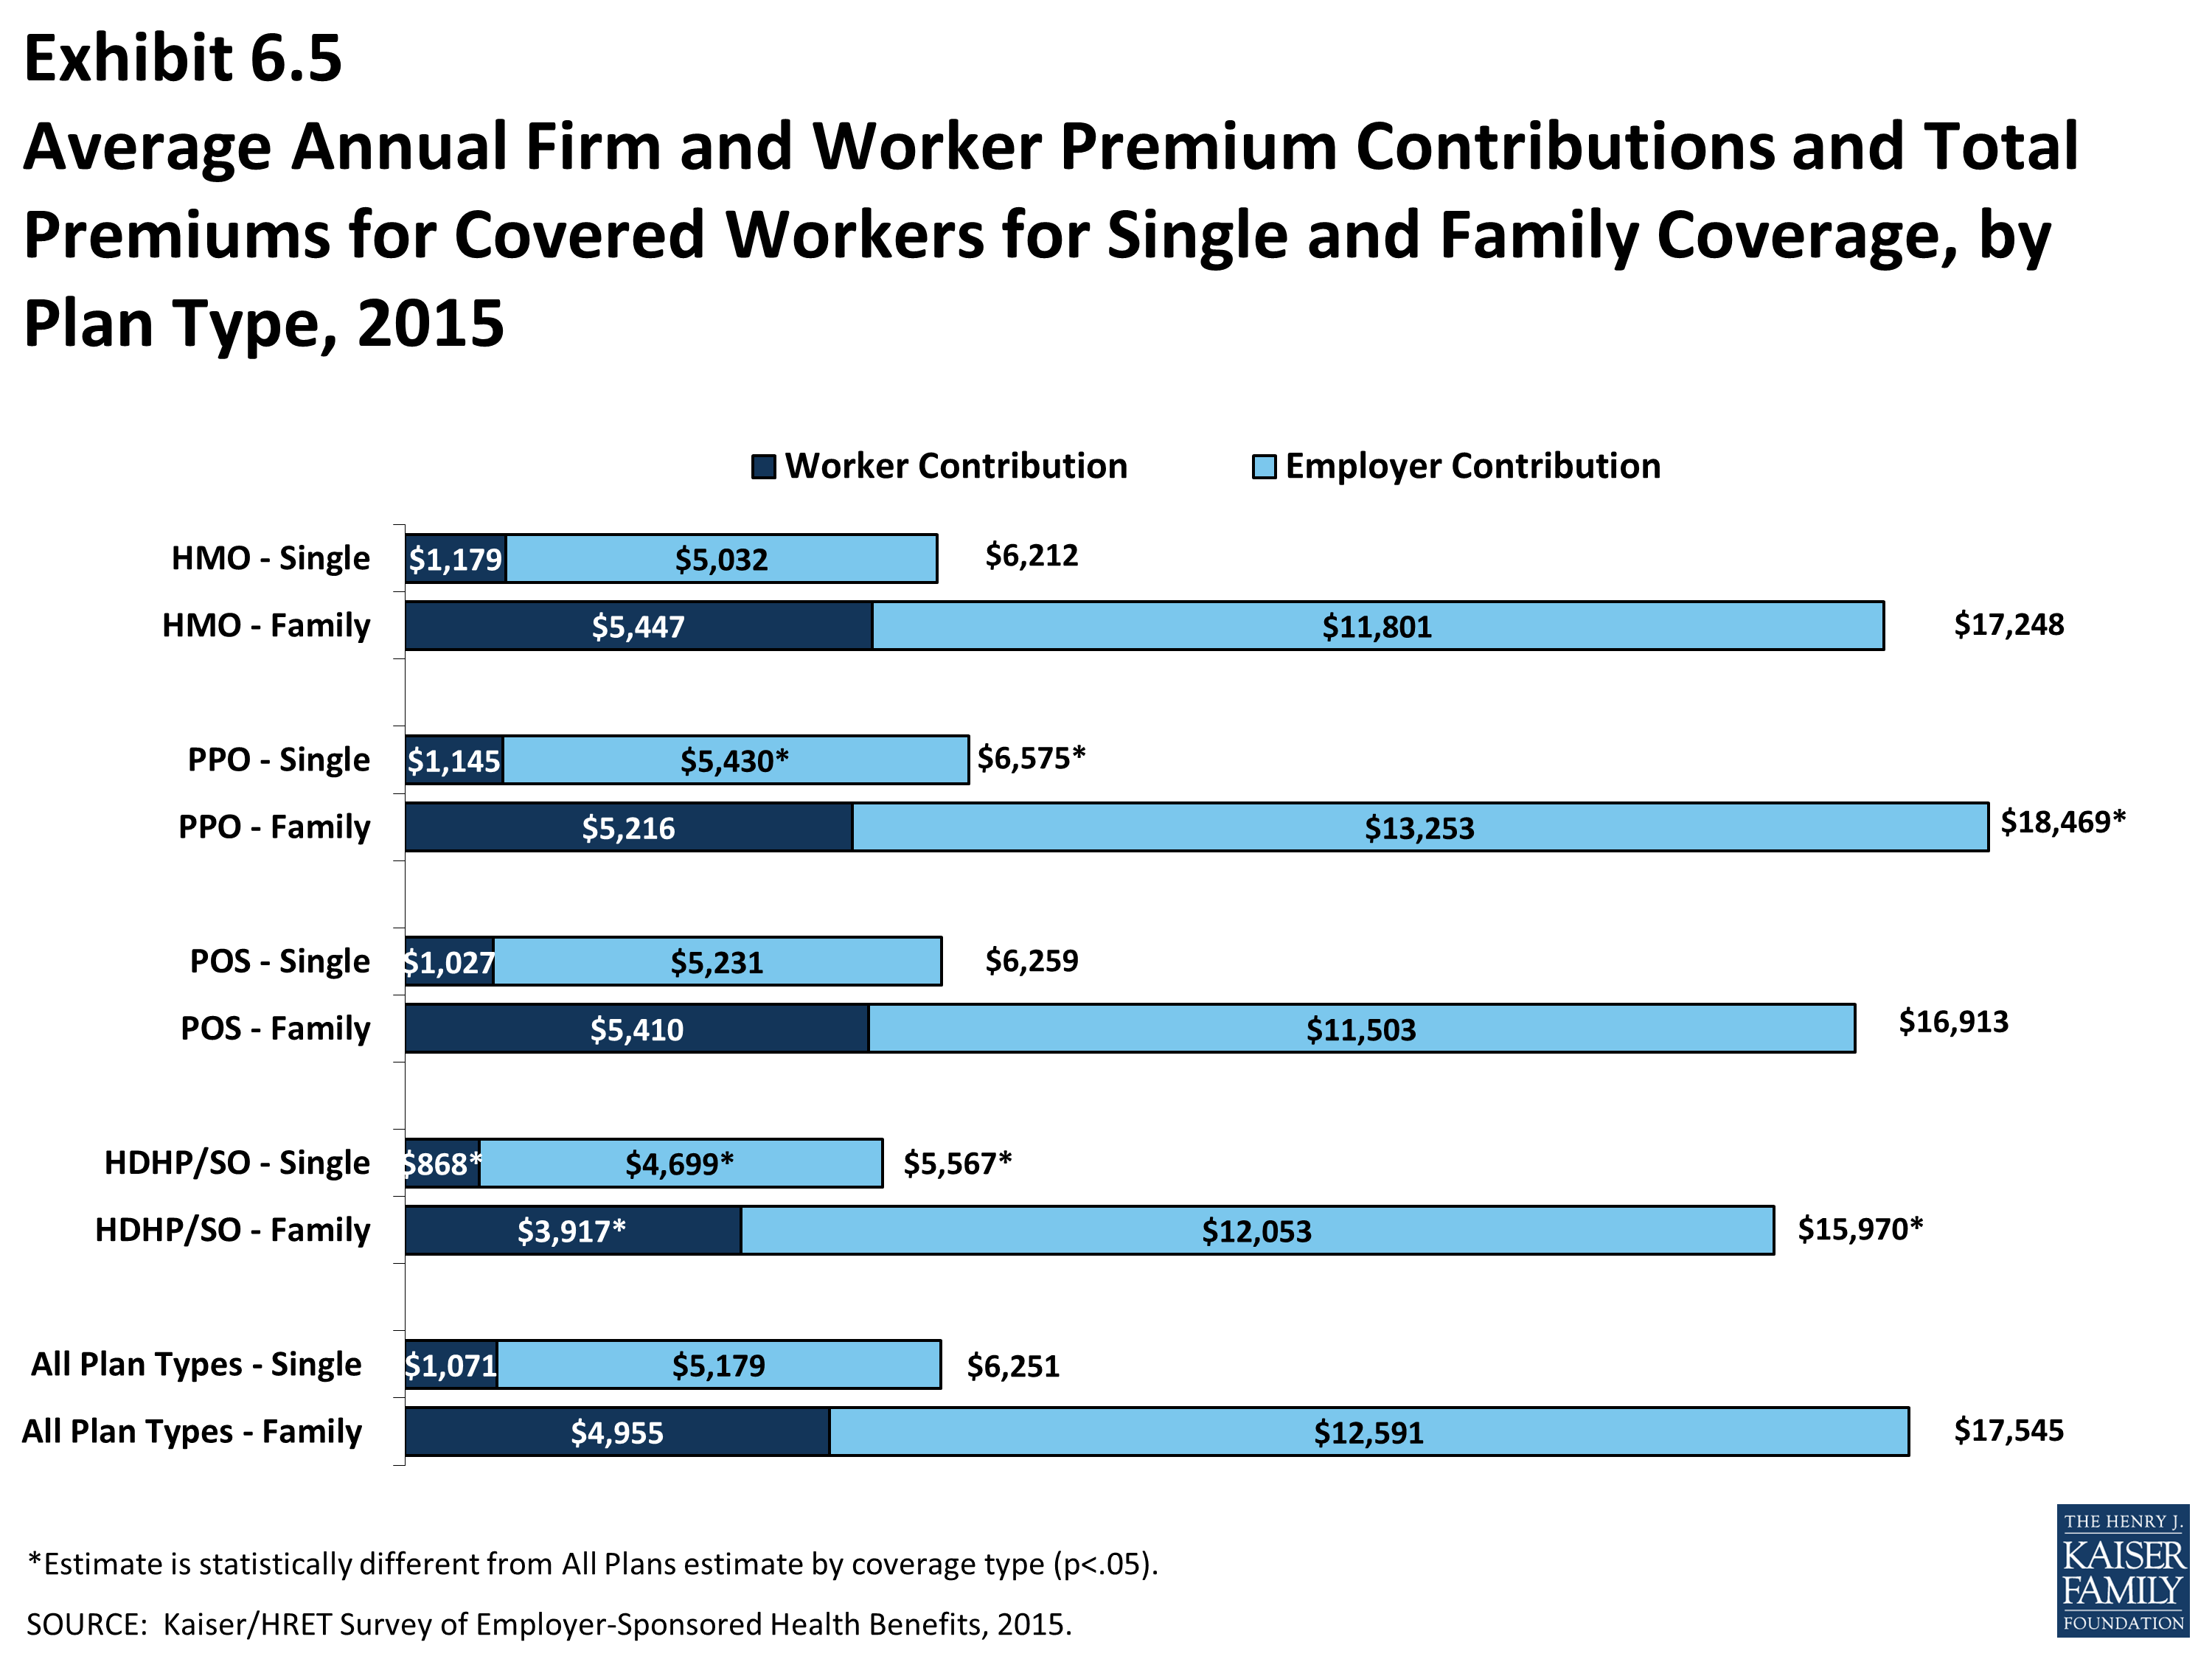
Average Annual Firm and Worker Premium Contributions and Total Premiums for Covered Workers for Single and Family Coverage, by Plan Type, 2015
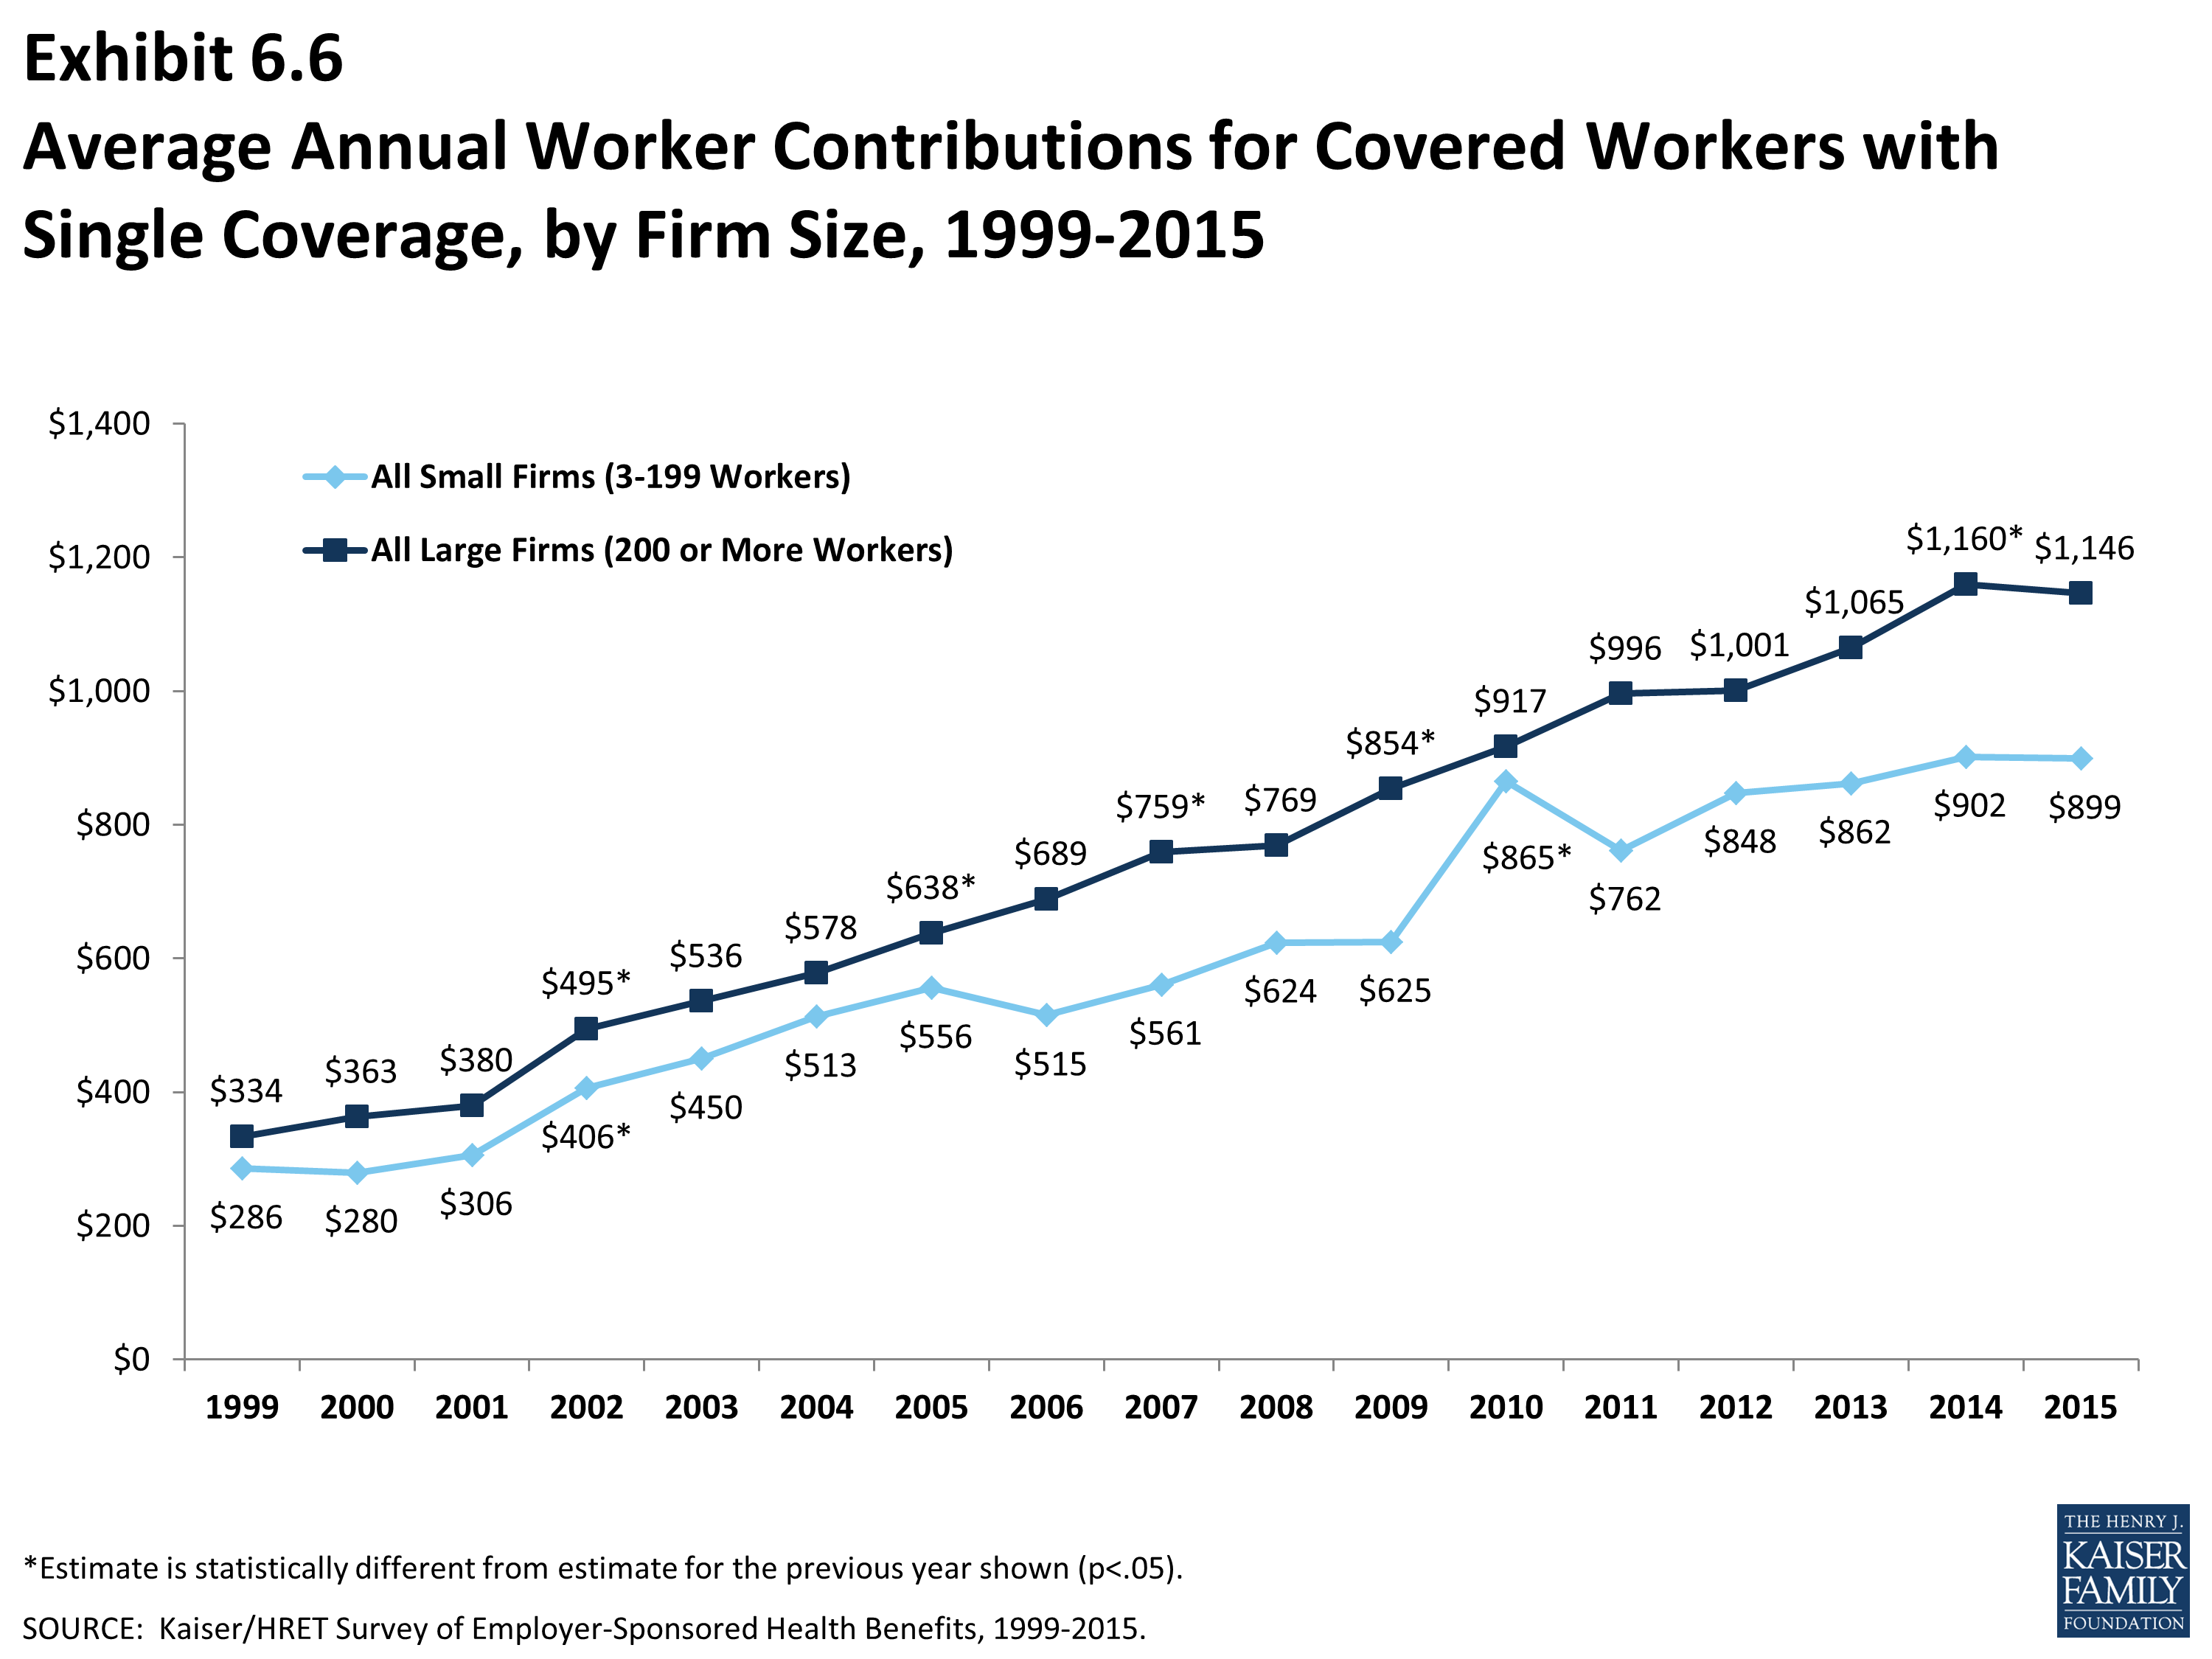
Average Annual Worker Contributions for Covered Workers with Single Coverage, by Firm Size, 1999-2015
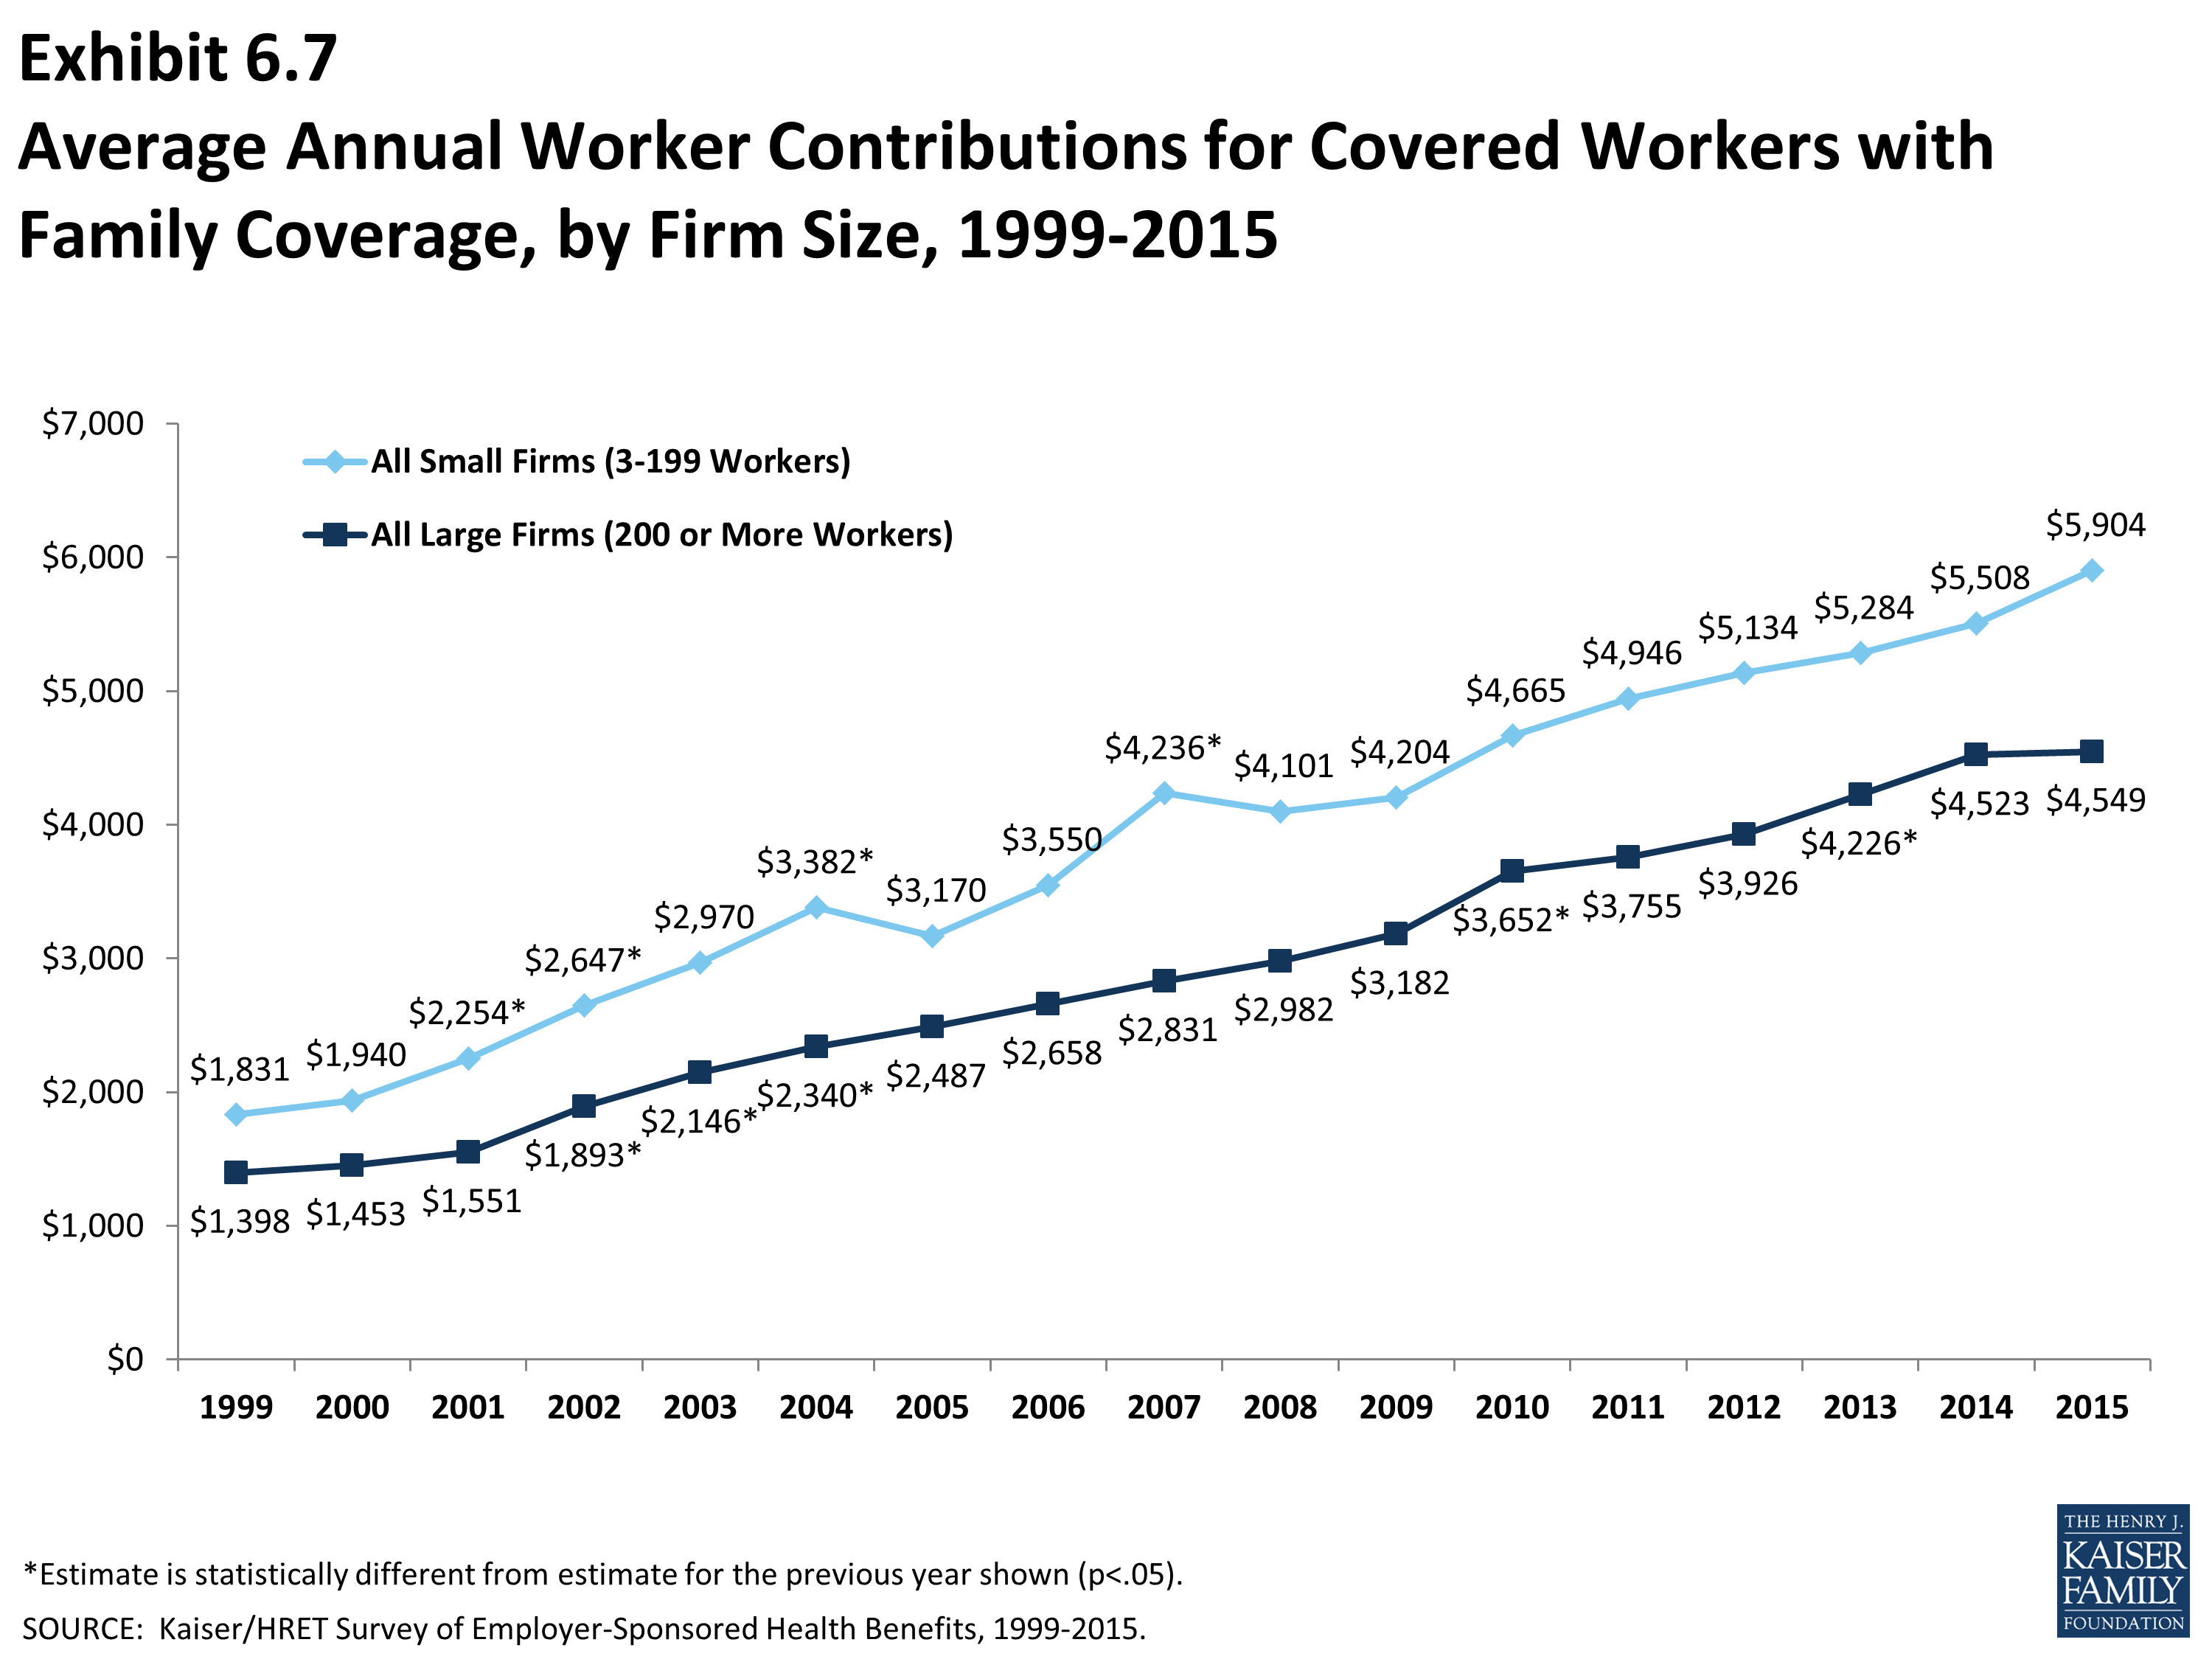
Average Annual Worker Contributions for Covered Workers with Family Coverage, by Firm Size, 1999-2015
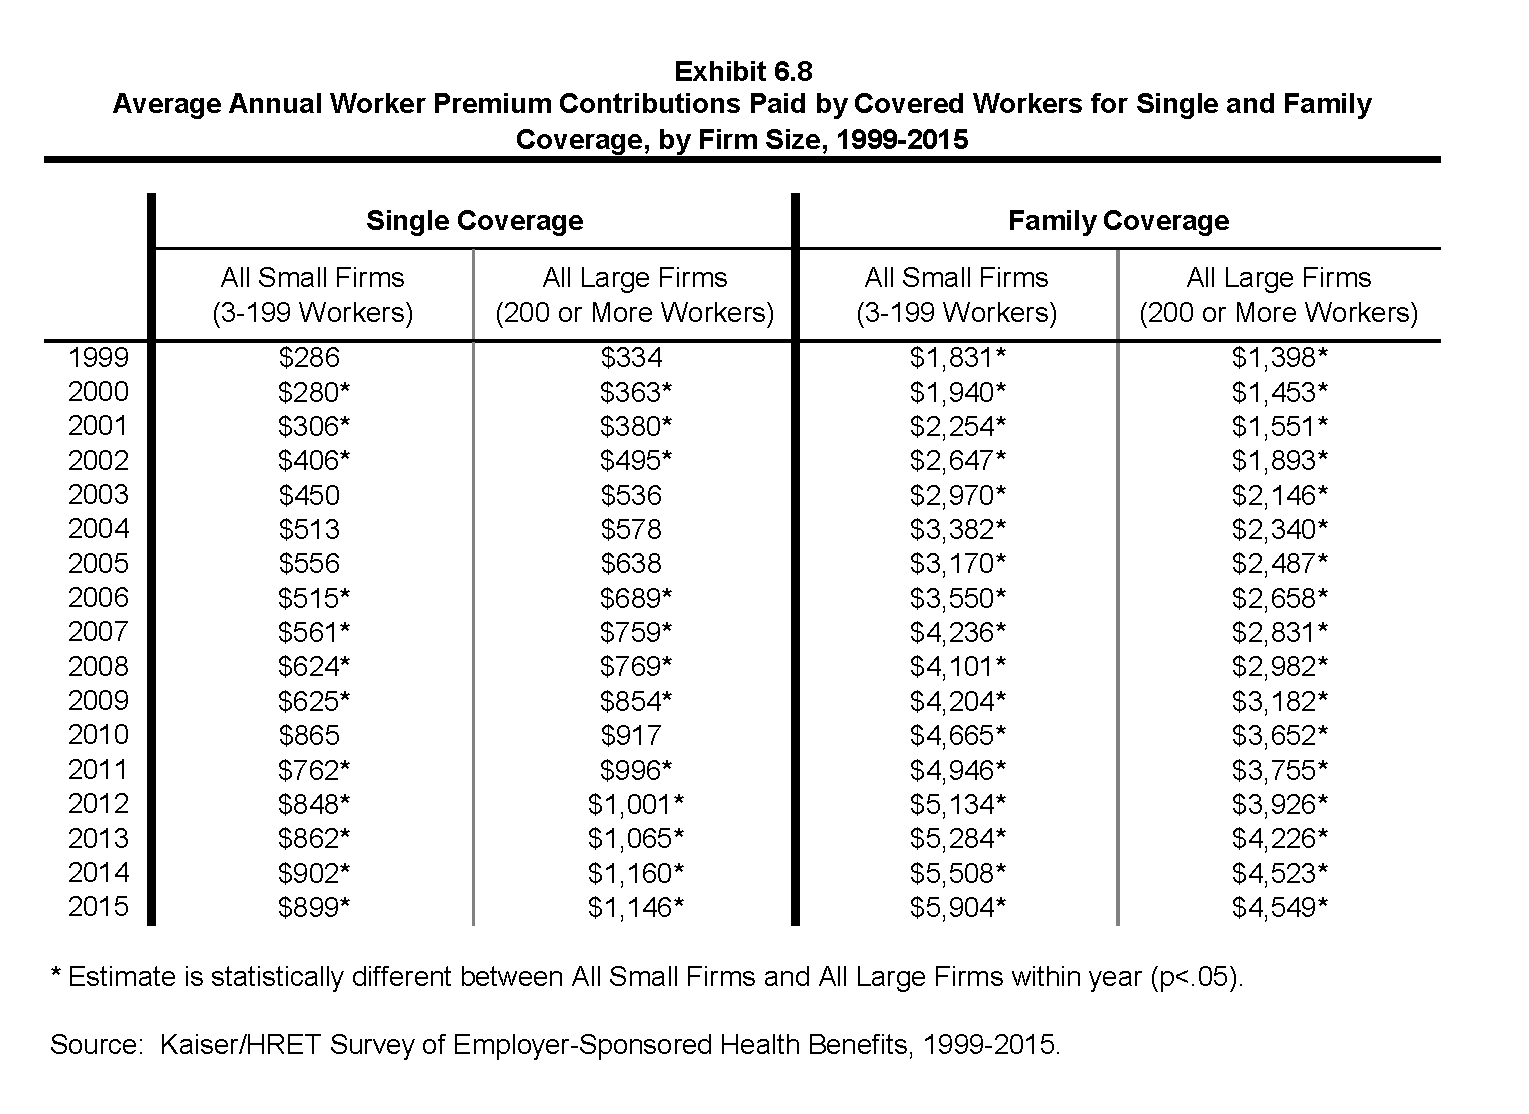
Average Annual Worker Premium Contributions Paid by Covered Workers for Single and Family Coverage, by Firm Size, 1999-2015
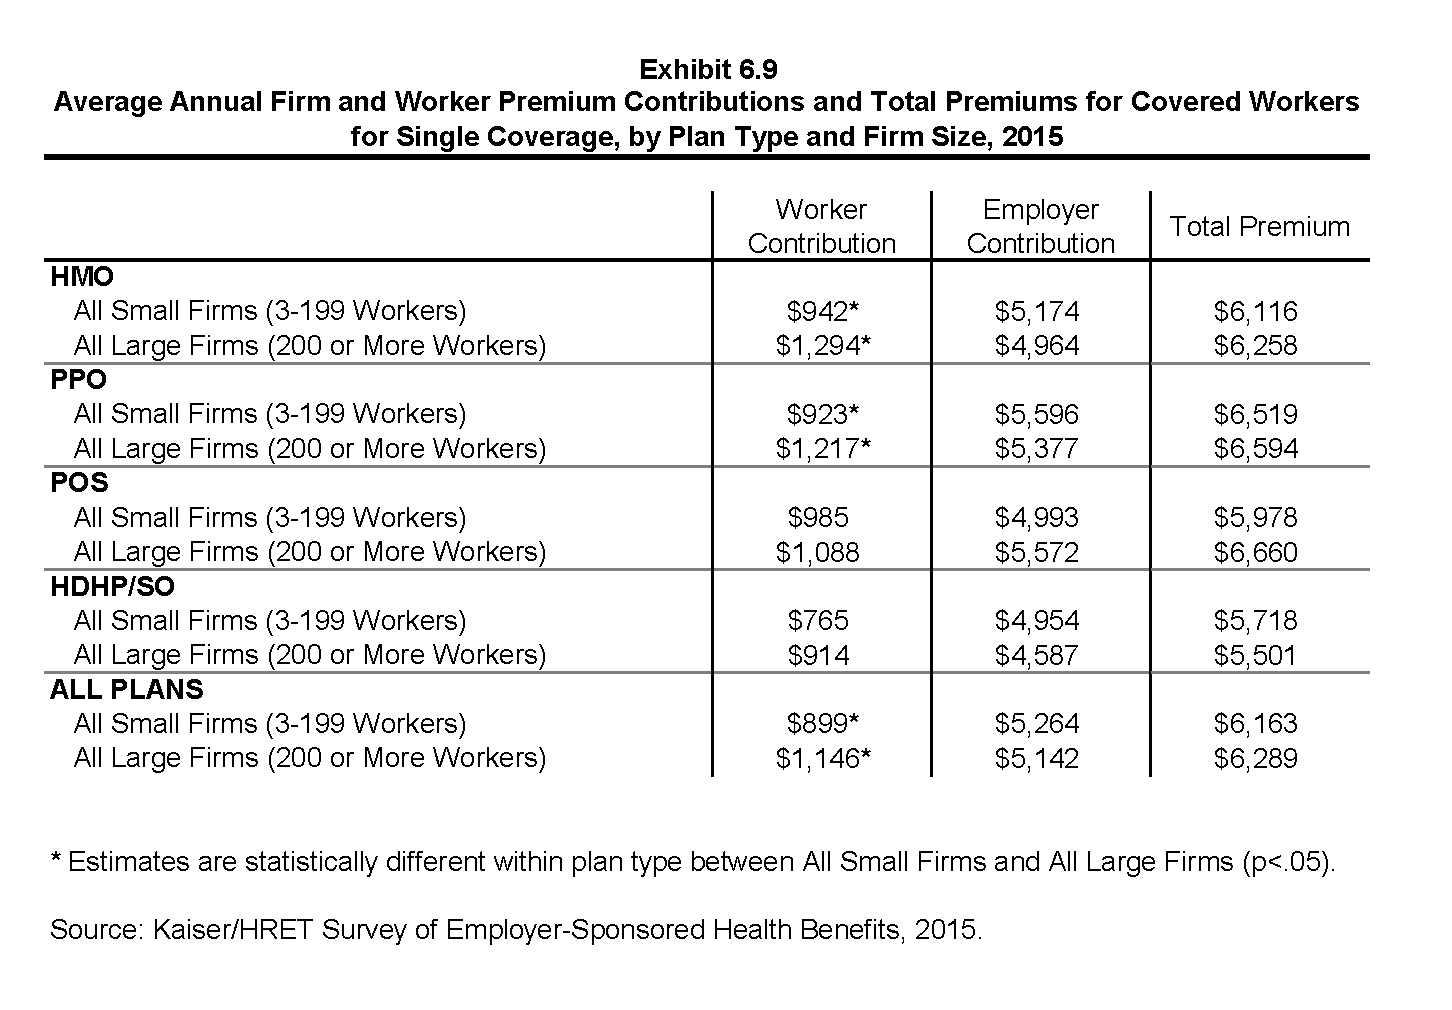
Average Annual Firm and Worker Premium Contributions and Total Premiums for Covered Workers for Single Coverage, by Plan Type and Firm Size, 2015
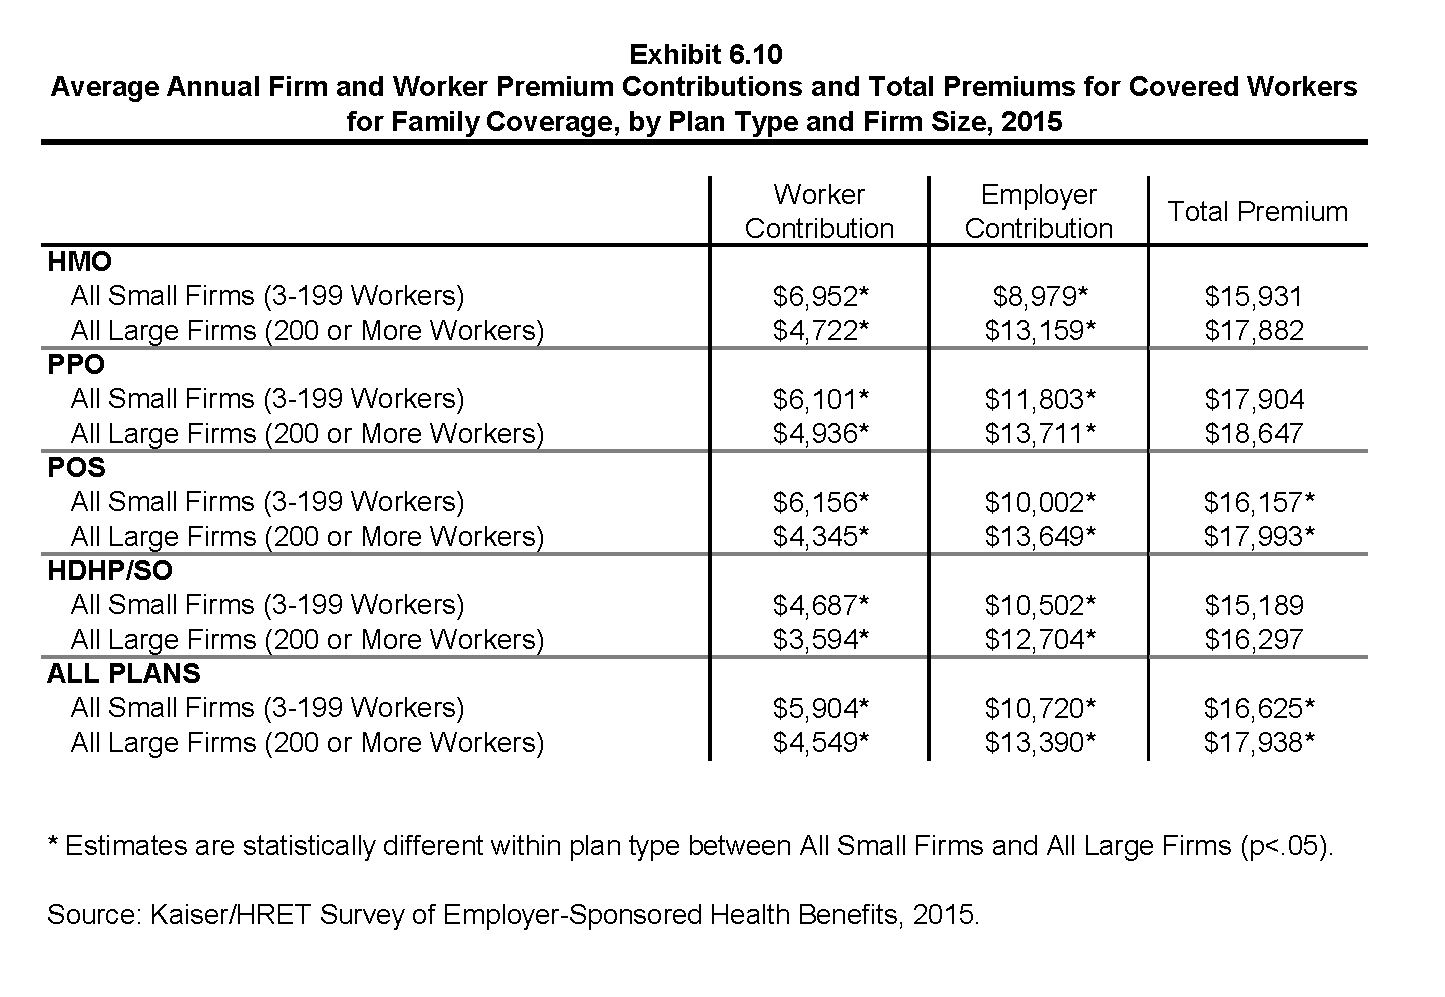
Average Annual Firm and Worker Premium Contributions and Total Premiums for Covered Workers for Family Coverage, by Plan Type and Firm Size, 2015
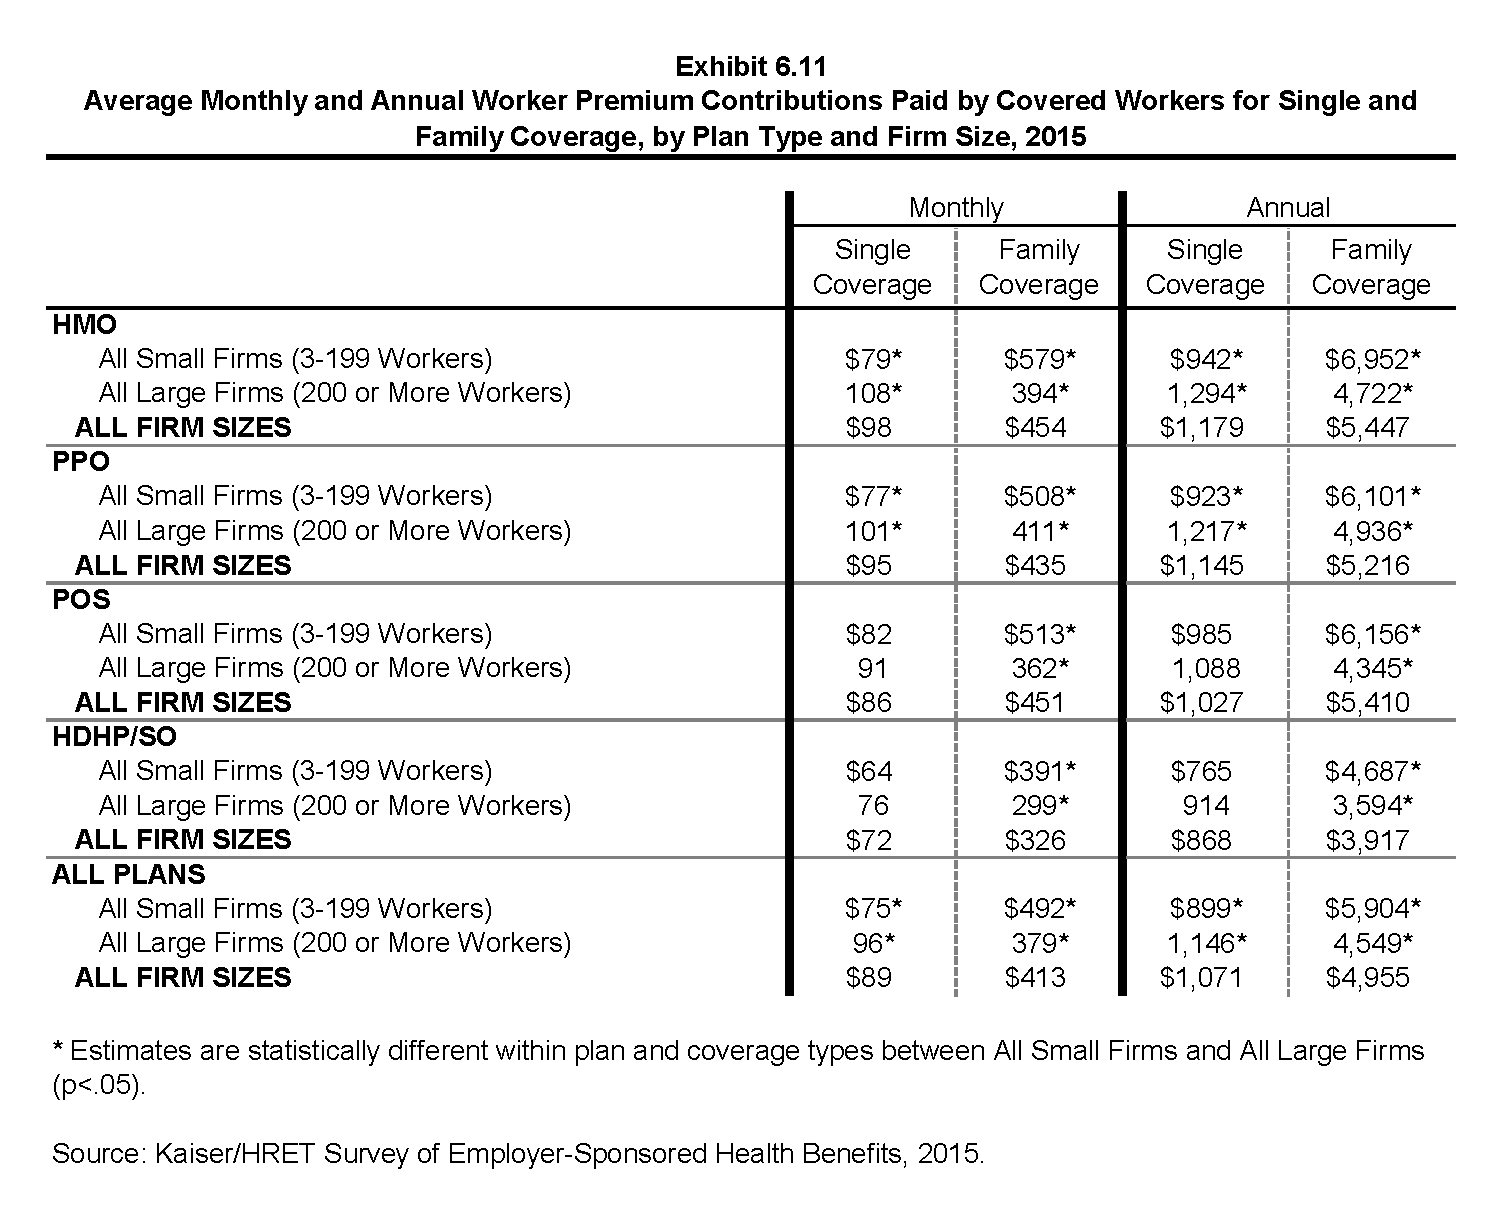
Average Monthly and Annual Worker Premium Contributions Paid by Covered Workers for Single and Family Coverage, by Plan Type and Firm Size, 2015
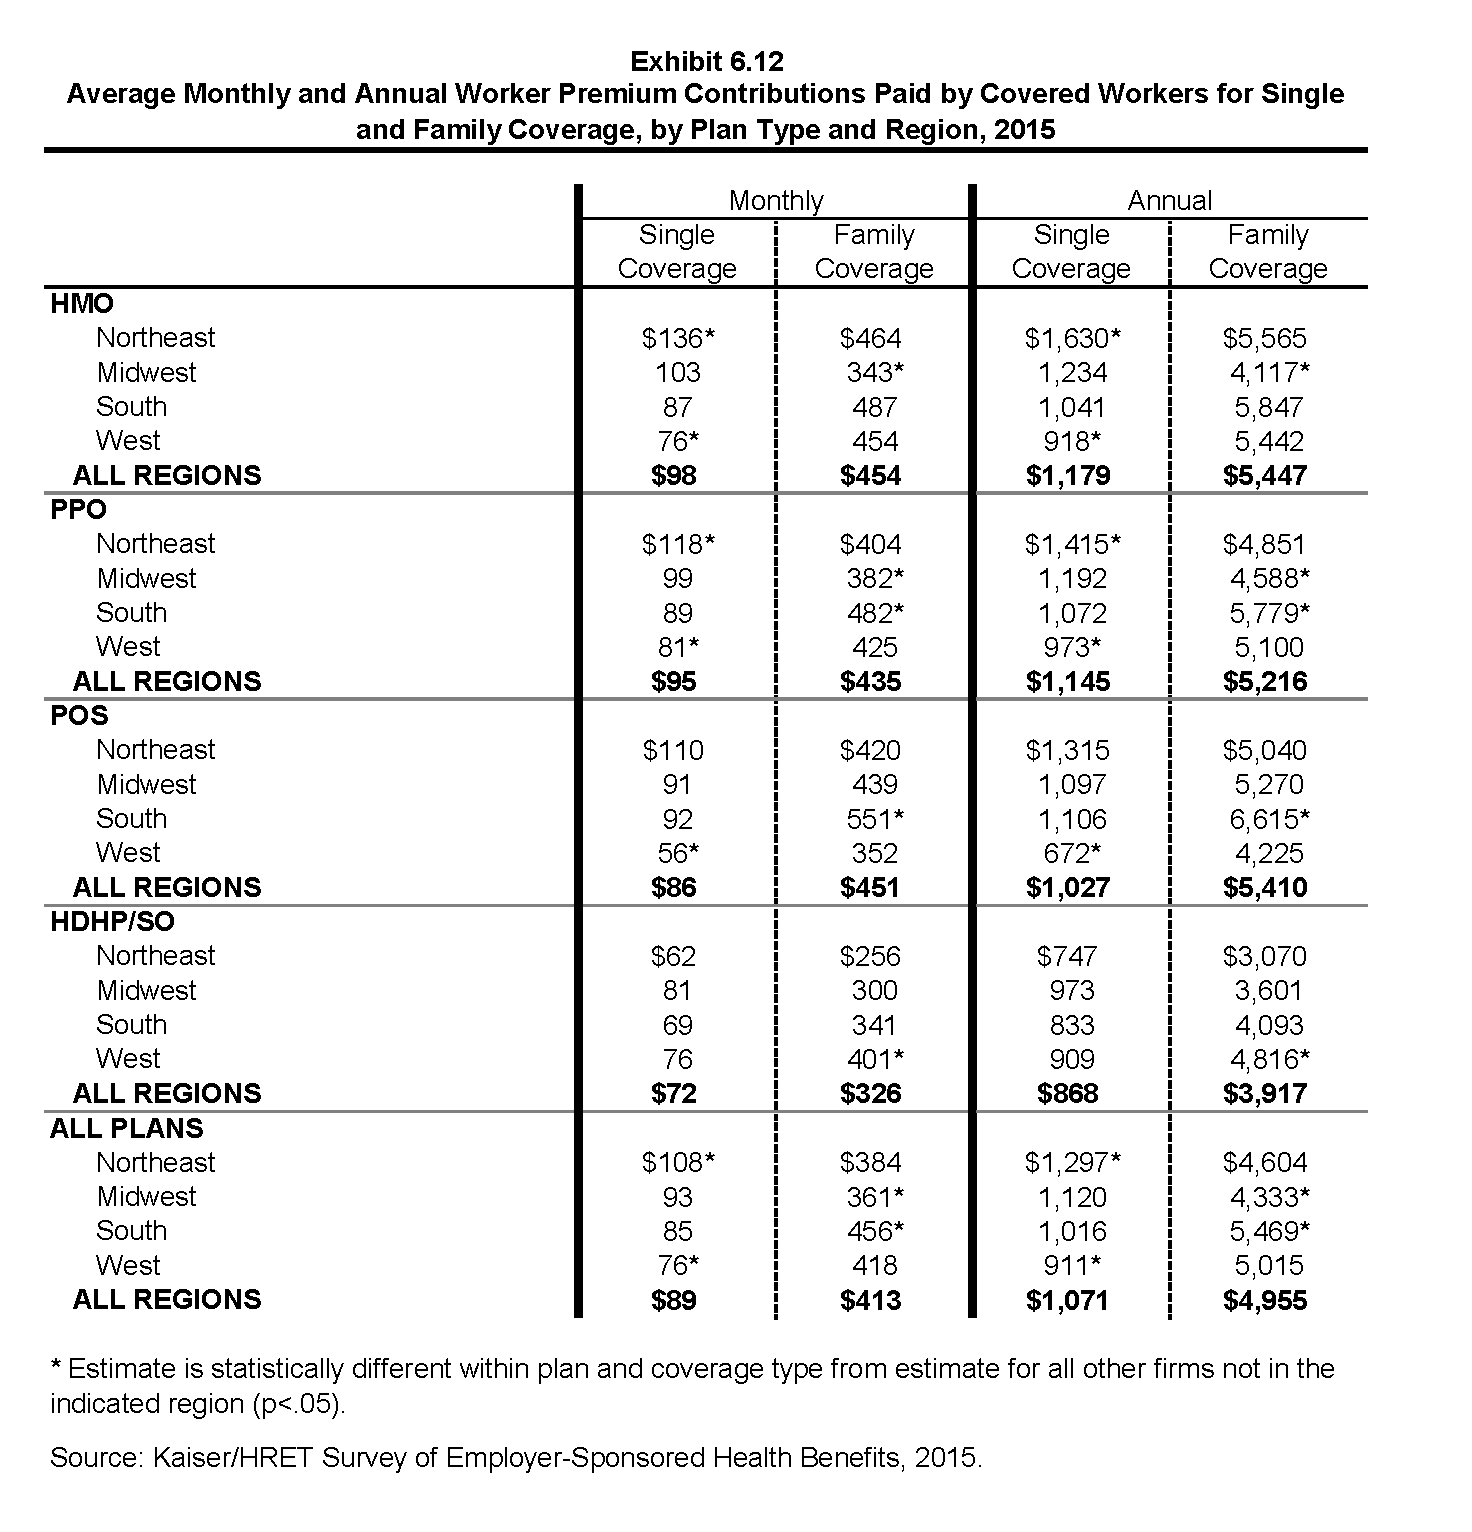
Average Monthly and Annual Worker Premium Contributions Paid by Covered Workers for Single and Family Coverage, by Plan Type and Region, 2015
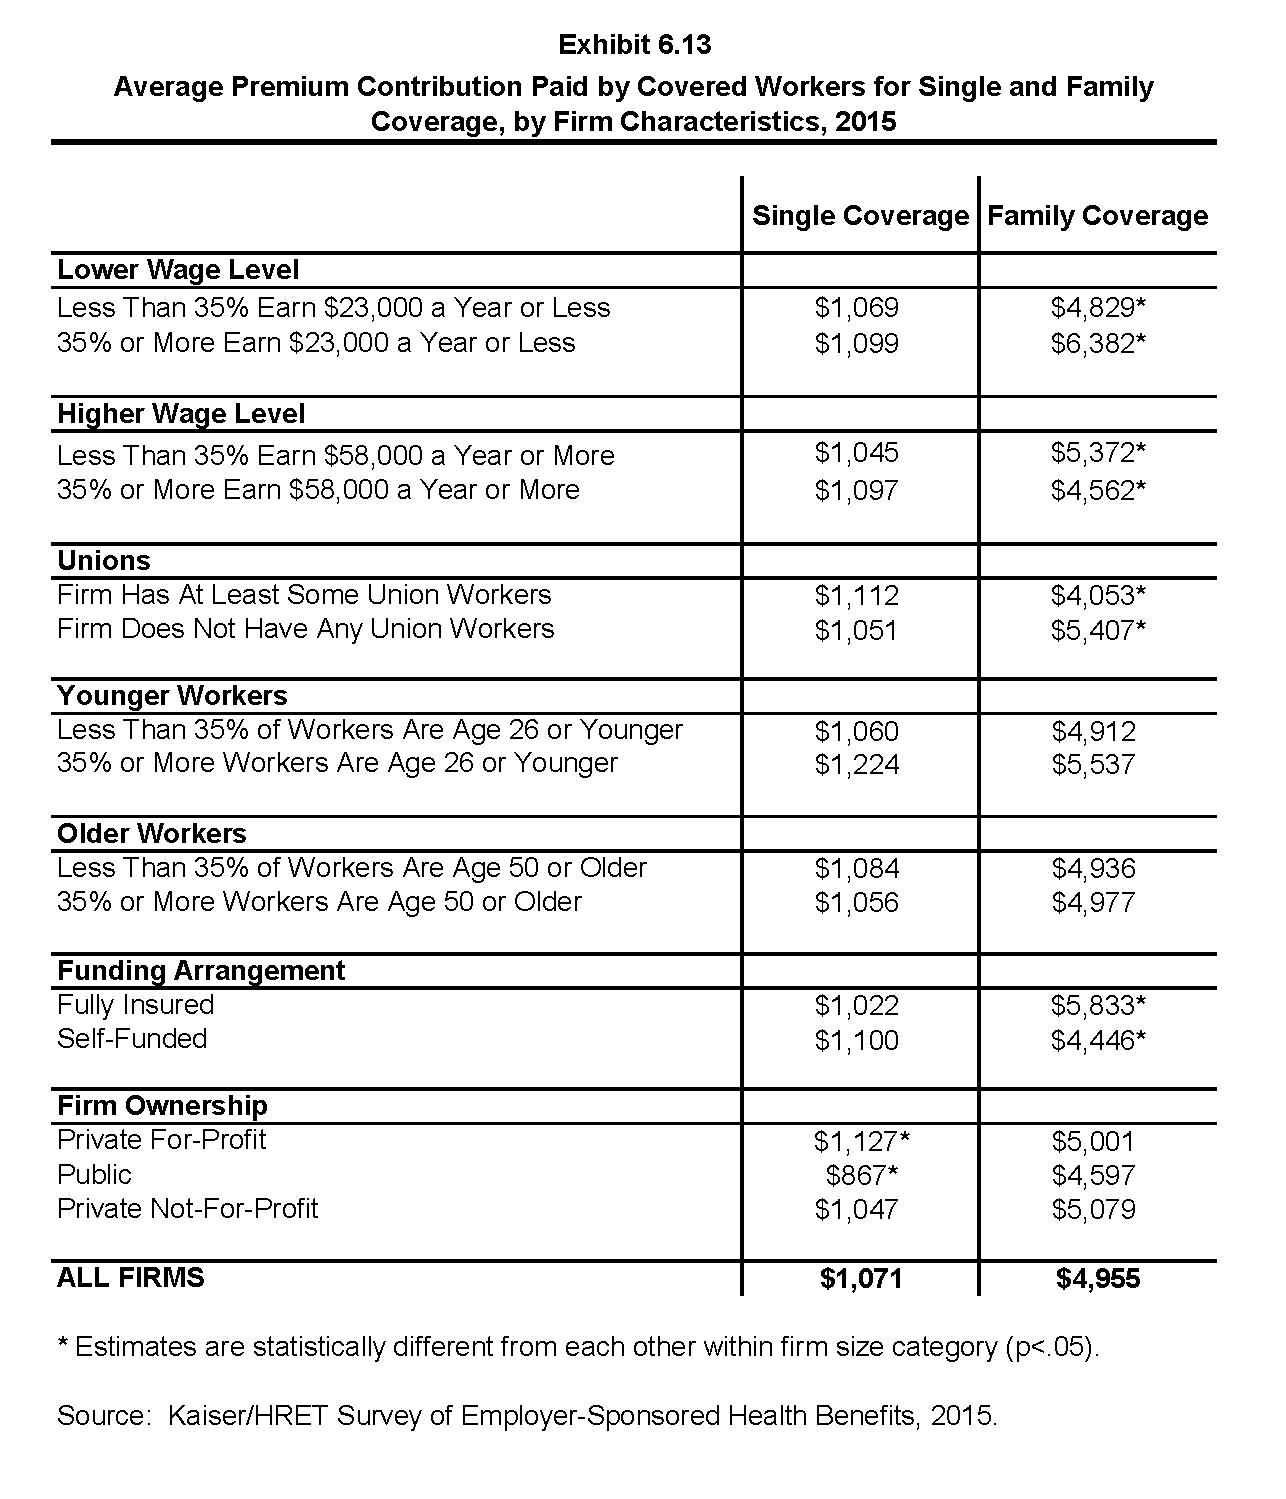
Average Premium Contribution Paid by Covered Workers for Single and Family Coverage, by Firm Characteristics, 2015
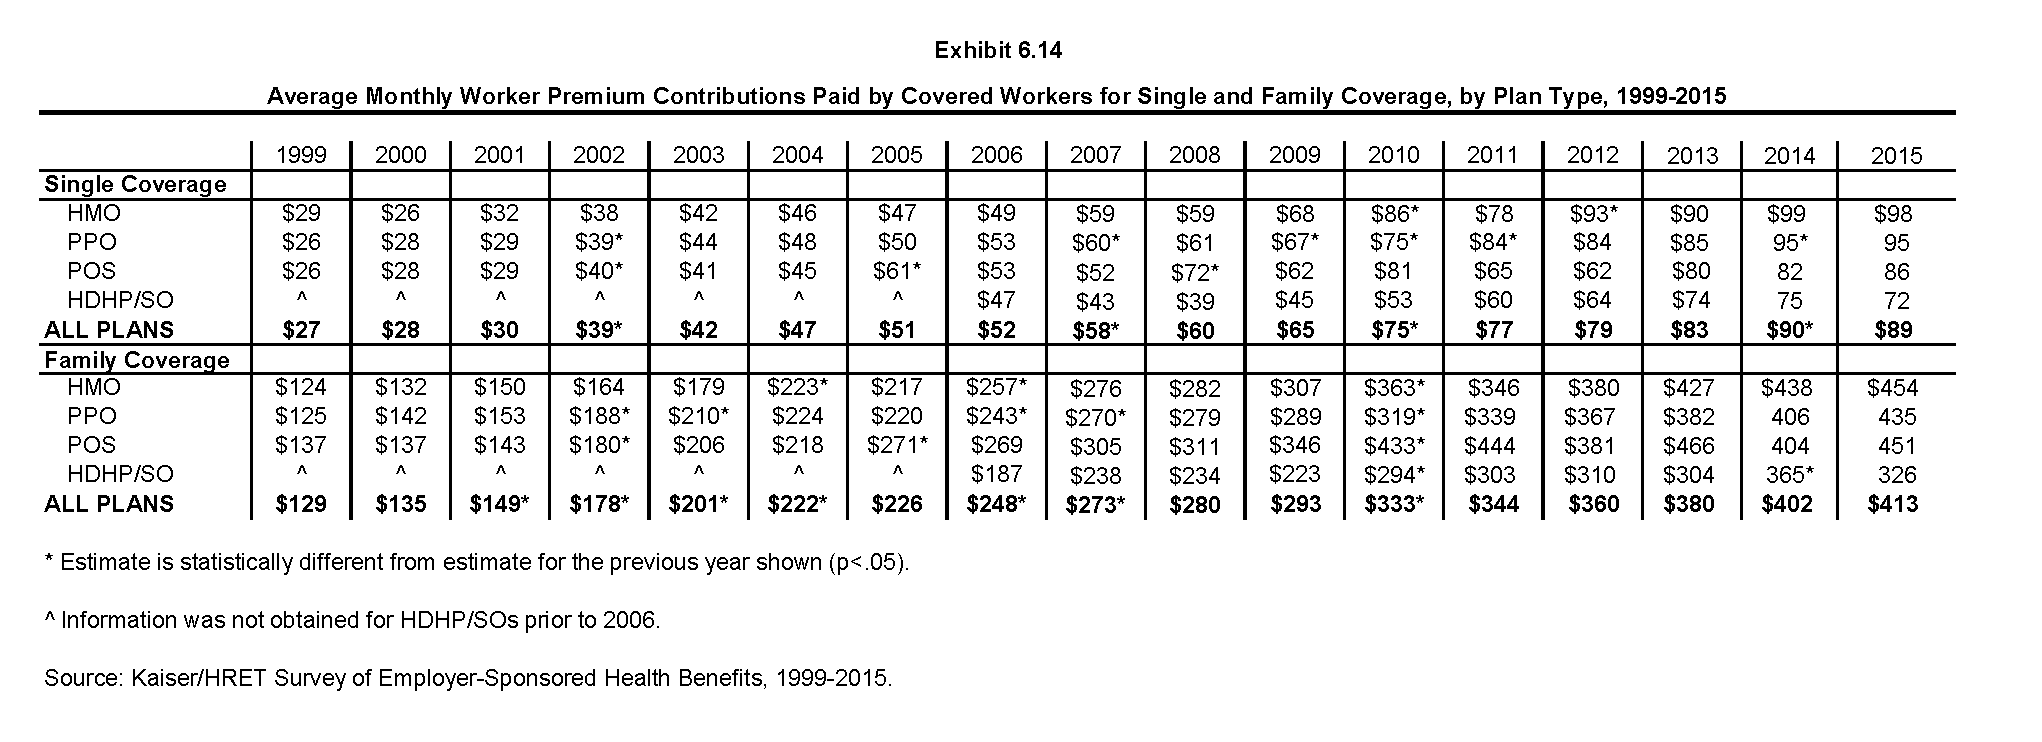
Average Monthly Worker Premium Contributions Paid by Covered Workers for Single and Family Coverage, by Plan Type, 1999-2015
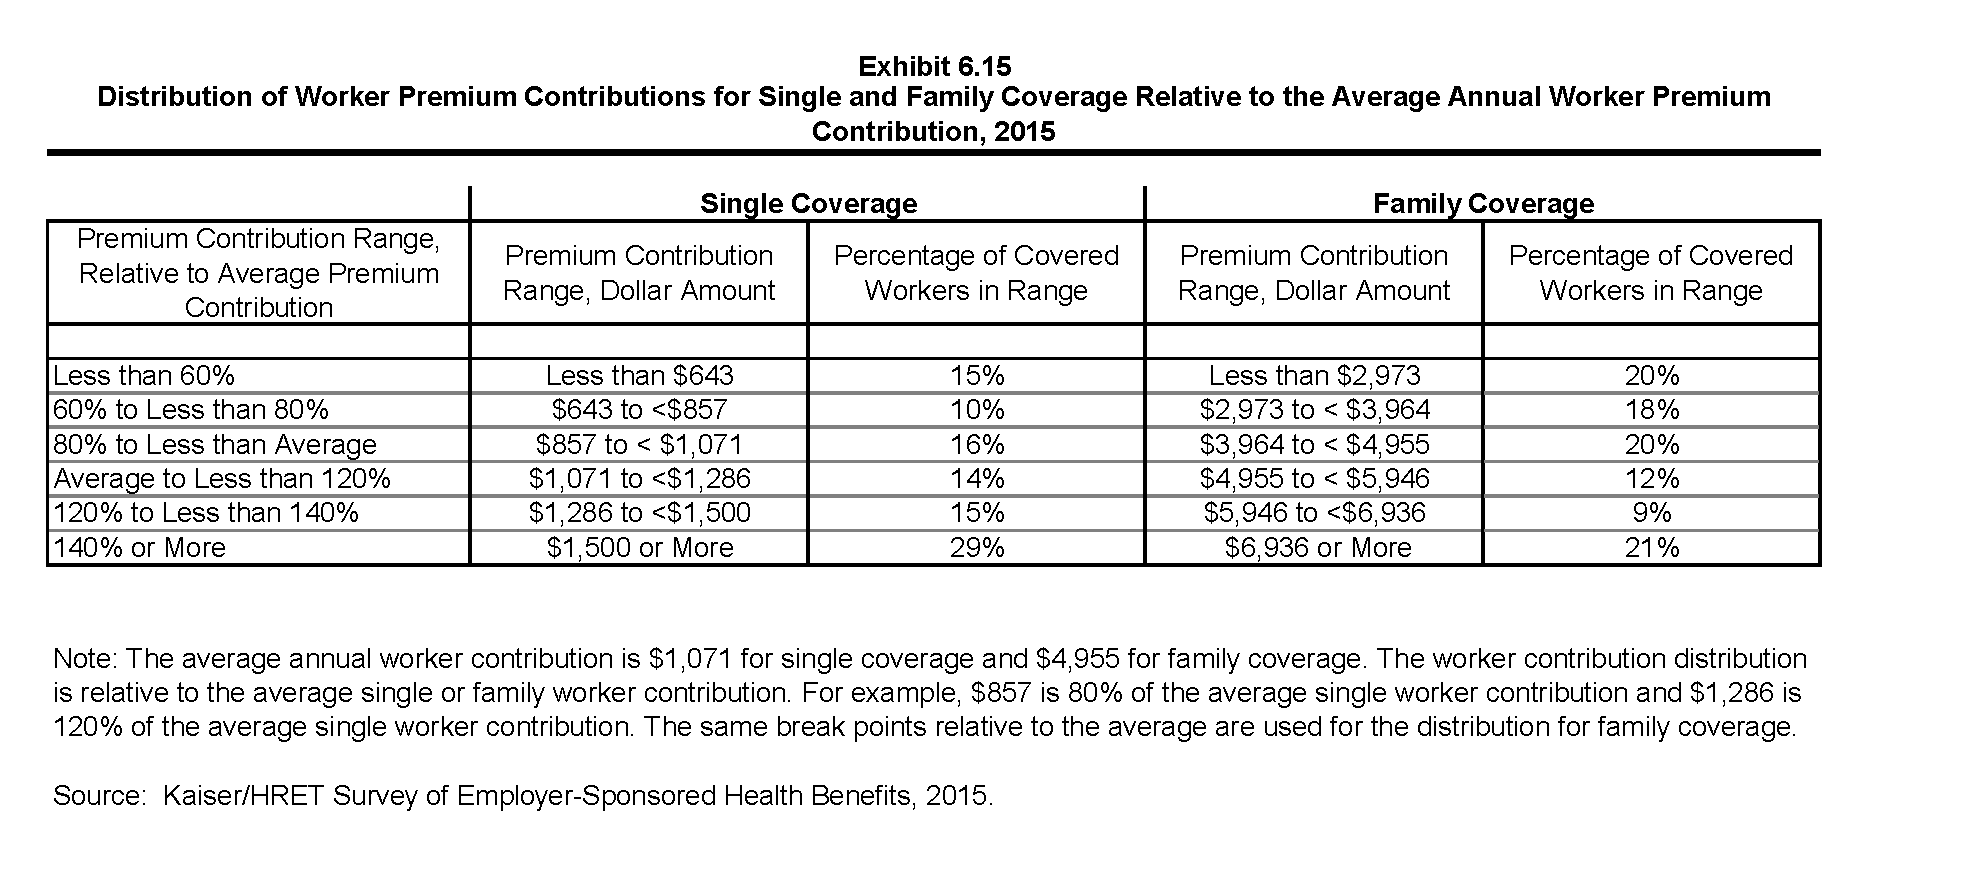
Distribution of Worker Premium Contributions for Single and Family Coverage Relative to the Average Annual Worker Premium Contribution, 2015
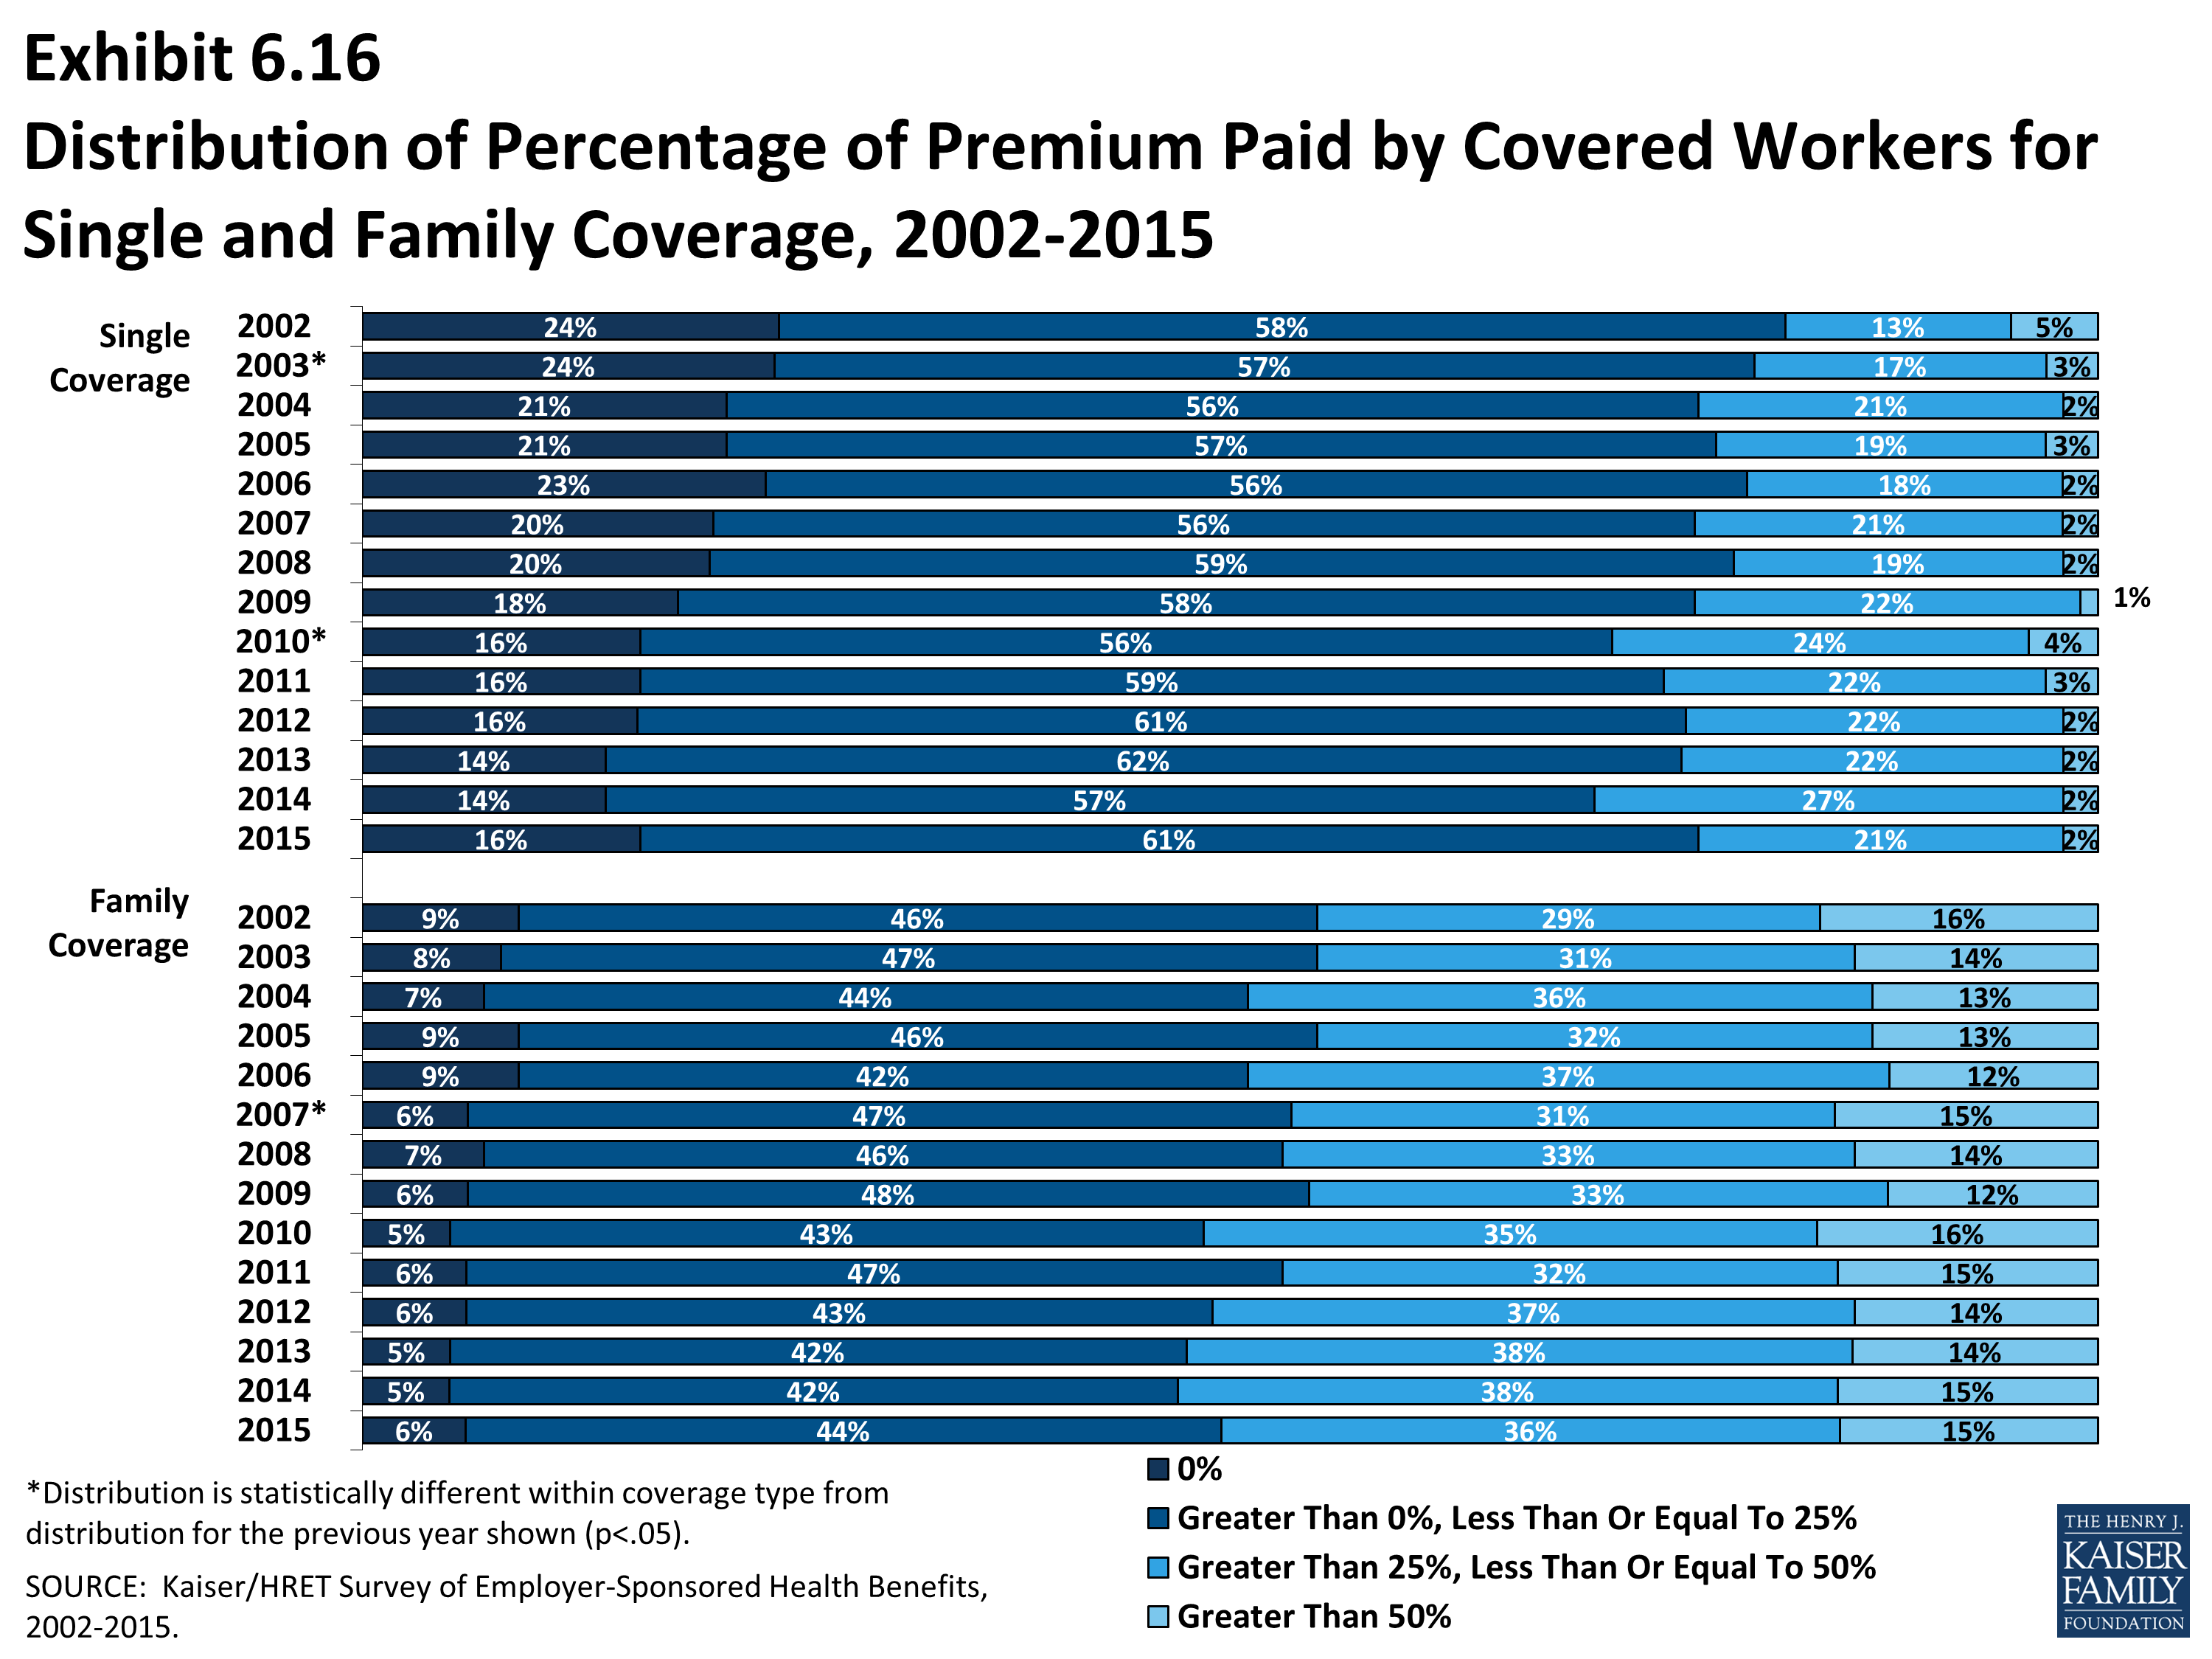
Distribution of Percentage of Premium Paid by Covered Workers for Single and Family Coverage, 2002-2015
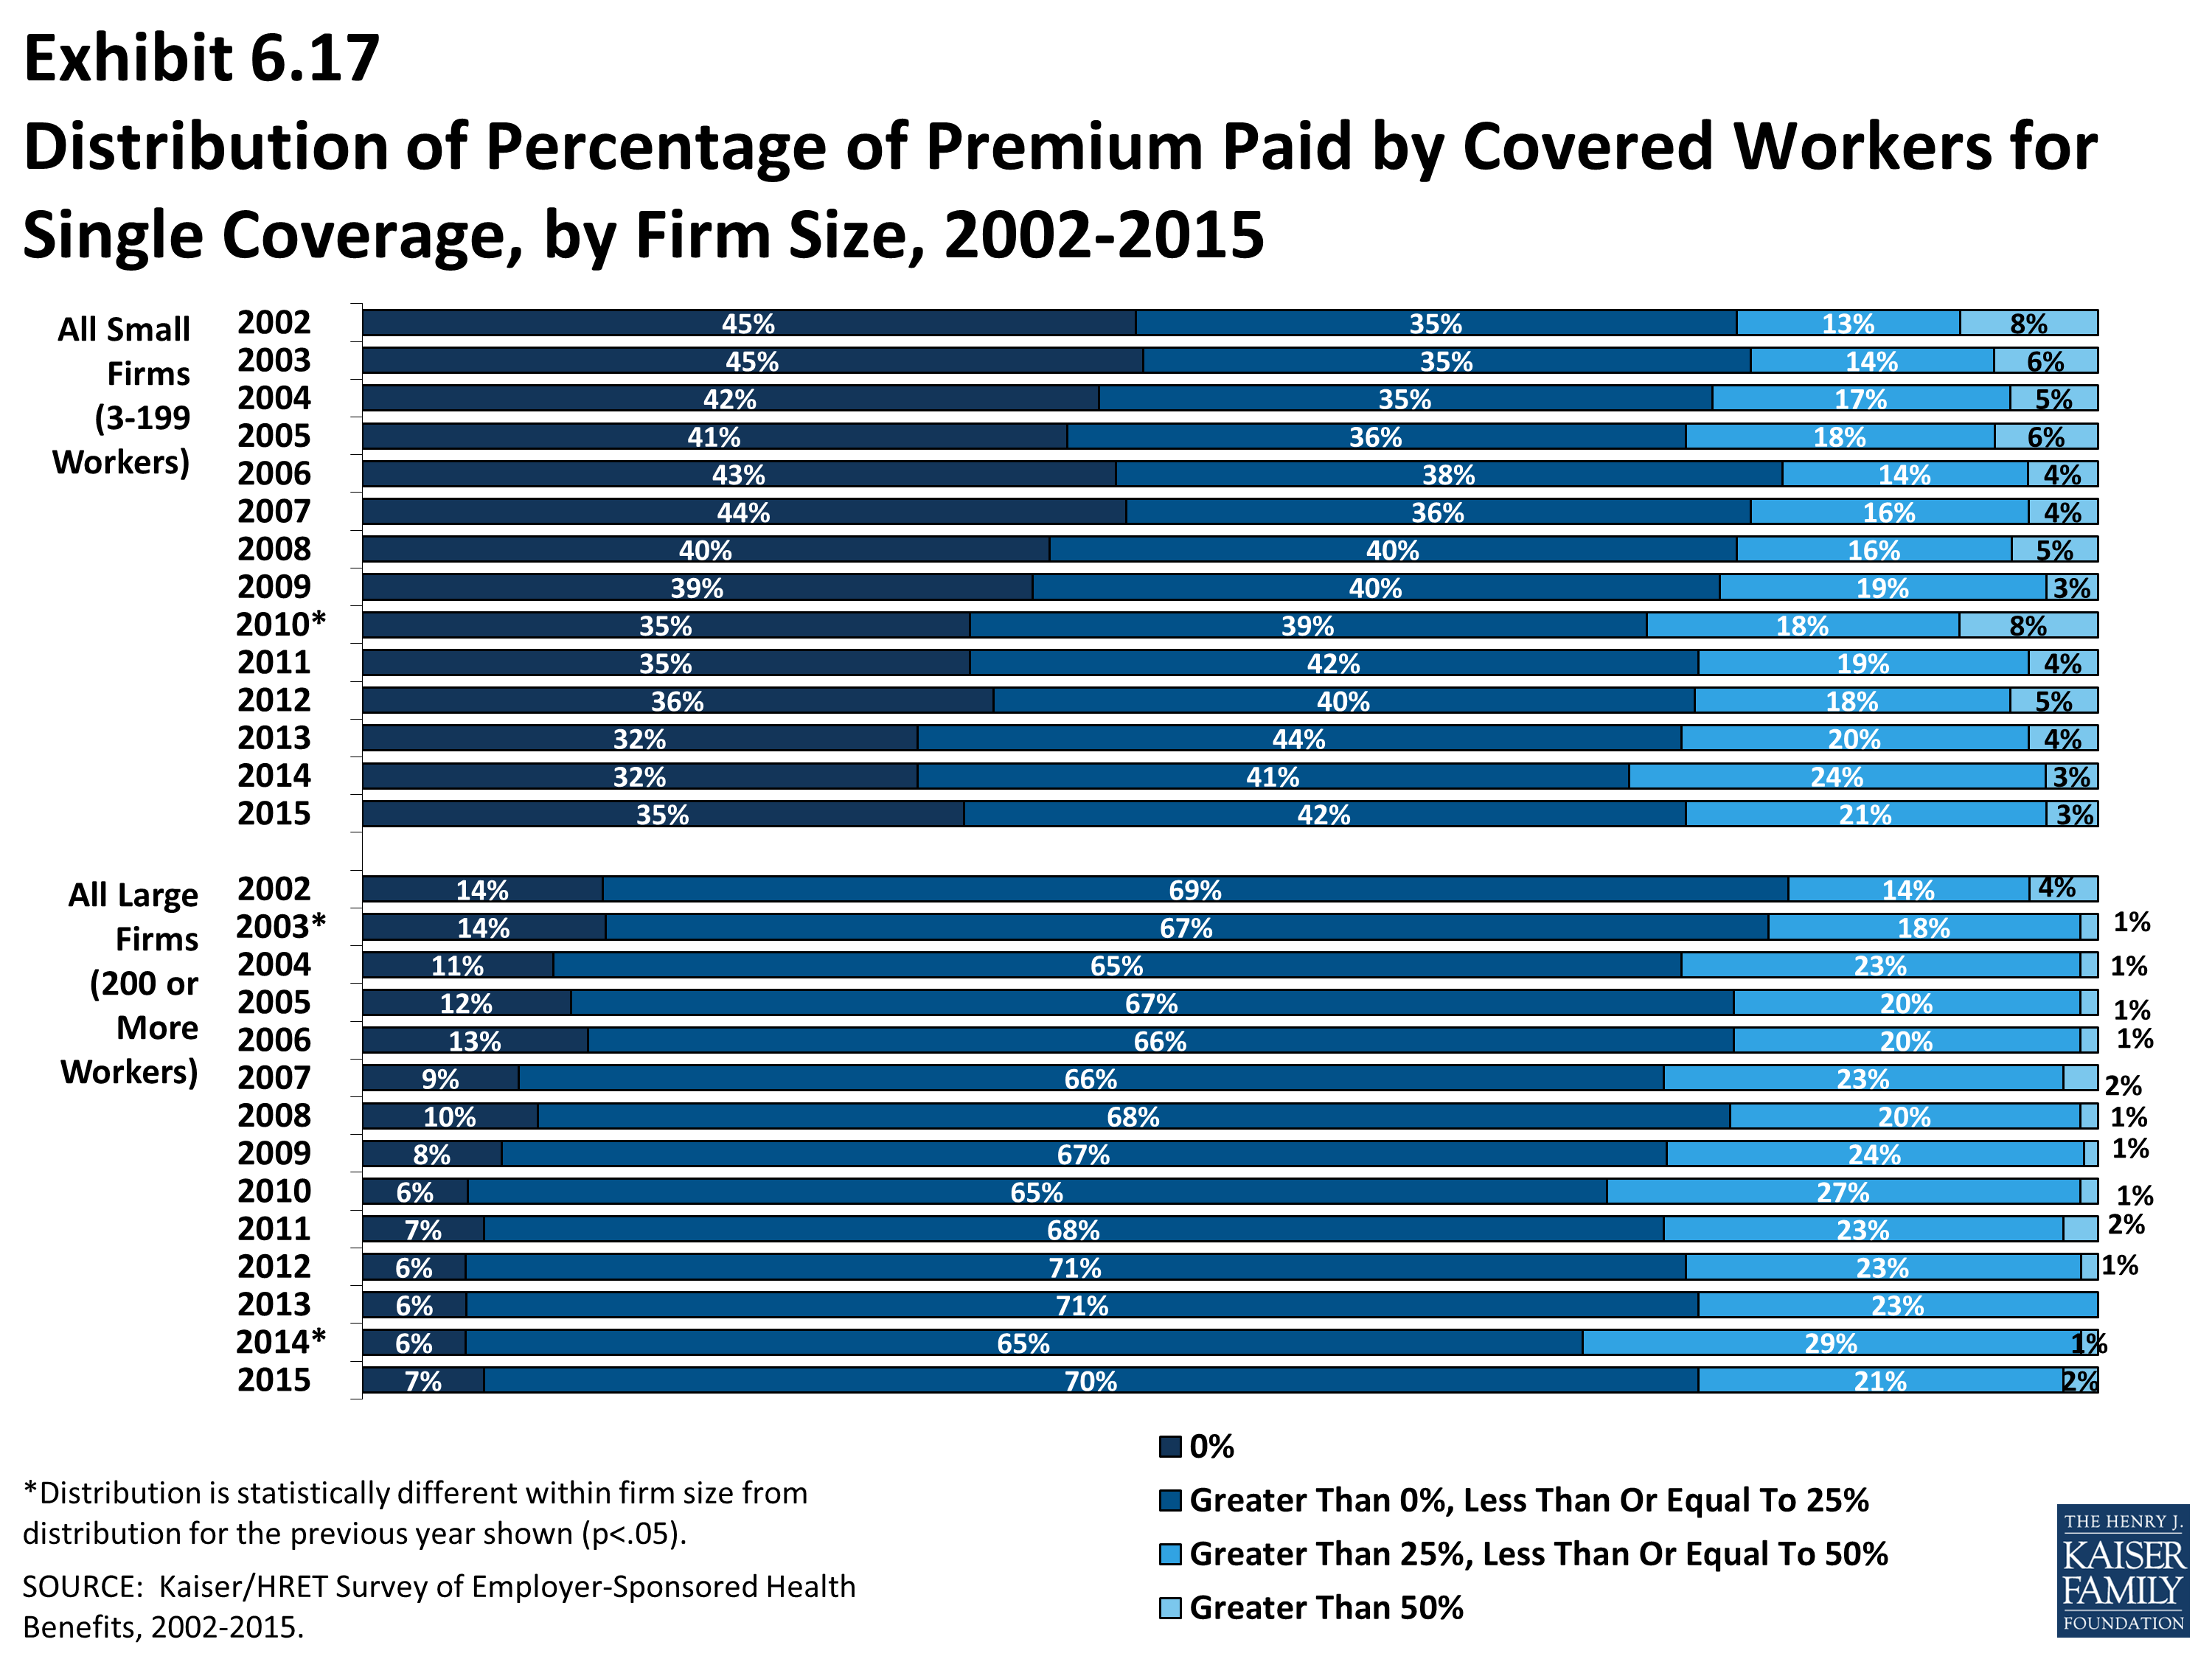
Distribution of Percentage of Premium Paid by Covered Workers for Single Coverage, by Firm Size, 2002-2015
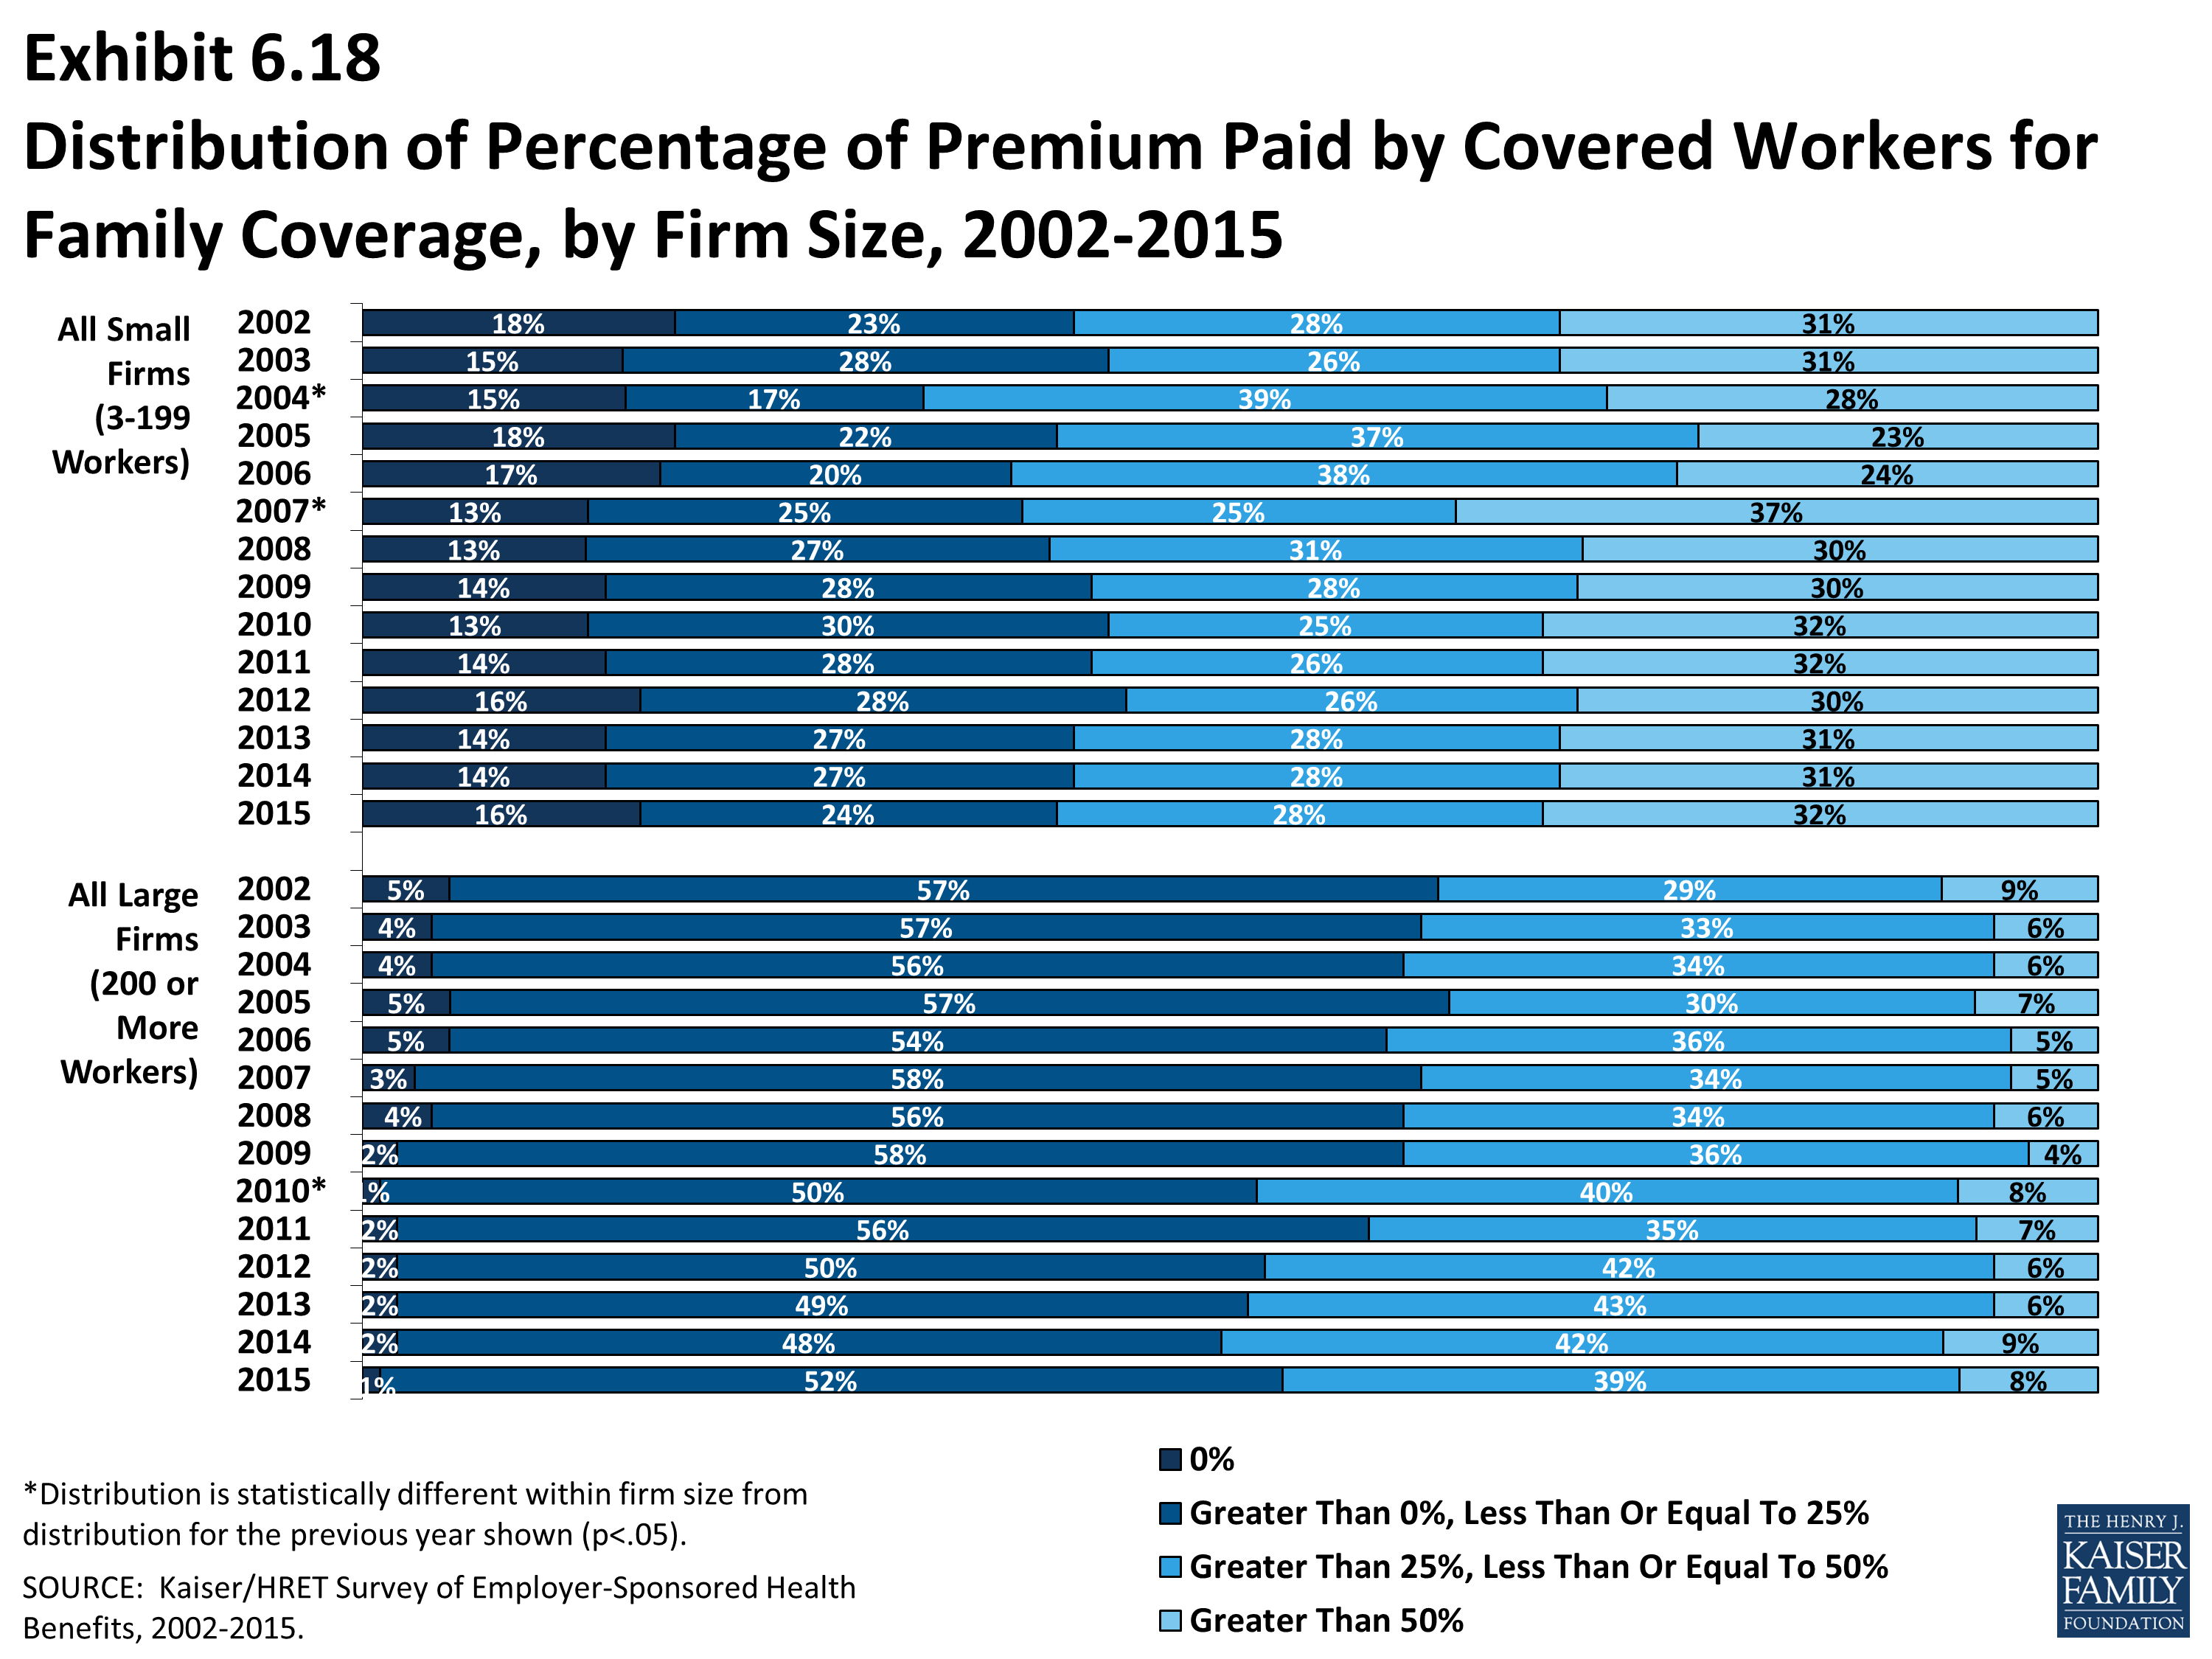
Distribution of Percentage of Premium Paid by Covered Workers for Family Coverage, by Firm Size, 2002-2015
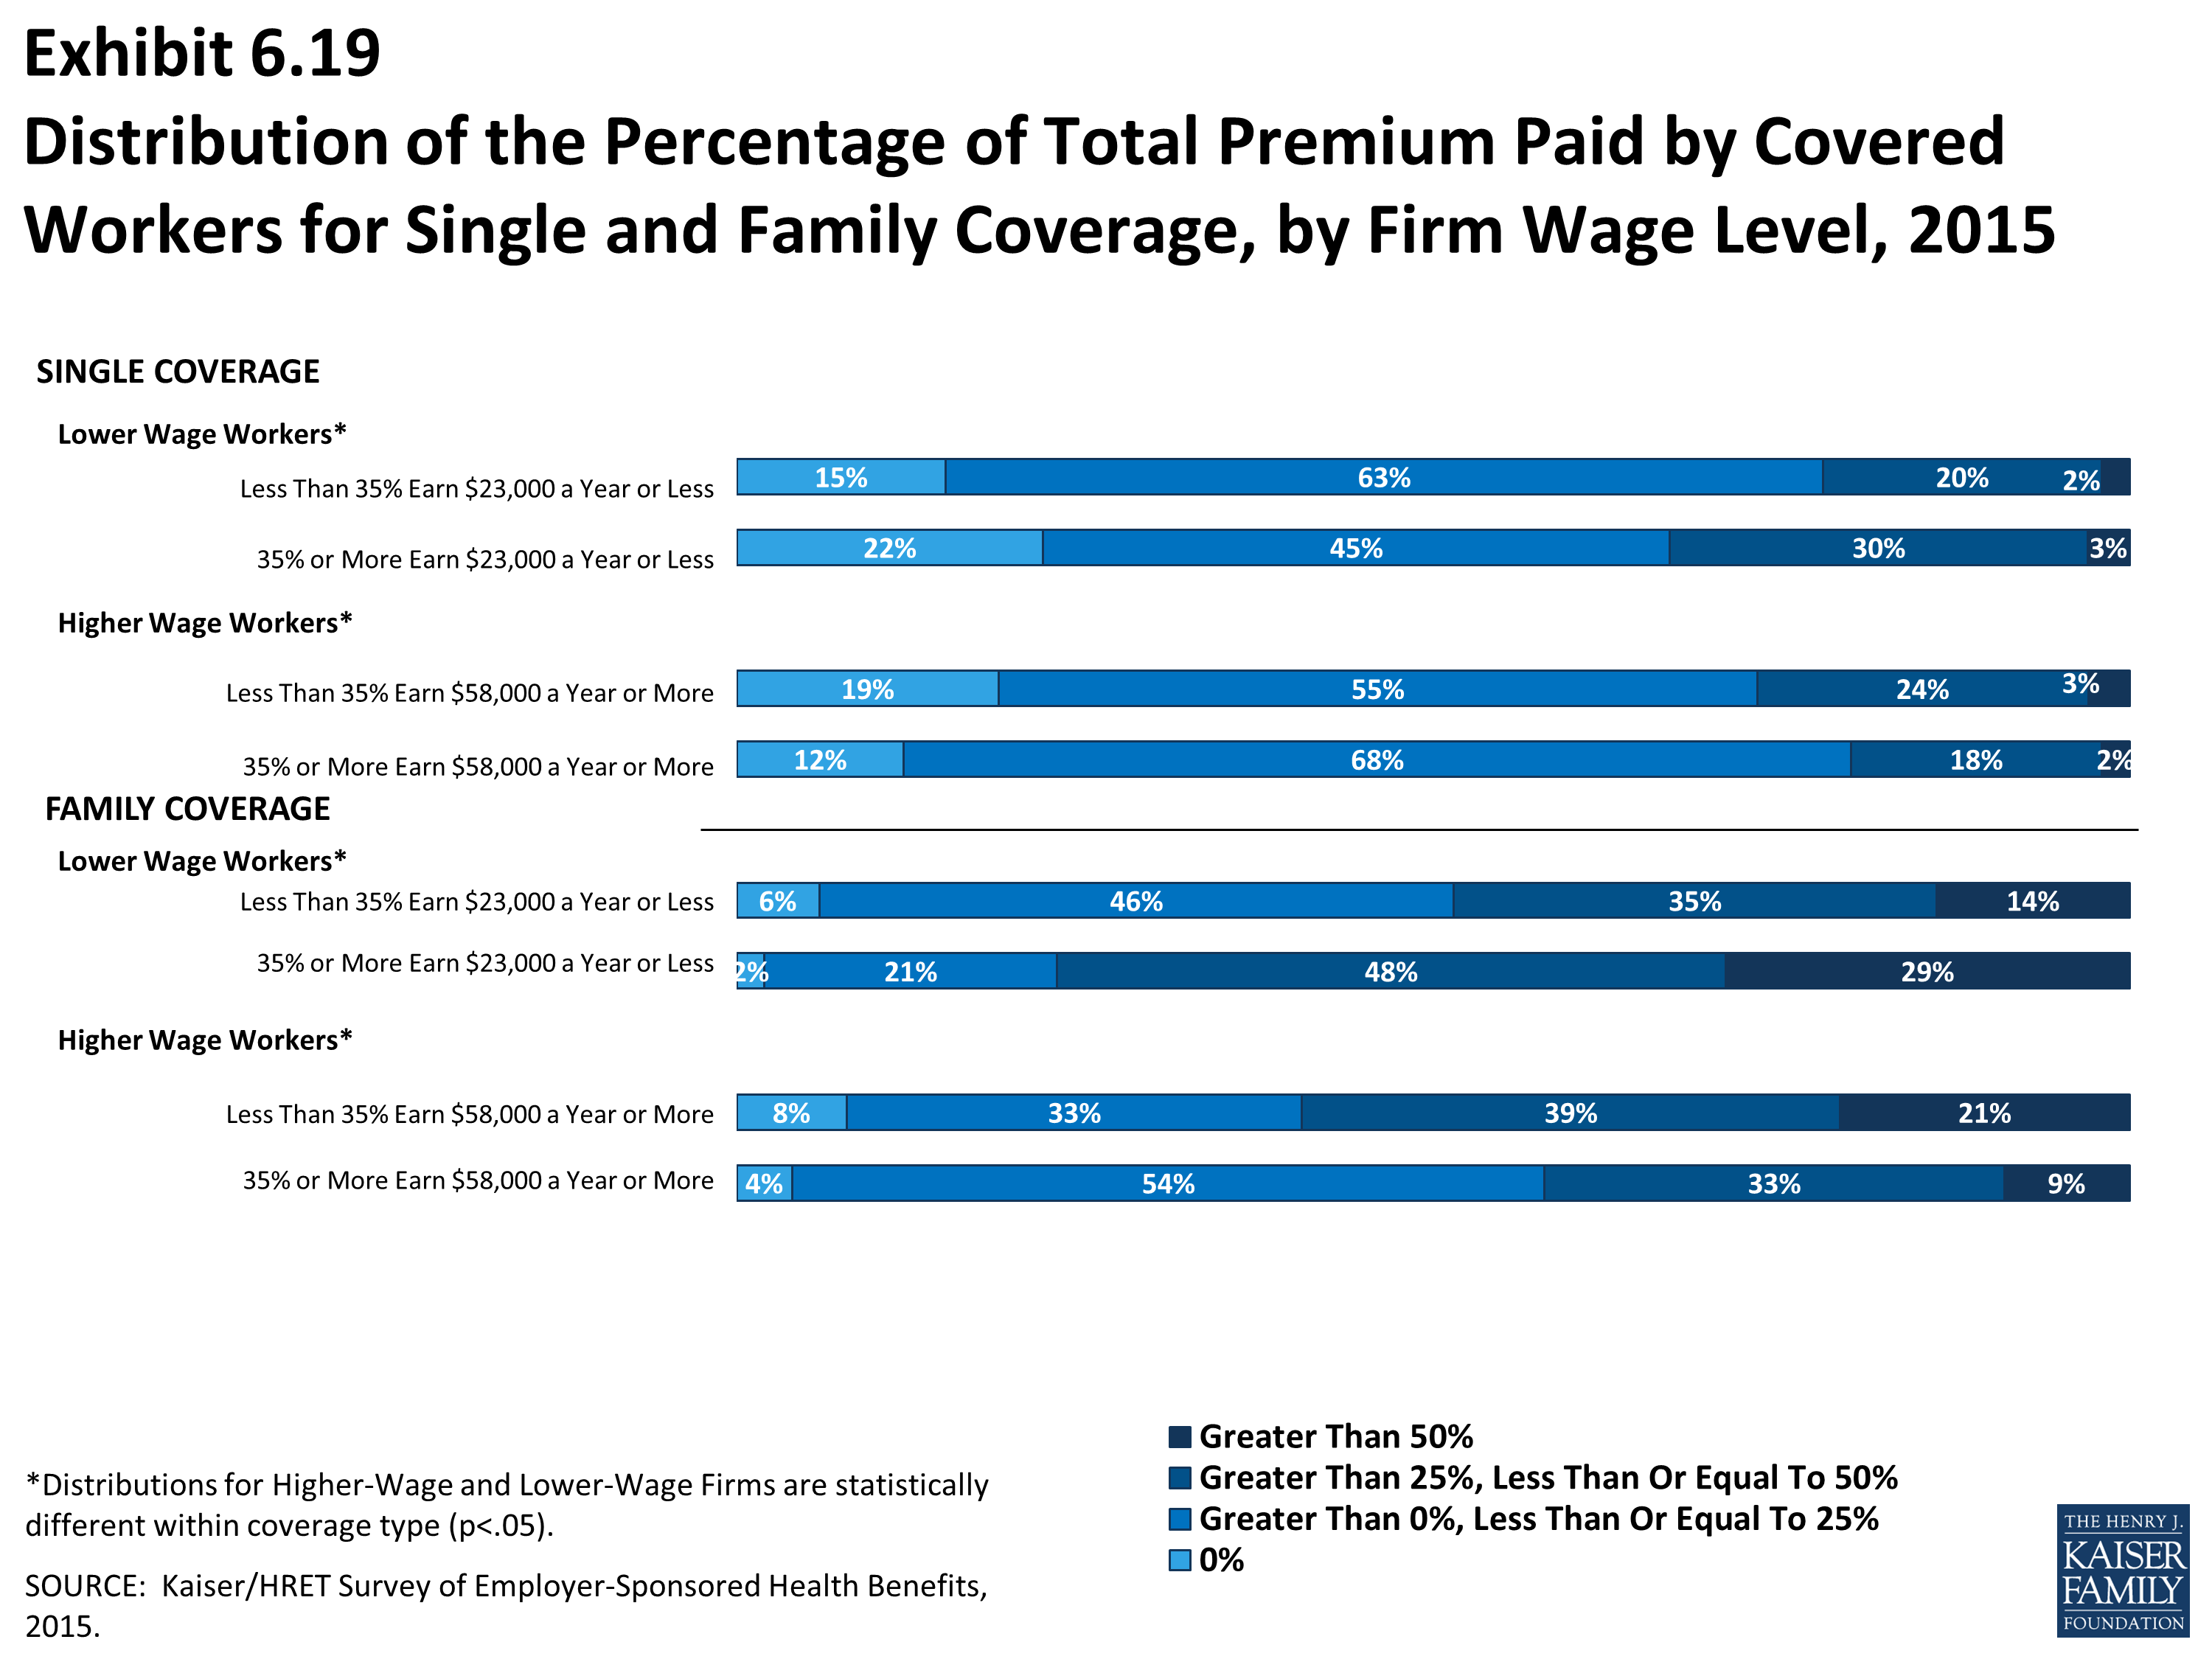
Distribution of the Percentage of Total Premium Paid by Covered Workers for Single and Family Coverage, by Firm Wage Level, 2015
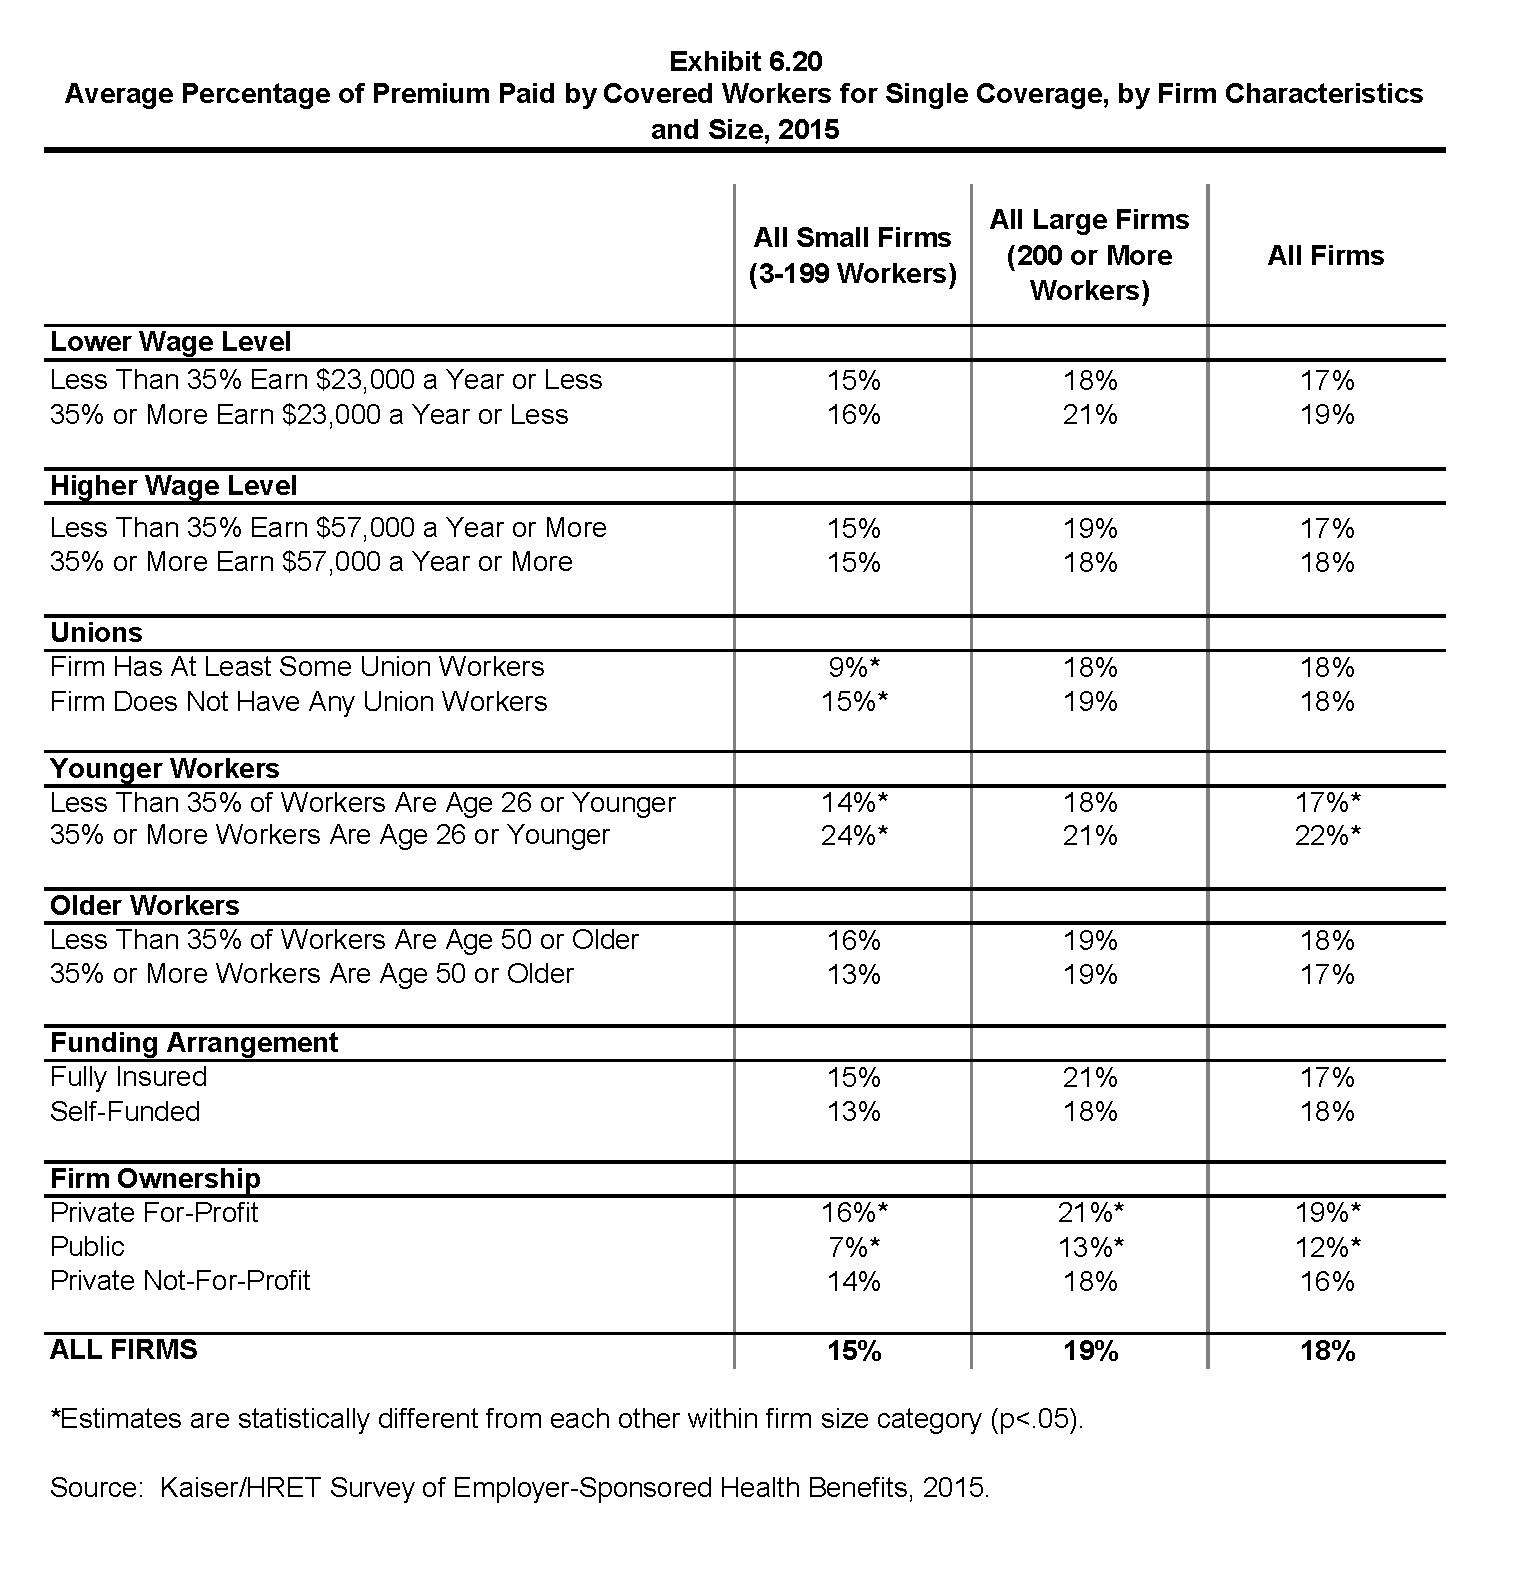
Average Percentage of Premium Paid by Covered Workers for Single Coverage, by Firm Characteristics and Size, 2015
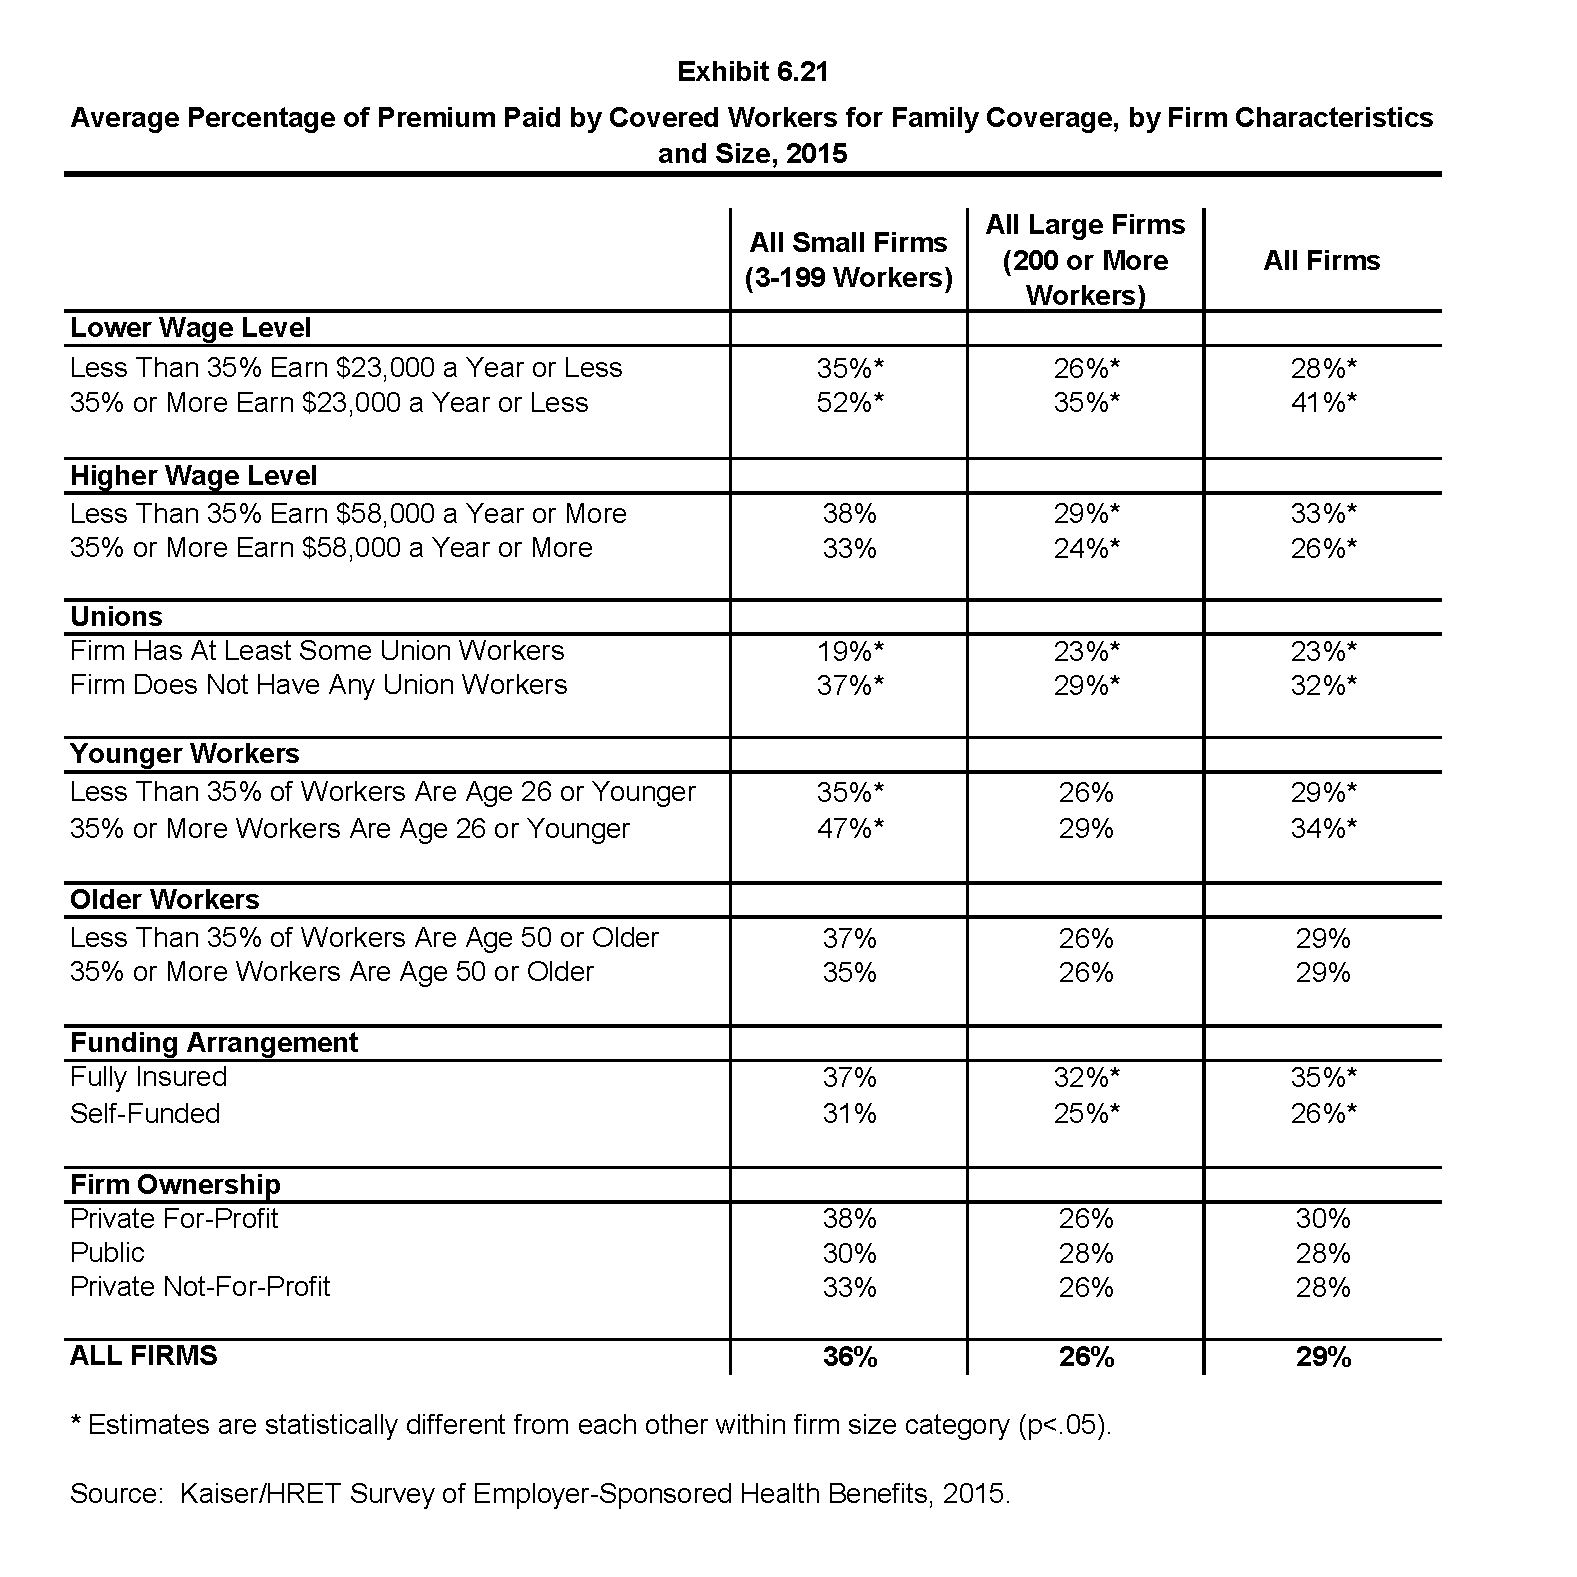
Average Percentage of Premium Paid by Covered Workers for Family Coverage, by Firm Characteristics and Size, 2015
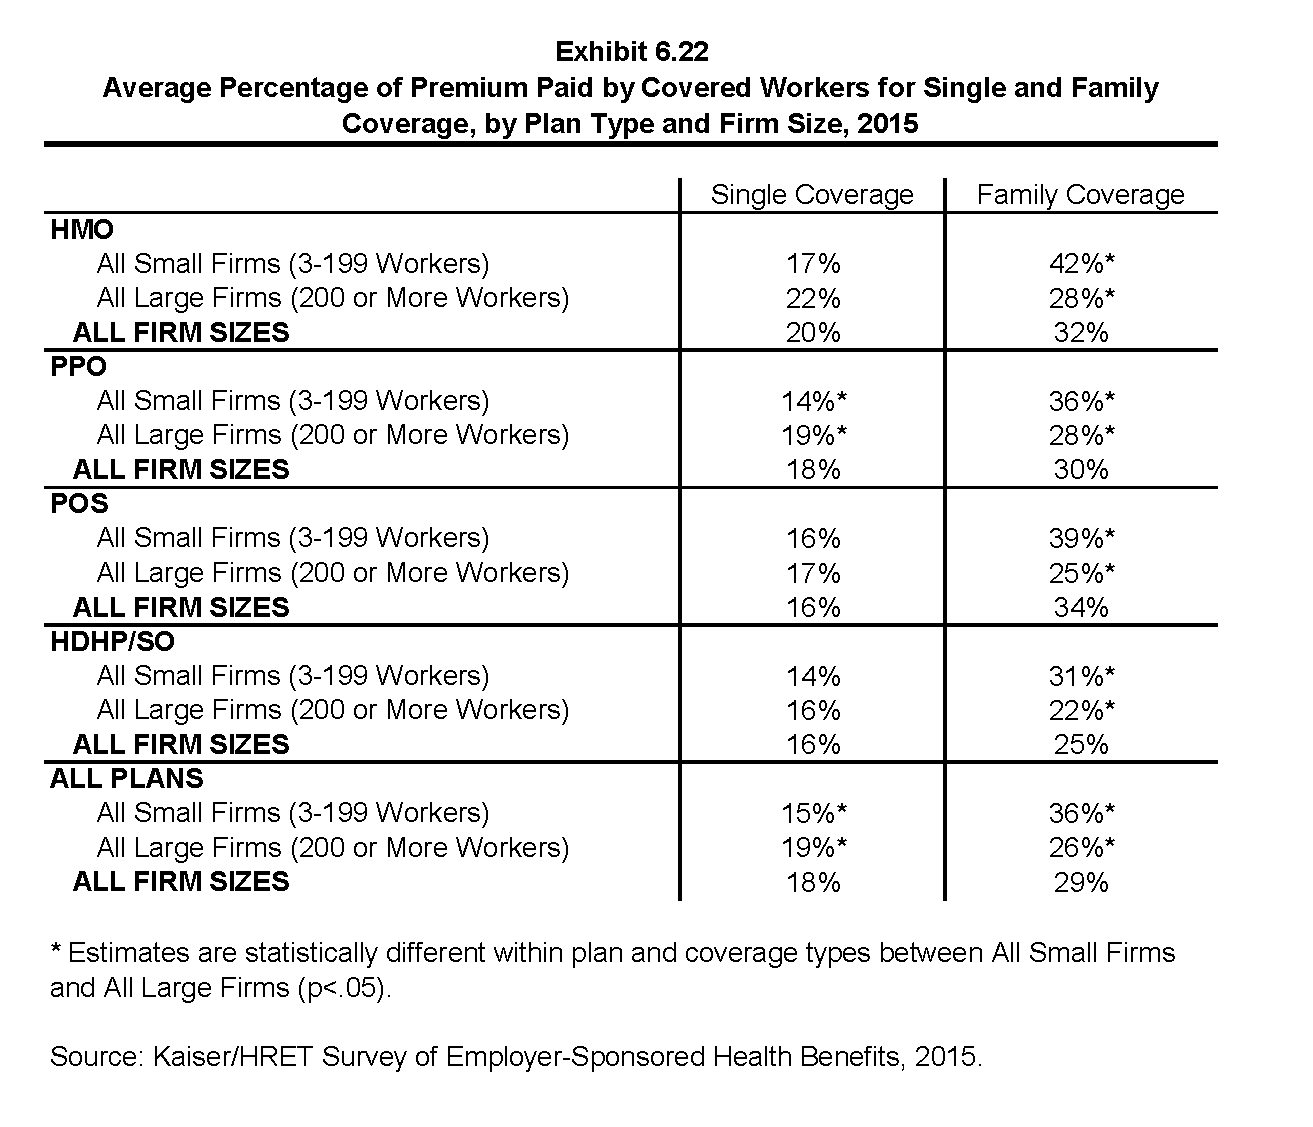
Average Percentage of Premium Paid by Covered Workers for Single and Family Coverage, by Plan Type and Firm Size, 2015
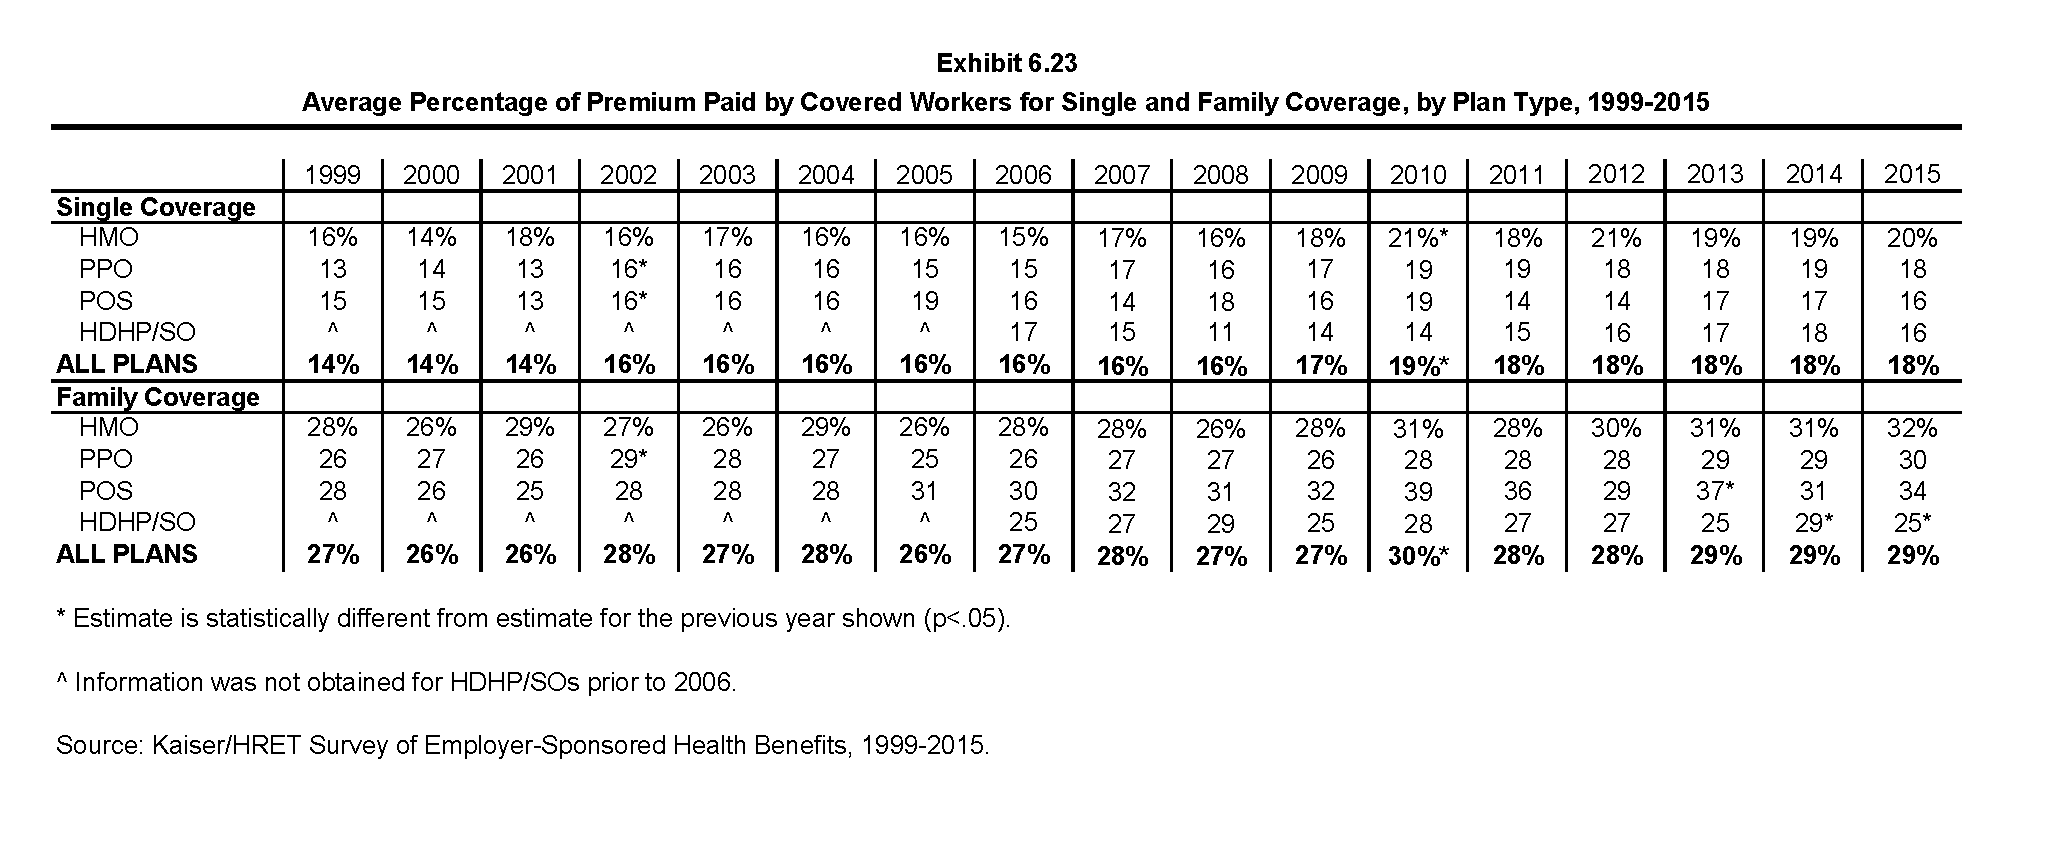
Average Percentage of Premium Paid by Covered Workers for Single and Family Coverage, by Plan Type, 1999-2015
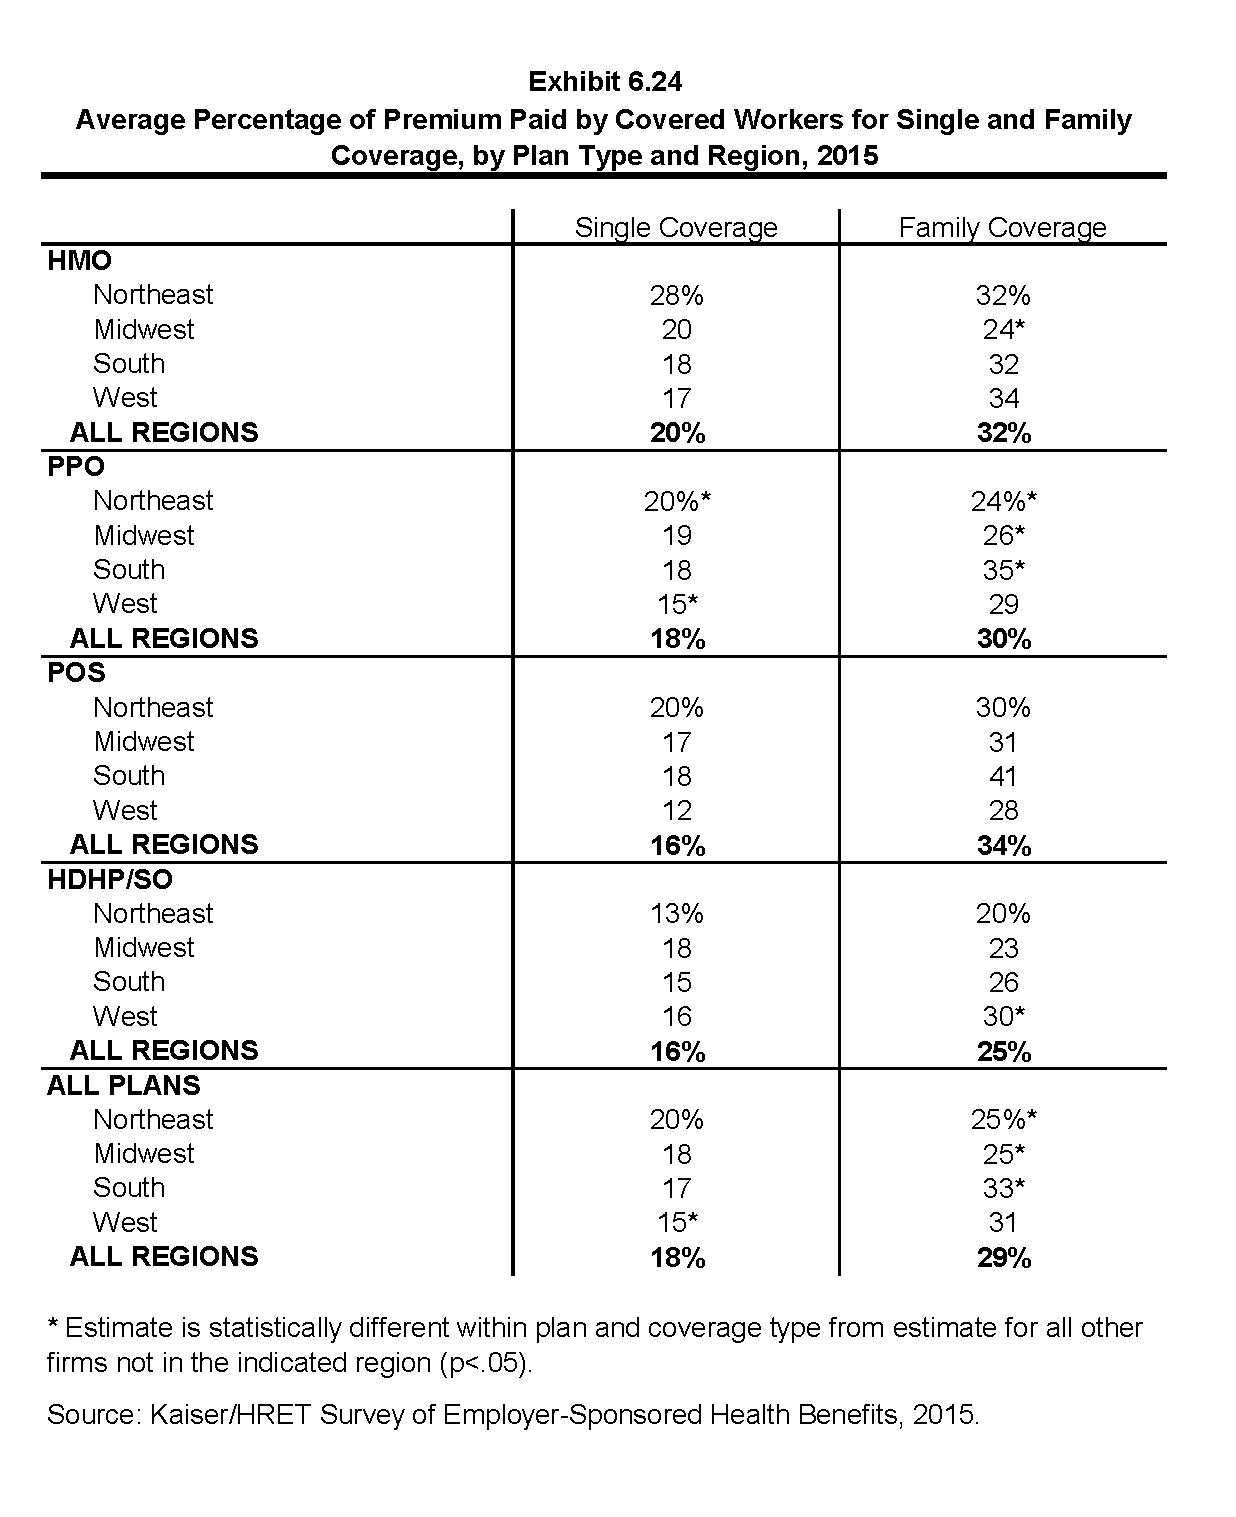
Average Percentage of Premium Paid by Covered Workers for Single and Family Coverage, by Plan Type and Region, 2015
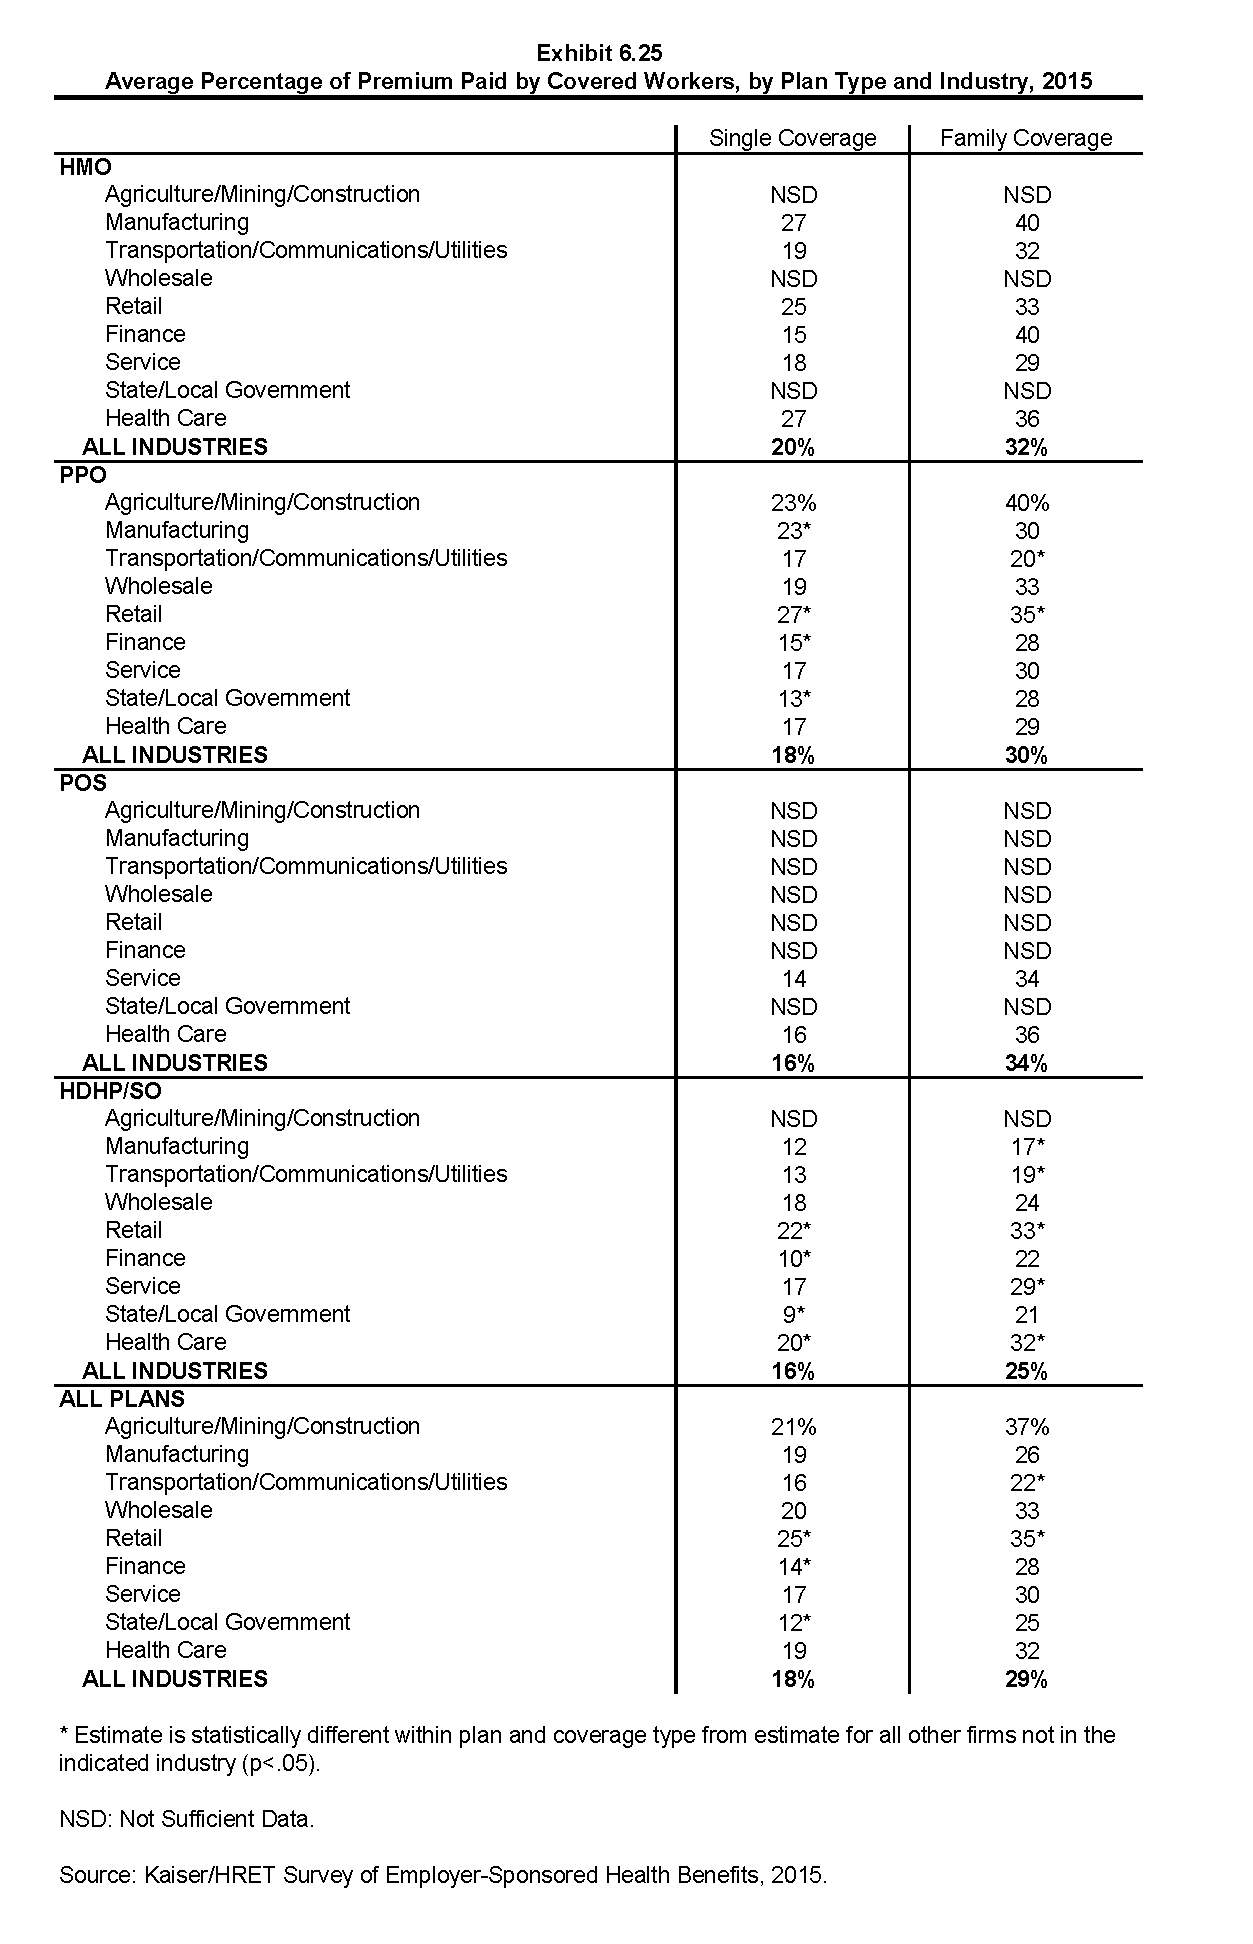
Average Percentage of Premium Paid by Covered Workers, by Plan Type and Industry, 2015
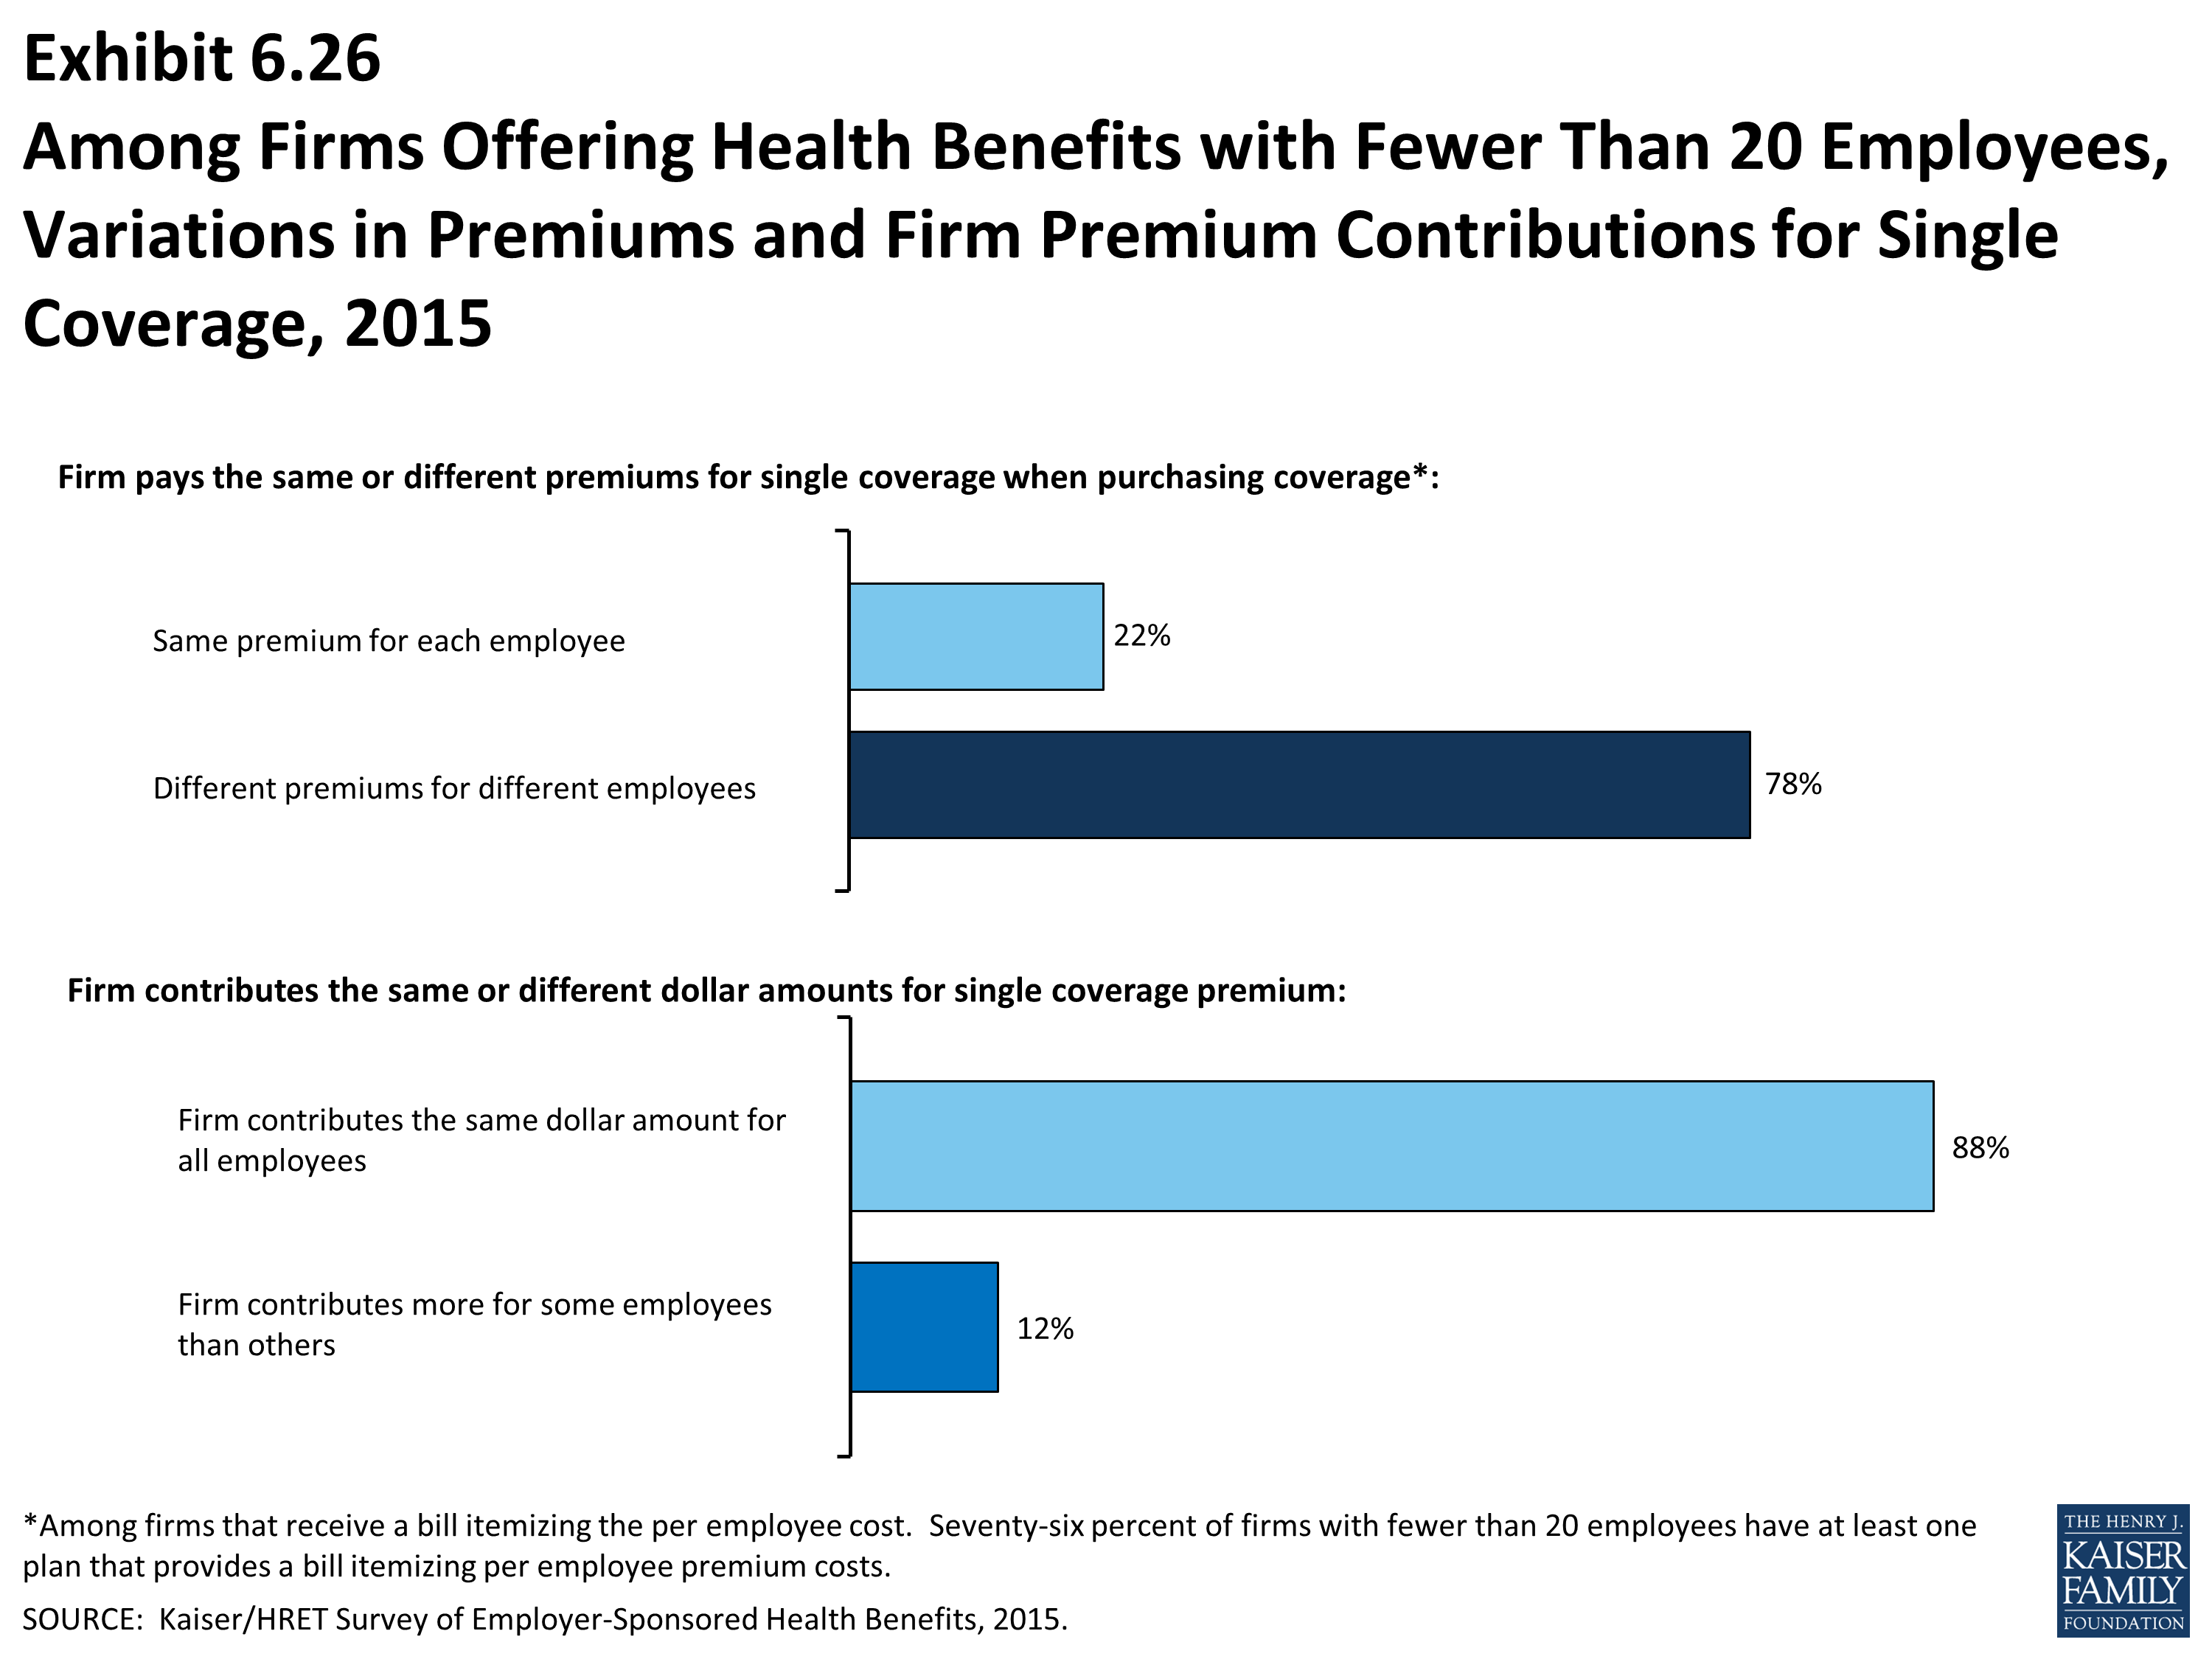
Among Firms Offering Health Benefits with Fewer Than 20 Employees, Variations in Premiums and Firm Premium Contributions for Single Coverage, 2015
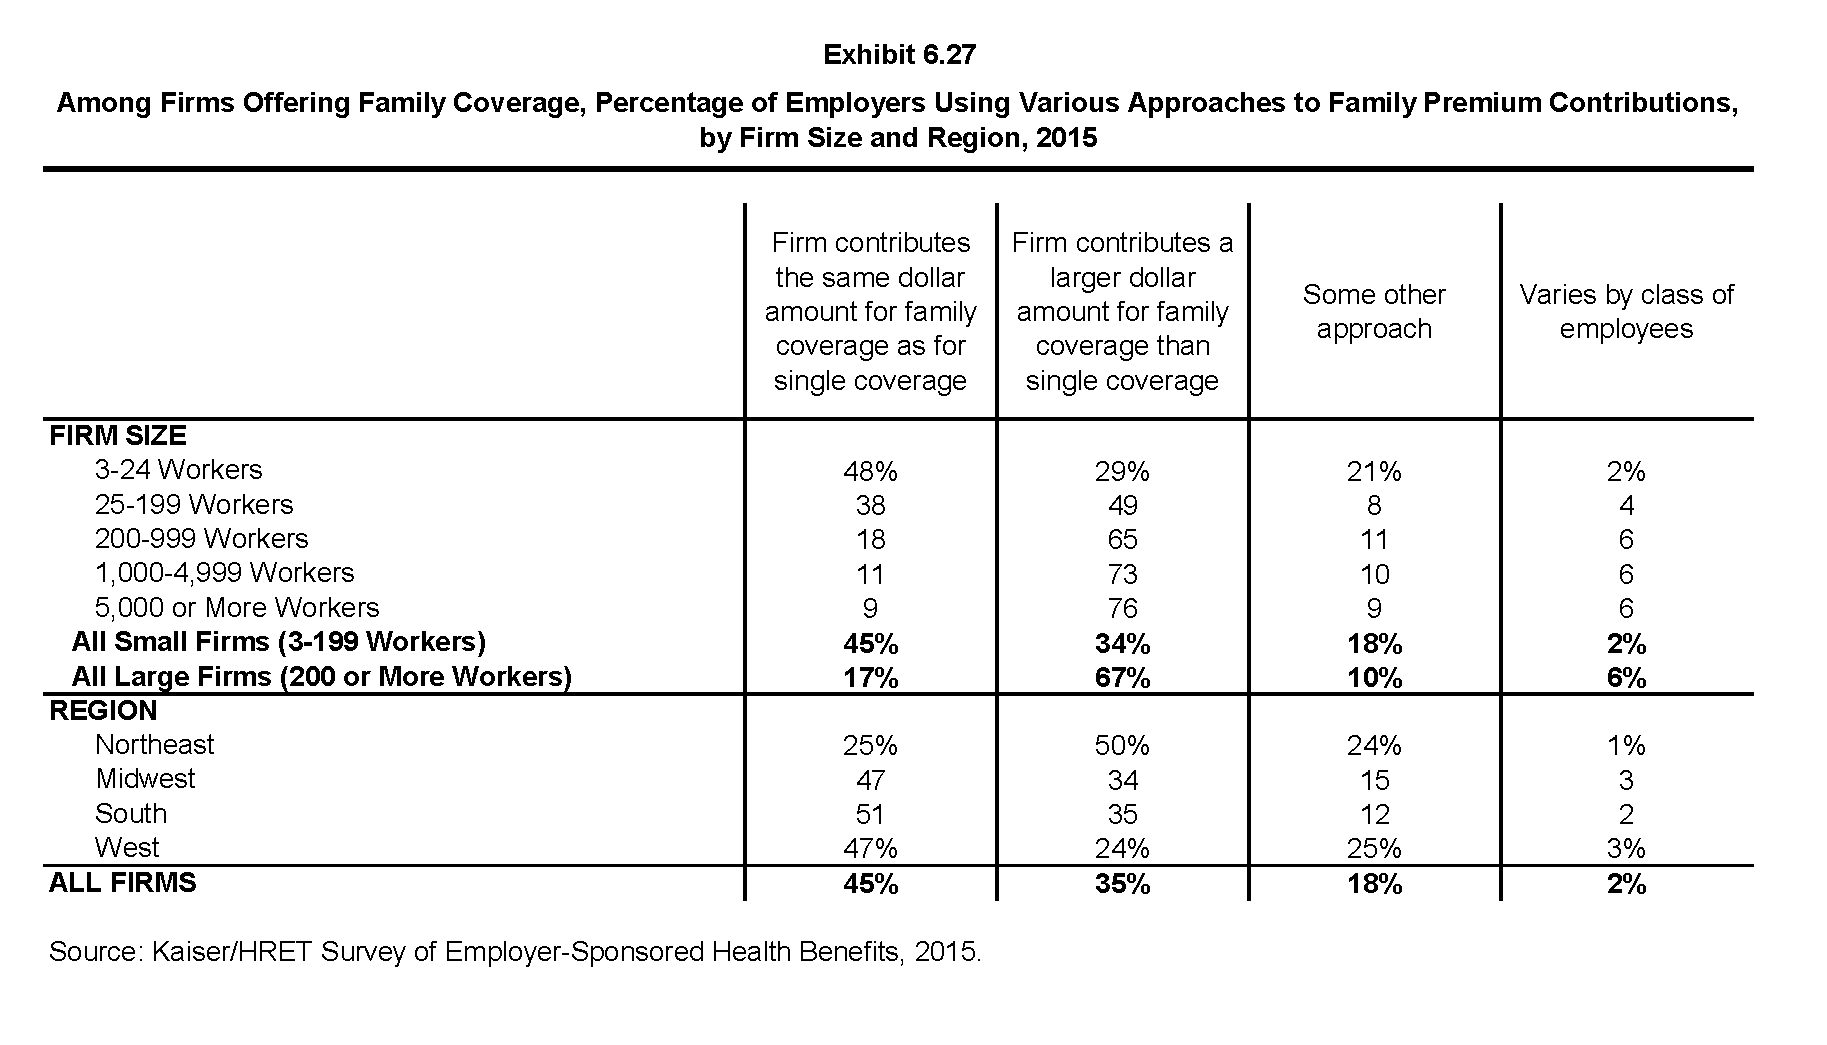
Among Firms Offering Family Coverage, Percentage of Employers Using Various Approaches to Family Premium Contributions, by Firm Size and Region, 2015
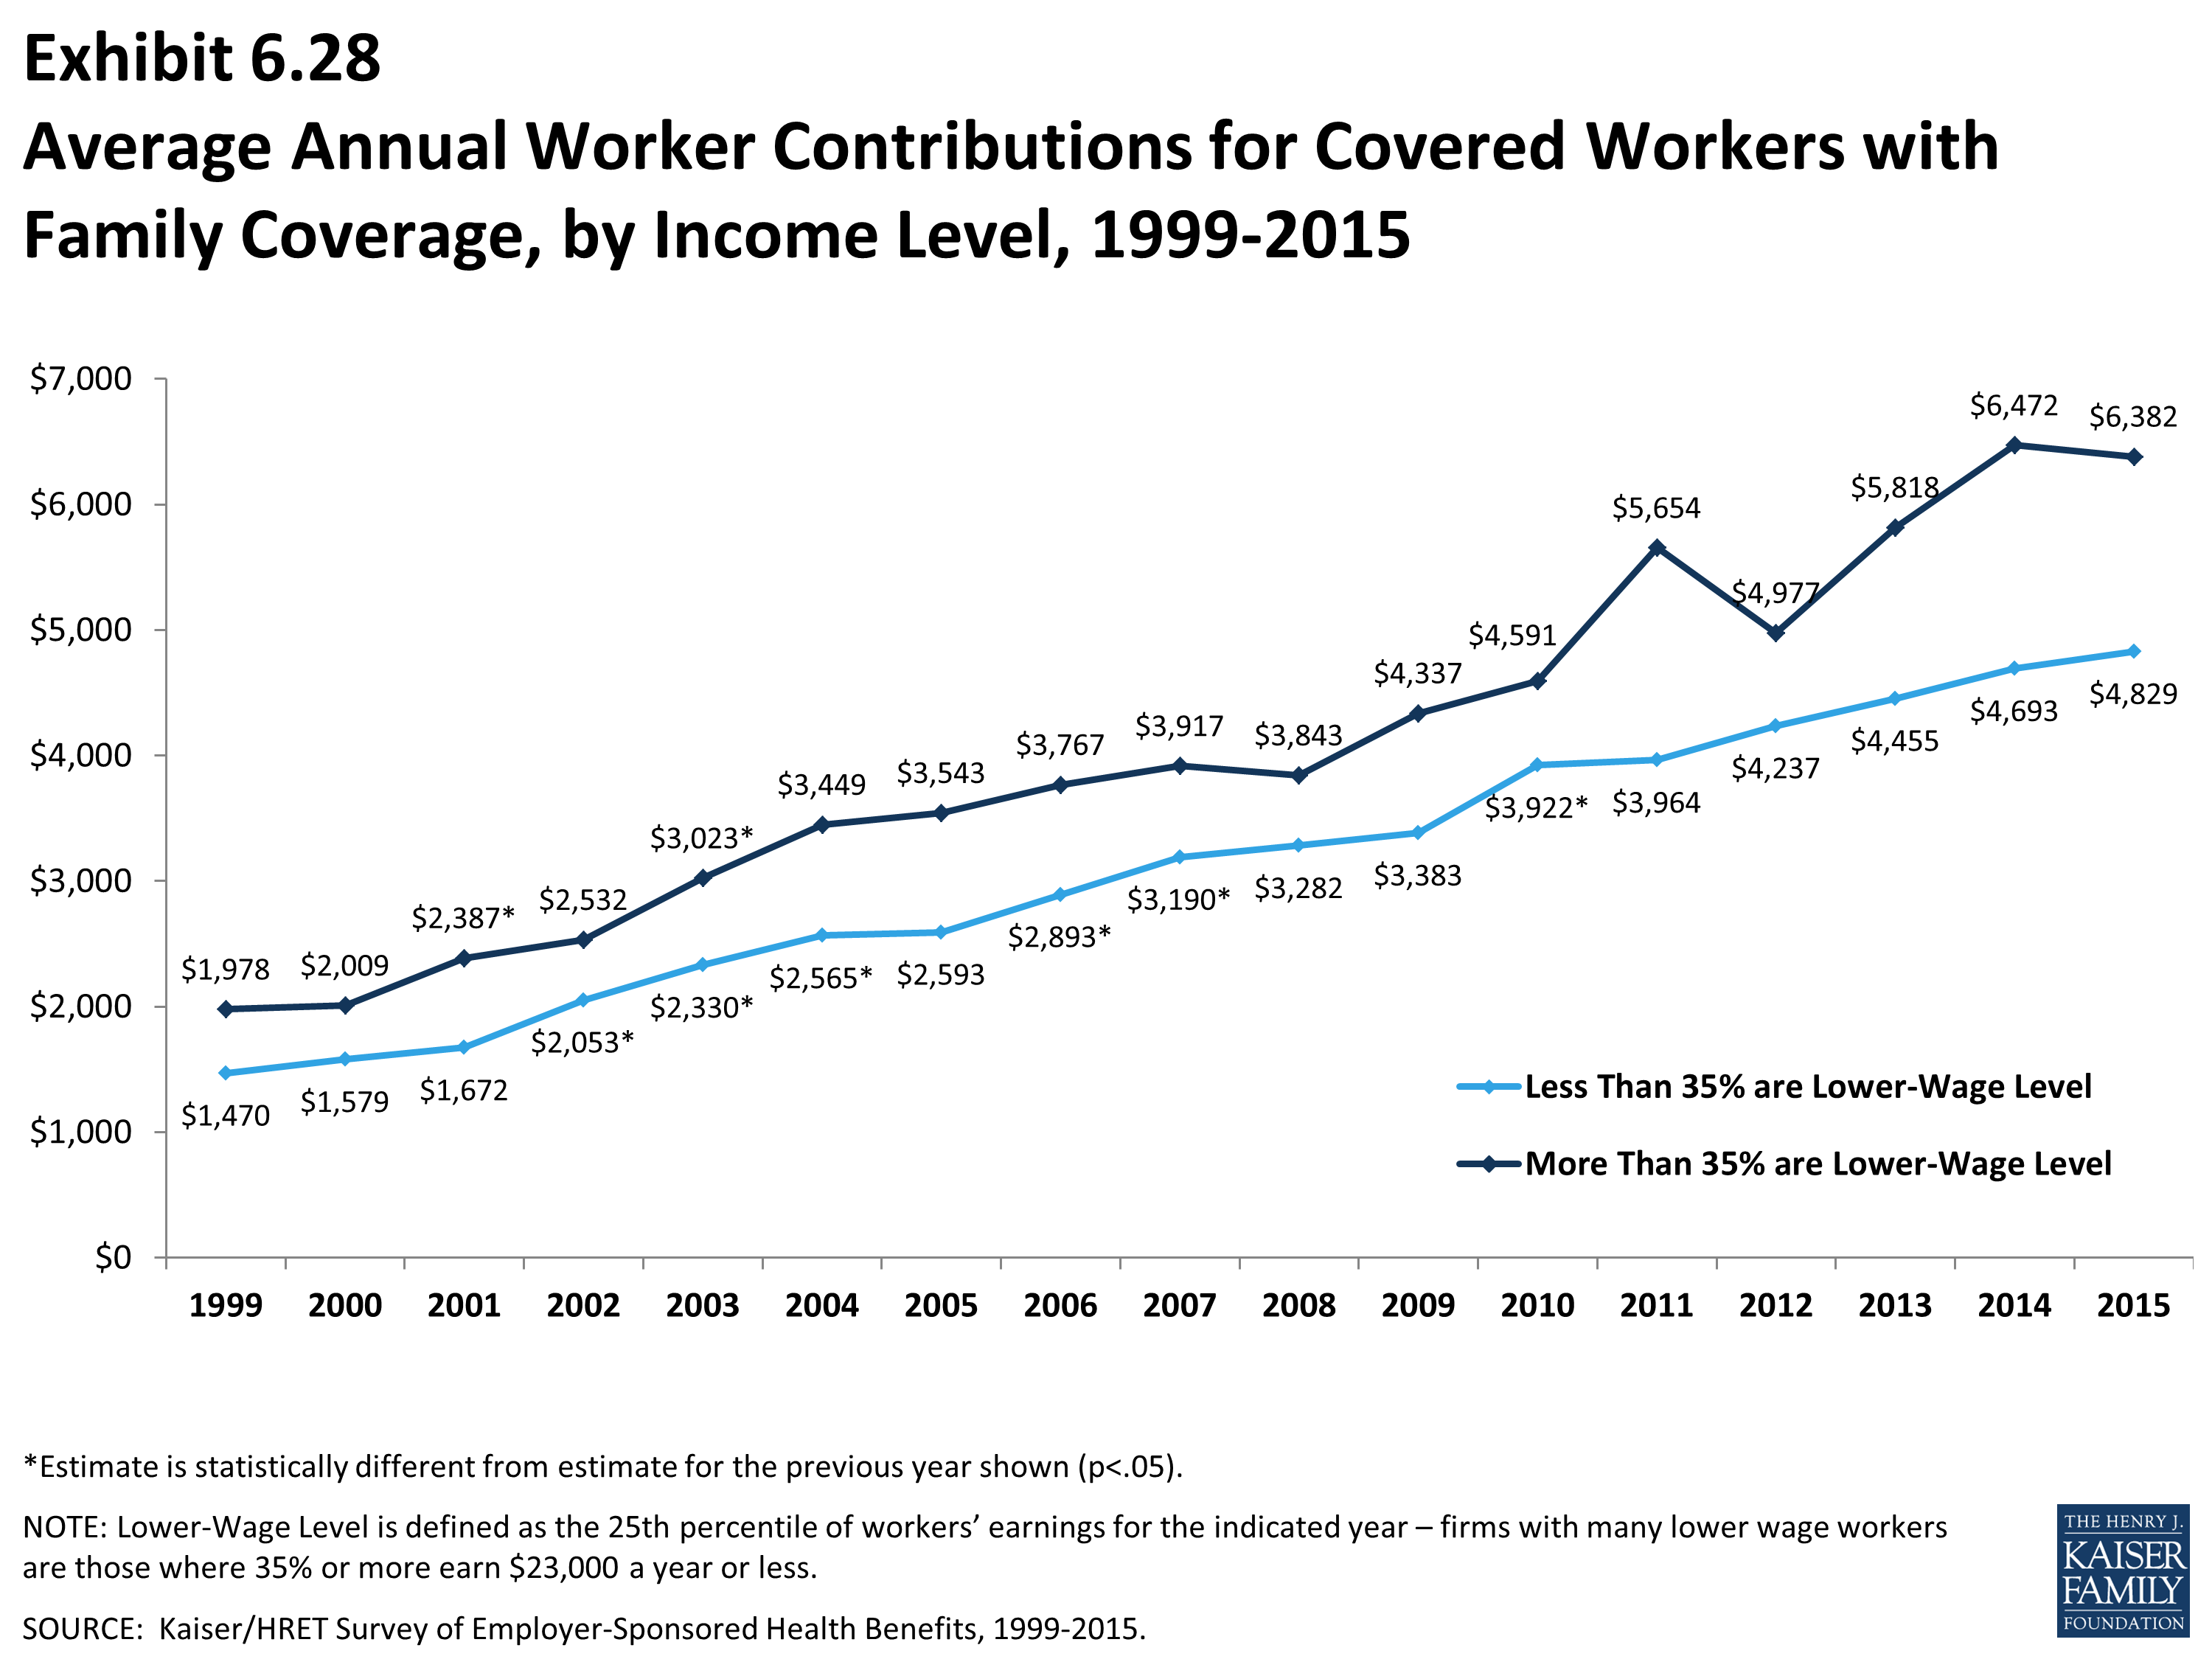
Average Annual Worker Contributions for Covered Workers with Family Coverage, by Income Level, 1999-2015
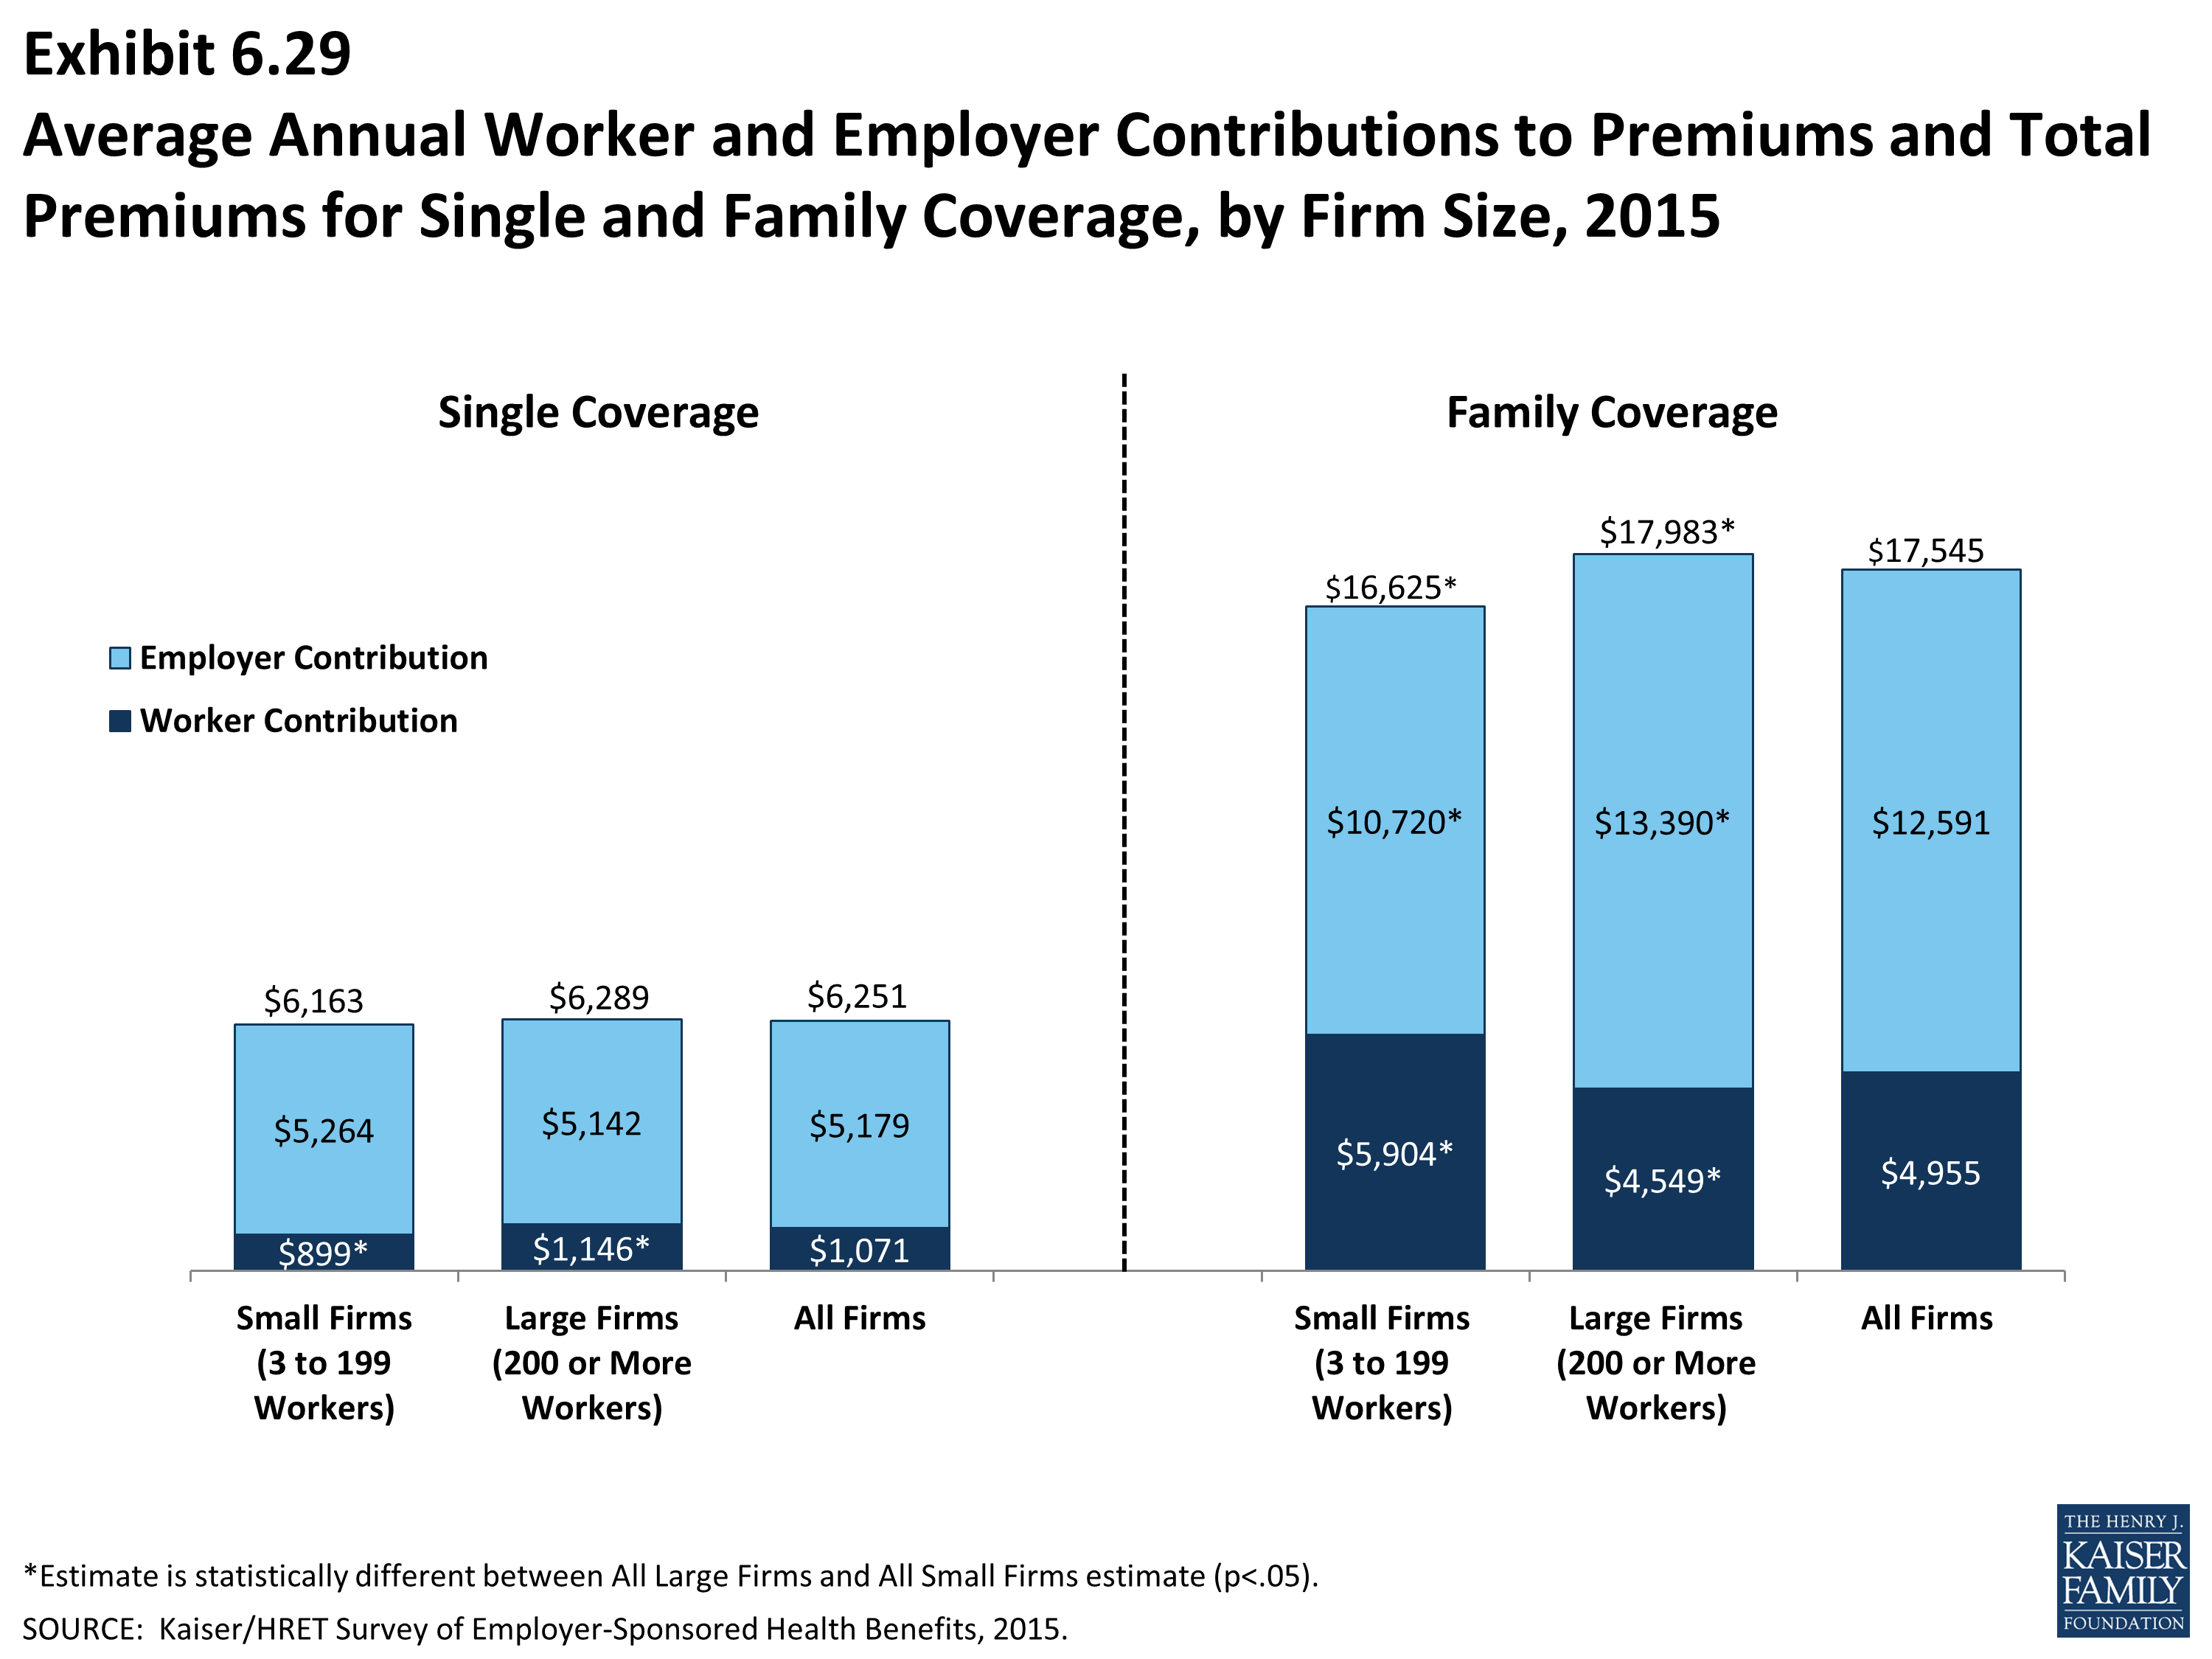
Average Annual Worker and Employer Contributions to Premiums and Total Premiums for Single and Family Coverage, by Firm Size, 2015
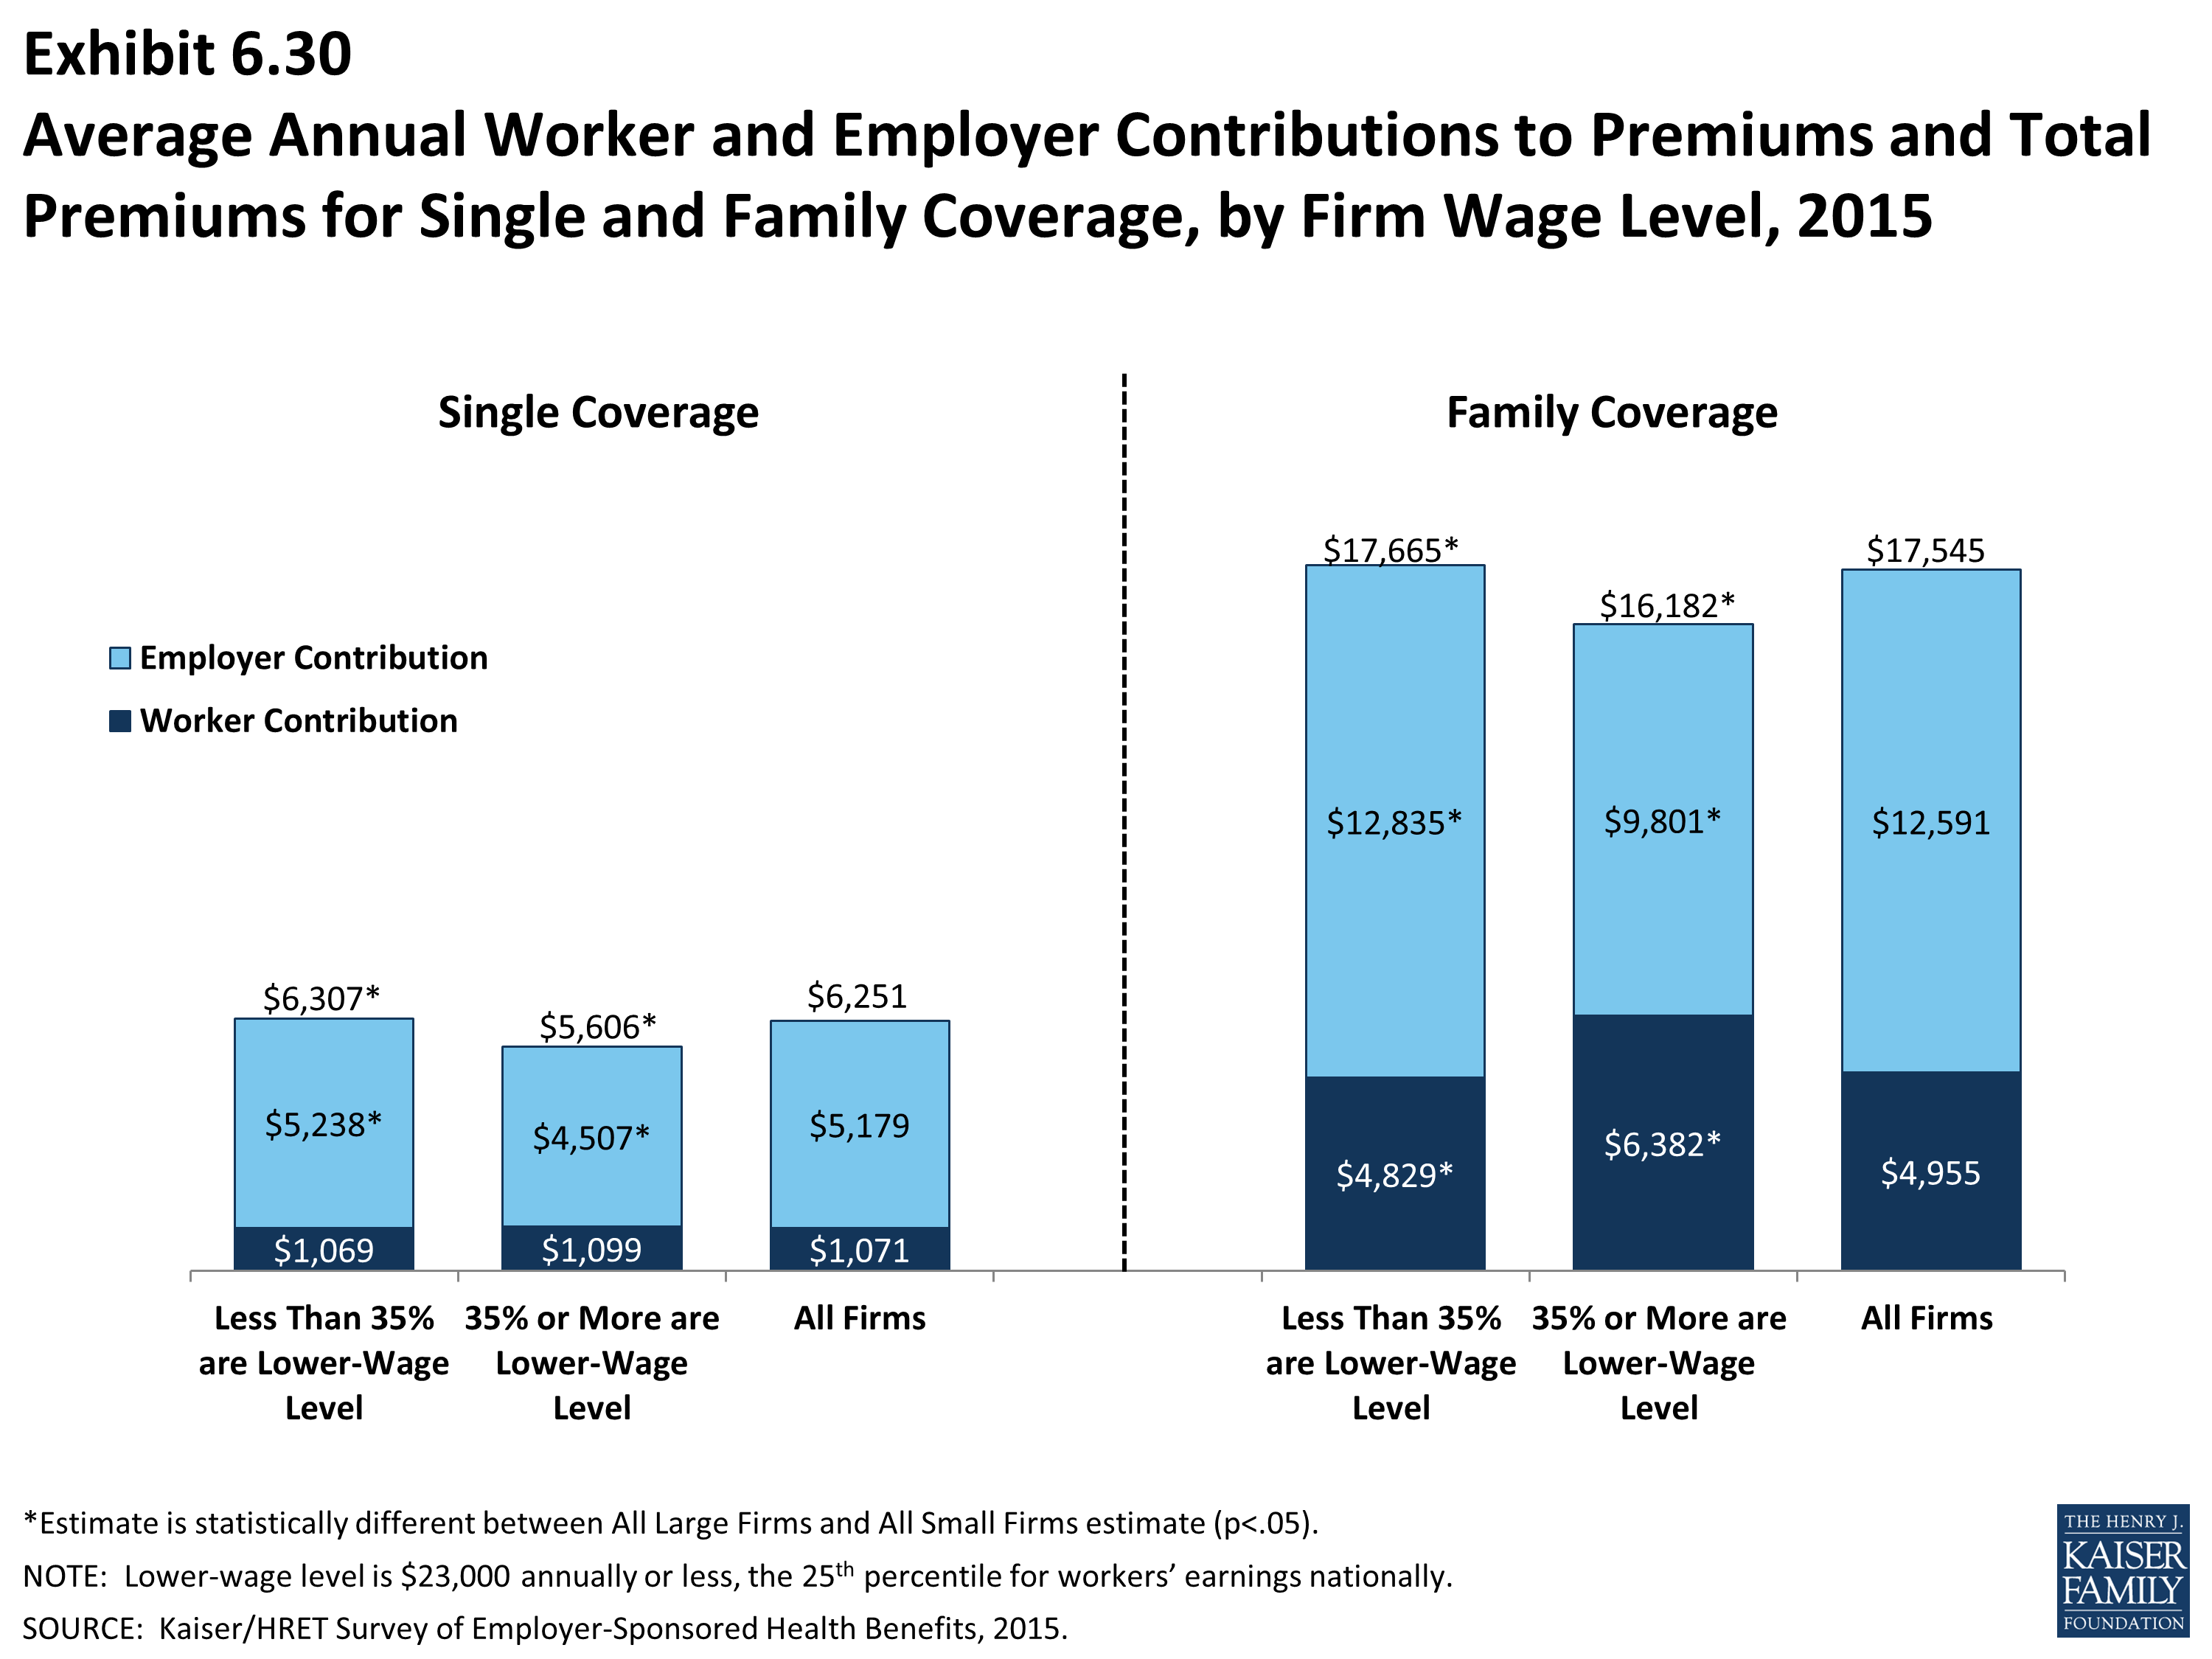
Average Annual Worker and Employer Contributions to Premiums and Total Premiums for Single and Family Coverage, by Firm Wage Level, 2015
Section Seven: Employee Cost Sharing
In addition to any required premium contributions, most covered workers face cost sharing for the medical services they use. Cost sharing for medical services can take a variety of forms, including deductibles (an amount that must be paid before most services are covered by the plan), copayments (fixed dollar amounts), and/or coinsurance (a percentage of the charge for services). The type and level of cost sharing often vary by the type of plan in which the worker is enrolled. Cost sharing may also vary by the type of service, such as office visits, hospitalizations, or prescription drugs.
The cost-sharing amounts reported here are for covered workers using services provided in-network by participating providers. Plan enrollees receiving services from providers that do not participate in plan networks often face higher cost sharing and may be responsible for charges that exceed plan allowable amounts. The framework of this survey does not allow us to capture all of the complex cost-sharing requirements in modern plans, particularly for ancillary services (such as durable medical equipment or physical therapy) or cost-sharing arrangements that vary across different settings (such as tiered networks). Therefore, we do not collect information on all plan provisions and limits that affect enrollee out-of-pocket liability.
General Annual Deductibles For Workers in Plans with Deductibles
- A general annual deductible is an amount that must be paid by enrollees before most services are covered by their health plan. Non-grandfathered health plans are required to cover some services such as preventive care without cost sharing. Some plans require enrollees to meet a service-specific deductible such as on prescription drugs or hospital admissions in lieu of or in addition to a general deductible.
- Eighty-one percent of covered workers are enrolled in a plan with a general annual deductible for single coverage, similar to 80% in 2014. Since 2010, the percentage of covered workers with a general annual deductible for single coverage has increased from 70% to 81% (Exhibit 7.2).
- The percentage of covered workers enrolled in a plan for single coverage without a general annual deductible is similar for small firms (3-199 workers) and large firms (18% and 19%) (Exhibit 7.1).
- The likelihood of having a deductible varies by plan type. Workers in HMOs are less likely to have a general annual deductible for single coverage than workers in other plan types. Fifty-eight percent of workers in HMOs do not have a general annual deductible for single coverage, compared to 28% of workers in POS plans and 15% of workers in PPOs (Exhibit 7.1). The percentage of workers enrolled in HMO plans with a general annual deductible for single coverage has increased from 28% in 2010 to 42% in 2015 (Exhibit 7.2).
- Workers in firms with many lower-wage workers (35% or more earning $23,000 or less annually) have higher average general annual deductibles for single coverage than workers in firms with fewer such workers ($1,667 vs. $1,288) (Exhibit 7.3).
- Workers without a general annual deductible often have other forms of cost sharing for medical services. For workers without a general annual deductible with single coverage, 77% in HMOs, 80% in PPOs, and 75% in POS plans are in plans that require cost sharing for hospital admissions. The percentages are similar for family coverage (Exhibit 7.4).
- The dollar amounts of general annual deductibles vary greatly by plan type and firm size.
- The average annual deductible for single coverage for covered workers in a plan with a deductible is $1,318. However, average deductibles vary considerably by plan type. The average annual deductibles for single coverage among covered workers with a deductible are $1,025 for HMOs, $958 for PPOs, $1,230 for POS plans, and $2,099 for HDHP/SOs (Exhibit 7.5).
- Deductibles for single coverage generally are higher for covered workers in small firms (3-199 workers) than for covered workers in large firms (200 or more workers) across plan types. For example, for covered workers in PPOs with a general annual deductible, the average deductible amount for single coverage in small firms is more than twice as large as the average deductible amount in large firms ($1,516 vs. $775). Overall, for covered workers in plans with a general annual deductible, the average deductible amount for single coverage in small firms (3-199 workers) is higher than the average deductible amount in large firms ($1,836 vs. $1,105) (Exhibit 7.5).
- The average general annual deductible for single coverage for covered workers in plans with a deductible has increased significantly over time. The average deductible for covered workers with a deductible is similar to last year, but significantly higher than $917 in 2010 (Exhibit 7.7).
- There is considerable variation in the dollar values of general annual deductibles for workers at different firms. For example, 27% of covered workers enrolled in a PPO plan with a general annual deductible for single coverage have a deductible of less than $500 while 11% have a deductible of $2,000 or more (Exhibit 7.11).
- For family coverage, the majority of workers with general annual deductibles have an aggregate deductible, meaning all family members’ out-of-pocket expenses count toward meeting the deductible amount. Among those with a general annual deductible for family coverage, the percentage of covered workers with an average aggregate general annual deductible is 56% for workers in HMOs, 62% for workers in PPOs, 77% for workers in POS plans and 82% for workers in HDHP/SOs (Exhibit 7.13).
- The average amounts for workers with an aggregate deductible for family coverage are $2,758 for HMOs, $2,012 for PPOs, $2,467 for POS plans, and $4,332 for HDHP/SOs (Exhibit 7.14). Deductible amounts for aggregate family deductibles are similar to last year for all plan types (Exhibit 7.15).
- The other type of family deductible, a separate per-person deductible, requires each family member to meet a separate per-person deductible amount before the plan covers expenses for that member. Many plans with separate per-person family deductibles consider the deductible met for all family members if a prescribed number of family members each reaches his or her separate deductible amounts (Exhibit 7.18). Plans may also require each family member to meet a separate per-person deductible until the family’s combined spending reaches a specified dollar amount.
- For covered workers in health plans that have separate per-person general annual deductible amounts for family coverage, the average plan deductibles are $852 for HMOs, $944 for PPOs, $1,153 for POS plans, and $1,965 for HDHP/SOs (Exhibit 7.14).
- Most covered workers in plans with a separate per-person general annual deductible for family coverage have a limit to the number of family members required to meet the separate deductible amounts (Exhibit 7.18).1 Among those workers in plans with a limit on the number of family members, the most frequent number of family members required to meet the separate deductible amounts is two for HMO, PPO, and POS plans, and three for HDHP/SO plans (Exhibit 7.19).
- The majority of covered workers with a general annual deductible are in plans where the deductible does not have to be met before certain services, such as physician office visits or prescription drugs, are covered.
- Large majorities of covered workers (84% in HMOs, 68% in PPOs, and 74% in POS plans) with general annual deductibles are enrolled in plans where the deductible does not have to be met before physician office visits for primary care are covered (Exhibit 7.21).
- Similarly, among workers with a general annual deductible, large shares of covered workers in HMOs (97%), PPOs (92%), and POS plans (92%) are enrolled in plans where the general annual deductible does not have to be met before prescription drugs are covered (Exhibit 7.21).
General Annual Deductibles Among All Covered Workers
- As discussed above, the share of covered workers in plans with a general annual deductible has increased significantly over time: from 55% in 2006, to 70% in 2010, to 81% in 2015, as have the average deductible amounts for covered workers in plans with deductibles: from $584 in 2006, to $917 in 2010, to $1,318 in 2015. Neither trend by itself captures the full impact of changes in deductibles on covered workers. We can look at the average impact of both trends together on covered workers by assigning a zero deductible value to covered workers in plans with no deductible and looking at how the resulting averages change over time. These average deductible amounts are lower in any given year but the changes over time reflect both the higher deductibles in plans with deductibles and the fact that more workers face them.
- Using this approach, the average general annual deductible for single coverage for all covered workers in 2015 is $1,077 (Exhibit 7.32).
- The 2015 value is 67% higher than the average general annual deductible of $646 in 2010 and 255% higher than the average general annual deductible of $303 in 2006 (Exhibit 7.32).
- Another way to look at deductibles is to look at the percentage of all covered workers who are in a plan with a deductible that exceeds certain thresholds. Forty-six percent of covered workers are in plans with a general annual deductible of $1,000 or more for single coverage, similar to the percentage (41%) in 2014 (Exhibit 7.9).
- Over the last five years, the percentage of covered workers with a general annual deductible of $1,000 or more for single coverage has grown substantially, increasing from 27% to 46% (Exhibit 7.9). The share of workers in large firms with a deductible of $1,000 or more increased significantly since 2014; from 32% to 39%.
- Workers in small firms (3-199 workers) are more likely to have a general annual deductible of $1,000 or more for single coverage than workers in large firms (200 or more workers) (63% vs. 39%) (Exhibit 7.8).
- Nineteen percent of covered workers are enrolled in a plan with a deductible of $2,000 or more. Thirty-six percent of covered workers at small firms (3-199 workers) have a general annual deductible of $2,000 or more, in contrast to just 12% in large firms (Exhibit 7.8).
Hospital and Outpatient Surgery Cost Sharing
- Whether or not a worker has a general annual deductible, most workers face additional types of cost sharing (such as a copayment, coinsurance, or a per diem charge) when admitted to a hospital or having outpatient surgery. The distribution of workers with cost sharing for hospital and outpatient surgery does not equal 100% as workers may face a combination of types of cost sharing. In addition, the average copayment and coinsurance rates for hospital admissions include workers who may have a combination of these types of cost sharing.
- For hospital admissions, 65% of covered workers have coinsurance and 14% have copayments. Lower percentages of workers have per day (per diem) payments (4%), a separate hospital deductible (2%), or both copayments and coinsurance (11%), while 16% have no additional cost sharing for hospital admissions after any general annual deductible has been met. For covered workers in HMO plans, copayments are more common (35%) and coinsurance (31%) is less common than in other plan types (Exhibit 7.22).
- The percentage of covered workers in a plan that requires coinsurance for hospital admissions has increased from 55% in 2011 to 65% in 2015 (Exhibit 7.22).
- The average coinsurance rate is 19%; the average copayment is $308 per hospital admission; the average per diem charge is $281; and the average separate annual hospital deductible is $1,006 (Exhibit 7.24).
- The cost-sharing provisions for outpatient surgery are similar to those for hospital admissions, as most workers have coinsurance or copayments. Sixty-seven percent of covered workers have coinsurance and 15% have copayments for an outpatient surgery episode. In addition, 1% has a separate annual deductible for outpatient surgery, and 5% have both copayments and coinsurance, while 17% have no additional cost sharing after any general annual deductible has been met (Exhibit 7.23).
- For covered workers with cost sharing for outpatient surgery, the average coinsurance is 19% and the average copayment is $181 (Exhibit 7.24).
Cost Sharing for Physician Office Visits
- The majority of covered workers are enrolled in health plans that require cost sharing for an in-network physician office visit, in addition to any general annual deductible2.
- The most common form of physician office visit cost sharing for in-network services is copayments. Sixty-eight percent of covered workers have a copayment for a primary care physician office visit and 23% have coinsurance. For office visits with a specialty physician, 68% of covered workers have copayments and 24% have coinsurance. Workers in HMOs, PPOs, and POS plans are much more likely to have copayments than workers in HDHP/SOs for both primary care and specialty care physician office visits. The majority of workers in HDHP/SOs have coinsurance (64%) or no cost sharing after the general annual plan deductible is met (19%) for primary care physician office visits (Exhibit 7.25).
- Among covered workers with a copayment for in-network physician office visits, the average copayment is $24 for primary care and $37 for specialty physician office visits (Exhibit 7.26), similar to $24 and $36 reported in 2014.
- Among workers with coinsurance for in-network physician office visits, the average coinsurance rates are 18% for a visit with a primary care physician and 19% for a visit with a specialist (Exhibit 7.26).
Out-Of-Pocket Maximum Amounts
- Most covered workers are in a plan that partially or totally limits the cost sharing that a plan enrollee must pay in a year. These limits are generally referred to as out-of-pocket maximum amounts. The Affordable Care Act (ACA) requires that non-grandfathered health plans have an out-of-pocket maximum of $6,600 or less for single coverage and $13,200 for family coverage for 2015. Many plans have complex out-of-pocket structures, increasing the difficulty of accurately collecting information on this element of plan design.
- In 2015, 98% percent of covered workers have an out-of-pocket maximum for single coverage; significantly more than 82% in 2010.
- For covered workers with out-of-pocket maximums, there is wide variation in spending limits.
- Seventeen percent of covered workers with an out-of-pocket maximum for single coverage have an out-of-pocket maximum of less than $2,000, while 13% have an out-of-pocket maximum of $6,000 or more (Exhibit 7.31).
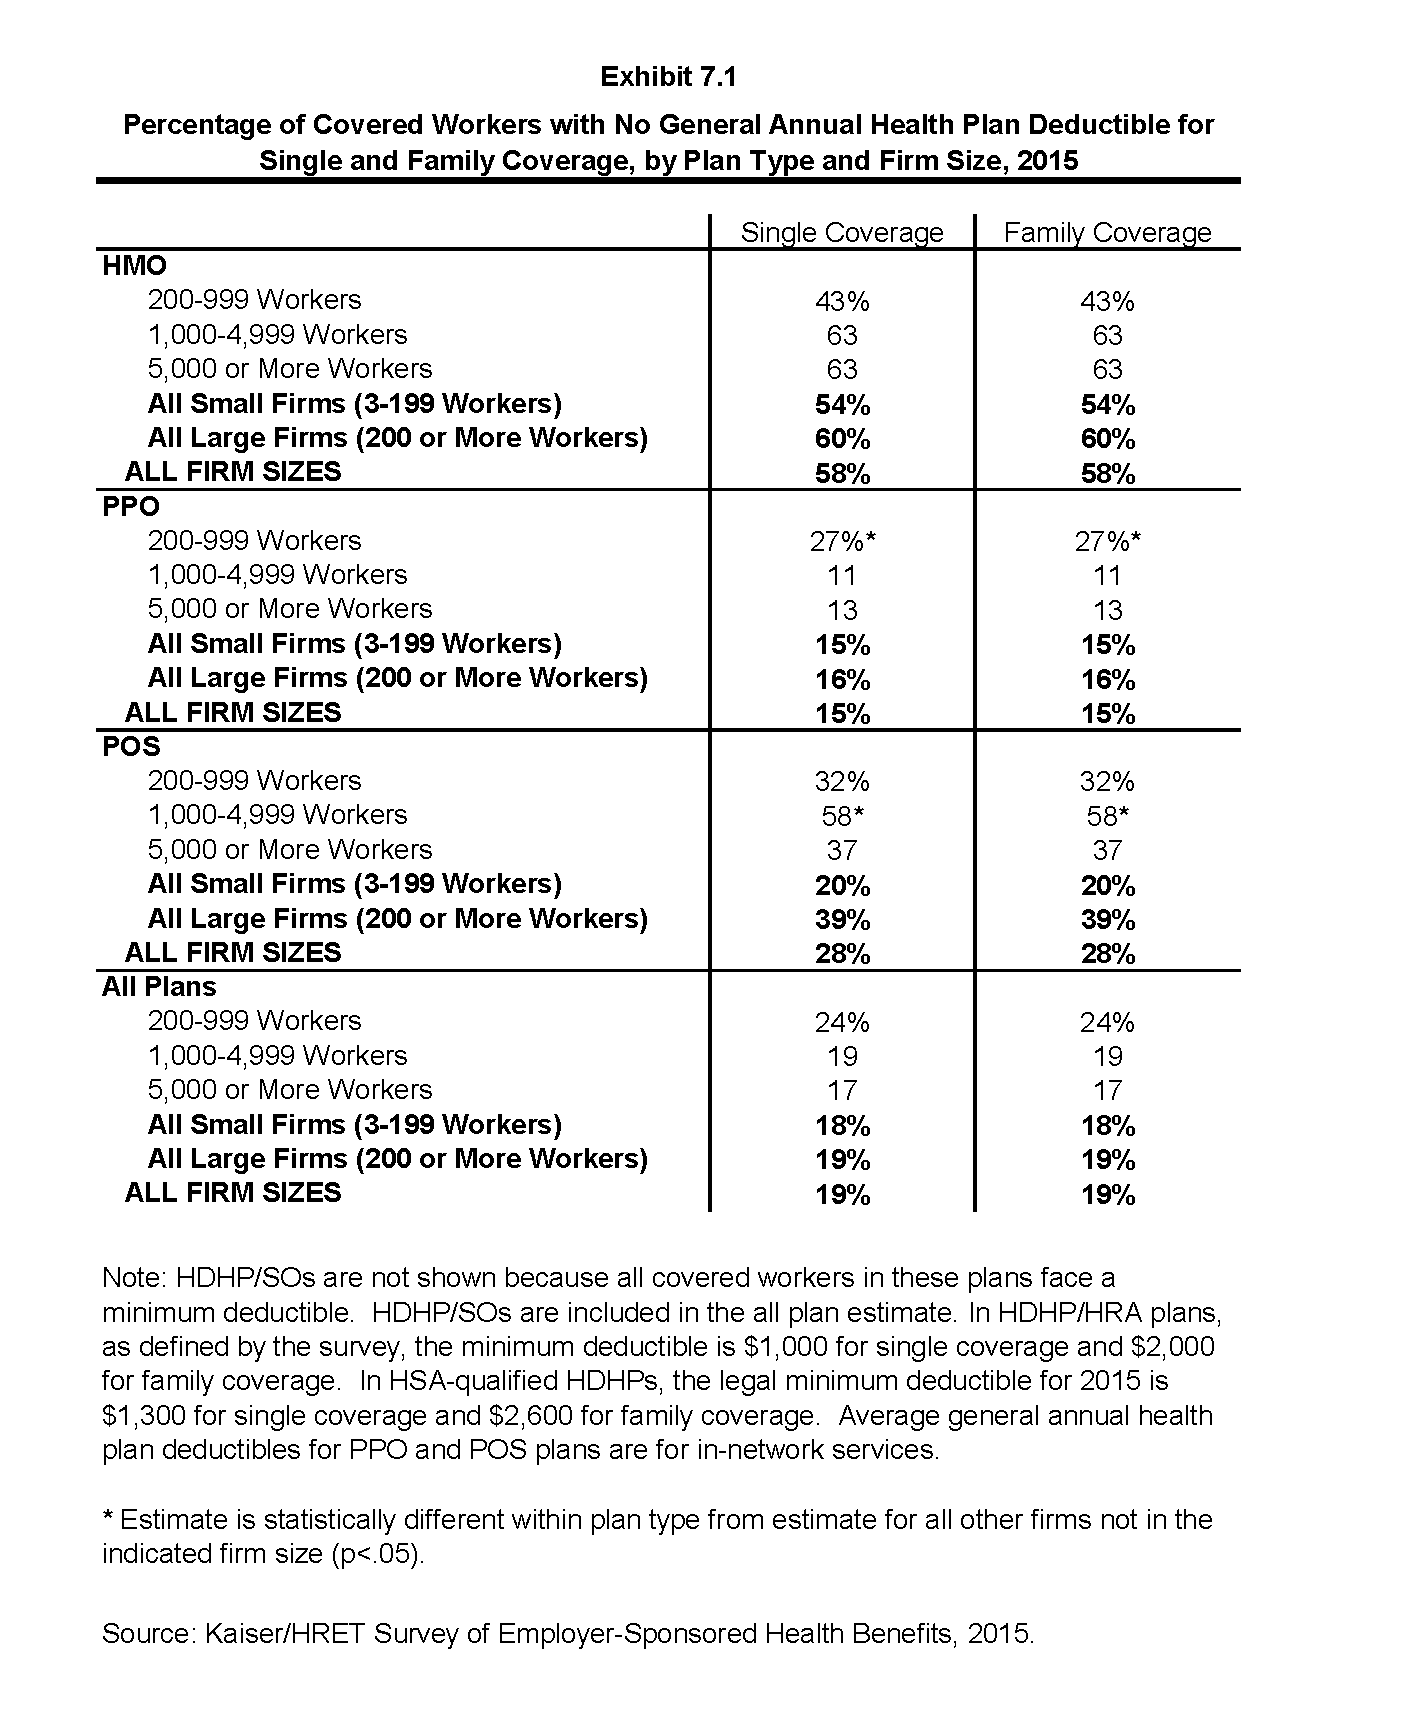
Percentage of Covered Workers with No General Annual Health Plan Deductible for Single and Family Coverage, by Plan Type and Firm Size, 2015
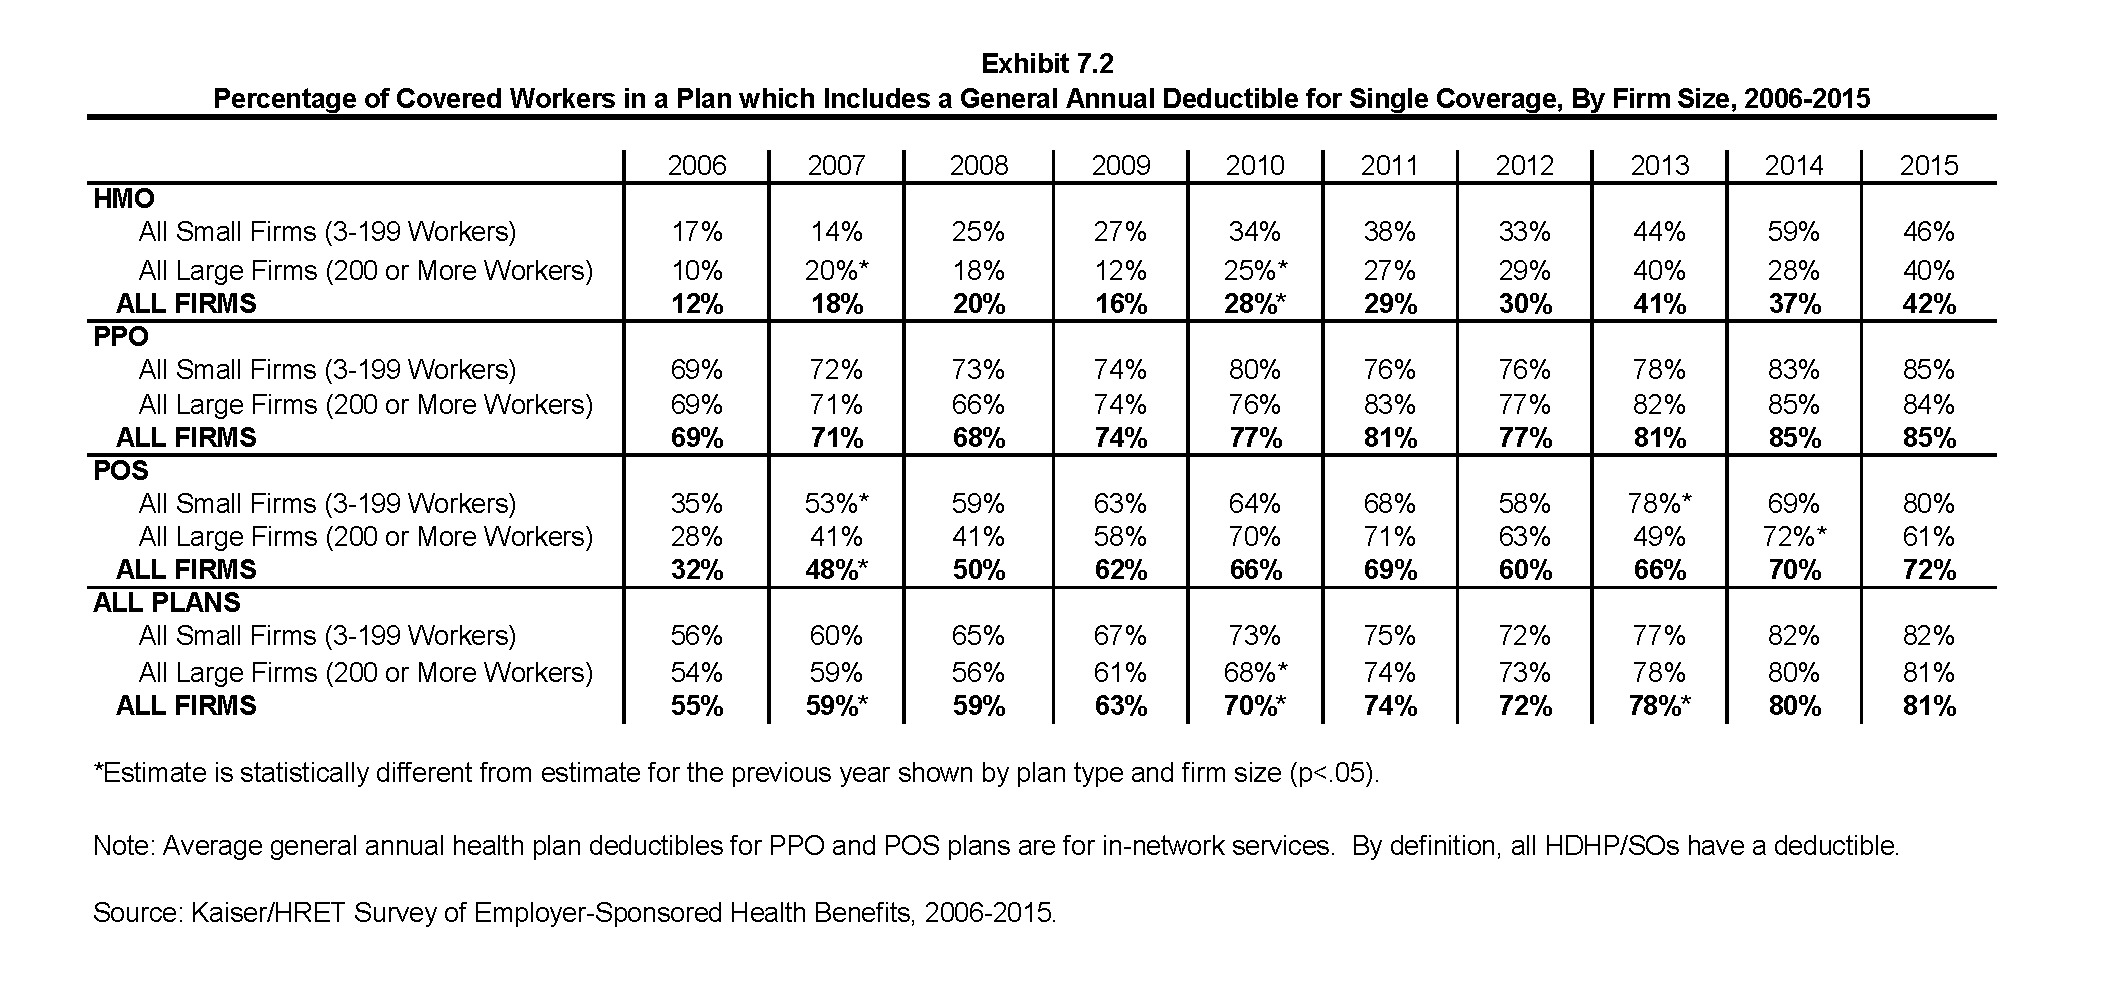
Percentage of Covered Workers in a Plan which Includes a General Annual Deductible for Single Coverage, By Firm Size, 2006-2015
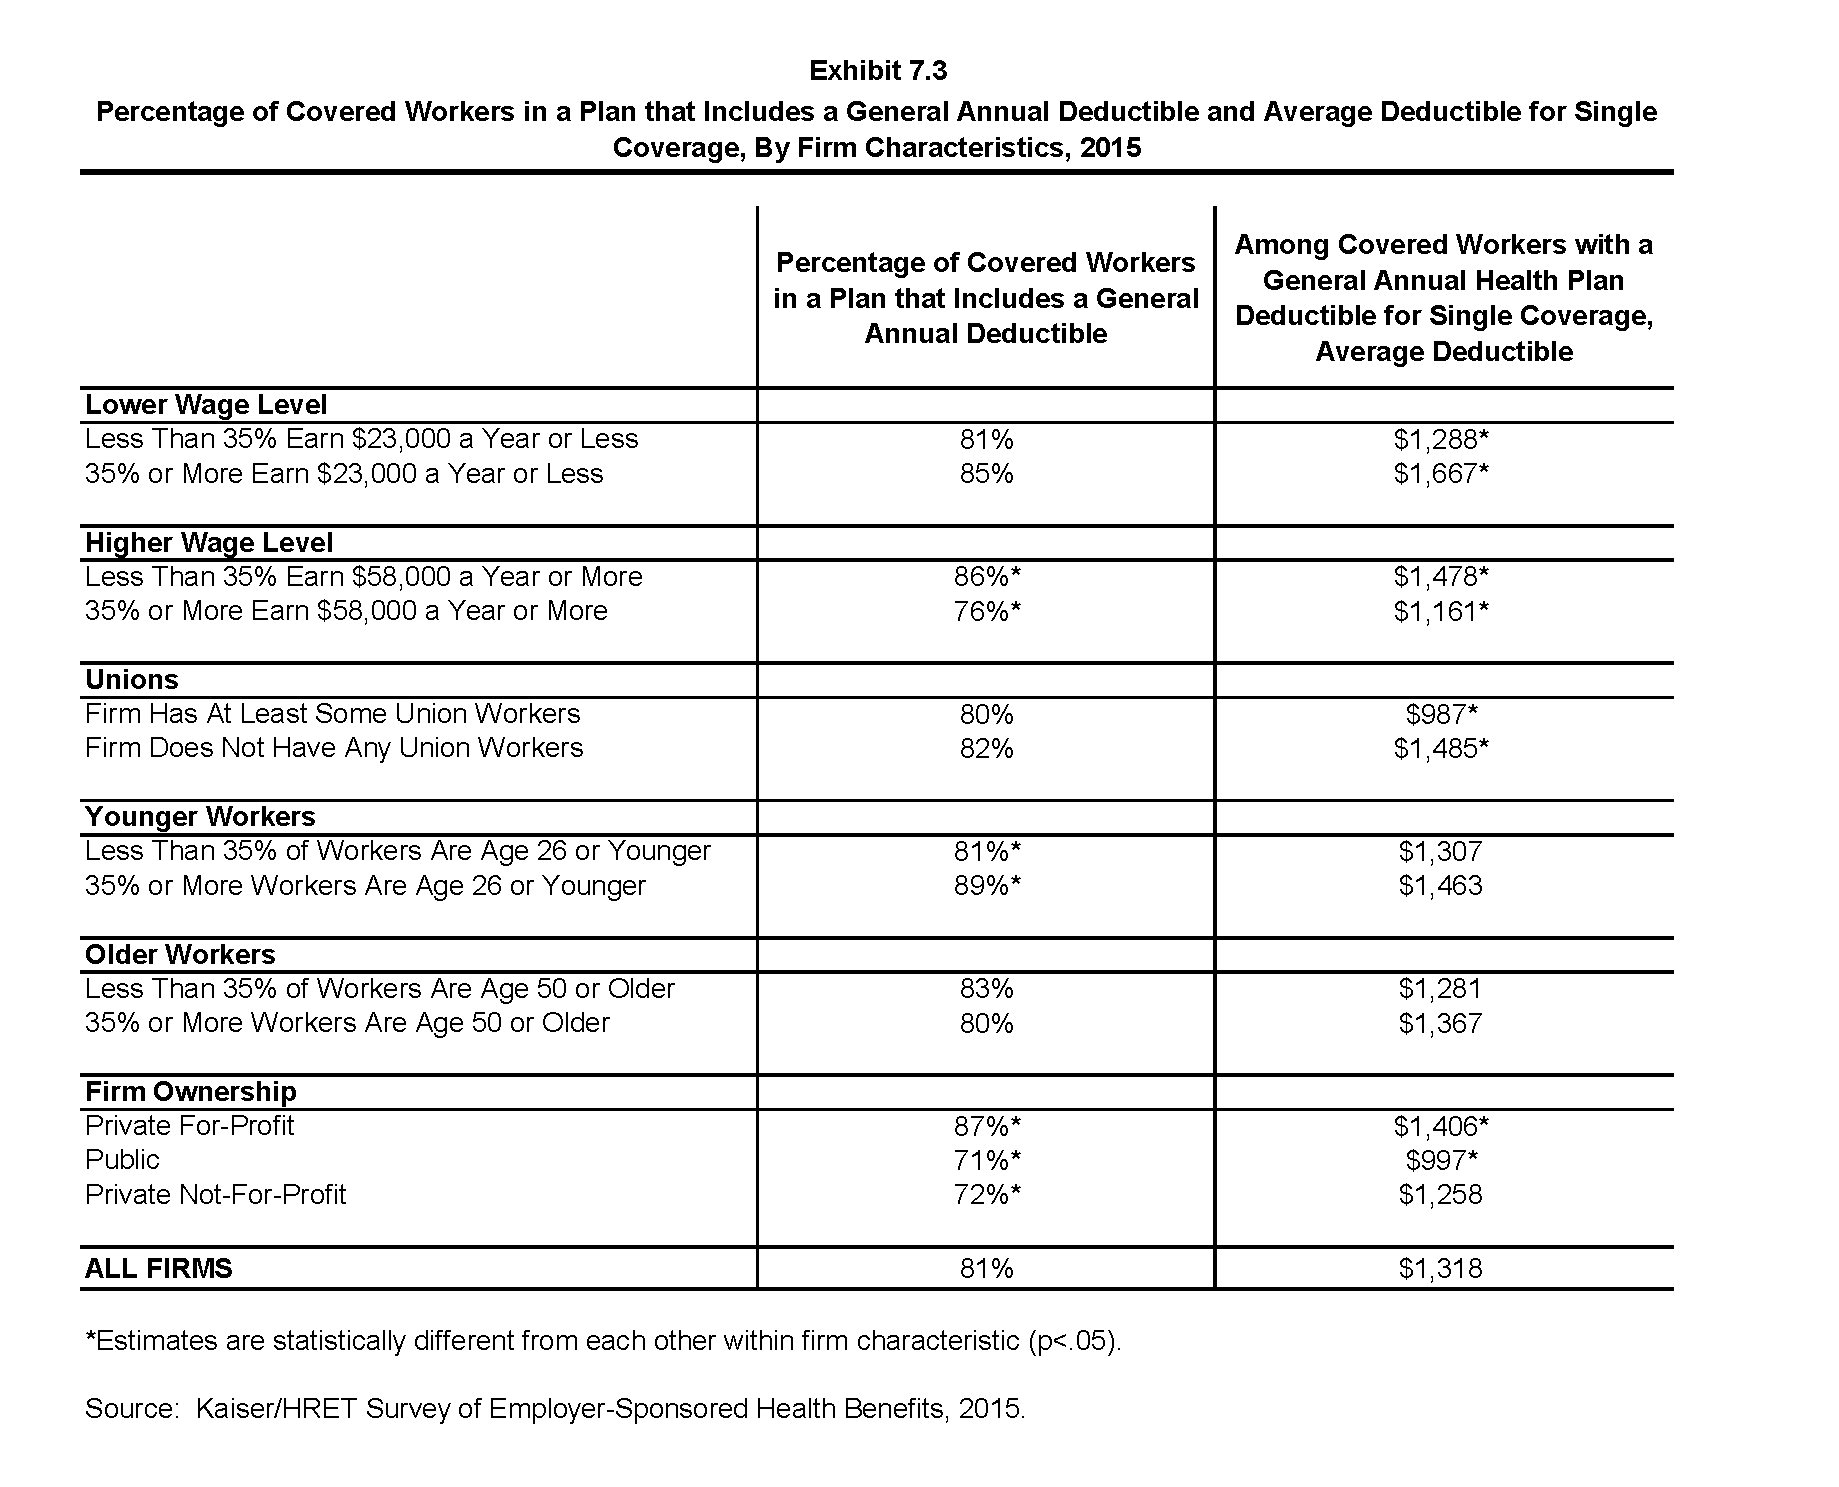
Percentage of Covered Workers in a Plan that Includes a General Annual Deductible and Average Deductible for Single Coverage, By Firm Characteristics, 2015
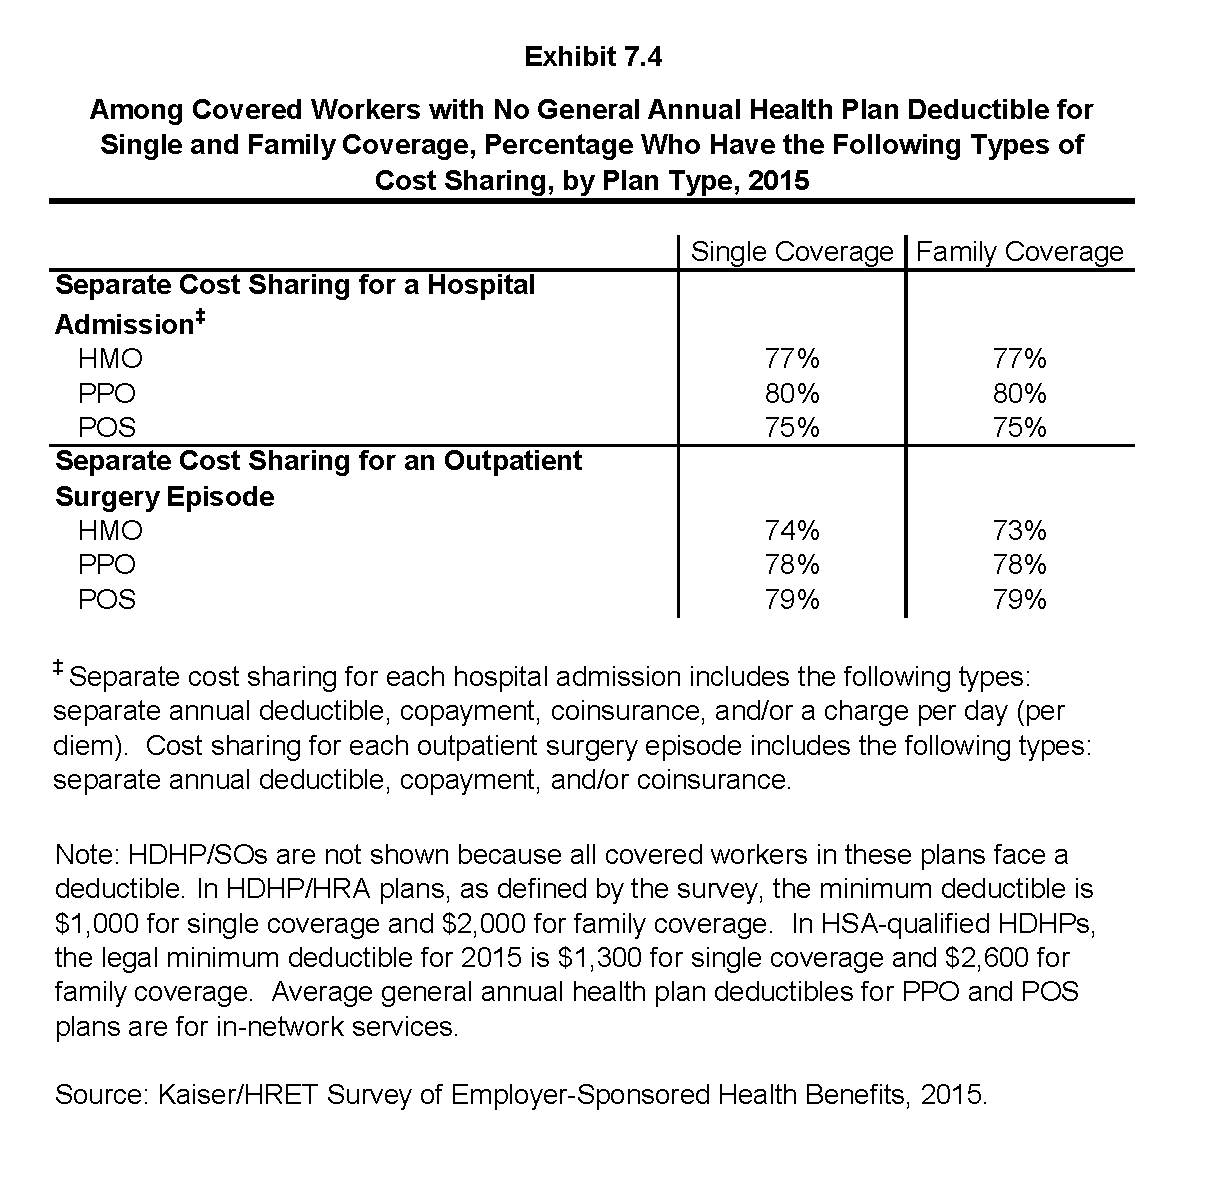
Among Covered Workers with No General Annual Health Plan Deductible for Single and Family Coverage, Percentage Who Have the Following Types of Cost Sharing, by Plan Type, 2015
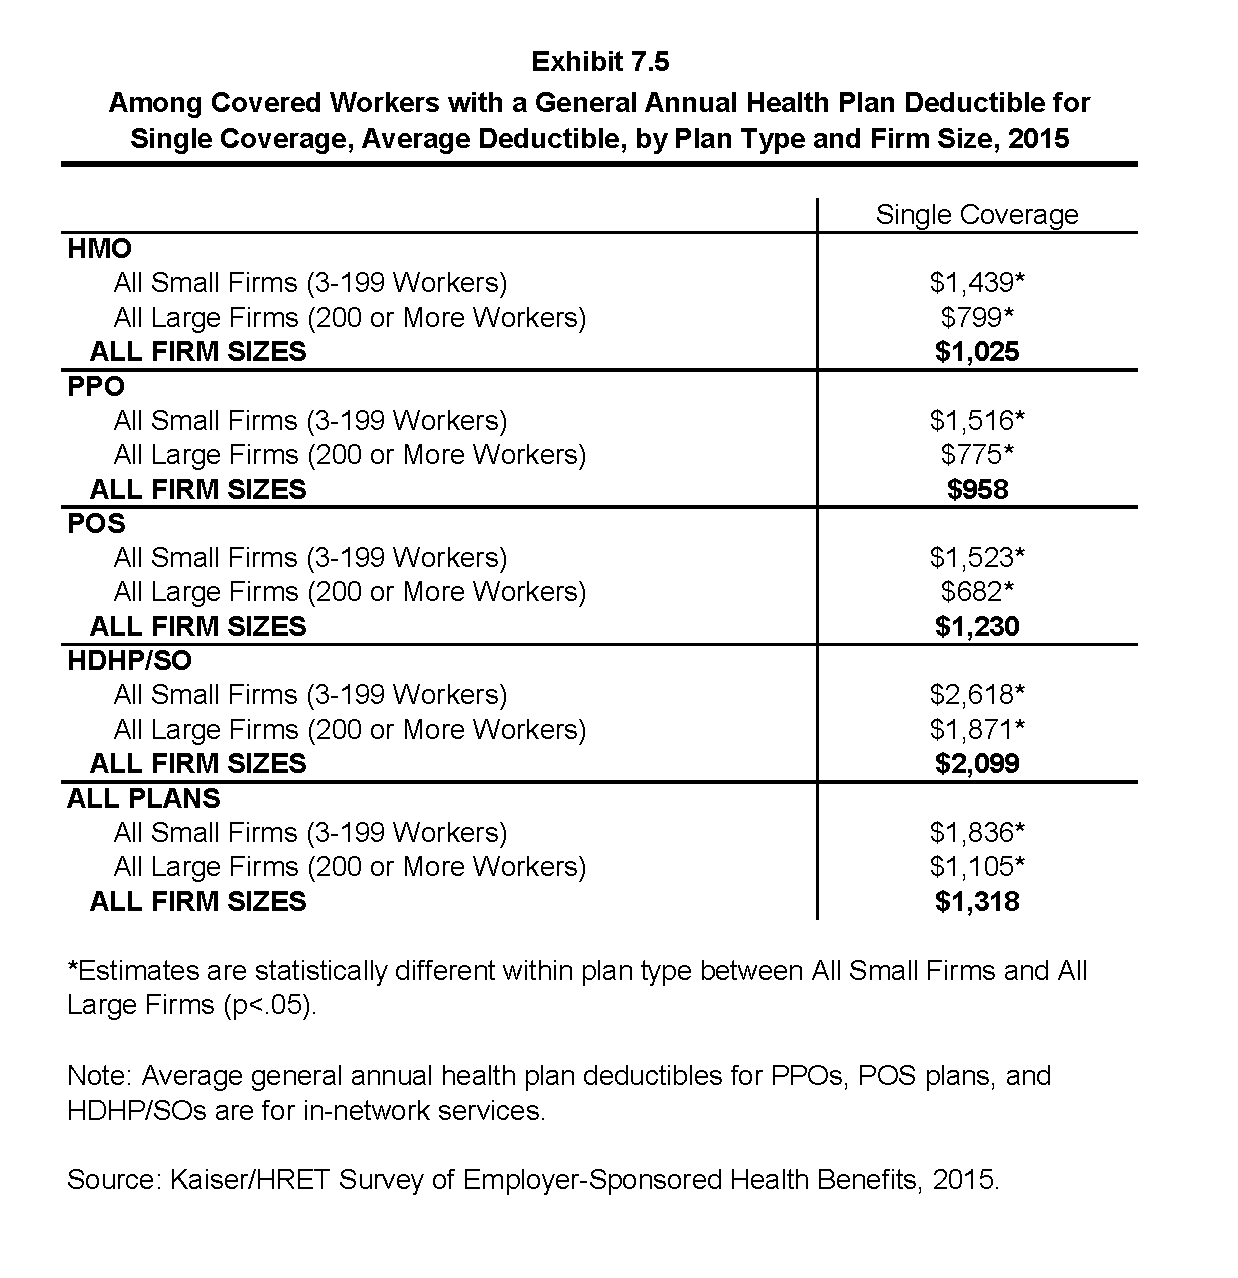
Among Covered Workers with a General Annual Health Plan Deductible for Single Coverage, Average Deductible, by Plan Type and Firm Size, 2015
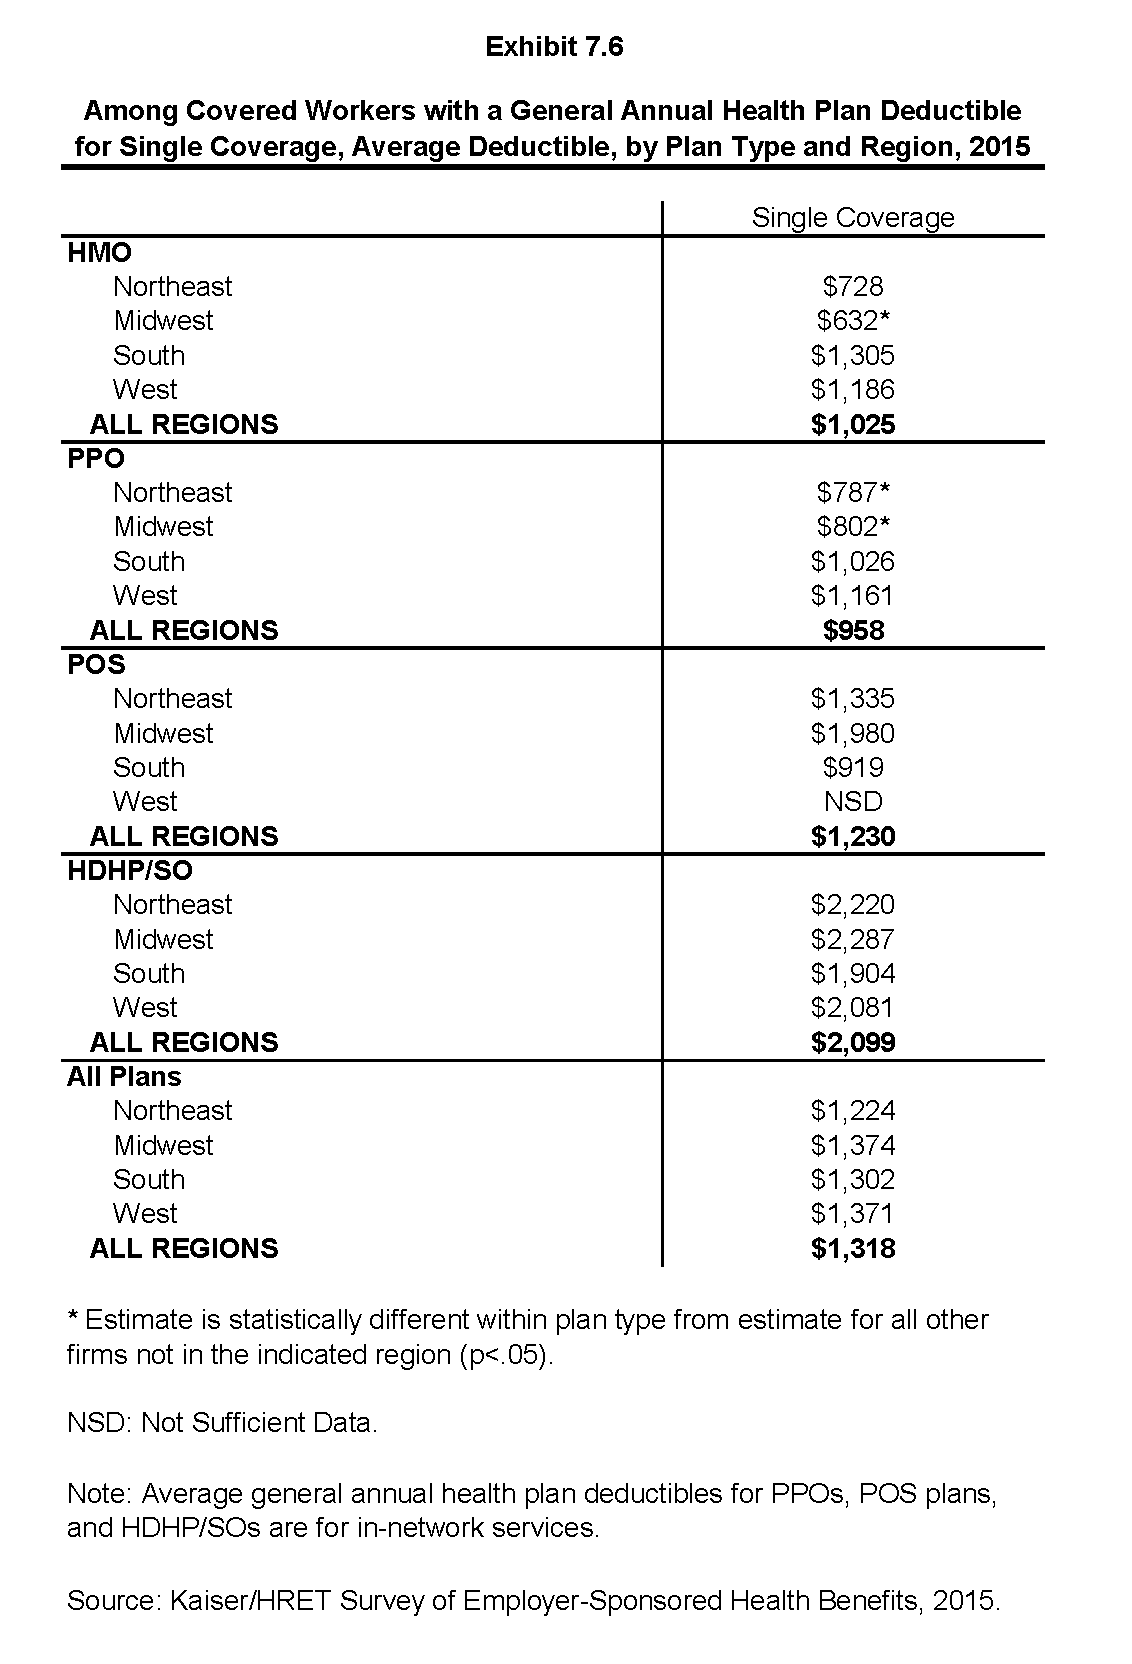
Among Covered Workers with a General Annual Health Plan Deductible for Single Coverage, Average Deductible, by Plan Type and Region, 2015
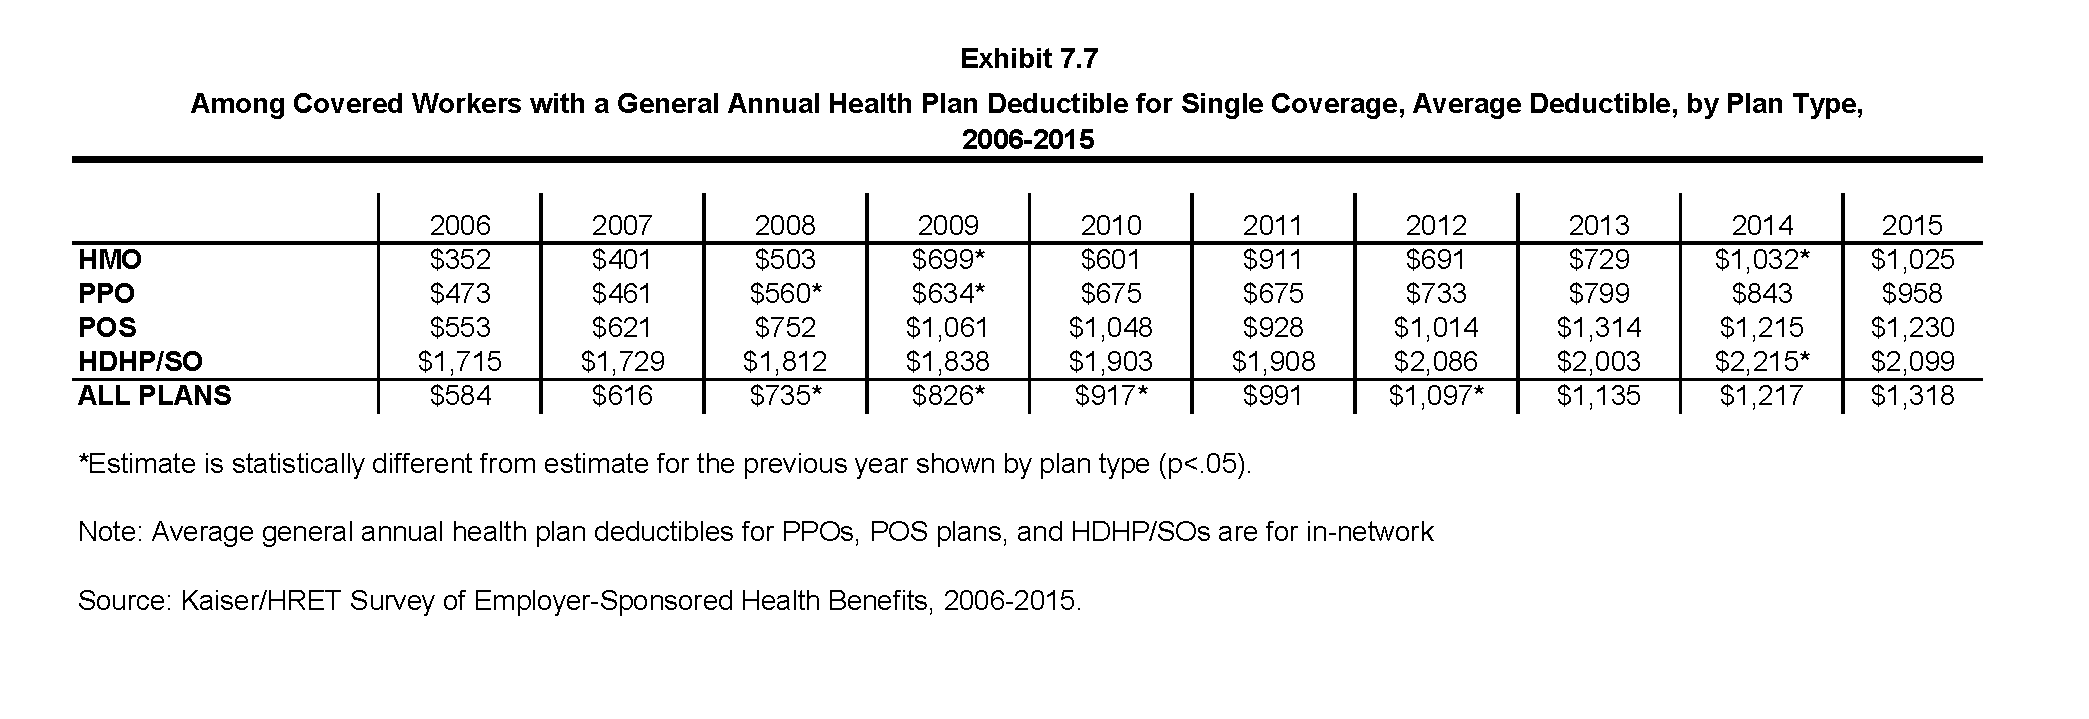
Among Covered Workers with a General Annual Health Plan Deductible for Single Coverage, Average Deductible, by Plan Type, 2006-2015
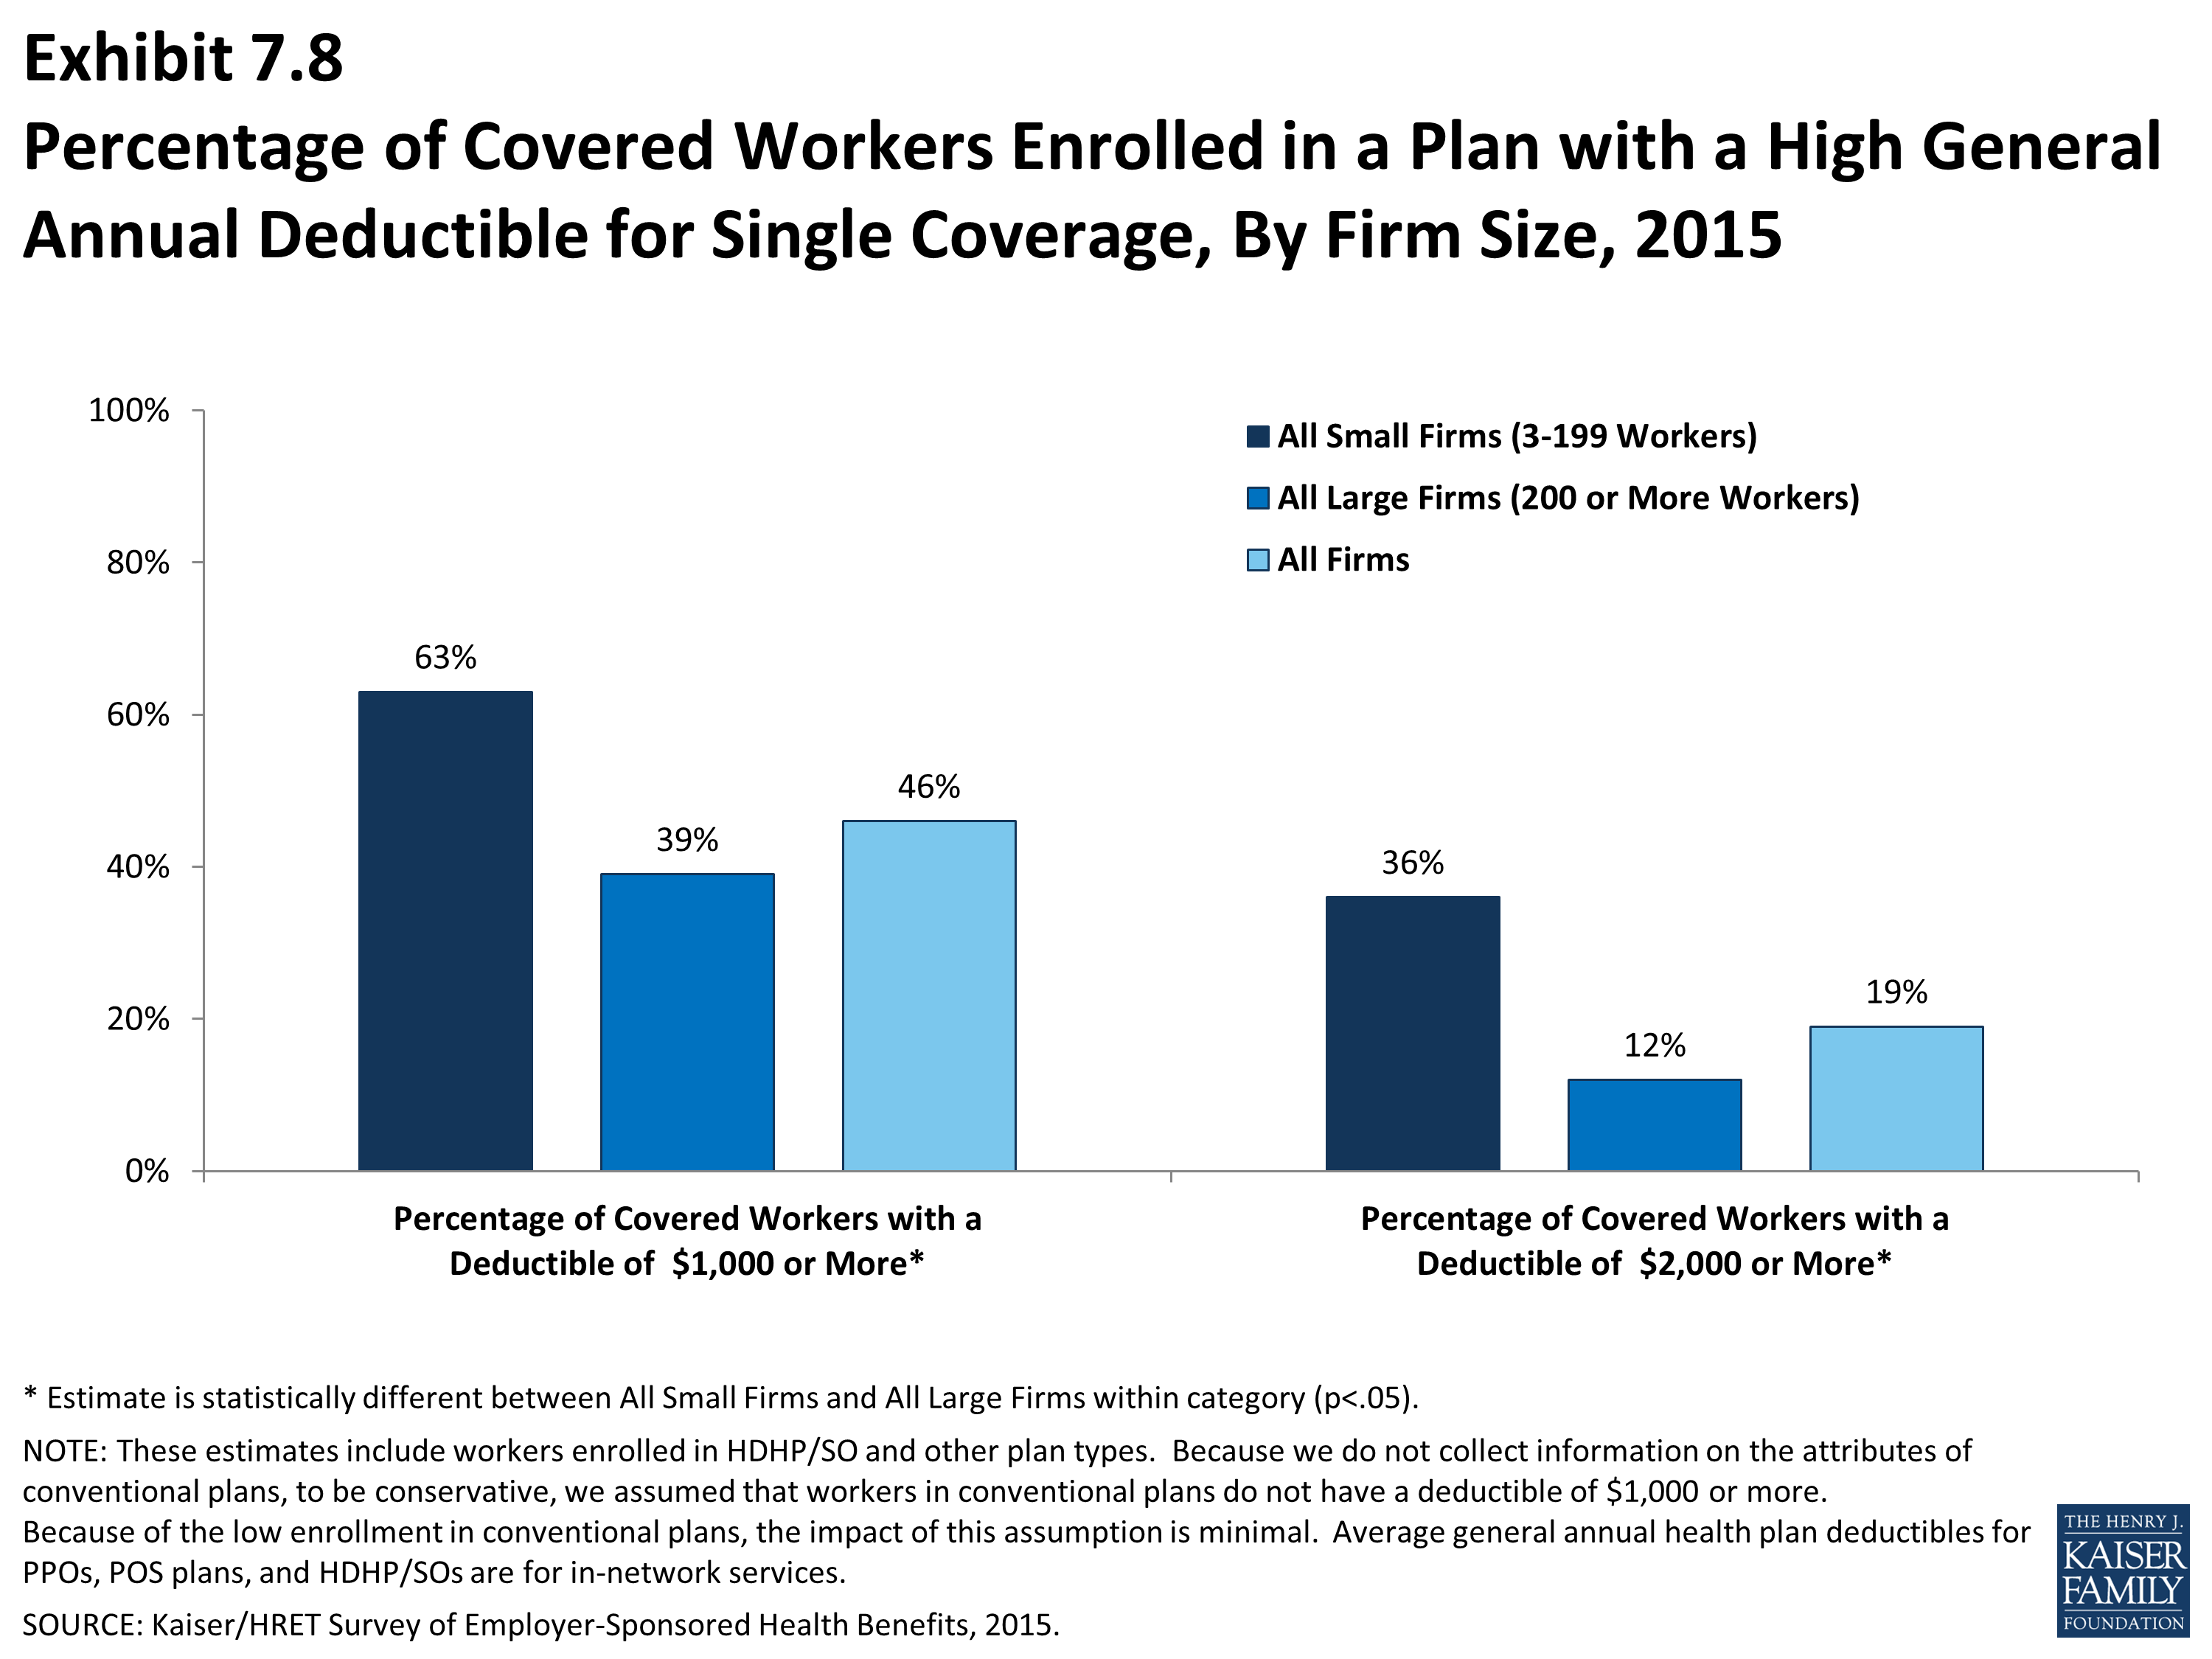
Percentage of Covered Workers Enrolled in a Plan with a High General Annual Deductible for Single Coverage, By Firm Size, 2015
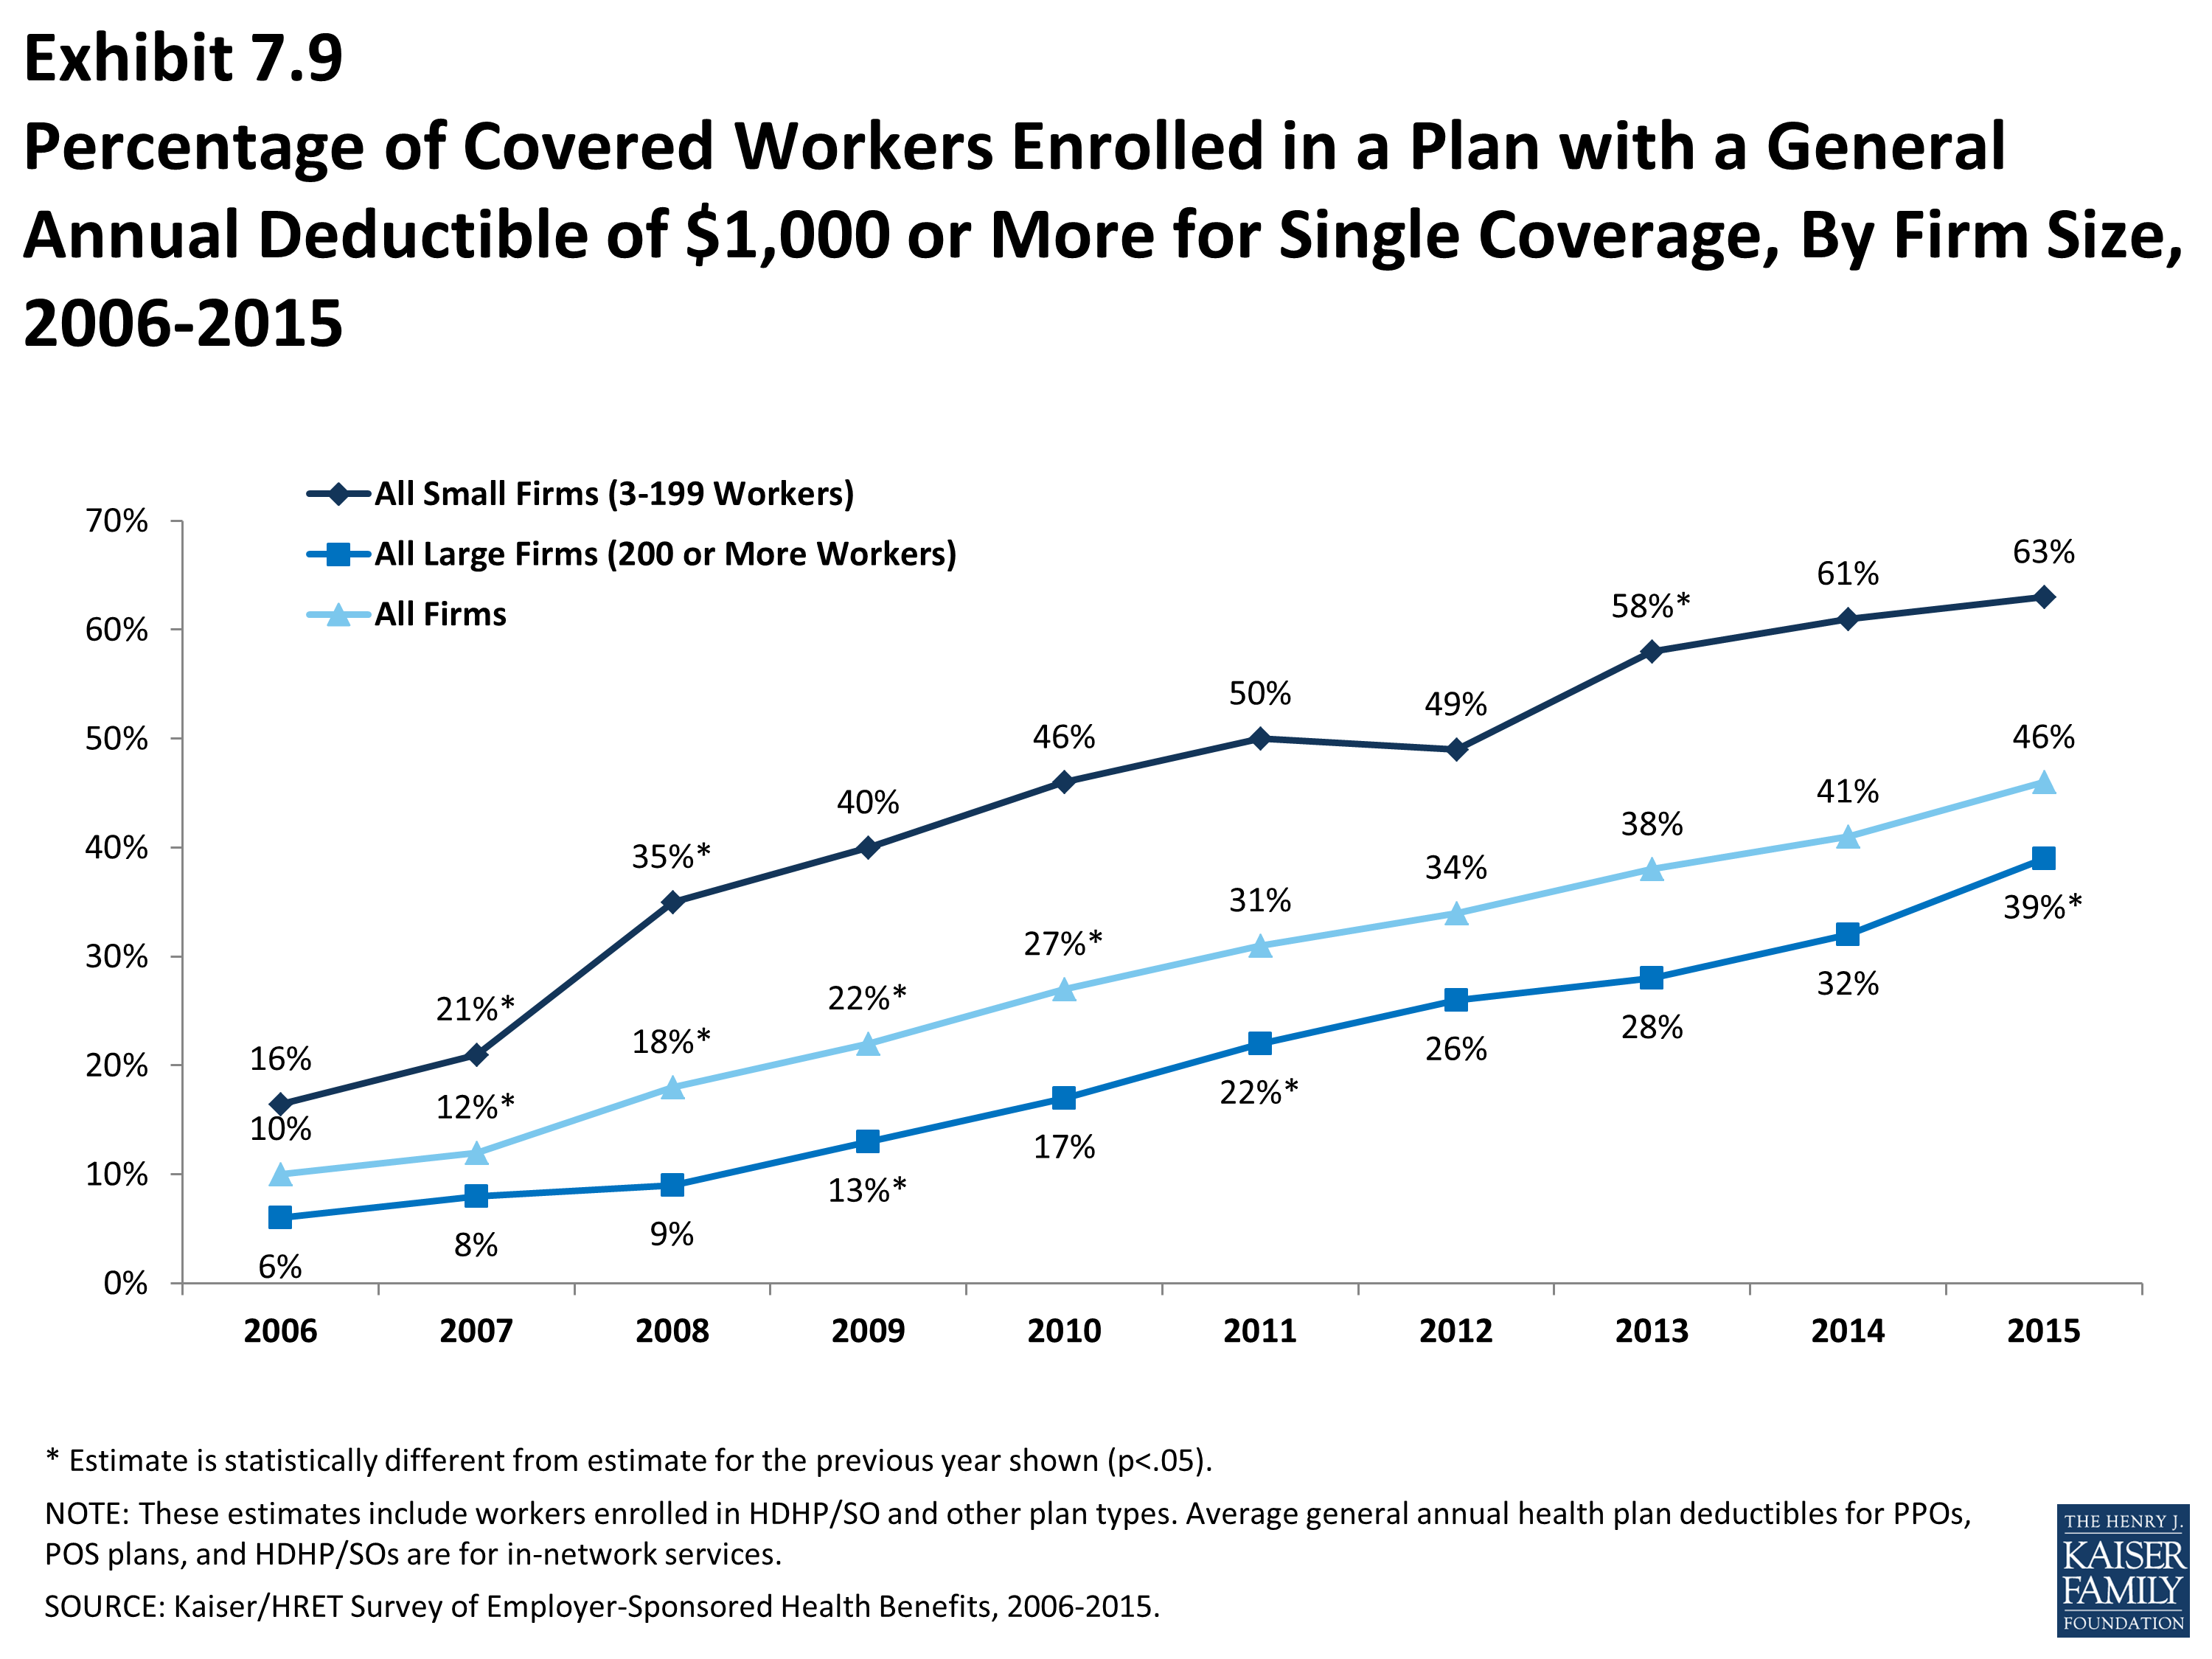
Percentage of Covered Workers Enrolled in a Plan with a General Annual Deductible of $1,000 or More for Single Coverage, By Firm Size, 2006-2015
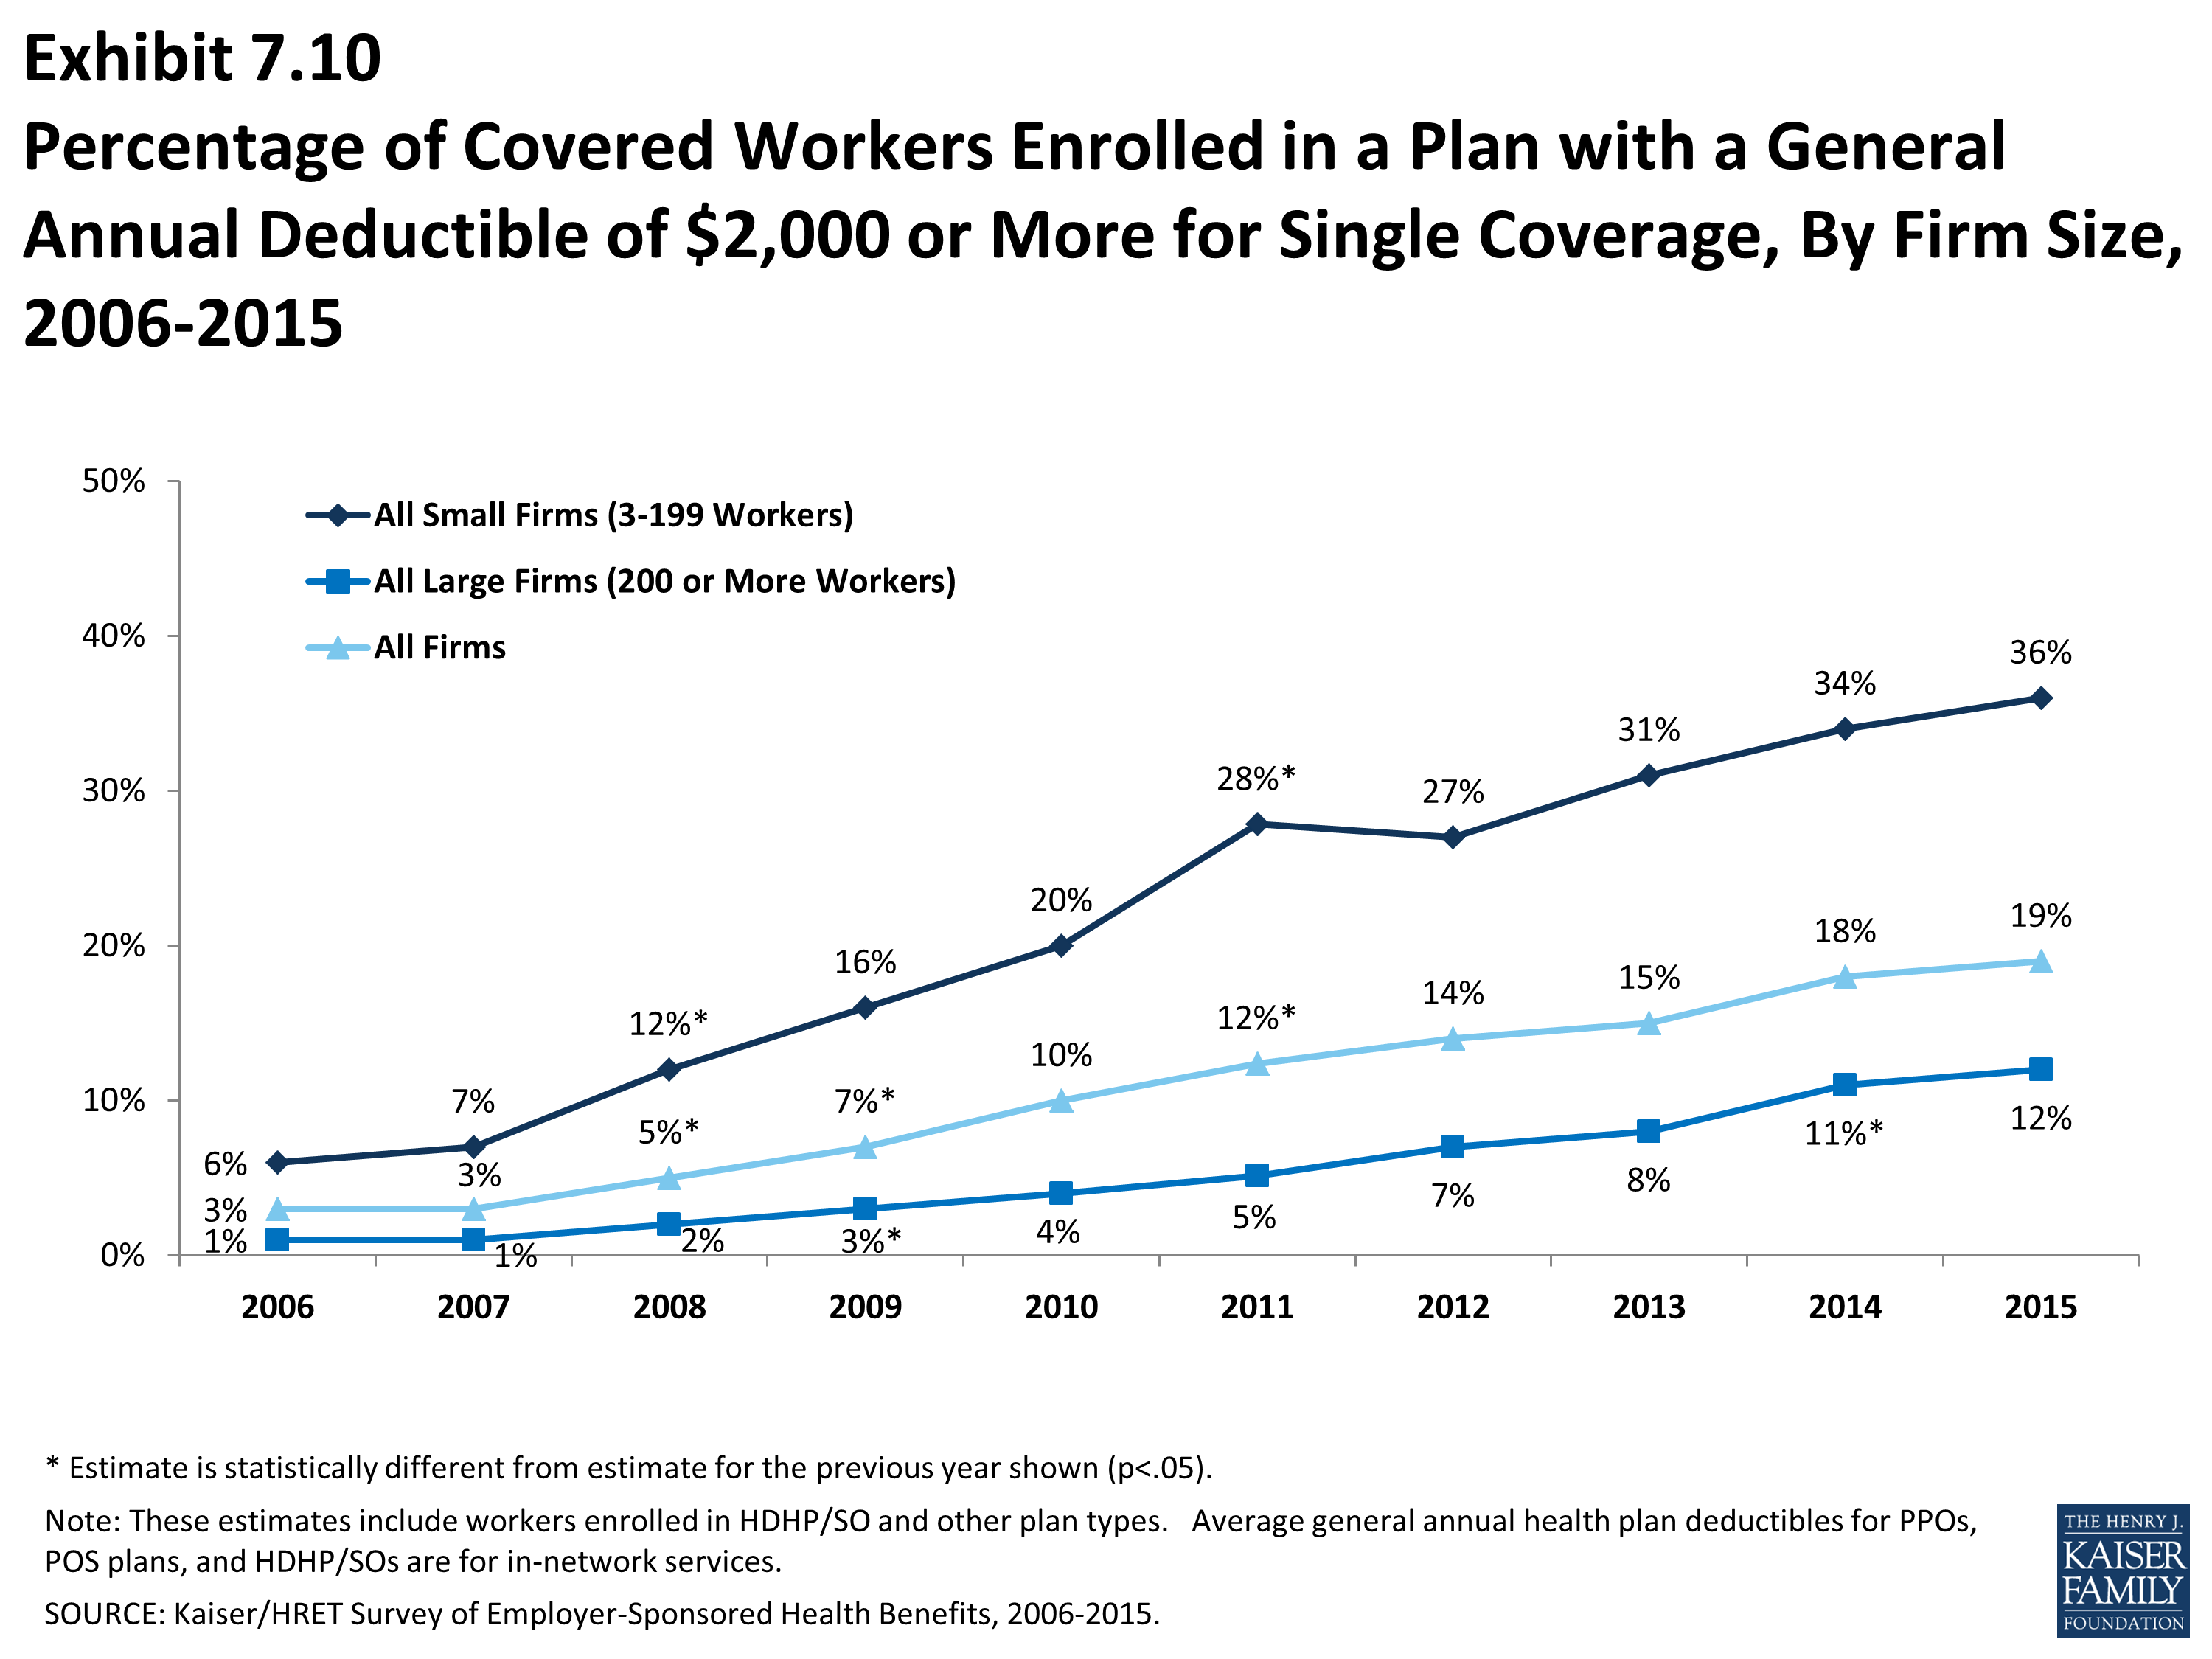
Percentage of Covered Workers Enrolled in a Plan with a General Annual Deductible of $2,000 or More for Single Coverage, By Firm Size, 2006-2015
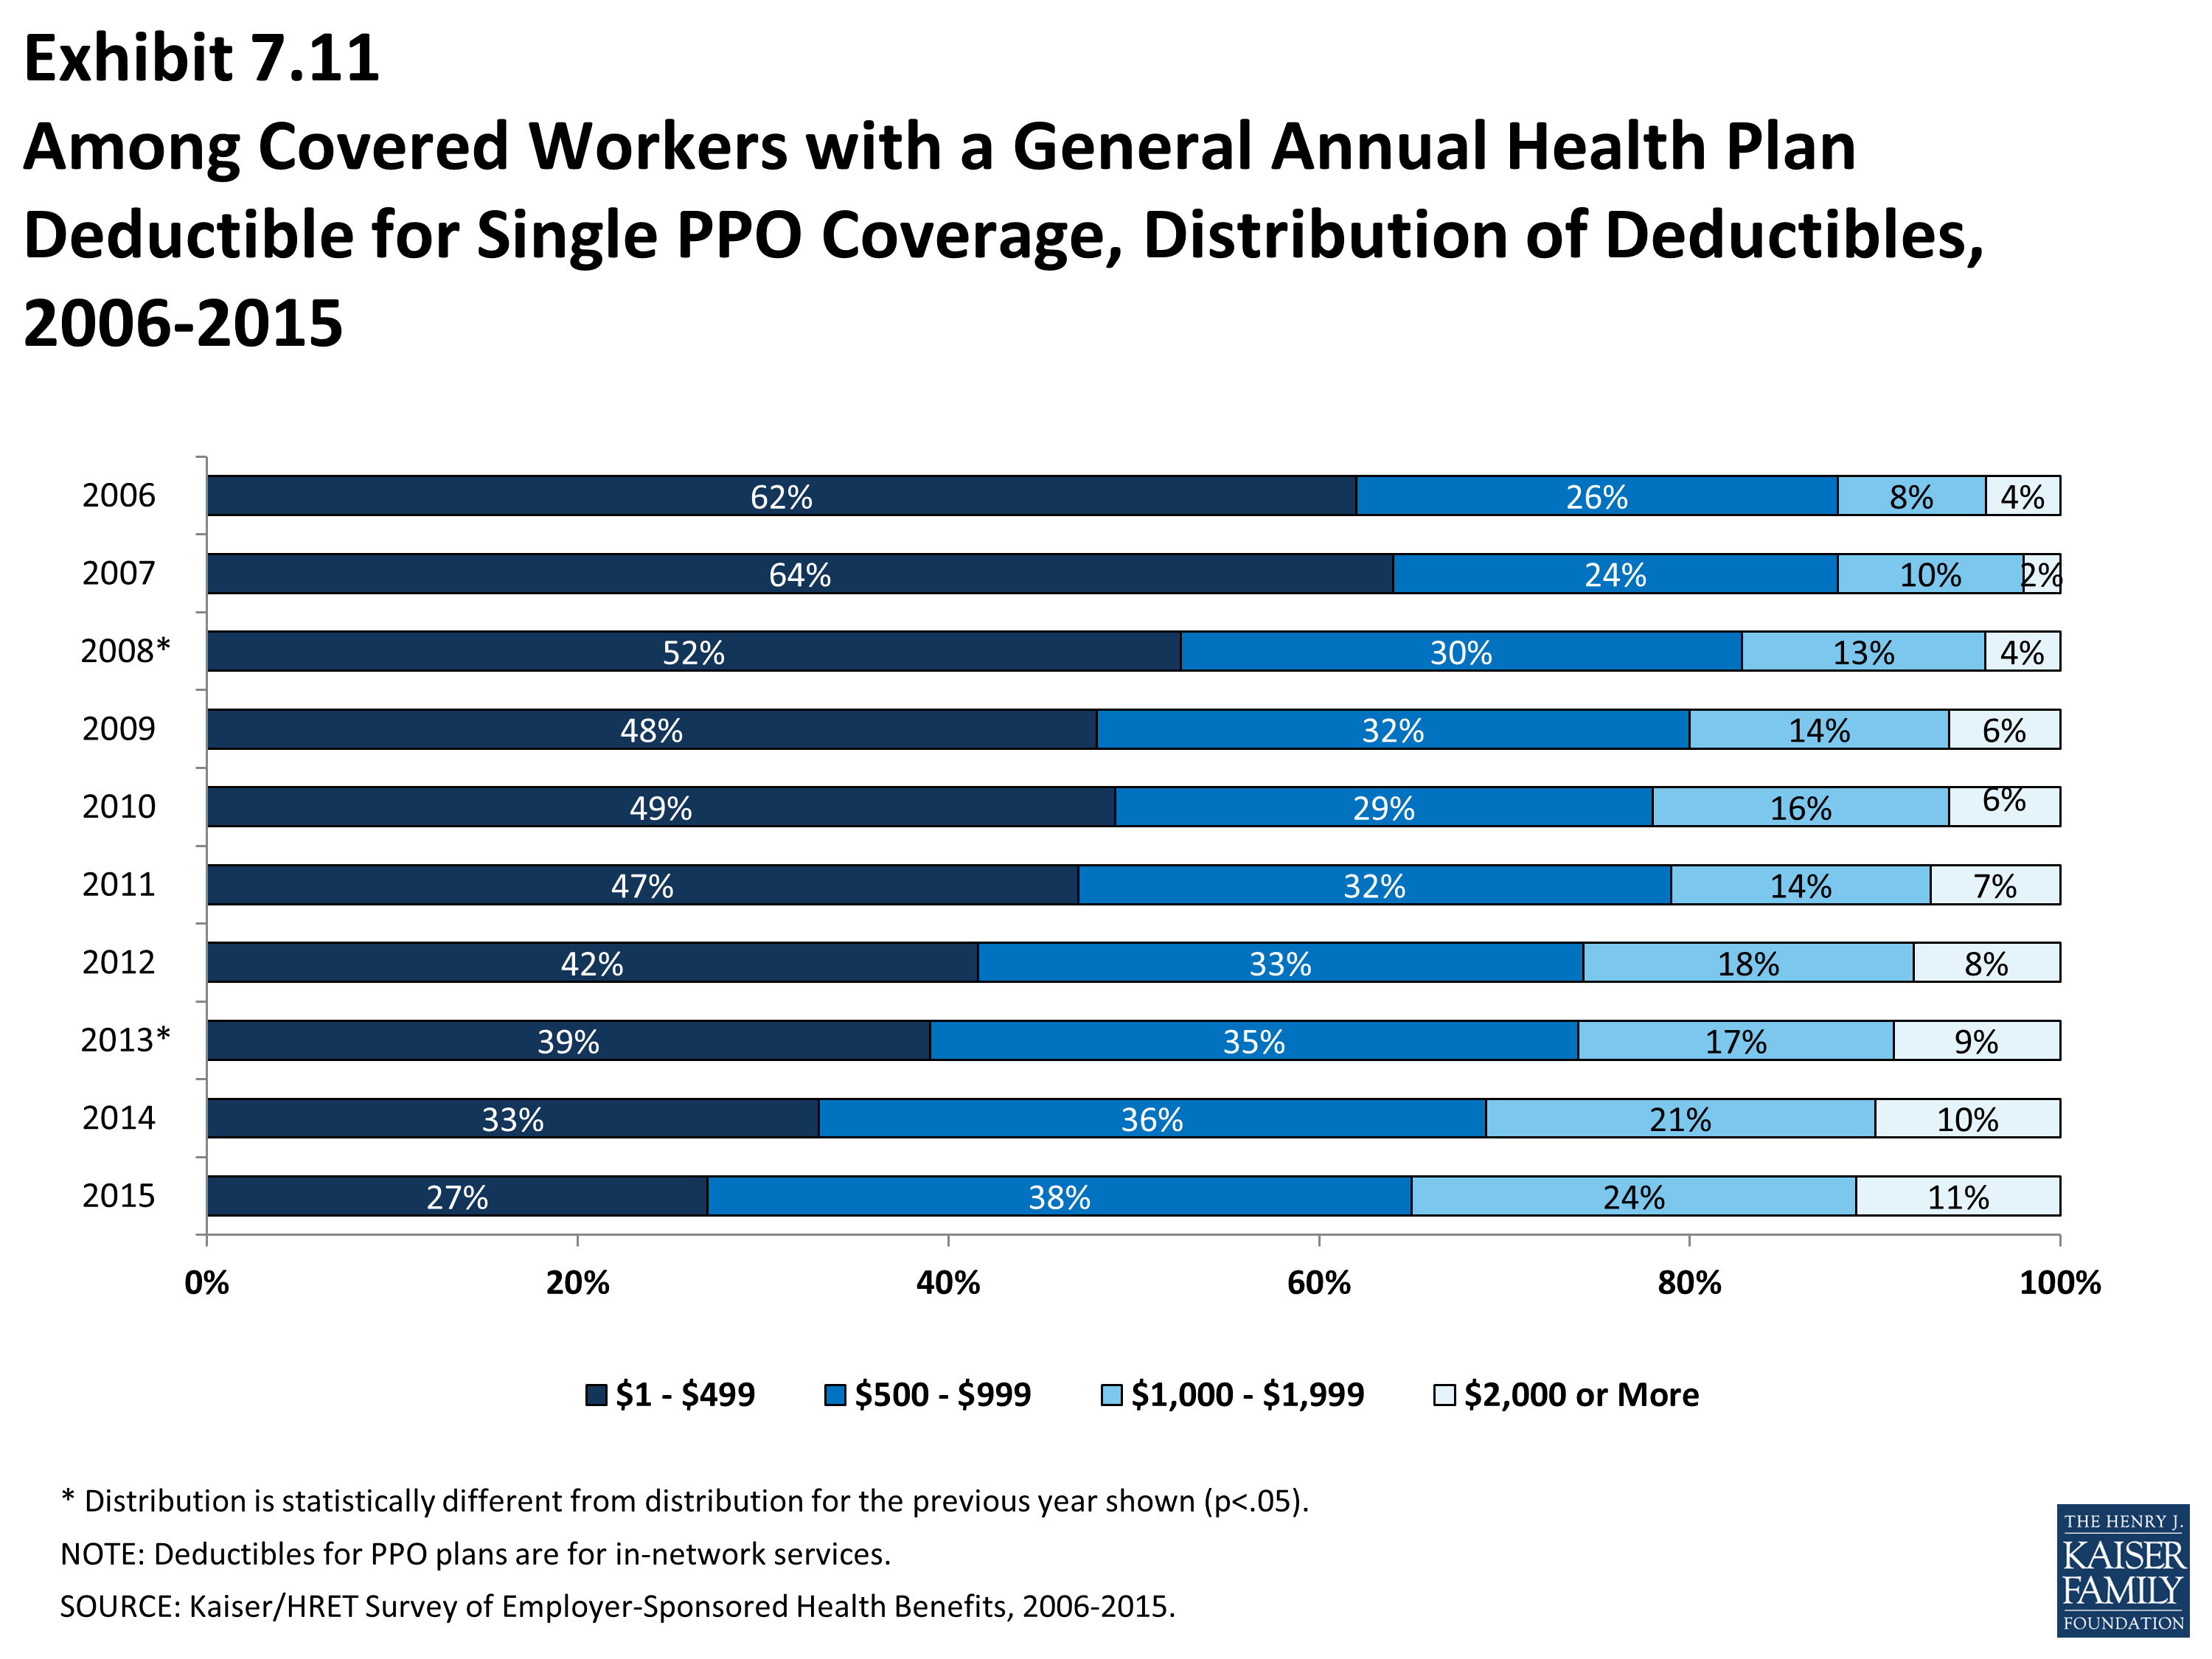
Among Covered Workers with a General Annual Health Plan Deductible for Single PPO Coverage, Distribution of Deductibles, 2006-2015
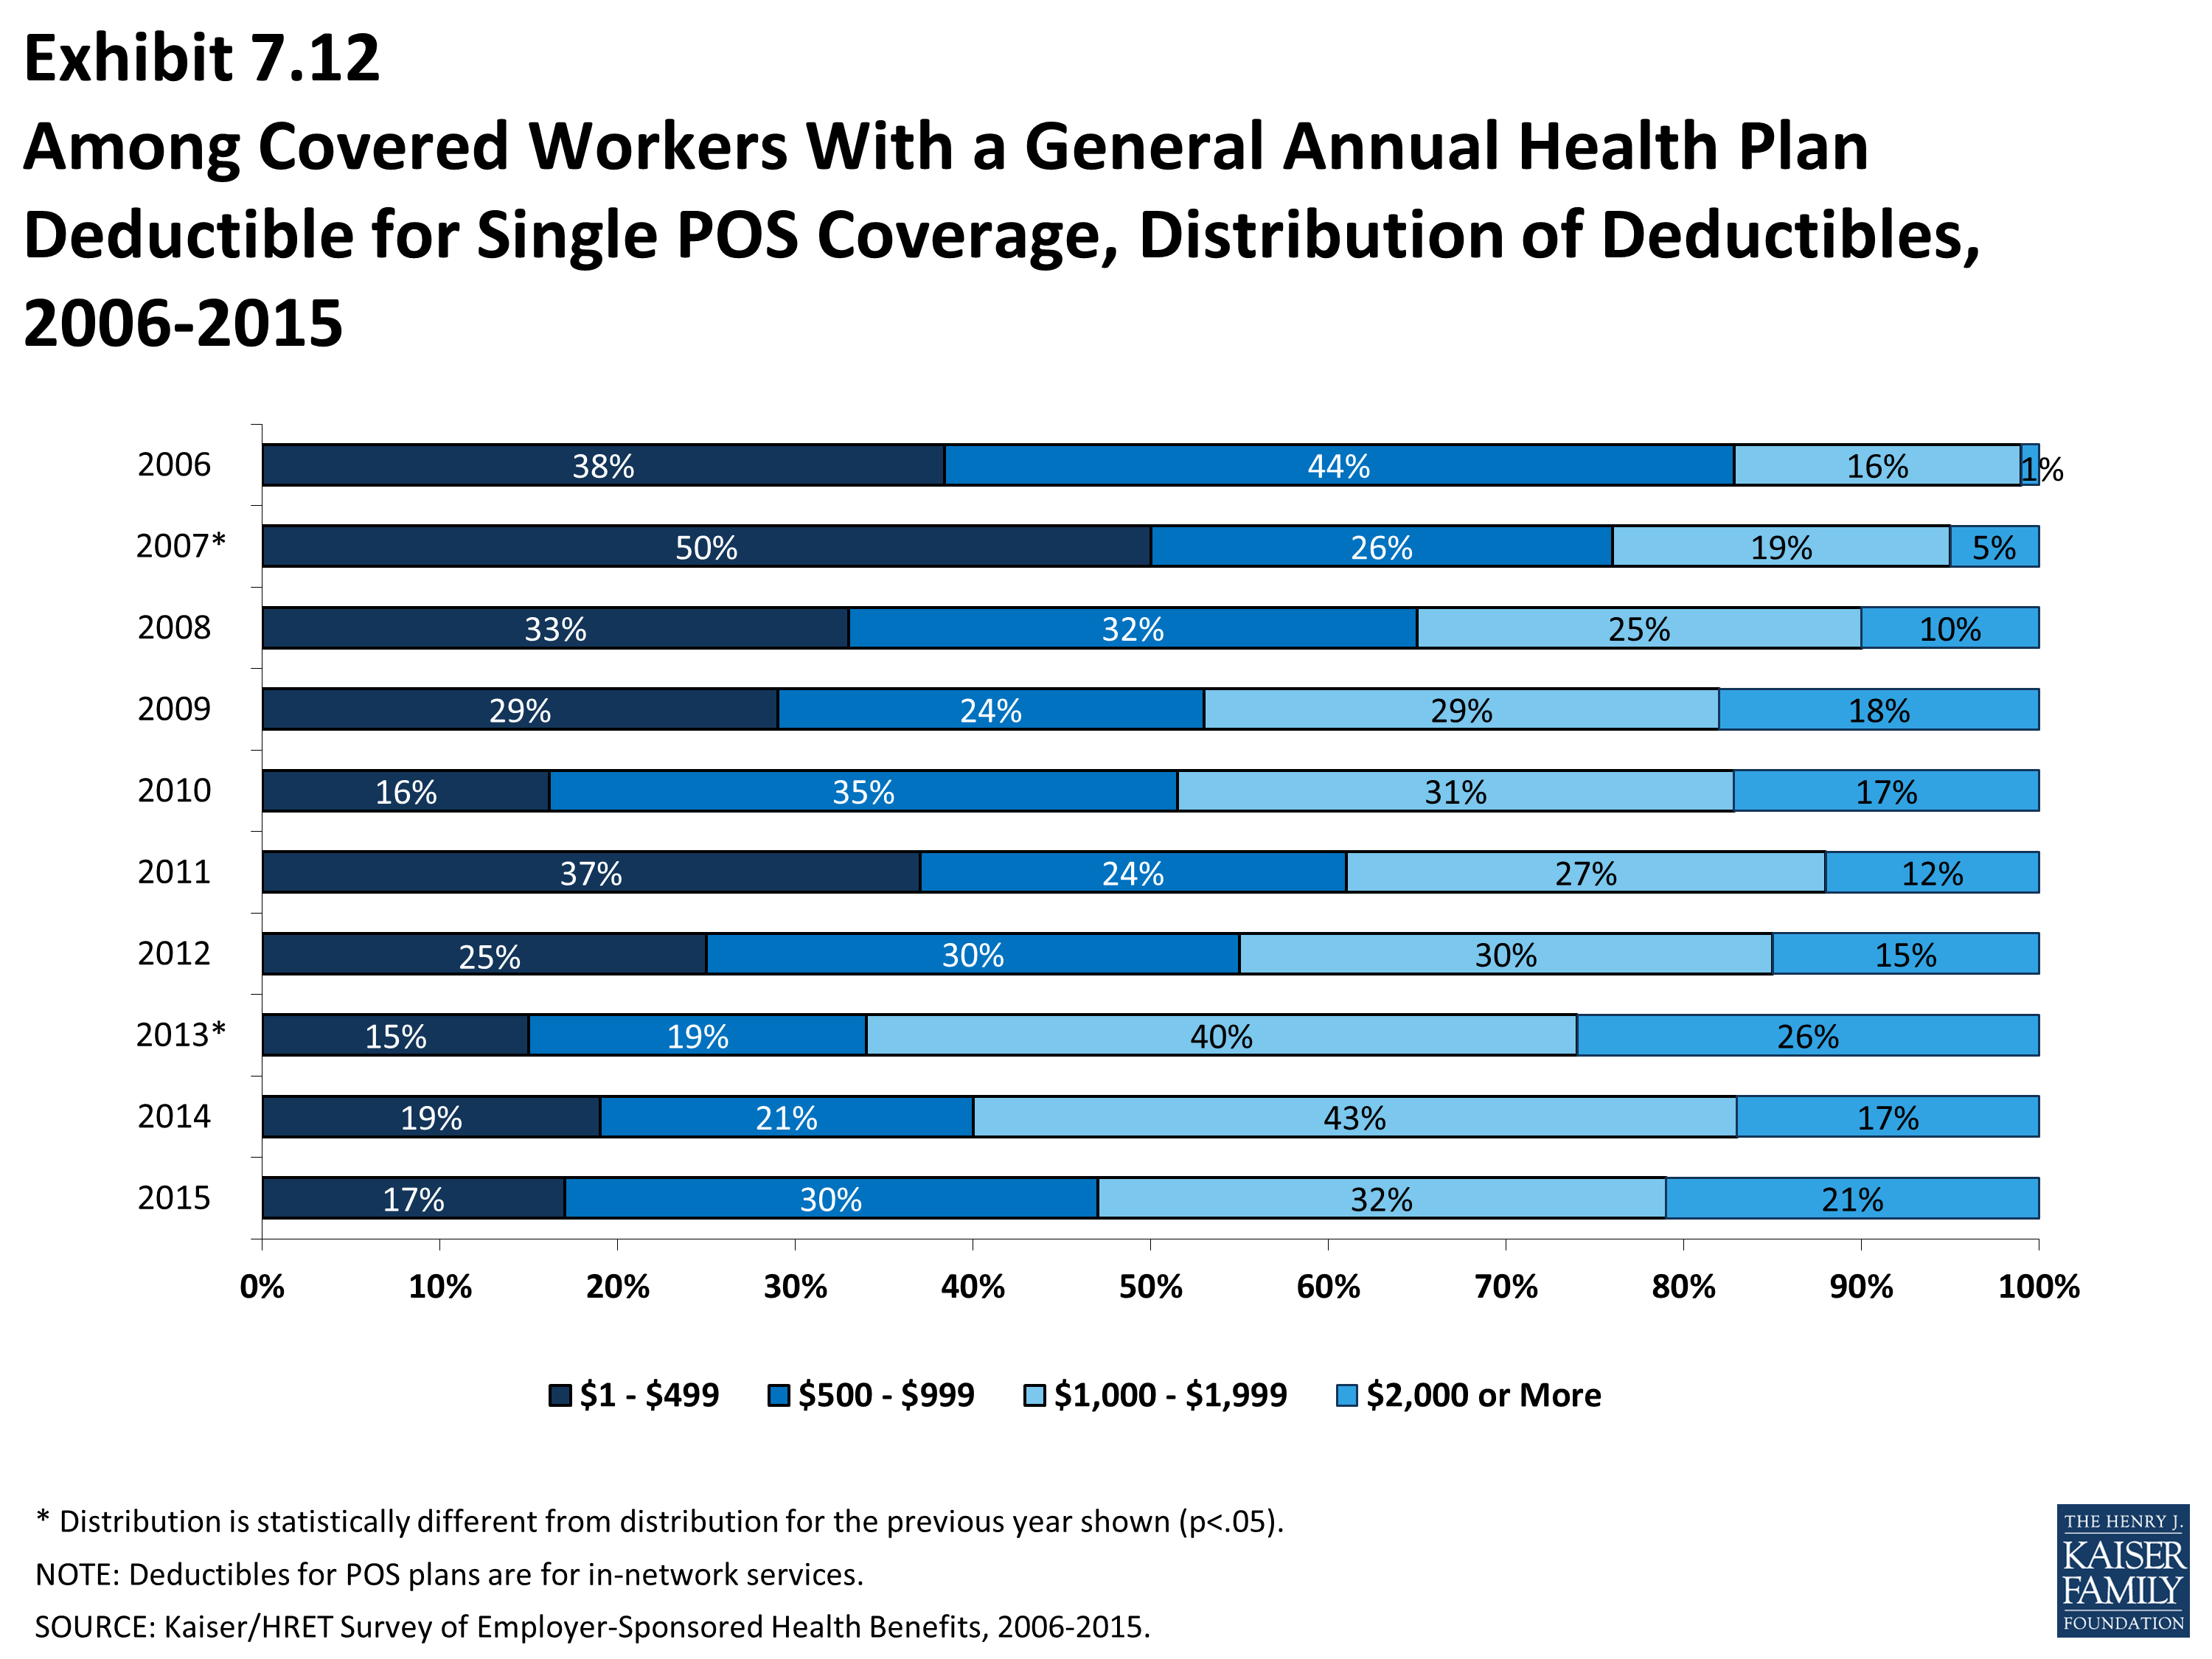
Among Covered Workers With a General Annual Health Plan Deductible for Single POS Coverage, Distribution of Deductibles, 2006-2015
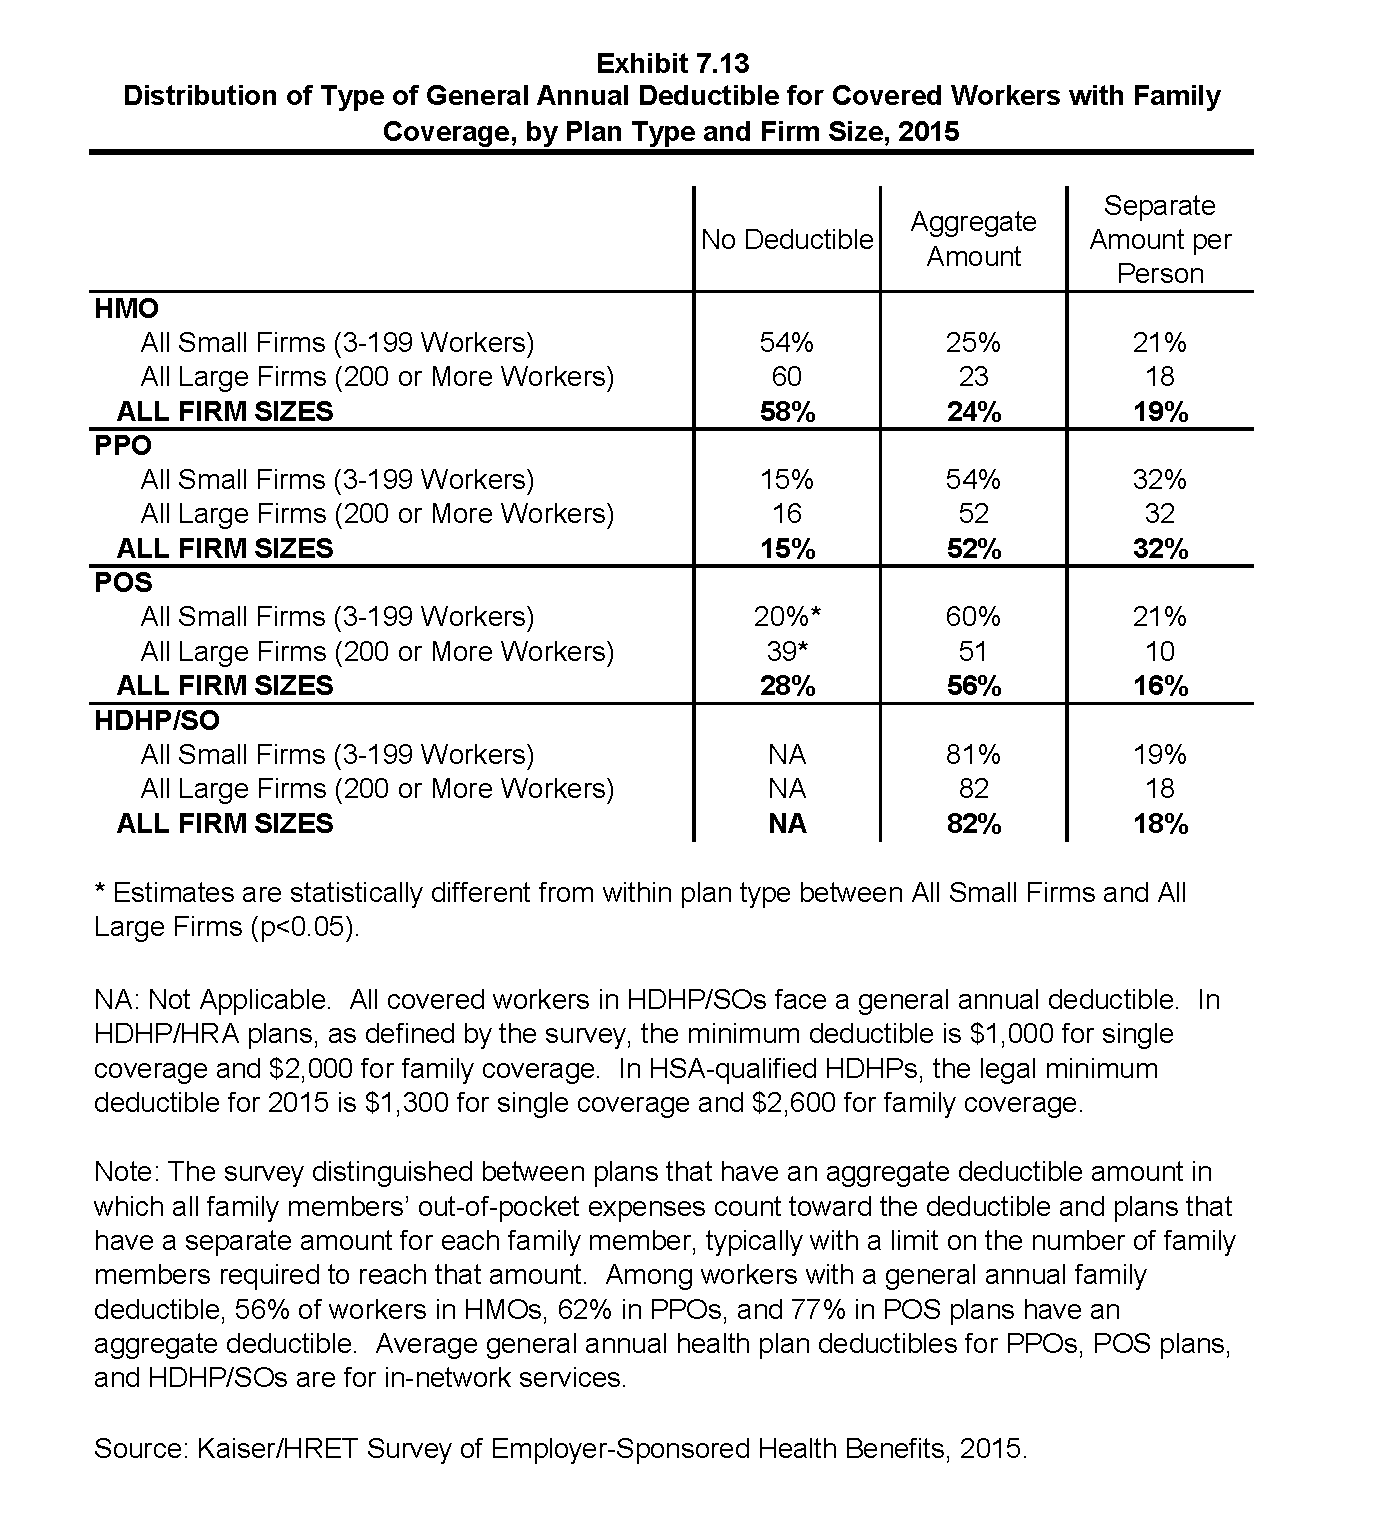
Distribution of Type of General Annual Deductible for Covered Workers with Family Coverage, by Plan Type and Firm Size, 2015
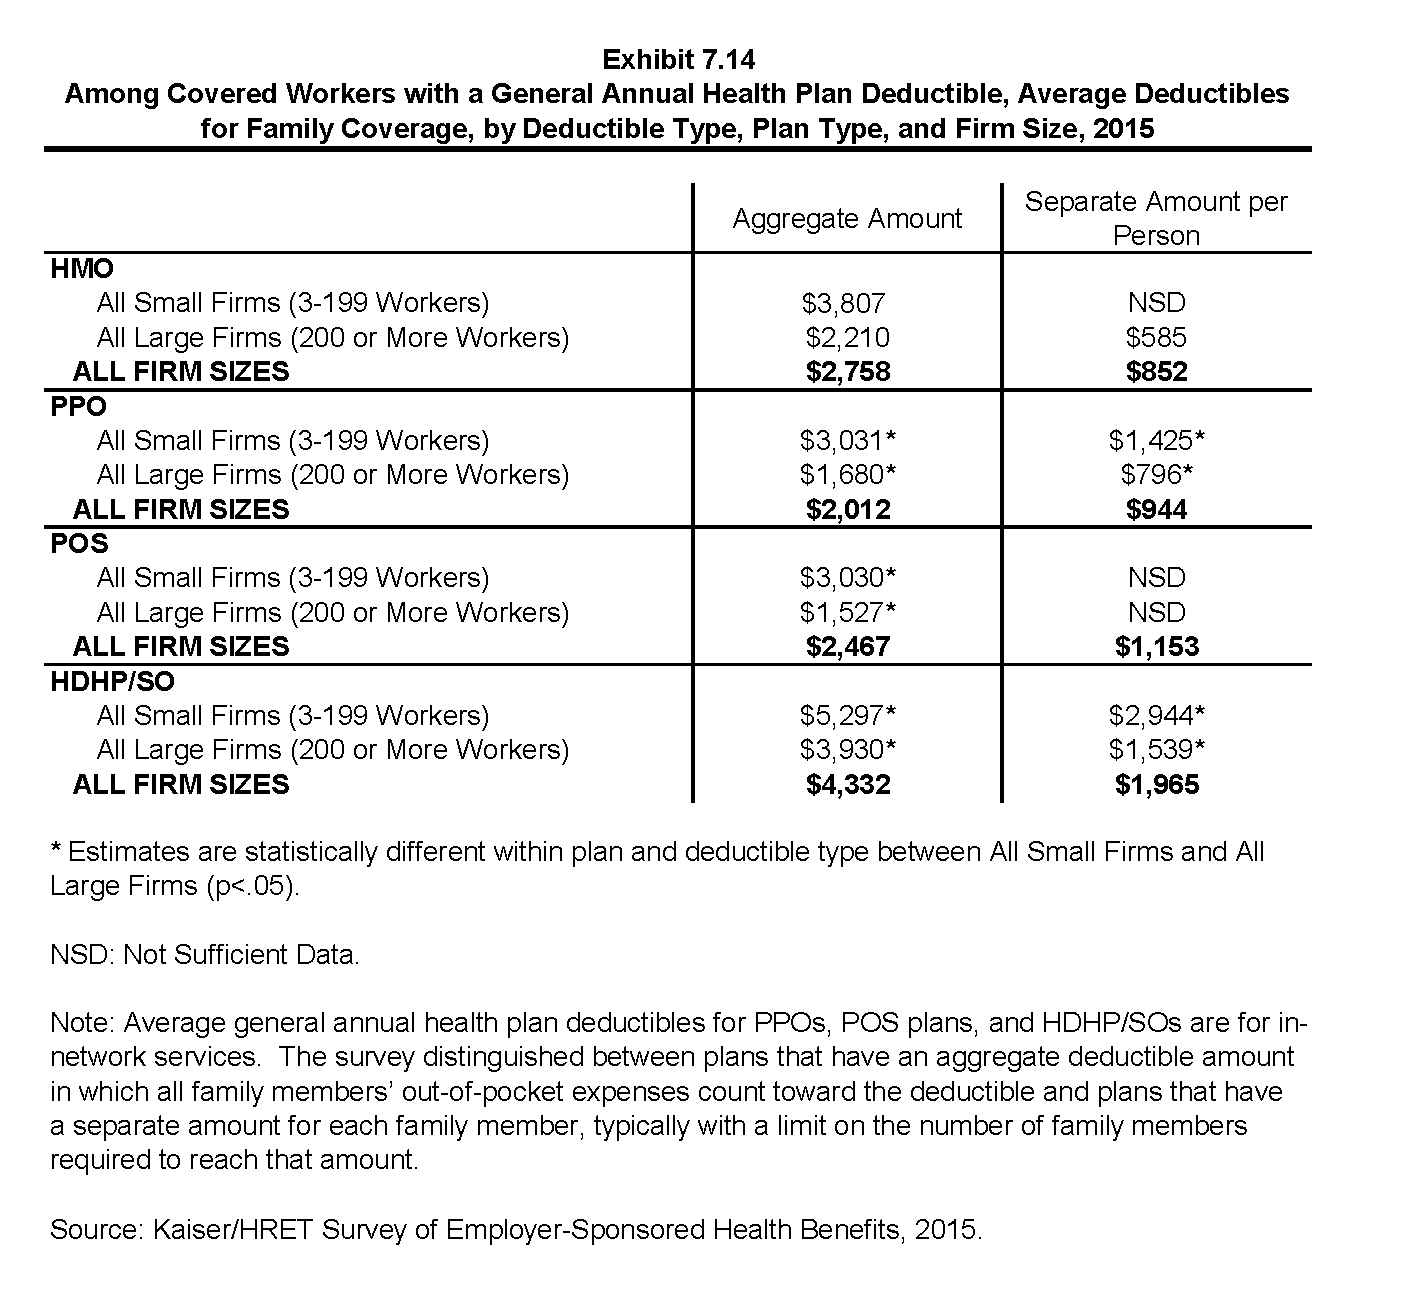
Among Covered Workers with a General Annual Health Plan Deductible, Average Deductibles for Family Coverage, by Deductible Type, Plan Type, and Firm Size, 2015
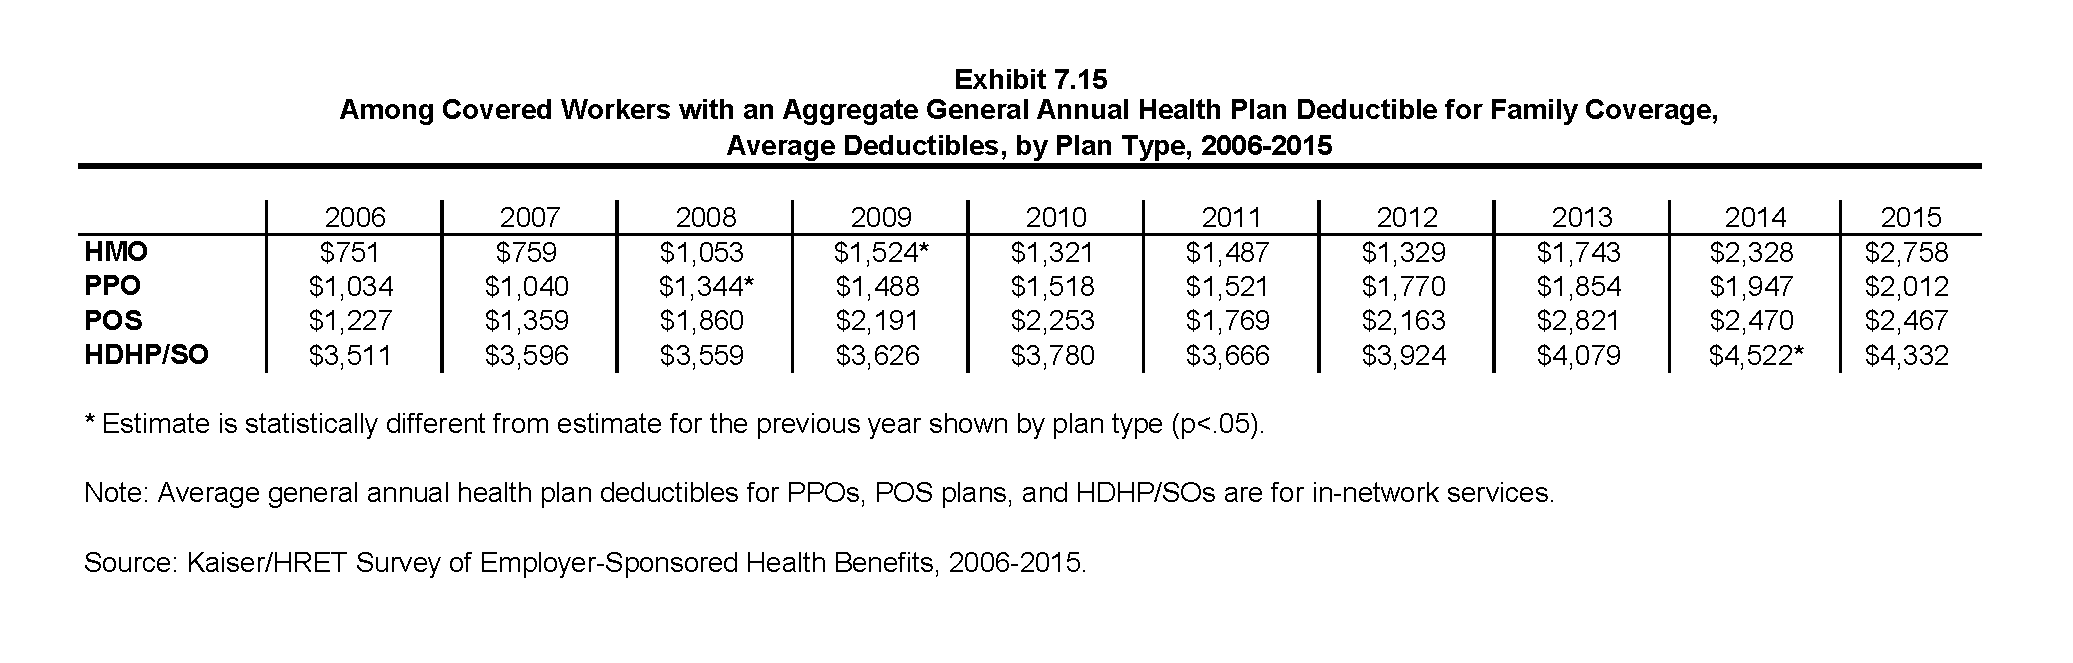
Among Covered Workers with an Aggregate General Annual Health Plan Deductible for Family Coverage, Average Deductibles, by Plan Type, 2006-2015
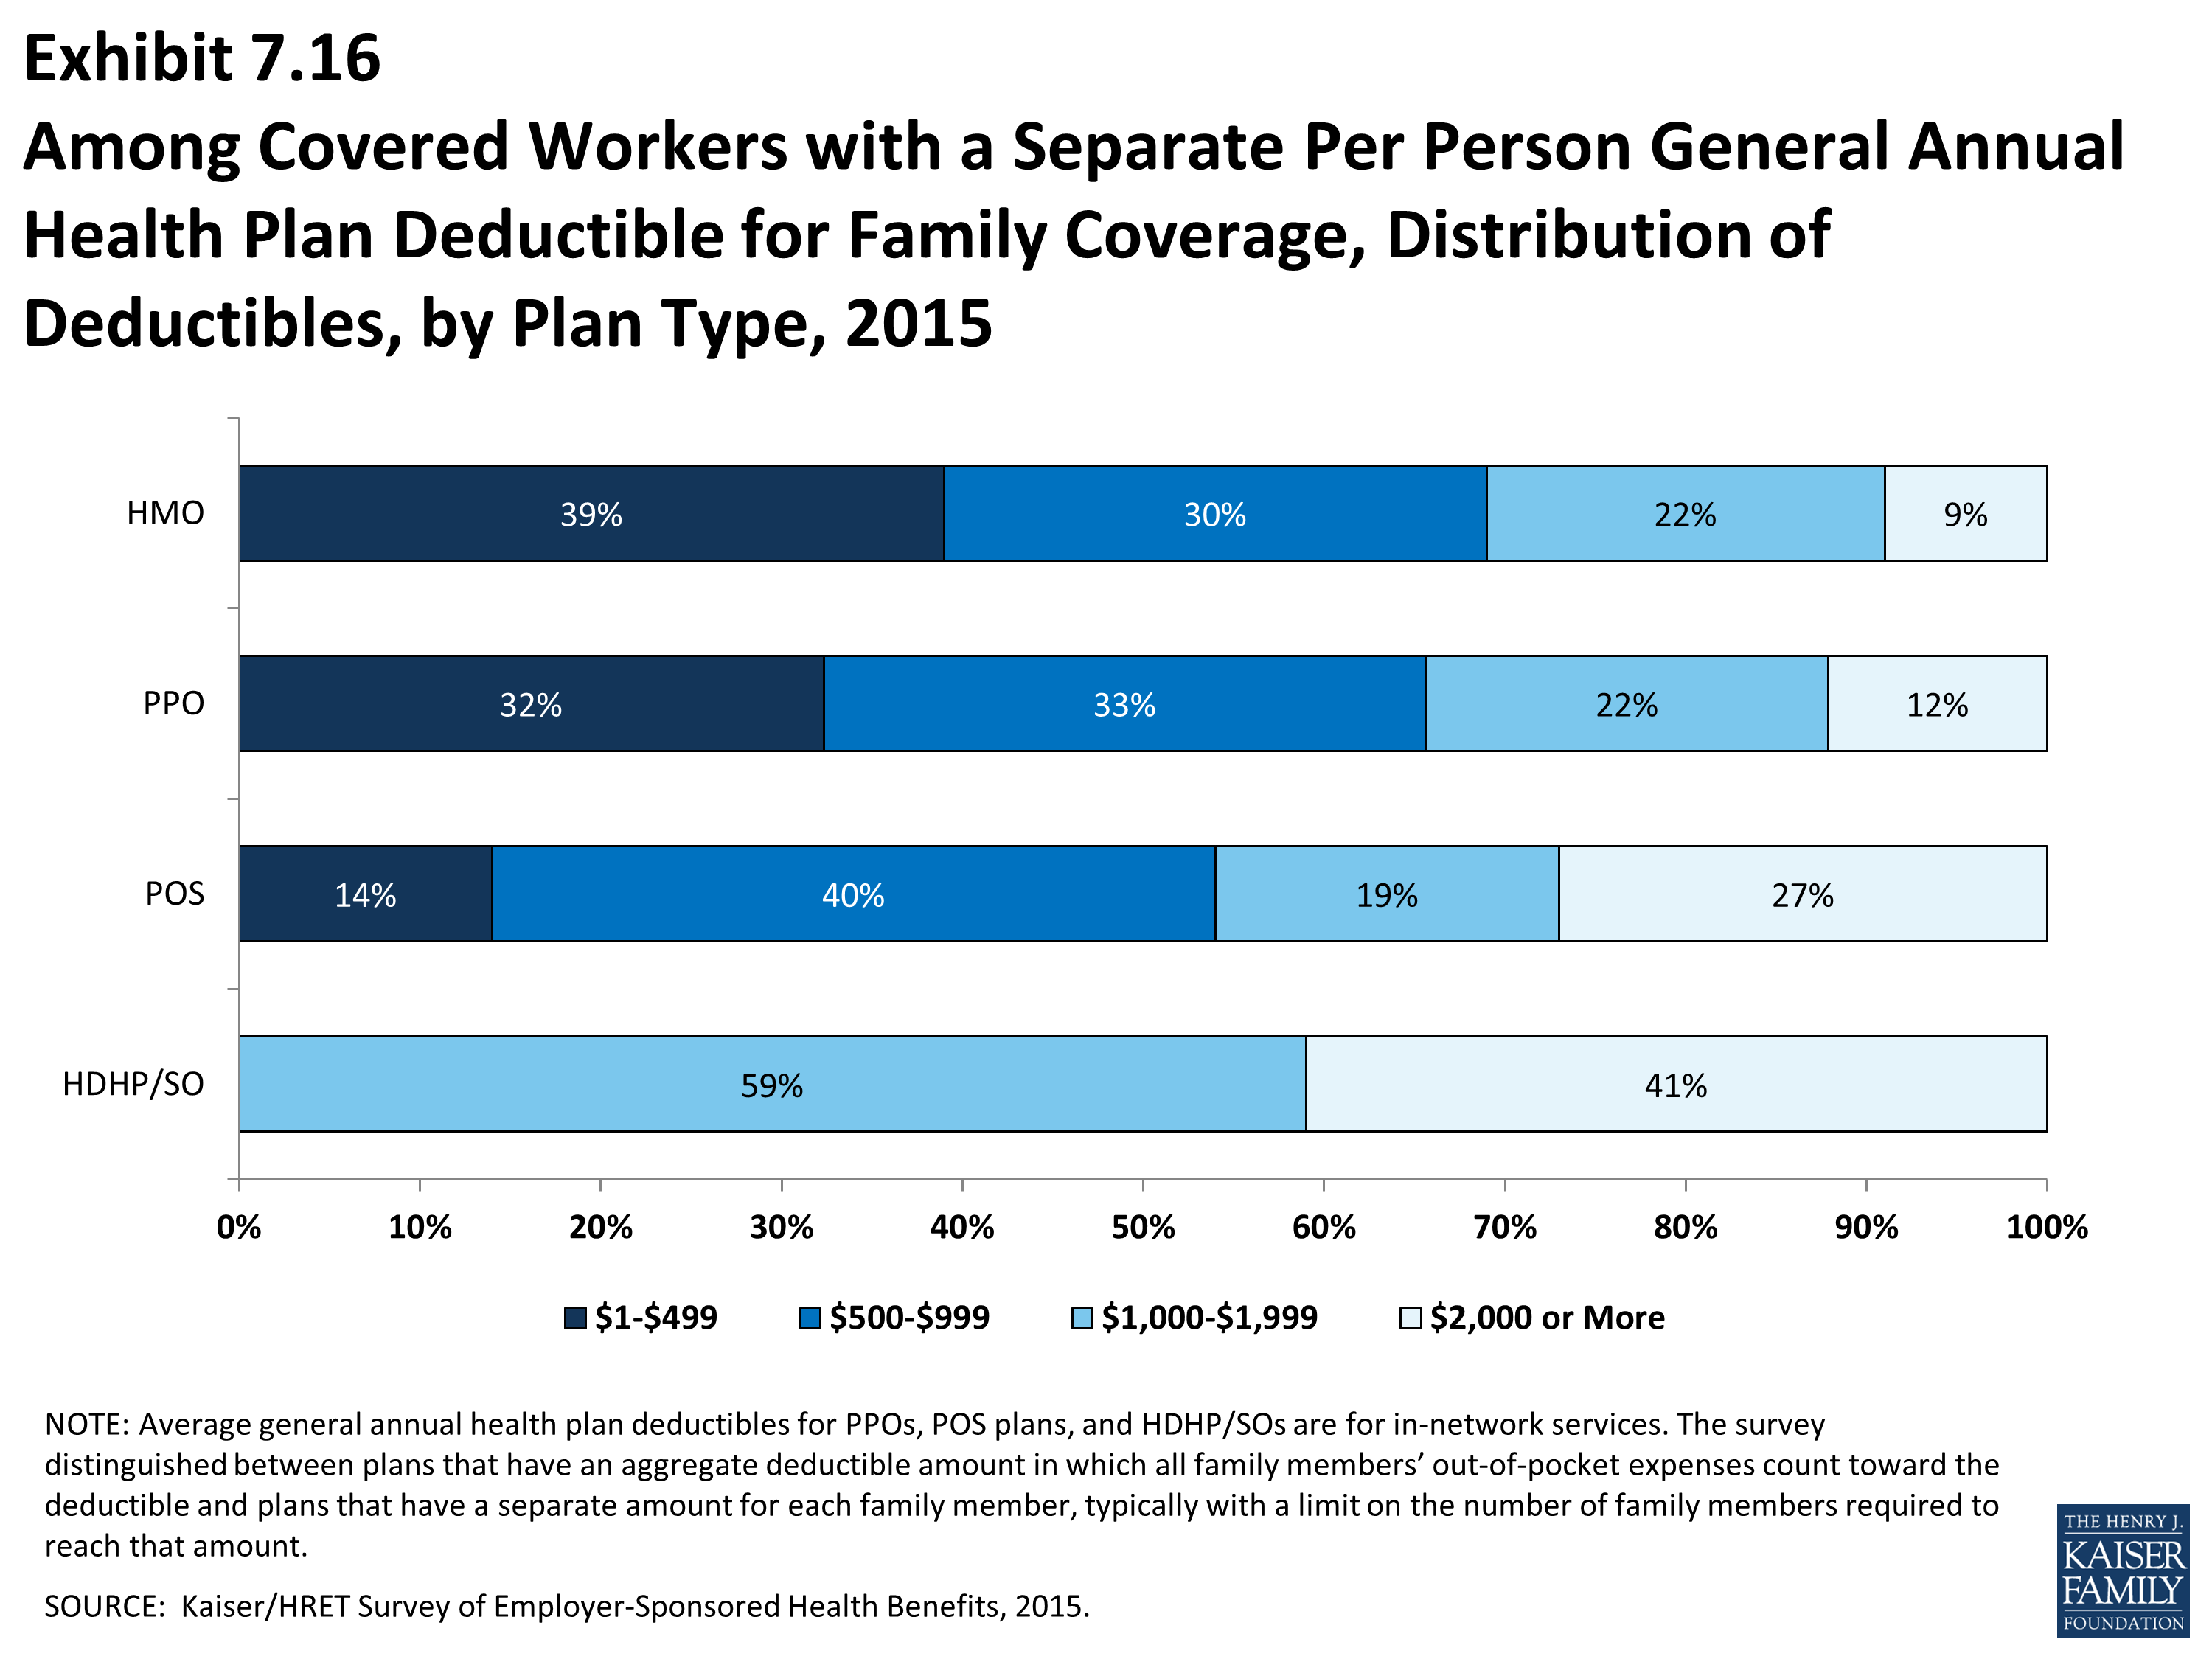
Among Covered Workers with a Separate Per Person General Annual Health Plan Deductible for Family Coverage, Distribution of Deductibles, by Plan Type, 2015
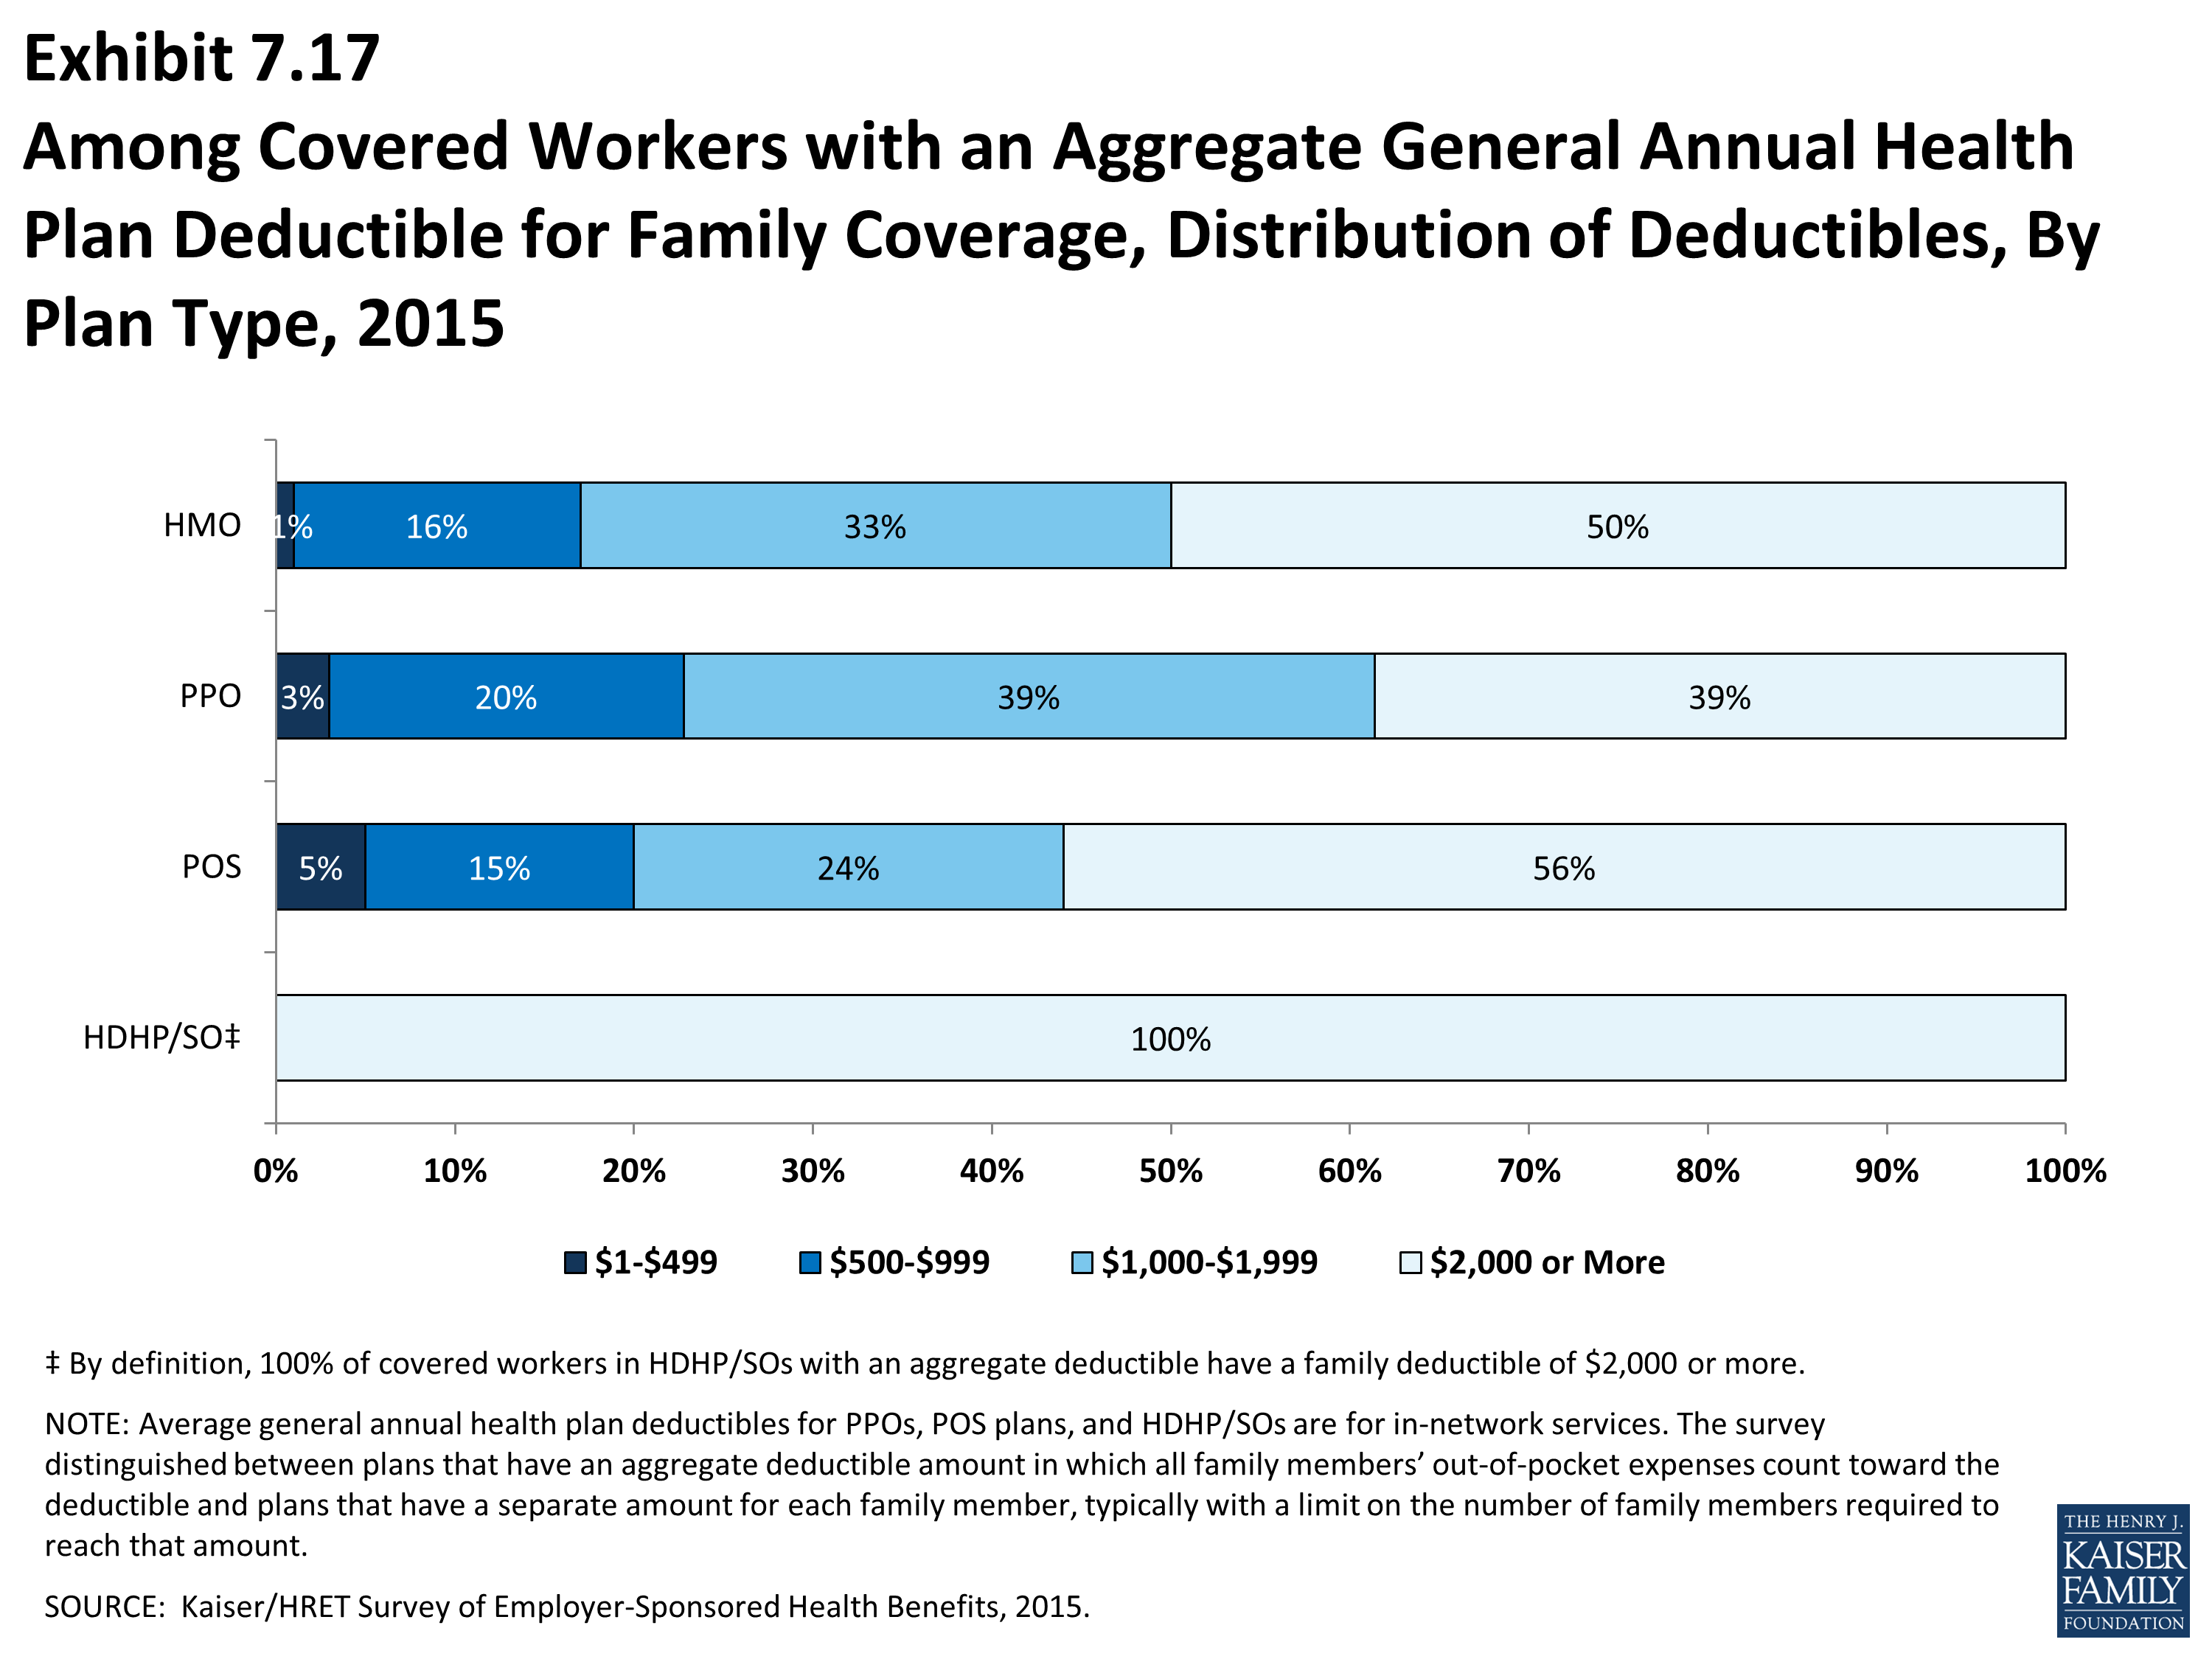
Among Covered Workers with an Aggregate General Annual Health Plan Deductible for Family Coverage, Distribution of Deductibles, By Plan Type, 2015
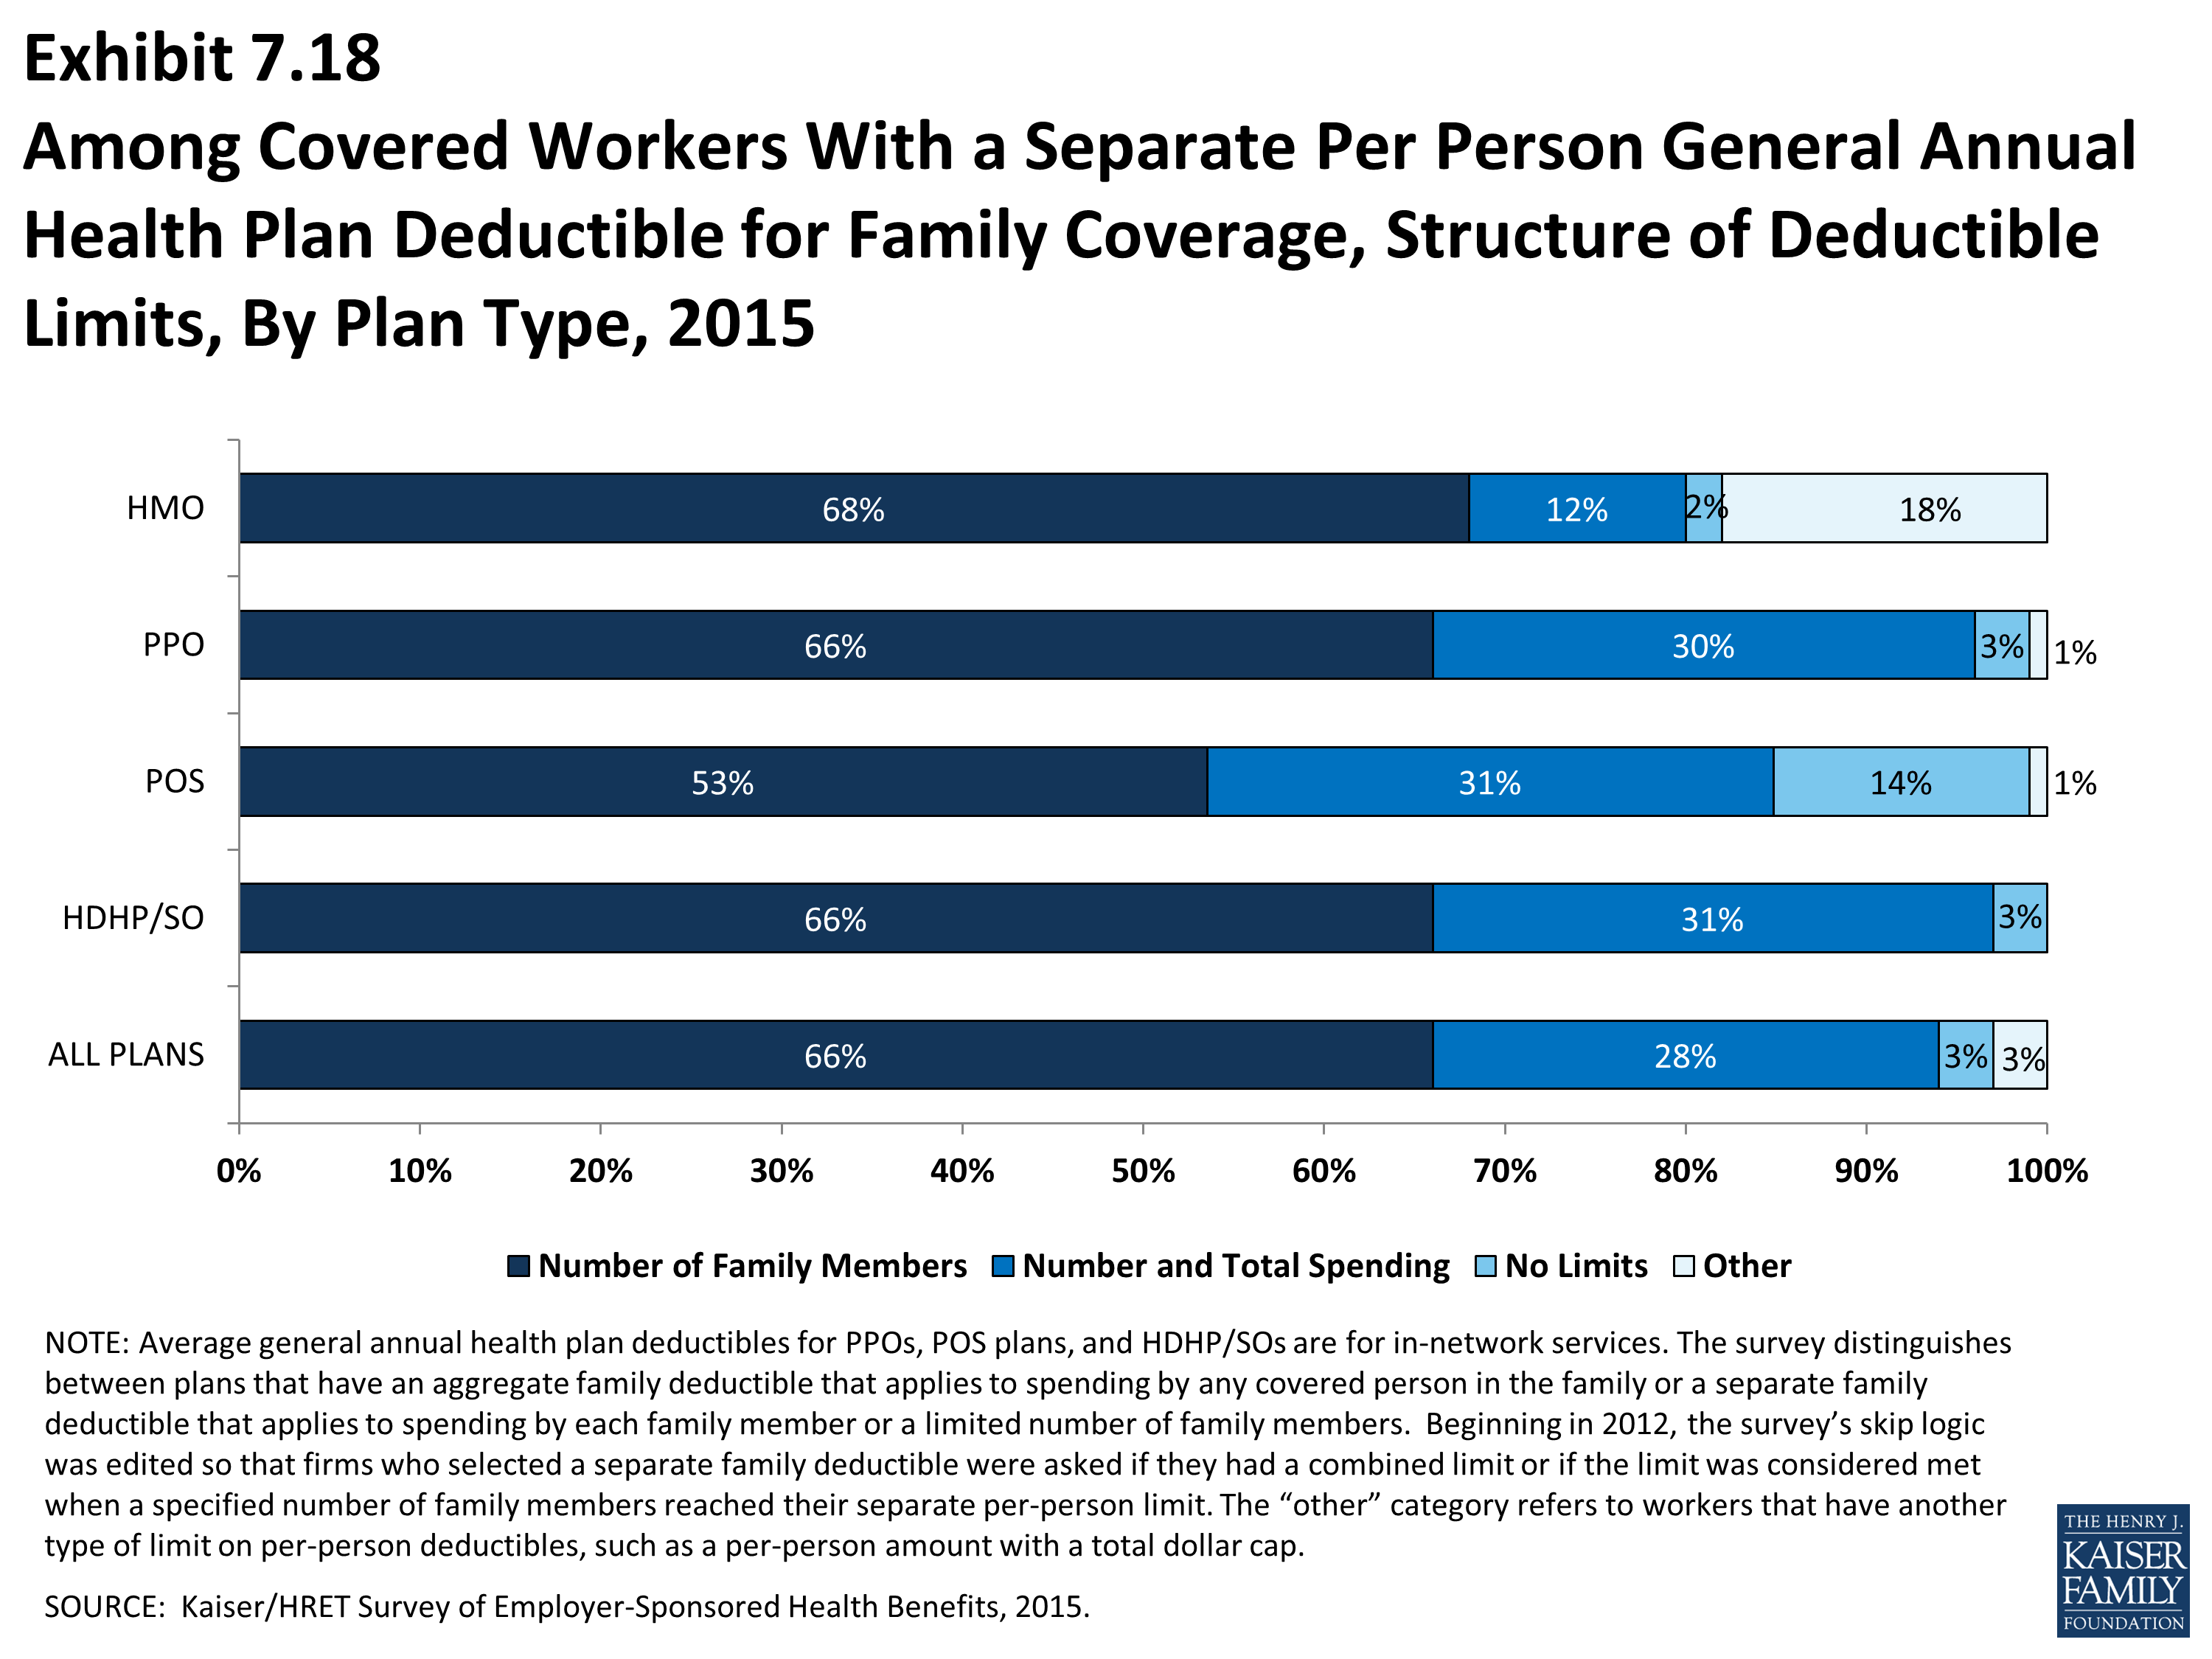
Among Covered Workers With a Separate Per Person General Annual Health Plan Deductible for Family Coverage, Structure of Deductible Limits, By Plan Type, 2015
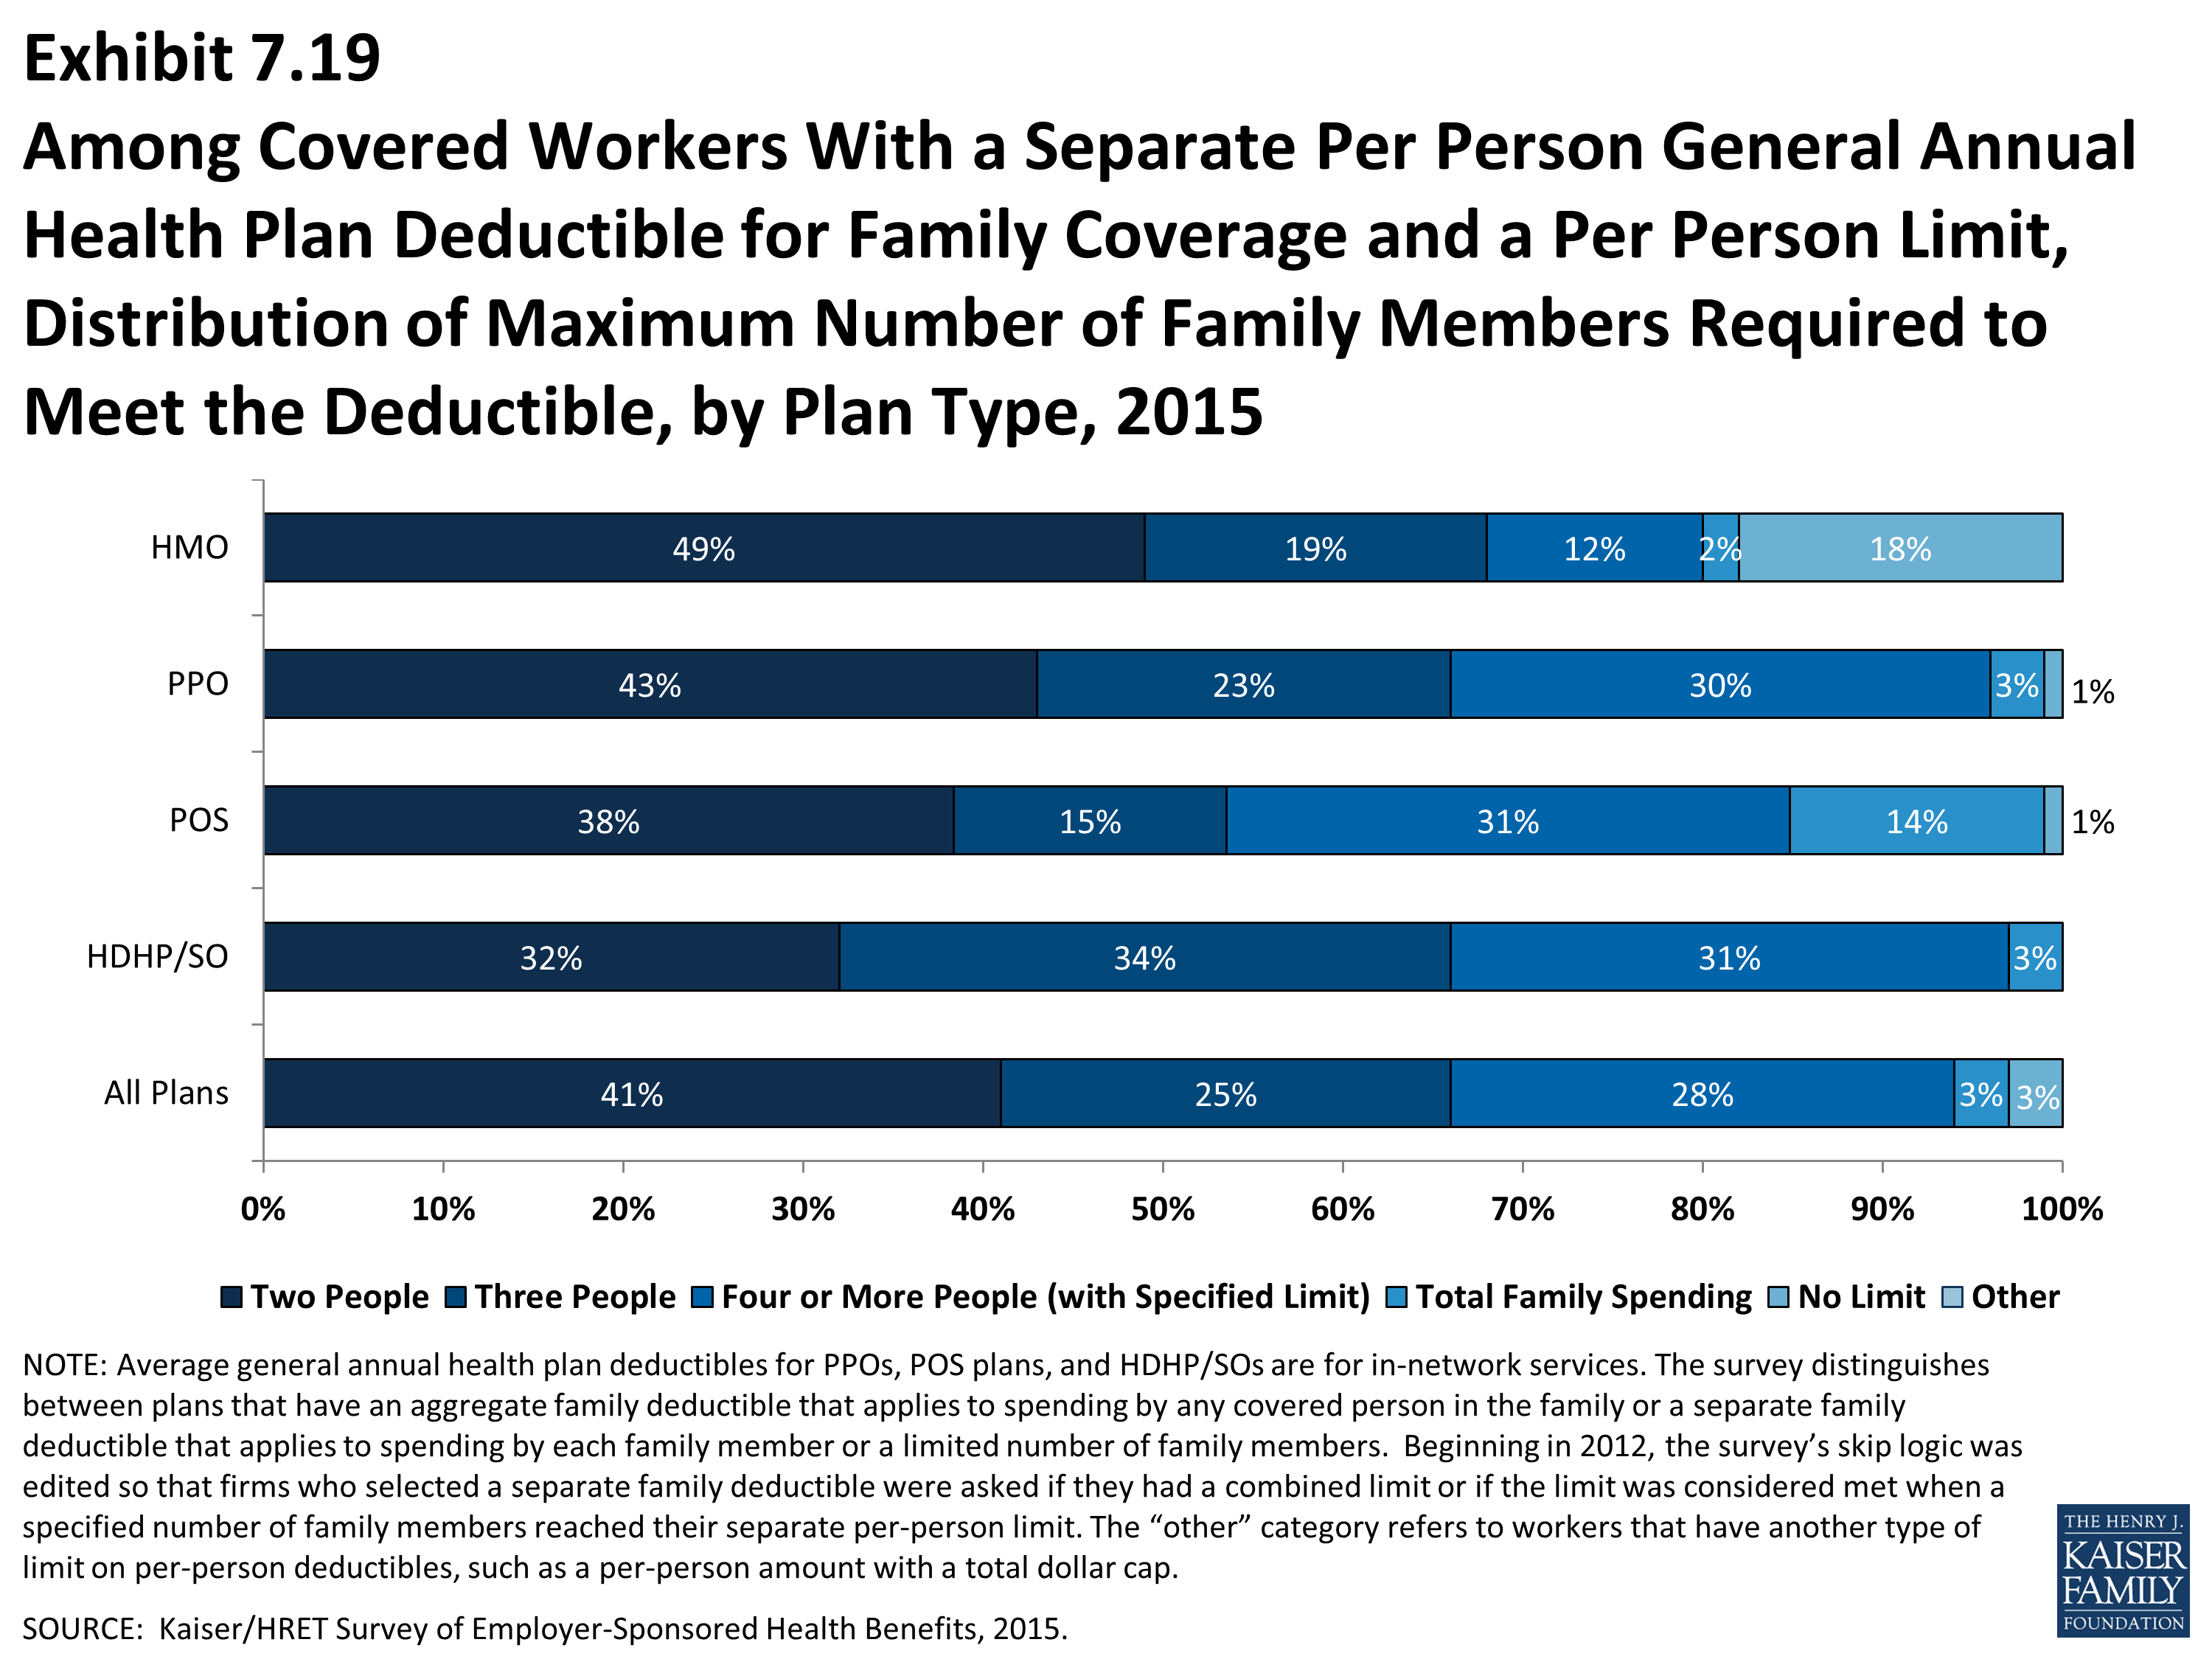
Among Covered Workers With a Separate Per Person General Annual Health Plan Deductible for Family Coverage and a Per Person Limit, Distribution of Maximum Number of Family Members Required to Meet the Deductible, by Plan Type, 2015
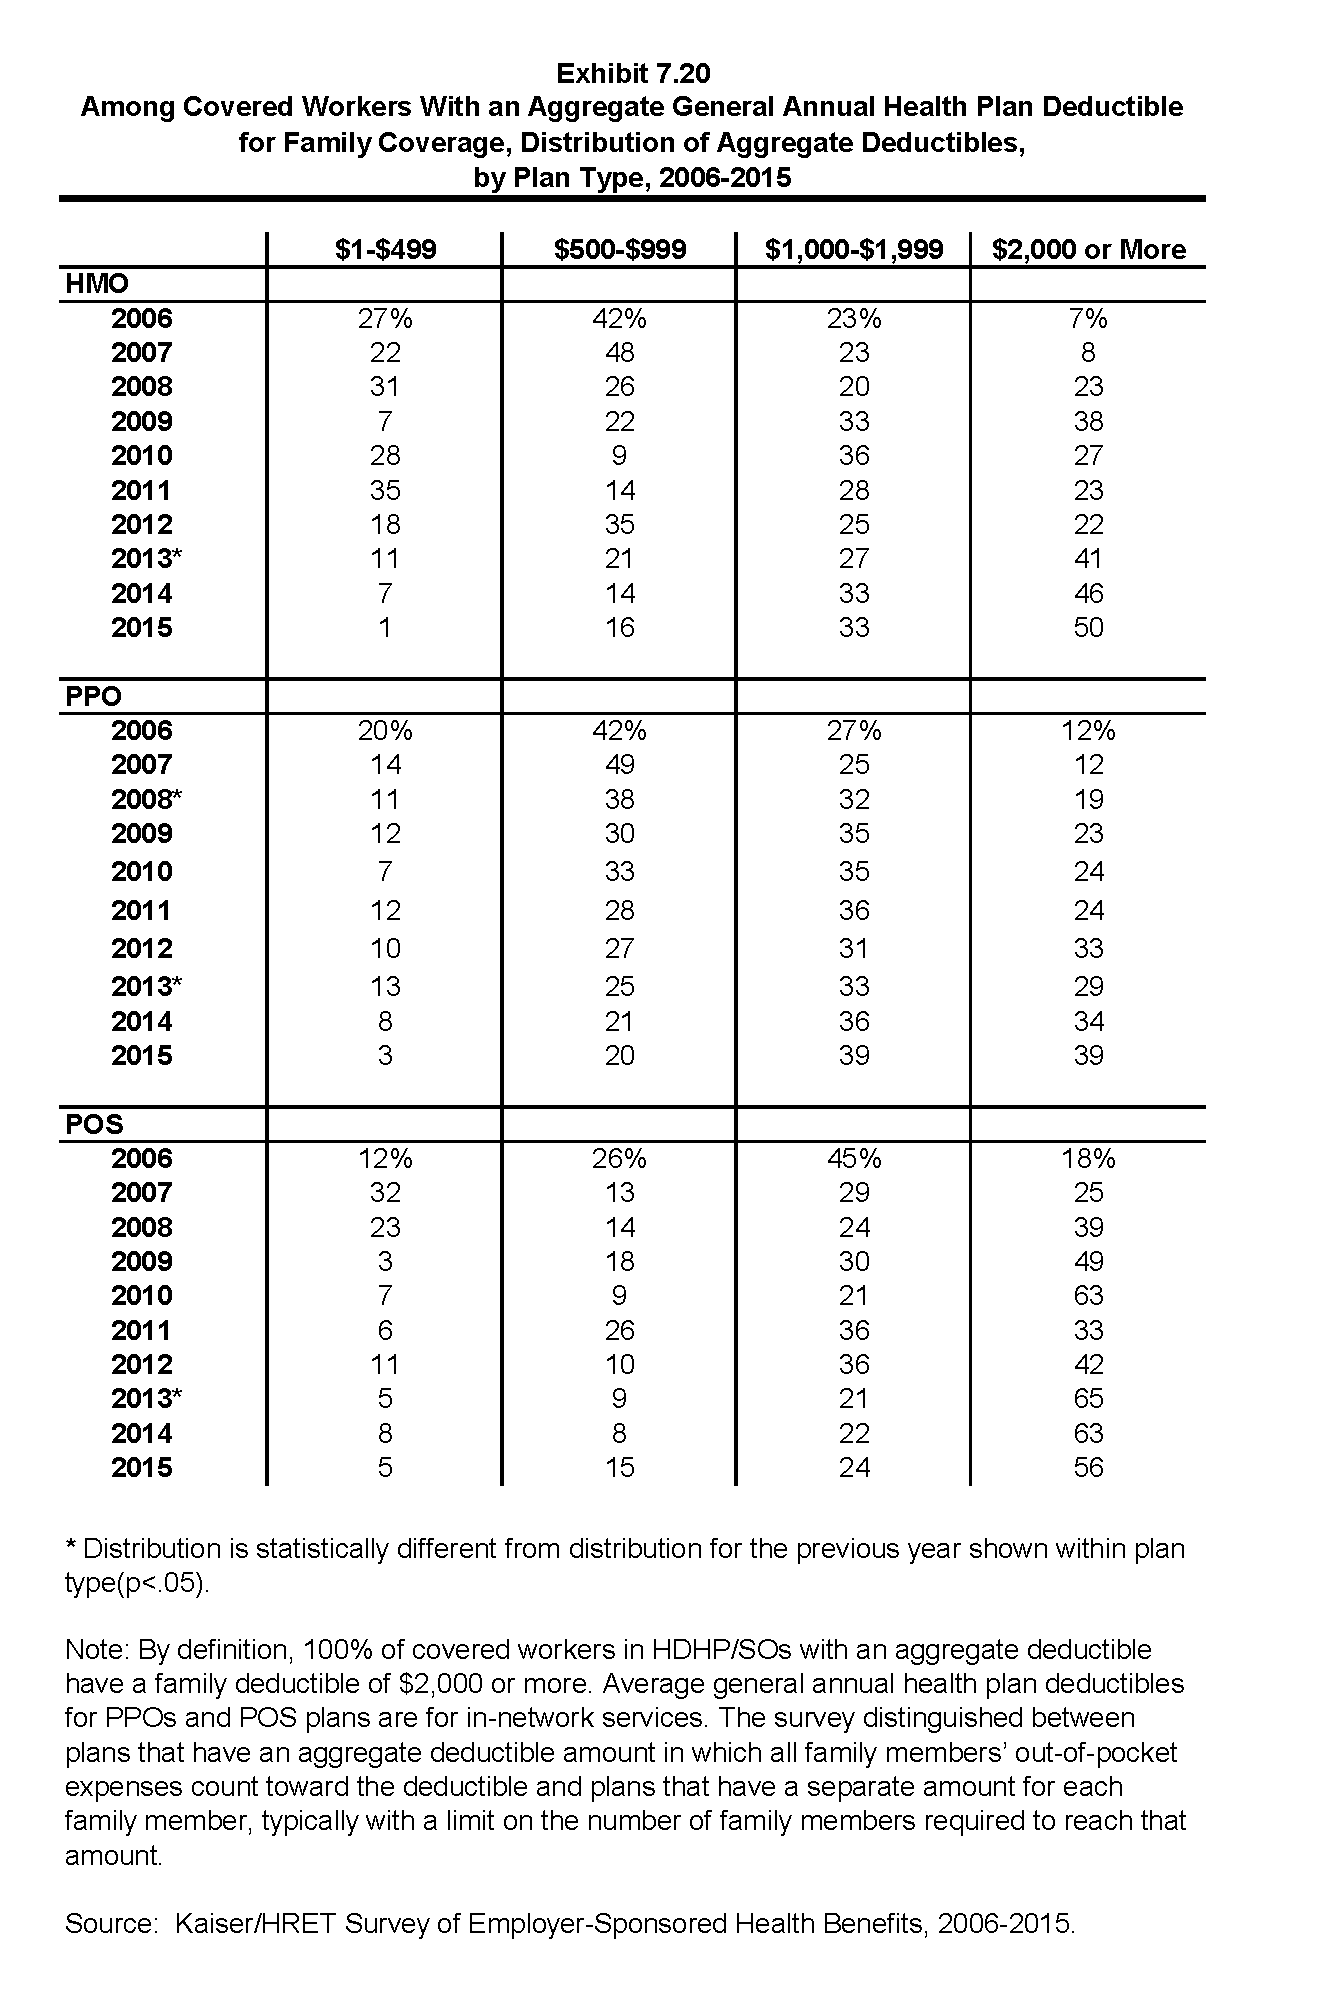
Among Covered Workers With an Aggregate General Annual Health Plan Deductible for Family Coverage, Distribution of Aggregate Deductibles, by Plan Type, 2006-2015
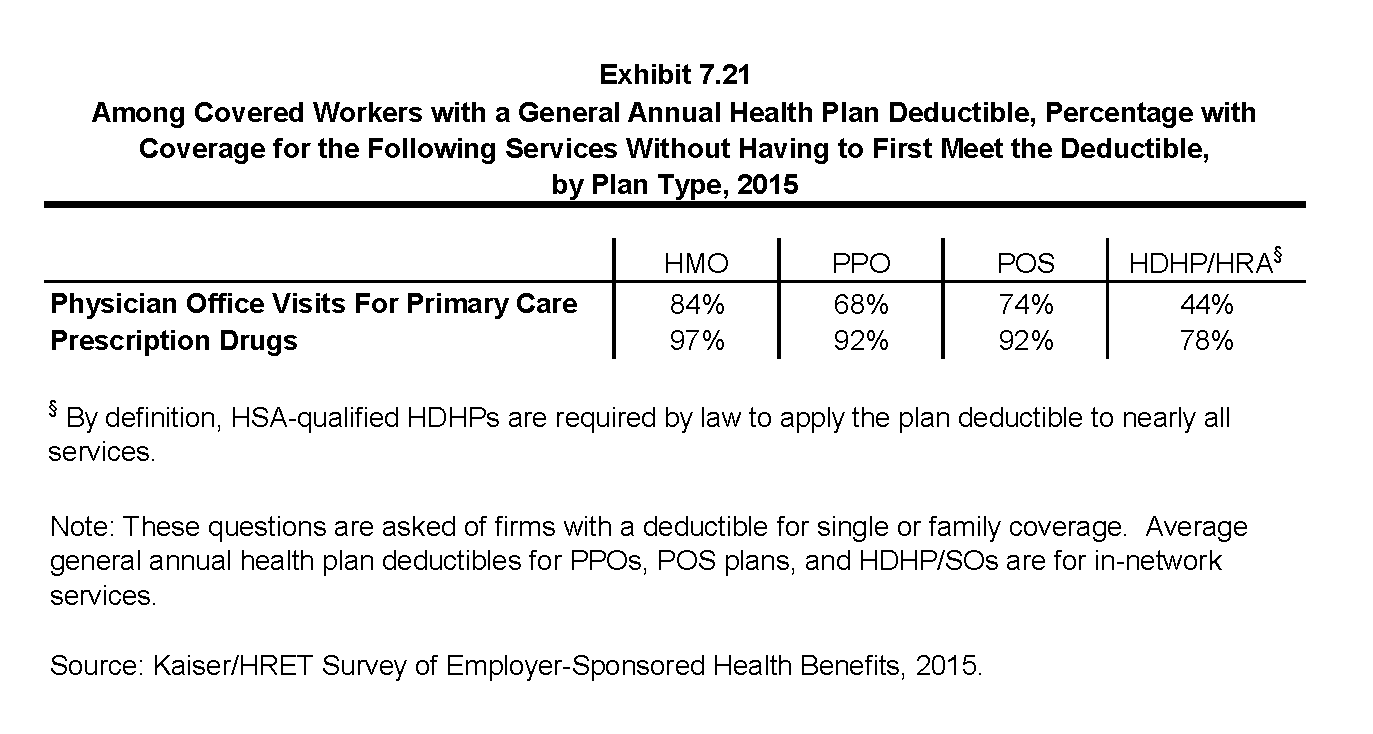
Among Covered Workers with a General Annual Health Plan Deductible, Percentage with Coverage for the Following Services Without Having to First Meet the Deductible, by Plan Type, 2015
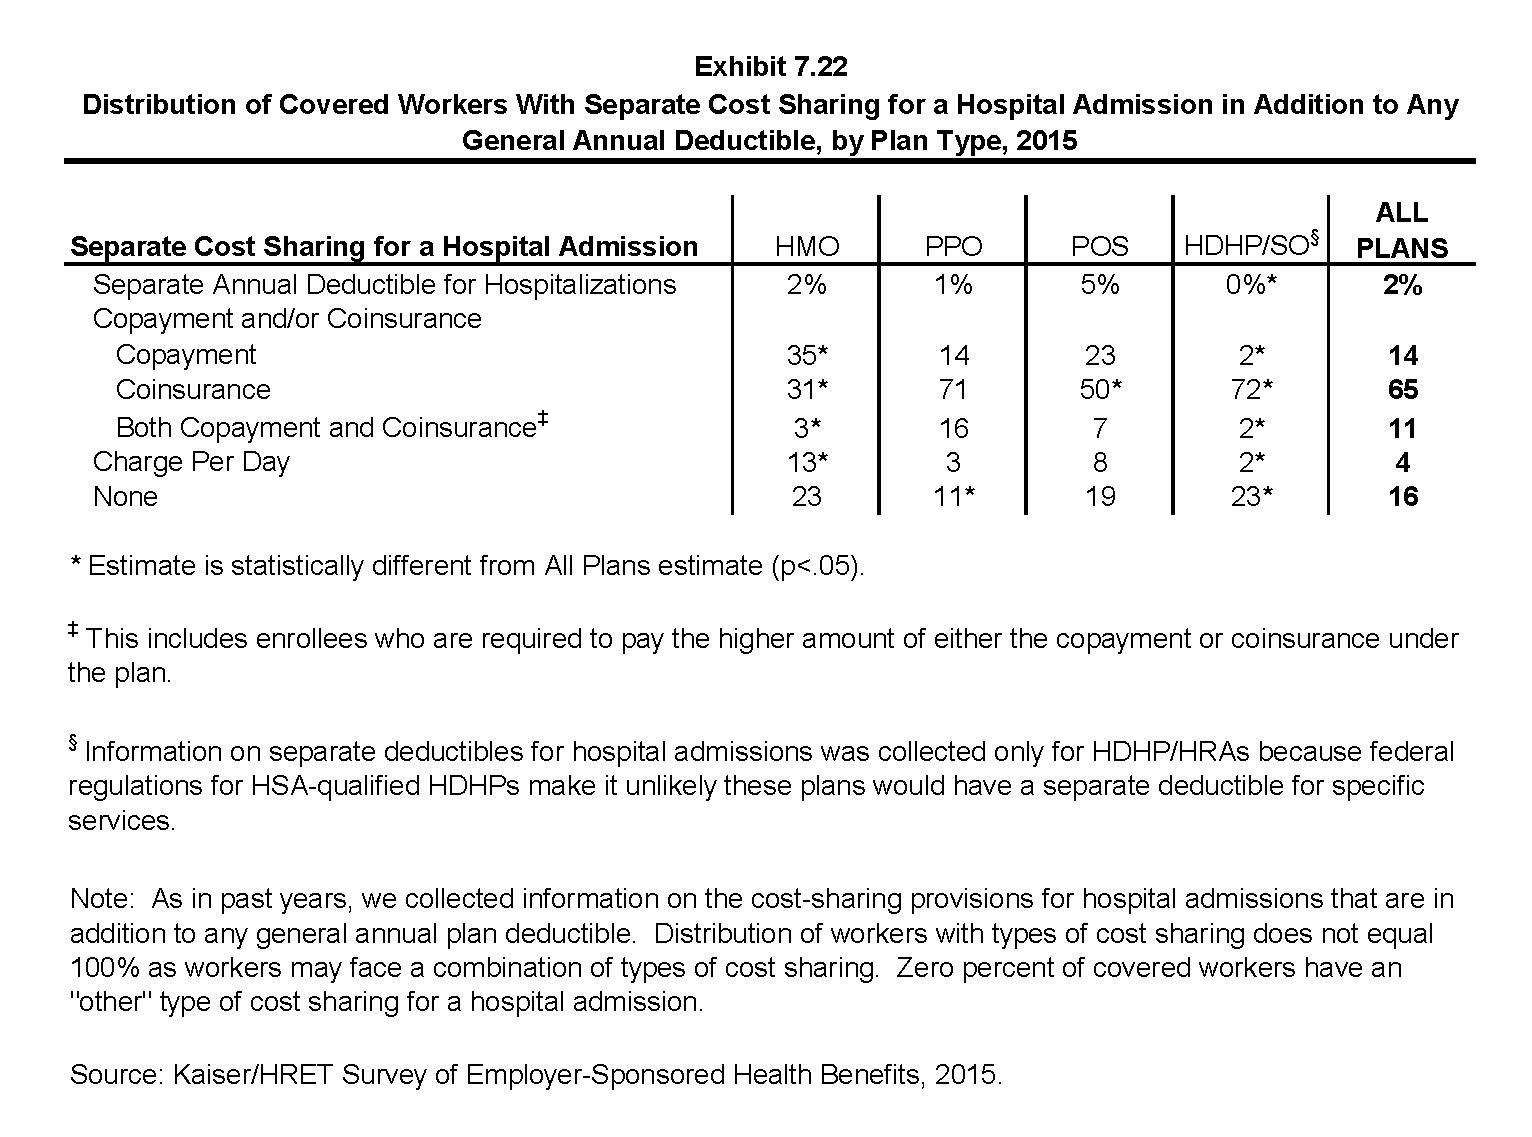
Distribution of Covered Workers With Separate Cost Sharing for a Hospital Admission in Addition to Any General Annual Deductible, by Plan Type, 2015
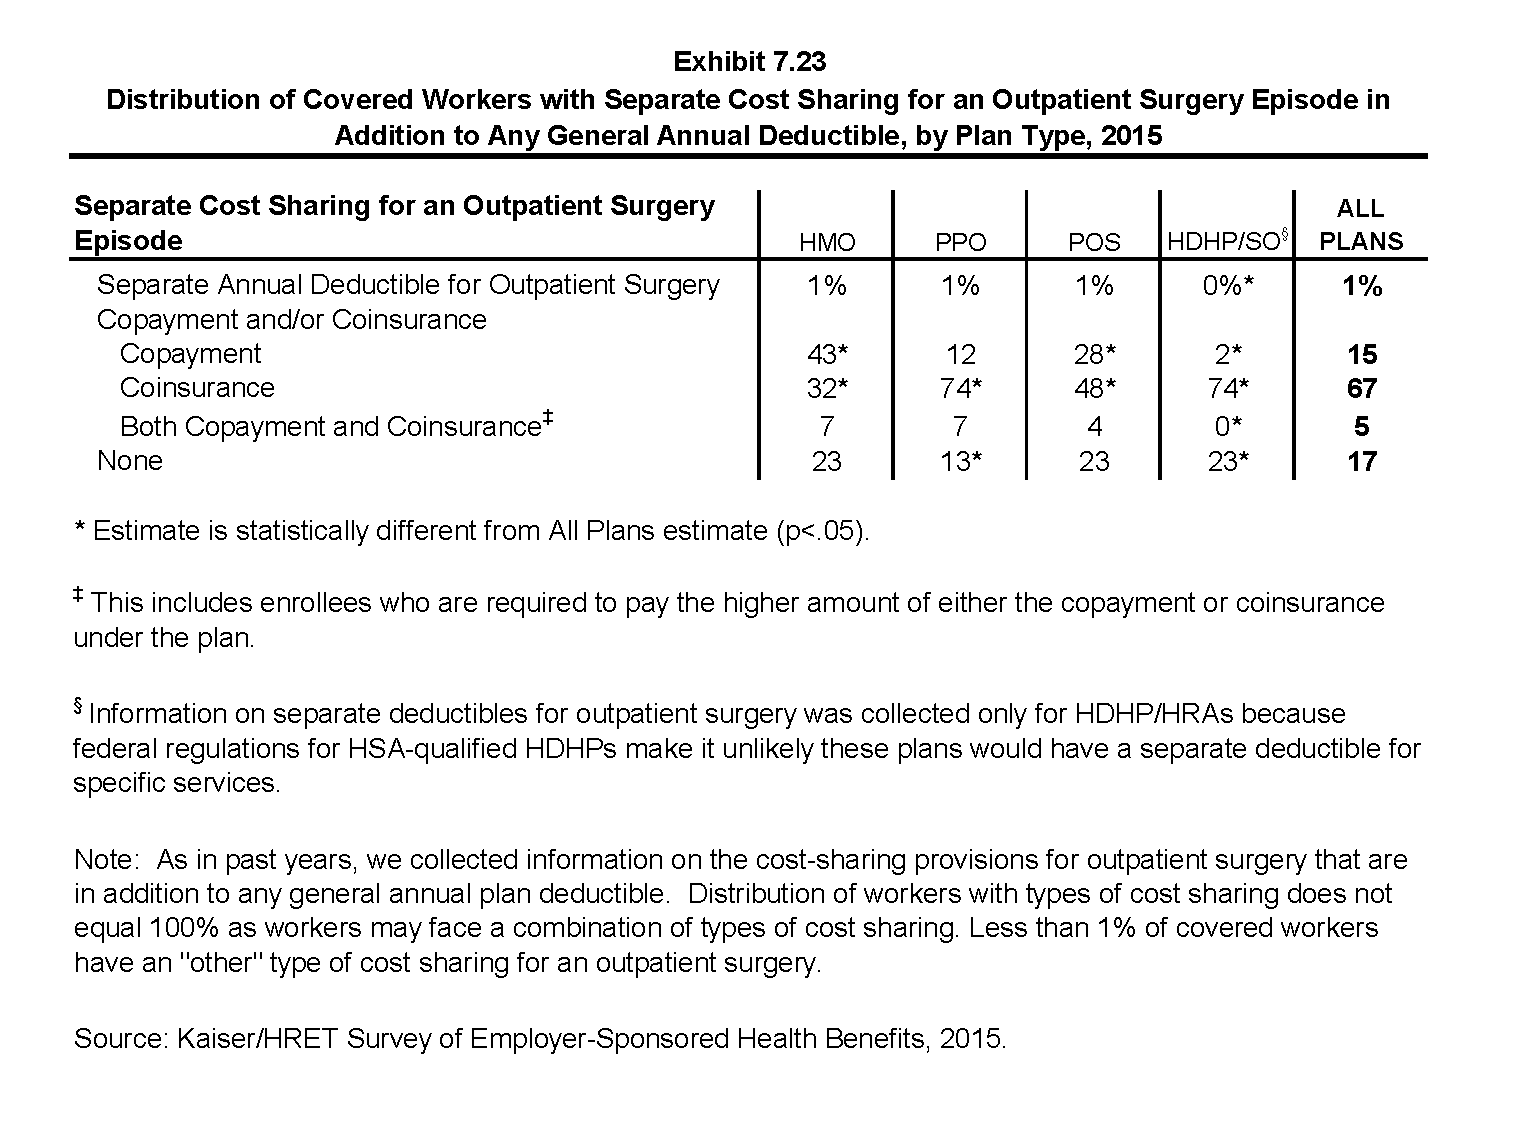
Distribution of Covered Workers with Separate Cost Sharing for an Outpatient Surgery Episode in Addition to Any General Annual Deductible, by Plan Type, 2015
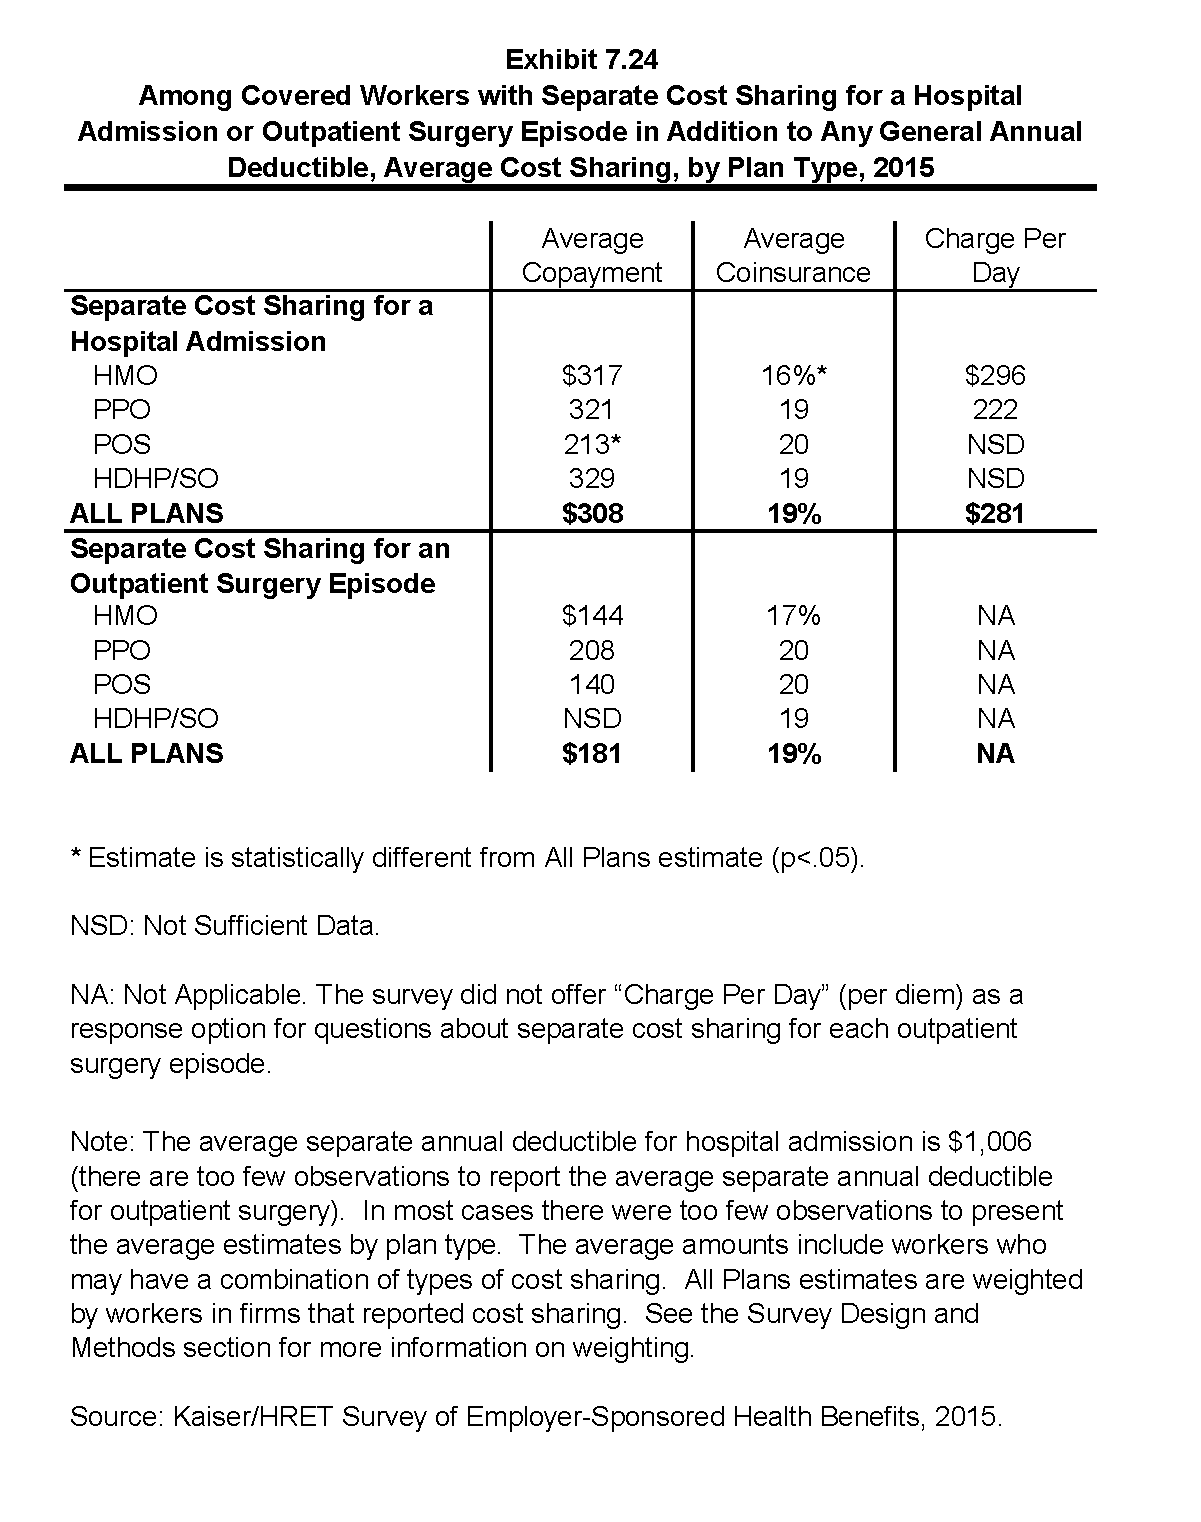
Among Covered Workers with Separate Cost Sharing for a Hospital Admission or Outpatient Surgery Episode in Addition to Any General Annual Deductible, Average Cost Sharing, by Plan Type, 2015
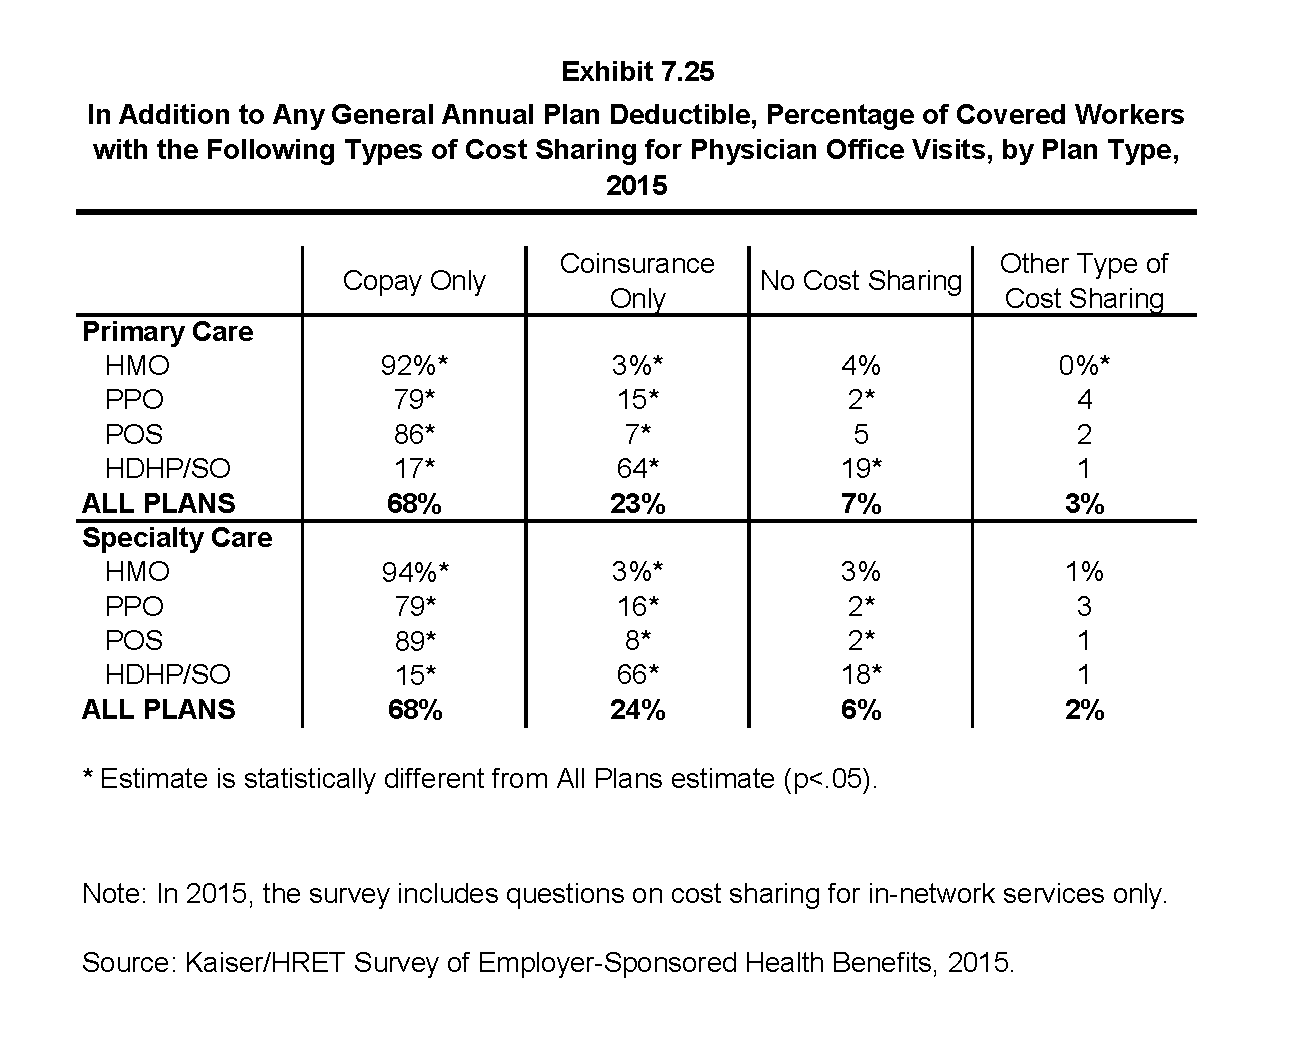
In Addition to Any General Annual Plan Deductible, Percentage of Covered Workers with the Following Types of Cost Sharing for Physician Office Visits, by Plan Type, 2015
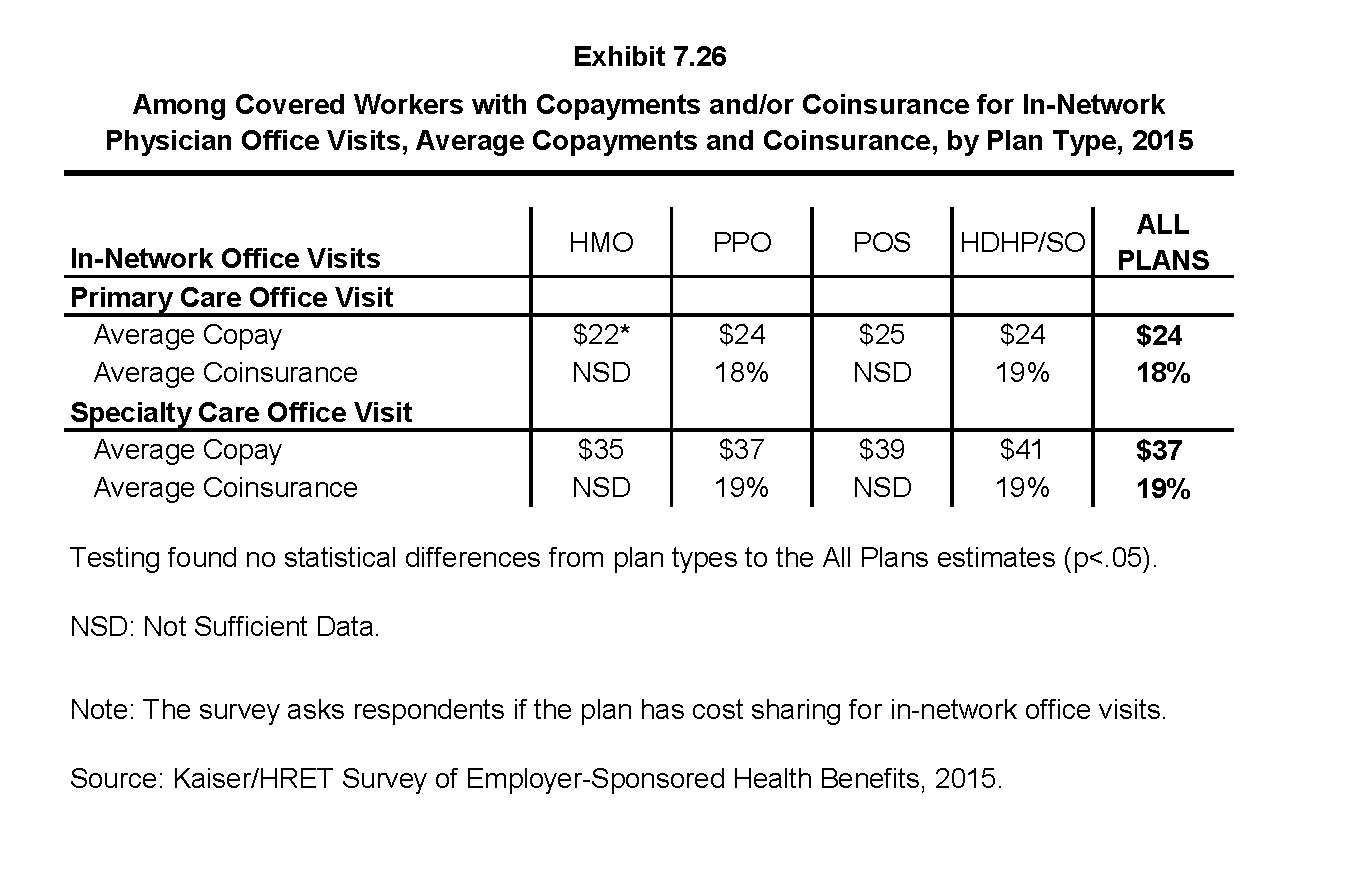
Among Covered Workers with Copayments and/or Coinsurance for In-Network Physician Office Visits, Average Copayments and Coinsurance, by Plan Type, 2015
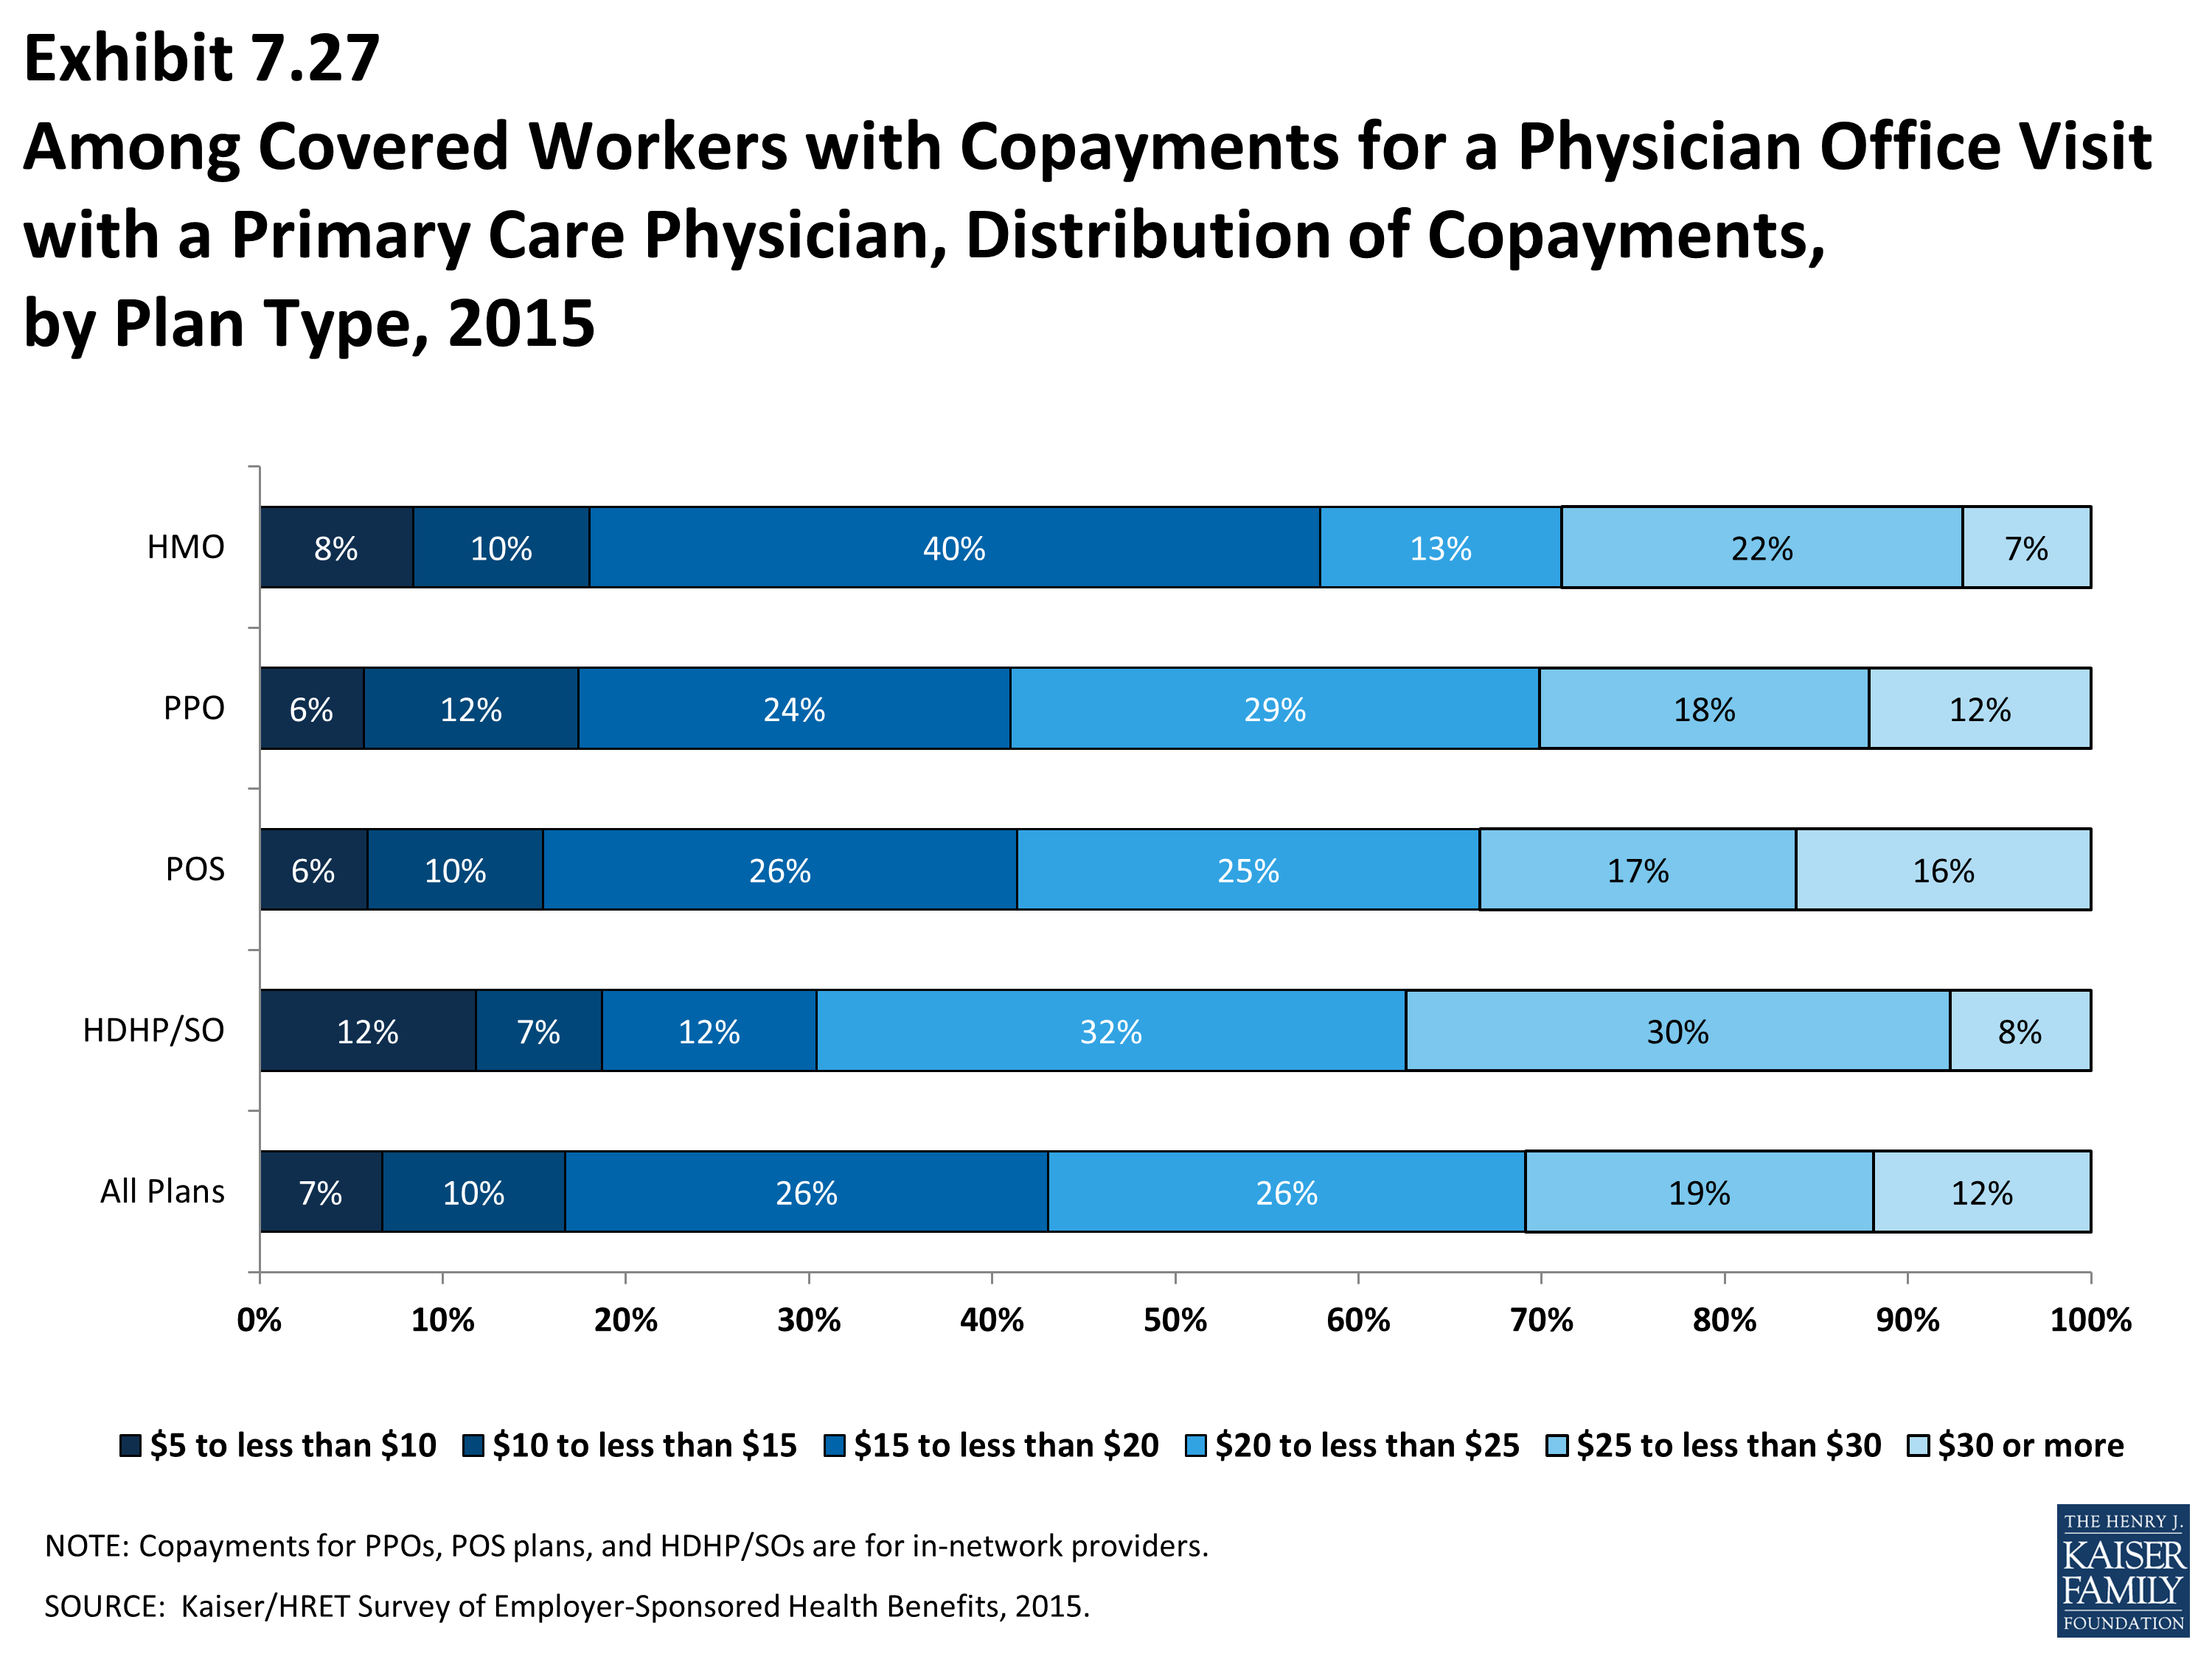
Among Covered Workers with Copayments for a Physician Office Visit with a Primary Care Physician, Distribution of Copayments, by Plan Type, 2015
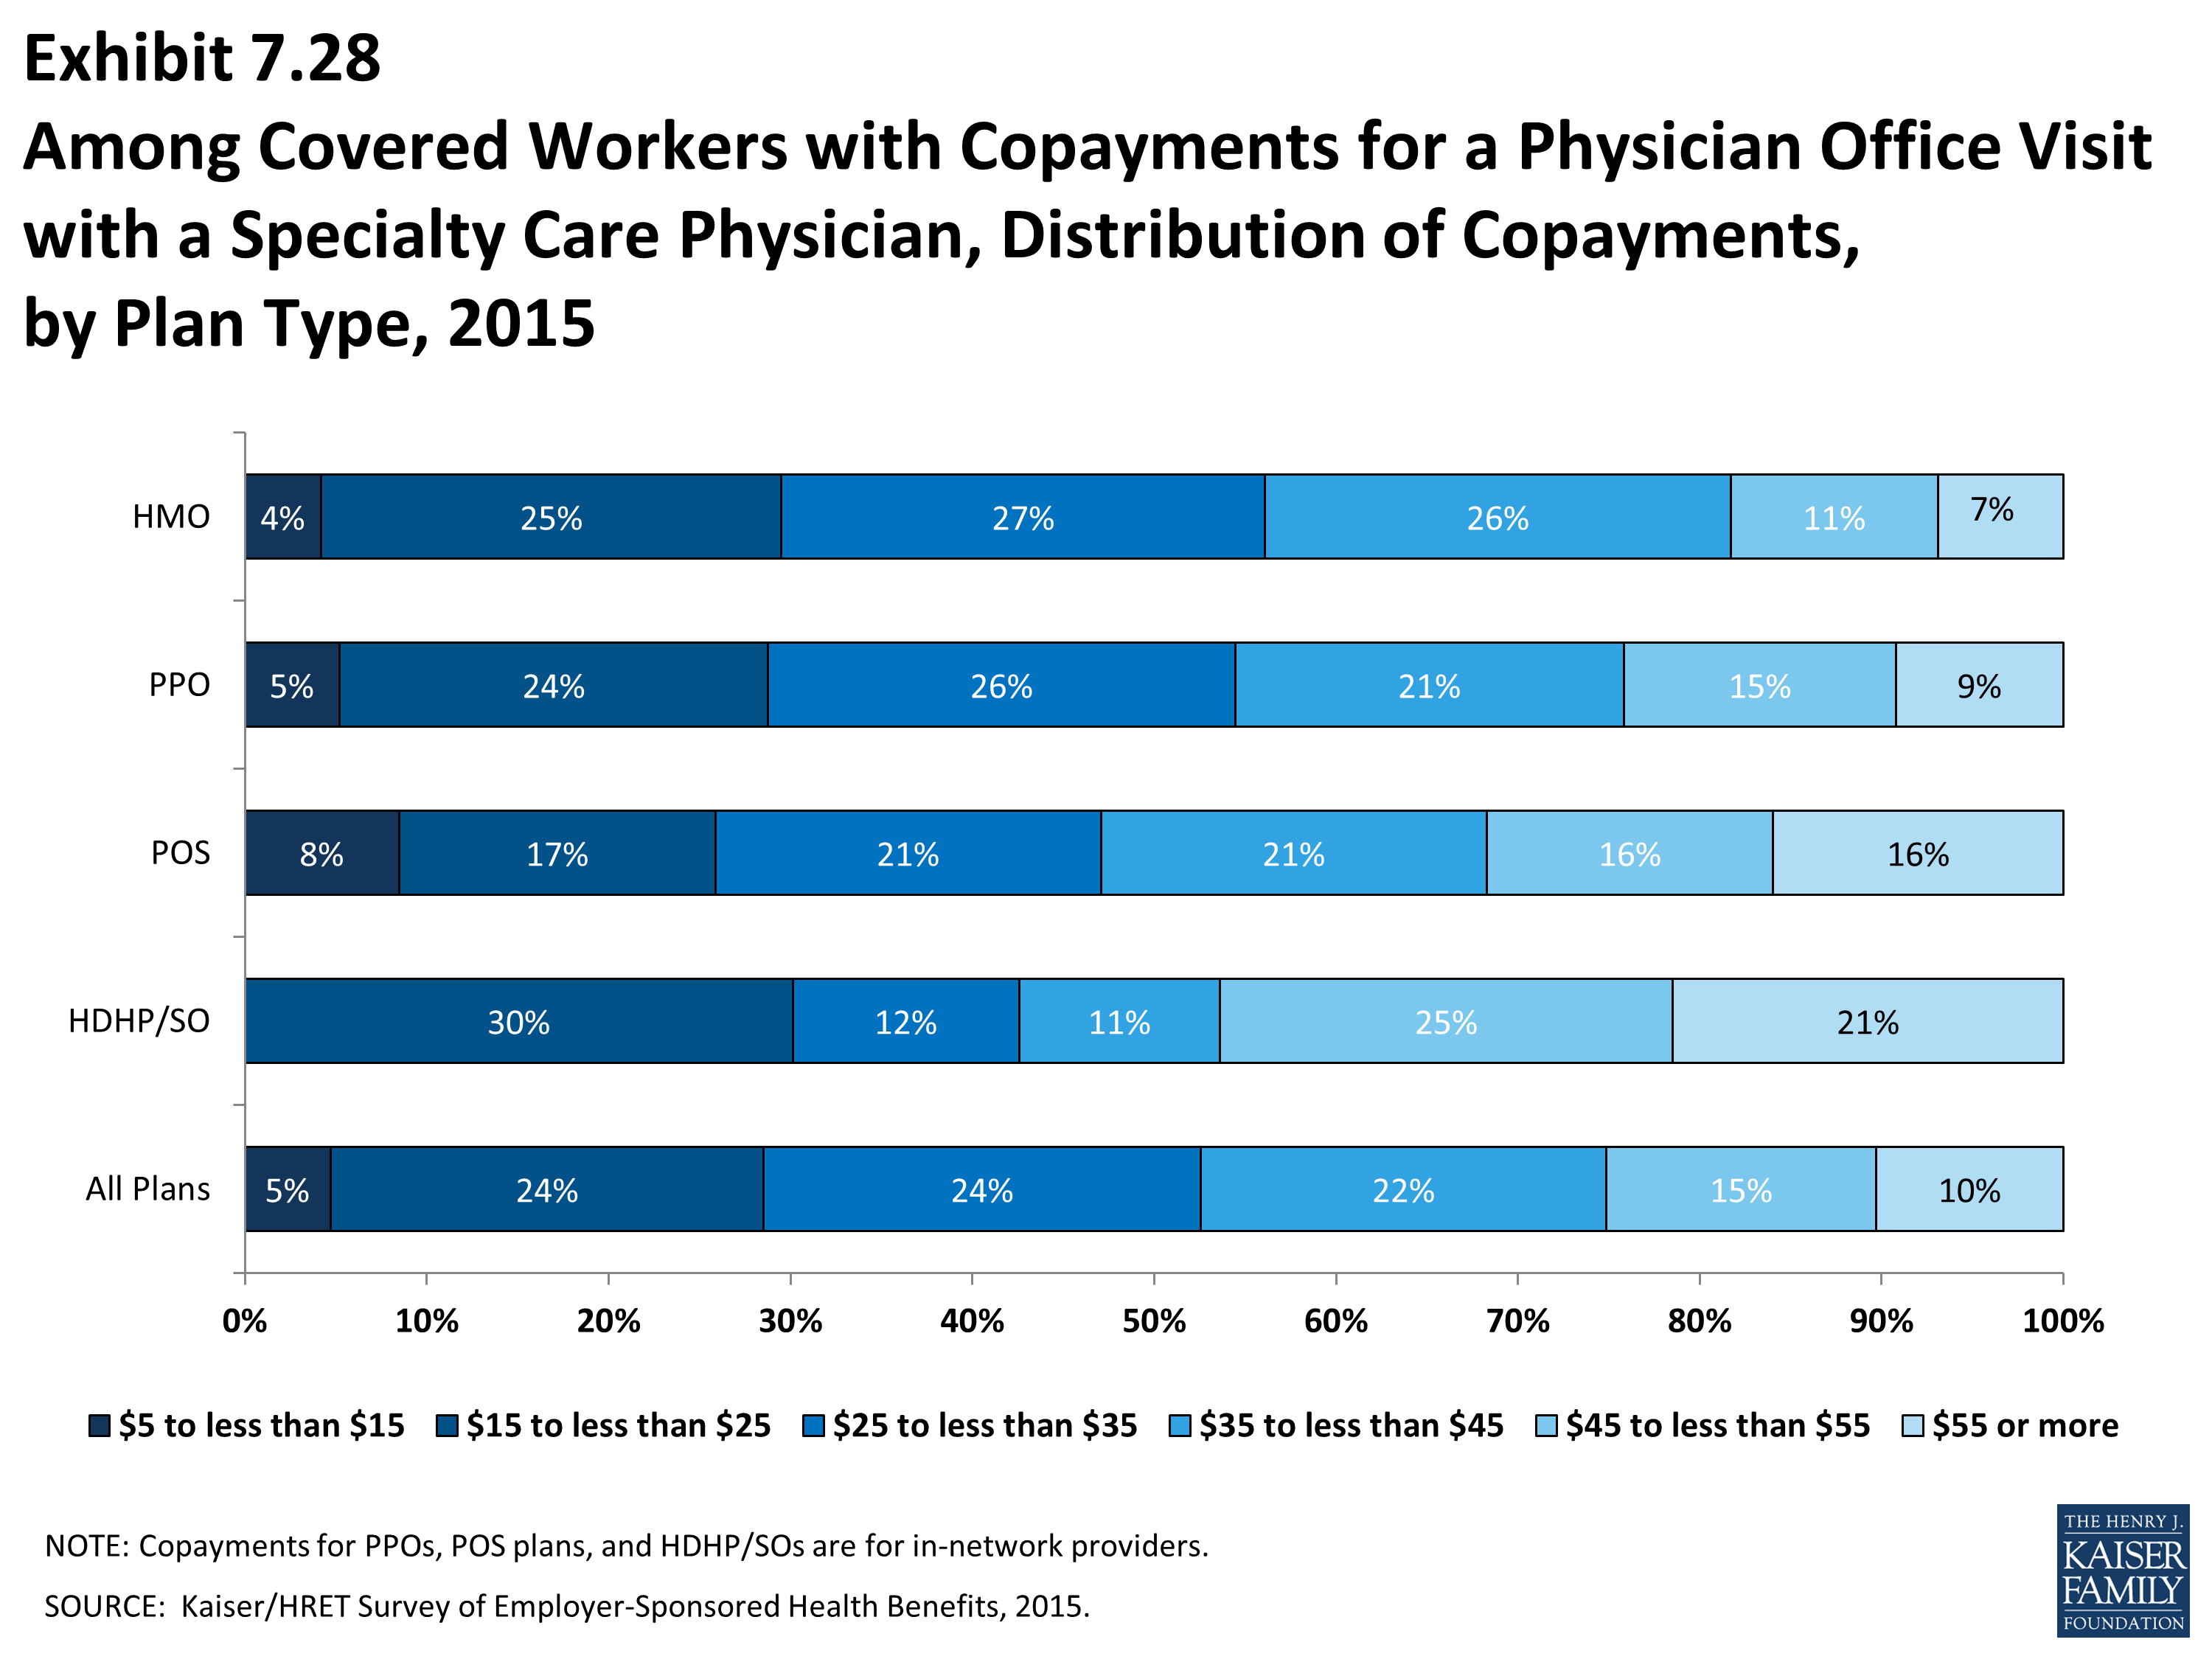
Among Covered Workers with Copayments for a Physician Office Visit with a Specialty Care Physician, Distribution of Copayments, by Plan Type, 2015
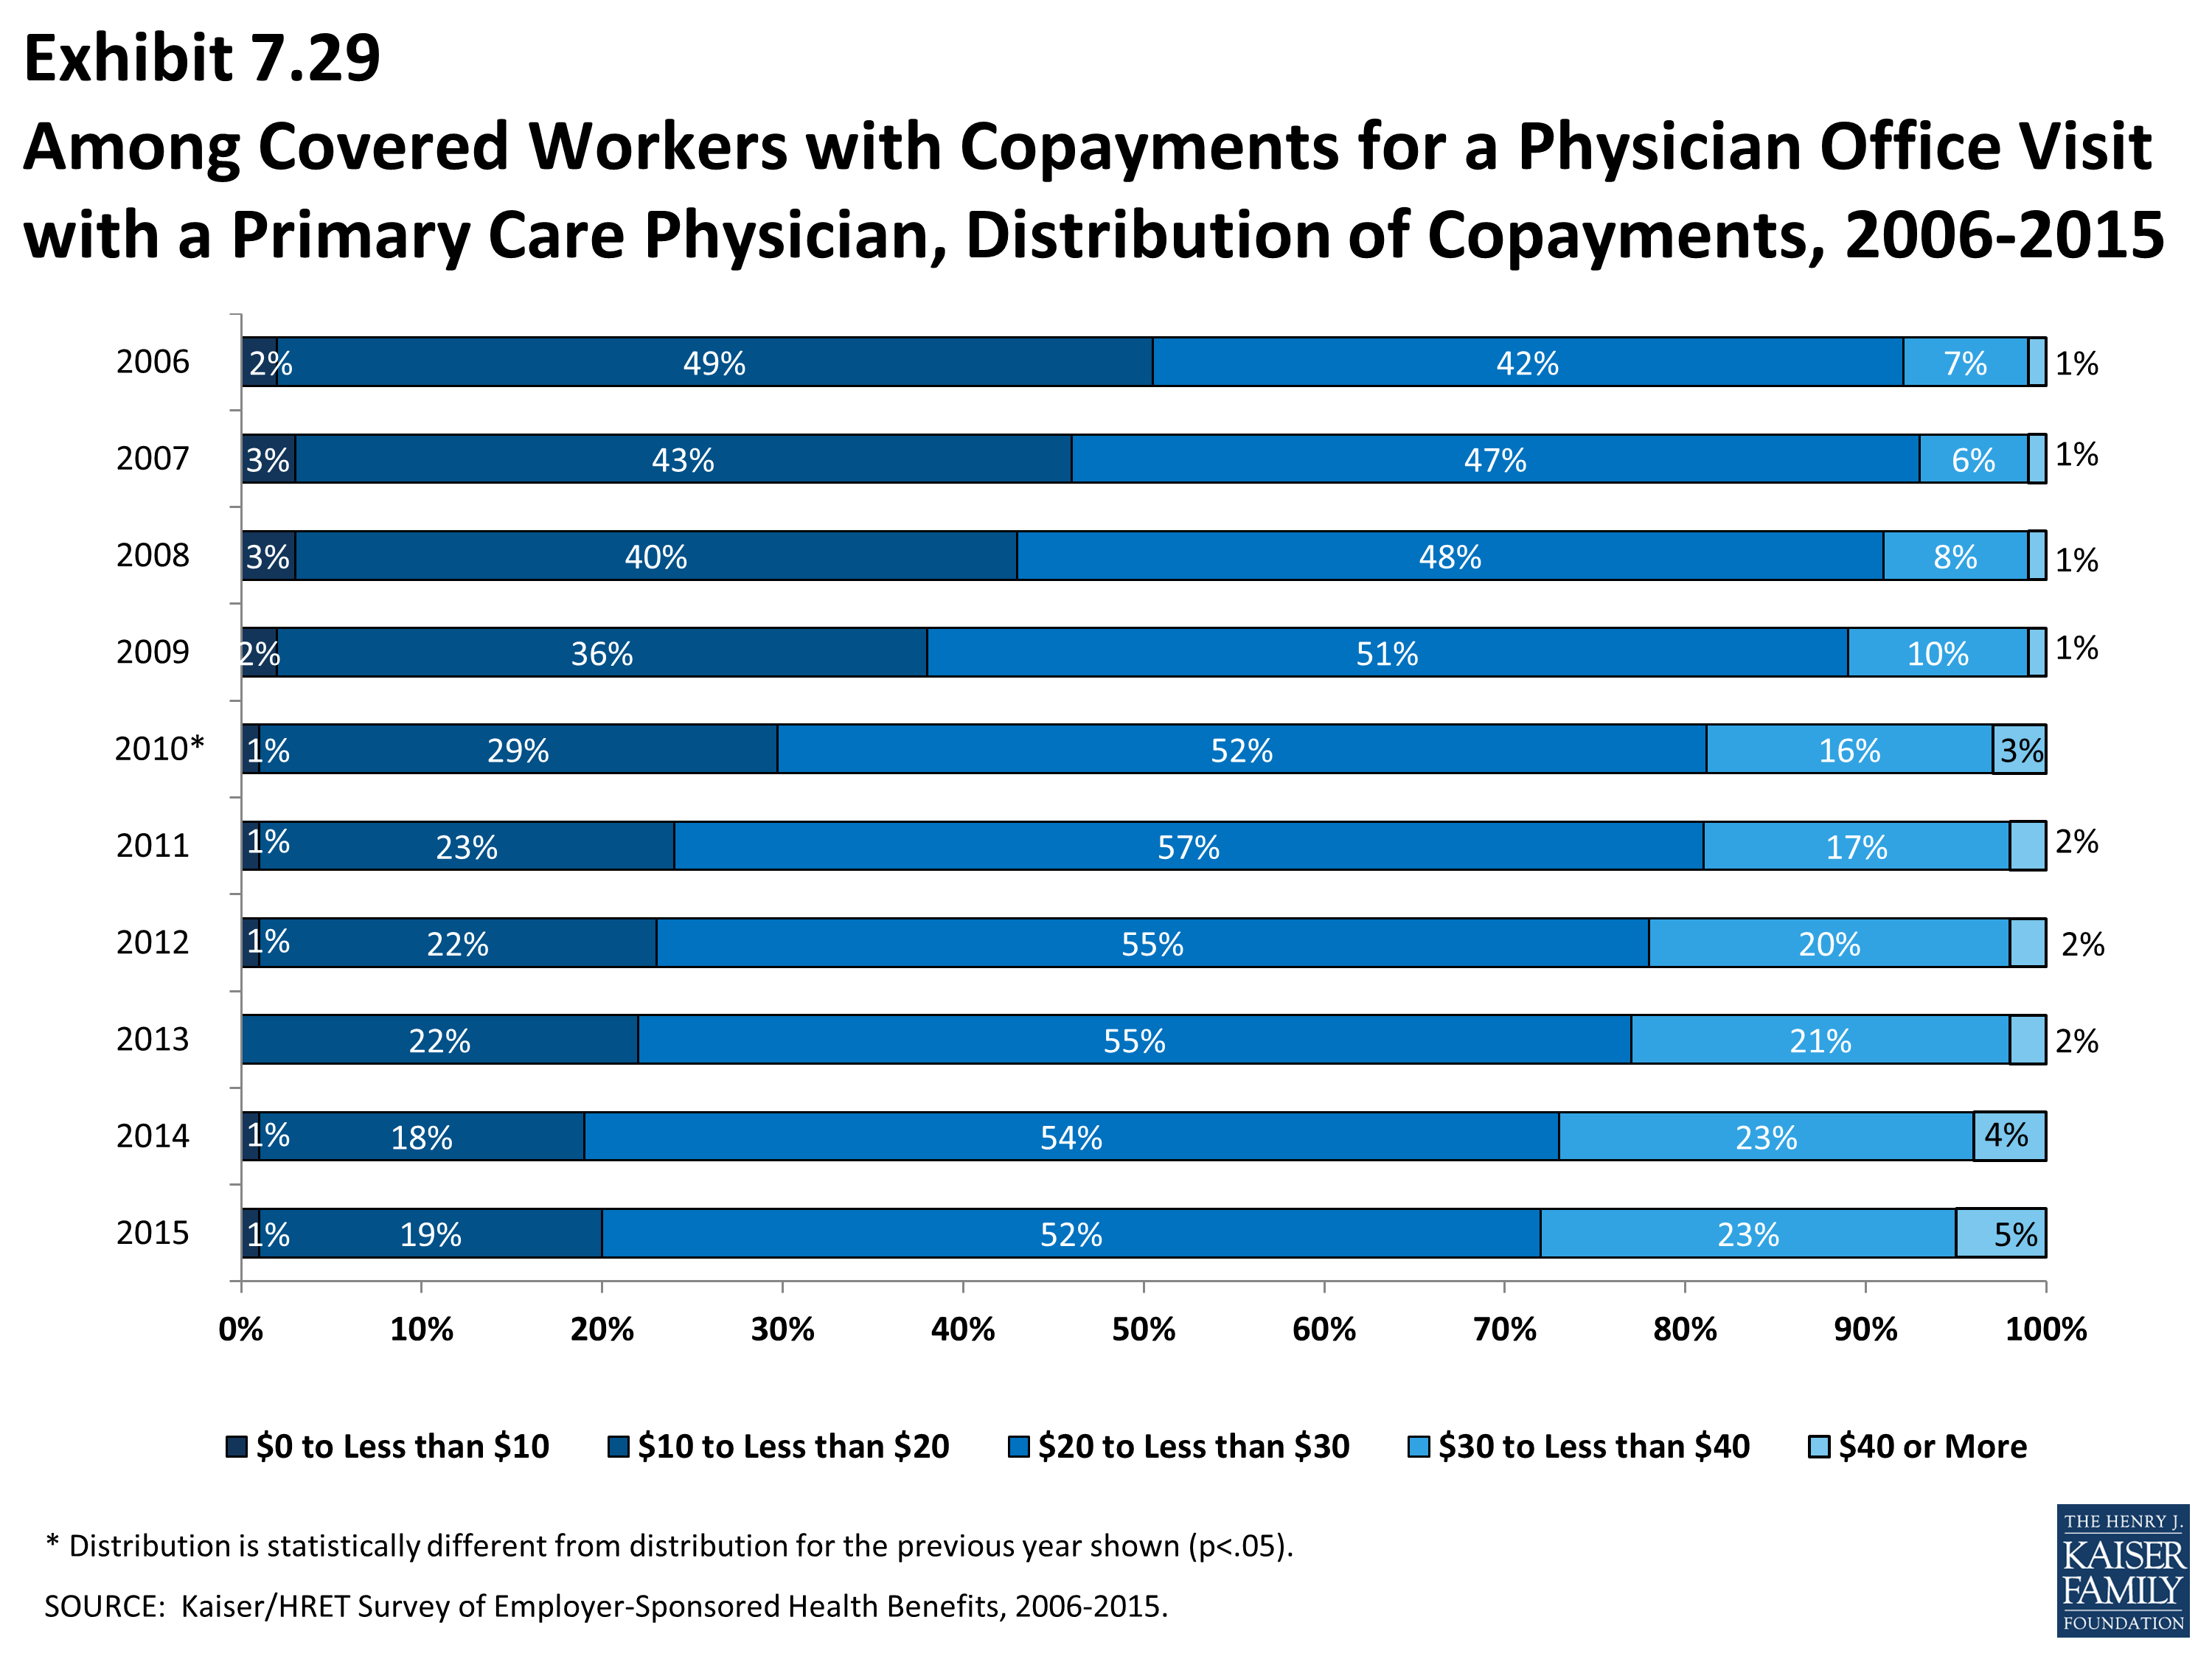
Among Covered Workers with Copayments for a Physician Office Visit with a Primary Care Physician, Distribution of Copayments, 2006-2015
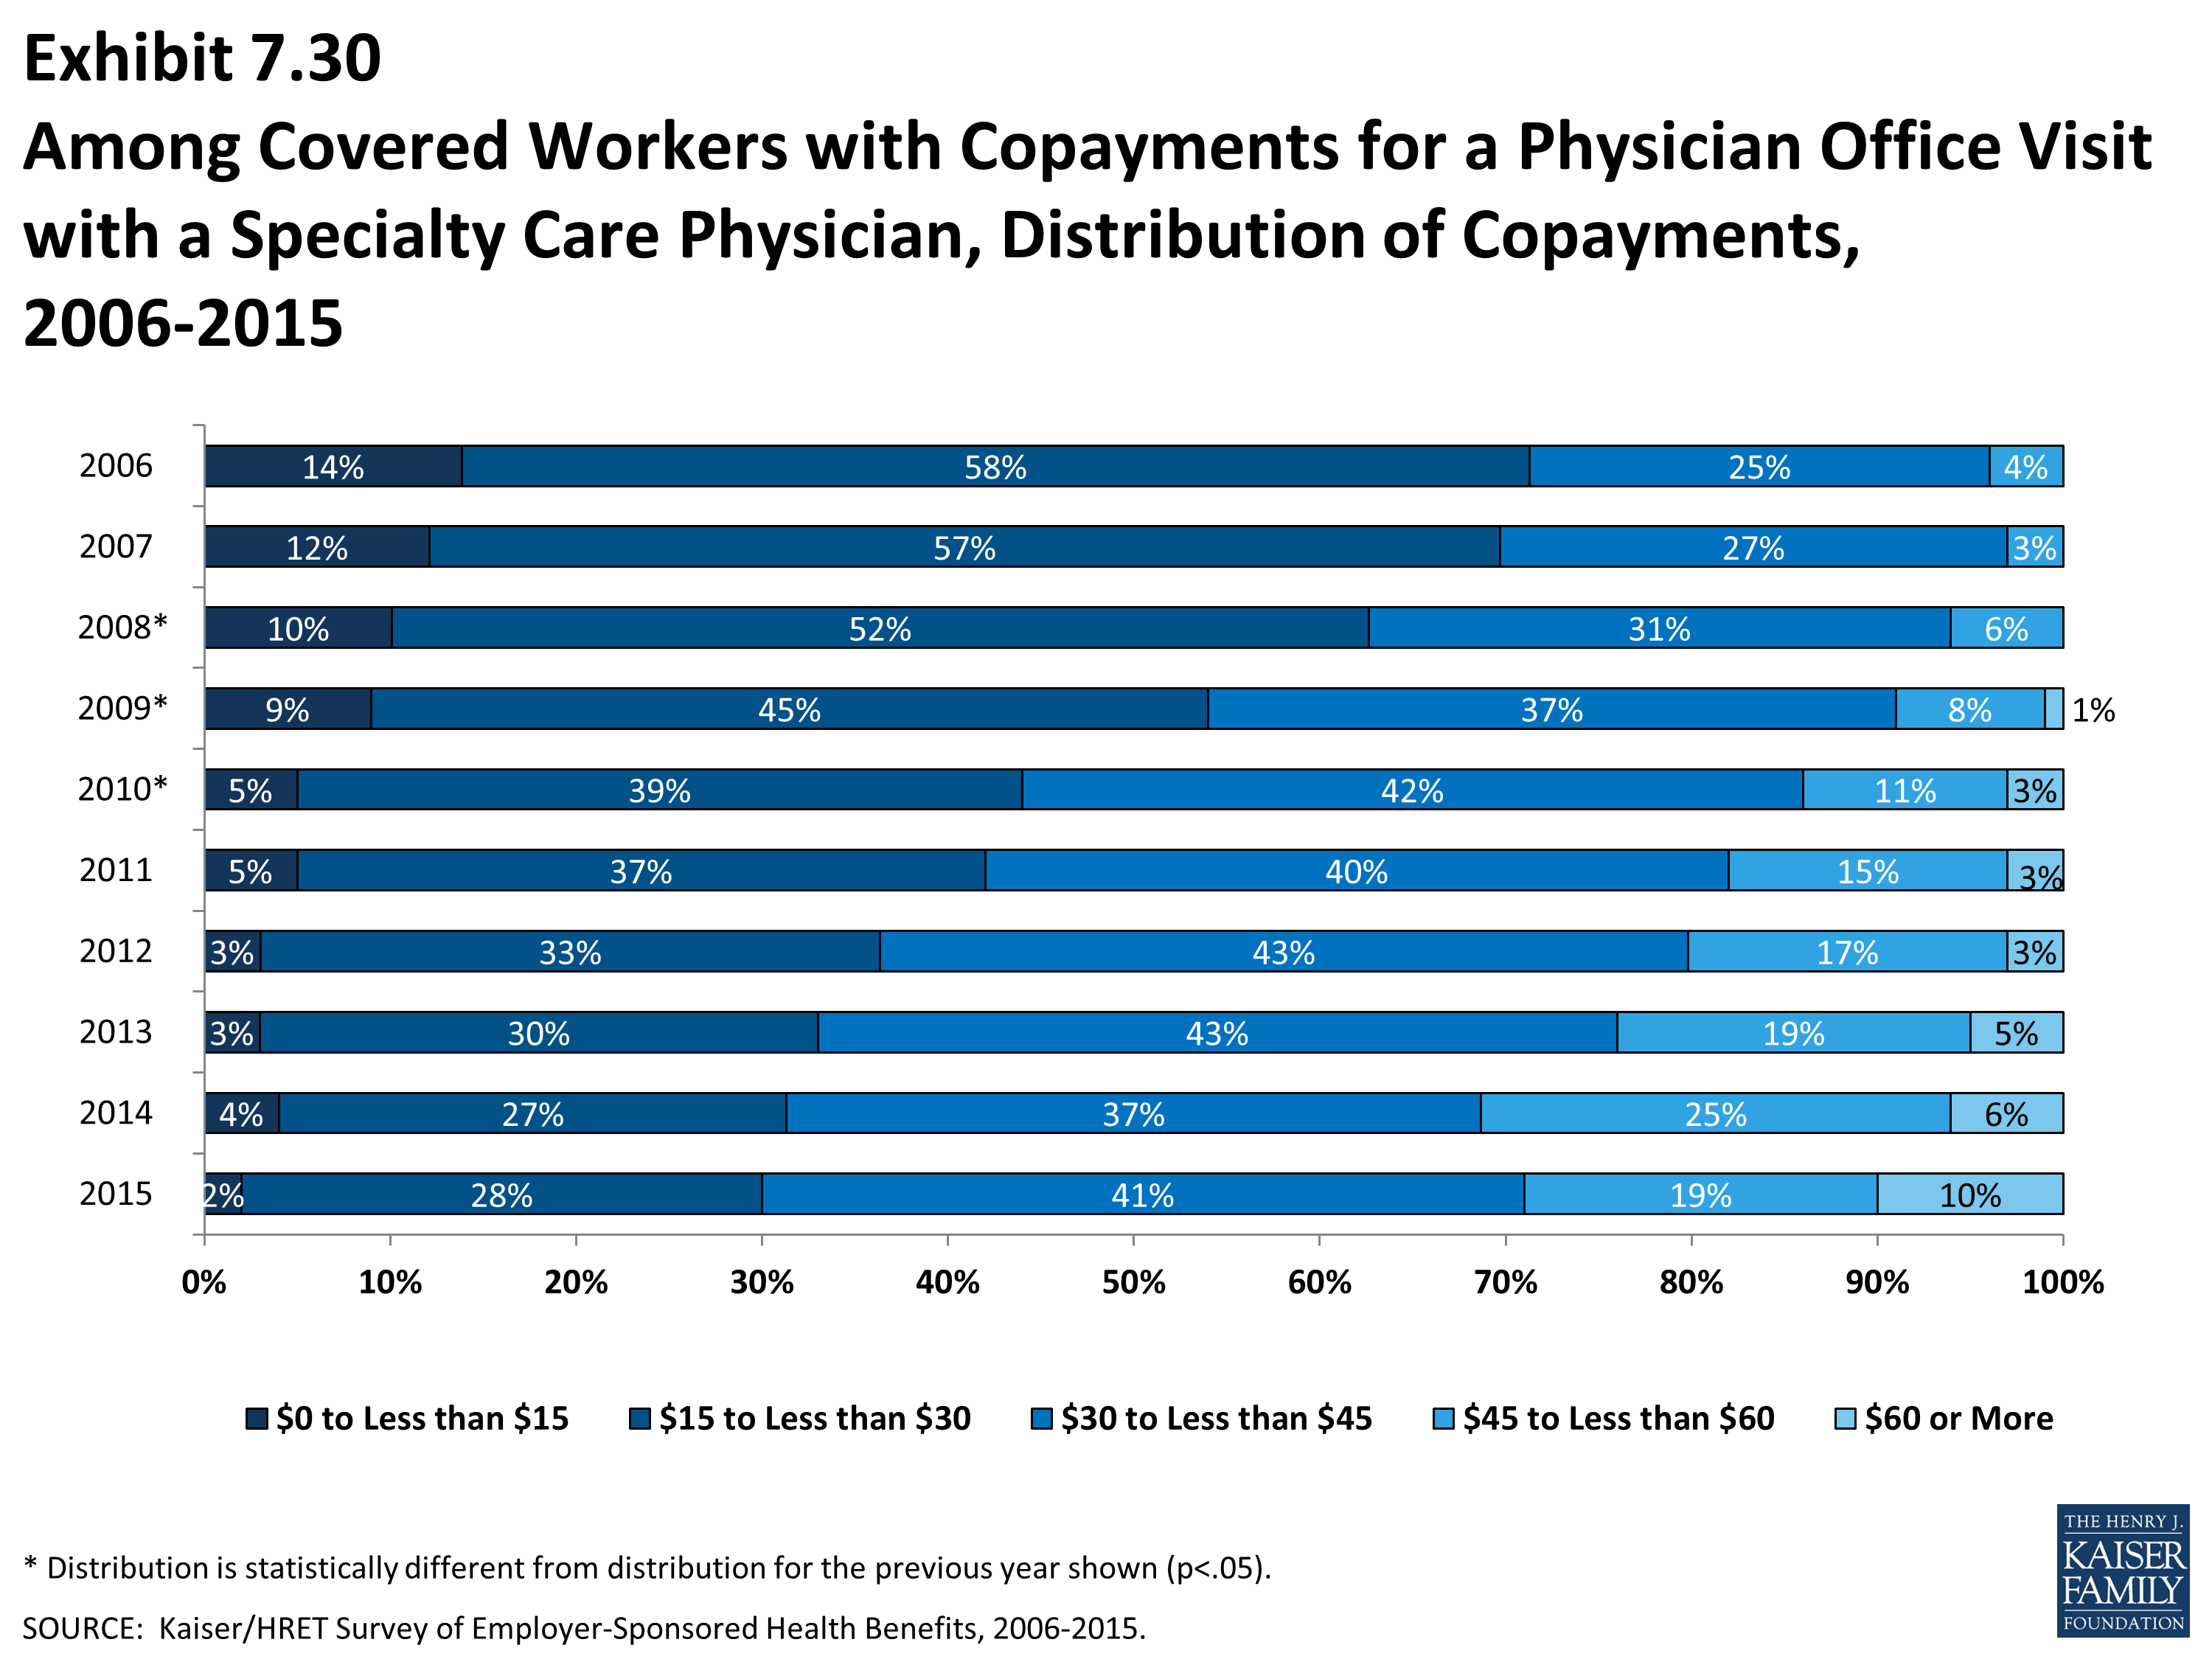
Among Covered Workers with Copayments for a Physician Office Visit with a Specialty Care Physician, Distribution of Copayments, 2006-2015
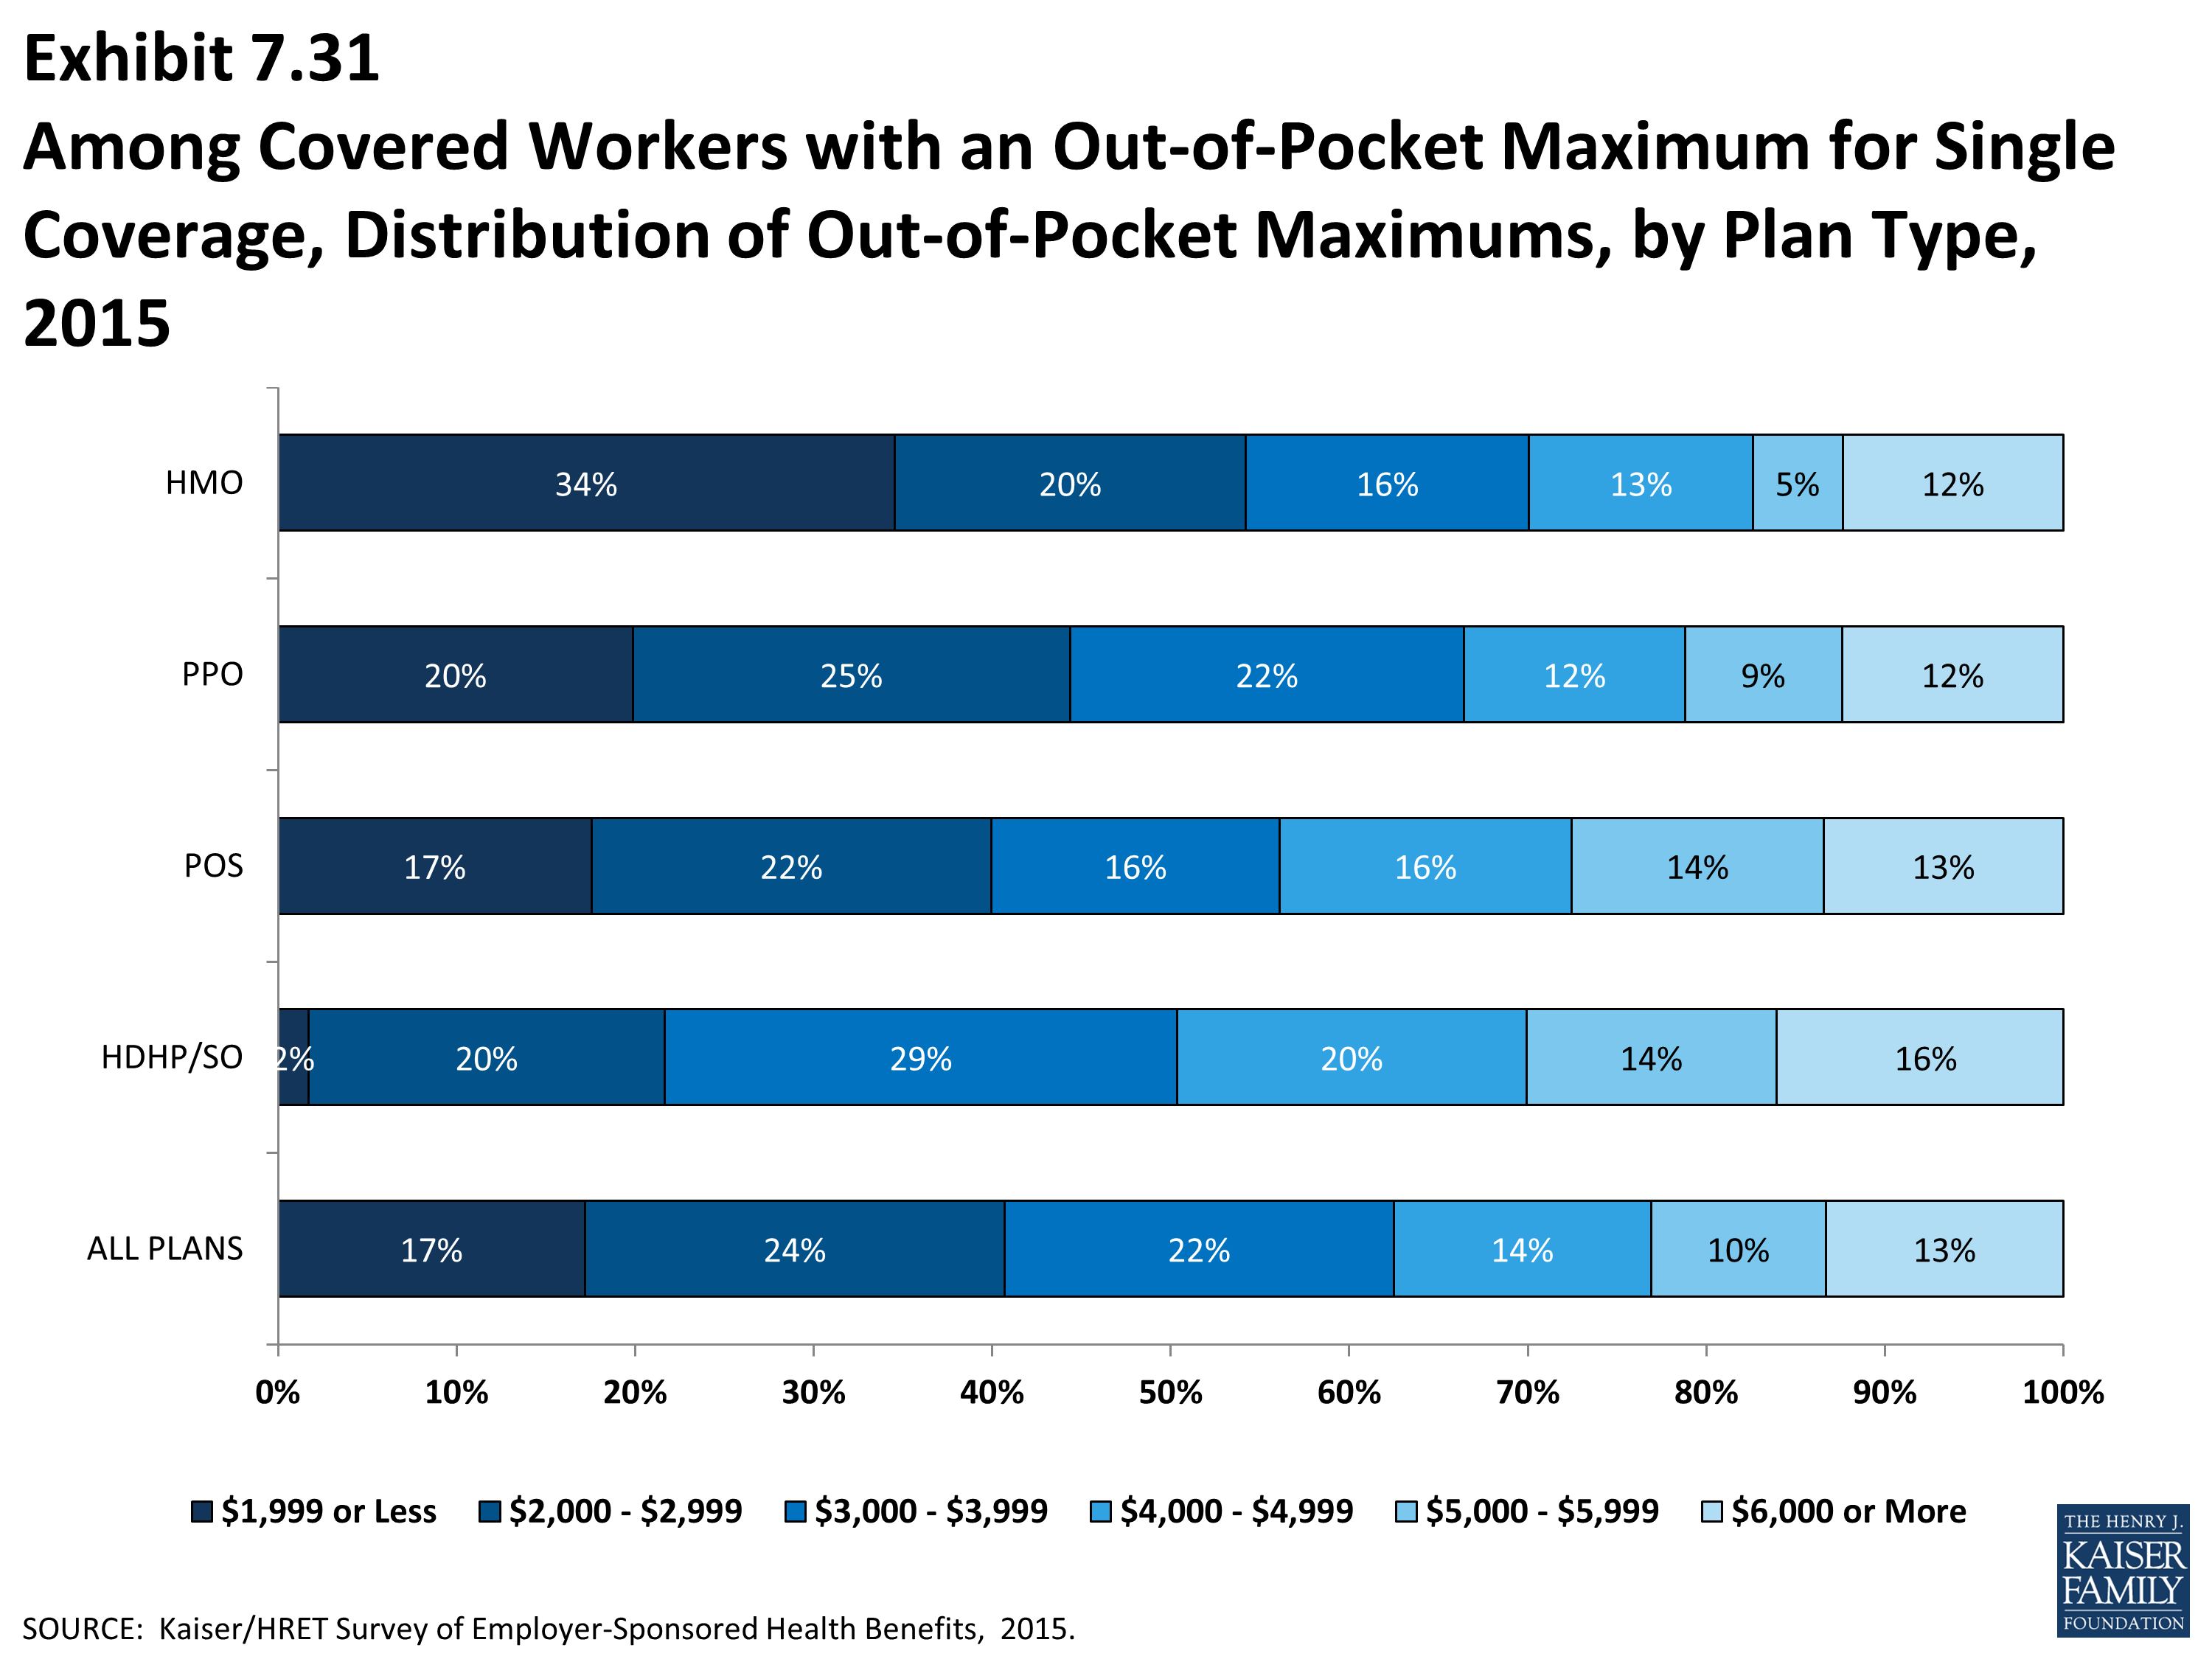
Among Covered Workers with an Out-of-Pocket Maximum for Single Coverage, Distribution of Out-of-Pocket Maximums, by Plan Type, 2015
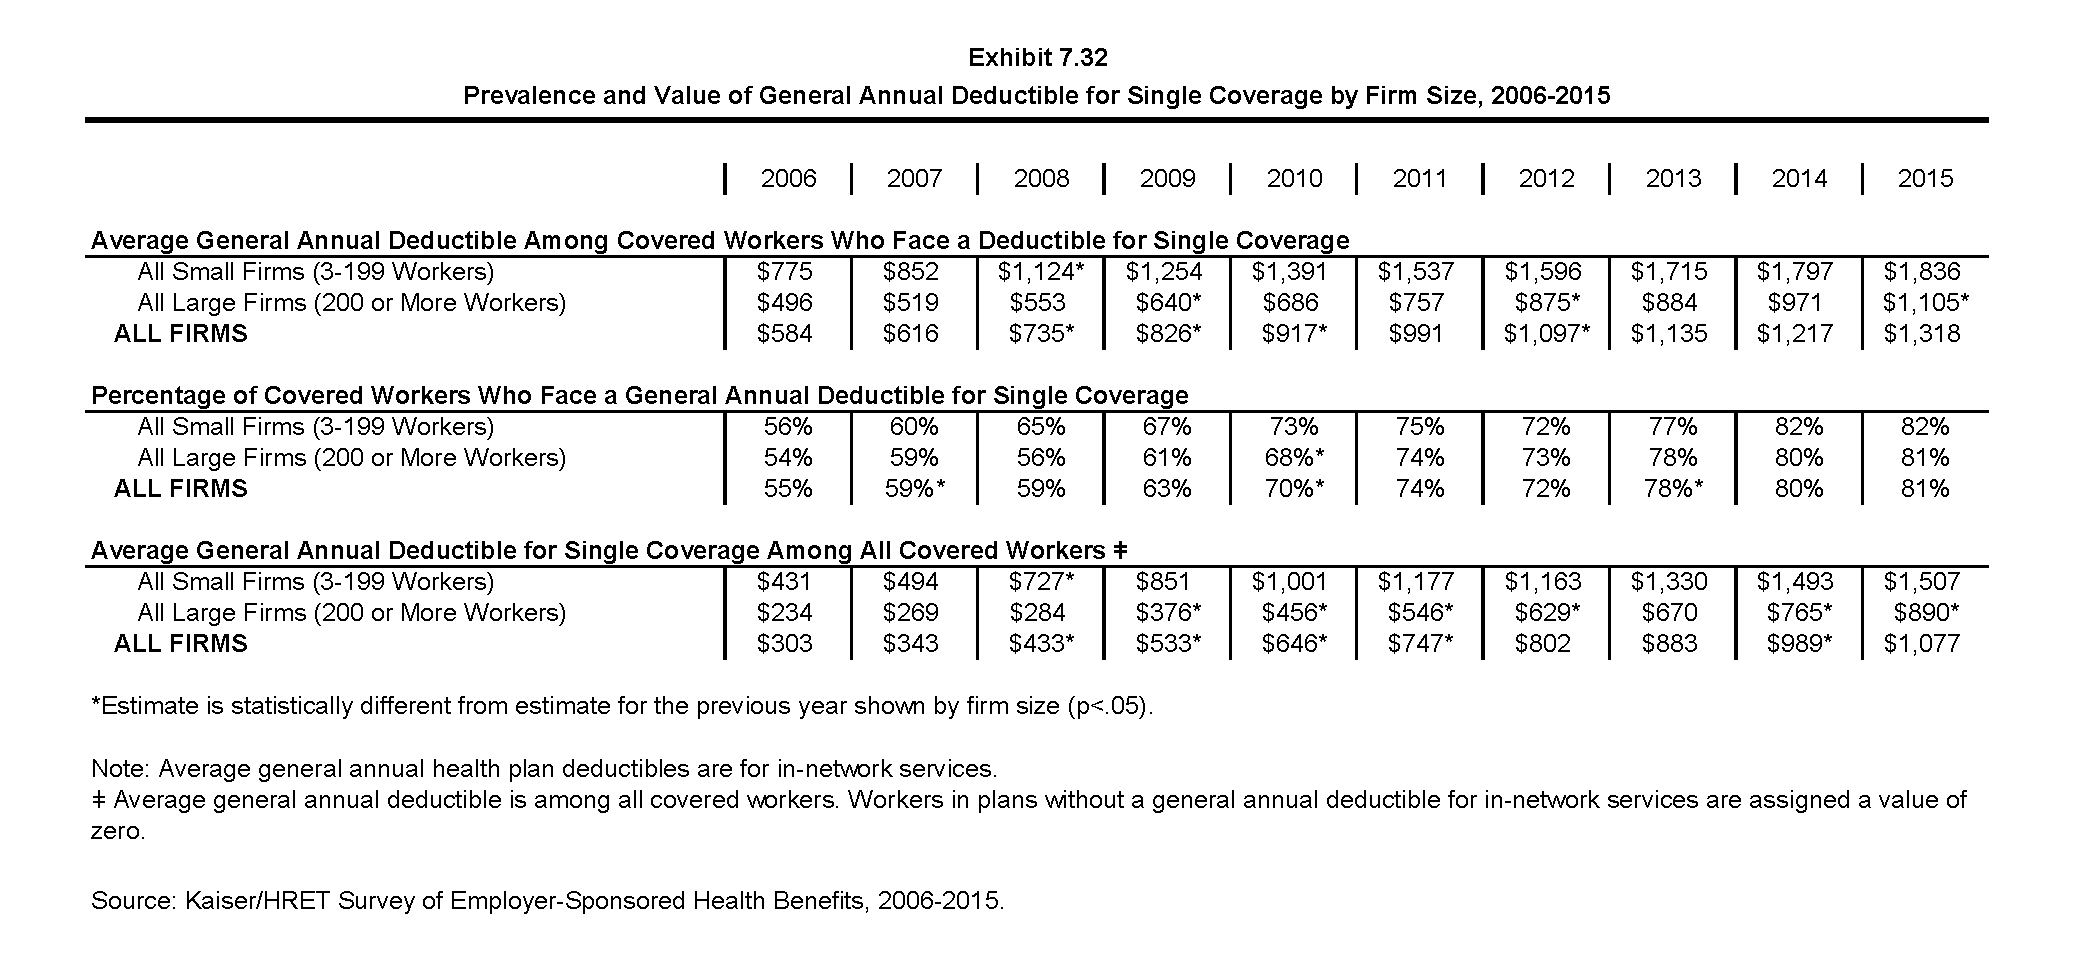
Prevalence and Value of General Annual Deductible for Single Coverage by Firm Size, 2006-2015
Section Eight: High-Deductible Health Plans with Savings Option
To help cover out-of-pocket expenses not covered by a health plan, some employers offer high deductible plans that are paired with an account that allows enrollees to use tax-preferred savings to pay plan cost sharing and other out-of-pocket medical expenses. The two most common are health reimbursement arrangements (HRAs) and health savings accounts (HSAs). HRAs and HSAs are financial accounts that workers or their family members can use to pay for health care services. These savings arrangements are often (or, in the case of HSAs, always) paired with health plans with high deductibles. The survey treats high-deductible plans paired with a savings option as a distinct plan type – High-Deductible Health Plan with Savings Option (HDHP/SO) – even if the plan would otherwise be considered a PPO, HMO, POS plan, or conventional health plan. Specifically for the survey, HDHP/SOs are defined as (1) health plans with a deductible of at least $1,000 for single coverage and $2,000 for family coverage1 offered with an HRA (referred to as HDHP/HRAs); or (2) high-deductible health plans that meet the federal legal requirements to permit an enrollee to establish and contribute to an HSA (referred to as HSA-qualified HDHPs).2
Percentage of Firms Offering HDHP/HRAs and HSA-Qualified HDHPs, and Enrollment
- Twenty-six percent of firms offering health benefits offer either or both an HDHP/HRA or an HSA-qualified HDHP. Among firms offering health benefits, 7% offer an HDHP/HRA and 20% offer an HSA-qualified HDHP (Exhibit 8.1). The percentage of firms offering an HDHP/SO is similar to last year but has increased over time.
- Firms with 1,000 or more workers are significantly more likely to offer an HDHP/SO than smaller firms. Fifty-two percent of firms with 1,000 or more workers offer an HDHP/SO, compared to 25% of firms with 3 to 199 workers, and 38% of firms with 200-999 workers (Exhibit 8.2). Not all covered workers enrolled at a firm that offers an HDHP/SO may be eligible to enroll in the plan; for example, the HDHP/SO plan may only be offered in one location (see Section 4 for more information)
Health Reimbursement Arrangements (HRAs) are medical care reimbursement plans established by employers that can be used by employees to pay for health care. HRAs are funded solely by employers. Employers may commit to make a specified amount of money available in the HRA for premiums and medical expenses incurred by employees or their dependents. HRAs are accounting devices, and employers are not required to expend funds until an employee incurs expenses that would be covered by the HRA. Unspent funds in the HRA usually can be carried over to the next year (sometimes with a limit). Employees cannot take their HRA balances with them if they leave their job, although an employer can choose to make the remaining balance available to former employees to pay for health care.
HRAs often are offered along with a high-deductible health plan (HDHP). In such cases, the employee pays for health care first from his or her HRA and then out-of-pocket until the health plan deductible is met. Sometimes certain preventive services or other services such as prescription drugs are paid for by the plan before the employee meets the deductible.
Health Savings Accounts (HSAs) are savings accounts created by individuals to pay for health care. An individual may establish an HSA if he or she is covered by a “qualified health plan” –a plan with a high deductible (i.e., a deductible of at least $1,300 for single coverage and $2,600 for family coverage in 2015) that also meets other requirements.1 Employers can encourage their employees to create HSAs by offering an HDHP that meets the federal requirements. Employers in some cases also may assist their employees by identifying HSA options, facilitating applications, or negotiating favorable fees from HSA vendors.
Both employers and employees can contribute to an HSA, up to the statutory cap of $3,350 for single coverage and $6,650 for family coverage in 2015. Employee contributions to the HSA are made on a pre-income tax basis, and some employers arrange for their employees to fund their HSAs through payroll deductions. Employers are not required to contribute to HSAs established by their employees but if they elect to do so, their contributions are not taxable to the employee. Interest and other earnings on amounts in an HSA are not taxable. Withdrawals from the HSA by the account owner to pay for qualified health care expenses are not taxed. The savings account is owned by the individual who creates the account, so employees retain their HSA balances if they leave their job.
1 See U.S. Department of the Treasury, Health Savings Accounts, available at http://www.irs.gov/pub/irs-drop/rp-14-30.pdf
- In addition to looking at the percentage of firms that offer an HDHP/SO, the survey can analyze the percentage of workers who are enrolled in this plan type. Enrollment in HDHP/so plans has increased over time from 13% of covered workers in 2010 to 24% in 2015.
- Nine percent of covered workers are enrolled in HDHP/HRAs in 2015, and 15% percent of covered workers are enrolled in HSA-qualified HDHPs. Enrollment in both HSA-qualified HDHPs and HDHP/HRAs is similar to last year (Exhibit 8.5).
- A similar percentage of coverage workers at small firms (3-199 workers) and large firms are enrolled in HDHP/SOs (Exhibit 8.5).
Plan Deductibles
- As expected, workers enrolled in HDHP/SOs have higher deductibles than workers enrolled in HMOs, PPOs, or POS plans.
- The average general annual deductible for single coverage is $1,954 for HDHP/HRAs and $2,196 for HSA-qualified HDHPs (Exhibit 8.7). These averages are similar to the amounts reported in recent years. There is wide variation around these averages, however. Twenty percent of covered workers are enrolled in an HDHP/SO with a deductible of $3,000 or more (Exhibit 8.9).
- The survey asks employers whether the family deductible amount is (1) an aggregate amount (i.e., the out-of-pocket expenses of all family members are counted until the deductible is satisfied), or (2) a per-person amount that applies to each family member (typically with a limit on the number of family members that would be required to meet the deductible amount) (for more information see Section 7).
- The average aggregate deductibles for workers with family coverage are $4,345 for HDHP/HRAs and $4,347 for HSA-qualified HDHPs (Exhibit 8.7). As with single coverage, there is wide variation around these averages for family coverage. Nineteen percent of covered workers enrolled in HDHP/SO plans have an aggregate family deductible of $6,000 dollars or more (Exhibit 8.11).
Out-of-Pocket Maximum Amounts
- HSA-qualified HDHPs are legally required to have a maximum annual out-of-pocket liability of no more than $6,450 for single coverage and $12,900 for family coverage in 2015. Non-grandfathered HDHP/HRA plans starting in 2015 are required to have out-of-pocket maximums of no more than $6,600 for single coverage and $13,200 for family coverage. Ninety-nine percent of HDHP/HRA plans have an out of pocket maximum for single coverage.
- The average annual out-of-pocket maximum for single coverage is $3,866 for HDHP/HRAs3 and $4,085 for HSA-qualified HDHPs (Exhibit 8.7).
Premiums
- In 2015, the average annual premiums for HDHP/HRAs are $6,045 for single coverage and $17,101 for family coverage. The average single and family premiums for covered workers enrolled in HDHP/HRAs are similar to the average premiums for covered workers enrolled in non-HDHP/SO plans (Exhibit 8.8).
- The average annual premium for workers in HSA-qualified HDHPs is $5,312 for single coverage and $15,379 for family coverage. These amounts are significantly lower than the average single and family premium for workers in plans that are not HDHP/SOs (Exhibit 8.8).
- The average single and family coverage premiums for an HSA-qualified HDHPs are less than the premiums for covered workers enrolled in HDHP/HRAs (Exhibit 8.8).
Worker Contributions to Premiums
- The average annual worker contributions to premiums for workers enrolled in HDHP/HRAs are $1,021 for single coverage and $4,407 for family coverage (Exhibit 8.8).
- The average annual worker contributions to premiums for workers in HSA-qualified HDHPs are $773 for single coverage and $3,660 for family coverage. The average contribution for single coverage for workers in HSA-qualified HDHPs is significantly less than the average premium contribution made by covered workers in plans that are not HDHP/SOs (Exhibit 8.8).
Employer Contributions to Premiums and Savings Options
- Employers contribute to HDHP/SOs in two ways: through their contributions toward the premium for the health plan and through their contributions (if any, in the case of HSAs) to the savings account option (i.e., the HRAs or HSAs themselves).
- Looking at only the annual employer contributions to premiums, covered workers in HDHP/HRAs on average receive employer contributions of $5,024 for single coverage and $12,695 for family coverage (Exhibit 8.8).
- The average annual employer contributions to premiums for workers in HSA-qualified HDHPs are $4,539 for single coverage and $11,719 for family coverage. These amounts are lower than the average contributions for single or family coverage for workers in plans that are not HDHP/SOs (Exhibit 8.8).
- When looking at employer contributions to the savings option, workers enrolled in HDHP/HRAs on average receive an annual employer contribution to their HRA of $1,079 for single coverage and $2,001 for family coverage (Exhibit 8.8).
- HRAs are generally structured in such a way that employers may not actually spend the whole amount that they make available to their employees’ HRAs.4 Amounts committed to an employee’s HRA that are not used by the employee generally roll over and can be used in future years, but any balance may revert back to the employer if the employee leaves his or her job. Thus, the employer contribution amounts to HRAs that we capture in the survey may exceed the amount that employers will actually spend.
- Workers enrolled in HSA-qualified HDHPs on average receive an annual employer contribution to their HSA of $568 for single coverage and $991 for family coverage (Exhibit 8.8).
- In many cases, employers that sponsor HSA-qualified HDHP/SOs do not make contributions to HSAs established by their employees. Forty-five percent of employers offering single coverage and 44% offering family coverage through HSA-qualified HDHPs do not make contributions towards the HSAs that their workers establish. Thirty percent of workers with single coverage and thirty percent of workers with family coverage in an HSA-qualified HDHP do not receive an account contribution from their employer (see notes in (Exhibit 8.14) and (Exhibit 8.15)). Many employers are beginning to incorporate more complex structures to fund savings accounts, including providing a higher contribution if workers complete wellness or other health promotion activities.
- The percentage of covered workers enrolled in a plan where the employer makes no HSA contribution for single coverage (30%) is similar to the 24% last year and the percentage from five years ago.
- The average HSA contributions reported above include the portion of covered workers whose employer contribution to the HSA is zero. When those firms that do not contribute to the HSA are excluded from the calculation, the average employer contribution for covered workers is $809 for single coverage and $1,412 for family coverage (Exhibit 8.8).
- Employer contributions to savings account options (i.e., the HRAs and HSAs themselves) for their employees can be added to their health plan premium contributions to calculate total employer contributions toward HDHP/SOs.
- For HDHP/HRAs, the average annual total employer contribution for covered workers is $6,104 for single coverage and $14,696 for family coverage. The average total employer contribution amounts for single and family coverage in HDHP/HRAs are higher than the average amount that employers contribute towards single and family coverage in health plans that are not HDHP/SOs (Exhibit 8.8).
- For HSA-qualified HDHPs, the average annual total employer contribution for covered workers is $5,127 for single coverage and $12,824 for workers with family coverage. The total amounts contributed for workers in HSA-qualified HDHPs for single and family coverage are similar to the amounts contributed for workers not in HDHP/SOs (Exhibit 8.8).
Variation in Employer Contributions to Savings Options
- There is considerable variation in the amount that employers contribute to savings accounts.
- Thirty-three percent of covered workers are enrolled in a plan with an HRA annual contribution of less than $648 (less than 60% of the average) and 20% are enrolled in a plan with a contribution of $1,511 or more (at least 140% of the average) (Exhibit 8.16).
- Thirty-nine percent of covered workers are enrolled in a plan with an HSA annual contribution of less than $341 (less than 60% of the average) and 27% are enrolled in a plan with a contribution of $796 or more (at least 140% of the average) for single coverage (Exhibit 8.17).
Cost Sharing for Office Visits, Outpatient Surgery and Hospital Surgery
- The cost-sharing pattern for primary care office visits differs for workers enrolled in HDHP/SOs. Thirty-four percent of covered workers enrolled in HDHP/HRAs have a copayment for primary care physician office visits compared to 7% enrolled in an HSA-qualified HDHP (Exhibit 8.18). Workers in other plan types are much more likely to face copayments than coinsurance for physician office visits (see Section 7).
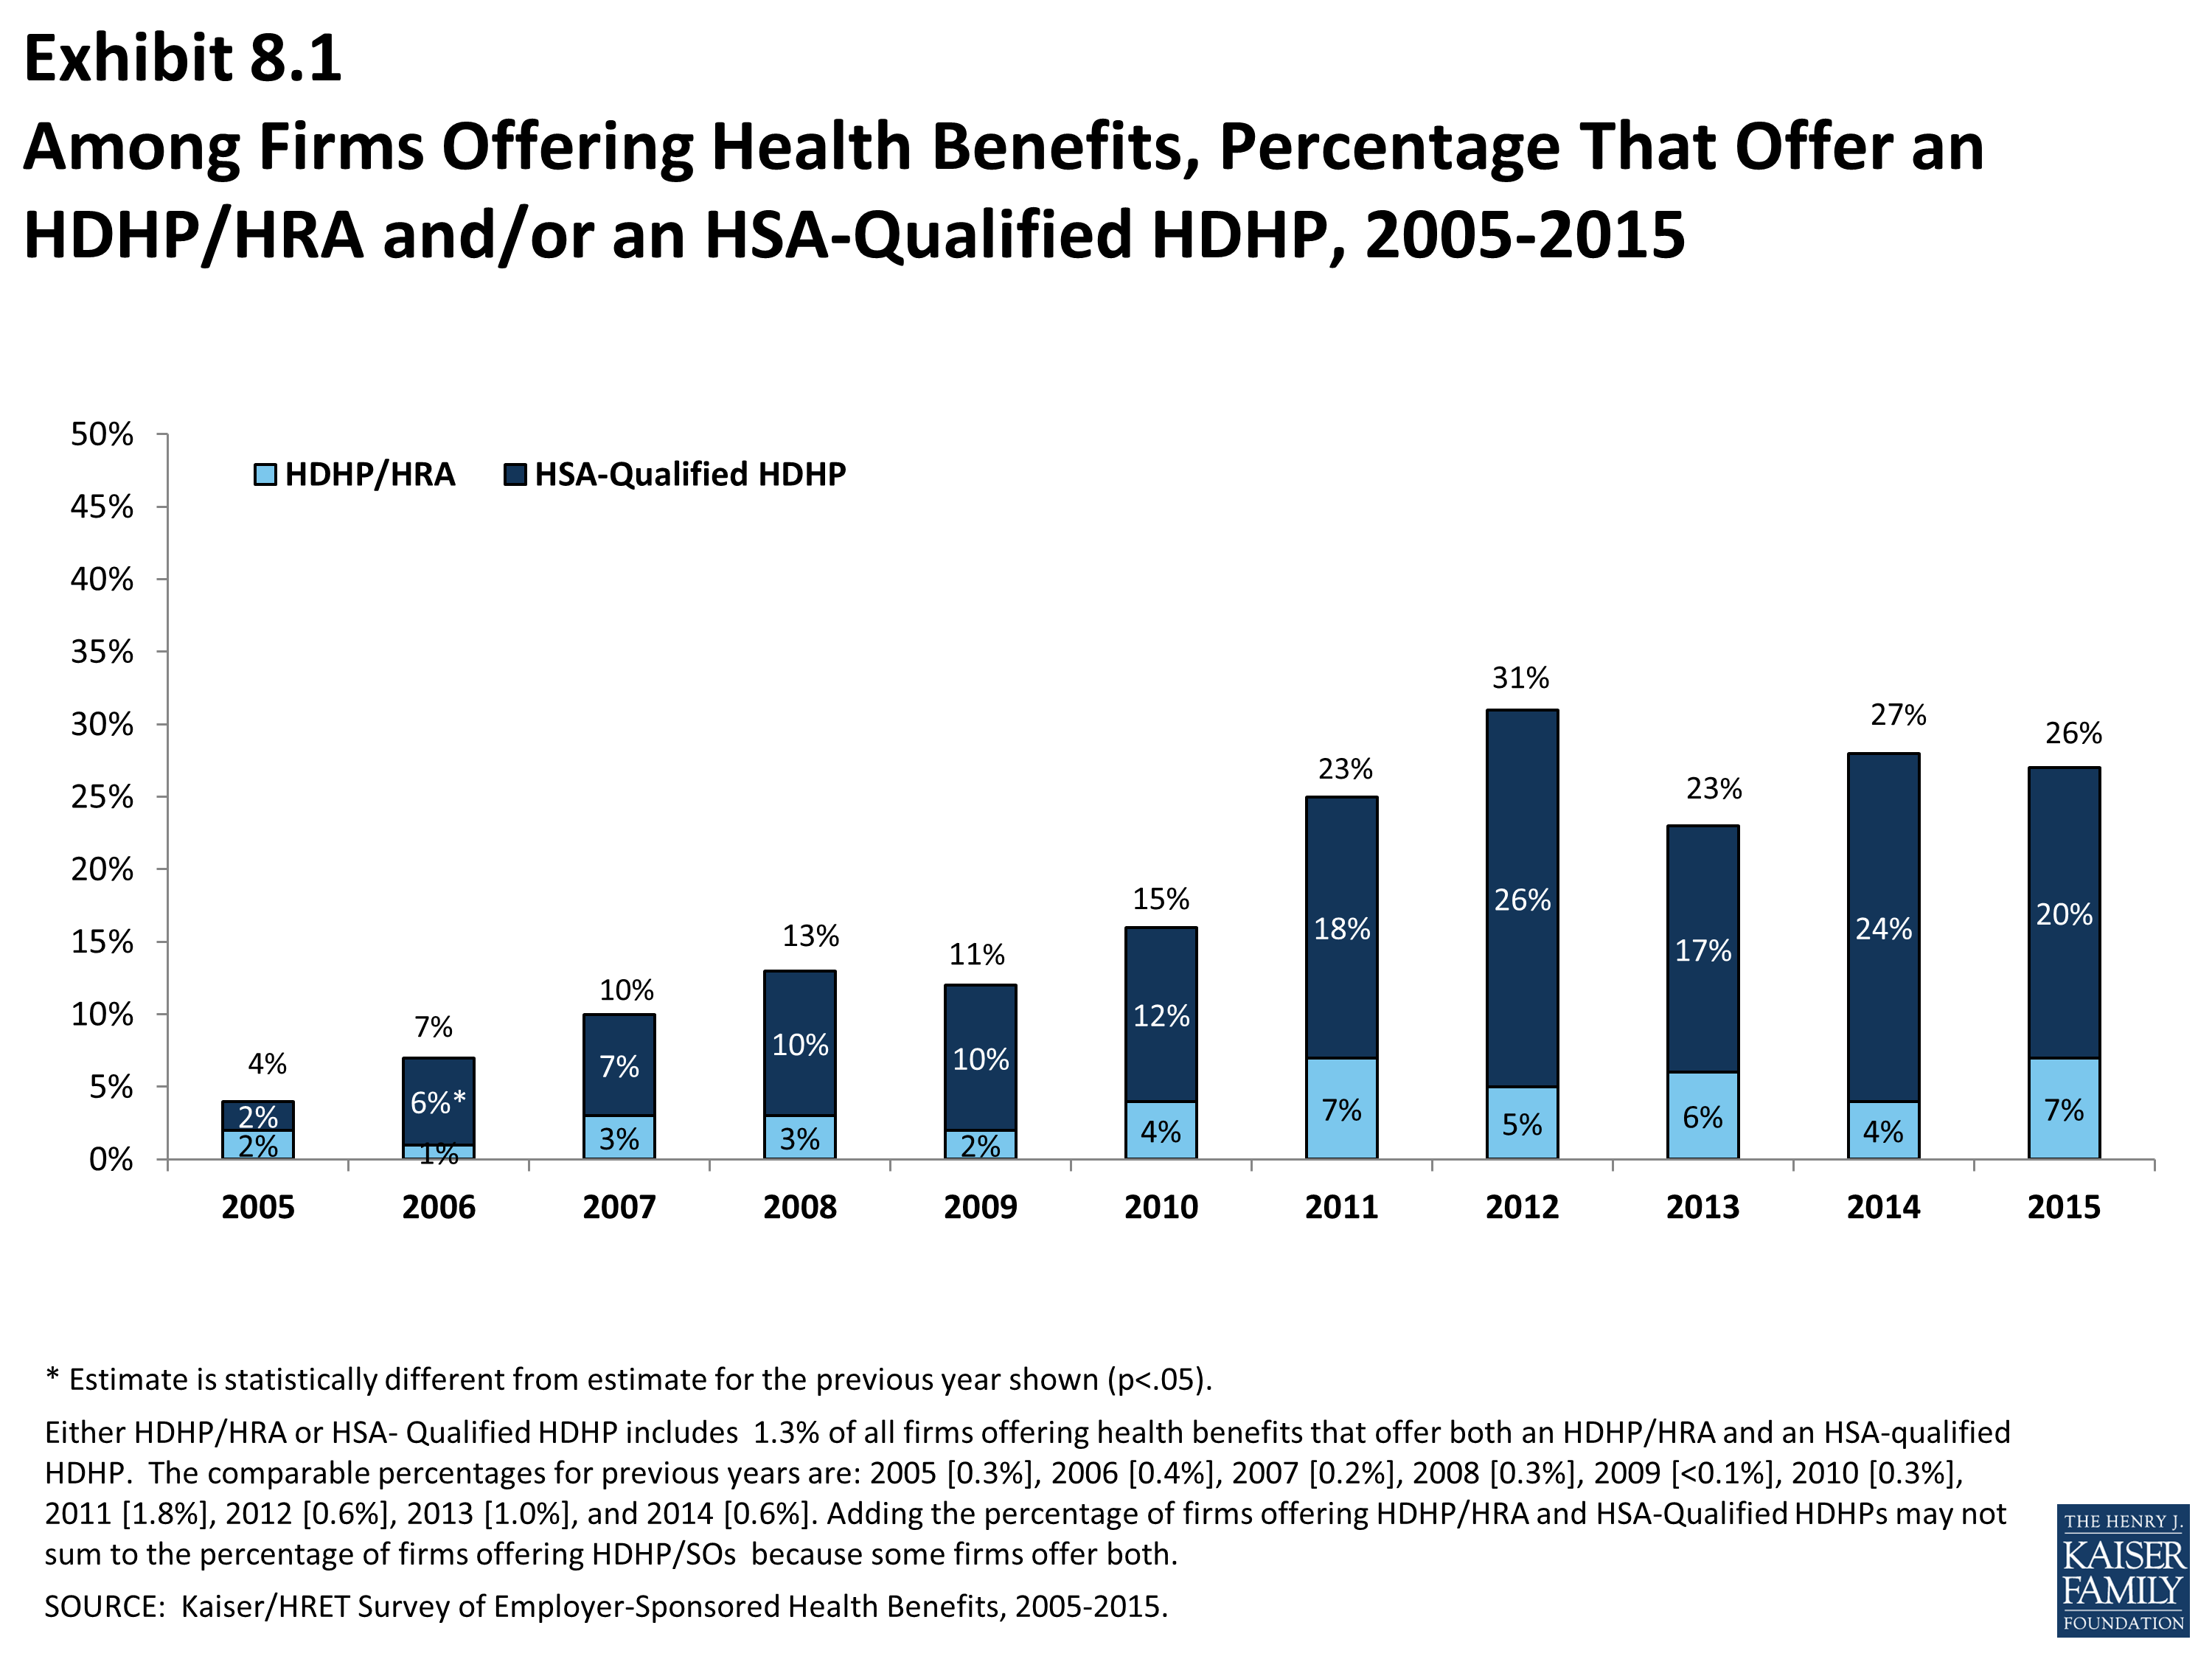
Among Firms Offering Health Benefits, Percentage That Offer an HDHP/HRA and/or an HSA-Qualified HDHP, 2005-2015
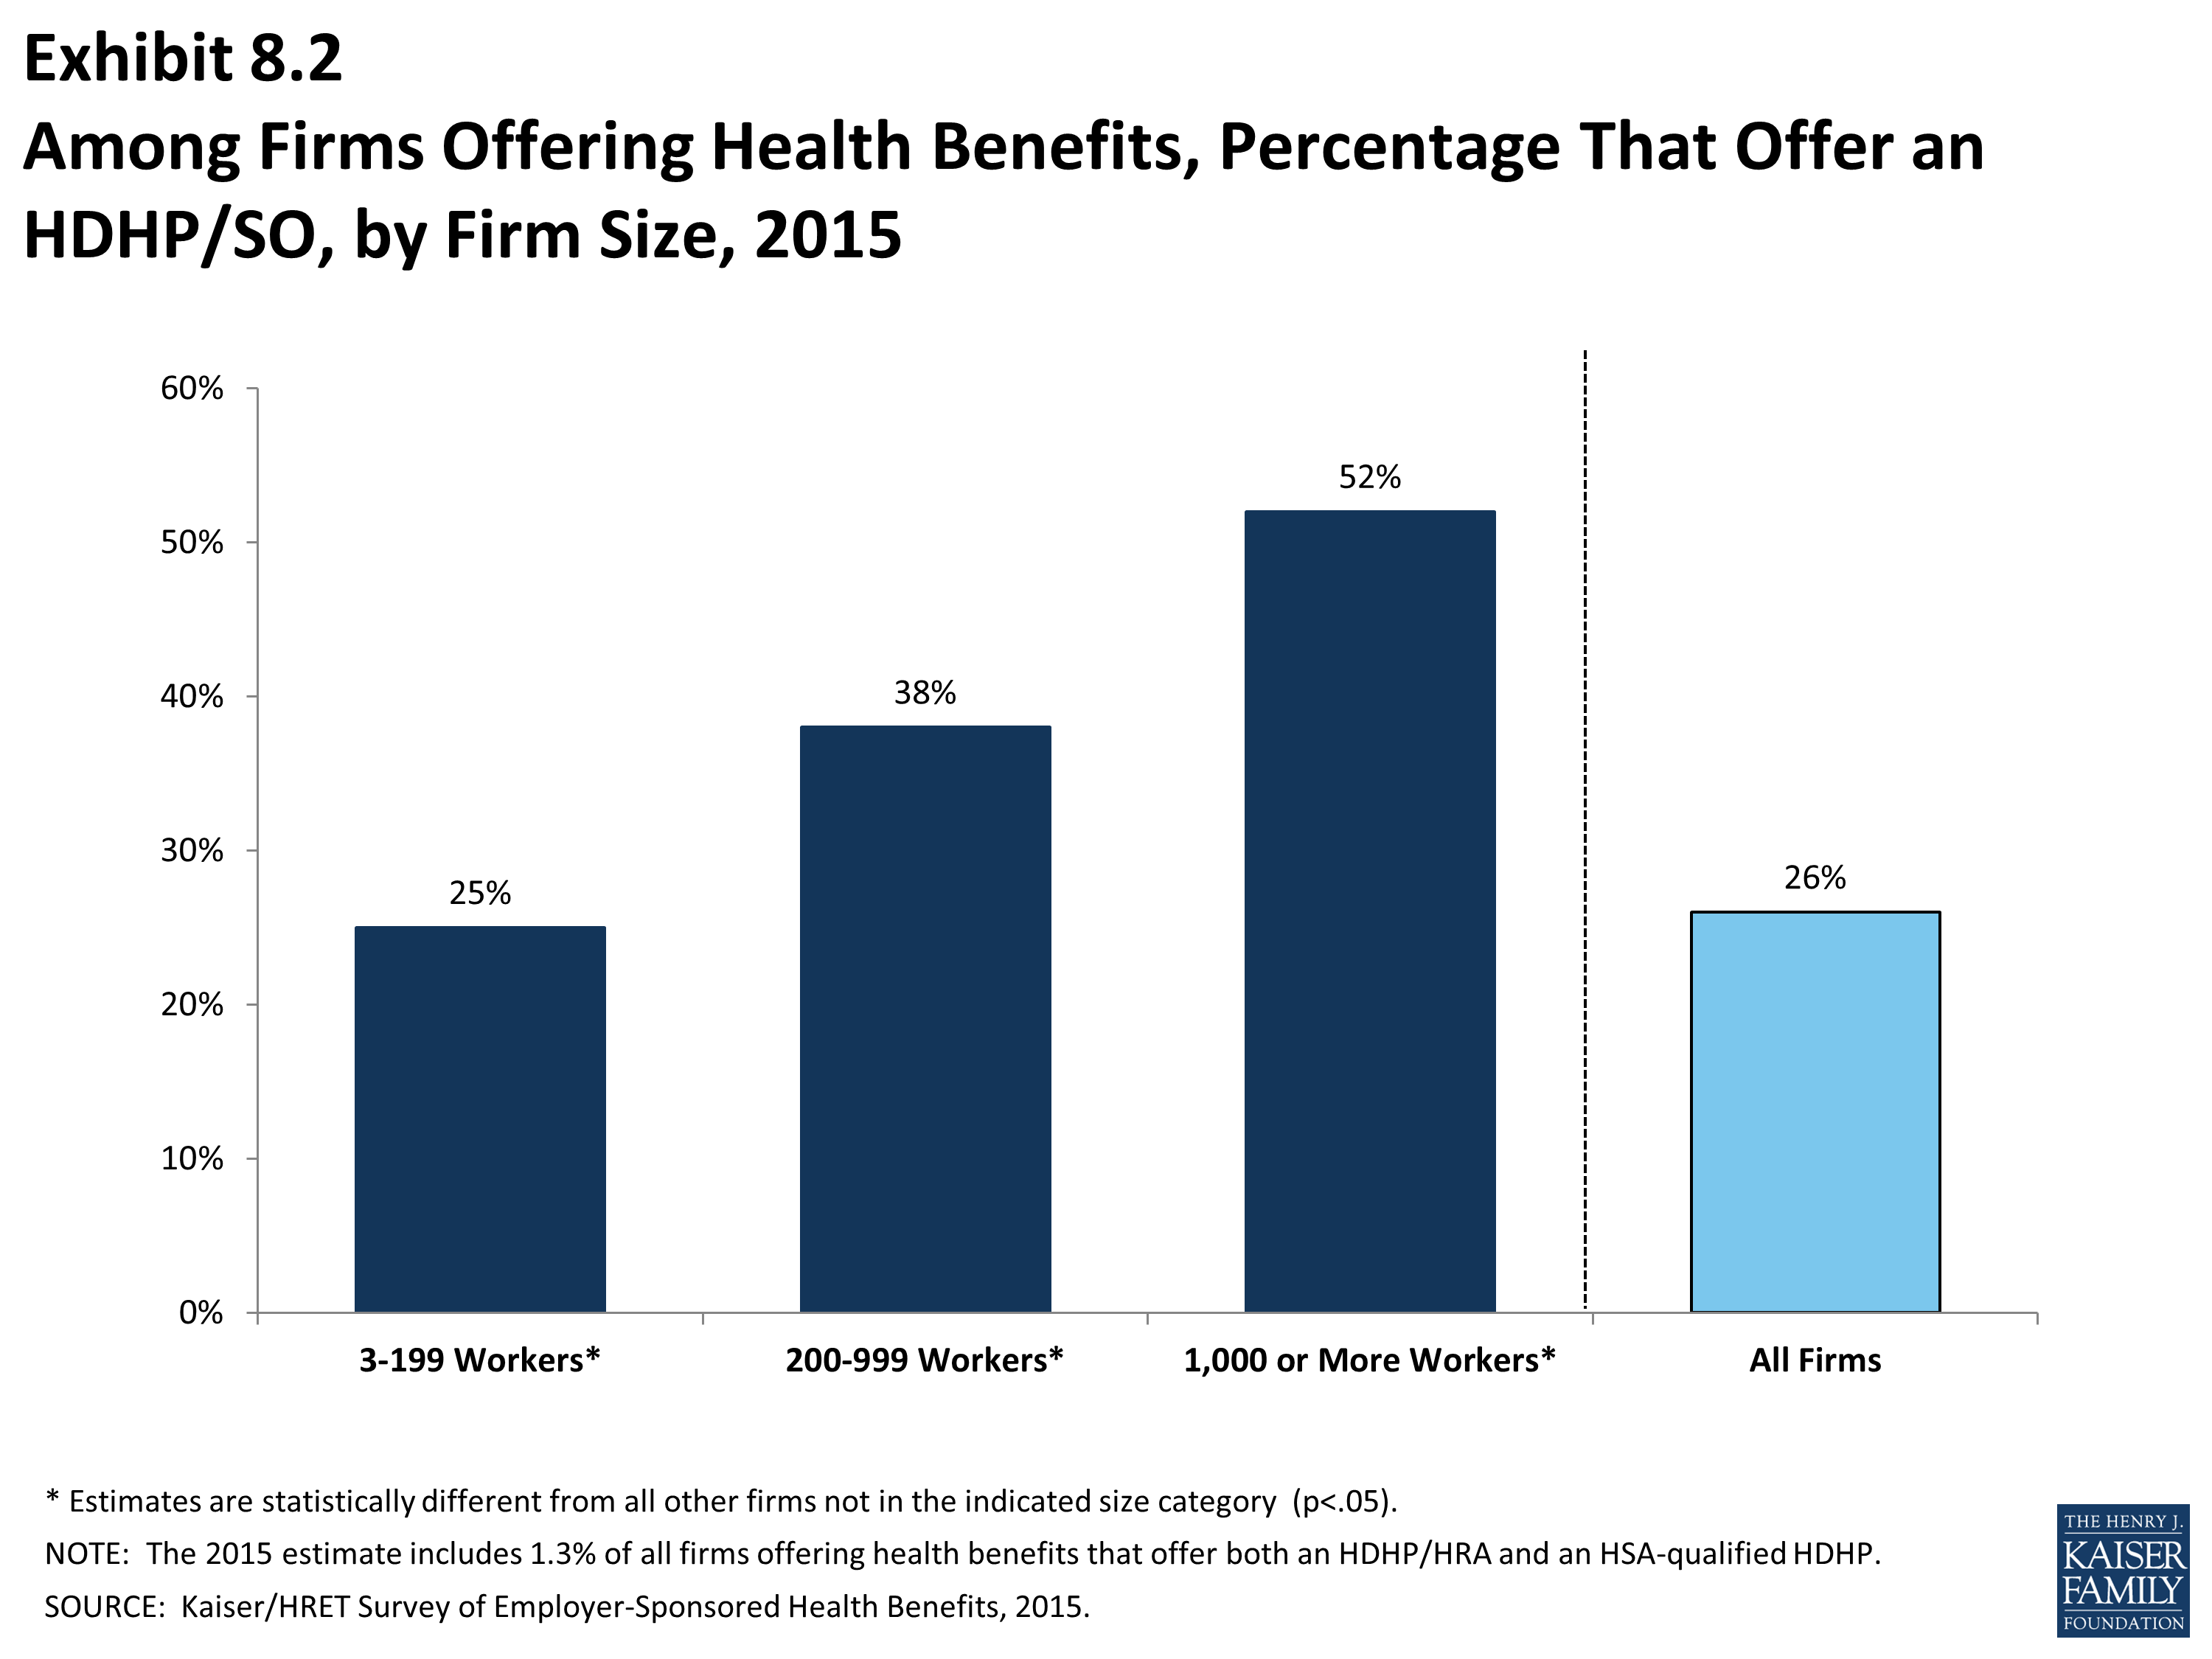
Among Firms Offering Health Benefits, Percentage That Offer an HDHP/SO, by Firm Size, 2015
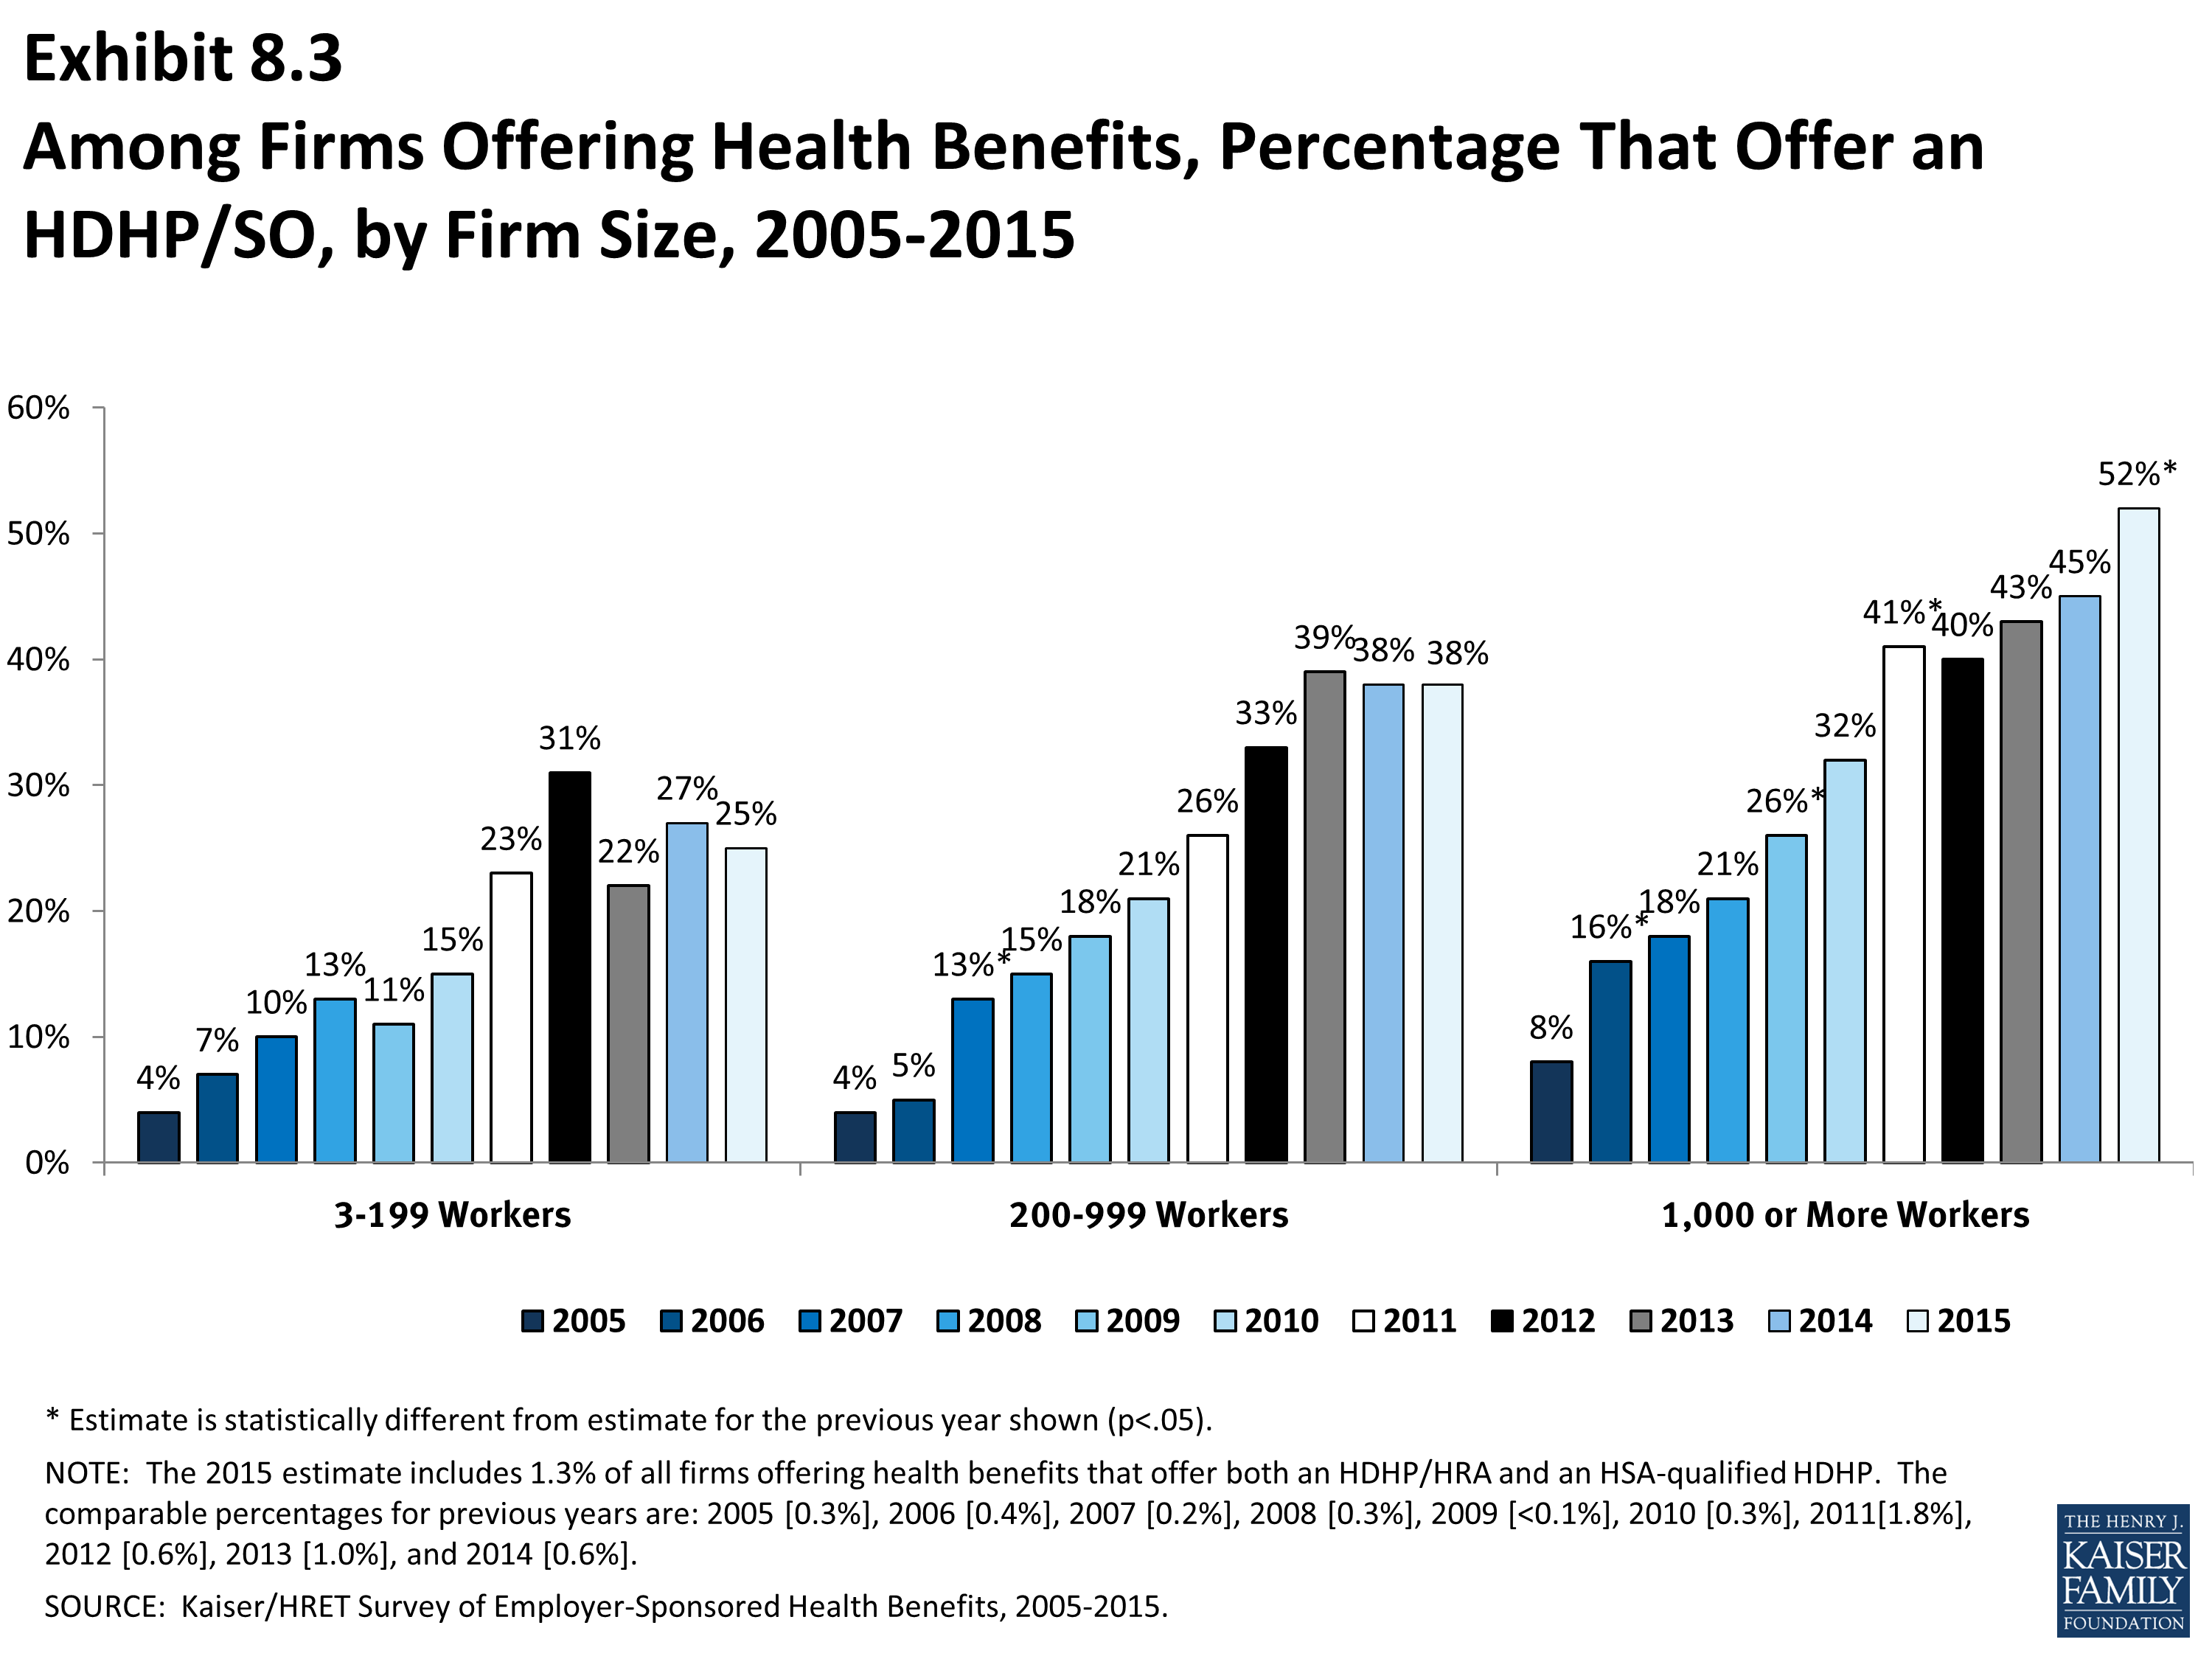
Among Firms Offering Health Benefits, Percentage That Offer an HDHP/SO, by Firm Size, 2005-2015
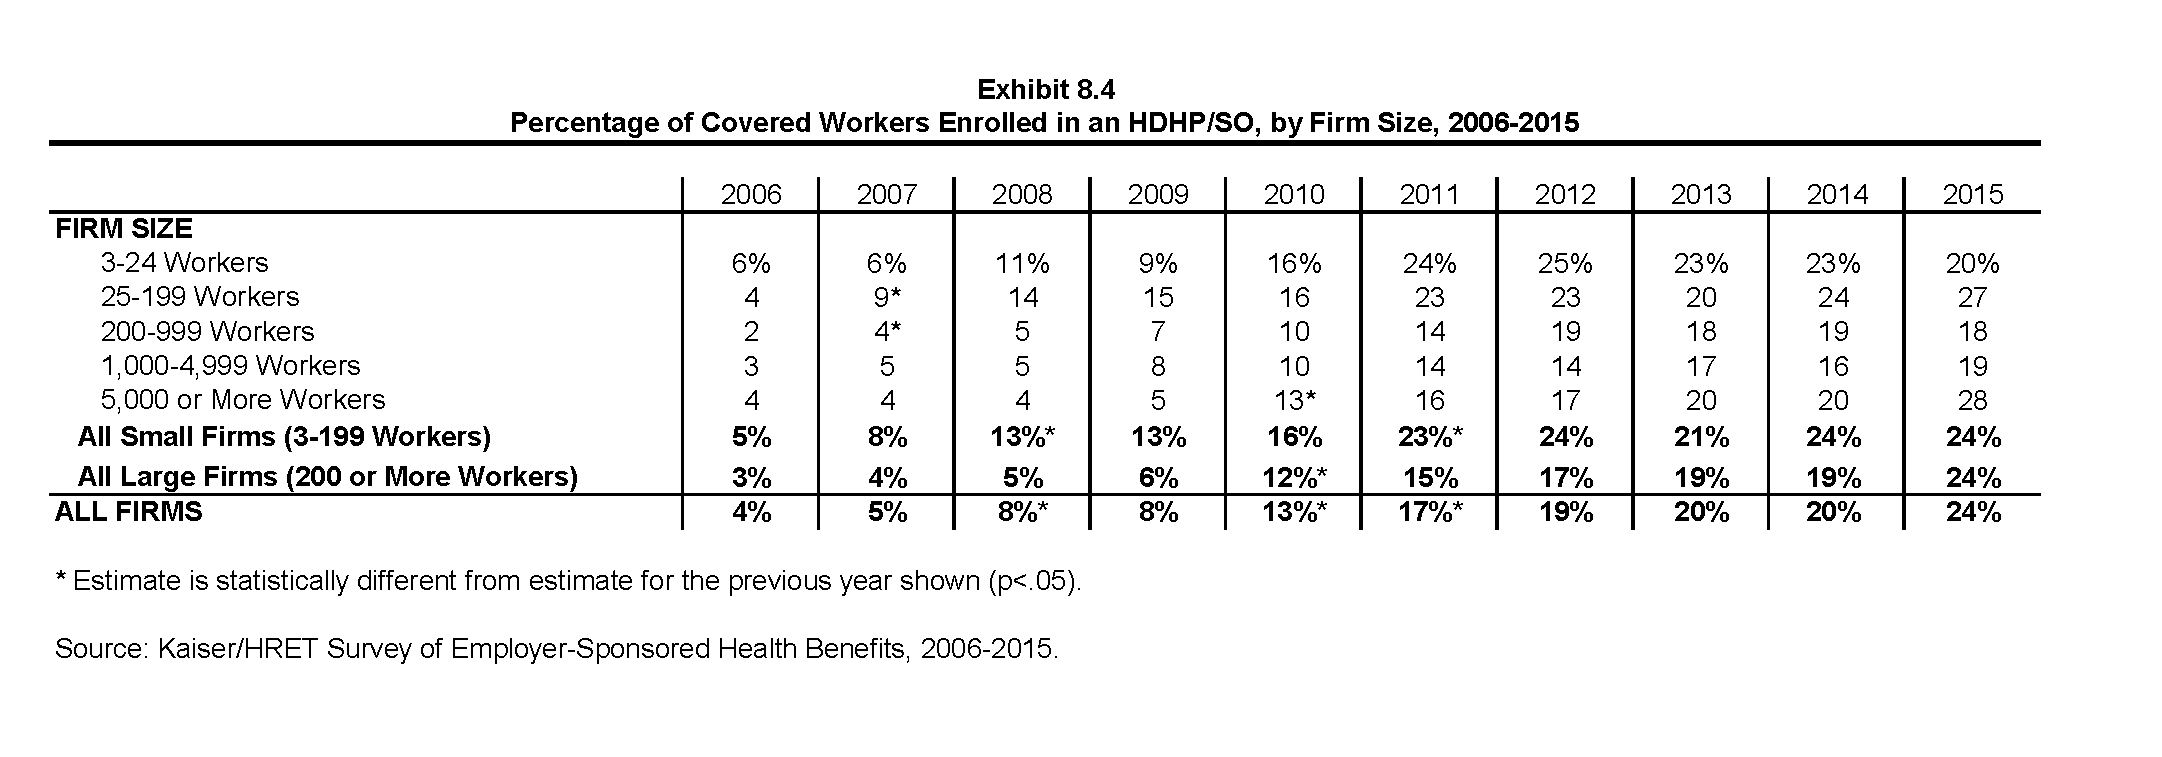
Percentage of Covered Workers Enrolled in an HDHP/SO, by Firm Size, 2006-2015
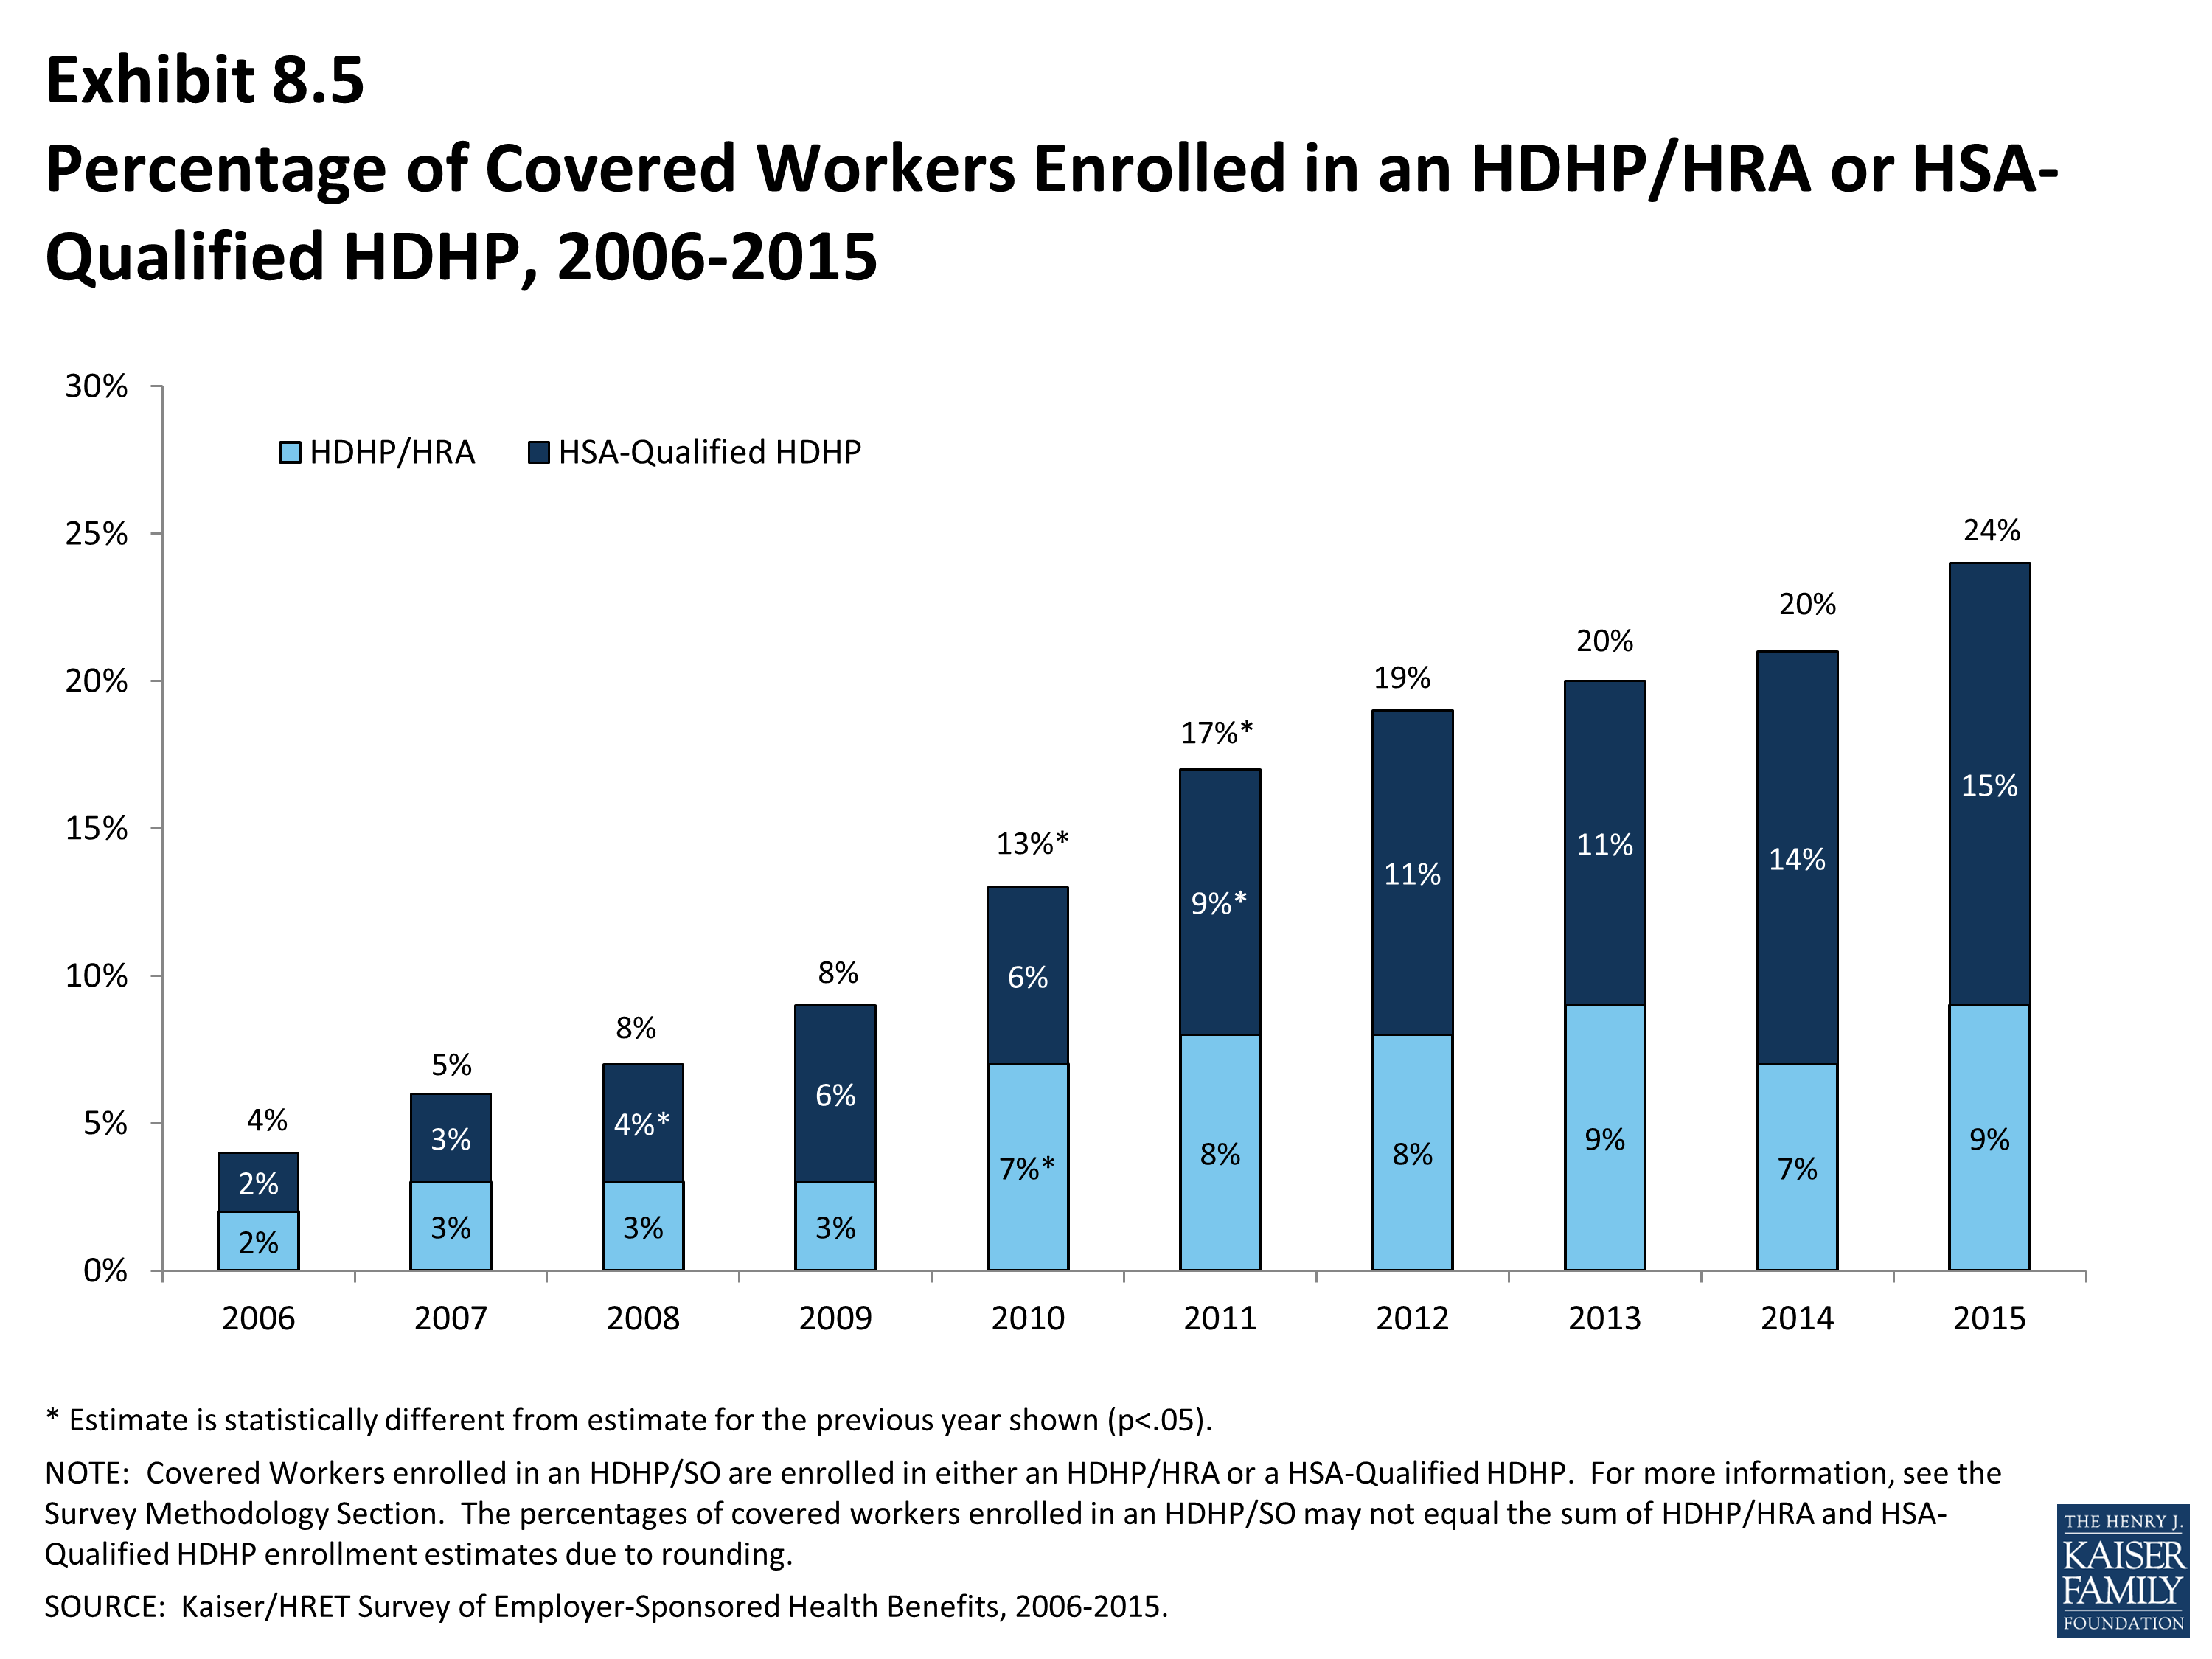
Percentage of Covered Workers Enrolled in an HDHP/HRA or HSA-Qualified HDHP, 2006-2015
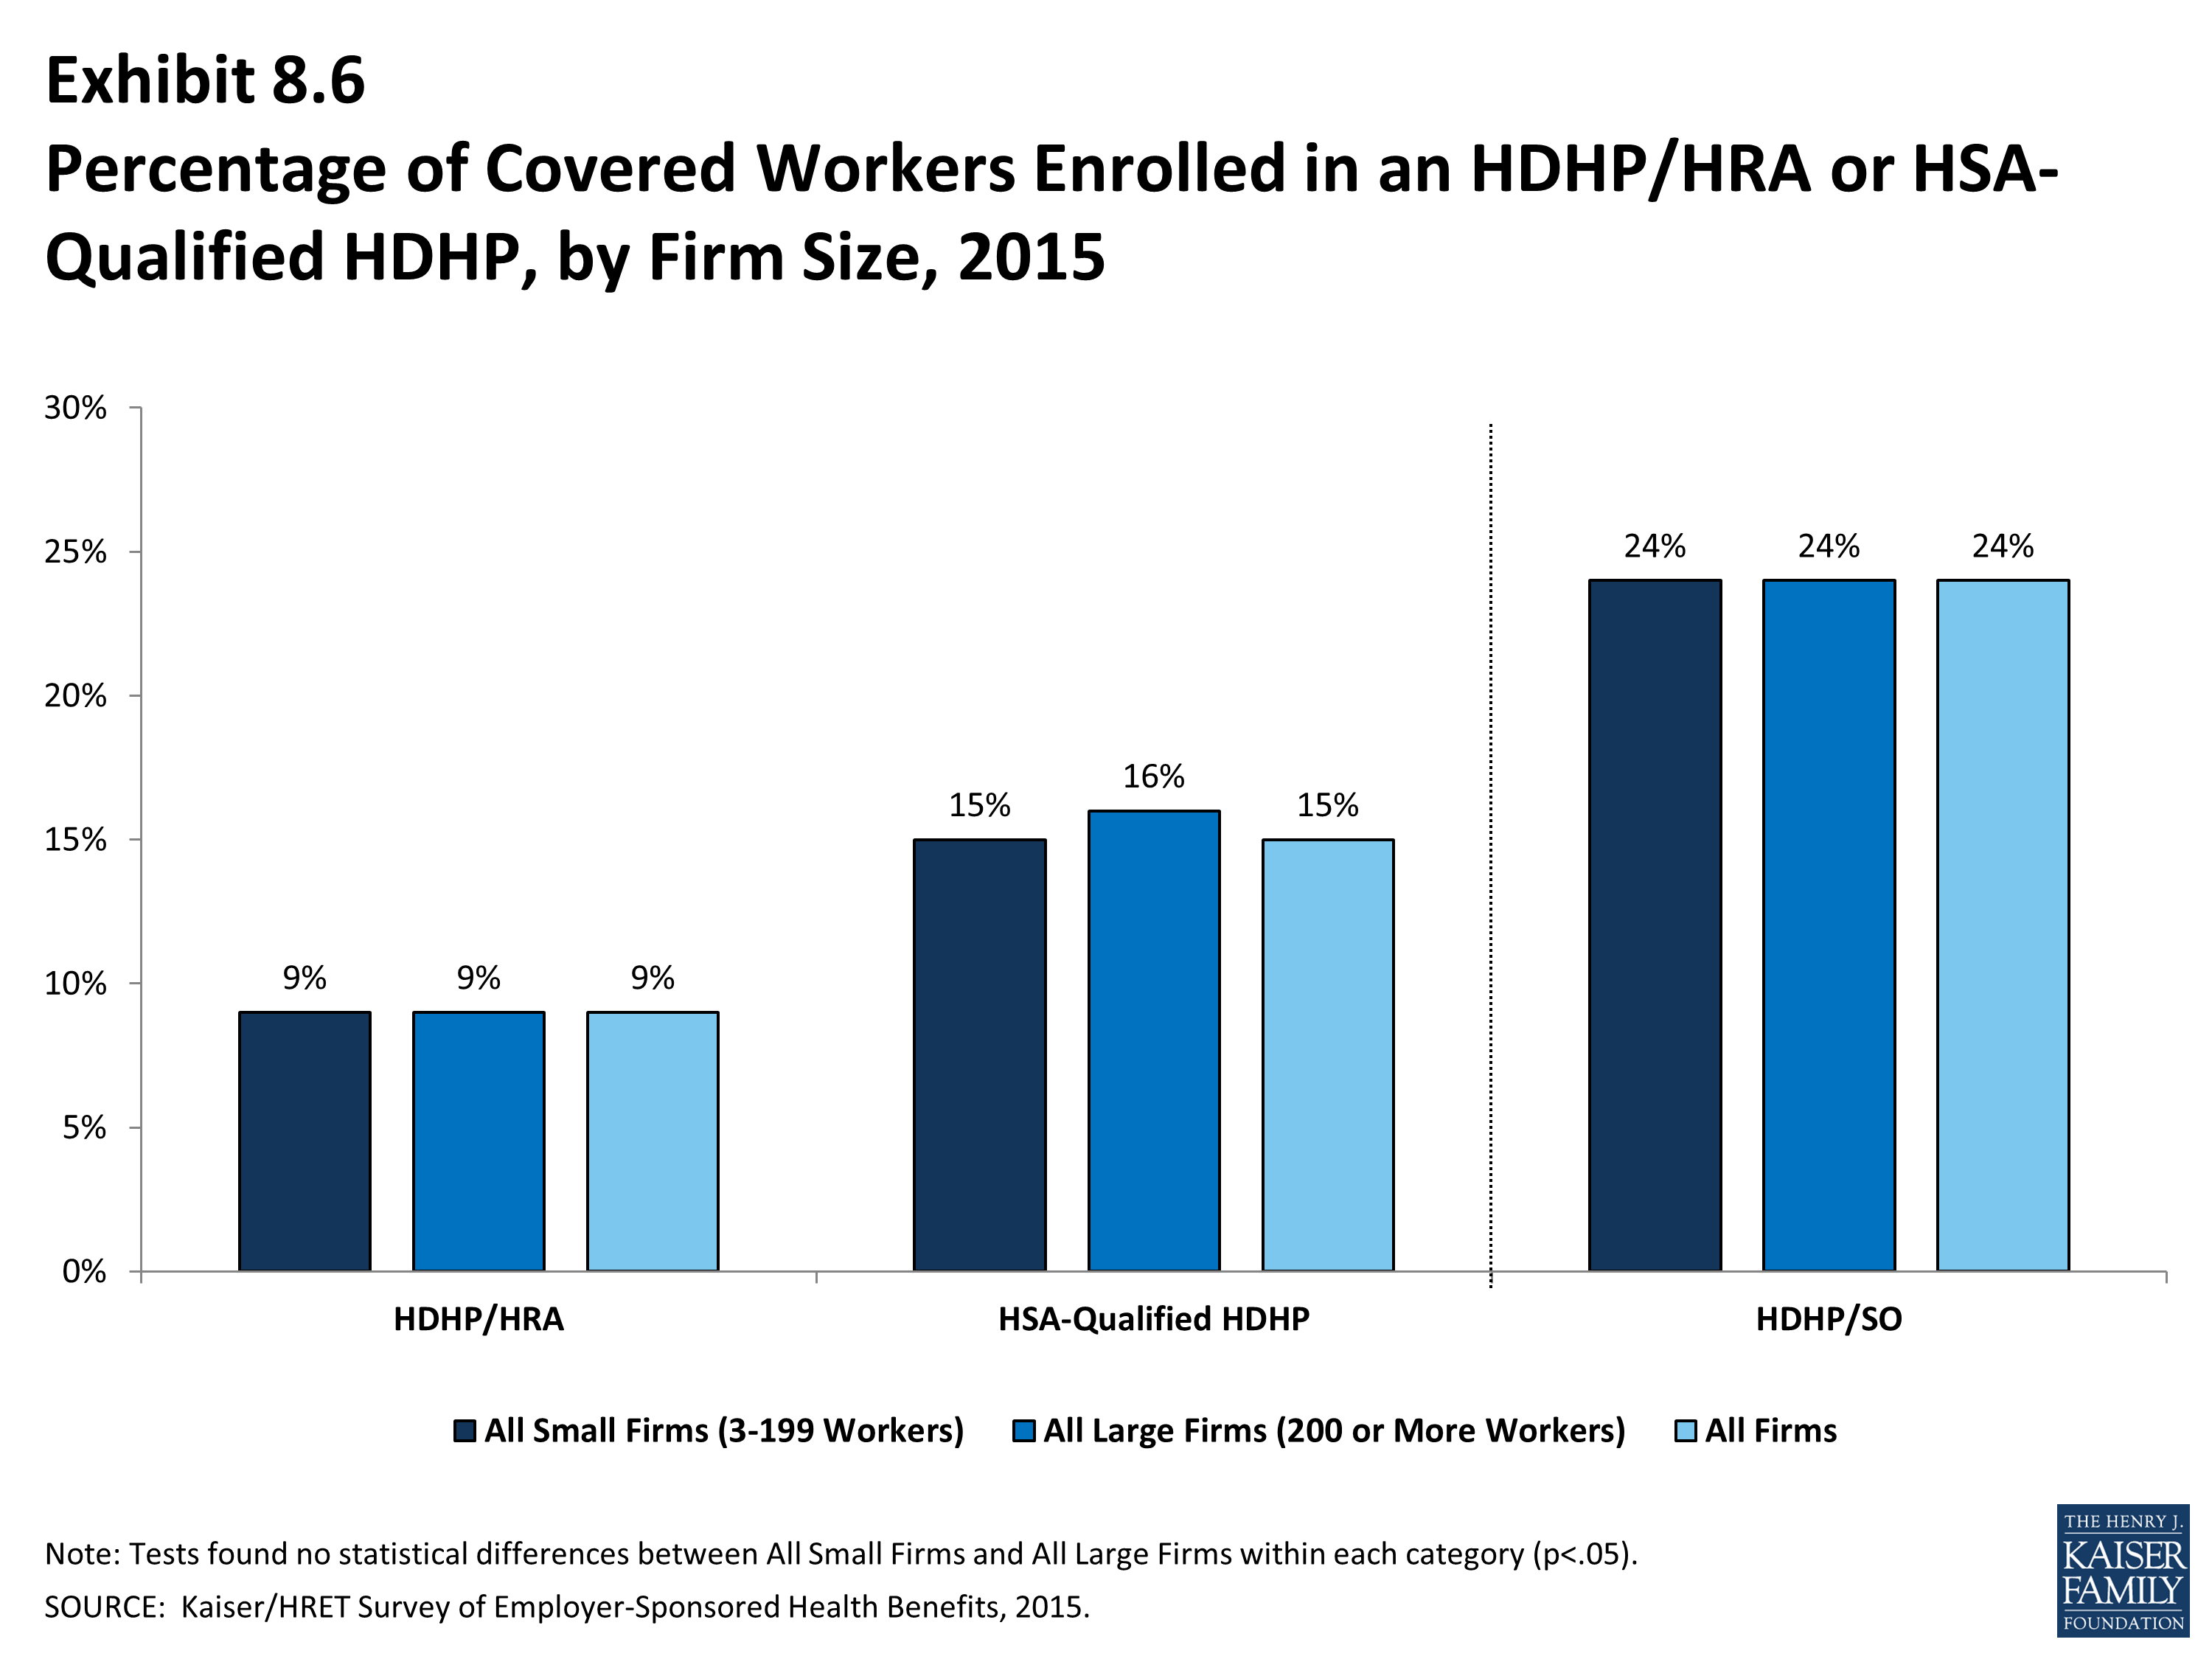
Percentage of Covered Workers Enrolled in an HDHP/HRA or HSA-Qualified HDHP, by Firm Size, 2015
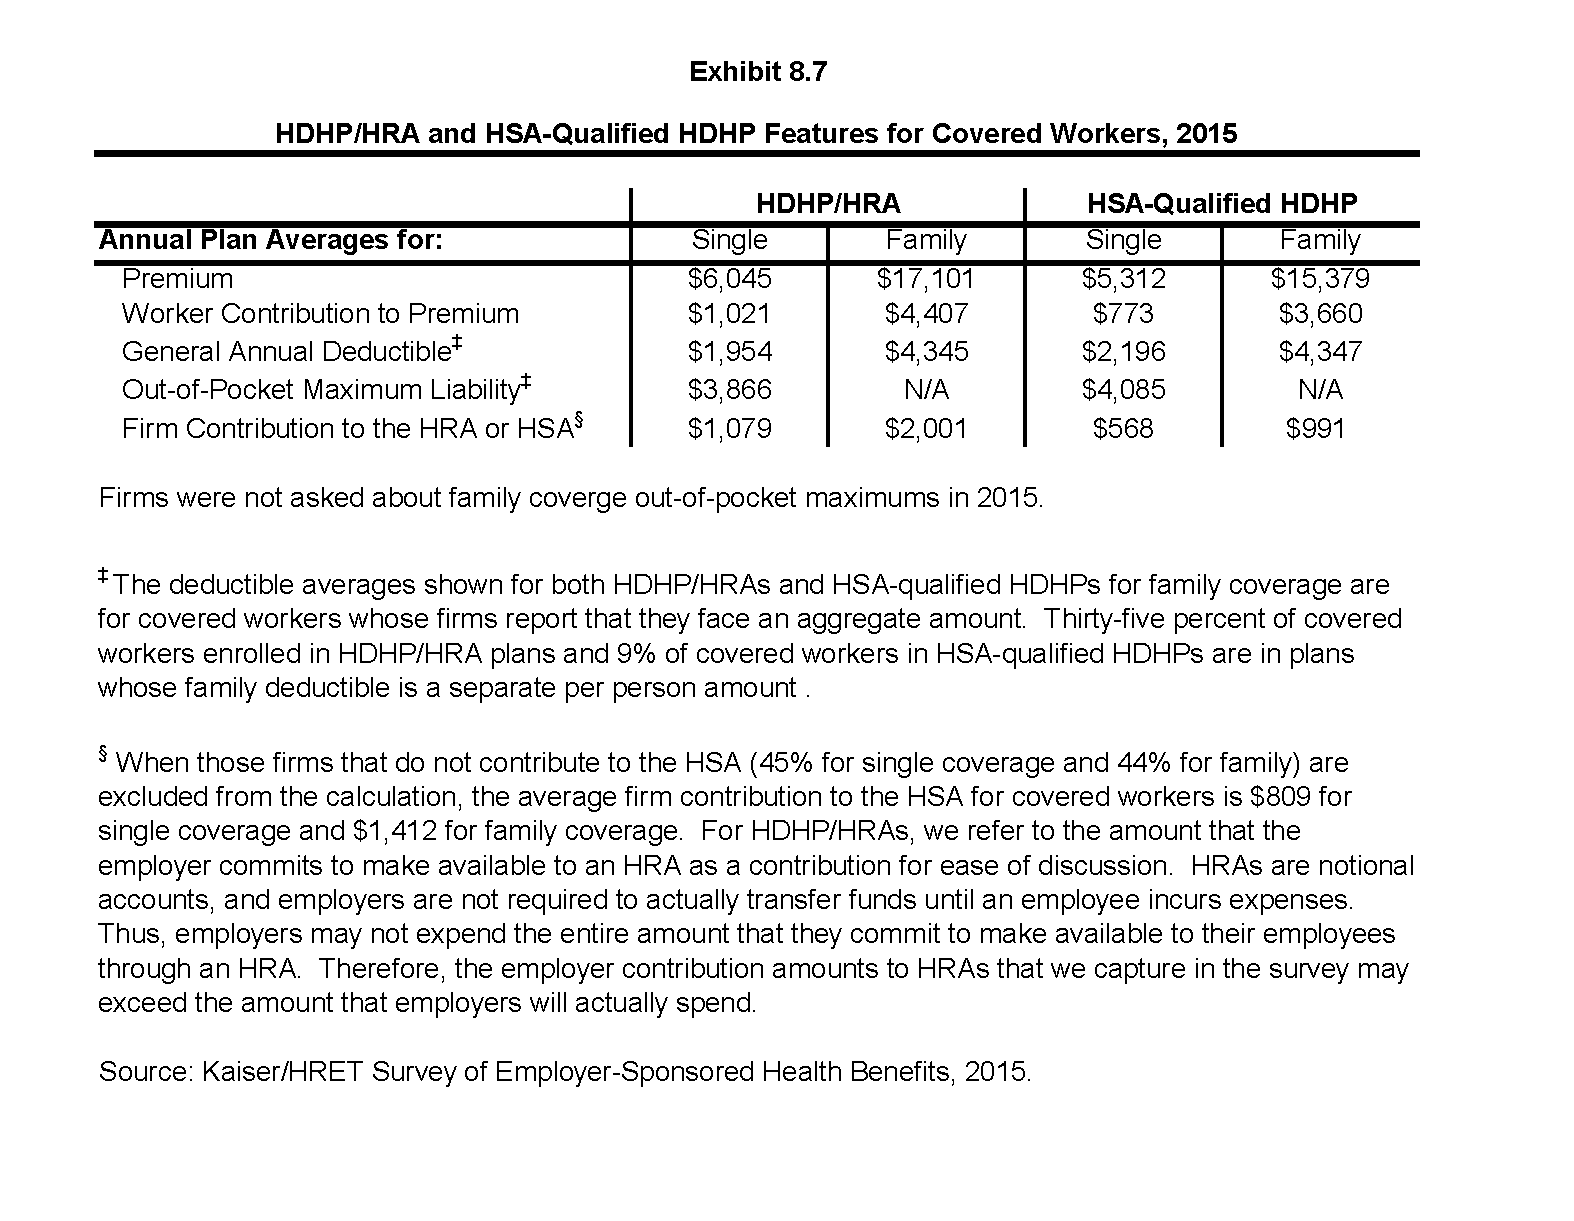
HDHP/HRA and HSA-Qualified HDHP Features for Covered Workers, 2015
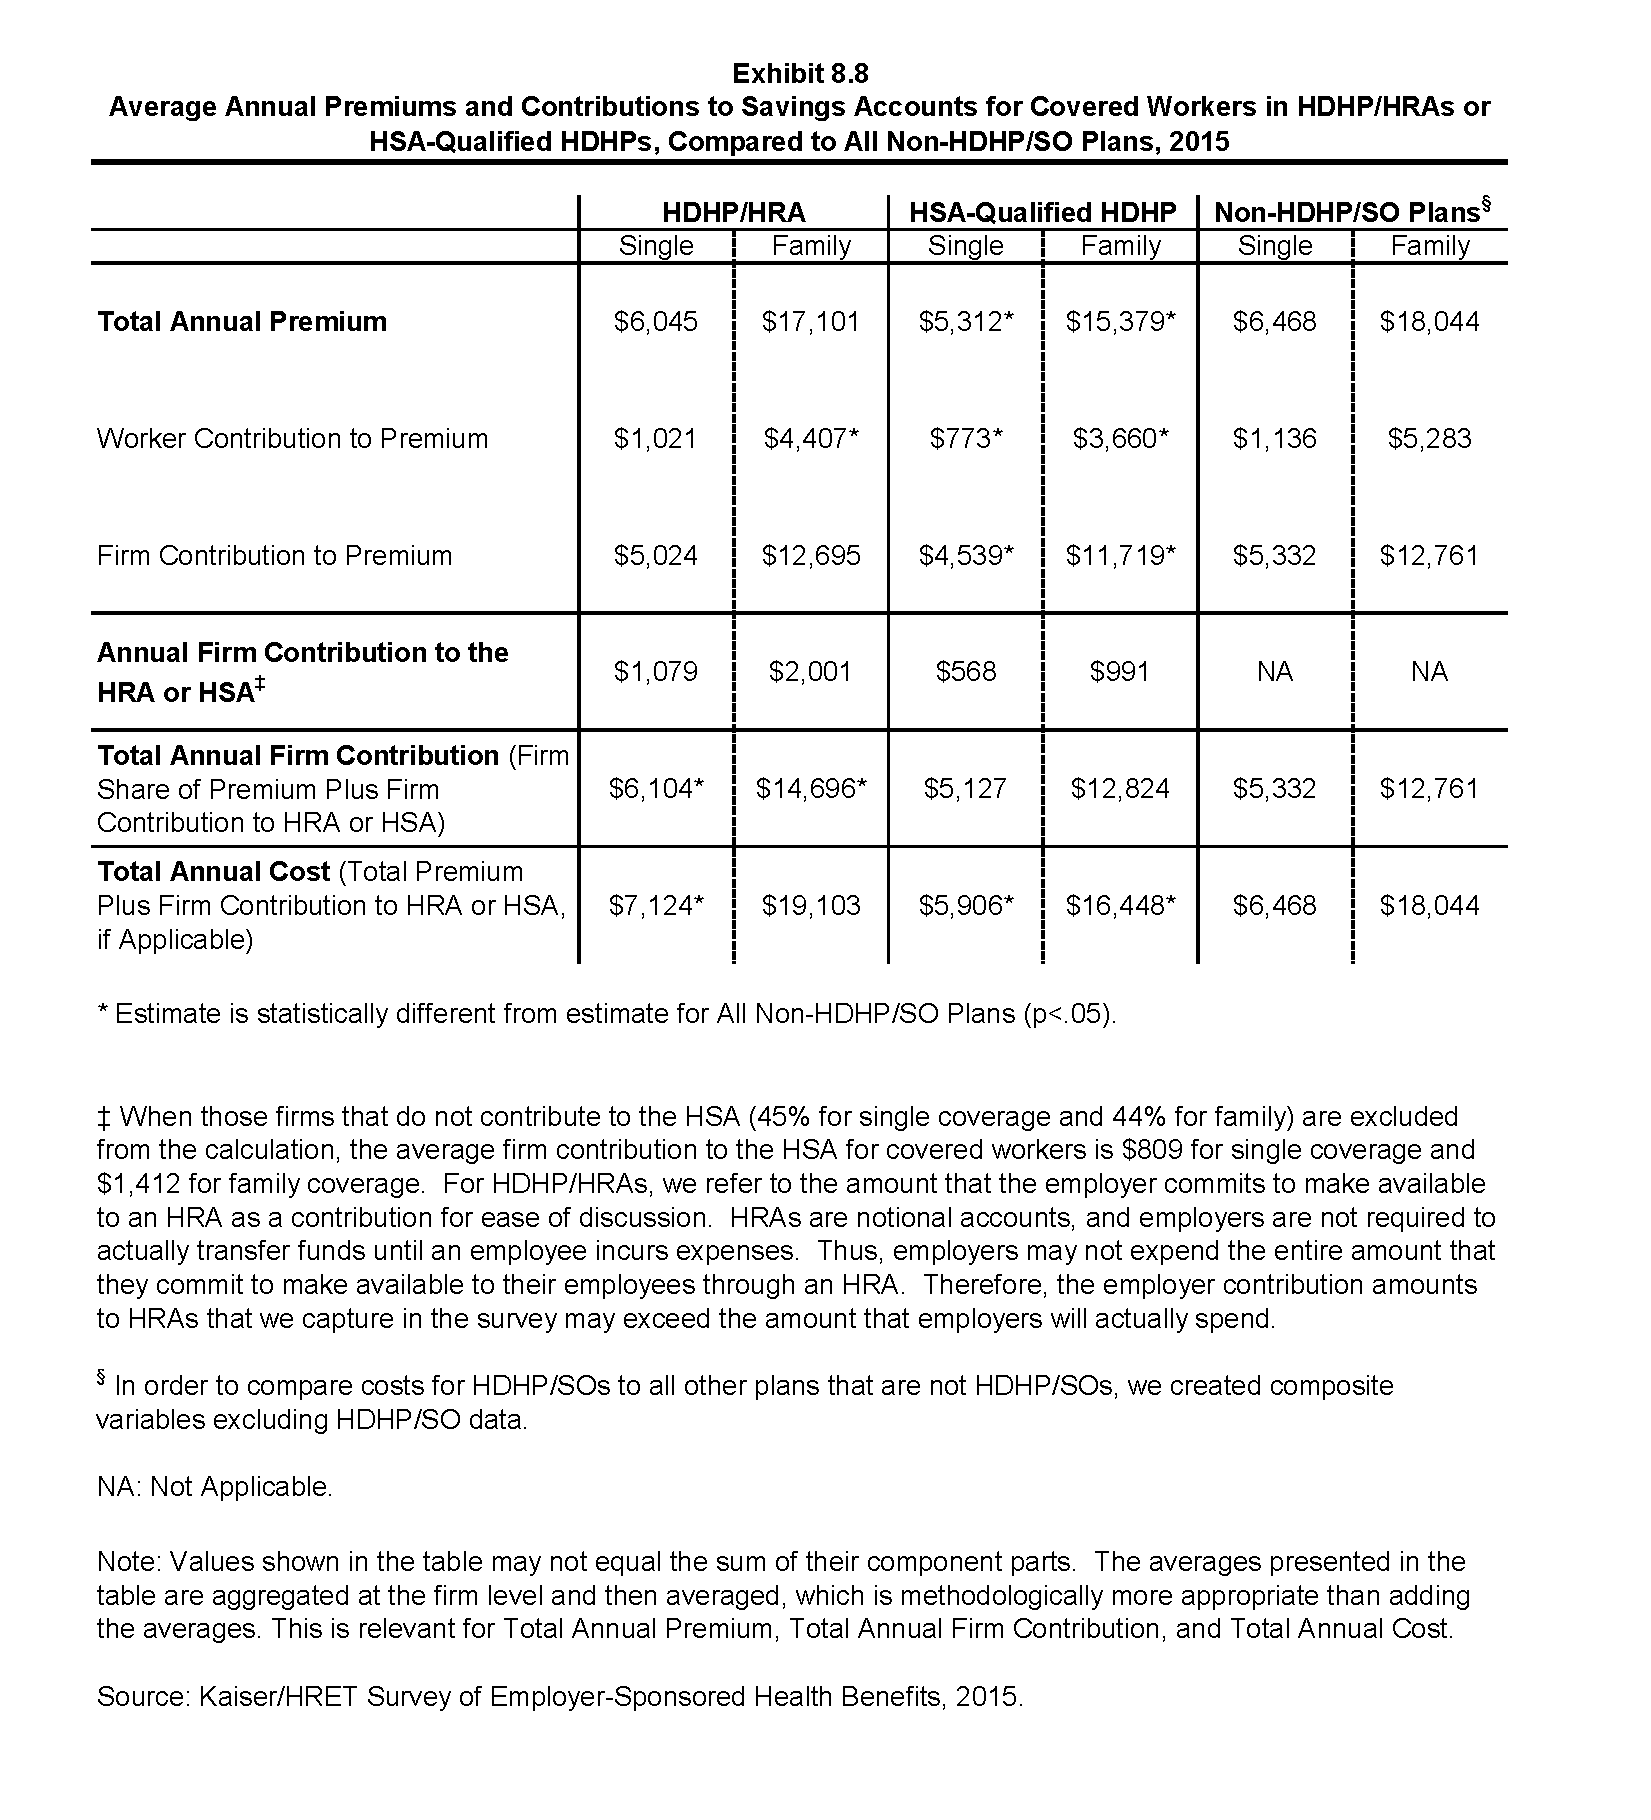
Average Annual Premiums and Contributions to Savings Accounts for Covered Workers in HDHP/HRAs or HSA-Qualified HDHPs, Compared to All Non-HDHP/SO Plans, 2015
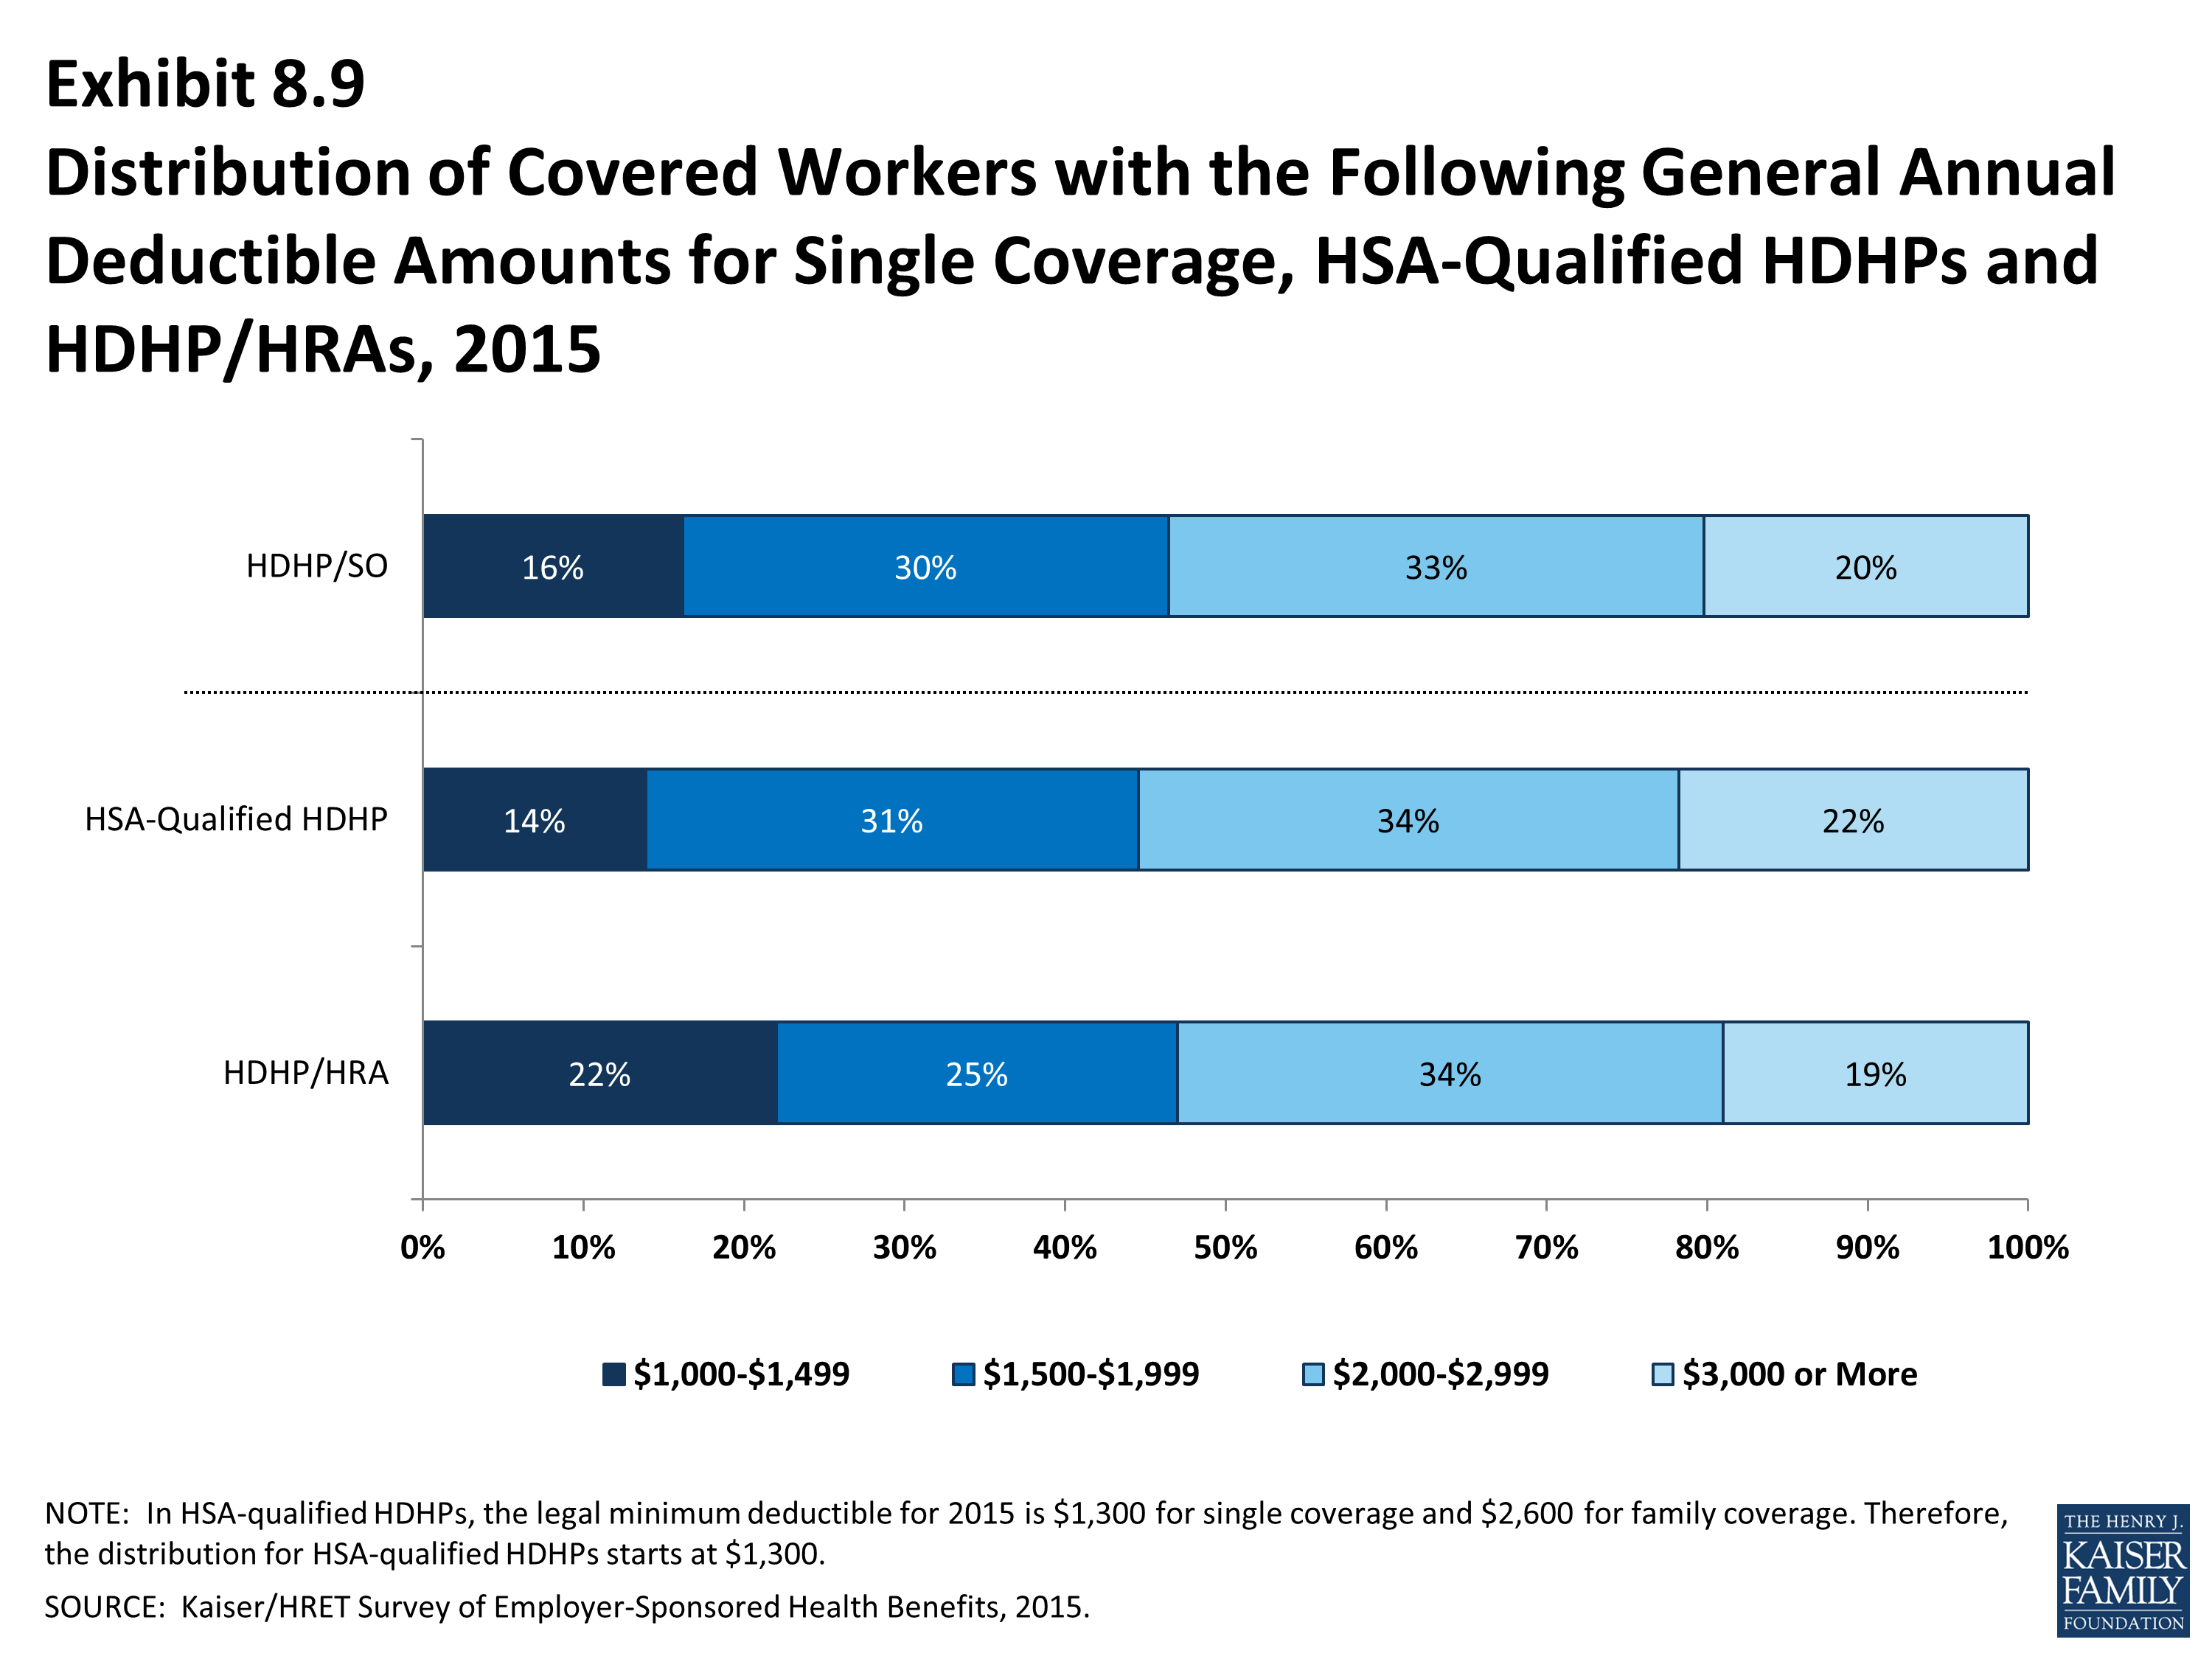
Distribution of Covered Workers with the Following General Annual Deductible Amounts for Single Coverage, HSA-Qualified HDHPs and HDHP/HRAs, 2015
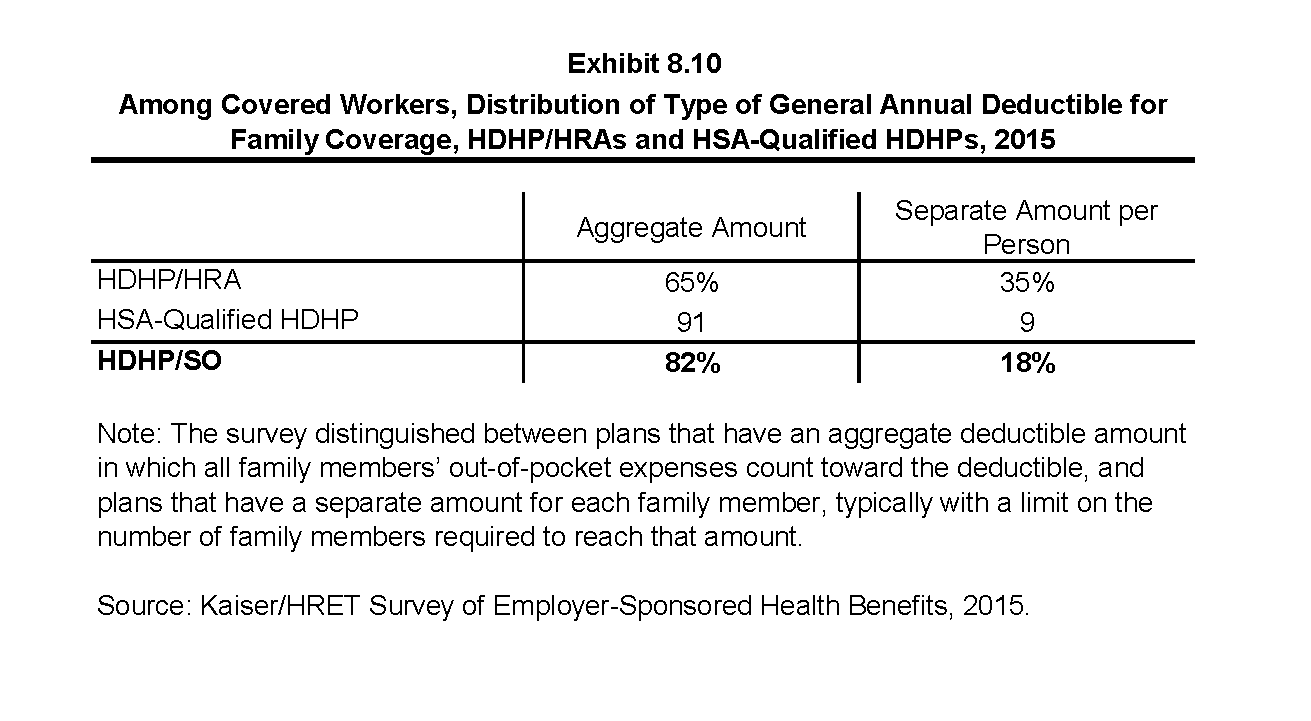
Among Covered Workers, Distribution of Type of General Annual Deductible for Family Coverage, HDHP/HRAs and HSA-Qualified HDHPs, 2015
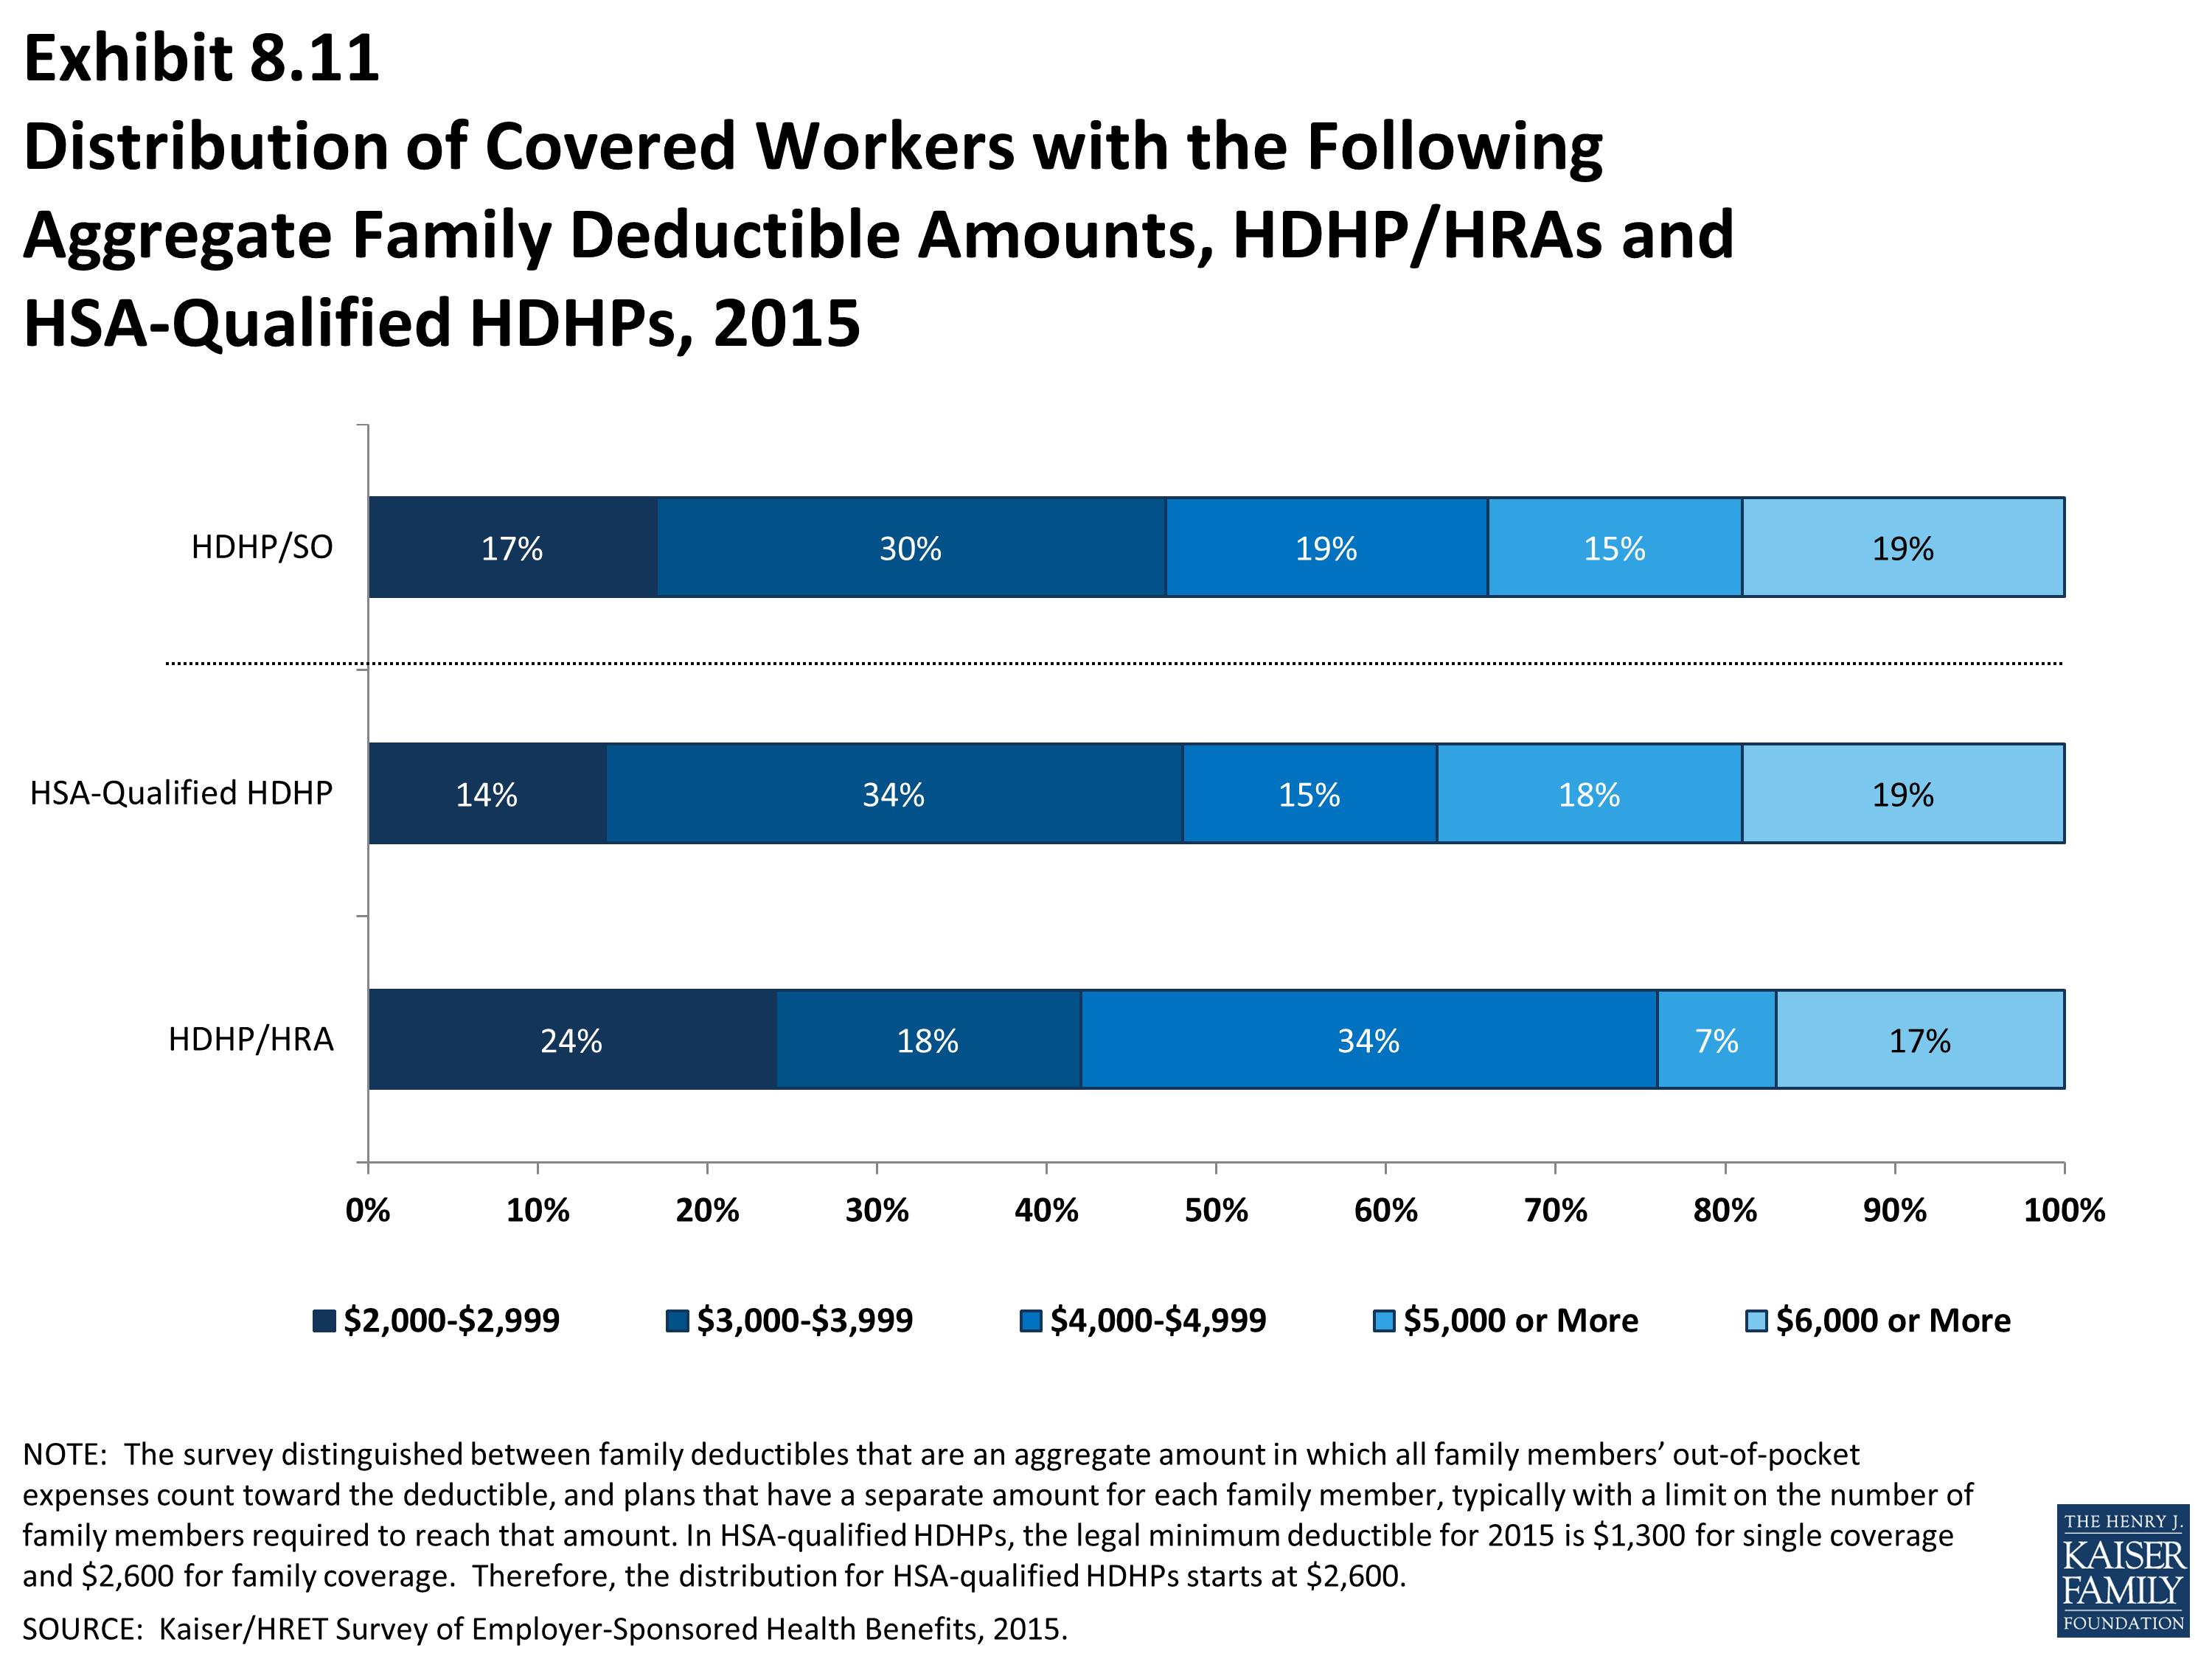
Distribution of Covered Workers with the Following Aggregate Family Deductible Amounts, HDHP/HRAs and HSA-Qualified HDHPs, 2015
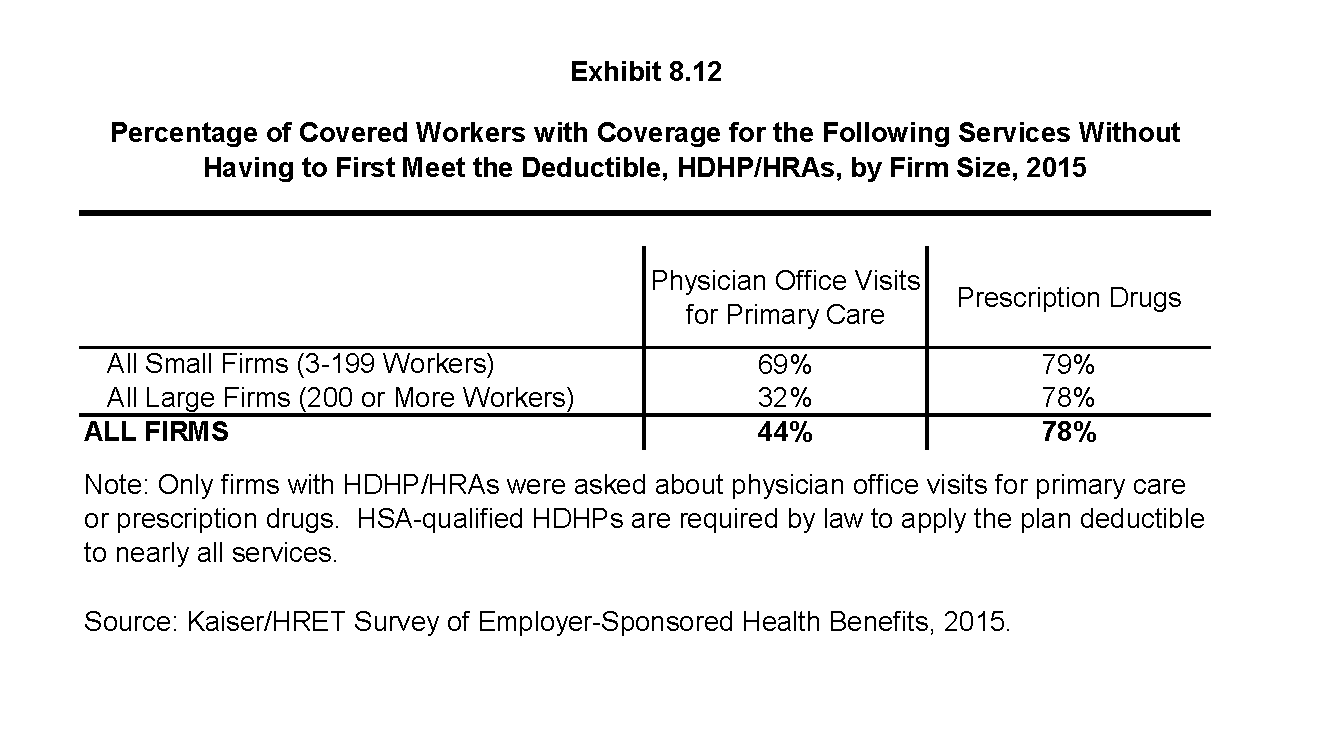
Percentage of Covered Workers with Coverage for the Following Services Without Having to First Meet the Deductible, HDHP/HRAs, by Firm Size, 2015
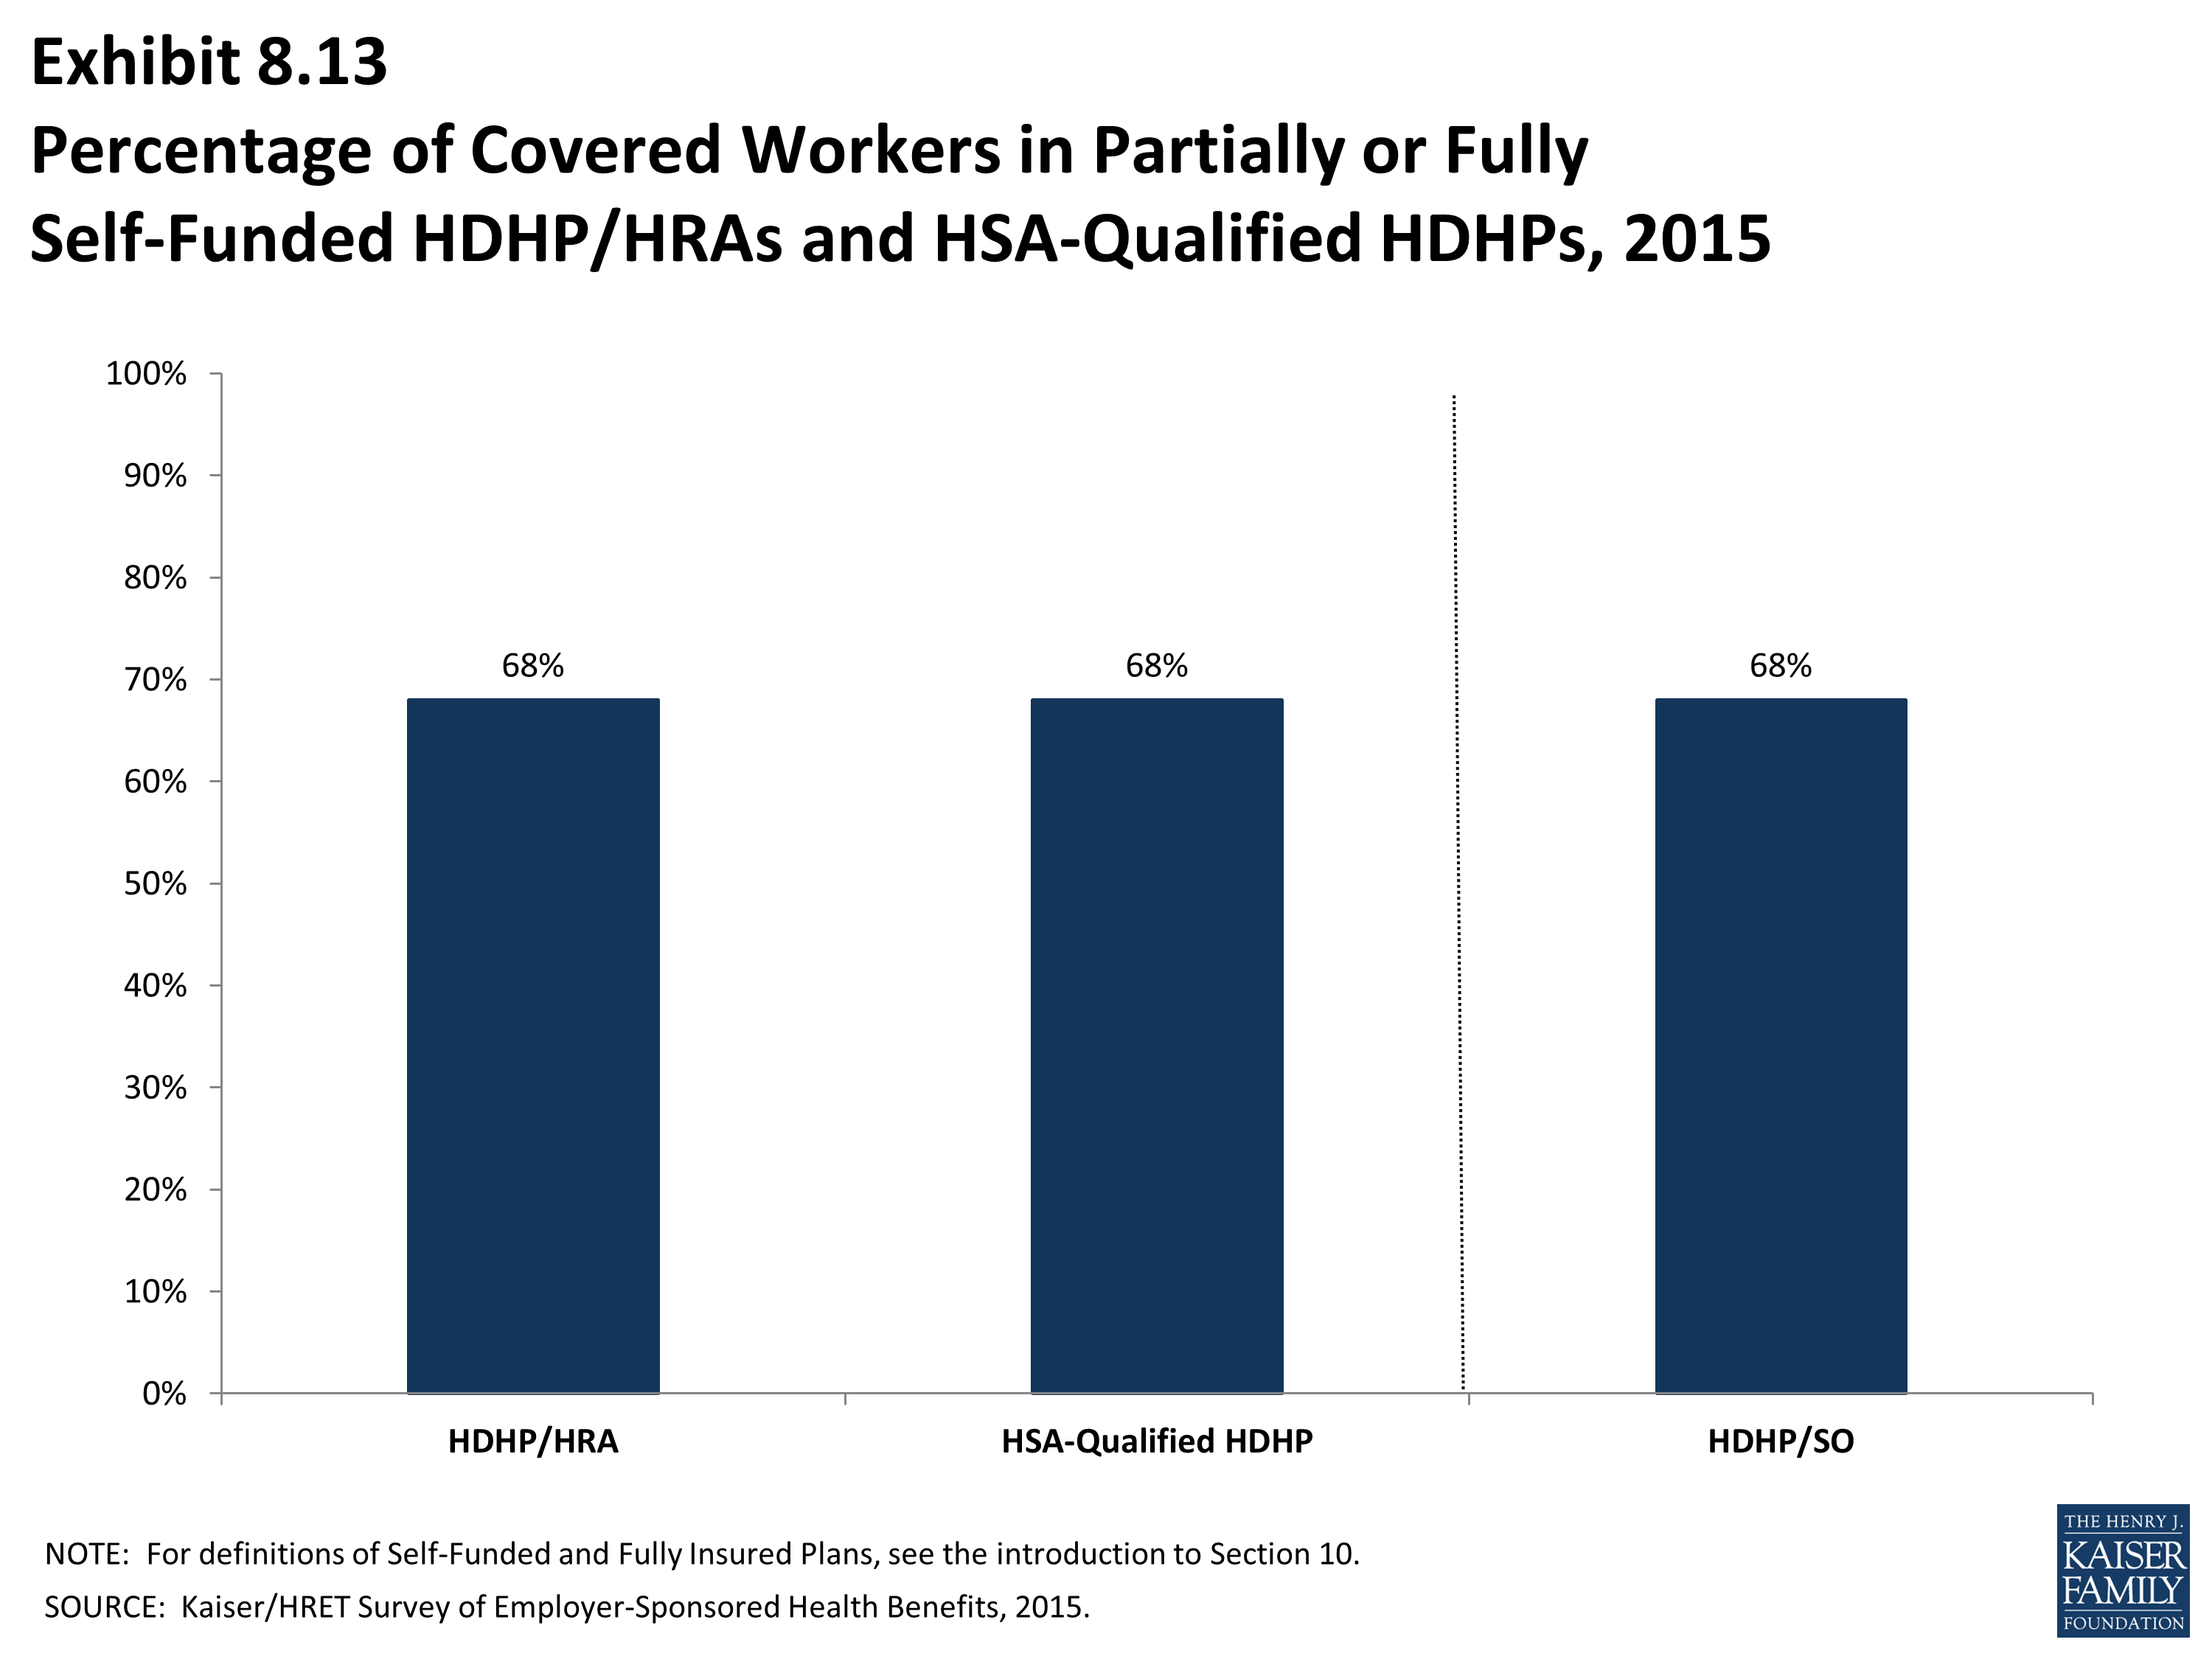
Percentage of Covered Workers in Partially or Fully Self-Funded HDHP/HRAs and HSA-Qualified HDHPs, 2015
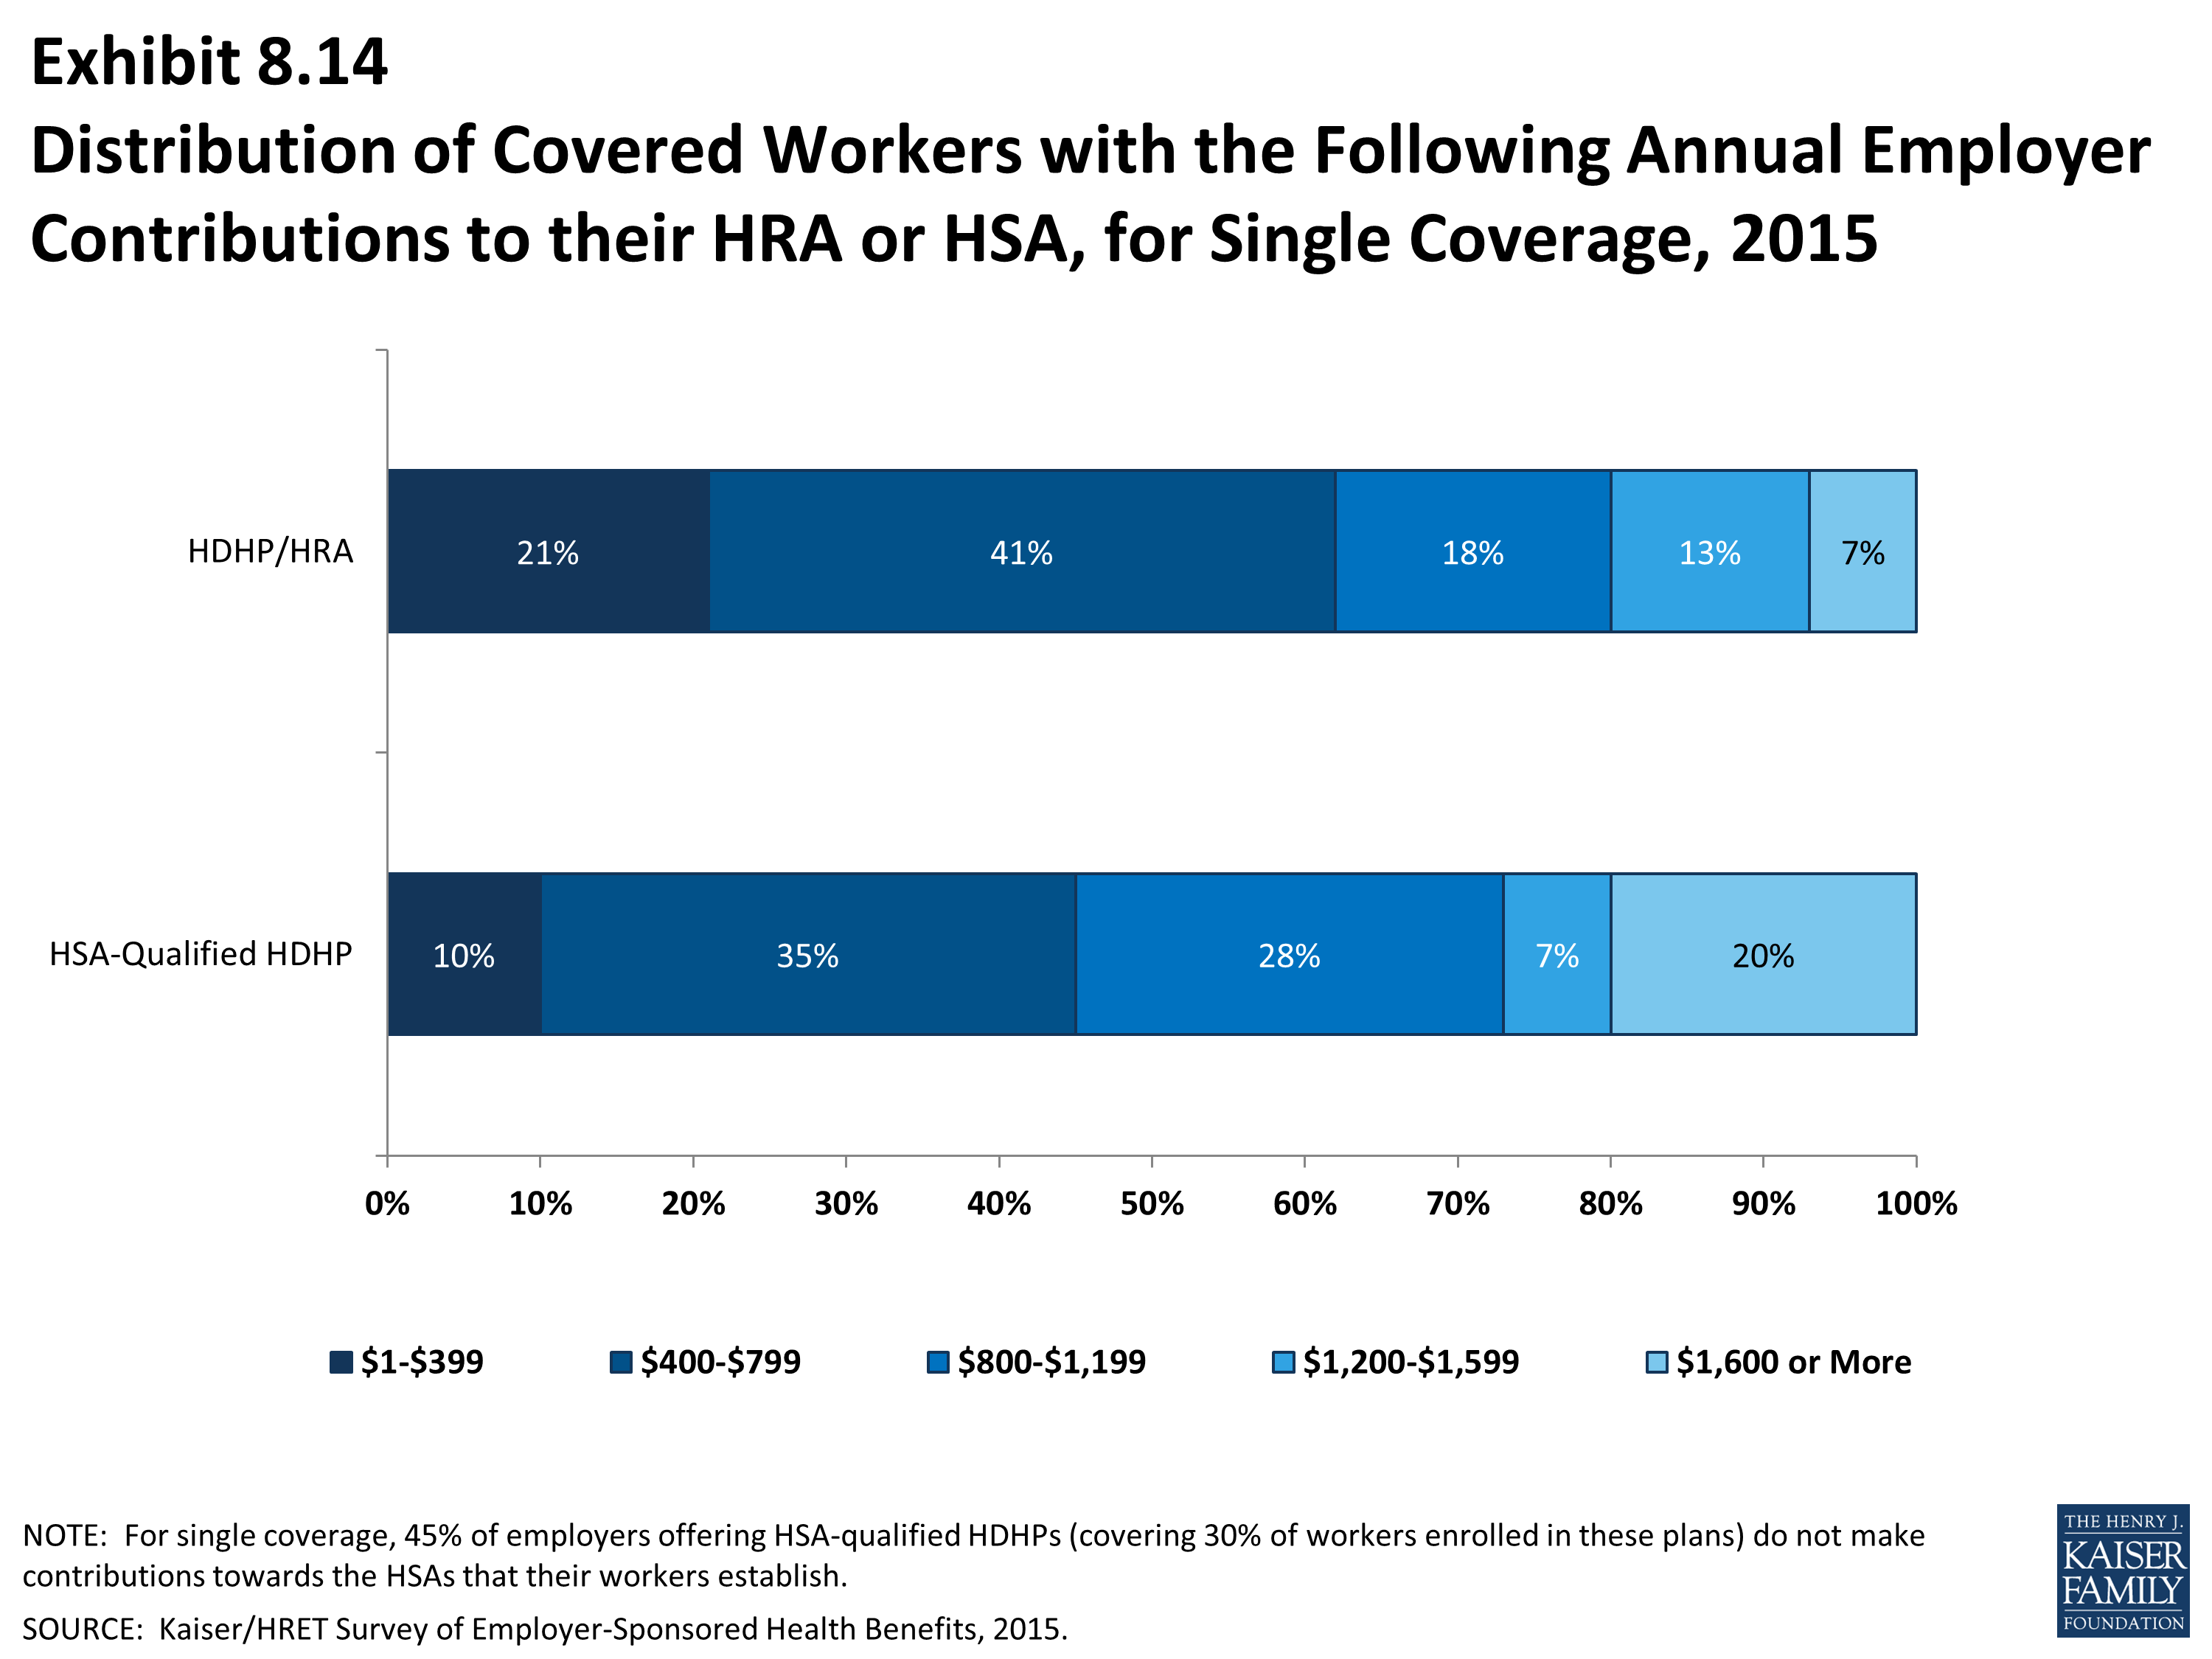
Distribution of Covered Workers with the Following Annual Employer Contributions to their HRA or HSA, for Single Coverage, 2015
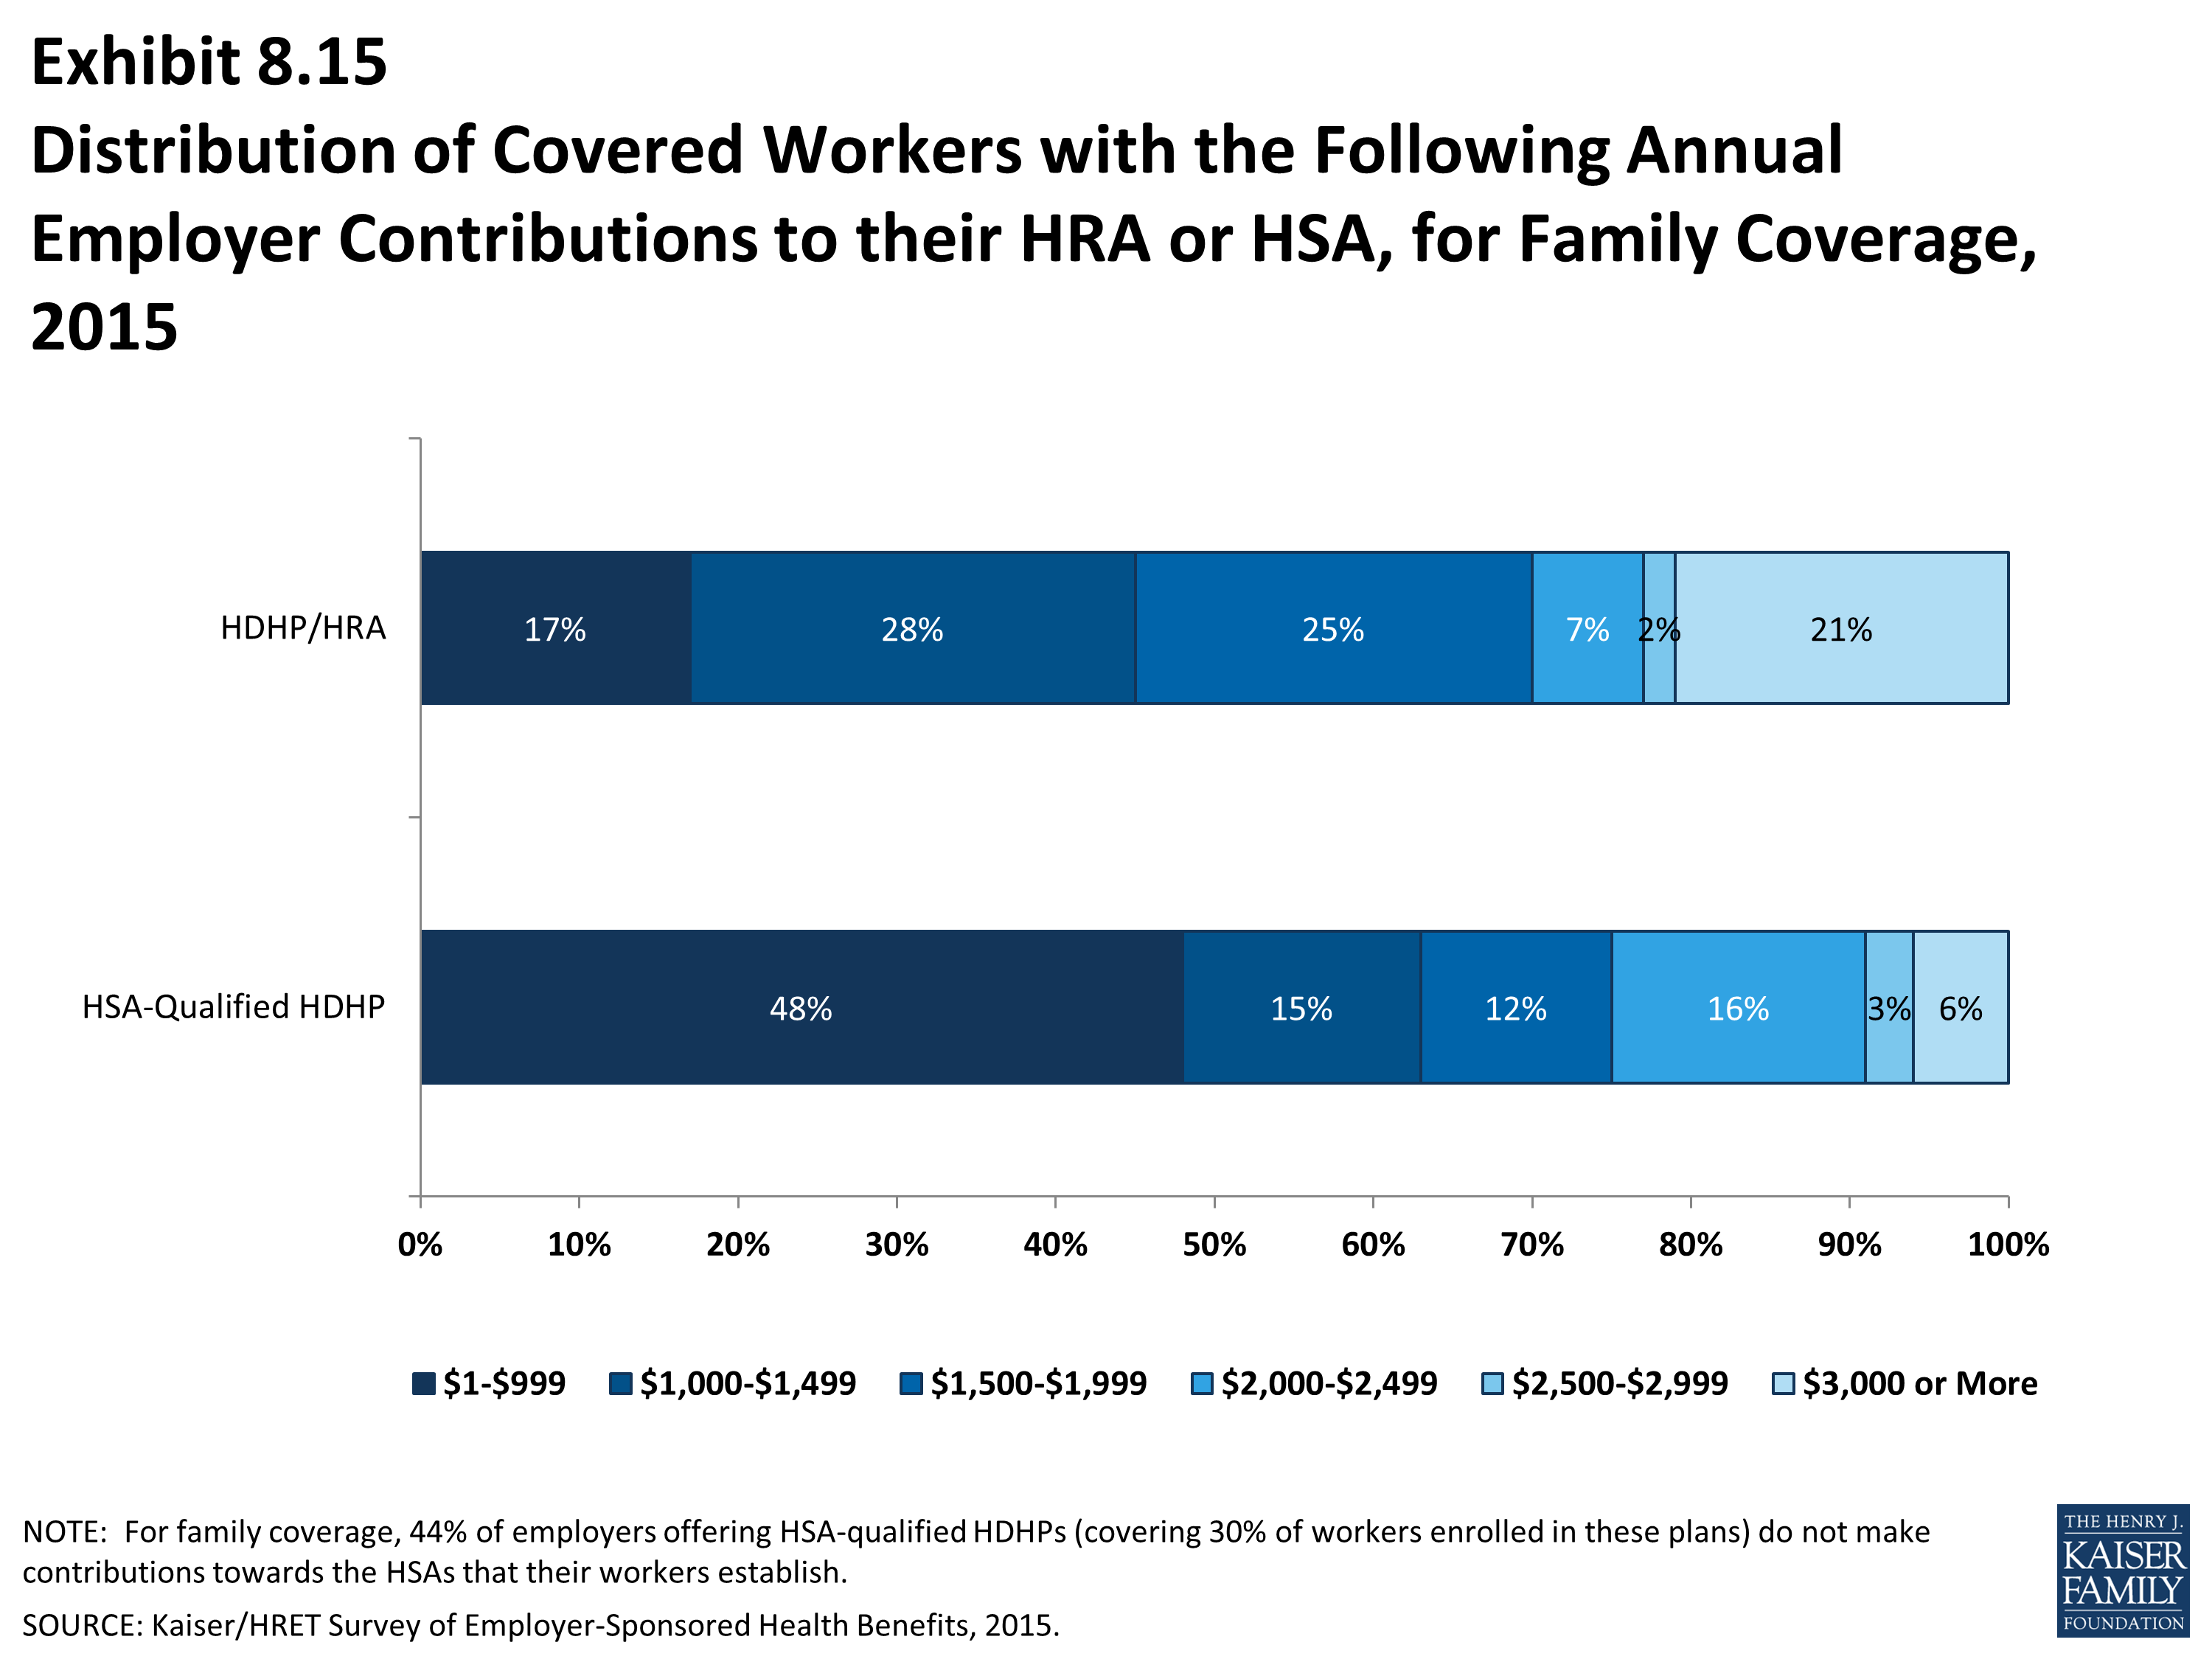
Distribution of Covered Workers with the Following Annual Employer Contributions to their HRA or HSA, for Family Coverage, 2015

Distribution of Firm Contributions to the HRA for Single and Family Coverage Relative to the Average Annual Firm Contribution to the HRA, 2015
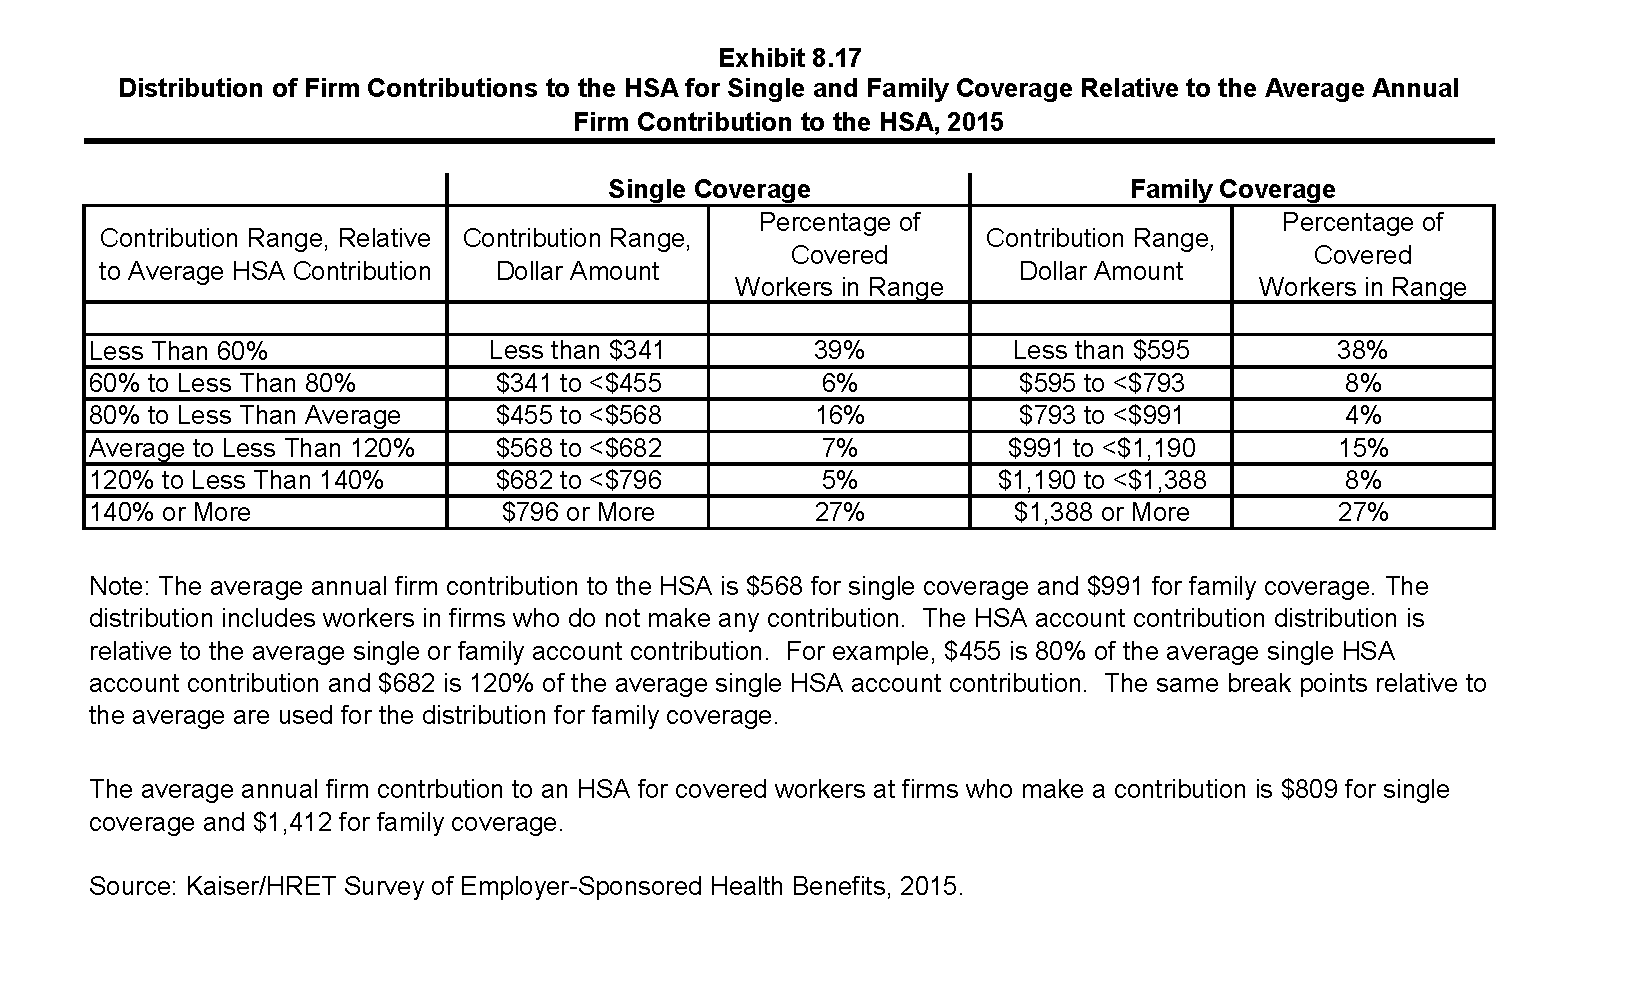
Distribution of Firm Contributions to the HSA for Single and Family Coverage Relative to the Average Annual Firm Contribution to the HSA, 2015
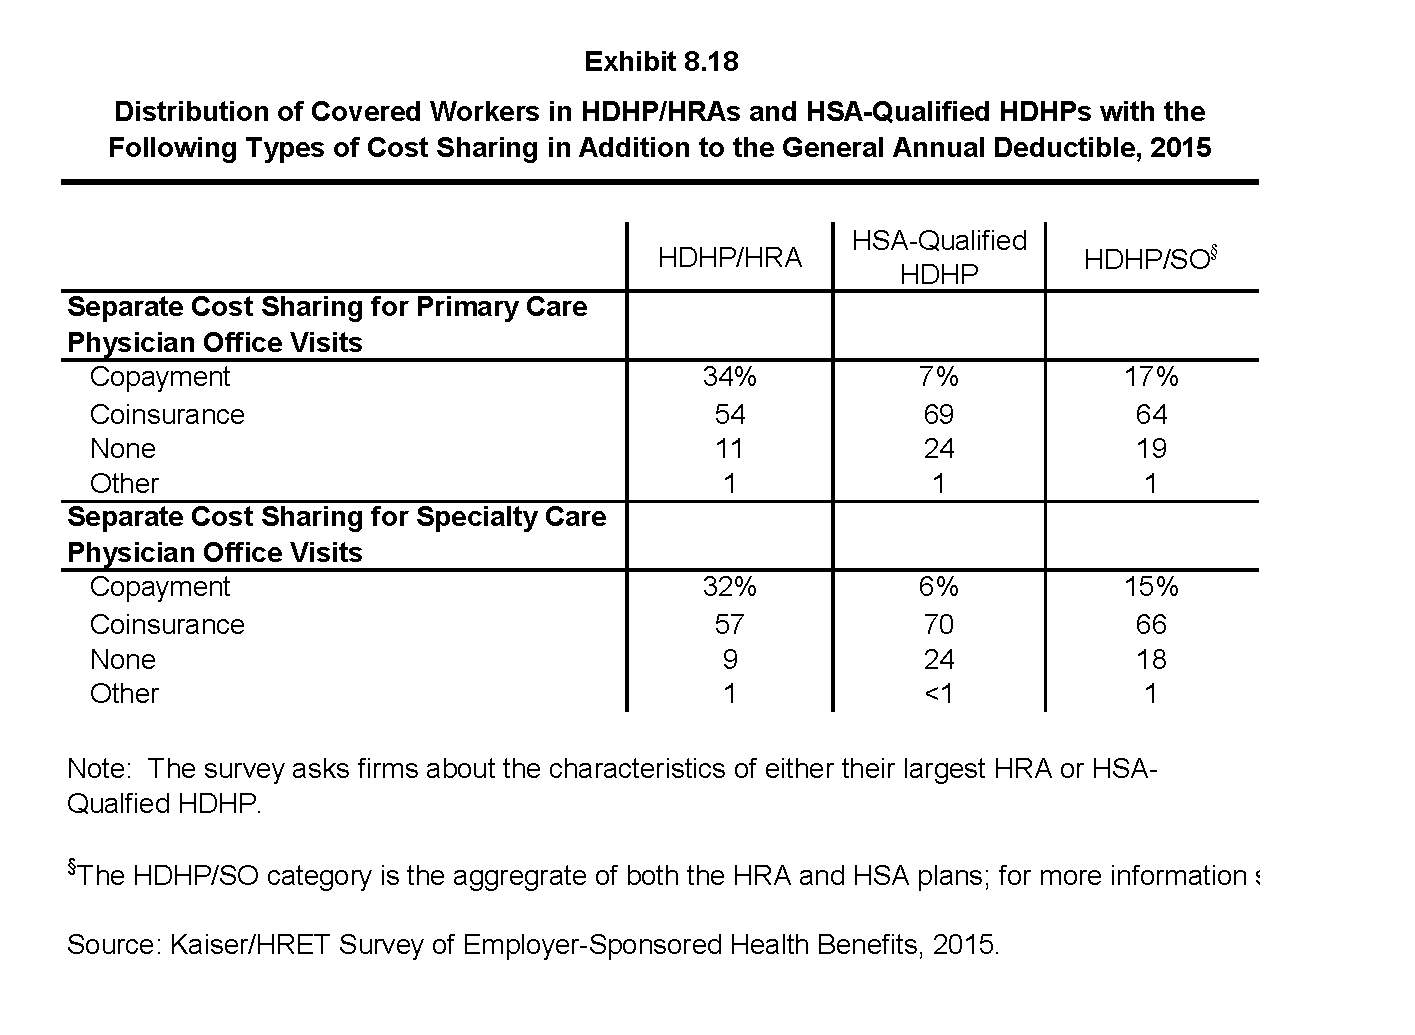
Distribution of Covered Workers in HDHP/HRAs and HSA-Qualified HDHPs with the Following Types of Cost Sharing in Addition to the General Annual Deductible, 2015
Section Nine: Prescription Drug Benefits
- As in prior years, nearly all (more than 99%) covered workers in employer-sponsored plans have a prescription drug benefit.
- An overwhelming majority of covered workers (88%) have a tiered cost-sharing formula for prescription drugs in 2015 (Exhibit 9.1). Cost-sharing tiers generally refer to a health plan placing a drug on a formulary or preferred drug list, which classifies drugs as generic, preferred, or non-preferred. Over the past few years, an increasing number of plans have created four or more tiers of drug cost sharing, which may be used for lifestyle drugs or expensive biologics. Employers often place various drugs in generic, preferred, or non-preferred tiers to encourage enrollees to select cheaper alternatives or to pass on to enrollees the higher costs of more expensive drugs. Sometimes employers will require high initial cost sharing for higher tier drugs but then include a coinsurance maximum to limit an enrollee’s total liability.
- Eighty-one percent of covered workers are enrolled in plans with three, four, or more tiers of cost sharing for prescription drugs, similar to 80% of covered workers in 2014 (Exhibit 9.1).
- HDHP/SOs have a different cost-sharing pattern for prescription drugs than other plan types. Twenty-two percent of workers enrolled in HDHP/SOs are in a plan whose payment is the same regardless of drug type, compared to only 8% for all plans. Twelve percent are in a plan that pays 100% of prescription costs once the plan deductible is met, compared to 4% for all plans (Exhibit 9.2).
Three or More Tiers
- Twenty-three percent of covered workers are in a plan that has four or more tiers of cost sharing for prescription drugs (Exhibit 9.1).
- Among workers covered by plans with three or more tiers of cost sharing for prescription drugs, copayments are far more common than coinsurance in the first three tiers. For covered workers in plans with three or more cost-sharing tiers, 50% face a copayment for fourth-tier drugs and 40% face coinsurance (Exhibit 9.3).
- For covered workers in plans with three, four, or more tiers of cost sharing for prescription drugs, the average copayments for first-tier drugs ($11), second-tier drugs ($31), third-tier drugs ($54), and fourth-tier drugs ($93) are comparable to the amounts reported in 2014 ($11, $31, $53, and $83, respectively) (Exhibit 9.4).
- For covered workers in plans with three, four, or more tiers of cost sharing for prescription drugs, coinsurance averages 17% for first-tier drugs, 27% for second-tier drugs, 43% for third-tier drugs, and 32% for fourth-tier drugs. Coinsurance averages for second and third tier drugs are significantly higher than last year (27% vs. 24%) (43% vs. 37%) (Exhibit 9.4).
Single and Two Tiers
- Seven percent of covered workers are in a plan that has two tiers for prescription drug cost sharing (Exhibit 9.1). Similar to workers in plans with more cost-sharing tiers, copayments are more common than coinsurance for workers in plans with two tiers (Exhibit 9.5). The average copayment for the first tier is $12, and the average copayment for the second tier is $31. The average coinsurance rate for the second tier is 28% (Exhibit 9.6).
- Eight percent of covered workers are covered by plans in which cost sharing is the same regardless of the type of drug chosen (Exhibit 9.1). Among these covered workers, 16% have copayments and 83% have coinsurance (Exhibit 9.7). The average copayment is $12 and the average coinsurance is 22% (Exhibit 9.8).
- Coinsurance rates for prescription drugs often have maximum or minimum dollar amounts associated with the coinsurance rate. Depending on the plan design, coinsurance maximums may significantly limit an enrollee’s out of pocket spending on high cost drugs. For generic or first tier drugs, 24% of workers with a coinsurance rate have only a maximum dollar amount attached to the coinsurance rate, 5% have only a minimum dollar amount, 18% have both, and 51% have neither. Coinsurance maximums are more common on higher tiers; 74% of covered workers with a fourth tier coinsurance have a maximum compared to 42% of first tier plans (Exhibit 9.9).
Deductibles
- In addition to a copayment or coinsurance, some covered workers with drug coverage are also required to pay a separate prescription drug deductible (12%) (Exhibit 9.10). Separate annual deductibles are an amount an employee must pay out of pocket before the plan covers most drugs. These deductibles are separate from any general annual deductible and may apply to a select number of tiers.
- The average annual deductible among workers who face a separate general annual deductible is $231 (Exhibit 9.11). Five percent of covered workers are enrolled in a plan with an annual deductible for prescription drug coverage of $500 or more.
Specialty drugs
- Specialty drugs such as biologics may be used to treat chronic conditions and often require special handling and administration. Many plans place specialty drugs on the fourth or higher tier of the formulary. Eighty-five percent of firms’ largest plan includes coverage for specialty drugs (Exhibit 9.12). Most covered workers with drug coverage are enrolled in a plan that covers specialty drugs such as biologics (94%).
- Specialty drugs are typically high cost; firms use a variety of strategies to contain these costs. Nine percent of firms whose plan with the largest enrollment covers specialty drugs use a separate cost sharing tier for specialty drugs. Eight percent use a step-therapy approach where enrollees must try alternatives before specialty drugs are covered, and 7% use tight limits on the number of units administered at a single time (Exhibit 9.13).
Generic drugs: Drugs product that are no longer covered by patent protection and thus may be produced and/or distributed by multiple drug companies.
Preferred drugs: Drugs included on a formulary or preferred drug list; for example, a brand-name drug without a generic substitute.
Non-preferred drugs: Drugs not included on a formulary or preferred drug list; for example, a brand-name drug with a generic substitute.
Fourth-tier drugs: New types of cost-sharing arrangements that typically build additional layers of higher copayments or coinsurance for specifically identified types of drugs, such as lifestyle drugs or biologics.
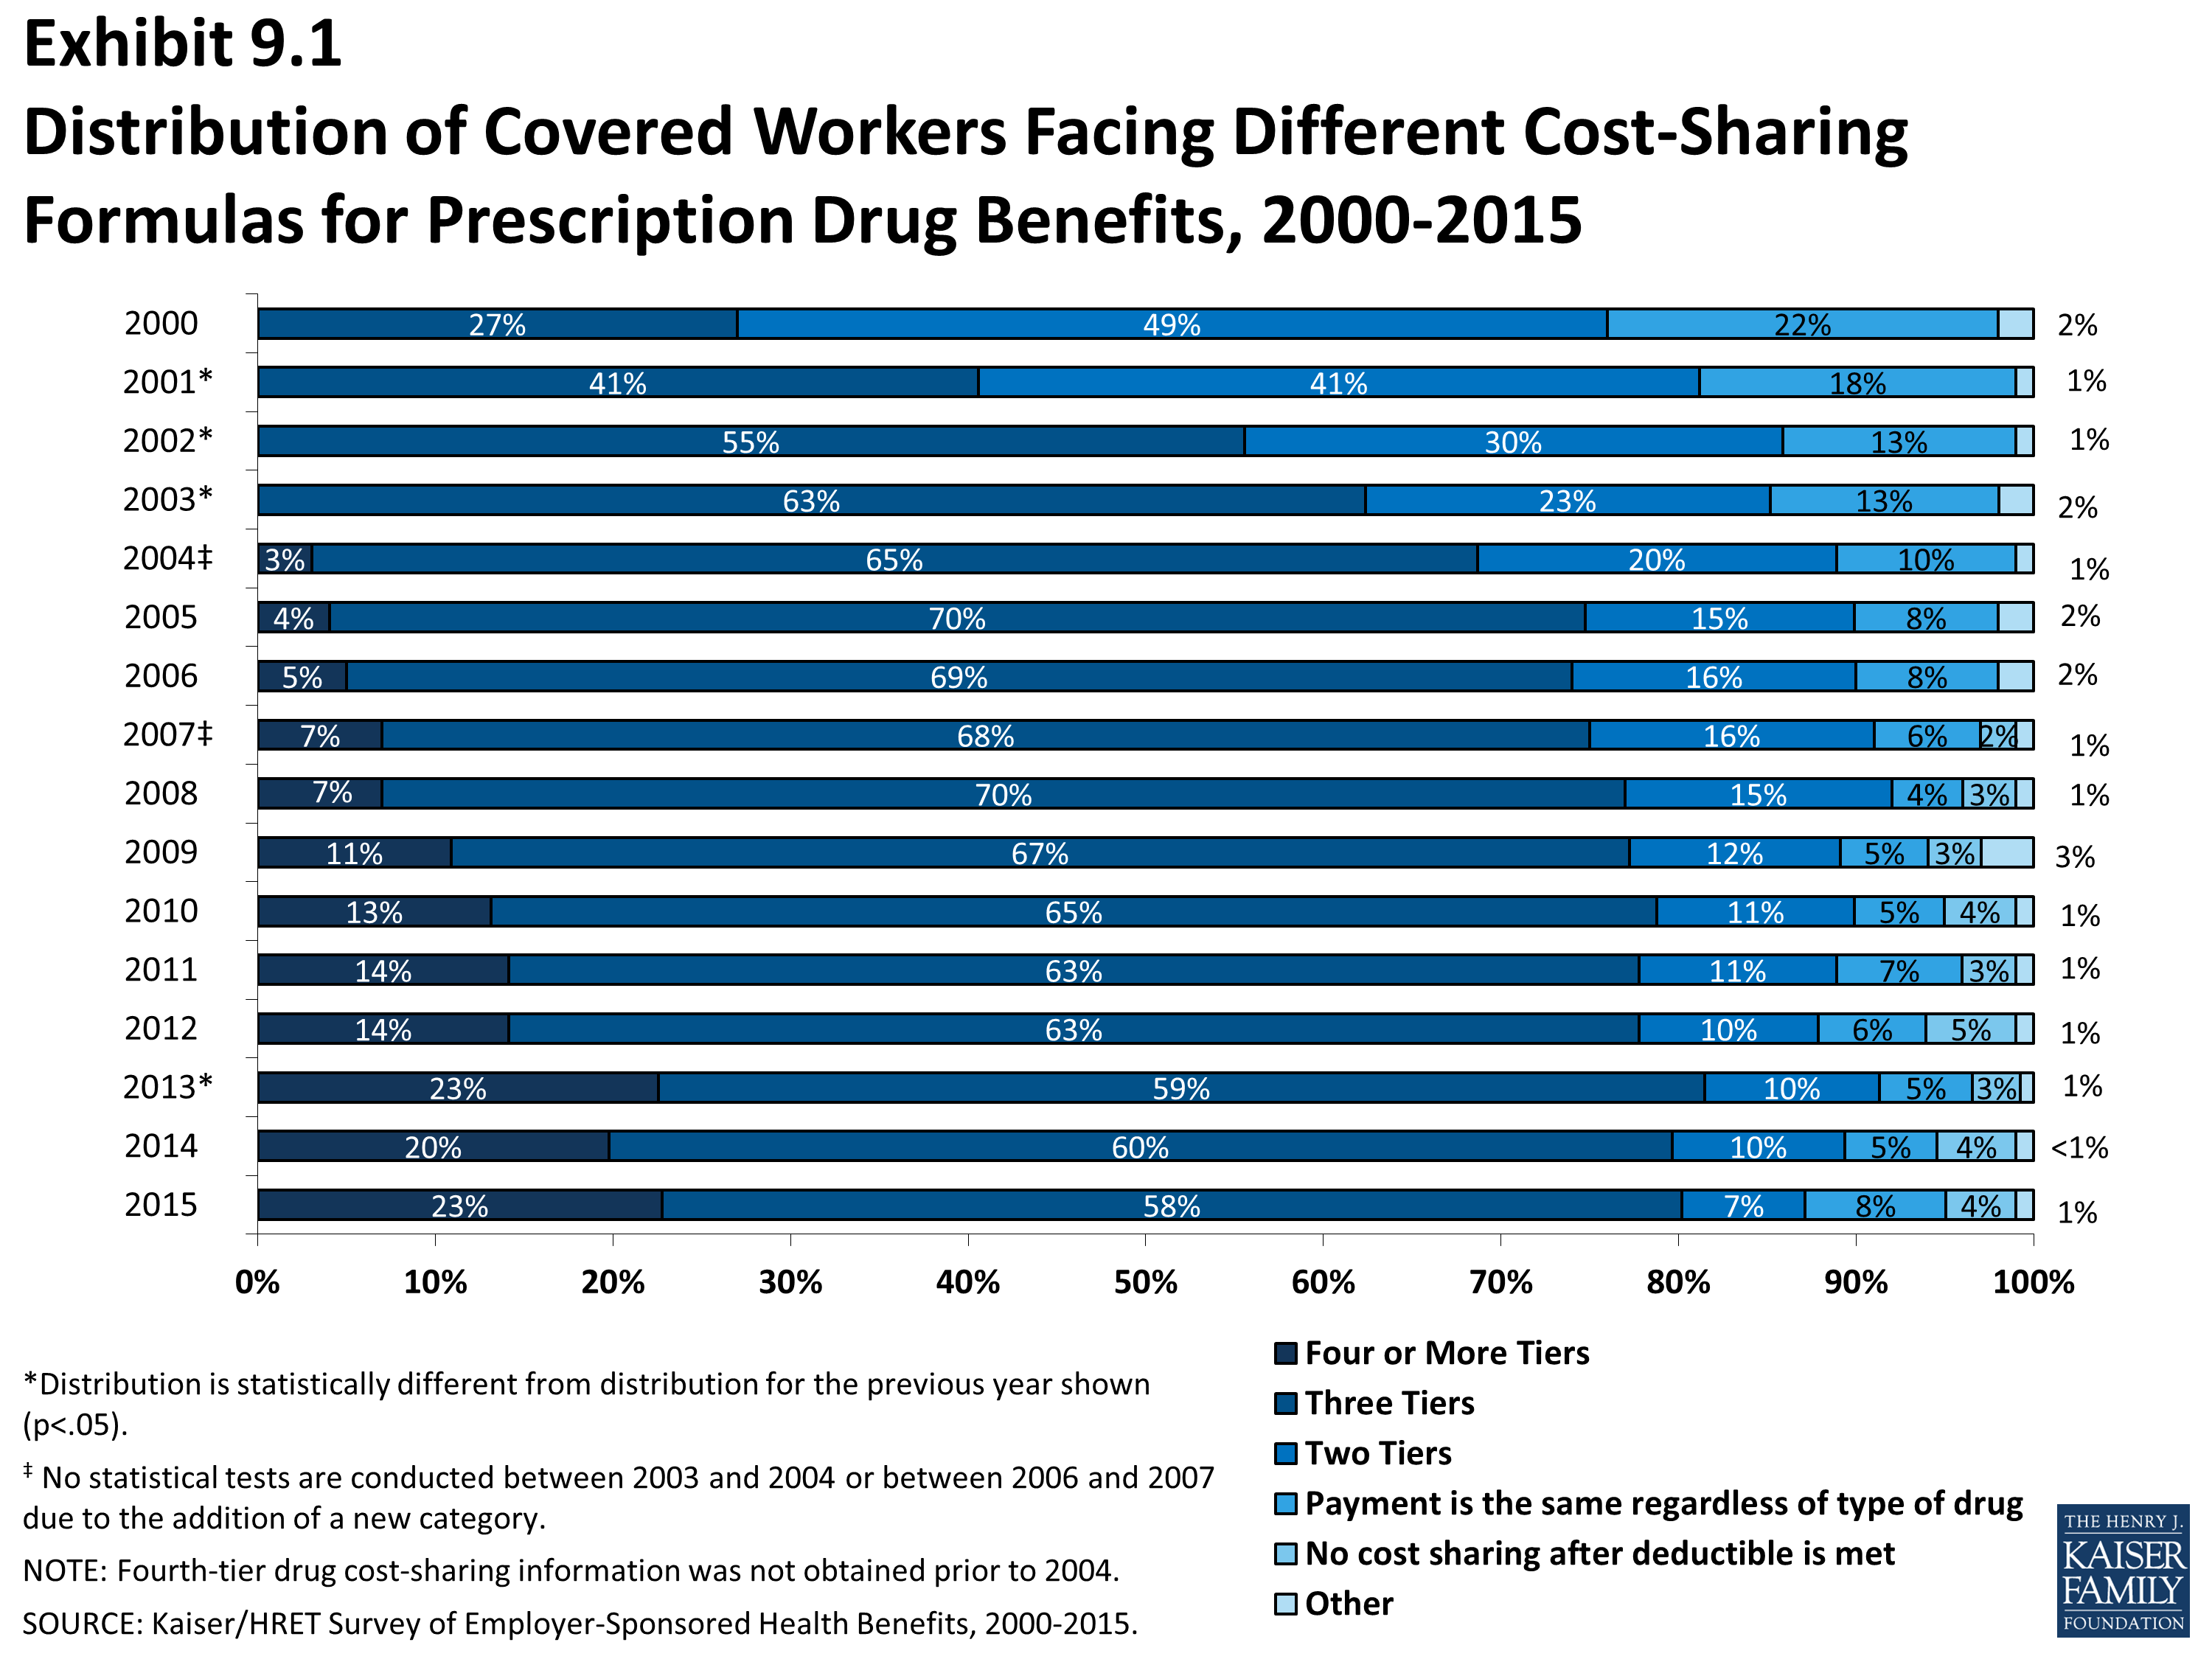
Distribution of Covered Workers Facing Different Cost-Sharing Formulas for Prescription Drug Benefits, 2000-2015
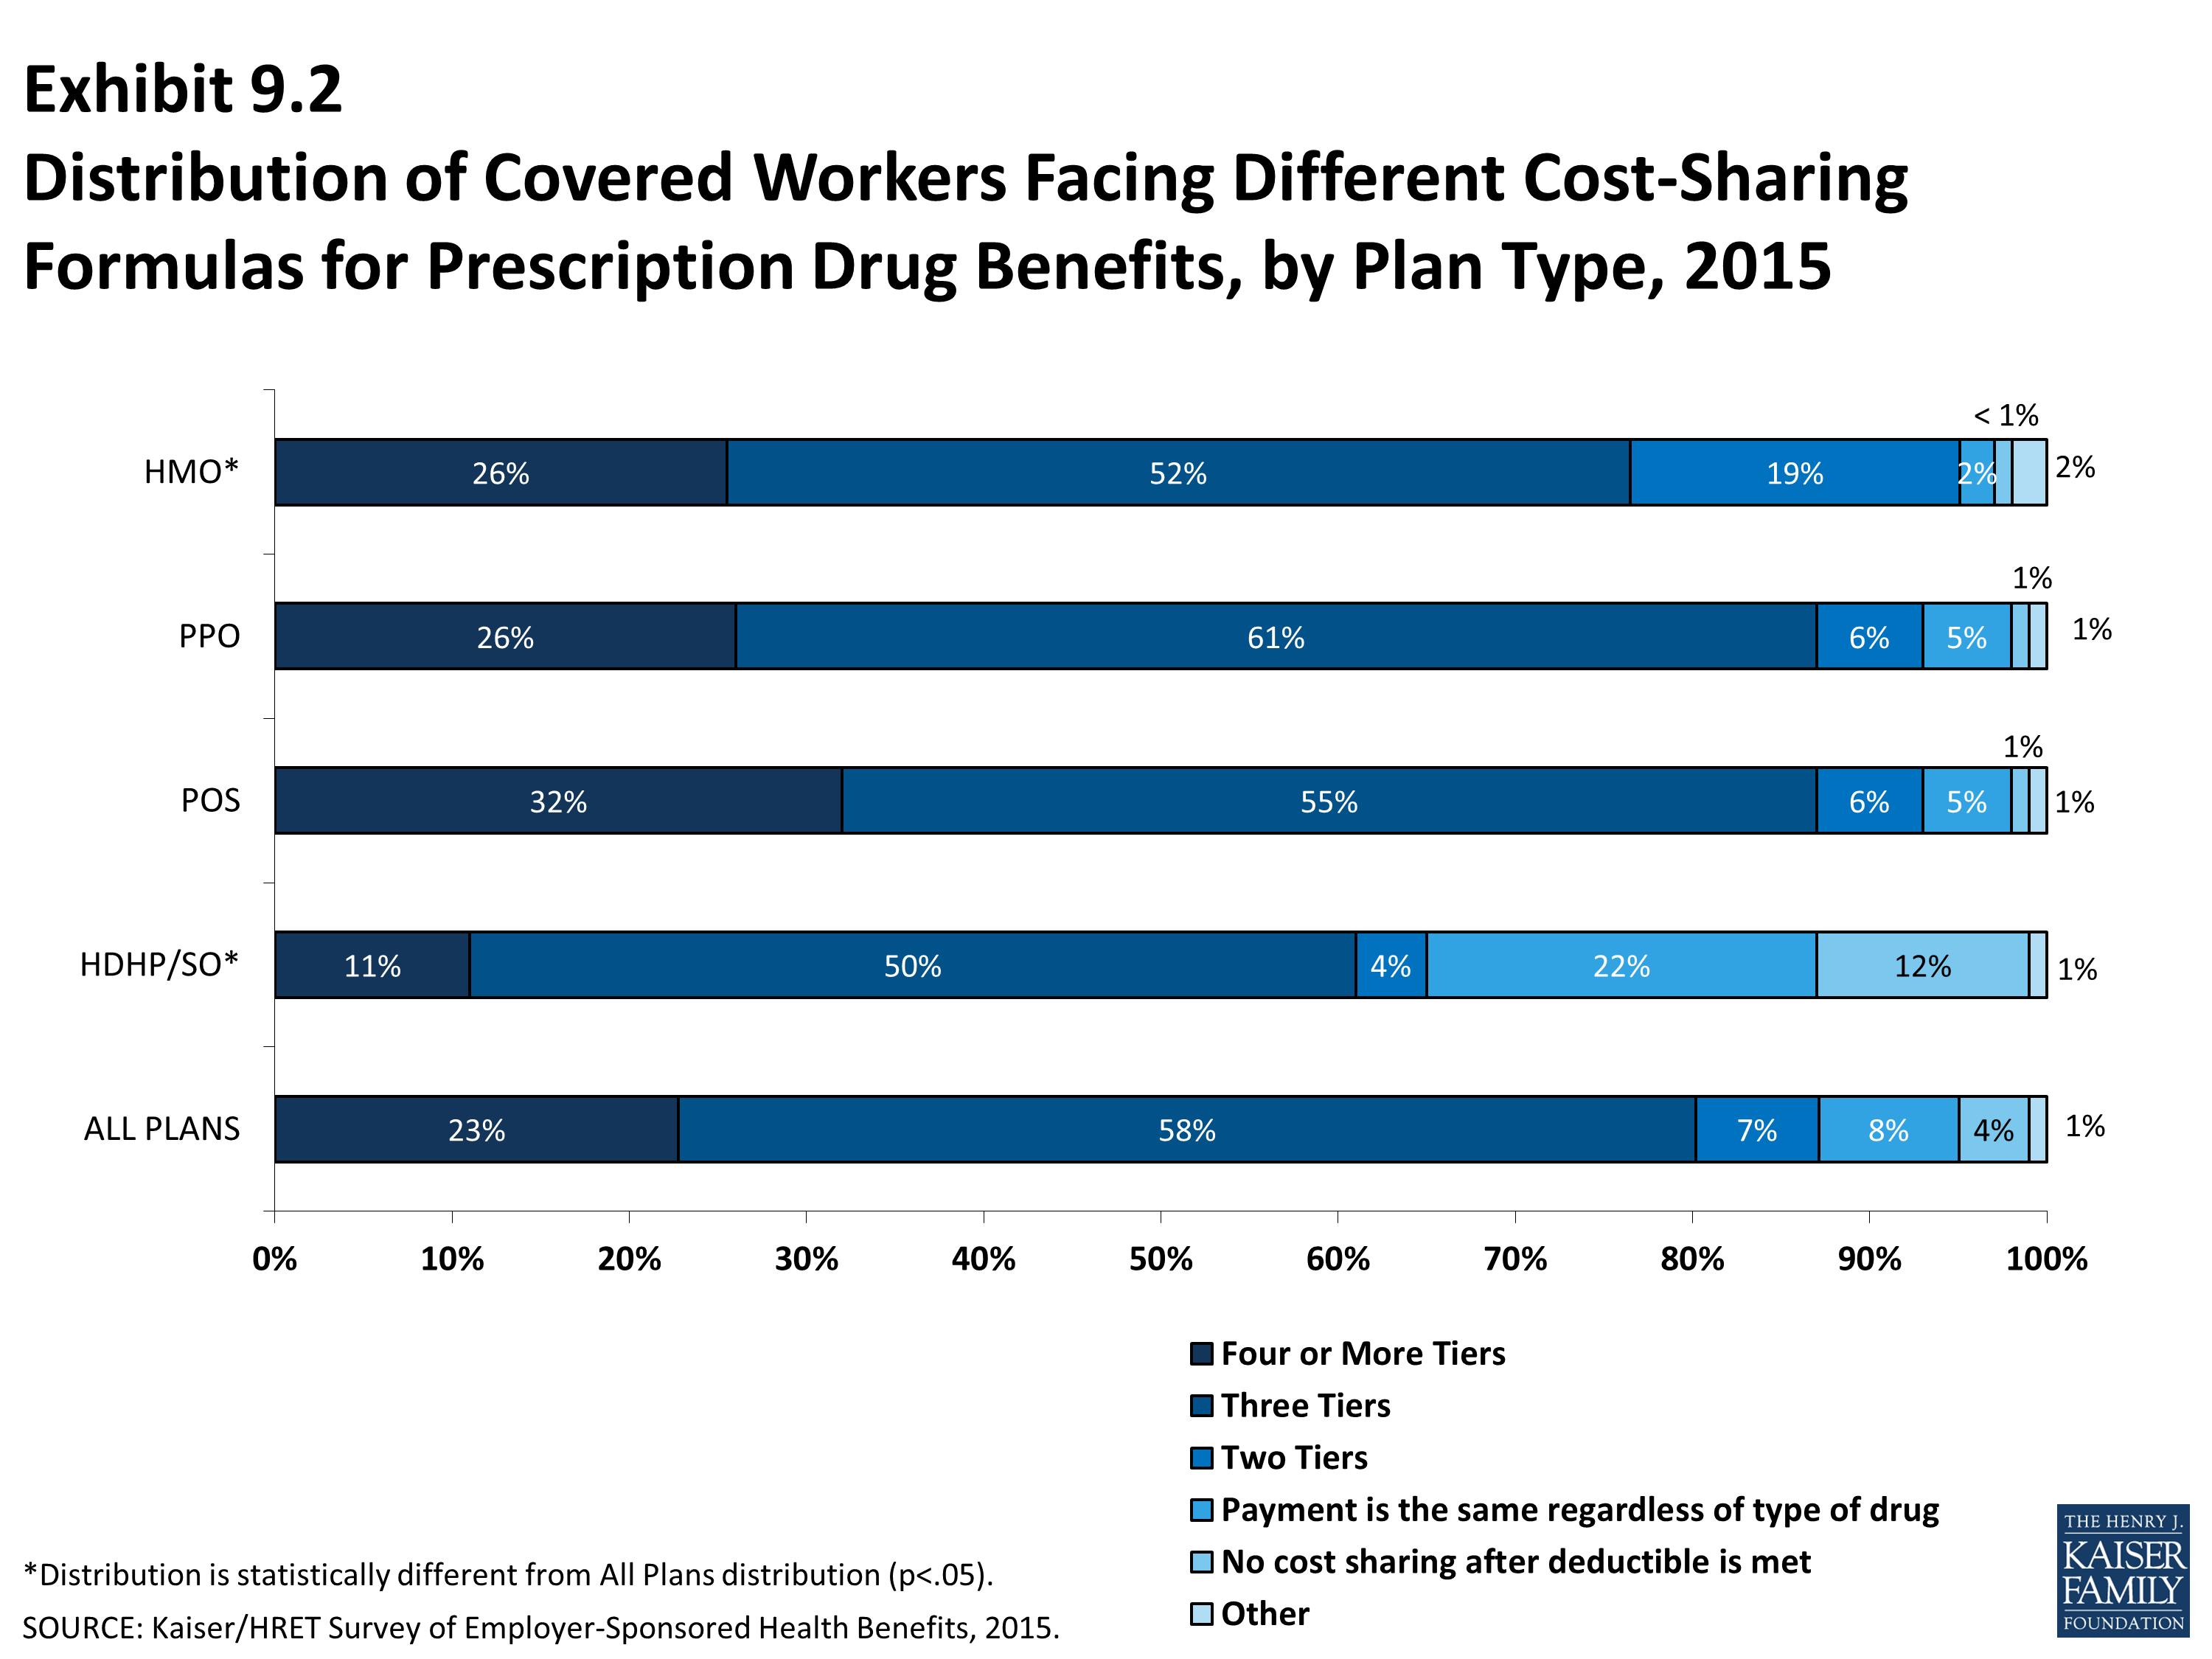
Distribution of Covered Workers Facing Different Cost-Sharing Formulas for Prescription Drug Benefits, by Plan Type, 2015
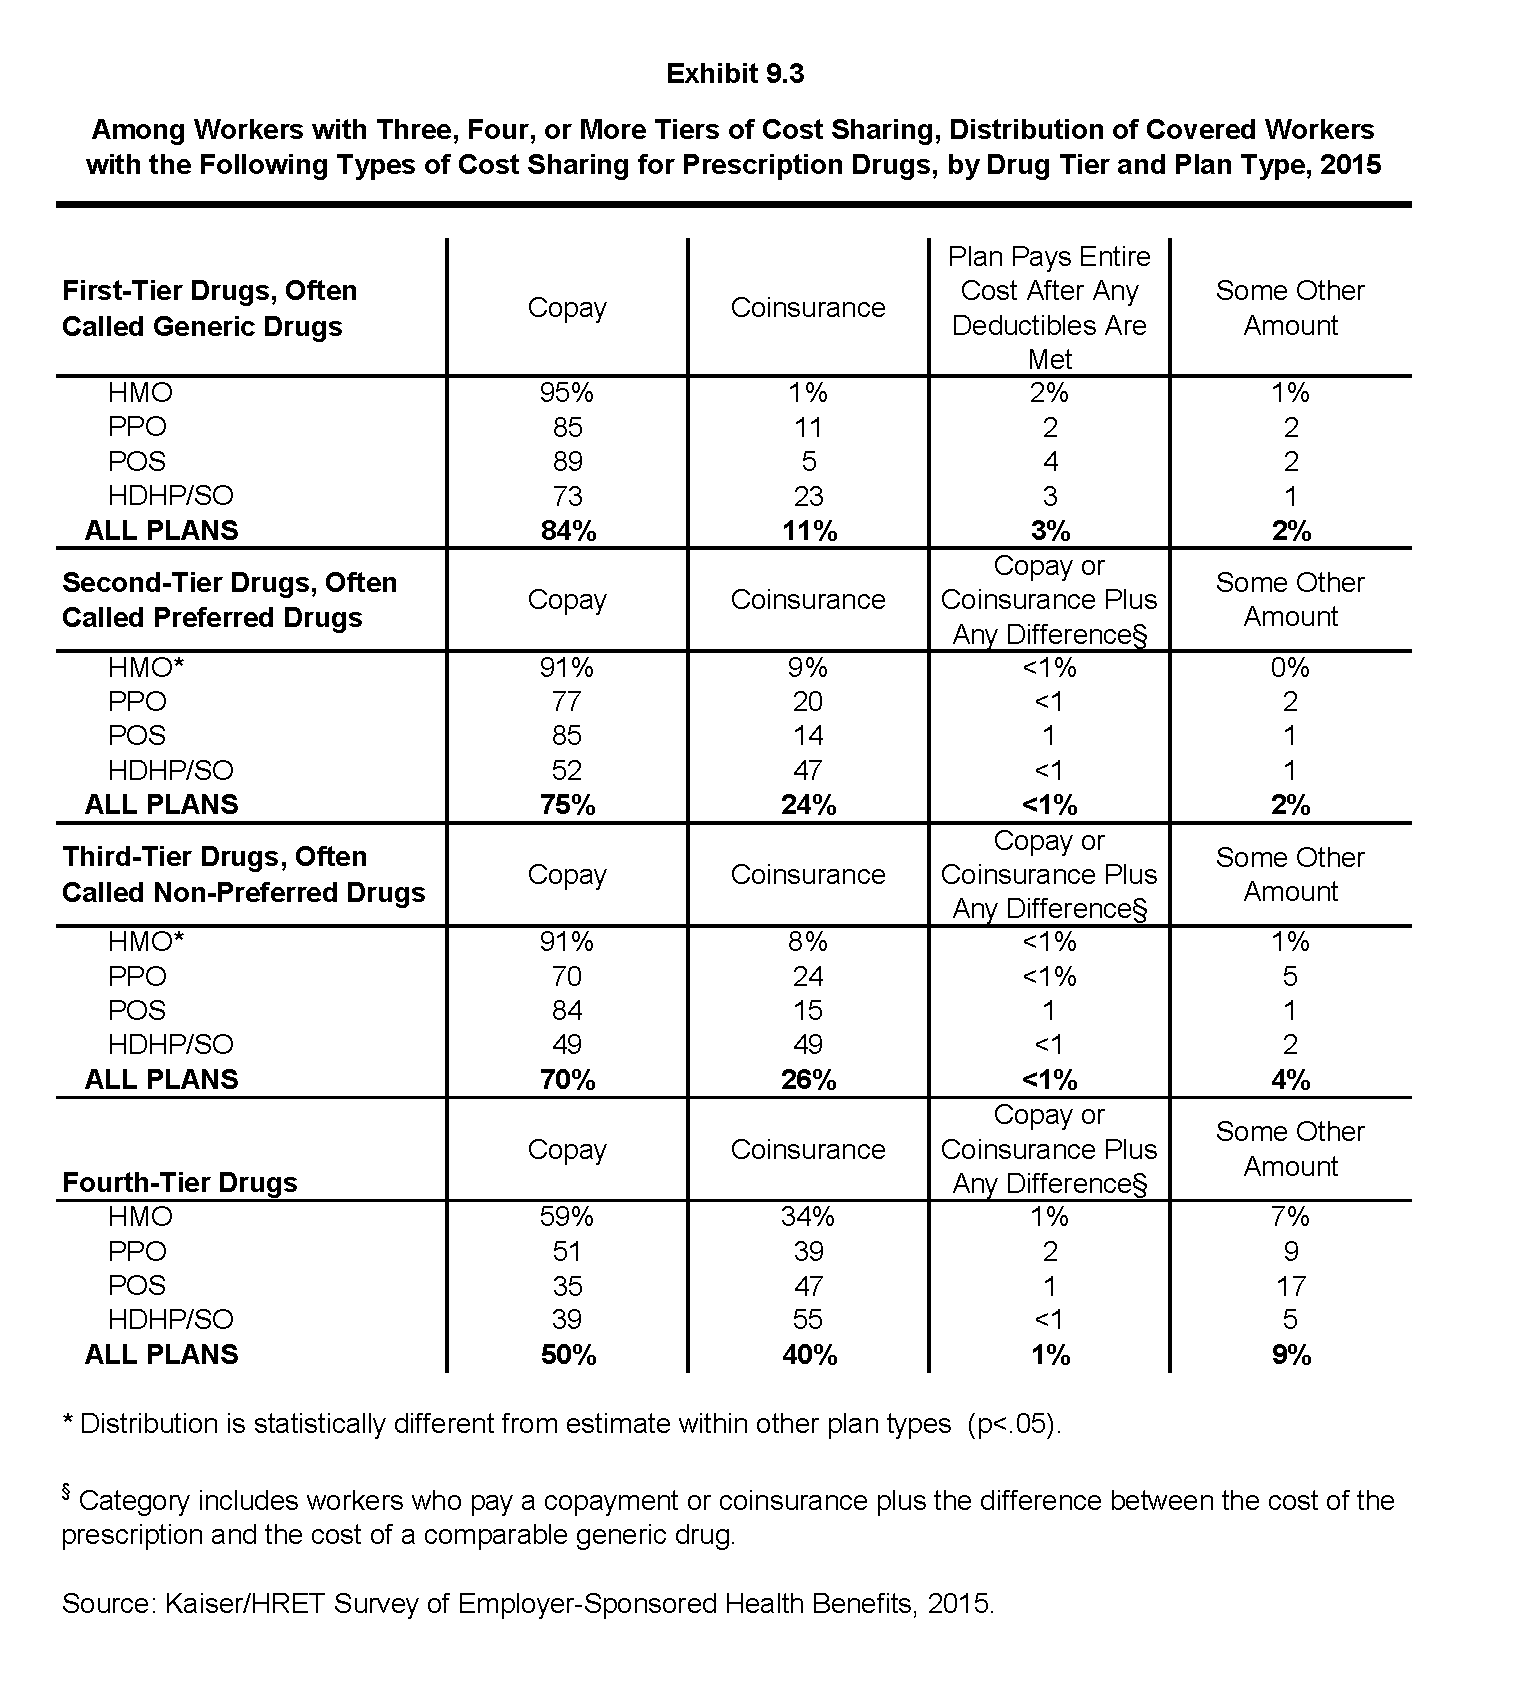
Among Workers with Three, Four, or More Tiers of Cost Sharing, Distribution of Covered Workers with the Following Types of Cost Sharing for Prescription Drugs, by Drug Tier and Plan Type, 2015
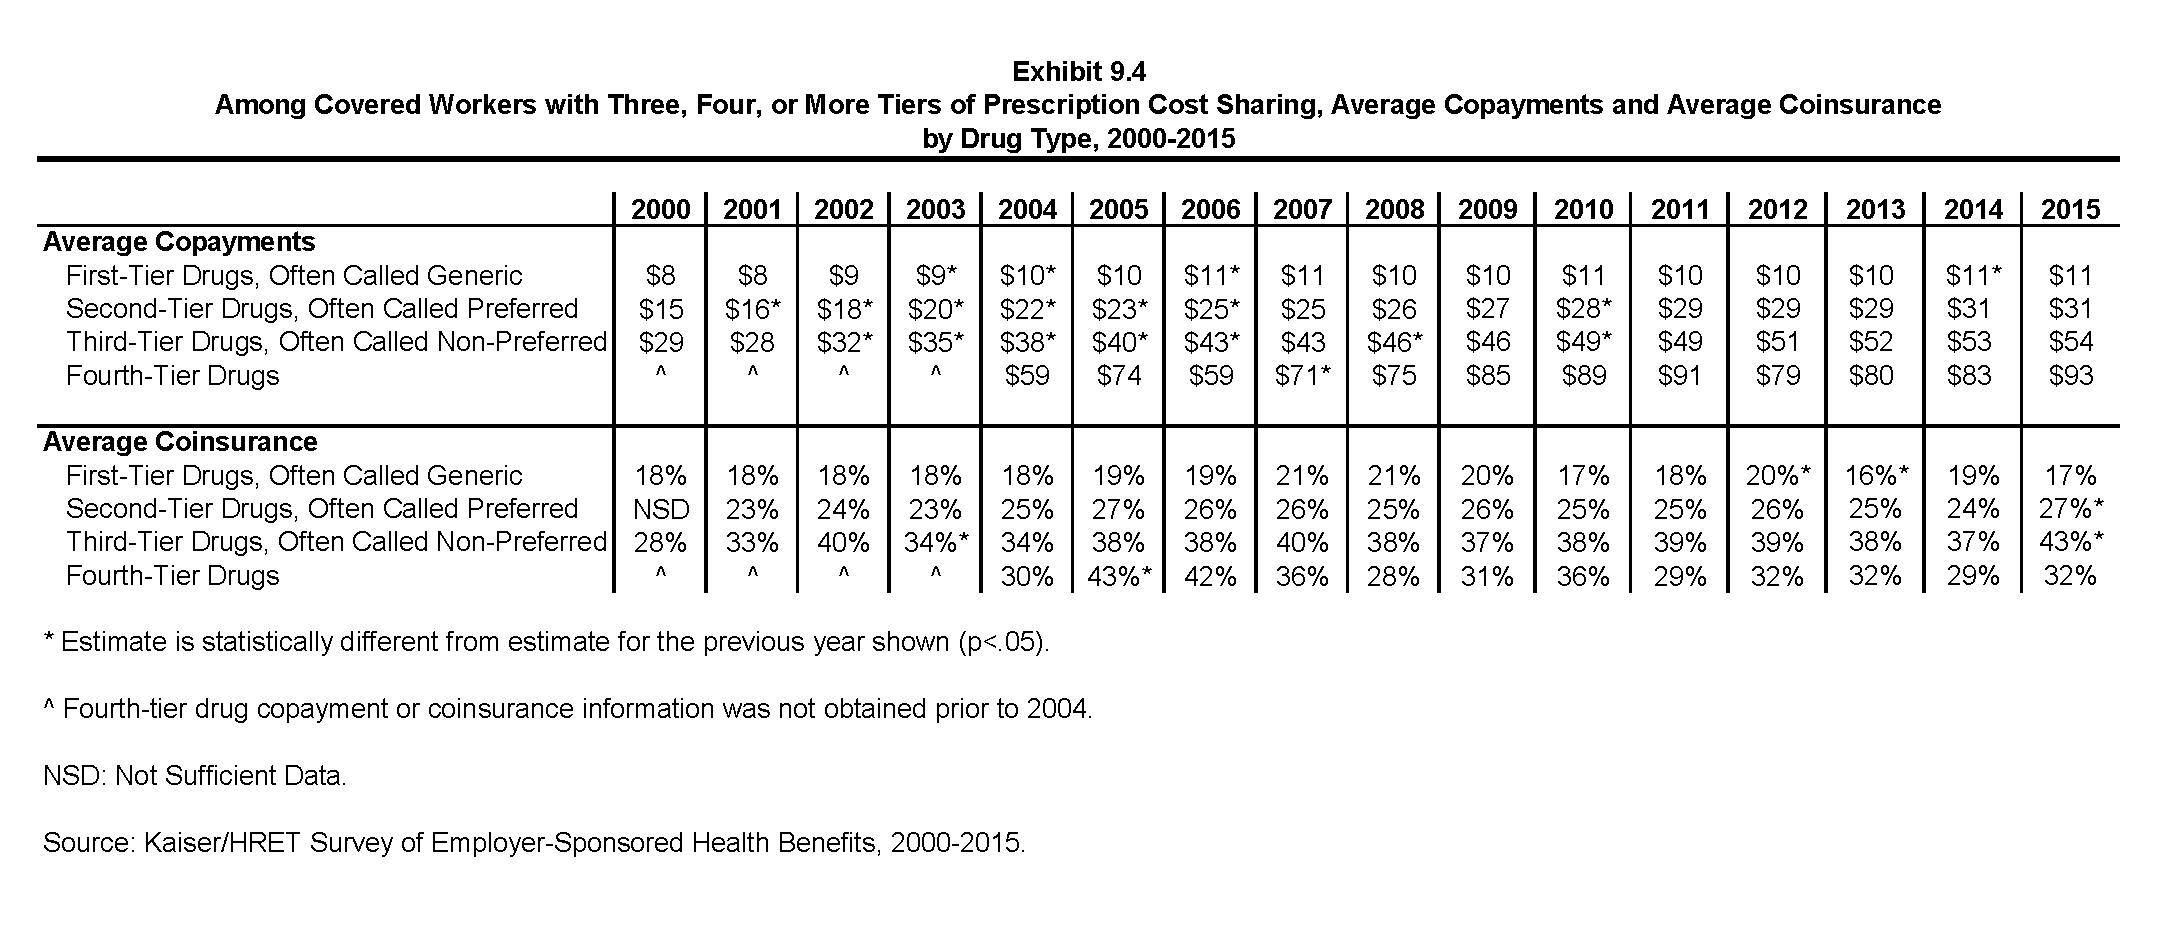
Among Covered Workers with Three, Four, or More Tiers of Prescription Cost Sharing, Average Copayments and Average Coinsurance by Drug Type, 2000-2015

Among Workers with Two Tiers of Cost Sharing for Prescription Drugs, Distribution of Covered Workers with the Following Types of Cost Sharing for Prescription Drugs, by Drug and Plan Type, 2015

Among Covered Workers with Two Tiers of Prescription Cost Sharing, Average Copayments and Average Coinsurance, by Drug Type, 2000-2015
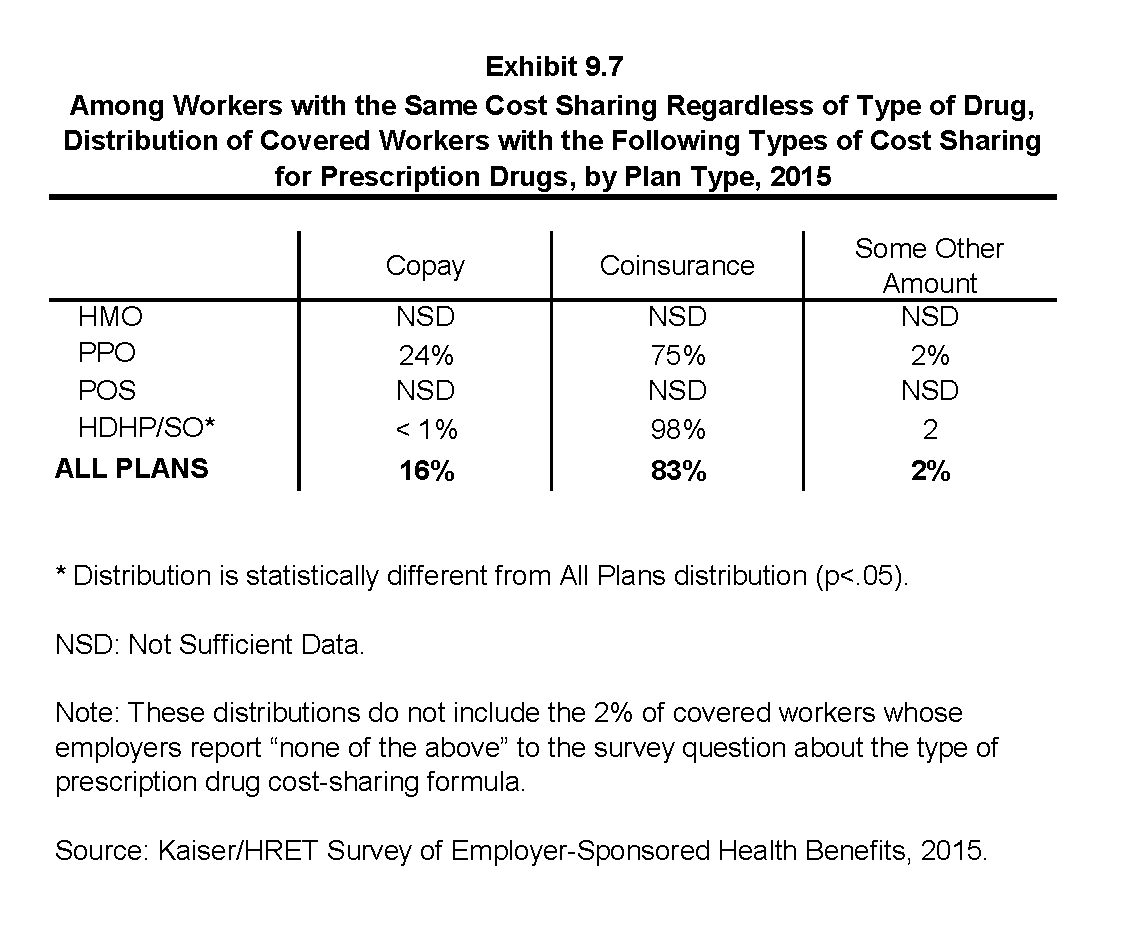
Among Workers with the Same Cost Sharing Regardless of Type of Drug, Distribution of Covered Workers with the Following Types of Cost Sharing for Prescription Drugs, by Plan Type, 2015
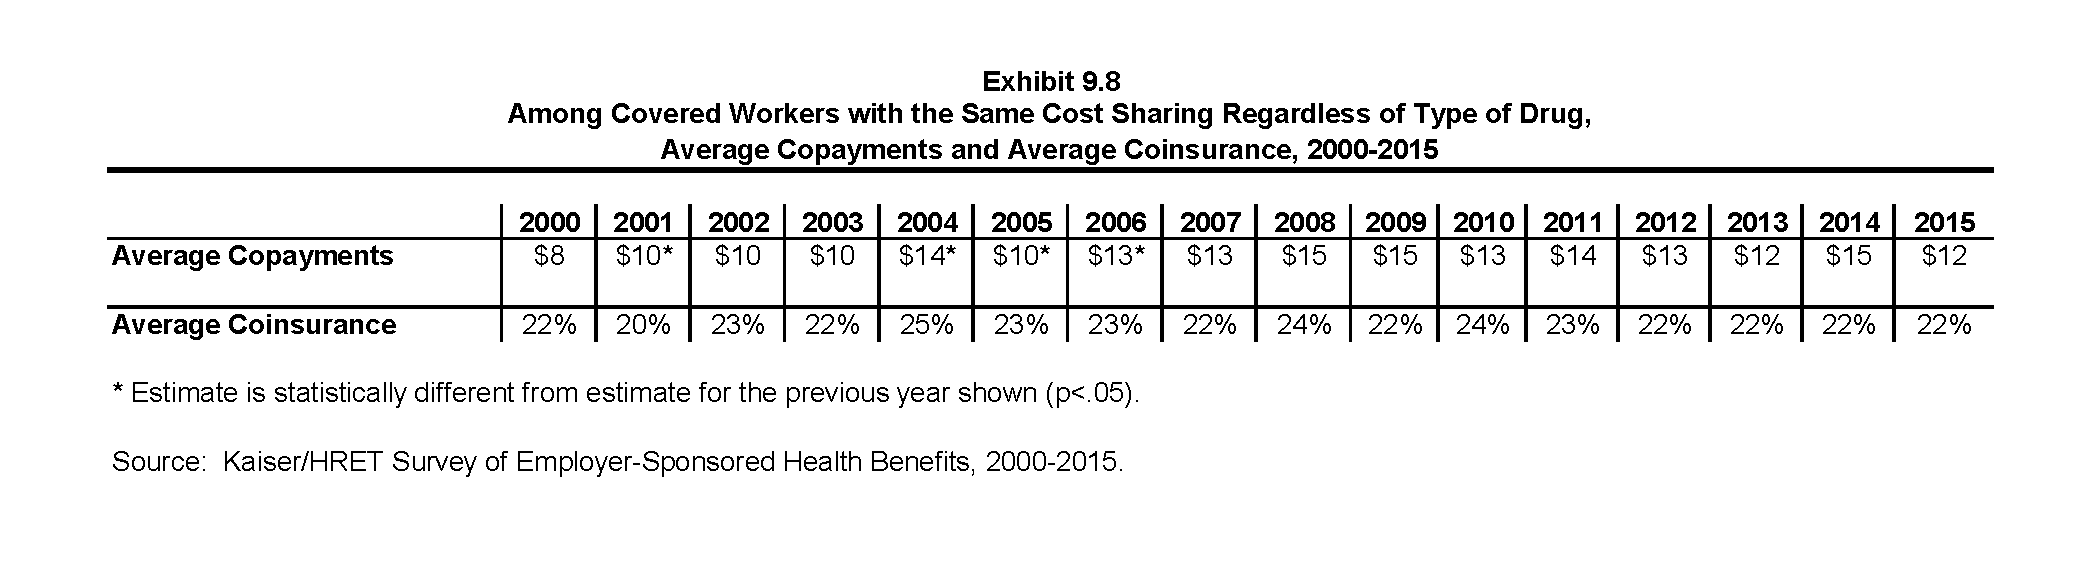
Among Covered Workers with the Same Cost Sharing Regardless of Type of Drug, Average Copayments and Average Coinsurance, 2000-2015
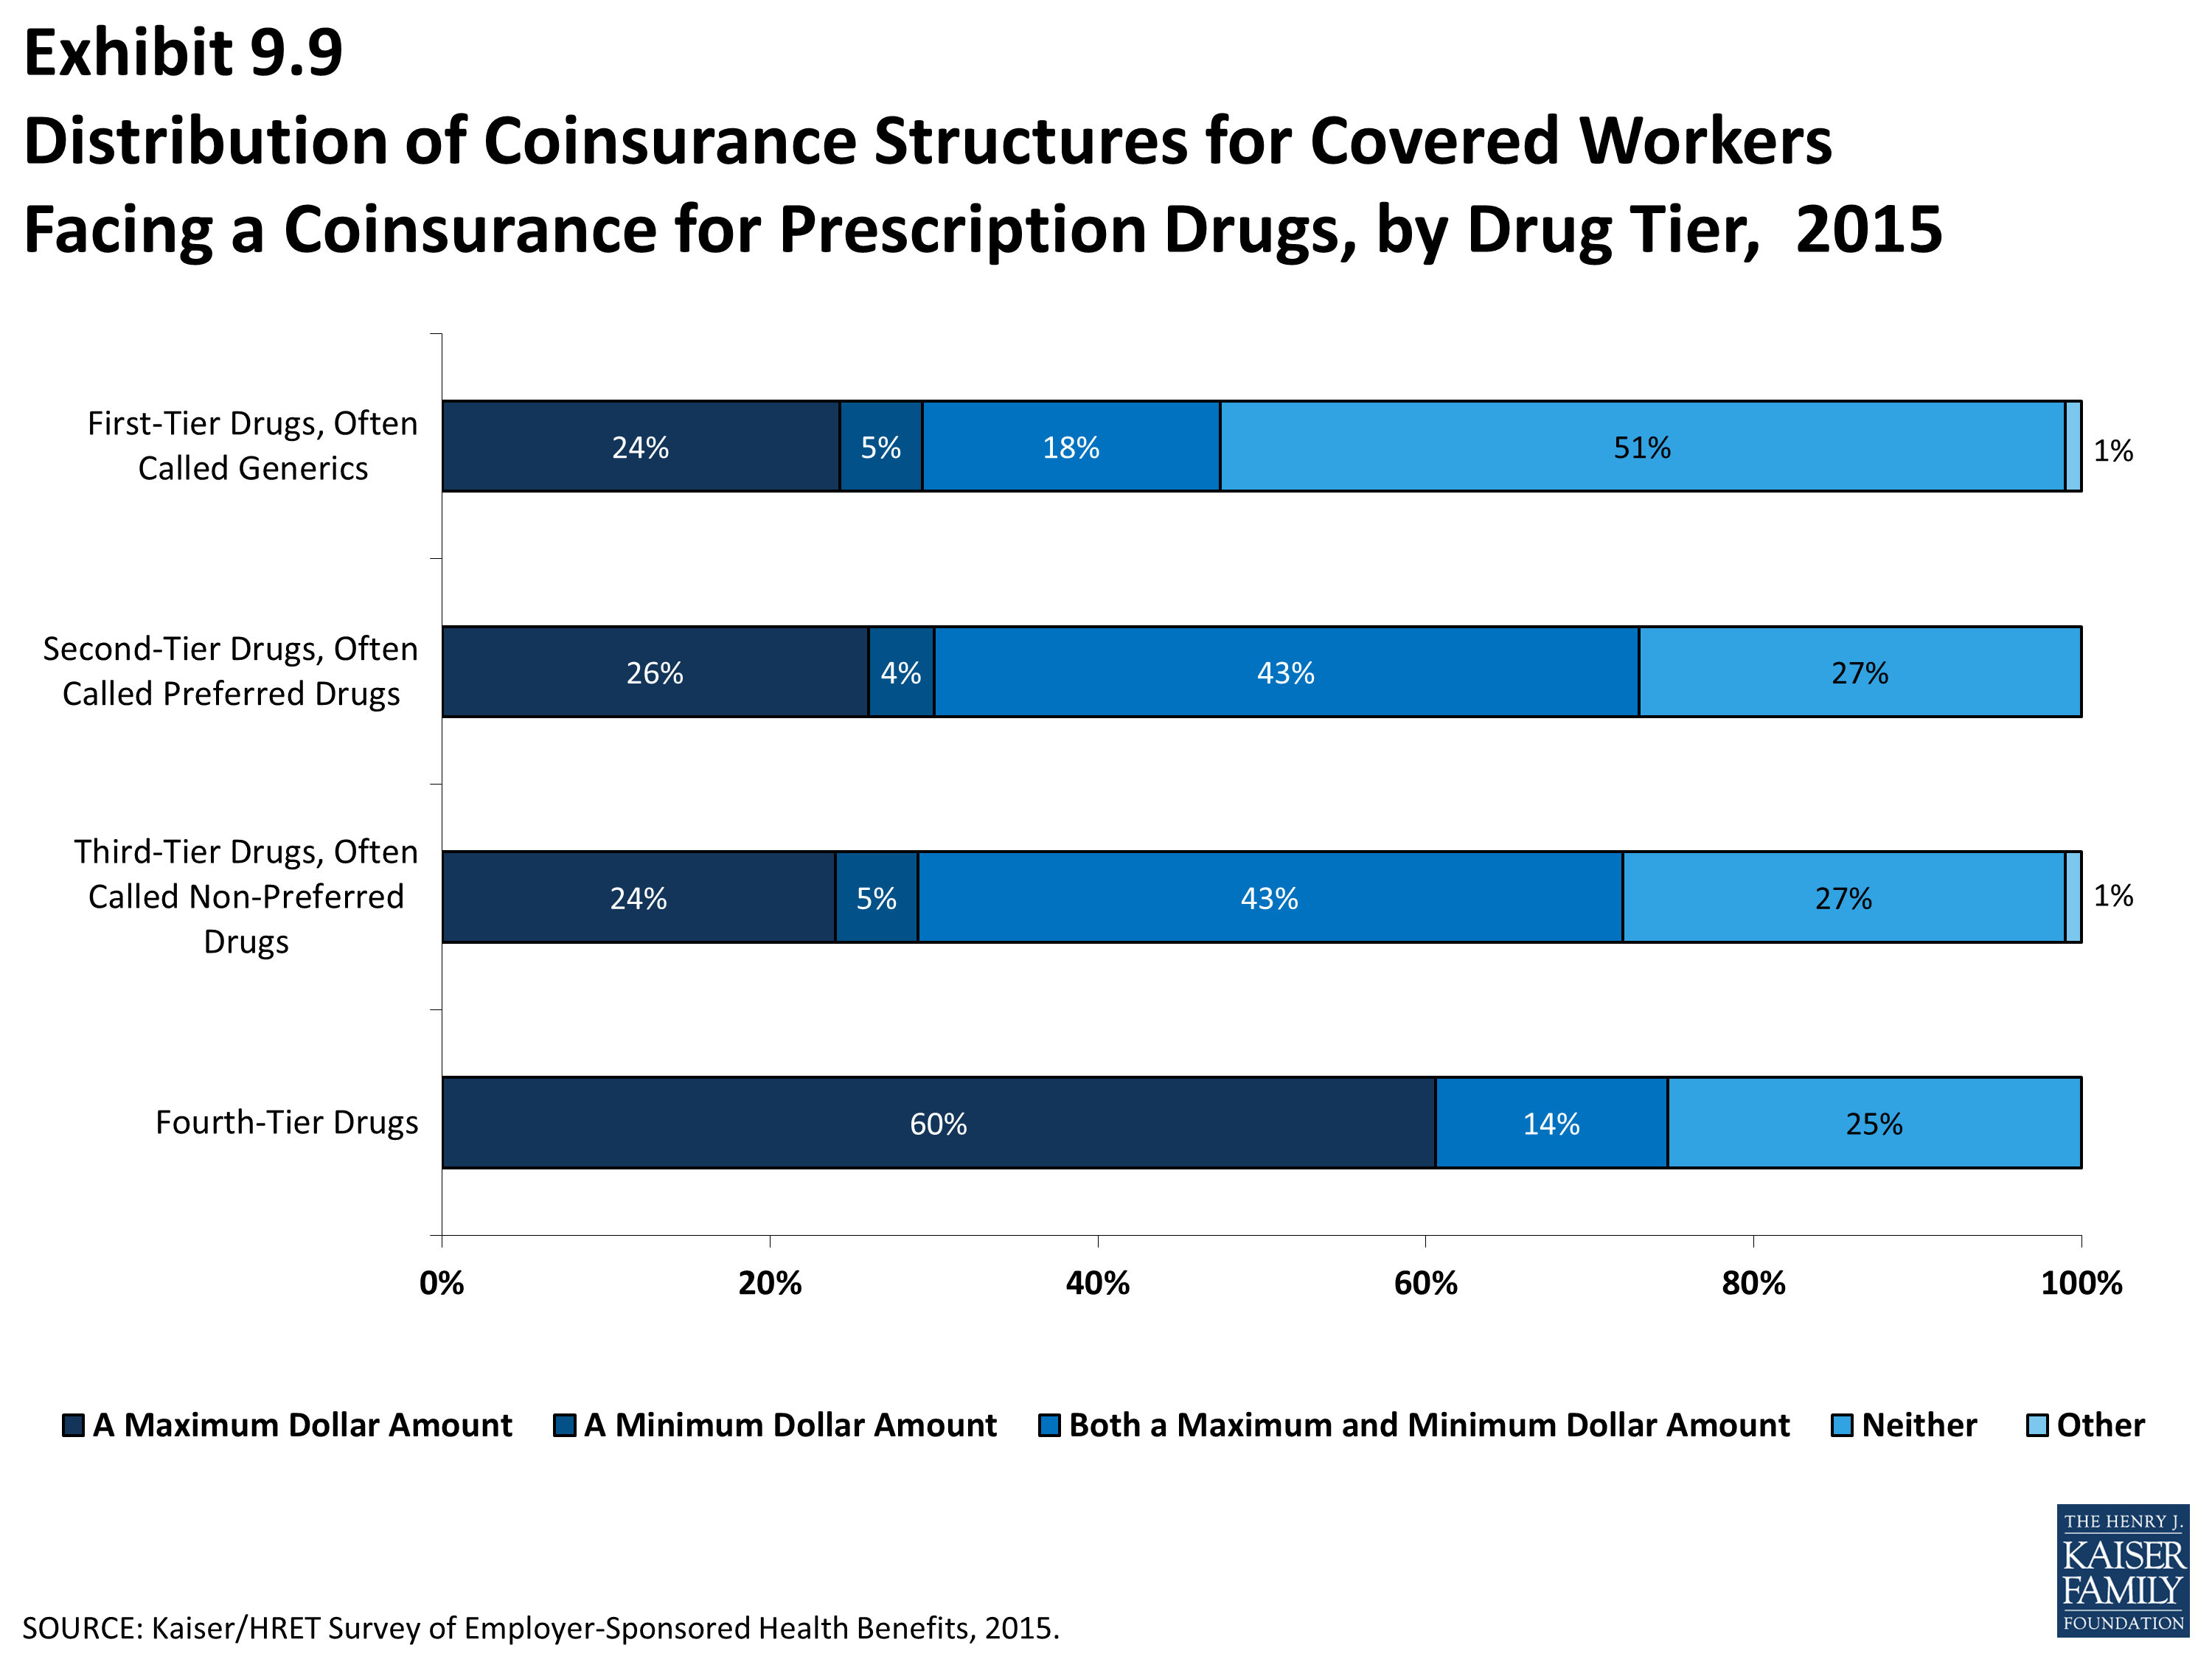
Distribution of Coinsurance Structures for Covered Workers Facing a Coinsurance for Prescription Drugs, by Drug Tier, 2015

Percentage of Covered Workers with Drug Coverage Who Face a Separate Prescription Drug Deductible, by Plan Type, 2005-2015
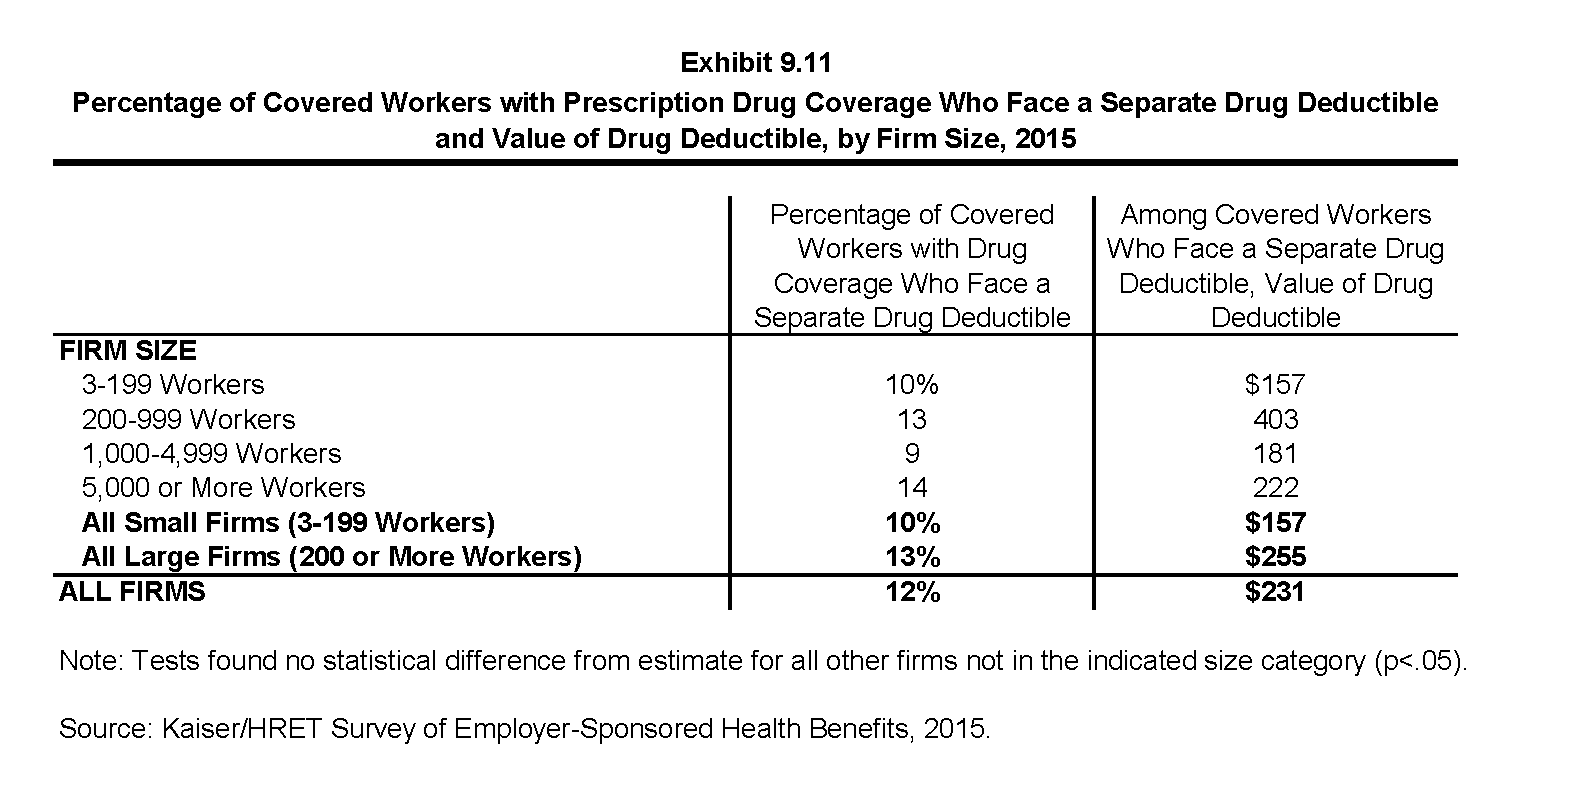
Percentage of Covered Workers with Prescription Drug Coverage Who Face a Separate Drug Deductible and Value of Drug Deductible, by Firm Size, 2015
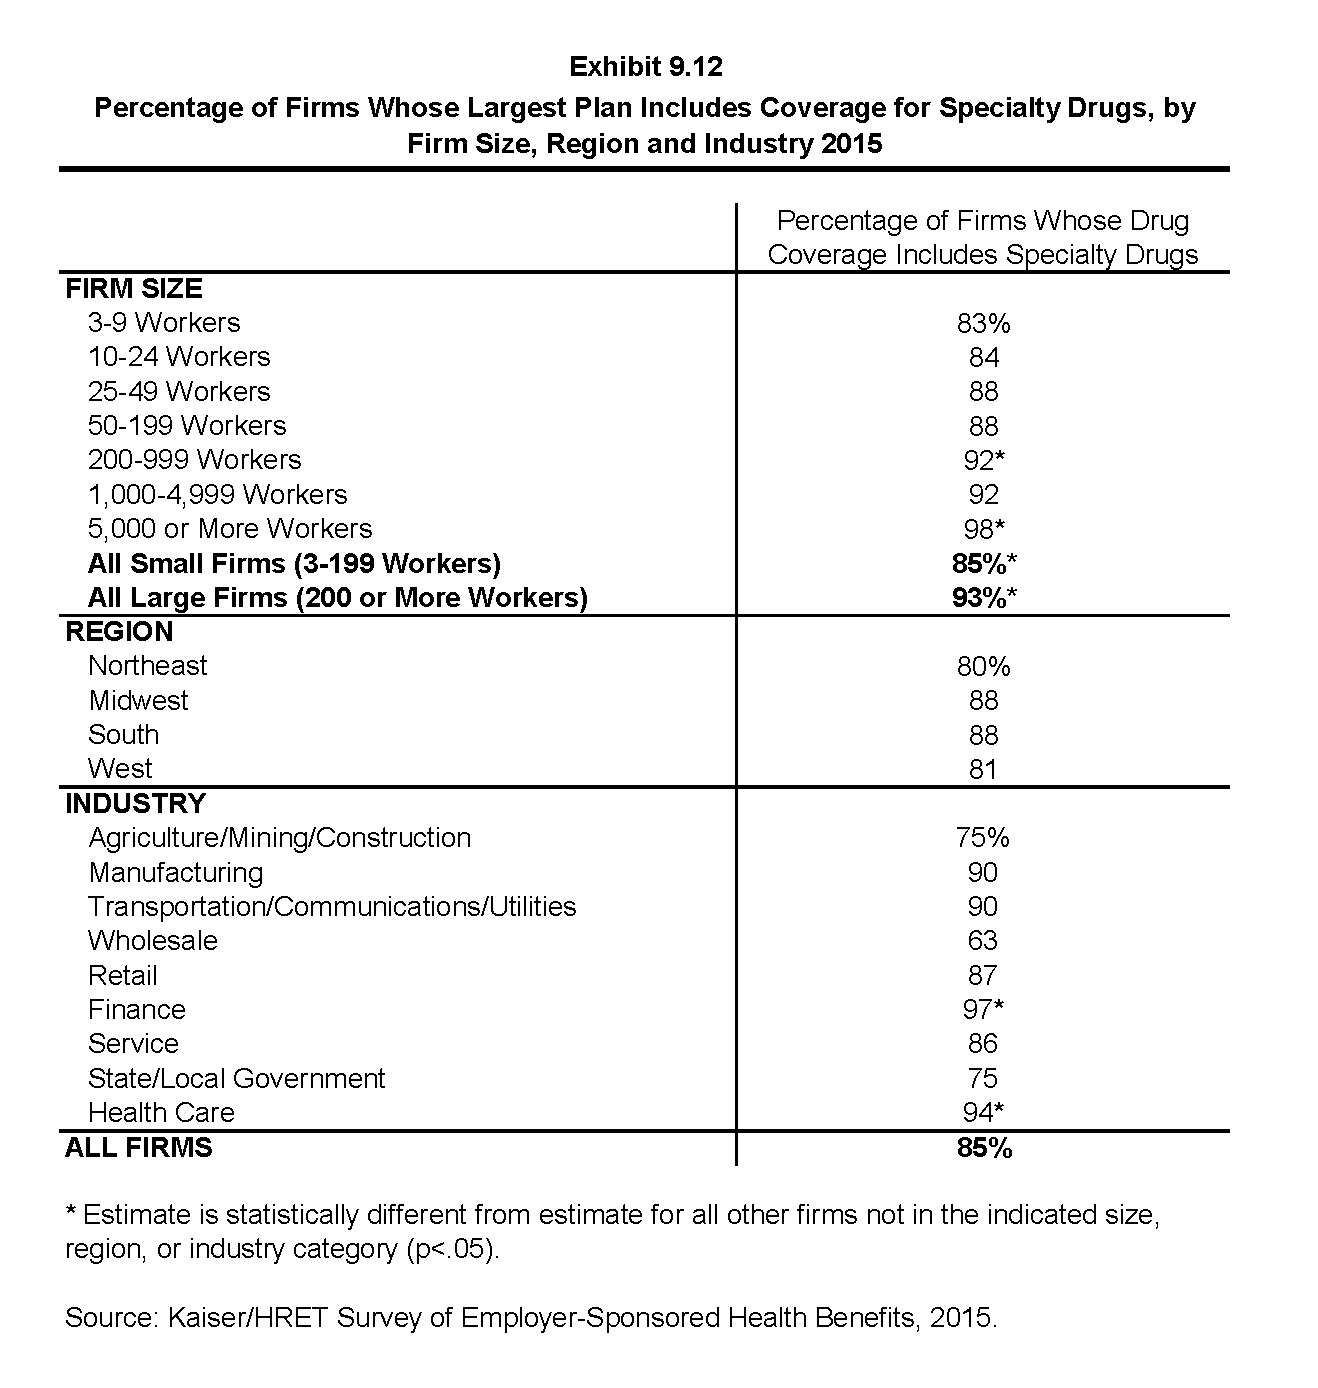
Percentage of Firms Whose Largest Plan Includes Coverage for Specialty Drugs, by Firm Size, Region and Industry 2015
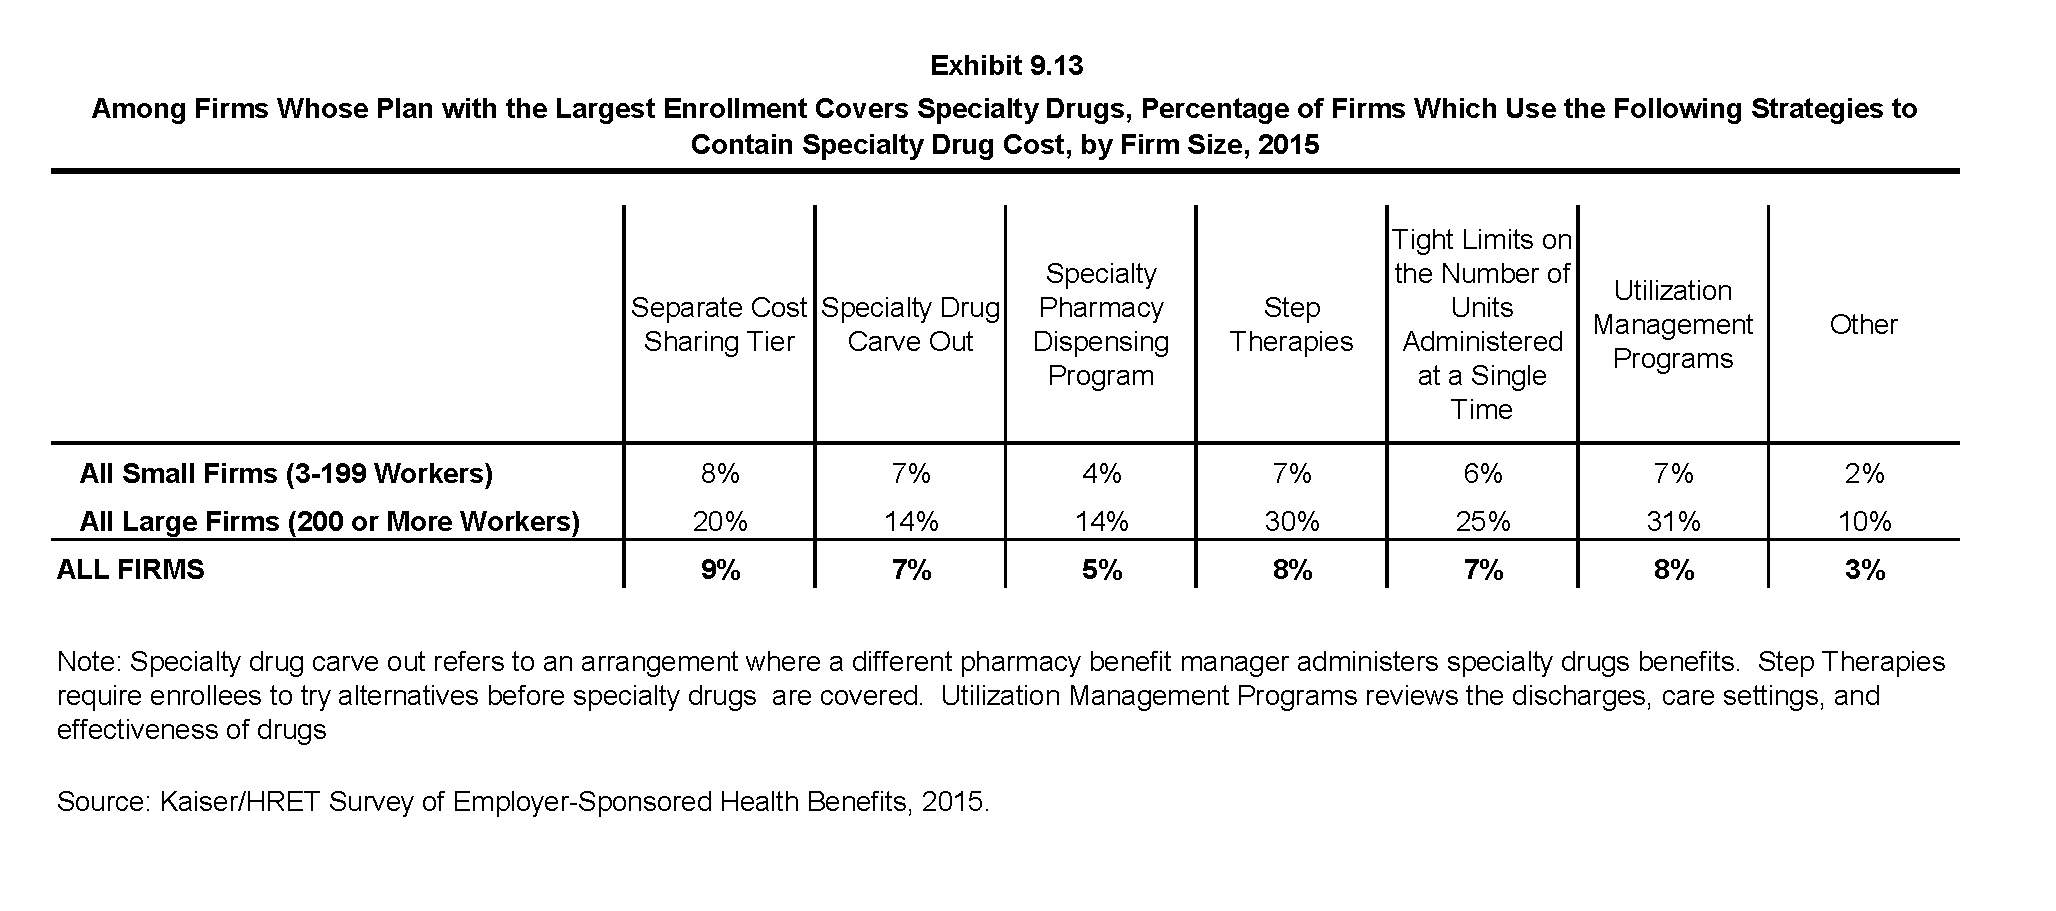
Among Firms Whose Plan with the Largest Enrollment Covers Specialty Drugs, Percentage of Firms Which Use the Following Strategies to Contain Specialty Drug Cost, by Firm Size, 2015
Section Ten: Plan Funding
Federal law (the Employee Retirement Income Security Act of 1974, or ERISA) exempts self-funded plans from most state insurance laws, including reserve requirements, mandated benefits, premium taxes, and consumer protection regulations. Sixty-three percent of covered workers are in a self-funded health plan. Self-funding is common among larger firms because they can spread the risk of costly claims over a large number of employees and dependents. Many self-funded plans use insurance, often called stoploss coverage, to limit the plan sponsor’s liability for very large claims or an unexpected level of expenses. Three in five covered workers in fully or partially self-funded plans are in plans with stoploss protection.
Self-Funded Plan: An insurance arrangement in which the employer assumes direct financial responsibility for the costs of enrollees’ medical claims. Employers sponsoring self-funded plans typically contract with a third-party administrator or insurer to provide administrative services for the self-funded plan. In some cases, the employer may buy stoploss coverage from an insurer to protect the employer against very large claims.
Fully Insured Plan: An insurance arrangement in which the employer contracts with a health plan that assumes financial responsibility for the costs of enrollees’ medical claims.
- Sixty-three percent of covered workers are in a plan that is completely or partially self-funded, similar to last year. The percentage of covered workers who are in a self-funded plan has increased over time from 49% in 2000 and 54% in 2005. In recent years, the percentage of covered workers enrolled in a self-funded plan has remained steady: 59% of covered workers were in such an arrangement in 2010; similar to 63% in 2015 (Exhibit 10.1).
- The percentage of covered workers enrolled in self-funded plans has been stable in recent years in both small firms (3-199 workers) and large firms (Exhibit 10.2).
- The percentage of covered workers in self-funded plans differs by plan type: 70% of covered workers in PPOs, 68% in HDHP/SOs, 38% in HMOs, and 36% in POS plans are in a self-funded plan. The share of covered workers in self-funded HDHP/SOs increased from 60% to 68% in the last year (Exhibit 10.3).
- As expected, covered workers in large firms (200 or more workers) are significantly more likely to be in a self-funded plan than covered workers in small firms (3-199 workers) (83% vs. 17%). The percentage of covered workers in self-funded plans increases as the number of employees in a firm increases. Eighty-two percent of covered workers in firms with 1,000 to 4,999 workers and 94% of covered workers in firms with 5,000 or more workers are in self-funded plans in 2015 (Exhibit 10.4).
Stoploss Coverage and Attachment Points
- Sixty percent of workers in self-funded health plans are in plans that have stoploss insurance (Exhibit 10.10). Stoploss coverage limits the amount that a plan sponsor has to pay in claims. Stoploss coverage may limit the amount of claims that must be paid for each employee or may limit the total amount the plan sponsor must pay for all claims over the plan year.
- The percentage of workers in self-funded health plans with stoploss insurance is unchanged from 2011, when the survey first asked about stoploss insurance (58% in 2011 and 60% in 2015).
- Ninety-two percent of covered workers in self-funded plans that have stoploss protection are in plans where the stoploss insurance limits the amount that the plan must spend on each employee (Exhibit 10.11). This includes stoploss insurance plans that limit a firm’s per-employee spending and plans that limit both a firm’s overall spending and per-employee spending.
- Firms with per-enrollee stoploss coverage were asked for the dollar amount where the stoploss coverage would start to pay for most or all of the claim (called an attachment point). The average attachment point in firms with 3-199 workers is about $210,000. For large firms (200 or more workers) with a per-person limit, the average attachment point is about $340,000 (Exhibit 10.11).
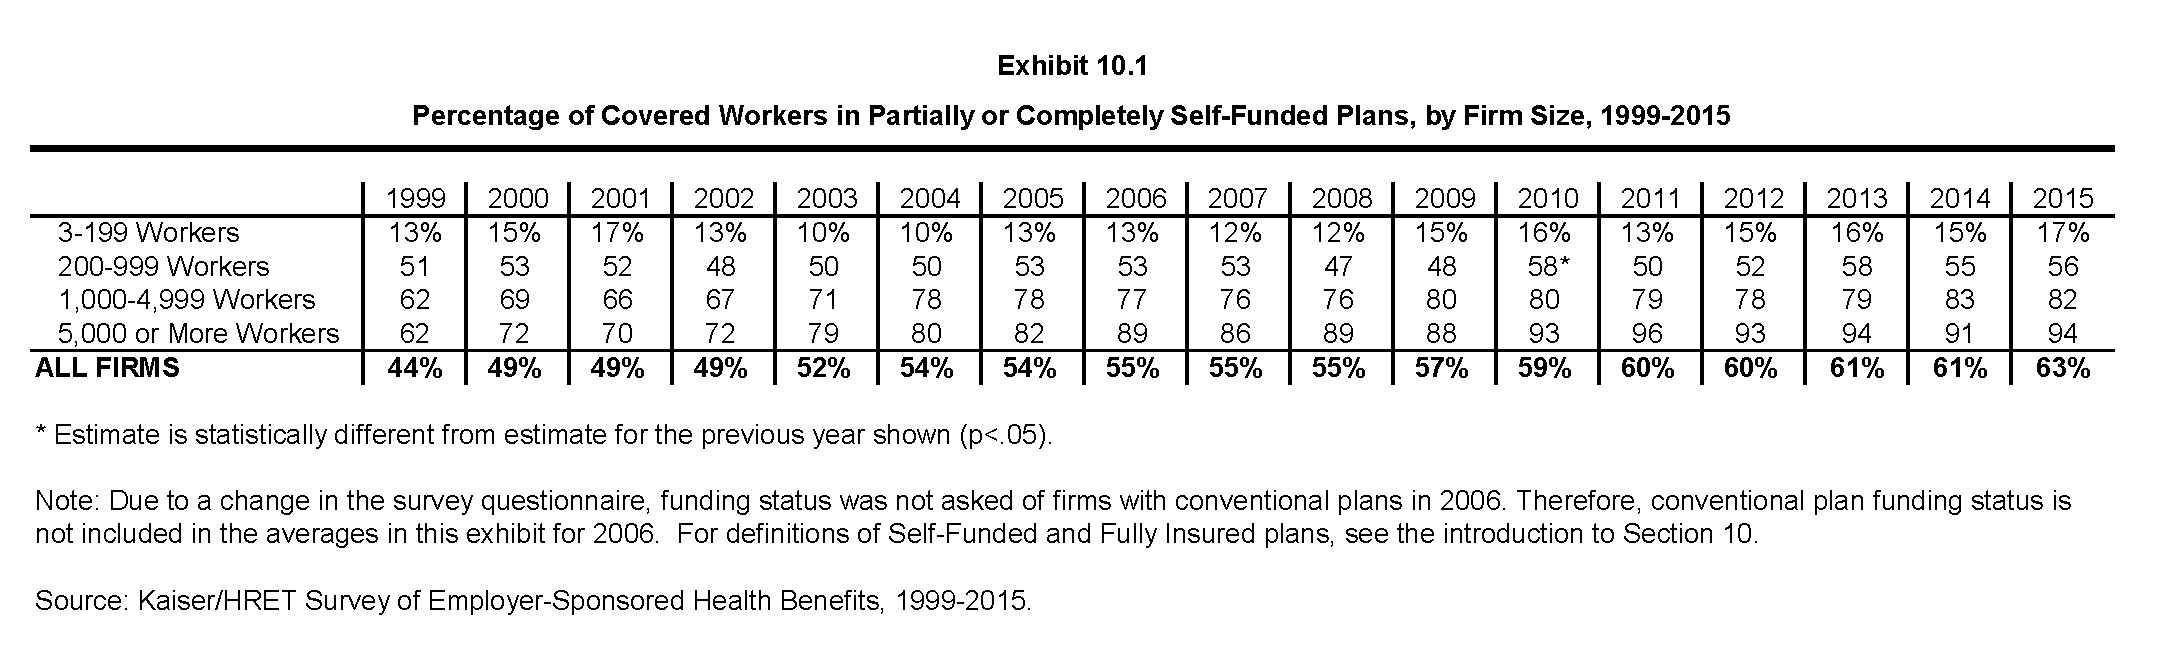
Percentage of Covered Workers in Partially or Completely Self-Funded Plans, by Firm Size, 1999-2015
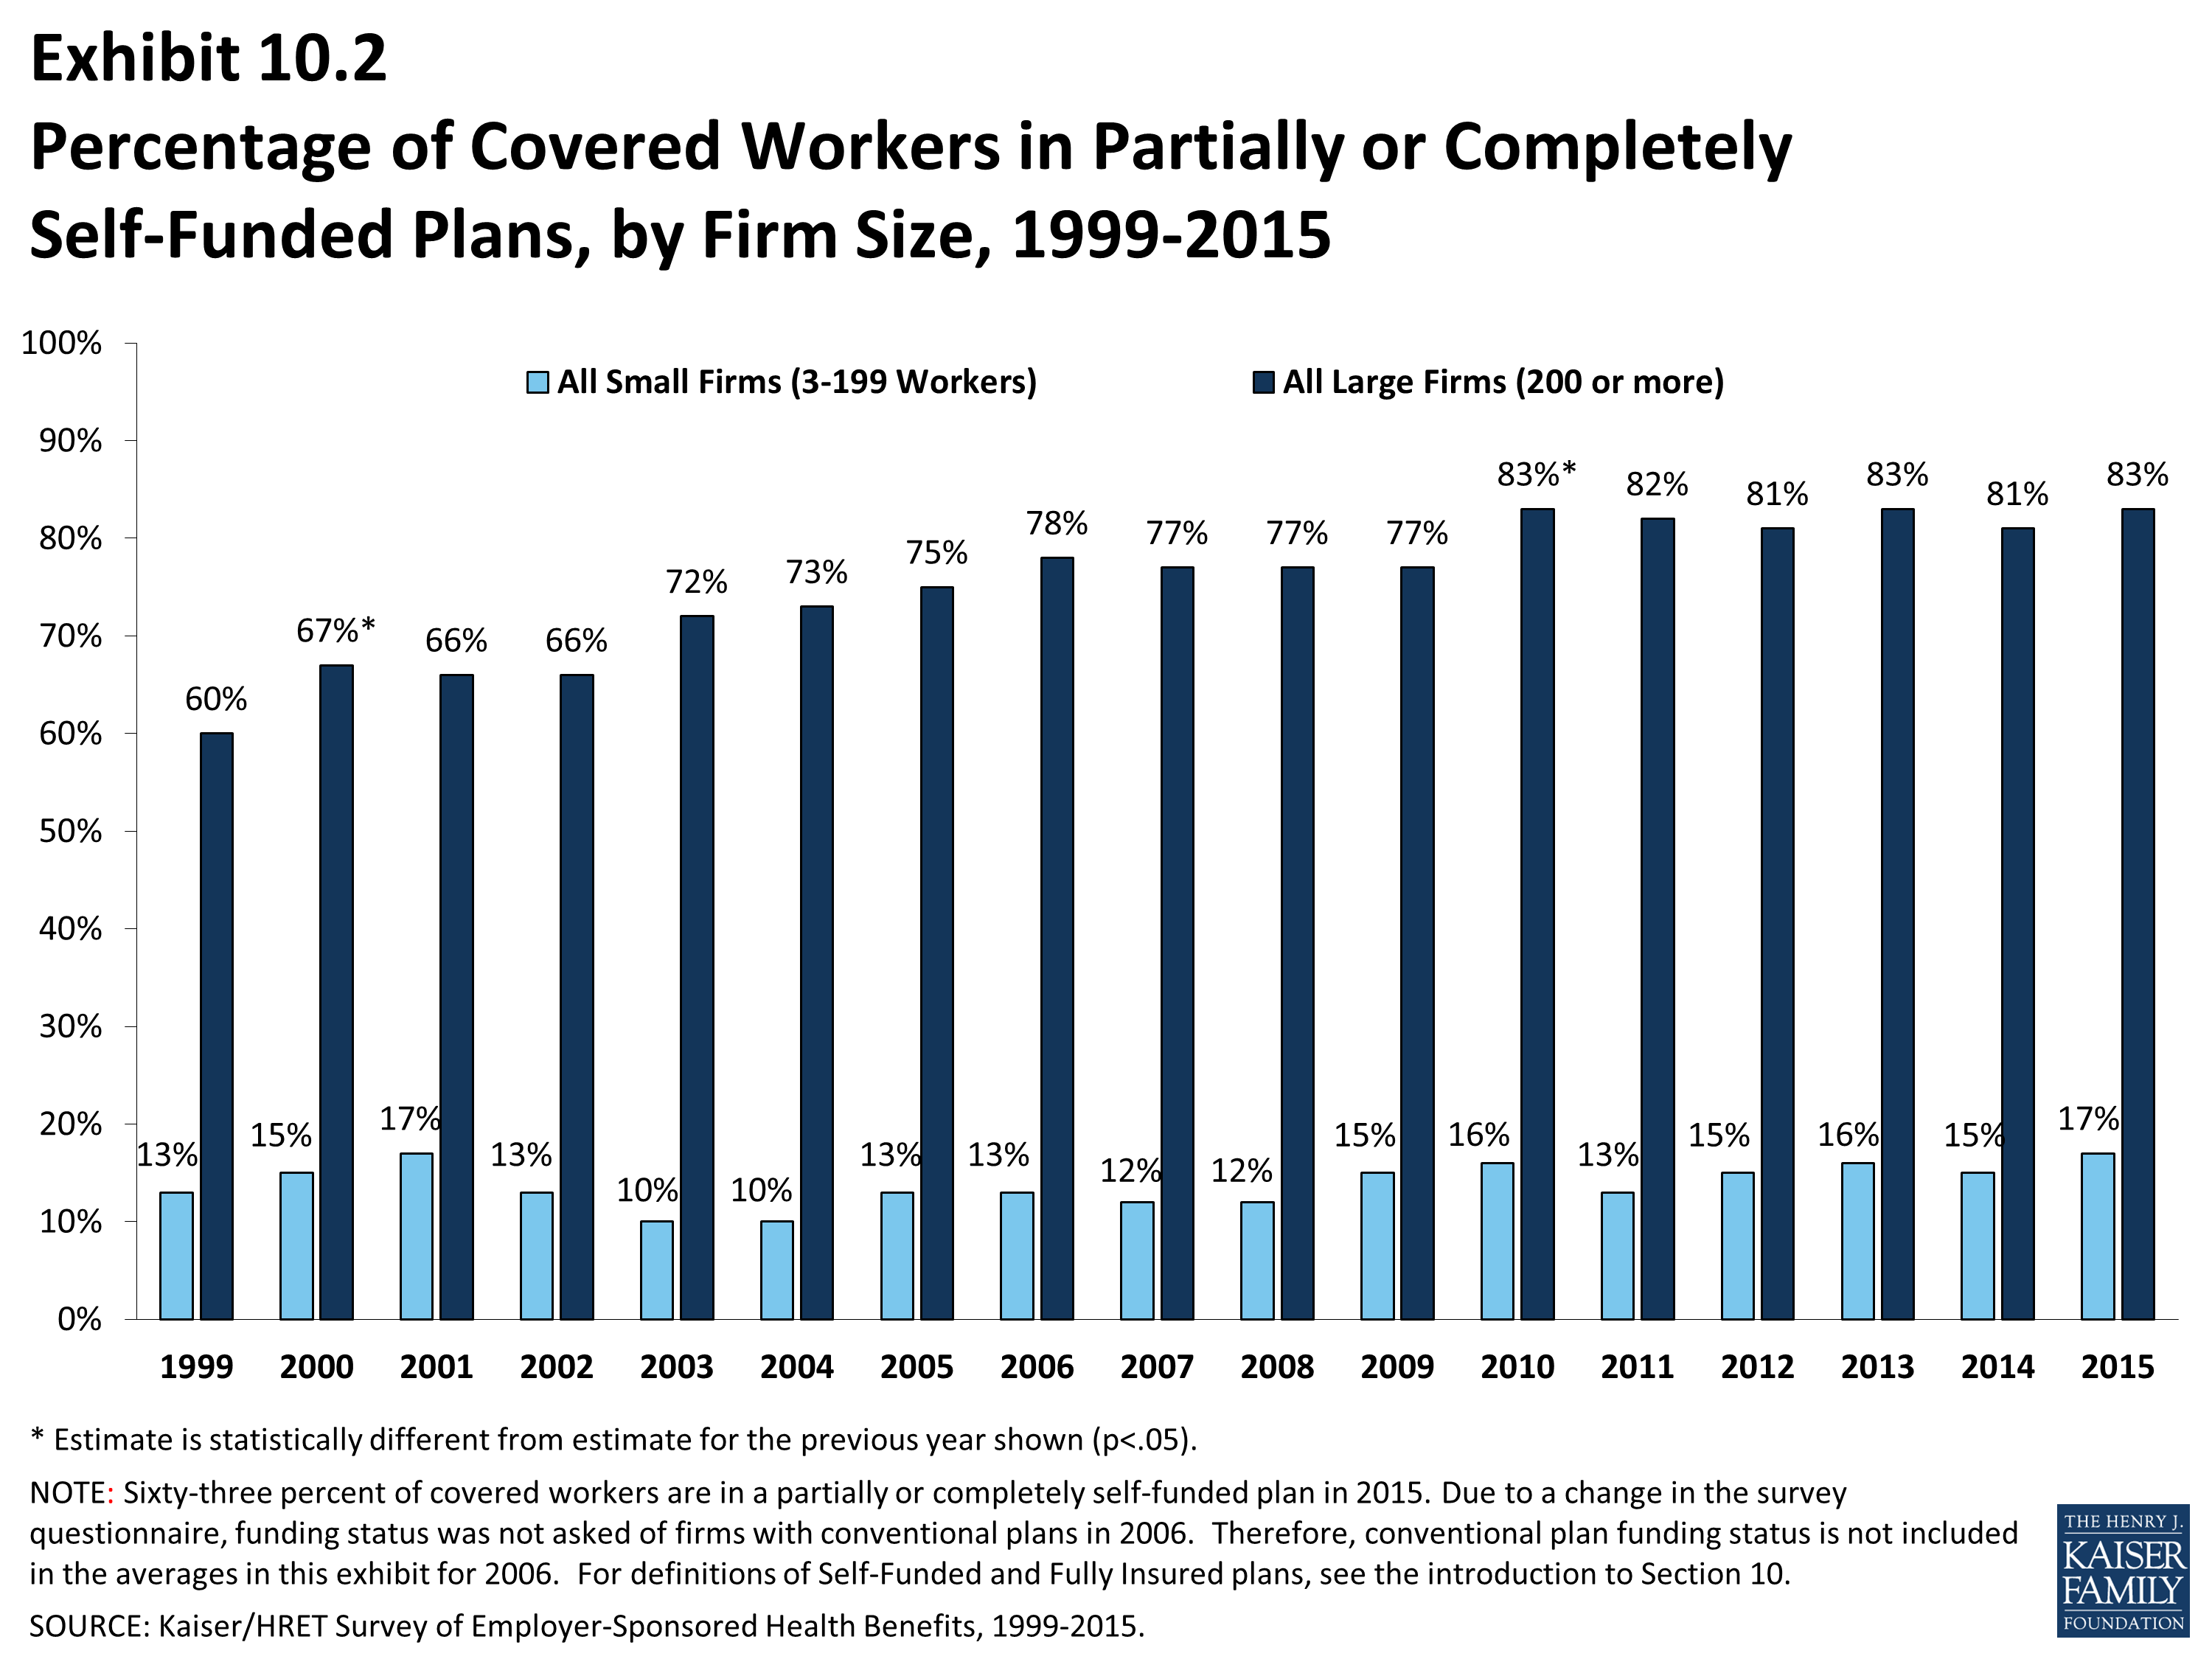
Percentage of Covered Workers in Partially or Completely Self-Funded Plans, by Firm Size, 1999-2015
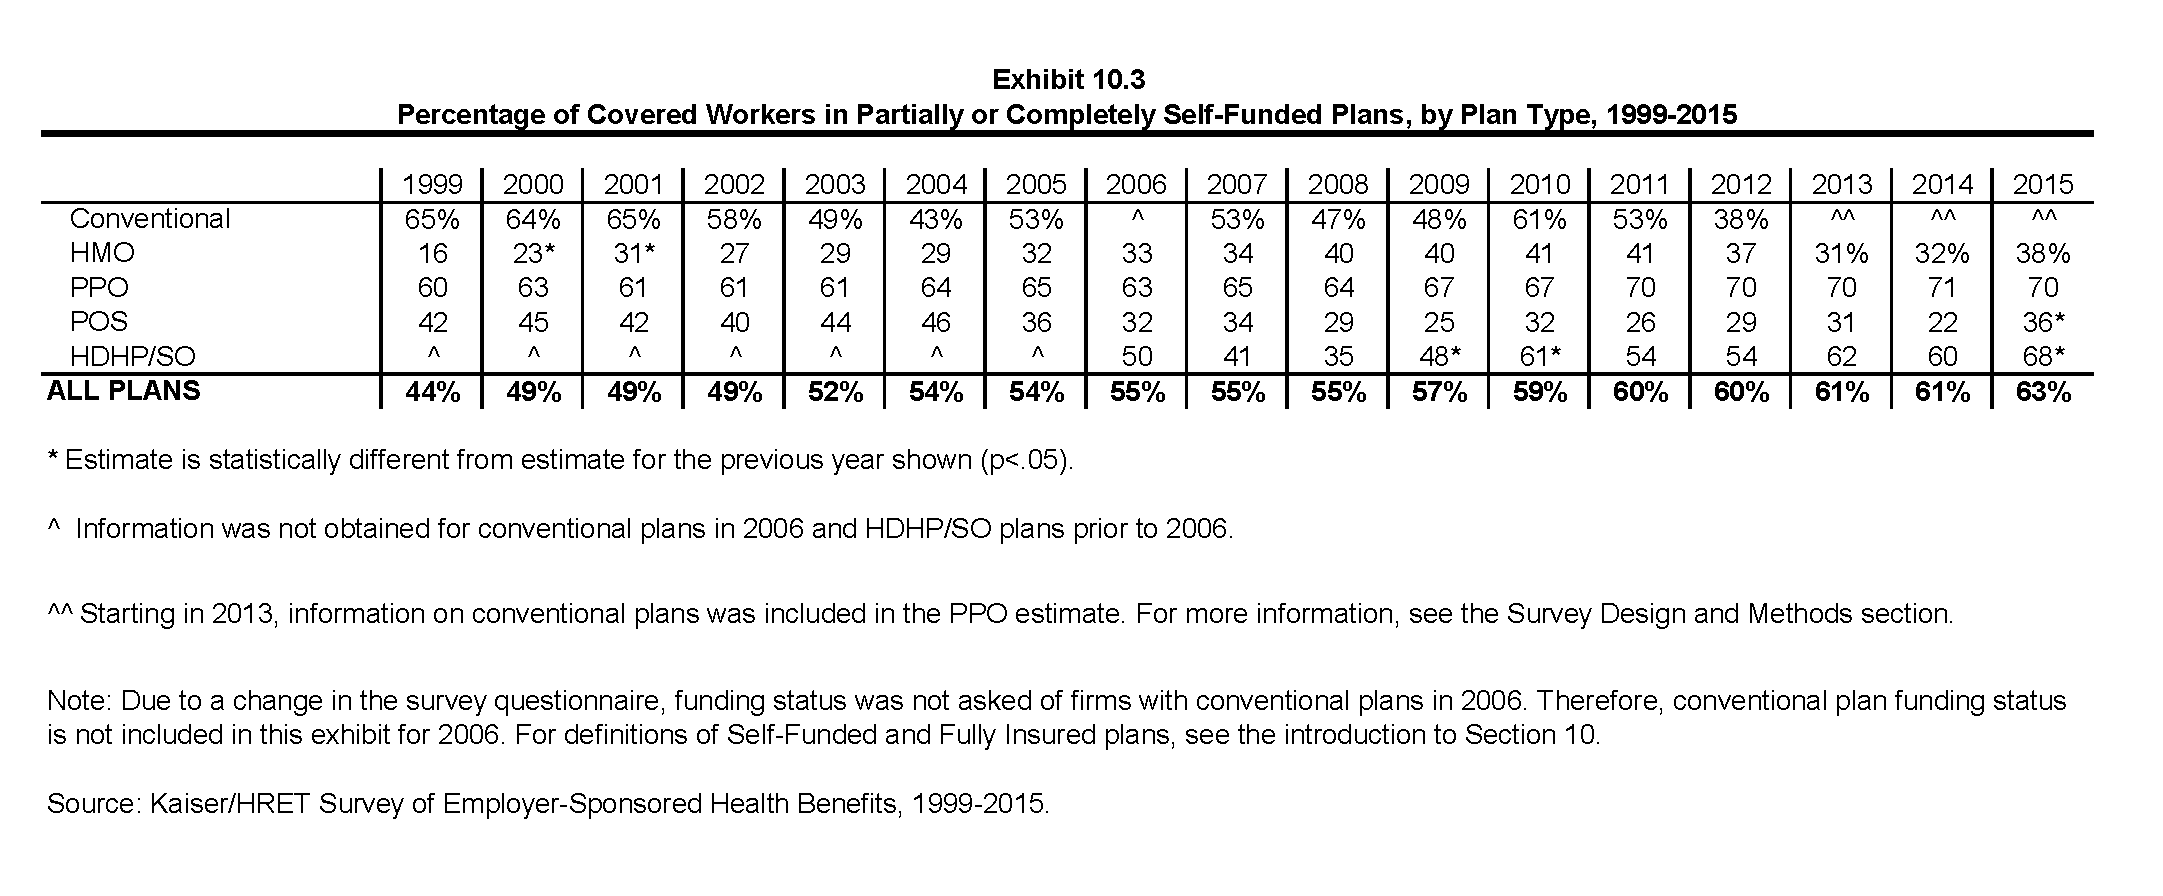
Percentage of Covered Workers in Partially or Completely Self-Funded Plans, by Plan Type, 1999-2015
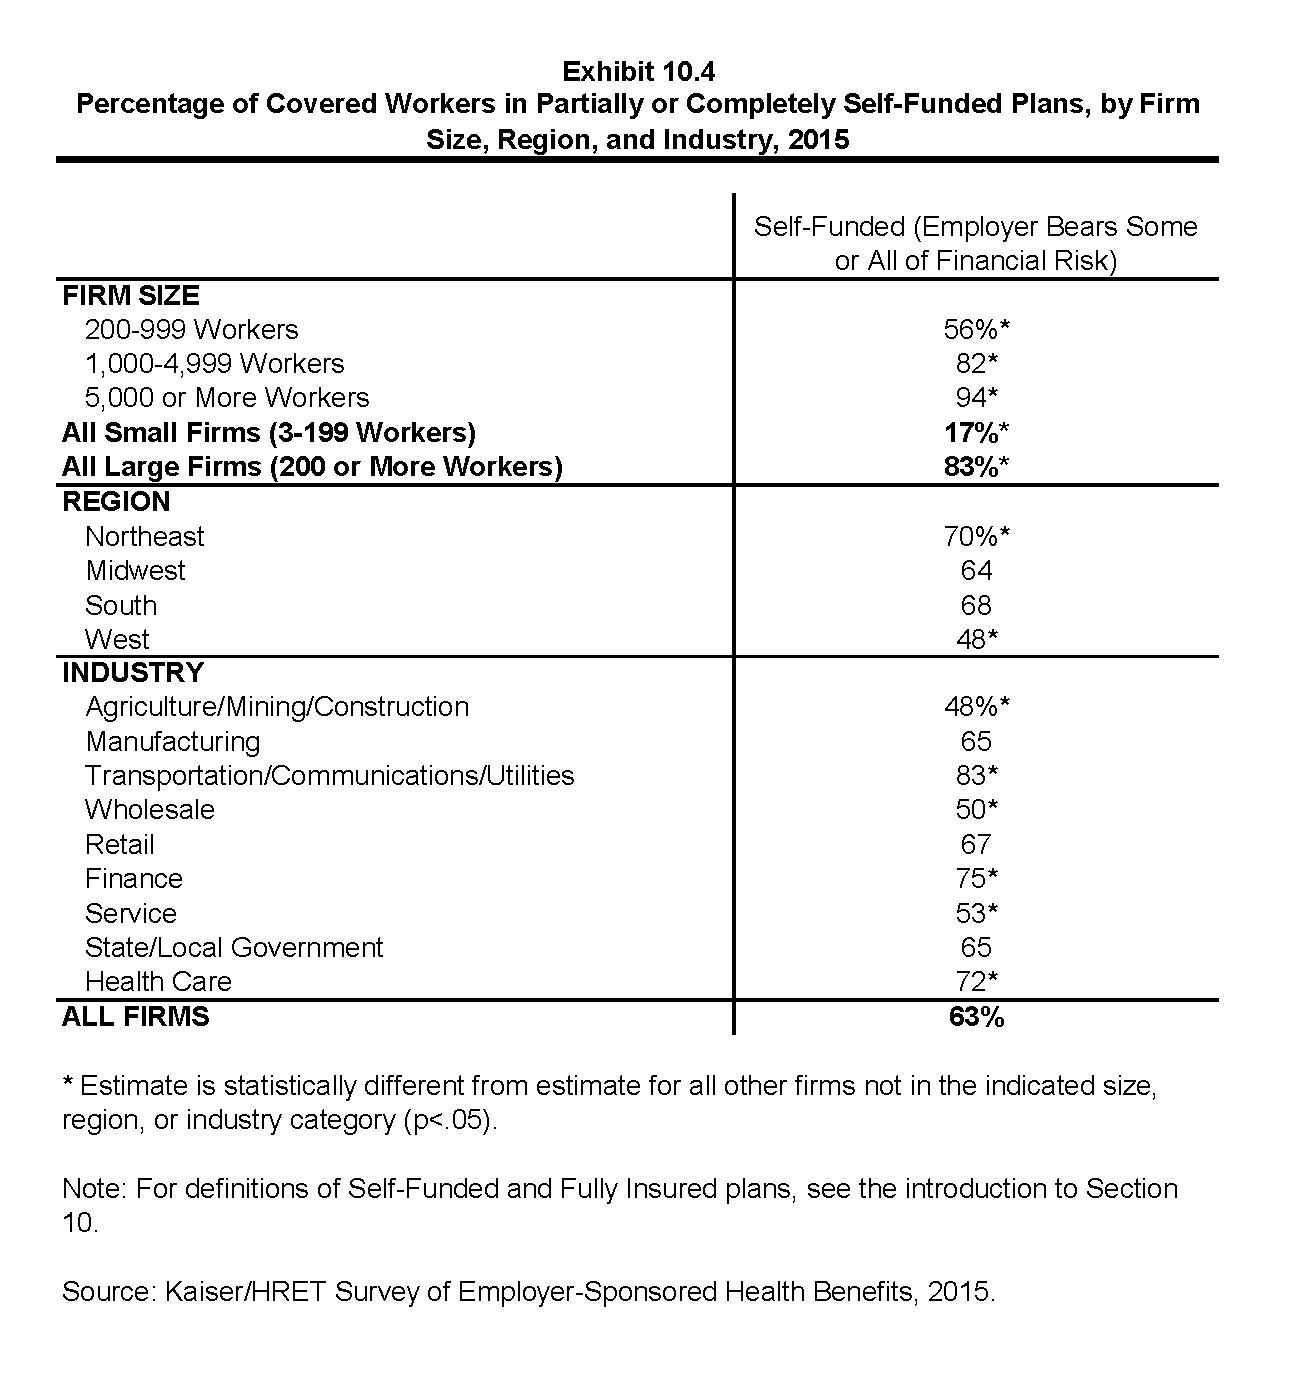
Percentage of Covered Workers in Partially or Completely Self-Funded Plans, by Firm Size, Region, and Industry, 2015
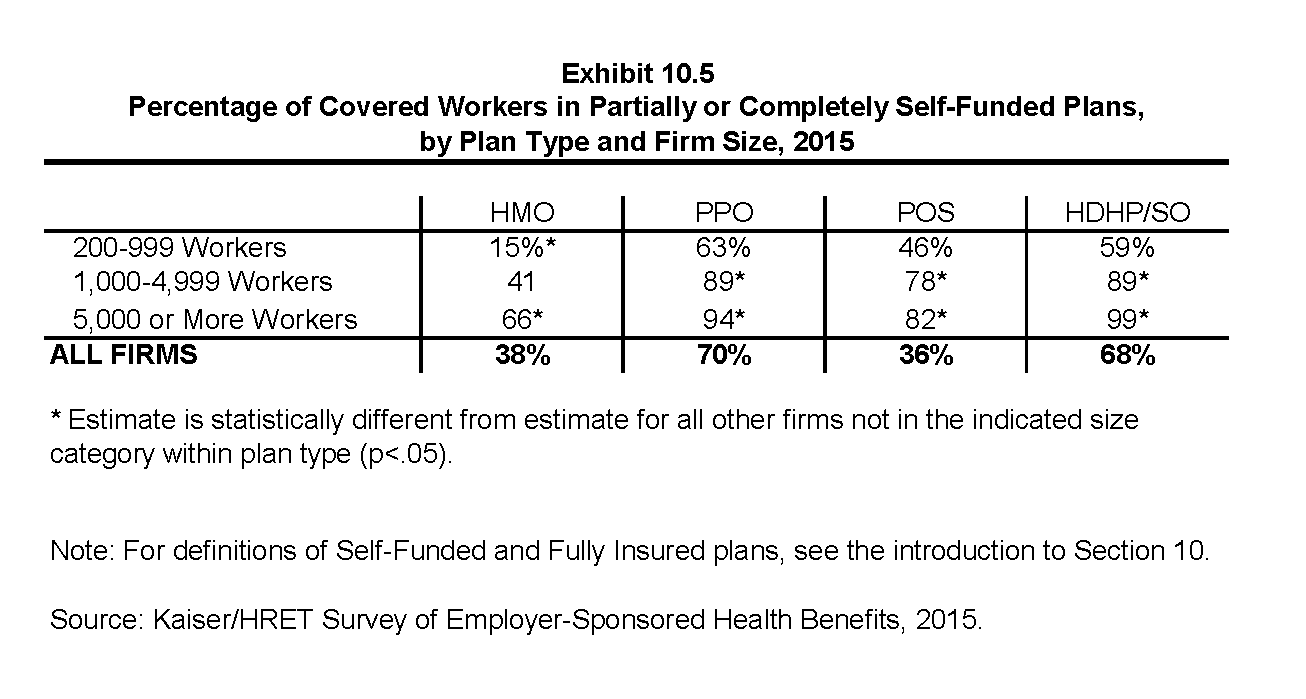
Percentage of Covered Workers in Partially or Completely Self-Funded Plans, by Plan Type and Firm Size, 2015

Percentage of Covered Workers in Partially or Completely Self-Funded HMO Plans, by Firm Size, 1999-2015
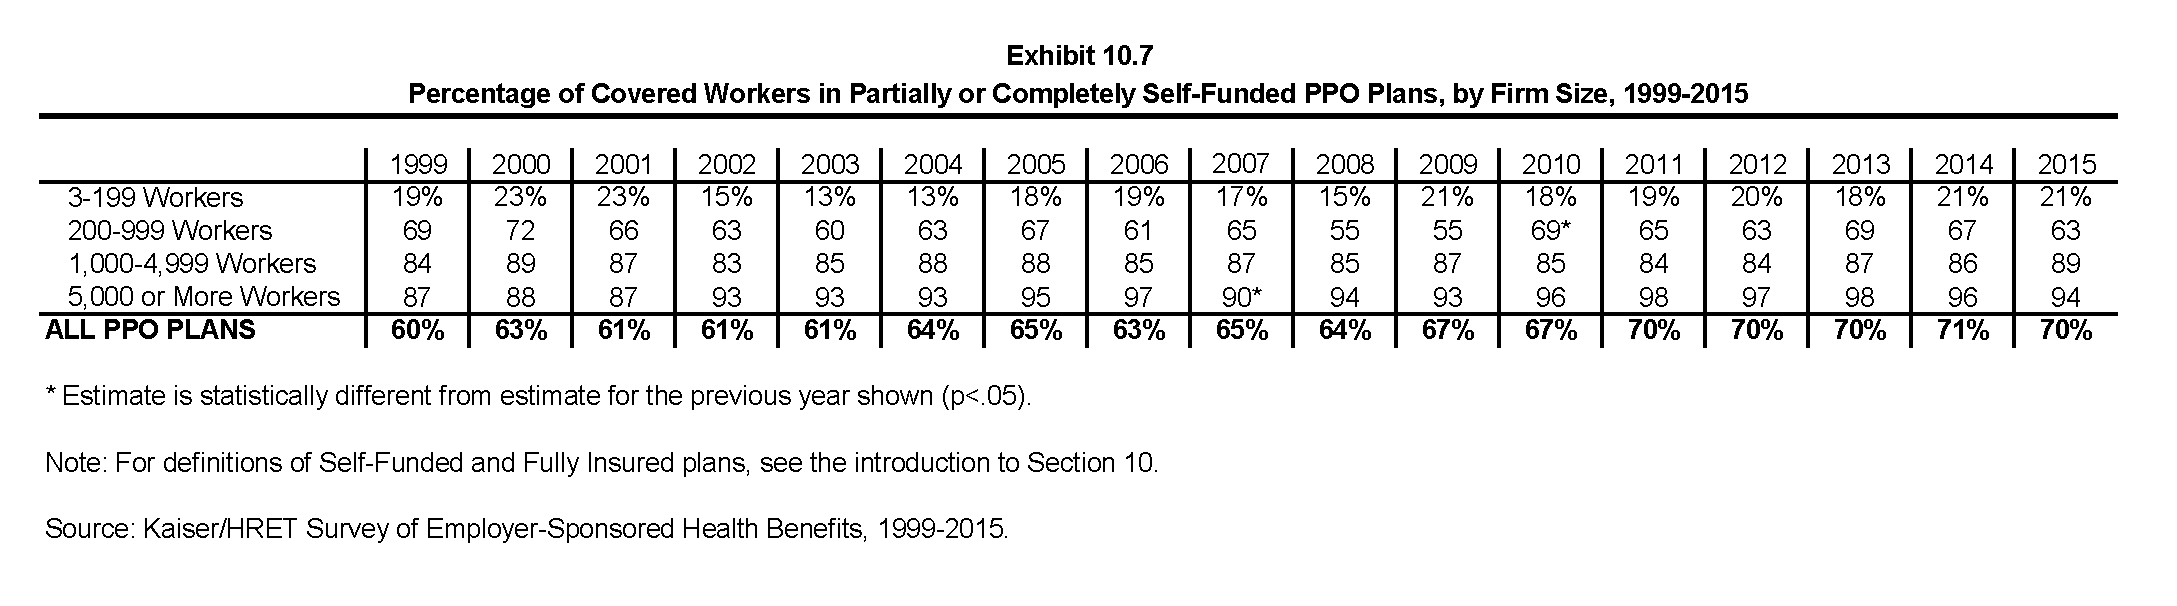
Percentage of Covered Workers in Partially or Completely Self-Funded PPO Plans, by Firm Size, 1999-2015
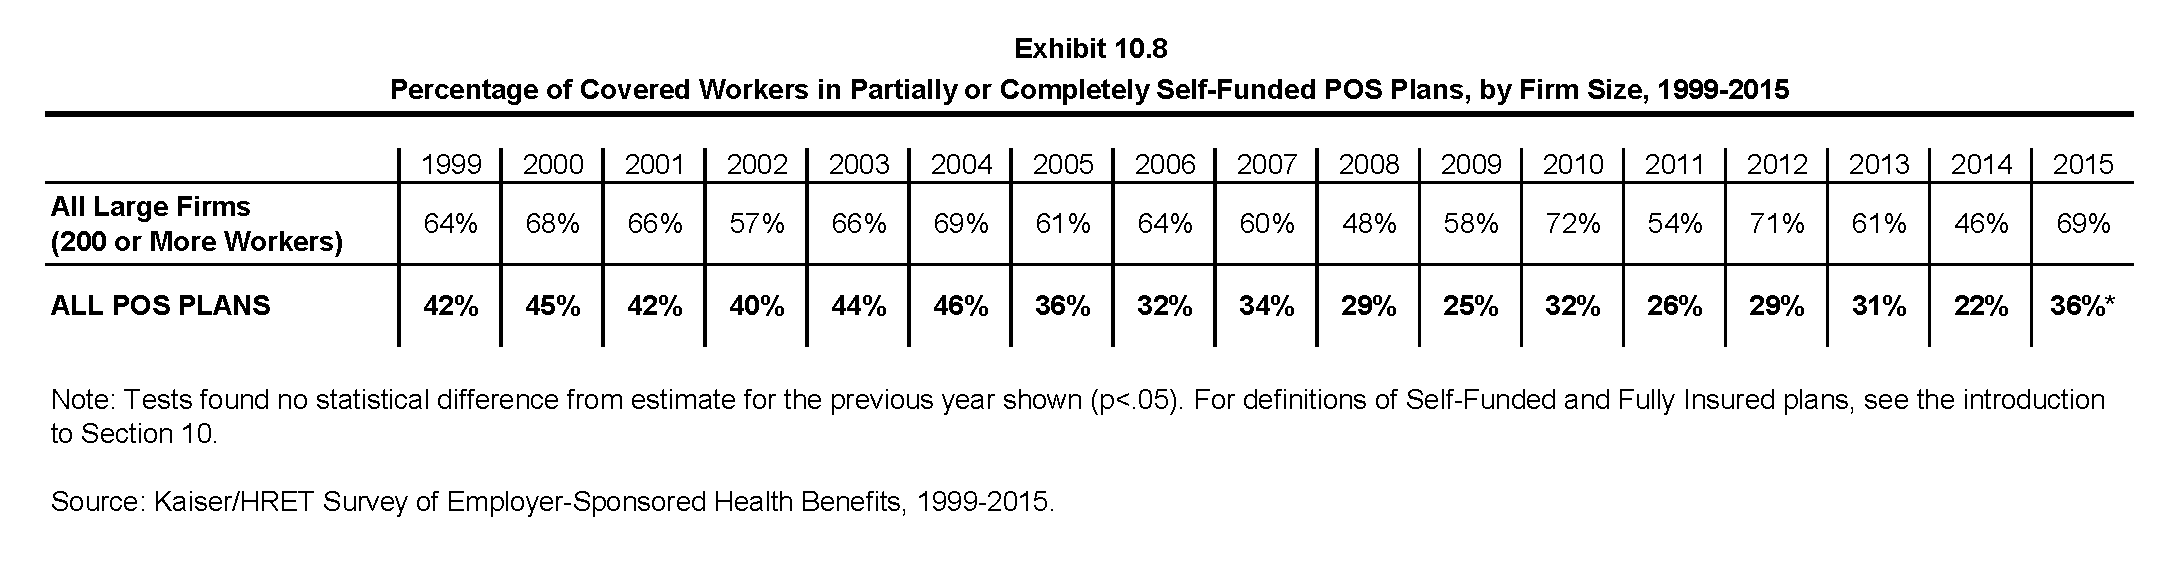
Percentage of Covered Workers in Partially or Completely Self-Funded POS Plans, by Firm Size, 1999-2015

Percentage of Covered Workers in Partially or Completely Self-Funded HDHP/SOs, by Firm Size, 2006-2015
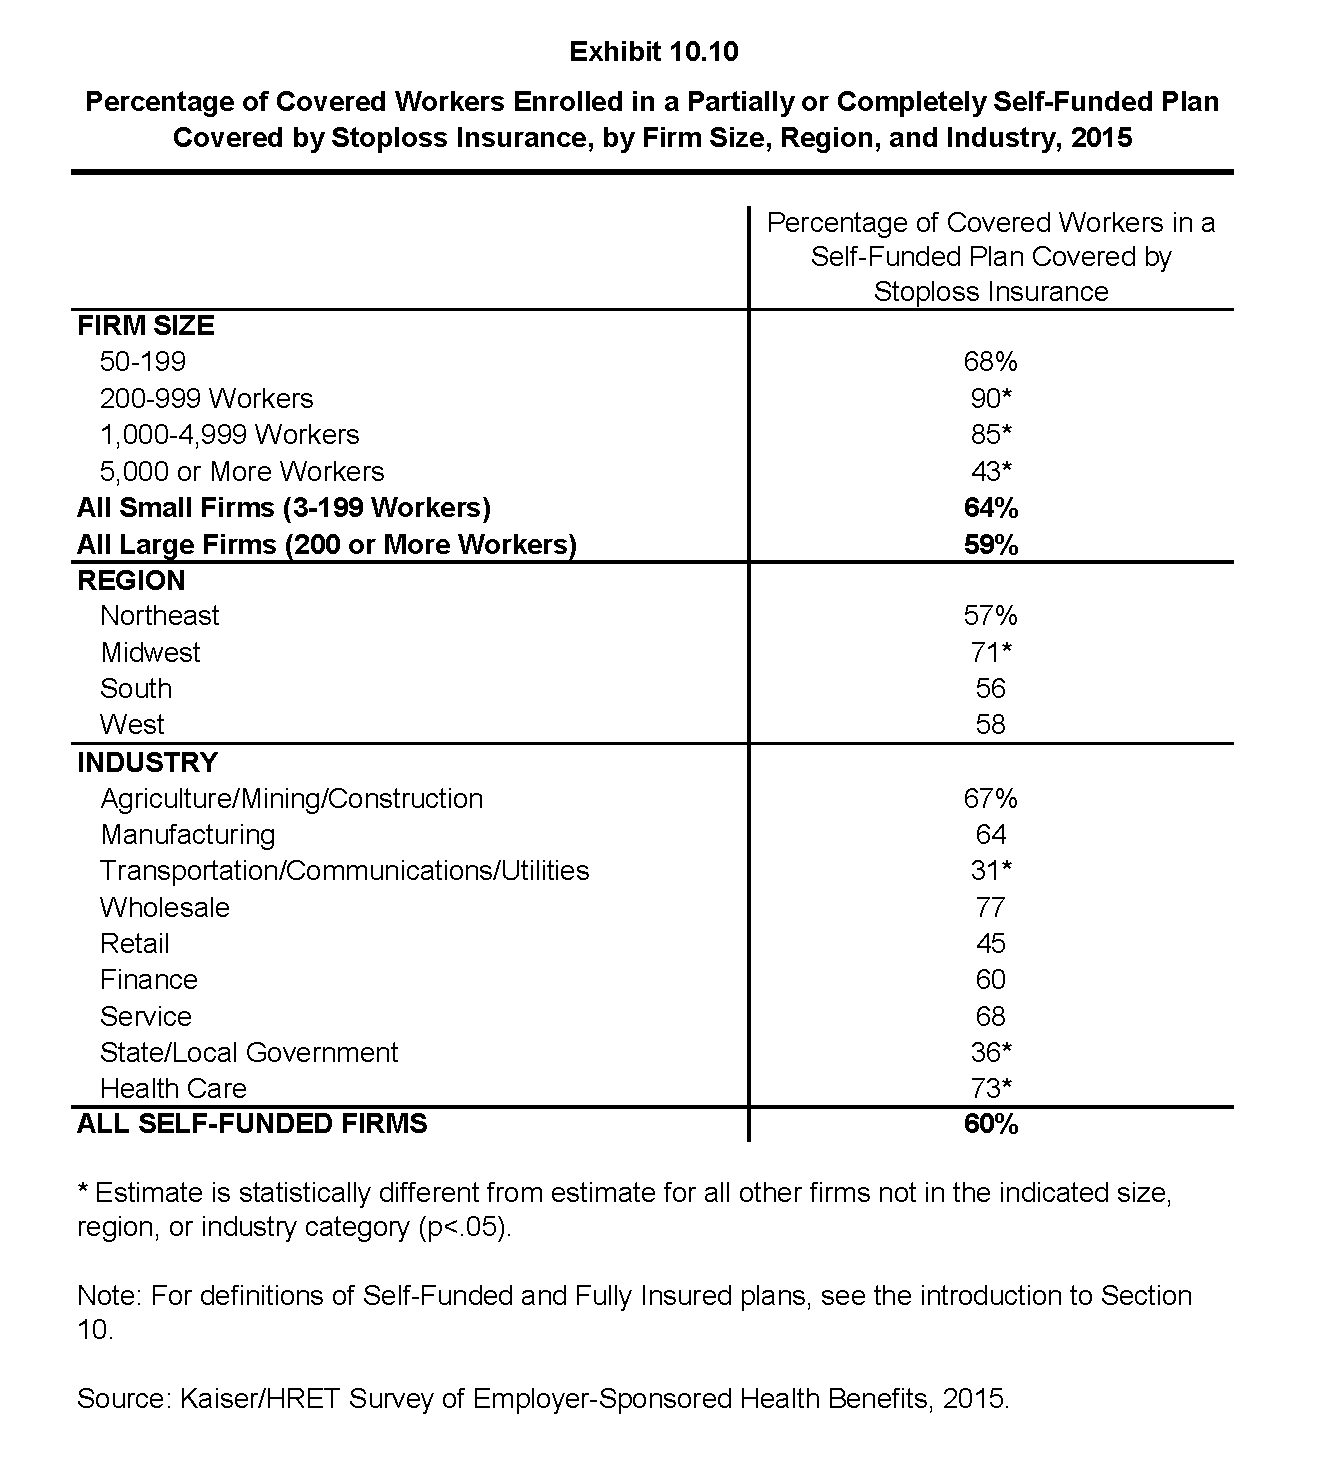
Percentage of Covered Workers Enrolled in a Partially or Completely Self-Funded Plan Covered by Stoploss Insurance, by Firm Size, Region, and Industry, 2015
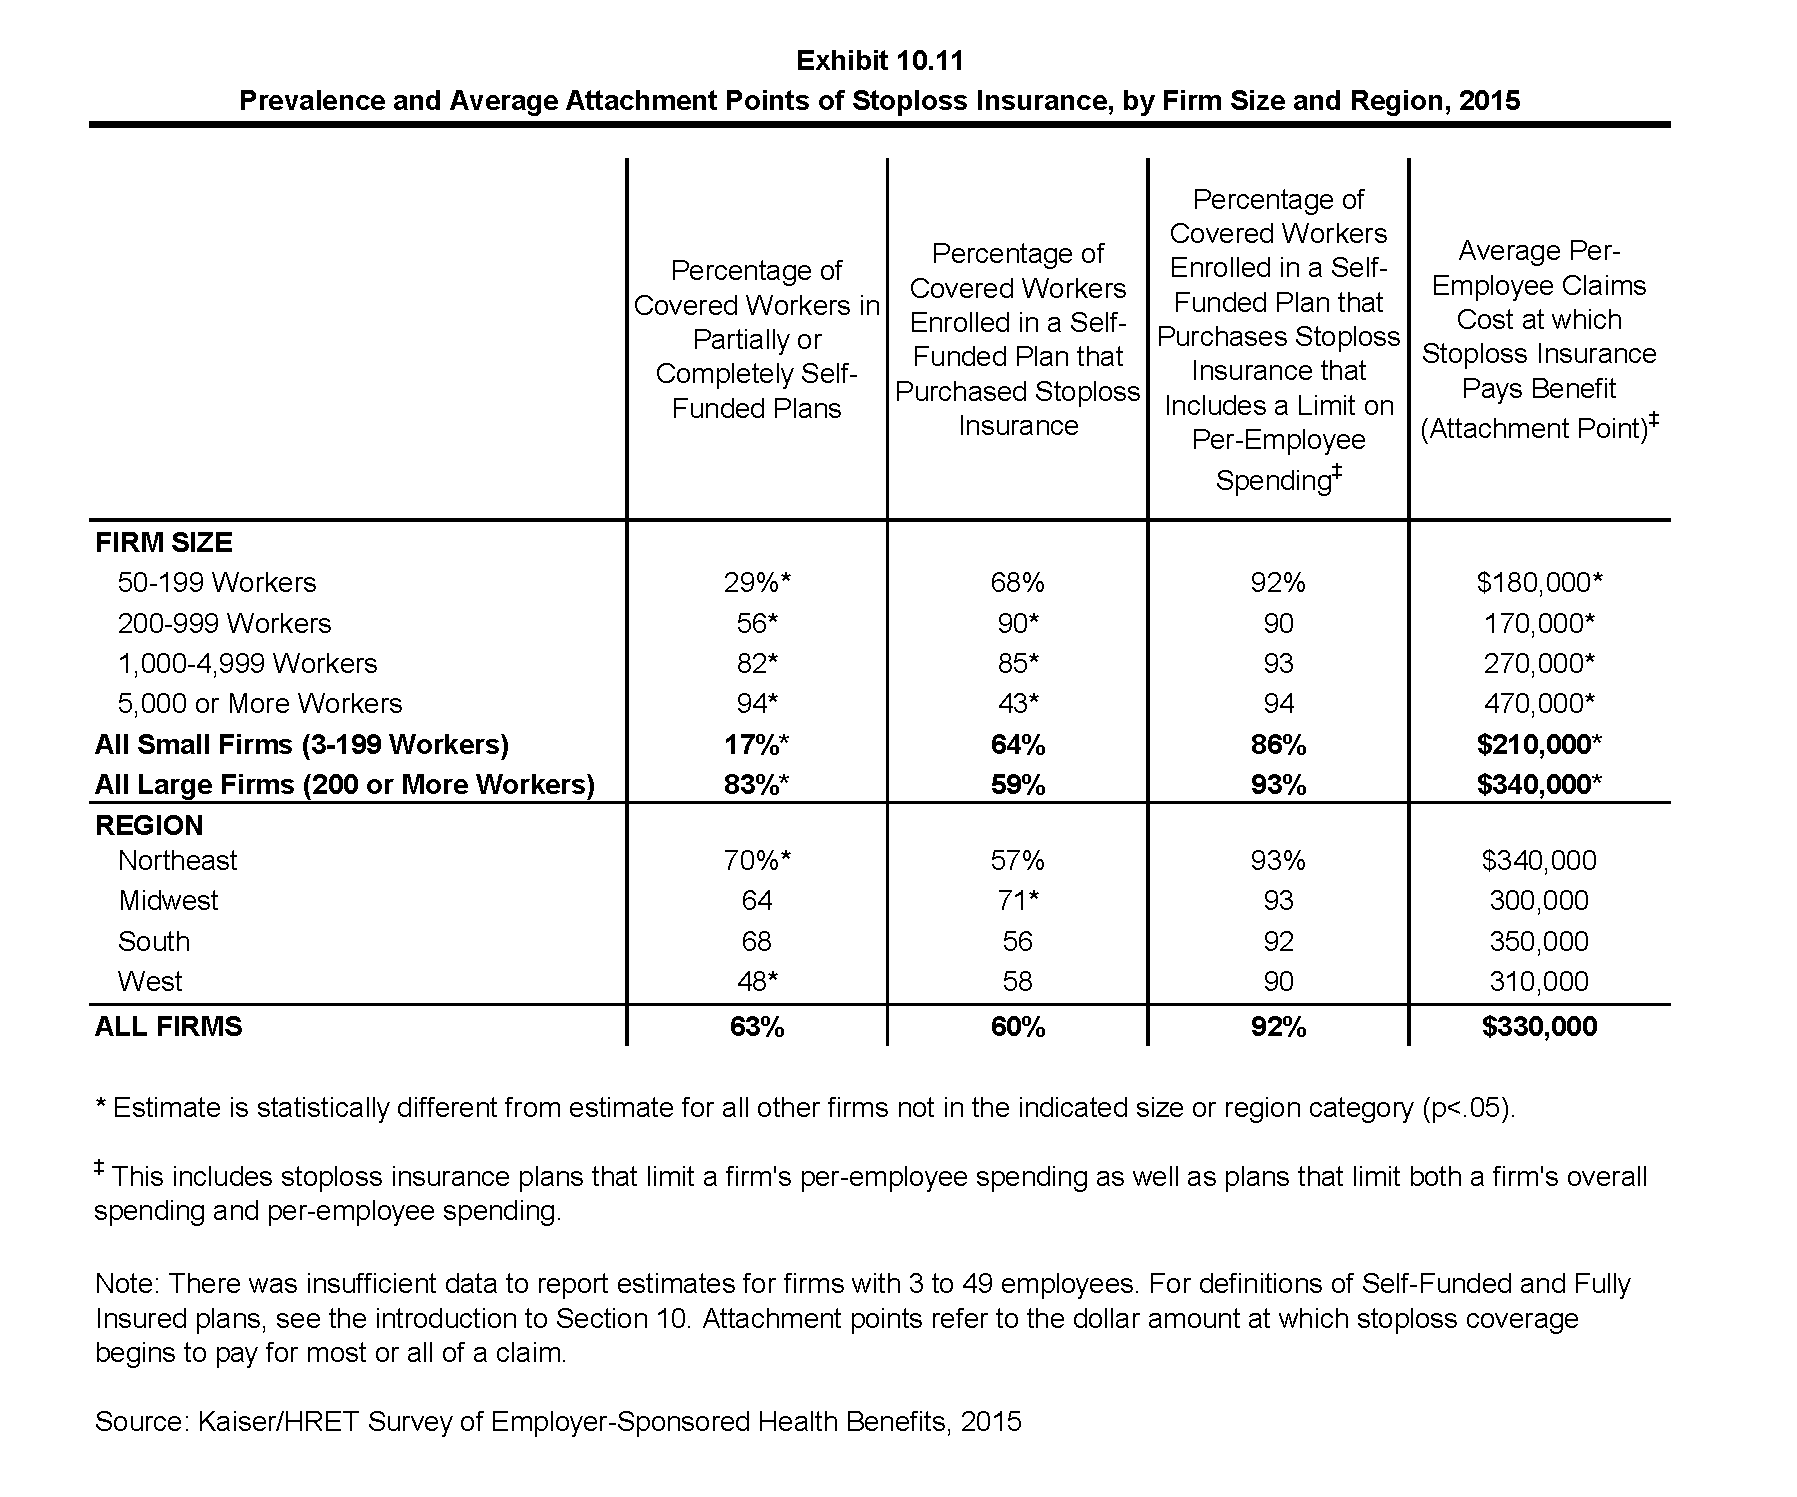
Prevalence and Average Attachment Points of Stoploss Insurance, by Firm Size and Region, 2015
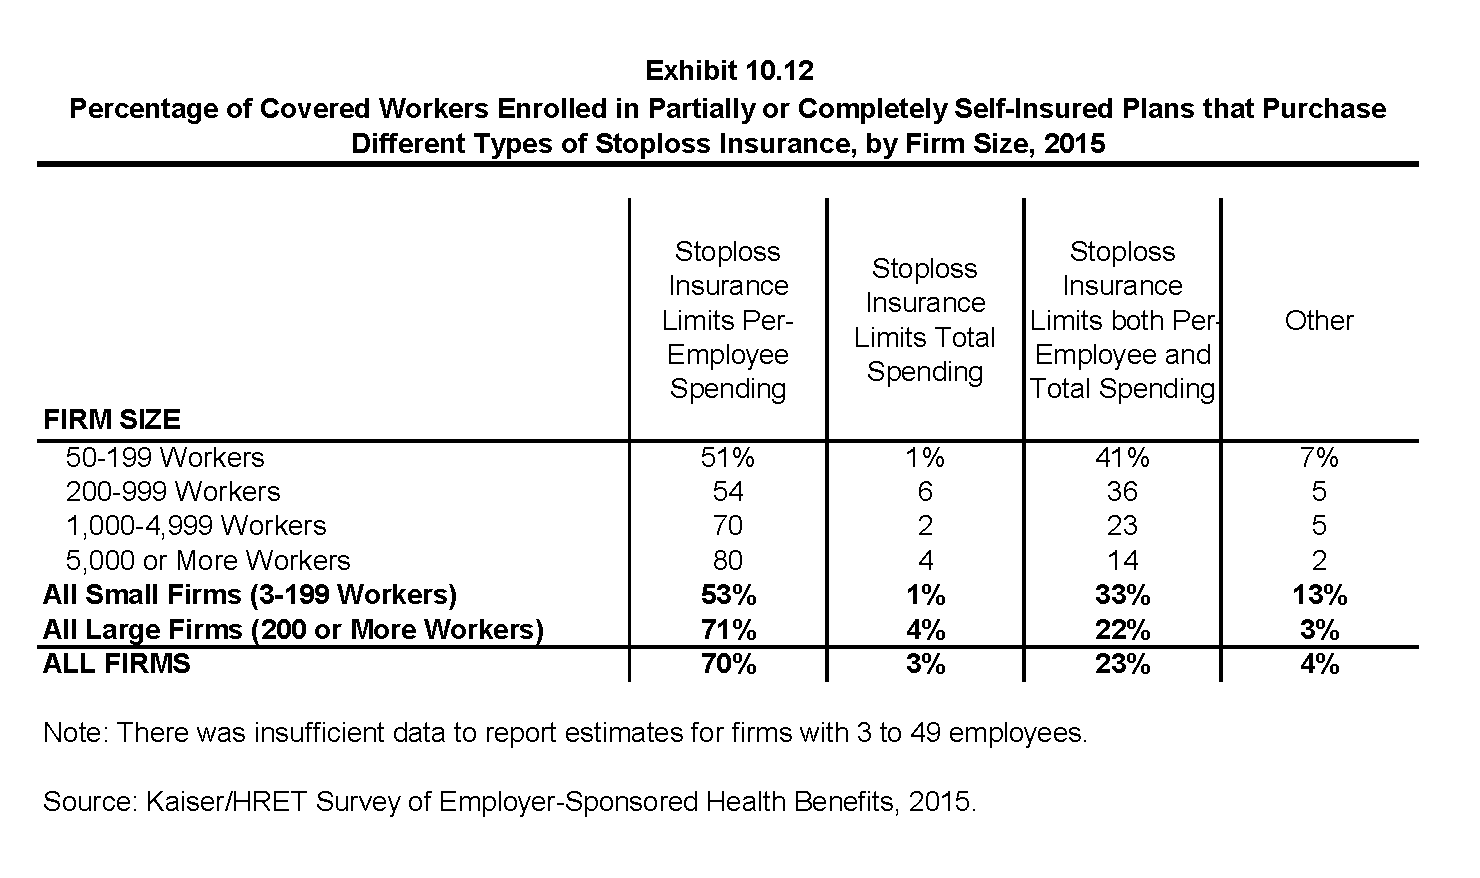
Percentage of Covered Workers Enrolled in Partially or Completely Self-Insured Plans that Purchase Different Types of Stoploss Insurance, by Firm Size, 2015
Section Eleven: Retiree Health Benefits
Retiree health benefits are an important consideration for older workers making decisions about their retirement. Health benefits for retirees provide an important supplement to Medicare for retirees age 65 or older. Over time, the percentage of firms offering retiree coverage has decreased.
- Twenty-three percent of large firms (200 or more workers) that offer health benefits to their employees offer retiree coverage in 2015, similar to 25% in 2014. There has been a downward trend in the percentage of firms offering retirees coverage, from 34% in 2006 and 66% in 1988 (Exhibit 11.1).
- The offering of retiree health benefits varies considerably by firm characteristics.
- Very large firms (5,000 or more workers) are more likely to offer retiree health benefits than firms with 200-999 workers (42% vs. 20%) (Exhibit 11.2).
- Among large firms (200 or more workers), state and local governments (73%) are more likely than large firms in other industries to offer retiree health benefits. In contrast, large firms in the manufacturing industry are less likely (14%) to offer retiree health benefits when compared to large firms in other industries (Exhibit 11.2).
- Large firms with a larger share of older workers (35% or more of workers are age 50 or older) are more likely to offer retiree health benefits than large firms with fewer older workers (31% vs. 17%). Large firms with at least some union workers are more likely to offer retiree health benefits than large firms without any union workers (37% vs. 18%) (Exhibit 11.3).
- Large, public employers such as state or local governments are more likely to offer retiree benefits than large, private for-profit employers or private not-for-profit employers (57% vs. 18% and 16%, respectively) (Exhibit 11.3).
- Among all large firms (200 or more workers) offering retiree health benefits, most firms offer them to early retirees under the age of 65 (92%). A lower percentage (73%) of large firms offering retiree health benefits offer them to Medicare-age retirees. These percentages are similar to 2014 and have remained stable over time (Exhibit 11.4).
- Among all large firms (200 or more workers) offering retiree health benefits, 66% offer health benefits to both early and Medicare-age retirees.
- Among all large firms (200 or more workers) offering retiree health benefits, 2% offer coverage that covers only prescription drugs (Exhibit 11.6).
Private Exchanges and Public Exchanges
- Private exchanges have received considerable attention over the last several years. They are typically created by a consulting company, broker, or insurer, and are different then the public exchanges created under the Affordable Care Act (ACA). Private exchanges allow employees or retirees to choose from several health benefit options offered on the exchange. Seven percent of large employers offering retiree health benefits do so through a private exchange (Exhibit 11.7). For more information on the use of private exchanges for active employees, please see section 14.
- The percentage of large firms offering retiree health benefits providing them through a private exchange is similar to last year (4% and 7%) (Exhibit 11.7).
- Since 2014, households with an income between 100% and 400% of the federal poverty level and without an offer of employer coverage may be eligible for subsidized health insurance on federal and state exchanges. Some current retirees may be eligible for premium tax credits for coverage provided through these marketplaces.
- Twenty-six percent of large firms (200 or more workers) offering retiree health coverage report they are considering changes in the way they offer retiree health benefits because of the new marketplaces (Exhibit 11.9).
- The percentage of large firms offering health benefits to active workers and retirees who are considering changing the way they offer coverage because of the health care exchanges established under the ACA is similar to last year (25% in 2014 and 26% in 2015) (Exhibit 11.10).
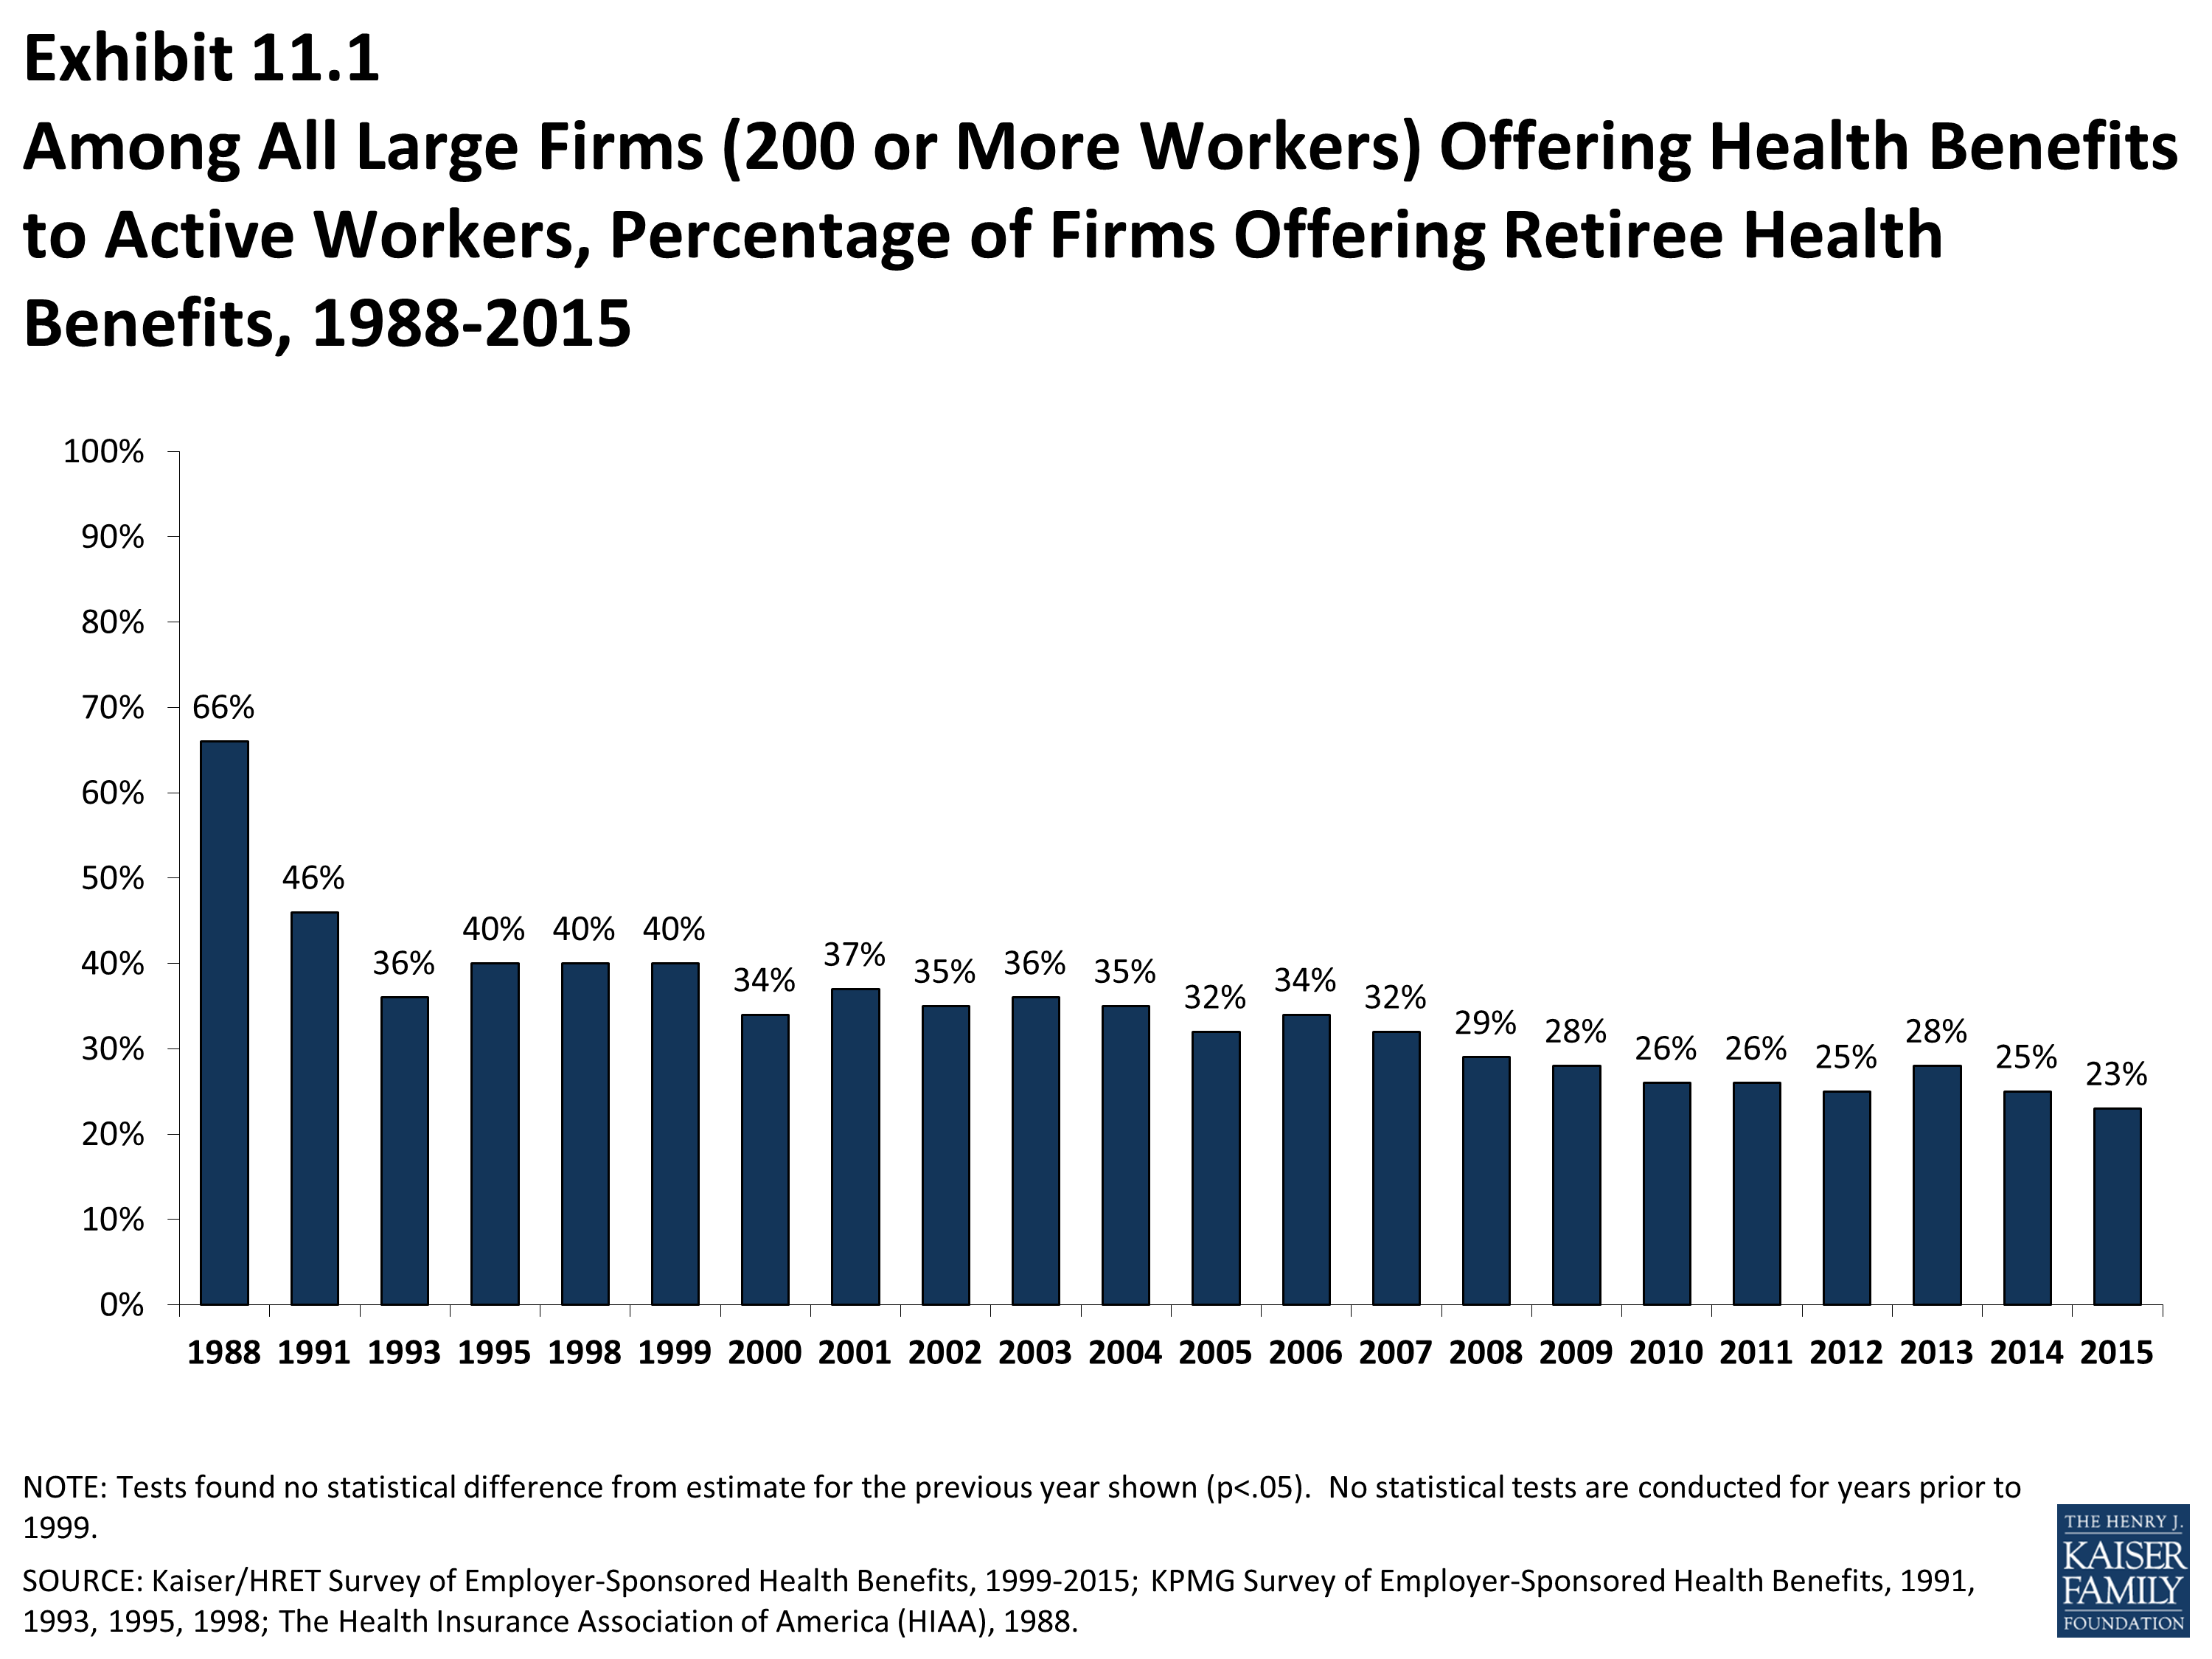
Among All Large Firms (200 or More Workers) Offering Health Benefits to Active Workers, Percentage of Firms Offering Retiree Health Benefits, 1988-2015
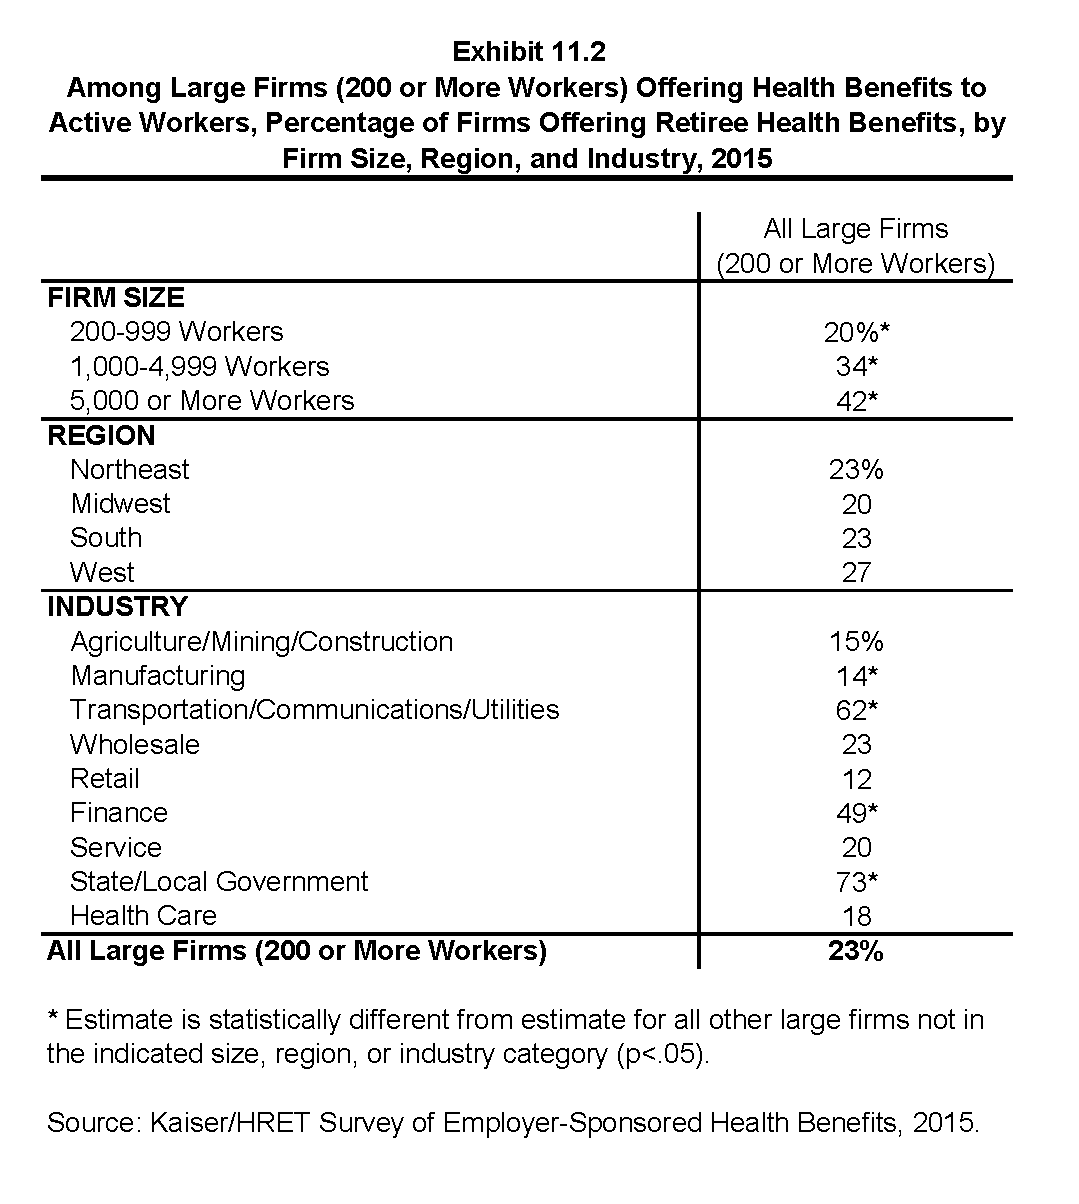
Among Large Firms (200 or More Workers) Offering Health Benefits to Active Workers, Percentage of Firms Offering Retiree Health Benefits, by Firm Size, Region, and Industry, 2015
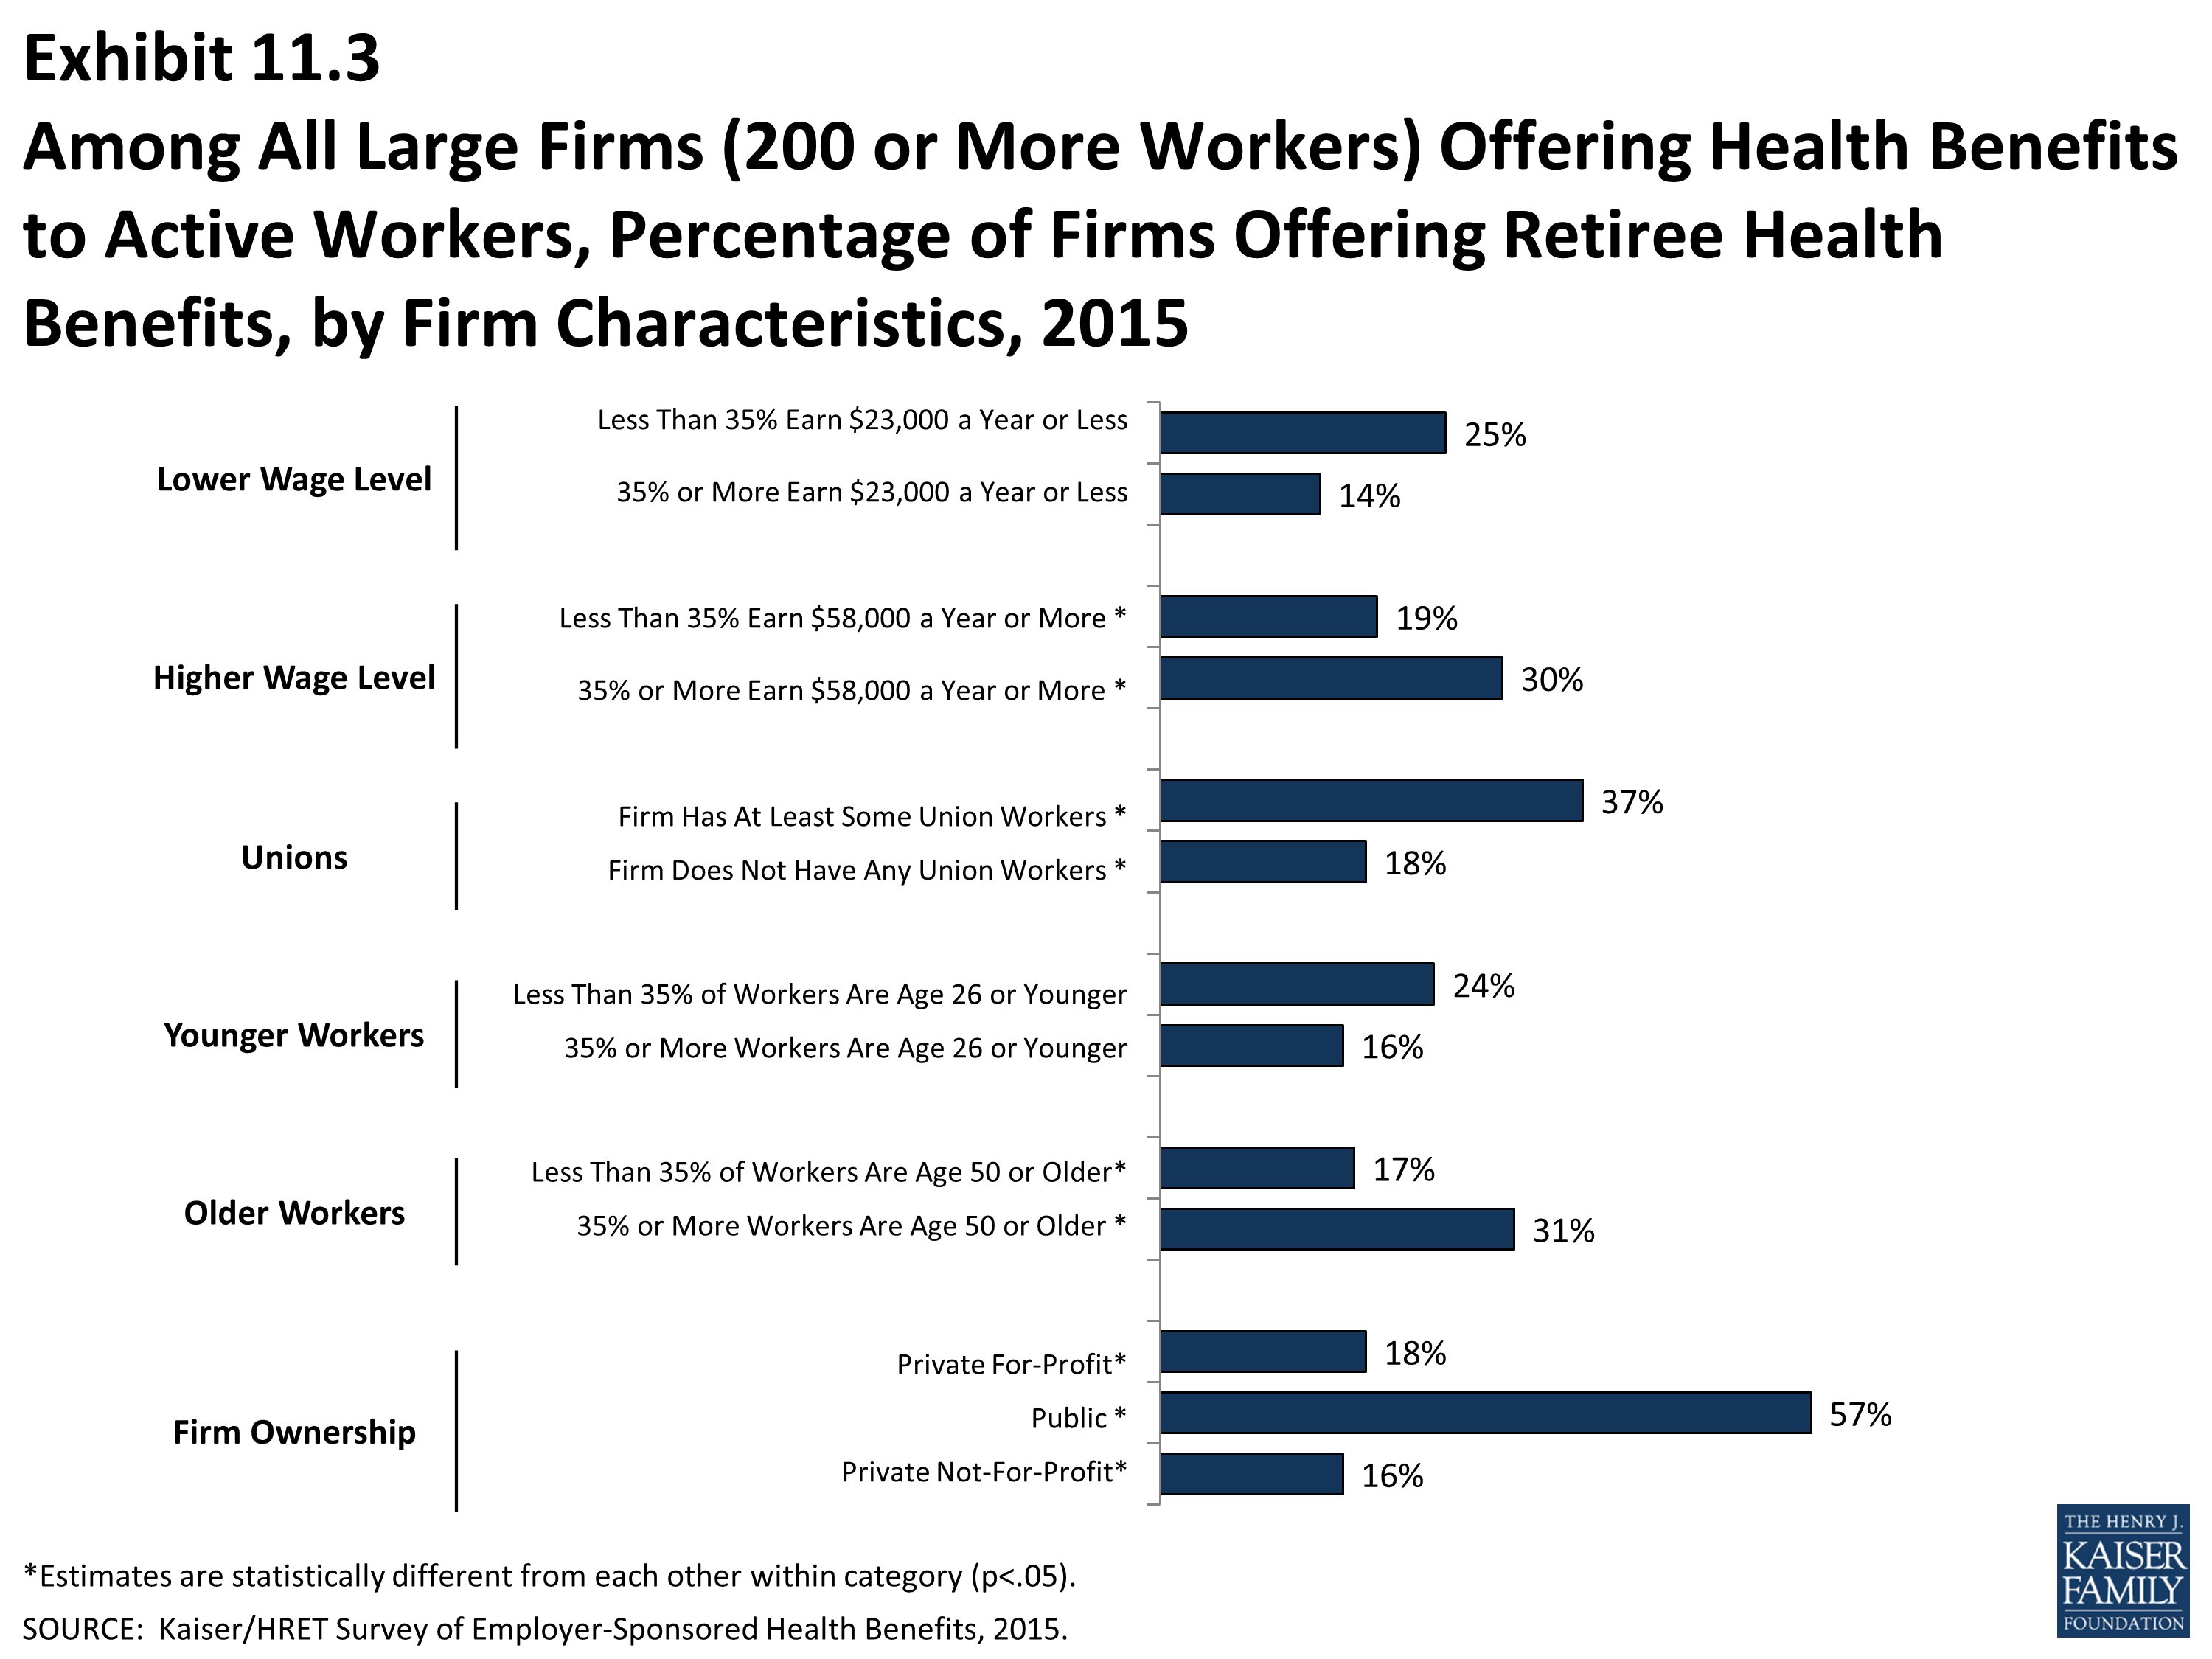
Among All Large Firms (200 or More Workers) Offering Health Benefits to Active Workers, Percentage of Firms Offering Retiree Health Benefits, by Firm Characteristics, 2015
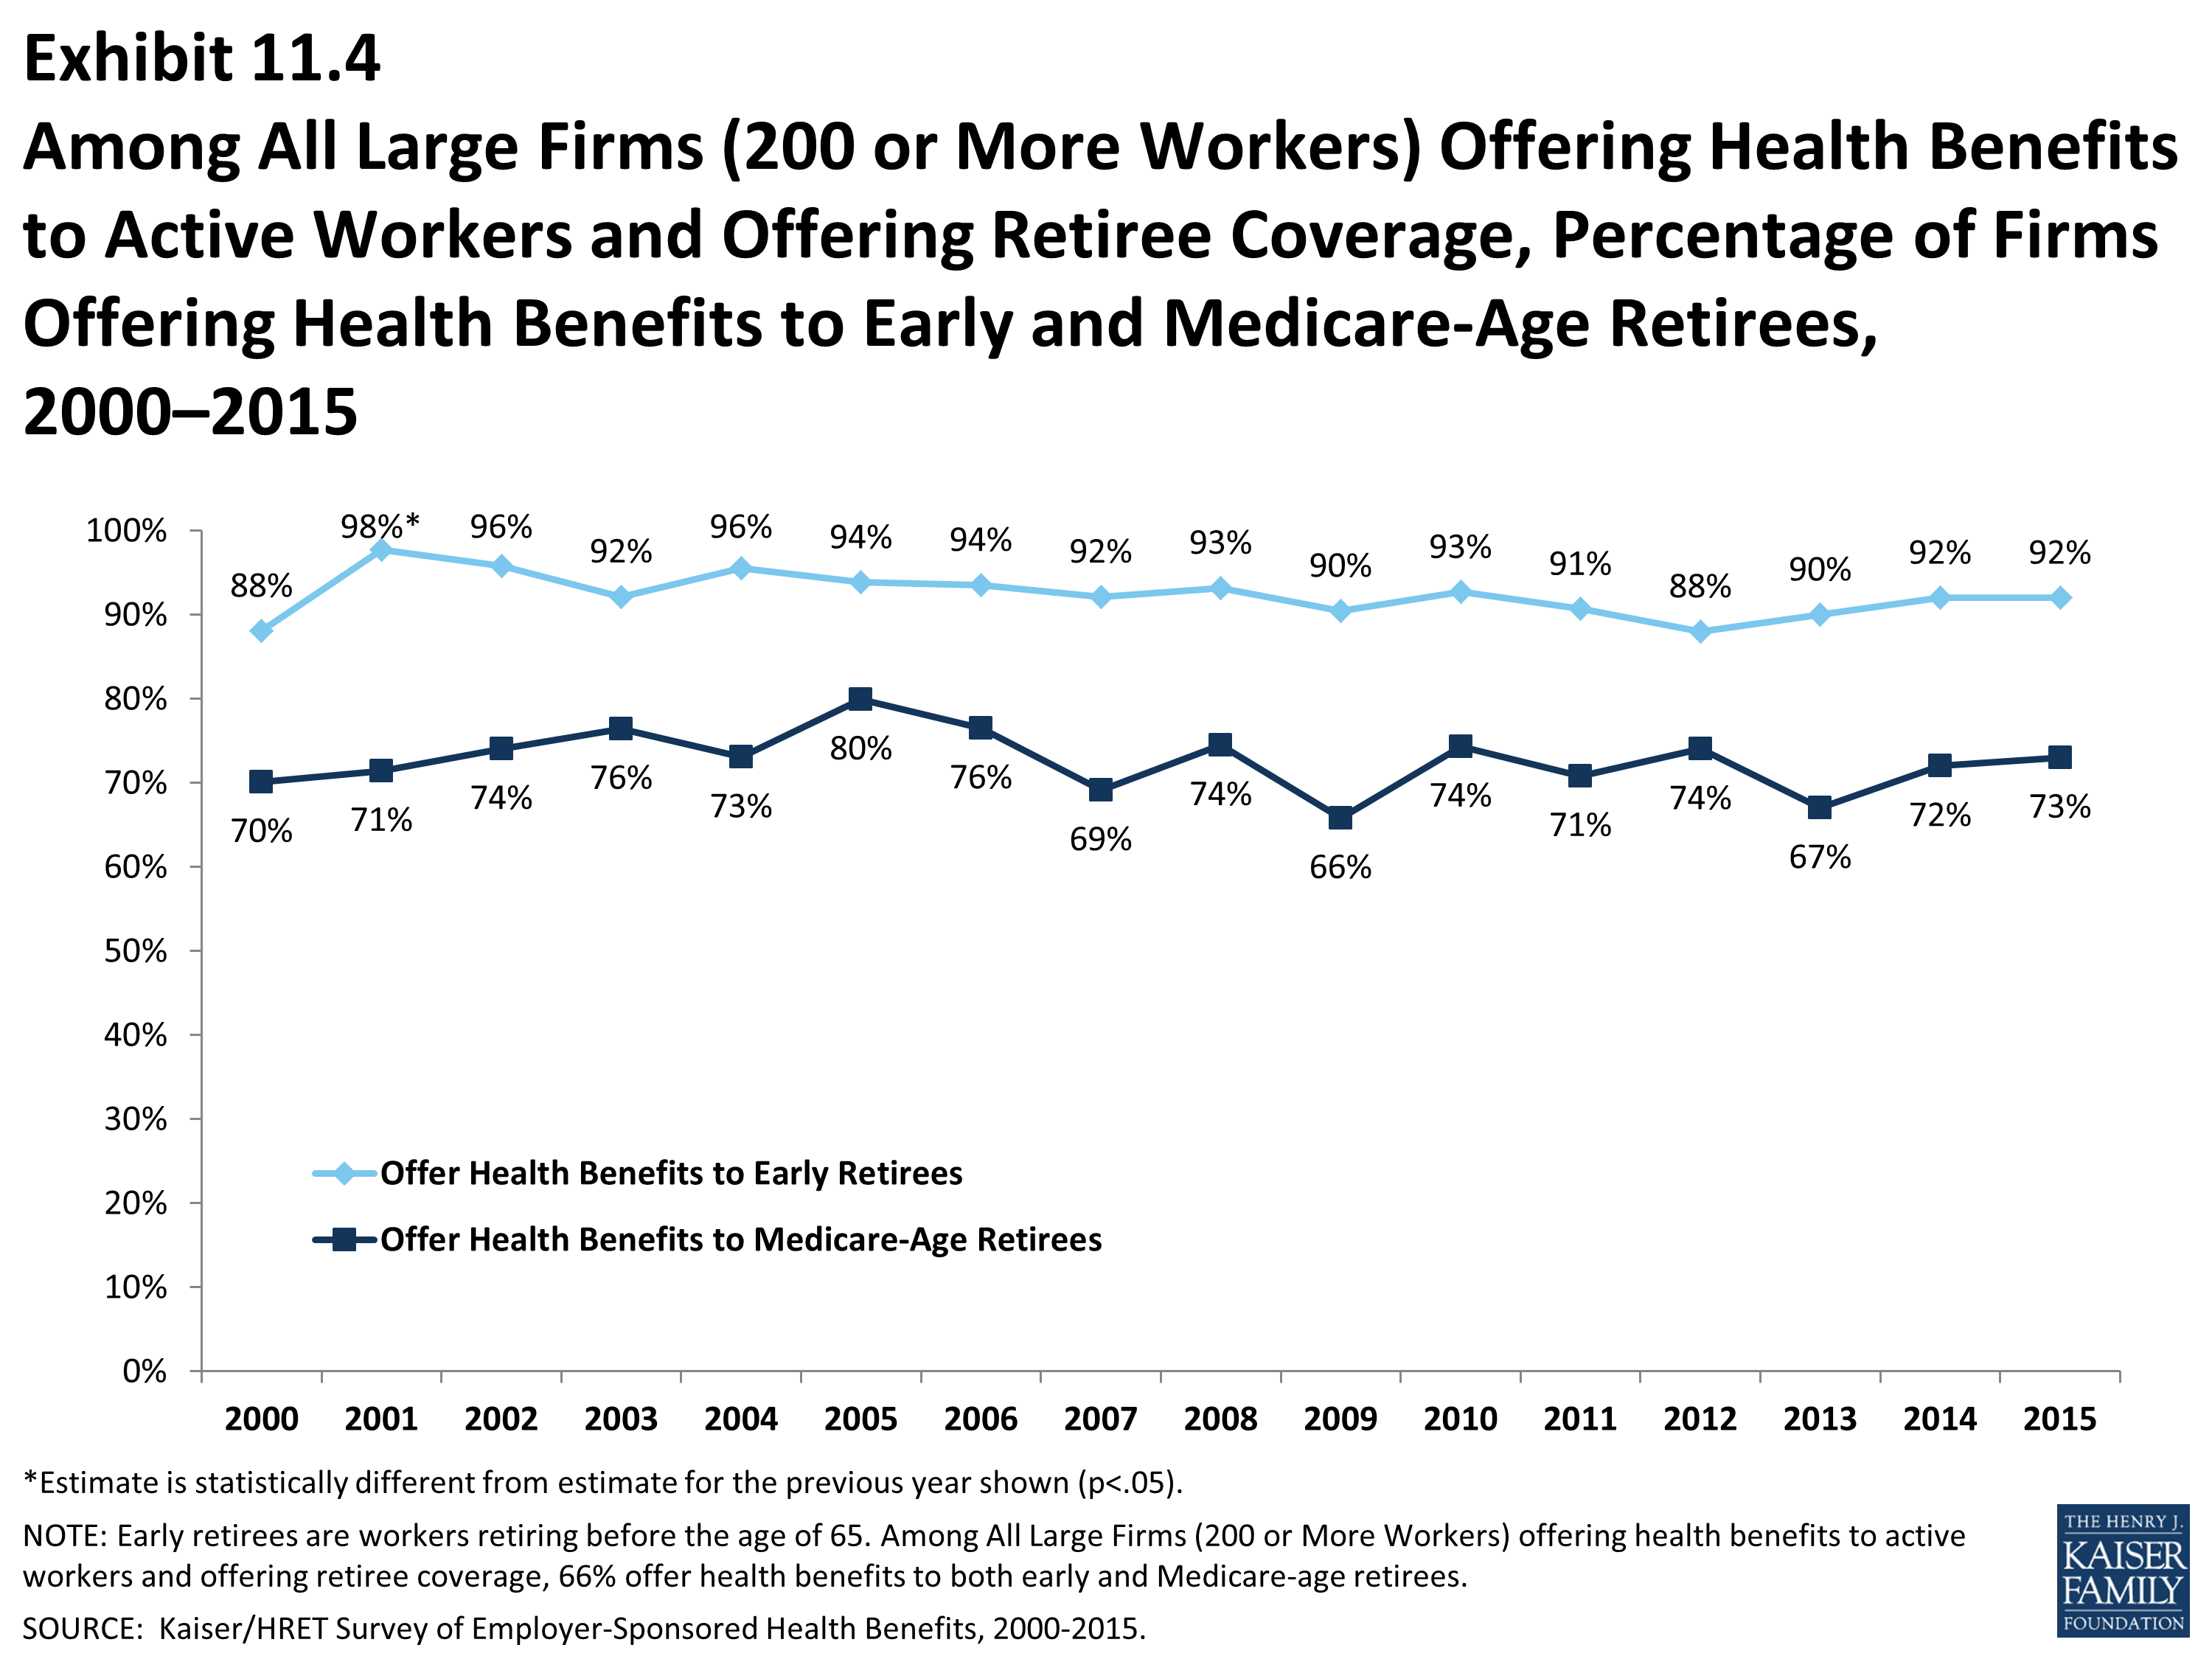
Among All Large Firms (200 or More Workers) Offering Health Benefits to Active Workers and Offering Retiree Coverage, Percentage of Firms Offering Health Benefits to Early and Medicare-Age Retirees, 2000–2015
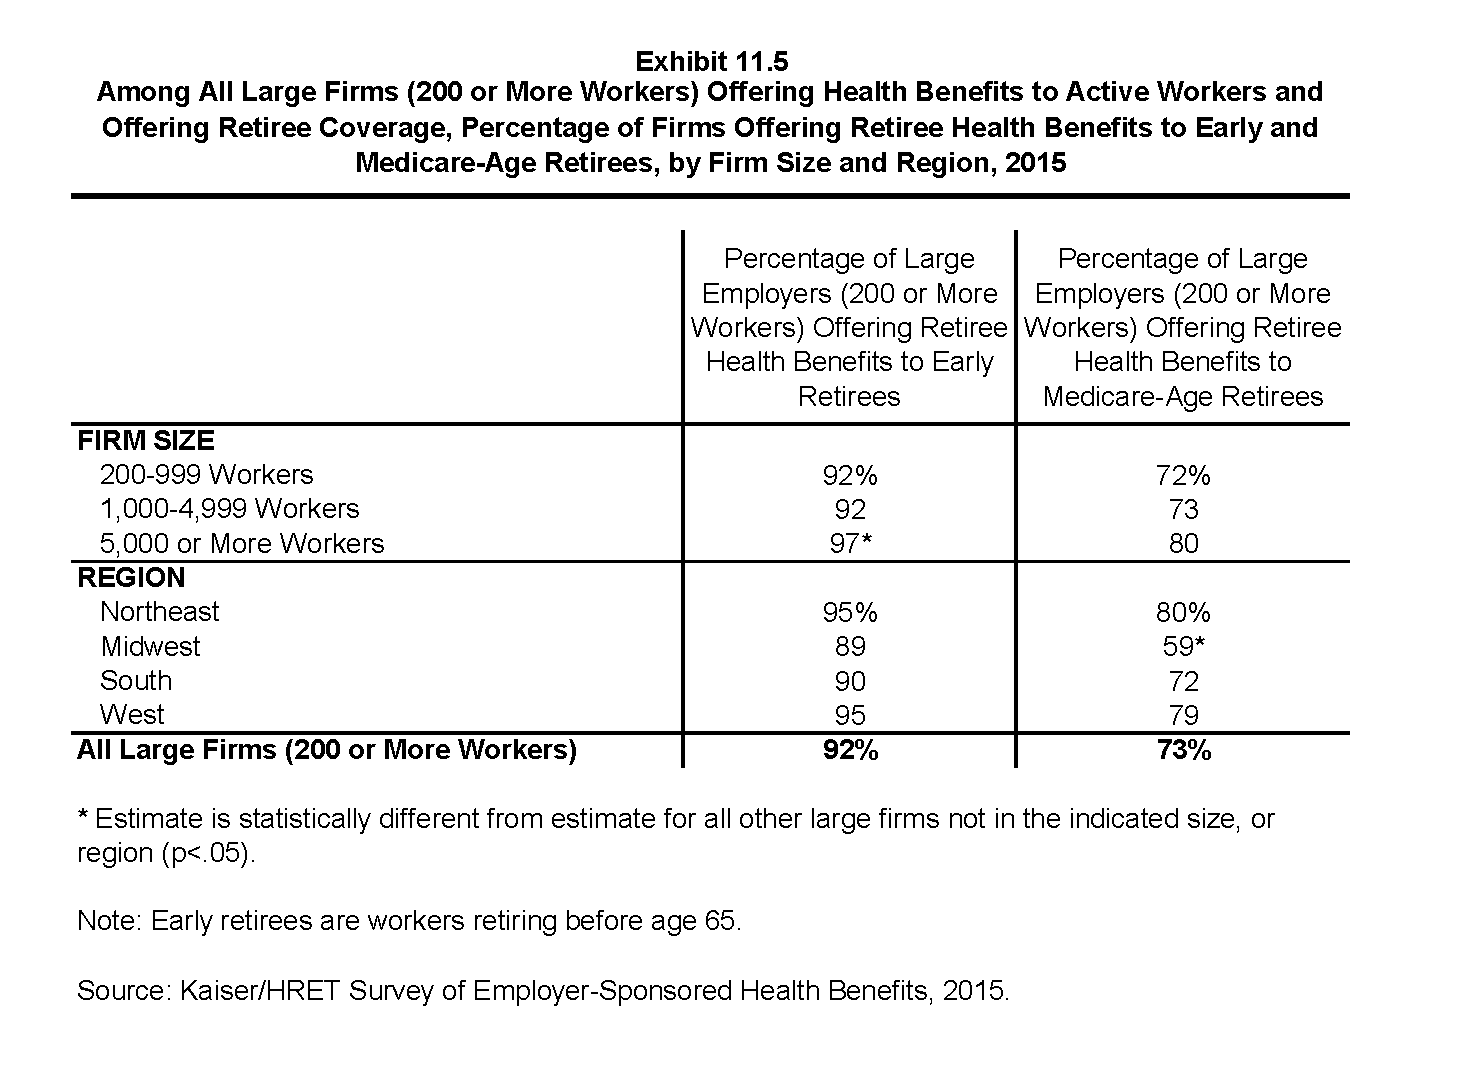
Among All Large Firms (200 or More Workers) Offering Health Benefits to Active Workers and Offering Retiree Coverage, Percentage of Firms Offering Retiree Health Benefits to Early and Medicare-Age Retirees, by Firm Size and Region, 2015
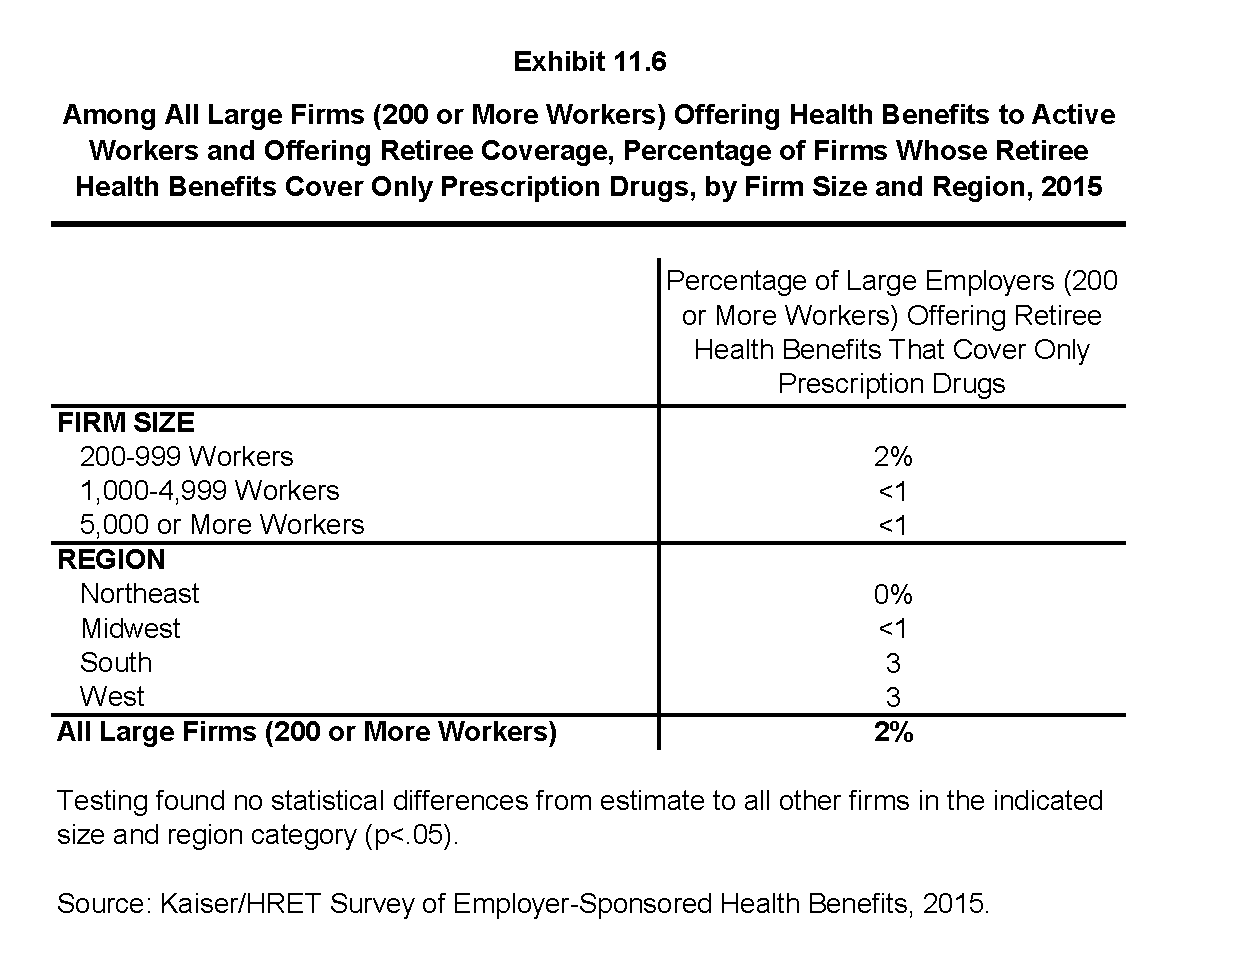
Among All Large Firms (200 or More Workers) Offering Health Benefits to Active Workers and Offering Retiree Coverage, Percentage of Firms Whose Retiree Health Benefits Cover Only Prescription Drugs, by Firm Size and Region, 2015
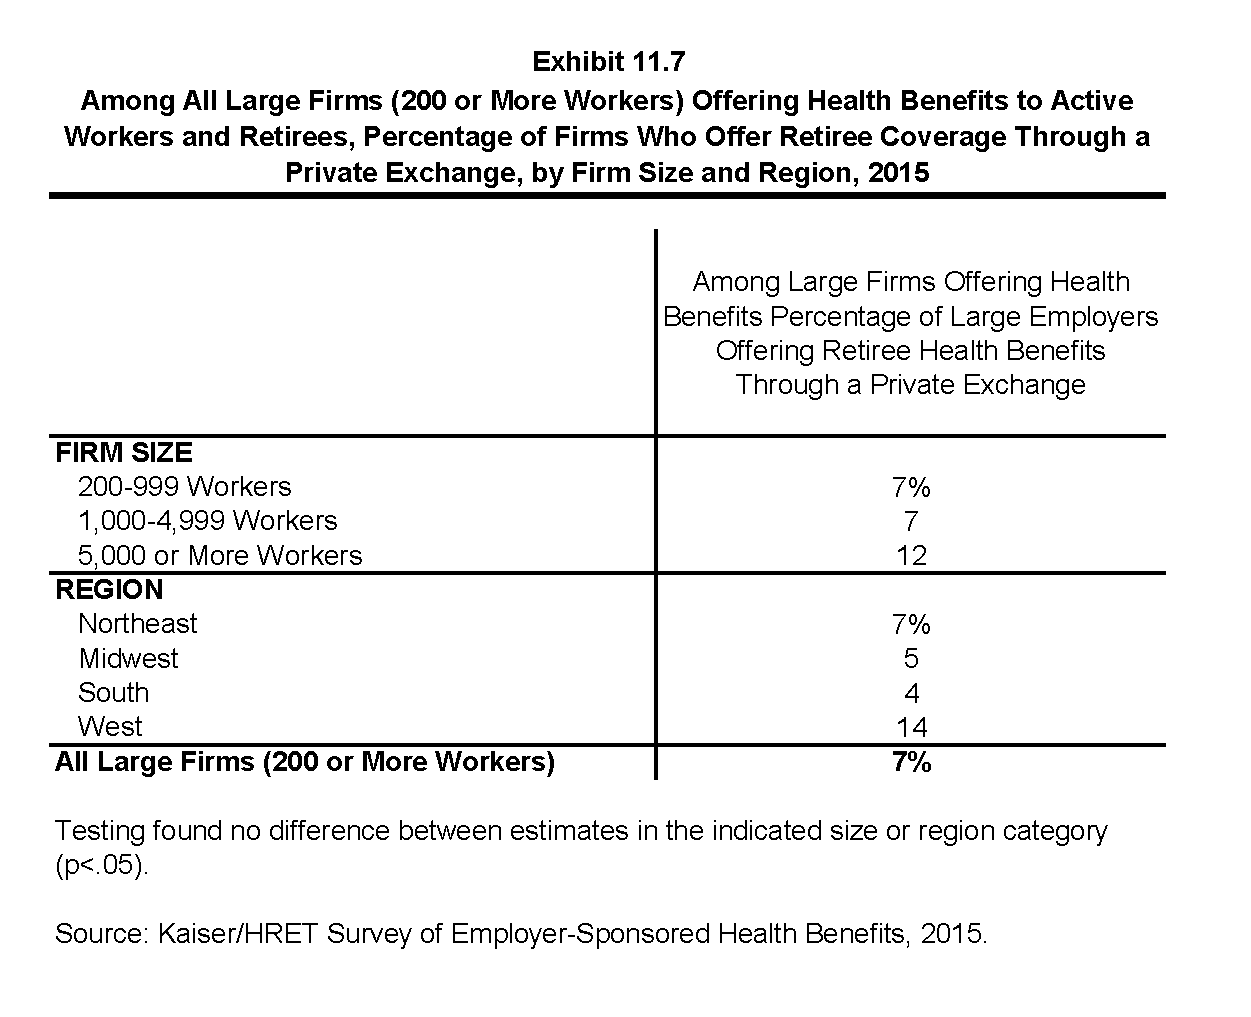
Among All Large Firms (200 or More Workers) Offering Health Benefits to Active Workers and Retirees, Percentage of Firms Who Offer Retiree Coverage Through a Private Exchange, by Firm Size and Region, 2015
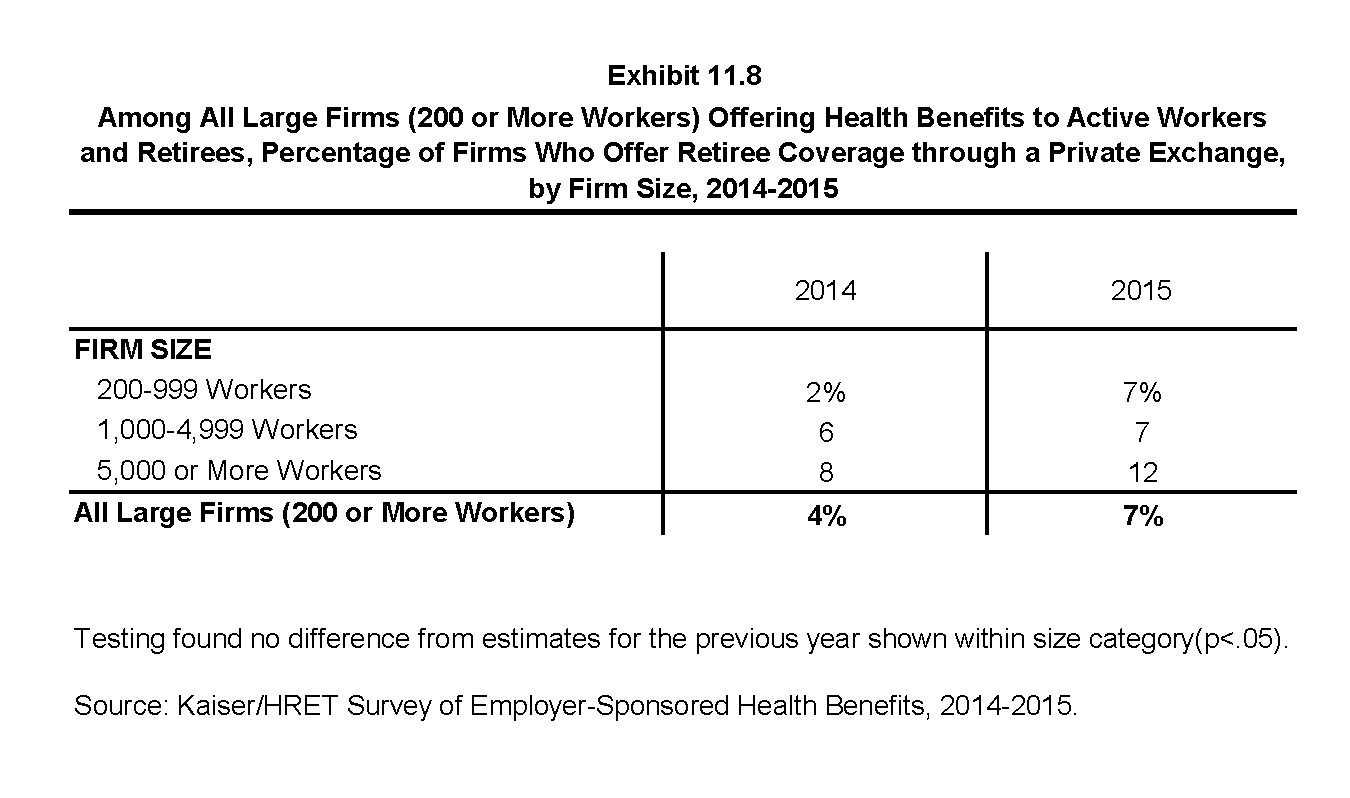
Among All Large Firms (200 or More Workers) Offering Health Benefits to Active Workers and Retirees, Percentage of Firms Who Offer Retiree Coverage through a Private Exchange, by Firm Size, 2014-2015
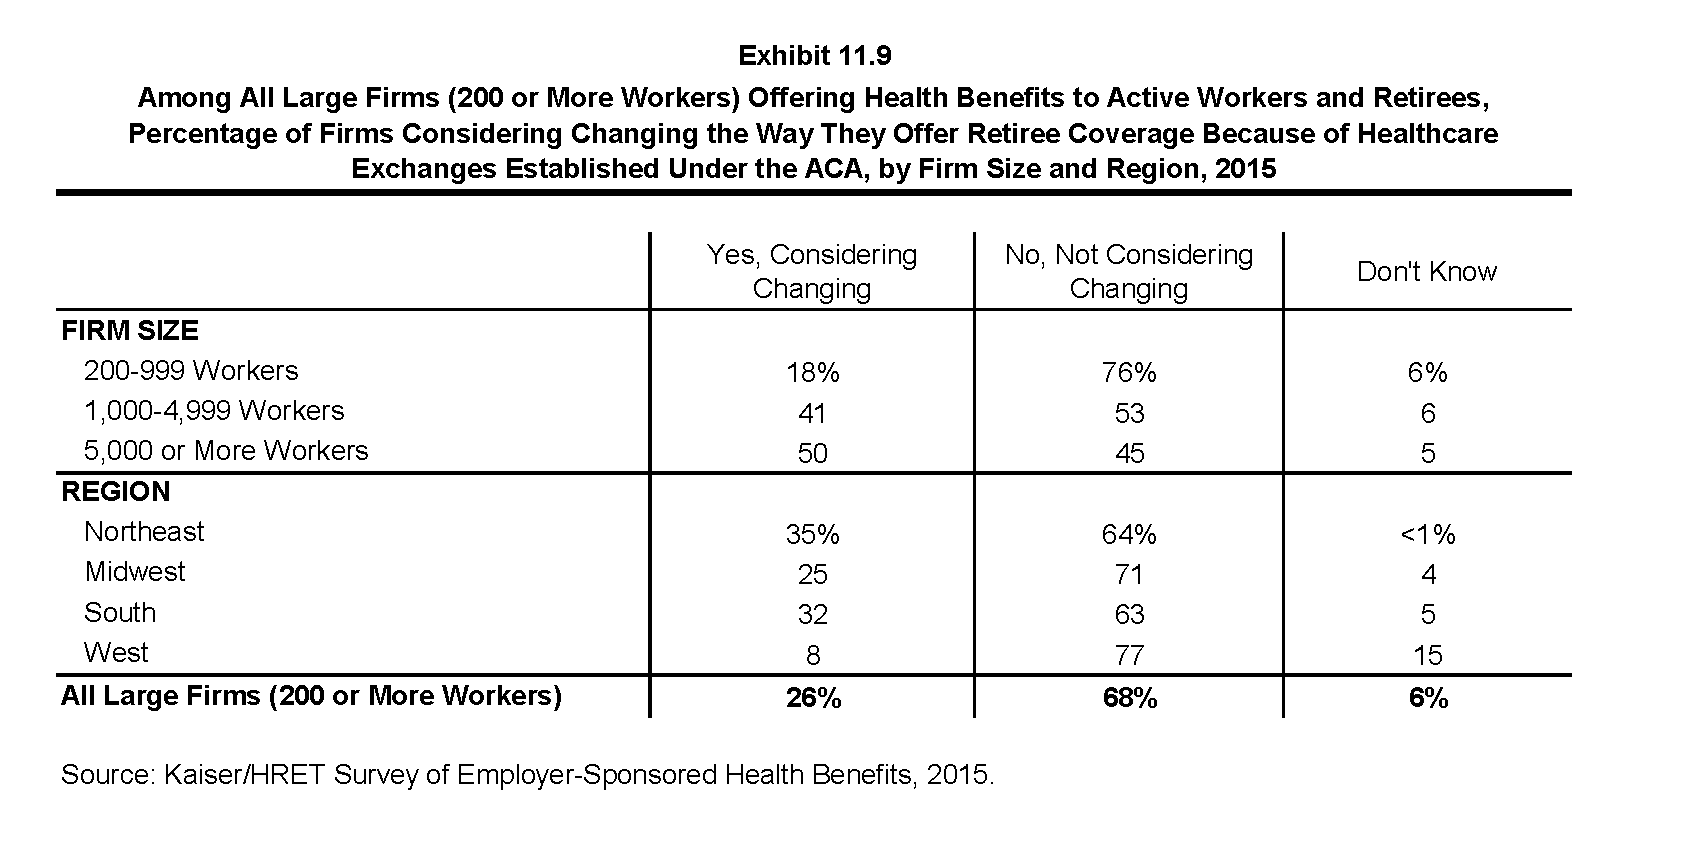
Among All Large Firms (200 or More Workers) Offering Health Benefits to Active Workers and Retirees, Percentage of Firms Considering Changing the Way They Offer Retiree Coverage Because of Healthcare Exchanges Established Under the ACA, by Firm Size and Region, 2015
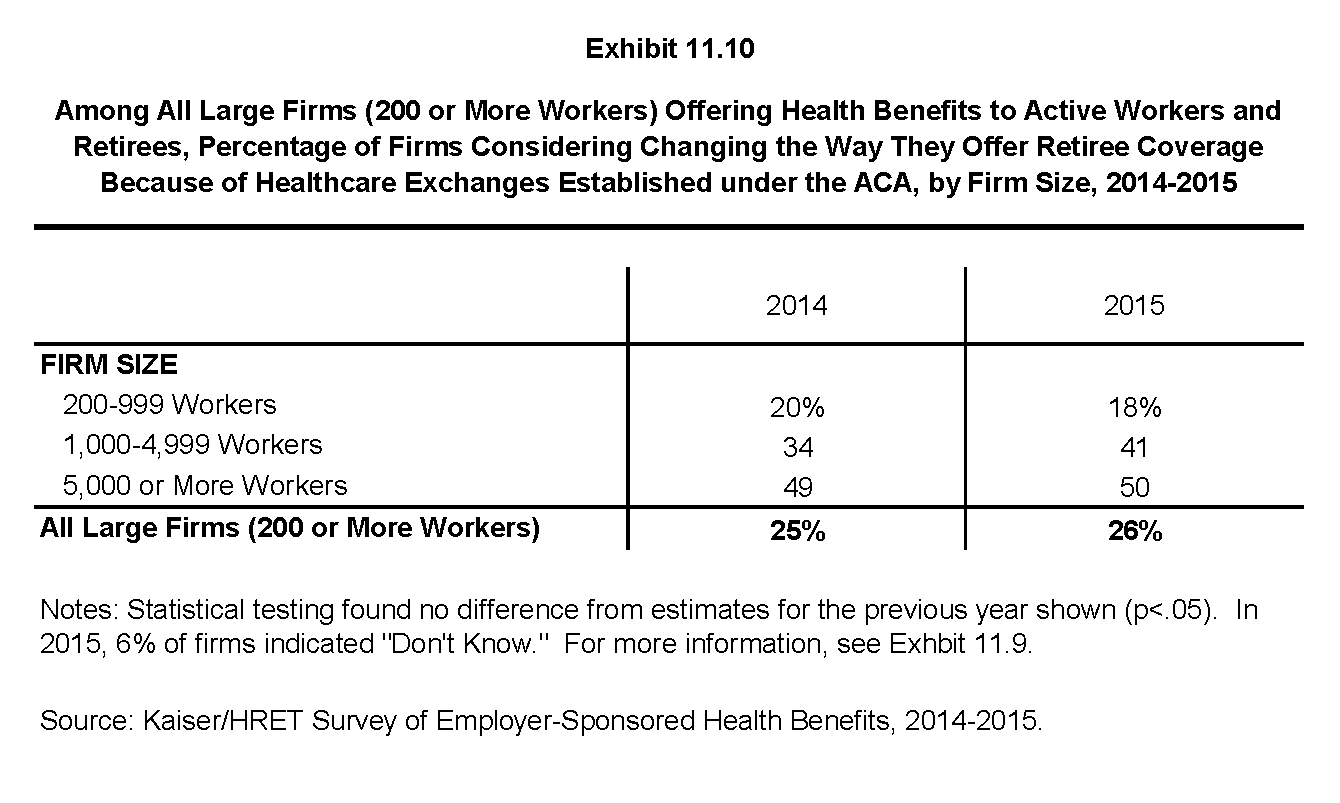
Among All Large Firms (200 or More Workers) Offering Health Benefits to Active Workers and Retirees, Percentage of Firms Considering Changing the Way They Offer Retiree Coverage Because of Healthcare Exchanges Established under the ACA, by Firm Size, 2014-2015
Section Twelve: Health Risk Assessment, Biometrics Screening and Wellness Programs
Employers continue to show considerable interest in programs that help employees identify health issues and manage chronic conditions. Many employers believe that improving the health of their workers and their family members can improve morale, productivity and reduce health care costs. In addition to offering wellness programs, a majority of large employers now offer health screening programs including health risk assessments, which are questionnaires asking employees about lifestyle, stress or physical health, and biometric screening, which we define as in-person health examinations conducted by a medical professional. Employers and insurers may use the health information collected during screenings to target wellness offerings or other health services to employees with risk conditions. Some employers have incentive programs that reward or penalize employees for different activities, including participating in wellness programs or completing health screenings. Recent regulatory changes have expanded employers’ ability to offer incentive programs for health-contingent programs that reward employees for meeting health outcomes. We revised the 2015 survey to better capture employers’ evolving approaches to wellness programs and health screening. This year’s survey includes more information on employers’ use of incentive programs, so in most cases, statistics reported in 2015 are not comparable to previous years’ findings because of these changes. Only firms offering health benefits were asked about their wellness and health promotion programs.
In 2015, 50% of large firms (200 or more workers) offering health benefits offer the opportunity or require employees to complete health risk assessments. Fifty-percent of large employers offering health benefits offer the opportunity or ask employees to complete biometric screening. Eighty-one percent of large firms offering health benefits offer wellness programs such as programs to help employees stop smoking, programs to help employees lose weight, or other lifestyle and behavioral coaching.
Health Risk Assessments
Some firms give their employees the opportunity to complete a health risk assessment to identify potential health issues. Health risk assessments generally include questions about medical history, health status, and lifestyle.
- Overall, 19% of firms offering health benefits offer the opportunity or require employees to complete a health risk assessment. Large firms (200 or more workers) are more likely than small firms to offer or require employees to complete the assessment (50% vs. 18%). Among offering firms with 5,000 or more employees, 72% either offer or require employees to complete a health risk assessment (Exhibit 12.1).
- The percentage of large firms (200 or more workers) who offer their employees the opportunity to complete a health risk assessment (50%) is similar to last year (51%).
- Some firms offer financial incentives to encourage employees to complete health risk assessments.
- Among firms that offer health benefits and a health risk assessment, 31% offer an incentive to employees who complete the assessment. Large firms (200 or more workers) that offer health risk assessments are more likely to offer a financial incentive than small firms (62% vs. 29%) (Exhibit 12.3).
- Half (50%) of large employers that offer health risk assessments offer employees who complete the assessment lower premium contributions or reduced cost sharing. Five percent of large firms (200 or more workers) that offer health risk assessments report that they require employees to complete a health risk assessment in order to enroll in a health plan (Exhibit 12.4). Some employers with incentives to complete health risk assessments may offer employees multiple types of incentives.
- About half of the employees (51% in small firms (3-199 workers) and 45% in large firms) who are offered the opportunity or required to complete a health risk assessment actually do so (Exhibit 12.2).
- There is considerable variation in the percentage of workers who complete the screening. Twenty-seven percent of large firms (200 or more workers) offering or requiring a health risk assessment report that more than 75% of their employees complete the assessment, while 41% report no more than 25% of employees complete the assessment (Exhibit 12.2).
Biometric Screening
Biometric screening is a health examination that measures an employee’s risk factors for certain medical issues such as cholesterol, blood pressure, stress, and nutrition. Biometric outcomes may include meeting a target body mass index (BMI) or cholesterol level. As defined by this survey, goals related to smoking are not included.
- Thirteen percent of small firms (3 to 199 workers) and 50% of large firms offering health benefits offer employees the opportunity or ask employees to complete biometric screenings. Among firms with 5,000 or more workers, 65% of firms offering health benefits have biometric screening programs (Exhibit 12.5).
- Firms that offer or ask employees to complete biometric screenings may include additional incentives for those employees who do so. Thirty-two percent of firms with biometric screening programs offer an incentive for employees to complete the screening. Firms with 5,000 or more employees with biometric screening programs are more likely to have an incentive to complete the screening (80%) than firms in other size categories (Exhibit 12.6).
- Among large firms (200 or more workers) with biometric screening programs that offer an incentive to complete biometric screenings, 7% require employees to complete screenings in order to enroll in a health plan.
- Forty-seven percent of large employers (200 or more workers) with biometric screening programs that offer an incentive to complete biometric screenings offer employees who complete biometric screenings lower premium contributions or lower cost sharing (Exhibit 12.7).
- Among large firms (200 or more workers) offering biometric screenings and an incentive for completing the screening, 20% reward or penalize employees for meeting biometric outcomes (Exhibit 12.6). The Affordable Care Act allowed employers to increase the size of their financial incentives for completing health-contingent wellness programs, which can include meeting biometric targets.
- Among firms that reward or penalize employees for meeting biometric outcomes, 93% include targets for blood pressure, 87% include targets for BMI, and 85% include targets for blood cholesterol (Exhibit 12.8).
- There is considerable variation in the size of the incentives that employers offer for meeting biometric outcomes. Among large firms (200 or more workers) offering a reward or penalty for meeting biometric outcomes, the maximum reward is valued at a $150 dollars or less for 16% percent of firms and $1,000 or more for 28% of firms (Exhibit 12.9).
Wellness Programs
For a variety of reasons including efforts to improve health and lower costs, many employers and health plans offer wellness programs. Wellness programs may include exercise programs, health education classes, and stress-management counseling. Wellness programs may be offered directly by the firm, an insurer, or a third-party contractor.
- Seventy-one percent of large firms (200 or more workers) offering health benefits offer programs to help employees stop smoking, 68% offer lifestyle or behavioral coaching, and 61% offer programs to help employees lose weight. Eighty-one percent of large employers offering health benefits report offering at least one of these three programs (Exhibit 12.10).
- Large firms (200 or more workers) offering health benefits are more likely to offer each of the listed wellness programs than small firms (3-199 workers) (Exhibit 12.11).
- To encourage participation in wellness programs, firms may offer financial incentives to employees who participate in or complete wellness programs.
- Sixteen percent of firms offering wellness benefits offer an incentive to encourage employees to participate in or complete wellness programs. Large firms offering wellness programs are more likely to offer an incentive than small firms (38% vs. 15%). Over half (58%) of firms with more than 5,000 employees who offer a wellness program offer an incentive to participate in or complete wellness programs (Exhibit 12.12).
- Sixty-five percent of large firms (200 or more workers) with an incentive for workers to participate in or complete wellness programs offer cash (including a contribution to an HRA or HSA) or merchandise for participating in or completing a wellness program. Thirty-four percent of those firms offer lower premium contributions or cost sharing, and 19% offer some other type of incentive (Exhibit 12.14).
- Fifty-nine percent of large firms (200 or more workers) that offer an incentive for wellness programs offered incentives based on whether employees participated in the program (Exhibit 12.13).
- Firms with at least one of the listed wellness programs were asked to report the maximum reward or penalty an employee could earn for all of the firm’s health promotion activities combined. For some employers, the maximum incentive may include rewards or penalties for activities related to health risk assessments and biometric screening. Some employers do not offer incentives for individual activities, but offer rewards to employees who complete a variety of activities. Among large firms offering incentives for wellness or health promotion programs, 22% reported that the maximum value of all their incentives for health risk assessments, biometric screenings, and wellness programs combined is $150 or less. Fifteen percent of these employers indicate that the maximum reward is more than $1,000 (Exhibit 12.15).
- Firms that offer an incentive for employees to participate in or complete wellness or health promotion programs were asked how effective they believed incentives were for encouraging participation. Twenty-seven percent of large firms offering health benefits and incentives to participate in wellness or health promotion programs think incentives are “very effective” at encouraging employees to participate (Exhibit 12.16).
Disease Management
Disease management programs try to improve health and reduce costs for enrollees with chronic illness by teaching patients about their disease and suggesting treatment options. These programs can help employees with conditions such as diabetes, asthma, hypertension, and high cholesterol.
- Thirty-three percent of firms that offer health benefits offer disease management programs. Large firms (200 or more workers) are more likely than small firms to offer disease management programs (68% vs. 32%) (Exhibit 12.17).
- Eight percent of large firms that offer disease management programs offer incentives to employees who participate in or complete the programs. This percentage is highest among firms with 5,000 or more workers (24%) (Exhibit 12.18).
- Firms that offer disease management programs have different methods for enrolling eligible employees. In 54% of large firms offering disease management programs, employees have to enroll if they want to participate. In 13% of these firms, in at least some cases, employees have to opt-out if they do not want to participate (Exhibit 12.19)
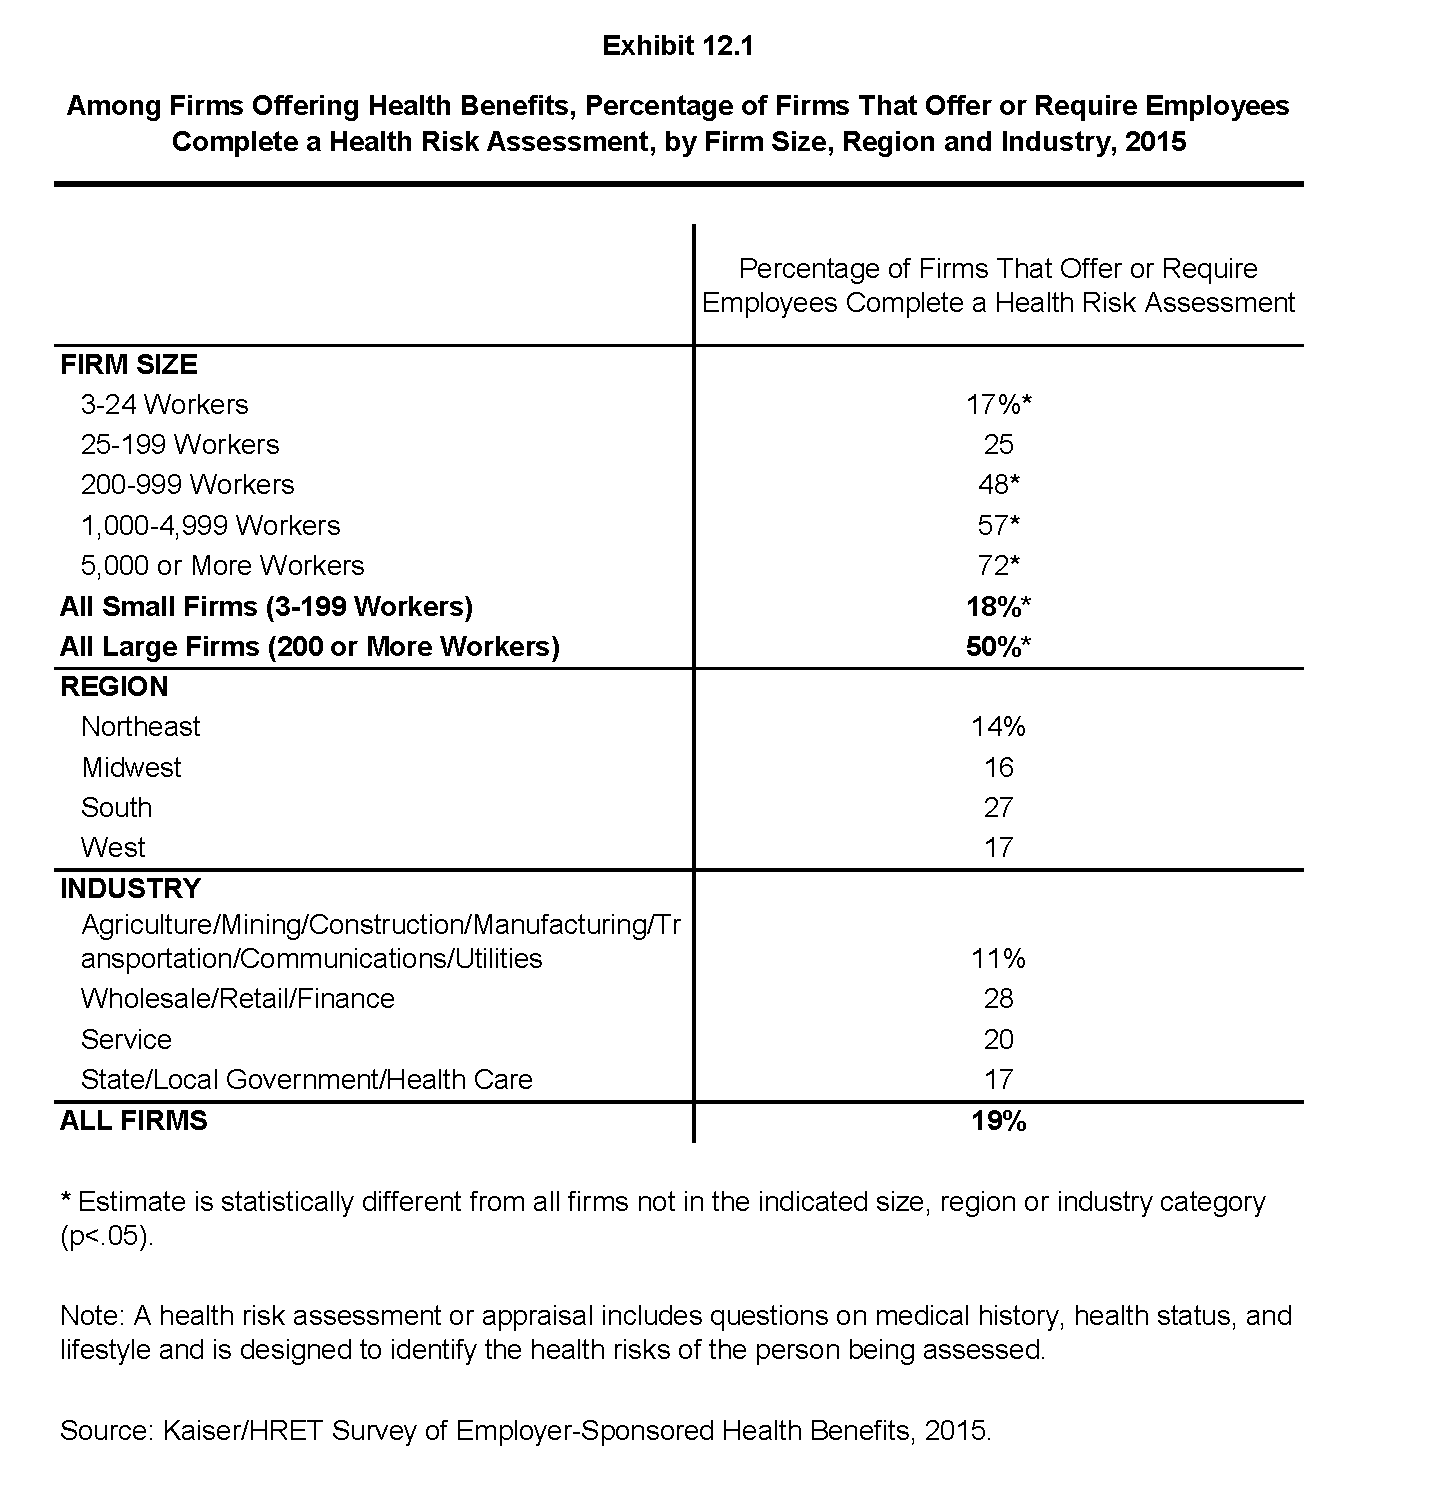
Among Firms Offering Health Benefits, Percentage of Firms That Offer or Require Employees Complete a Health Risk Assessment, by Firm Size, Region and Industry, 2015
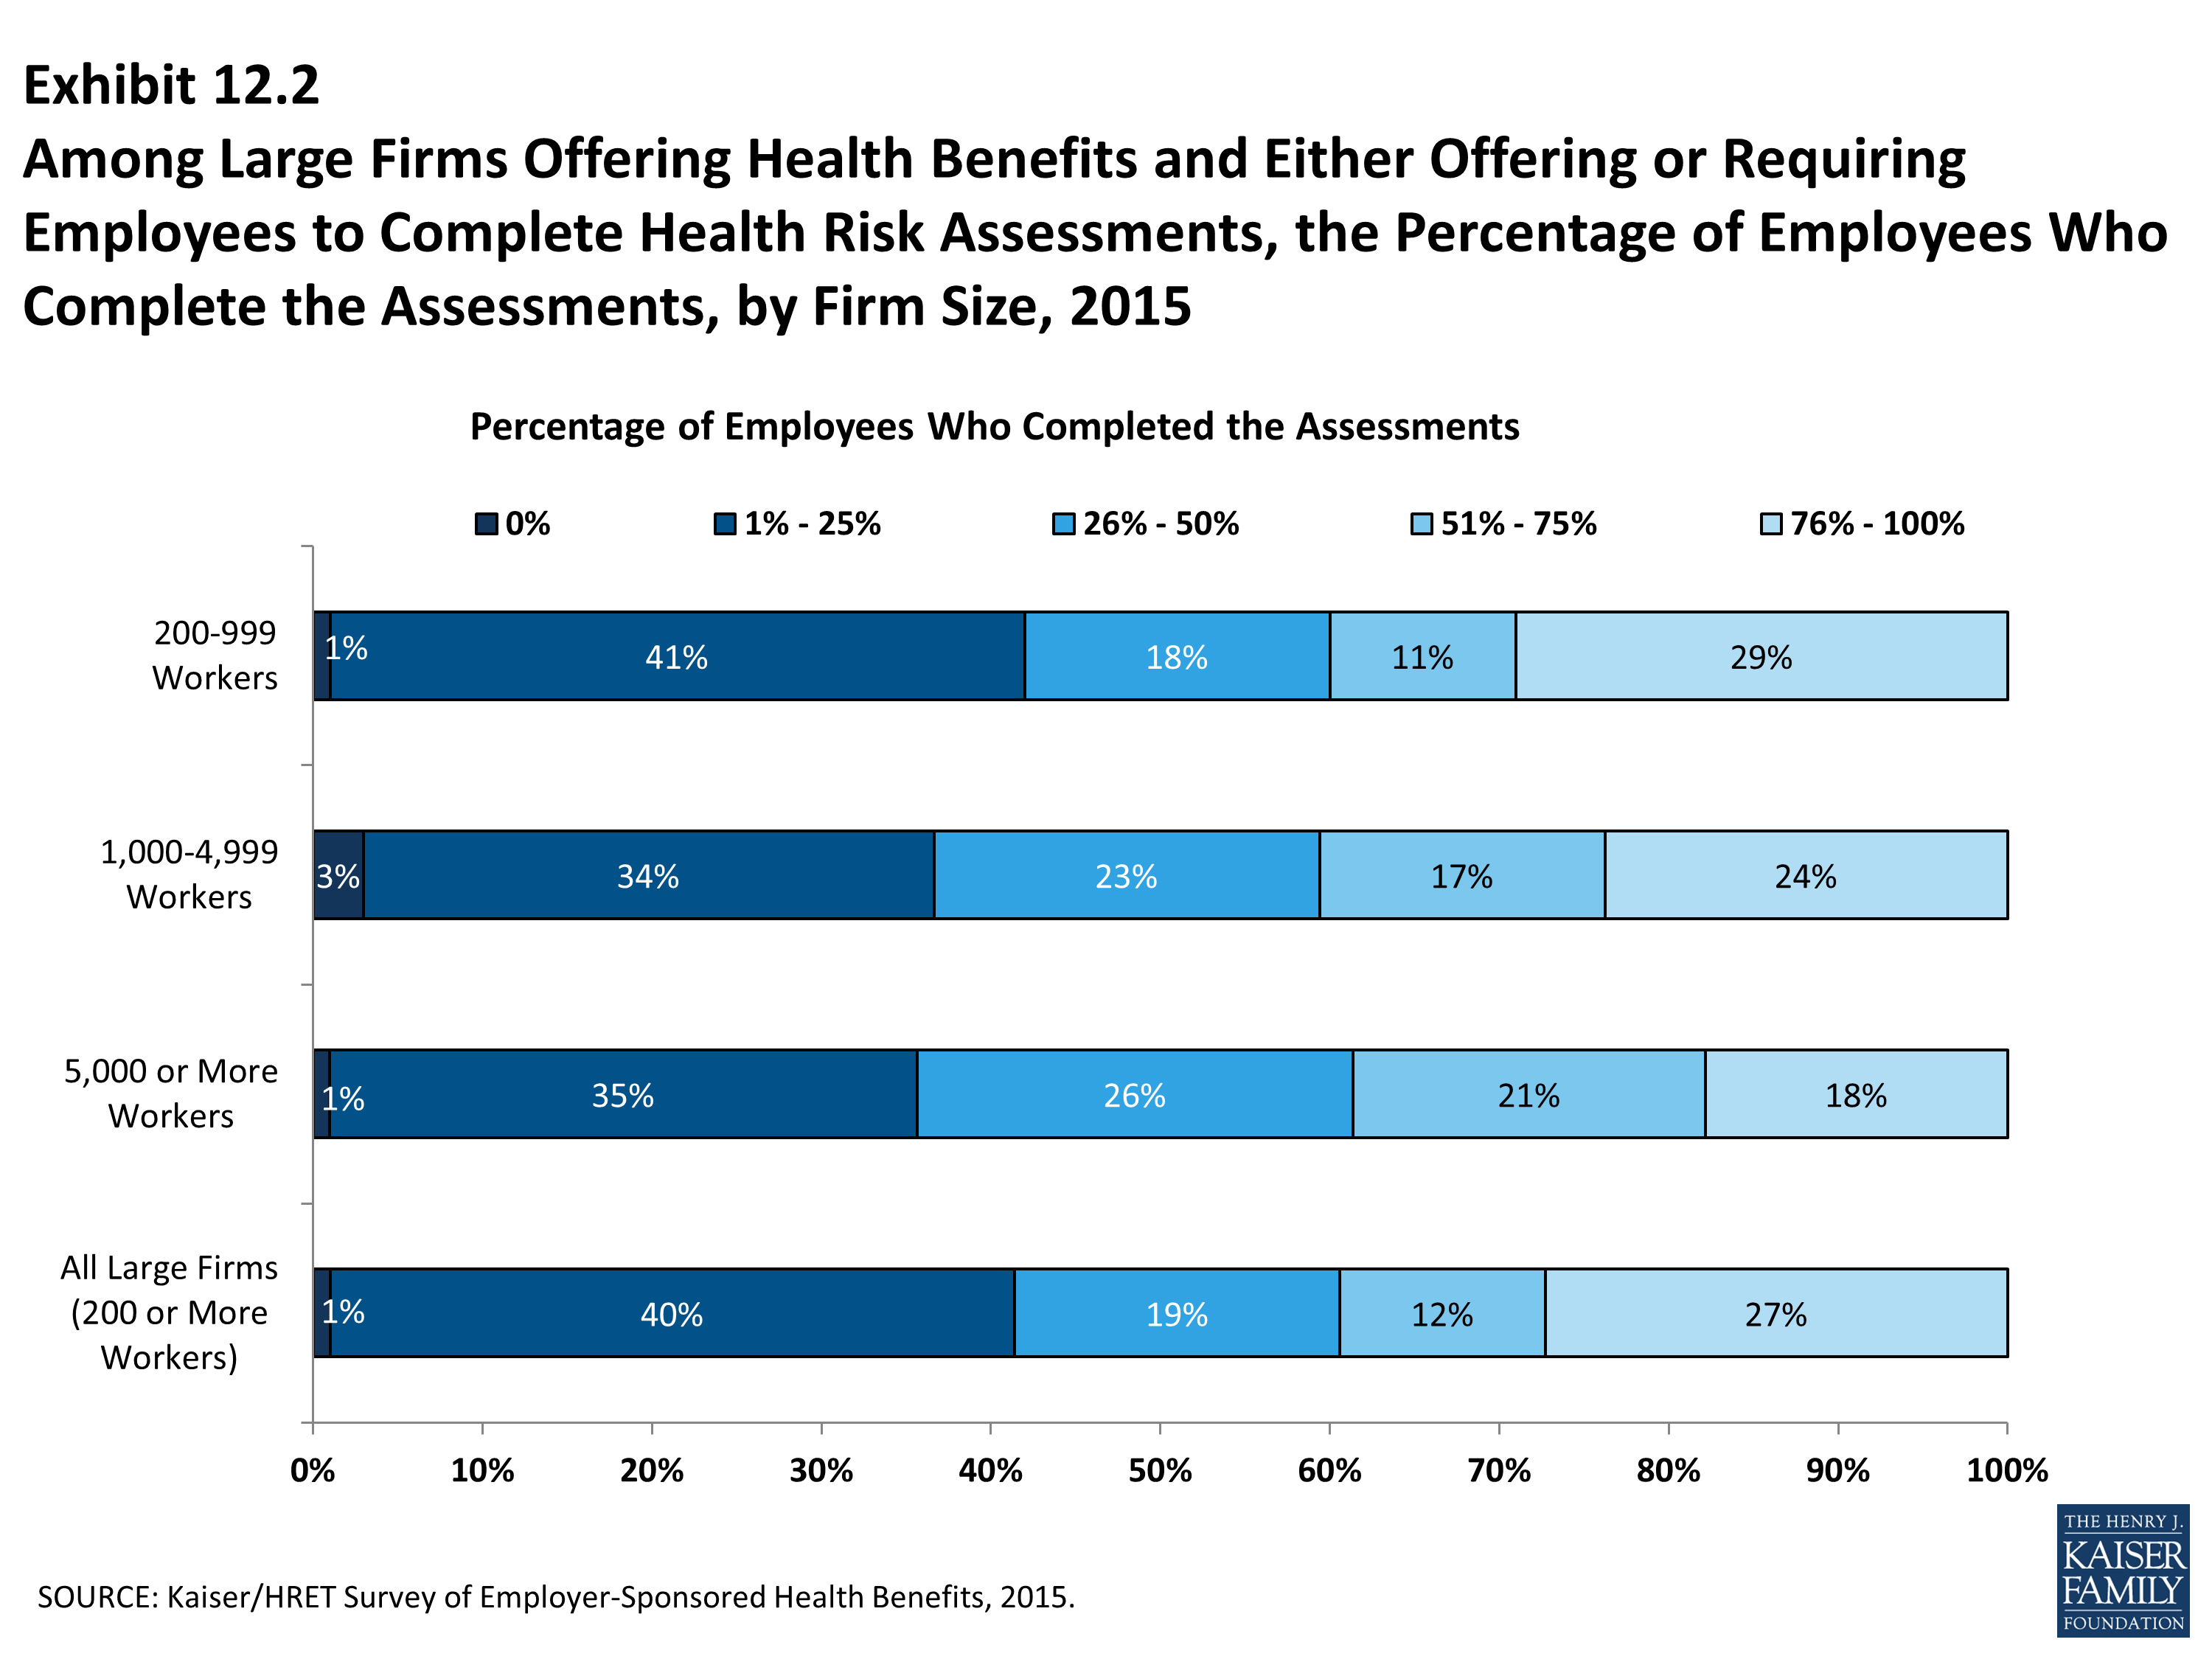
Among Large Firms Offering Health Benefits and Either Offering or Requiring Employees to Complete Health Risk Assessments, the Percentage of Employees Who Complete the Assessments, by Firm Size, 2015
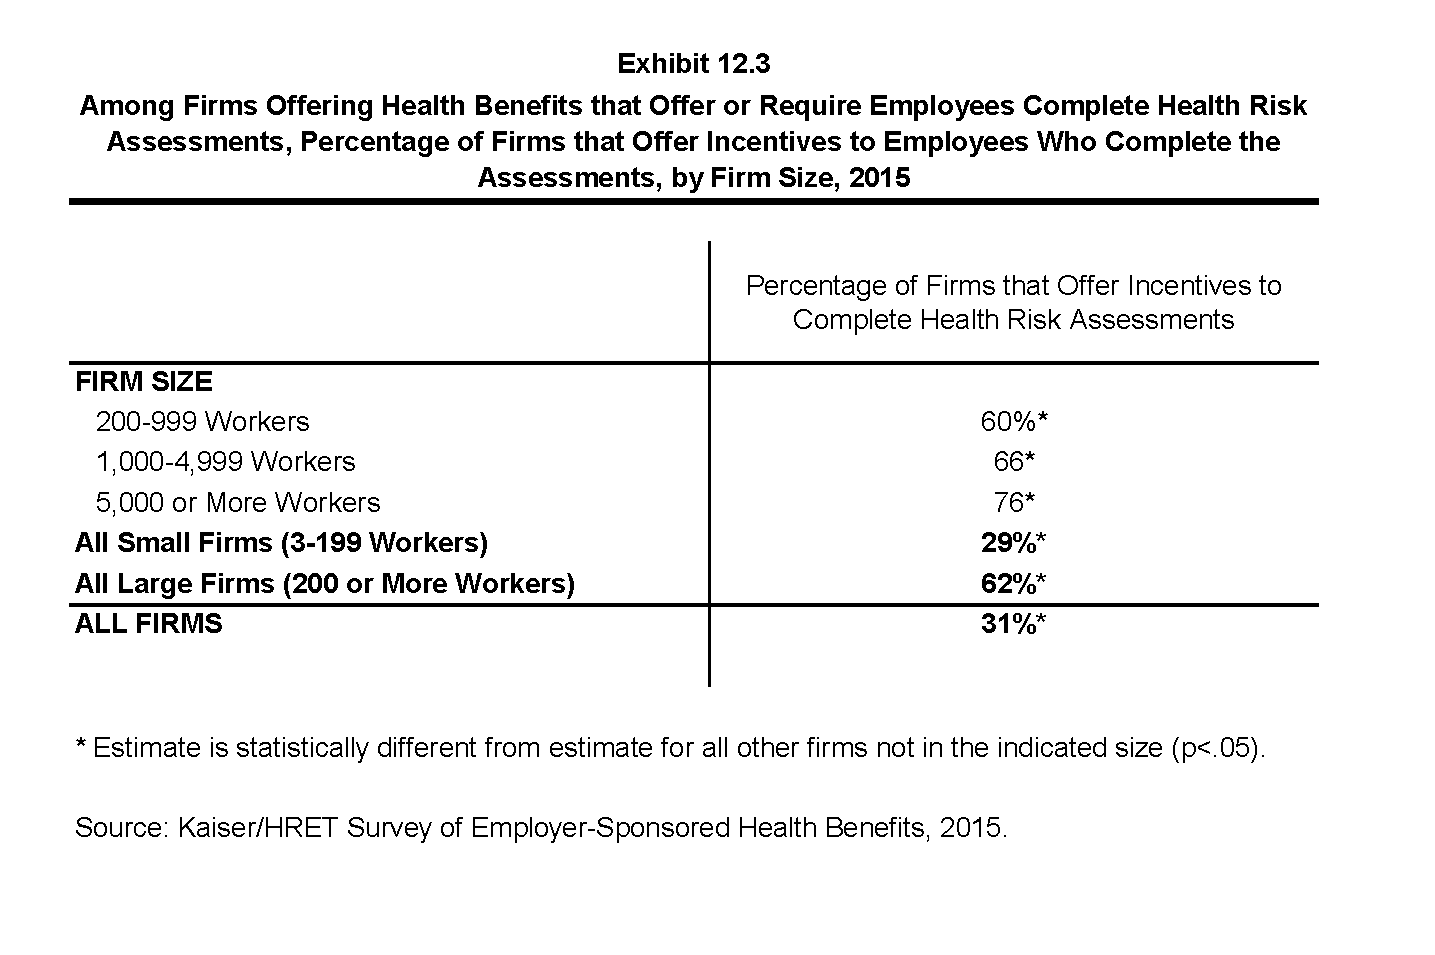
Among Firms Offering Health Benefits that Offer or Require Employees Complete Health Risk Assessments, Percentage of Firms that Offer Incentives to Employees Who Complete the Assessments, by Firm Size, 2015
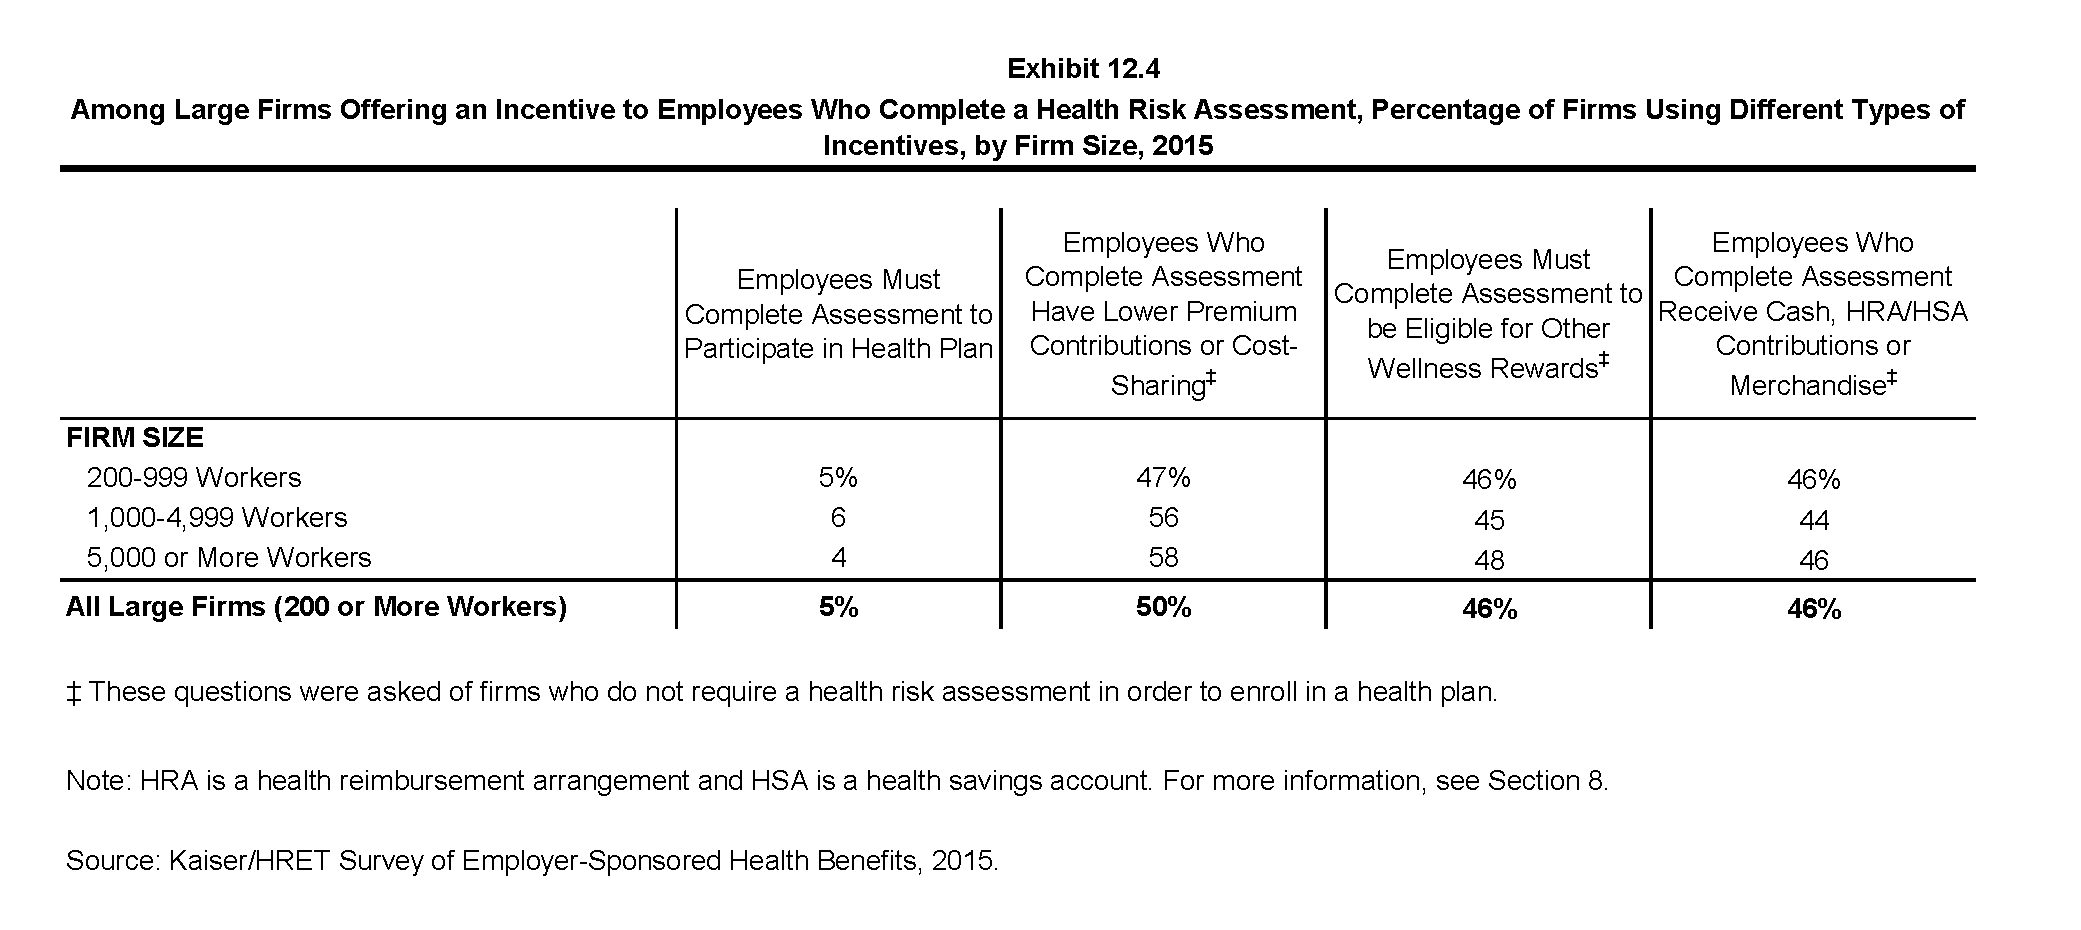
Among Large Firms Offering an Incentive to Employees Who Complete a Health Risk Assessment, Percentage of Firms Using Different Types of Incentives, by Firm Size, 2015
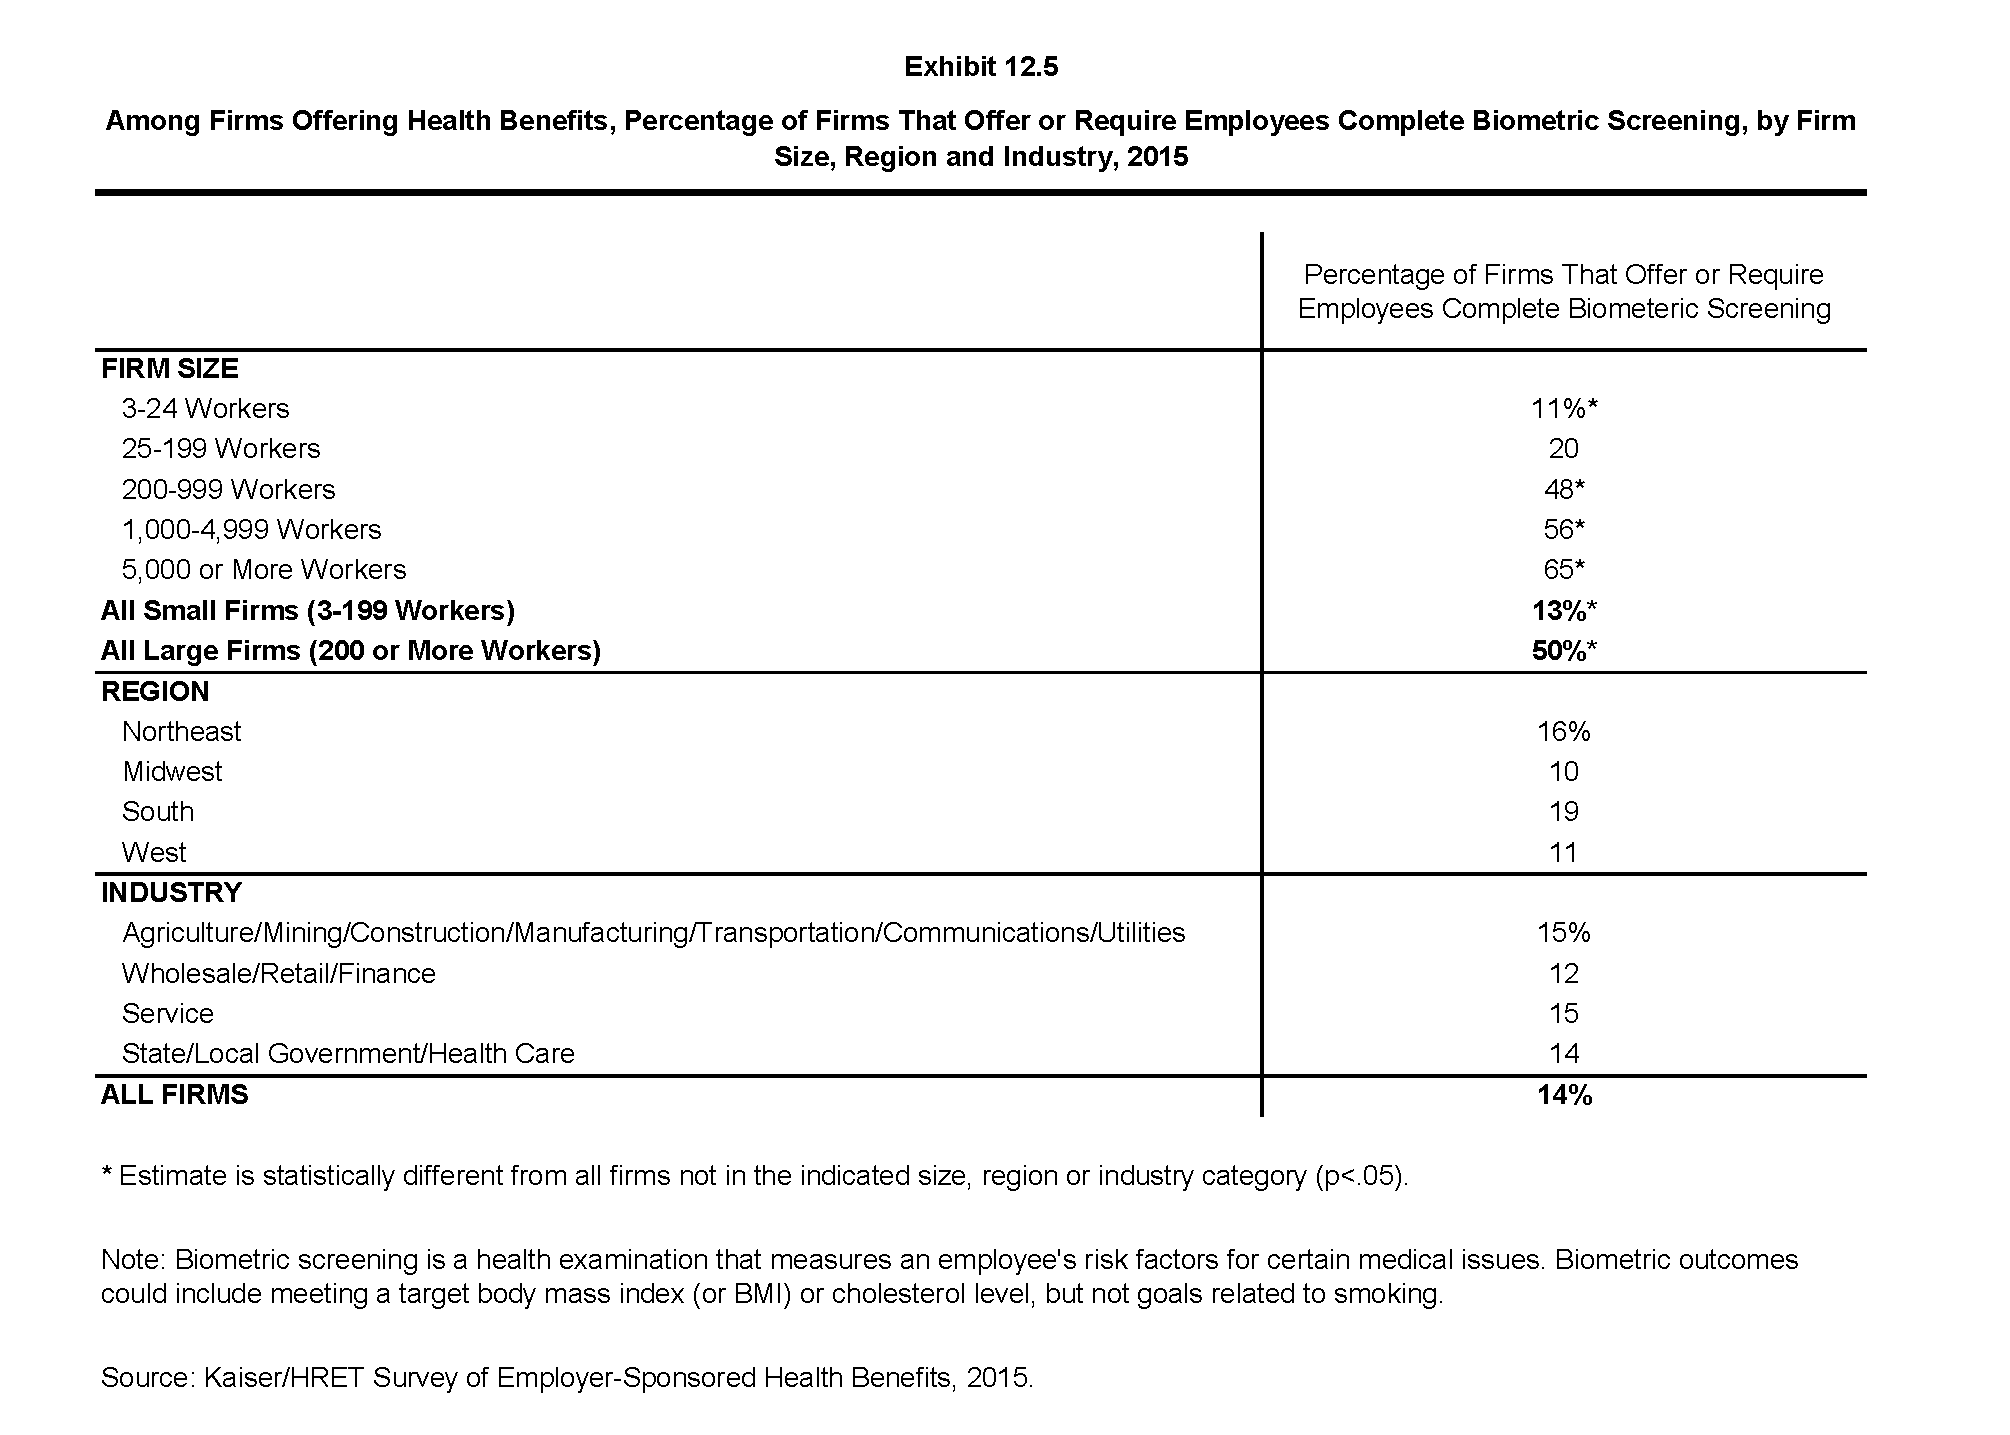
Among Firms Offering Health Benefits, Percentage of Firms That Offer or Require Employees Complete Biometric Screening, by Firm Size, Region and Industry, 2015
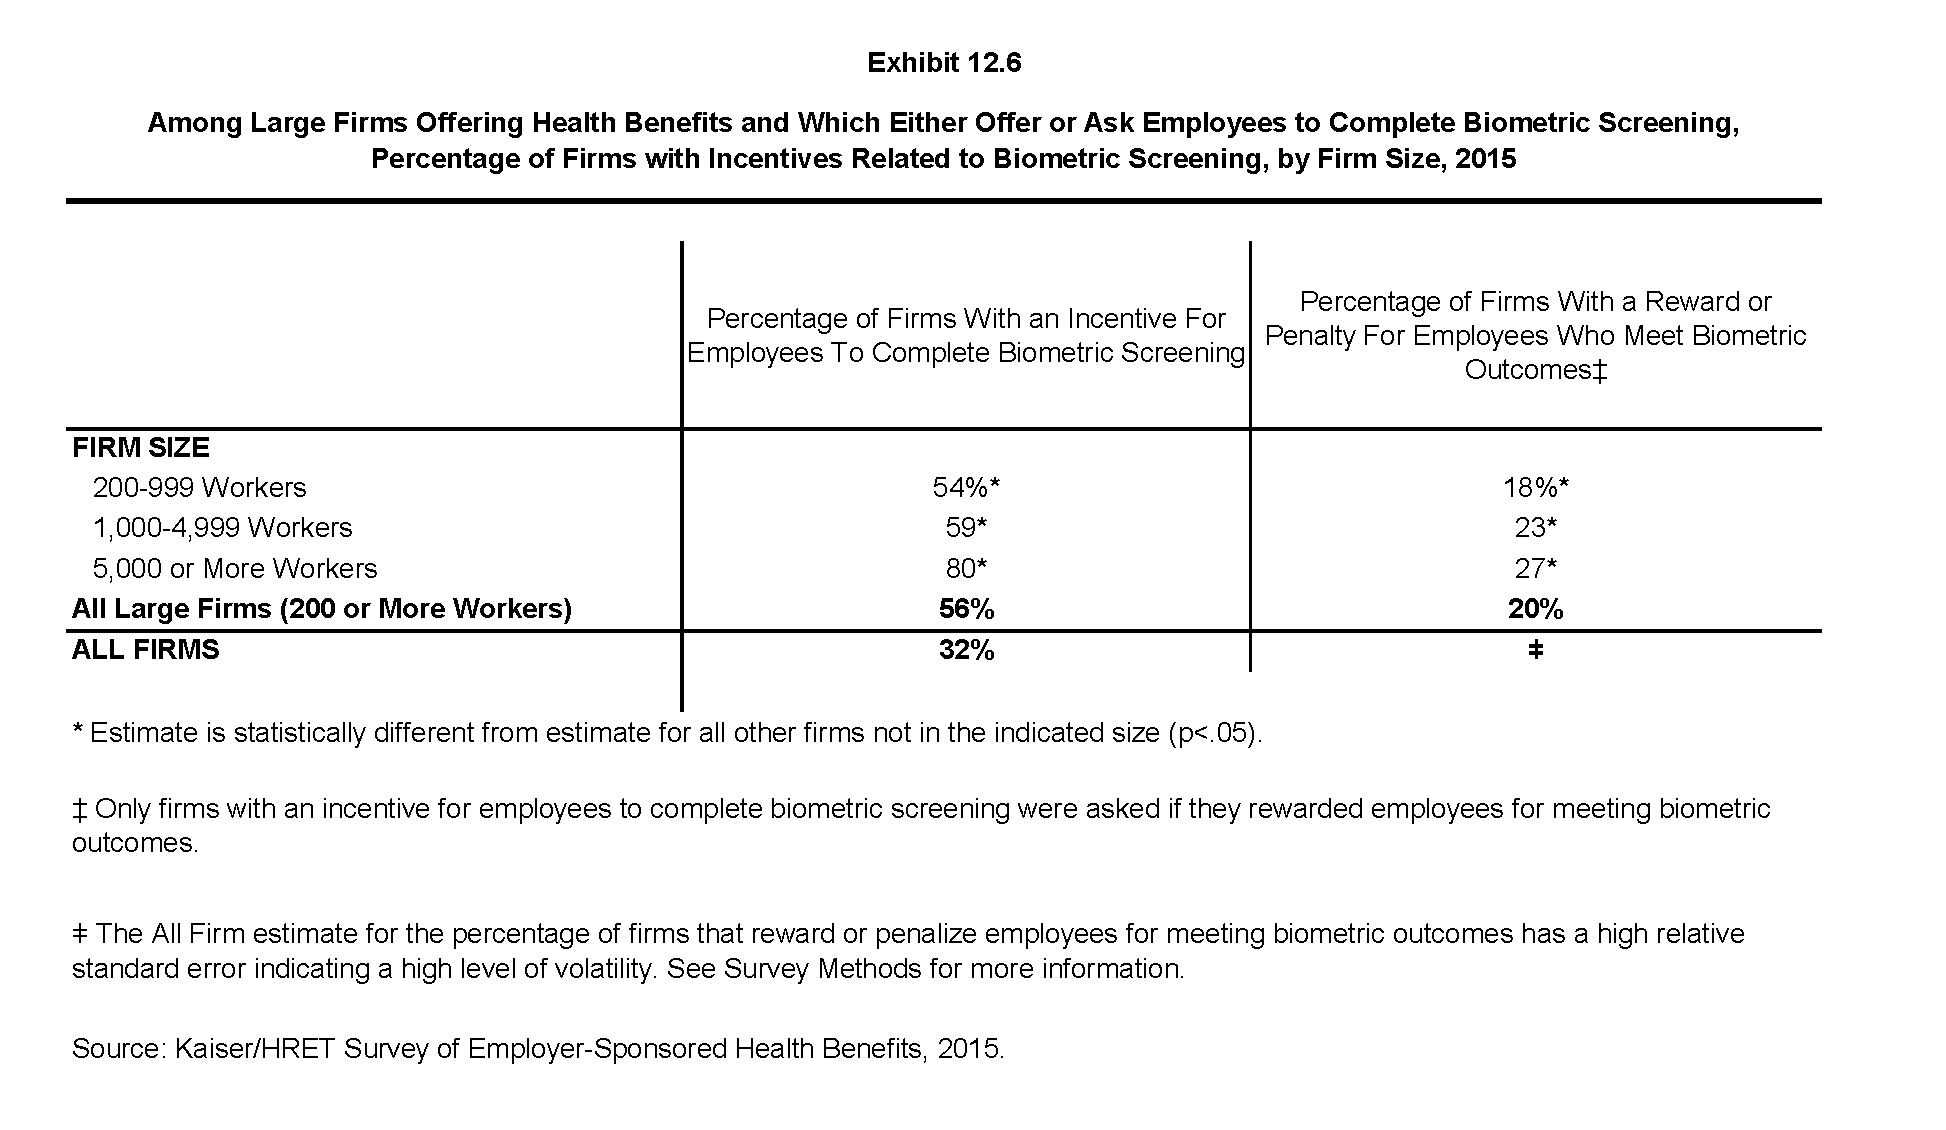
Among Large Firms Offering Health Benefits and Which Either Offer or Ask Employees to Complete Biometric Screening, Percentage of Firms with Incentives Related to Biometric Screening, by Firm Size, 2015
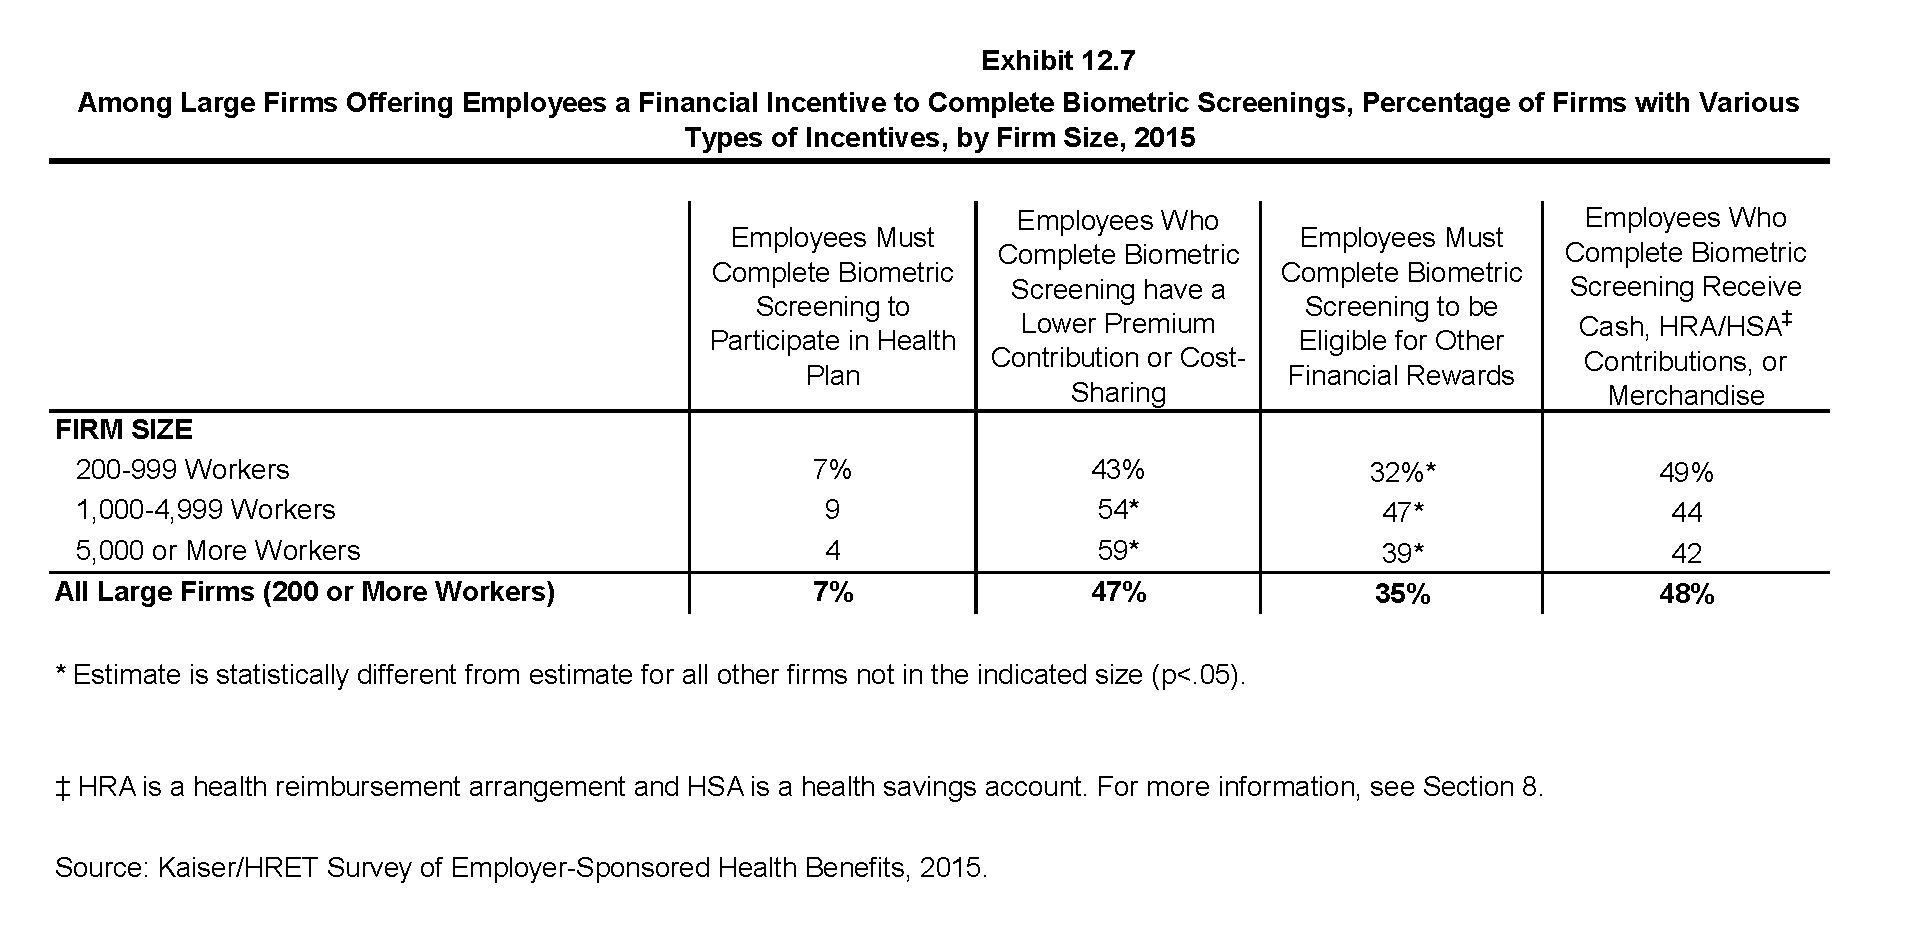
Among Large Firms Offering Employees a Financial Incentive to Complete Biometric Screenings, Percentage of Firms with Various Types of Incentives, by Firm Size, 2015
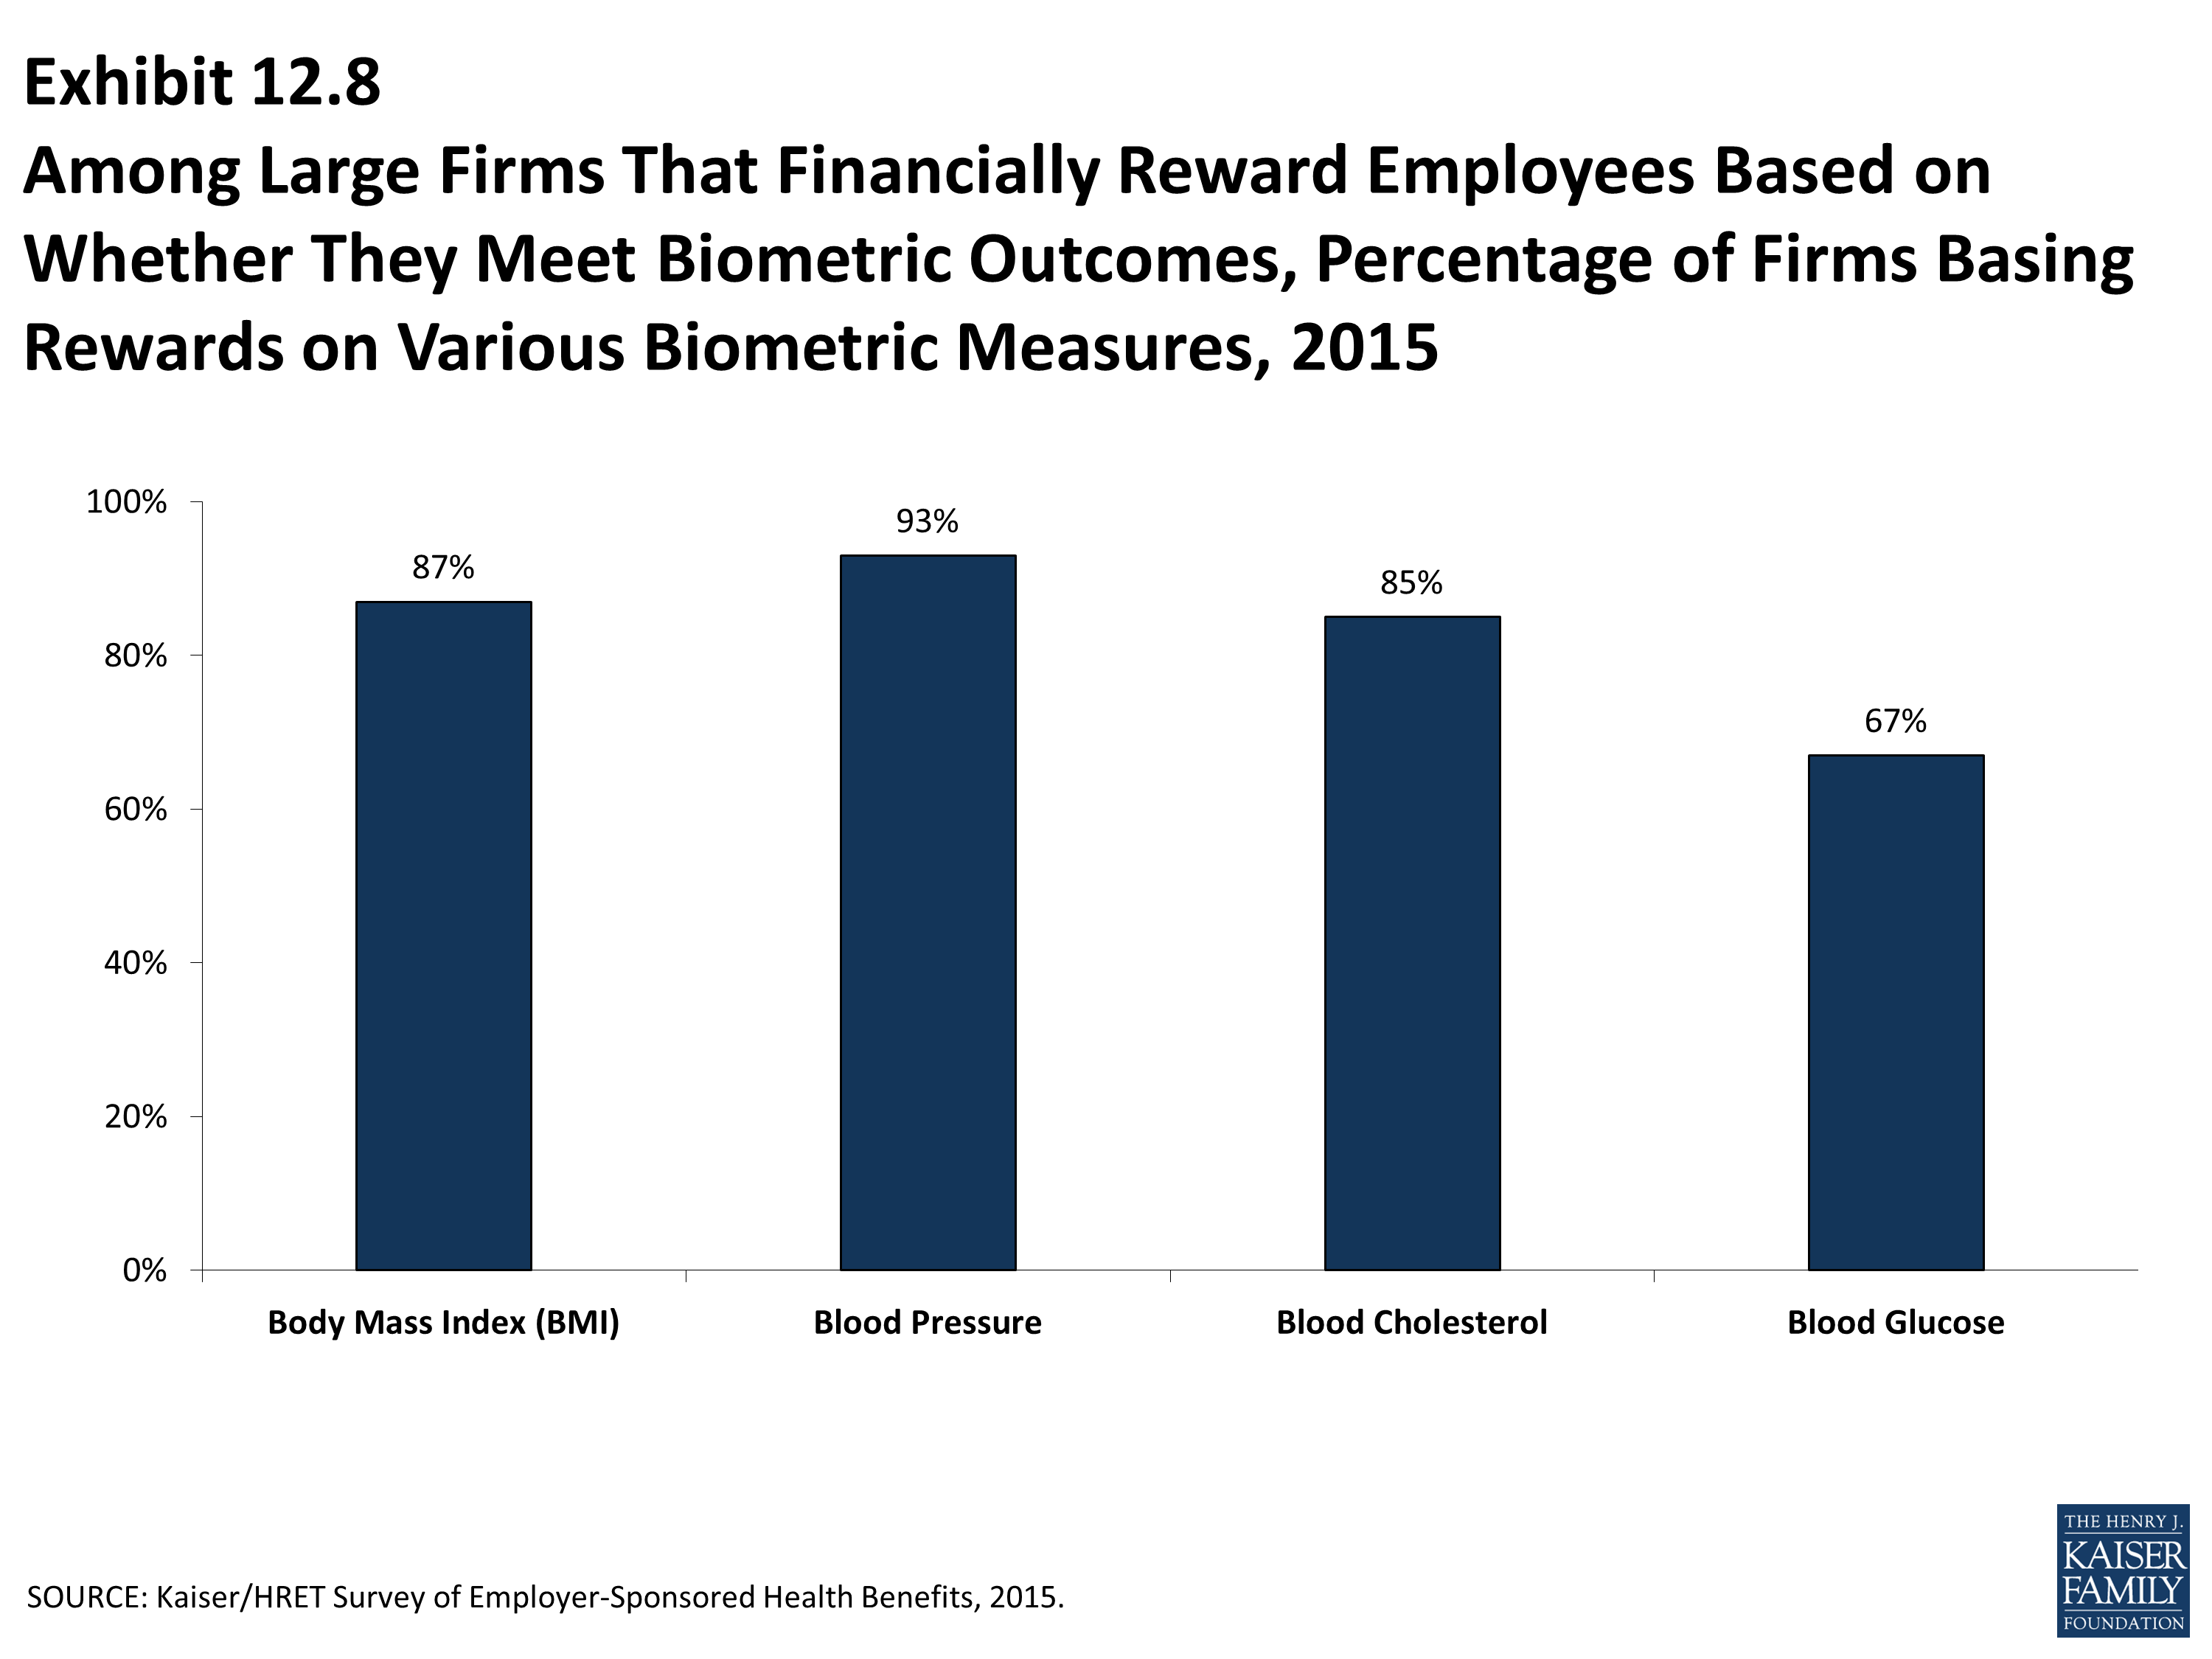
Among Large Firms That Financially Reward Employees Based on Whether They Meet Biometric Outcomes, Percentage of Firms Basing Rewards on Various Biometric Measures, 2015
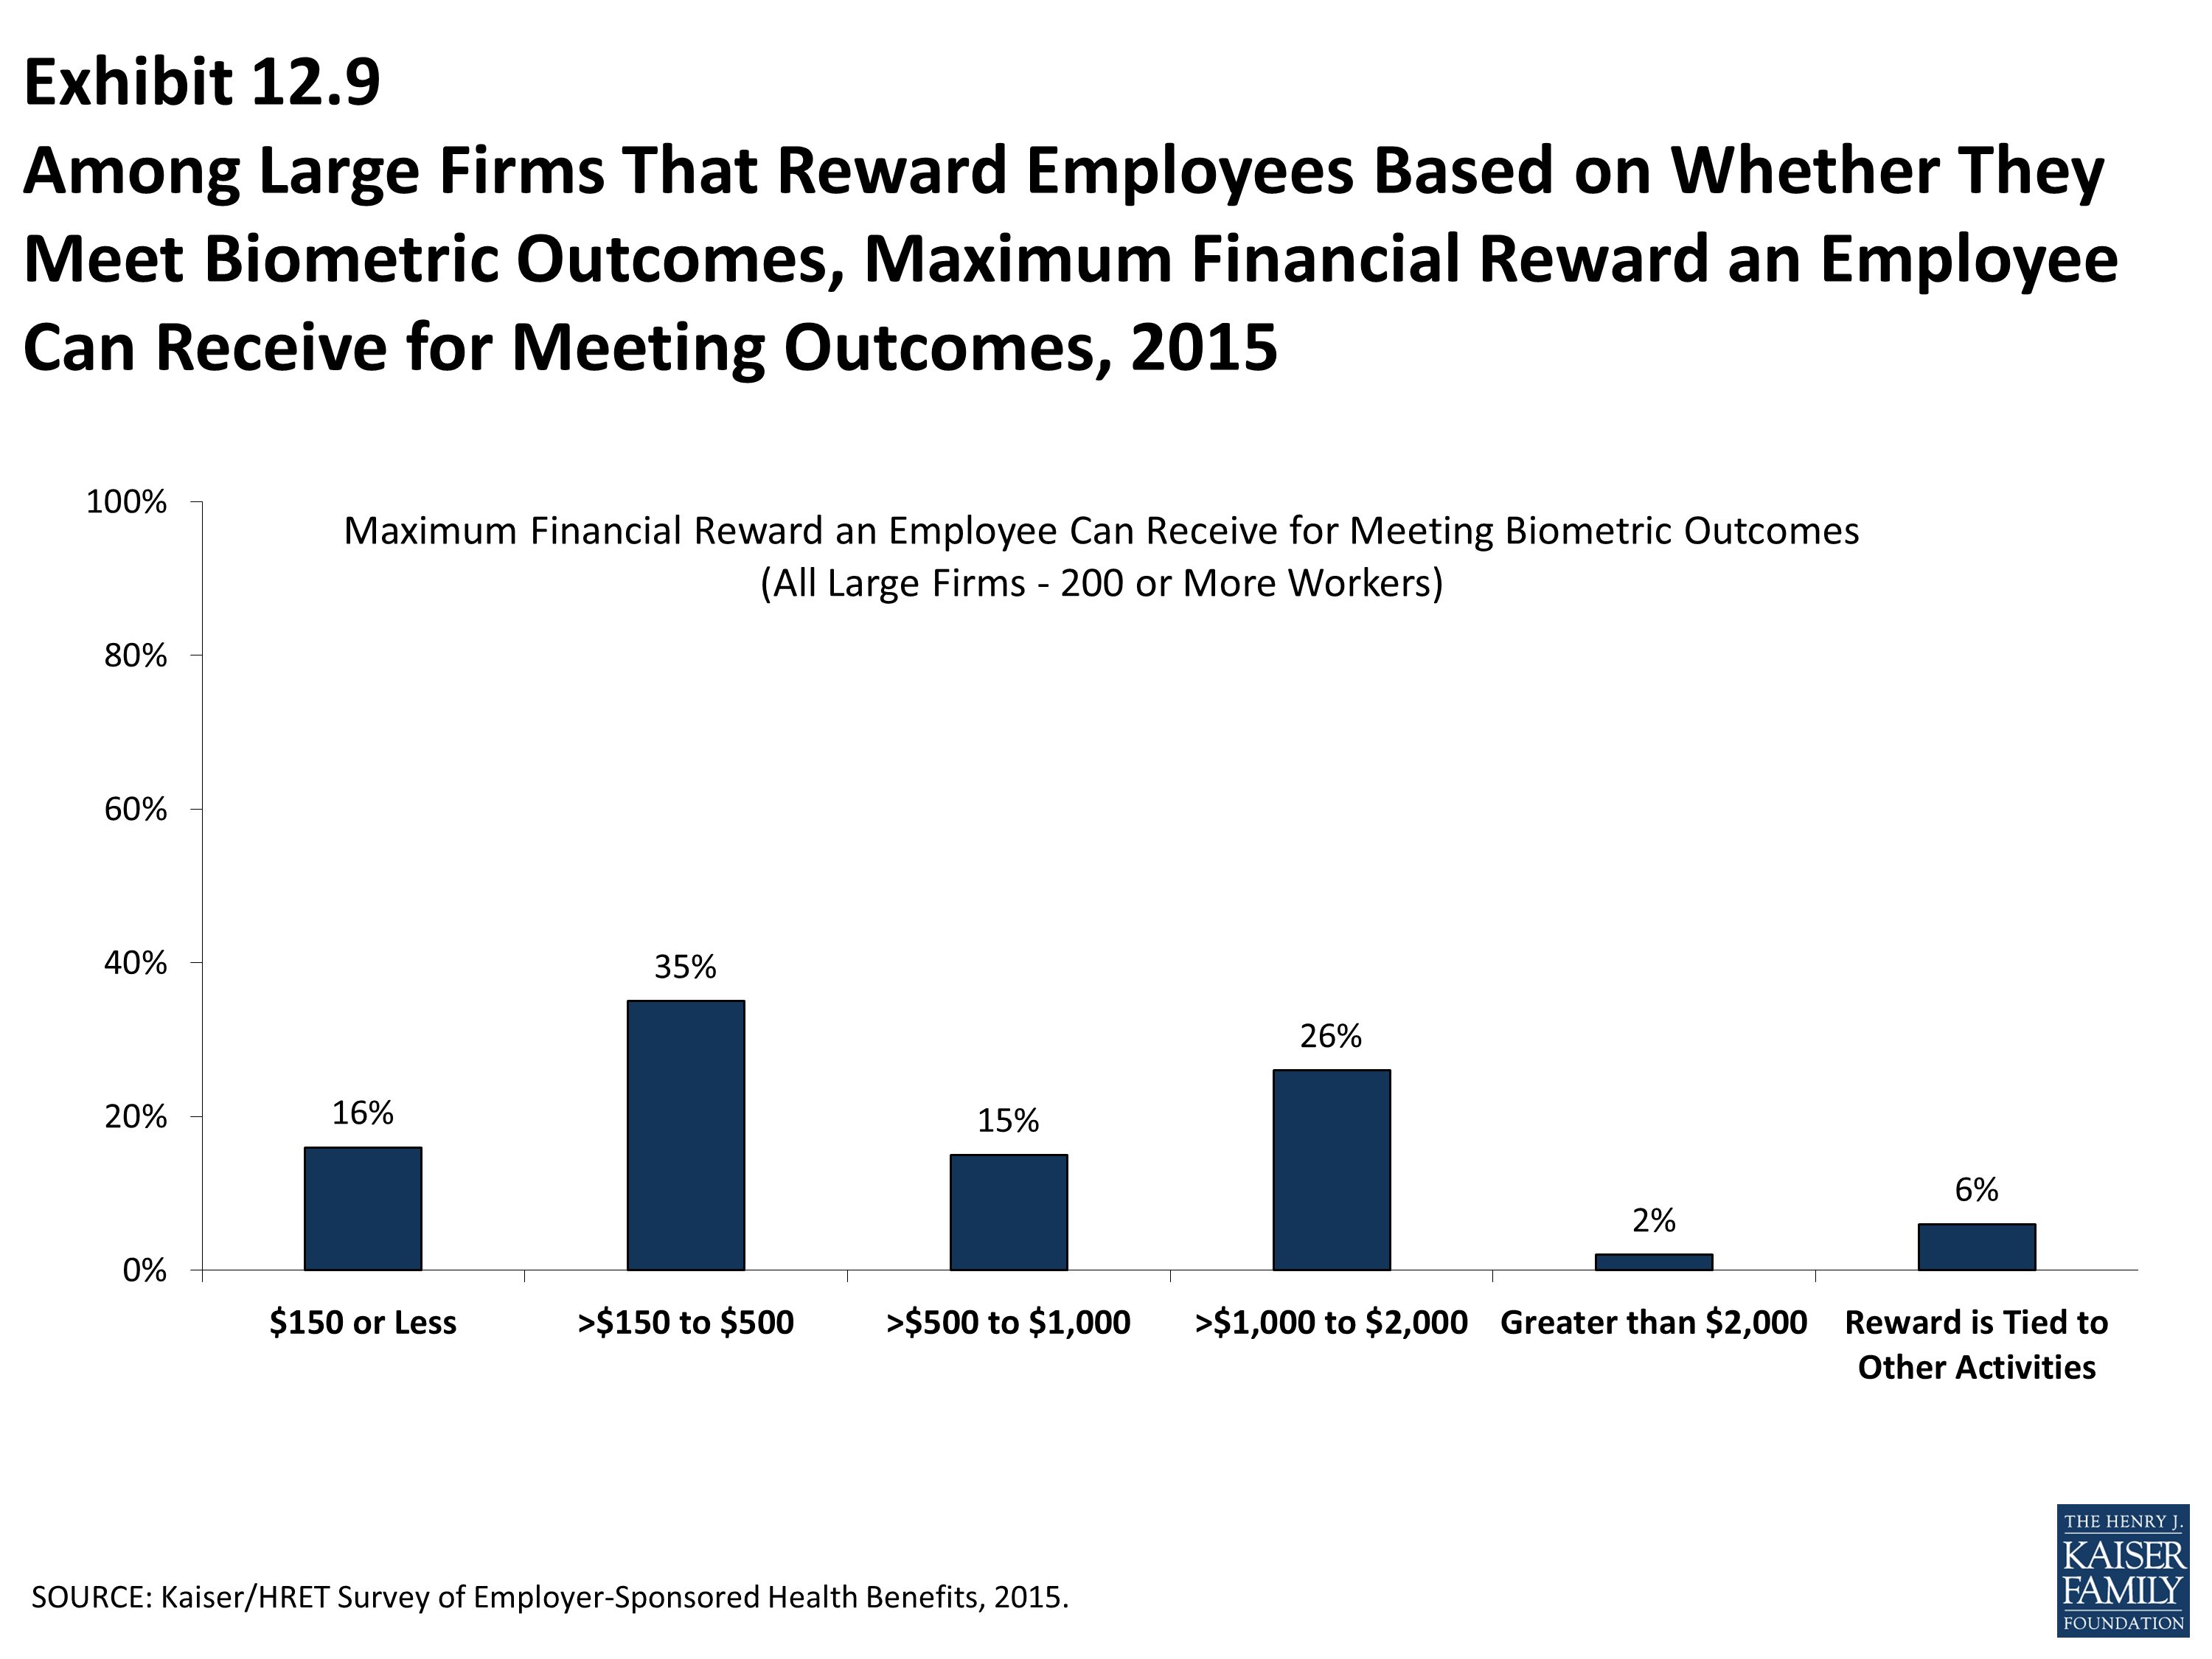
Among Large Firms That Reward Employees Based on Whether They Meet Biometric Outcomes, Maximum Financial Reward an Employee Can Receive for Meeting Outcomes, 2015
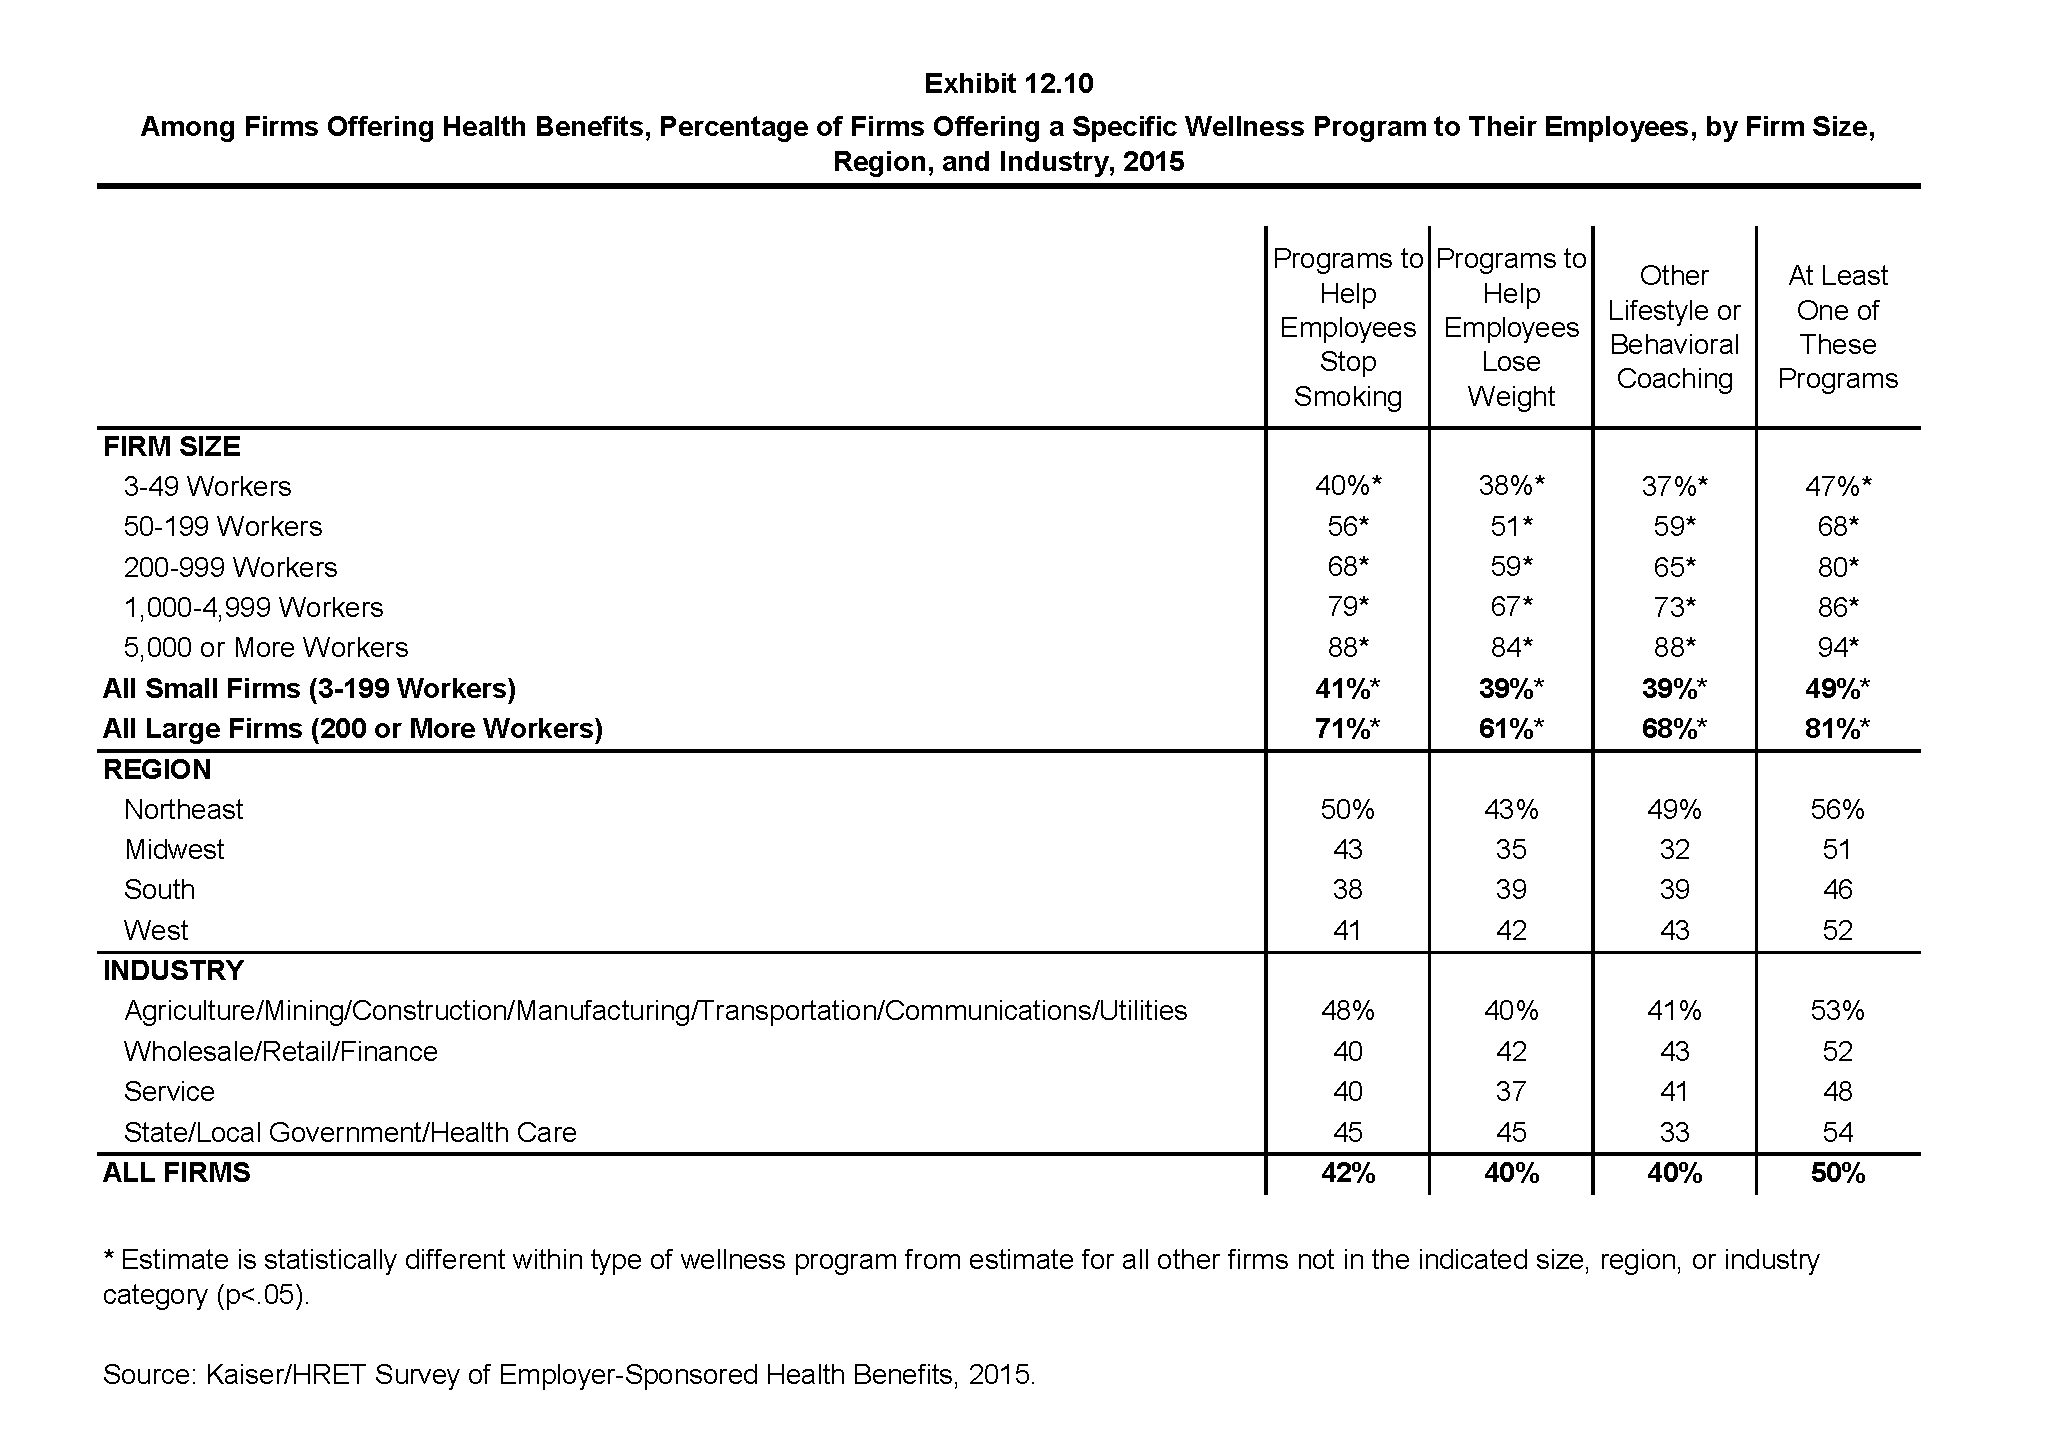
Among Firms Offering Health Benefits, Percentage of Firms Offering a Specific Wellness Program to Their Employees, by Firm Size, Region, and Industry, 2015
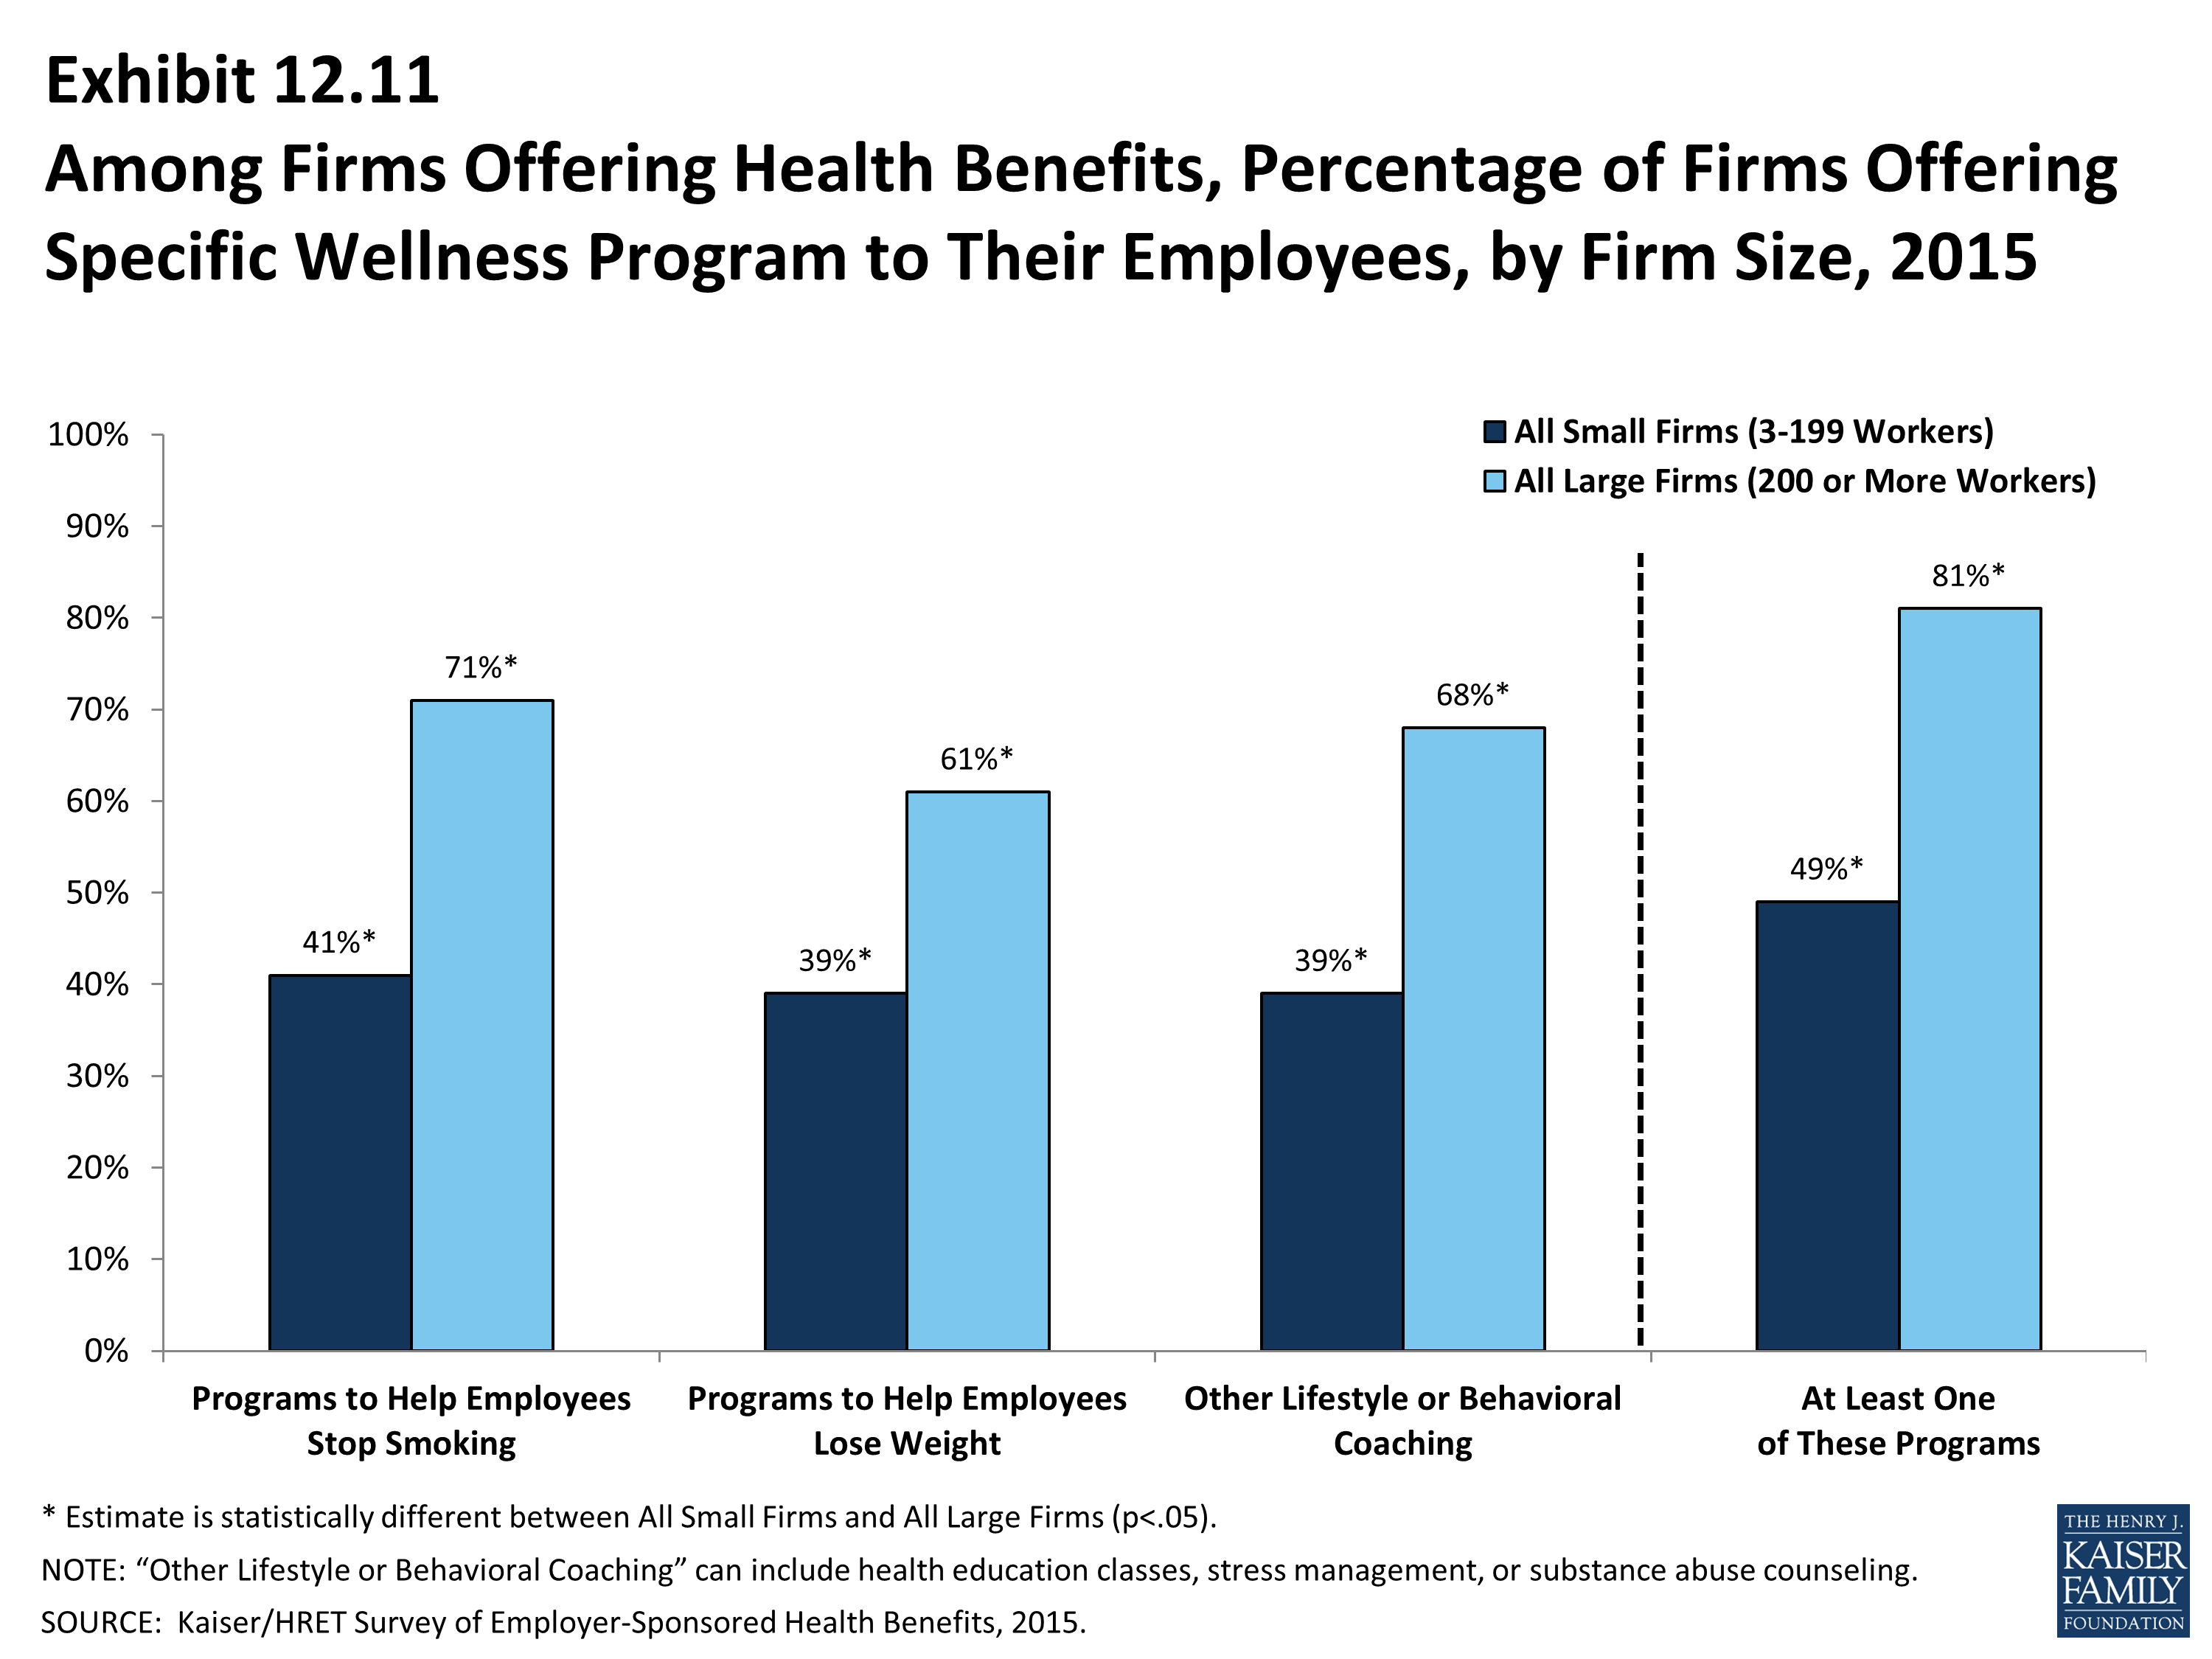
Among Firms Offering Health Benefits, Percentage of Firms Offering Specific Wellness Program to Their Employees, by Firm Size, 2015
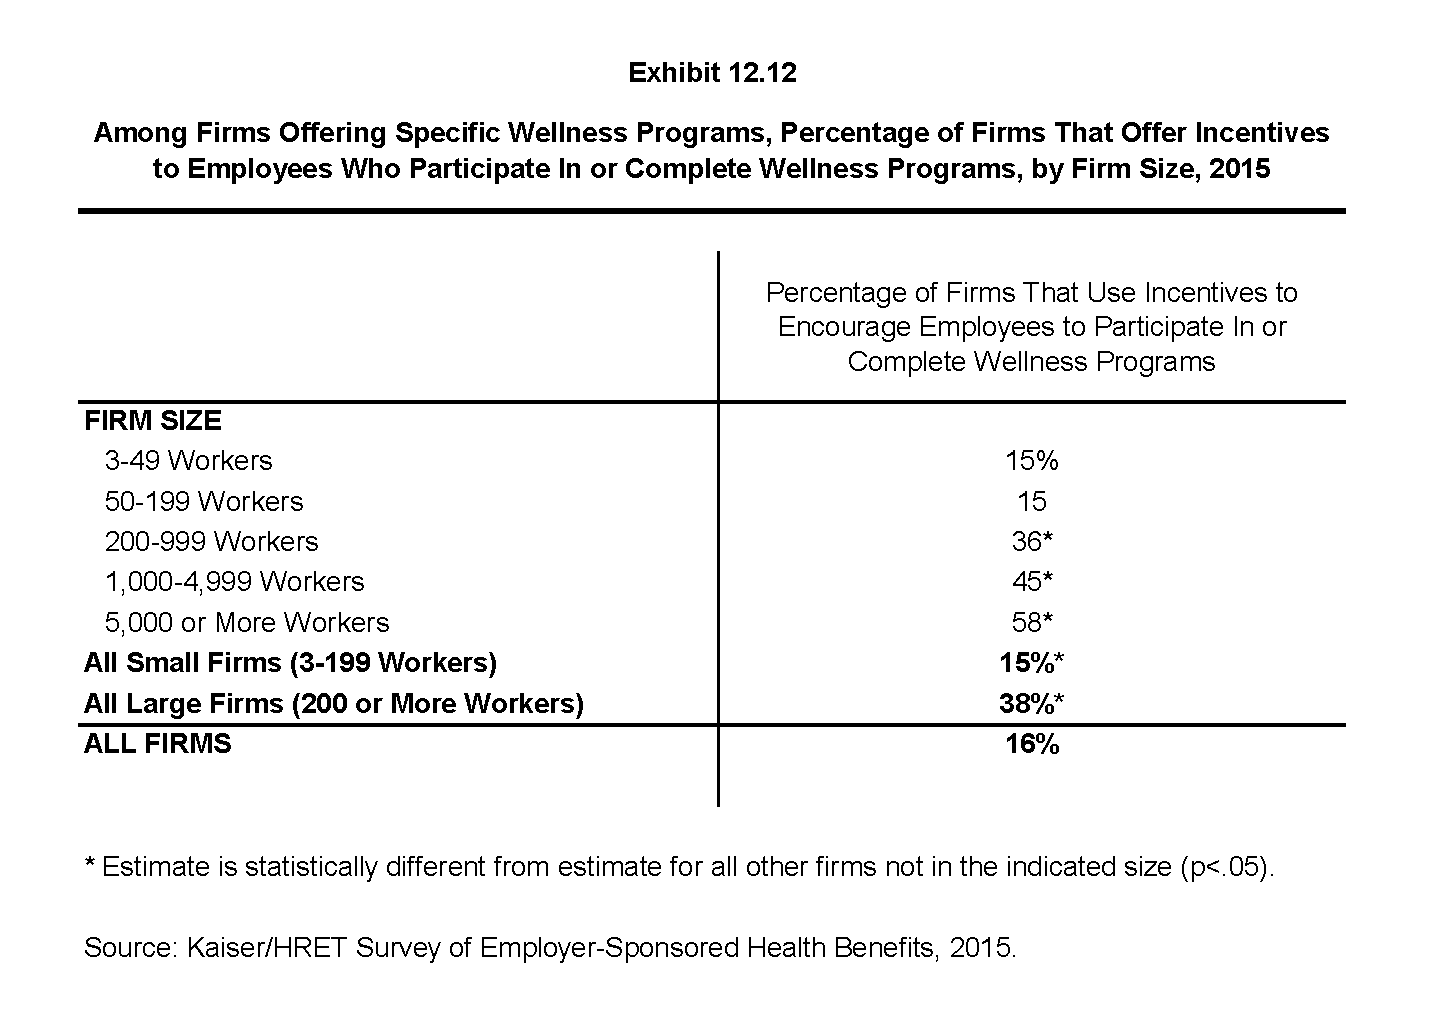
Among Firms Offering Specific Wellness Programs, Percentage of Firms That Offer Incentives to Employees Who Participate In or Complete Wellness Programs, by Firm Size, 2015
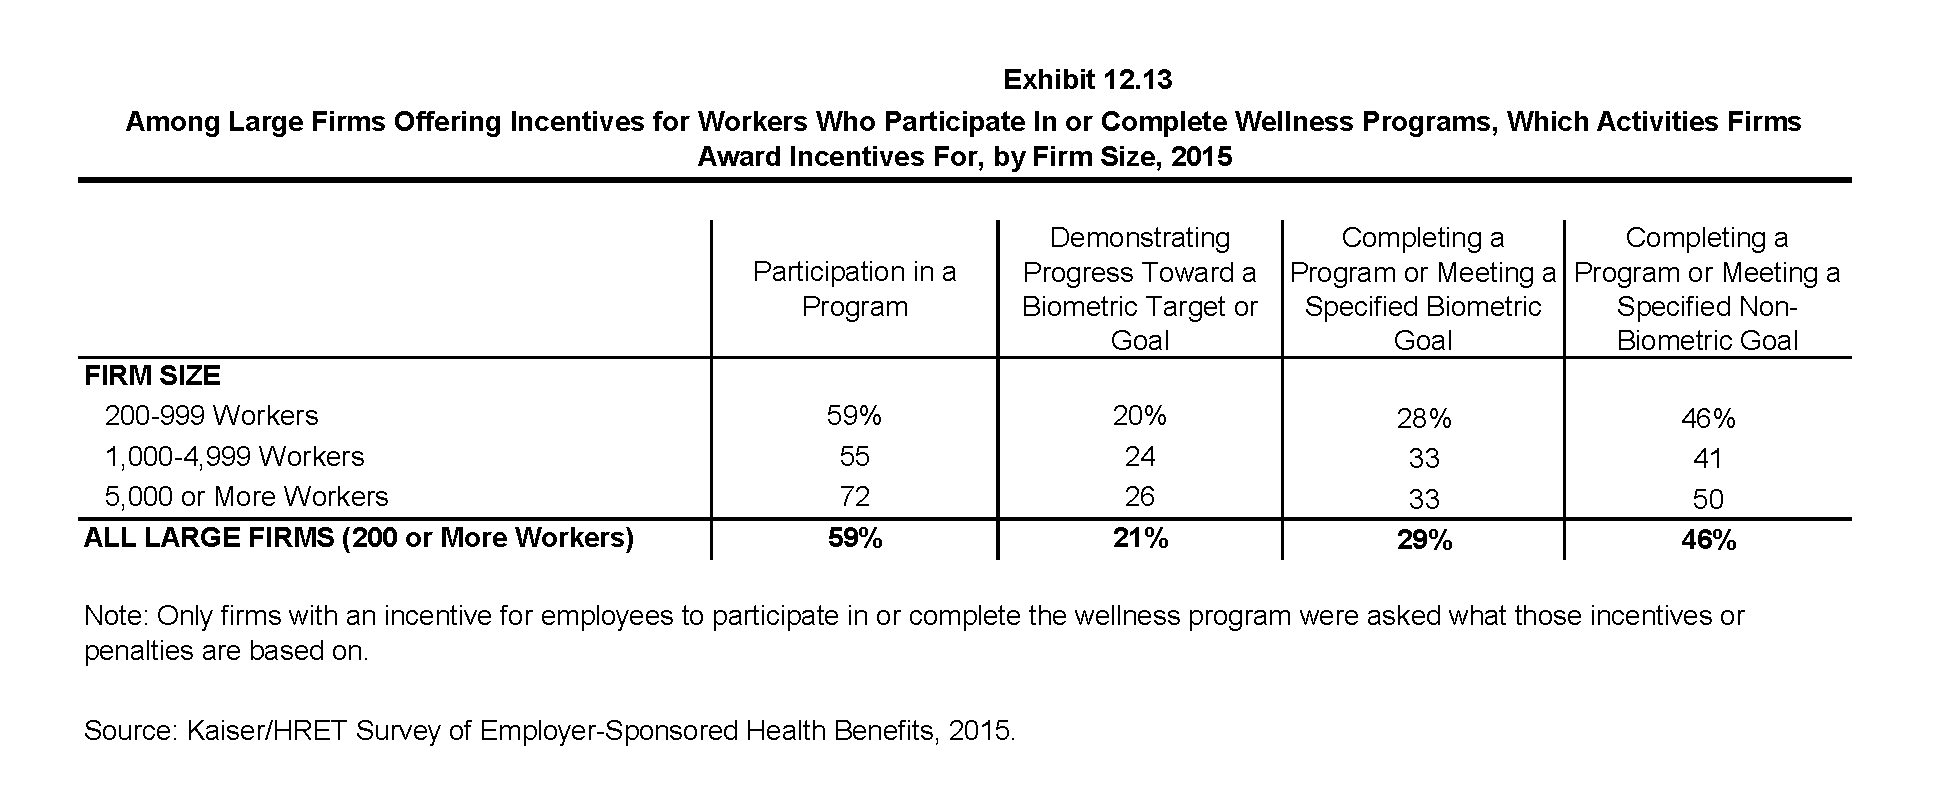
Among Large Firms Offering Incentives for Workers Who Participate In or Complete Wellness Programs, Which Activities Firms Award Incentives For, by Firm Size, 2015
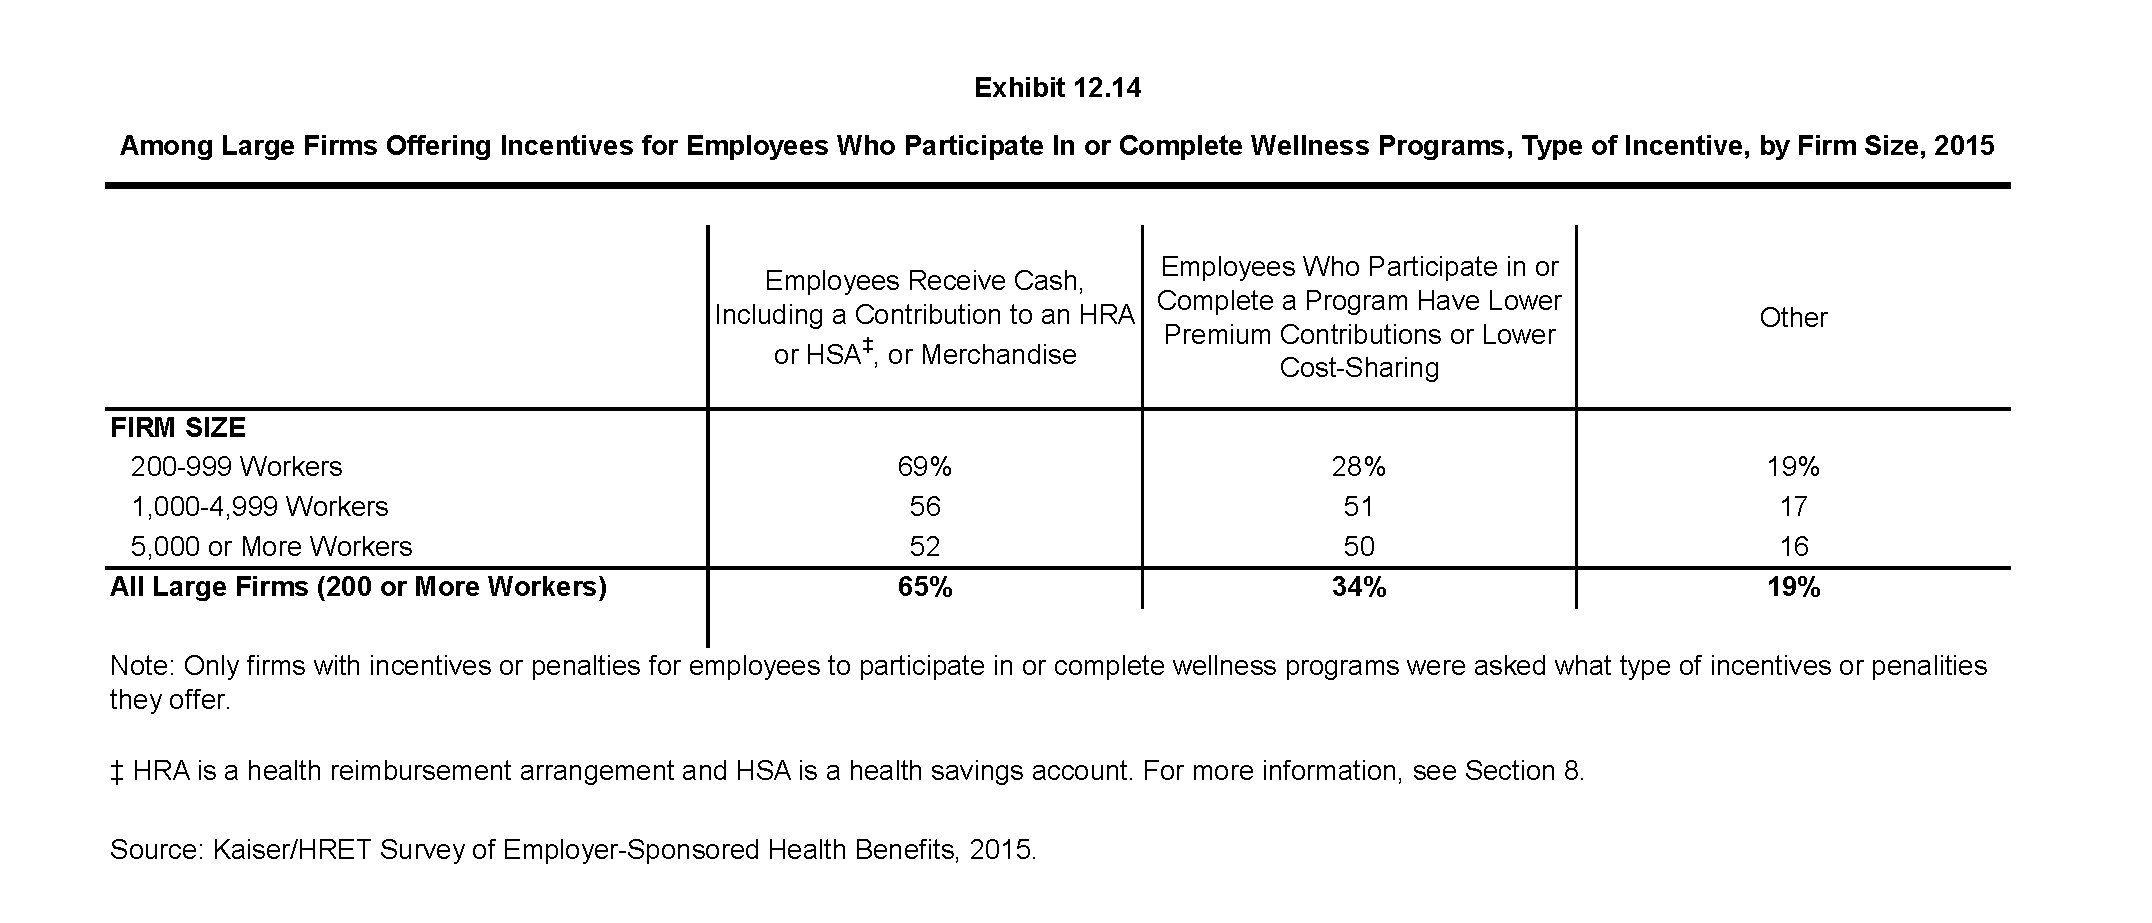
Among Large Firms Offering Incentives for Employees Who Participate In or Complete Wellness Programs, Type of Incentive, by Firm Size, 2015
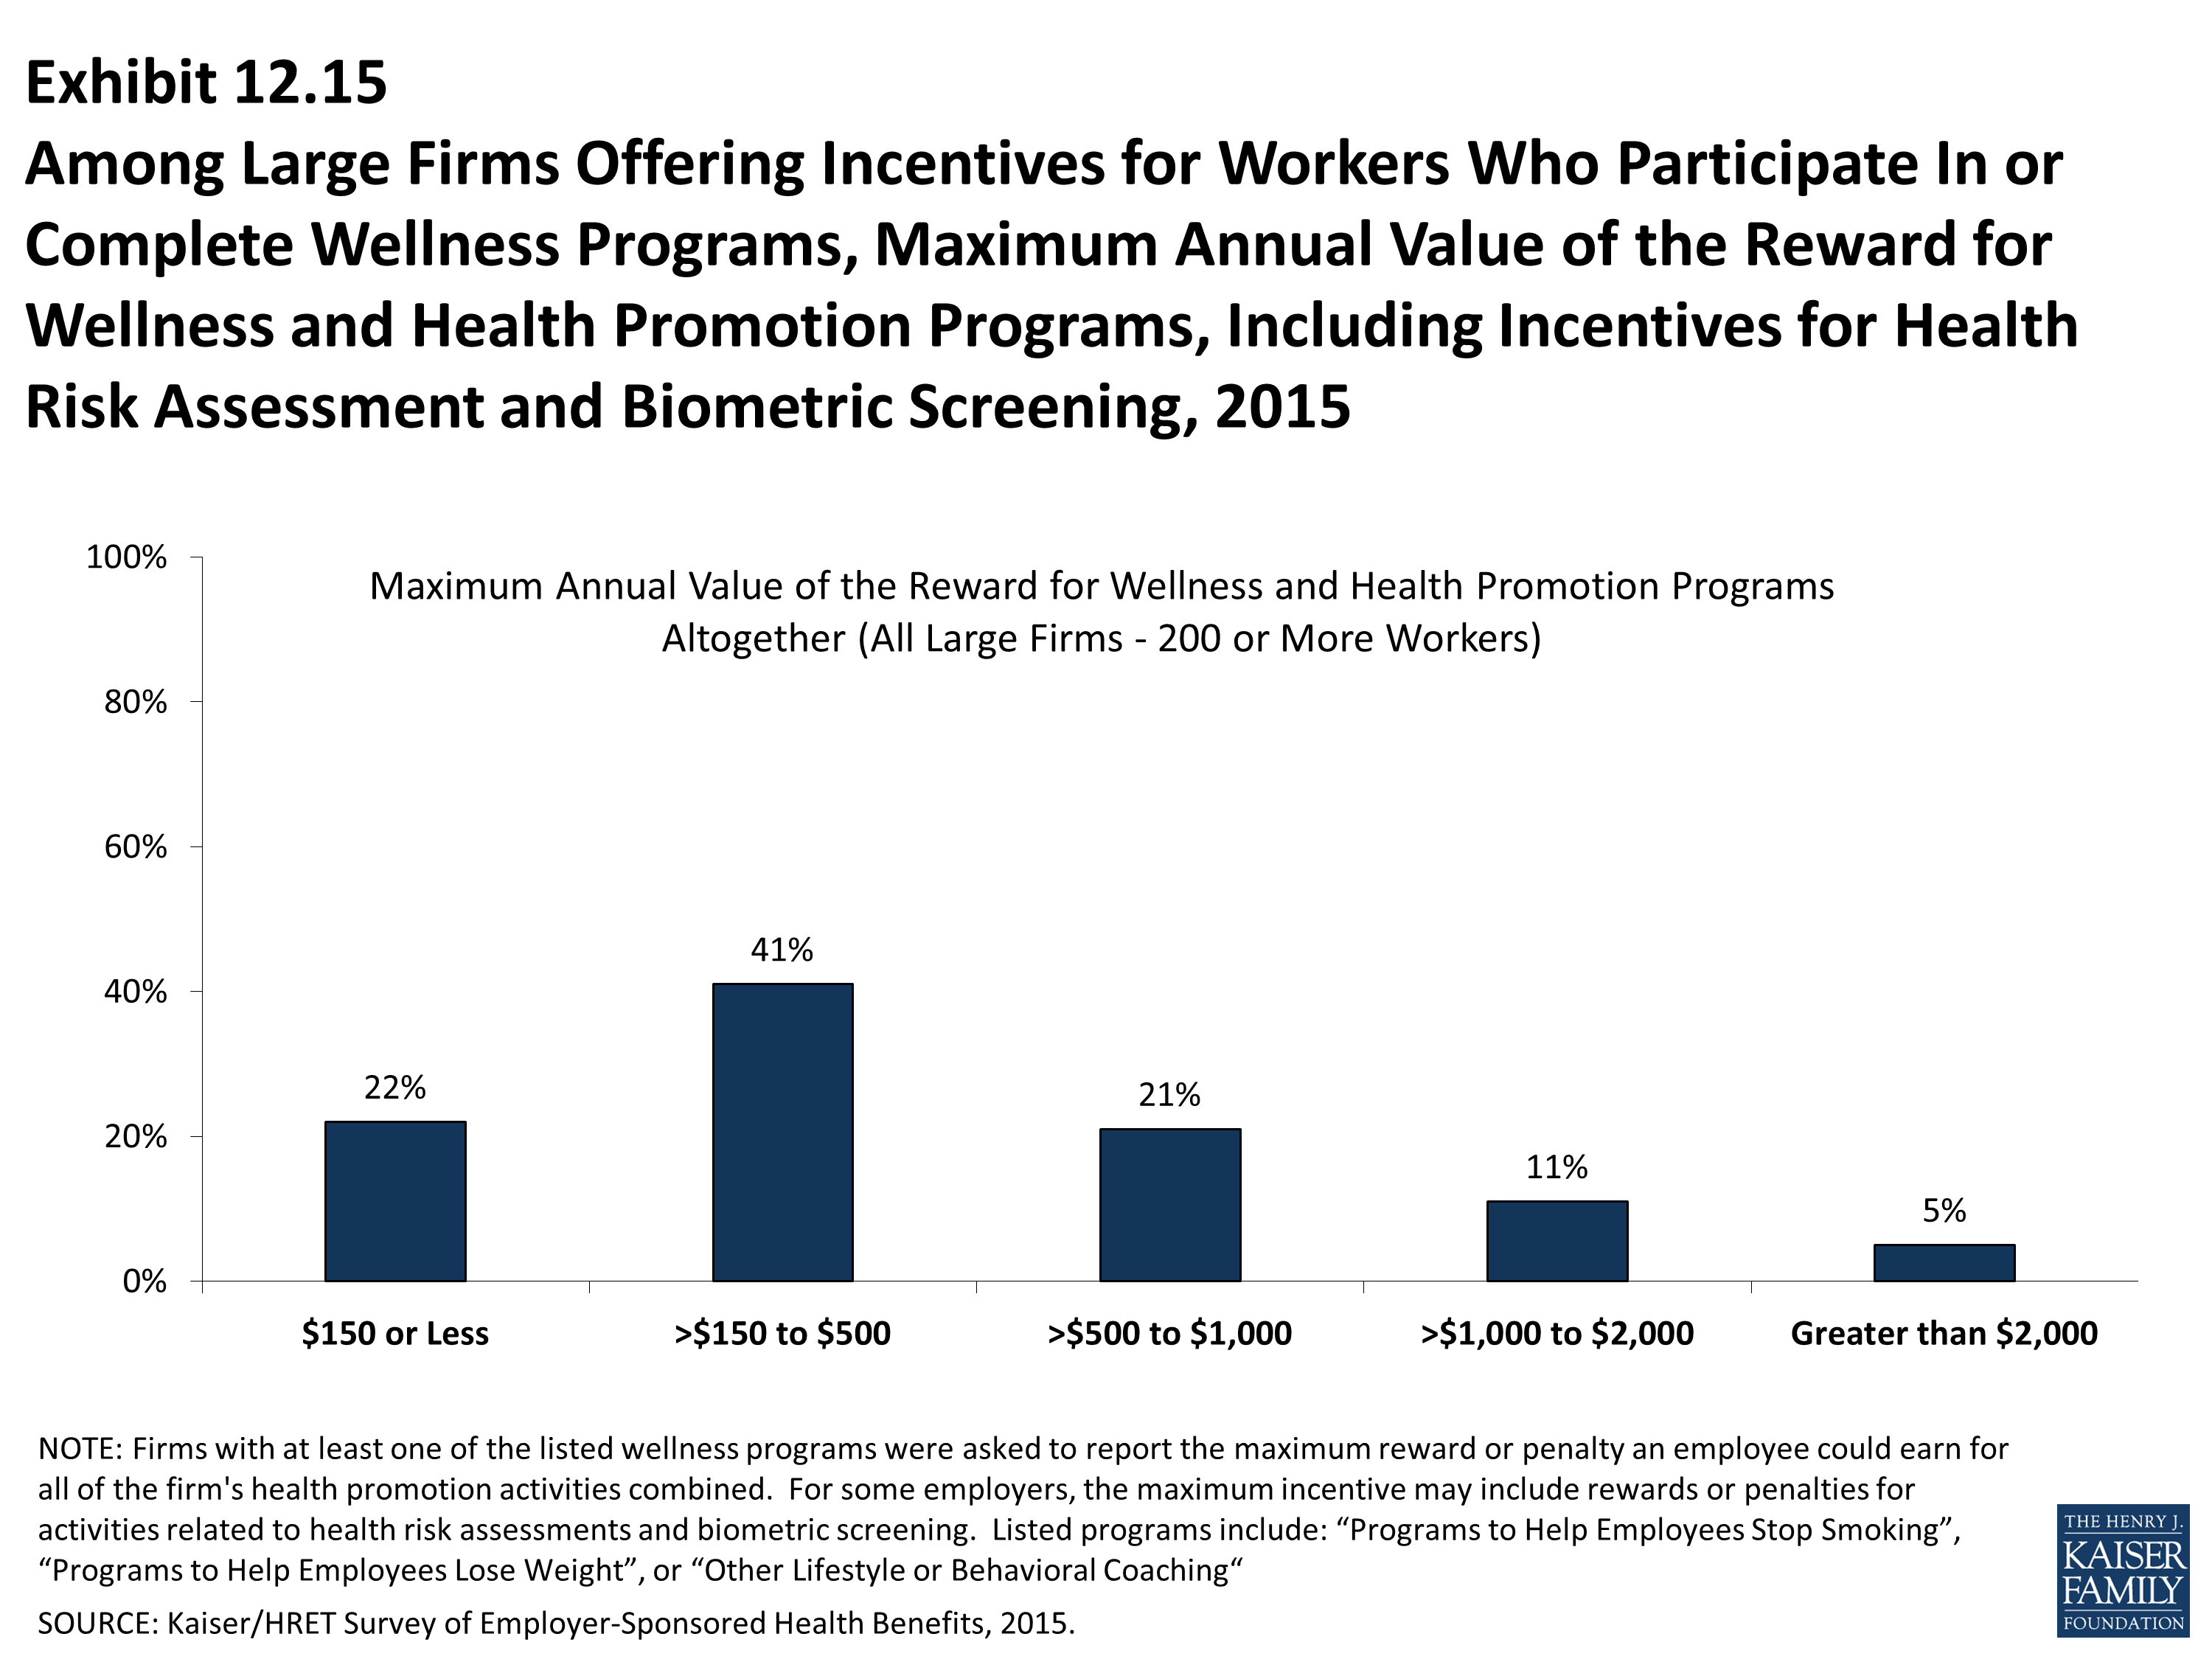
Among Large Firms Offering Incentives for Workers Who Participate In or Complete Wellness Programs, Maximum Annual Value of the Reward for Wellness and Health Promotion Programs, Including Incentives for Health Risk Assessment and Biometric Screening, 2015
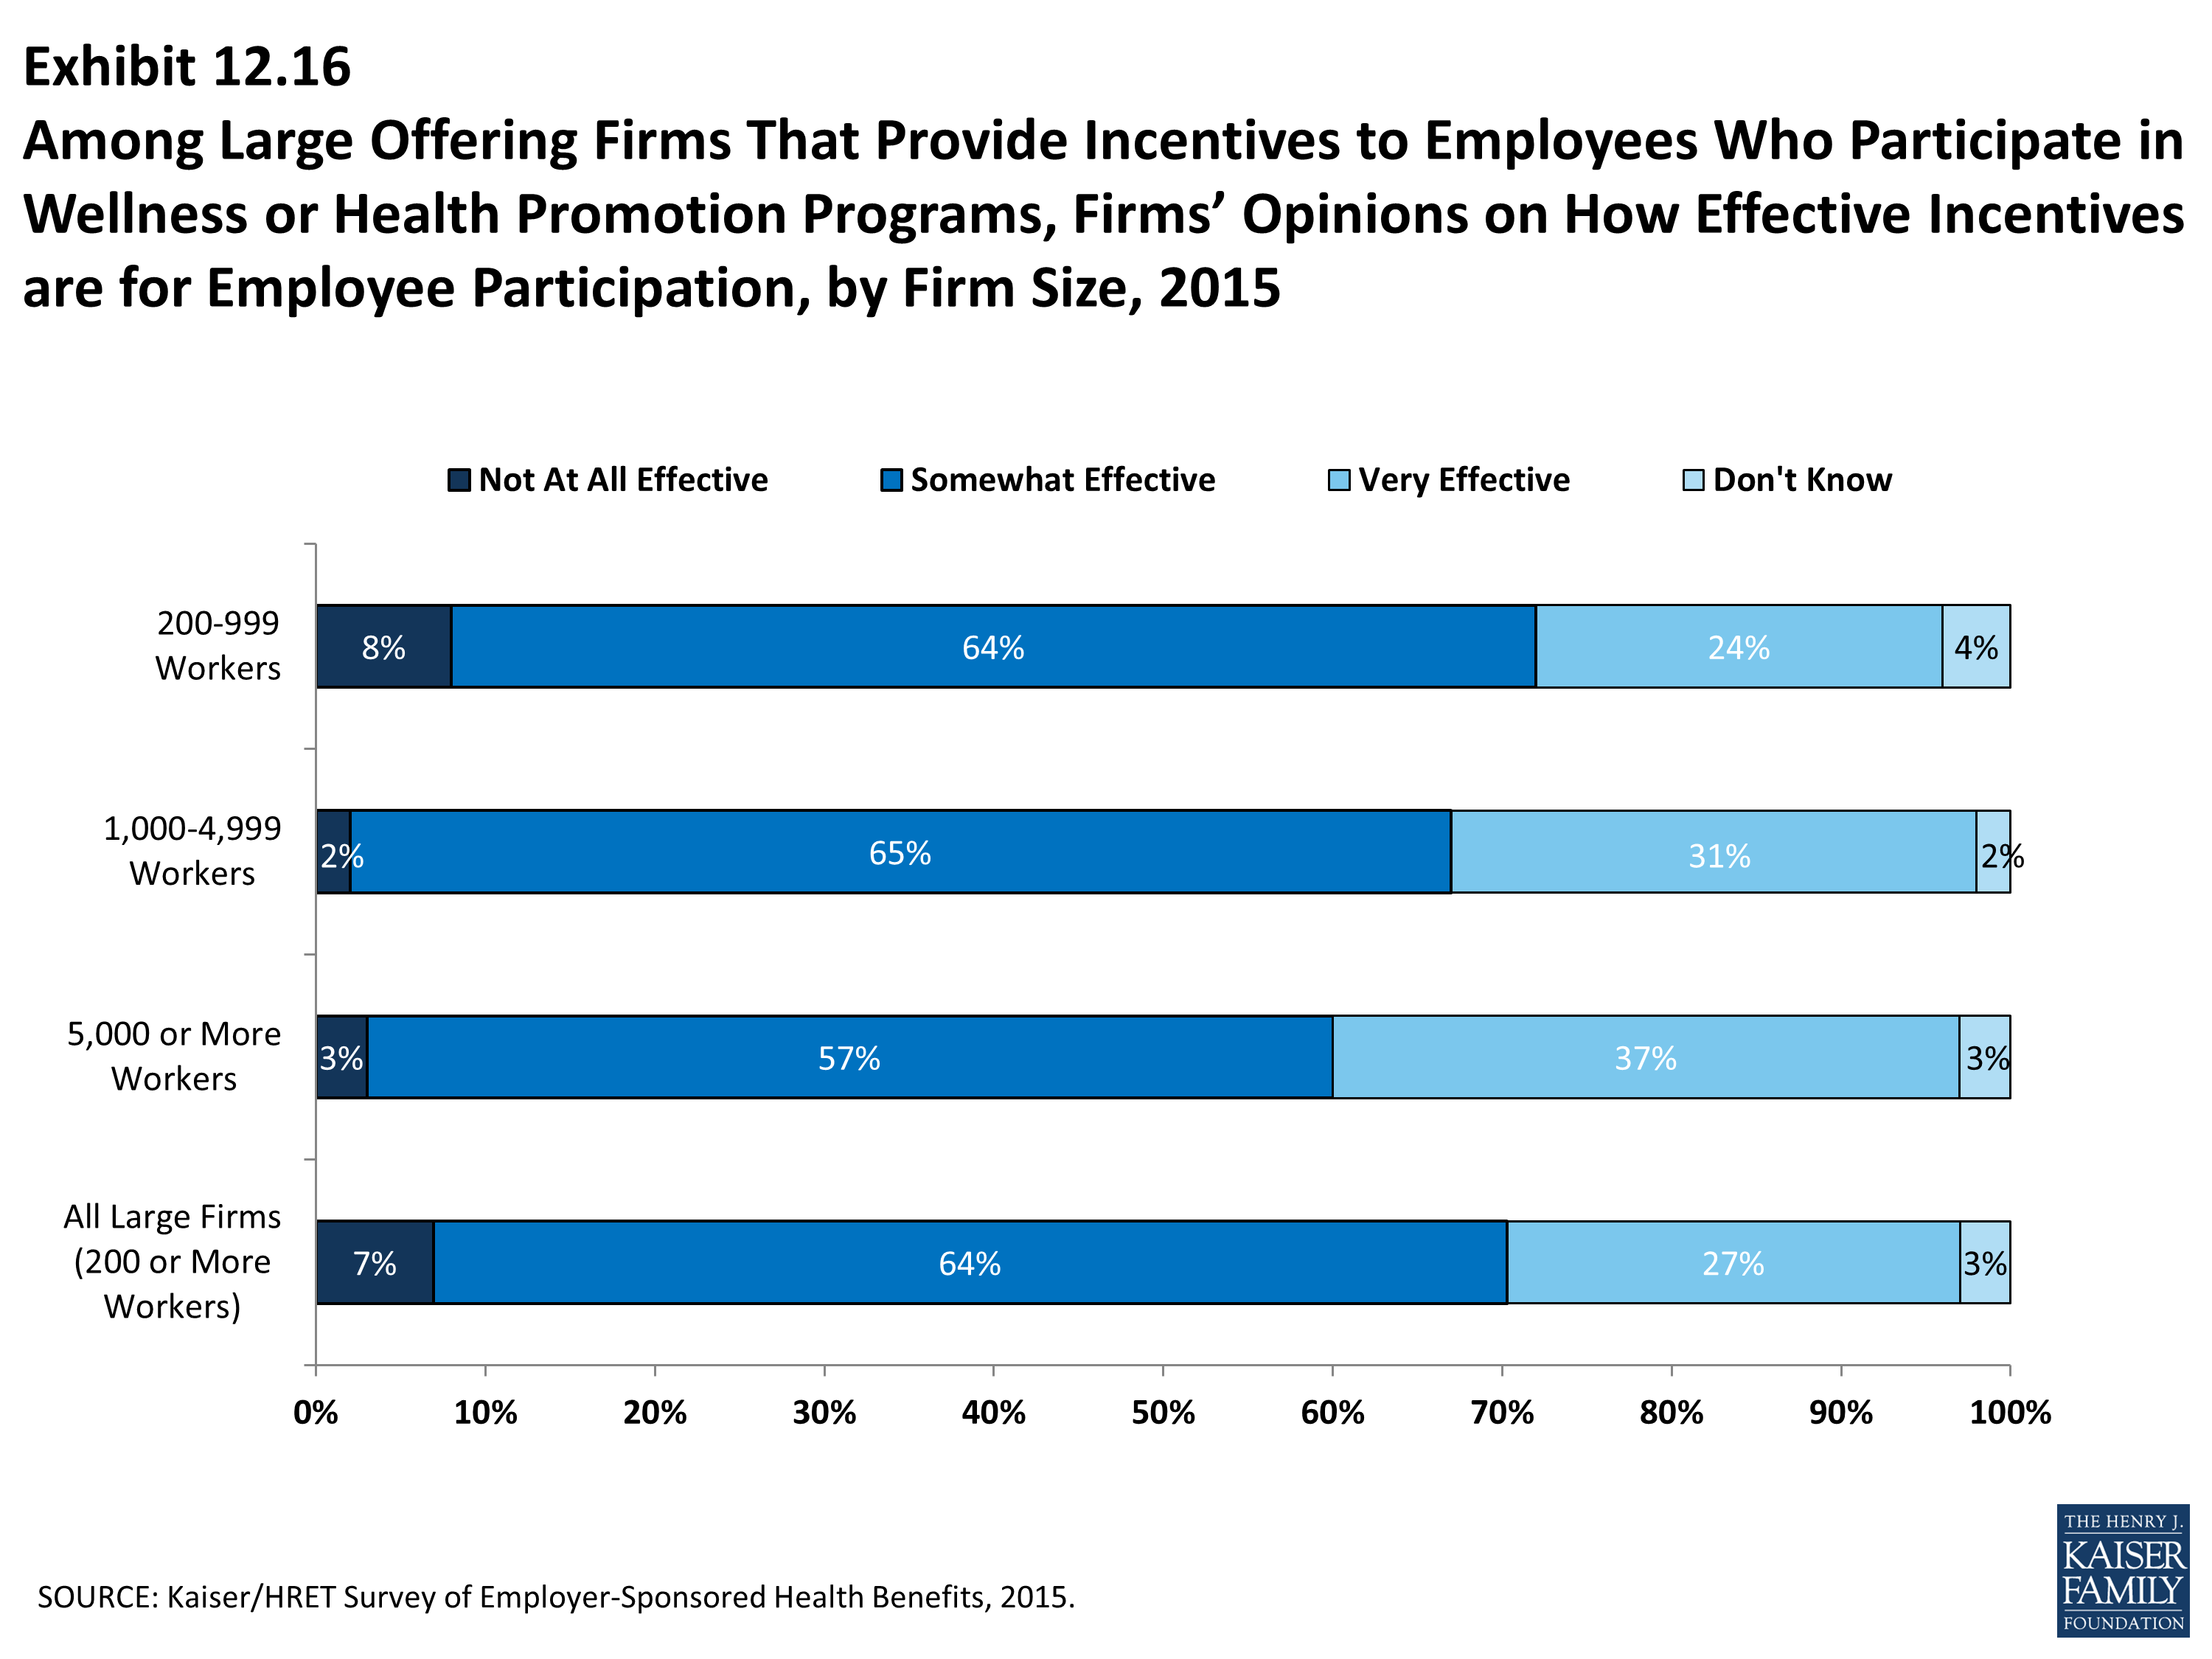
Among Large Offering Firms That Provide Incentives to Employees Who Participate in Wellness or Health Promotion Programs, Firms’ Opinions on How Effective Incentives are for Employee Participation, by Firm Size, 2015
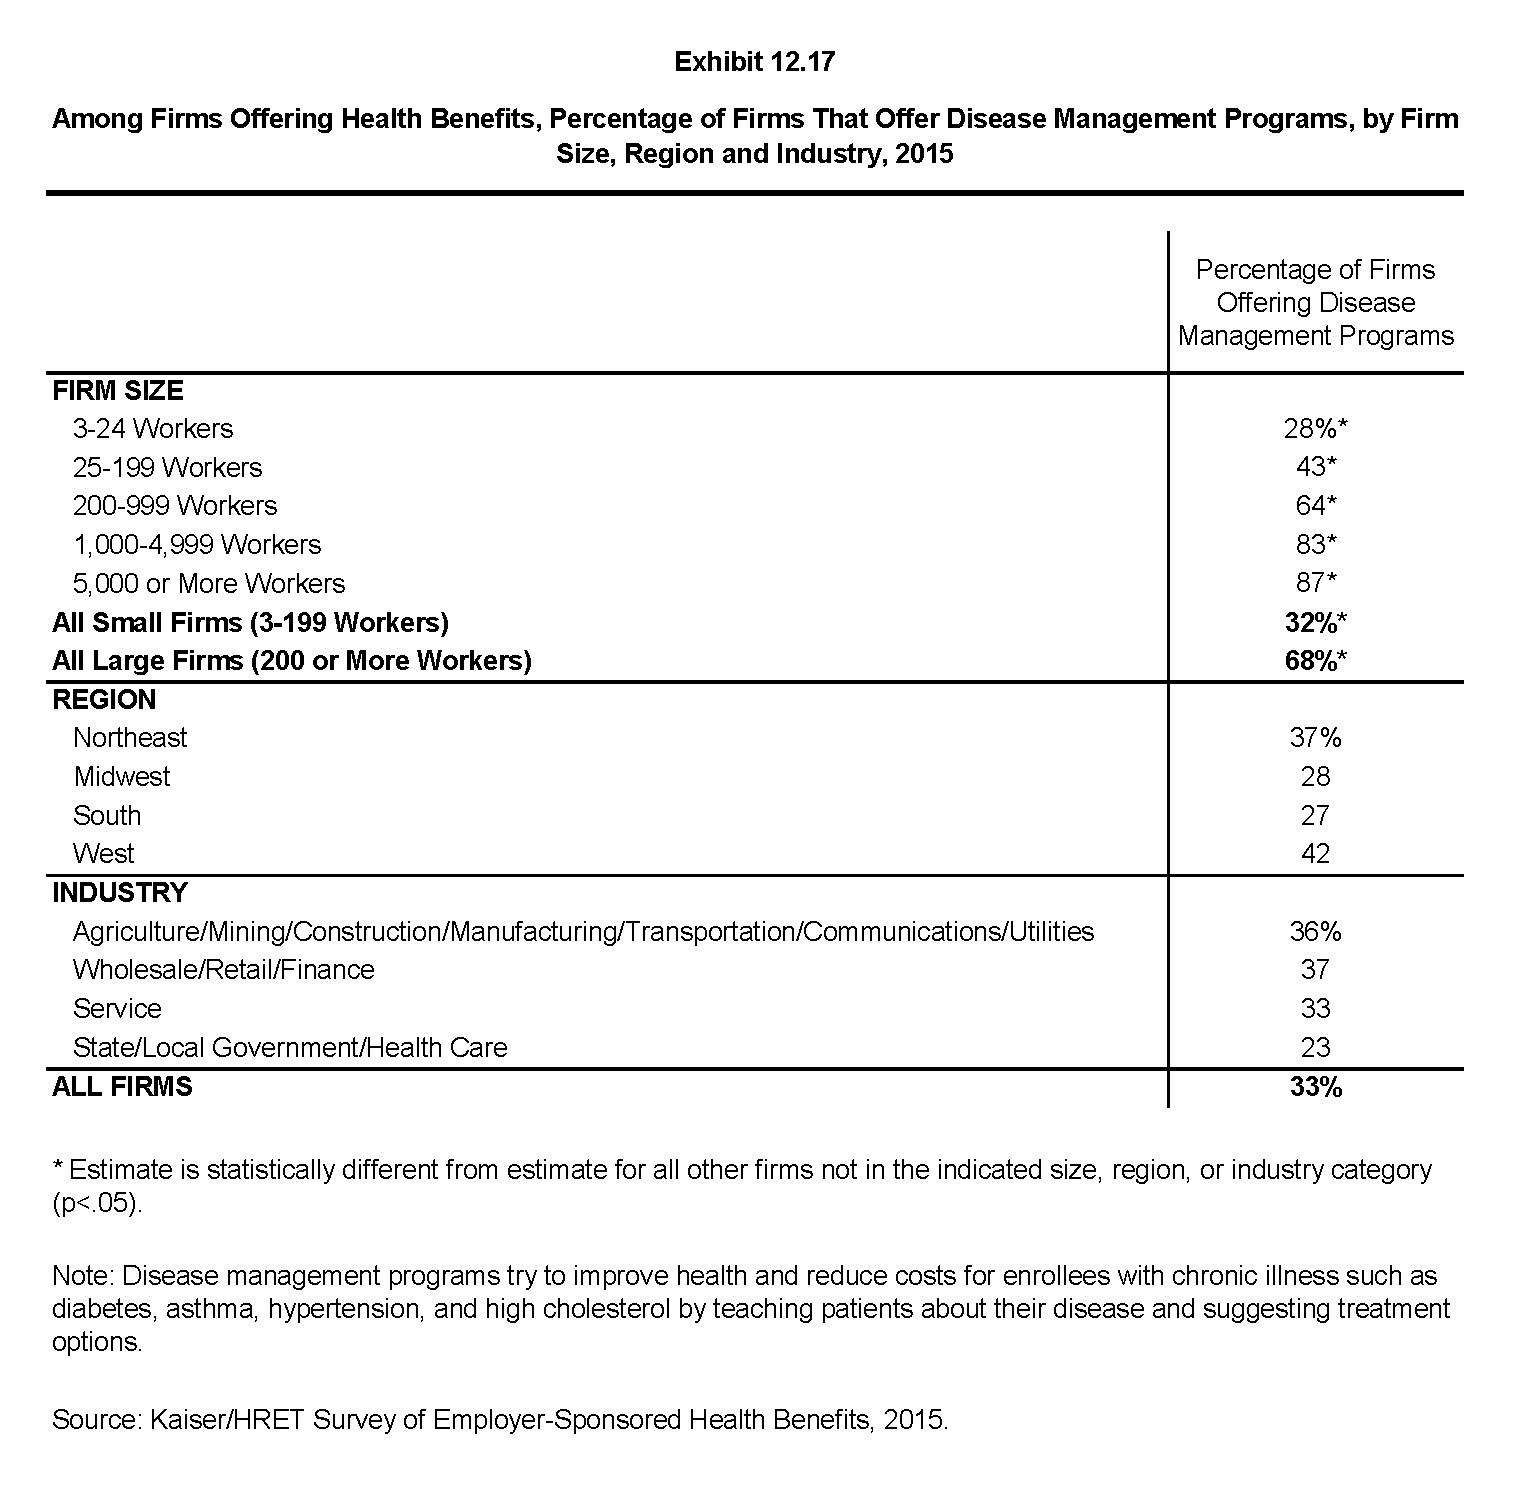
Among Firms Offering Health Benefits, Percentage of Firms That Offer Disease Management Programs, by Firm Size, Region and Industry, 2015
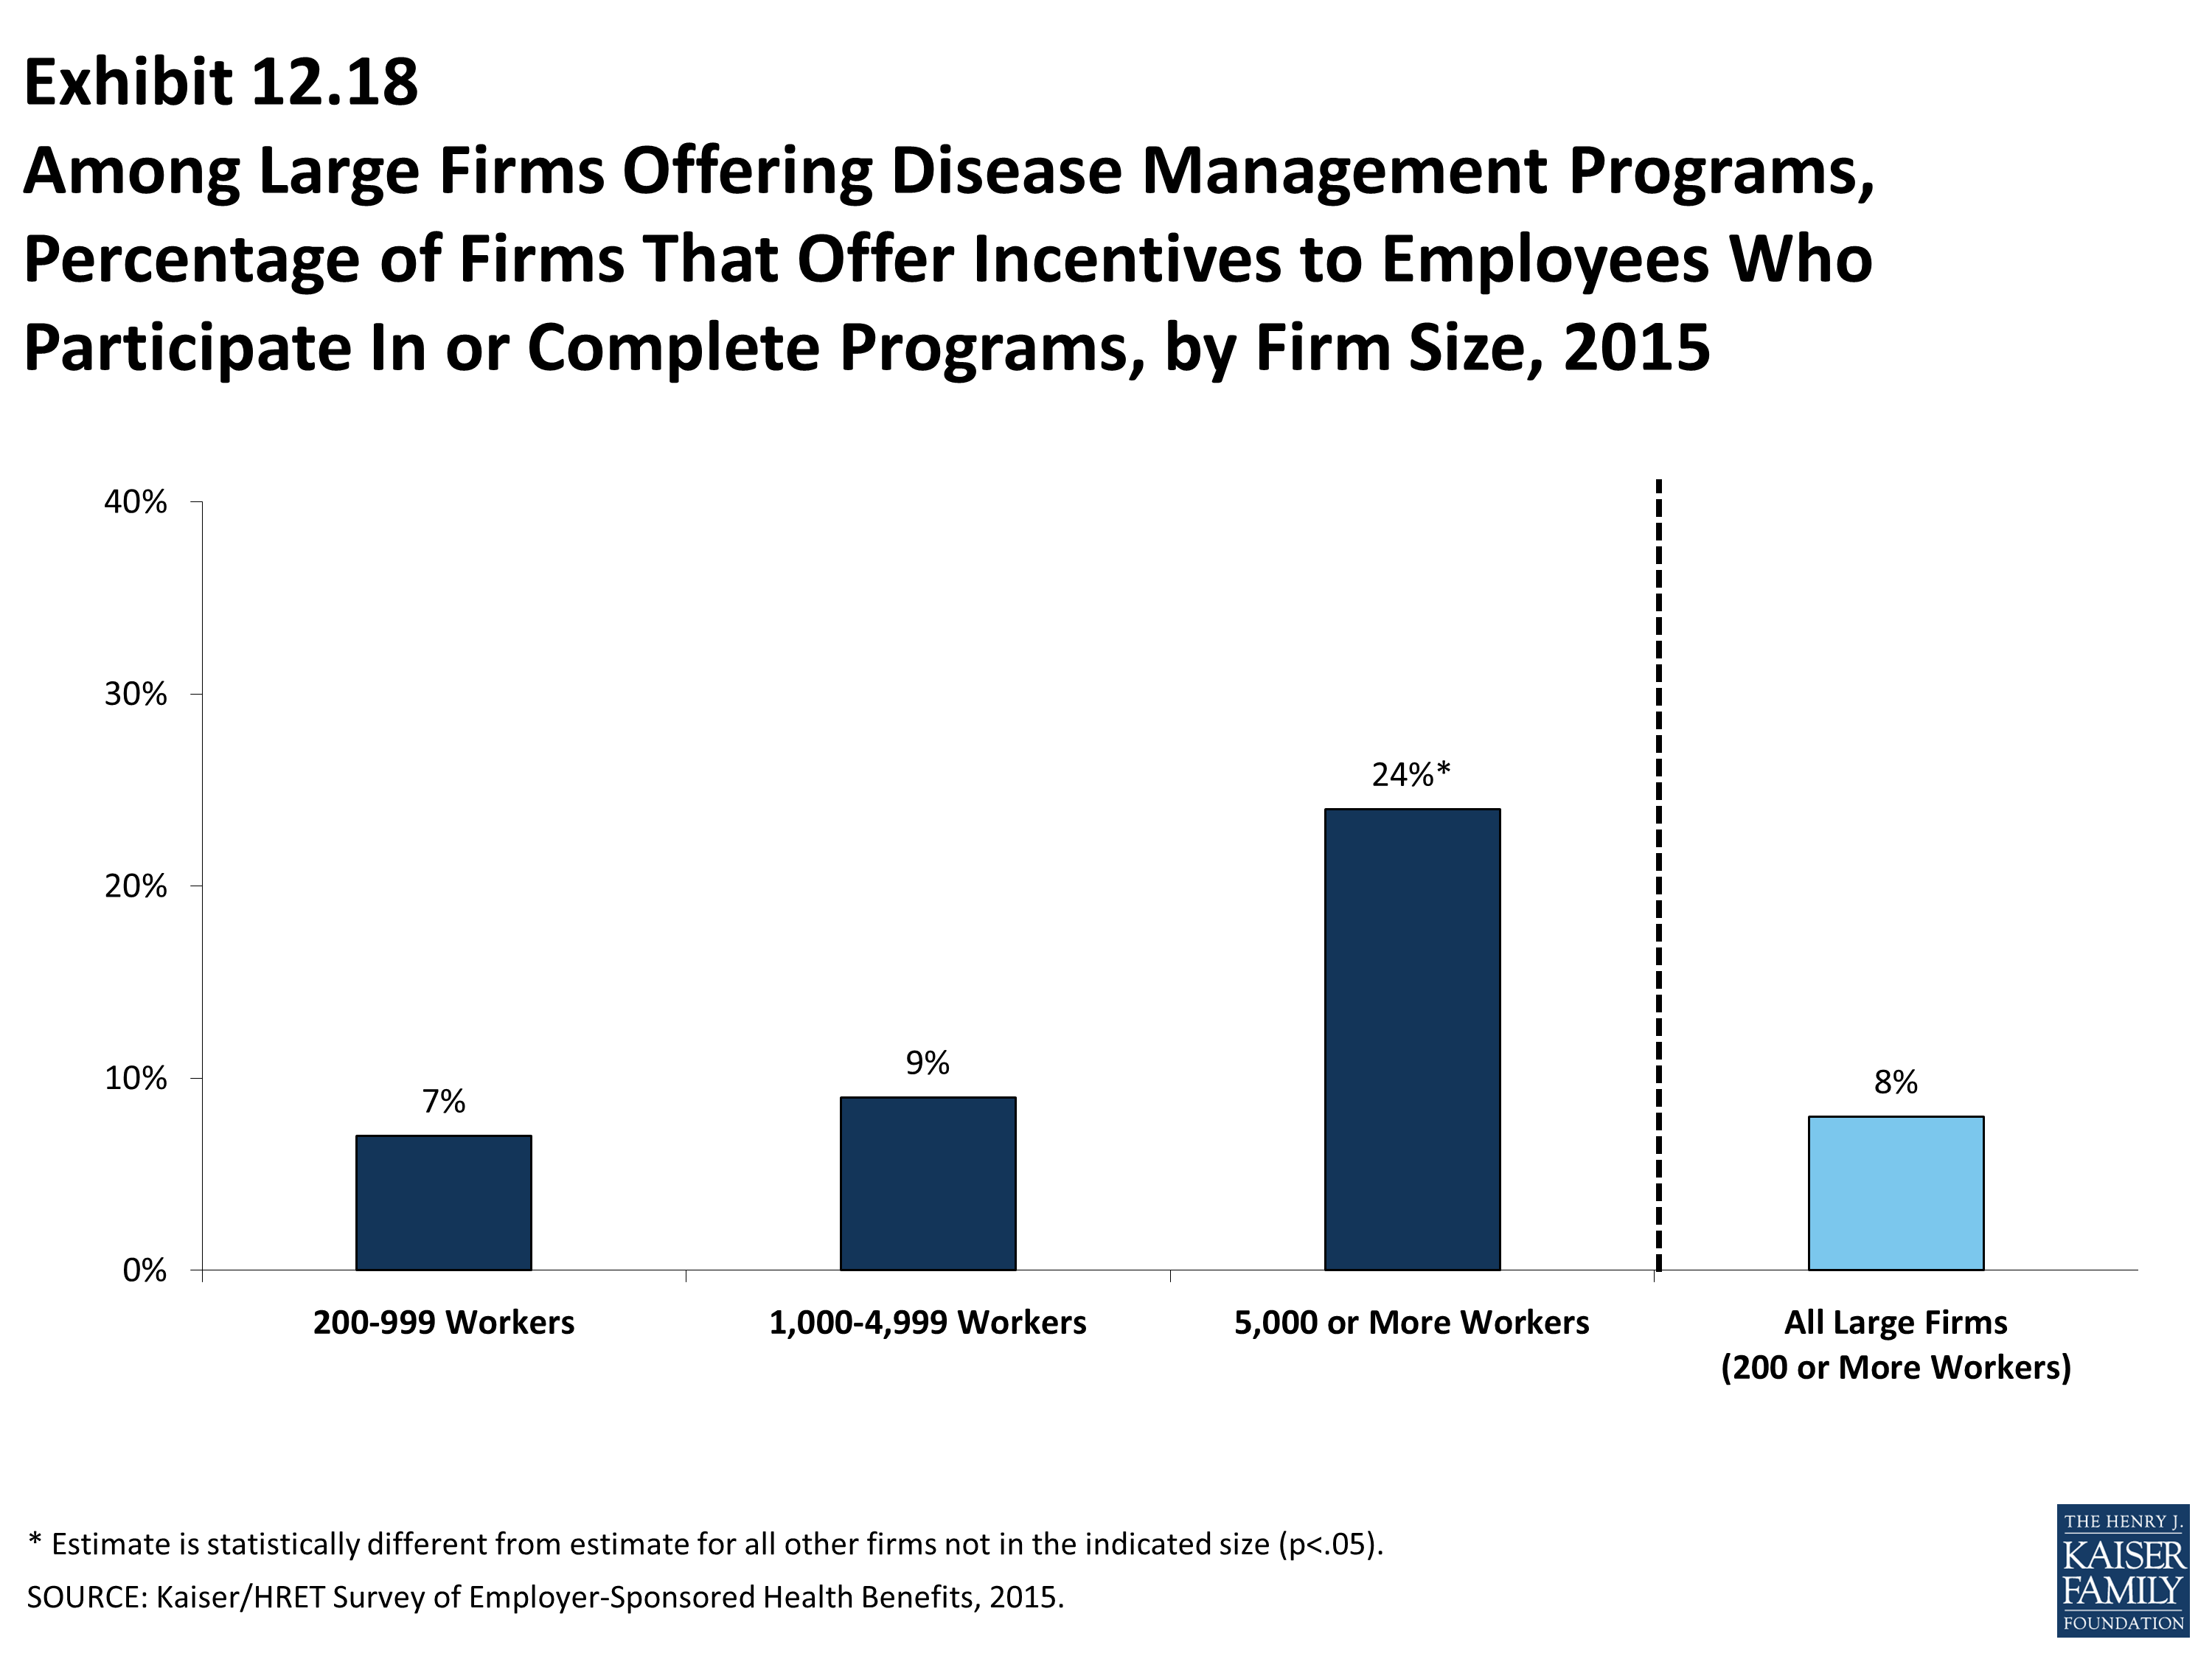
Among Large Firms Offering Disease Management Programs, Percentage of Firms That Offer Incentives to Employees Who Participate In or Complete Programs, by Firm Size, 2015
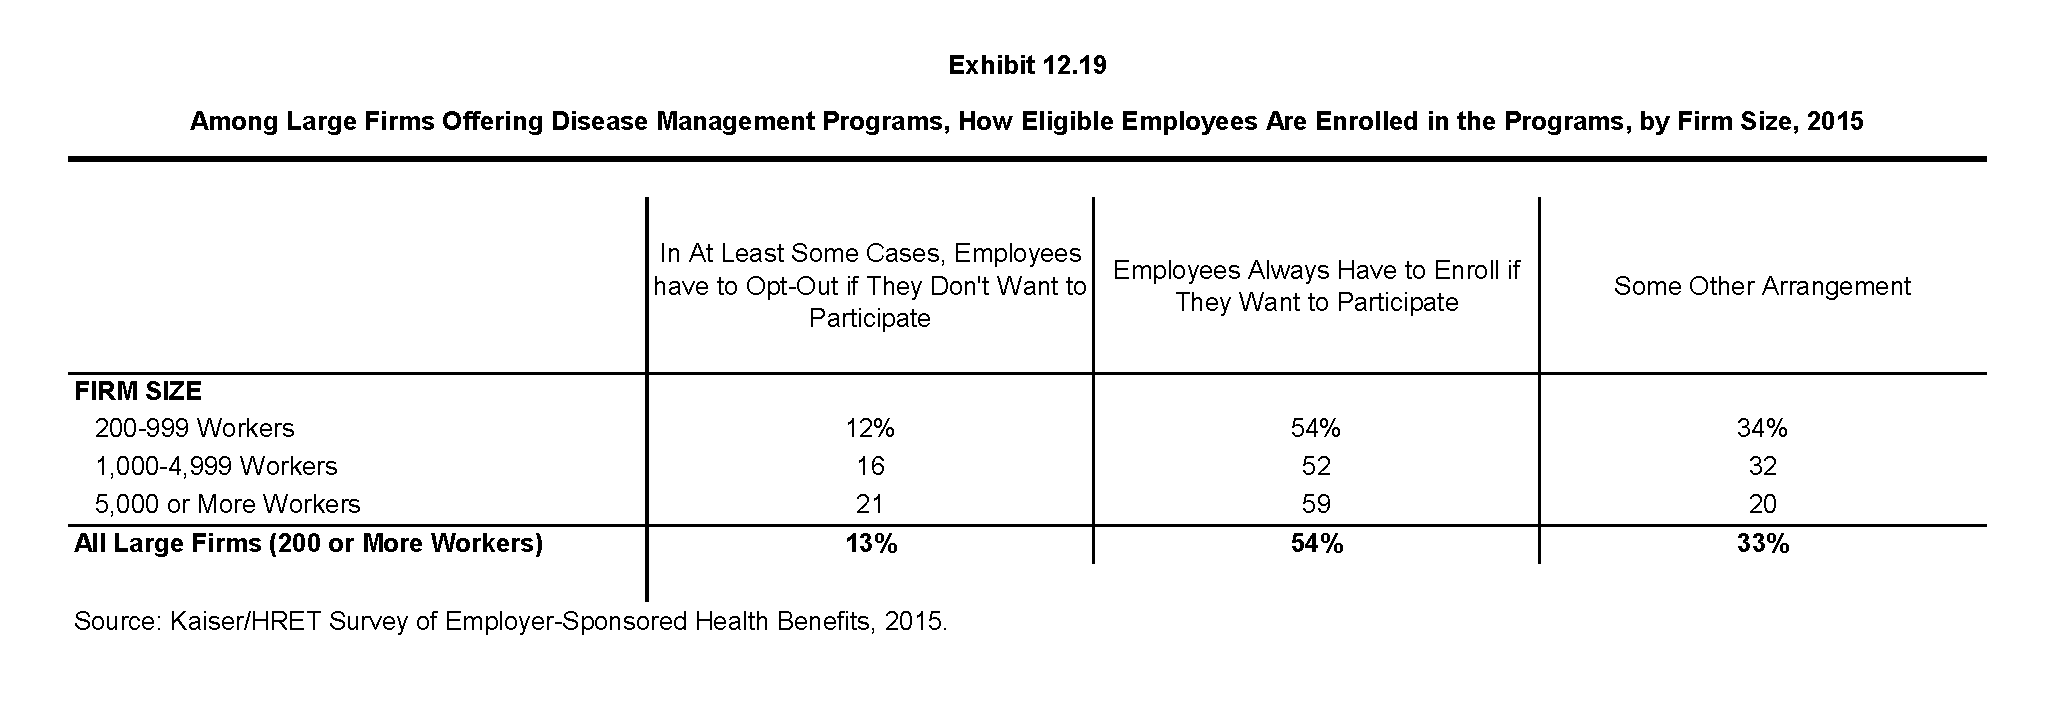
Among Large Firms Offering Disease Management Programs, How Eligible Employees Are Enrolled in the Programs, by Firm Size, 2015
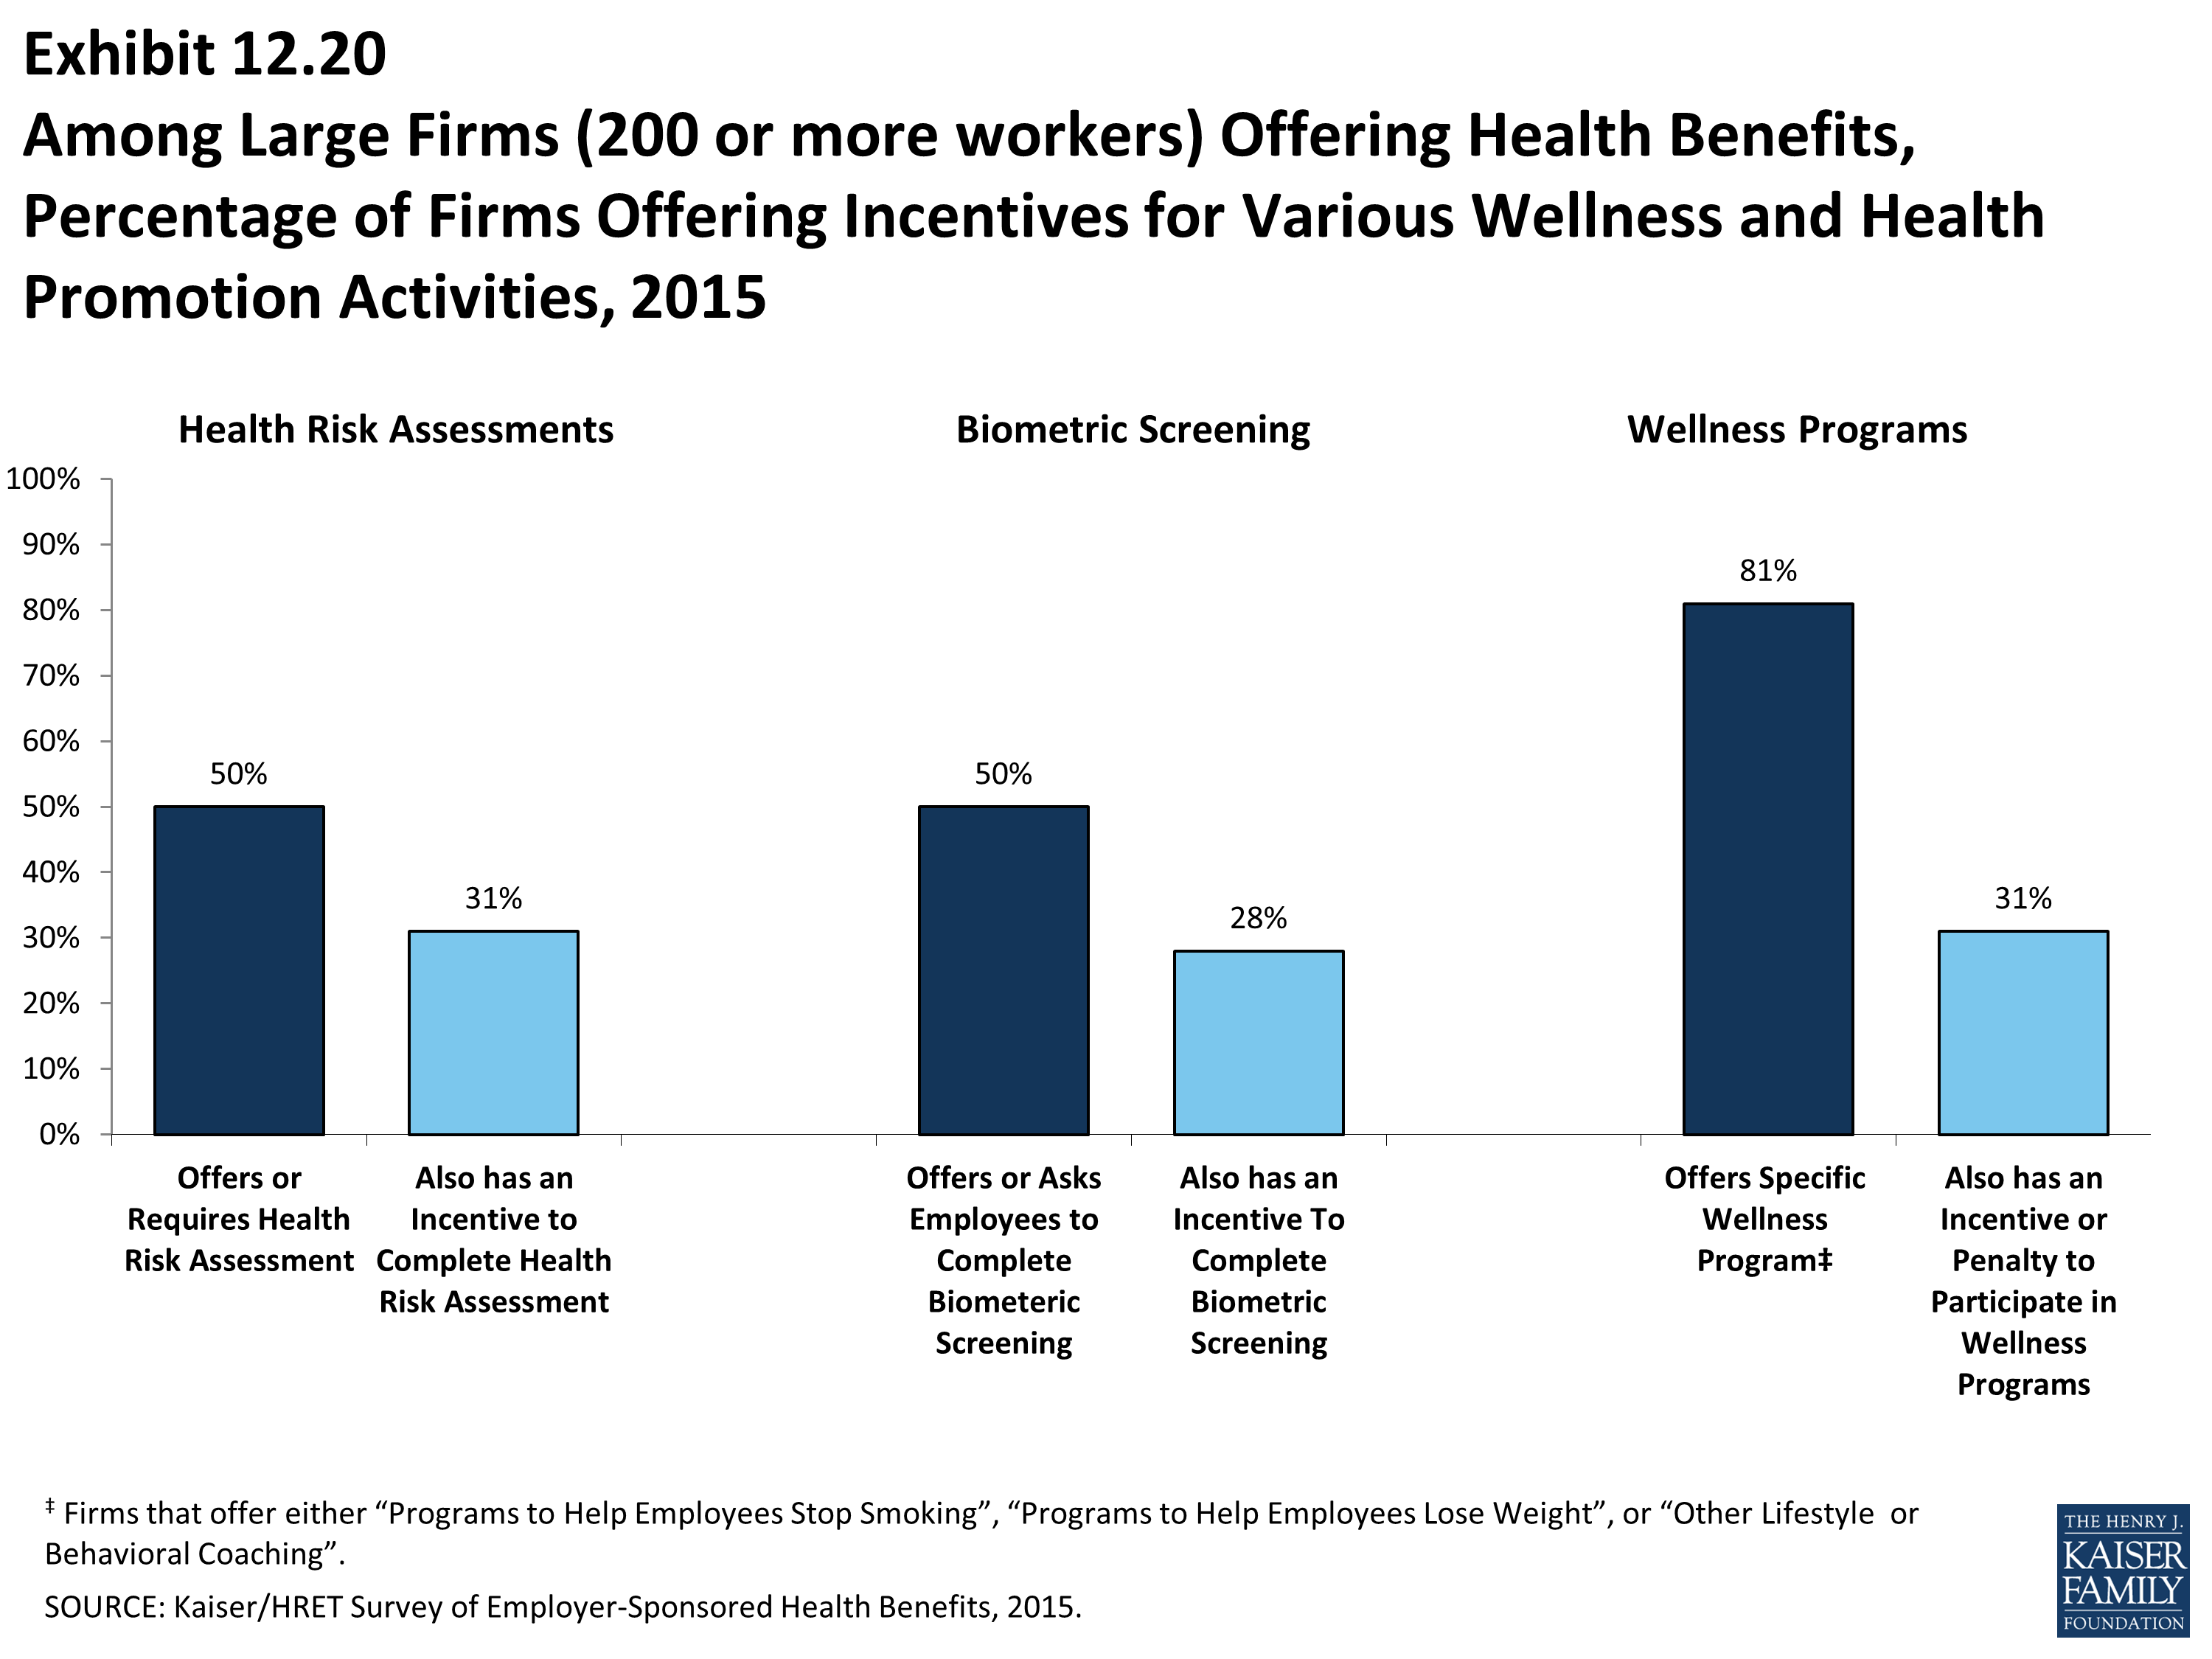
Among Large Firms (200 or more workers) Offering Health Benefits, Percentage of Firms Offering Incentives for Various Wellness and Health Promotion Activities, 2015
Section Thirteen: Grandfathered Health Plans
The Affordable Care Act (ACA) exempts certain health plans that were in effect when the law was passed, referred to as grandfathered plans, from some standards in the law, including the requirement to cover preventive benefits without cost sharing, have an external appeals process, or comply with the new benefit and rating provisions in the small group market. In 2015, 35% of firms offering health benefits offer at least one grandfathered health plan, and 25% of covered workers are enrolled in a grandfathered plan.
In the employer-sponsored market, health plans that were in place when the ACA was enacted (March 2010) can be grandfathered health plans. Interim final rules released by the Department of Health and Human Services (HSS) on June 17, 2010, and amended on November 17, 2010, stipulate that firms cannot significantly change cost sharing, benefits, employer contributions, or access to coverage in grandfathered plans.1 New employees can enroll in a grandfathered plan as long as the firm has maintained consecutive enrollment in the plan.
Grandfathered plans are exempted from many of the ACA’s new requirements, but still must comply with other provisions, including: (1) provide a uniform explanation of coverage, (2) report medical loss ratios and provide premium rebates if medical loss ratios are not met, (3) prohibit lifetime and annual limits on essential health benefits, (4) extend dependent coverage to age 26, (5) prohibit health plan rescissions, (6) prohibit waiting periods greater than 90 days, and (7) prohibit coverage exclusions for pre-existing health conditions.2 Firms must decide whether to grandfather their insurance plans, which limits the changes they can make to their plans, or whether to comply with the full set of new health reform requirements.
In responding to the 2015 survey, some employers found it difficult to distinguish between the grandfathering provisions in the ACA from guidance issued by HHS. We would note that smaller firms in particular appear to have some confusion about whether or not they are grandfathered, likely in part because of the use of the term “grandmothered” to refer to pre-ACA plans that can be renewed under guidance issued by HHS3. Many smaller firms, even those offering a health plan in effect in March 2010, were unsure about whether their plan was grandfathered.
- The percentage of firms offering health benefits reporting that they have at least one health plan that is grandfathered is similar to last year. Thirty-five percent of offering firms report having at least one grandfathered plan in 2015, similar to 37% in 2014, but down from 54% in 2013, 58% in 2012, and 72% in 2011 (Exhibit 13.1).
- Twenty-five percent of covered workers are enrolled in a grandfathered health plan in 2015 (Exhibit 13.2). A similar percentage of covered workers at small firms (3-199 workers) and large firms (200 or more workers) offering health benefits are enrolled in grandfathered plans (34% and 22%, respectively). The percentage of covered workers enrolled in a grandfathered plan is similar to 26% in 2014, but down from 36% in 2013, 48% in 2012 and 56% in 2011 (Exhibit 13.4).
- The health care industry has the highest percentage of covered workers enrolled in a grandfathered health plan (35% in 2015) (Exhibit 13.2).
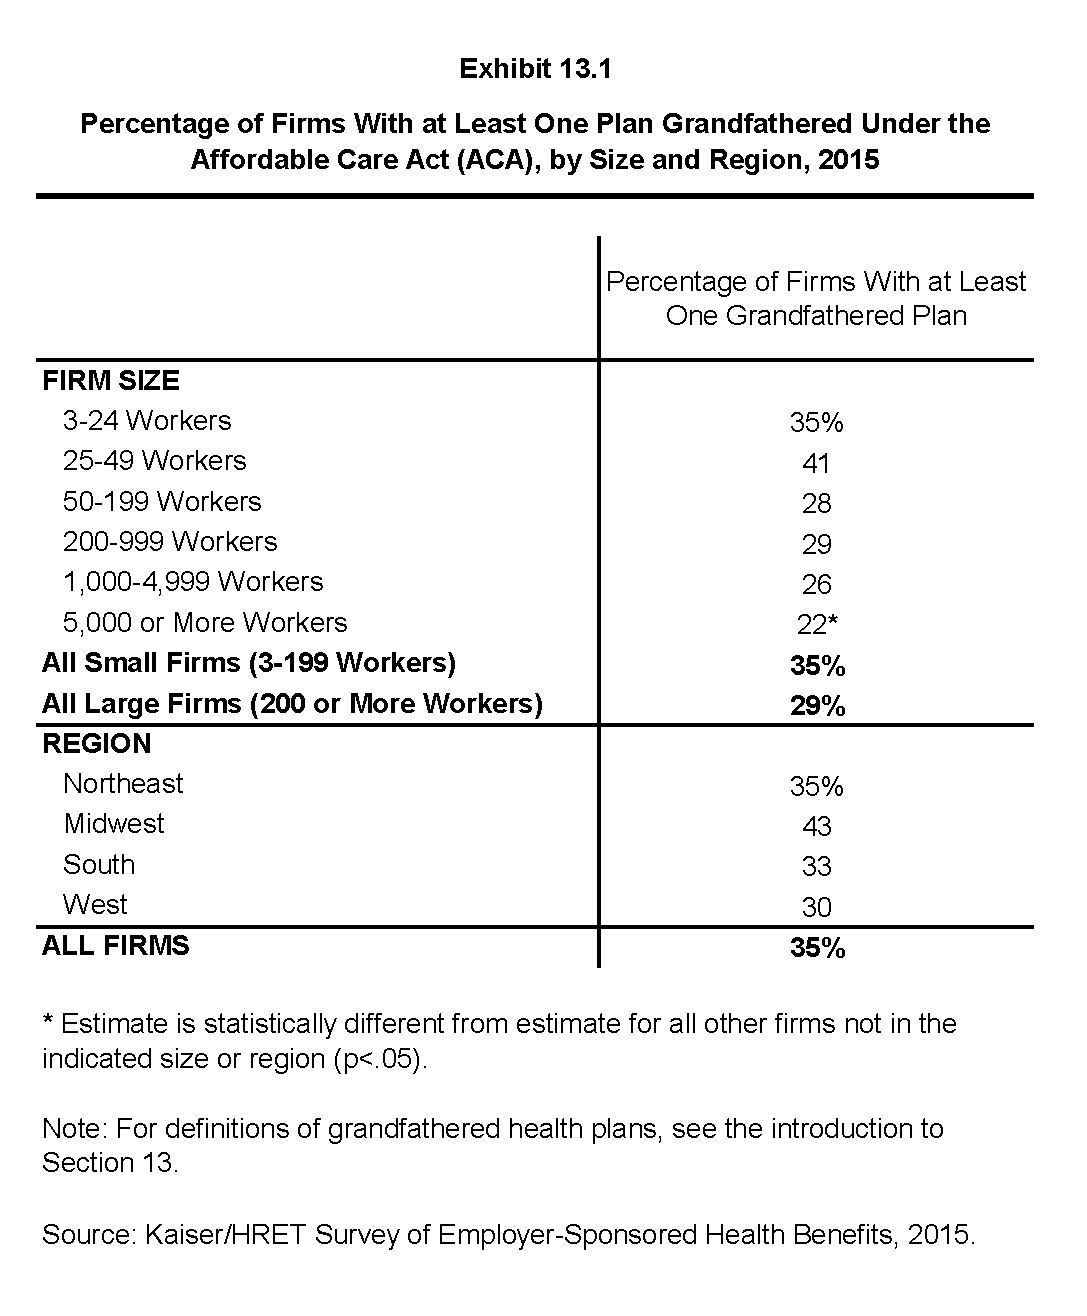
Percentage of Firms With at Least One Plan Grandfathered Under the Affordable Care Act (ACA), by Size and Region, 2015
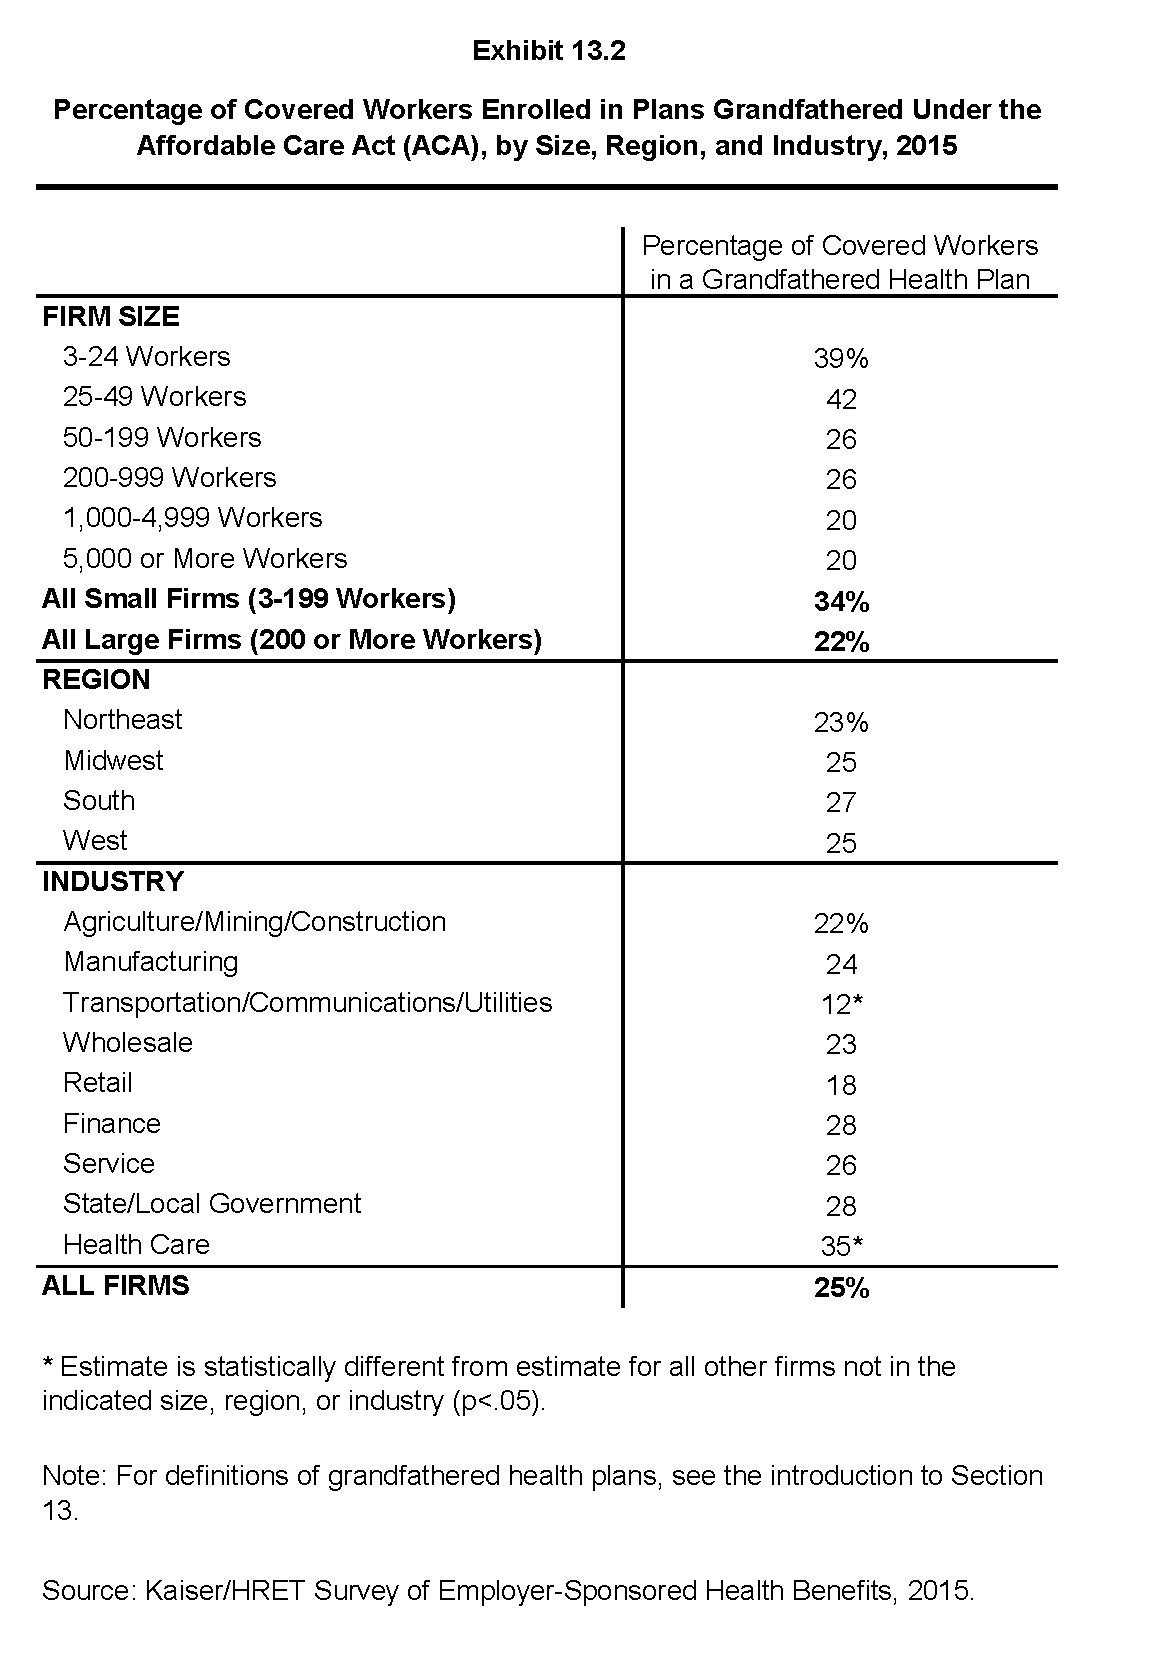
Percentage of Covered Workers Enrolled in Plans Grandfathered Under the Affordable Care Act (ACA), by Size, Region, and Industry, 2015
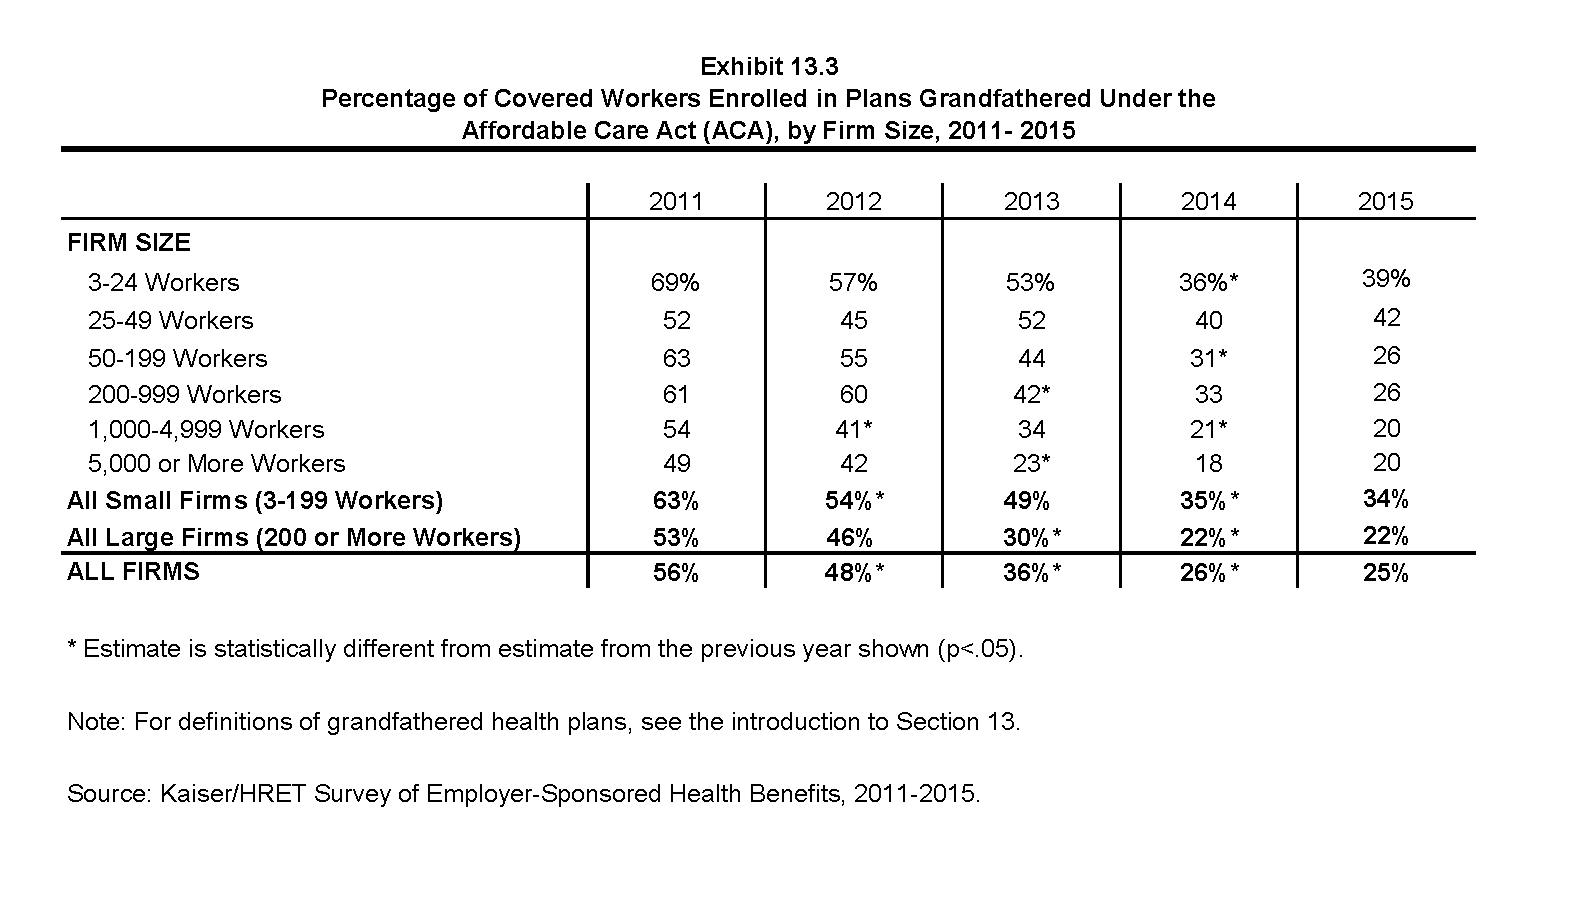
Percentage of Covered Workers Enrolled in Plans Grandfathered Under the Affordable Care Act (ACA), by Firm Size, 2011- 2015
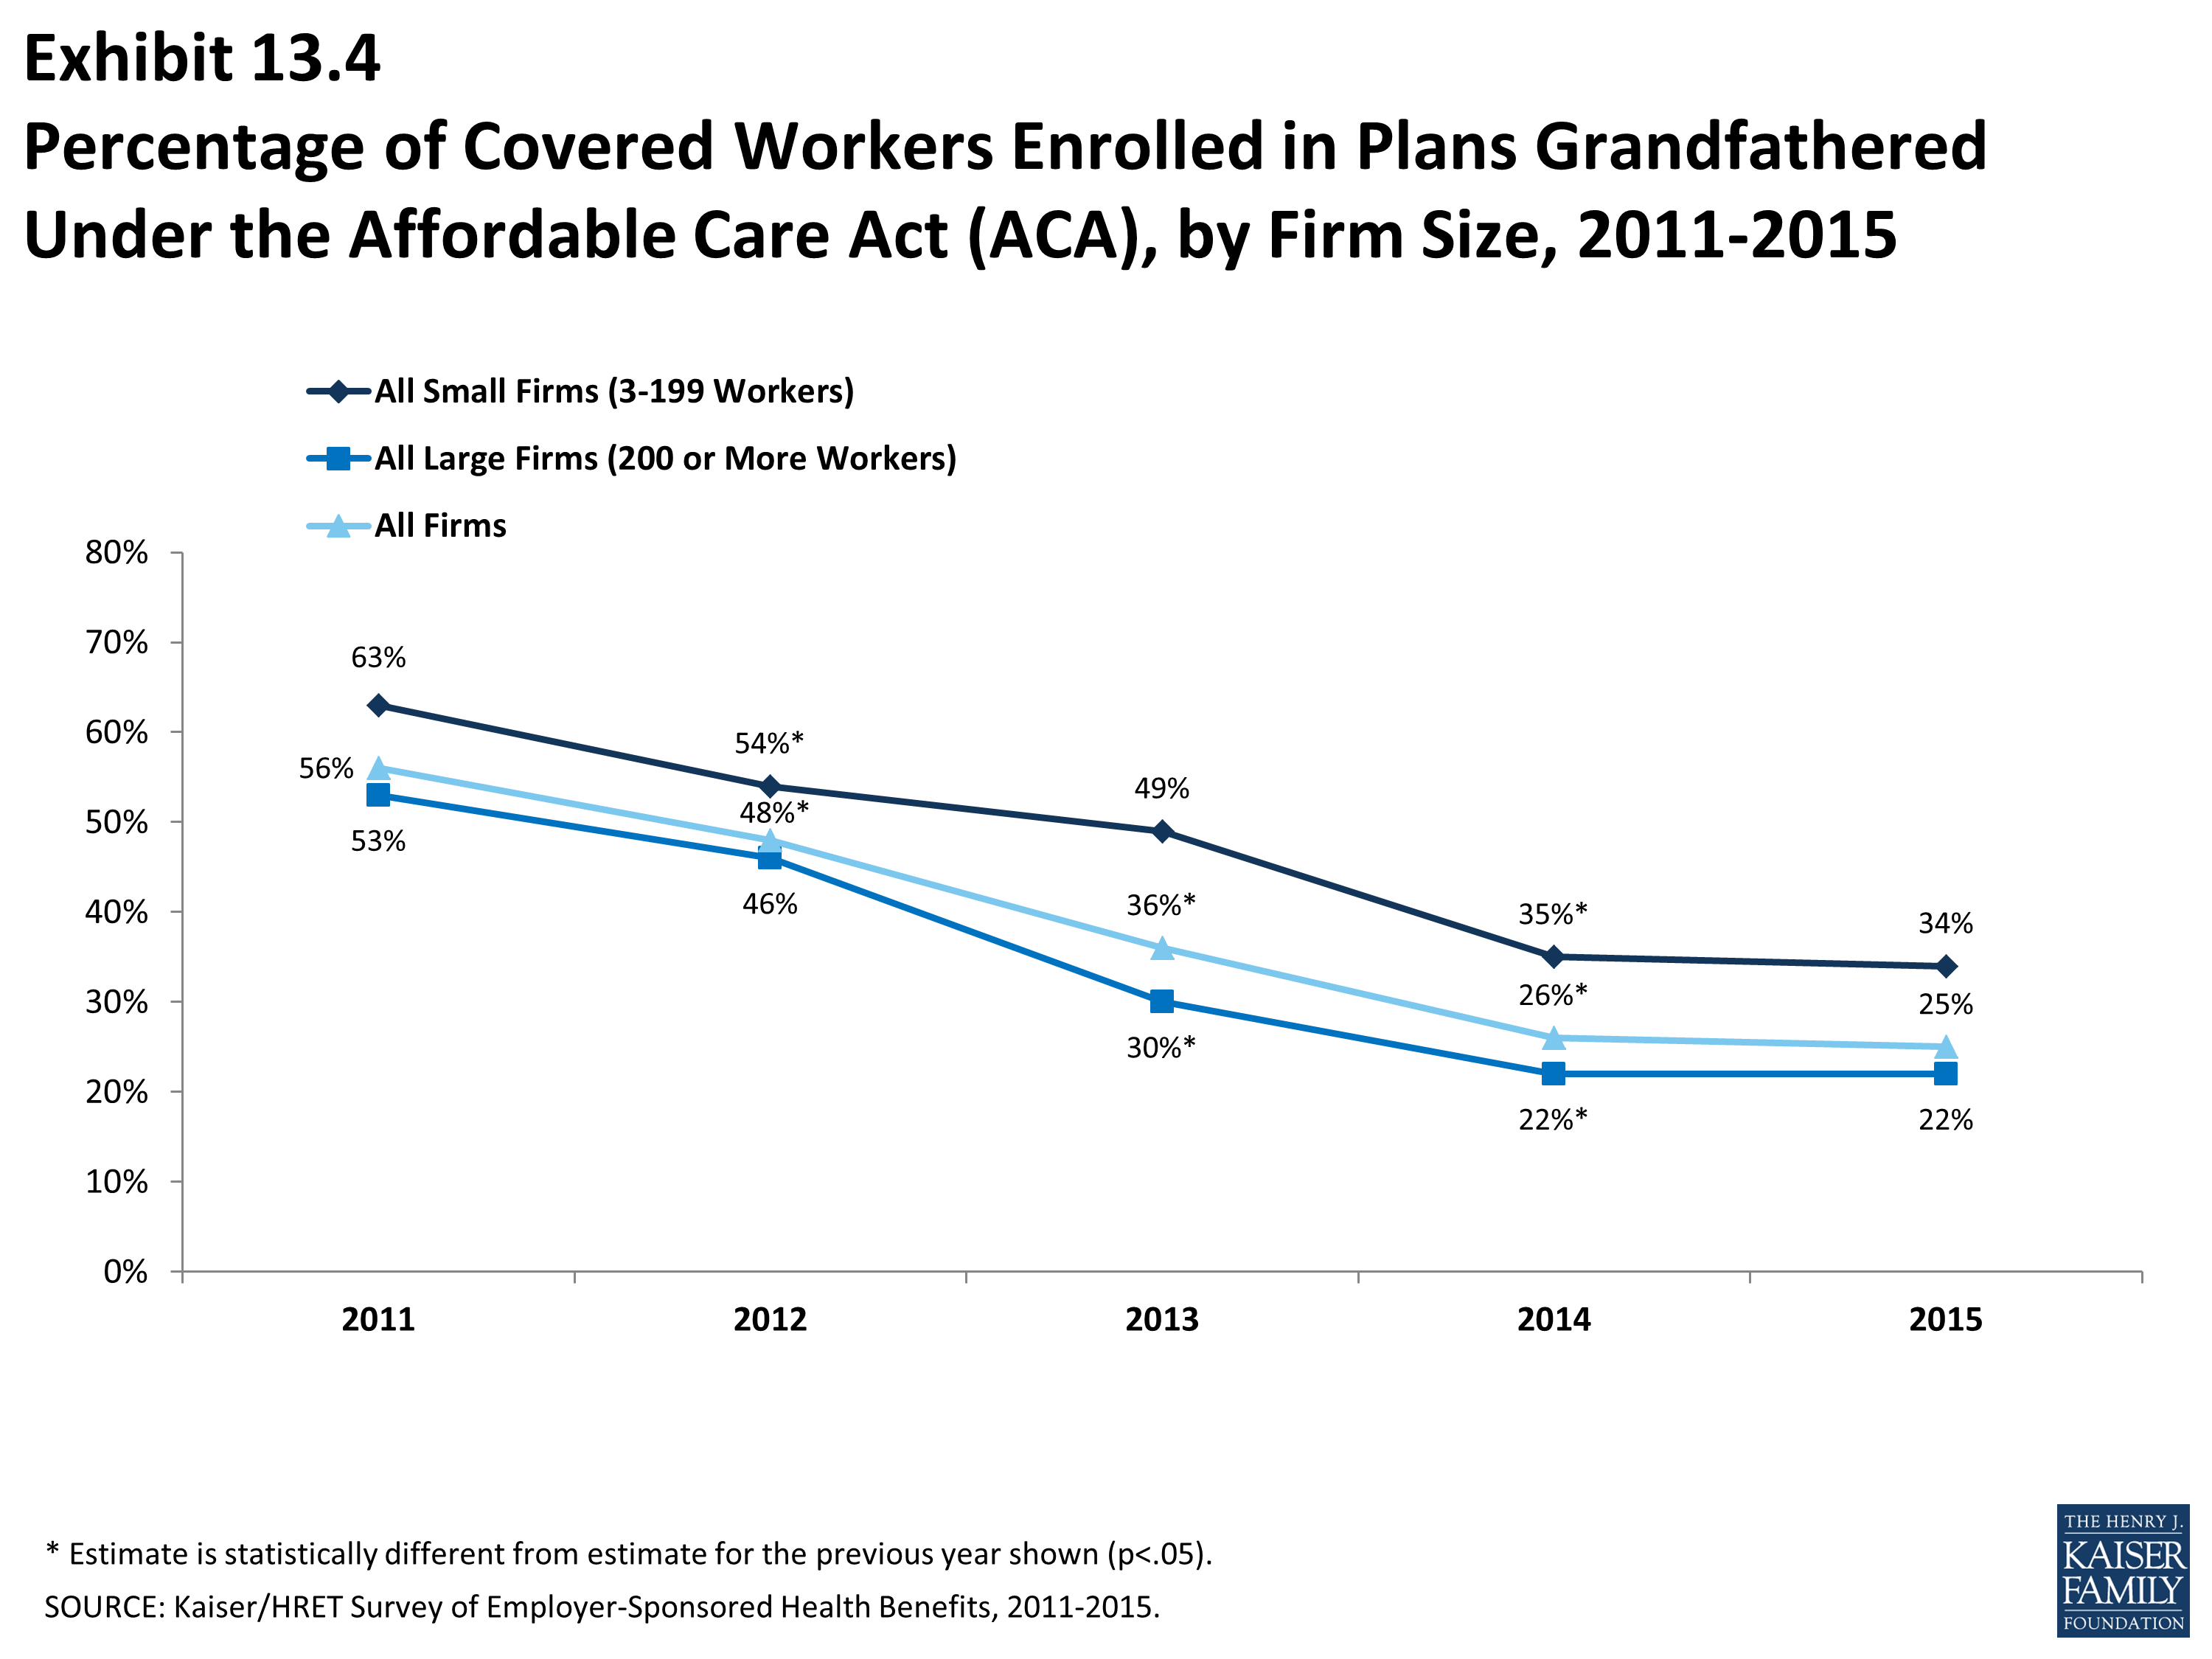
Percentage of Covered Workers Enrolled in Plans Grandfathered Under the Affordable Care Act (ACA), by Firm Size, 2011-2015
Section Fourteen: Employer Opinions and Health Plan Practices
Employers play a significant role in health insurance coverage – so their opinions and experiences are important factors in health policy discussions. Employer practices continue to evolve, partially in response to Affordable Care Act provisions, including the employer shared responsibility provisions, which require large employers offer coverage or pay a fee, and the impending excise tax on high-cost plans. Thirteen percent of large firms (200 or more workers) offering health benefits have already made changes to their plans’ coverage or cost sharing in response to high-cost plan tax provisions.
Employers continue to innovate as to how they offer, structure, and deliver their benefits. A considerable number of employers have developed strategies to reduce costs or improve quality through changes to their plan’s provider networks. Seven percent of employers offering health benefits offer a plan with a narrow network. Although relatively few employers offering health benefits with more than 50 workers offer coverage through a private or corporate exchange (3%), employers continue to show interest in these arrangements. Five percent of firms with 3 to 499 workers offering health benefits provide for benefits through a co-employment arrangement with a Professional Employer Organization (PEO).
Shopping for Health Coverage
Nearly one-half (47%) of firms offering health benefits reported shopping for a new health plan or a new insurance carrier in the past year, suggesting that the market is quite dynamic. The largest firms, those with 1,000 or more employees, were less likely to shop for a new plan or carrier than small firms (Exhibit 14.1). The percentage of firms offering health benefits that reported shopping for a new plan or carrier has remained stable over the last couple of years.
- Among firms that offer health benefits and who shopped for a new plan or carrier, 24% changed insurance carriers (Exhibit 14.2).
Tiered Networks and Narrow Network Plans
A tiered or high-performance network groups providers in the network together based on quality, cost, and/or the efficiency of the care they deliver. These networks encourage patients to visit preferred doctors by either restricting networks to efficient providers, or by having different cost sharing requirements based on the provider’s tier.
- Seventeen percent of firms that offer health benefits include a high-performance or tiered provider network in their health plan with the largest enrollment. The largest firms (those with 1,000 or more employees) are more likely to incorporate a high-performance or tiered network into their largest plan (Exhibit 14.4).
- The percentage of large firms (200 or more workers) offering health benefits whose largest plan includes a high-performance or tiered network increased from 17% in 2010 to 24% in 2015. The percentage of all firms offering health benefits whose largest plan includes a tiered network (17%) is similar to the 19% reported in 2014 (Exhibit 14.5).
Firms offering health benefits were asked whether they offered a plan that they considered to be a narrow network. Narrow networks are plans that limit the number of providers who can participate in order to reduce costs. Narrow network plans are generally more restrictive than standard HMO networks.
- Seven percent of offering firms indicated that they offered a plan they considered to be a narrow network plan (Exhibit 14.3), similar to 8% in 2014.
- Nine percent of firms offering health benefits said that either they or their insurer eliminated a hospital or health system from a provider network in order to reduce the plan’s cost (Exhibit 14.3).
Private exchanges and Professional Employer Organizations
There has been considerable interest in private exchanges recently. An exchange is a marketplace for health insurance. Private exchanges allow employees to choose from several health benefit options offered on the exchange. Private exchanges generally are created by consulting firms, insurers, or brokers, and are different than the public exchanges that have been created by states or the federal government. There is considerable variation in the types of exchanges currently offered; some exchanges allow workers to choose between multiple plans offered by the same carrier while in other cases multiple carriers participate. The exchange operator may establish strict standards for the plans offered or allow the insurers more flexibility in determining their plan offerings.
- In 2015, 3% of firms offering health benefits with more than 50 employees offer coverage through a private exchange. Looking at worker enrollment, private exchanges cover 2% of covered workers at firms with more than 50 employees (Exhibit 14.7).
- Firms offering health benefits with more than 50 workers and who do not already offer health benefits through a private exchange were asked whether they were considering private exchanges. Seventeen percent of these firms are considering offering benefits through a private exchange (Exhibit 14.6).
- Private exchanges may or may not include a defined contribution for premiums. A defined contribution is a set dollar amount offered to the employee by the employer. Employees may then select one of several plans, paying the difference between the defined contribution and the cost of their chosen health insurance plan. This permits an employer to offer a larger variety of health plans to employees and to structure contributions or other rules to encourage employees to choose more efficient plans.
- Firms offering health benefits with more than 50 workers and who do not already offer health benefits through a private exchange were asked whether they were considering a defined contribution approach. Twenty-six percent of these firms were considering such an approach (Exhibit 14.6).
Some firms provide for health and other benefits by entering into a co-employment relationship with a Professional Employer Organization (PEO). Under this arrangement, the firm manages the day-to-day responsibilities of employees but the PEO also hires the employees and acts as the employer for insurance, benefits, and other administrative purposes.
- Five percent of firms with 3 to 499 workers offering health benefits offer coverage in conjunction with a PEO (Exhibit 14.8).
- Six percent of covered workers enrolled in health benefits at firms with 3 to 499 workers are enrolled in a plan offered through a PEO.
Enrollment incentives
Some firms provide additional incentives to influence employees’ enrollment decisions.
- Nine percent of firms offering health benefits provide additional incentives if an employee enrolls in a spouse’s plan (Exhibit 14.9).
- Among firms offering benefits who do not offer additional incentives to employees who enroll in a spouse’s plan, 7% provide additional compensation or benefits to employees if they choose not to enroll in the firm’s health benefits (Exhibit 14.9).
Pre-Tax employee premium contributions and flexible spending accounts
Section 125 of the Internal Revenue Code permits employees to pay for health insurance premiums with pre-tax dollars. Firms do not have to offer health insurance in order to establish these accounts. Flexible spending accounts (FSAs) allow employees to set aside funds on a pre-tax basis to pay for medical expenses not covered by health insurance. In 2015, employees may place up to $2,550 in an FSA.
- Among firms offering and not offering health benefits, 38% offer pre-tax employee premium contributions. Large firms (200 or more workers) are significantly more likely than small firms (3-199 workers) to offer these contributions (90% vs. 37%, respectively) (Exhibit 14.10). Seven percent of firms responded “not applicable” when asked if they allow the establishment of a section 125 plan. For example, some firms offering coverage may pay all of the premium.
- Among firms offering and not offering health benefits, 18% offer FSAs. Large firms are significantly more likely than small firms to offer an FSA (74% vs. 17%, respectively) (Exhibit 14.10).
- The percentage of firms offering pre-tax employee premium contributions and FSAs in 2015 is similar to 2012 (42% and 18%, respectively) (Exhibit 14.11).
- Firms offering health benefits are more likely to have a section 125 account (54% vs. 21%) and allow workers to make FSA contributions (31% vs. 3%) than firms that do not offer health benefits.
Telemedicine
Telemedicine involves exchanging medical information electronically, such as through video, email, or smart phones. This survey does not consider information provided online as telemedicine unless a health professional provides information specific to the enrollee’s condition.
- The largest health plan at 27% of large firms (200 or more employees) offering health benefits includes coverage for telemedicine (Exhibit 14.12).
Excise tax on high cost health plans
Beginning in 2018, employer plans will be assessed a 40% excise tax on the value of the total cost of their plans above specified thresholds ($10,200 for single coverage and $27,000 for family coverage in 2018). The total cost of the plan is calculated based on several factors including any FSA contributions, premium costs, and any employer HRA contributions. In anticipation of the high-cost plan tax (sometimes referred to as the “Cadillac plan tax”), some employers have begun making changes to their health benefits.
- Among firms offering health benefits, 53% of large firms (200 or more workers) and 17% of small firms have conducted an analysis to determine if one of their plans will be subject to the tax when it takes effect (Exhibit 14.13).
- Among firms who have conducted an analysis to determine their liability under the high-cost plan tax, 12% believe their plan with the largest enrollment will exceed the thresholds in 2018 (Exhibit 14.14).
- Some employers have already taken action to mitigate the anticipated impacts of the high-plan excise tax; 13% of large firms (200 or more employers) and 7% of small firms have made changes to their plans’ coverage or cost sharing to avoid exceeding the limits. Eight percent of both large and small firms have switched to a lower cost plan. Looking at firms that took one of these two actions, 11% of small firms (3-199 workers) and 16% of large firms reported either changing their plan or switching carriers to reduce the cost of their plan in anticipation of the assessment.
- Among large firms (200 or more workers) who indicated changing their plan or switching carriers to reduce the cost of their plan, 64% have increased cost sharing, 10% have reduced the scope of covered services, 34% have moved benefit options to account-based plans such as an HRA or HSA, 18% have increased incentives to use less costly providers, and 16% have considered offering health insurance through a private exchange in anticipation of the excise tax (Exhibit 14.15).
Employer shared responsibility
Beginning in 2015, employers with at least 100 full-time equivalent employees (FTEs) are required to offer health benefits to at least 70% of their full-time employees and their dependent children or potentially pay a fee. There is a separate provision that sets minimum standards for minimum value and affordability for the coverage that is offered in order to avoid a potential fee. Beginning in 2016, employers with at least 50 FTEs will also be subject to the employer shared responsibility provisions.
- Among firms reporting at least 100 FTEs (or, if they did not know FTEs, of firms with at least 100 employees), 96% report that they offer a health plan that would meet these requirements, 2% said they did not, and 3% reported “Don’t know” (Exhibit 14.17).
- Five percent of these firms reported that this year they offered more comprehensive benefits to some workers who previously were only offered a limited benefit plan (Exhibit 14.20).
- Twenty-one percent of offering firms with 100 or more FTEs (or, if they did not know FTEs, firms with at least 100 employees) reported that the employer shared responsibility provisions encouraged them to extend eligibility for health benefits to workers or groups of workers that were not previously eligible for benefits (Exhibit 14.18).
Firms with 50 or more FTEs (or, if they did not know how many FTEs, firms with at least 50 employees) were asked about changes to their workforce in response to the employer requirement.
- Four percent of these firms reported changing some job classifications from full-time to part-time so employees in those jobs would not be eligible for health benefits, and 10% of firms reported doing just the opposite and converting part-time jobs to full-time jobs (Exhibit 14.19).
- Four percent of these firms reported that they reduced the number of employees they intended to hire because of the cost of providing health benefits (Exhibit 14.19).
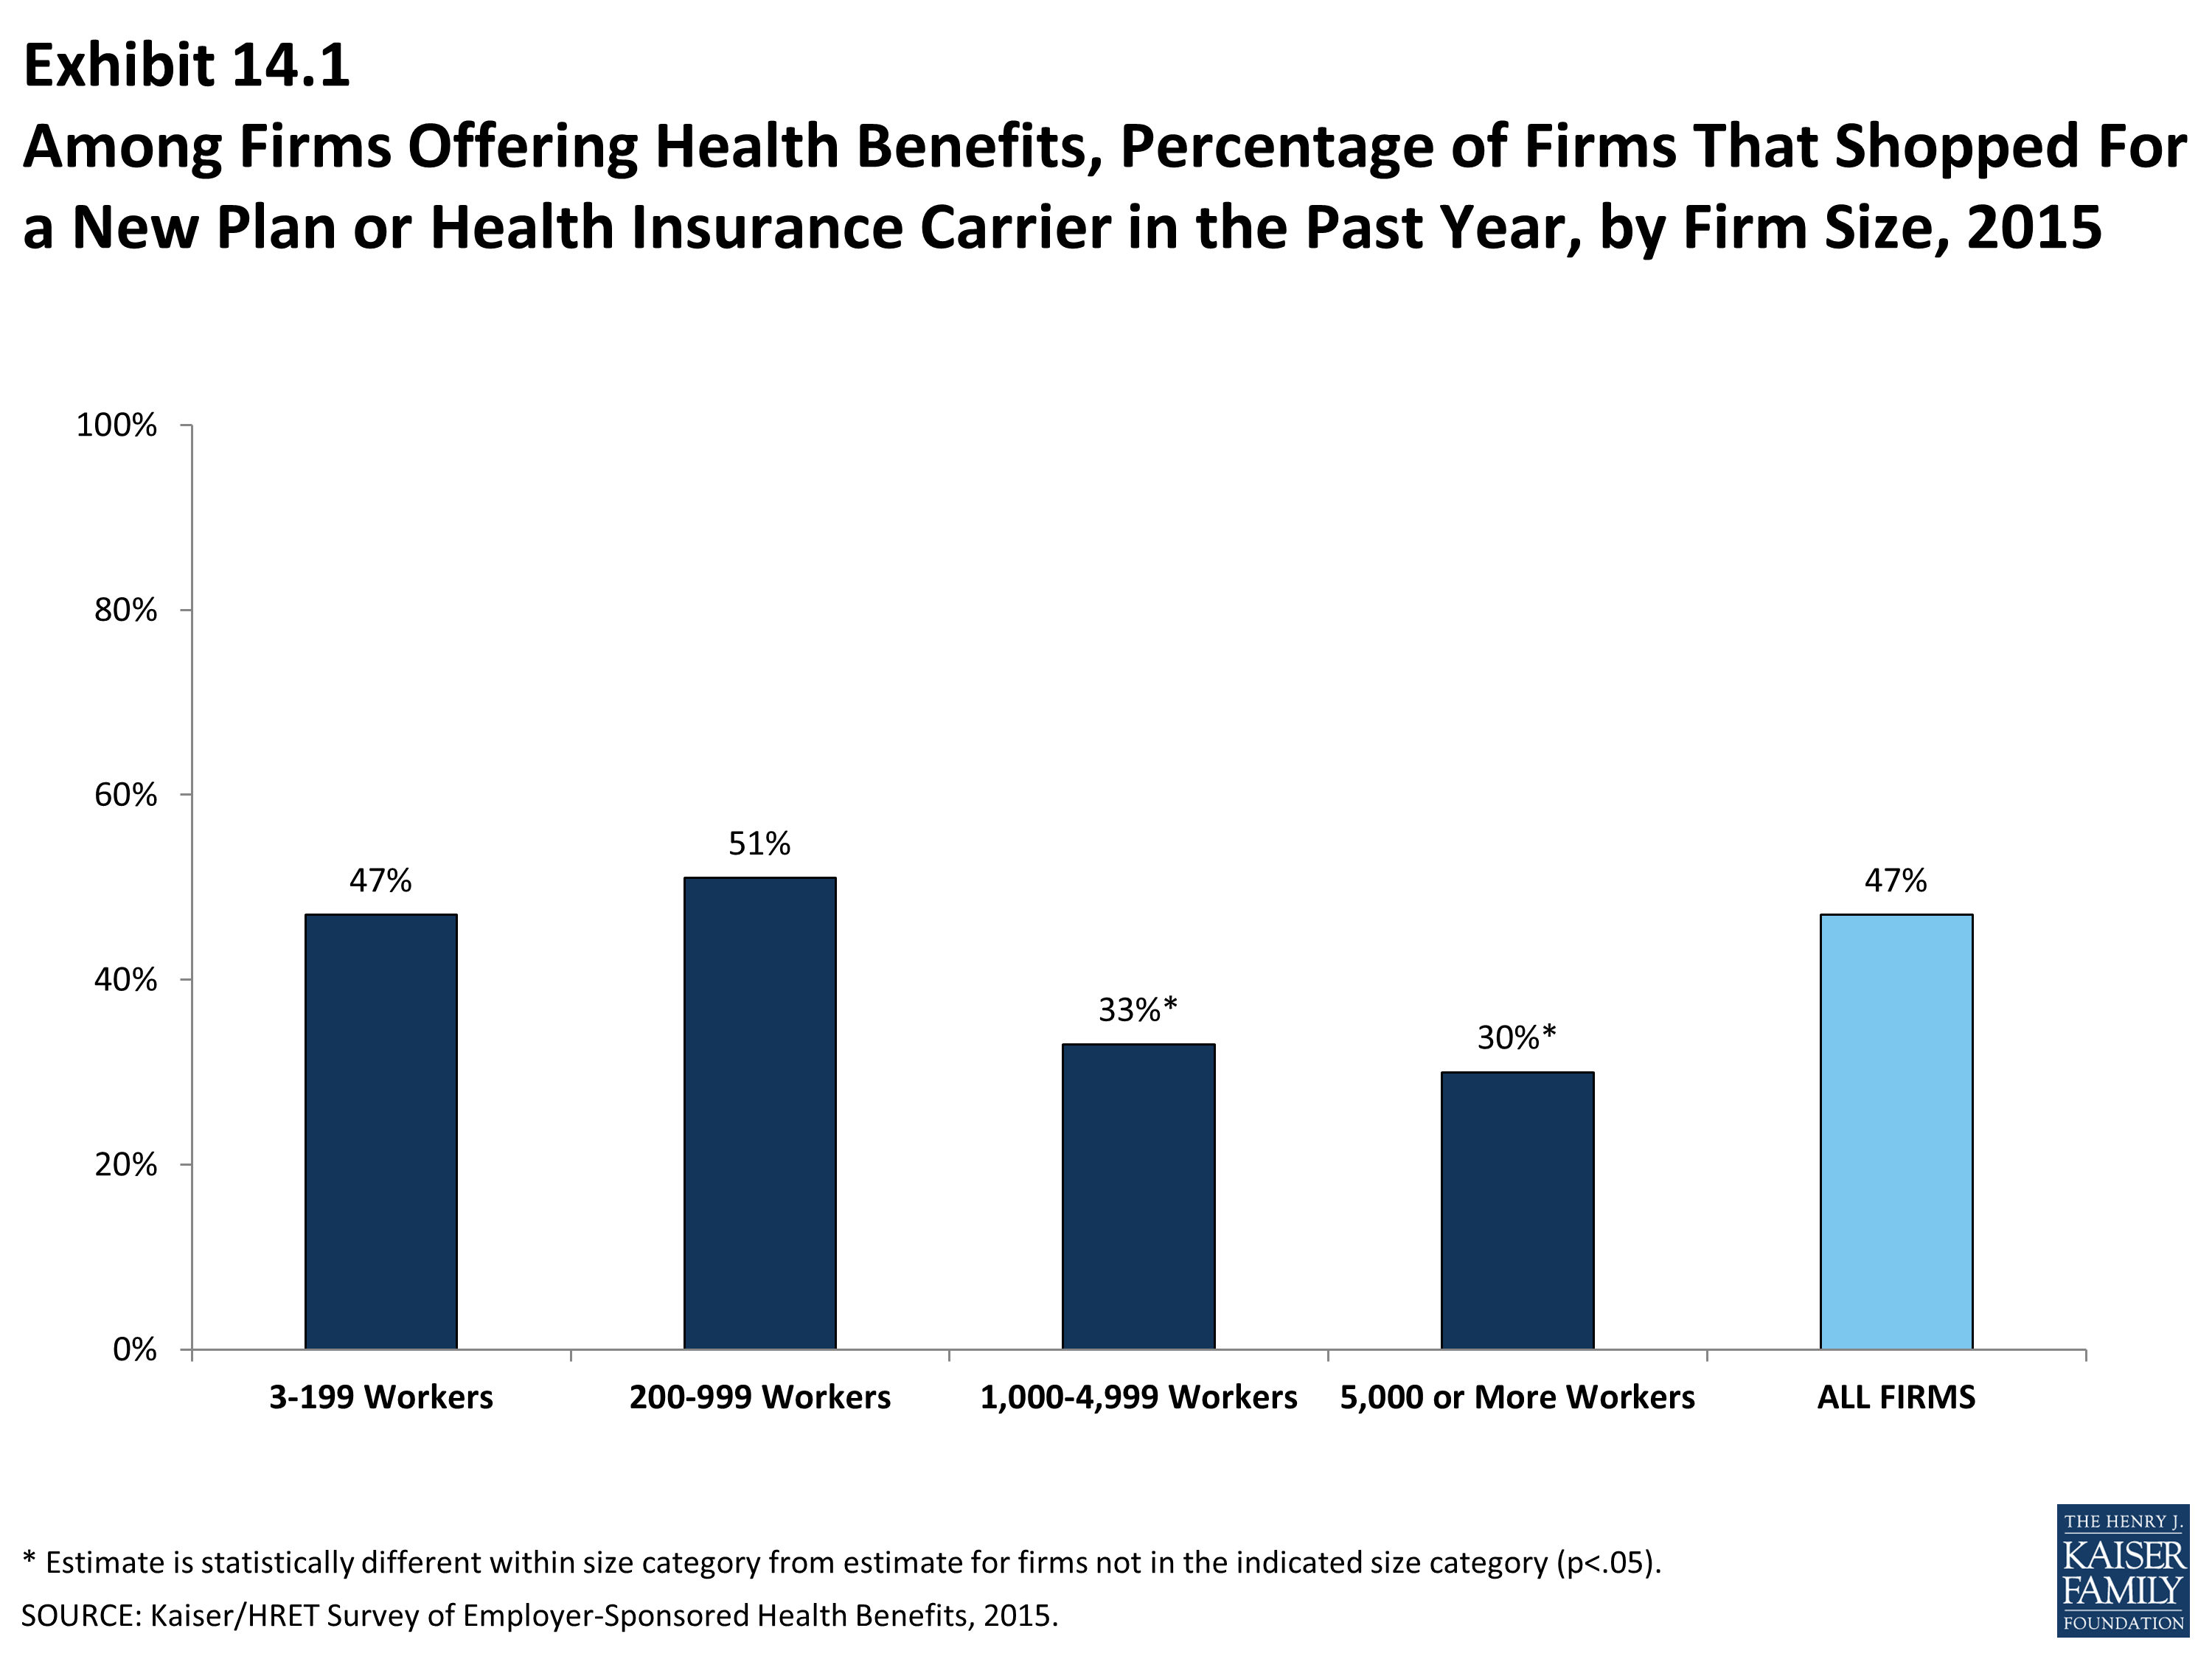
Among Firms Offering Health Benefits, Percentage of Firms That Shopped For a New Plan or Health Insurance Carrier in the Past Year, by Firm Size, 2015
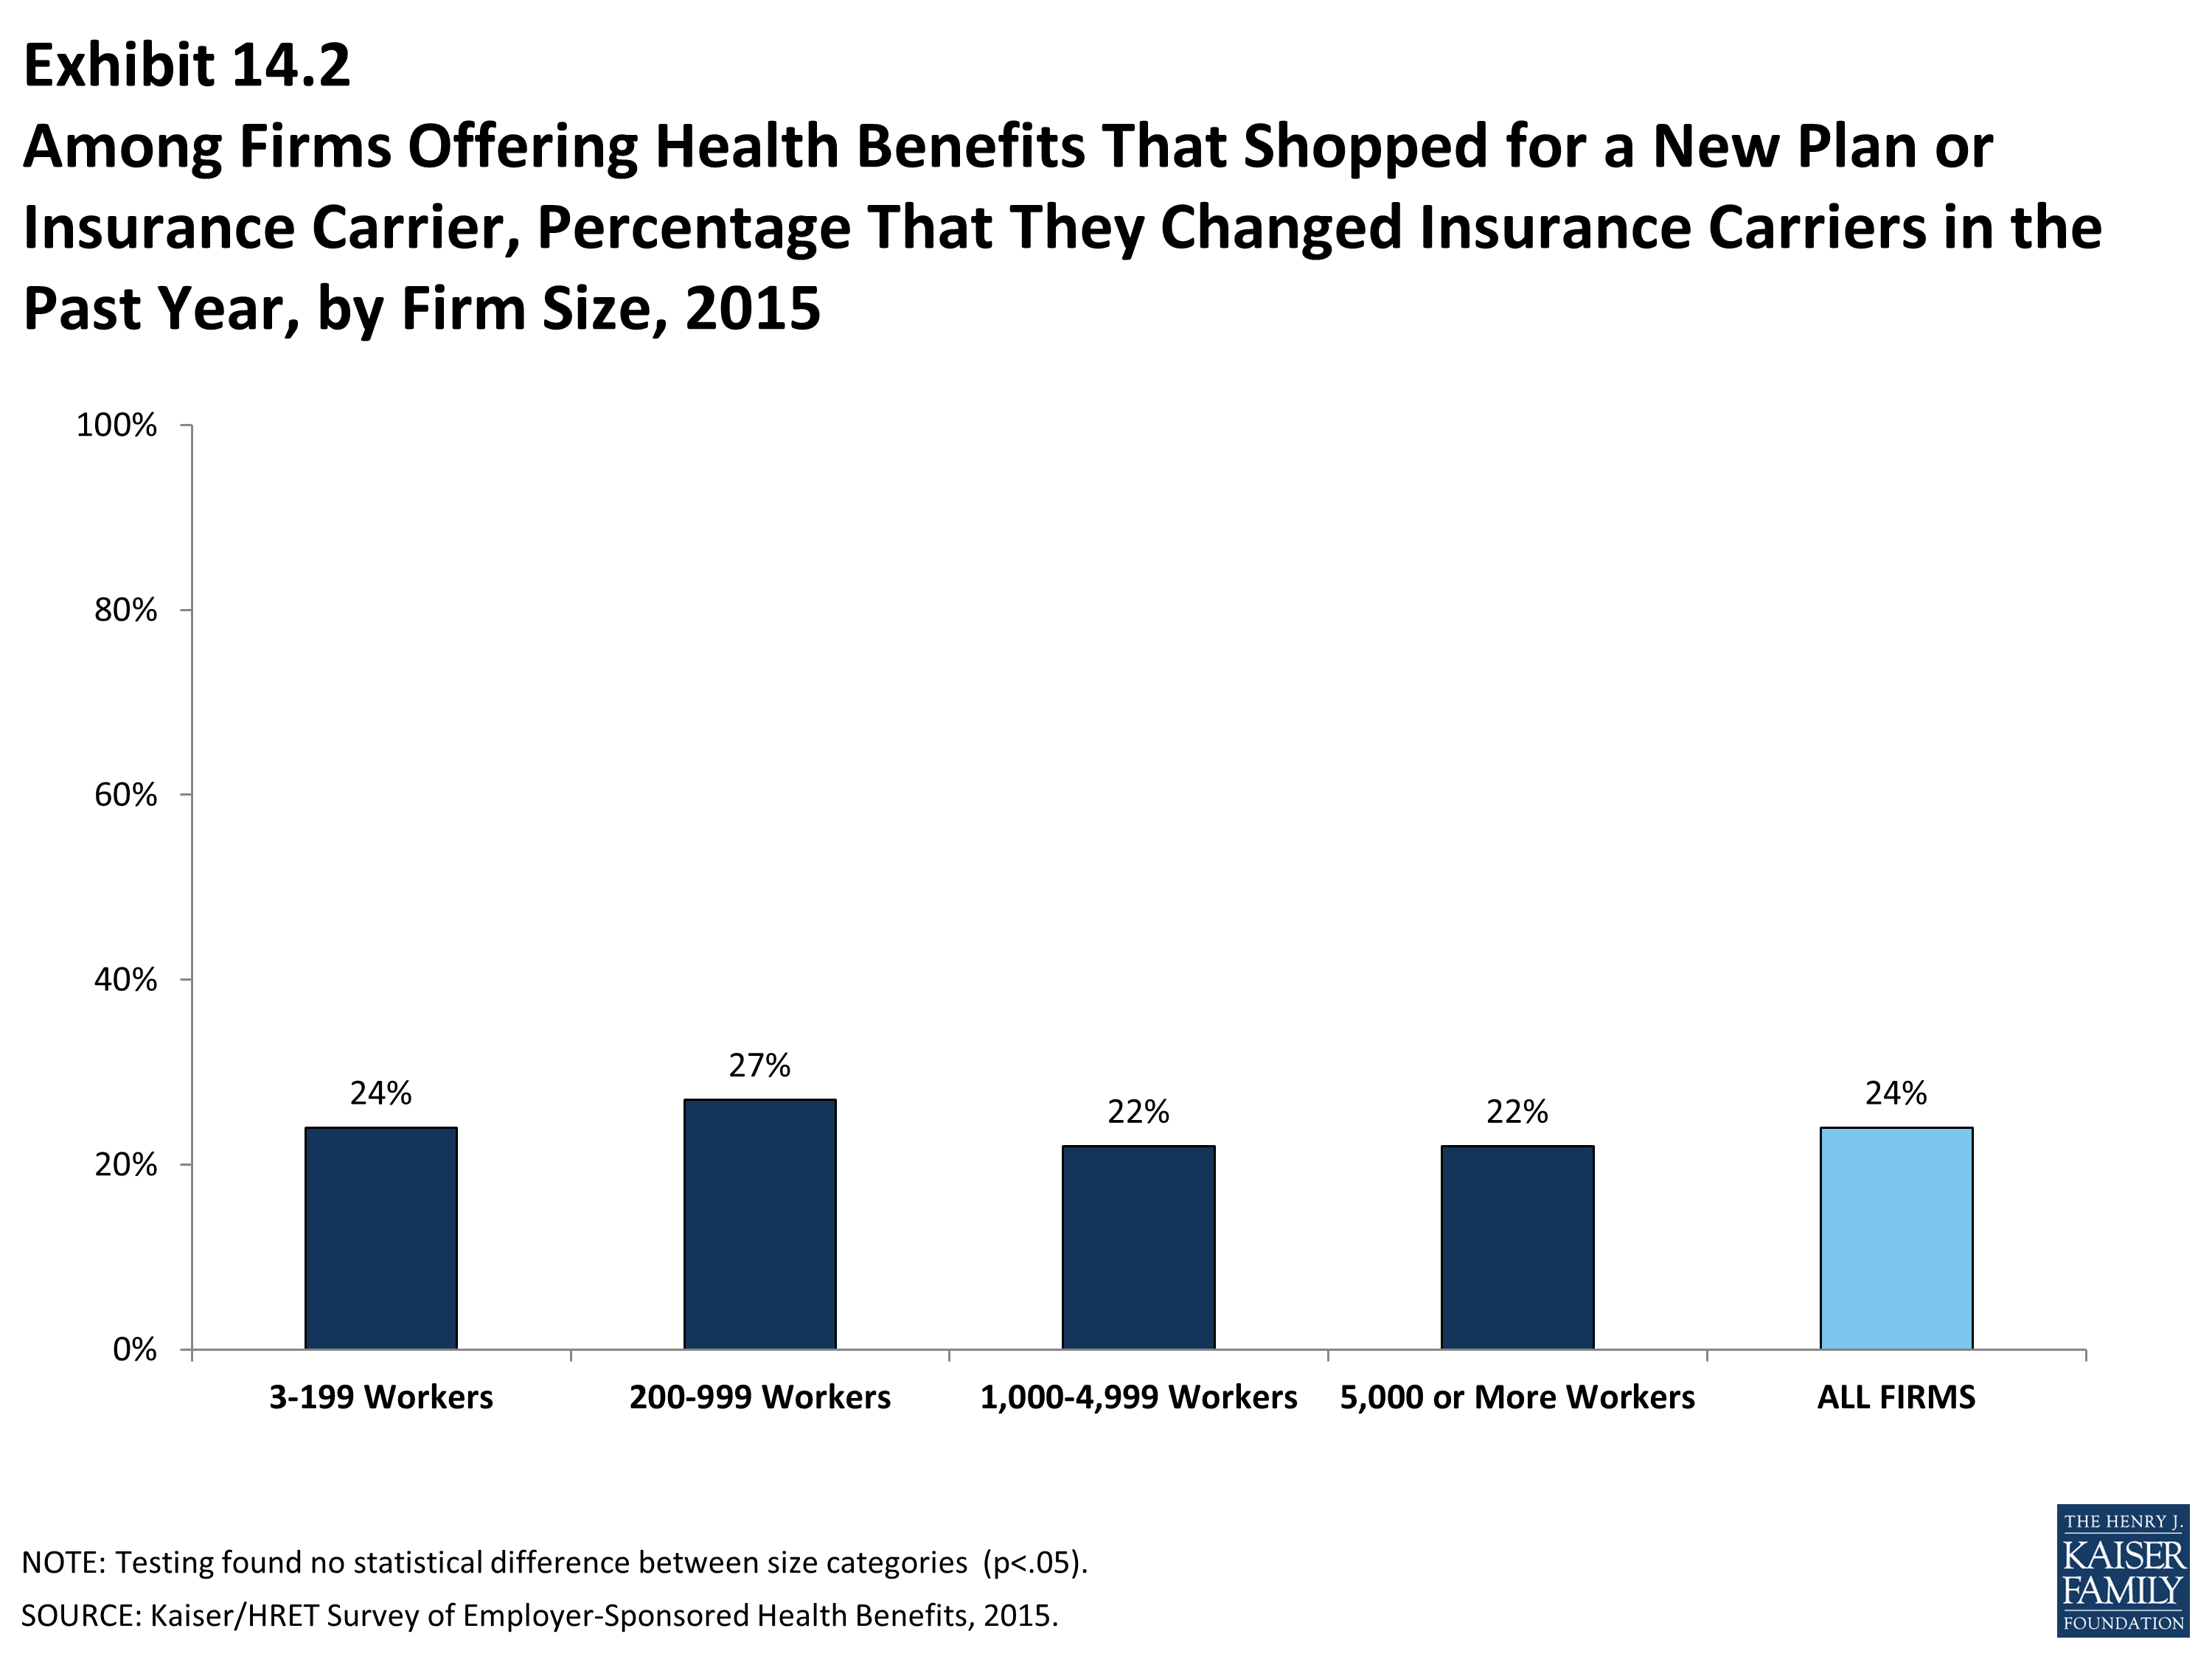
Among Firms Offering Health Benefits That Shopped for a New Plan or Insurance Carrier, Percentage That They Changed Insurance Carriers in the Past Year, by Firm Size, 2015
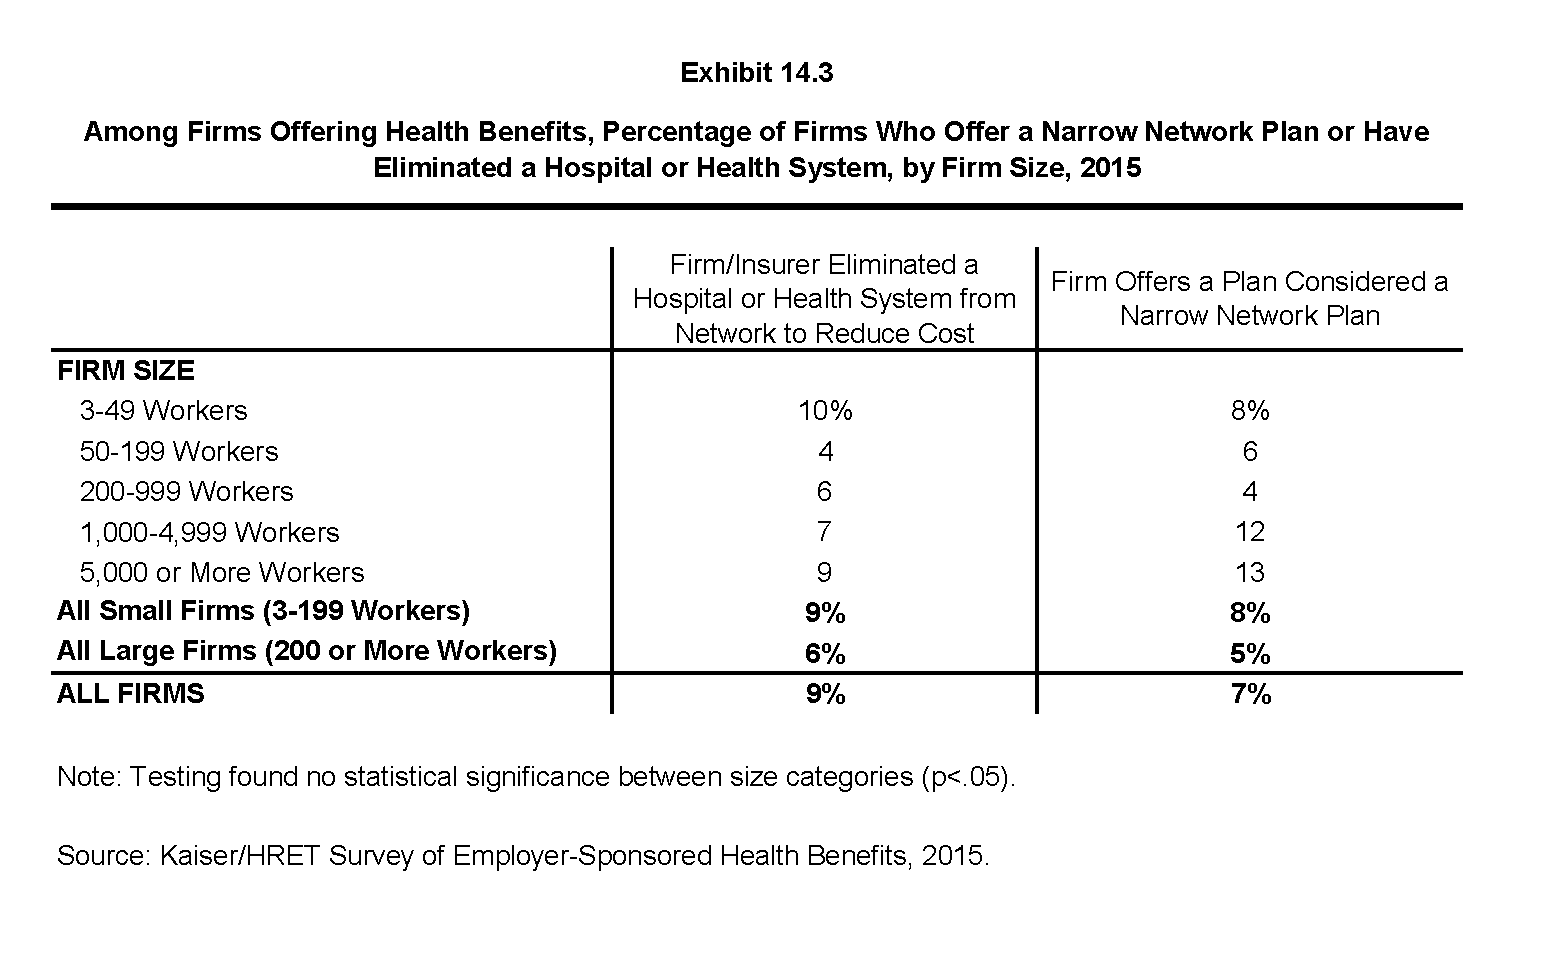
Among Firms Offering Health Benefits, Percentage of Firms Who Offer a Narrow Network Plan or Have Eliminated a Hospital or Health System, by Firm Size, 2015
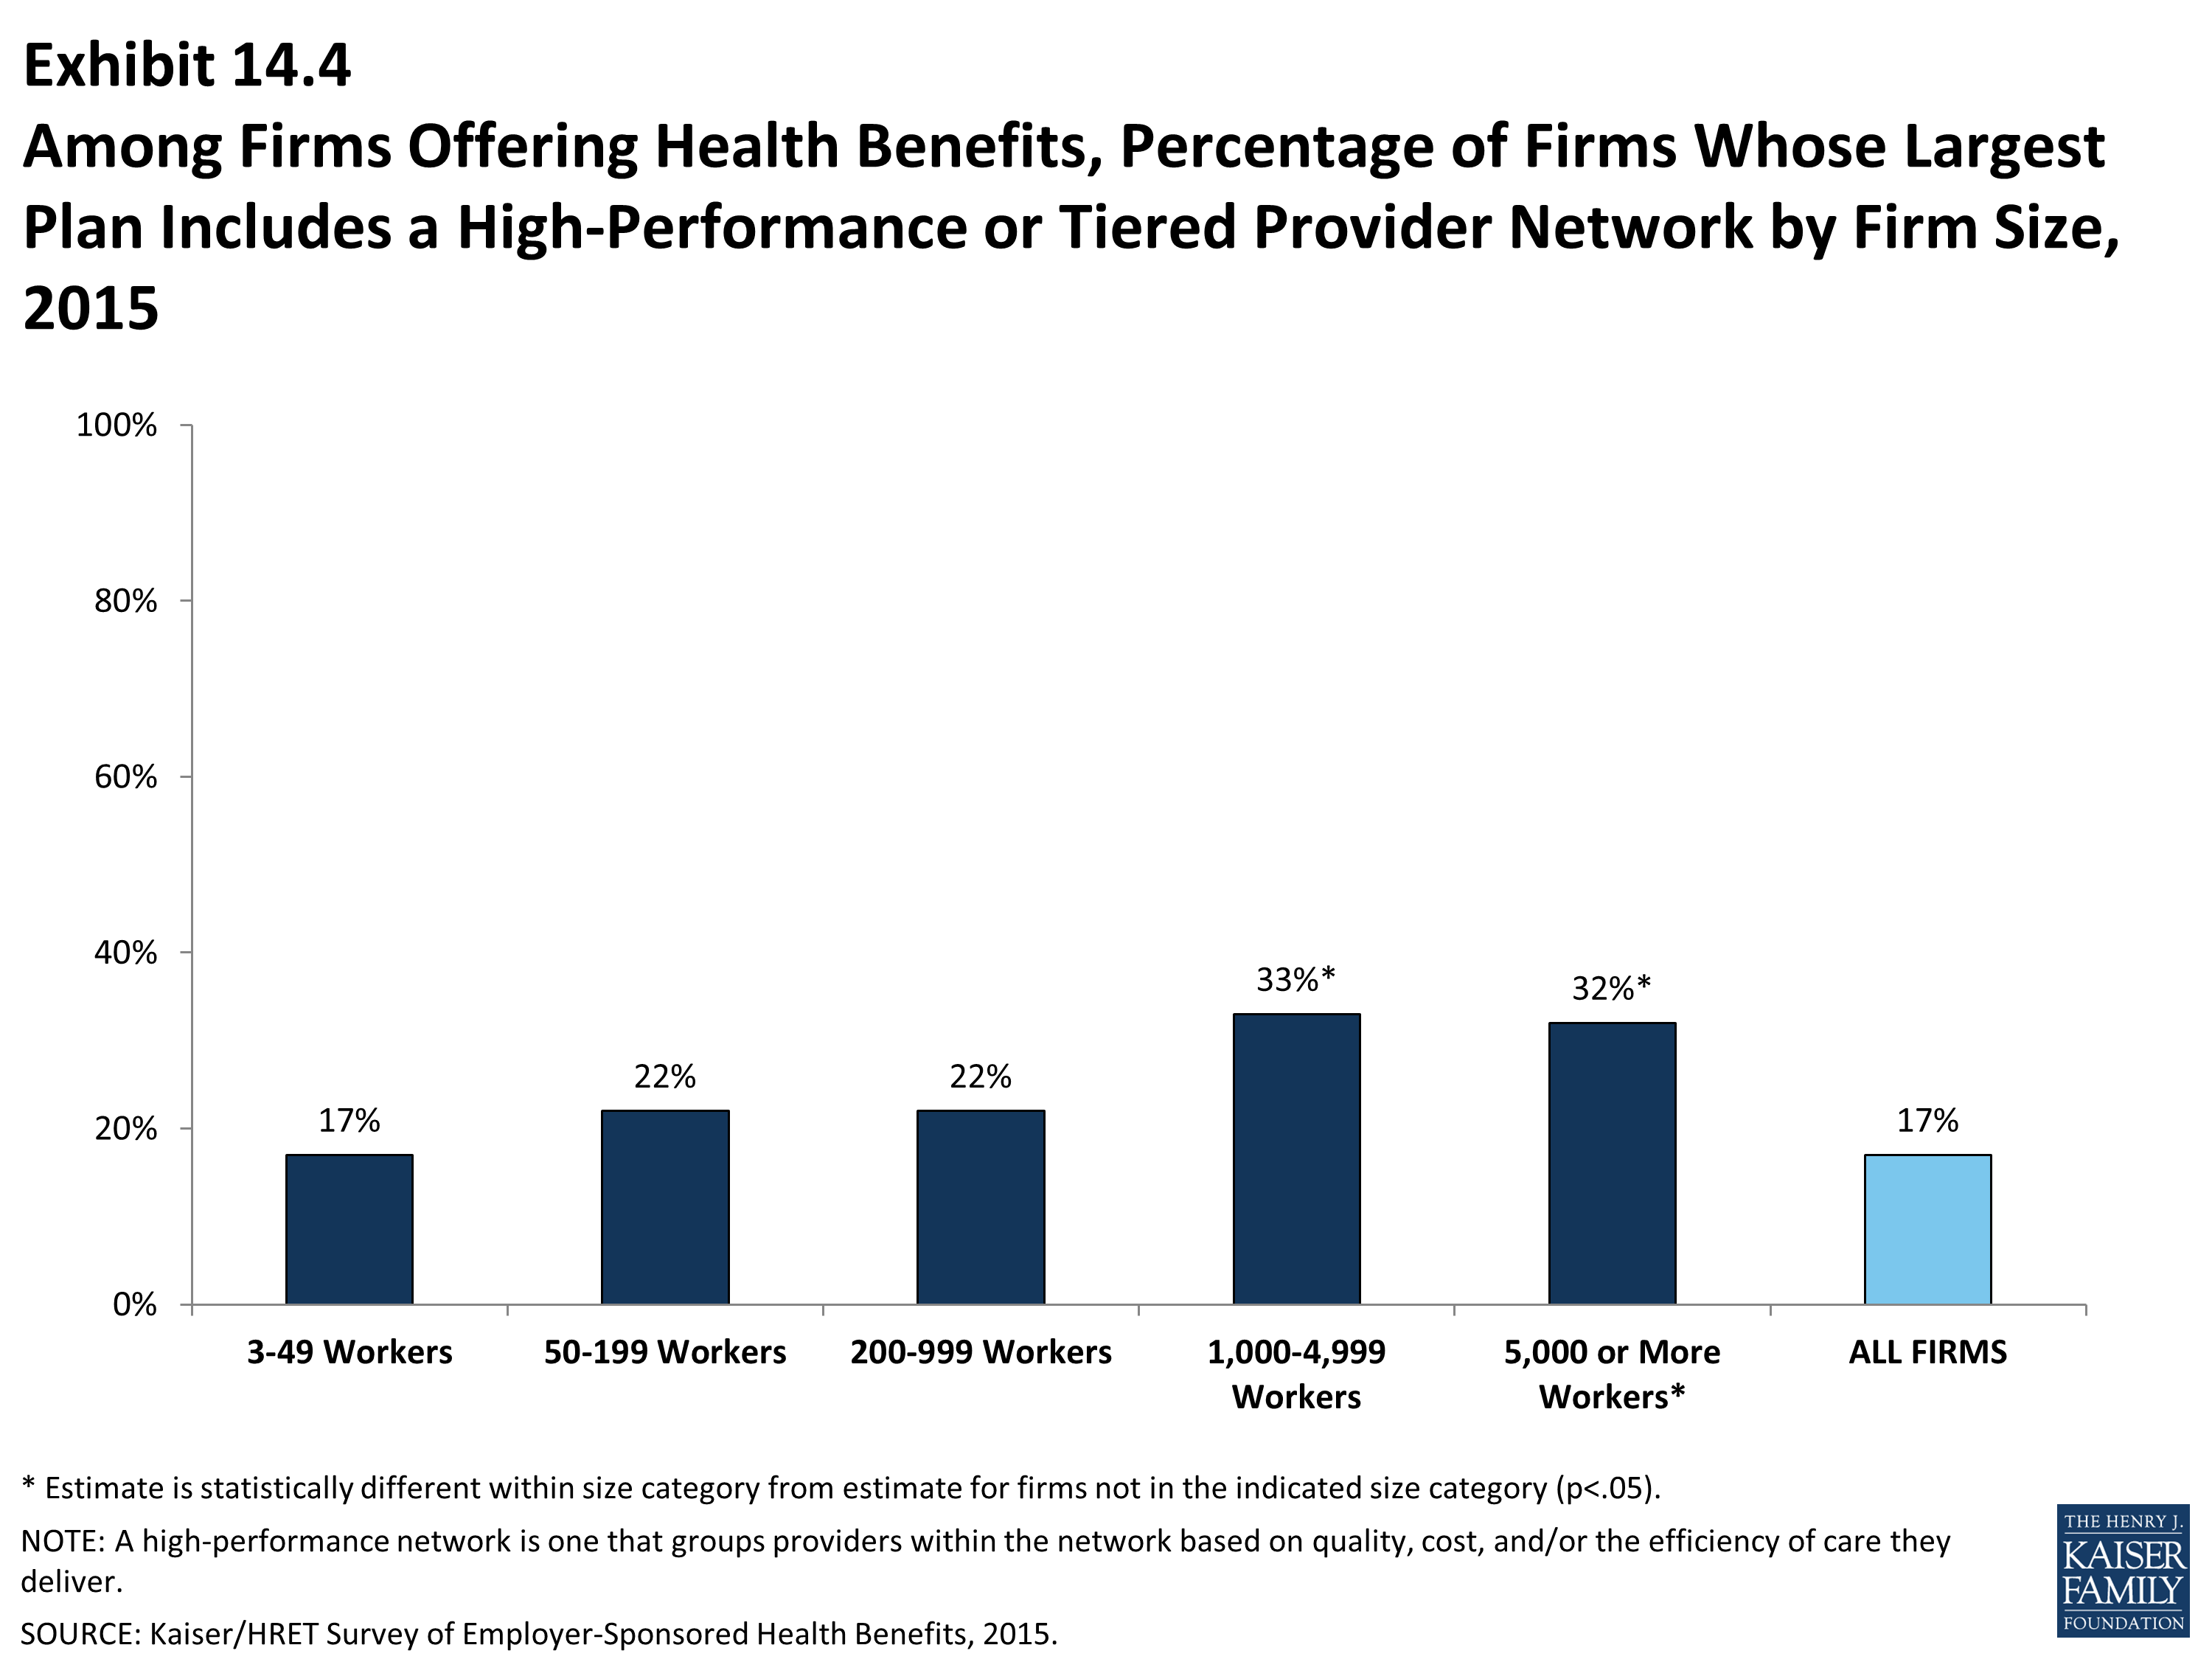
Among Firms Offering Health Benefits, Percentage of Firms Whose Largest Plan Includes a High-Performance or Tiered Provider Network by Firm Size, 2015
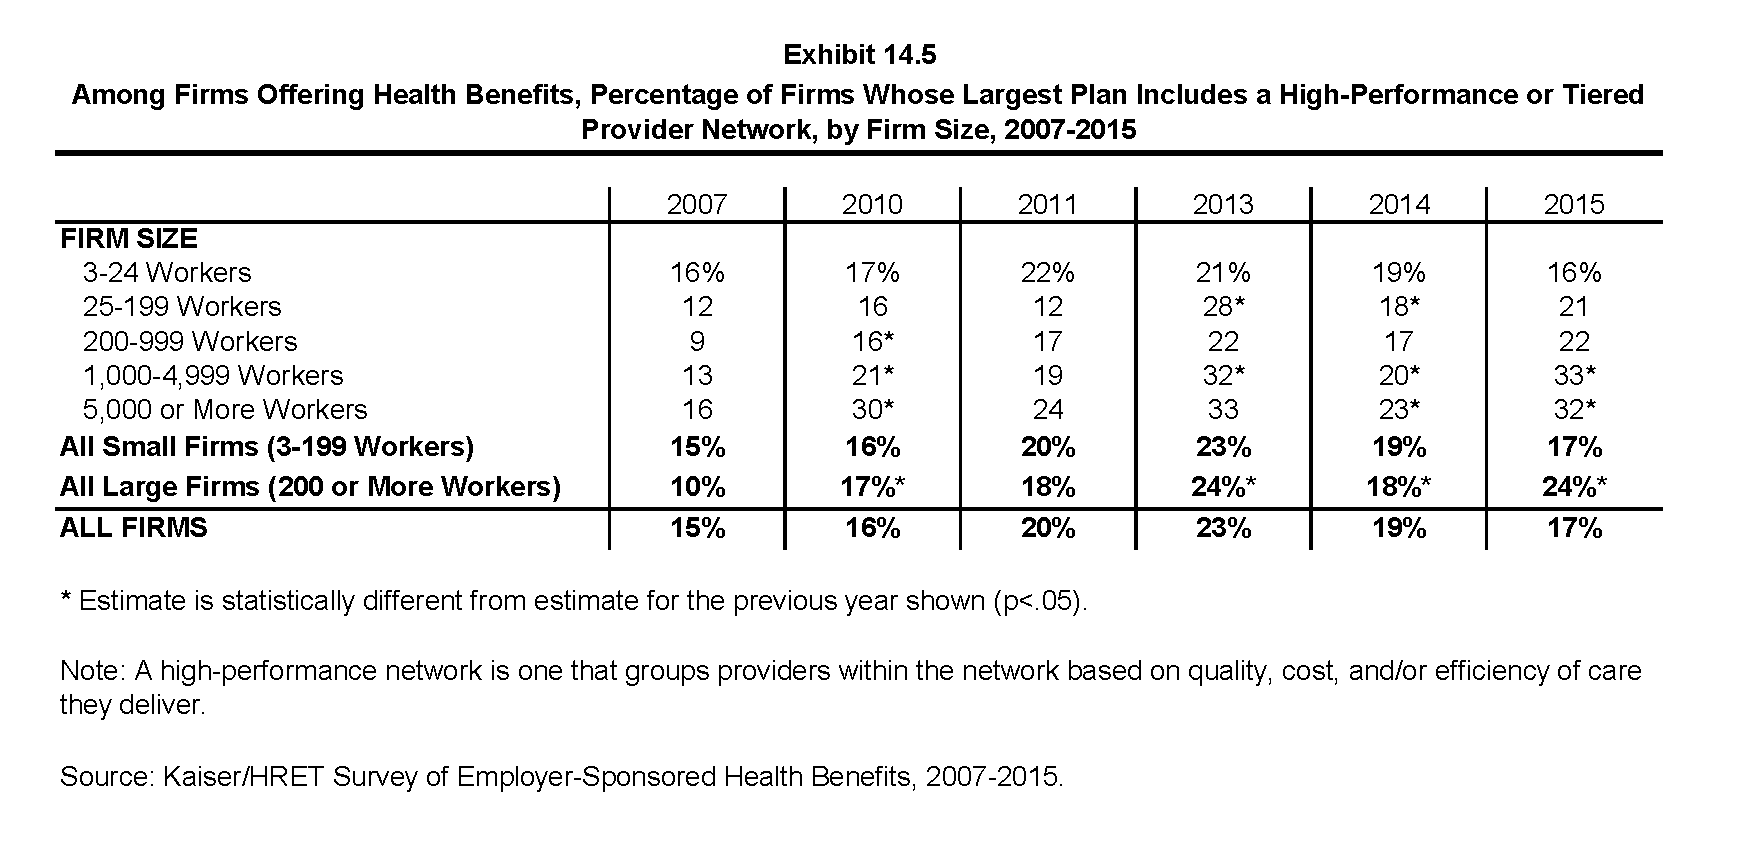
Among Firms Offering Health Benefits, Percentage of Firms Whose Largest Plan Includes a High-Performance or Tiered Provider Network, by Firm Size, 2007-2015
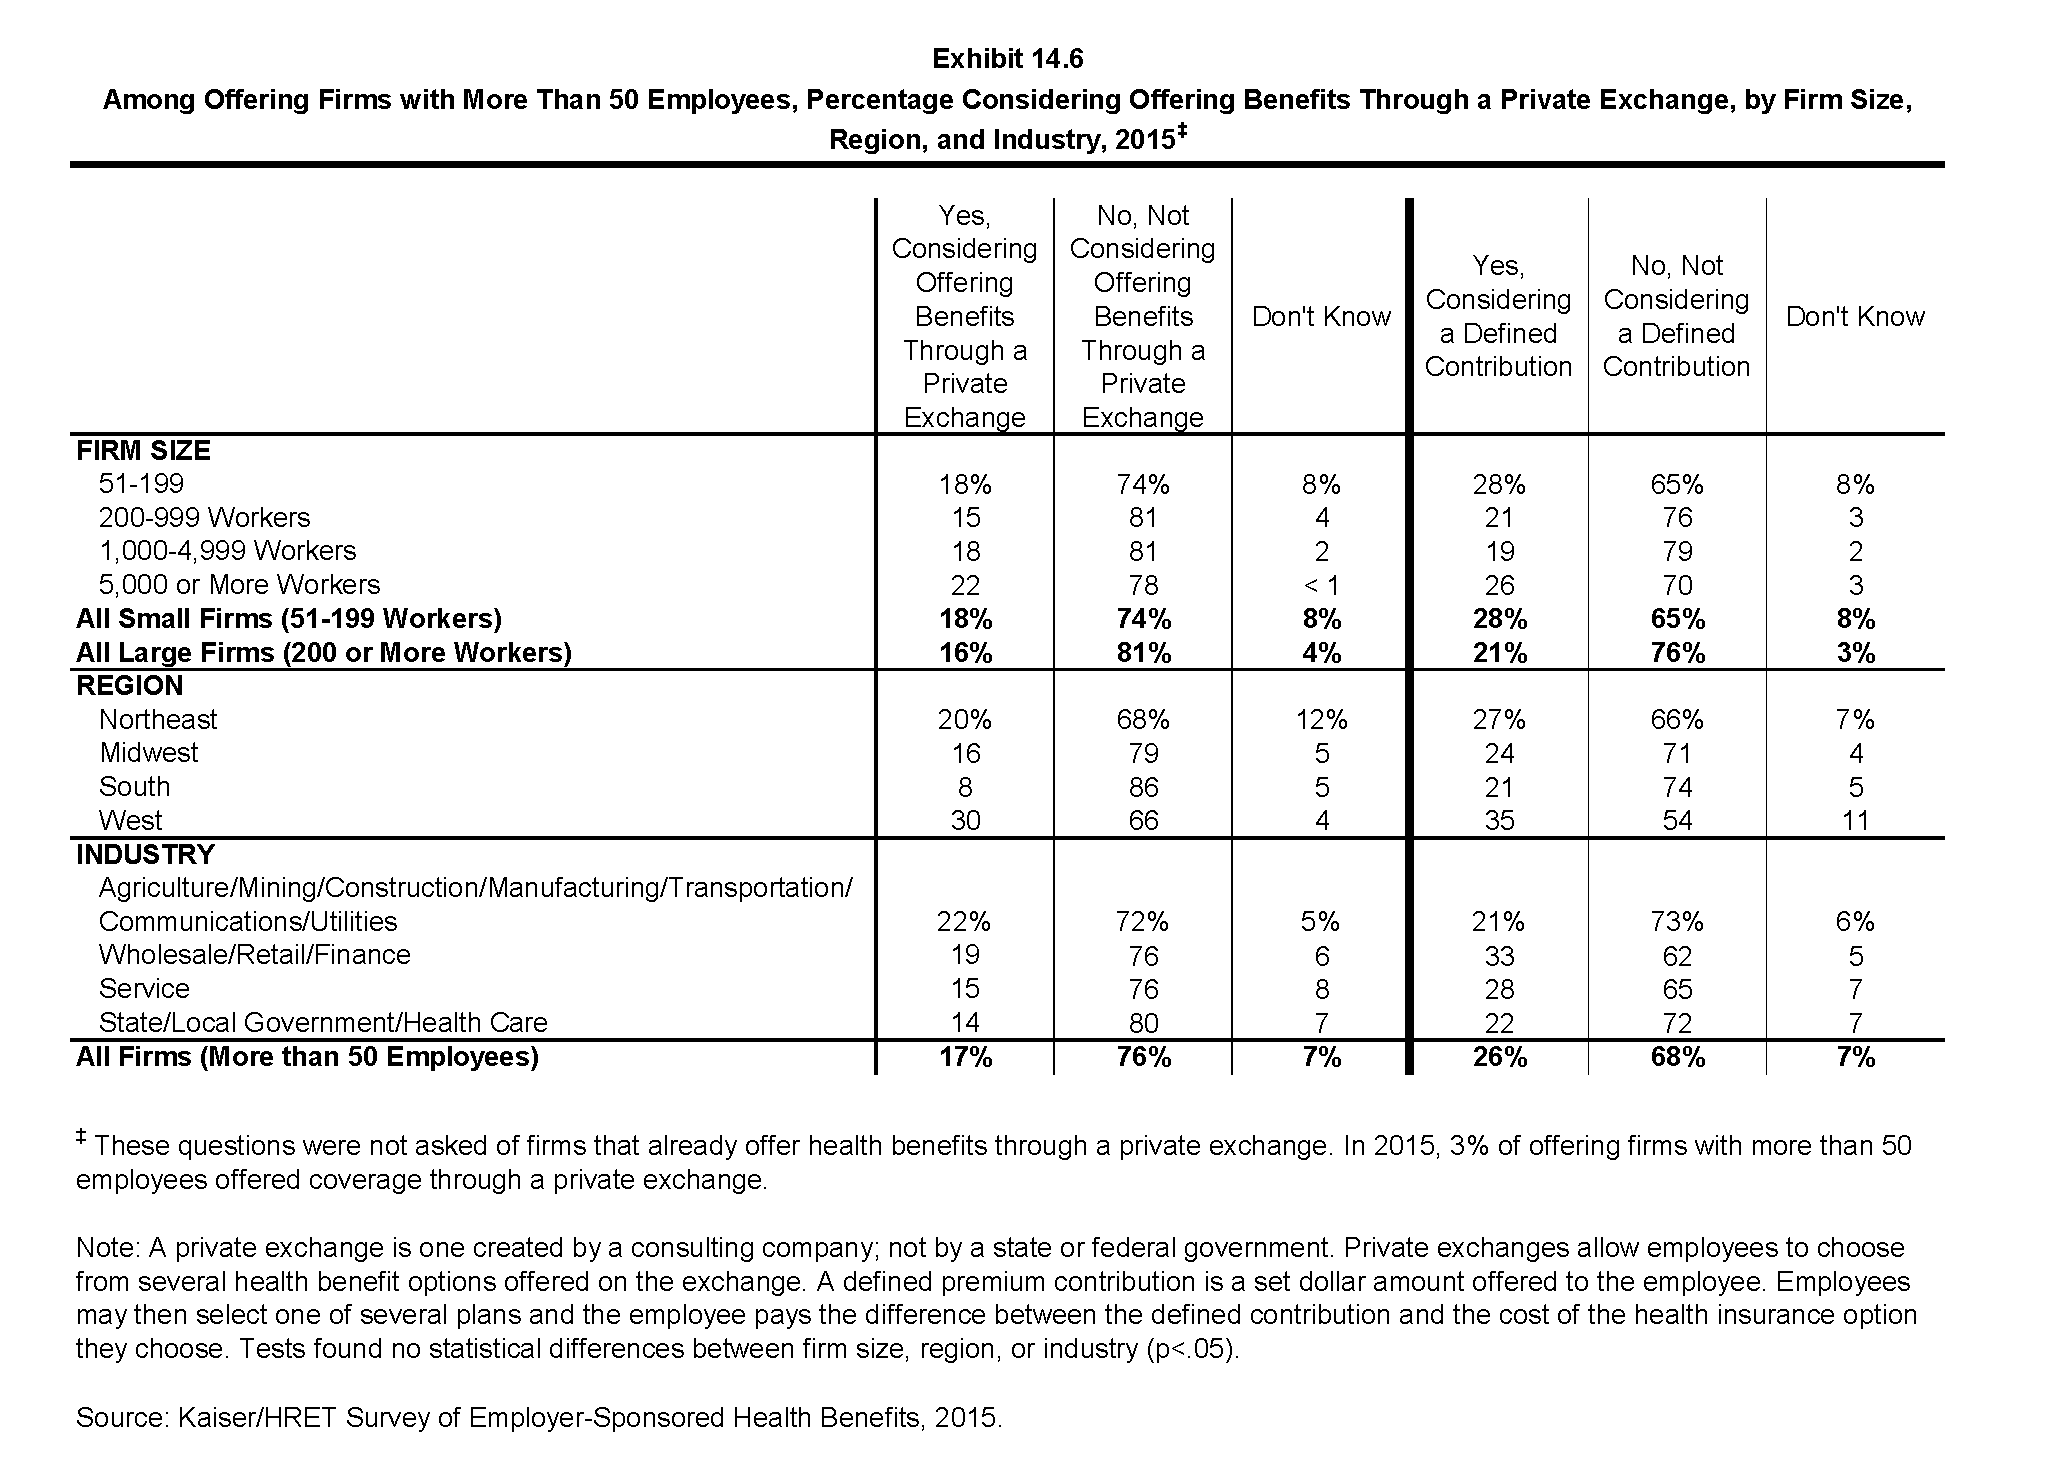
Among Offering Firms with More Than 50 Employees, Percentage Considering Offering Benefits Through a Private Exchange, by Firm Size, Region, and Industry, 2015
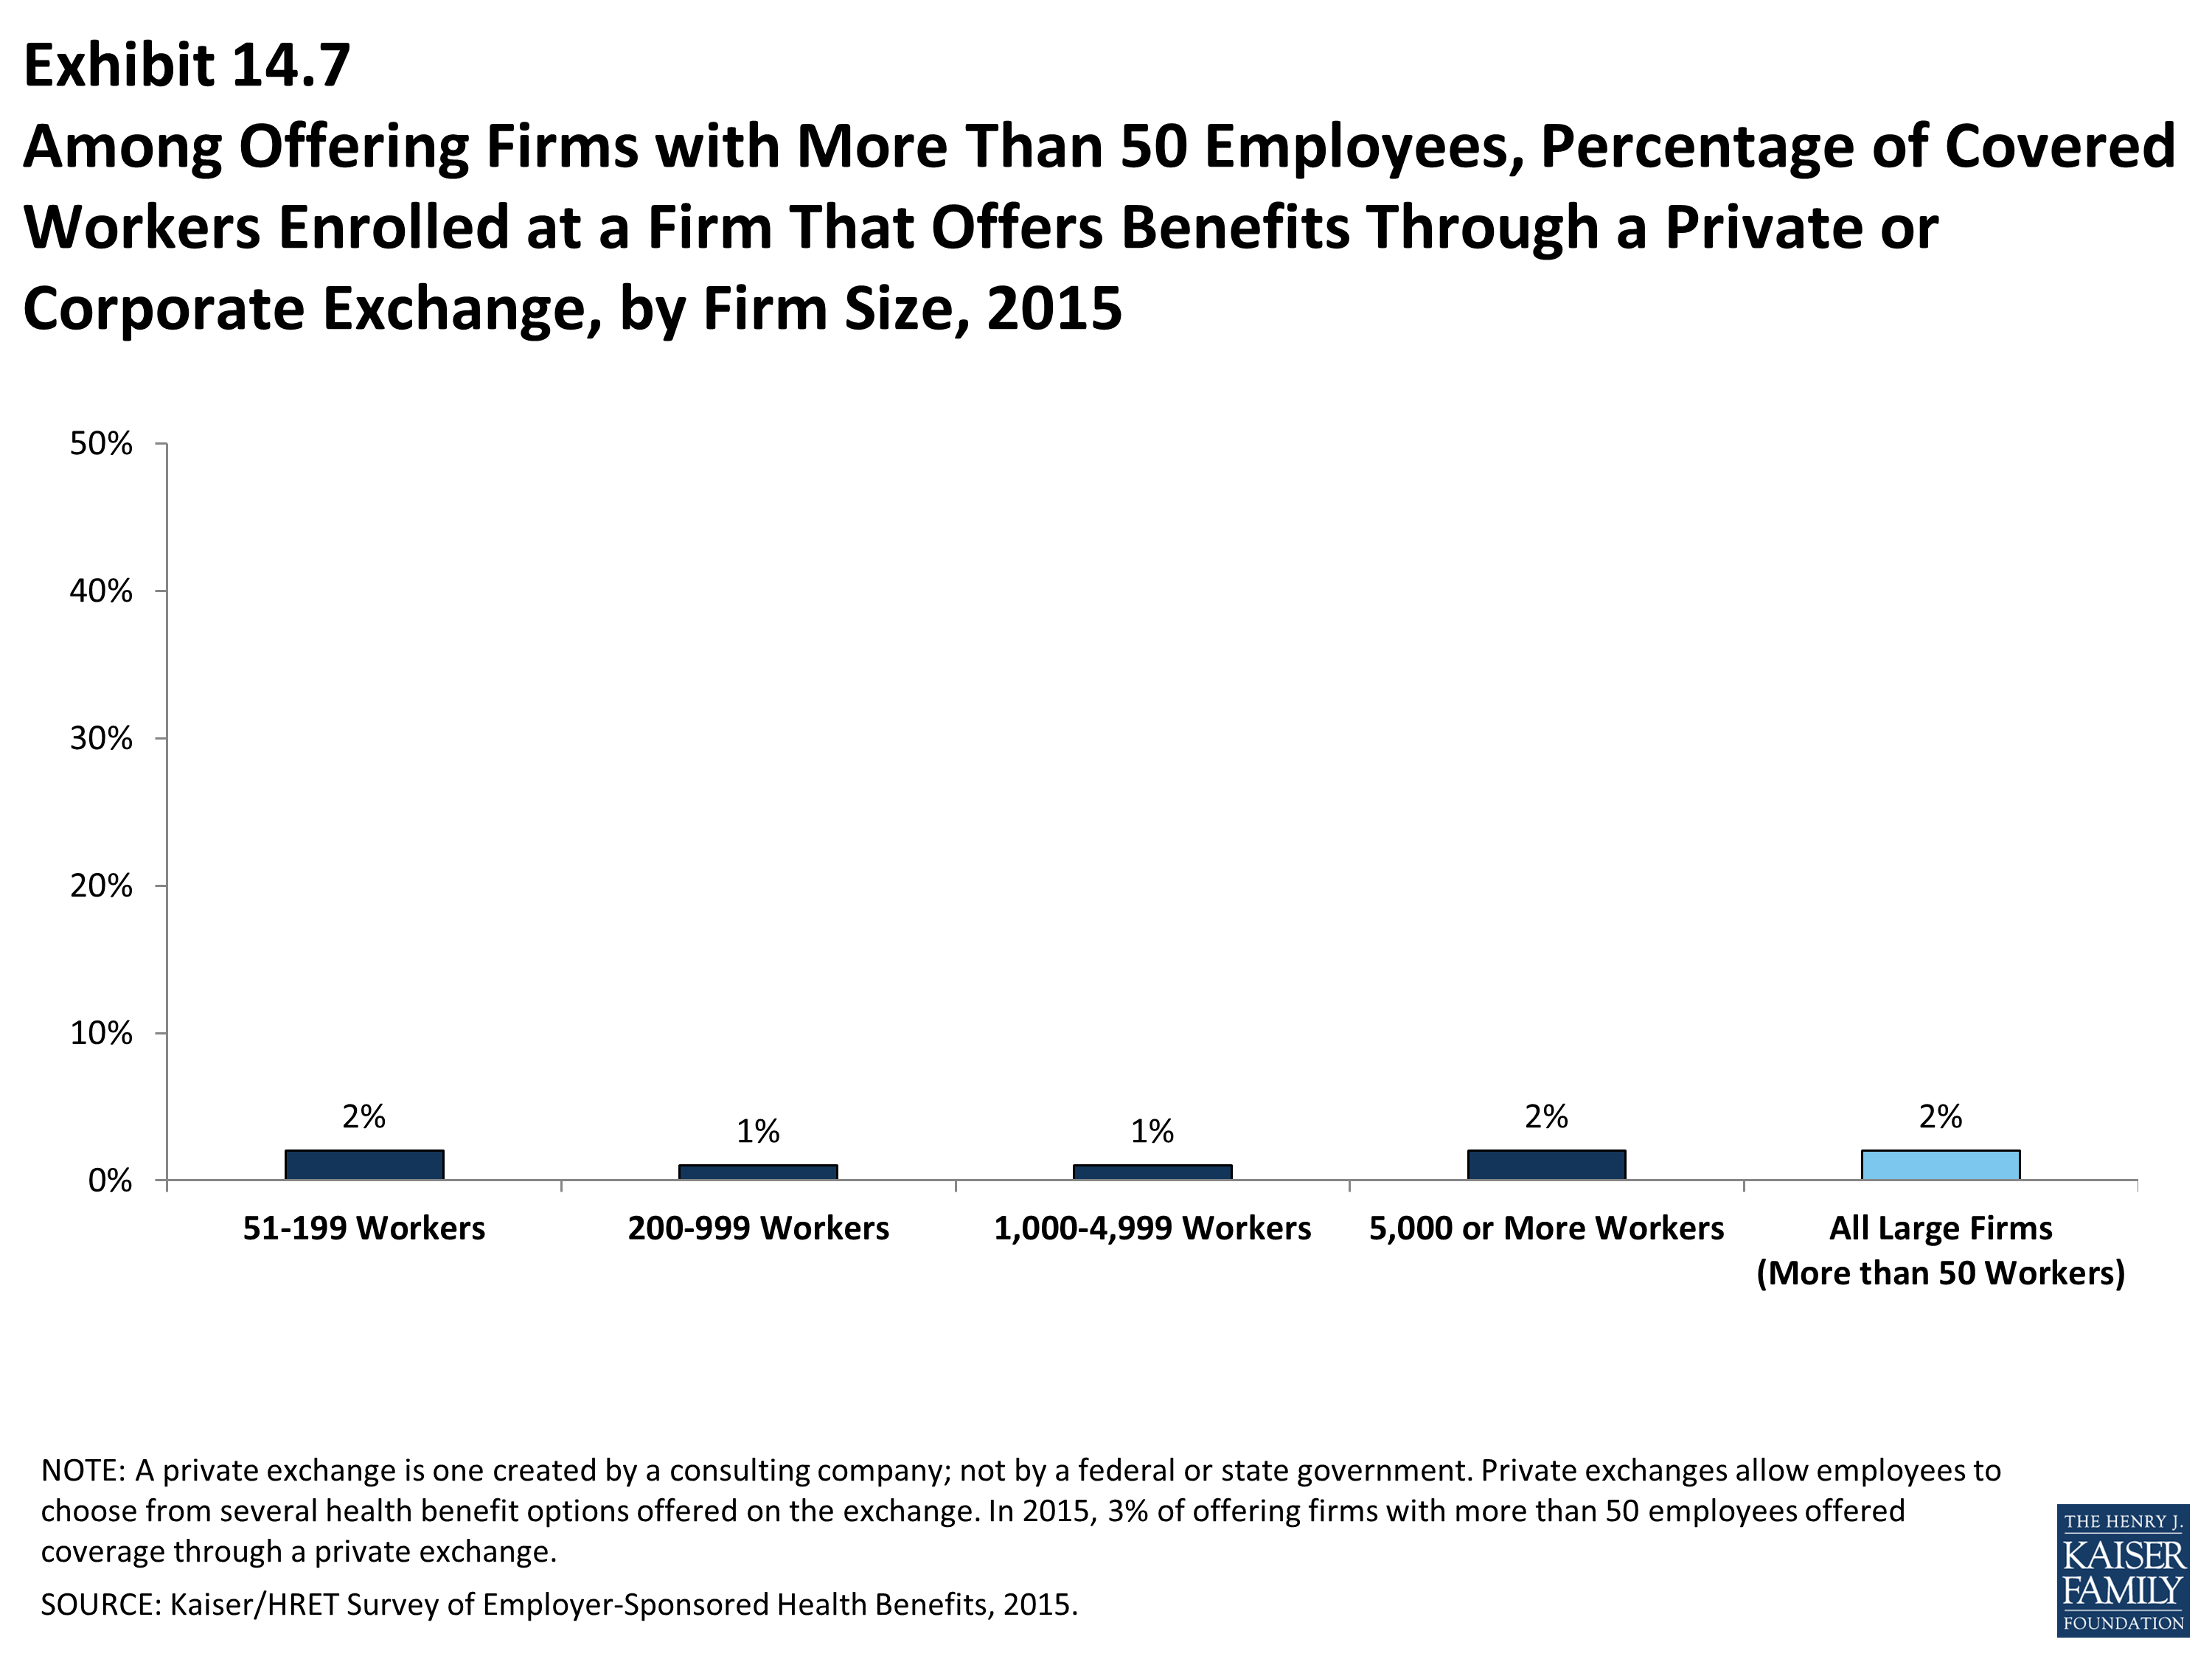
Among Offering Firms with More Than 50 Employees, Percentage of Covered Workers Enrolled at a Firm That Offers Benefits Through a Private or Corporate Exchange, by Firm Size, 2015
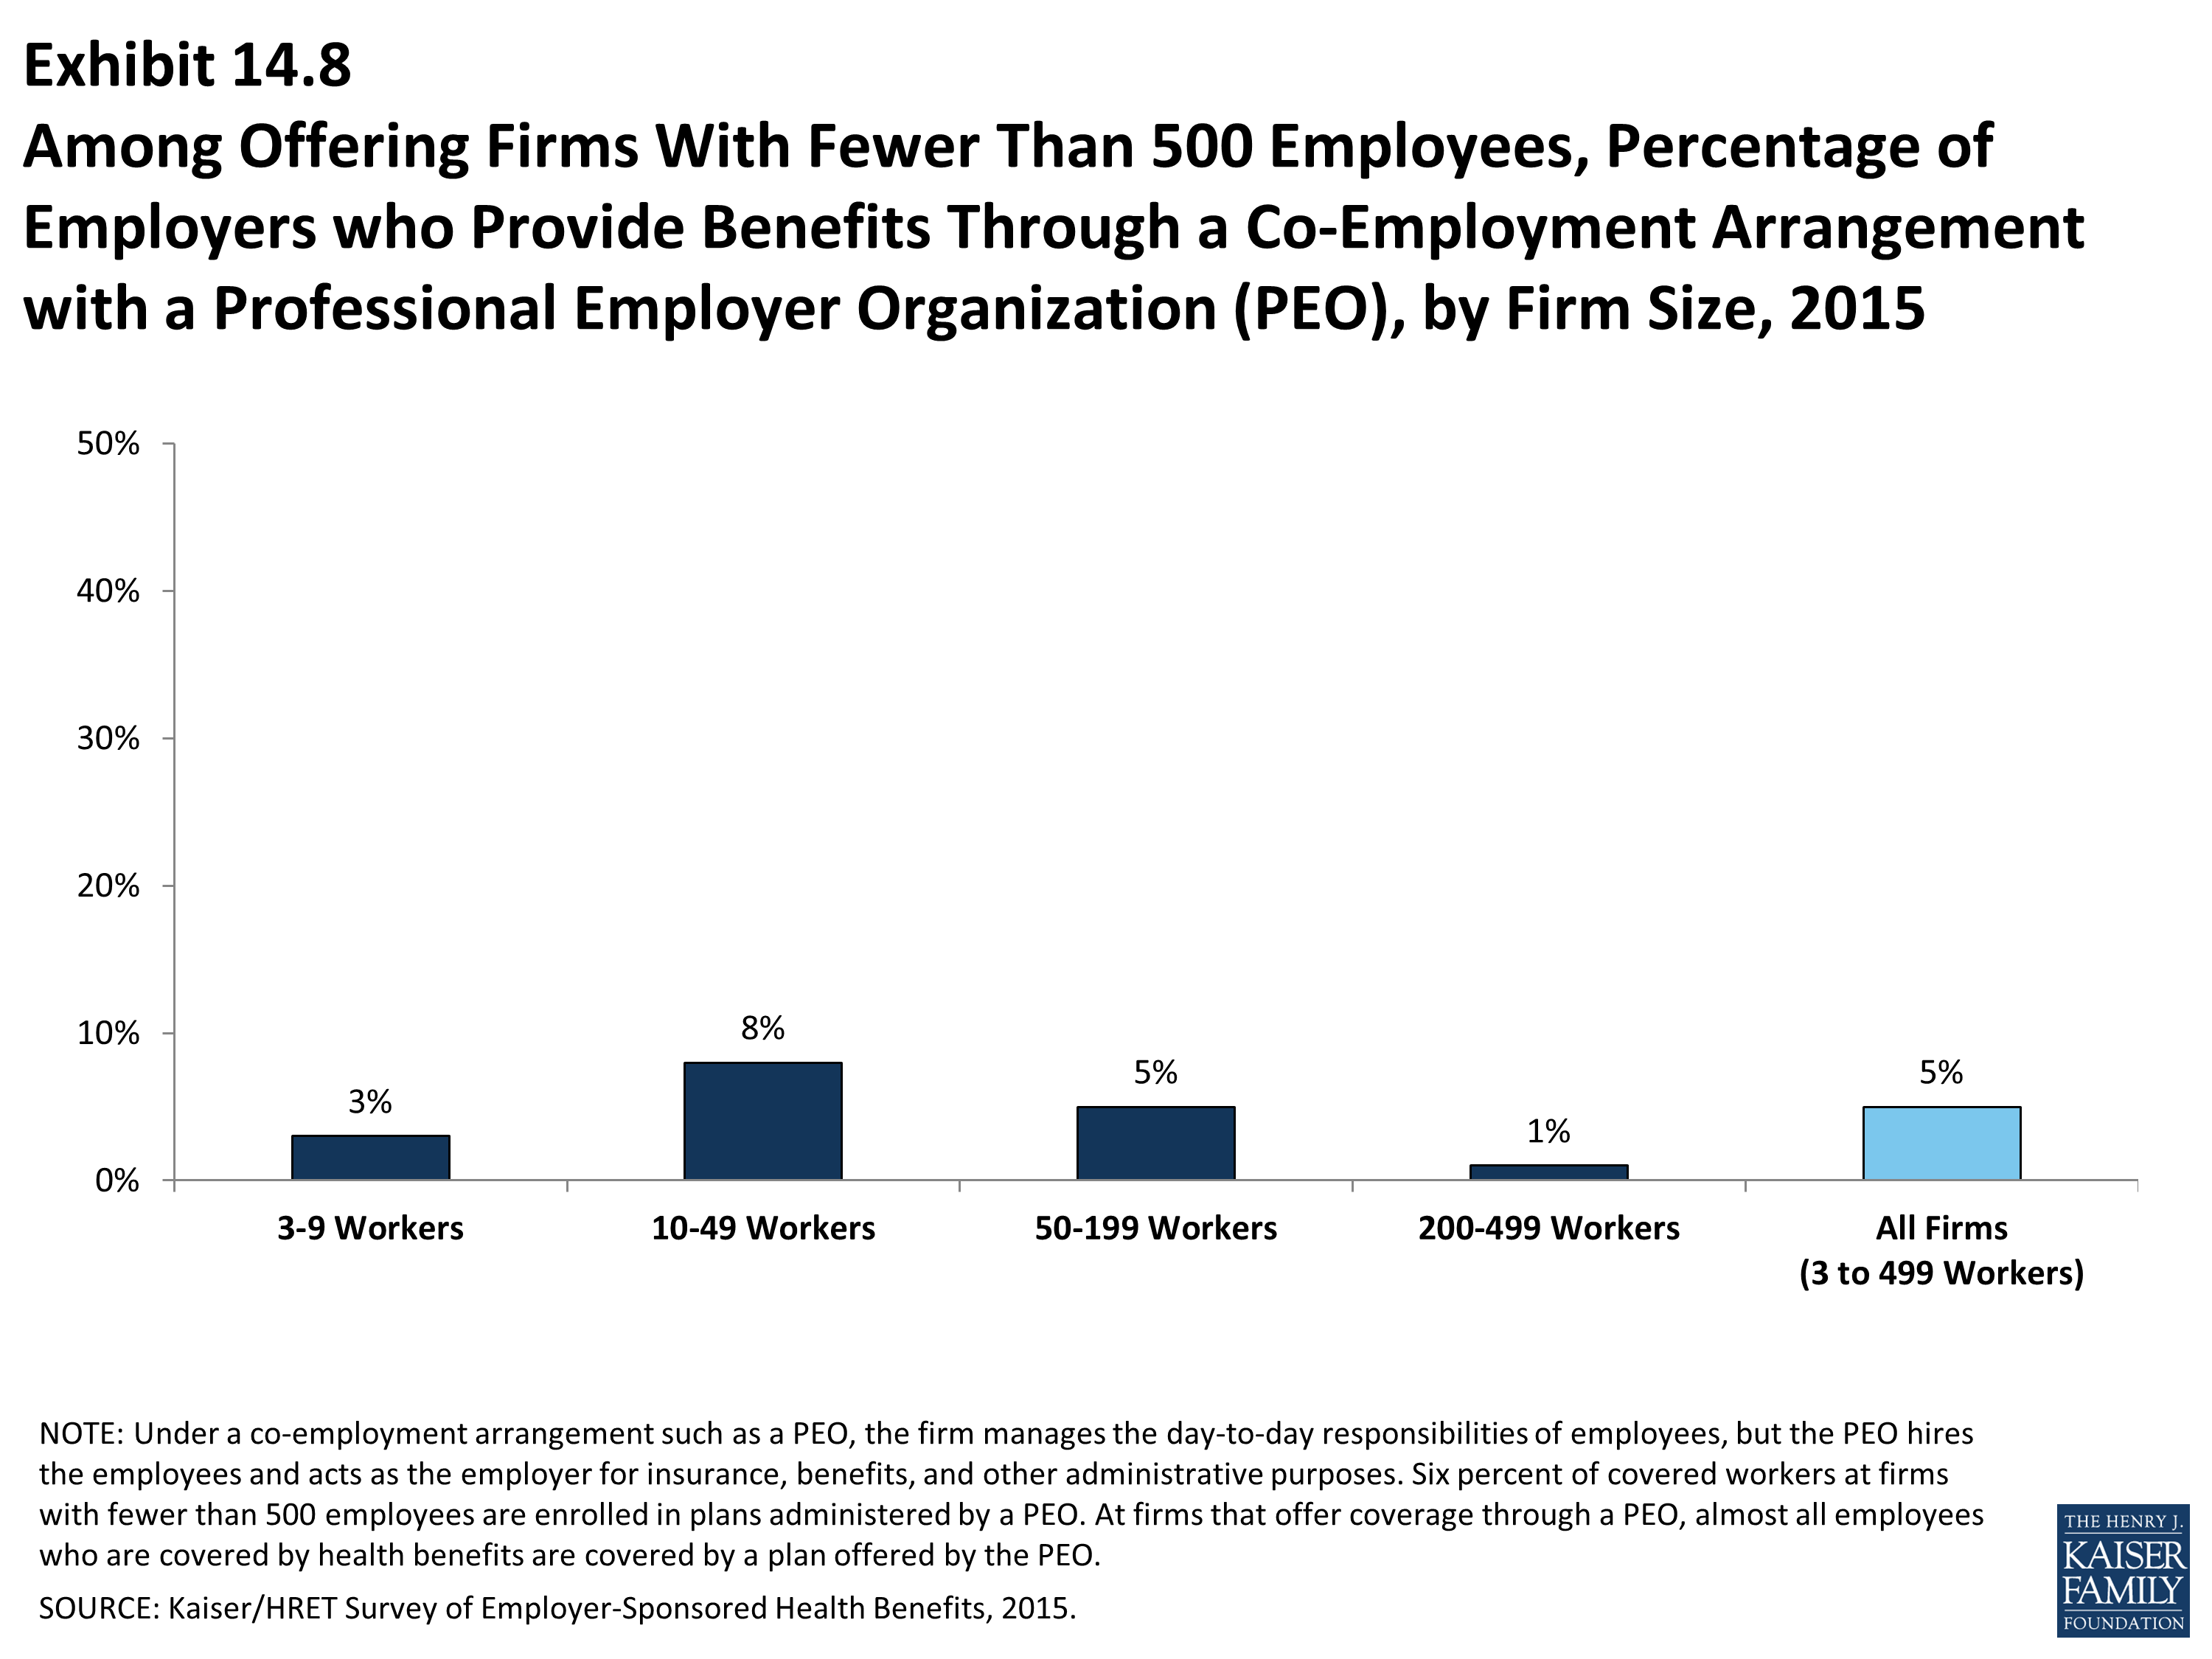
Among Offering Firms With Fewer Than 500 Employees, Percentage of Employers who Provide Benefits Through a Co-Employment Arrangement with a Professional Employer Organization (PEO), by Firm Size, 2015
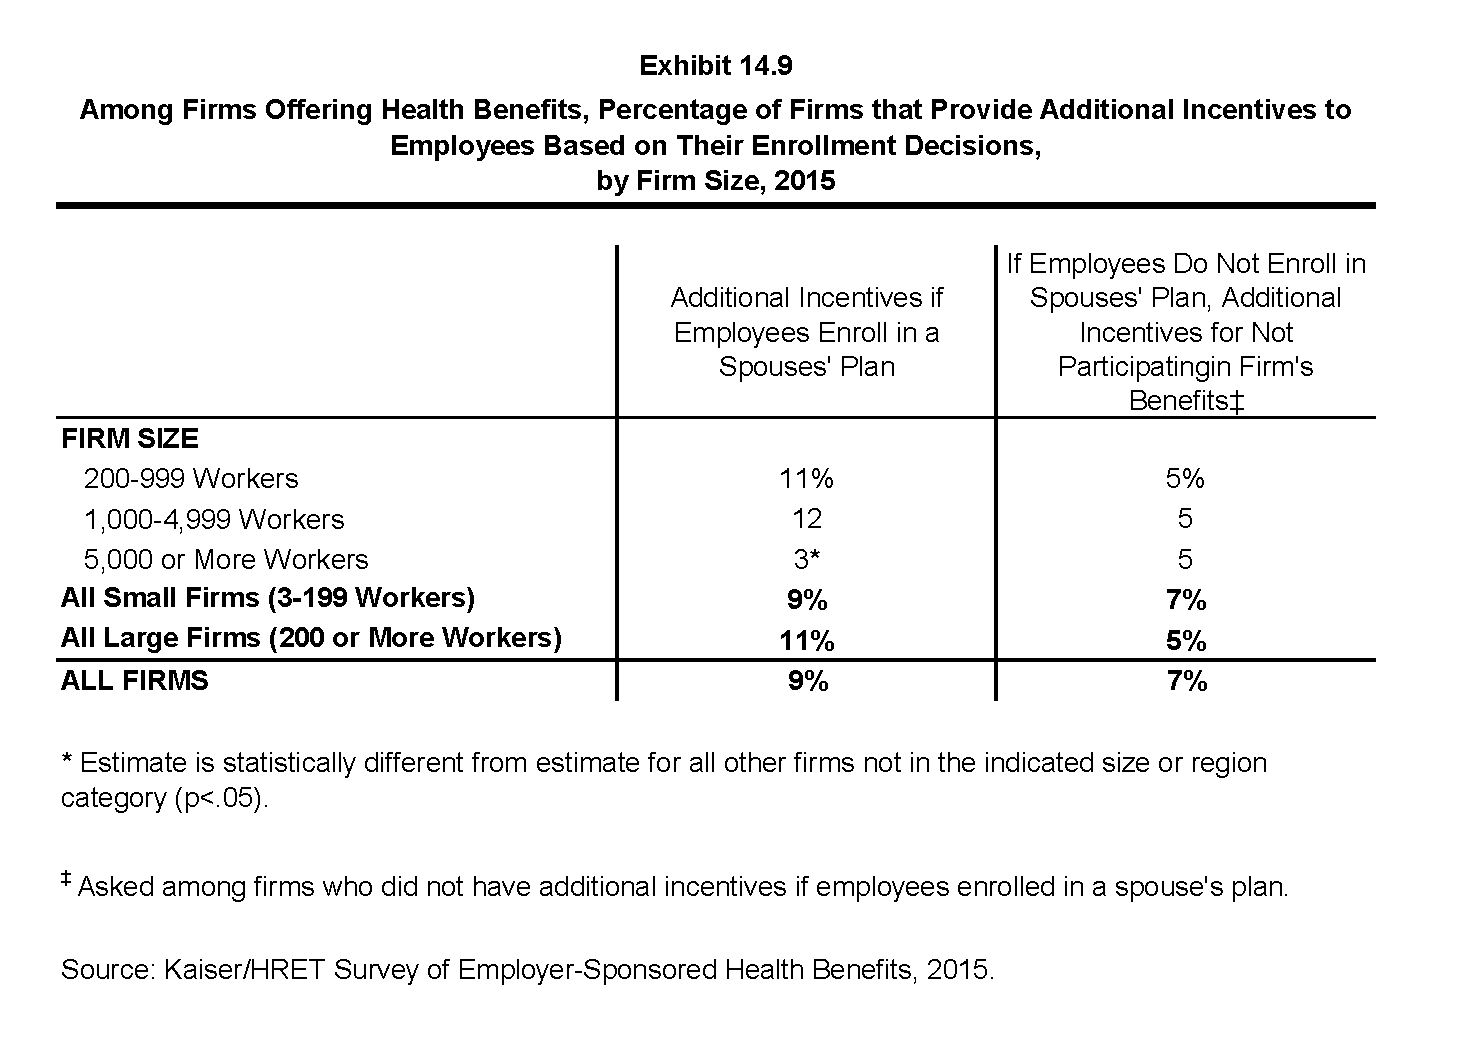
Among Firms Offering Health Benefits, Percentage of Firms that Provide Additional Incentives to Employees Based on Their Enrollment Decisions, by Firm Size, 2015
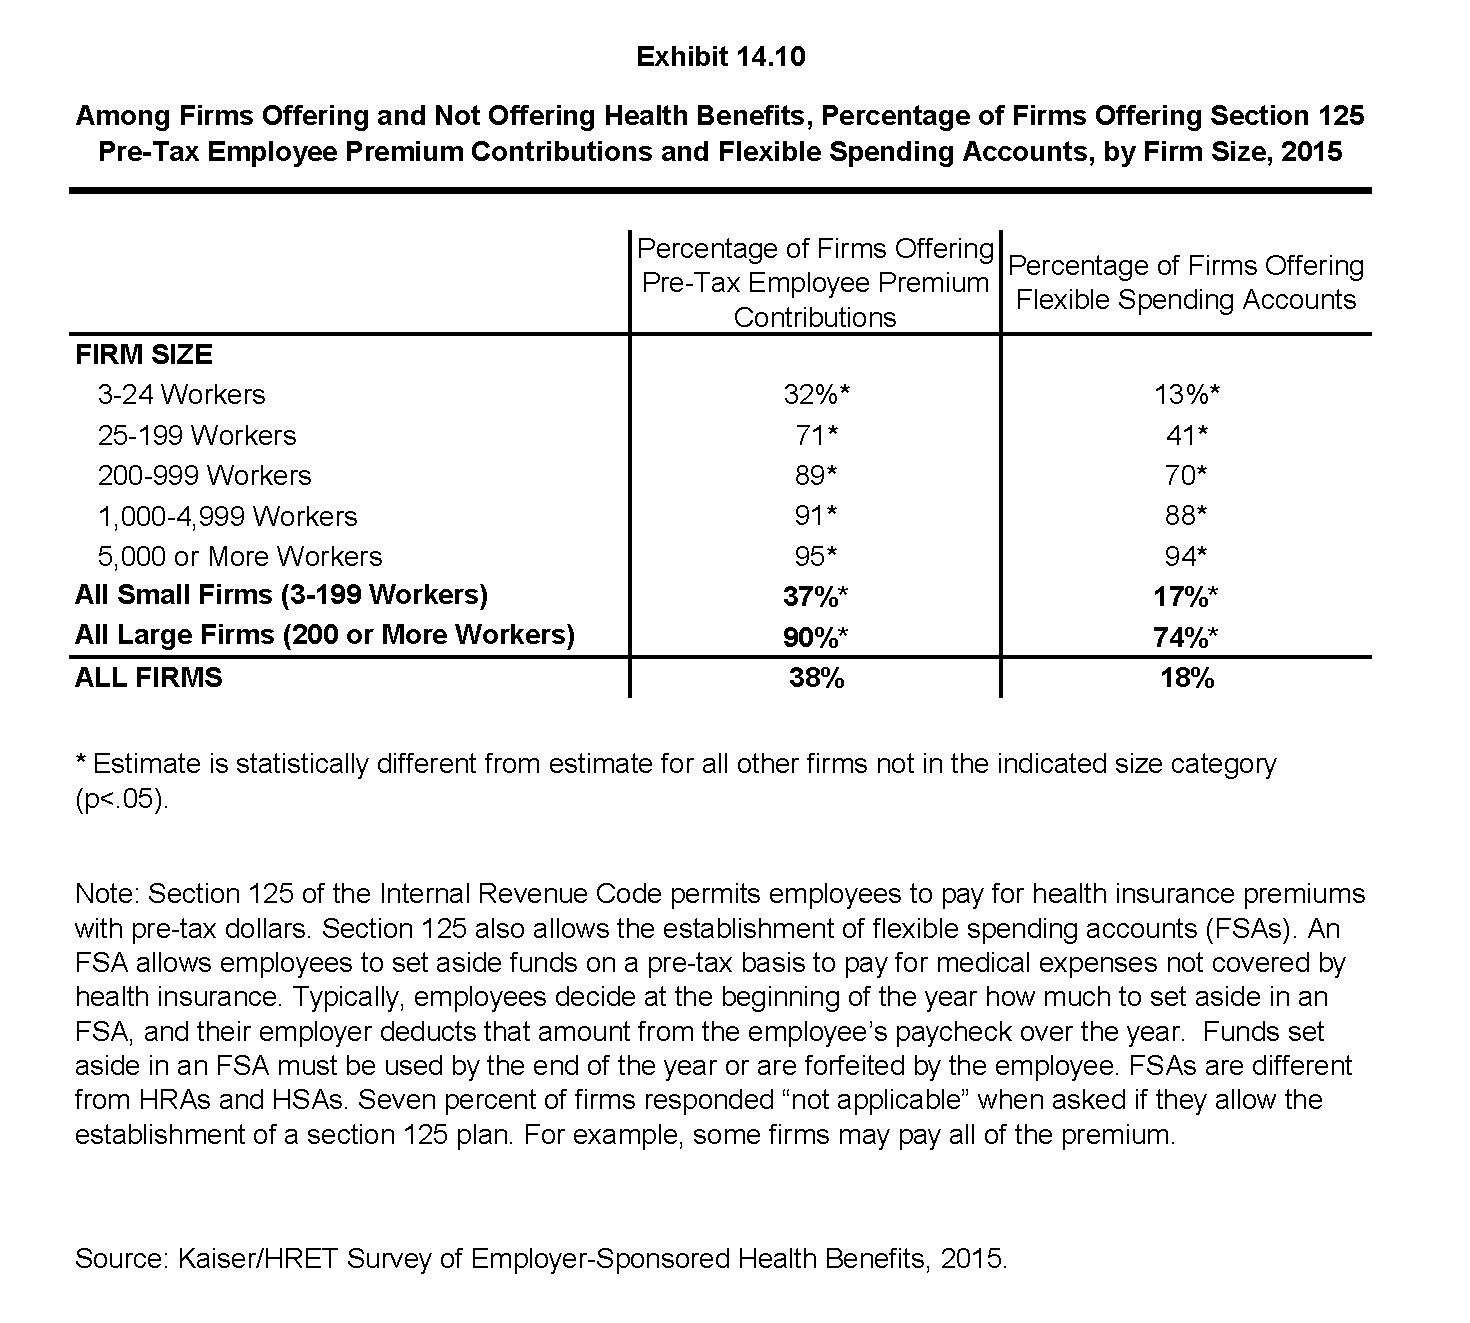
Among Firms Offering and Not Offering Health Benefits, Percentage of Firms Offering Section 125 Pre-Tax Employee Premium Contributions and Flexible Spending Accounts, by Firm Size, 2015
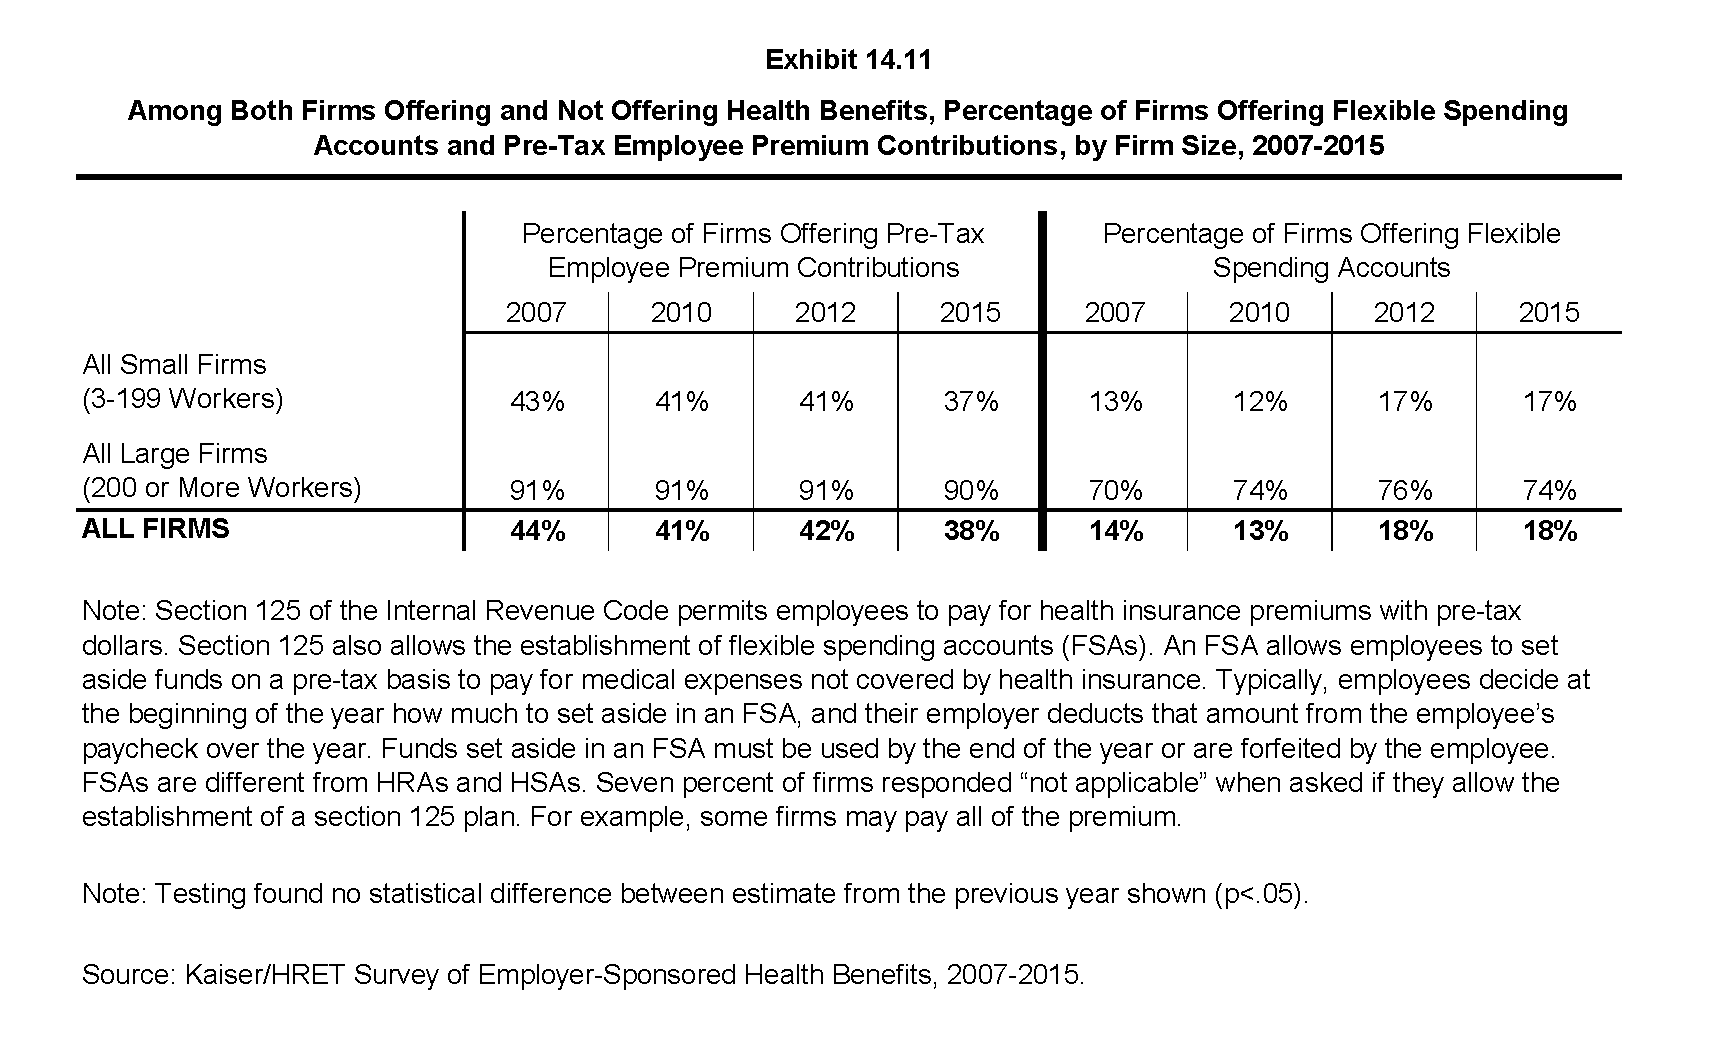
Among Both Firms Offering and Not Offering Health Benefits, Percentage of Firms Offering Flexible Spending Accounts and Pre-Tax Employee Premium Contributions, by Firm Size, 2007-2015
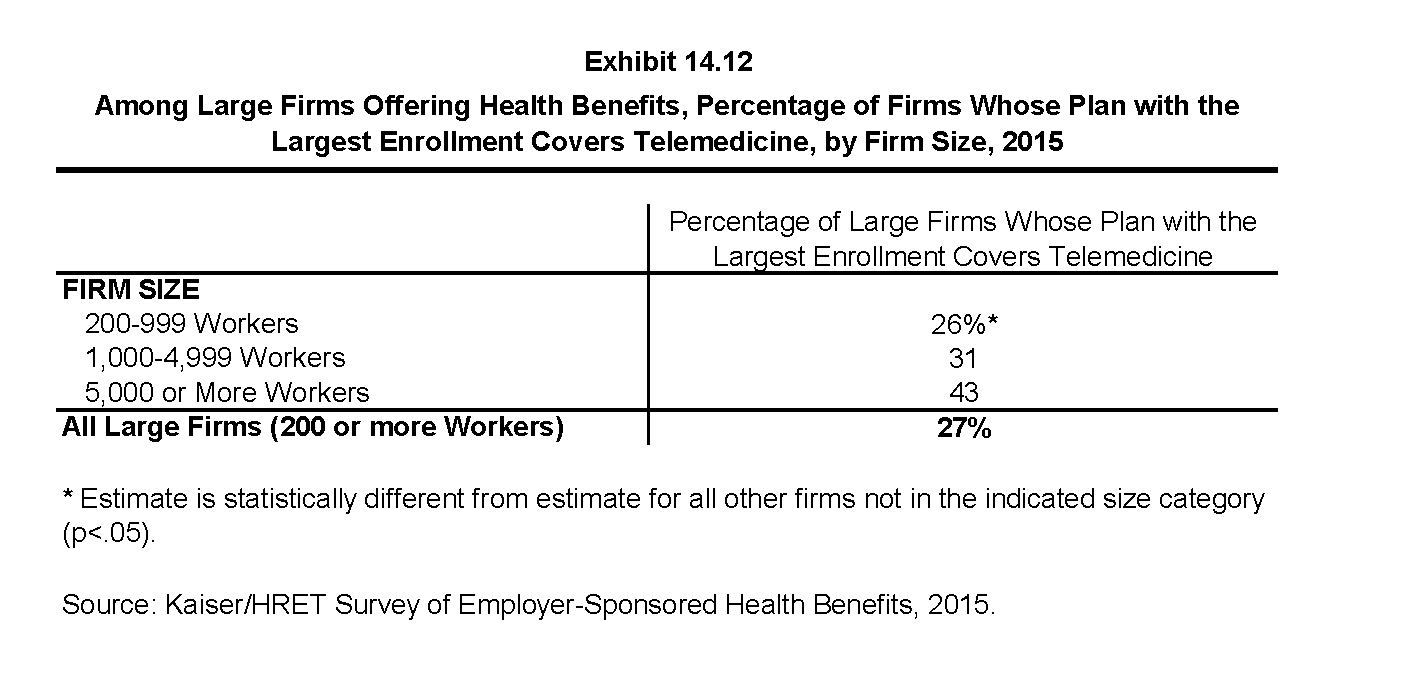
Among Large Firms Offering Health Benefits, Percentage of Firms Whose Plan with the Largest Enrollment Covers Telemedicine, by Firm Size, 2015
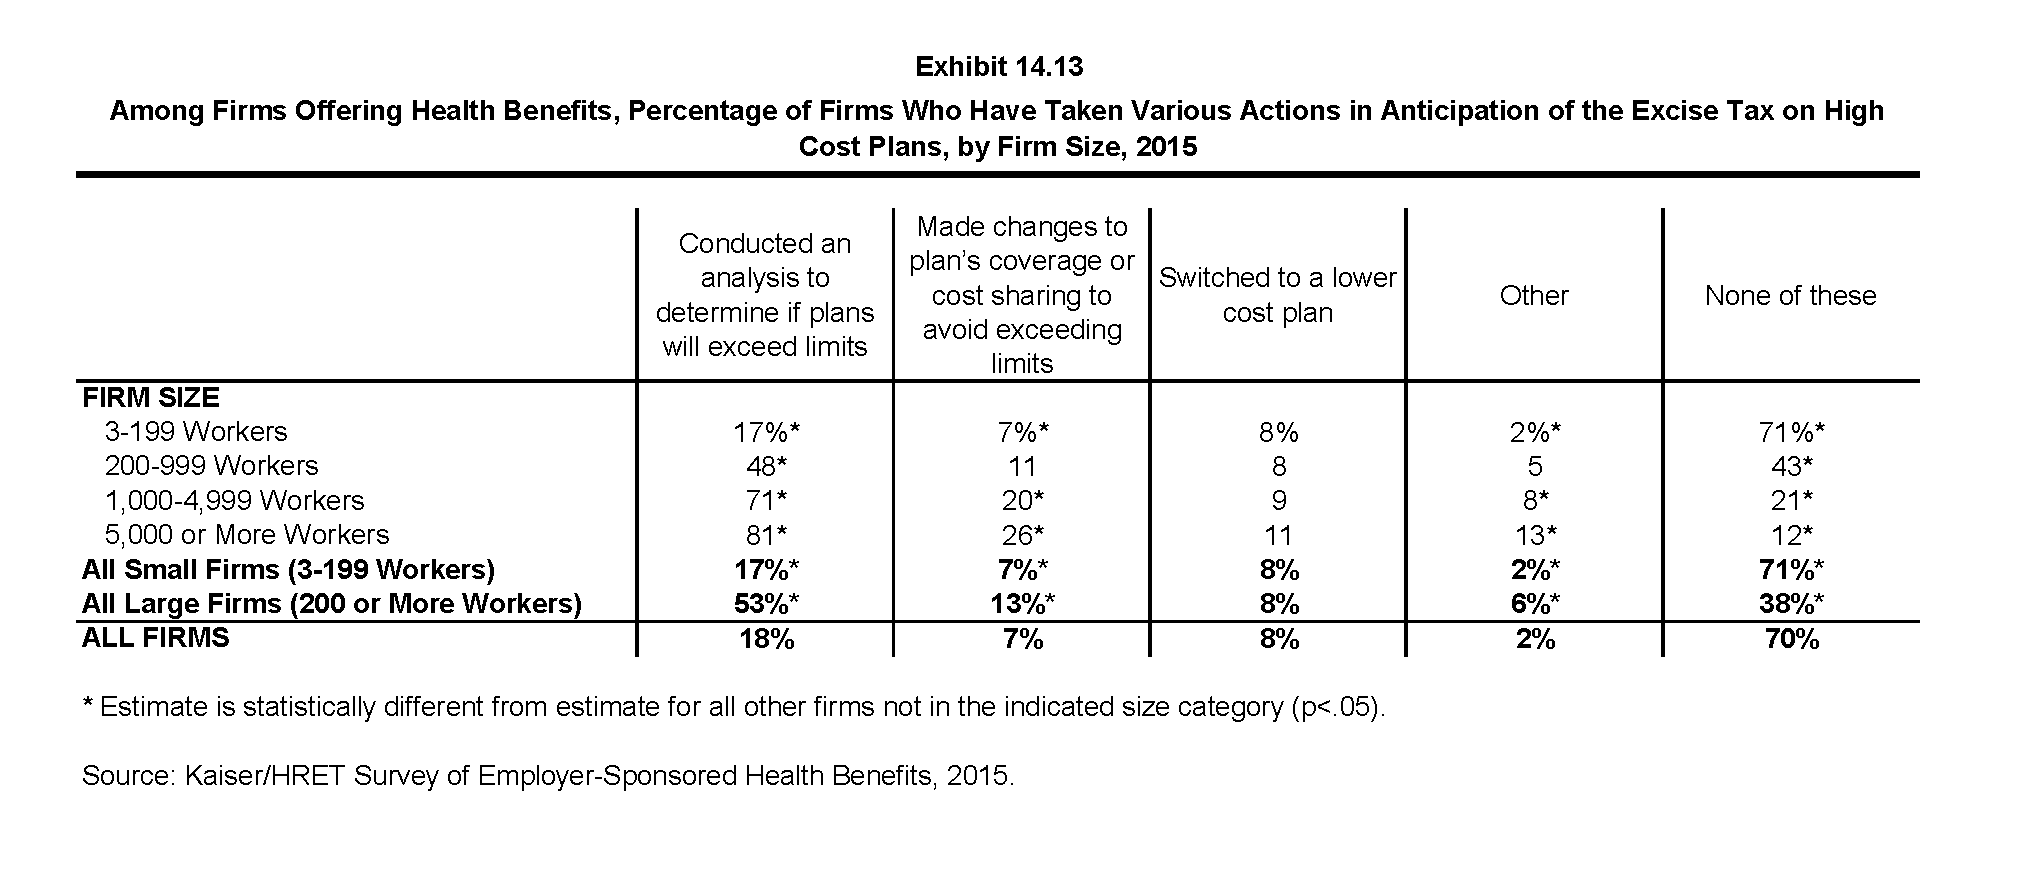
Among Firms Offering Health Benefits, Percentage of Firms Who Have Taken Various Actions in Anticipation of the Excise Tax on High Cost Plans, by Firm Size, 2015
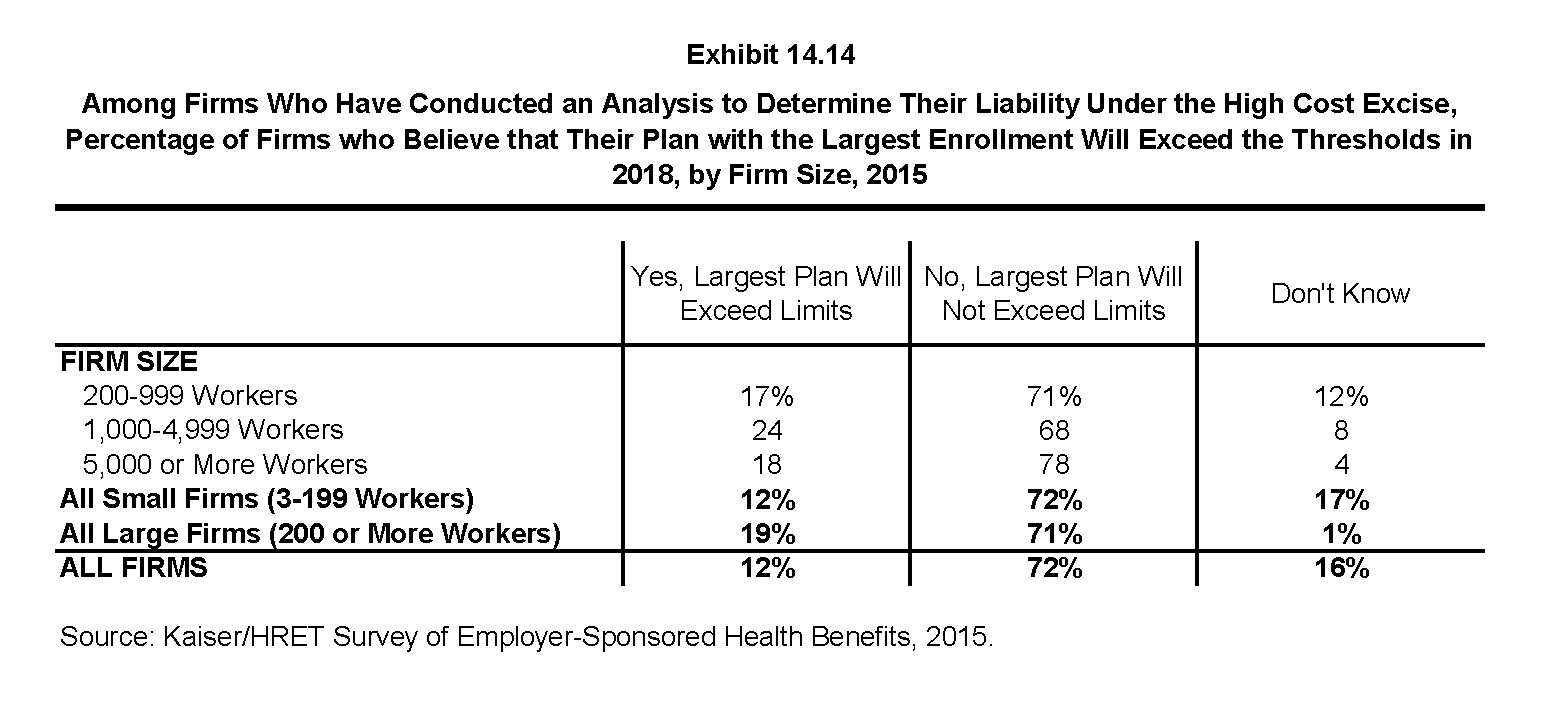
Among Firms Who Have Conducted an Analysis to Determine Their Liability Under the High Cost Excise, Percentage of Firms who Believe that Their Plan with the Largest Enrollment Will Exceed the Thresholds in 2018, by Firm Size, 2015
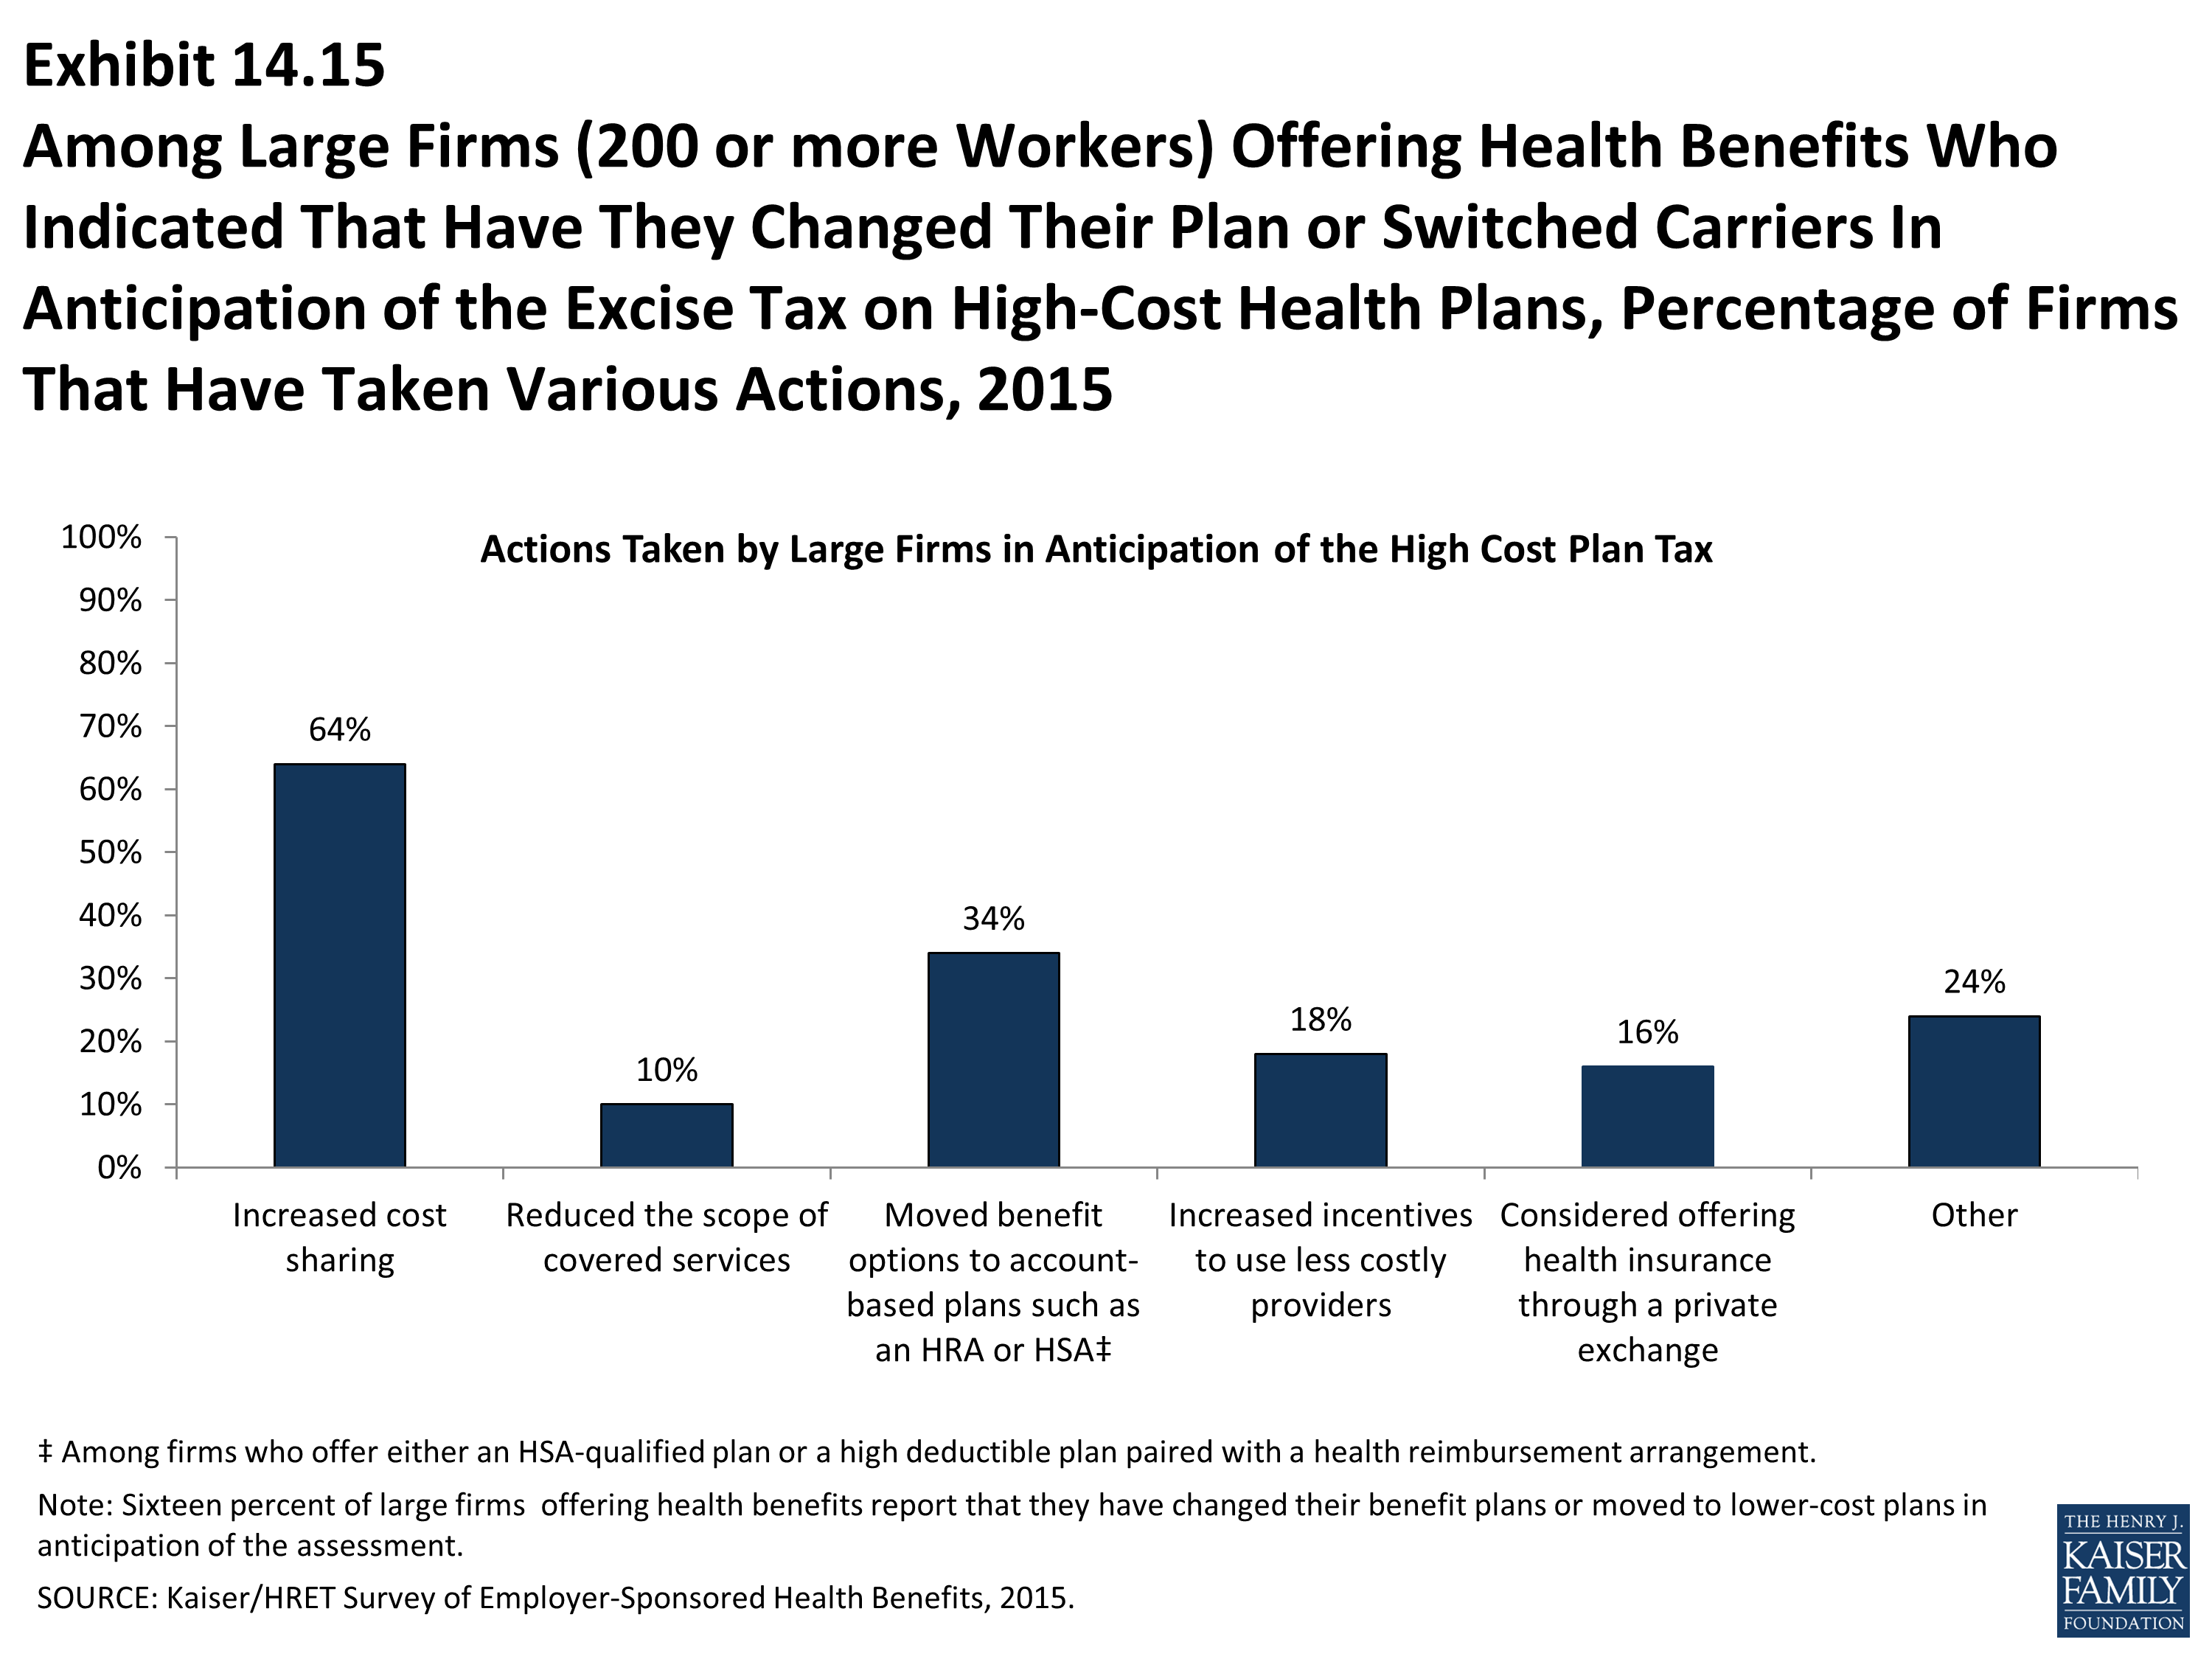
Among Large Firms (200 or more Workers) Offering Health Benefits Who Indicated That Have They Changed Their Plan or Switched Carriers In Anticipation of the Excise Tax on High-Cost Health Plans, Percentage of Firms That Have Taken Various Actions, 2015
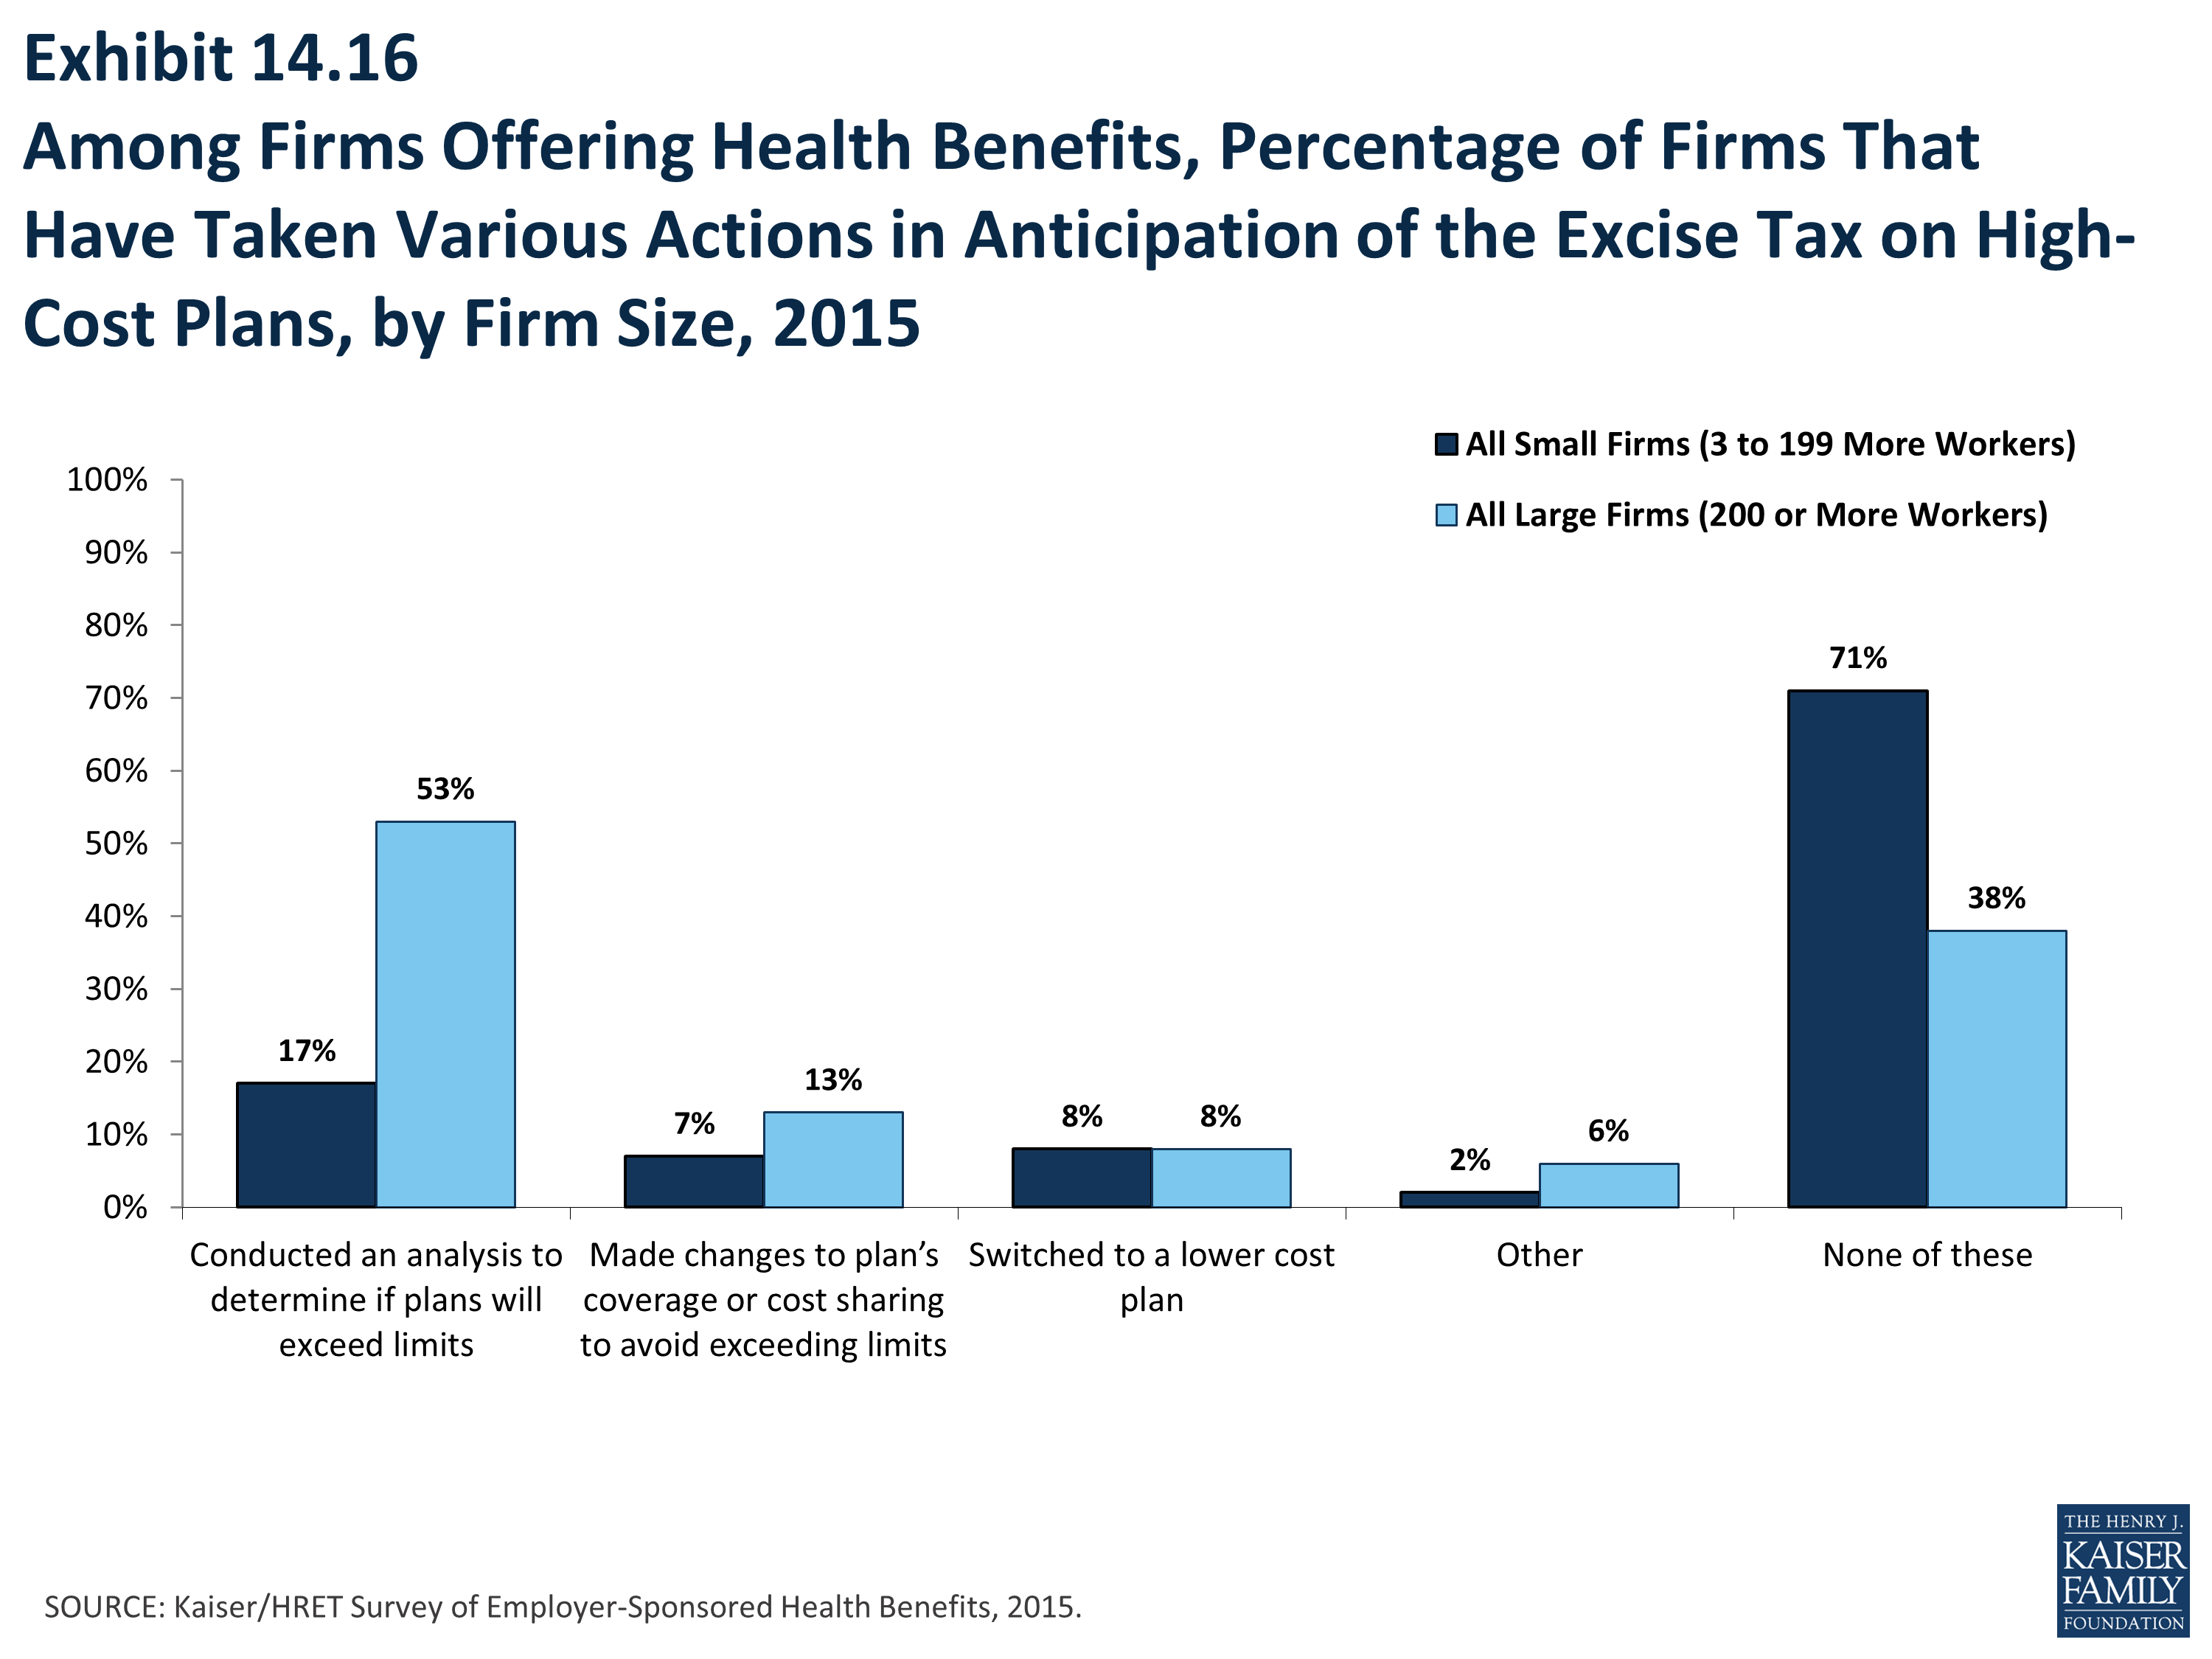
Among Firms Offering Health Benefits, Percentage of Firms That Have Taken Various Actions in Anticipation of the Excise Tax on High-Cost Plans, by Firm Size, 2015
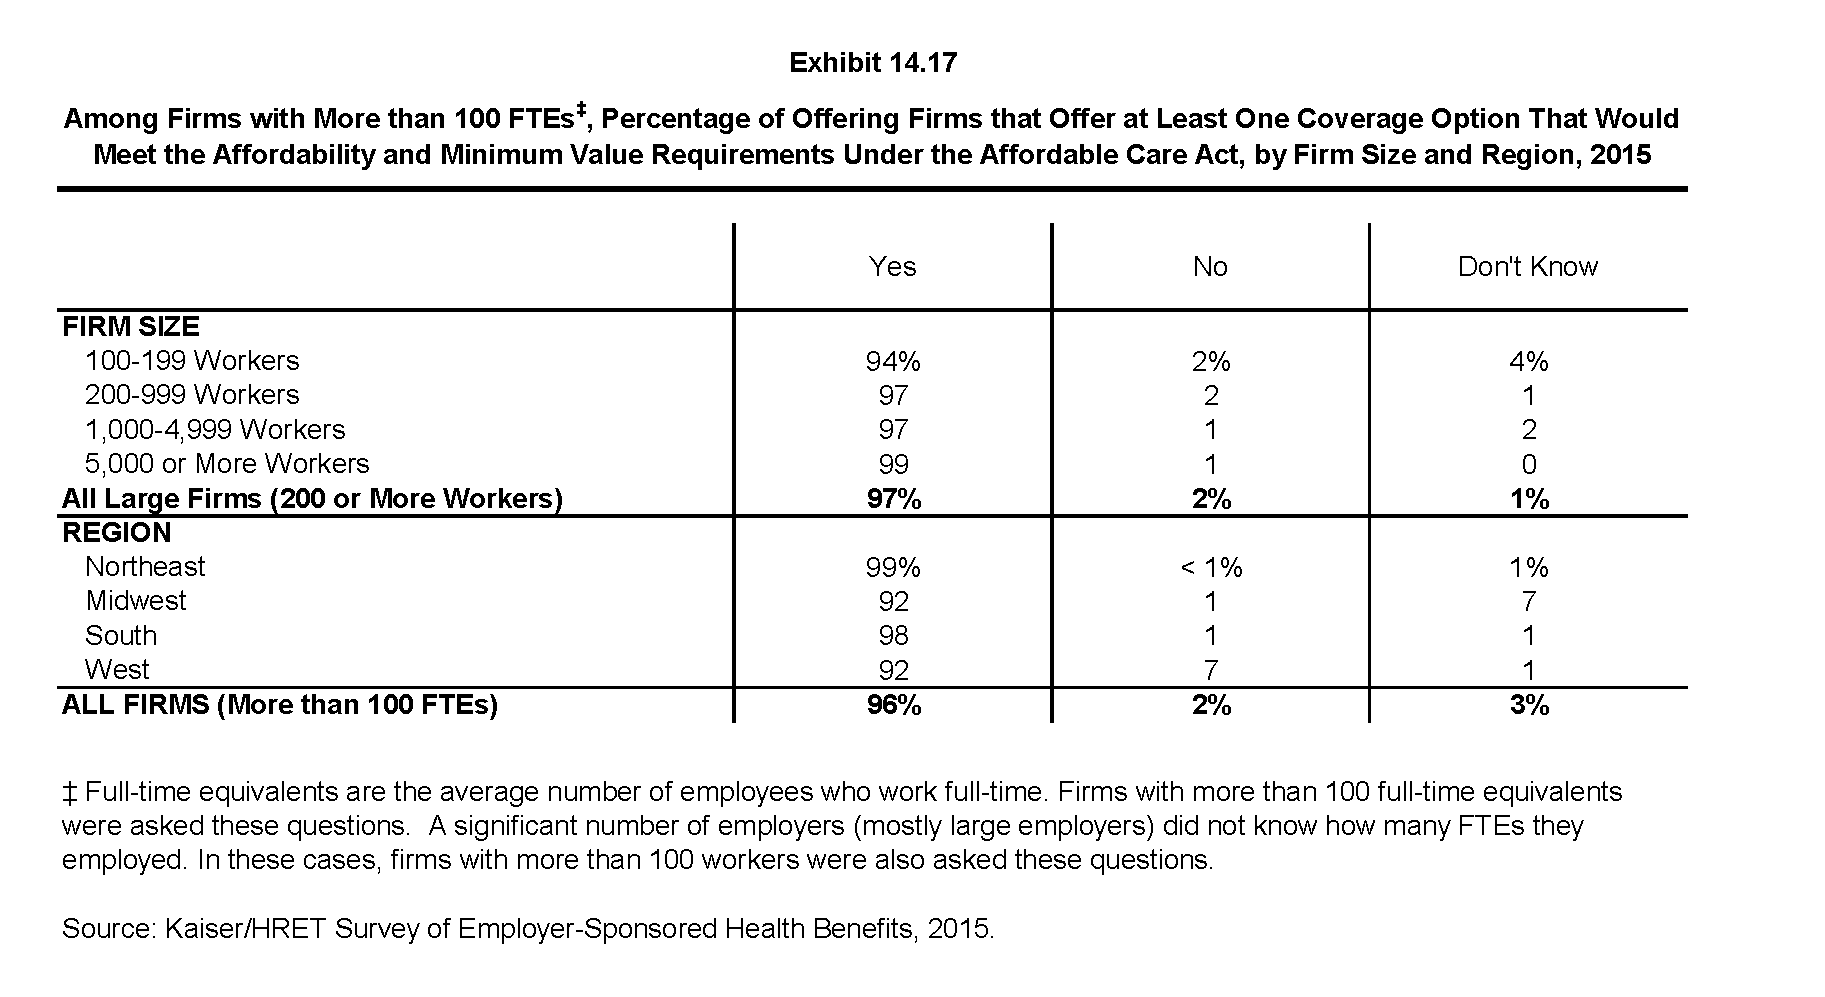
Among Firms with More than 100 FTEs, Percentage of Offering Firms that Offer at Least One Coverage Option That Would Meet the Affordability and Minimum Value Requirements Under the Affordable Care Act, by Firm Size and Region, 2015
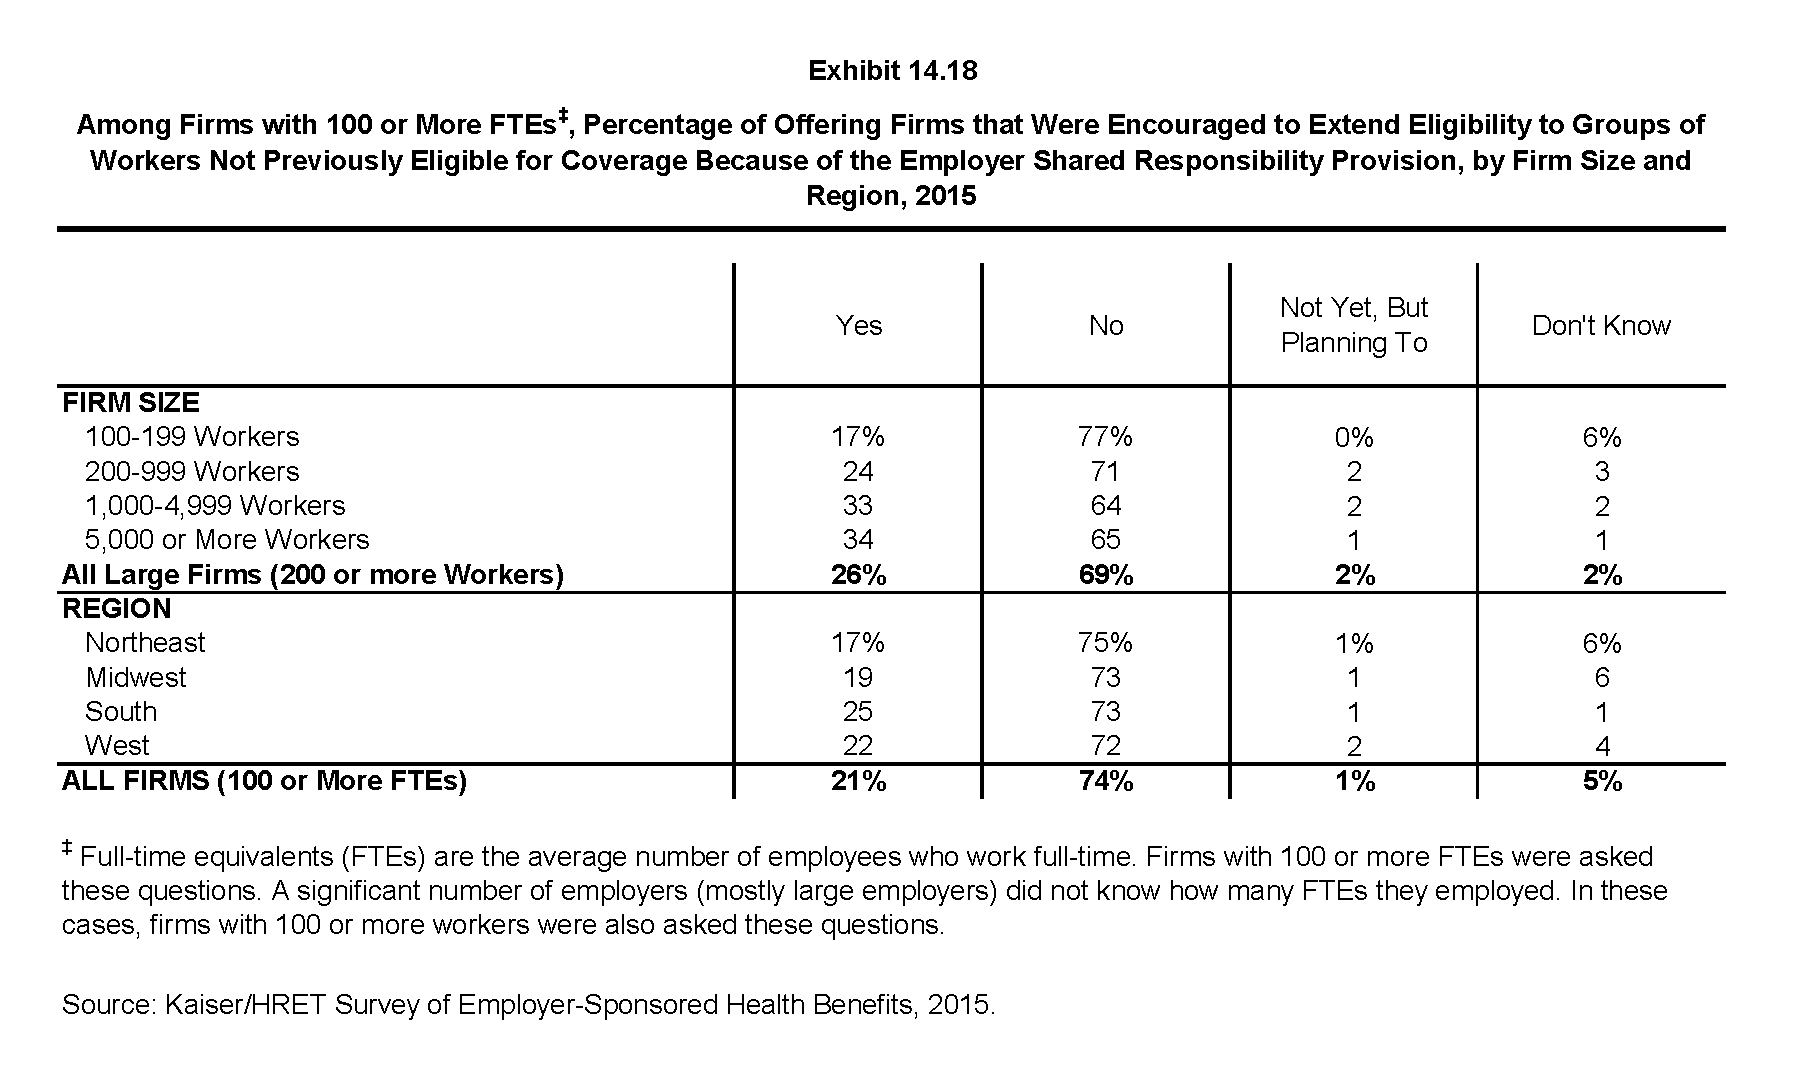
Among Firms with 100 or More FTEs, Percentage of Offering Firms that Were Encouraged to Extend Eligibility to Groups of Workers Not Previously Eligible for Coverage Because of the Employer Shared Responsibility Provision, by Firm Size and Region, 2015
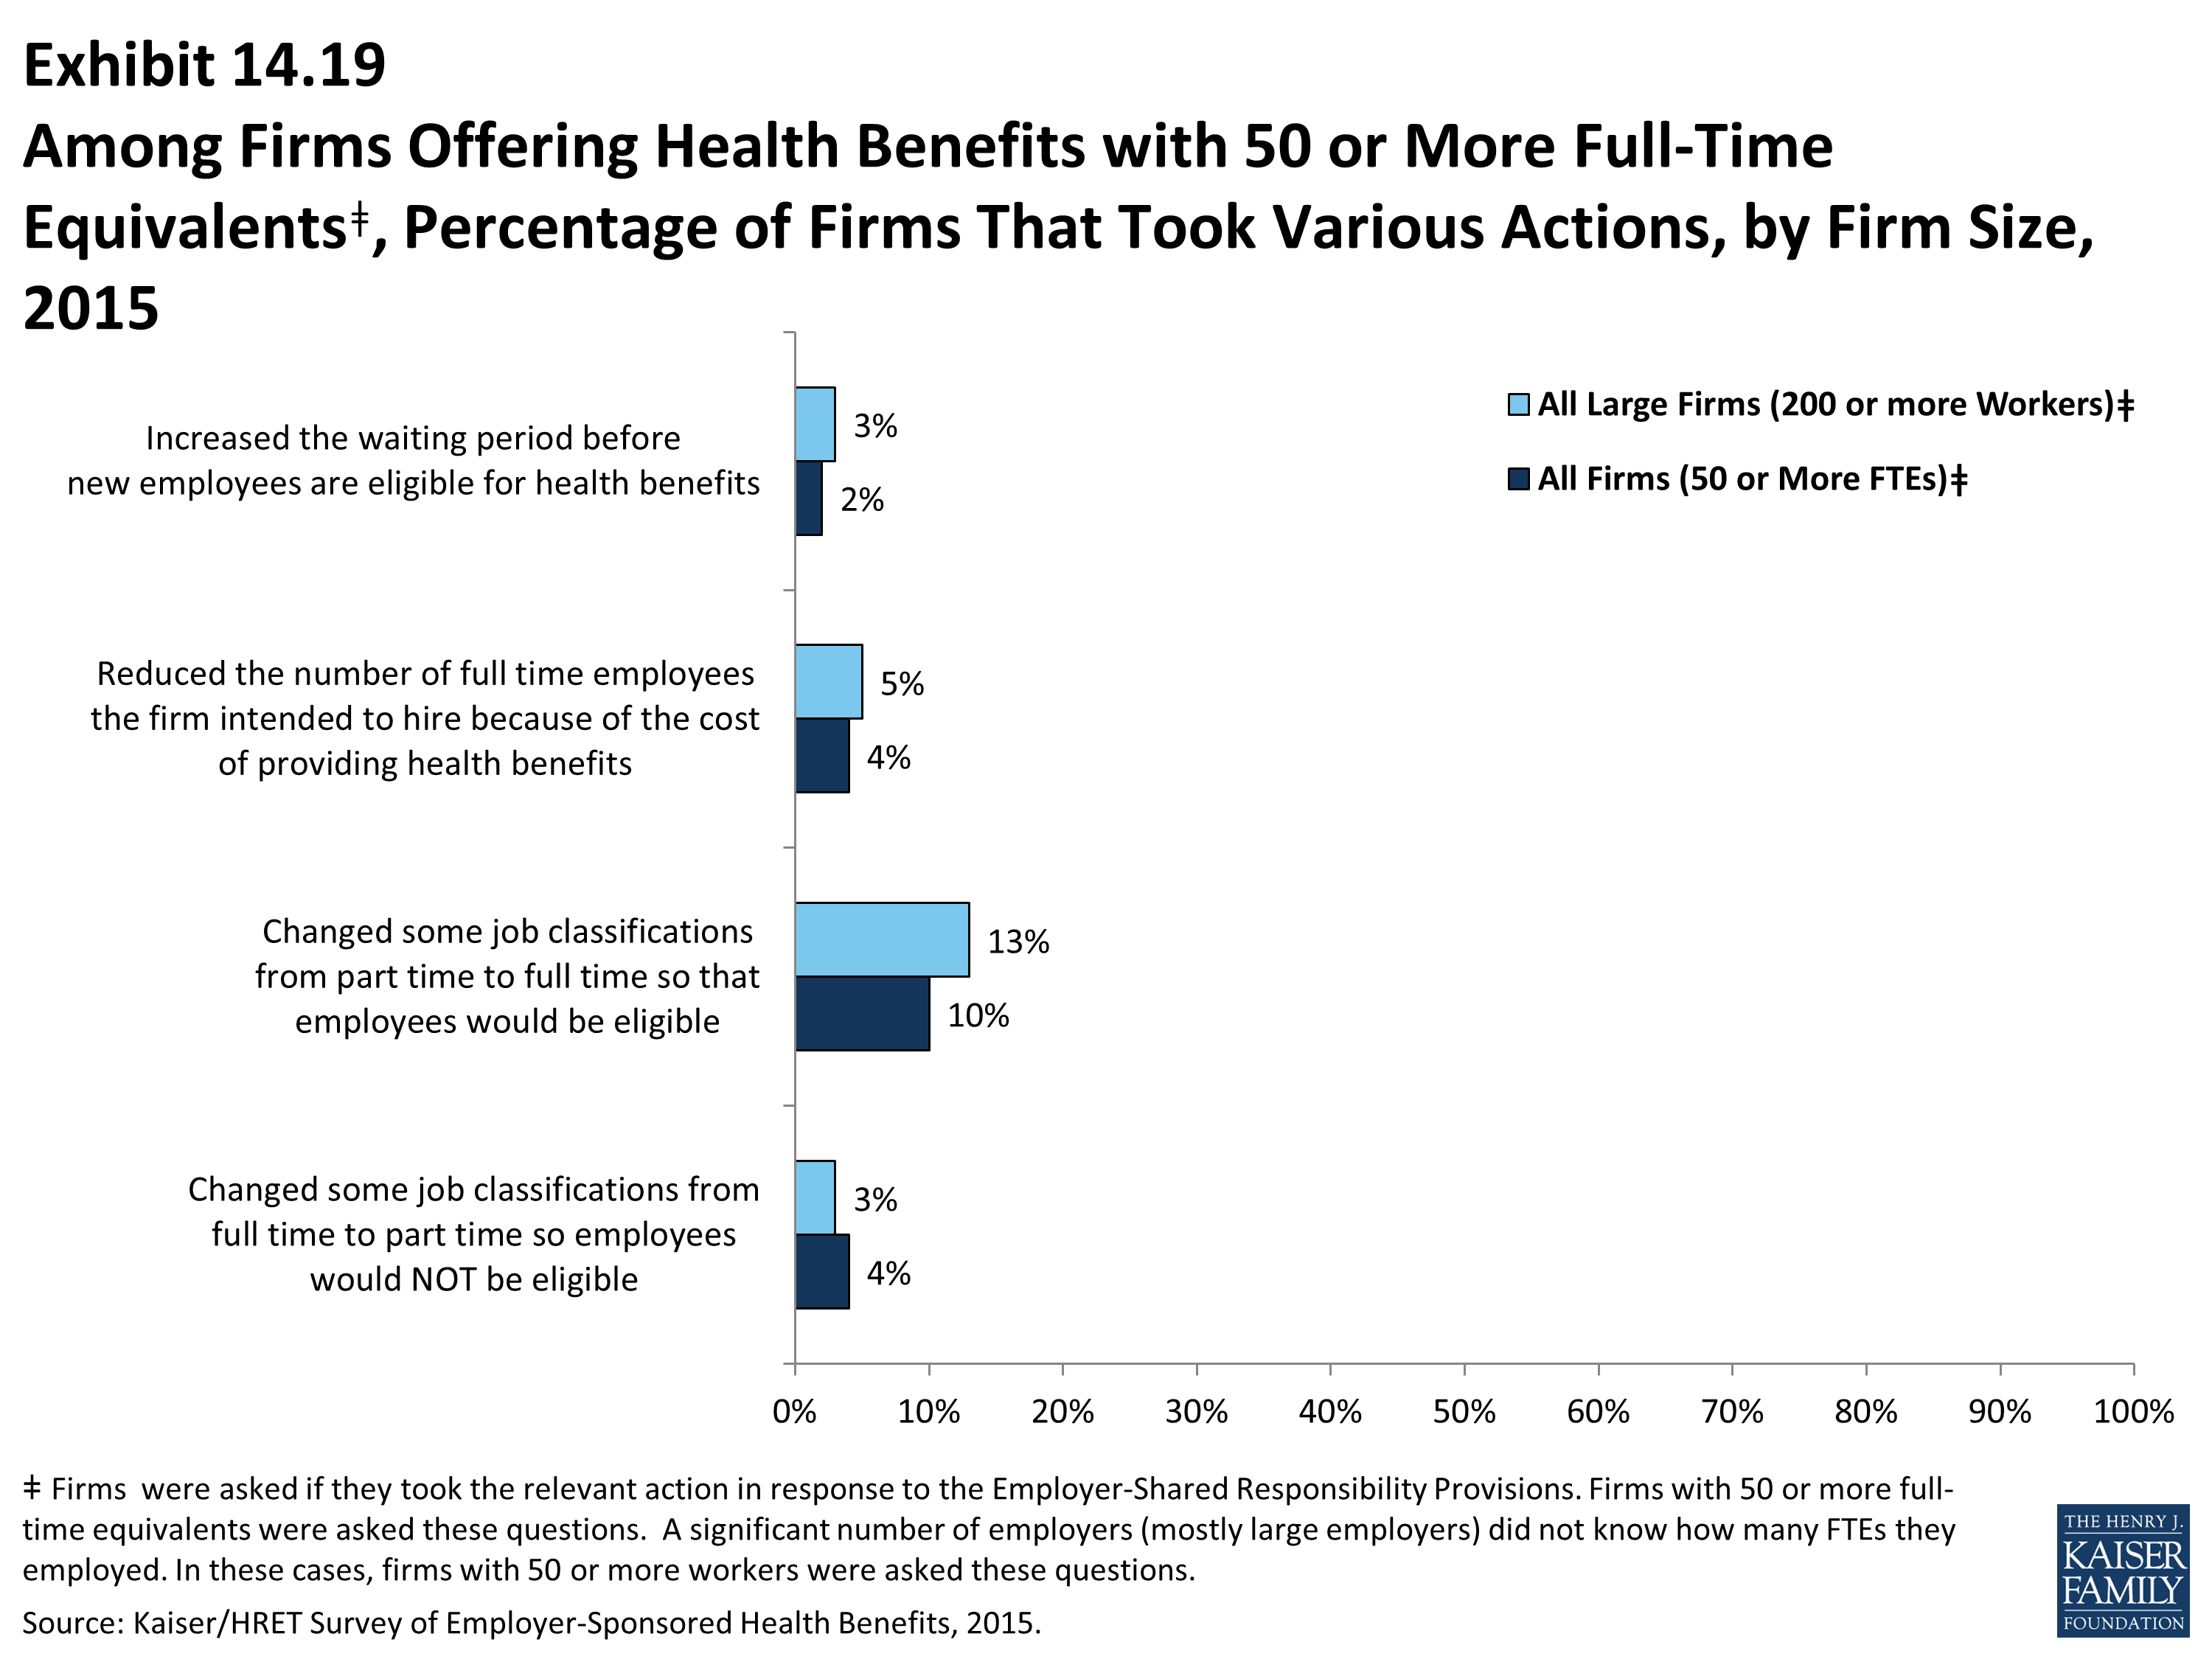
Among Firms Offering Health Benefits with 50 or More Full-Time Equivalentsǂ, Percentage of Firms That Took Various Actions, by Firm Size, 2015
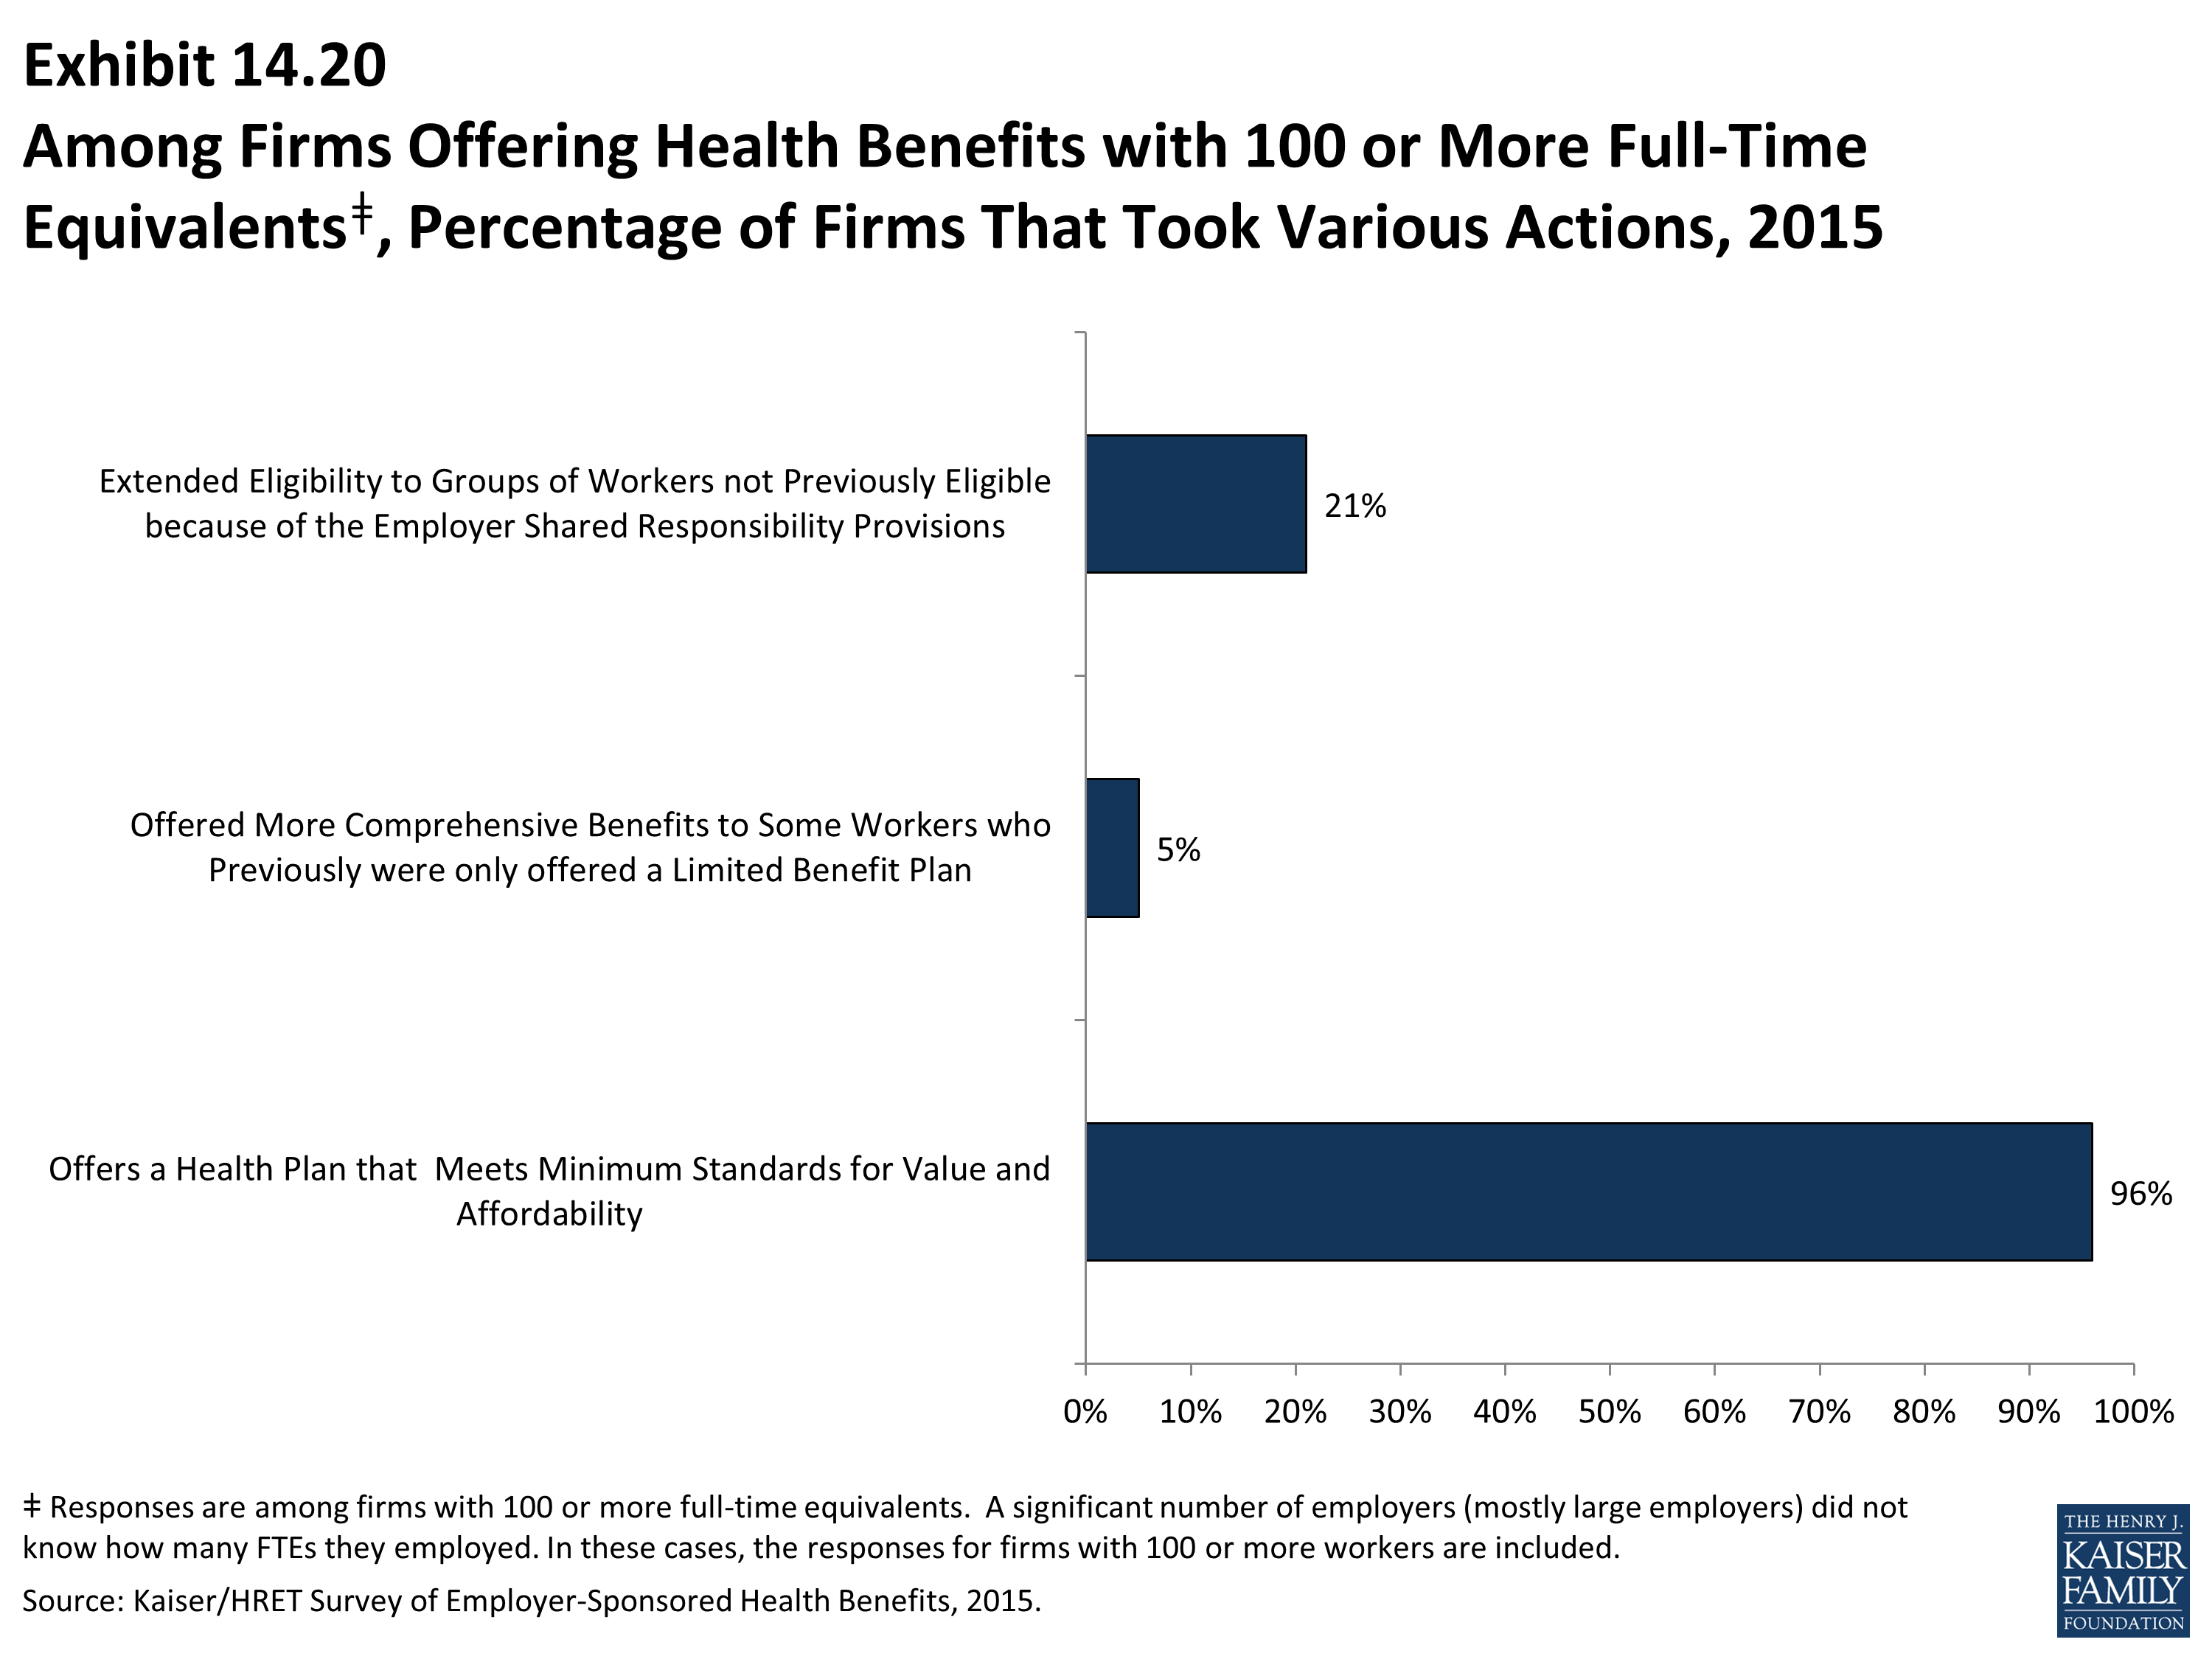
Among Firms Offering Health Benefits with 100 or More Full-Time Equivalentsǂ, Percentage of Firms That Took Various Actions, 2015
Methodology
Survey Design and Methods
The Kaiser Family Foundation and the Health Research & Educational Trust (Kaiser/HRET) conduct this annual survey of employer-sponsored health benefits. HRET, a nonprofit research organization, is an affiliate of the American Hospital Association. The Kaiser Family Foundation designs, analyzes, and conducts this survey in partnership with HRET, and also funds the study. Kaiser contracts with researchers at NORC at the University of Chicago (NORC) to work with the Kaiser and HRET researchers in conducting the study. Kaiser/HRET retained National Research, LLC (NR), a Washington, D.C.-based survey research firm, to conduct telephone interviews with human resource and benefits managers using the Kaiser/HRET survey instrument. From January to June 2015, NR completed full interviews with 1,997 firms.
Survey Topics
As in past years, Kaiser/HRET asked each participating firm as many as 400 questions about its largest health maintenance organization (HMO), preferred provider organization (PPO), point-of-service (POS) plan, and high-deductible health plan with a savings option (HDHP/SO).1 We treat exclusive provider organizations (EPOs) and HMOs as one plan type and report the information under the banner of “HMO;” if an employer sponsors both an HMO and an EPO, they are asked about the attributes of the plan with the larger enrollment. Similarly, starting in 2013, plan information for conventional (or indemnity) plans was collected within the PPO battery. Less than 1% of firms that completed the PPO section had more enrollment in a conventional plan than in a PPO plan.
As in past years, the survey includes questions on the cost of health insurance, health benefit offer rates, coverage, eligibility, enrollment patterns, premiums,2 employee cost sharing, prescription drug benefits, retiree health benefits, wellness benefits, and employers’ opinions.
Response Rate
After determining the required sample from U.S. Census Bureau data, Kaiser/HRET drew its sample from a Survey Sampling Incorporated list (based on an original Dun and Bradstreet list) of the nation’s private employers and from the Census Bureau’s Census of Governments list of public employers with three or more workers. To increase precision, Kaiser/HRET stratified the sample by ten industry categories and six size categories. Kaiser/HRET attempted to repeat interviews with prior years’ survey respondents (with at least ten employees) who participated in either the 2013 or the 2014 survey, or both. Firms with 3-9 employees are not included in the panel to minimize the impact of panel effects on the offer rate statistic. Since a relatively small number of the 1.9 million firms in this size category are included in the sample, each of these firms tends to have a larger proportion of the employer weight. As a result, 1,539 of the 1,997 firms that completed the full survey also participated in either the 2013 or 2014 surveys, or both.3 The overall response rate is 42%.4 To increase response rates, firms with 3–9 employees were offered an incentive of $75 in cash or as a donation to a charity of their choice to complete the full survey.
The vast majority of questions are asked only of firms that offer health benefits. A total of 1,771 of the 1,997 responding firms indicated that they offered health benefits. The response rate for firms that offer health benefits is also 41%.
We asked one question of all firms in the study with which we made phone contact but where the firm declined to participate. The question was, “Does your company offer a health insurance program as a benefit to any of your employees?” A total of 3,191 firms responded to this question (including 1,997 who responded to the full survey and 1,194 who responded to this one question). These responses are included in our estimates of the percentage of firms offering health benefits.5 The response rate for this question is 67%. In 2012, the calculation of the response rates was adjusted to be slightly more conservative than previous years.
Firm Size Categories and Key Definitions
Throughout the report, exhibits categorize data by size of firm, region, and industry. Firm size definitions are as follows: small firms: 3 to 199 workers; and large firms: 200 or more workers. Exhibit M.1 shows selected characteristics of the survey sample. A firm’s primary industry classification is determined from Survey Sampling International’s (SSI) designation on the sampling frame. A firm’s ownership category and other firm characteristics used in exhibits such as 3.2 and 6.21 are based on respondents’ answers. While there is considerable overlap in firms in the “State/Local Government” industry category and those in the “public” ownership category, they are not identical. For example, public school districts are included in the service industry even though they are publicly owned.
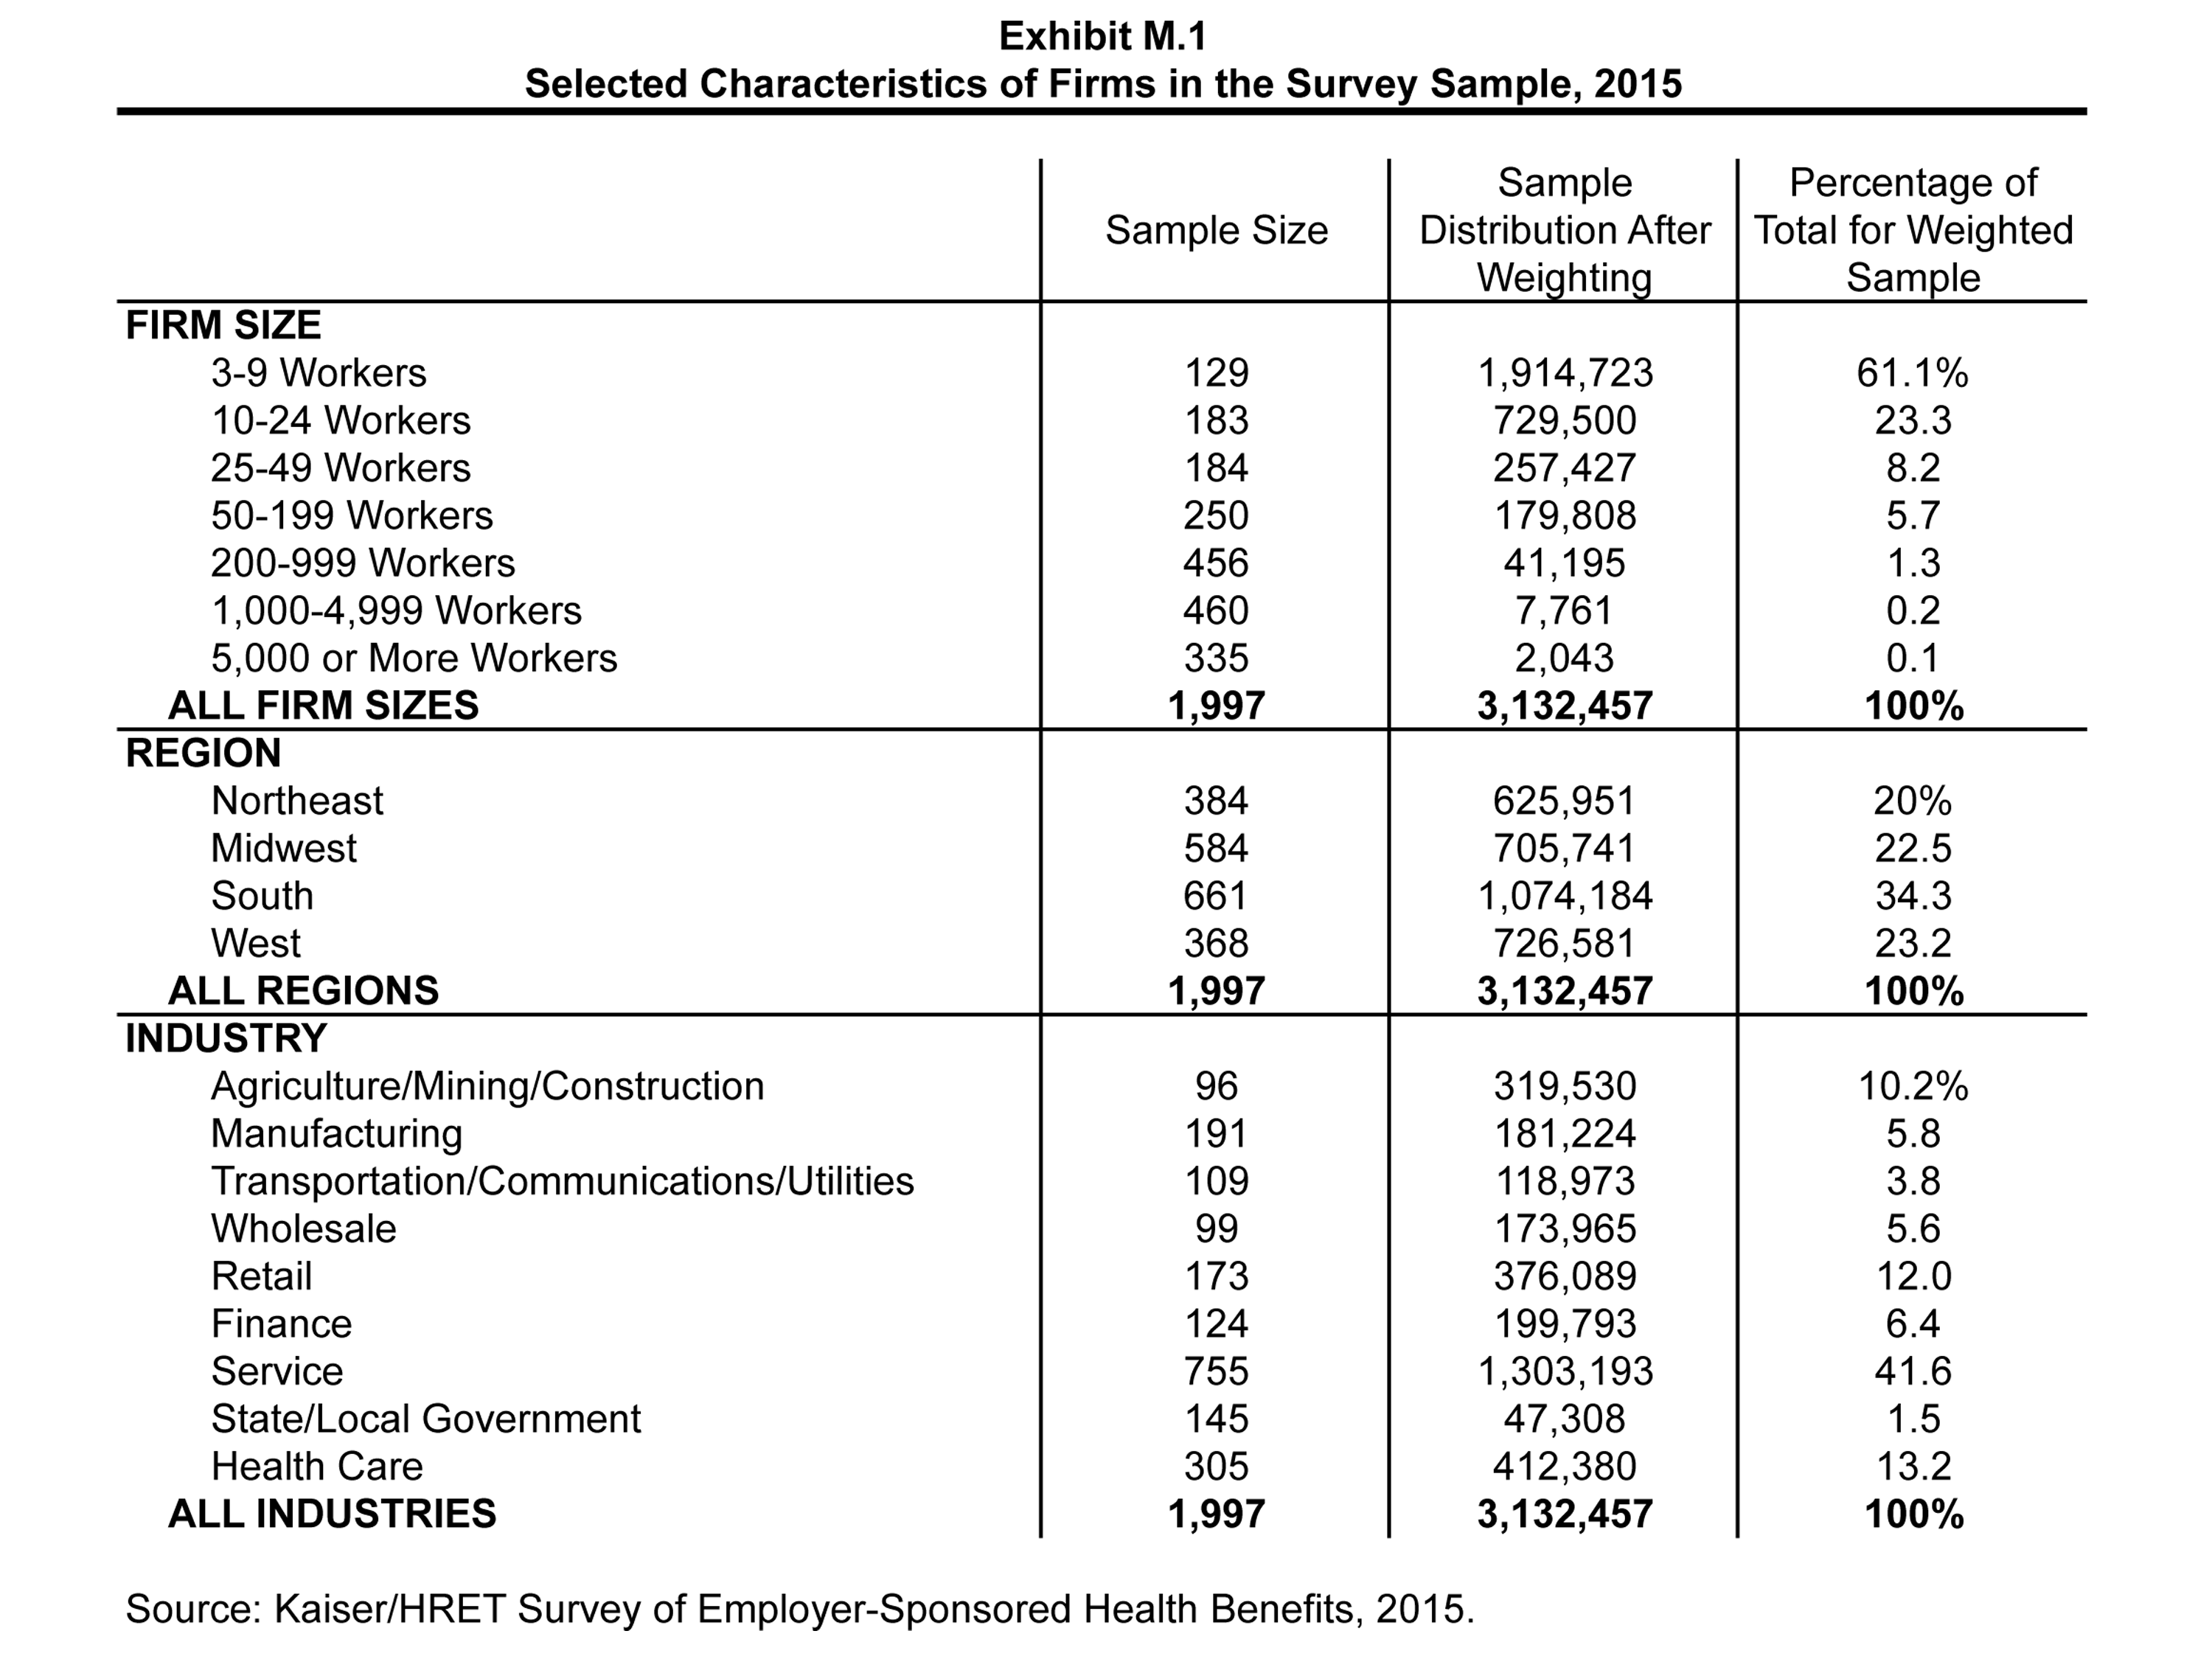
Exhibit M.1: Selected Characteristics of Firms in the Survey Sample, 2015
Exhibit M.2 displays the distribution of the nation’s firms, workers, and covered workers (employees receiving coverage from their employer). Among the over three million firms nationally, approximately 61.1% are firms employing 3 to 9 workers; such firms employ 8.1% of workers, and 4.1% of workers covered by health insurance. In contrast, less than 1% of firms employ 5,000 or more workers; these firms employ 35.1% of workers and 39.4% of covered workers. Therefore, the smallest firms dominate any statistics weighted by the number of employers. For this reason, most statistics about firms are broken out by size categories. In contrast, firms with 1,000 or more workers are the most important employer group in calculating statistics regarding covered workers, since they employ the largest percentage of the nation’s workforce.
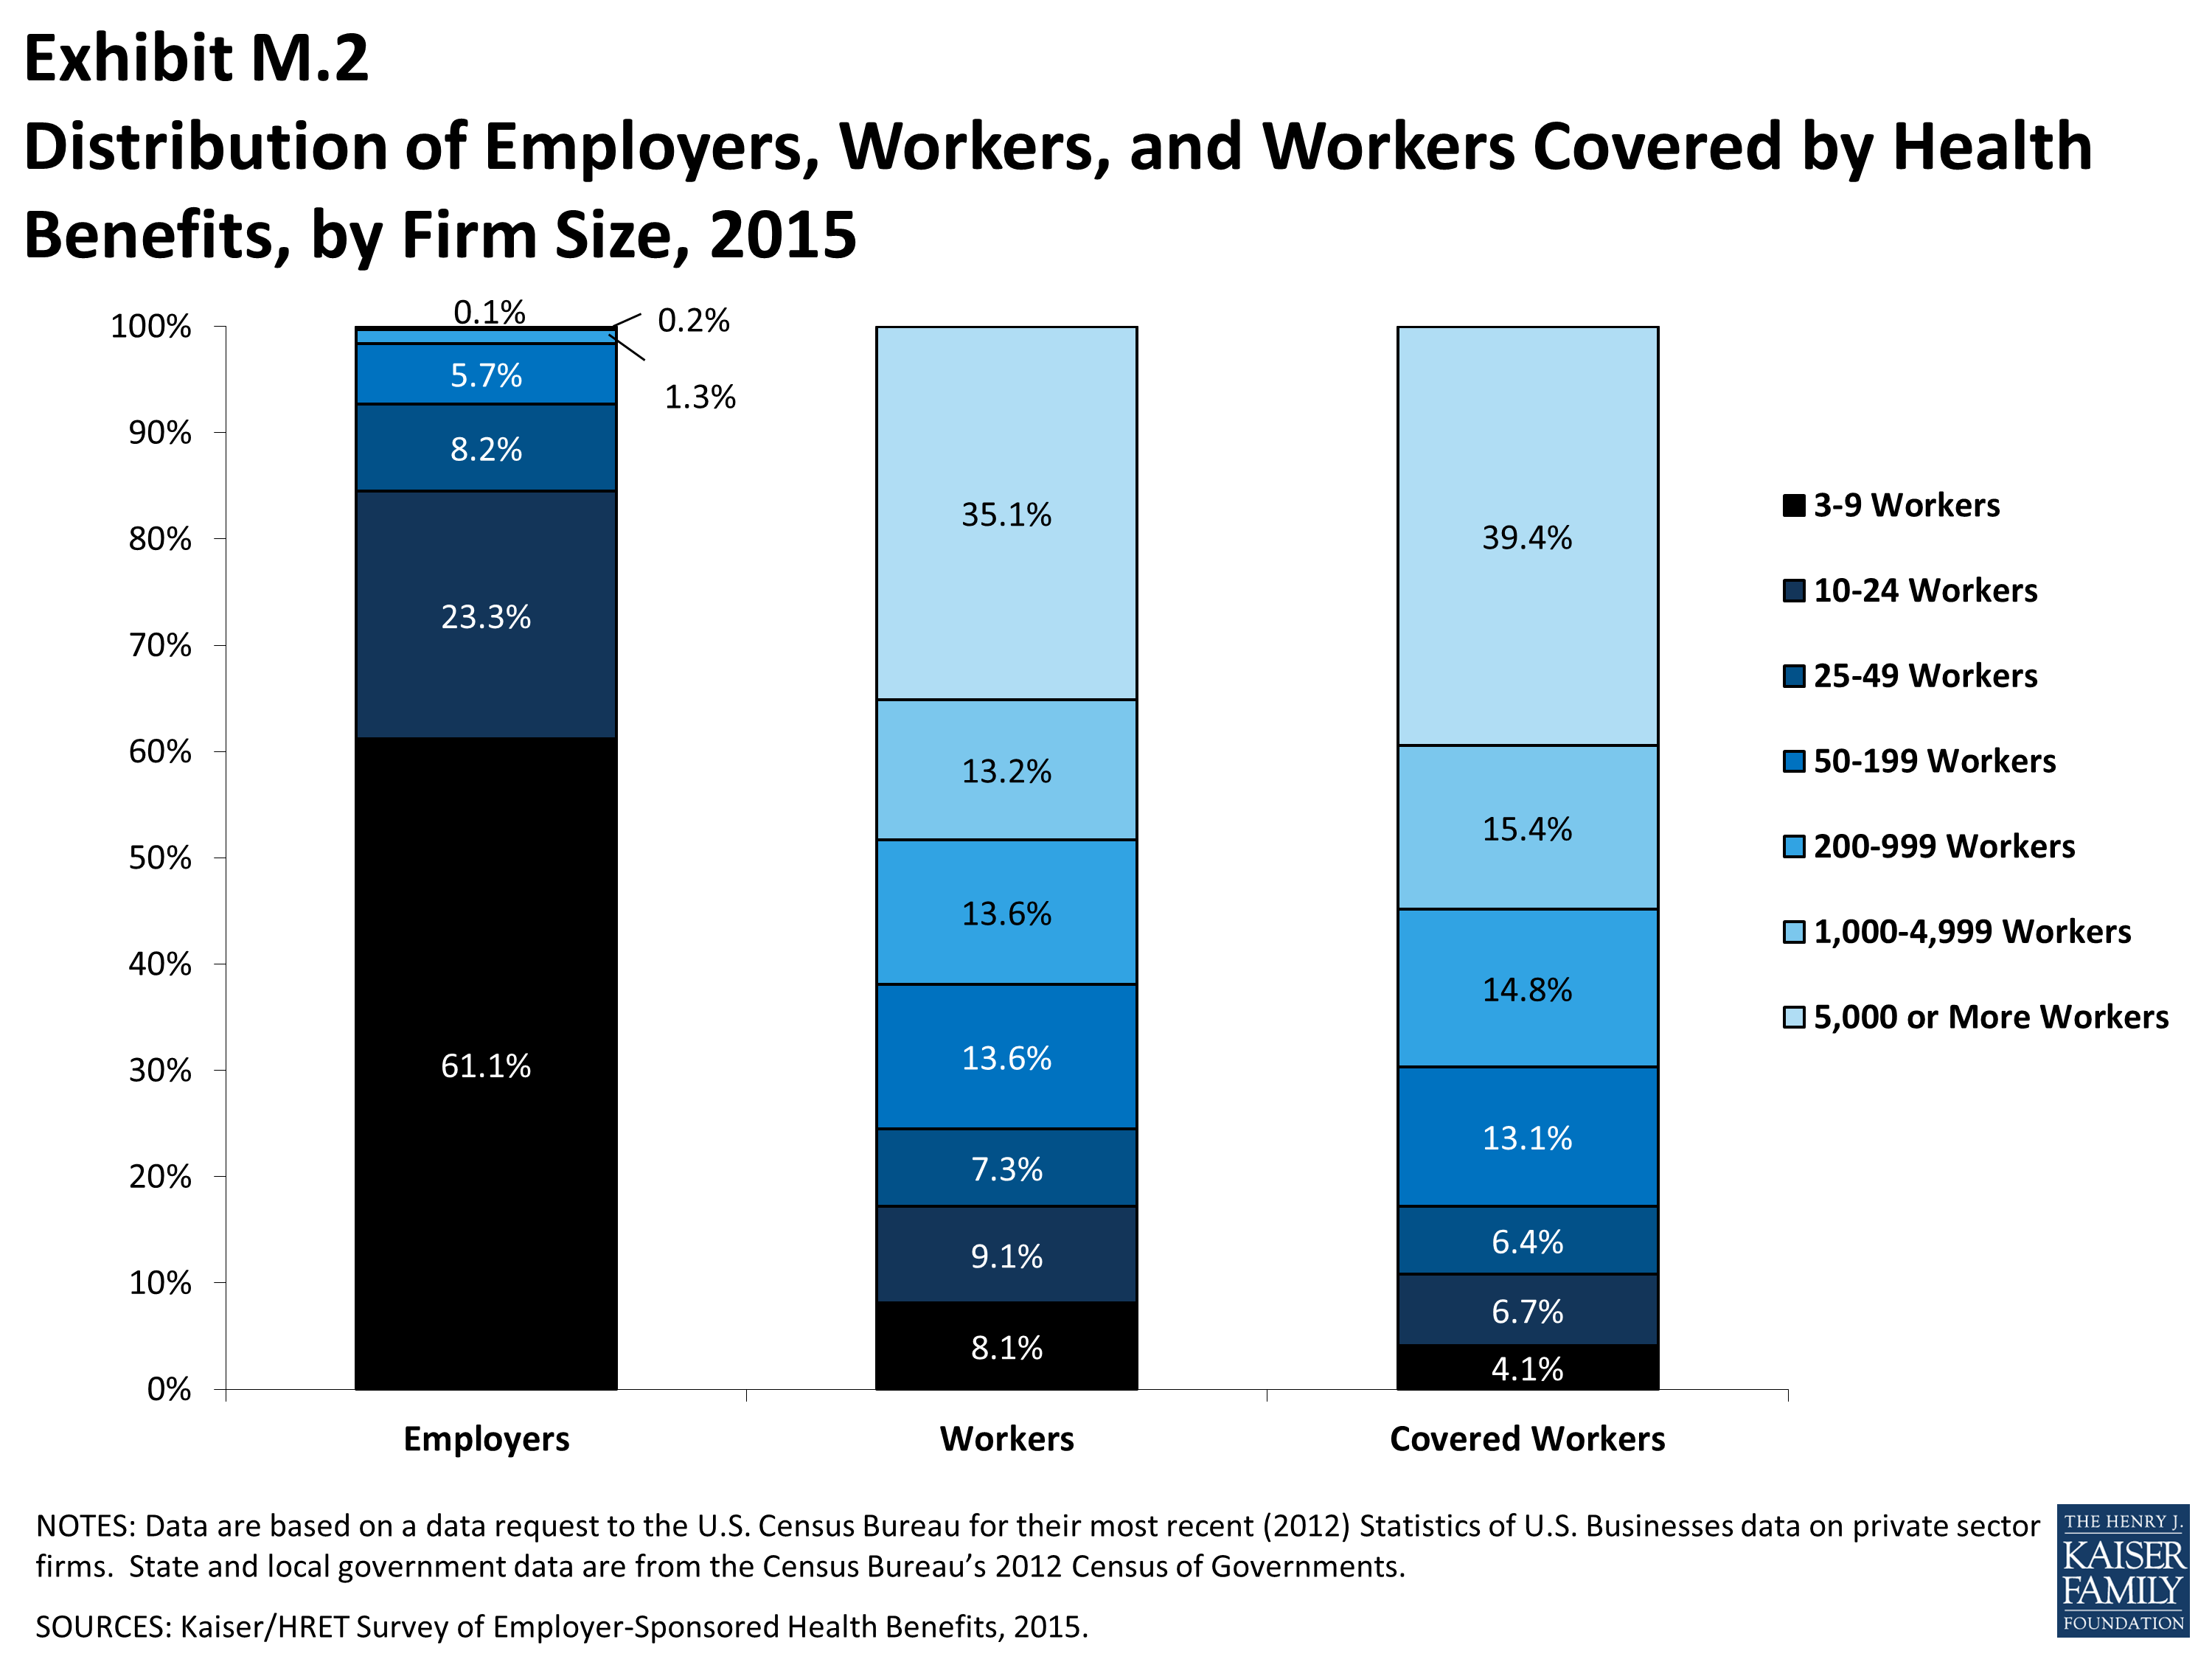
Exhibit M.2: Distribution of Employers, Workers, and Workers Covered by Health Benefits, by Firm Size, 2015
Throughout this report, we use the term “in-network” to refer to services received from a preferred provider. Family coverage is defined as health coverage for a family of four.
Each year, the survey asks firms for the percentage of their employees who earn less than a specified amount in order to identify the portion of a firm’s workforce that has relatively low wages. This year, the income threshold is $23,000 per year for lower-wage workers and $58,000 for higher-wage workers. These thresholds are based on the 25th and 75th percentile of workers’ earnings as reported by the Bureau of Labor Statistics using data from the Occupational Employment Statistics (OES) (2012).6 The cutoffs were inflation-adjusted and rounded to the nearest thousand. Prior to 2013, wage cutoffs were calculated using the now-eliminated National Compensation Survey.
Rounding and Imputation
Some exhibits in the report do not sum to totals due to rounding. In a few cases, numbers from distribution exhibits may not add to the numbers referenced in the text due to rounding. Although overall totals and totals for size and industry are statistically valid, some breakdowns may not be available due to limited sample sizes or a high relative standard error. Where the unweighted sample size is fewer than 30 observations, exhibits include the notation “NSD” (Not Sufficient Data). Many breakouts by subsets may have a large standard error, meaning that even large differences in the text are not statistically different.
To control for item nonresponse bias, Kaiser/HRET imputes values that are missing for most variables in the survey. On average, 5% of observations are imputed. All variables are imputed following a hotdeck approach. The hotdeck approach replaces missing information with observed values from a firm similar in size and industry to the firm for which data are missing. In 2015, there were 9 variables where the imputation rate exceeded 20%. For these cases, the unimputed variable is compared with the imputed variable. Also, most of these cases were for individual plan level statistics – when aggregate variables were constructed for all of the plans, the imputation rate is usually much lower. There are a few variables that Kaiser/HRET has decided not to impute; these are typically variables where “don’t know” is considered a valid response option (for example, firms’ opinions about effectiveness of various strategies to control health insurance costs or whether the firm is considering private exchanges.). In addition, there are several variables in which missing data are calculated based on respondents’ answers to other questions (for example, when missing employer contributions to premiums are calculated from the respondent’s premium and the ratio of contributions to premiums).
In 2012, the method to calculate missing premiums and contributions was revised; if a firm provides a premium for single coverage or family coverage, or a worker contribution for single coverage or family coverage, that information was used in the imputation. For example, if a firm provided a worker contribution for family coverage but no premium information, a ratio between the family premium and family contribution was imputed and then the family premium was calculated. In addition, in cases where premiums or contributions for both family and single coverage were missing, the hotdeck procedure was revised to draw all four responses from a single firm. The change in the imputation method did not make a significant impact on the premium or contribution estimates.
Starting in 2014, we elected to estimate separate single and family coverage premiums for firms that provided premium amounts as the average cost for all covered workers, instead of differentiating between single and family coverage. This method will more accurately account for the portion that each type of coverage contributes to the total cost for the 1% of covered workers who are enrolled at firms affected by this adjustment.
Sample Design
We determined the sample requirements based on the universe of firms obtained from the U.S. Census. Prior to the 2010 survey, the sample requirements were based on the total counts provided by Survey Sampling Incorporated (SSI) (which obtains data from Dun and Bradstreet). Over the years, we found the Dun and Bradstreet frequency counts to be volatile due to duplicate listings of firms, or firms that are no longer in business. These inaccuracies vary by firm size and industry. In 2003, we began using the more consistent and accurate counts provided by the Census Bureau’s Statistics of U.S. Businesses and the Census of Governments as the basis for post-stratification, although the sample was still drawn from a Dun and Bradstreet list. In order to further address this concern at the time of sampling, starting in 2009, we use Census data to determine the number of firms to attempt to interview within each size and industry category.
Starting in 2010, we also defined Education as a separate sampling category for the purposes of sampling, rather than as a subgroup of the Service category. In the past, Education firms were a disproportionately large share of Service firms. Education is controlled for during post-stratification, and adjusting the sampling frame to also control for Education allows for a more accurate representation of both the Education and Service industries.
In past years, both private and government firms were sampled from the Dun and Bradstreet database. Beginning in 2009, Government firms were sampled from the 2007 Census of Governments. This change was made to eliminate the overlap of state agencies that were frequently sampled from the Dun and Bradstreet database. The sample of private firms is screened for firms that are related to state/local governments, and if these firms are identified in the Census of Governments, they are reclassified as government firms and a private firm is randomly drawn to replace the reclassified firm. The federal government is not included in the sample frame.
Finally, the data used to determine the 2015 Employer Health Benefits Survey sample frame include the U.S. Census’ 2012 Statistics of U.S. Businesses and the 2012 Census of Governments. At the time of the sample design (December 2014), these data represented the most current information on the number of public and private firms nationwide with three or more workers. As in the past, the post-stratification is based on the most up-to-date Census data available (the 2012 update to the Census of U.S. Businesses was purchased during the survey fielding period).
Weighting and Statistical Significance
Because Kaiser/HRET selects firms randomly, it is possible through the use of statistical weights to extrapolate the results to national (as well as firm size, regional, and industry) averages. These weights allow Kaiser/HRET to present findings based on the number of workers covered by health plans, the number of total workers, and the number of firms. In general, findings in dollar amounts (such as premiums, worker contributions, and cost sharing) are weighted by covered workers. Other estimates, such as the offer rate, are weighted by firms. Specific weights were created to analyze the HDHP/SO plans that are offered with a Health Reimbursement Arrangement (HRA) or that are Health Savings Account (HSA)-qualified. These weights represent the proportion of employees enrolled in each of these arrangements.
Calculation of the weights follows a common approach. We trimmed the weights in order to reduce the influence of weight outliers. First, we identified common groups of observations. Within each group, we identified the median and the interquartile range of the weights and calculated the trimming cut point as the median plus six times the interquartile range (M + [6 * IQR]). Weight values larger than this cut point are trimmed to the cut point. In all instances, very few weight values were trimmed. Finally, we calibrated the weights to U.S. Census Bureau’s 2012 Statistics of U.S. Businesses for firms in the private sector, and the 2012 Census of Governments as the basis for calibration / post-stratification for public sector firms. Historic employer weighted statistics were updated in 2011.
In 2015, weights were not adjusted using the nonresponse adjustment process described in previous years’ methods. As in past years, Kaiser/HRET conducted a small follow-up survey of those firms with 3 to 49 workers that refused to participate in the full survey. Based on the results of a McNemar test, we were not able to verify that the results of the follow-up survey were comparable to the results from the original survey. In 2010, the results of the McNemar test were also significant and we did not conduct a nonresponse adjustment.
Between 2006 and 2012, only limited information was collected on conventional plans. Starting in 2013, information on conventional plans was collected under the PPO section and therefore, the covered worker weight was representative of all plan types.
The survey contains a few questions on employee cost sharing that are asked only of firms that indicate in a previous question that they have a certain cost-sharing provision. For example, the copayment amount for prescription drugs is asked only of those that report they have copayments for prescription drugs. Because the composite variables (using data from across all plan types) are reflective of only those plans with the provision, separate weights for the relevant variables were created in order to account for the fact that not all covered workers have such provisions.
To account for design effects, the statistical computing package R and the library package “survey” were used to calculate standard errors.7,8 All statistical tests are performed at the .05 confidence level, unless otherwise noted. For figures with multiple years, statistical tests are conducted for each year against the previous year shown, unless otherwise noted. No statistical tests are conducted for years prior to 1999. In 2012, the method to test the difference between distributions across years was changed to use a Wald test, which accounts for the complex survey design. In general, this method was more conservative than the approach used in prior years.
Statistical tests for a given subgroup (firms with 25-49 workers, for instance) are tested against all other firm sizes not included in that subgroup (all firm sizes NOT including firms with 25-49 workers, in this example). Tests are done similarly for region and industry; for example, Northeast is compared to all firms NOT in the Northeast (an aggregate of firms in the Midwest, South, and West). However, statistical tests for estimates compared across plan types (for example, average premiums in PPOs) are tested against the “All Plans” estimate. In some cases, we also test plan-specific estimates against similar estimates for other plan types (for example, single and family premiums for HDHP/SOs against single and family premiums for HMO, PPO, and POS plans); these are noted specifically in the text. The two types of statistical tests performed are the t-test and the Wald test.
The small number of observations for some variables resulted in large variability around the point estimates. These observations sometimes carry large weights, primarily for small firms. The reader should be cautioned that these influential weights may result in large movements in point estimates from year to year; however, these movements are often not statistically significant.
2015 Survey
The 2015 survey contains new information in several areas, including in section 12 on wellness and biometric screening. In most cases, information reported in this section is not comparable with previous years’ findings.
Data presented in the 2015 report reflect the firm’s benefits at the time they completed the interview. Some firms may report on a plan which took effect in the prior calendar year. Starting in 2015, firms were able to have a contribution and deductible in compliance with HSA requirements for the plan year. In 2015, six firms had an HSA deductible of $1,250.
Firms with 50 or more workers were asked: “Does your firm offer health benefits for current employees through a private or corporate exchange?” Employers were still asked for plan information about their HMO, PPO, POS and HDHP/SO plan regardless of whether they purchased health benefits through a private exchange or not.
Starting in 2015, employers were asked how many full-time equivalents they employed. In cases in which the number of full-time equivalents was relevant to the question, interviewer skip patterns may have depended on the number of FTEs.
In cases where a firm had multiple plans, they were asked about their strategies for containing the cost of specialty drugs for the plan with the largest enrollment.
Under the Affordable Care Act, non-grandfathered plans are required to have an out-of pocket maximum. Non-grandfathered plans who indicated that they did not have an out of pocket maximum were asked to confirm whether their plan was grandfathered and whether that plan had an out-of-pocket maximum.
Annual inflation estimates are usually calculated from April to April. The 12 month percentage change for May to May was 0%.9
Historical Data
Data in this report focus primarily on findings from surveys jointly authored by the Kaiser Family Foundation and the Health Research & Educational Trust, which have been conducted since 1999. Prior to 1999, the survey was conducted by the Health Insurance Association of America (HIAA) and KPMG using a similar survey instrument, but data are not available for all the intervening years. Following the survey’s introduction in 1987, the HIAA conducted the survey through 1990, but some data are not available for analysis. KPMG conducted the survey from 1991-1998. However, in 1991, 1992, 1994, and 1997, only larger firms were sampled. In 1993, 1995, 1996, and 1998, KPMG interviewed both large and small firms. In 1998, KPMG divested itself of its Compensation and Benefits Practice, and part of that divestiture included donating the annual survey of health benefits to HRET.
This report uses historical data from the 1993, 1996, and 1998 KPMG Surveys of Employer-Sponsored Health Benefits and the 1999-2014 Kaiser/HRET Survey of Employer-Sponsored Health Benefits. For a longer-term perspective, we also use the 1988 survey of the nation’s employers conducted by the HIAA, on which the KPMG and Kaiser/HRET surveys are based. The survey designs for the three surveys are similar.
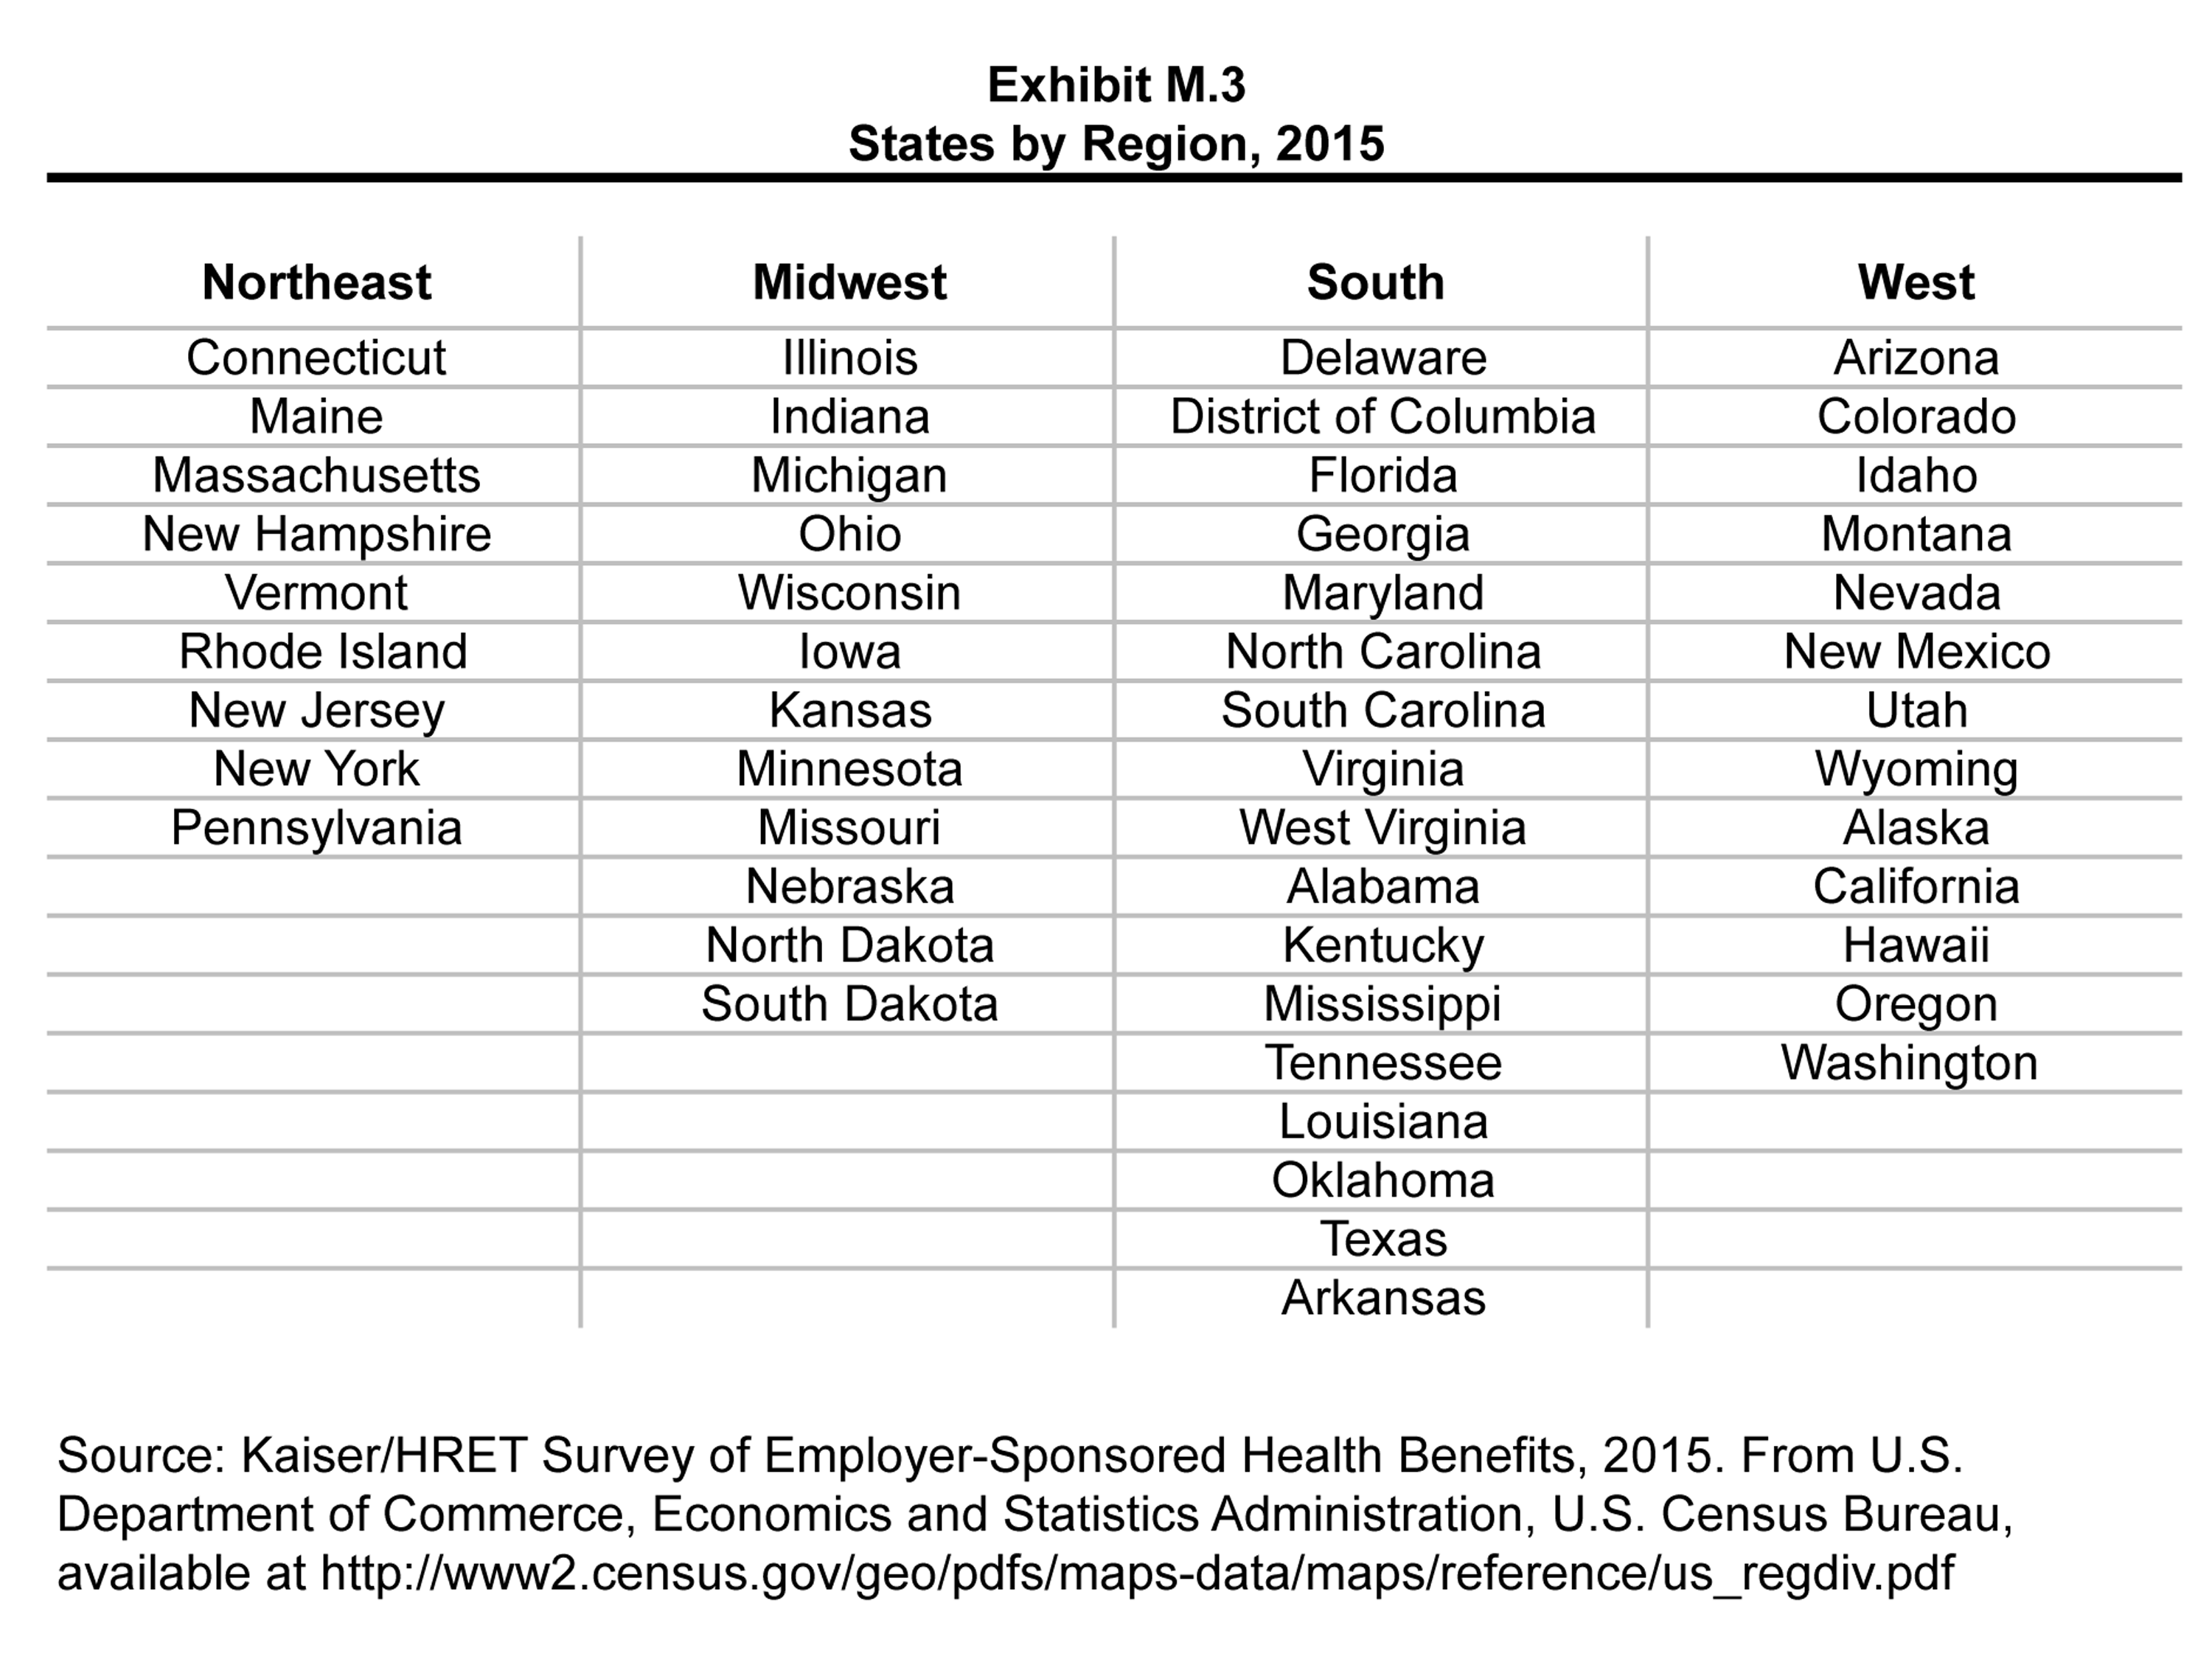
Exhibit M.3: States by Region, 2015
Endnotes
Summary of Findings
Summary Of Findings
Majerol, Melissa, Newkirk, Vann and Garfield, Rachel. "The uninsured: A primer—key facts about health insurance on the eve of coverage expansions." Kaiser Commission on Medicaid and the Uninsured. Dec 2014. https://www.kff.org/uninsured/report/the-uninsured-a-primer/ See supplemental tables - Table 1: 268.9 million non-elderly people, 54.6% of whom are covered by ESI.
Kaiser/HRET surveys use the April-to-April time period, as do the sources in this and the following note. The inflation numbers are not seasonally adjusted. Bureau of Labor Statistics. Consumer Price Index - All Urban Consumers: Department of Labor; 2015. [cited 2015 September 2] http://data.bls.gov/timeseries/CUUR0000SA0?output_view=pct_1mth. Wage data are from the Bureau of Labor Statistics and based on the change in total average hourly earnings of production and nonsupervisory employees. Employment, hours, and earnings from the Current Employment Statistics survey: Department of Labor; 2015 [cited 2015 September 2]. http://data.bls.gov/timeseries/CES0500000008
"Application of Market Reform and other Provisions of the Affordable Care Act to HRAs, Health FSAs, and Certain other Employer Healthcare Arrangements." Notice 2013-54. Internal Revenue Service. http://www.irs.gov/pub/irs-drop/n-13-54.pdf
Federal Register. Volume 79, No 36, February 24, 2014. http://webapps.dol.gov/FederalRegister/HtmlDisplay.aspx?DocId=27369&Month=2&Year=2014
Federal Register. Vol. 75, No 221, November 17, 2010, http://www.gpo.gov/fdsys/pkg/FR-2010-11-17/pdf/2010-28861.pdf.
Claxton, Gary & Levitt, Larry. "How Many Employers Could be Affected by the Cadillac Plan Tax?" Kaiser Family Foundation. Apr 2015. https://www.kff.org/health-reform/issue-brief/how-many-employers-could-be-affected-by-the-cadillac-plan-tax/
The 2015 offer rate is significantly lower than the 69% of firms which indicated that they offered benefits in 2010. The increase in the 2010 estimate was primarily driven by a 12 percentage point increase in firms with between 3 and 9 employees offering coverage. Given the number of small firms in the country, statistics weighted by the number of employers tend to be volatile - for more information see the survey design section.
"Assessing the Effects of the Economy on the Recent Slowdown in Health Spending." Kaiser Family Foundation. Apr 2013. https://www.kff.org/health-costs/issue-brief/assessing-the-effects-of-the-economy-on-the-recent-slowdown-in-health-spending-2/
"How has health spending changed over time?" Peterson-Kaiser Health System Tracker. June 2015. http://www.healthsystemtracker.org/chart-collection/how-has-health-spending-changed-over-time/?slide=1
Report
Section Two: Health Benefits Offer Rates
- Because surveys only collect information from a portion of the total number of firms in the country, there is uncertainty in any estimate. Since there are so many small firms, sometimes even seemingly large differences are not statistically different. For more information on the Employer Health Benefits Survey's weighting and design please see the Survey Design and Methods section.
- Internal Revenue Service. "Determining Full-Time Employees for Purposes of Shared Responsibility for Employers Regarding Health Coverage". Notice 2012-58. http://www.irs.gov/pub/irs-drop/n-12-58.pdf
- Internal Revenue Service. "Employer Health Care Arrangements". April 16, 2015. http://www.irs.gov/Affordable-Care-Act/Employer-Health-Care-Arrangements
Section Three: Employee Coverage, Eligibility, and Participation
Kaiser Commission on Medicaid and the Uninsured. The uninsured: A primer—key facts about health insurance and the uninsured in America [Internet]. Washington (DC): The Commission; 2014 Dec [cited 2015 Jul 24]. https://www.kff.org/uninsured/report/the-uninsured-a-primer/ See supplemental tables - Table 1: 268.9 million non-elderly people, 54.6% of whom are covered by ESI.
In 2009, Kaiser/HRET began weighting the percentage of workers that take up coverage by the number of workers eligible for coverage. The historical take up estimates have also been updated. See the Survey Design and Methods section for more information.
Variable hour employees may have a measurement period of up to 12 months before it is determined if they are eligible for benefits. Employers may require a cumulative service requirement of 1,200 hours before an employee may enroll. Federal Register. Vol. 79, No.36. February 24, 2014. https://www.federalregister.gov/articles/2014/02/24/2014-03811/ninety-day-waiting-period-limitation
United States Department of Labor. “Technical Release 2012-01”. http://www.dol.gov/ebsa/healthreform/regulations/automaticenrollment.html
Section Four: Types of Plans Offered
Starting in 2010, we included firms that said they offer a plan type even if there are no covered workers enrolled in that plan type.
Section Six: Worker and Employer Contributions for Premiums
Estimates for premiums, worker contributions to premiums, and employer contributions to premiums presented in Section 6 do not include contributions made by the employer to Health Savings Accounts (HSAs) or Health Reimbursement Arrangements (HRAs). See Section 8 for estimates of employer contributions to HSAs and HRAs.
For definitions of Self-Funded and Fully Insured plans, see the introduction to Section 10.
Section Seven: Employee Cost Sharing
Some workers with separate per-person deductibles or out-of-pocket maximums for family coverage do not have a specific number of family members that are required to meet the deductible amount and instead have another type of limit, such as a per-person amount with a total dollar amount limit. These responses are included in the averages and distributions for separate family deductibles and out-of-pocket maximums.
Starting in 2010, the survey asked about the prevalence and cost of physician office visits separately for primary care and specialty care. Prior to the 2010 survey, if the respondent indicated the plan had a copayment for office visits, we assumed the plan had a copayment for both primary and specialty care visits. The survey did not allow for a respondent to report that a plan had a copayment for primary care visits and coinsurance for visits with a specialist physician. The changes made in 2010 allow for variations in the type of cost sharing for primary care and specialty care visits. This year the survey includes cost sharing for in-network services only. See the 2007 survey for information on out-of-network office visit cost sharing.
Section Eight: High-Deductible Health Plans with Savings Option
There is no legal requirement for the minimum deductible in a plan offered with an HRA. The survey defines a high-deductible HRA plan as a plan with a deductible of at least $1,000 for single coverage and $2,000 for family coverage. Federal law requires a deductible of at least $1,300 for single coverage and $2,600 for family coverage for HSA-qualified HDHPs in 2015. See the Text Box for more information on HDHP/HRAs and HSA-qualified HDHPs.
The definitions of HDHP/SOs do not include other consumer-driven plan options, such as arrangements that combine an HRA with a lower-deductible health plan or arrangements in which an insurer (rather than the employer as in the case of HRAs or the enrollee as in the case of HSAs) establishes an account for each enrollee. Other arrangements may be included in future surveys as the market evolves.
The average out-of-pocket maximum for HDHP/HRAs is calculated for plans with an out-of-pocket maximum. About 3% of covered workers in HDHP/HRAs with single coverage or family coverage are in plans that reported having no limit on out-of-pocket expenses.
In the survey, we ask, “Up to what dollar amount does your firm promise to contribute each year to an employee’s HRA or health reimbursement arrangement for single coverage?” We refer to the amount that the employer commits to make available to an HRA as a contribution for ease of discussion. As discussed, HRAs are notional accounts, and employers are not required to actually transfer funds until an employee incurs expenses. Thus, employers may not expend the entire amount that they commit to make available to their employees through an HRA. Some employers may make their HRA contribution contingent on other factors, such as completing wellness programs.
Section Thirteen: Grandfathered Health Plans
Federal Register. Vol. 75, No. 116, June 17, 2010, http://www.gpo.gov/fdsys/pkg/FR-2010-06-17/pdf/2010-14614.pdf, and No. 221, Nov. 17, 2010, http://edocket.access.gpo.gov/2010/pdf/2010-28861.pdf
United States Department of Labor. (June 17, 2010). EBSA Final Rules. Group Health Plans and Health Insurance Coverage Relating to Status as a Grandfathered Health Plan Under the Patient Protection and Affordable Care Act; Interim Final Rule and Proposed Rule. http://webapps.dol.gov/FederalRegister/HtmlDisplay.aspx?DocId=23967&AgencyId=8&DocumentType=2
Cohen, Gary. Department of Health and Human Services. Nov 14, 2013. http://www.cms.gov/CCIIO/Resources/Letters/Downloads/commissioner-letter-11-14-2013.PDF and Cohen, Gary, "Insurance Standards Bulletin Series – Extension of Transitional Policy through October 1, 2016." Department of Health and Human Services. March 5, 2014. https://www.cms.gov/CCIIO/Resources/Regulations-and-Guidance/Downloads/transition-to-compliant-policies-03-06-2015.pdf
Methodology
HDHP/SO includes high-deductible health plans offered with either a Health Reimbursement Arrangement (HRA) or a Health Savings Account (HSA). Although HRAs can be offered along with a health plan that is not an HDHP, the survey collected information only on HRAs that are offered along with HDHPs. For specific definitions of HDHPs, HRAs, and HSAs, see the introduction to Section 8.
HDHP/SO premium estimates do not include contributions made by the employer to Health Savings Accounts or Health Reimbursement Arrangements.
In total, 142 firms participated in 2013, 315 firms participated in 2014 and, and 1,082 firms participated in 2013 and 2014.
Response rate estimates are calculated by dividing the number of completes over the number of refusals and the fraction of the firms with unknown eligibility to participate estimated to be eligible. Firms determined to be ineligible to complete the survey are not included in the response rate calculation.
Estimates presented in Exhibits 2.1, 2.2, 2.3 and 2.5 are based on the sample of both firms that completed the entire survey and those that answered just one question about whether they offer health benefits.
General information on the OES can be found at: http://www.bls.gov/oes/oes_emp.htm#scope. A comparison between the OES and the NCS is available at: http://www.bls.gov/oes/oes_ques.htm
Analysis of the 2011 survey data using both R and SUDAAN (the statistical package used prior to 2012) produced the same estimates and standard errors. Research Triangle Institute (2008). SUDAAN Software for the Statistical Analysis of Correlated Data, Release 10.0, Research Triangle Park, NC: Research Triangle Institute.
A supplement with standard errors for select estimates can be found online at Technical Supplement: Standard Error Tables for Selected Estimates, http://ehbs.kff.org
Bureau of Labor Statistics, Consumer Price Index, U.S. City Average of Annual Inflation (April to April), 2000-2015; http://data.bls.gov/timeseries/CUUR0000SA0?output_view=pct_1mth