Assessing the Effects of the Economy on the Recent Slowdown in Health Spending
Introduction
Health spending has been growing at historically low levels in recent years. The Office of the Actuary (OACT) in the Centers for Medicare and Medicaid Services reports that national health spending grew by 3.9% each year from 2009 to 2011, the lowest rate of growth since the federal government began keeping such statistics in 1960. Estimates from the Center for Sustainable Health Spending at the Altarum Institute suggest that the slowdown largely continued into 2012, with health spending growing by 4.3% last year. The Kaiser Family Foundation/Health Research & Educational Trust Employer Health Benefits Survey shows similar moderation, with premiums in employer-sponsored health plans increasing by 4% in 2012.
There has been a significant focus on whether this slowdown in health spending is a result of broader economic factors (such as the Great Recession of 2007-2009), structural changes in the health system that could lead to slower growth in the future as well, or some combination of the two. To the extent this is a temporary phenomenon driven by the economic downturn and abnormally low inflation, we can expect health spending growth to bounce back up in the future as the economy recovers. To the extent structural changes are at play – i.e., that health spending is growing more slowly than what would be expected given the state of the economy – we may see a continuation of historically low rates of growth even as the economy returns to full employment.
This has major implications for policy, since health spending growth is a major driver of federal and state budgets through the Medicare and Medicaid programs, as well as the tax exclusion for employer-sponsored insurance. Beginning in 2014, it will also affect the federal cost for subsidies provided to low- and middle-income people buying coverage through new health insurance exchanges. In particular, projected future increases in health spending are an important factor in estimates of the federal budget deficit, and the Congressional Budget Office (CBO) recently lowered its forecast of future Medicare and Medicaid spending based on the historically low rates of growth of health spending in recent years. A better understanding of what is driving changes in health spending will also be important context for interpreting what happens as the Affordable Care Act (ACA) goes into effect. Perhaps most importantly, if we believe health spending growth will remain low, we may be satisfied letting current cost containment strategies play out; if we do not, there may be greater impetus to consider new efforts to address health care costs.
This analysis uses a statistical model we developed to assess how much of the recent slowdown in spending is due to economic factors, and to identify sustained periods where health spending has grown faster or slower than would have been expected due to macroeconomic changes (i.e., growth in GDP and inflation). We also address what could happen to health spending in the coming years if the economy recovers as projected by CBO.
A Statistical Model of the Effects of the Economy on Health Spending
Researchers at the Kaiser Family Foundation and the Altarum Institute’s Center for Sustainable Health Spending developed a statistical model to track how the growth in national health spending varies with macroeconomic indicators, using estimates of national health spending from OACT for 1965 to 2011 and estimates of health spending for 2012 from Altarum.
This model allows us to go back in time and assess how much changes in the economy as a whole are associated with increases in health spending, in effect generating a “reverse forecast.” It also allows us to forecast what could happen to the growth in health spending in the future assuming the economy recovers as expected.
Two macroeconomic variables were found to be highly predictive of the growth in health spending in any given year:
- Inflation in the current year, as measured by the Gross Domestic Product (GDP) deflator, as well as inflation in the prior two years.
- The growth in real GDP in the current year, as well as GDP growth in the prior five years.
These variables explain over 85% of the variation in health spending growth rates from 1965 through 2011.1
It is not surprising that inflation and GDP are significant drivers of health spending growth. Changes in real GDP – reflecting recessions and periods of economic growth – are primarily a function of changes in consumer spending, so it makes sense that consumers will also respond to broader economic changes by adjusting spending on health care as well. This could be a very direct response (e.g., that consumers use fewer health care services as their incomes lag and they cut back on spending of other goods and services as well). It could also be an indirect effect (e.g., employers cutting back on health benefits or fewer people working and more people uninsured during recessionary periods).
Perhaps more surprising, we found that these effects are quite slow to develop, with changes in GDP filtering through the health system over a six year period (including the current year). There are a variety of possible explanations for this lagged effect, including:
- Most people are insured, and insurance has an economically protective effect in shielding people from the full cost of health care.
- Consumers may perceive health care as a necessity in a way that is different from other economic goods, and therefore cut back on health spending only after exhausting other ways of trimming household budgets.
- Employers may not make immediate changes to health benefits in response to changes in GDP.
- Hospitals (which account for a large share of health spending) are quite deliberate in their decision-making processes regarding whether to expand or contract services and capital expenditures.
- Legislated changes in spending under Medicare and Medicaid may require an extended process of debate before any substantial adjustments are made. In fact, as unemployment rises and incomes fall, Medicaid costs tend to go up as more people become eligible for the program, though states in response may react by cutting back on eligibility or payments to providers.
In effect, our analysis finds that health spending fully responds to changes in the economy, but that the effect is gradual and cumulative rather than immediate. For example, a 1% change in real GDP ultimately a produces a 1.49% change in health spending. The effect is greater than 1.0 because health spending over time grows faster than the economy as a whole, leading to a greater share of GDP devoted to health.
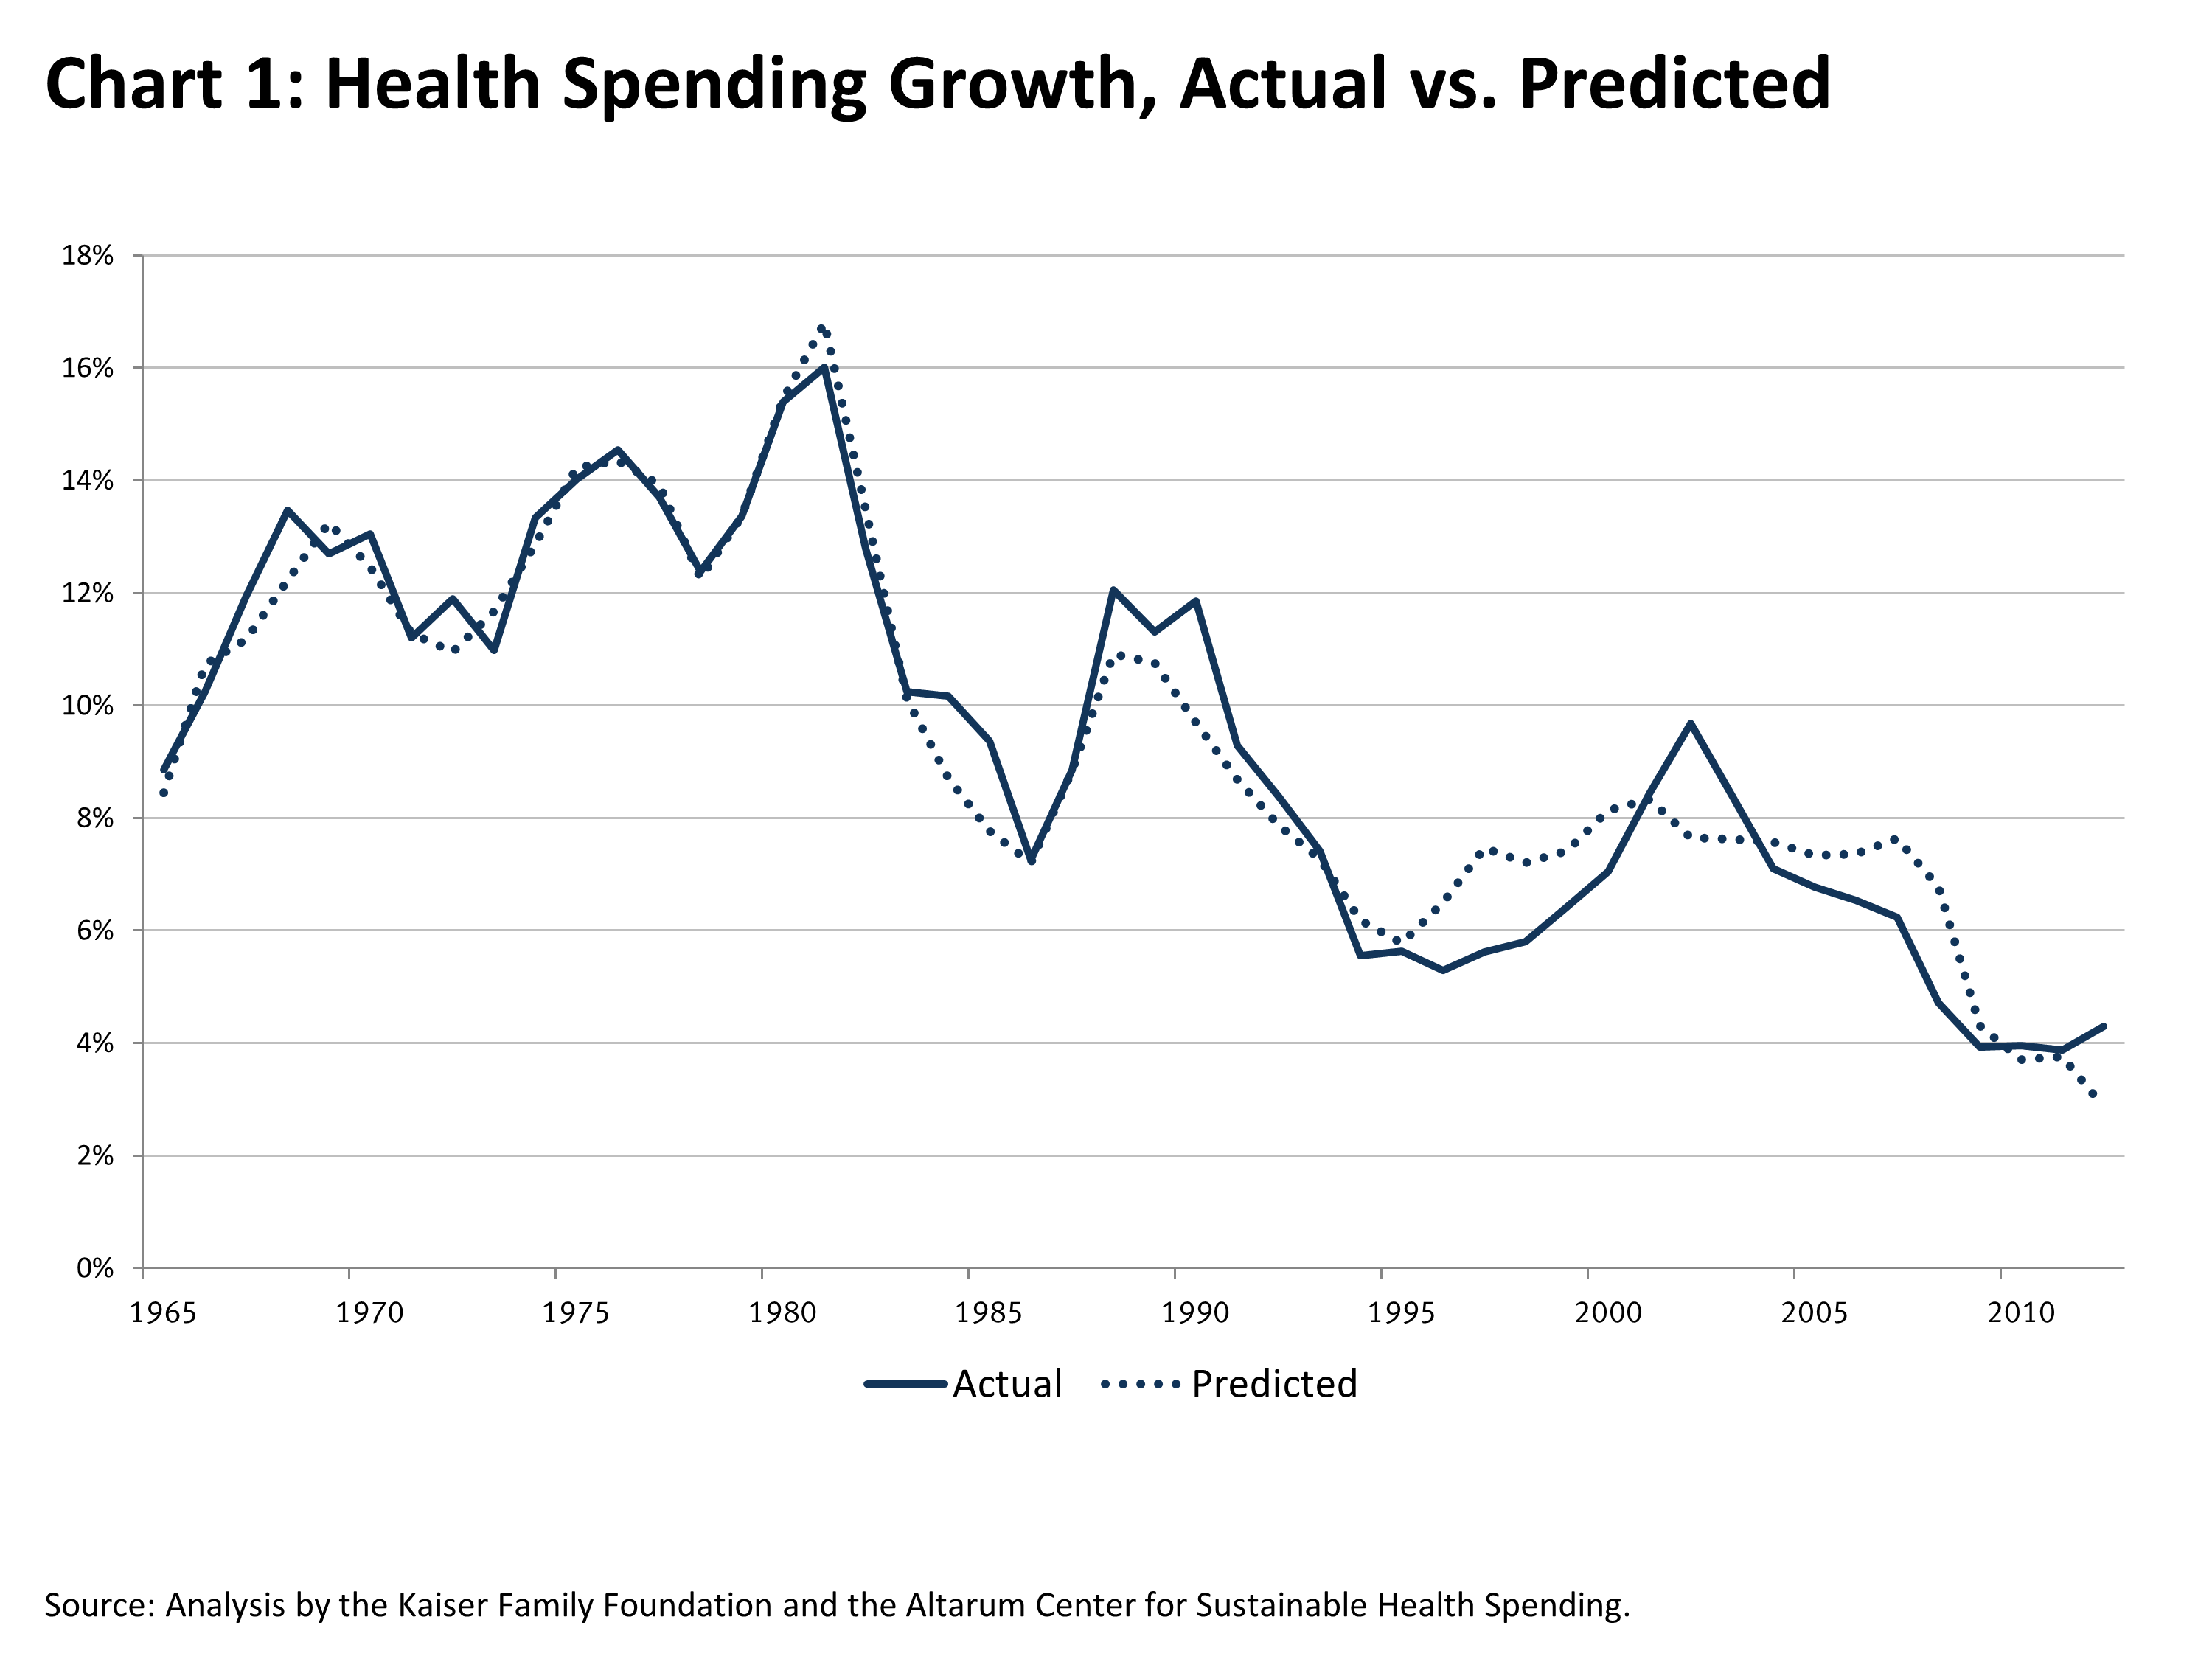
Chart 1 shows the growth in health spending for the period 1965 to 2012, as well as what the model predicts health spending would have been based solely on inflation and changes in real GDP. This chart illustrates the striking relationship between health spending and the economy, with health spending growth cycling up and down over time closely in sync with macroeconomic measures.
How Much of the Recent Slowdown in Health Spending is Due to the Economic Downturn?
For the past four years, health spending growth has been at its lowest level in five decades. There has been much discussion about how much of this slowdown is due to the great recession. This is not just interesting from an historical perspective, but also highly relevant in considering how long the slowdown may last. A casual examination suggests that there is more going on here than just the recession, since the slowdown in costs predated the recession and has continued after it. However, because GDP and inflation influence health spending with a significant lag, the effects of economic cycles on the health system are not always apparent from looking at such simple relationships.2
Our analysis indicates that that economic growth influences health spending on a lagged basis over a period of six years, and inflation does so over two years. Inflation was quite similar in the years running up to 2002 and 2012, but real GDP growth was quite different. Real GDP growth averaged 3.4% per year during the period 1997-2002, but just .8% from 2007-2012.
As a result, our analysis suggests that much of the decline in health spending growth in recent years was fully expected given what was happening more broadly in the economy. For example, in the three years 2001-2003, annual health spending growth rates averaged 8.8%, the recent peak in the curve. Annual growth rates have been steadily declining since then and have averaged 4.2% from 2008 to 2012, a decline of 4.6 percentage points from the peak. But, based on patterns of real GDP changes and inflation, our model predicts that the growth rate in health spending would have been expected to decline by 3.6 percentage points over that same period. In other words, about three-quarters (77%) of the recent decline in health spending growth can be explained by changes in the broader economy.
Are We in a Period of High or Low “Excess” Health Spending?
While economic factors explain the vast majority of the recent slowdown in health spending, they do not explain it entirely. To quantify how much of the slowdown might be due to structural changes in the health system that could persist for some period of time, we estimate the amount of “excess” health spending growth over time.
Historically, “excess” growth in health spending has been measured by how much faster (or slower) health expenditures are rising relative to GDP. Over the long term, from 1960 to 2011, health spending has grown by an average of 2.6 percentage points faster than GDP. Over the last 20 years, the average “excess” has been 1.6 percentage points. Any time this “excess” growth is greater than zero, it means that the health sector is growing as a share of GDP.
One challenge with this measure is that it is quite volatile. For example, when GDP falls precipitously during recessions, health spending typically does not immediately move in lockstep (as our statistical model confirms), leading to a very large gap between health and GDP. This is an accurate measure of how much faster the health care system grew than the economy as a whole in any given year, but the results are largely driven by GDP and are not a good indication of how the health system is performing from a cost perspective. For example, in 2009 health spending grew at about GDP+6, but this was clearly not indicative of any longer term trend.
Some have sought to correct for this volatility in GDP by instead looking at the gap between health spending growth and what is known as “potential” GDP (PGDP) as an indicator of “excess” growth in the health system. PGDP estimates what the nation’s economic output would be if labor and capital resources were fully employed, and it is consequently relatively insensitive to business cycles. Therefore, using PGDP to measure “excess” health growth may provide a better indicator of longer-term trends. However, looking at the gap between health spending and PGDP has almost the opposite problem of looking at GDP – during economic downturns, “excess” health spending will appear unnaturally low because the growth in health expenditures tends to drop while PGDP remains relatively constant.
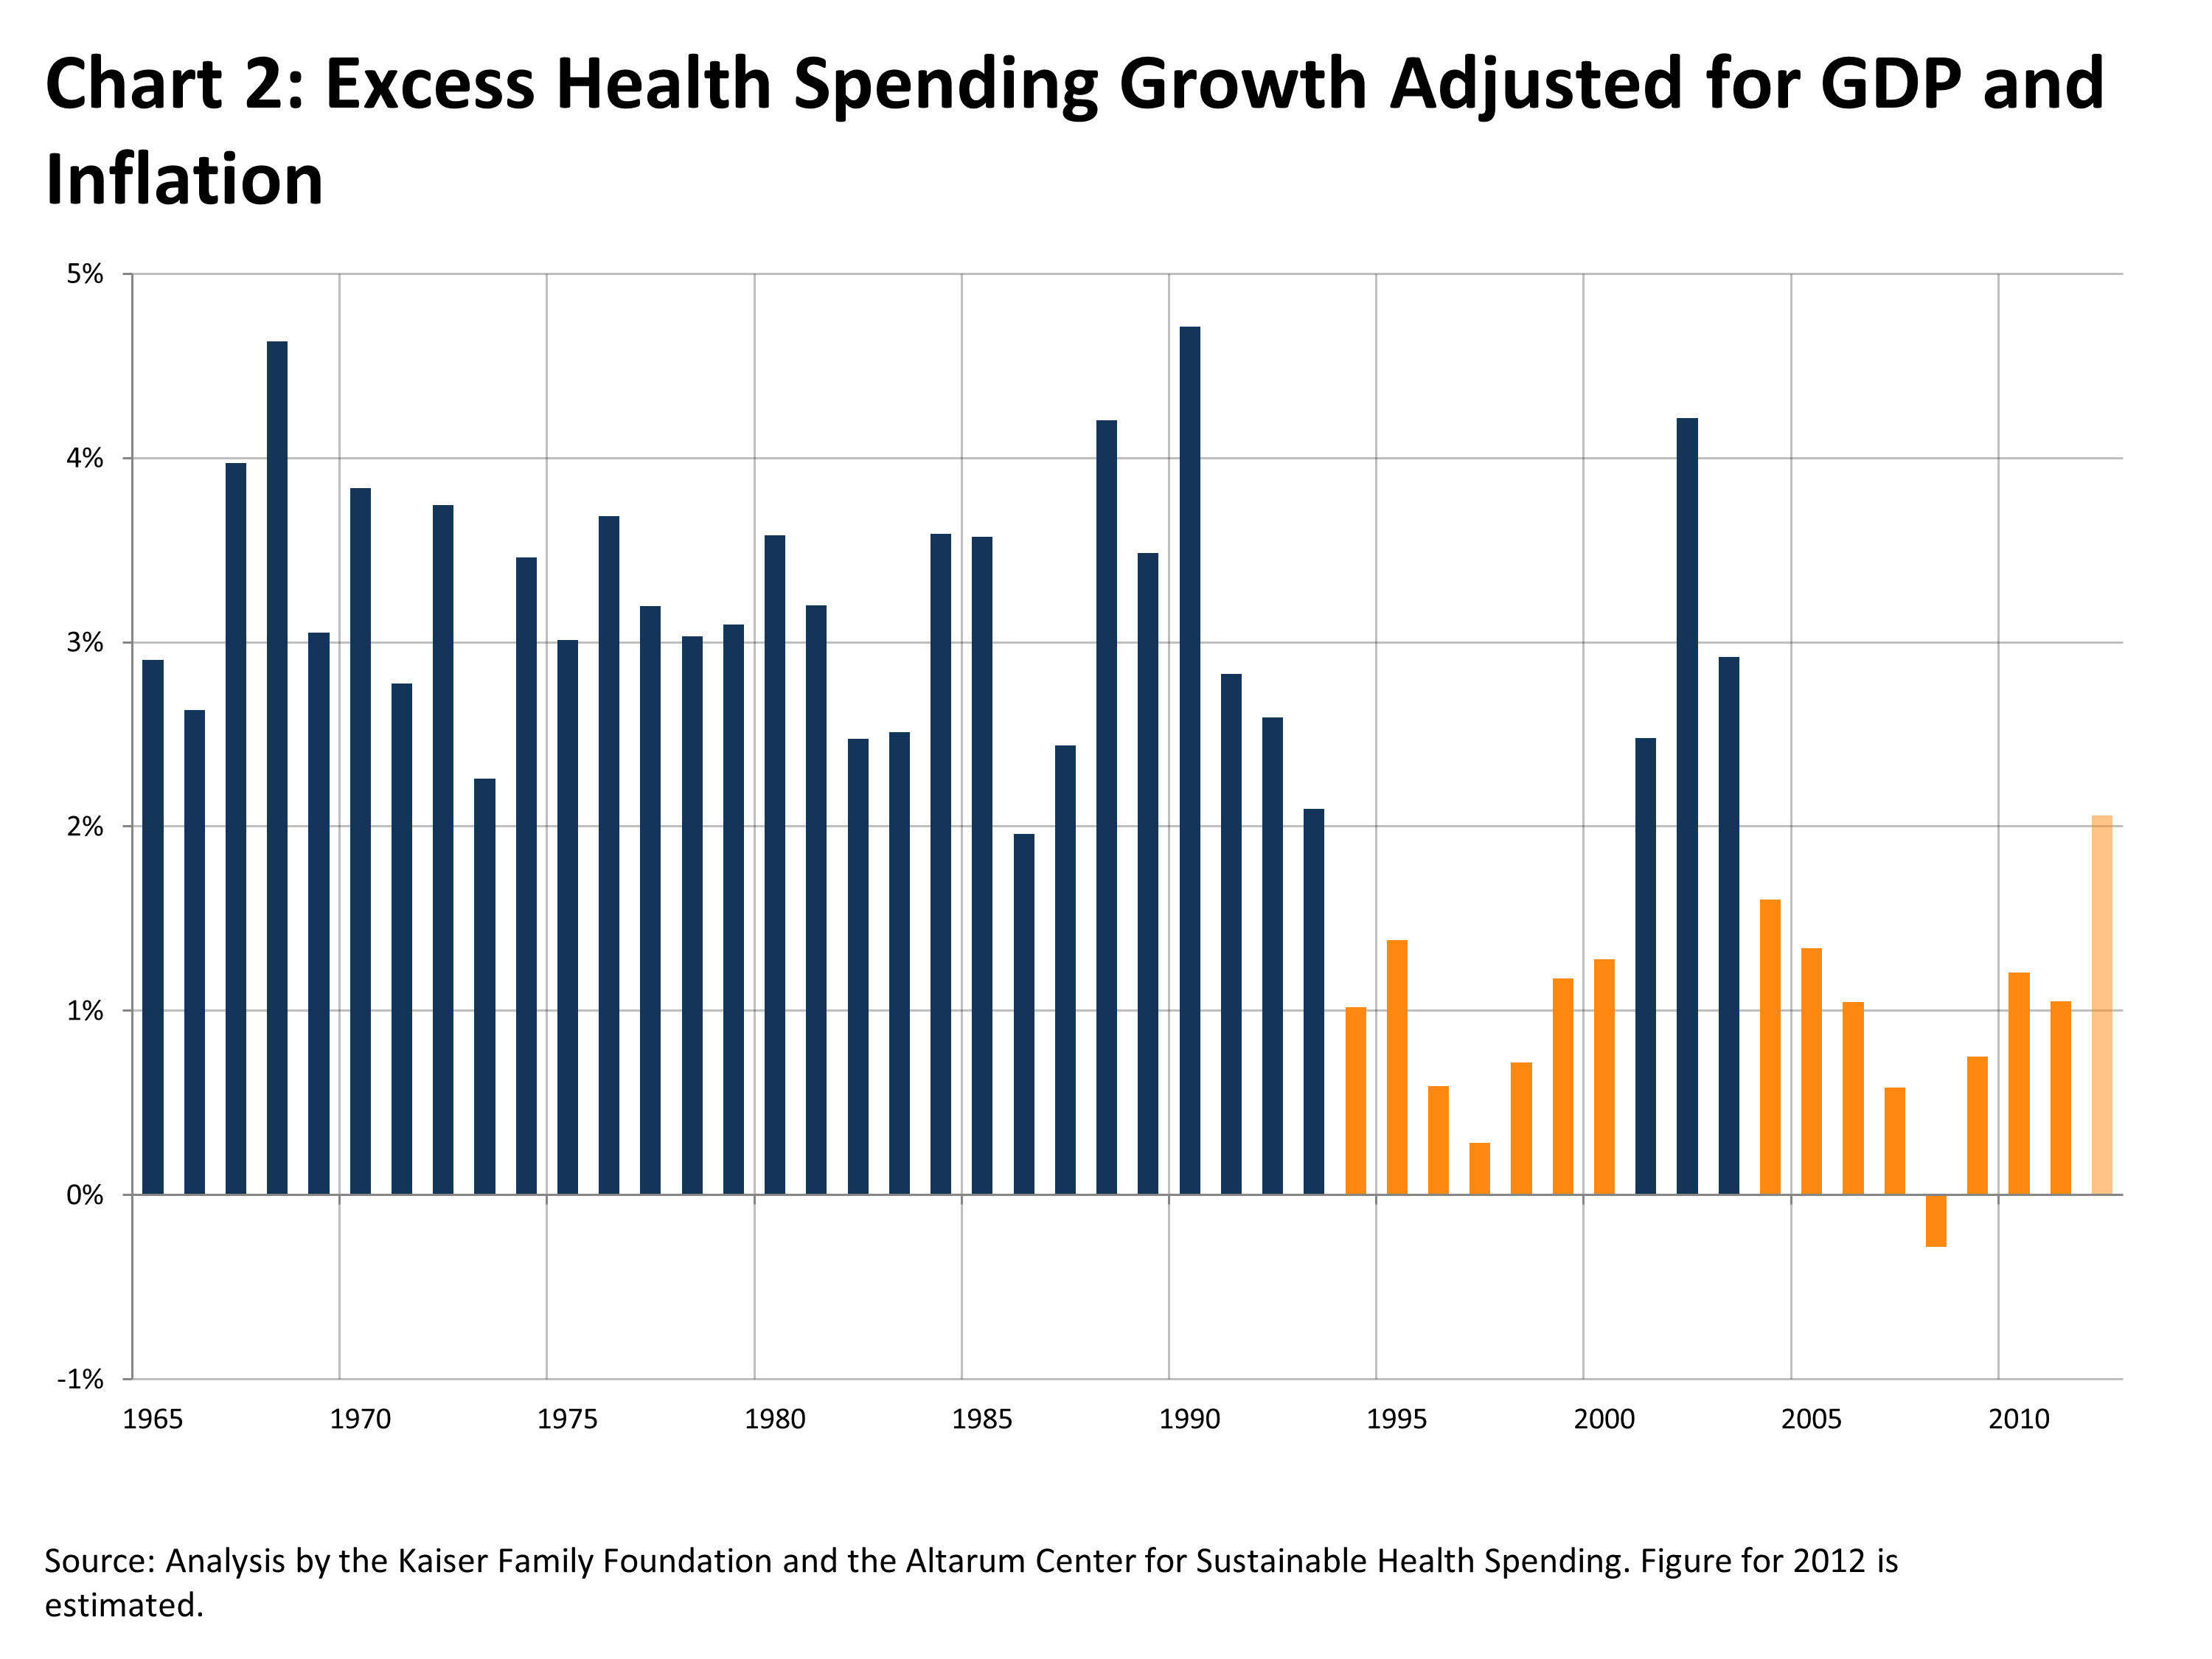
To compensate for the deficiencies in these rough measures of “excess” health spending, we instead developed an improved measure (using our statistical model) that adjusts for temporary fluctuations in health spending and GDP growth caused by the lagged effect of business cycles and inflation. This measure, in effect, estimates how health spending is growing relative to the economy as a whole, independent of business cycles. [3] Chart 2 presents year-by-year estimates of “excess” health spending growth using this approach, with orange bars illustrating periods of sustained low growth (2012 is shaded differently since it is based on a preliminary estimate of spending).
As the chart shows, health spending grew significantly faster than the economy throughout the 1960s, 1970s, and 1980s, with “excess” growth averaging 3.2% over the period. That long-term trend first broke in about 1993, likely due to the threat of health reform during the debate over the Clinton Health Security Act and the subsequent rapid rise in managed care enrollment. “Excess” growth remained low through the rest of the 1990s – averaging just less than 1% – at which point it spiked for a few years as a backlash against managed care ensued and hospitals consolidated. This spike was short-lived, lasting through 2003, and the rest of the decade and the early years of the new millennium have looked very much like the 1990s (with “excess” growth averaging about 1%). It may be too soon to identify the changes that have led to the slowdown in “excess” growth since 2004. Some of it could be attributed to the ongoing effects of various forms of managed care. Through the 1980s, the vast majority of people with private insurance were in relatively unmanaged insurance models, including conventional fee-for-service plans and loosely organized preferred provider organization (PPO) type arrangements. Since then – even following the backlash against managed care – various forms of utilization management and plans with defined networks are the norm in employer-sponsored insurance. These arrangements have also grown in Medicare and Medicaid as well. However, deductibles and other types of patient cost-sharing have also increased in recent years, dampening use of services. Some point to greater sophistication of information technology systems to track and manage health services and changes in the delivery system as possible sources of system-wide savings as well.
There is no way of knowing for certain whether this slowdown will persist and for how long, though the trend since 2008 has been generally upward. However, the major elements of the ACA – including significant cost savings in Medicare and the creation of new health insurance exchanges – have in general not yet been fully implemented, and could dampen growth in the future.
What May Happen to Health Spending if the Economy Recovers?
From a policy perspective, understanding patterns of health spending in the past is primarily of interest as a guide for what may happen in the future. Our statistical model can be used to forecast health spending in the coming years, based on assumptions about how quickly the economy recovers.
Chart 3 shows historical growth in health spending by year broken down by the components of that growth as estimated by our statistical model: the effects of real GDP and inflation (current and lagged), as well as “excess” health spending growth. The chart also illustrates what could happen to health expenditures over the next decade based on CBO’s forecast of GDP and inflation. However, future spending depends critically on not only the economy, but also on the level of “excess” growth in the health system.
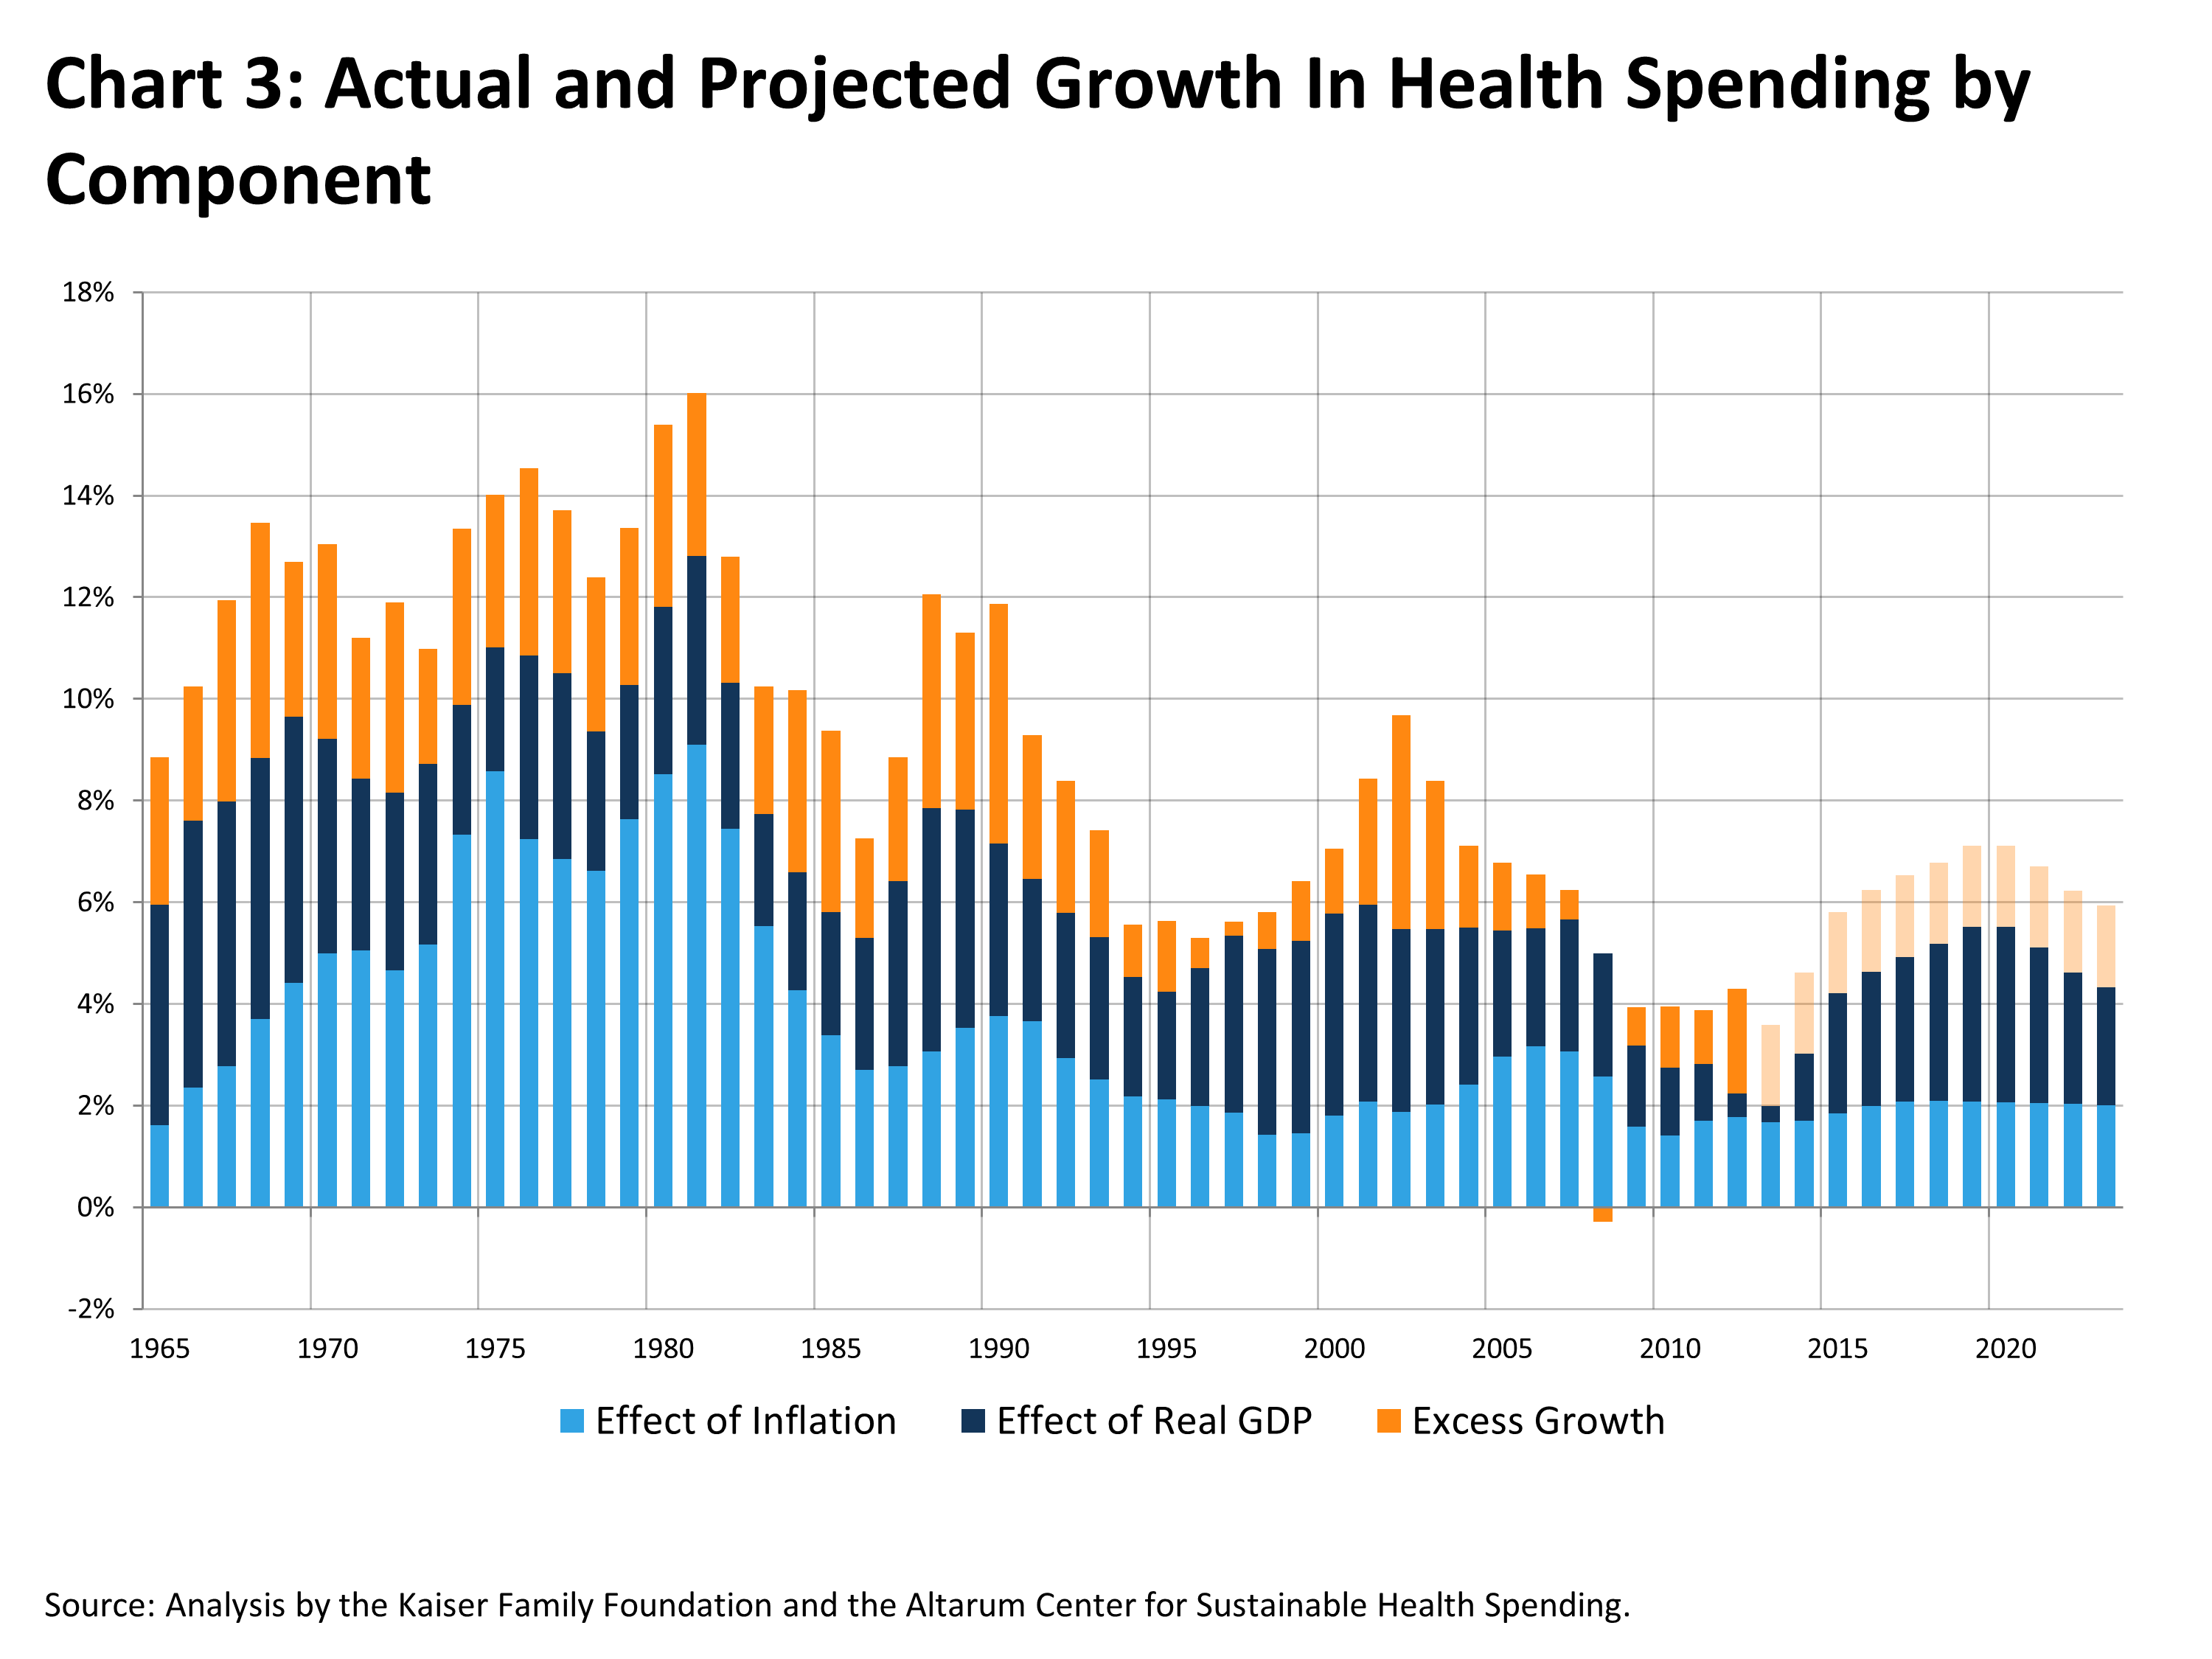
The stacked light and dark blue bars in Chart 3 show how health spending growth rates are expected to climb as inflation and especially GDP ramp up as the economy recovers. Our analysis suggests that the lagged effect of the economy alone – i.e., no change upwards or downwards in “excess” health costs – will gradually add 3.5 percentage points to the annual growth rate in health spending by 2019.
However, how fast health spending will ultimately grow also depends on the level of “excess” in the health system. If the “excess” rate of growth is 1.6 percentage points over the next 10 years – the average for the last 20 years and what preliminary estimates suggest it has been over the last couple of years – then health spending growth could remain roughly flat for the next couple of years but reach 7.1% by the end of the current decade (compared to an estimated 4.3% in 2012). This is illustrated by the orange bars in Chart 3. Even under this scenario, though, we would not see a return to the double-digit increases of the late 1980s and early 1990s, assuming inflation and real GDP growth remain relatively modest and “excess” health spending does not rise further.
National health expenditures totaled an estimated $2.8 trillion in 2012, so even a small difference in the growth rate can lead to substantial differences in spending over time. For example, lowering the growth rate by one percentage point on average over the next decade means that total health spending would be almost half a trillion dollars lower than expected 10 years from now.
These projections are intended to be illustrative rather than precise. They do not account for an expected one-time increase of two to three percentage points in health spending growth as more people become insured under the ACA. Nor do they explicitly include substantial future savings in Medicare under the ACA – or potential spillover to the private sector of Medicare pilot projects to reform delivery system incentives – which could help to hold the overall level of “excess” growth down. In fact, Medicare spending per capita is expected to grow slower than GDP per capita over the next decade.
Except for the ACA boost in 2014, our projections with a 1.6 percentage point “excess” growth rate track very closely on a year-to-year basis with those from the CMS Office of the Actuary.
Discussion
There has been much discussion recently about the causes of the historically low rate of growth we are now seeing in health spending, and more importantly, whether it will continue. This analysis will not settle that debate – especially about what the future holds — but will hopefully illuminate it.
There is a very strong statistical link between business cycles and inflation and national health spending. However, because the effect of economic activity on health prices and utilization is gradual and highly lagged, it is not always easy to discern the relationship by looking just at single year measures. In particular, the fact that health spending growth rates started to fall before the great recession, or continued to fall even after the recession ended, is not necessarily a demonstration that the recent slowdown is occurring for reasons other than what is happening generally in the economy.
Our analysis suggests that the vast majority (77%) of the recent decline in the health spending trend can be attributed to broader changes in the economy. At the same time, however, there are also indications that structural changes in the health system may be playing a modest role as well. “Excess” health growth in recent years has fallen to levels similar to the mid to late 1990s when managed care was spreading rapidly. This could be due to continuing changes in the way health care is delivered, but also to rising levels of patient cost-sharing in private insurance plans that discourage use of services. While discussions in the health community have focused more on changes in delivery, it is difficult to determine which of these developments is having a greater impact.
As the economy recovers, health spending is likely to trend upwards, though growth rates are unlikely to return to the double-digit levels we have seen in the past. Future health spending increases will also depend on whether “excess” health costs remain at the relatively modest level of recent years or return to the historical norm. History suggests that previous efforts to control health care costs have had only a temporary effect, and there are initial signs that the recent slowdown (independent of the effects of the economy) is beginning to wane.
Changes coming under the ACA could also affect these trends significantly. Increases in coverage will induce a modest, one-time bump of a couple percent in spending as people who were previously uninsured get insurance and better access to health services. This will likely coincide with an expected economic recovery, so higher growth rates in health spending due to that recovery should not be attributed to the ACA simply because of the coincidental timing.
On the other side of the ledger, the bulk of the Medicare savings included in the ACA – primarily achieved through smaller increases in payments to providers – have yet to be realized and will lower the future growth in spending in that program. Changes in the delivery system – through accountable care organizations (ACOs) and bundled payments to providers – may also yield results and help to keep “excess” health costs down in public programs, as well as in private insurance. In addition, the ACA’s tax on high cost, “Cadillac” employer-sponsored health plans, scheduled to take effect in 2018, is expected to trim the cost of benefits and could lead to lower overall health spending as well.
In fact, caution should be exercised in translating broad projections of total national health spending to effects on federal and state budgets. Many of the drivers of health spending overall affect Medicare and Medicaid as well, as reflected in CBO’s reduced estimates for future spending in those programs. At the same time, spending in these programs is also influenced heavily by legislated changes such as those in the ACA or that have been discussed in the context of federal deficit reduction proposals.
However, our analysis suggests that over time the economy is by far the biggest determinant of changes in health spending overall. Increases in health expenditures are likely to trend upwards over the coming decade as the economy returns to a more normal rate of growth. Sustaining low growth rates in health spending will require continued pressure for containing costs throughout the system.
This paper, as well as the analysis supporting it, was prepared by researchers at the Kaiser Family Foundation, including Larry Levitt and Gary Claxton; Charles Roehrig of the Altarum Institute’s Center for Sustainable Health Spending; and Thomas Getzen of the Fox School of Business at Temple University.
Notes:
1. The model was estimated in SAS using least squares regression with the Yule-Walker correction for autocorrelation. Results are presented below.
| Dependent Variable | National Health Expenditures |
| Intercept | 0.03% |
| Inf | 0.71* |
| Inf-1 | 0.28 |
| Inf-2 | 0.25 |
| rGDP | 0.20* |
| rGDP-1 | 0.23* |
| rGDP-2 | 0.16* |
| rGDP-3 | 0.28* |
| rGDP-4 | 0.40* |
| rGDP-5 | 0.23* |
2. See Getzen, T.E. Forecasting health expenditures: short, medium and long (long) term. Journal of Health Care Finance. 200; 26: 56-72.
3. To estimate “excess” growth in health spending, we adjust the coefficients in the statistical model so that they sum to 1.0 for the current and lagged inflation variables and for the real GDP variables. This assumes that health spending grows at the same rate as real GDP plus inflation, taking into account lagged effects. We measure “excess” health spending growth as the difference between actual spending growth and what this adjusted model would predict for any given year.