Trump Administration Actions to Curb Data Collection Related to Sexual Orientation and Gender Identity (SOGI)
On January 20, 2025, the first day of his second term, President Trump issued an executive order on “gender ideology” outlining how his administration would view sex and gender and incorporate these concepts into government. This executive order has had widespread implications across government and for federal grantees. One area that has been impacted is the federal government’s data collection efforts. This includes changes to questions about sexual orientation and gender identity (SOGI) in multiple federal surveys, and retreating from plans to incorporate SOGI questions in surveys of the U.S. population by the Census Bureau. While data collection on both sexual orientation and gender has been scaled back or modified, measures relating to gender identity have been more specifically targeted for deletion.
Although several national surveys and data sets have been affected by changes to SOGI data collection and availability, this brief focuses specifically on changes in three national surveys that are representative of these efforts: the National Health Interview Survey (NHIS), the Medicare Current Beneficiary Survey (MCBS), and the National Crime Victimization Survey (NCVS). These surveys are central to the federal government’s efforts to understand the health and well-being of the U.S. population overall (NHIS) and people with Medicare (MCBS) and to understand people’s experiences with criminal victimization (NCVS), and had the potential to meaningfully expand the knowledge base in these areas as they relate to the nearly 14 million U.S. adults who identify as LGBT, and particularly the over 2 million adults who identify as transgender. Limiting SOGI data collection in these and other federal surveys moving forward will present challenges for understanding and assessing the needs and experiences of the LGBTQ population in the U.S.
Overview of Surveys Examined and Adoption of SOGI Metrics
The NHIS, MCBS, and NCVS offer unique opportunities to better understand the experiences of people’s health and well-being. While not the only federal sources that have historically collected SOGI data, these three surveys represent distinct and policy-relevant opportunities for the collection and use of LGBTQ data. The NHIS has included SOGI measures that enable analyses of broad population health measures, including insurance coverage patterns and overall health status. The MCBS could offer rare insight into LGBTQ older adults—a population that is typically difficult to sample due to its relatively small size (just 1.8% of adults over 65 identify as LGBT, but this share is likely to grow larger over time). SOGI data were only recently added to MCBS. Finally, the NCVS has provided SOGI data that is particularly valuable for examining experiences of violence and discrimination, areas where disparities between LGBTQ and non-LGBTQ people have been well documented.
The National Health Interview Survey (NHIS), administered by the National Center for Health Statistics within the U.S. Centers for Disease Control and Prevention, is the largest and oldest national health survey in the U.S. and collects information on a broad range of topics including demographics, socioeconomic factors, health status, health care access, and health coverage. NHIS data provides in depth information across the population, and its size allows for comparisons across groups, including LGBT people.
Questions about sexual orientation were added to NHIS in 2013 and questions related to gender identity were added to the survey in 2022 on an experimental basis to develop a methodology. On adding a sexual orientation variable to the survey (at the time referred to as sexual identity) HHS wrote, “The objective of asking a question on sexual identity in the NHIS is to fill the tremendous gap that exists regarding knowledge of general health behaviors, health status, and health care utilization of LGBT persons.”
The Medicare Current Beneficiary Survey (MCBS), administered by the Centers for Medicare & Medicaid Services (CMS), is the government’s long-running, comprehensive, nationally representative survey of people with Medicare. The MCBS includes questions about beneficiaries’ health care use, health status, cost and payment issues, demographic and housing characteristics, experiences with care, and other domains.
Questions about sexual orientation and gender identity were added to the survey in 2023 to provide the opportunity to gain new knowledge about LGBTQ older adults and people with disabilities covered by Medicare. According to CMS at the time, “Including sexual orientation and gender identity questions on the MCBS will provide nationally representative data on topics such as the accessibility and utilization of health care services by the Lesbian, Gay, Bisexual, and Transgender (LGBT) populations and the resulting health disparities that impact this community. … In no instance have we identified another source of data that would be an effective substitute for the MCBS.” CMS also added an item asking Medicare beneficiaries about their experiences with discrimination from health care providers based on eight demographic factors, including race, language or accent, gender or gender identity, sexual orientation, age, culture or religion, disability, and medical history. This measure, according to CMS, would allow the agency “to capture the most actionable and impactful information about health care experiences that directly influence health outcomes and will provide CMS with additional measures for assessing health equity and fair treatment for underserved populations.”
The National Crime Victimization Survey (NCVS), administered by the Bureau of Justice Statistics within the U.S. Department of Justice, provides nationally representative data on criminal victimization, including frequency, characteristics, and consequences. Data are collected on both crimes reported to the police and crimes not reported. Demographic data is also collected from respondents along with experiences with the criminal justice system.
Questions about sexual orientation and gender identity were added to the survey in 2016. The NCVS included questions asking respondents about their sexual orientation, sex assigned at birth, gender identity, and a clarifying question used when there was a conflict between a respondent’s reported sex assigned at birth and gender identity.1 Two additional questions were asked among those who had been victimized about whether they believed it was due to “prejudice or bigotry” relating to gender identity or sexual orientation. In support of including these measures, DOJ wrote that they were “identified in other research as subgroups of interest to key stakeholders and, correlates to victimization. For example, sexual orientation and gender identity are recognized in the 2013 reauthorized Violence Against Women Act (VAWA). Additionally, the inclusion of these items will allow researchers to better understand the relationships between these variables and experiences with criminal victimization.”
Why Were SOGI Questions Added to Federal Surveys?
The inclusion of SOGI questions to federal surveys aligned with a range of efforts by the federal government to improve data collection related to sexual orientation and gender identity. Top of Form
The move to collect SOGI data within the federal government was recommended in a National Academies of Sciences Report: Understanding the Well-Being of LGBTQI+ Populations and received support from a number of researchers and advocates. Other activities that led to wider collection of this data include:
- Support in Healthy People 2010, 2020 and 2030 to increase collection of sexual orientation and gender identity data in population surveys.
- In 2016, the Office of Management and Budget (OMB) convened a Federal Interagency Working Group on Improving Measurement of Sexual Orientation and Gender Identity in Federal Surveys “to begin addressing the dearth of data for these populations and the issues surrounding methodological issues in collecting such data.”
- In 2022, pursuant to a Biden administration executive order, the OMB released a report on the best practices for sexual orientation and gender identity data collection in federal surveys.
- In 2023, the Biden administration developed a Federal Evidence Agenda on Lesbian, Gay, Bisexual, Transgender, Queer, and Intersex (LGBTQI+) Equity, a “roadmap for opportunities for the Federal Government to continue to build evidence and leverage data to advance equity for LGBTQI+ people.”
- Efforts within NIH to “Encourage data collection related to SGM [sexual and gender minority] populations in research and the health research workforce.” (Note the webpage for the NIH Sexual & Gender Minority Research Office hasbeen removed under the Trump Administration, likely also a part of broad efforts to align with the Executive Order discussed here).
How SOGI Data Collected in NHIS, MCBS, and NCVS Has Been Used
NHIS
The NHIS data on gender identity and sexual orientation has been used to track insurance coverage among LGBTQ people, including by KFF. Additionally, NHIS SOGI measures have allowed researchers to explore population level disparities among sexual minorities including: examining substance use and sleep problems by sexual orientation and assessing food insecurity, mental health, and health care access, as well as experiences with intersectional disparities.
MCBS
SOGI questions were added to the MCBS in 2023 and were initially released to researchers with approved data use agreements who purchased an “early release” version of the 2023 MCBS Survey File in the fall of 2024 from CMS – about 9 months before the full year of 2023 MCBS Survey File data were made available in July 2025. As such, SOGI data collected in the MCBS have not yet been widely utilized by researchers. Additionally, KFF found that the number of Medicare beneficiaries who identified as transgender in the early release file (the only file to include this data) was too small to generate a reliable estimate. Without data on gender identity in future years, researchers will be unable to pool multiple years of data to produce a more robust sample, as is sometimes done in research with LGBTQ groups in other contexts when necessitated by limited sample sizes.
NCVS
NCVS data has been used to understand the victimization experiences of teens and adults, including LGBTQ people. NCVS has been used to provide representative estimates on transgender people’s experiences specifically. Research has examined the forms of violence experienced by gender identity and sexual orientation. Experiences of victimization among LGBT people have also been examined to assess intersecting factors such as age, race/ethnicity, and relationship to the assailant, alongside comparison to non-LGBT people.
Recent Changes to SOGI Data in Federal Surveys
The Trump administration’s January 2025 Executive Order (EO) 14168 on “gender ideology” required federal agencies to “remove all statements, policies, regulations, forms, communications, or other internal and external messages that promote or otherwise inculcate gender ideology.” With these actions, the Trump administration sought to promote a view of sex as a binary biological concept and to disavow the notion of gender identity – the internal sense and experience of being male, female, transgender, non-binary or something else. Operating under this directive, the federal government undertook an effort to remove gender-identity related content from federal surveys and modify certain content related to sexual orientation and sex in early 2025.
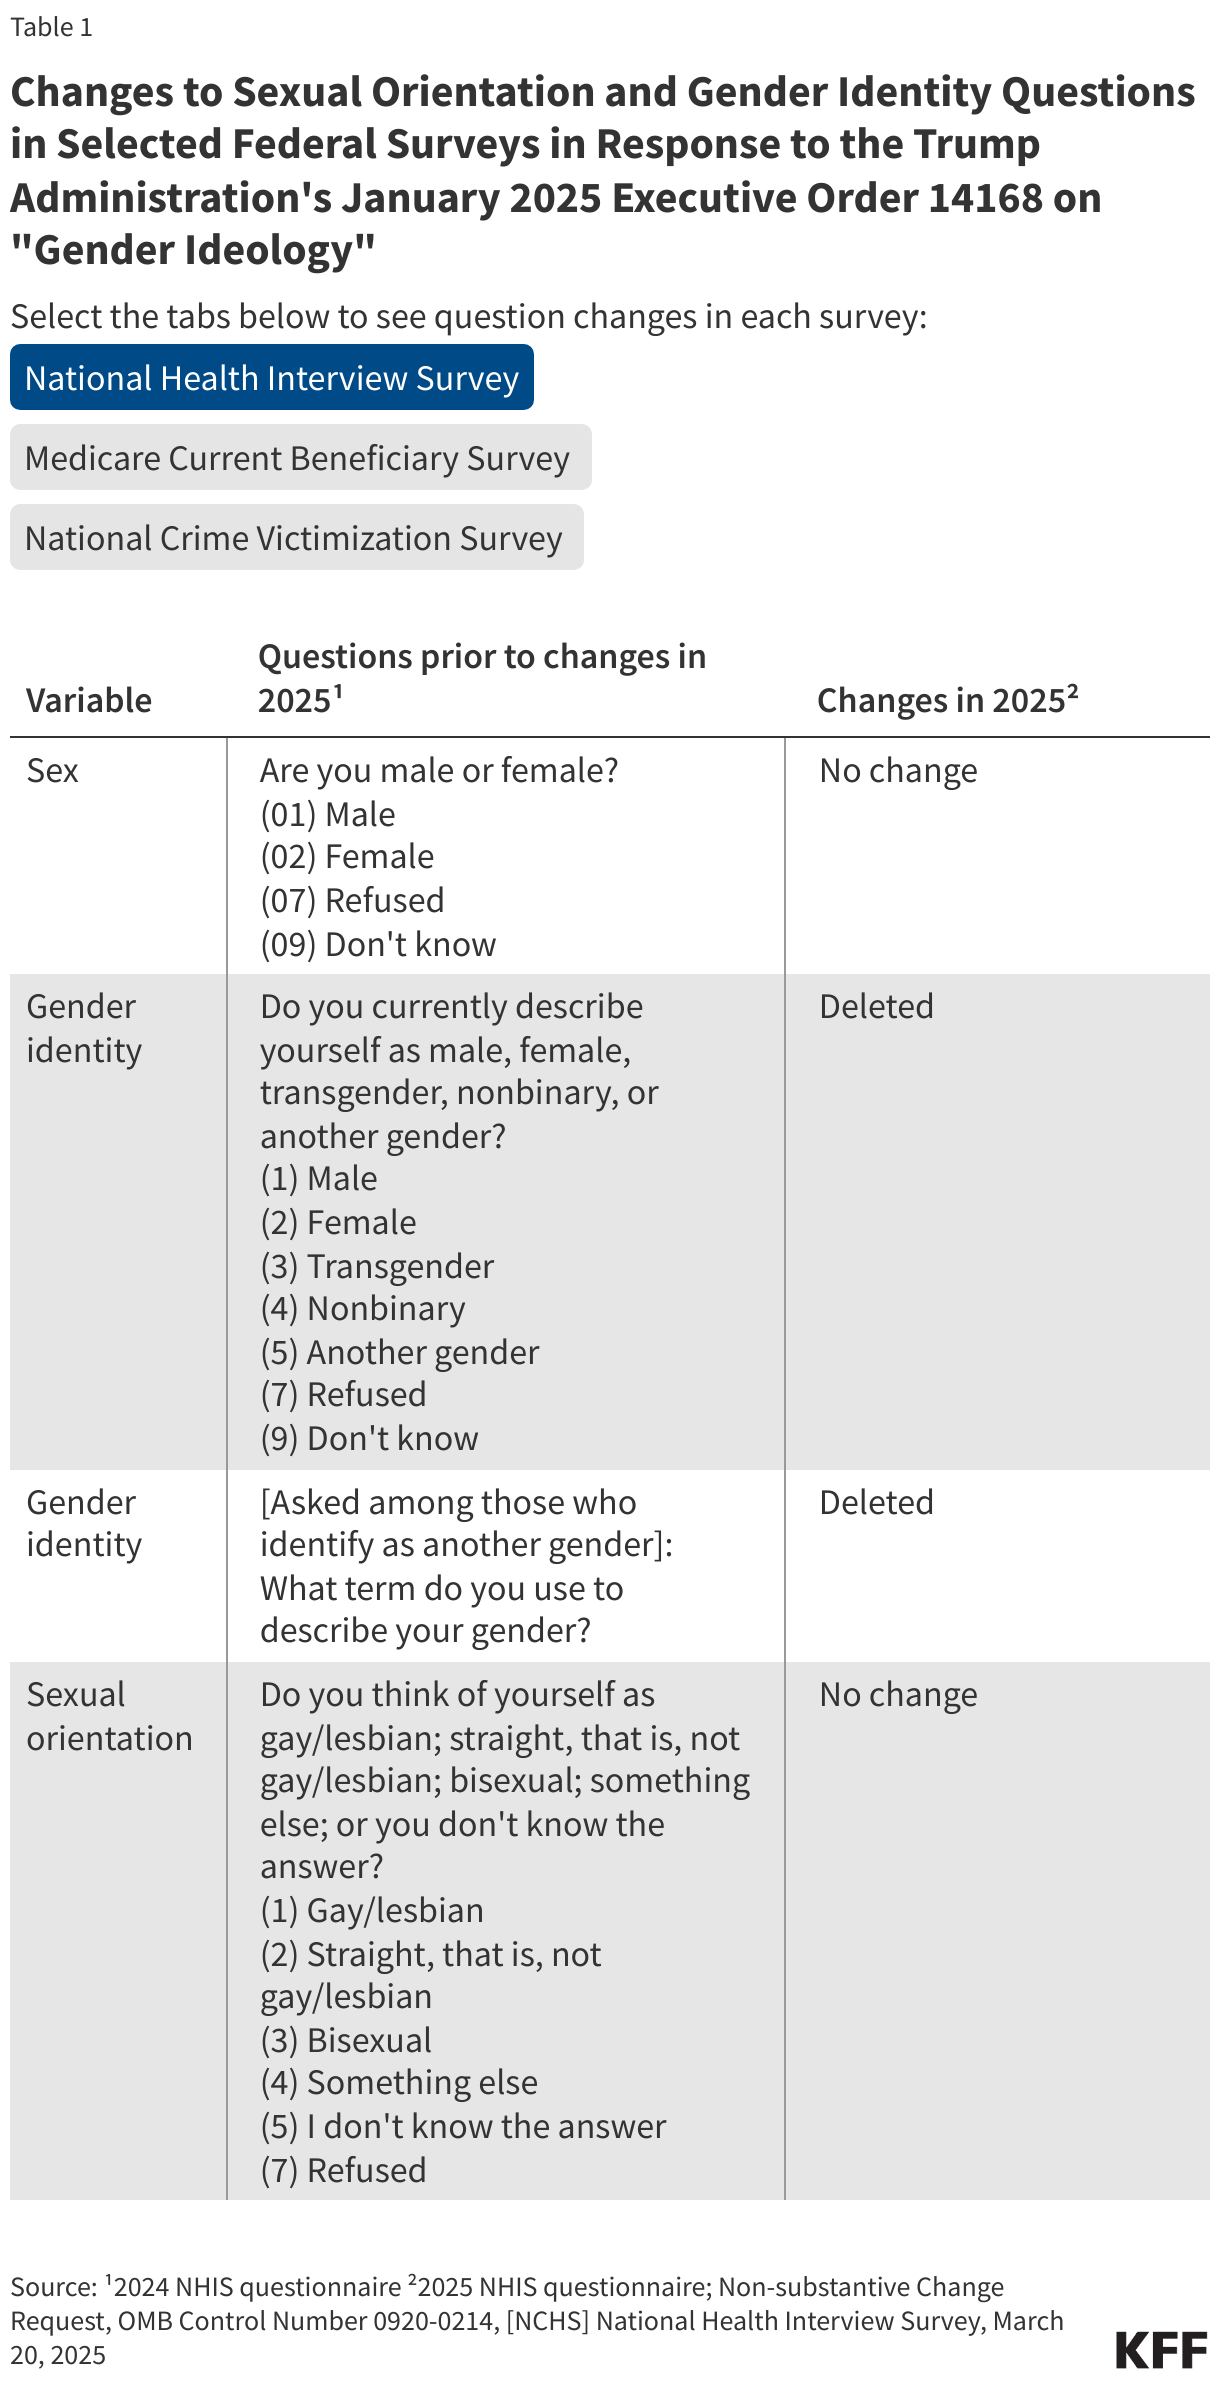
The federal agencies responsible for administering NHIS, MCBS, and NCVS specifically cited EO 14168 in their rationale when requesting changes from the Office of Management and Budget. The changes made to these variables in NHIS, MCBS, and NCVS are as follows (see Table 1 for full question wording, changes, and sources):
NHIS
Modifications were made to the gender identity question but not the sexual orientation question. The specific changes include:
- removing a question asking about the respondent’s gender identity
- removing the follow-up question where a respondent who selected “something else” could provide a verbatim response to describe their gender identity in their own words
MCBS
Changes were made to the series of SOGI questions, including:
- removing a question asking about the respondent’s gender identity,
- removing a question asking respondents to report their sex assigned at birth on their original birth certificate and replacing it with a question asking the respondent to report their sex (without providing additional information on how to consider the question),
- removing “something else” as a response option to a question about the respondent’s sexual orientation,
- removing the follow-up question where a respondent who selected “something else” could provide a verbatim response to describe their sexual orientation in their own words, and
- removing a question related to the respondent’s experiences with unfair or insensitive treatment from health care providers based on several demographic factors, including their sexual orientation and their gender or gender identity.
NCVS
Modifications were made to most of the gender identity questions but not the sexual orientation questions, including:
- removing a question asking about the respondent’s gender identity,
- removing a question asking respondents to report the sex assigned at birth on their original birth certificate,
- removing a question seeking clarification related to gender identity (asked when sex assigned at birth and gender identity do not align),
- temporarily pausing and then reinstating a question related to whether respondents who had been victimized believed it was due to prejudice or bigotry relating to gender identity, and
- removing training material information on the above questions.
Implications of the Survey Changes
Deleting and modifying questions related to sexual orientation and gender identity from federal surveys will leave gaps in researchers’ ability to understand and analyze the experiences of LGBTQ people, including the challenges they face and their health problems; diminish the ability of policymakers to identify and address health discrimination and equity issues for the population; and limit the information available to health care provider trying to improve care for LGBTQ people and eliminate barriers to care. Limiting data collection related to LGBTQ people and experiences with violence and victimization may also lead to challenges with addressing unmet need in that area. As LGBTQ people face persistent disparate experiences with stigma, discrimination, and victimization, as well as health (including mental health) disparities, across the lifespan, losing access to this federal data is particularly notable.
Because transgender people make up a very small share of the U.S. population overall, it may be difficult for the private and nonprofit sectors to make up for the loss of data from large federal surveys in non-governmental nationally representative surveys, which rarely have a large enough sample size to be able to pull out the experiences of this group. National surveys, with large sample sizes, had started to fill some of that gap. The challenge is especially acute when trying to understand the experiences of a segment of the transgender community. For example, given that only a small share of older adults identifies as LGBTQ and an even smaller share identify as transgender, maintaining the gender identity variable in the MCBS would have provided an opportunity to understand the experiences of a population that would otherwise be very difficult and/or very costly to sample through traditional surveys.
The Trump administration’s rolling back of data collection related to gender identity, and to some extent sexual orientation, marks a decline in the capacity of the federal government to measure the experiences of LGBTQ people. The full implications for data users, providers, policymakers, and communities will continue to unfold, and ongoing assessment could help clarify the effects of deleted or modified SOGI measures in federal surveys.
- Asking about both biological sex assigned at birth and gender identity provides a method for identifying people who might identify as male or female rather than as transgender, but who were assigned a different sex on their original birth certificate. This two-step approach to measuring gender identity is a recommended best practice. ↩︎