Medicaid Enrollment and Spending Growth Amid the Unwinding of the Continuous Enrollment Provision: FY 2023 & 2024
Key Takeaways
For a three-year period following the onset of the COVID-19 pandemic, states provided continuous Medicaid enrollment in exchange for an increase in the federal share of Medicaid spending (known as the Federal Medical Assistance Percentage or “FMAP”). This policy increased Medicaid enrollment and helped decrease the uninsured rate. While total Medicaid spending also increased during the pandemic, a KFF analysis found that Medicaid spending from state and other non-federal sources remained comparable to pre-pandemic levels due to the increased federal financing. The Consolidated Appropriations Act (CAA) ended the continuous enrollment provision as of March 31, 2023 and allowed states to begin disenrolling individuals from Medicaid as early as April 2023. The CAA also phases down the enhanced federal matching funds through December 2023 if states comply with certain rules. Though the month in which states began disenrollments varied, most disenrollments will occur in state fiscal year (FY) 2024 (which ends on June 30 for most states1 ) and millions of individuals have already been disenrolled. Considerable uncertainty remains, however, as to how Medicaid enrollment will change as “unwinding” continues and how those enrollment changes, along with the enhanced FMAP phase-down, will impact Medicaid spending.
This brief analyzes Medicaid enrollment and spending trends for FY 2023 and FY 2024, based on data provided by state Medicaid directors as part of the 23rd annual survey of Medicaid directors. Forty-eight states (including the District of Columbia) responded to the 2023 survey,2 although response rates for specific questions varied. The methodology used to calculate enrollment and spending growth can be found at the end of the brief. Most officials indicated that their enrollment and spending projections reflect what is assumed in their states’ adopted budgets, though estimates are uncertain and the effects of unwinding are evolving, with significant variation across states. Key survey findings include the following:
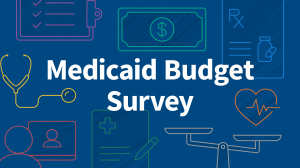
- Medicaid enrollment growth slowed to 6.5% in FY 2023 (down from 8.4% in FY 2022). Although estimates are uncertain, Medicaid officials projected enrollment would decline by 8.6% in FY 2024. After reaching record high enrollment, these estimates reflect a dramatic year-over-year decline in program enrollment from that high. Enrollment change estimates for FY 2024 reflect new enrollments as well as coverage losses due to unwinding, but they also assume some “churn” – that is, that some individuals losing coverage will re-enroll within the year. This “net” enrollment change estimate differs from other unwinding projections that estimate cumulative disenrollments without offsetting new enrollments and re-enrollments. The continuous enrollment provision and its subsequent unwinding were the most significant drivers of enrollment trends cited by survey respondents.
- State Medicaid officials reported total Medicaid spending (including both federal and state funds) slowed to 8.3% in FY 2023 (down from a peak of 9.8% in FY 2022) and projected total Medicaid spending will slow further in FY 2024 to 3.4%. States identified changes in enrollment as the most significant driver of total expenditure changes.
- States reported that the phase out and eventual end of the enhanced FMAP will shift the state and federal spending shares for Medicaid as state spending grows faster to make up for the declining federal share. Responding state Medicaid agencies reported that state (non-federal) spending grew by 13.0% FY 2023 and was projected to increase by 17.2% in FY 2024, even as total spending growth rates slow. State spending on Medicaid declined in FY 2020 and FY 2021 due to the pandemic-era enhanced FMAP. A few states reported that the phase out of other pandemic era federal funding and changes in the regular FMAP formula were also contributing factors to higher state spending growth.
Context
Medicaid represents $1 out of every $6 spent on health care in the U.S. and is the major source of financing for states to provide health coverage and long-term services and supports for low-income residents. Medicaid is administered by states within broad federal rules and jointly funded by states and the federal government through a federal matching program with no cap. Medicaid is a counter-cyclical program, meaning that more people become eligible and enroll during economic downturns. At the same time, states may face declines in revenues that make it difficult to finance the state share of funding for the program. After peaking following the implementation of the ACA, Medicaid enrollment and total spending growth slowed or declined in the ensuing years, likely due to improving economic conditions and restrictions permitted under the Trump Administration.
The onset of the COVID-19 pandemic and its economic impact had significant implications for Medicaid enrollment and spending. As in past economic downturns, the federal government provided additional financial assistance to states during the pandemic to help them maintain their Medicaid programs. Federal legislation prohibited states from disenrolling people from Medicaid in exchange for enhanced federal matching funds, and as a result, Medicaid enrollment grew to 94.5 million, an increase of 23.1 million or 32.4% between February 2020 and April 2023. Total Medicaid spending reached $804 billion in federal fiscal year 2022, with 29% financed by states and 71% paid by the federal government – a somewhat higher federal share than in recent years due to the pandemic-related enhanced FMAP.
State economic conditions worsened rapidly when the pandemic hit in March 2020 but recovered quickly compared to past recessions. National economic indicators such as initial unemployment claims and the unemployment rate spiked early in the pandemic but returned to pre-pandemic levels by 2022. State revenue collections followed a similar pattern, declining early in the pandemic and then rebounding. Most states saw strong revenue collections in FY 2021 and FY 2022, with revenue growth in the double digits collectively across states. Many states took the opportunity to make one time investments, enact tax cuts, build reserves, and pay down debts, with rainy day funds reaching historic levels. These favorable state fiscal conditions combined with federal fiscal relief mitigated the need for the widespread state spending cuts that occurred in prior recessions.
Fiscal conditions in most states remained strong in FY 2023, but growth in revenue collections slowed and states expressed concerns regarding their longer-term fiscal outlook. After adjusting for inflation, FY 2023 state general fund spending grew 4.4% compared to 8.1% in FY 2022. Although states had projected that revenue collections would decline in FY 2023, revenue collections outperformed projections in most states. Heading into FY 2024, many states appear be in strong fiscal positions and have built up reserve funds, but inflationary pressures, changes in consumer consumption, stock market volatility, tapering federal fiscal relief, and the impact of tax cuts on revenue collections have all added pressure and uncertainty to the state budgeting process. While there has been recent optimism that a recession will be avoided as inflation cools and job indicators remain strong, state revenue collections have started to slow or decline, and some states may have to contend with budget gaps in the coming years. According to governors’ proposed budgets for FY 2024, states together are expecting state general fund spending growth to slow (2.5% growth) and revenue growth to decline (by 0.7%).
Trends in Enrollment Growth FY 2023 and FY 2024
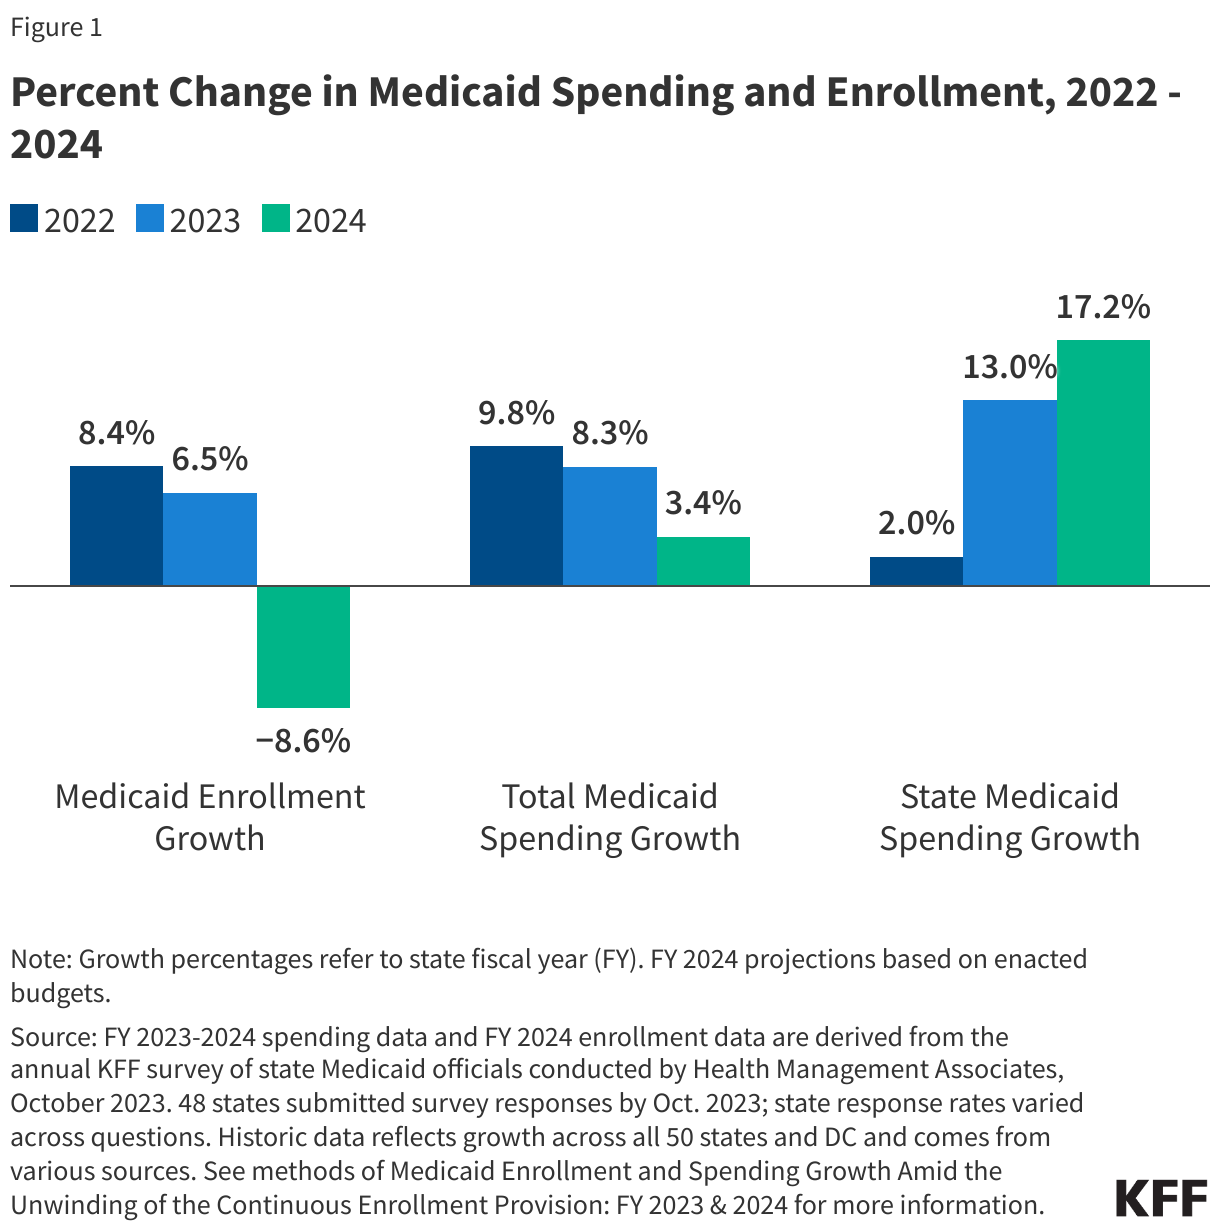
Medicaid enrollment grew more slowly in FY 2023 and is expected to decline in FY 2024 due to the unwinding of the continuous enrollment requirement (Figure 2). Following the onset of the COVID-19 pandemic and start of the Medicaid continuous enrollment provision, enrollment rose sharply in FY 2021 (11.1%) and continued to grow, though more slowly, in FY 2022 (8.4%) and FY 2023 (6.5%). The continuous enrollment provision ended March 31, 2023, and most states began Medicaid disenrollments in late FY 2023 (though some did not start until FY 2024). Throughout the unwinding, states will redetermine eligibility for all Medicaid enrollees and will disenroll those who are no longer eligible or who may remain eligible but are unable to complete the renewal process. Responding state Medicaid agencies project total Medicaid enrollment will decline by 8.6% in FY 2024. After reaching record high enrollment, these estimates reflect a dramatic year-over-year decline in program enrollment from that high. The FY 2024 projection reflects the net Medicaid enrollment change from FY 2023 to FY 2024 including new enrollments, coverage losses due to unwinding, and some “churn” when those who lose coverage re-enroll within the year. Estimates of both enrollment and spending are uncertain, and the effects of unwinding are evolving, with significant variation across states.
While the largest driver of enrollment trends continues to be the continuous enrollment provision and its subsequent unwinding, state Medicaid agencies also reported eligibility policy changes as an upward pressure. While unwinding was expected to result in enrollment declines, many states (almost a third of responding states in FY 2023 and nearly three-quarters in FY 2024) mentioned eligibility expansions were putting upward pressure on enrollment. Most of the reported expansions, however, are narrow in scope and not expected to fully offset the magnitude of enrollment declines expected during unwinding. The most frequently reported changes were the adoption of a new option to extend Medicaid postpartum coverage to 12 months and the new federal requirement, beginning January 2024, for all states to adopt 12-month continuous eligibility for Medicaid and Children’s Health Insurance Program (CHIP) children. (About half of states provide 12-month continuous eligibility already.) A small number of states also noted adopting the ACA Medicaid expansion or changes in eligibility policy for justice-involved populations, lawfully present or state-funded coverage of undocumented immigrants, and foster care youth who age out of foster care. A few states reported that a strong economy put downward pressure on enrollment.
Trends in Spending Growth FY 2023 and FY 2024
After peaking in FY 2022 at 9.8%, total Medicaid spending growth slowed to 8.3% in FY 2023 and is expected to slow further to 3.4% in FY 2024 (Figure 2). Spending growth increased sharply when the pandemic began in FY 2020 and continued to increase in FY 2021 and FY 2022. Most responding states (8 in 10) noted that Medicaid projections (for FY 2024) reflect the assumptions used in the state’s adopted budget; however, a few states noted projections reflect more recent assumptions and others mentioned outdated assumptions (e.g. from governor’s budget) or that their budget had not yet been approved. State Medicaid agencies reported enrollment changes as the most significant factor driving changes in total Medicaid spending. For FY 2024, the total spending growth rate is projected to slow further, and the majority of states pointed to declines in enrollment during unwinding as the most significant downward pressure. Beyond enrollment growth, about half of the responding states cited provider rate increases as an upward pressure on spending in FY 2023 and FY 2024. States noted that inflation and workforce shortages were driving higher labor costs, resulting in pressure to increase provider rates. A few states also noted expanded eligibility or benefits, utilization increases, home and community-based services (HCBS) spending, directed or supplemental payments, and/or increasing pharmacy costs were putting upward pressure on total spending. Conversely, a few states reported decreased nursing facility utilization, lower per member costs during the continuous enrollment period, pharmacy rebates, and/or MCO risk corridors as downward pressures on total spending.
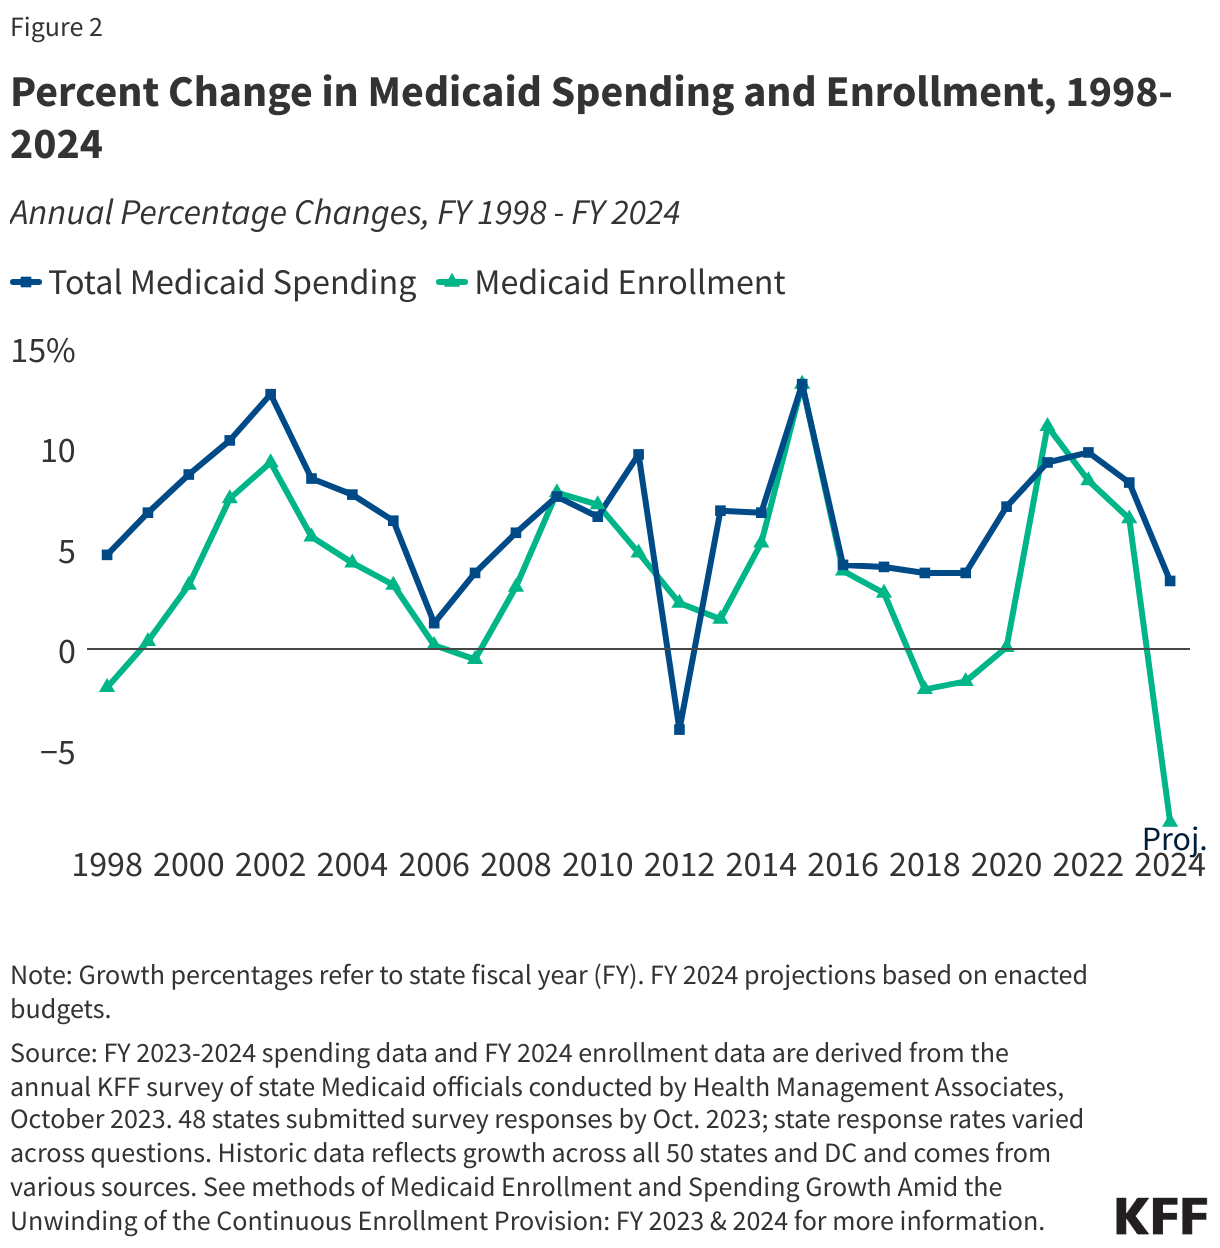
State Medicaid spending growth increased in FY 2023 and is projected to increase further in FY 2024 as the enhanced FMAP expires (Figure 3). The state share of Medicaid spending typically grows at a similar rate as total Medicaid spending growth unless there is a change in the FMAP. During the Great Recession, state spending for Medicaid declined in FY 2009 and FY 2010 due to fiscal relief from a temporary FMAP increase provided in the American Recovery and Reinvestment Act (ARRA). State spending increased sharply when that fiscal relief ended. This pattern has repeated during the pandemic, with state Medicaid spending declining in FY 2020 and FY 2021, then increasing but at a slower rate than total spending in FY 2022 due to the pandemic-era enhanced FMAP. The rate of state spending growth in FY 2023 (13.0%) surpassed the rate of total spending growth (8.3%), with states noting the continuation of elevated enrollment even as the enhanced FMAP phase out began at the end of the fiscal year. A few states also reported additional pressure on state spending from changes in their regular FMAP formula and/or the end of the enhanced FMAP for HCBS implemented as part of the American Rescue Plan Act (ARPA). As the pandemic related enhanced FMAP phases completely out in FY 2024, the rate of state spending growth is expected to increase further (to 17.2%) as total spending growth continues to slow (3.4%).
What to watch?
The unwinding of the Medicaid continuous enrollment provision and phase-down of the enhanced FMAP are expected to have a significant impact on Medicaid enrollment and spending in FY 2024. While a great deal of uncertainty remains related to how Medicaid enrollment will change over the course of the unwinding, KFF analysis of state data finds that millions of people have already been disenrolled from Medicaid. Almost three-quarters of disenrollments so far have been for paperwork or procedural reasons, raising concerns that many people who remain eligible for Medicaid may be losing coverage. As noted above, state Medicaid agencies reported enrollment changes as the most significant factor driving changes in total Medicaid spending. States also mentioned challenges anticipating the acuity of members that will remain on the program after the unwinding and the share of individuals that will churn back on the program after disenrolling. In addition, CMS oversight that has resulted in reinstatement of coverage for some enrollees as well pauses in procedural disenrollments may affect the pace of unwinding and the magnitude of disenrollments. Significant variation in state unwinding policies (including the adoption of federal unwinding waivers) as well as variations in state administrative capacities and systems limitations are also likely to contribute to differing state enrollment and spending results related to unwinding.
While most states at the time of the survey reported favorable state fiscal conditions, over half of responding states noted an uncertain fiscal outlook. Most states were not anticipating state revenue shortfalls and no states reported active budget cuts at the time of the survey. However, some state Medicaid agencies did report being asked to focus on budget neutral program changes or to identify cost containment initiatives that could improve quality while reducing spending, though this is often routine in many states regardless of fiscal condition. In addition to the unwinding, macroeconomic uncertainties (e.g., inflationary pressures and workforce challenges) and the loss of the enhanced FMAP and other expiring federal pandemic relief all add pressure and uncertainty to the Medicaid budgeting process, and by extension, to the state budgeting process as Medicaid is a significant part of state budgets as both a spending and revenue source. Many Medicaid officials are therefore looking ahead cautiously knowing that they must be prepared to rapidly respond to worsening economic conditions, if and when they occur.
Methods
Definition of Medicaid Spending. Total Medicaid spending includes all payments to Medicaid providers for Medicaid-covered services provided to enrolled Medicaid beneficiaries. Medicaid spending also includes special disproportionate share hospital (DSH) payments that subsidize uncompensated hospital care for persons who are uninsured and unreimbursed costs of care for persons on Medicaid. Total Medicaid spending does not include Medicaid administrative costs and federally mandated state “Clawback” payments to help finance the Medicare Part D prescription drug benefit for Medicaid beneficiaries who are also enrolled in Medicare. States are also asked to exclude costs for the Children’s Health Insurance Program (CHIP). Total Medicaid spending includes payments financed from all sources, including state funds, local contributions, and federal matching funds. Historical state Medicaid spending refers to all non-federal spending, which may include local funds and provider taxes and fees as well as state general fund dollars.
Methodology. KFF commissioned Health Management Associates (HMA) to survey Medicaid directors in all 50 states and DC to identify and track trends in Medicaid spending, enrollment, and policymaking. Given differences in the financing structure of their programs, the U.S. territories were not included in this analysis. This is the 23rd annual survey, conducted at the beginning of each state fiscal year from FY 2002 through FY 2024. The KFF/HMA Medicaid survey for this report was sent to each Medicaid director in June 2023. Forty-eight states provided survey responses by October 2023. The three states that did not respond by this time are Florida, Minnesota, and South Carolina.
For FY 2023 and FY 2024, annual rates of growth for Medicaid spending were calculated as weighted averages across all states. Forty-eight states reported Medicaid expenditure growth rates for FY 2023, and 47 states reported Medicaid expenditure growth rates for FY 2024. Weights for spending were derived from the most recent state Medicaid expenditure data for FY 2022, based on estimates prepared for KFF by the Urban Institute using CMS Form 64 reports, adjusted for state fiscal years. These CMS-64 data were also used for historic Medicaid spending and include all 50 states and DC. For FY 2018 and 2019, spending for New York was adjusted to reflect unexplained anomalies in the state spending on the CMS-64 data.
The average annual Medicaid enrollment growth rate for FY 2024 was calculated using weights based on Medicaid and CHIP preliminary monthly enrollment data for June 2023 published by CMS. For FY 2024, 40 states reported Medicaid enrollment growth rates. The data reported for FY 2023 and FY 2024 for Medicaid spending and FY 2024 for Medicaid enrollment are weighted averages, and therefore, data reported for states with larger enrollment and spending have a greater effect on the national average.
Historical enrollment trend data for FY 1998 to FY 2013 reflects the annual percentage change from June to June of monthly enrollment data for Medicaid beneficiaries collected from all states and DC. Enrollment trend data for FY 2014 to FY 2023 reflects growth in average monthly enrollment based on KFF analysis of the Medicaid & CHIP Monthly Applications, Eligibility Determinations, and Enrollment Reports from CMS for all 50 states and DC. Note that several states have revised monthly enrollment data as far back as June 2017 to better align with reporting criteria for the CMS, Medicaid & CHIP Monthly Applications, Eligibility Determinations, and Enrollment Reports. Data for months prior to June 2017 have not been revised and may use slightly different criteria for reporting monthly enrollment and generally result in larger enrollment totals.