KFF designs, conducts and analyzes original public opinion and survey research on Americans’ attitudes, knowledge, and experiences with the health care system to help amplify the public’s voice in major national debates.
On July 23, 2026, the Department of Health and Human Services (HHS) finalized revisions to regulations implementing Title VI of the Civil Rights Act of 1964 to eliminate disparate impact as a basis for determining whether discrimination has occurred in programs, services, or activities receiving HHS federal financial assistance. It was issued following Executive Order 14281, “Restoring Equality of Opportunity and Meritocracy,” and similar actions by other federal agencies, including the Department of Justice (DOJ), Department of Education (DOE), and Department of Housing and Urban Development (HUD). This issue brief provides background on Title VI, summarizes the key changes in the 2026 final rule, and discusses the potential implications for racial and ethnic health disparities.
The rule marks a significant change in the federal government’s approach to enforcing civil rights protections, which may have significant implications for its enforcement of civil rights law and health and health care disparities. The changes under the rule narrow the scope for administrative enforcement of civil rights law; may allow for policies and practices that lead to disparate outcomes in health and health care to remain in place, which may exacerbate disparities; and may reduce proactive review of whether policies and practices have unintended disproportionate effects on certain racial or ethnic or other protected groups.
Overview of the HHS Title VI Civil Rights Rule
Title VI of the Civil Rights Act of 1964 is a federal law that prohibits discrimination based on race, color, or national origin in programs and activities receiving federal financial assistance. It was enacted during the Civil Rights Movement in response to widespread racial discrimination by institutions receiving federal funds, including hospitals that refused to treat Black patients, maintained segregated wards and waiting rooms, or otherwise provided unequal care. Title VI has since served as a cornerstone of federal civil rights enforcement across health care, education, and other federally funded programs.
While the Supreme Court has interpreted Title VI to prohibit intentional discrimination, federal agencies historically implemented broader protections against discrimination through regulations. In its initial regulations implementing Title VI, HHS (then the Department of Health, Education and Welfare) and other federal agencies also prohibited disparate-impact discrimination. Disparate impact refers to policies or practices that have a disproportionately adverse effect on people of a particular race, color, or national origin, even when there is no evidence of intentional discrimination. These regulations recognized that facially neutral policies can perpetuate or exacerbate inequities in access to programs, services, and benefits.
In health care, disparate impact can arise from inequities embedded in institutional policies and practices, although intentional discrimination still persists. For example, historical discriminatory policies, such as redlining, have lasting effects today, leading to residential segregation of Black and Hispanic people into urban neighborhoods with more limited resources and increased health risks. Within medicine, disproven beliefs about biological differences by race persist today and have led to race permeating clinical decision making and treatment in multiple ways, including through its use in clinical algorithms, tools, and treatment guidelines. Similarly, language barriers can reduce the quality of care patients receive and increase the risk of adverse outcomes or medical errors. Studies have found that inadequate language assistance can delay patients’ access to timely care and contribute to suboptimal care and dissatisfaction with the care received, leading to poor chronic disease management and resulting in worse health outcomes.
The federal government has used disparate-impact regulations for over 50 years to investigate and resolve policies and procedures of recipients of federal financial assistance that disproportionately negatively affect a protected group. For example:
HHS’s Office for Civil Rights (OCR) investigated the proposed closure of University of Pittsburgh Medical Center (UPMC) Braddock, a hospital serving a predominantly Black community in Pennsylvania, to assess whether the closure would have a disparate impact on Black residents’ access to care. The investigation resulted in a voluntary resolution agreement requiring UPMC to implement measures to reduce potential barriers to care, including expanded transportation services, enhanced primary care and behavioral health services, and ongoing monitoring of the closure’s impact on the affected community.
Similarly, OCR entered into a voluntary resolution agreement with Mee Memorial Hospital (MMH) following an investigation into allegations that the hospital had failed to provide meaningful language assistance to Triqui-speaking patients with limited English proficiency (LEP). Although the hospital was not intentionally withholding services from Mexican indigenous patients, it’s lack of language assistance disproportionately prevented them from receiving effective care. The agreement required the hospital to strengthen its language access policies, interpreter services, staff training, and monitoring.
More recently,in 2021, HHS’s OCR and the DOJ investigated the Alabama Department of Public Health (ADPH) over concerns that its wastewater and public health practices disproportionately burdened Black residents of Lowndes County. The agencies reached an interim resolution agreement requiring ADPH to take steps to address the community’s longstanding exposure to raw sewage, including improving access to functioning septic systems, suspending criminal enforcement against residents unable to afford compliant systems, and strengthening public health data collection and infrastructure planning. In 2024, HHS and DOJ reported progress in implementing these reforms. However, in April 2025, the Trump Administration terminated the agreement, ending the federal agencies’ enforcement of the reforms.
Disparate-impact standards have also shaped HHS guidance to recipients about designing and administering programs and policies. For example, HHS issued guidance on serving individuals with LEP explaining that recipients could violate Title VI by using criteria or methods that had the effect of discriminating based on national origin and translated this standard into expectations for providing meaningful access to care. HHS’s Office of Minority Health (OMH) National Culturally and Linguistically Appropriate Services (CLAS) Standards also reflect principles underlying disparate-impact protections, particularly in their language access standards. During the COVID-19 pandemic, HHS’s OCR issued guidance advising that Title VI applied to procedures, criteria, and methods of administration that have a disparate impact based on race, color or national origin. The guidance specifically identified examples of disparate-impact discrimination that could arise in COVID-19 vaccination programs, such as requirements for vaccines to be distributed solely through pharmacies or appointments needing to be scheduled online, which could disproportionately limit access in communities of color, even in the absence of discriminatory intent. HHS also advised vaccine providers to review policies for barriers, collect and analyze demographic data, address language and transportation barriers, and locate vaccination sites in historically underserved communities. HHS also incorporated disparate-impact principles into a training curriculum for medical students by including examples of facially neutral health care policies that could disproportionately limit access for racial and ethnic communities and instructing participants to consider whether less discriminatory alternatives could achieve the same objectives.
Potential Implications of Eliminating Disparate Impact Enforcement
The 2026 final rule eliminates disparate impact as a basis for administratively enforcing Title VI under HHS’s implementing regulations. Under the revised regulations, HHS will enforce Title VI only when there is evidence of intentional discrimination based on race, color, or national origin. As a result, a policy or practice that disproportionately affects a protected group, by itself, is no longer sufficient to establish a violation of Title VI under HHS regulations. HHS states that these revisions are intended to align its regulations with the text of Title VI, Supreme Court precedent, and Executive Order 14281, “Restoring Equality of Opportunity and Meritocracy,” issued by President Trump on April 23, 2025, directing federal agencies to eliminate the use of disparate-impact liability. The final rule also clarifies that statistical evidence showing racial or ethnic disparities may still be considered as part of an investigation, but disparities alone are not sufficient to establish discrimination absent evidence of intentional discriminatory treatment.
The 2026 final rule marks a shift in HHS’s approach to investigating and resolving Title VI complaints and will likely have a range of implications for enforcement of civil rights law and health disparities. The changes under the rule:
Narrow the scope for administrative enforcement of civil rights law. The rule changes what the federal government will identify as discrimination in its activities and investigations since the federal government will no longer enforce policies and procedures that result in disparate effects for protected groups but cannot be tied to intentional discrimination. Moreover, parties seeking administrative enforcement of the law will face a higher burden to demonstrate discrimination, since they must be able to show intentional discrimination.
May allow for policies and practices that lead to disparate outcomes in health and health care to remain in place, which may exacerbate disparities. As noted, even in the absence of intentional discrimination, policies and procedures may lead to disparate impact for protected groups. For example, hospital or clinic closures; reductions in obstetric, behavioral health, or specialty services; provider network changes; transportation or service relocation decisions; eligibility or enrollment procedures; lack of effective language access services; and resource allocation decisions may lead to or exacerbate disparities because of longstanding differences in where individuals live and the resources they have available, where health care services are located, insurance coverage, transportation, and other social and economic factors. Moreover, the increasing use of artificial intelligence (AI) in health care and language services may exacerbate cases of disparate impact because underlying data, model design, or implementation may reinforce or widen existing disparities.
Reduce incentives for HHS and recipients of federal financial assistance to ensure policies and practices are equitable and do not disproportionately adversely affect certain racial or ethnic groups or other protected groups. Without disparate impact as an enforcement standard, the federal government has reduced incentive to investigate policies and procedures for discrimination unless there are claims of intentional discrimination. Despite civil rights statutes remaining in full effect, federal funding recipients may have less incentive to proactively assess the equity implications of institutional decisions, policies, and procedures. Some organizations may continue to focus on equitable practices as a part of their accreditation standards, state laws, Medicaid requirements, quality improvement initiatives, or organizational priorities, but they will not be subject to federal enforcement to ensure equitable impacts or outcomes for the groups they serve unless there is evidence of intentional discrimination.
In the absence of Title VI disparate impact enforcement, other federal and state authorities may provide mechanisms for addressing disparate impacts, but these protections may have more limited reach and may apply to different protected groups, entities, programs, jurisdictions, or forms of discrimination than Title VI. For example, Section 1557 of the Affordable Care Act continues to prohibit discrimination in covered health programs based on race, color, national origin, disability, age and sex and includes requirements related to providing meaningful language access. However, the Administration has indicated it will make changes to Section 1557 implementing regulations. Medicaid also provides mechanisms for addressing disparities, particularly through managed care contracting practices, although efforts vary across states. States may also retain or establish their own protections against disparate-impact discrimination. For example, California statute prohibits discrimination in state-funded programs and activities based on a broader range of protected characteristics than Title VI with state regulations prohibiting practices with discriminatory effects, providing a state-level disparate impact standard similar to one the one eliminated from HHS’s Title VI regulations. Illinois also enacted the Civil Rights Safeguard Act in 2026, expanding existing state protections against disparate impact discrimination in employment, financial credit, and public accommodations, including health care. However, without a federal standard of enforcement, protections and mechanisms to address discrimination will vary across states.
The Medicare program provides health insurance coverage to over 70 million people ages 65 or older and younger adults with long-term disabilities. While Medicare covers a wide range of health care services, Medicare beneficiaries generally pay out-of-pocket for their monthly premiums, deductibles, and cost sharing for Medicare covered services. Medicare premiums and other cost-sharing requirements have increased steadily in recent years and are projected to continue growing over the next decade. At the same time, many Medicare beneficiaries have modest incomes which can make it difficult to afford these costs: one in four Medicare beneficiaries lived on incomes below $24,600 per person in 2024, and out-of-pocket spending on Medicare premiums and cost-sharing expenses accounted for more than a third (36%) of the average Medicare beneficiary’s Social Security income in 2023.
Out-of-pocket costs may also vary depending on the choices Medicare beneficiaries make about their coverage. People with Medicare can choose to receive their benefits through traditional Medicare or through a privately administered Medicare Advantage plan. Beneficiaries in traditional Medicare can sign up for prescription drug coverage through a stand-alone Part D plan, and may also purchase a Medicare supplemental insurance policy, known as Medigap, to assist with Medicare cost sharing. Medicare Advantage plans typically include prescription drug coverage, as well as limits on how much enrollees pay out of pocket each year for Medicare covered services (in contrast to traditional Medicare, which has no limit on out-of-pocket costs), but most plans also require enrollees to use a specified network of providers or charge higher cost sharing for services from out-of-network providers. Each of these Medicare coverage options comes with different premium and cost-sharing requirements, as well as considerable variation from plan to plan. Overall, navigating these options and expenses can be complex, and the costs can be substantial, particularly for beneficiaries with high health care needs.
This brief provides an overview of the costs faced by Medicare beneficiaries in traditional Medicare, Medicare Advantage, and Medicare Part D, including premiums, deductibles, copays, and coinsurance, focusing on costs in 2026. (The brief will be updated with cost information for 2027 when available.)
Premiums for Medicare Part A and Part B
Part A Premium: $0 per month for most Medicare beneficiaries
Part B Premium: $202.90 per month (standard); income-related adjustments apply for people with higher incomes
Part A Premiums
Most Medicare beneficiaries, whether they are covered under traditional Medicare or Medicare Advantage, pay no monthly premium for Medicare Part A, which covers inpatient hospital stays, short-term nursing facility care, hospice, and some home health services. People generally qualify for premium-free Part A if they or a spouse have worked at least 40 quarters (10 years) in jobs where they paid Medicare payroll taxes. People who are otherwise eligible for Medicare but do not meet this requirement may still enroll in Part A but are required to pay a monthly premium. In 2026, the Part A premium is $311 per month (or $3,732 for the year) for beneficiaries with more than 30 quarters but less than 40 quarters of covered employment and $565 per month (or $6,780 for the year) for beneficiaries with fewer than 30 quarters of covered employment.
Late enrollment penalty. If a Medicare-eligible person is required to pay a Part A premium but delays enrollment beyond their initial enrollment period and lacks qualifying group coverage in the interim, they are subject to a late enrollment penalty in the form of a 10% increase to their monthly Part A premium when they enroll in Part A. The Part A late enrollment penalty applies for twice the number of years enrollment was delayed. For example, if a person with 30 quarters of covered employment was initially eligible to enroll in Part A in January 2023, but delayed enrollment for two years until January 2025, they would incur late enrollment penalties until 2029 and would pay $342.10 per month for Part A coverage in 2026 (based on $311 times 10%).
Part B Premiums
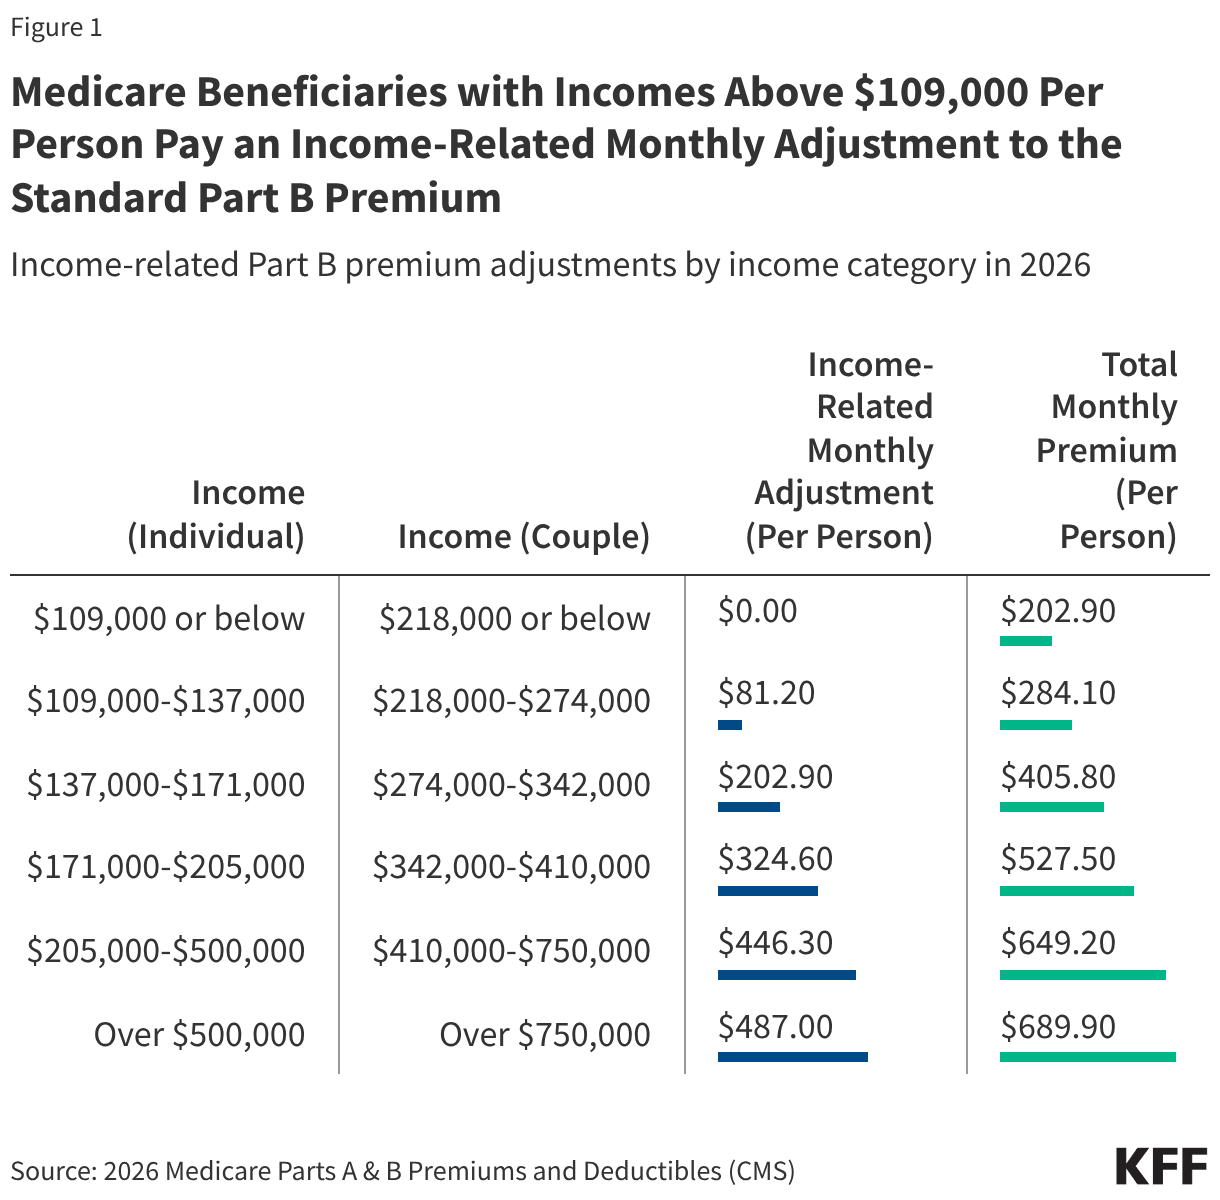
Beneficiaries are required to pay a monthly premium for Part B coverage, whether they are covered under traditional Medicare or Medicare Advantage. Part B covers physician visits, outpatient hospital services, preventive services, diagnostic tests, and physician-administered drugs. In 2026, the standard Part B premium is $202.90 per month (or $2,434.80 for the year). Beneficiaries with incomes greater than $109,000 for individuals or $218,000 for married couples in 2026 pay a higher, income-adjusted Part B premium ranging from $284.10 to $689.90 per person per month in 2026 (Figure 1). Beneficiaries with low incomes and modest assets may qualify for help from their state Medicaid program to pay their Medicare Part B premium.
Medicare Beneficiaries with Incomes Above $109,000 Per Person Pay an Income-Related Monthly Adjustment to the Standard Part B Premium
Income-related Part B premium adjustments by income category in 2026
2026 Medicare Parts A & B Premiums and Deductibles (CMS)
Late enrollment penalty. As with Part A, Medicare-eligible people who delay enrolling in Part B beyond their initial enrollment period and who lack other qualifying group coverage in the interim are subject to a late enrollment penalty when they enroll in Part B. The Part B late enrollment penalty is a lifetime penalty and is calculated as 10% of the monthly standard Part B premium for each 12-month period enrollment was delayed. For example, someone who delayed enrollment in Part B for two years would face a 20% monthly Part B premium penalty and would pay $243.48 per month in 2026 (based on $202.90 times 20%).
Cost-Sharing Requirements in Traditional Medicare
Part A:
Deductible: $1,736 per inpatient hospital benefit period
Cost sharing: Daily copayments after day 60 for inpatient hospital care (out of a maximum of 150 covered days); daily copayments after day 20 for skilled nursing facility care (out of a maximum of 100 covered days)
Part B:
Deductible: $283 annual
Cost sharing: 20% coinsurance for most Part B-covered services
Cost Sharing for Part A Services
Inpatient hospital services covered under Medicare Part A are subject to a deductible of $1,736 in 2026, which applies per benefit period rather than per year, meaning that some beneficiaries may pay the deductible more than once if they are hospitalized multiple times in a year. Cost sharing only applies after the first 60 days of a hospital stay, at a rate of $434 per day for days 61-90 and $868 for each additional day afterwards in 2026 (up to a lifetime cap of 60 additional days).
For a stay in a skilled nursing facility following a qualifying hospitalization, beneficiaries pay no cost sharing for the first 20 days and $217 per day for days 21-100 in 2026. Medicare covers a maximum of 100 days of skilled nursing facility care per benefit period, after which point beneficiaries are responsible for the full cost of any additional days. Other Part A services, such as hospice care or home health services, are covered with no deductible and no cost sharing (with the exception of certain services, such as pain management medications and respite care, for which modest cost sharing may apply).
Cost Sharing for Part B Services
Services covered under Medicare Part B, such as doctor visits, outpatient hospital services, diagnostic tests and imaging, mental health and substance use disorder services, and durable medical equipment (e.g., prosthetics or mobility devices) are generally subject to an annual deductible of $283 in 2026 and a coinsurance rate of 20%. Many preventive services, such as annual wellness visits, flu shots and certain other vaccines, mammograms, and prostate cancer screenings are covered with no deductible or coinsurance.
Traditional Medicare has No Out-of-Pocket Limit
Traditional Medicare does not include an annual limit on how much beneficiaries pay out-of-pocket for Part A and Part B services. For this reason, many beneficiaries choose to purchase a Medigap policy, which helps cover Part A and B cost-sharing requirements in traditional Medicare, offering beneficiaries protection against unforeseen or catastrophic out-of-pocket expenses. Beneficiaries who choose to purchase a Medigap policy must pay a separate monthly premium to their Medigap insurer (in addition to the Part B premium). The average premium among current Medigap policyholders was $217 per month in 2023 (or $2,604 for the year), though Medigap premiums may rise with age and other factors, with considerable variation by state and policy type.
In addition to Medigap, some beneficiaries have access to other types of supplemental coverage, such as employer- or union-sponsored coverage or Medicaid coverage, which may also assist with out-of-pocket expenses, as well as coverage of services not included in traditional Medicare. Beneficiaries with low incomes and modest assets who do not qualify for full Medicaid coverage may still qualify for help from their state Medicaid program to cover Medicare Part A and Part B deductibles and cost-sharing requirements (as well as premium costs, as noted above).
Costs Under Medicare Advantage
Plan Premium: Varies by plan; 75% pay no additional premium
Deductible: Varies by plan; many plans do not include a deductible
Cost Sharing: Varies by plan, subject to a maximum out-of-pocket cap of $9,250 for in-network services or $13,900 for all covered services
Medicare Advantage plans are private health plans that contract with Medicare to provide Part A and Part B benefits, and serve as an alternative to traditional Medicare. Most Medicare Advantage plans also include prescription drug coverage and offer supplemental benefits not covered in traditional Medicare, such as dental, vision, and hearing services. Medicare Advantage plans often have lower cost-sharing requirements for many services than what beneficiaries would face in traditional Medicare. At the same time, Medicare Advantage plans frequently use provider networks, prior authorization, and referral requirements to manage enrollees’ use of services, in contrast to traditional Medicare where these types of restrictions are rarely used.
Premiums
People in Medicare Advantage plans are required to pay the standard monthly Part B premium, plus the income-related surcharge as applicable, and the Part A premium if they do not qualify for premium-free Part A, as well as any additional premium charged by their Medicare Advantage plan. However, most Medicare Advantage enrollees are in plans with no additional plan premium. Among Medicare Advantage plans that include prescription drug coverage (known as MA-PDs) available for individual enrollment, the average enrollment-weighted premium is $15 per month in 2026. This amount is heavily weighted by zero-premium plans, as three-quarters (75%) of all MA-PD enrollees are in plans that charge no monthly premium.
Some Medicare Advantage plans use rebate dollars from Medicare payments to buy down a portion of the monthly Part B premium for their enrollees. In 2026, roughly one third (31%) of all MA-PD enrollees are in plans that reduce the Part B premium, most often by less than $10 per month.
Cost Sharing for Part A and Part B Services
Medicare Advantage plans are required to cover all services covered under Medicare Parts A and B. Overall cost sharing in Medicare Advantage cannot exceed what would be paid across Part A and Part B services in traditional Medicare, though specific cost-sharing requirements vary across plans and may be higher or lower for a given service, with some exceptions. Cost-sharing requirements may also vary depending on whether or not a given provider or health care facility is included in the plan’s network. Preferred provider organizations (PPOs) generally offer coverage of out-of-network services but may require higher cost sharing than would be required for in-network services, while health maintenance organizations (HMOs) do not include any coverage of out-of-network services.
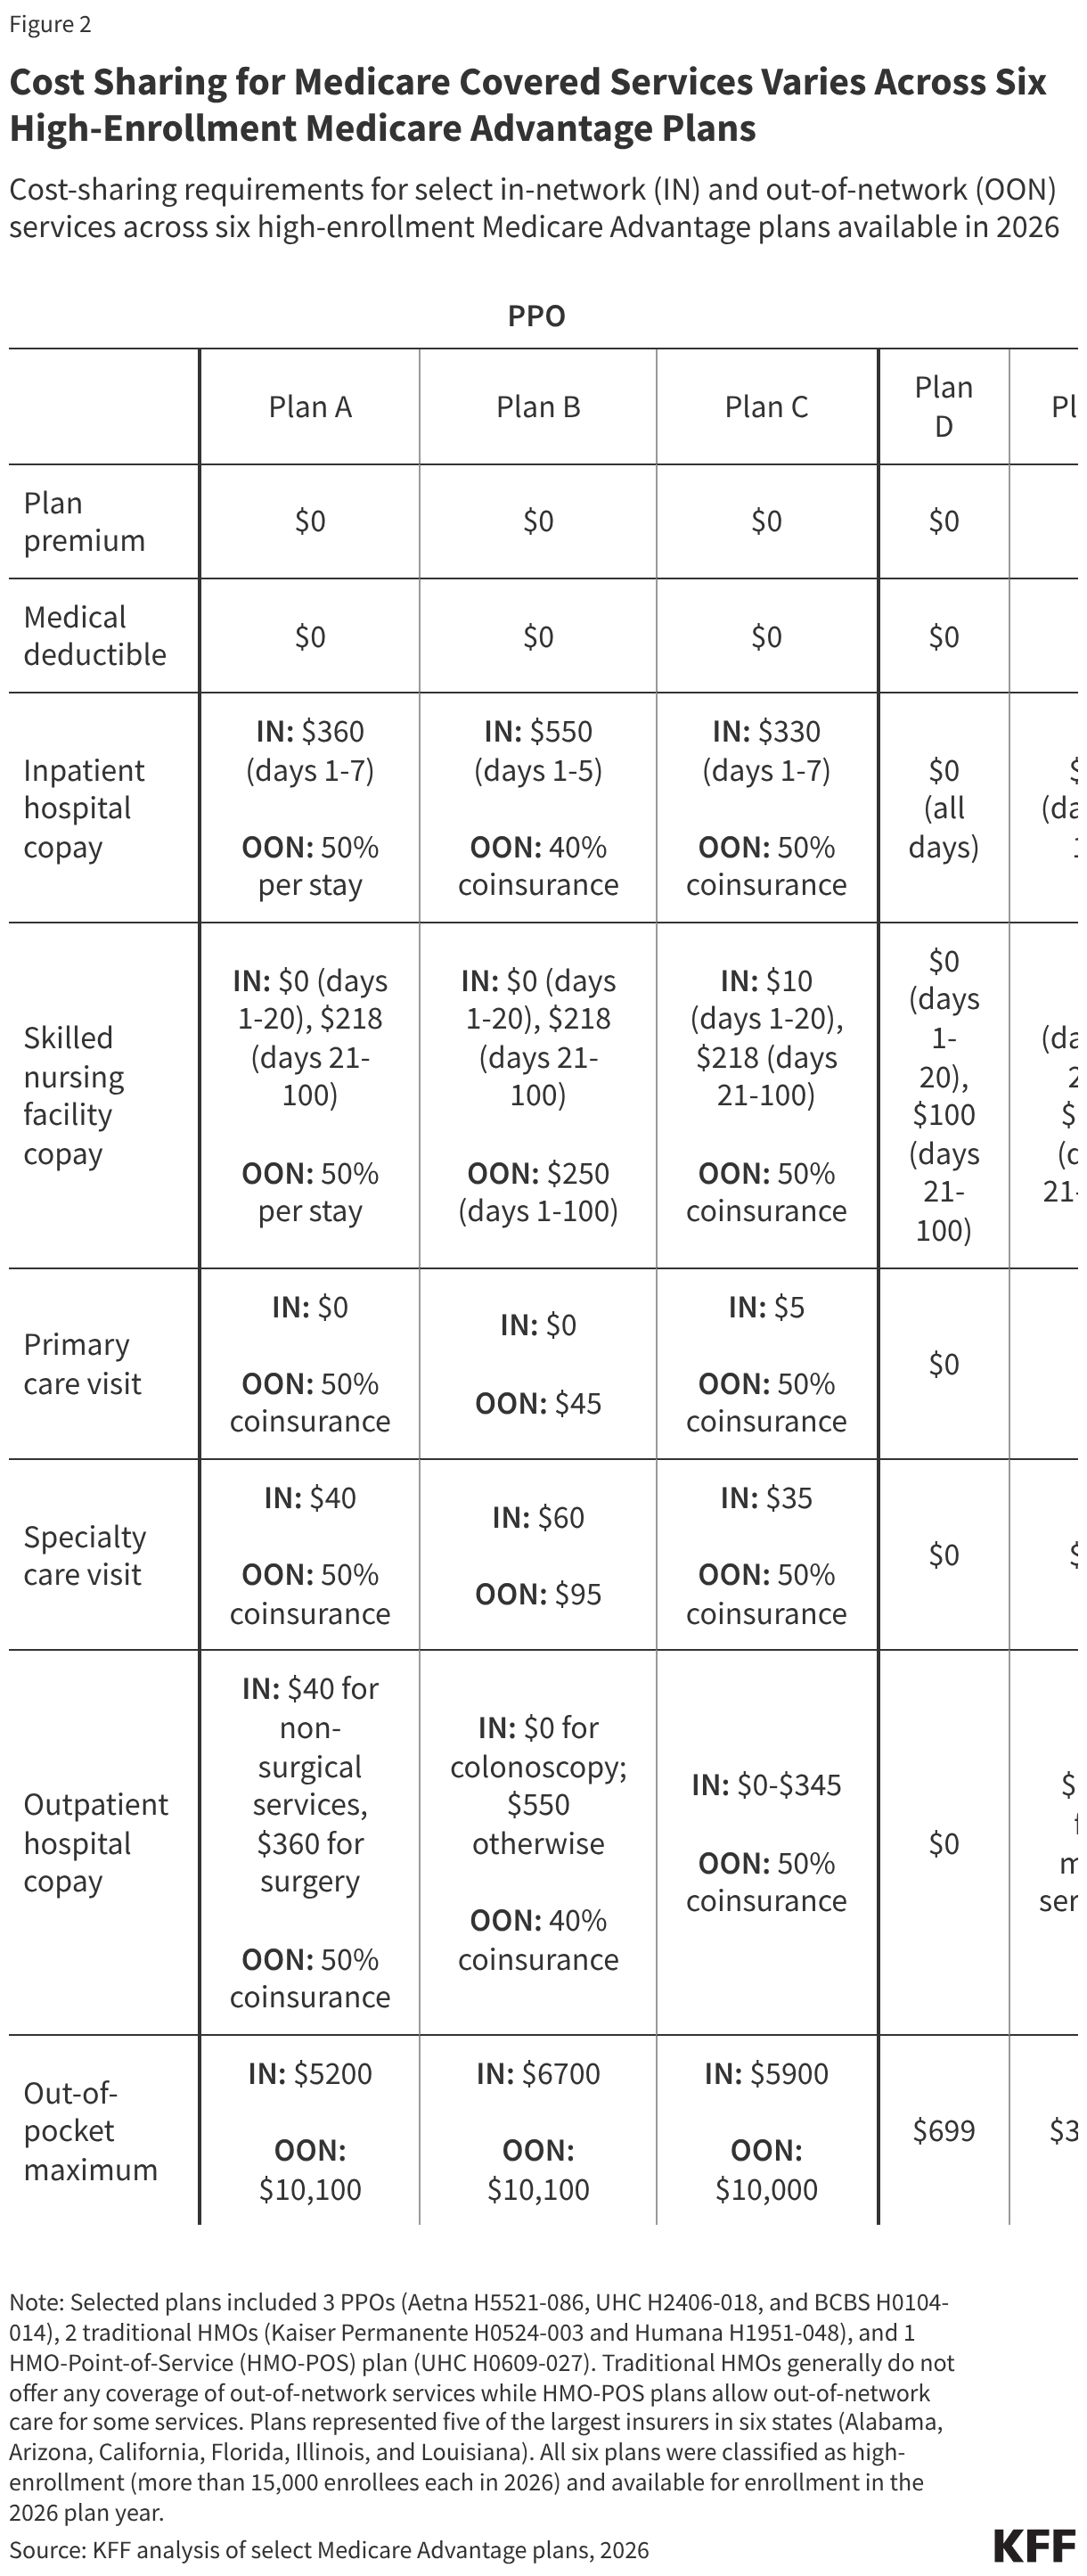
Among an illustrative sample of six high-enrollment Medicare Advantage plans available in 2026, representing five of the largest insurers in six different states across the country, none of the six plans required an additional premium or a deductible for medical services covered under Medicare Part A and Part B, but plan costs for Part A and Part B services varied widely (Figure 2).
Cost Sharing for Medicare Covered Services Varies Across Six High-Enrollment Medicare Advantage Plans
Cost-sharing requirements for select in-network (IN) and out-of-network (OON) services across six high-enrollment Medicare Advantage plans available in 2026
Selected plans included 3 PPOs (Aetna H5521-086, UHC H2406-018, and BCBS H0104-014), 2 traditional HMOs (Kaiser Permanente H0524-003 and Humana H1951-048), and 1 HMO-Point-of-Service (HMO-POS) plan (UHC H0609-027). Traditional HMOs generally do not offer any coverage of out-of-network services while HMO-POS plans allow out-of-network care for some services. Plans represented five of the largest insurers in six states (Alabama, Arizona, California, Florida, Illinois, and Louisiana). All six plans were classified as high-enrollment (more than 15,000 enrollees each in 2026) and available for enrollment in the 2026 plan year.
KFF analysis of select Medicare Advantage plans, 2026
Inpatient hospitalization: Among the three PPOs examined, daily copays for inpatient services at in-network facilities ranged from $330 per day for days 1-7 to $550 per day for days 1-5, after which no additional cost sharing was required, while coinsurance for inpatient services at out-of-network facilities ranged from 40% to 50% for all covered days. Among the three HMOs examined, daily copays for inpatient services ranged from $0 for all days to $275 for days 1-8, after which no additional cost sharing was required.
Primary care visits: Among the three PPOs examined, copays for primary care visits ranged from $0 to $5 for in-network providers and from $45 to a 50% coinsurance fee for out-of-network providers. None of the three HMOs examined charged a copay for primary care visits.
Specialty care visits: Among the three PPOs examined, copays for specialty care visits ranged from $35 to $60 for in-network providers and from $95 to a 50% coinsurance for out-of-network providers. Among the three HMOs examined, copays for specialty care visits ranged from $0 to $30.
Outpatient hospital services: Among the three PPOs examined, copays for outpatient services at in-network facilities ranged from $0 for select services (such as colonoscopies) to $550 for most covered services, while coinsurance for outpatient services at out-of-network facilities ranged from 40% to 50%. Among the three HMOs examined, copays for outpatient services ranged from $0 to $275 for most services.
Out-of-Pocket Limits are Required in Medicare Advantage
Medicare Advantage plans are required to include a limit on enrollees’ out-of-pocket spending. In 2026, this limit may not exceed $9,250 for in-network services or $13,900 for all covered services, though plans may choose to offer limits below these amounts. The average out-of-pocket limit among Medicare Advantage enrollees in 2026 is $5,421 for in-network services (across HMOs and PPOs) and $9,825 for in- and out-of-network services combined (among PPOs, as HMOs do not include coverage of out-of-network services). Just over one in ten (13%) Medicare Advantage enrollees are in plans with limits of $3,000 or less for in-network services, while one in five (19%) are in plans with limits greater than $7,000. Among PPO enrollees, roughly, one in ten (9%) are in plans with limits of $6,000 or less for in-network and out-of-network services combined, while one in four (25%) are in plans with limits greater than $12,000. Out-of-pocket limits apply to Part A and Part B services only, though out-of-pocket spending for Part D drugs is subject to a separate limit (as discussed below).
Out-of-pocket limits varied among the six illustrative plans described above. Among the three PPOs examined, out-of-pocket limits ranged from $5,200 to $6,700 for in-network services and from $10,000 to $10,100 for in-network and out-of-network services combined. Among the three HMOs examined, out-of-pocket limits ranged from $699 to $3,850 for covered services.
Non-Medicare Covered Services
Most Medicare Advantage plans include some coverage of services not covered in traditional Medicare, such as dental care, glasses and eye exams, and hearing exams or hearing aids. The scope of coverage for these benefits varies widely between plans, with some limited to coverage of basic preventive services (e.g., dental cleanings) while others offer a broader range of covered services (e.g., root canals or dentures). Cost sharing for these benefits also varies between plans, and coverage may be subject to network restrictions, limits on the number of services covered per year, or annual dollar caps on the amount the plan will pay towards covered services.
Costs for Part D Prescription Drug Coverage
Premium: Varies by plan; income-related adjustments apply for people with higher incomes
Deductible: $615 (standard); plans can lower or eliminate the deductible
Cost Sharing: Varies by plan, subject to an annual out-of-pocket cap of $2,100
Medicare Part D is a voluntary outpatient prescription drug benefit for people with Medicare provided through private plans that contract with the federal government. Beneficiaries can choose to enroll in either a stand-alone prescription drug plan (PDP) to supplement traditional Medicare or a Medicare Advantage drug plan (MA-PD) that includes drug coverage and all other Medicare-covered benefits. Monthly premiums, deductibles, cost-sharing requirements for covered drugs, pharmacy networks, and formularies (the list of drugs covered by a plan) all vary across Part D plans.
Part D Premiums
Many, though not all, Part D enrollees pay a monthly premium for Part D coverage, with premiums varying by plan. In 2026, the average Part D premium among stand-alone PDPs is $36 per month. For MA-PD enrollees, the Part D premium is included as a portion of their Medicare Advantage plan premium. In 2026, the Part D portion of the average MA-PD premium is $8 per month, but 75% of Medicare Advantage enrollees in individual plans pay no premium for Part D coverage (because the Medicare Advantage insurer uses payments from the federal government to buy down these costs).
As with the Part B premium, beneficiaries with incomes greater than $109,000 for individuals or $218,000 for married couples in 2026 pay a higher, income-adjusted Part D premium, with monthly adjustment amounts ranging from $14.50 to $91.00 added to their individual Part D plan’s premium. Beneficiaries with low incomes and modest assets can qualify for financial assistance through the Part D Low-Income Subsidy (LIS). People who qualify for the LIS program pay modest copayments for prescription drugs, no drug deductible, and no premium for drug coverage if they are enrolled in premium-free “benchmark” plans.
Late enrollment penalty. Beneficiaries who go without Part D coverage for 63 days or more at any point after their initial enrollment period and lack other qualifying drug coverage in the interim are subject to a late enrollment penalty. The Part D late enrollment penalty is a lifetime penalty equal to 1% of the Part D base beneficiary premium ($38.99 in 2026) for each month of delayed coverage. For example, someone who went without Part D or equivalent coverage for eighteen months would face an 18% monthly Part D premium penalty and would pay $7 per month in 2026 in addition to any premium charged by their Part D plan (based on $38.99 times 18%).
Cost Sharing
The standard Part D deductible is $615 in 2026, but Part D plans can offer an enhanced benefit with a lower or no deductible. In 2026, MA-PD enrollees face an average Part D deductible of $371, while PDP enrollees face an average deductible of $544. Part D plans typically charge different amounts for covered drugs, with lower cost-sharing amounts charged for generic drugs and preferred brands and higher cost-sharing amounts for non-preferred and specialty drugs. Cost sharing typically consists of a mixture of flat dollar copays and coinsurance (based on a percentage of the drug’s list price). Part D plans can also designate certain pharmacies where enrollees will face lower (“preferred”) cost-sharing requirements.
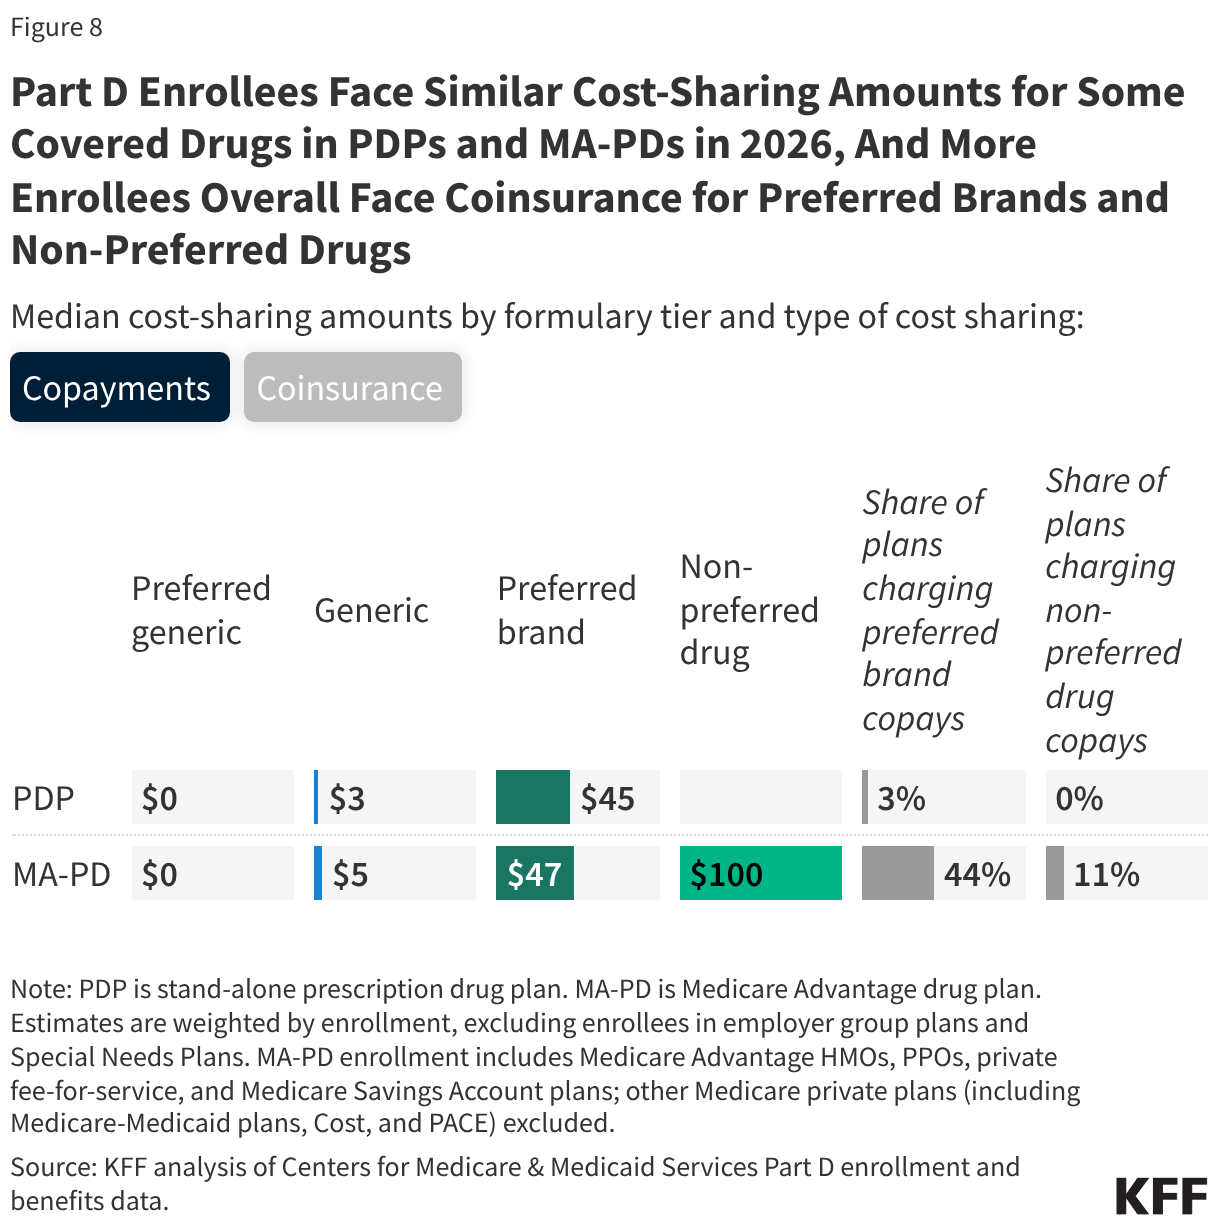
In 2026, the median copay for generic drugs is $3 among PDPs and $5 among MA-PDs. For preferred brand drugs, the median copay is $45 among PDPs and $47 among MA-PDs. Virtually all PDP enrollees pay coinsurance for non-preferred drugs (with a median rate of 34%), while MA-PDs may charge either coinsurance (with a median rate of 38%) or a flat dollar copay (with a median of $100). The median coinsurance rate for specialty drugs is 25% among PDPs and 28% among MA-PDs (Figure 3).
Cost-Sharing Requirements Vary by Formulary Tier Among PDPs and MA-PDs
Median cost-sharing amounts by formulary tier and type of cost sharing in 2026:
Copayments
Coinsurance
PDP is stand-alone prescription drug plan. MA-PD is Medicare Advantage drug plan. Estimates are weighted by enrollment, excluding enrollees in employer group plans and Special Needs Plans. MA-PD enrollment includes Medicare Advantage HMOs, PPOs, private fee-for-service, and Medicare Savings Account plans; other Medicare private plans (including Medicare-Medicaid plans, Cost, and PACE) excluded.
KFF analysis of Centers for Medicare & Medicaid Services Part D enrollment and benefits data.
Cost-Sharing Requirements Vary by Formulary Tier Among PDPs and MA-PDs
Median cost-sharing amounts by formulary tier and type of cost sharing in 2026:
Copayments
Coinsurance
PDP is stand-alone prescription drug plan. MA-PD is Medicare Advantage drug plan. Estimates are weighted by enrollment, excluding enrollees in employer group plans and Special Needs Plans. MA-PD enrollment includes Medicare Advantage HMOs, PPOs, private fee-for-service, and Medicare Savings Account plans; other Medicare private plans (including Medicare-Medicaid plans, Cost, and PACE) excluded.
KFF analysis of Centers for Medicare & Medicaid Services Part D enrollment and benefits data.
An Out-of-Pocket Limit Applies Under Part D
Out-of-pocket costs for Part D enrollees are capped at $2,100 in 2026. Once this out-of-pocket limit is reached, enrollees pay no additional costs for the remainder of the year for drugs covered by their Part D plan. Part D enrollees in plans that offer enhanced benefits could pay less than $2,100 out of pocket before they qualify for catastrophic coverage. Part D enrollees also have the option of spreading out their out-of-pocket costs over a calendar year to lower their monthly costs.
Medicare Advantage Plan Availability Varies Widely by County for 2027
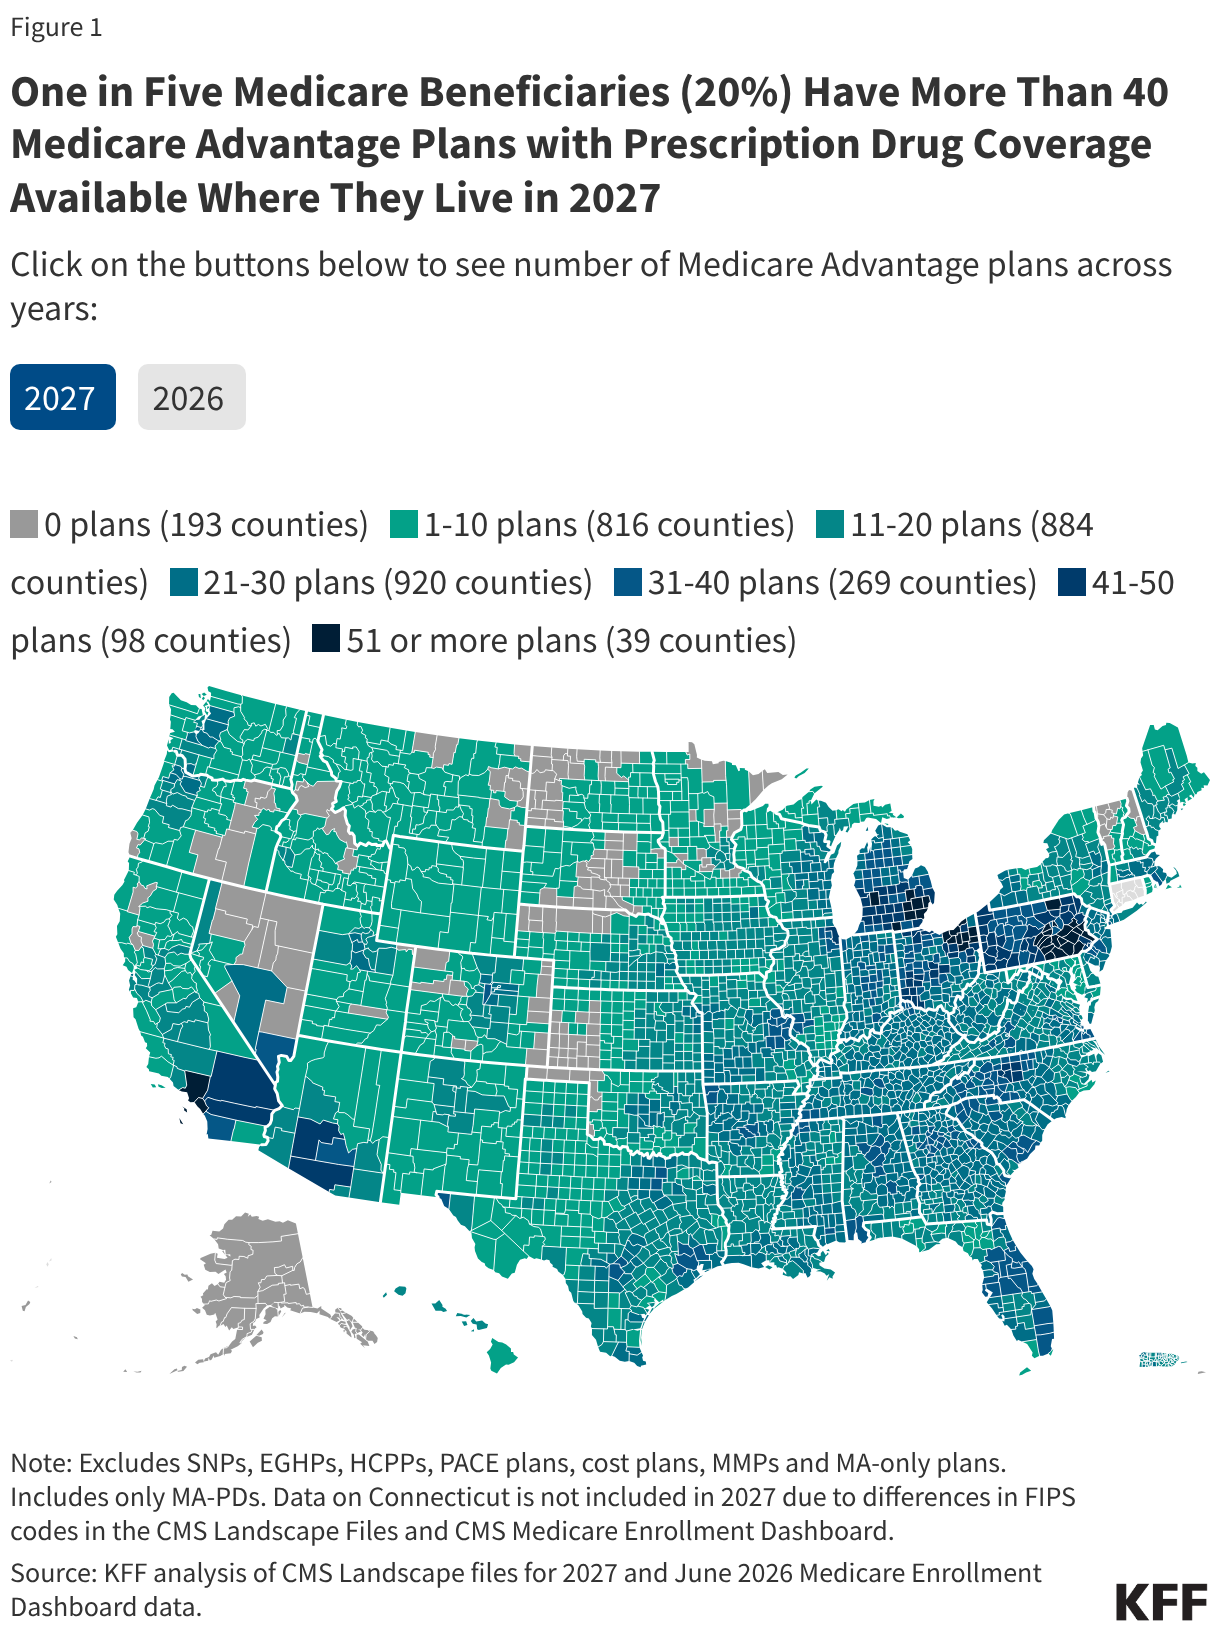
One in five (20%) Medicare beneficiaries have more than 40 Medicare Advantage drug plan options, while 1% of beneficiaries have none.
The Medicare Advantage market, the private plan alternative to traditional Medicare, is dynamic, and plan offerings can change from year to year. With 28 Medicare Advantage prescription drug (MA-PD) plans available to the average beneficiary in 2027, most people with Medicare have a robust set of MA-PD options. However, Medicare Advantage plans are offered at the county level, and variation in plan availability across the country has long been a feature of the Medicare Advantage market. This analysis uses Medicare plan landscape data from the Centers for Medicare & Medicaid Services to examine county-level variation in MA-PD plan availability in 2027 and changes from 2026. This analysis does not examine changes in costs, benefits, or other plan characteristics. The analysis shows that plan level availability varies widely across the country in 2027, with a modest reduction in the share of enrollees having more than 40 MA-PDs to choose from compared to 2026, and some major insurers exiting a much larger number of counties than they are entering.
Findings
One in five Medicare beneficiaries (20%) can choose from more than 40 MA-PDs for coverage in 2027.
The 20% of Medicare beneficiaries who have more than 40 MA-PD options are concentrated in 4% of counties (Figure 1). This is a decrease from 2026 when 27% of beneficiaries, who resided in 6% of counties, had more than 40 options. Similar to 2026, the counties with the most plan options are predominantly in Pennsylvania, Ohio, and Michigan, as well as Los Angeles County, California. Beneficiaries in Lancaster, Pennsylvania can choose from 66 MA-PDs – the most offerings of any county in the U.S.
One in Five Medicare Beneficiaries (20%) Have More Than 40 Medicare Advantage Plans with Prescription Drug Coverage Available Where They Live in 2027
Click on the buttons below to see number of Medicare Advantage plans across years:
2027
 
2026  
Excludes SNPs, EGHPs, HCPPs, PACE plans, cost plans, MMPs and MA-only plans. Includes only MA-PDs. Data on Connecticut is not included in 2027 due to differences in FIPS codes in the CMS Landscape Files and CMS Medicare Enrollment Dashboard.
KFF analysis of CMS Landscape files for 2027 and June 2026 Medicare Enrollment Dashboard data.
More than One Quarter of Medicare Beneficiaries (27%) Have More Than 40 Medicare Advantage Plans with Prescription Drug Coverage Available Where They Live in 2026
Click on the buttons below to see number of Medicare Advantage plans across years:
2027
 
2026  
Excludes SNPs, EGHPs, HCPPs, PACE plans, cost plans, MMPs and MA-only plans. Includes only MA-PDs. Data on Connecticut is not included in 2026 due to differences in FIPS codes in the CMS Landscape Files and CMS Medicare Enrollment Dashboard.
KFF analysis of CMS Landscape files for 2026 and June 2025 Medicare Enrollment Dashboard data.
For 2027, Medicare beneficiaries residing in 193 counties will have no MA-PDs available for general enrollment, an increase from 123 counties in 2026.
Beneficiaries in the 193 counties without any MA-PD option for general enrollment for 2027 comprise 1% of all Medicare beneficiaries, or 638,000 people. This is an increase from 2026, when 399,000 beneficiaries did not have an MA-PD option (an increase of 239,000 beneficiaries).
The counties with no MA-PD options are located in 16 states (Alaska, California, Colorado, Idaho, Kansas, Minnesota, Montana, Nebraska, Nevada, New Hampshire, North Dakota, Oklahoma, Oregon, South Dakota, Utah, and Vermont) and U.S. territories other than Puerto Rico. These are the same states as 2026, with the addition of New Hampshire, North Dakota, and Oklahoma. Similar to 2026, there are no MA-PDs for general enrollment being offered in any county in Alaska in 2027, which includes about 110,000 beneficiaries.
In six counties (Boyd, Nebraska; Aurora, Beadle, Bon Homme, Brown, and Charles Mix, South Dakota) there is a Medicare Advantage plan option without prescription drug coverage, but in the other 187 counties, no Medicare Advantage plans with or without prescription drug coverage for general enrollment are available. In some counties where Medicare Advantage plans for general enrollment are not available, there are other private plan options, including cost plans as well as special needs plans, which restrict enrollment to Medicare beneficiaries who meet specific criteria.
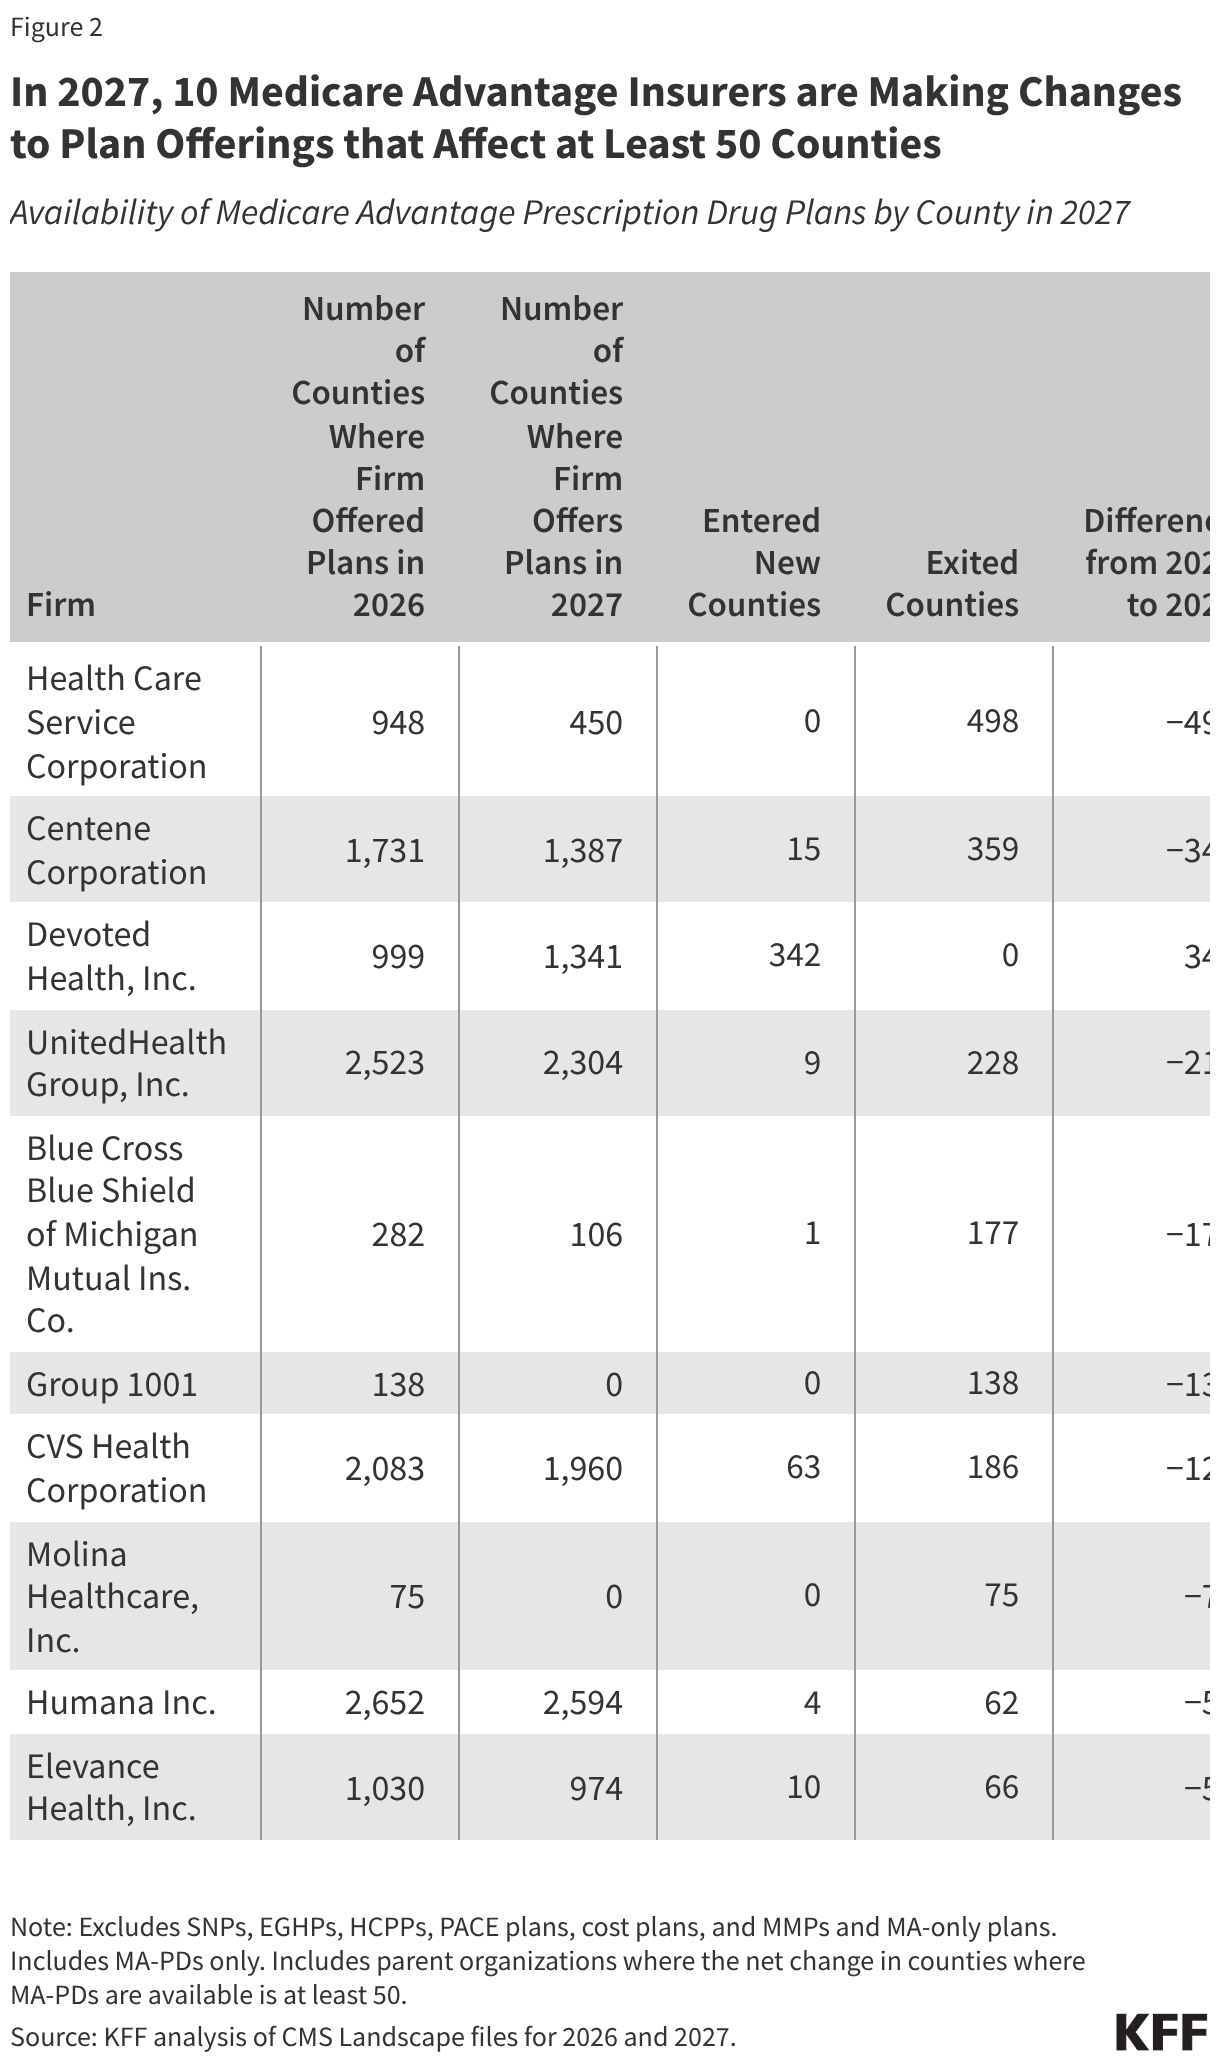
The two largest Medicare Advantage insurers – UnitedHealth Group and Humana – are exiting more counties, meaning they are no longer offering any MA-PDs in those counties, than they are entering in 2027.
UnitedHealth Group is exiting 228 counties and entering 9 new counties, and Humana is exiting 62 counties and entering 4 new counties (Figure 2). Humana is offering MA-PDs in the largest number of counties relative to other insurers – about 80% of all U.S. counties, similar to 2026 – while UnitedHealth Group is offering plans in about 70% of counties, a decline from 2026, when the insurer offered plans in nearly 80% of counties.
In 2027, 10 Medicare Advantage Insurers are Making Changes to Plan Offerings that Affect at Least 50 Counties
Availability of Medicare Advantage Prescription Drug Plans by County in 2027
Excludes SNPs, EGHPs, HCPPs, PACE plans, cost plans, and MMPs and MA-only plans. Includes MA-PDs only. Includes parent organizations where the net change in counties where MA-PDs are available is at least 50.
KFF analysis of CMS Landscape files for 2026 and 2027.
Among insurers offering MA-PD plans, Health Care Service Corporation is making the largest reduction in its county footprint, exiting the greatest number of counties in 2027 (498 counties) while entering no new counties. Centene has the second largest reduction, exiting 359 counties and entering 15 new counties for 2027. Blue Cross Blue Shield of Michigan Mutual Ins. Co., which had offered MA-PDs in Iowa, Michigan, North Dakota, South Dakota, and Wyoming in 2026, is exiting 177 counties and entering one new county, and will only offer MA-PDs in Michigan and Wyoming for 2027. Elevance Health is exiting 66 counties and entering 10 new counties in 2027.
Two insurers – Group 1001 (marketed as Clear Spring Health), which offered plans in Colorado, Georgia and Illinois, and Molina Healthcare – are completely exiting the MA-PD market, though Molina is still offering SNPs in many counties in 2027.
In contrast, Devoted Health is expanding its MA-PD footprint, entering 342 counties and exiting none in 2027. Second to Devoted Health, CVS Health is entering a larger number of new counties in 2027 than other insurers (63 new counties), but is also exiting 186 counties.
Kaiser Foundation Health Plans, a high enrollment insurer, is maintaining its footprint, exiting three counties while entering three new ones in 2027 (data not shown).
The characteristics of markets that insurers are leaving vary. In some cases, multiple insurers are exiting more rural areas with relatively small Medicare populations, such as four counties in Minnesota (Brown, Lake of the Woods, Morrison, and Renville), in each of which three insurers who offered MA-PDs in 2026 are no longer offering MA-PDs for 2027. In other cases, individual insurers are exiting counties in more urban areas with higher Medicare Advantage penetration, such as Miami-Dade County, FL where Health Care Service Corporation is no longer offering MA-PDs in 2027 and Monroe County, New York (Rochester) where Humana left the market. The different decisions of insurers to exit certain counties suggest a combination of factors are at play, including local market characteristics, cost pressures, shifts in firm-level strategies, and ultimately the insurers’ assessment of profitability.
Medicare Open Enrollment and Coverage Options: Key Questions and Answers
Medicare is the federal health insurance program for more than 70 million people ages 65 and over and younger adults with long-term disabilities. The program helps to pay for many medical care services, including hospitalizations, physician visits, and prescription drugs, along with post-acute care, skilled nursing facility care, home health care, hospice care, and preventive services.
People with Medicare may choose to receive their Medicare benefits through traditional Medicare or through a Medicare Advantage plan, such as a health maintenance organization (HMO) or preferred provider organization (PPO), administered by a private health insurer. People who choose traditional Medicare can sign up for a separate Medicare Part D prescription drug plan for coverage of outpatient prescription drugs and may also consider purchasing a supplemental insurance policy (Medigap) to help with out-of-pockets costs if they do not have additional coverage from a former employer, union, or Medicaid. People who opt for Medicare Advantage can choose from among more than two dozen Medicare Advantage plans on average, which include all services covered under Medicare Parts A and B, and typically include Part D prescription drug coverage as well.
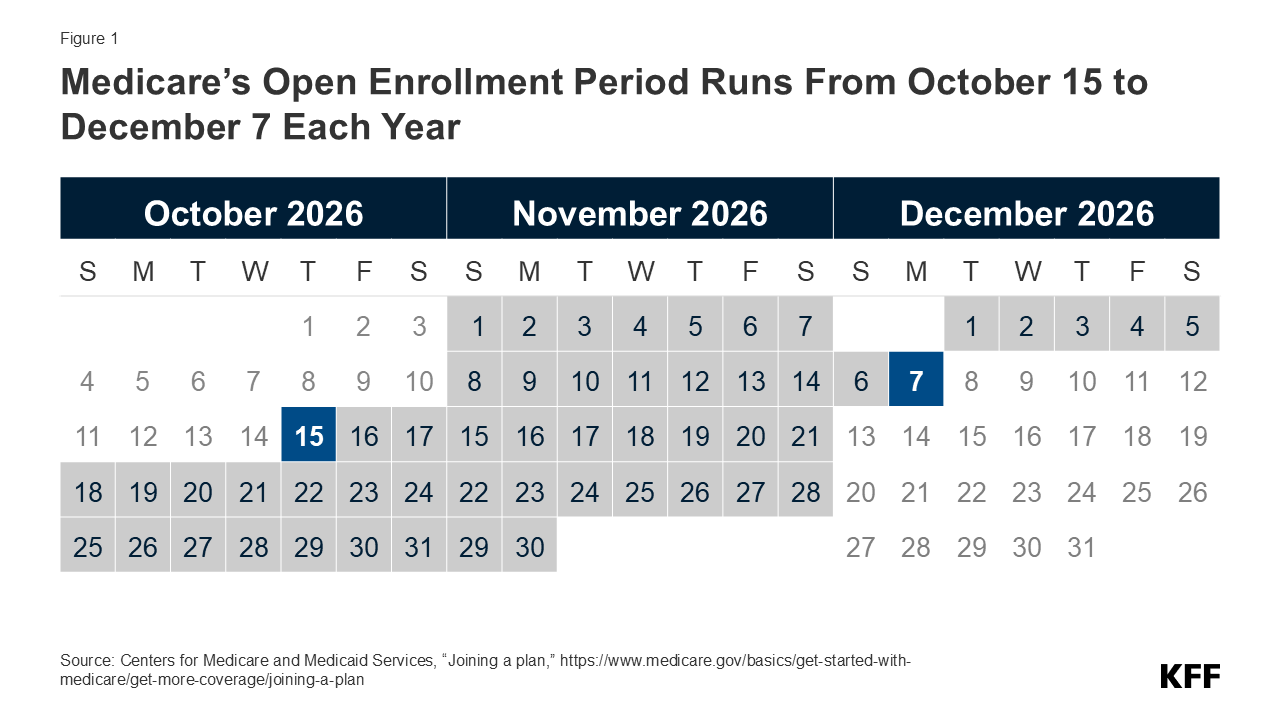
Each year, Medicare beneficiaries have an opportunity to make changes to how they receive their Medicare coverage during the nearly 8-week annual open enrollment period. This brief answers key questions about the Medicare open enrollment period and Medicare coverage options.
1. When is the annual Medicare open enrollment period?
The annual Medicare open enrollment period runs from October 15 to December 7 each year (Figure 1). During this time, people with Medicare can review features of Medicare plans offered in their area and make changes to their Medicare coverage, which go into effect on January 1 of the following year. These changes include switching from traditional Medicare to a Medicare Advantage plan (or vice versa), switching between Medicare Advantage plans, and electing or switching between Medicare Part D prescription drug plans.
2. What changes can Medicare beneficiaries make during the annual open enrollment period?
People in traditional Medicare can use the Medicare open enrollment period to enroll in a Medicare Part D prescription drug plan or switch between Part D plans. Traditional Medicare beneficiaries who did not sign up for a Part D plan during their initial enrollment period for Medicare can enroll in a Part D plan during the annual open enrollment period, though they may be subject to a late enrollment penalty if they did not have comparable prescription drug coverage from another plan before signing up for Part D. Traditional Medicare beneficiaries with Medicare Parts A and B can also use this time to switch from traditional Medicare into a Medicare Advantage plan, with or without Part D coverage.
People who are enrolled in a Medicare Advantage plan can use the Medicare open enrollment period to choose a different Medicare Advantage plan or switch to traditional Medicare. Medicare Advantage enrollees who switch to traditional Medicare can enroll in a Part D plan if they want outpatient prescription drug coverage, which is not covered under Medicare Parts A and B. (Beneficiaries may be subject to late enrollment penalties if they go without Part D drug coverage and don’t have other creditable coverage.) They may also consider purchasing a Medicare supplemental insurance policy (Medigap) if the option is available to them (see Q4 for details about Medigap and potential limits on enrollment).
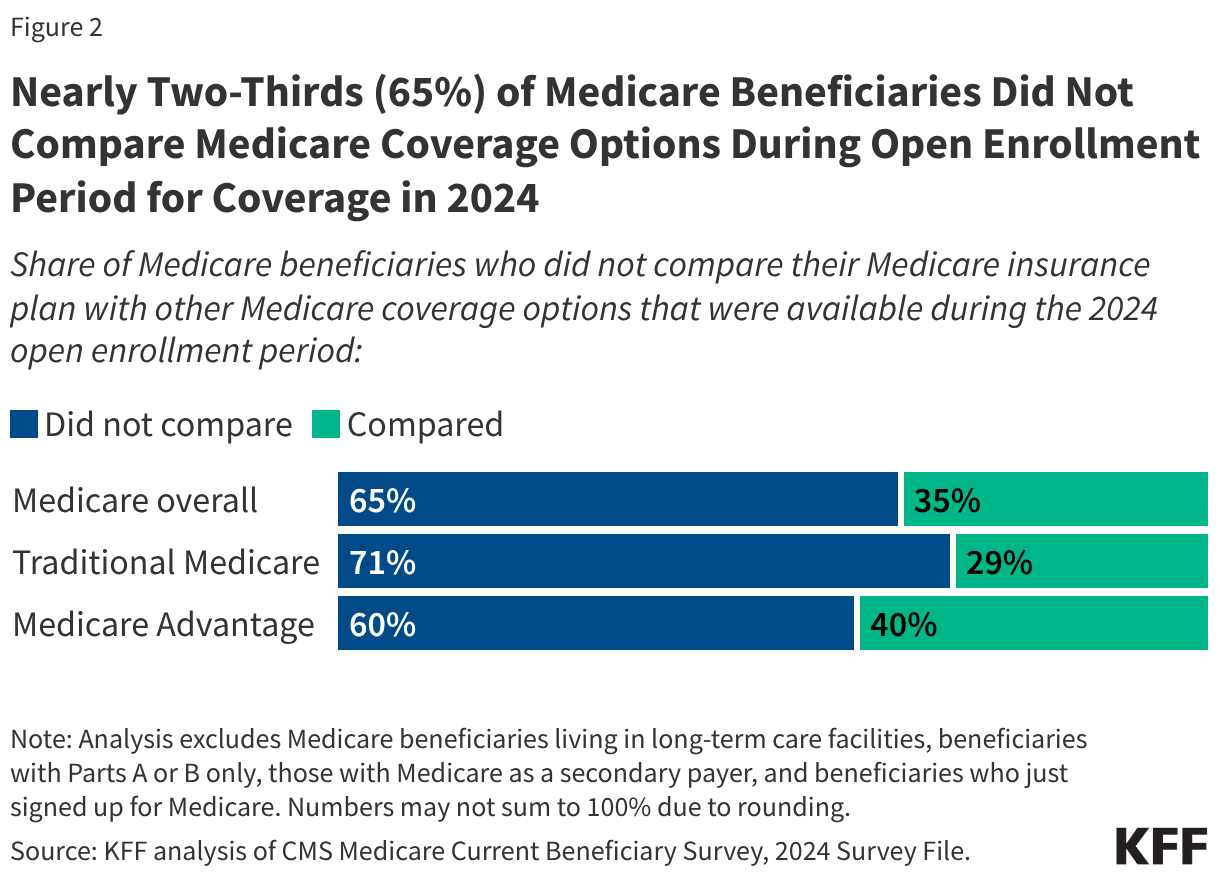
Medicare beneficiaries are encouraged to review their current source of Medicare coverage during the annual open enrollment period and compare other options that are available where they live. Because an individual’s medical needs can change over the course of the year, and from one year to the next, this might influence their priorities when choosing how they want to get their Medicare benefits. Medicare Advantage and Medicare prescription drug plans typically change from one year to the next and might vary in many ways that could have implications for a person’s access to providers and costs. Despite this, nearly two-thirds (65%) of Medicare beneficiaries did not compare their Medicare coverage options during a recent open enrollment period. The share of beneficiaries who did not compare coverage options was larger among people in traditional Medicare relative to those enrolled in Medicare Advantage (71% vs. 60%, Figure 2).
Nearly Two-Thirds (65%) of Medicare Beneficiaries Did Not Compare Medicare Coverage Options During Open Enrollment Period for Coverage in 2024
Share of Medicare beneficiaries who did not compare their Medicare insurance plan with other Medicare coverage options that were available during the 2024 open enrollment period:
Analysis excludes Medicare beneficiaries living in long-term care facilities, beneficiaries with Parts A or B only, those with Medicare as a secondary payer, and beneficiaries who just signed up for Medicare. Numbers may not sum to 100% due to rounding.
KFF analysis of CMS Medicare Current Beneficiary Survey, 2024 Survey File.
3. What other opportunities do Medicare beneficiaries have to make coverage changes outside of the open enrollment period?
Medicare provides several different Special Enrollment Periods (SEPs) where Medicare beneficiaries can make changes to their coverage outside of the annual open enrollment period under certain circumstances. For example, beneficiaries who experience disruptions to existing coverage, such as a cross-county move, losing employer- or union-sponsored coverage, or losing Medicaid eligibility, may qualify for a SEP at any time of year.
As of 2025, people who are enrolled in both Medicare and Medicaid (i.e., dual-eligible individuals) or who qualify for the Medicare Part D Low-Income Subsidy program (also known as “Extra Help”), can make certain changes to their coverage once per month. Beneficiaries in these groups may use this monthly SEP to disenroll from a Medicare Advantage plan into traditional Medicare, enroll in a stand-alone Part D drug plan, or switch between Part D plans. However, they may not use the monthly SEP to newly enroll in Medicare Advantage from traditional Medicare or switch between Medicare Advantage plans, with the exception of individuals with full Medicaid benefits who are switching to a Fully Integrated Dually Eligible Special Needs Plan (FIDE SNP), a Highly Integrated Dually Eligible Special Needs Plan (HIDE SNP), or a coordination-only D-SNP that is an Applicable Integrated Plan (AIP) (meaning it meets certain criteria for integration of Medicare and Medicaid coverage). People living in nursing homes and certain other facilities may also change their Medicare Advantage or Medicare Part D coverage once per month.
Medicare Advantage enrollees who wish to change plans or switch to traditional Medicare may do so between January 1through March 31 each year, during the Medicare Advantage Open Enrollment Period. (This is in addition to the open enrollment period that runs from October 15 to December 7.) Additionally, those who are enrolled in a Medicare Advantage or Medicare Part D plan with less than a 5-star quality rating and who have a plan with a 5-star quality rating available in their area may switch into a 5-star plan between December 8 and November 30 of the following year. Finally, Medicare Advantage enrollees may qualify for an SEP if their plan makes certain changes to its provider network that are deemed “significant,” such as terminating a large number of in-network providers. (See Q6 for more information about Medicare Advantage provider networks.)
The annual open enrollment period and other opportunities to switch coverage are distinct from the initial enrollment period for people who are newly enrolling in Medicare, which begins three months before a person’s 65th birthday and ends three months after it. For more information on initial enrollment, see KFF’s Medicare Open Enrollment FAQ.
4. How does supplemental coverage, like Medigap and employer-sponsored retiree health benefits, factor into Medicare coverage decisions?
Many Medicare beneficiaries have some form of additional coverage, such as a Medicare Supplement Insurance policy (also known as Medigap) or coverage offered by an employer or a union, that helps with Medicare’s cost-sharing requirements. Enrollment in these plans and programs is not tied to the Medicare open enrollment period, though beneficiaries might wish to take them into account when considering their options for Medicare coverage.
Medigap. People in traditional Medicare with both Part A and Part B can apply for a Medigap policy at any time of the year. Medigap policies are designed to help beneficiaries in traditional Medicare with Medicare’s deductibles and cost-sharing requirements and have standard benefits to allow for apples-to-apples comparisons across insurers. Traditional Medicare beneficiaries with a Medigap plan that covers most deductible and cost-sharing requirements might have lower out-of-pocket spending for Medicare-covered services than people with other coverage, including a Medicare Advantage plan. Medigap policies are designed to wrap around traditional Medicare, and do not work with Medicare Advantage. People enrolled in Medicare Advantage do not need (and can’t buy) a Medigap policy.
While Medigap insurers are required to issue policies to people age 65 or over, without regard to health status or diagnosed medical conditions when they first enroll in Medicare, those with pre-existing conditions may be denied a Medigap policy or face higher premiums in most states if they apply for Medigap coverage after their first six months of enrollment in Part B. People who disenroll from Medicare Advantage within 12 months of first enrolling in Medicare Advantage have a right to purchase a Medigap policy without regard to medical history, but after 12 months, they are not guaranteed Medigap coverage and may be denied a policy due to a pre-existing condition or face higher Medigap premiums if they are offered a policy.
Medigap guaranteed issue rights are different for people under age 65 who qualify for Medicare due to long-term disability. Federal law does not require Medigap insurers to sell a policy to people with Medicare under age 65, although several states do require insurers to offer at least one kind of Medigap policy to people under 65. Premiums for Medigap policies sold to people under age 65 are typically higher than policies sold to those age 65 or older. People under age 65 with disabilities who are already enrolled in Medicare will qualify for the 6-month Medigap open enrollment period when they turn 65 and become age eligible for Medicare. At this point, they can buy any Medigap policy they want without facing higher premiums or denials of coverage based on their existing medical conditions.
Employer-sponsored coverage. While employer-sponsored retiree health benefits are on the decline, more than 14.1 million people with Medicare have retiree health coverage (distinct from people with Medicare Part A only who continue to work and have health insurance through their current employer or a spouse’s current employer). Retiree health benefits may be designed to supplement either traditional Medicare or Medicare Advantage.
If a Medicare beneficiary drops their employer or union-sponsored retiree health benefits for any reason, such as switching from traditional Medicare to Medicare Advantage or vice versa, they might not be able to get them back. For example, some employers that offer health benefits to retirees on Medicare offer these benefits exclusively through a Medicare Advantage plan. Beneficiaries with retiree health coverage offered exclusively through a Medicare Advantage plan might lose these benefits if they choose to switch to traditional Medicare during the annual open enrollment period. Similarly, employers might only offer a retiree health benefit that supplements traditional Medicare. If a person with such coverage switches from traditional Medicare to Medicare Advantage during an open enrollment period, they might lose their retiree health benefits.
5. How does additional support for low-income people factor into Medicare coverage decisions?
Low-income Medicare beneficiaries who meet their states’ Medicaid eligibility criteria qualify for additional coverage of services through Medicaid that are not covered under Medicare, such as long-term services and supports. Additionally, Medicare beneficiaries with low and modest incomes may qualify for assistance with Medicare premiums and out-of-pocket costs from the Medicare Savings Programs (MSP) and Part D Low-Income Subsidy (LIS) if their income and assets are below certain amounts. Medicare beneficiaries who are eligible for Medicaid, MSPs, or LIS, but not yet enrolled in these programs, can enroll at any time of the year. This additional coverage and assistance could factor into how people choose to receive their Medicare benefits.
Medicaid. For people with Medicare who qualify for full Medicaid benefits, their choice of Medicare coverage can affect how they receive Medicaid benefits and the degree to which those benefits are coordinated with Medicare. In general, Medicaid wraps around Medicare coverage, with Medicare as the primary payer and Medicaid paying for costs and services not covered by Medicare. People who are eligible for both Medicare and Medicaid (dual-eligible individuals) can enroll in a Medicare Advantage plan designed for this population, such as a dual-eligible Special Needs Plan (SNP), and depending on the state and the plan, might experience a higher level of coordination of their benefits. As of 2025, people who qualify for full Medicaid benefits can make certain changes to their Medicare coverage outside of the open enrollment period, up to once per month (see Q3 for further details).
Medicare Savings Programs. Through the Medicare Savings Programs (MSP), state Medicaid programs pay Medicare premiums and, in many cases, cost sharing for Medicare beneficiaries who have income and assets below certain amounts (while the federal government sets minimum income and asset thresholds, some states have opted for higher income and/or asset thresholds). Specifically, states cover the Medicare Part B premium for people who qualify and, in many cases, also provide assistance with Medicare deductibles and other cost-sharing requirements. People who receive MSP assistance and are enrolled in a Medicare Advantage plan might still have cost sharing associated with non-Medicare covered services offered by the plan. People who are enrolled in MSP can also make certain changes to their coverage outside of the open enrollment period, up to once per month.
Part D Low-Income Subsidy. People who qualify for the Part D Low-Income Subsidy (LIS) receive varying levels of assistance toward their Part D prescription drug coverage premiums and cost sharing, depending on their income and asset levels. People with full-benefit Medicaid coverage, people who receive Part B premium assistance through the Medicare Savings Programs, and people who receive Supplemental Security Income payments from Social Security automatically qualify for LIS benefits, and Medicare automatically enrolls them into a stand-alone Part D drug plan in their area with a premium at or below a certain amount (the Low-Income Subsidy benchmark) if they do not choose a plan on their own. Other beneficiaries are subject to both an income and asset test and need to apply for the LIS through either the Social Security Administration or Medicaid. People who receive LIS assistance can select any Part D plan offered in their area, but if they enroll in a plan that is not a so-called “benchmark plan” (that is, plans available without a premium to enrollees receiving LIS), or their current plan loses benchmark status, they may be required to pay some portion of their plan’s monthly premium. People who receive LIS can also make certain changes to their coverage outside of the open enrollment period, up to once per month.
6. How do the features of traditional Medicare compare to those of Medicare Advantage?
Traditional Medicare and Medicare Advantage both provide coverage of all services included in Medicare Part A and Part B, but certain features, such as cost-sharing requirements, provider networks, and access to extra benefits vary between these two types of Medicare coverage. When deciding between traditional Medicare and Medicare Advantage, Medicare beneficiaries might want to consider a variety of factors, such as their own health and financial circumstances, preferences for how they get their medical care, which providers they see, and their prescription drug needs. These decisions might involve careful consideration of premiums, deductibles, and cost sharing requirements; extra benefits offered by Medicare Advantage plans; how the choice of coverage might affect access to certain physicians, specialists, hospitals and pharmacies; rules related to prior authorization and referral requirements; and variations in coverage and costs for prescription drugs.
People might prefer traditional Medicare if they want the broadest possible access to doctors, hospitals and other health care providers. Traditional Medicare beneficiaries may see any provider that accepts Medicare and, if they are new to the provider, accepts new patients. (Roughly 98% of all non-pediatric physicians participate in the Medicare program.) People with traditional Medicare are not required to obtain a referral for specialists or mental health providers. Additionally, prior authorization is rarely required in traditional Medicare and only applies to a limited set of services. With traditional Medicare, people can choose among stand-alone prescription drug plans offered in their area, which tend to vary widely in terms of which drugs are covered and at what cost. (Beginning in 2026, a pilot initiative known as the Wasteful and Inappropriate Services Reduction (WISeR) model is testing the use of prior authorization in traditional Medicare for a small set of outpatient services in six states. The WISeR model is limited to traditional Medicare, though most Medicare Advantage plans already require prior authorization for some services.)
People might prefer Medicare Advantage if they want extra benefits, such as coverage of some dental and vision services, and reduced cost sharing, which is offered by most plans, often for no additional premium (other than the Part B premium). Additionally, Medicare Advantage plans are required to include a cap on out-of-pocket spending, providing some protection from catastrophic medical expenses. Medicare Advantage plans also offer the benefit of one-stop shopping (i.e., people who enroll have coverage under one plan and do not need to sign up for a separate Part D prescription drug plan or a Medigap policy to supplement traditional Medicare).
7. How do Medicare Advantage plans vary?
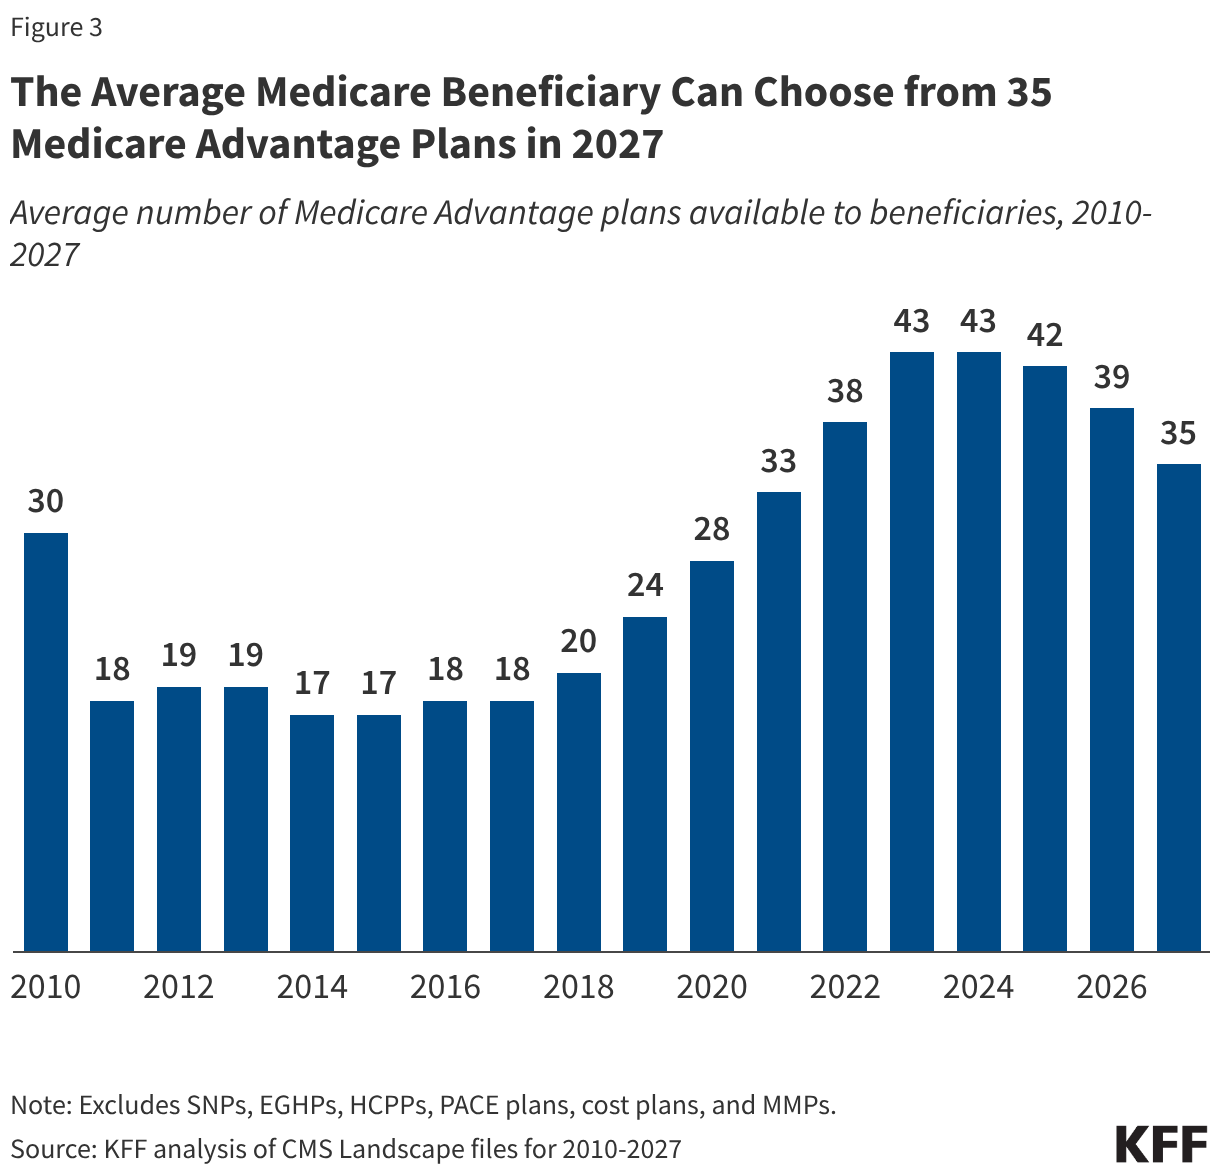
The average Medicare beneficiary can choose from 35 Medicare Advantage plans in 2027, including 28 Medicare Advantage plans with Part D coverage, though the average number of plan options varies widely across states (Figure 3). These plans vary across many dimensions, including premiums and cost-sharing requirements, provider networks, extra benefits, prior authorization and referral requirements, and prescription drug coverage. As a result, enrollees face different out-of-pocket costs, access to providers and pharmacies, and coverage of non-Medicare benefits (such as dental, vision and hearing) based on the Medicare Advantage plan they choose.
The Average Medicare Beneficiary Can Choose from 35 Medicare Advantage Plans in 2027
Average number of Medicare Advantage plans available to beneficiaries, 2010-2027
Excludes SNPs, EGHPs, HCPPs, PACE plans, cost plans, and MMPs.
KFF analysis of CMS Landscape files for 2010-2027
Premiums and cost-sharing requirements. Medicare Advantage enrollees may be charged a separate monthly premium (in addition to the Part B premium). In 2026, the average enrollment-weighted premium for Medicare Advantage plans was $15 per month, though three quarters (75%) of enrollees were in plans that charged no additional premium (apart from the Part B premium).
Medicare Advantage plans are generally prohibited from charging more than traditional Medicare, but vary in the deductibles, co-pays and co-insurance they require. For example, plans typically charge a daily co-pay for hospital stays, which vary both in the amount and the number of days for which they apply.
Medicare Advantage plans are required to include a cap on out-of-pocket expenses. In 2026, this cap may not exceed $9,250 for in-network services or $13,900 for all covered services. Most plans have an out-of-pocket limit below this cap, averaging $5,421 for in-network services and $9,825 for in-network and out-of-network services combined. Out-of-pocket limits only apply to services covered under Medicare Parts A and B.
Provider networks. Medicare Advantage plans are permitted to limit their provider networks, the size of which can vary considerably for both physicians and hospitals, depending on the plan and the county where it is offered. Medicare Advantage plans that include prescription drug coverage may also establish pharmacy networks or designate preferred pharmacies, where enrollees will have lower out-of-pocket costs. If a Medicare Advantage plan provides coverage of out-of-network providers, it may require higher cost sharing from enrollees for these services. As of 2026, the Medicare Plan Finder tool includes searchable provider directories for Medicare Advantage plans. Insurers must provide plan network information directly to CMS ahead of the open enrollment period each year, as well as notifications within 30 days of any changes to a plan’s network and annual attestations that the listed directories are up to date if no changes have taken place.
Extra benefits. Medicare Advantage plans can offer extra benefits not covered by traditional Medicare, such as some coverage of dental, vision, and hearing services. In 2026, virtually all Medicare Advantage enrollees are in a plan that offers extra benefits, including some coverage of eye exams and/or eyeglasses (more than 99%), dental care (98%), hearing exams and/or aids (95%), and a fitness benefit (91%). Additionally, a majority of Medicare Advantage enrollees are in plans that provide an allowance for over-the-counter items (68%) and meals following a hospital stay (65%). While extra benefits are common, the scope of coverage varies widely from plan to plan. For example, some plans that include a dental benefit may limit coverage to basic preventive services (e.g., dental cleanings) while others may offer coverage of a broader range services (e.g., root canals or dentures).
Special Supplemental Benefits for the Chronically Ill (SSBCI): Since 2020, Medicare Advantage plans have been able to offer a wider range of extra benefits for chronically ill beneficiaries, known as Special Supplemental Benefits for the Chronically Ill (SSBCI). These include benefits that are not primarily health related but support the health and well-being of people living with chronic illness, such as food and produce (often called grocery or healthy food benefits), assistance with housing and utilities, and transportation for non-medical needs, among others. To qualify for these benefits, Medicare Advantage enrollees must have one or more chronic conditions that meet certain criteria related to illness severity and chronic care needs and might also be required to meet additional plan-specific criteria.
Beginning with the 2027 plan year, Medicare Advantage plans must confirm that an enrollee meets these criteria using an objective process such as a health risk assessment or a claims review. Additionally, plans will be required to make the criteria they use to determine eligibility for SSBCI publicly available on their website to ensure that potential enrollees have access to this information when comparing plans.
Prior authorization and referral requirements. Medicare Advantage plans may require enrollees to receive prior authorization before a service will be covered. In 2024, nearly 53 million prior authorization requests were submitted to insurers on behalf of Medicare Advantage enrollees, and in 2026, virtually all Medicare Advantage enrollees are in plans that require prior authorization for some services, such as inpatient hospital stays, diagnostic tests and procedures, or stays in a skilled nursing facility. Prior authorization may also be required for some services included in a plan’s extra benefits, such as hearing and eye exams or comprehensive dental services. In addition, Medicare Advantage plans may require enrollees to obtain a referral from a primary care provider in order to see a specialist or mental health provider.
Medicare Advantage plans are also required to follow additional requirements when making prior authorization decisions. These include issuing decisions within a set timeframe (7 calendar days for standard requests or 72 hours for expedited requests), informing beneficiaries and providers of the specific reason a request is denied, and reporting certain information about their prior authorization processes on their public websites by March 31 each year, such as the share of requests that were approved, denied, or approved after appeal in the prior calendar year.
Prescription drug coverage. Medicare Advantage enrollees who want prescription drug coverage must choose a plan that offers this coverage, as they are not permitted to enroll in a stand-alone prescription drug plan while enrolled in Medicare Advantage. Medicare Advantage plans that include prescription drug coverage typically charge a separate drug deductible. Drug coverage in Medicare Advantage plans varies along the same dimensions as drug coverage in stand-alone Part D plans (described below).
8. How do Part D plans vary?
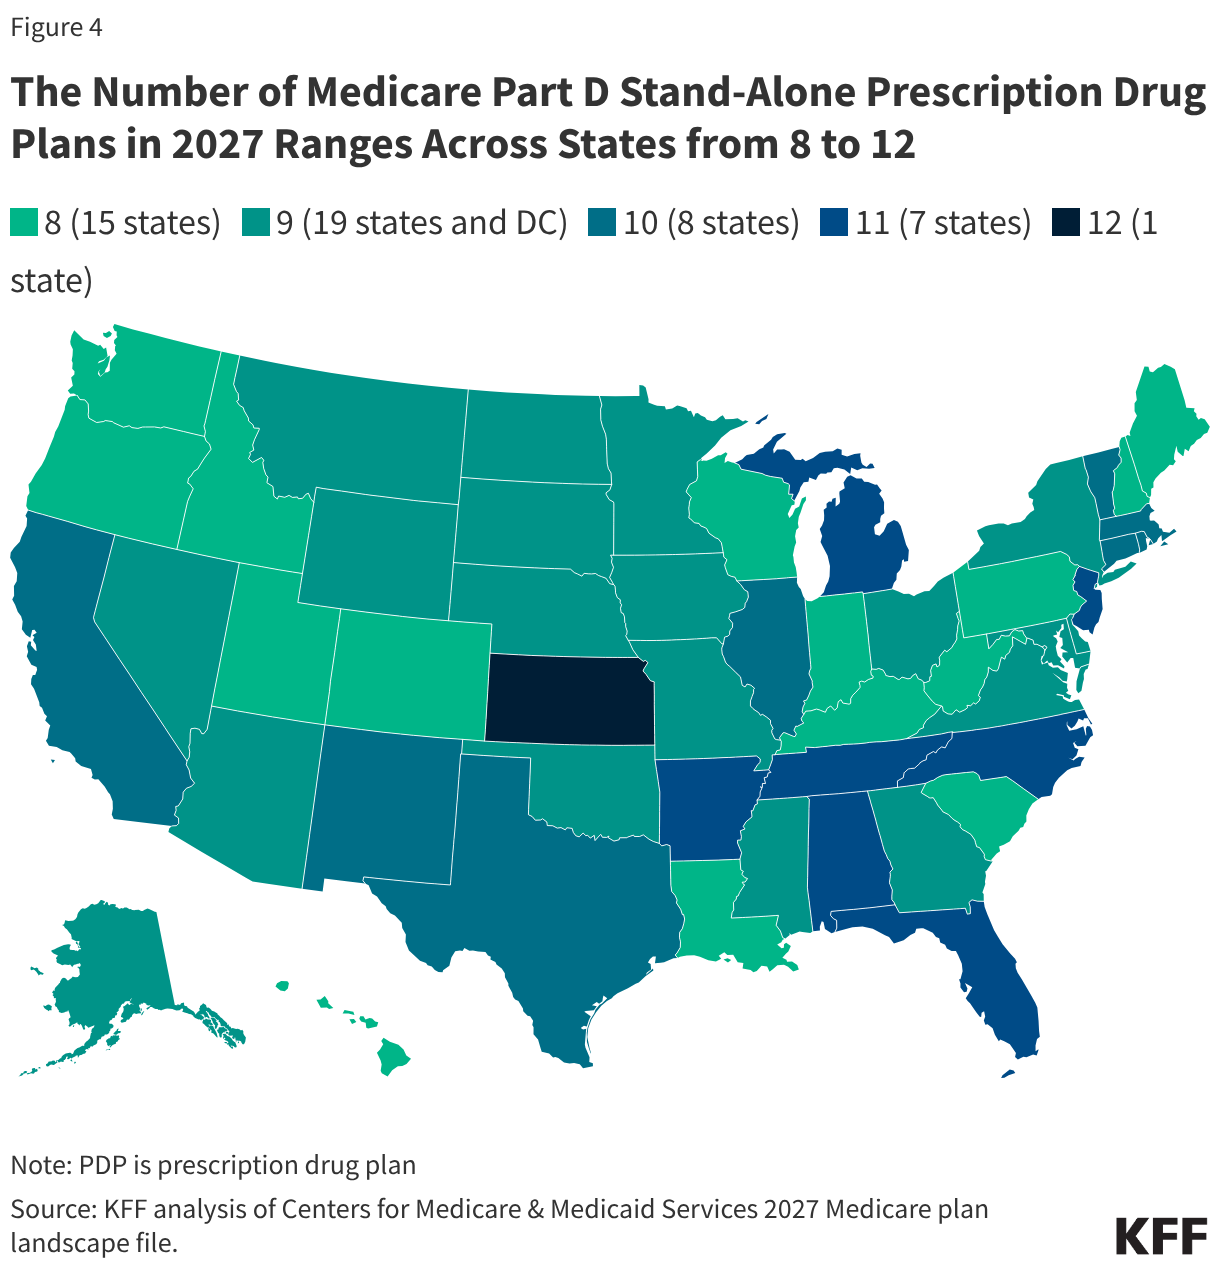
Medicare beneficiaries have between 8 and 12 stand-alone Part D plans to choose from for 2027 (Figure 4) (in addition to a large number of Medicare Advantage drug plans, if they want to consider Medicare Advantage for all of their Medicare-covered benefits). Both stand-alone Part D plans and Medicare Advantage plans that include prescription drug coverage vary in terms of premiums, deductibles and cost sharing, the drugs that are covered and any utilization management restrictions that apply, and pharmacy networks. These differences can affect enrollees’ access to prescription drugs and out-of-pocket costs.
The Number of Medicare Part D Stand-Alone Prescription Drug Plans in 2027 Ranges Across States from 8 to 12
PDP is prescription drug plan
KFF analysis of Centers for Medicare & Medicaid Services 2027 Medicare plan landscape file.
Premiums. People in traditional Medicare who are enrolled in a separate stand-alone Part D plan generally pay a monthly Part D premium unless they qualify for benefits through the Part D Low-Income Subsidy (LIS) program and are enrolled in a premium-free (benchmark) plan. In 2026, the average enrollment-weighted premium for stand-alone Part D plans was $36 per month. In comparison, most enrollees in Medicare Advantage plans that offer prescription drug coverage do not pay a premium. (Medicare Advantage plans can use rebate dollars from the federal government to reduce premiums for prescription drug coverage, funds that are not available to plan sponsors for PDPs).
Deductibles and cost sharing. Deductibles and cost-sharing requirements for prescription drugs vary across both stand-alone Part D plans and Medicare Advantage prescription drug plans. In 2027, the standard deductible for Part D coverage is $700, but some plans charge a lower or no deductible. Plans generally impose a tier structure to define the cost-sharing amounts charged for different types of drugs. Plans typically charge lower cost-sharing amounts for generic drugs and preferred brands and higher amounts for non-preferred and specialty drugs. Plans also charge a mix of flat dollar copayments and coinsurance (based on a percentage of a drug’s list price) for covered drugs. Separate cost-sharing rules apply to insulin, where copays are capped at $35 per month, and adult vaccines covered under Part D, where no cost sharing can be charged, based on provisions in the Inflation Reduction Act of 2022. Annual out-of-pocket costs for prescription drugs are capped at $2,400 for 2027.
Drugs covered and utilization management restrictions. Part D plans include a list of drugs they cover (also referred to as a plan’s formulary). In addition, plans impose utilization management restrictions on some covered prescription drugs, including prior authorization, quantity limits, and step therapy, which can affect beneficiaries’ access to medications. In 2026, Part D plans applied utilization management requirements to around half of all drugs covered on a plan’s formulary.
Pharmacy networks. Part D plans may establish pharmacy networks or designate preferred pharmacies where enrollees will have lower out-of-pocket costs.
Medicare Prescription Payment Plan. The Medicare Prescription Payment Plan is an opt-in program created by the Inflation Reduction Act and launched in January 2025 that allows Part D enrollees to pay their out-of-pocket drug costs in monthly installments throughout the year rather than paying all at once at the pharmacy. The program does not change the total amount that participants must pay for their covered prescriptions in the course of the year, and total payments are subject to the annual cap on out-of-pocket drug spending for Part D enrollees ($2,400 in 2027). The program is available to all Part D enrollees, whether they get their Part D coverage through Medicare Advantage or through a stand-alone Part D plan, regardless of their level of income. (See Q6 for a discussion of additional cost-sharing support available to low-income beneficiaries.)
Coverage of GLP-1s for obesity. The Medicare GLP-1 Bridge Program is a temporary program launched in July 2026 that offers coverage of GLP-1s for treatment of obesity. Medicare beneficiaries who are enrolled in Part D (either through Medicare Advantage or through a stand-alone Part D plan) and who meet certain clinical criteria related to their body mass index (BMI) and other health risks are eligible for coverage of GLP-1 medications for weight reduction at a copayment of $50 per month. Eligibility for the Medicare GLP-1 Bridge Program is limited to Medicare beneficiaries who have not filled a prescription under their Part D plan for a GLP-1 in 2026, and who do not have a diagnosis with a condition that is a medically accepted indication for a GLP-1 drug, such as type 2 diabetes or obstructive sleep apnea (OSA). While Medicare beneficiaries are required to have some form of Part D coverage to qualify for the GLP-1 Bridge Program, the program operates outside of participants’ Part D plan, and copayments do not count towards plan deductibles or the annual Part D out-of-pocket spending cap.
9. What changes have been made to Medicare eligibility based on immigration status?
Due to changes made in the 2025 reconciliation law, starting in July 2025, Medicare eligibility is limited to U.S. citizens and nationals, permanent residents (i.e., green card holders), Cuban-Haitian entrants, and people residing in the U.S. under the Compacts of Free Association. Lawfully present immigrants who don’t meet these criteria, such as refugees, asylees, and people with Temporary Protected Status, are no longer eligible for Medicare regardless of their age or work history. Individuals with current Medicare coverage who do not fall in any of these categories will have their coverage terminated no later than January 4, 2027. CMS has estimated that roughly 32,000 previously eligible beneficiaries will lose their Medicare coverage beginning in 2027 under these changes.
Lawfully present immigrants who remain eligible for Medicare can qualify on the basis of age, disability, ALS, or end-stage renal disease and must meet all applicable work history and residency requirements. As with U.S. citizens, immigrants with an eligible status who are ages 65 and older generally qualify for premium-free Medicare Part A if they have worked at least 40 quarters (10 years) in jobs where they or their spouse paid Medicare payroll taxes. Those ages 65 and older who do not have this work history may purchase Medicare Part A after residing legally in the U.S. for five continuous years. Immigrants with an eligible status who are under age 65 with long-term disabilities may also qualify for Medicare, provided they meet the same eligibility requirements for Social Security Disability Insurance (SSDI) that apply to U.S. citizens. These requirements are based on work history, payment of Social Security taxes on income, and having enough years of Social Security taxes accumulated to equal between 20 and 40 work credits (5-10 years).
10. What resources are available to assist Medicare beneficiaries in understanding their coverage options?
People with Medicare can learn more about Medicare coverage options and the features of different plan options by reviewing the Medicare & You handbook. In addition, people can review and compare the Medicare options available in their area by using the Medicare Plan Compare website, a searchable tool on the Medicare.gov website, by calling 1-800-MEDICARE (1-800-633-4227), or by contacting their local State Health Insurance Assistance Program (SHIP). SHIPs offer local, personalized counseling and assistance to people with Medicare and their families. Contact information for state SHIPs can be found by calling 877-839-2675 or by checking the listings provided on the Medicare.gov website or the SHIP website.
Additionally, many people use insurance agents and brokers to navigate their coverage options. While independent agents and brokers can be helpful, they are often financially compensated by private insurers for enrolling people in their plans, and may receive higher commissions if people choose a Medicare Advantage plan rather than remaining in traditional Medicare and purchasing a supplemental Medigap policy and stand-alone Part D plan. Commissions may also vary across Medicare Advantage plans, providing an incentive for enrollment in some plans over others.
Editorial Note: Originally published on January 13, 2026, this resource will be updated as needed, most recently on October 8, 2026, to reflect additional developments.
On September 18, 2025, the U.S. government (USG) released its new America First Global Health Strategy, which details how the U.S. will engage in global health efforts moving forward. As part of this new strategy, the U.S. has announced that it will be establishing bilateral health cooperation agreements with countries that receive U.S. global health assistance. These agreements, or Memorandums of Understanding (MOUs), between the U.S. and partner countries represent five-year plans (for the period 2026-2030) outlining U.S. engagement in each country’s health efforts with the goal of “helping countries move toward more resilient and durable health systems.” Central to these plans is transitioning country programs from U.S. assistance to long-term country ownership, with a pledge from each partner country to increase its domestic health spending, or co-investment in health, over the next five years as the U.S. decreases its health assistance. The U.S. began signing these agreements in late 2025 and this process is ongoing. Implementation is slated for later this year.
This tracker provides an overview of the MOUs signed to date. Data are based on press releases issued by the State Department, U.S. embassies, and partner country Ministries of Health, as well as MOU documents (if publicly available). See Methods for more information. This tracker will be updated as agreements are signed and more data become available.
USG Global Health MOUs by Country
Data as of October 8, 2026.
For countries with available MOU documents, funding data were sourced directly from MOUs, with the exception of Malawi, which is based on State Department press releases. <br>*Global health MOU agreements for Bolivia, Botswana, Panama, and South Sudan are for a three-year period.<br>**Exact agreement date unknown for Madagascar.<br>***The Philippines did not sign an official MOU but rather a "Strategic Objective Agreement." While an overall funding amount is available, co-financing details are not yet publicly available.<br>**** The U.S. funding amount was specified in Vietnam's press release, but the total MOU and country co-financing amounts are unclear. The press release states, "[Vietnam's] annual health expenditure is projected to grow by approximately $10.5 billion over the five-year MOU period, from $23.3 billion to $33.8 billion." For this reason, Vietnam is excluded from the overall country co-financing share.
Number of countries with signed agreements: 36 countries
Data as of October 8, 2026.
Signed USG global health MOU agreements are for the 5-year period, 2026-2030, with the exception of Bolivia, Botswana, Panama, and South Sudan which have a signed USG global health MOU agreement for a 3-year period. The Philippines did not sign an official MOU but rather a "Strategic Objective Agreement."
KFF analysis of U.S. Department of State, U.S. embassy, and Ministries of Health press releases, and MOU documents.
Global Health MOU Funding by Country
Number of countries with signed agreements: 36 countries
Total funding announced for the 5-year period (2026-2030): $26.7 billion
Data as of October 8, 2026.
Totals represent U.S. and country co-investment funding. For countries with available MOU documents, funding data were sourced directly from MOUs, with the exception of Malawi, which is based on State Department press releases. Global health MOU agreements for Bolivia, Botswana, Panama, and South Sudan are for a three-year period. The Philippines did not sign an official MOU but rather a "Strategic Objective Agreement."<br>*An overall funding amount is not yet available for Vietnam (the U.S. announced it would provide $98.75m for Vietnam's MOU, but country co-financing amounts are unclear. The State Department press release states, "[Vietnam's] annual health expenditure is projected to grow by approximately $10.5 billion over the five-year MOU period, from $23.3 billion to $33.8 billion").
KFF analysis of U.S. Department of State, U.S. embassy, and Ministries of Health press releases, and MOU documents.
USG Global Health MOU Co-Financing Share by Country
Number of countries with signed agreements: 36 countries
Overall country co-investment share for the 5-year period (2026-2030): 39%
Click on the buttons below to see data for
different charts:
Share  
Amount
 
Data as of October 8, 2026.
For countries with available MOU documents, funding data were sourced directly from MOUs, with the exception of Malawi, which is based on State Department press releases. Global health MOU agreements for Bolivia, Botswana, Panama, and South Sudan are for a three-year period.<br>*The Philippines did not sign an official MOU but rather a "Strategic Objective Agreement." While an overall funding amount is available, co-financing details are not yet publicly available.<br>**Co-financing details are not available for Vietnam (the U.S. announced it would provide $98.75m for Vietnam's MOU, but country co-financing details are unclear. The State Department press release states, "[Vietnam's] annual health expenditure is projected to grow by approximately $10.5 billion over the five-year MOU period, from $23.3 billion to $33.8 billion"). For this reason, Vietnam is excluded from the overall country co-financing share.
KFF analysis of U.S. Department of State, U.S. embassy, and Ministries of Health press releases, and MOU documents.
USG Global Health MOU Co-Financing Amount by Country
Number of countries with signed agreements: 36 countries
Click on the buttons below to see data for
different charts:
Share  
Amount
 
Data as of October 8, 2026.
For countries with available MOU documents, funding data were sourced directly from MOUs, with the exception of Malawi, which is based on State Department press releases. Global health MOU agreements for Bolivia, Botswana, Panama, and South Sudan are for a three-year period.<br>*The Philippines did not sign an official MOU but rather a "Strategic Objective Agreement." While an overall funding amount is available, co-financing details are not yet publicly available.<br>**Co-financing details are not available for Vietnam (the U.S. announced it would provide $98.75m for Vietnam's MOU, but country co-financing details are unclear. The State Department press release states, "[Vietnam's] annual health expenditure is projected to grow by approximately $10.5 billion over the five-year MOU period, from $23.3 billion to $33.8 billion").
KFF analysis of U.S. Department of State, U.S. embassy, and Ministries of Health press releases, and MOU documents.
USG Global Health MOU Program Areas by Country
Data as of October 8, 2026.
Global health program area information based on publicly available information but may not reflect the full scope of areas to be addressed. Global health MOU agreements for Bolivia, Botswana, Panama, and South Sudan are for a three-year period.<br>*The Philippines did not sign an official MOU but rather a "Strategic Objective Agreement."
KFF analysis of U.S. Department of State, U.S. embassy, and Ministries of Health press releases, and MOU documents.
Historical vs. Proposed 5-Year USG Global Health MOU Funding by Country
Number of countries with signed agreements: 36 countries
Total change (and percent change) in 5-year global health funding among countries with agreements: -$8.1 billion (-34%)
Click on the buttons below to see data for
different charts:
Funding Amount
 
Funding Change
 
Percent Change  
Data as of October 8, 2026.
Historical funding totals represent appropriated and planned amounts for FY21-23, and requested amounts for FY24-25 for the Global Health Programs (GHP) account. Represents U.S. funding only; does not include country co-investment funding. For countries with available MOU documents, MOU funding data were sourced directly from MOUs, with the exception of Malawi, which is based on State Department press releases.<br>*Global health MOU agreements for Bolivia, Botswana, Panama, and South Sudan are for a three-year period. For Botswana and South Sudan, prior funding represents planned global health funding for FY23-25. Due to limited data, Bolivia and Panama comparisons cannot be provided.<br>**The Philippines did not sign an official MOU but rather a "Strategic Objective Agreement." While an overall funding amount is available, co-financing details are not yet publicly available.
KFF analysis of U.S. Department of State, U.S. embassy, and Ministries of Health press releases, and MOU documents.
Historical vs. Proposed 5-Year USG Global Health MOU Funding, Funding Change by Country
Number of countries with signed agreements: 36 countries
Total change (and percent change) in 5-year global health funding among countries with agreements: -$8.1 billion (-34%)
Click on the buttons below to see data for
different charts:
Funding Amount
 
Funding Change
 
Percent Change  
Data as of October 8, 2026.
Historical funding totals represent appropriated and planned amounts for FY21-23, and requested amounts for FY24-25 for the Global Health Programs (GHP) account. Represents U.S. funding only; does not include country co-investment funding. For countries with available MOU documents, MOU funding data were sourced directly from MOUs, with the exception of Malawi, which is based on State Department press releases.<br>*Global health MOU agreements for Bolivia, Botswana, Panama, and South Sudan are for a three-year period. For Botswana and South Sudan, prior funding represents planned global health funding for FY23-25. Due to limited data, Bolivia and Panama comparisons cannot be provided.<br>**The Philippines did not sign an official MOU but rather a "Strategic Objective Agreement." While an overall funding amount is available, co-financing details are not yet publicly available.
KFF analysis of U.S. Department of State, U.S. embassy, and Ministries of Health press releases, and MOU documents.
Historical vs. Proposed 5-Year USG Global Health MOU Funding, Percent Change by Country
Number of countries with signed agreements: 36 countries
Total change (and percent change) in 5-year global health funding among countries with agreements: -$8.1 billion (-34%)
Click on the buttons below to see data for
different charts:
Funding Amount
 
Funding Change
 
Percent Change  
Data as of October 8, 2026.
Historical funding totals represent appropriated and planned amounts for FY21-23, and requested amounts for FY24-25 for the Global Health Programs (GHP) account. Represents U.S. funding only; does not include country co-investment funding. For countries with available MOU documents, MOU funding data were sourced directly from MOUs, with the exception of Malawi, which is based on State Department press releases. <br>*Global health MOU agreements for Bolivia, Botswana, Panama, and South Sudan are for a three-year period. For Botswana and South Sudan, prior funding represents planned global health funding for FY23-25. Due to limited data, Bolivia and Panama comparisons cannot be provided.<br>**The Philippines did not sign an official MOU but rather a "Strategic Objective Agreement." While an overall funding amount is available, co-financing details are not yet publicly available.
KFF analysis of U.S. Department of State, U.S. embassy, and Ministries of Health press releases, and MOU documents.
Methods
This tracker provides information on U.S. MOU bilateral global health agreements to date. Information is sourced from publicly available U.S. Department of State, U.S. embassies, and partner country Ministries of Health press release statements and MOU texts, and will be updated as more information becomes available and when additional agreements are signed. Currently, MOU text, which contains the most detailed information of these sources, is publicly available for only a limited number of countries; for these countries, data were sourced directly from these MOU documents. For countries with available MOU documents, overall totals are based on the sum of annual amounts presented in the text.
Program areas are captured using keyword searches; for global health security (GHS) specifically, country agreements were categorized as targeting GHS if they specifically mentioned GHS, or if they included descriptions of outbreak preparedness and response activities and containing health threats. Due to the limited nature of press release statements, this tracker may not comprehensively capture the global health program areas targeted in each country’s agreement.
Medicaid is the primary program providing comprehensive health and long-term care to 81 million people living in the U.S. (particularly those with low incomes) and accounts for nearly $1 out of every $5 spent on health care. Last year, Congress enacted the 2025 reconciliation law, which made major changes to Medicaid. Shortly after enactment, the Congressional Budget Office (CBO) estimated the new law would reduce federal spending on Medicaid by $911 billion over the 2025-2034 period and that it would increase the number of people without health insurance by 10 million in 2034. Reductions in federal Medicaid spending could leave states with tough choices on how to offset the loss of spending through cuts to Medicaid, cuts to other programs, or tax increases. The impacts of the changes will vary across states and will be especially substantial for states that have expanded Medicaid under the Affordable Care Act (ACA).
As the 2026 midterms approach, health care costs remain voters’ top health priority and economic worry. The interactive maps below illustrate how many people are enrolled in Medicaid in 2025 and what percentage of the population is enrolled in Medicaid for each congressional district. Enrollment numbers include enrollment in each of the major Medicaid eligibility groups. The analysis uses Medicaid administrative data to estimate Medicaid enrollment by eligibility group and Census data to estimate congressional district populations. Political affiliation refers to the party of the current incumbent. See Methods for more details. Key takeaways include:
There are 52,900 or more Medicaid enrollees living in each congressional district, with enrollment as high as 496,500 in a district. In each congressional district, there are at least 3,600 Medicaid enrollees ages 65 and older, 3,900 enrollees eligible because of a disability, 7,500 child enrollees, and 6,600 other adult enrollees.
In half of all Republican congressional districts, 20% or more of the population is enrolled in Medicaid, and in half of all Democratic districts, 25% or more of the population is enrolled in Medicaid.
Republican districts have a higher share of Medicaid enrollees who are children or eligible because of a disability, compared with Democratic districts which have a higher share of expansion enrollees and adults ages 65 and older. However, this varies by specific district and depends on whether a state has adopted the Medicaid expansion; there are both Democratic and Republican districts with high shares of ACA expansion enrollees.
The top 10 Republican districts with the highest number of Medicaid enrollees are: CA-22 (496,100); CA-23 (375,200); LA-05 (347,200); CA-20 (324,100); NY-11 (313,900); LA-03 (312,700); KY-05 (311,000); LA-04 (302,200); CA-01 (298,000); and WV-01 (289,000).
The top 10 Democratic districts with the highest number of Medicaid enrollees are: NY-15 (496,500); CA-21 (450,600); CA-43 (449,400); CA-37 (431,500); CA-13 (427,900); CA-34 (426,200); NY-14 (419,200); NY-13 (404,500); CA-29 (395,800); and NY-08 (374,900).
Medicaid Enrollment by Eligibility Group and Congressional District, 2025
Enrollment numbers were rounded to the nearest 100. The sum of the Medicaid eligibility groups may not add to total enrollment due to rounding.
KFF analysis of the T-MSIS Research Identifiable Files, CY 2024; Missouri Census Data Center GeoCorr tool; MBES Medicaid Enrollment – New Adult Group, June 2025
Share of Congressional District Enrolled in Medicaid, 2025
Enrollment numbers were rounded to the nearest 100. The sum of the Medicaid eligibility groups may not add to total enrollment due to rounding.
KFF analysis of the T-MSIS Research Identifiable Files, CY 2024; Missouri Census Data Center GeoCorr tool; MBES Medicaid Enrollment – New Adult Group, June 2025; Census ACS 1-year Estimates, 2024; U.S. Census Bureau Vintage 2025 Population Estimates
Medicaid Enrollment by Eligibility Group and Congressional District, 2025
Enrollment numbers were rounded to the nearest 100. The sum of Medicaid eligibility groups may not add to total enrollment due to rounding.
KFF analysis of the T-MSIS Research Identifiable Files, CY 2024; Missouri Census Data Center GeoCorr tool; MBES Medicaid Enrollment – New Adult Group, June 2025; Census ACS 1-year Estimates, 2024; U.S. Census Bureau Vintage 2025 Population Estimates
Methods
Data: To calculate Medicaid enrollment by eligibility group and congressional district, this analysis uses the 2024 Transformed Medicaid Statistical Information System (T-MSIS) Research Identifiable Demographic-Eligibility and Claims Files, the Missouri Census Data Center’s GeoCorr 2022 data (downloaded in September 2026), the Medicaid new adult group enrollment data collected through the Medicaid Budget and Expenditure System (MBES) for June 2025 (downloaded in August 2026), the Census American Community Survey (ACS) 1-Year Estimates, 2024 (downloaded in August 2026), and the U.S. Census Bureau Vintage 2025 Population Estimates (downloaded in September 2026).
Assigning Medicaid Enrollees to Congressional Districts: This analysis used the Missouri Census Data Center’s GeoCorr tool to create a zip code-to-congressional district crosswalk. Using the crosswalk, Medicaid enrollees were assigned to congressional districts in the T-MSIS data.
In some cases, a zip code can be split among multiple congressional districts. In those cases, enrollees were randomly assigned to a congressional district based on a zip code-to-congressional district allocation factor from the GeoCorr tool that is calculated using the 2020 decennial census.
The analysis applied the T-MSIS distributions of enrollees in eligibility groups and congressional districts to the MBES administrative enrollment data. Those data report enrollment for adults eligible through the Affordable Care Act (ACA) and for all other Medicaid enrollees on a quarterly basis.
Calculating Congressional District Population: To estimate 2025 congressional district population, two approaches were used: one for states that were redistricted and another for states that did not redistrict.
Redistricted states: GeoCorr 2022’s county-to-congressional district population distributions were used to estimate the share of each county’s population in each congressional district. County crosswalks were used instead of zip code as Census data does not report population estimates at the zip code level. County population totals from the Census Bureau Vintage 2025 Population Estimates were applied to those distributions and summed to the congressional district level. The states that redistricted are Alabama, California, Florida, Louisiana, North Carolina, Ohio, Tennessee, Texas, and Utah.
Non-redistricted states: ACS 2024 congressional district populations were used to estimate the share of state population in each congressional district, and then those shares were applied to the Census Bureau Vintage 2025 state population estimates.
Assigning Political Party to Congressional Districts: The political party of the current incumbent was used to assign political party affiliation to each congressional district. For vacant congressional seats, FL-20 and TX-23, the Cook Political Report projections for the districts (accessed September 2026) were used instead. Their political affiliations are Democrat and Republican, respectively.
Enrollment in the Affordable Care Act (ACA) Marketplaces fell in 2026 for the first time in seven years, following the expiration of the enhanced premium tax credits at the end of 2025. Nationally, effectuated enrollment declined from 21.8 million people in 2025 to 19.2 million in February 2026, a 12% drop, and is expected to further decline through the remainder of 2026. A KFF survey of 2025 Marketplace enrollees found that 1 in 10 reported they had become uninsured in early 2026. For remaining enrollees, health costs have risen substantially, with premium payments rising 58% on average, and deductibles up by 37% or about $1,000 per person.
Changes in enrollment, however, were not evenly distributed across the country. Marketplace enrollment changed substantially from one state to another, and even within states. In some congressional districts, a sizable portion of the population are enrolled in ACA Marketplace plans, such as several districts in Florida in which almost 30% of the population is enrolled.
This analysis estimates how Marketplace enrollment varies both within and across states using both publicly available data on federally facilitated Exchanges (FFEs) from the Centers for Medicare and Medicaid Services (CMS) and data provided by state-based Exchanges (SBEs). Enrollment estimates are rounded to the nearest thousand. Key takeaways include:
Marketplace enrollment varies widely by congressional district: from as low as 2,000 people to 249,000 people.
In 12 Democratic districts and 16 Republican districts, more than 100,000 people are enrolled in an ACA plan, based on the incumbent representative. All these districts are in Florida, Texas, or Georgia.
Marketplace enrollment fell more sharply in Republican-held congressional districts, which account for 55% of current enrollees but 67% of the enrollment decline between 2025 and 2026.
The top 10 Republican districts with the highest number of Marketplace enrollees are: FL-27 (249,000), FL-28 (238,000), FL-26 (223,000), FL-11 (139,000), FL-21 (128,000), FL-18 (127,000), TX-15 (124,000), FL-19 (121,000), FL-05 (109,000), and FL-12 (105,000).
The top 10 Democratic districts with the highest number of Marketplace enrollees are: FL-24 (229,000), FL-25 (192,000), FL-20 (183,000), FL-10 (182,000), FL-09 (172,000), FL-22 (155,000), FL-23 (145,000), TX-28 (132,000), FL-14 (116,000), and GA-13 (109,000).
ACA Marketplace Enrollment in Some Congressional Districts in Florida, Texas, and Georgia Exceeds 100,000 People
ACA Marketplace effectuated enrollment, by congressional district (120th Congress), 2026
Number of enrollees
% of population
Change from 2025
Florida, Georgia, Texas, and Utah Have the Highest Rates of ACA Enrollment<br><br>
Share of population enrolled in the ACA Marketplace, by congressional district (120th Congress), 2026
Number of enrollees
% of population
Change from 2025
Few Congressional Districts Saw Increased ACA Marketplace Enrollment in 2026<br><br>
Percent change in ACA Marketplace enrollment, by congressional district (120th Congress), 2025-2026
Number of enrollees
% of population
Change from 2025
2025 enrollment values are adjusted for redistricting.
The number of people enrolled in an ACA Marketplace plan varies widely across the country, reflecting differences in demographics, eligibility, the availability of other sources of coverage, and state Marketplace policies. Enrollment is generally highest in the South, where several states have not expanded Medicaid, leaving some low-income people eligible for subsidized Marketplace coverage instead. Florida has 21 congressional districts with more than 100,000 Marketplace enrollees, including the 11 districts with the highest enrollment nationwide. Texas and Georgia also have districts with more than 100,000 enrollees.
Marketplace enrollment is estimated to account for a large share of the population in several Florida districts, including 31% in FL-27, 30% in FL-28, 29% in FL-24, and 28% in FL-26. Districts in Georgia, Texas, and Utah also have Marketplace enrollment representing at least 10% of the population. Most ACA Marketplace enrollees (55%) live in a Republican-held congressional district. This is roughly proportionate to Republicans’ share of House seats. Two-thirds of the enrollment decline between 2025 and 2026 occurred in Republican-held districts (67%).
Marketplace enrollment is much lower in states with broader public coverage options. Twenty-four of the 25 congressional districts with the lowest estimated Marketplace enrollment are in New York, each with less than 10,000 enrollees. Minnesota, Oregon, Kentucky, and Hawaii also have low ACA Marketplace enrollment. In the majority of their congressional districts, less than 3% of the population are enrolled in an ACA plan. All five states have expanded Medicaid eligibility up to 138% of the federal poverty line (FPL), and New York, Minnesota, and Oregon additionally offer Basic Health Plans that cover low-income residents.
Figure 2
States with the Highest Share in ACA Marketplaces Voted for Trump in the 2024 Presidential Election
Share of population enrolled in ACA Marketplace, by state and 2024 presidential election winner
Note: Population data used to calculate share enrolled in ACA Marketplace are from 2025. Enrollment data are from 2026.
ACA Marketplace enrollment represents a substantial share of the population in many states, but the share varies widely. Overall, the share of state populations enrolled in ACA Marketplace plans tends to be highest across the South, where several states have not expanded Medicaid, while shares are generally lower in the Northeast and Midwest. Thirteen states have greater than 5% of their population enrolled in ACA Marketplace coverage; they were all won by President Trump in 2024.
Florida has the highest share, with 16% of its population enrolled in a Marketplace plan, followed by Georgia (11%), Texas (10%), and Utah (10%). In contrast, enrollment accounts for less than 2% of the population in New York (1%), Hawaii (2%), Minnesota (2%), and the District of Columbia (2%).
Methods
To estimate effectuated enrollment by congressional district, effectuated enrollment was first determined at the county level and then allotted to congressional district. For states operating state-based exchanges (SBE), 2026 county enrollment data provided by the exchanges directly are February or first quarter effectuated enrollment, measured as of at least March 15. When county effectuated enrollment was not available, it was estimated by multiplying county plan selection counts by the state-level effectuation rate. This method was used to estimate enrollments for all counties in 2025, and in 2026, counties in FFM states and SBE states where only plan selection data were available (California, Idaho, Maryland, and Pennsylvania). County plan selections were obtained from the CMS Open Enrollment Period (OEP) County-Level Public Use File (PUF) for FFE states or directly from the SBE; state-level effectuation rate was derived from the OEP State-Level PUF and CMS’s Monthly Effectuated Enrollment data. Allocation of county effectuated enrollment to congressional district was based on the 2020 decennial census distribution using the Census Bureau block equivalency file for the 120th Congress for all states except Missouri, which retained the block equivalency of the 119th Congress.
Population estimates from 2026 are not yet available so data for 2025 were used, which may slightly overestimate the share of population enrolled in Marketplace coverage in states with large recent population growth. (For reference, state population change from 2024 to 2025 ranged from -0.3% in Vermont to +1.5% in South Carolina.) To estimate the population of each congressional district, state population estimates from Vintage 2025 of the Census Bureau Population Estimates Program were allocated to congressional districts using the population distribution from the Census Bureau 2024 American Community Survey 1-year estimates. A different method was used for states that recently redistricted: Alabama, California, Florida, Louisiana, North Carolina, Ohio, Tennessee, Texas, and Utah. In these states, the Vintage 2025 county population estimates were allocated to congressional district using the distribution from the 2020 decennial census.
Congressional district maps of effectuated enrollment account for redistricting ahead of the 120th Congress. 2024 House race vote margins were marked as NA for districts with boundary changes after the 2024 election ahead of the 120th Congress. These were identified by comparing Census Bureau block equivalency files for the 119th and 120th Congress for all states other than Missouri.
Appendix
ACA Marketplace Enrollment, by Congressional District, 2026
2025 enrollment estimates are adjusted for redistricting.
Federal health agencies are testing new applications of AI in health care that move beyond narrow clinical support tasks into more direct patient care typically handled by physicians. Questions about AI accuracy remain, however, and may be complicated by unpredictable outputs and changes in performance over time.
Recent research also suggests that how health claims are presented may affect how people respond to them, beyond the accuracy of the underlying information. People may place more trust in information from an AI chatbot that offers conversational responses, while presenting false claims as coming from an authoritative source may increase people’s willingness to share them.
AI & Emerging Technology
Federal Officials Pilot AI Health Tools with Greater Autonomy as Accuracy Questions Remain
New federal pilot programs are testing AI tools that can perform clinical functions traditionally handled by physicians, including interacting directly with patients, providing therapy, diagnosing conditions, and recommending or adjusting treatment with less direct physician involvement. This marks a shift beyond AI’s more established role in narrower tasks, like reviewing scans or test results. According to The New York Times, more than 200 companies have received Centers for Medicare and Medicaid Services (CMS) approval to test AI tools like these, and the Food and Drug Administration (FDA) has allowed four of them for use with Medicare patients outside its standard approval process. The projects include an AI chatbot that delivers cognitive behavioral therapy and a federally funded project developing AI that would adjust medication for heart failure patients, under legally required physician oversight.
Perspectives about how much independence these systems should have vary. The American Medical Association, for example, has said that AI should continue to support rather than replace physician care. On the other hand, an August 2026 JAMA perspective piece argued that AI could soon match or exceed physicians at several tasks. Officials working on more autonomous AI systems have said that these tools that can act without a clinician directing each decision could expand access to care for people who can’t easily see a specialist.
Older AI-enabled medical devices already approved by the FDA for narrower tasks like reading a scan or test result have raised accuracy concerns. An August 2025 research letter in JAMA Health Forum examined 950 AI devices the FDA had cleared as of late 2024, finding that 60 were recalled a combined 182 times, mostly for diagnostic or measurement errors. Nearly half of those recalls happened within the device’s first year on the market. The FDA has said that newer uses of AI, including systems like those being piloted under Medicare, may be harder to evaluate than existing devices because they can produce unpredictable outputs and change over time. The agency has not yet established rules for evaluating this newer category of AI and is accepting public comment through October 19, 2026.
KFF polling from September 2025 found low levels of trust in health care apps that relied on AI to provide medical information: just one-third (32%) of the public said they would trust a health care app, website, or patient portal that uses artificial intelligence (AI) to access their medical records and provide personalized health information.
What To Watch Out For
As federal agencies test and set new rules for evaluating this newer category of AI tools, what standards will determine whether AI is accurate and safe enough to make clinical decisions with less direct physician involvement?
Conversational AI Chatbots and Perceived Authority May Shape Trust in Health Claims
Recent research suggests that people may place more trust in health information when AI appears conversational or when a claim is presented as coming from an authoritative source, even when the underlying information is wrong or weakly supported.
A more conversational AI chatbot led people to trust its answers more, in part because they perceived it as less rigid and more capable of subjective judgment, according to one recent experiment. This effect extended to claims that researchers described as “ridiculously wrong,” including a claim that ginger is more effective than chemotherapy for treating cancer. Giving participants the option to verify the chatbot’s answers did not produce a statistically significant change to their trust. Only those who clicked to check the information showed reduced trust, and only half of those offered the choice did so.
The apparent authority of who delivers an AI-generated health claim may have a similar effect on whether people say they’d share it. Researchers in China showed 320 older adults one of four AI-generated videos presenting the false health claim that combining vitamin B with dandelion tea could prevent or treat the flu. The videos varied who delivered the claim and how well-argued it was, portraying either an ordinary social media user or a supposed researcher wearing a lab coat. When the argument was weak, people who saw the video from the authoritative source were more likely to say they would share it than those who saw the video from the ordinary user. The difference was not significant when the argument was stronger, nor did stronger arguments make the claim itself appear more credible.
Whether perceived authority has a similar effect in the United States, where trust in scientists has declined in recent years but trust in doctors and health care providers remains high, is unclear. A similar finding has been documented, though, in research about false claims on social media. A recent study, including both an observational analysis of data from 8.7 million tweets and an experiment with U.S.-based participants, found that mentions of scientific authority were associated with a greater willingness to share, including when the underlying content was false. Polling from Pew Research Center has found that medical training, transparency, and clarity were the top three most important characteristics cited by the public when it comes to what they want from health information sources.
Why This Matters
Efforts to address false claims on AI platforms and social media may need to focus not only on the claims themselves, but also on making it easier for people to recognize when seemingly credible information should be verified. KFF’s Tracking Polls on Health Information and Trust have found that many adults who use AI for health information do not later follow up with a doctor, and most who use social media for health information similarly say they do not regularly follow up with providers or other sources to verify the accuracy of health information they come across.
What We’re Watching
As People Express Uncertainty on Health Claims, Health Care Providers Remain Influential Sources of Information
Polling from KFF and other organizations has found that many people are uncertain about health claims rather than consistently accepting or rejecting them. Majorities of adults in KFF’s polling on Health Information and Trust fall into the “malleable middle,” saying that claims are either “probably true” or “probably false.” In KFF’s June 2026 Tracking Poll on Health Information and Trust, for example, at least half of the public expressed uncertainty about four common vaccine myths, including that the measles, mumps, and rubella (MMR) vaccine had been proven to cause autism in children (61%) or that more people have died from COVID-19 vaccines than have died from COVID-19 itself (52%).
The recent 2026 Edelman Trust Barometer Special Analysis, conducted with the Yale School of Public Health, adds to this research by examining the range of sources people draw on when forming those views, including what they value from health care providers. The survey of adults across 13 countries asked about six claims, including about vaccines, fluoride, raw milk, and acetaminophen use during pregnancy. Similar to findings from KFF’s polling, few people believed all of the claims were true or false, with more expressing a mix of beliefs or saying that they did not know.
The Edelman analysis also provides insight into how people form these views, with respondents citing their own research and experiences, friends and family, news and social media, and health care providers. The influence of health care providers ranked highly regardless of how many health myths people believed, but those who believed three or more were more likely to cite a wider range of sources as influencing their beliefs, including AI platforms and content creators without medical training. KFF’s June 2026 Tracking Poll also found that frequent use of social media and AI for health information was associated with a greater tendency to believe vaccine myths.
Why This Matters
Many people express uncertainty about common health claims rather than firm views in either direction, and health care providers may play an important role in helping them work through that uncertainty. Respondents in the Edelman survey said that they valued providers who listened to their concerns, took their perspectives into account, and communicated with humility and respect. Similarly, KFF’s June 2026 poll found that adults who had a trusted health care provider were less likely than those with no trusted provider to believe vaccine myths. Understanding how providers can engage with people who are uncertain may be important for addressing health myths.
EPA Study of Mifepristone in Drinking Water May Shape Abortion Pill Debate, Even Before Its Findings Are Known
Despite a lack of evidence of any harms, the Environmental Protection Agency (EPA) is launching a national drinking-water study to test for the presence of mifepristone and misoprostol, two medications that are part of the medication abortion regimen. These drugs are also used for miscarriage management, to induce labor, and in the treatment of certain autoimmune diseases. This review is the latest development in a yearslong effort by some groups opposed to abortion to use environmental claims about the drug to restrict access. Earlier this summer, a journal run by anti-abortion physicians published a report purporting to show mifepristone in drinking water, but it only measured for any progesterone-blocking compound, not mifepristone specifically. The new EPA study, by contrast, aims to specifically measure for mifepristone, alongside more than 1,400 other pharmaceuticals, pesticides, and synthetic chemicals.
The EPA’s method, known as non-targeted analysis, can only detect whether a substance is present in a water sample, not its concentration or whether it poses any health risk. Despite the absence of any evidence documenting any harms, there have been claims that suggest that the public could face fertility or reproductive effects from exposure in water supplies. The report published earlier this summer made similar claims about the potential health effects of mifepristone in water, as have some anti-abortion state attorneys general and members of Congress. The FDA’s own environmental assessment of mifepristone, though, estimated concentrations under one part per billion, too low to impact standard test organisms.
Why This Matters
Having a major federal agency like the EPA decide to test for the drugs in drinking water may lend credence to these unsupported environmental claims, regardless of the agency’s eventual findings. False environmental claims about the harms of mifepristone have already been used to support proposed legislation in seven states and can shape public opinion regardless of the lack of documentation of any harm. Unsubstantiated claims about mifepristone in drinking water may cause unnecessary apprehension for people who already have concerns about fertility or reproductive health, making the distinction between just the ability to detect the drug in water supplies and establishing a concrete health risk especially critical.
About The Health Information and Trust Initiative: the Health Information and Trust Initiative is a KFF program aimed at tracking health misinformation in the U.S., analyzing its impact on the American people, and mobilizing media to address the problem. Our goal is to be of service to everyone working on health misinformation, strengthen efforts to counter misinformation, and build trust.
The Monitor is a report from KFF’s Health Information and Trust initiative that focuses on recent developments in health information. It’s free and published twice a month.
Support for the Health Information and Trust initiative is provided by the Robert Wood Johnson Foundation (RWJF). The views expressed do not necessarily reflect the views of RWJF and KFF maintains full editorial control over all of its policy analysis, polling, and journalism activities. The data shared in the Monitor is sourced through media monitoring research conducted by KFF.
Women’s Experiences with and Attitudes Towards Family Support Policies
There has been increased attention on declining fertility rates in the U.S. and globally. Fertility rates have been falling for many years, but they have been in the spotlight of media coverage recently, in part because of the current Administration’s focus on pronatalist policies aimed at encouraging people to have more children. Considerable financial and structural barriers face people who want to start families, including expensive and limited childcare options, inconsistent and limited paid leave and workplace flexibility, low economic mobility, and high cost of living.
The 2026 KFF Women’s Health Survey is a nationally representative survey of 4,688 women and 1,148 men ages 18 to 64, fielded between March 11, 2026 to April 14, 2026. This analysis presents data among women 18 to 49 (n=3,538) and men 18-49 (840), and highlights women’s opinions regarding the possible impact of potential federal actions on their decision to have children in the future as well their experiences with paid parental leave and sick leave in the workplace.
One in four women ages 18 to 49 say they are considering having children in the next three years. Less than a quarter of reproductive age women (23%) are considering having or adopting a child in the near future, including 24% of those who do not currently have children (under 18 years old). Six in ten women (63%) say they are not planning on having children in the next three years.
While the majority of reproductive age women say that greater family support policies such as assistance with childcare costs and mandatory paid parental leave would not affect their plans to have children, some say they would be more likely to consider growing their families if these policies were in place. Four in ten women say they are more likely to consider having children if the government assisted with childcare costs (43%) or required employers to offer paid parental leave (43%). This rises to about seven in ten among women who are already considering having a child in the near future. Half of men say these two policies would make them more likely to consider having children.
Compared to government assistance with childcare costs and mandatory paid parental leave, somewhat fewer women say the expansion of the child tax credit and one-time cash bonuses for a new child in the family would make them more likely to have children in the near future. One-third of reproductive age women say that if the government increased the child tax credit (35%) or provided a one-time cash payment to parents after welcoming a new child (35%), they would be much or somewhat more likely to consider having a child.
There is wide variation in the types and amount of parental leave women take, including whether they take any at all. Among employed women who had or adopted a child in the past three years, half (52%) took some amount of paid leave. About one-third (35%) took only unpaid leave, while more than one in ten (13%) did not take any leave after the arrival of their child. Among those who took leave, four in ten (37%) took up to two months of time in total, one third (34%) took between 9 to 12 weeks of leave, and 28% took more than 12 weeks off.
Women are the primary caretakers for children when they are sick at nearly three times the rate of men, and many women lose pay when they take time off. Nearly three times as many working women (58%) than men (20%) say they are the ones who care for their child when they are sick and cannot go to school. Among these women who care for their child either alone or with a partner, half (53%) report losing pay when they miss work.
The majority of reproductive age women say they are not planning on having children in the next three years, including those who are already parents of a young child. About one in four women age 18 to 49 (23%) are considering having or adopting a child in the next three years (Figure 1). Larger shares of younger women between the ages of 18 and 25 (22%) and between 26 and 35 (33%) say they are planning on having children compared to women in their later reproductive years (13%). By political affiliation, more Republican women (29%) than Democrats (20%) plan on having children in the next three years. Almost half (45%) of reproductive age women are already parents to a child under 18 years old (data not shown). Half as many parents with older children (14%) than parents of younger children (28%) are planning on having another child in the next three years.
Less Than A Quarter of Reproductive Age Women Are Considering Having Children in the Next 3 Years
Stacked bars showing the share of women ages 18-49 considering having or adopting a child in the next 3 years with variation across age groups, income levels, partisanship, race/ethcnity, and parental status.
Income is based on 2023 ASPE income levels. Two hundred percent (200%) of the federal poverty level (FPL) in 2023 for an individual was $29,160. Persons of Hispanic origin may be of any race; other racial groups are non-Hispanic. The sample primarily includes English-speaking Asian adults and, therefore, may not be representative of the overall Asian adult population. *Estimate for "Yes" is statistically different than reference (ref) estimate within group (p < 0.05).
KFF Women's Health Survey 2026.
Influence of Potential Family Supports
The costs of having children and raising a family have never been higher. The current administration and other conservative policymakers have been pushing for young Americans to start families and have more children to address concerns about the declining birth rate in the U.S. They have discussed some ideas that they say would help, such as “Trump Savings Accounts,” a “motherhood medal” for women with six or more children, and most recently, using childcare subsidy funds to pay stay-at-home parents. The Administration has also proposed policies aimed at expanding access to fertility care such as in vitro fertilization (IVF), including discounts on medications and clarifying insurance rules for employers that want to offer fertility benefits to their workers.
Many factors come into play when people are thinking about having a child, including cost of living and income, the cost of raising a child, or certainty about having children. Previous KFF research has found that affordable and high-quality childcare is particularly daunting and difficult to find. Some policymakers have been advocating for policies that are intended to support families by offering broader financial assistance.
The survey probed whether people would be more likely to have children if the government did each of the following:
expanded the child tax credit
offered a one-time cash bonus for a new child in the family
provided more financial assistance with childcare costs
required employers to offer paid parental leave
Overall, less than half of reproductive age women say that enhanced family support policies would make them more likely to consider having a child.
About one-third of reproductive age women say that they would be much more likely or somewhat more likely to consider having a child if the government increased the child tax credit (35%) or provided a one-time cash bonus to parents after welcoming a child (35%). Most women say that these two policies would not have much or any impact on whether they have a child (Figure 2).
The federal child tax credit lowers the amount of taxes that parents/guardians of dependent children under age 18 owe. In 2021, the American Rescue Plan Act (ARPA), a COVID relief law, included a temporary expansion of the child tax credit. Research has found that the policy lowered the rate of child poverty, but that its economic benefits were uneven across different populations.
In the past few years, some states and locales have experimented with different models of cash payments to new parents, and recently, the Trump Administration launched tax-preferred investment accounts available to families with children, with the federal government providing an initial $1,000 deposit for the youngest children.
One Third of Women Say Proposed Family Support Policies Would Make Them More Likely to Consider Having A Child; More Men Say They Would Make a Difference
Stacked bar chart showing how increasing the child tax credit, one-time cash payments to parents, help with childcare costs, and paid parental leave would impact women and men in their consideration in having a child. Across all four, more men than women say that these family support policies would make them much or somewhat more likely to consider having children.
Among women and men 18 to 49. *Estimate for "Much more/somewhat more likely" is statistically different than reference group (ref) (p<0.05).
KFF Women's Health Survey 2026.
About four in ten reproductive age women say that if the government provided more financial assistance with childcare costs (43%) or required employers to offer paid parental leave (43%), they would be more likely to consider having a child, but half say that these two policies would have little or no impact. Higher shares of women who are Asian or Hispanic say they would be more likely to consider having a child if these policies were in place (Appendix Tables 3, 4).
Nationally, the average cost of childcare exceeds $13,000 annually, and many parents say that affordable childcare is difficult to obtain. Government assistance with childcare expenses can come in various forms, such as vouchers to help pay costs, public preschools, and tax incentives. Furthermore, the United States is one of the few industrialized nations that does not require employers to provide paid time off for new parents, but some states have enacted paid leave policies that cover a portion of their workers’ salaries.
Consistently, slightly higher shares of men than women say if the government required more family supportive policies that would make them more likely to consider having a child. More than four in ten men ages 18 to 49 say if the government increased the child tax credit (45%) or provided a one-time cash bonus to parents (46%) that they would be much more or somewhat more likely to consider having a child (Figure 2). About an equal share of men, though, say that these policies would not make much difference or any at all. Half of men say they would be more likely if the government provided more assistance with childcare costs or mandated paid parental leave. About four in ten men say these policies would not have much or any impact (Figure 2).
Compared to increased child tax credits and one-time cash incentives, government assistance with childcare expenses and mandatory paid parental leave would make reproductive age women more likely to consider having children, but the rates are highest among those already considering having children. About seven in ten reproductive age women who say they are considering having a child in the next three years also say they would be more likely to consider having a child if the government offered assistance with the costs of childcare (68%) or required paid parental leave (72%) (Figure 3). Notably, more than half of reproductive age women who are unsure about having a child in the next three years also say that support with childcare costs (57%) and paid parental leave (54%) would make them more likely to have children. However, just over one-third (37%) of women who are not considering having a child in the near future say these policies would affect their childbearing plans, but most say they would not make much difference or any at all.
Family Supports Would Have Greatest Impact on Women Already Considering Having A Child in Near Future
Stacked bar chart showing how increasing the child tax credit, one-time cash payments to parents, help with childcare costs, and paid parental leave would impact women and men in their consideration in having a child. Across all four, women who are already considering having children say these policies would make them much or somewhat more likely to have children.
Among women 18 to 49. Data stratified by response to this question: <i>Within the next 3 years, are you considering having or adopting a child? </i> 23% of women responded Yes, 63% responded No, 14% responded Not sure.*Estimate for "Much more/somewhat more likely" is statistically different than reference group (ref) (p<0.05). Totals do not add to 100% due to rounding.
KFF Women's Health Survey 2026.
Paid Parental Leave
Among the family support policies the survey asked about, the largest share of women said that paid parental leave would make them more likely to consider having a child. Paid parental leave benefits have been found to be associated with positive health outcomes, including shorter recovery times for women after childbirth, stronger bonding attachments with newborns, and greater access to breastfeeding. Yet, the United States is one of the few industrialized nations that does not have a national paid leave standard for parents caring for a new child or workers that need leave work to care for themselves or family members due to an illness or health condition. The federal Family and Medical Leave Act (FMLA) requires eligible employers to provide certain workers unpaid family leave, but only a minority of workers in the private sector have a paid family leave benefit. This gap has garnered increasing attention among elected officials at the national and local levels, and more than a dozen states now have paid leave policies in place.
More than half of women who had a child in the past three years (57%) were employed at the time, and about half (52%) took some paid time off after the arrival of their child (Figure 4). While most employed women took some time off work after childbirth or adoption, more than one in ten (13%) did not take any time off. Half (52%) took time off and were paid for at least a portion of that time, while 35% took only unpaid time off.
Among women who took leave after having a child, about four in ten took up to two months or 8 weeks of leave (Figure 5). There is a wide range in the amount of time women take off work after having a child in the U.S. Thirteen percent (13%) of women who had a child in the past three years report taking up to one month of leave, 24% took between five and eight weeks off, a third (34%) took between nine and 12 weeks, while only one in four took more than 12 weeks (28%). Twelve weeks is much shorter than the required maternity leave in most other developed countries, which averages around four months or 17 weeks of paid leave. The amount of parental leave women take in the U.S. is governed by several factors, including whether their employer is required by state law to offer parental and sick leave and the amount of wages they cover. Other factors affecting the amount of leave include their income, childcare availability, and their own or their infant’s health status and needs.
Four in Ten Women Took 8 Weeks or Fewer of Leave After Their Last Childbirth or Adoption
Pie chart showing the number of weeks of leave employed women took during their last childbirth or adoption. The majority of women took 12 weeks or fewer of leave, which includes paid and unpaid leave.
Among women 18 to 49 who have adopted a child or have given birth in the past 3 years and took paid or unpaid family leave from their job.
KFF Women's Health Survey 2026
Paid Sick and Medical Leave
Like with parental leave, there is no federal law requiring employers to pay workers when they need time off to care for themselves, children, or other family members who are sick. However, far more employers do provide this benefit than not, and about eight in ten workers have some level of sick leave benefit. For workers with children, paid sick leave can allow them to stay home when their child is sick and cannot attend school without losing pay. Several states as well as cities require employers in their jurisdiction to provide a paid sick leave benefit to their workers.
Among working parents, a higher share of mothers than fathers report they are the ones that care for children when they are too sick to attend school. In addition to taking leave after the arrival of a child, many parents need to take time off when their children are sick and cannot attend school. Among working women, over half (58%) say they are the ones who usually take care of children when they are sick and cannot go to school, nearly three times the share of working fathers (20%) (Figure 6). One fifth (21%) of working mothers and three in ten working fathers (32%) say they share this responsibility equally with a spouse, partner, or co-parent. Only about one in ten (9%) working mothers say their spouse, partner, or co-parent usually takes on this responsibility, whereas this is the most common response among fathers (34%). Just over one in ten mothers (12%) and fathers (14%) say they can call someone else for childcare or their child can stay home alone. These numbers have remained steady over time and are similar to findings in 2022.
Nearly Three Times As Many Women Than Men Care For Their Child If They Are Too Sick To Go School/Childcare
Grouped column chart showing that women 18 to 49 are the primary caregiver for their child if they are too sick to go to school or childcare.
Among women and men 18 to 49 who are the parent/guardian of a child under 18 and are employed full-time or part-time. *Estimate is statistically different between women and men.
KFF Women's Health Survey
About half of working mothers report losing pay when they miss work to care for sick children who can’t go to school. When parents miss work to take care of their sick children, 53% of mothers and 38% of fathers say they are not paid for that time (Figure 7). This has a disproportionate impact on mothers, as they are more likely to care for children when they are sick.
Loss of pay is more common among women who are Black (62%) and Hispanic (65%), compared to those who are White (50%). Approximately three in four (76%) mothers with low incomes report losing pay when they miss work to care for sick children, compared to four in ten of those with higher incomes (41%).
More Than Half of Mothers Lose Pay When They Take Time Off to Care For A Sick Child, Especially Those With Low Incomes
Bar chart showing that share of women and men who lose pay when they take time off to care for a sick child. Significantly larger shares of women than men say they lose pay, as well as larger shares of Black women, Hispanic women, and women who have low incomes and are uninsured or insured by Medicaid.
Among women 18 to 49 who cares for child alone or shares responsibility and is employed full-time or part-time. Income is based on 2023 ASPE income levels. Two hundred percent (200%) of the federal poverty level (FPL) in 2023 for an individual was $29,160. Persons of Hispanic origin may be of any race; other racial groups are non-Hispanic. *Estimate is significantly different than reference (ref) group (p < 0.05).
How Reproductive Age Adults Rate the Impact of a One-time Cash Payment on the Likelihood of Having a Child, by Selected Characteristics
If the government provided a cash payment to parents after welcoming a new child, would that make you much more likely to consider having or adopting a child, somewhat more likely, or would it not have much impact, compared with how you feel today?
Selected characteristics are among women 18 to 49. Income is based on 2023 ASPE income levels. Two hundred percent (200%) of the federal poverty level (FPL) in 2023 for an individual was $29,160. Persons of Hispanic origin may be of any race; other racial groups are non-Hispanic. The sample primarily includes English-speaking Asian adults and, therefore, may not be representative of the overall Asian adult population. *Estimate is statistically different from estimate for reference (ref) estimate (p < 0.05).
KFF Women's Health Survey 2026
How Reproductive Age Adults Rate the Impact of Increased Child Tax Credits on the Likelihood of Having a Child, by Selected Characteristics
If the government increased the child tax credit and other tax breaks for people who have children, would that make you much more likely to consider having or adopting a child, somewhat more likely, or would it not have much impact, compared with how you feel today?
Selected characteristics are among women 18 to 49. Income is based on 2023 ASPE income levels. Two hundred percent (200%) of the federal poverty level (FPL) in 2023 for an individual was $29,160. Persons of Hispanic origin may be of any race; other racial groups are non-Hispanic. The sample primarily includes English-speaking Asian adults and, therefore, may not be representative of the overall Asian adult population. *Estimate is statistically different from estimate for reference (ref) estimate (p < 0.05).
KFF Women's Health Survey 2026
How Reproductive Age Adults Rate the Impact of Government Assistance With Childcare Costs on the Likelihood of Having a Child, by Selected Characteristics
If the government provided more financial assistance with childcare costs, would that make you much more likely to consider having or adopting a child, somewhat more likely, or would it not have much impact, compared with how you feel today?
Selected characteristics are among women 18 to 49. Income is based on 2023 ASPE income levels. Two hundred percent (200%) of the federal poverty level (FPL) in 2023 for an individual was $29,160. Persons of Hispanic origin may be of any race; other racial groups are non-Hispanic. The sample primarily includes English-speaking Asian adults and, therefore, may not be representative of the overall Asian adult population. *Estimate is statistically different from estimate for reference (ref) estimate (p < 0.05).
KFF Women's Health Survey 2026
How Reproductive Age Adults Rate the Impact of Paid Parental Leave on the Likelihood of Having a Child, by Selected Characteristics
If the government required employers to offer paid parental leave, would that make you much more likely to consider having or adopting a child, somewhat more likely, or would it not have much impact, compared with how you feel today?
Selected characteristics are among women 18 to 49. Income is based on 2023 ASPE income levels. Two hundred percent (200%) of the federal poverty level (FPL) in 2023 for an individual was $29,160. Persons of Hispanic origin may be of any race; other racial groups are non-Hispanic. The sample primarily includes English-speaking Asian adults and, therefore, may not be representative of the overall Asian adult population. *Estimate is statistically different from estimate for reference (ref) estimate (p < 0.05).
The 2026 KFF Women’s Health Survey was designed and analyzed by women’s health researchers at KFF. The survey was conducted from March 11 – April 14, 2026, online and by telephone among a nationally representative sample of 5,854 adults ages 18 to 64, including 3,538 women ages 18 to 49. Women include anyone who selected woman as their gender. Sampling, data collection, weighting, tabulation, and IRB approval by the University of Southern Maine’s Collaborative Institutional Review Board were managed by SSRS of Glenn Mills, Pennsylvania in collaboration with women’s health researchers at KFF.
Throughout the reports of findings, we refer to “women.” This includes respondents who said their gender is “woman,” and includes those who selected “woman” in addition to another gender, such as “transgender,” or “non-binary,” or another gender. We followed this approach to try to include as many people as possible but recognize that some people who need and seek abortion and other reproductive health care services may not be represented in the findings or identify as women. Some questions about sexual and reproductive health were only asked among those with a specific sex assigned at birth (i.e. male or female).
The national sample was drawn from two nationally representative probability-based panels: the SSRS Opinion Panel and the Ipsos Knowledge-Panel. The SSRS Opinion Panel is a nationally representative probability-based panel where panel members are recruited randomly in one of two ways: (a) Through invitations mailed to respondents randomly sampled from an Address-Based Sample (ABS) provided by Marketing Systems Groups (MSG) through the U.S. Postal Service’s Computerized Delivery Sequence (CDS); (b) from a dual-frame random digit dial (RDD) sample provided by MSG. For the online panel component, invitations were sent to panel members by email followed by up to five reminder emails. 5,660 panel members completed the survey online and panel members who do not use the internet were reached by phone (n=194). Another 514 respondents were reached online through the Ipsos Knowledge Panel to help reach adequate sample sizes among subgroups of interest, specifically women ages 18 to 49. This panel is recruited using ABS, based on a stratified sample from the CDS. The questionnaire was translated into Spanish, so respondents were able to complete the survey in English or Spanish.
The national sample was weighted by splitting the sample into three groups: [1] Women 18-49, [2] Women 50-64, and [3] Men 18-64 and each group was separately weighted to match known population parameters (see table below for weighting variables and sources). Weights within the three groups were then trimmed at the 4th and 96th percentiles, to ensure that individual respondents do not have too much influence on survey-derived estimates. After the weights were trimmed, the samples were combined, and the weights adjusted, so that the groups were represented in their proper proportions for a final combined, gender by age-adjusted weight.
Dimensions
Source
Age
Current Population Survey 2025
Education
Age by Education
Age by Gender
Census Region
Race/Ethnicity by Nativity
Home Tenure
Civic Engagement
2023 CPS Volunteering and Civic Life Supplement
Internet Frequency
Pew Research Center’s National Public Opinion Reference Survey (NPORS 2025)
Population Density
Claritas Pop-Facts Premier 2026
Voter Registration
CPS 2024 Voting and Registration Supplement
The margins of sampling error for the national sample of women ages 18 to 64 and reproductive age women ages 18 to 49 are plus or minus 2 percentage points. Numbers of respondents and margins of sampling error for key subgroups are shown in the table below. For results based on other subgroups, the margin of sampling error may be higher. Sampling error is only one of many potential sources of error and there may be other unmeasured error in this survey.
Group
N (unweighted)
M.O.S.E.
National Women Ages 18-64
4,688
± 2 percentage points
White, non-Hispanic
2,262
± 2 percentage points
Black, non-Hispanic
767
± 4 percentage points
Hispanic
1,135
± 4 percentage points
Asian or Pacific Islander
347
± 6 percentage points
18-25
508
± 5 percentage points
26-35
1,313
± 3 percentage points
36-49
1,715
± 3 percentage points
50-64
1,152
± 3 percentage points
<200% FPL
1,641
± 3 percentage points
200%+ FPL
2,707
± 2 percentage points
200%-399% FPL
1,232
± 3 percentage points
400%+ FPL
1,475
± 3 percentage points
Private
2,876
± 2 percentage points
Employer-Sponsored
2,490
± 2 percentage points
Individually Purchased
386
±6 percentage points
Medicaid
977
± 4 percentage points
Uninsured
537
± 5 percentage points
Democrat/Democrat leaning
2,267
± 3 percentage points
Independent
628
± 5 percentage points
Republican/Republican leaning
1,354
± 3 percentage points
National Women Ages 18-49
3,538
± 2 percentage points
White, non-Hispanic
1,536
± 3 percentage points
Black, non-Hispanic
620
± 5 percentage points
Hispanic
944
± 4 percentage points
Asian or Pacific Islander
304
± 6 percentage points
<200% FPL
1,300
± 3 percentage points
200%+ FPL
1,949
± 3 percentage points
Private
2,117
± 3 percentage points
Medicaid
785
± 4 percentage points
Uninsured
456
± 6 percentage points
Democrat/Democrat leaning
1,752
± 3 percentage points
Independent
496
± 5 percentage points
Republican/Republican leaning
896
± 4 percentage points
General Notes:
Percentages may not add to 100%, or to subtotals indicated, due to rounding.
The “No answer” category includes refusals and those who volunteered “don’t know” responses.
The “Not sure” or “Don’t know” categories are only shown in tables when it was an explicit response option (i.e., shown on web or read via telephone) for survey respondents.
A category with ‘(VOL.)’ signifies a response option was not shown or read via telephone for survey respondents.
Insufficient sample size for analysis is denoted with “n/a” (e.g, FER4a). The sample size itself is shown, but the percentages are not.
Some survey questions were asked of males and females based on sex assigned at birth, which is shown in the base text above each question. However, the topline tables show results based on current gender identity.
Income is based on 2023 ASPE income levels. Two hundred percent (200%) of the federal poverty level (FPL) in 2023 for an individual was $29,160.
The sample primarily includes English-speaking Asian adults and, therefore, may not be representative of the overall Asian adult population. Despite this limitation, it is important to report the views of Asian adults on the topics in this study. As always, Asian adults’ responses are incorporated into the general population figures throughout this report.
The high costs of in vitro fertilization (IVF), limited insurance coverage for fertility services, and intersection with state level abortion laws and fetal personhood policies have brought the issue of access to fertility care into the policy spotlight. President Trump has stated that he wants to make fertility care more affordable and said he would institute an insurance coverage mandate as part of his campaign promises. There is currently no federal requirement for insurance coverage of fertility services, and the Trump administration has not issued a proposal for one. Recently, the Trump Administration advanced a policy that offers a discount on some IVF medications for people without coverage through the TrumpRx website and clarified regulations about insurance options for employers to encourage them provide fertility benefits to those covered in their employer-sponsored health insurance policies. However, the Administration’s actions to date are likely to provide limited assistance for people seeking IVF services who have gaps in coverage and who are struggling to afford the costs. While several states have enacted laws requiring some level of fertility coverage in state-regulated plans, these laws have limited reach and only affect a minority of people with private insurance coverage given that most people with employer coverage are in self-insured plans.
To understand the need for and barriers to fertility services, the 2026 KFF Women’s Health Survey included questions on fertility care. The nationally representative survey was conducted from March 11, 2026 to April 14, 2026, online and by telephone. This analysis presents survey findings among women ages 18 to 49 (n=3,538) on their reported need for and use of fertility services.
Fifteen percent (15%) of reproductive age women say they or their partner have ever needed fertility services to help them become pregnant or prevent a miscarriage. However, not all actually received services. One in ten (11%) women ages 18 to 49 say they or their partner received fertility assistance, but a quarter of these women (3% of all reproductive age women) say they were unable to get the fertility care they needed.
The fertility services that reproductive age women most commonly use are fertility advice, fertility testing, and medications to improve ovulation. Only a fraction of this population say they have used IVF. Among women who say they or their partner ever needed fertility care, almost half (46%) say they received advice and 39% say they received testing services. As far as treatments, one-third (34%) say they have received drugs for ovulation. Thirteen percent (13%) of reproductive age women who say they or their partner ever needed fertility care report they received IVF, and 16% report they received artificial insemination (IUI), which translates to 2% of all reproductive age women who report ever receiving either service.
Cost is a major barrier to the receipt of fertility services for those who need them. Use of all fertility services is more common among women with higher incomes; among women who say they did not receive needed fertility care, the leading reason is cost. For example, among reproductive age women who say they or their partner have needed fertility assistance, 17% with higher incomes say they received IVF compared to just 3% of women with low incomes. Larger shares of women with low incomes report cost as the main barrier compared to those with higher incomes.
Approximately one in seven women ages 18 to 49 say they or their partner needed fertility assistance services at some point. Nationally, 15% of reproductive age women report needing fertility services to become pregnant or prevent a miscarriage at some time in their lives (Figure 1). The share reporting need increases with age, as fertility declines. Just over one in ten (12%) women ages 18 to 35 say they needed fertility services at some point, compared to 19% of women ages 36 to 49.
The reported need for fertility care is similar across most other demographic groups, except slightly lower among Black women (11%) compared to their White counterparts (17%). Nationally, 12% of women with lower incomes say they have needed fertility services, compared to 17% of women with higher incomes. About one in ten women with Medicaid coverage (11%) or who are uninsured (11%) say they have needed fertility services, lower than women with private insurance (17%). While the survey does not find differences across party lines of women reporting needing fertility care at some point, slightly more women who identify as pro-life (17%) say they or their partner has needed fertility services than women who are pro-choice (14%). Higher shares of women who identify as Protestants (16%) or Catholic (16%) report ever needing fertility assistance compared to those who do not follow a particular religion (11%).
More Than One in 10 Women of Reproductive Age Say They Needed Fertility Assistance Services At Some Point
Bar chart showing the share of women ages 18–49 who say they or their partner has ever needed medical assistance to become pregnant or prevent a miscarriage, overall, by age, race.ethnicity, income, insurance, party ID, abortion views, and religion. Fifteen percent of women say they or partner has needed assistance. Compared to their counterparts, this share is lower among women who are Black, have incomes less than 200% of poverty, have Medicaid or are Uninsured. Shares are slightly higher among women who are pro-life, Catholic, or Protestant.
*Estimate is statistically different from estimate for reference (ref) estimate (p < 0.05). Persons of Hispanic origin may be of any race; other racial groups are non-Hispanic. The sample primarily includes English-speaking Asian adults and, therefore, may not be representative of the overall Asian adult population. Income category designations are based on 2023 federal poverty guidelines. Two hundred percent (200%) of the federal poverty level (FPL) in 2023 for an individual was $29,160.
KFF Women's Health Survey 2026
Among all reproductive age women, about one in ten (11%) say they or their partner have received fertility services at some point. Another 3% say they needed services but were not able to obtain them (Figure 2). While a relatively small share of women say they could not obtain fertility services, they may not be able to grow their families as desired because they could not afford the care they needed to get pregnant. Most reproductive age women (85%) say they have never needed fertility services (includes women who have not yet tried to become pregnant as well as women who do not want to have children).
One in Ten Reproductive Age Women Say They Have Received Fertility Services They Needed At Some Point
Pie chart showing the share of women ages 18–49 reporting whether they or their partner received the medical care they needed to become pregnant or prevent a miscarriage. Eighty-five percent of women say they or partner never needed fertility care. Eleven percent received the care that they needed, and three percent did not receive the care they needed.
Among women ages 18 to 49. The share of women who say they never needed fertility care includes women who have not yet tried to become pregnant as well as women who do not want to have children.
KFF Women's Health Survey 2026
Most women who say they needed fertility services received them, but the leading reason why women say they didn’t get needed fertility services is cost. Not surprisingly, cost barriers are more common among women with lower incomes.
There are many obstacles to receiving fertility care, including costs, coverage, provider availability, and health status. However, cost is by far the single largest barrier. Among reproductive age women who reported needing fertility services at some point, 25% (3% of all reproductive age women) say they did not receive these services and cost was the primary barrier.
Among the 15% of women who said they ever needed fertility services, one in five (21%) with lower incomes (21%) cite cost as the main reason they could not obtain fertility services, compared to 13% of women with higher incomes (Figure 3). Overall, this represents 3% of all reproductive age women with low incomes and 2% of those with higher incomes who say they did not obtain fertility services because of cost.
Coverage for fertility services is limited in both private insurance and Medicaid. The 2024 KFF Employer Health Benefits Survey found that about a quarter (27%) of large firms that offer health benefits cover IVF services. Some states require state-regulated private insurers – which do not include self-insured employer plans -- to cover some level of fertility services. Medicaid, the health coverage program for people with lower incomes, rarely covers fertility services. In fact, federal law exempts state Medicaid programs from a requirement to cover fertility medications, which is different from most other outpatient prescription drugs that are typically covered by the program.
Majority of Women Who Needed Fertility Services Say They Received Them, But Cost Is Leading Reason Some Did Not Receive Care
Among 15% of women 18 to 49 who said they/partner needed fertility care:
Fifteen percent (15%) of women ages 18 to 49 said they or their partner ever needed medical advice, testing, services or medication to help them become pregnant or prevent a miscarriage. I<span style="background-color: rgb(255, 255, 255);">ncome category designations are based on 2023 federal poverty guidelines. Two hundred percent (200%) of the federal poverty level (FPL) in 2023 for an individual was $29,160.</span>
KFF Women's Health Survey 2026
Types of Fertility Services
The leading fertility services that women report receiving are advice, testing, and drugs to improve ovulation.
Fertility assistance encompasses a broad array of services, including advice and counseling, medications, surgical procedures, diagnostic tests, imaging studies, cryopreservation, intrauterine insemination (IUI), in-vitro fertilization (IVF), and surrogacy. Depending on individual circumstances, people may use a variety of these services to become pregnant and/or to prevent miscarriages, particularly if they have a history of or are at higher risk for pregnancy loss. The costs of services vary widely, ranging from a few hundred dollars for diagnostic tests and medications to upwards of $25,000 for one cycle of IVF, and some patients may need multiple cycles before they get pregnant.
Among the 15% of reproductive age women who ever needed fertility services, almost half said they received advice (46%). Four in ten said they received testing for themselves or their partner (39%), and about one-third (34%) obtained medications (e.g. clomid, hormones, etc.) to improve ovulation (Figure 4). One in ten (10%) women said they had a corrective surgery or used medications to address an issue that make getting pregnant or carrying a pregnancy difficult such as fibroids or endometriosis.
Among reproductive age women who said they or their partner ever needed fertility services, 13% report they received IVF and 16% report they received artificial insemination, also known as IUI. This translates to 2% of all reproductive age women who report receiving either IVF or IUI.
IVF is a costly medical procedure where eggs are removed from the ovary and are fertilized with sperm in a lab setting to create an embryo, which is then placed in the uterus. Artificial insemination, also known as Intrauterine insemination (IUI) is another fertility procedure that involves injecting sperm into the uterus. It is less invasive and less expensive than IVF and is often selected for those reasons.
While a relatively small share of people ever use IVF or IUI, many seek these services after trying a range of other services to get pregnant, such as medications, acupuncture, and surgeries.
Among Reproductive Age Women Who Say They Ever Needed Fertility Assistance, 13% Report Receiving In Vitro Fertilization (IVF)
Side by side bar chart showing the fertility services that women ages 18–49 say they or their partner received. Among women who needed medical care to become pregnant or prevent a miscarriage, forty-six percent received fertility advice, thirty-four percent received drugs to improve ovulation, and thirteen percent received IVF. This translates to less than ten percent for all services among the entire population of women ages 18 to 49.
Fifteen percent (15%) of women ages 18 to 49 said they or their partner ever needed medical advice, testing, services or medication to help them become pregnant or prevent a miscarriage.
KFF Women's Health Survey 2026
Smaller shares of women with lower incomes report receiving fertility services.
A smaller share of women with low incomes report that they obtained fertility services. This is the case for diagnostic services such as fertility advice and testing as well as treatments, including ovulation drugs. For IVF, the most intensive and expensive service, 17% of women with higher incomes who needed fertility assistance obtained IVF, compared to 3% of women with low incomes (Figure 5).
Among Women Who Say They Needed Fertility Assistance, There Are Consistent Disparities in Receipt of Services by Income Level
Grouped column chart showing among the 15% of women ages 18–49, the services they report receiving. Fifty-three percent of women with incomes at least two hundred percent of poverty report receiving fertility advice, compared to thirty-two percent of women with incomes below two hundred percent of poverty. Thirty-eight percent of women with incomes at least two hundred percent of poverty report receiving drugs for ovulation, compared to twenty-four percent of women with incomes below two hundred percent of poverty. Seventeen percent of women with incomes at least two hundred percent of poverty report receiving IVF, compared to three percent of women with incomes below two hundred percent of poverty.
Fifteen (15%) of women ages 18 to 49 report ever needing medical advice, testing, services or medication they needed to help them become pregnant or prevent a miscarriage. <br>
*Estimate is statistically different from estimate for women with incomes at or above 200% of the federal poverty level (FPL) (p < 0.05). Income category designations are based on 2023 federal poverty guidelines. Two hundred percent (200%) of the federal poverty level (FPL) in 2023 for an individual was $29,160. <br>IVF = in vitro fertilization. IUI = intrauterine insemination, also known as artificial insemination.
KFF Women's Health Survey 2026
Overall, Small Shares of Reproductive Age Women Report Using Various Fertility Services, but Receipt is Greater Among Women With Higher Incomes
Grouped column chart showing among all women ages 18–49, the fertility assistance services they report receiving. All percentages are less than ten percent but higher among women with incomes at least two hundred percent of poverty compared to those with incomes below two hundred percent of poverty.
Fifteen (15%) of women ages 18 to 49 report ever needing medical advice, testing, services or medication they needed to help them become pregnant or prevent a miscarriage. Income category designations are based on 2023 federal poverty guidelines. Two hundred percent (200%) of the federal poverty level (FPL) in 2023 for an individual was $29,160.<br> *Estimate is statistically different from estimate for women with incomes at or above 200% of the federal poverty level (FPL) (p < 0.05). IVF = in vitro fertilization. IUI = intrauterine insemination, also known as artificial insemination.
The 2026 KFF Women’s Health Survey was designed and analyzed by women’s health researchers at KFF. The survey was conducted from March 11 – April 14, 2026, online and by telephone among a nationally representative sample of 5,854 adults ages 18 to 64, including 3,538 women ages 18 to 49. Women include anyone who selected woman as their gender. Sampling, data collection, weighting, tabulation, and IRB approval by the University of Southern Maine’s Collaborative Institutional Review Board were managed by SSRS of Glenn Mills, Pennsylvania in collaboration with women’s health researchers at KFF.
Throughout the reports of findings, we refer to “women.” This includes respondents who said their gender is “woman,” and includes those who selected “woman” in addition to another gender, such as “transgender,” or “non-binary,” or another gender. We followed this approach to try to include as many people as possible but recognize that some people who need and seek abortion and other reproductive health care services may not be represented in the findings or identify as women. Some questions about sexual and reproductive health were only asked among those with a specific sex assigned at birth (i.e. male or female).
The national sample was drawn from two nationally representative probability-based panels: the SSRS Opinion Panel and the Ipsos Knowledge-Panel. The SSRS Opinion Panel is a nationally representative probability-based panel where panel members are recruited randomly in one of two ways: (a) Through invitations mailed to respondents randomly sampled from an Address-Based Sample (ABS) provided by Marketing Systems Groups (MSG) through the U.S. Postal Service’s Computerized Delivery Sequence (CDS); (b) from a dual-frame random digit dial (RDD) sample provided by MSG. For the online panel component, invitations were sent to panel members by email followed by up to five reminder emails. 5,660 panel members completed the survey online and panel members who do not use the internet were reached by phone (n=194). Another 514 respondents were reached online through the Ipsos Knowledge Panel to help reach adequate sample sizes among subgroups of interest, specifically women ages 18 to 49. This panel is recruited using ABS, based on a stratified sample from the CDS. The questionnaire was translated into Spanish, so respondents were able to complete the survey in English or Spanish.
The national sample was weighted by splitting the sample into three groups: [1] Women 18-49, [2] Women 50-64, and [3] Men 18-64 and each group was separately weighted to match known population parameters (see table below for weighting variables and sources). Weights within the three groups were then trimmed at the 4th and 96th percentiles, to ensure that individual respondents do not have too much influence on survey-derived estimates. After the weights were trimmed, the samples were combined, and the weights adjusted, so that the groups were represented in their proper proportions for a final combined, gender by age-adjusted weight.
Dimensions
Source
Age
Current Population Survey 2025
Education
Age by Education
Age by Gender
Census Region
Race/Ethnicity by Nativity
Home Tenure
Civic Engagement
2023 CPS Volunteering and Civic Life Supplement
Internet Frequency
Pew Research Center’s National Public Opinion Reference Survey (NPORS 2025)
Population Density
Claritas Pop-Facts Premier 2026
Voter Registration
CPS 2024 Voting and Registration Supplement
The margins of sampling error for the national sample of women ages 18 to 64 and reproductive age women ages 18 to 49 are plus or minus 2 percentage points. Numbers of respondents and margins of sampling error for key subgroups are shown in the table below. For results based on other subgroups, the margin of sampling error may be higher. Sampling error is only one of many potential sources of error and there may be other unmeasured error in this survey.
Group
N (unweighted)
M.O.S.E.
National Women Ages 18-64
4,688
± 2 percentage points
White, non-Hispanic
2,262
± 2 percentage points
Black, non-Hispanic
767
± 4 percentage points
Hispanic
1,135
± 4 percentage points
Asian or Pacific Islander
347
± 6 percentage points
18-25
508
± 5 percentage points
26-35
1,313
± 3 percentage points
36-49
1,715
± 3 percentage points
50-64
1,152
± 3 percentage points
<200% FPL
1,641
± 3 percentage points
200%+ FPL
2,707
± 2 percentage points
200%-399% FPL
1,232
± 3 percentage points
400%+ FPL
1,475
± 3 percentage points
Private
2,876
± 2 percentage points
Employer-Sponsored
2,490
± 2 percentage points
Individually Purchased
386
±6 percentage points
Medicaid
977
± 4 percentage points
Uninsured
537
± 5 percentage points
Democrat/Democrat leaning
2,267
± 3 percentage points
Independent
628
± 5 percentage points
Republican/Republican leaning
1,354
± 3 percentage points
National Women Ages 18-49
3,538
± 2 percentage points
White, non-Hispanic
1,536
± 3 percentage points
Black, non-Hispanic
620
± 5 percentage points
Hispanic
944
± 4 percentage points
Asian or Pacific Islander
304
± 6 percentage points
<200% FPL
1,300
± 3 percentage points
200%+ FPL
1,949
± 3 percentage points
Private
2,117
± 3 percentage points
Medicaid
785
± 4 percentage points
Uninsured
456
± 6 percentage points
Democrat/Democrat leaning
1,752
± 3 percentage points
Independent
496
± 5 percentage points
Republican/Republican leaning
896
± 4 percentage points
General Notes:
Percentages may not add to 100%, or to subtotals indicated, due to rounding.
The “No answer” category includes refusals and those who volunteered “don’t know” responses.
The “Not sure” or “Don’t know” categories are only shown in tables when it was an explicit response option (i.e., shown on web or read via telephone) for survey respondents.
A category with ‘(VOL.)’ signifies a response option was not shown or read via telephone for survey respondents.
Insufficient sample size for analysis is denoted with “n/a” (e.g, FER4a). The sample size itself is shown, but the percentages are not.
Some survey questions were asked of males and females based on sex assigned at birth, which is shown in the base text above each question. However, the topline tables show results based on current gender identity.
Income is based on 2023 ASPE income levels. Two hundred percent (200%) of the federal poverty level (FPL) in 2023 for an individual was $29,160.
The sample primarily includes English-speaking Asian adults and, therefore, may not be representative of the overall Asian adult population. Despite this limitation, it is important to report the views of Asian adults on the topics in this study. As always, Asian adults’ responses are incorporated into the general population figures throughout this report.