How Many Physicians Have Opted Out of the Medicare Program?
Medicare provides health insurance coverage to 67 million adults—20% of the U.S population—and is a major source of revenue for physicians and other health providers. In 2024, Medicare spending on Part B services (including physician services, outpatient services, and physician-administered drugs) accounted for nearly half (49%) of total Medicare benefit spending. Physicians are not required to participate in Medicare, though the vast majority of them choose to do so.
In recent years, physician groups and some policymakers have raised concerns that physicians would opt out of Medicare due to reductions in Medicare payments for many Part B services, potentially leading to a shortage of physicians willing to treat people with Medicare. Medicare payments are lower, on average, than payments from private insurers and are not automatically indexed to keep pace with inflation in medical practice costs. Every year, as required by law, the Centers for Medicare & Medicaid Services (CMS) updates Medicare payments to physicians under the physician fee schedule through rulemaking. Since 2021, Congress has enacted four temporary, one-year increases to physician payment rates to soften scheduled cuts. However, Congress has not enacted a payment increase for 2025, and a 2.93% drop in average Medicare payments to physicians went into effect on January 1.
Despite these ongoing concerns, virtually all (98%) of non-pediatric physicians participate in the Medicare program. Furthermore, Medicare beneficiaries report access to physician services that is equal to, or better than, that of privately-insured individuals, with similar shares reporting delays in needed care or difficulty finding a physician who takes their insurance.
This brief uses the most recent CMS data to document the extent to which non-pediatric physicians have opted out of Medicare, by specialty and by state, as of November 2024, updating prior KFF analyses. (See Methods for details).
Key Takeaways:
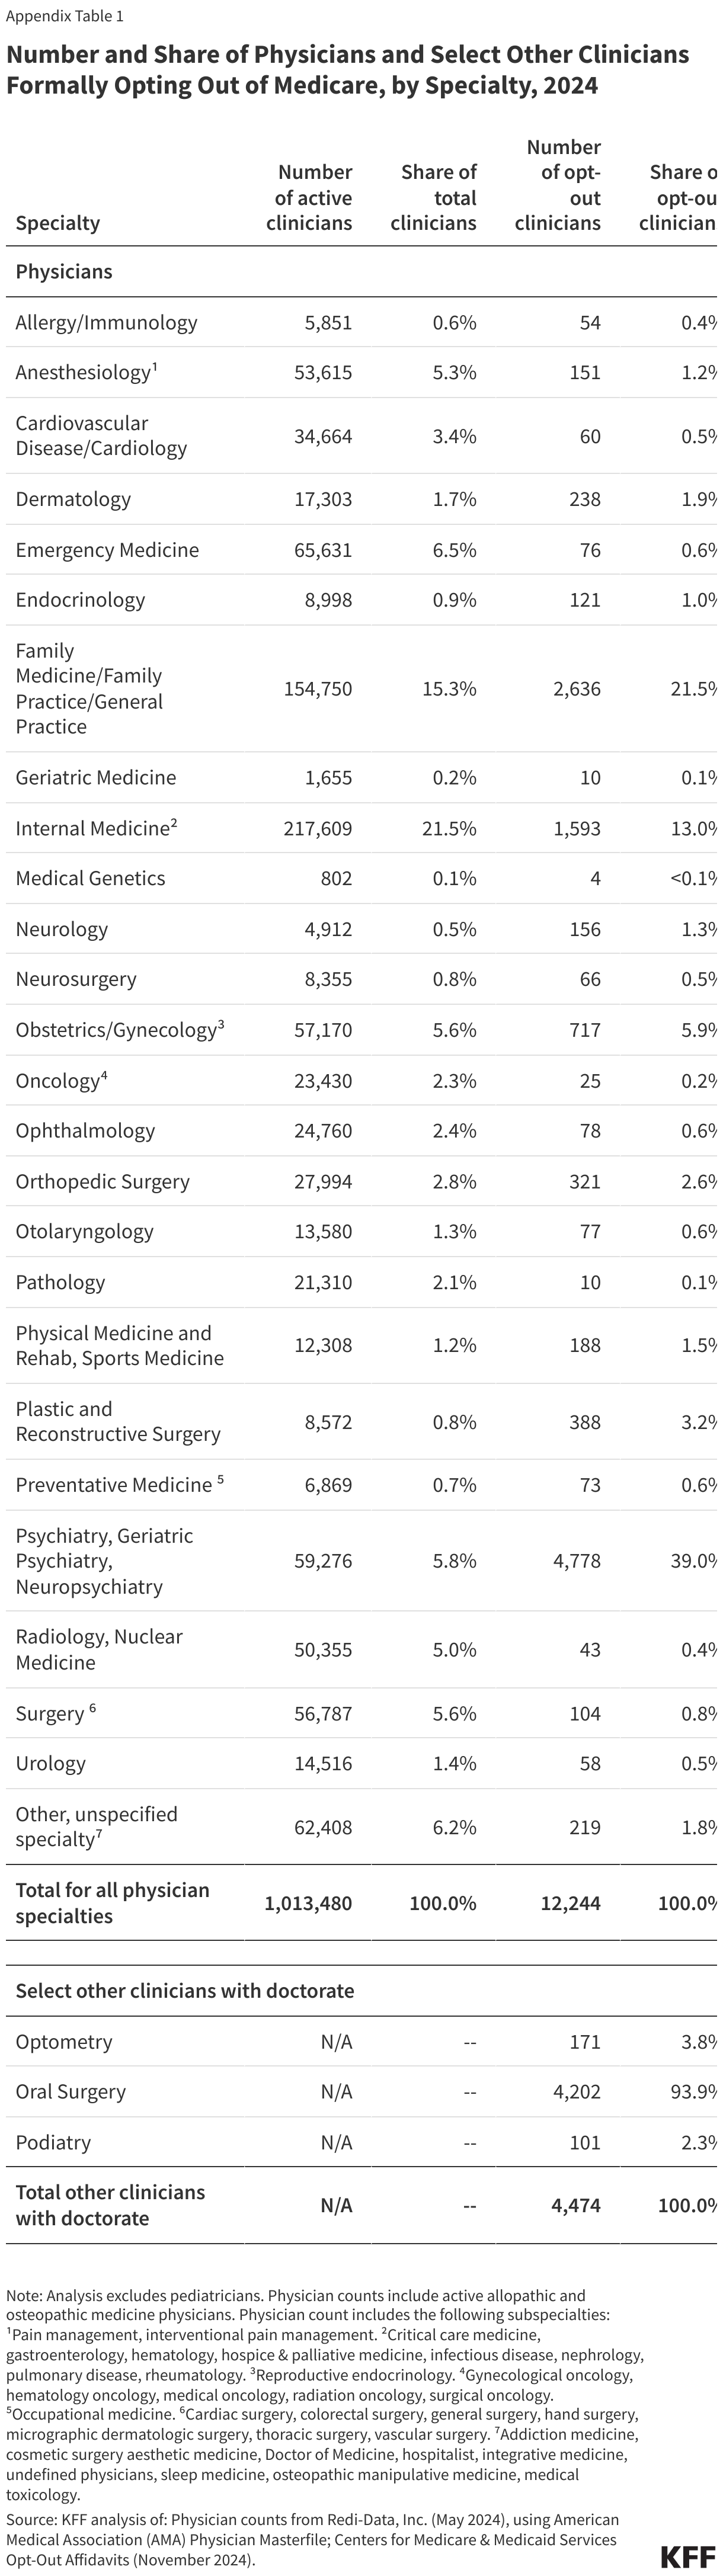
- About one percent of all non-pediatric physicians have formally opted out of the Medicare program in 2024. The share was highest for psychiatrists (8.1%), followed by plastic and reconstructive surgeons (4.5%) and neurologists (3.2%).
- In 11 specialties, the share of physicians who have opted out of Medicare is 0.5% or lower, with the lowest shares seen among emergency medicine physicians (0.1%), oncologists (0.1%), radiologists (0.1%), and pathologists (<0.1%).
- Psychiatrists account for the largest share (39.0%) of all non-pediatric physicians who have opted out of Medicare in 2024, followed by family medicine physicians (21.5%) and internal medicine physicians (13.0%).
- Less than two percent of non-pediatric physicians have opted out of Medicare in 47 states. The rate is slightly higher in three states and the District of Columbia: Alaska (2.8%), Colorado (2.3%), Idaho (2.2%), and the District of Columbia (2.9%).
Three options for physicians
Currently, physicians and other health providers seeking payment from Medicare for Part B services must enroll as a Medicare provider. Physicians may either agree to be a participating provider or non-participating provider. Providers who do not want to enroll in Medicare or receive Medicare payments are required to sign an “opt out” agreement with their patients.
- Participating providers agree to accept “assignment” on all Medicare claims for all of their Medicare patients, which means that they have signed a participation agreement with Medicare, agreeing to accept Medicare’s fee schedule amounts as payment-in-full for all Medicare covered services. Medicare beneficiaries seeing a participating provider can only be liable for the cost sharing required by Medicare. Providers have several incentives to be participating providers, such as being paid higher rates (5% higher) than the rates paid to non-participating providers. In 2022, the vast majority (98%) of physicians and practitioners billing Medicare were participating providers.
- Non-participating providers accept Medicare patients, but can choose whether to take assignment (i.e., Medicare’s approved amount) on a claim-by-claim basis. Unlike participating providers, who are paid the full Medicare-allowed payment amount, non-participating physicians who take assignment are limited to 95% of the Medicare approved amount. In 2022, 7% of fee schedule claims were paid on assignment. Physicians who choose to not accept assignment can charge beneficiaries up to 15% more than the Medicare-approved amount, a process known as “balance billing.” Medicare patients are financially liable for this additional amount plus applicable deductibles and coinsurance.
- Opt-out physicians and other practitioners must sign an affidavit to “opt out” of the Medicare program entirely. These providers enter into private contracts with their Medicare patients, allowing them to bill any amount they determine is appropriate. Providers who have opted out of the Medicare program must opt out for all of their Medicare patients, including those enrolled in Medicare Advantage. Medicare patients seeing a provider who has opted out of the Medicare program must sign this agreement and agree to be financially responsible for the entire cost of any services received. Neither the provider nor the patient can submit a bill to Medicare for reimbursement of any service covered under Medicare Part B. Opt-out agreements last for two consecutive years and are automatically renewed at the end of each two-year period.
What share of physicians have opted out of Medicare?
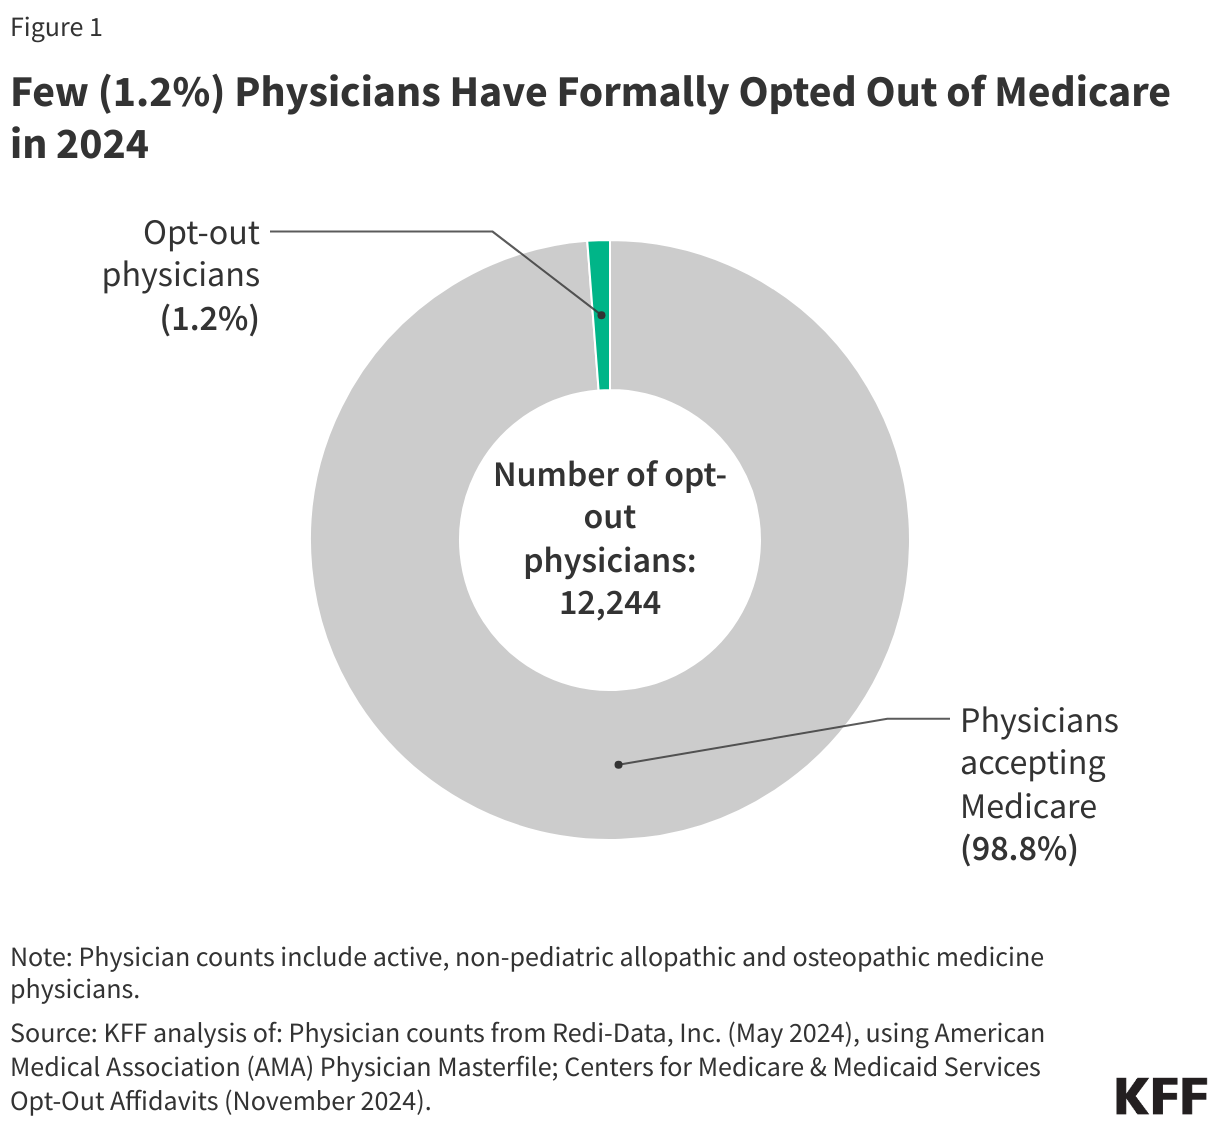
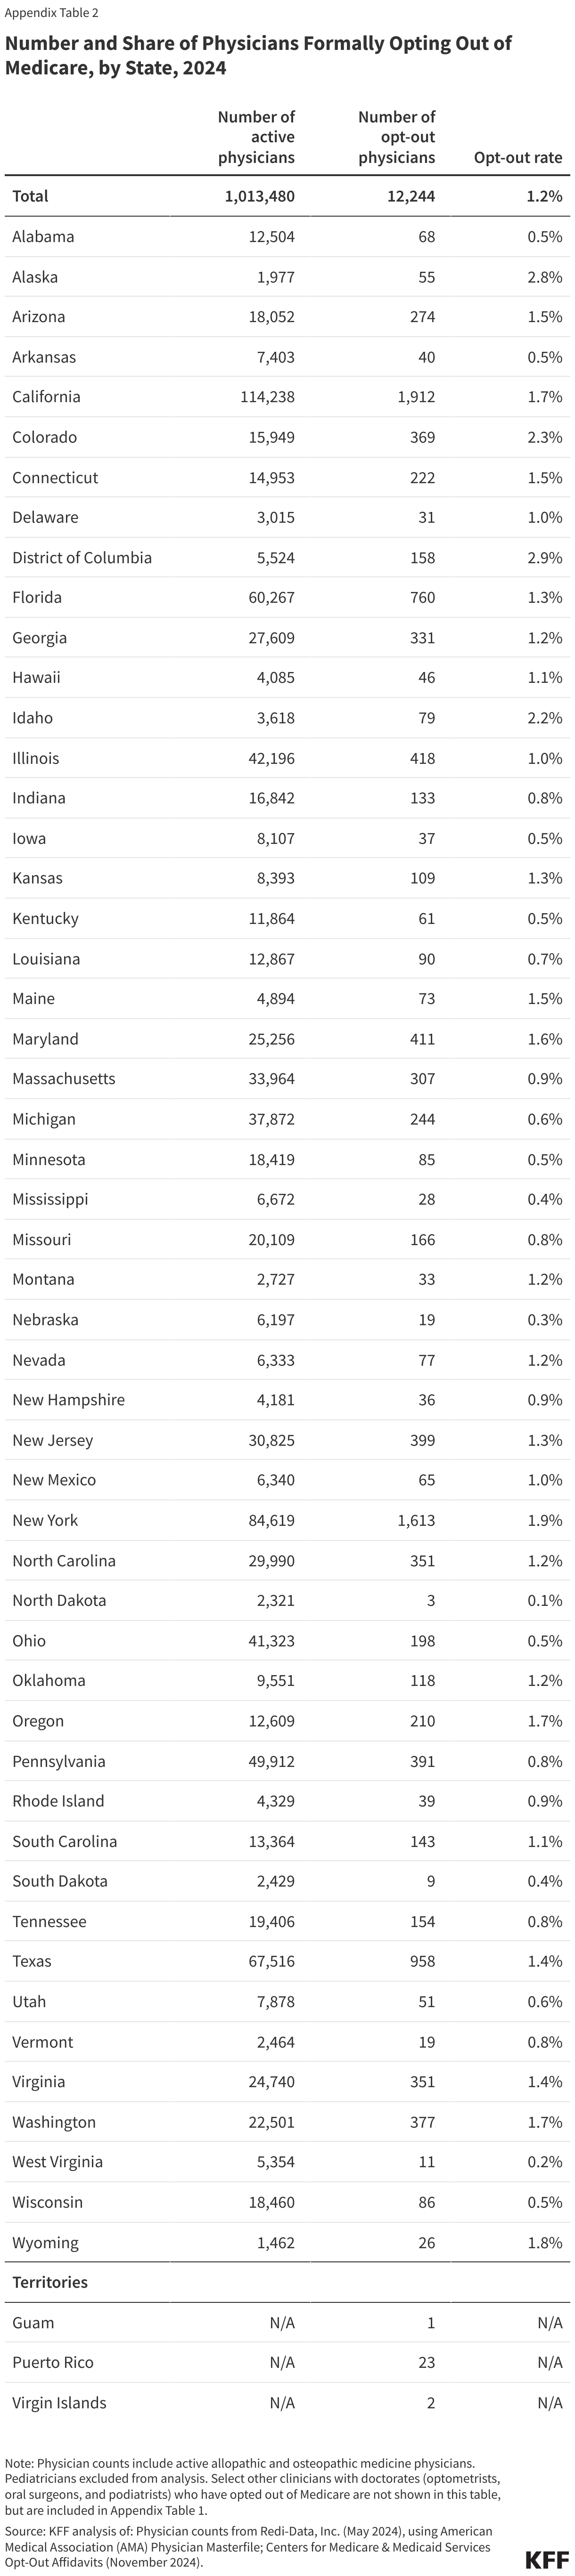
1.2 percent of non-pediatric physicians have formally opted out of the Medicare program. As of November 2024, 12,244 non-pediatric physicians have opted out of Medicare, representing a very small share (1.2%) of the total number active physicians, similar to the shares reported in 2013 and 2022 (Figure 1).
While the overall opt-out rate is low, opt-out rates are somewhat higher for certain specialties, such as psychiatry and plastic and reconstructive surgery. In 2024, 8.1% of psychiatrists have opted out of Medicare, followed by 4.5% of physicians specializing in plastic and reconstructive surgery and 3.2% of physicians specializing in neurology (Figure 2).
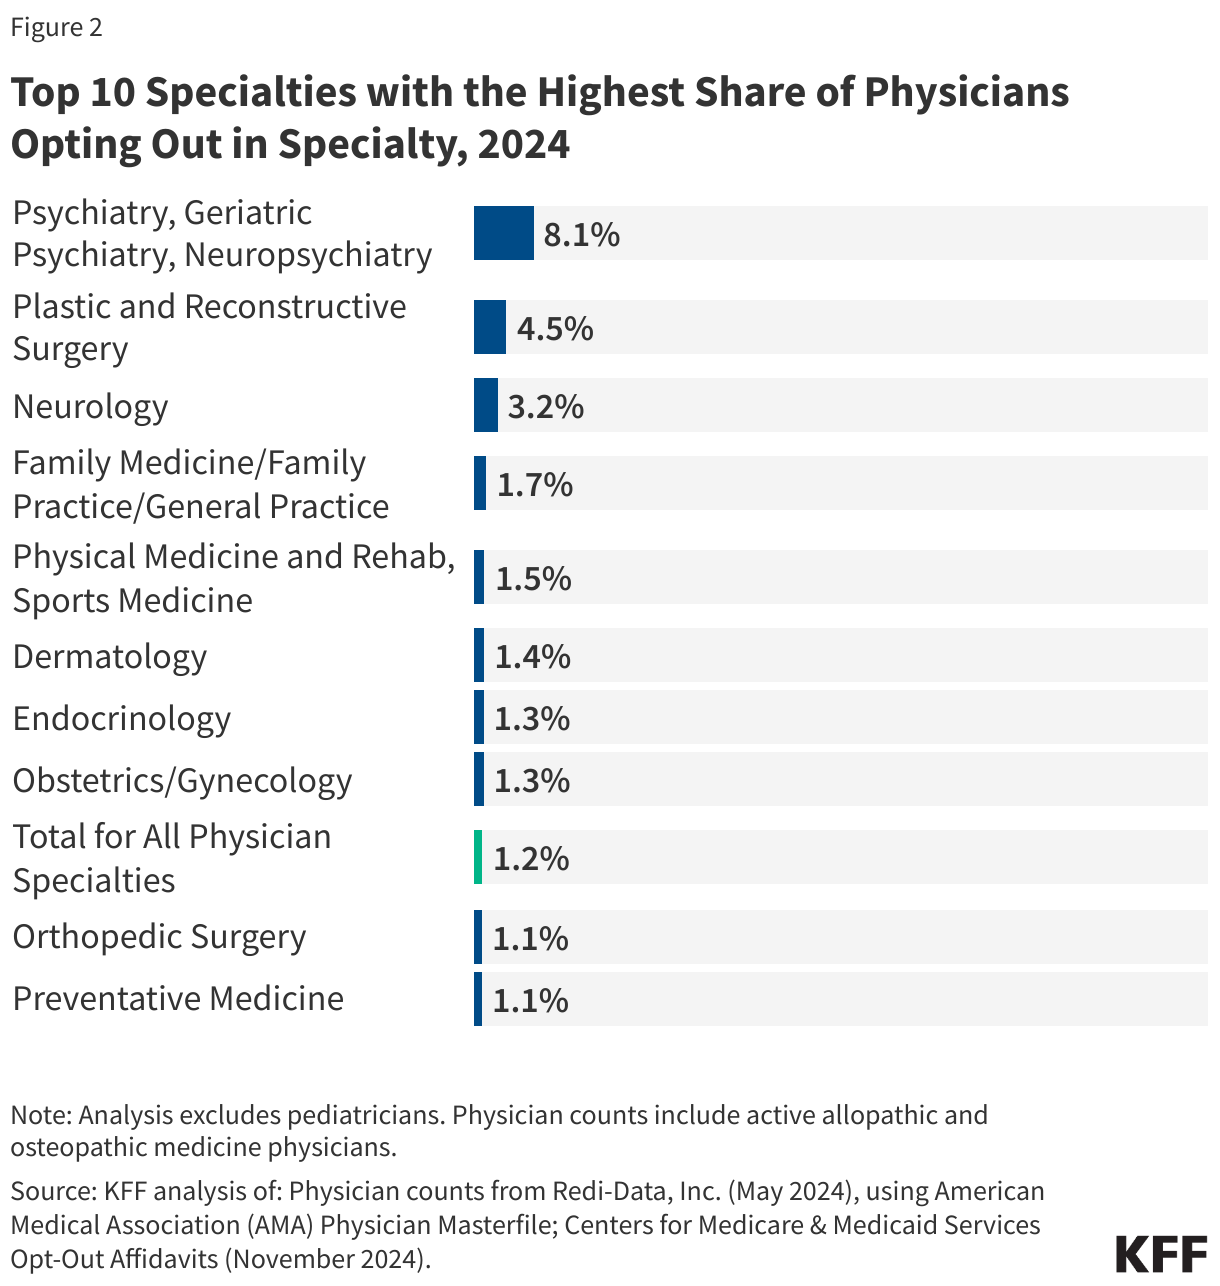
On the other hand, of the 26 specialty groups included in this analysis, 11 have opt-out rates that are 0.5% or lower, with the lowest rates seen among physicians specializing in emergency medicine (0.1%), oncology (0.1%), radiology (0.1%), and pathology (<0.1%) (Appendix Table 1).
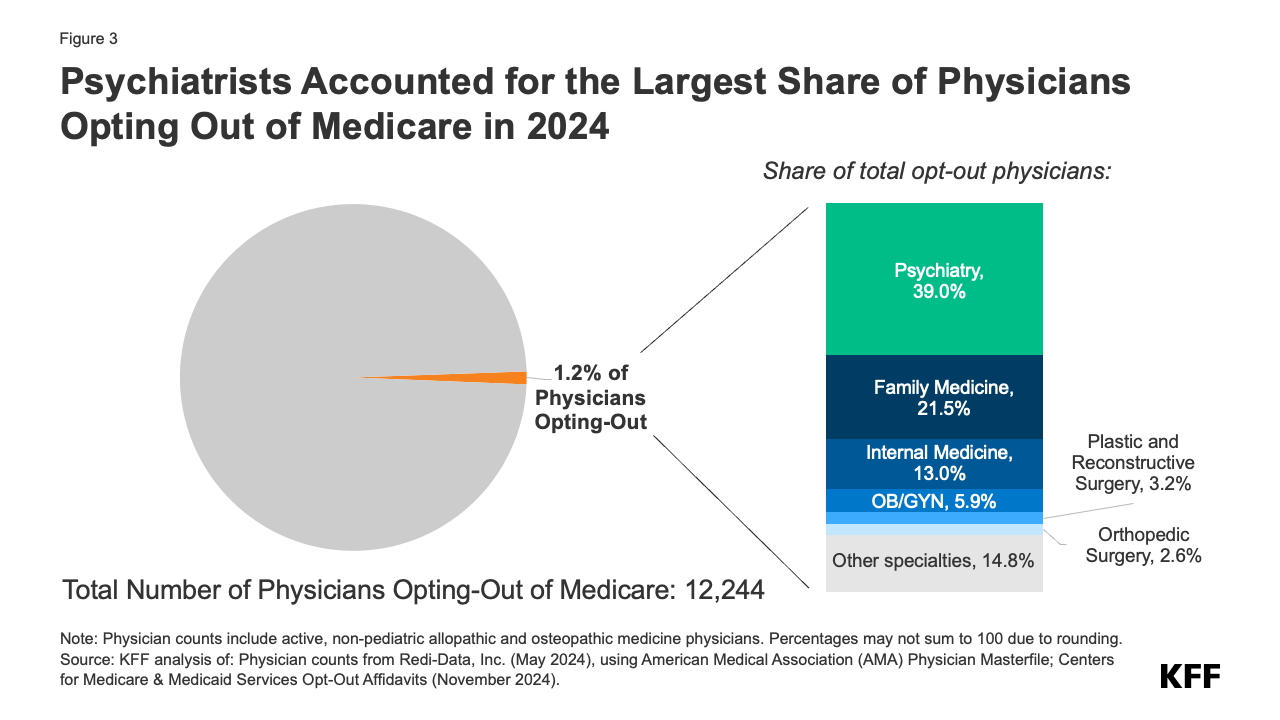
Psychiatrists are disproportionately represented among the 1.2 percent of active physicians who have opted out of Medicare. Psychiatrists account for the largest share (39.0%) of opt-out physicians, followed by physicians in family medicine (21.5%), internal medicine (13.0%), and obstetrics/gynecology (5.9%) (Figure 3). This is consistent with prior analyses that found that psychiatrists are less likely than other physician specialties to accept new patients with Medicare or private insurance, suggesting that psychiatrists may prefer to be paid directly by their patients, in order to avoid the administrative burden of submitting claims to insurers and maintain the flexibility to charge higher fees.
In addition to physicians, another 4,474 select clinical professionals with doctorate degrees (i.e. oral surgeons, podiatrists, and optometrists) have also opted out of the Medicare program, with oral surgeons accounting for the vast majority (93.9%) of this group (Appendix Table 1).
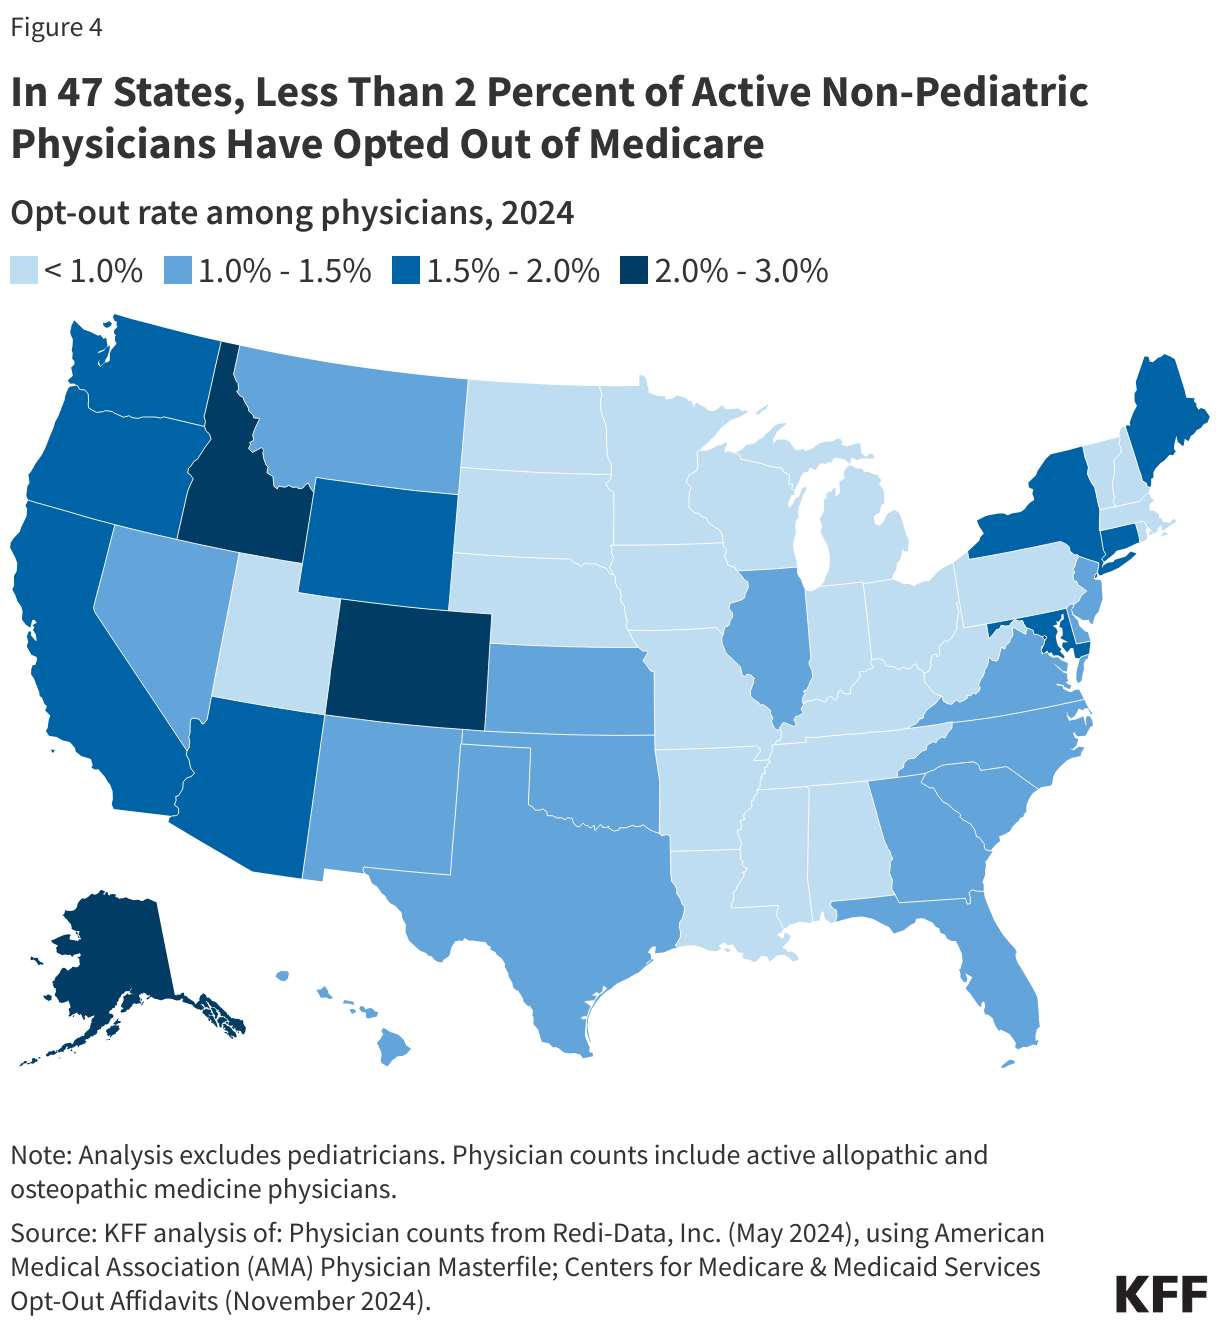
Less than two percent of physicians have opted out of Medicare in all but three states and the District of Columbia. As of November 2024, the District of Columbia (2.9%), Alaska (2.8%), Colorado (2.3%), and Idaho (2.2%) have the highest rates of non-pediatric physicians who have opted out of Medicare (Figure 4). In twelve states (Alabama, Arkansas, Iowa, Kentucky, Minnesota, Mississippi, Nebraska, North Dakota, Ohio, South Dakota, West Virginia, and Wisconsin) the opt-out rate is 0.5% or lower (Appendix Table 2).
Due to data limitations, this analysis only includes opt-out rates at the state level. Opt-out rates may vary based on rural status and other county-level factors, and some counties may have opt-out rates that are higher than the state average.
Appendix
Supplemental Tables
Methods
This analysis uses Medicare opt-out affidavit data from the Centers for Medicare & Medicaid Services (CMS), as of November 2024. The scope of this analysis was limited to non-pediatric physicians, given its Medicare focus, as well as a select group of other clinicians with doctorates: optometrists, oral surgery, and podiatrists. Therefore, pediatricians and other non-physician specialists, such as certified nurse midwives, clinical social workers, and physician assistants, were excluded from the total number of opt-out physicians. Of note, while some clinicians under the oral surgery specialty group may also hold a medical degree (MD or DO), for the purpose of this analysis, these physicians were grouped in accordance with the primary specialty (oral surgery) associated with their National Provider Identifier (NPI) in CMS’ opt-out file.
This analysis obtained data on the number of active allopathic and osteopathic physicians by specialty and state from Redi-data, Inc, which utilizes data from the American Medical Association (AMA) Physician Masterfile. One limitation of this analysis is that due to data source limitations, it was not possible to exclude active physicians involved in professional activities other than patient care, such as research and administration. We were also unable to examine opt-out rates based on the ownership characteristics of physicians (e.g., hospital-owned vs physician-owned practices). Further, we were unable to examine out-out rates by rural status due to lack of county-level opt-out data.
The specific physician specialty groups identified in this analysis were selected if they were included in the list of opt-out providers provided by CMS. In order to gain a more complete picture of the distribution of opt-out providers in each specialty category, this analysis grouped some subspecialties under a broader specialty category, consistent with the specialty cross-walk provided by Redi-Data, Inc. More specifically, anesthesiology includes pain management and interventional pain management, obstetrics and gynecology includes reproductive endocrinology, and preventive medicine includes occupational medicine. The internal medicine category includes the following subspecialties: internal medicine (not otherwise specified), critical care medicine, gastroenterology, hematology, hospice & palliative medicine, infectious disease, nephrology, pulmonary disease, and rheumatology. The surgery category includes the following subspecialties: cardiac surgery, colorectal surgery, general surgery, hand surgery, micrographic dermatologic surgery, thoracic surgery, and vascular surgery. The following subspecialties are included in the “other” category: addiction medicine, cosmetic surgery aesthetic medicine, Doctor of Medicine, hospitalist, integrative medicine, undefined physicians, sleep medicine, osteopathic manipulative medicine, and medical toxicology.