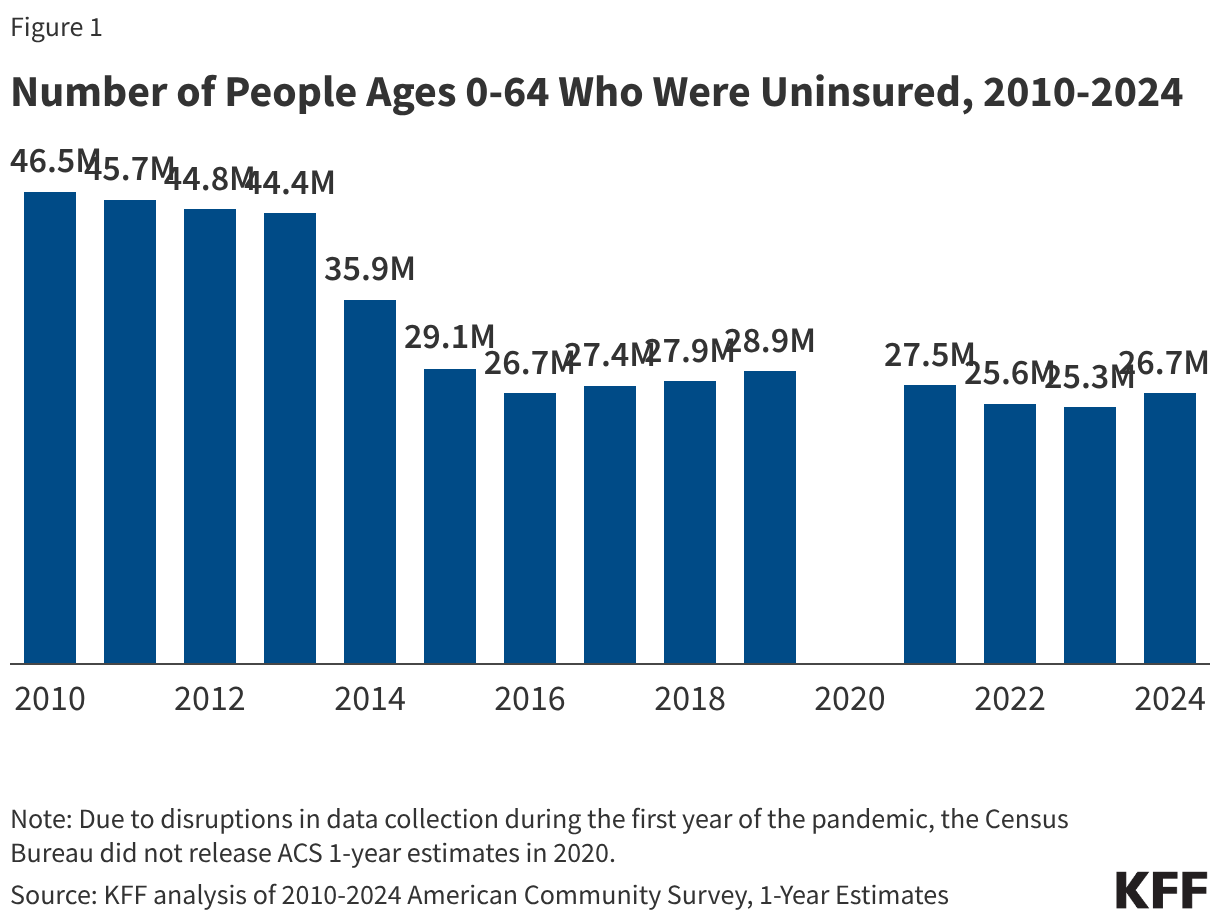
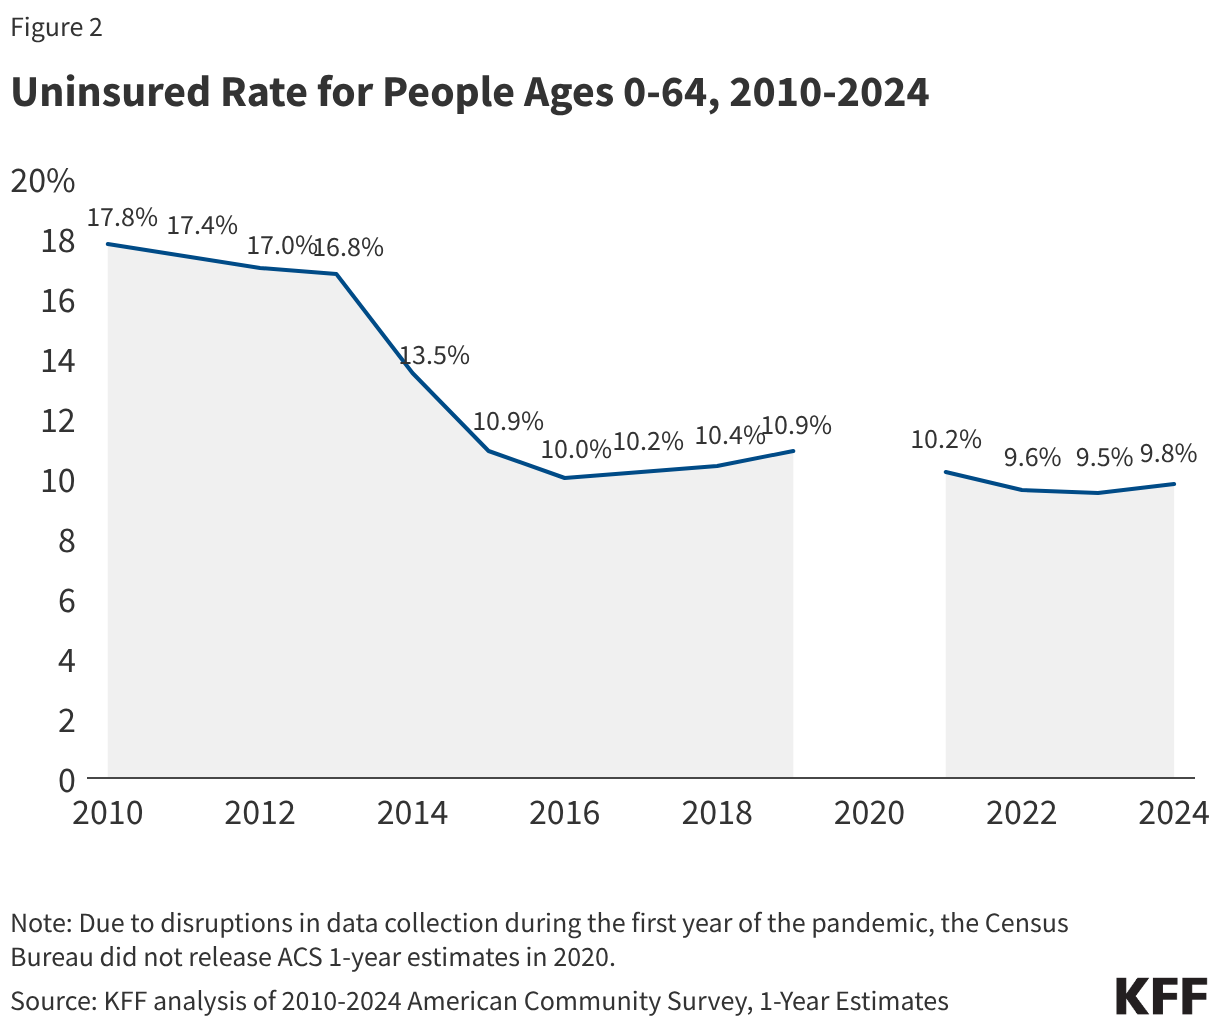
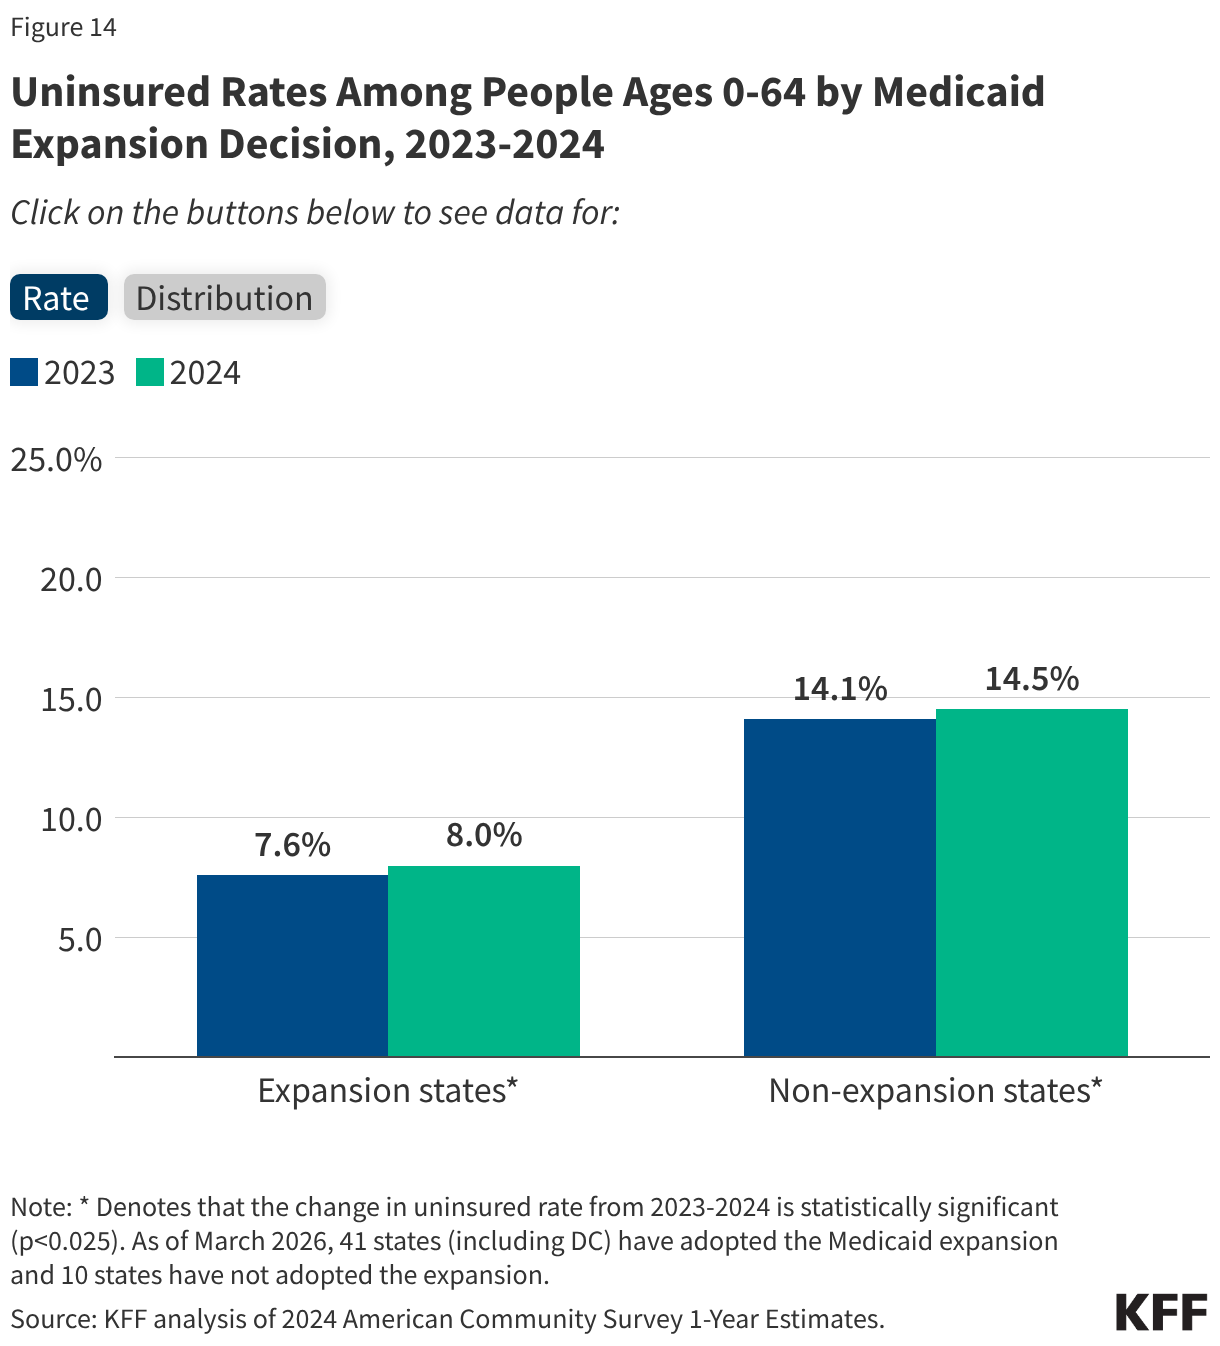
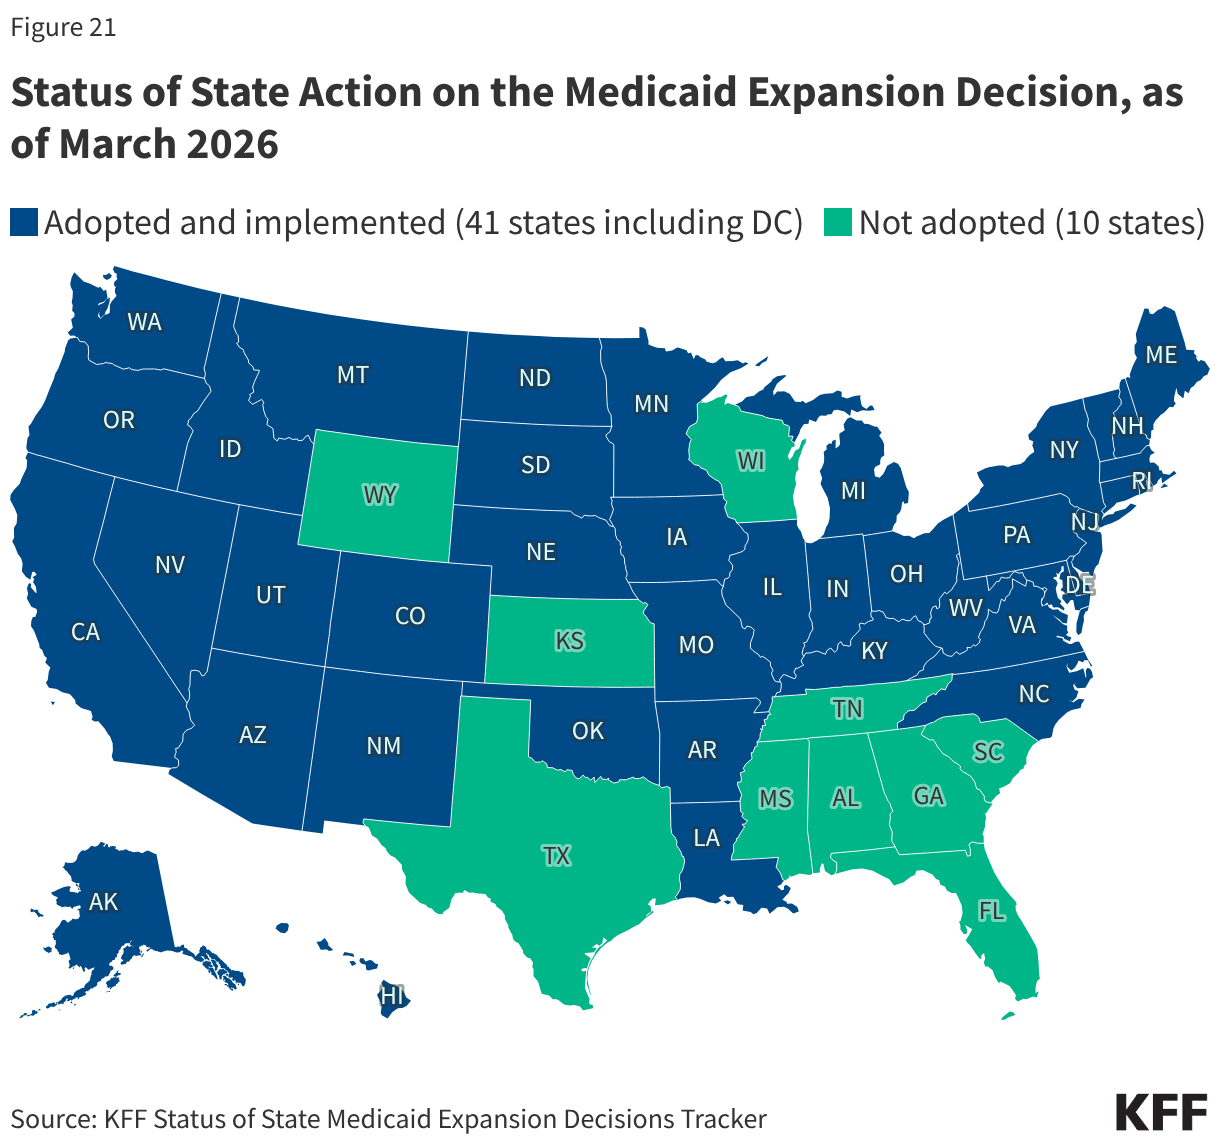
The high cost of private insurance and limited availability of public coverage for some individuals with low income—particularly in states that have not expanded Medicaid under the Affordable Care Act (ACA)—continued to leave millions of people without health coverage in 2024. Our fragmented and complex health insurance system also means some people fall through the cracks of coverage when they experience a change in circumstances. The end of continuous enrollment in Medicaid also affected health coverage trends in 2024. Starting in April 2023, states resumed disenrolling Medicaid enrollees, a process known as Medicaid unwinding, after a period of continuous enrollment during the pandemic. Nearly all states had completed renewals to verify eligibility for the program for all enrollees by the end of 2024, leading to the disenrollment of millions of Medicaid enrollees. Most individuals losing Medicaid do not have access to affordable job-based coverage, and while many transitioned to subsidized coverage through the Marketplace, even with enhanced Marketplace subsidies still in place during 2024, coverage was unaffordable for some. These coverage transitions and losses contributed to the first increase in the uninsured rate since 2019.
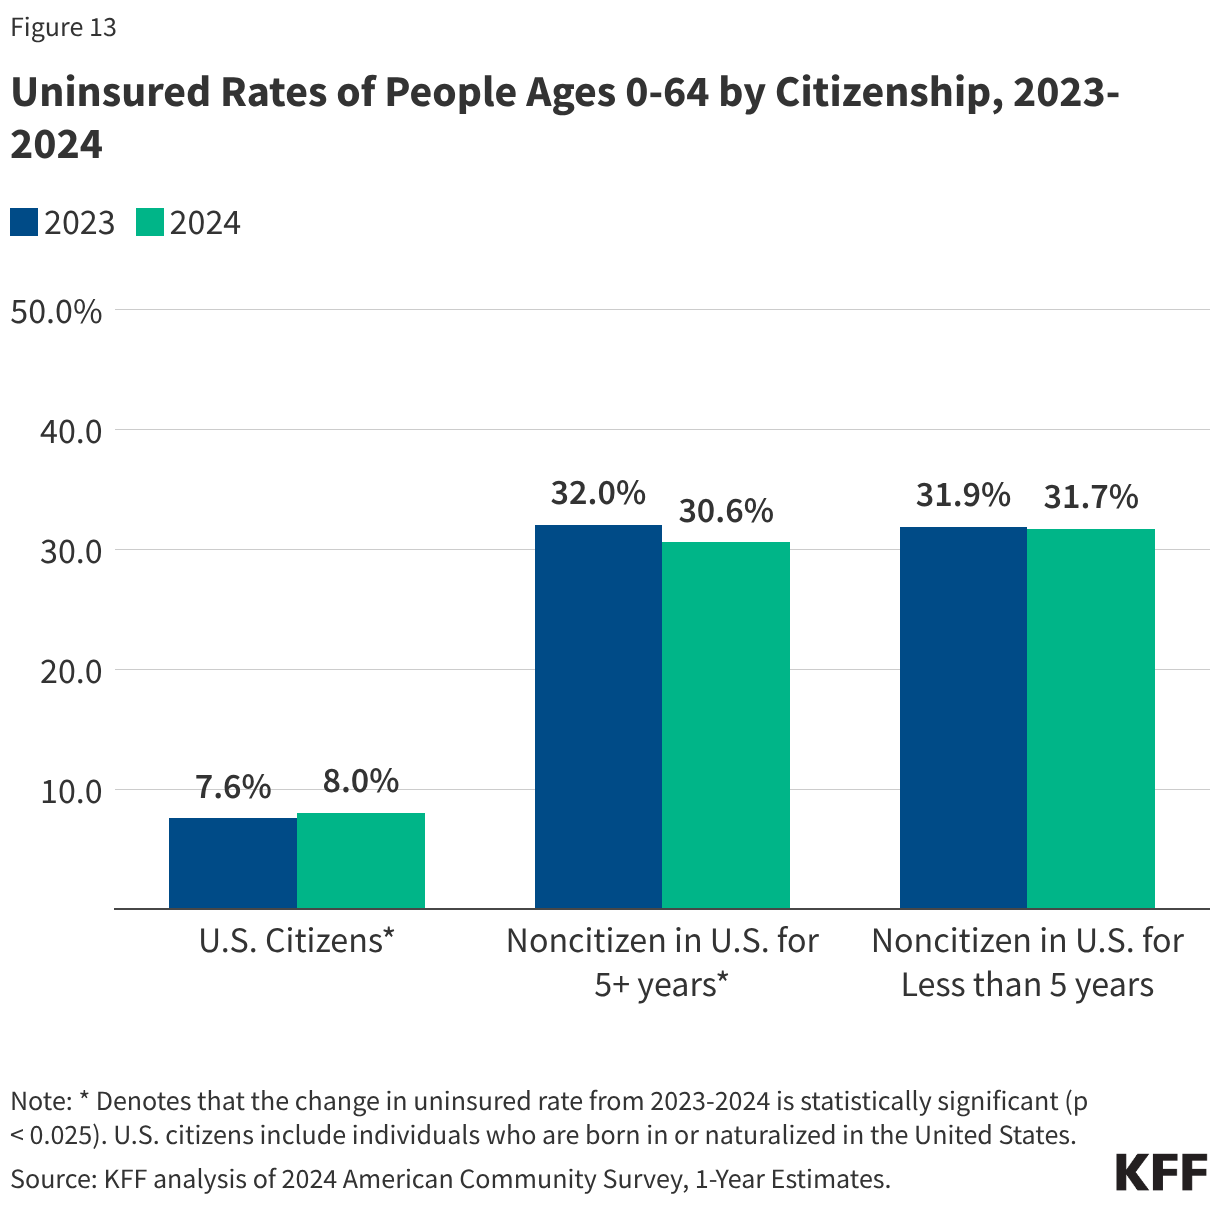
The number of people who are uninsured is expected to continue to increase in coming years because of changes to Medicaid and the ACA Marketplace included in the 2025 reconciliation law, the expiration of the Marketplace enhanced premium tax credits, and other administrative actions. The Congressional Budget Office (CBO) projects that over 14 million more people will be uninsured in 2034 due to the combined effects of the Medicaid and Marketplace eligibility changes included in the reconciliation law and the expiration of the enhanced Marketplace subsidies. In addition to these potential coverage losses, the Trump administration’s increased immigration enforcement activities and policy changes are likely to have a broad chilling effect that could cause lawfully present immigrants who remain eligible to decide to disenroll or not enroll themselves or their children in health coverage programs. This anticipated coverage loss will have implications for access to care and financial stability among those losing coverage and could lead to a worsening of disparities in health outcomes.
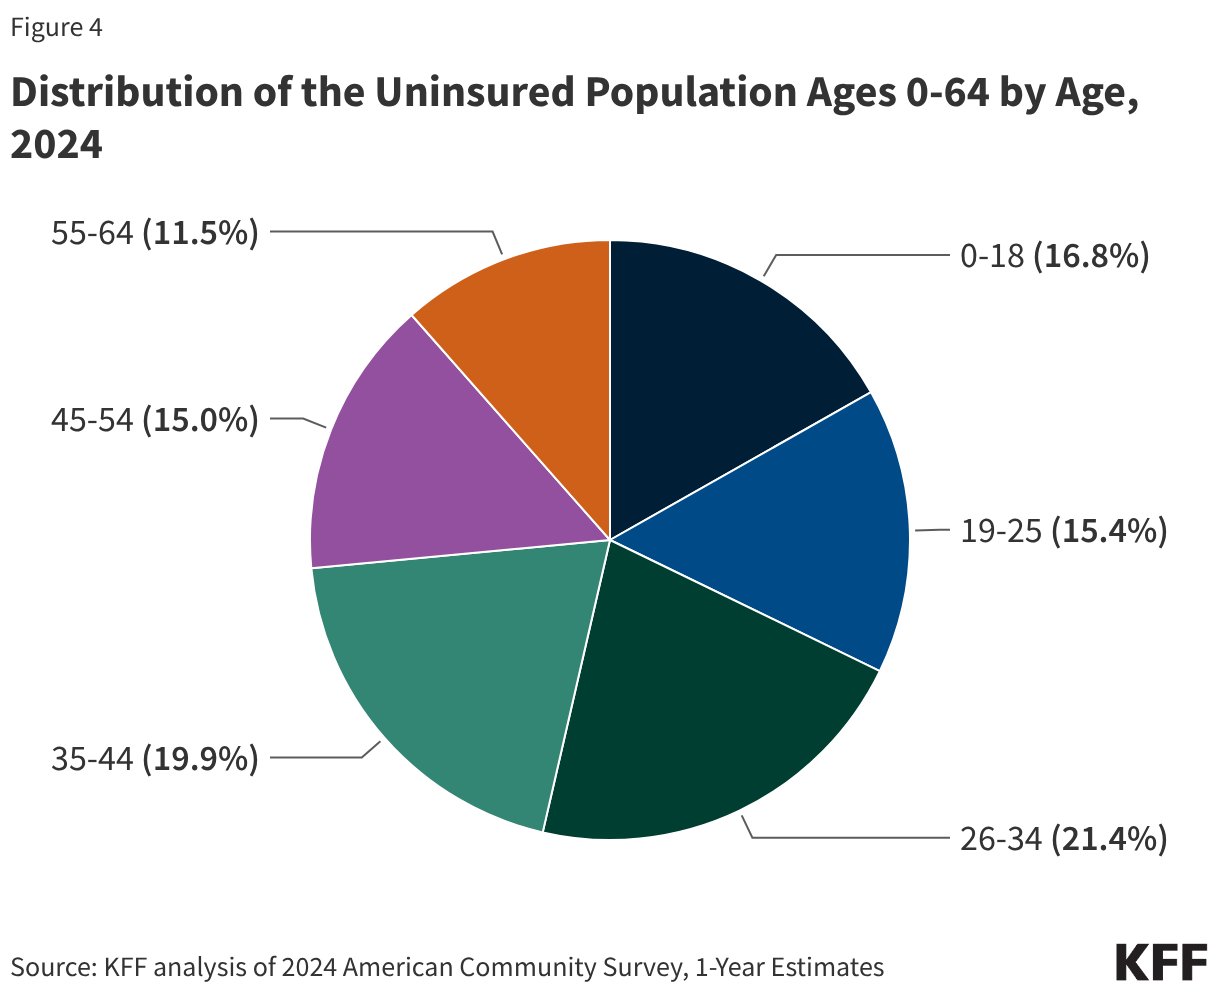
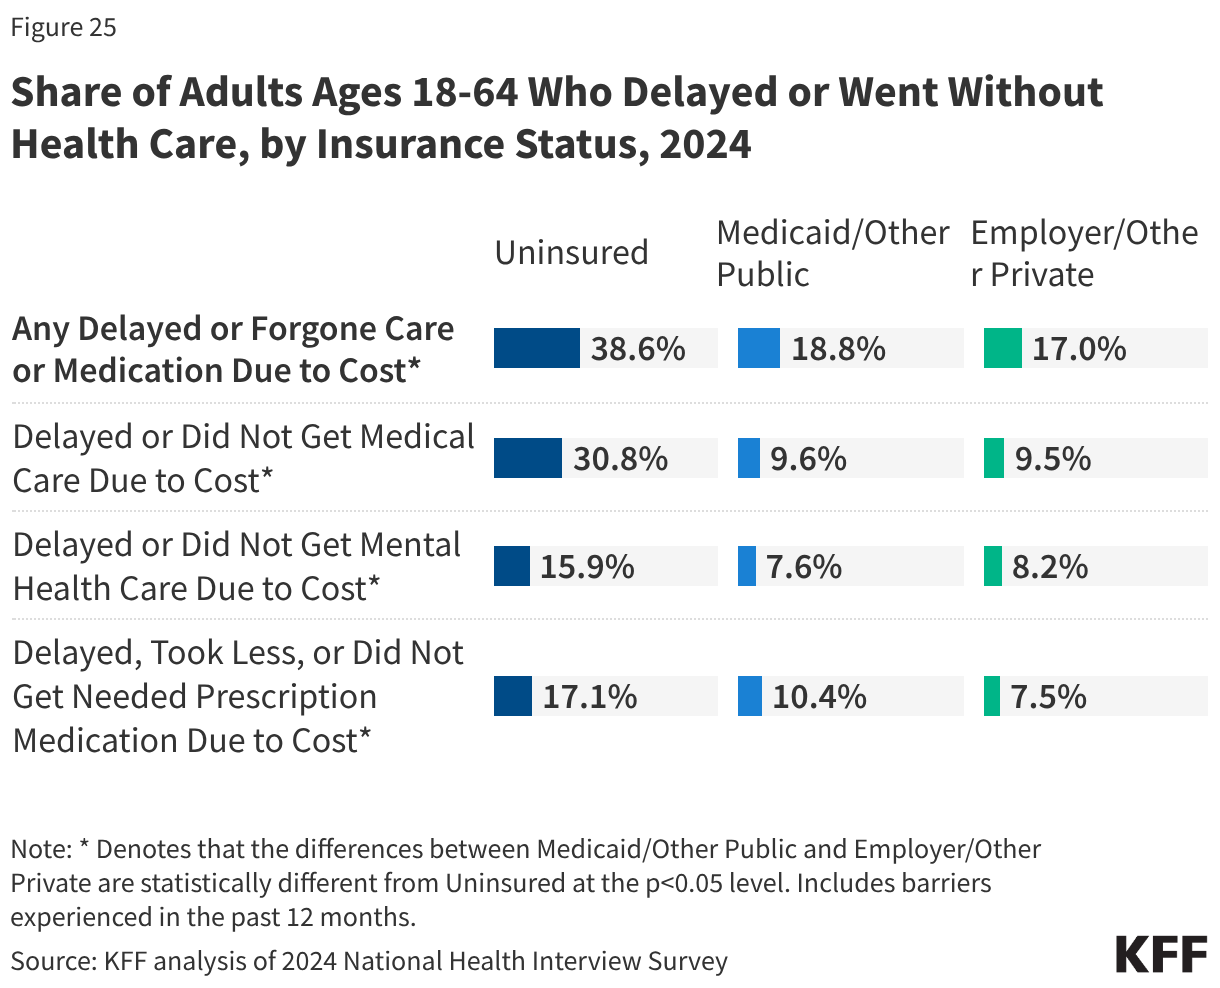
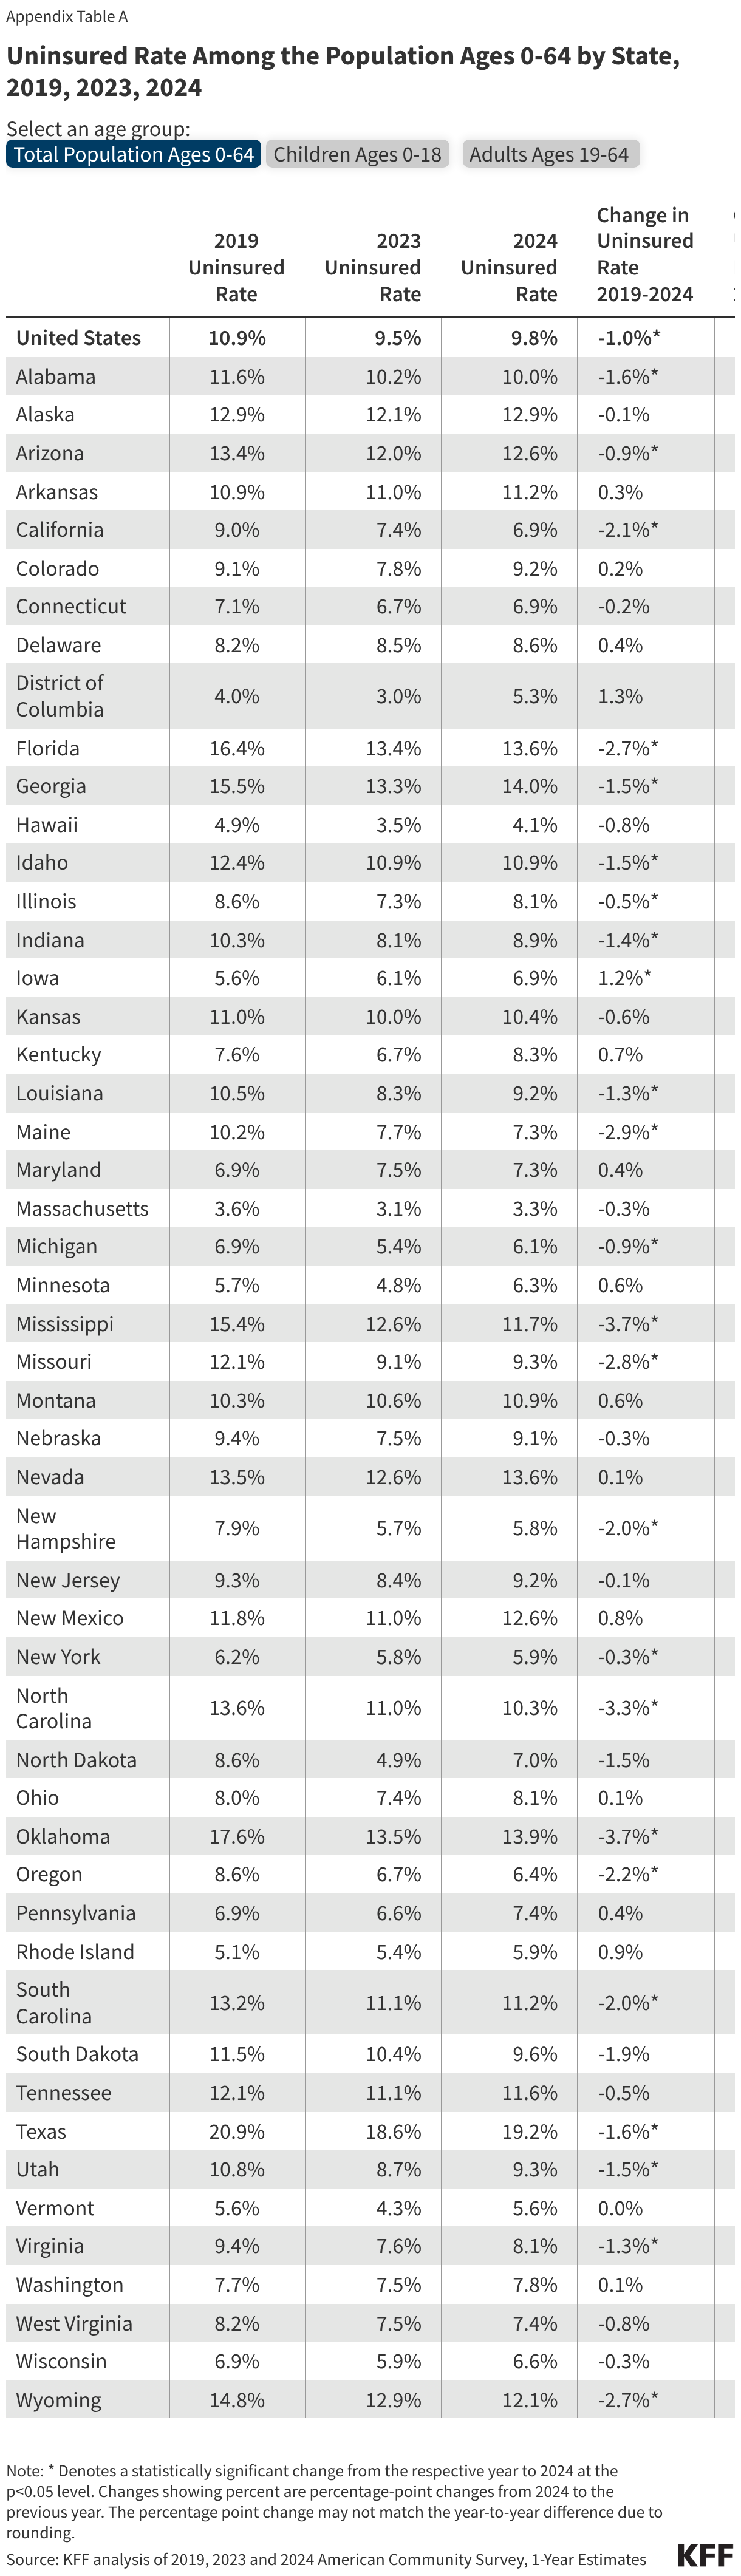
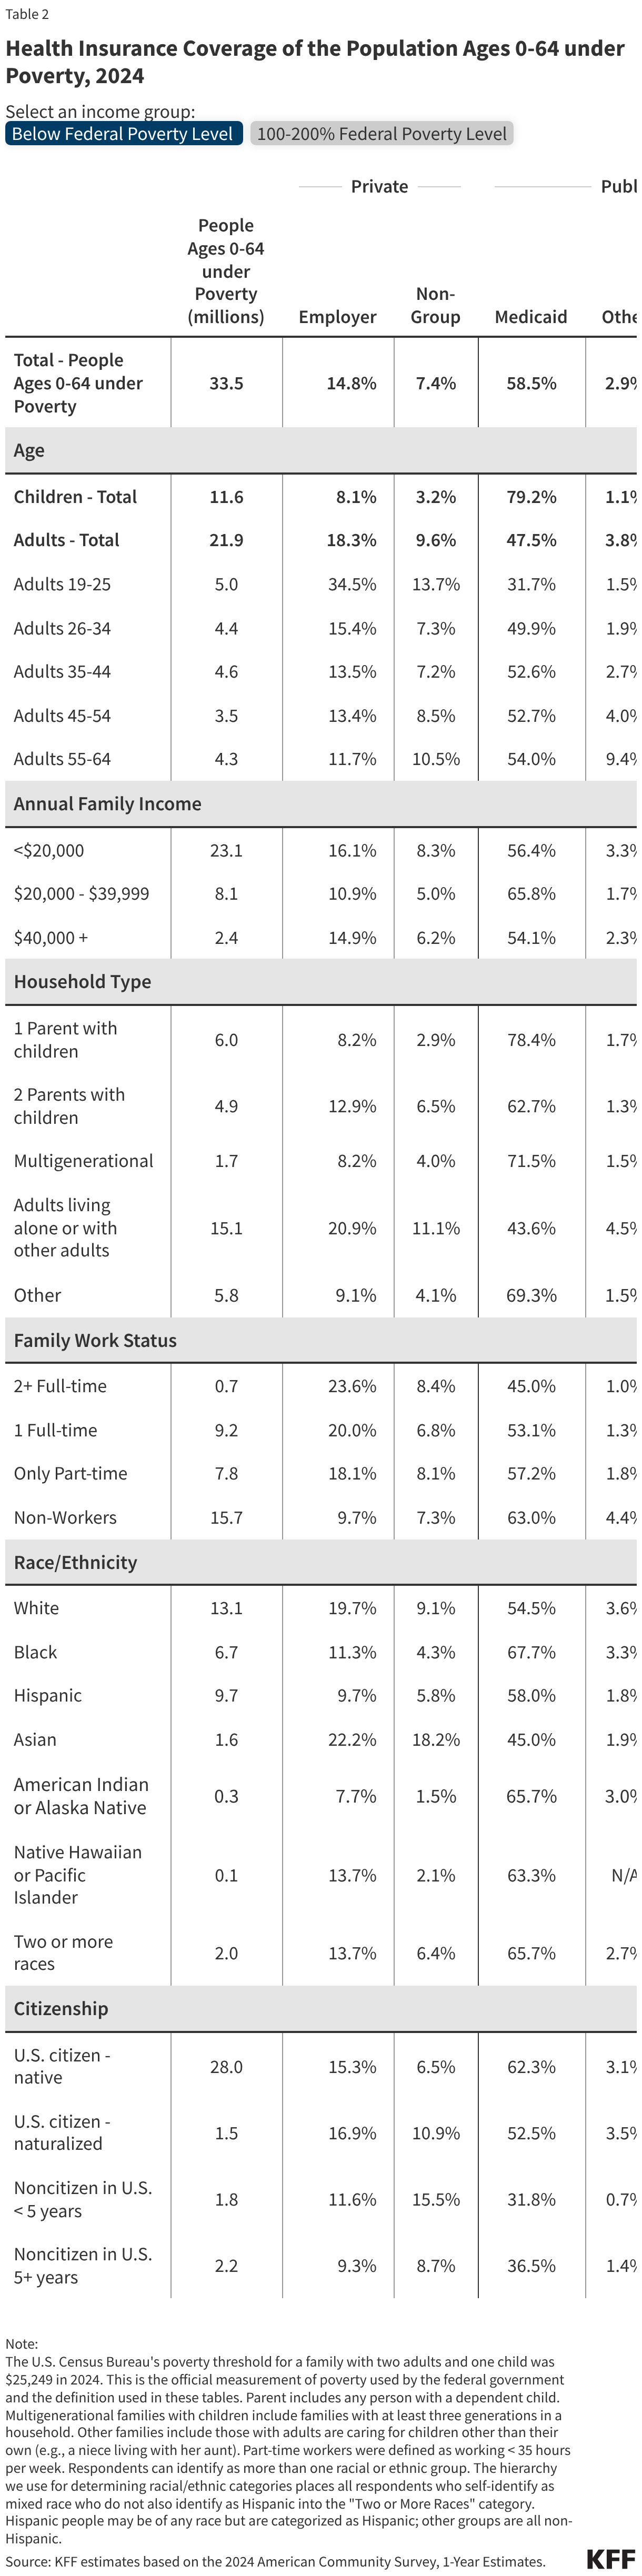
This issue brief describes trends in health coverage through 2024, examines the characteristics of the uninsured population ages 0-64, and summarizes the access and financial implications of not having coverage. Using data from the American Community Survey (ACS), this analysis examines changes in health coverage from 2023 to 2024. The analysis focuses on coverage among people ages 0-64 since Medicare offers near universal coverage for the elderly, with just 491,000, or less than 1%, of people over age 65 uninsured.