Understanding the Diversity in the Asian Immigrant Experience in the U.S.
The 2023 KFF/LA Times Survey of Immigrants
Findings
Executive Summary
Asian immigrants represent a significant and growing share of the U.S. population, contributing to the country’s communities and economy and representing dozens of countries of birth and languages spoken. Many come to the U.S. on H-1B visas, which are used by the U.S. government to employ immigrants in highly specialized and often technical fields, or on student visas for higher education. Reflecting these immigration pathways, as a broad group, Asian immigrants typically fare well on socioeconomic measures. However, contrary to the model minority myth, the experiences of Asian people in the U.S., including Asian immigrants, are not monolithic, with some subgroups facing significant socioeconomic challenges. Moreover, the U.S. has a long history of exclusionary policies focused on Asian immigrants, contributing to ongoing anti-Asian sentiment and the “perpetual foreigner” stereotype, which intensified during the COVID-19 pandemic and with some recent laws restricting the actions of Chinese immigrants in particular. Increased data on Asian immigrant experiences is important for understanding their diversity of experiences and focusing initiatives, policies, and resources to address the challenges they face.
This report examines experiences of Asian immigrant adults in the U.S. and how they vary across different factors such as region or country of origin, income, and English proficiency. It is based on The Survey of Immigrants, conducted by KFF in partnership with the Los Angeles Times during Spring 2023, the largest and most representative survey focused on immigrants living in the U.S. to date. With its sample size of 3,358 immigrant adults1 , the survey provides a deep understanding of immigrant experiences, reflecting their varied countries of origin and histories, citizenship and immigration statuses, racial and ethnic identities, and social and economic circumstances. KFF also conducted focus groups with immigrants from an array of backgrounds, which expand upon information from the survey (see Methodology for more details). Other reports from this survey include an overview report, a health and health care experiences report, and a report on politics and policy. Key takeaways from this report include:
A majority of Asian immigrants in the U.S. are from China, India, or the Philippines, are long-term U.S. residents, and are college-educated and employed; yet some face socioeconomic and language challenges. Asian immigrants include people born in China (21%), India (21%), the Philippines (17%), as well as smaller shares from other East, Southeast, South, and Central Asian countries. Three in four (74%) Asian immigrants have been in the U.S. for ten or more years and two-thirds (66%) are naturalized citizens. However, South Asian immigrants (including those from India) are more likely than East and Southeast Asian immigrants (including those from China and the Philippines) to be recent immigrants (15 vs. 7%) and less likely to be citizens (55% vs. 71%). Overall, four in ten (41%) Asian immigrants live in households with annual incomes of at least $90,000, with immigrants from South Asia (51%) more likely to have higher household incomes than immigrants from East and Southeast Asia (36%), likely reflecting differences in the shares with a college degree (71% vs. 48%). About half (49%) of Asian immigrants have limited English proficiency (LEP), including seven in ten (71%) Chinese immigrants.
Like immigrants overall, most Asian immigrants come to the US for better opportunities for themselves and their children and most feel that their lives are better as a result of coming, although they are somewhat less likely than other immigrants to say their safety is better off. Among Asian immigrants, those from China are particularly less likely to say that their safety is better as a result of immigrating to the U.S. with just one in three (34%) saying it is better as compared to at least half of Indian (52%) and Filipino (59%) immigrants. This may, in part, reflect increases in anti-Chinese sentiment during COVID-19 and recent laws targeting Chinese immigrants.
About one in three (36%) Asian immigrants report facing at least one form of discrimination or harassment in the community. These experiences include being treated worse than U.S.-born people in stores or restaurants (27%), in interactions with the police (17%), or when buying or renting a home (14%). One in five (20%) also say that the COVID-19 pandemic changed the way they are treated as an immigrant in a bad way, including about a quarter (27%) of Chinese immigrants. About four in ten (45%) with LEP also say that difficulty speaking or understanding English has made it hard for them to access health care or public assistance services or complete certain activities such as getting or keeping a job or interacting with the police.
While most Asian immigrants are faring well in employment and finances, reflecting higher educational attainment levels than other immigrant groups, those with lower household incomes face challenges. One in five (19%) living in households with lower incomes (less than $40,000 per year) have difficulty paying their bills each month, and one in three (32%) lower income Asian immigrants say they had problems paying for necessities such as housing, health care, utilities, or food in the past 12 months. Four in ten (44%) employed Asian immigrants, including half of those living in households with lower incomes, report experiencing at least one form of workplace discrimination asked about in the survey.
Reflecting their job patterns and higher incomes, a majority (64%) of Asian immigrant adults say they have private health coverage and only 4% report being uninsured. Highlighting the important role that coverage plays in access to health care, over eight in ten Asian immigrants say they have a usual source of care (86%) and a trusted doctor in the U.S. (84%) and only one in six (16%) report skipping or postponing health care for any reason in the past year. However, one in five (21%) report experiencing discrimination or unfair treatment in a health care setting due to their insurance status or ability to pay, their accent or ability to speak English, or their race, ethnicity, or skin color.
Four in ten (42%) of Asian immigrants say they don’t have enough information about U.S. immigration policies to understand how they impact their family, and many remain confused about how use of assistance for health care, housing, or food can impact immigration status. Among Asian immigrants with LEP, half (49%) say they do not have enough information about U.S. immigration policy. Seven in ten Asian immigrants, say they are unsure (55%) whether the use of non-cash benefits to help pay for health care, housing, or food can impact the likelihood of being approved for a green card or incorrectly believe this to be the case (15%). The share who incorrectly believe this to be the case is higher among noncitizens and immigrants who have been in the U.S. for less than 10 years as compared to their naturalized citizen and 10+ year resident counterparts.
Who Are Asian Immigrants?
Country/Region of Origin: One in five (21%) Asian immigrants in the U.S. are from China, an additional 17% are from the Philippines and 29% from other East and Southeast Asian countries (such as Korea, Japan, and Thailand).2 About one in five (21%) are from India with an additional 7% hailing from other South Asian countries (such as Bangladesh, Pakistan, and Sri Lanka). Asian immigrants also include those from Central Asia (including Kazakhstan, Uzbekistan, and others). See here for a list of regional groupings.
Census Region: Four in ten Asian immigrants live in the West (43%), a quarter (24%) live in the South, one in five (21%) live in the Northeast and a smaller share (12%) live in the Midwest. Almost half of Asian immigrants live in one of three U.S. states: California (31%), New York (9%), or Texas (8%).
Time in country: Similar to the overall immigrant population, most Asian immigrants are long-term U.S. residents. About three in four (74%) have lived in the U.S. for ten or more years, 14% have been in the U.S. for five to nine years, while one in ten (10%) have been in the U.S. for less than five years. Higher shares of immigrants from India have been in the U.S. for less than five years (16%) as compared to immigrants from the Philippines (6%) and this is also true for South Asian immigrants overall (15%) as compared to East and Southeast Asian immigrants (7%).
Employment: Similar to the overall immigrant population, two-thirds (64%) of Asian immigrants are currently employed for pay, including three-quarters (74%) of those ages 18-64; 17% of employed Asian immigrants are self-employed or the owner of a business.
Parental Status: About one in three (34%) Asian immigrants are the parent of a child under 18 living in their household, and the vast majority (81%) of this group say at least one of their children was born in the U.S.
English Proficiency: Similar to the total immigrant population, almost half (49%) of Asian immigrants have limited English proficiency (LEP, defined as speaking English less than very well), with shares with LEP about twice as high (71%) among immigrants from China as compared to their counterparts from India (32%) and the Philippines (34%). LEP rates are also higher among immigrants from East and Southeast Asia overall (56%) as compared to immigrants from South Asia (38%). About one in three Asian immigrants say they speak English very well (32%) and an additional one in five (19%) say they speak English exclusively. Asian immigrants speak a wide variety of languages at home, including one in five (21%) who speak some form of Chinese, one in ten (13%) who speak Filipino or Tagalog, and one in ten (10%) who speak Vietnamese. Other languages spoken by Asian immigrants include Urdu, Hindi, Korean, Japanese, and many others.
Immigration Status: Two-thirds (66%) of Asian immigrants are naturalized U.S. citizens, while about three in ten (29%) say they have a valid visa or green card, and 5% are likely undocumented. Among Asian immigrants, those from the Philippines have the highest shares (80%) of naturalized citizens followed by immigrants from China (60%); immigrants from India include lower shares of naturalized citizens (49%) which could in part be due to 16% of them being more recent immigrants (less than five years). In general, the shares of Asian immigrants who are naturalized citizens are higher among immigrants from East and Southeast Asia (71%) as compared to those from South Asia (55%).
Educational Attainment: A majority (54%) of Asian immigrants have a college degree or higher, about one in six have completed some college (18%), and about a quarter (26%) have a high school education or less. Those with a college degree or higher include much higher shares of immigrants from India (83%) as compared to immigrants from China (56%) or the Philippines (52%) and this is also true for South Asian immigrants overall (71%) as compared to East and Southeast Asian immigrants (48%).
Household Income: Four in ten (41%) Asian immigrants live in households with annual incomes of at least $90,000, and another 29% live in households with annual incomes of $40,000 to less than $90,000. About one in four (27%) live in households with lower incomes (less than $40,000 per year). Immigrants from India (62%) are much more likely to have higher household incomes compared with immigrants from China (41%) and the Philippines (37%), reflecting differences in educational attainment. Overall, immigrants from South Asia (51%) are more likely than immigrants from East or Southeast Asia (36%) to have higher household incomes.
Reasons For Coming And Life In The U.S.
Like immigrants overall, a majority of Asian immigrants cite better opportunities and a better future for their children as reasons for moving to the U.S., with high shares of immigrants from East and Southeast Asia also citing having more rights or freedoms as a reason. Among Asian immigrants, at least three in four say better economic and job opportunities (86%), educational opportunities (79%), and a better future for their children (75%) are a reason they moved to the U.S. Smaller shares say they came to the U.S. to have more rights or freedoms (66%), to join or accompany family members (51%), or to escape violent or unsafe conditions (34%). However, the share citing more rights and freedoms as a reason is higher among immigrants from East and Southeast Asia (71%) compared with those from South Asia (52%).
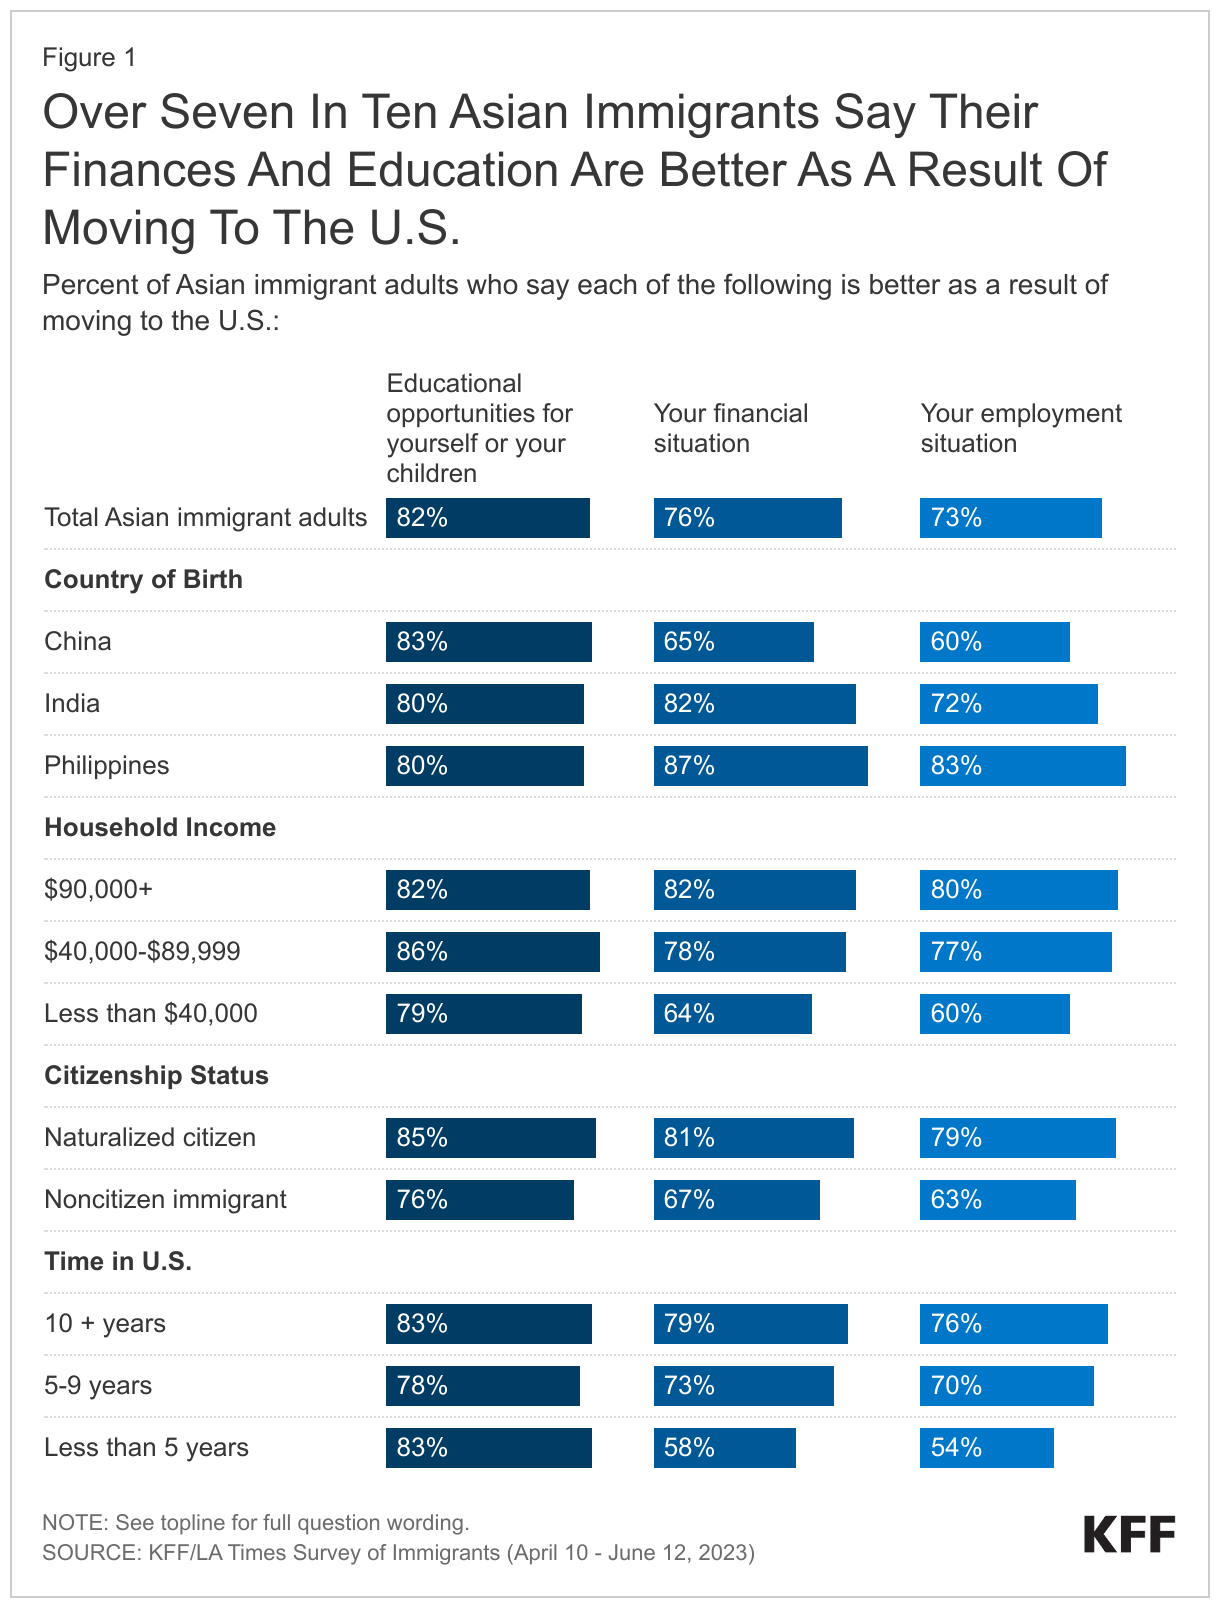
Majorities of Asian immigrants feel that their educational and financial situations are better as a result of moving to the US, even among those with lower incomes and those who are noncitizens (Figure 1). Overall, more than seven in ten Asian immigrants say their financial (76%) and employment (73%) situation are better, and eight in ten (82%) say their or their children’s educational opportunities are improved. Regardless of immigration status, income, or time in the U.S., a majority of Asian immigrants report they are doing better on these measures. However, the shares reporting they are doing better in terms of finances and employment are somewhat lower among noncitizens, more recent immigrants, and those with lower incomes (less than $40,000 per year) compared to their citizen, longer-term immigrant (10+ years), and higher income (at least $90,000 per year) counterparts. Moreover, those from China are less likely to say they are doing better on financial and employment measures than those from India and the Philippines.
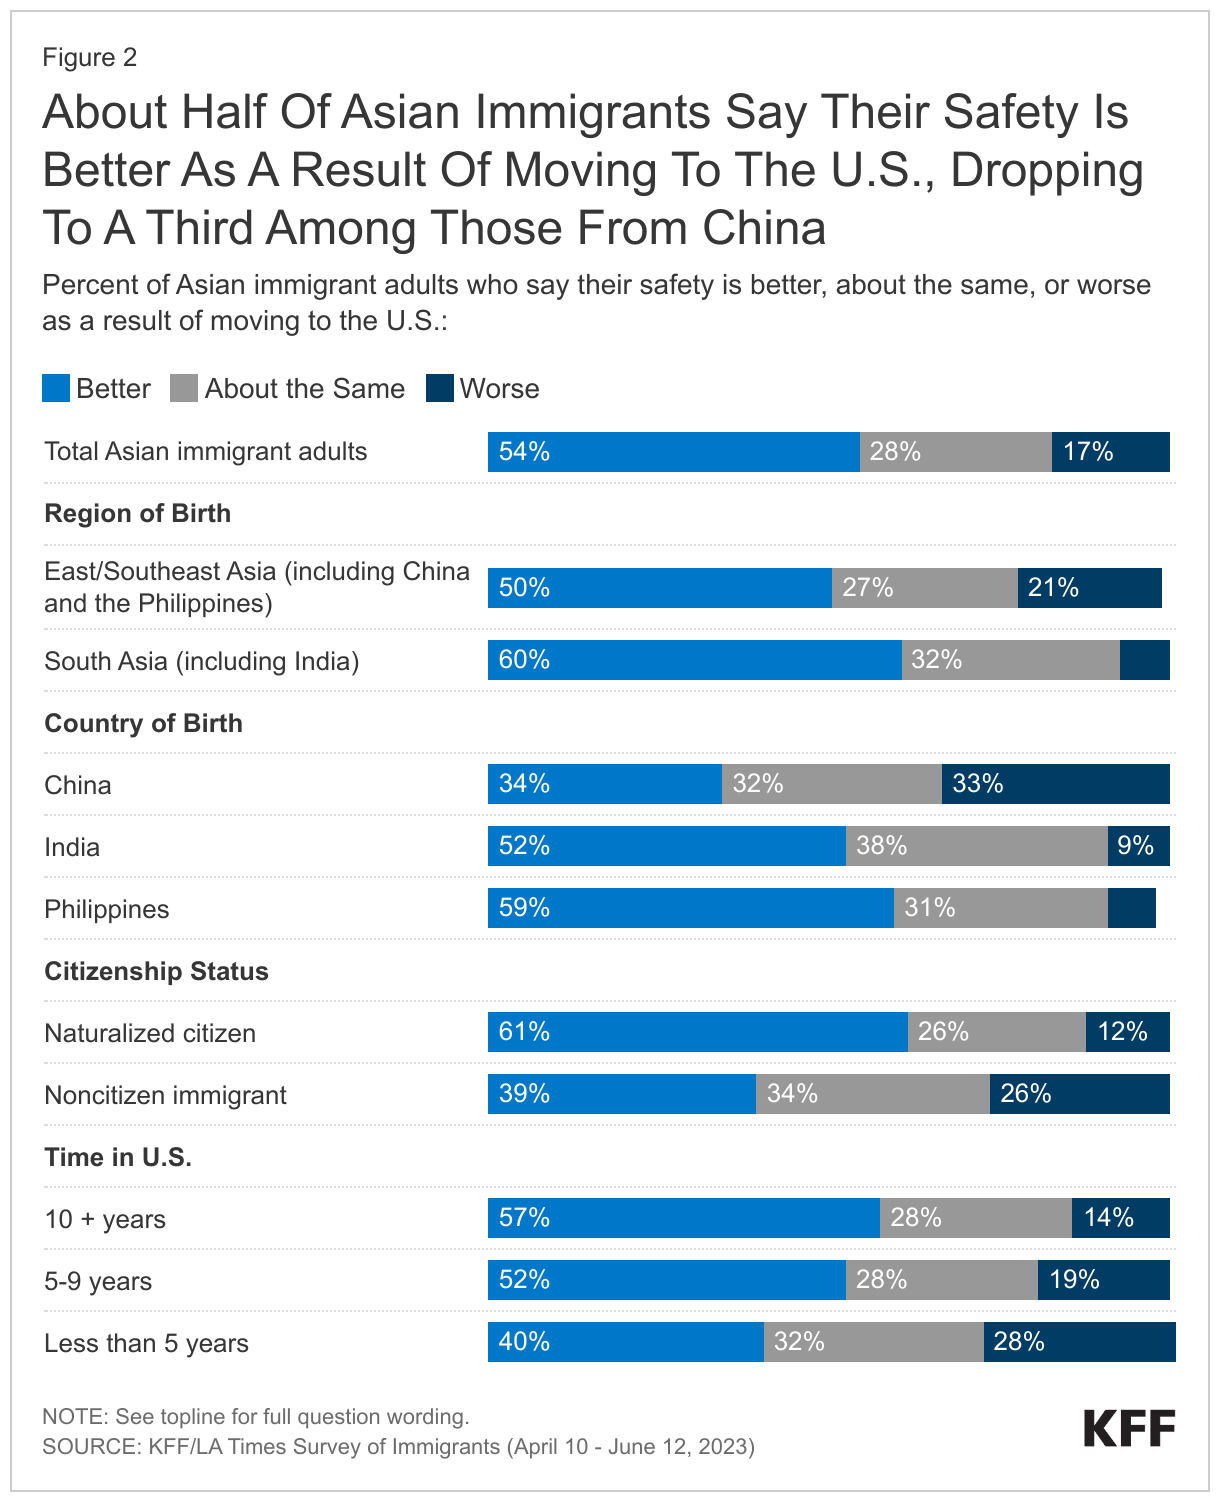
About half (54%) of Asian immigrants say their safety is better as a result of moving to the U.S. and roughly one in five (17%) say it is worse, with those from East and Southeast Asia, noncitizens, and recent immigrants more likely to say it is worse (Figure 2). In comparison, among immigrants overall, about two in three (65%) say their safety is better as a result of immigrating. Asian immigrants from East and Southeast Asia are about twice as likely as those from South Asia to say their safety is worse (21% vs. 7%), a pattern largely driven by the one-third (33%) of immigrants from China who say this. In addition, noncitizens (26%) and recent immigrants (less than five years) (28%) are about twice as likely as naturalized citizens (12%) and longer-term immigrants (10+ years) (14%), respectively, to say that their safety is worse because of moving to the U.S. These feelings about safety may, in part, reflect the rise in anti-Asian hate incidents during the COVID-19 pandemic.
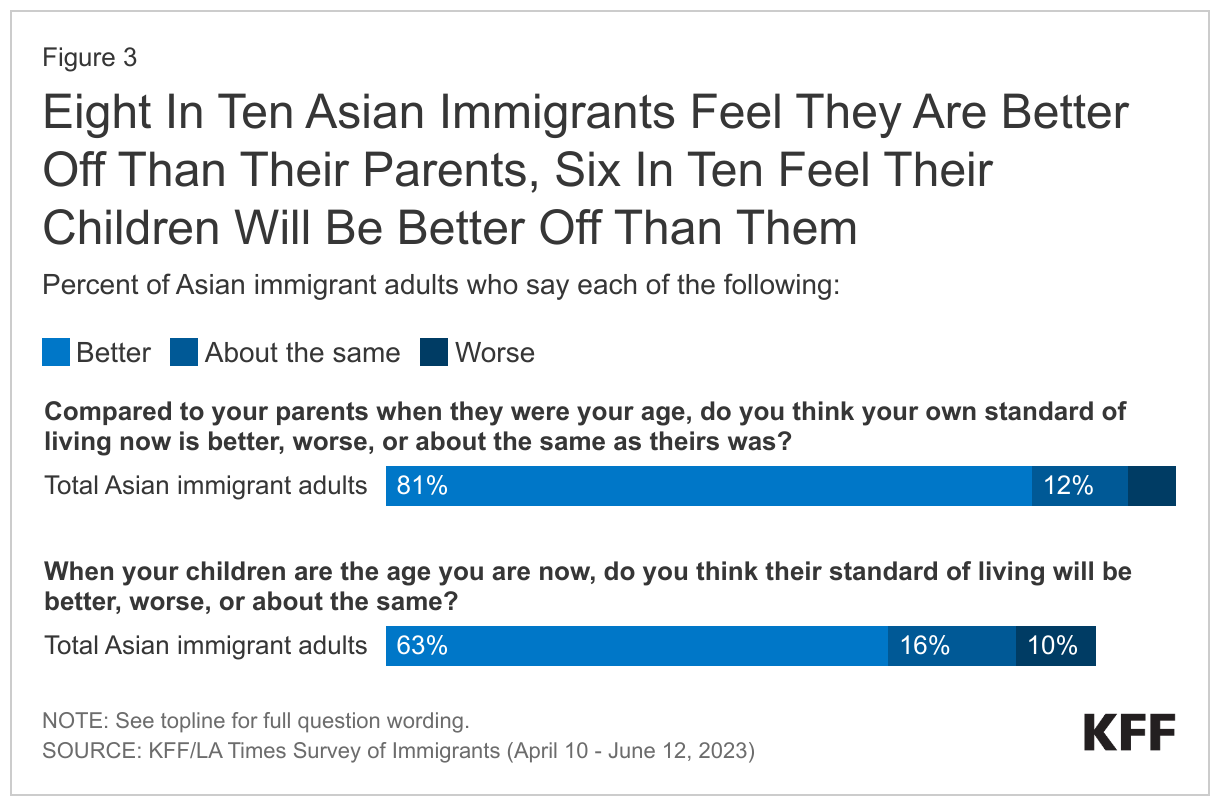
Eight in ten (81%) Asian immigrants, regardless of country or region of birth, citizenship status, and length of time in the country, feel that their standard of living is better than their parents’ was at their age, and six in ten (63%) feel that their children’s standard of living will be better than theirs (Figure 3). Optimism for their children’s future standard of living is higher among Asian immigrants with lower educational attainment (high school or less) (69%) and LEP (69%) compared with those who have completed college (58%) and are English proficient (57%).
Experiences With Discrimination And Unfair Treatment
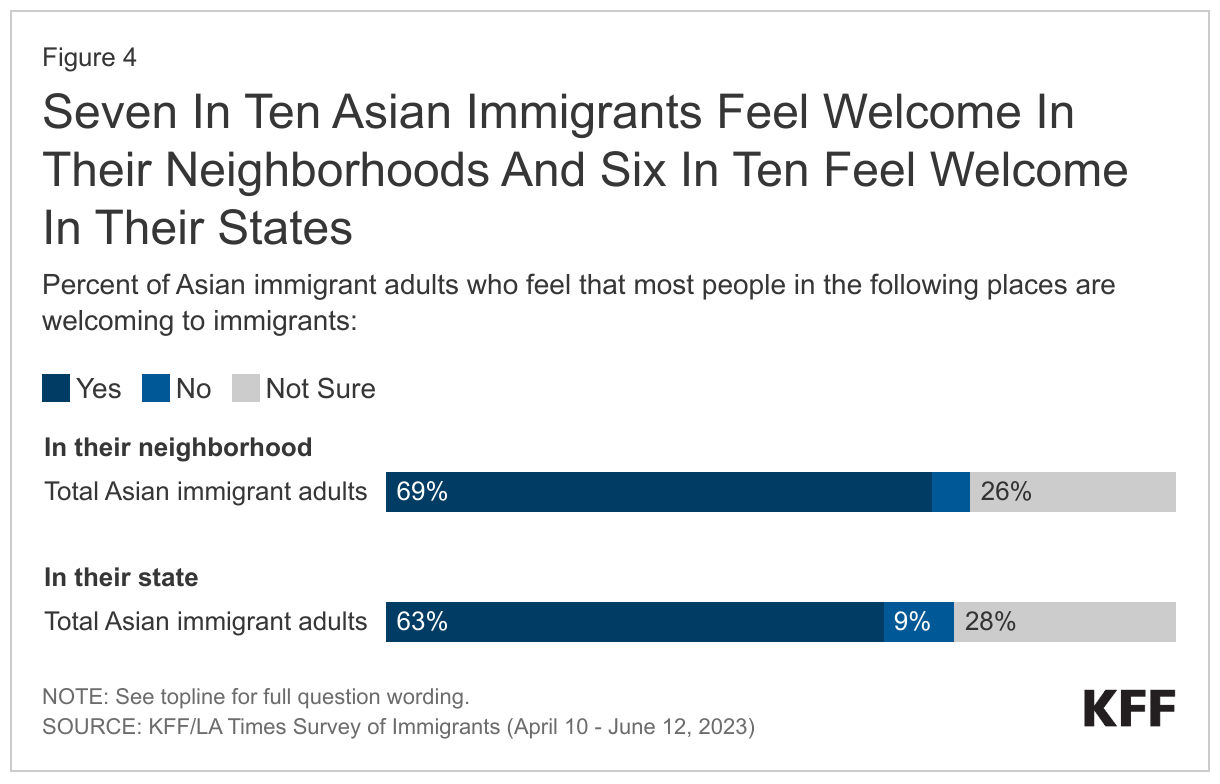
Like immigrants overall, a majority of Asian immigrants feel most people in their neighborhood (69%) and the state (63%) they live in are welcoming to immigrants (Figure 4). Overall, 5% say that most people in their neighborhood are not welcoming to immigrants, and about one in ten (9%) say that people in their state are not welcoming. The remaining shares say they are unsure if people in their neighborhood (26%) and state (28%) they live in are welcoming to immigrants.
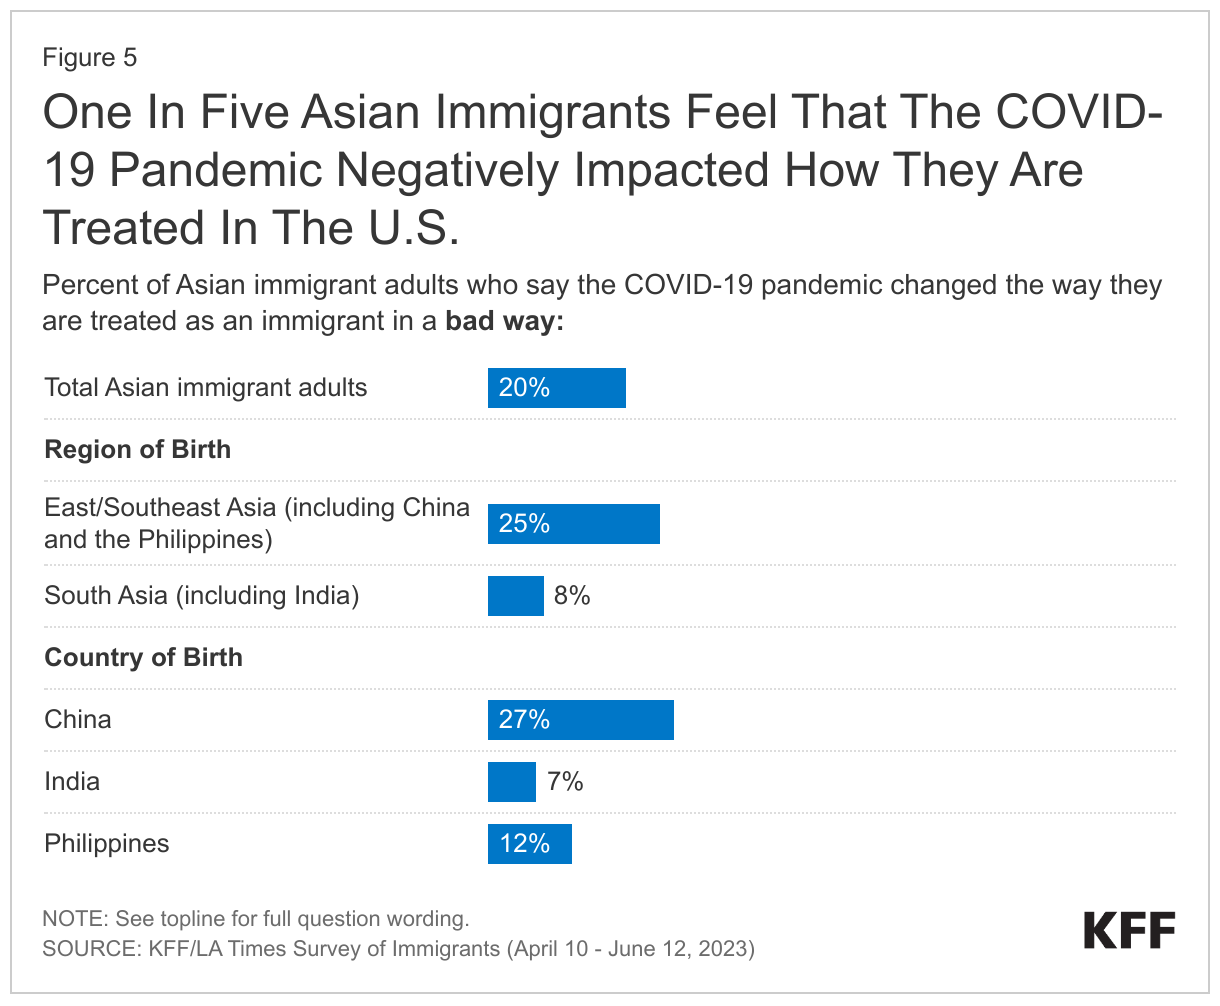
One in five (20%) Asian immigrants feel the COVID-19 pandemic has negatively impacted the way that they are treated as an immigrant, higher than the shares for Black (11%), Hispanic (9%), and White immigrants (7%). Immigrants from East and Southeast Asia (25%) are much more likely than those from South Asia (8%) to say that the pandemic changed how they are treated as an immigrant in a bad way, largely driven by the 27% of Chinese immigrants who say this compared with about one in ten Indian (7%) and Filipino (12%) immigrants (Figure 5). These patterns likely reflect the strong anti-Chinese rhetoric perpetuated by the Trump Administration, which repeatedly blamed China for the spread of the COVID-19 pandemic.
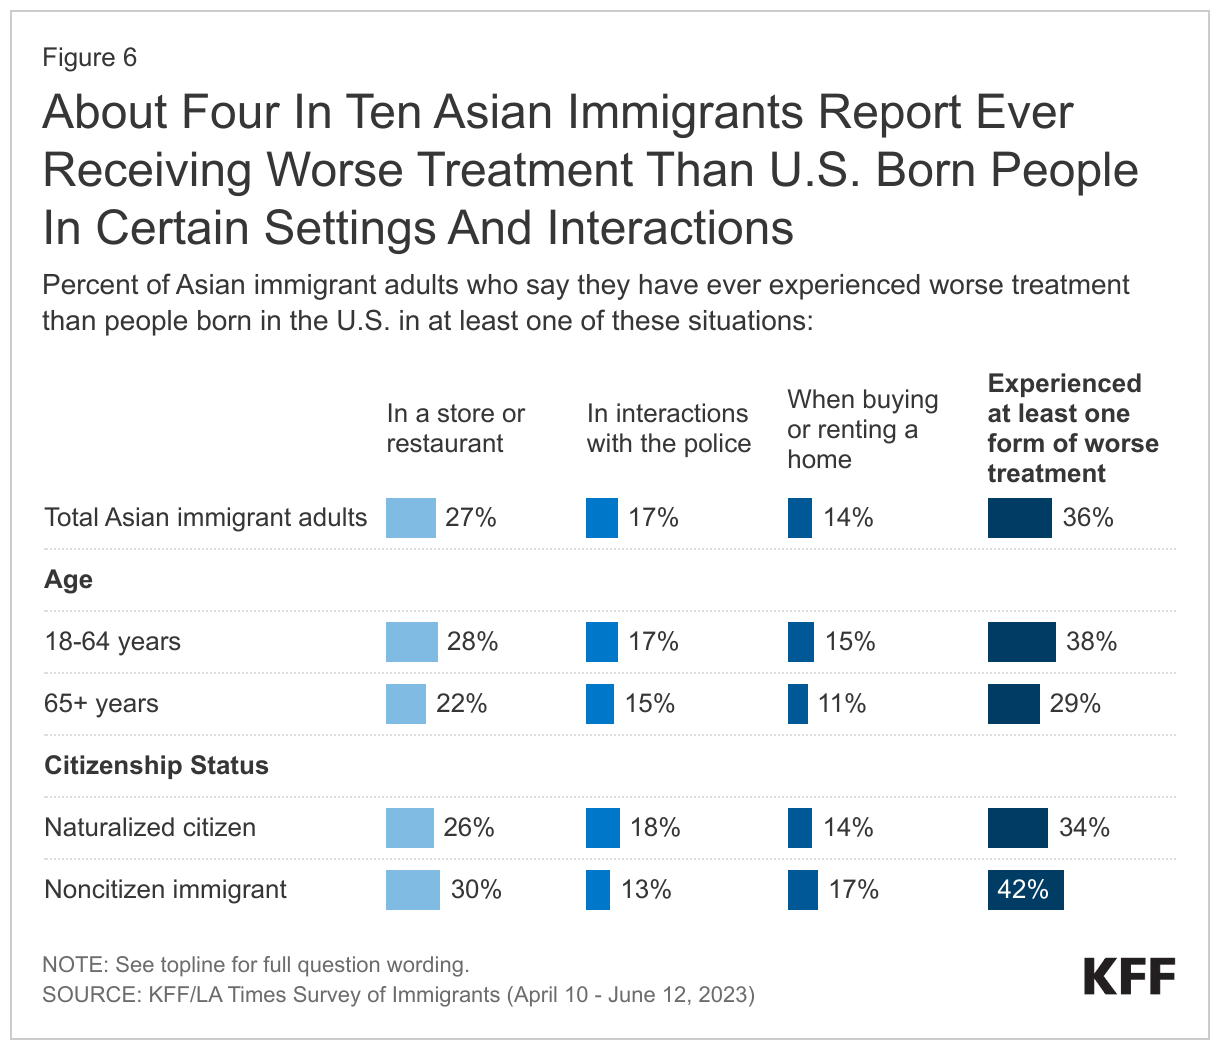
About one in three (36%) Asian immigrants say they have ever received worse treatment than U.S.-born people in stores or restaurants (27%), in interactions with the police (17%), or when buying or renting a home (14%), with those under age 65 and who are noncitizens particularly likely to report these experiences (Figure 6). Asian immigrant adults younger than 65 (38%) are more likely than their older counterparts (29%) to say they have ever experienced at least one form of worse treatment, as are noncitizen Asian immigrants (42%) compared with those who are naturalized citizens (34%).
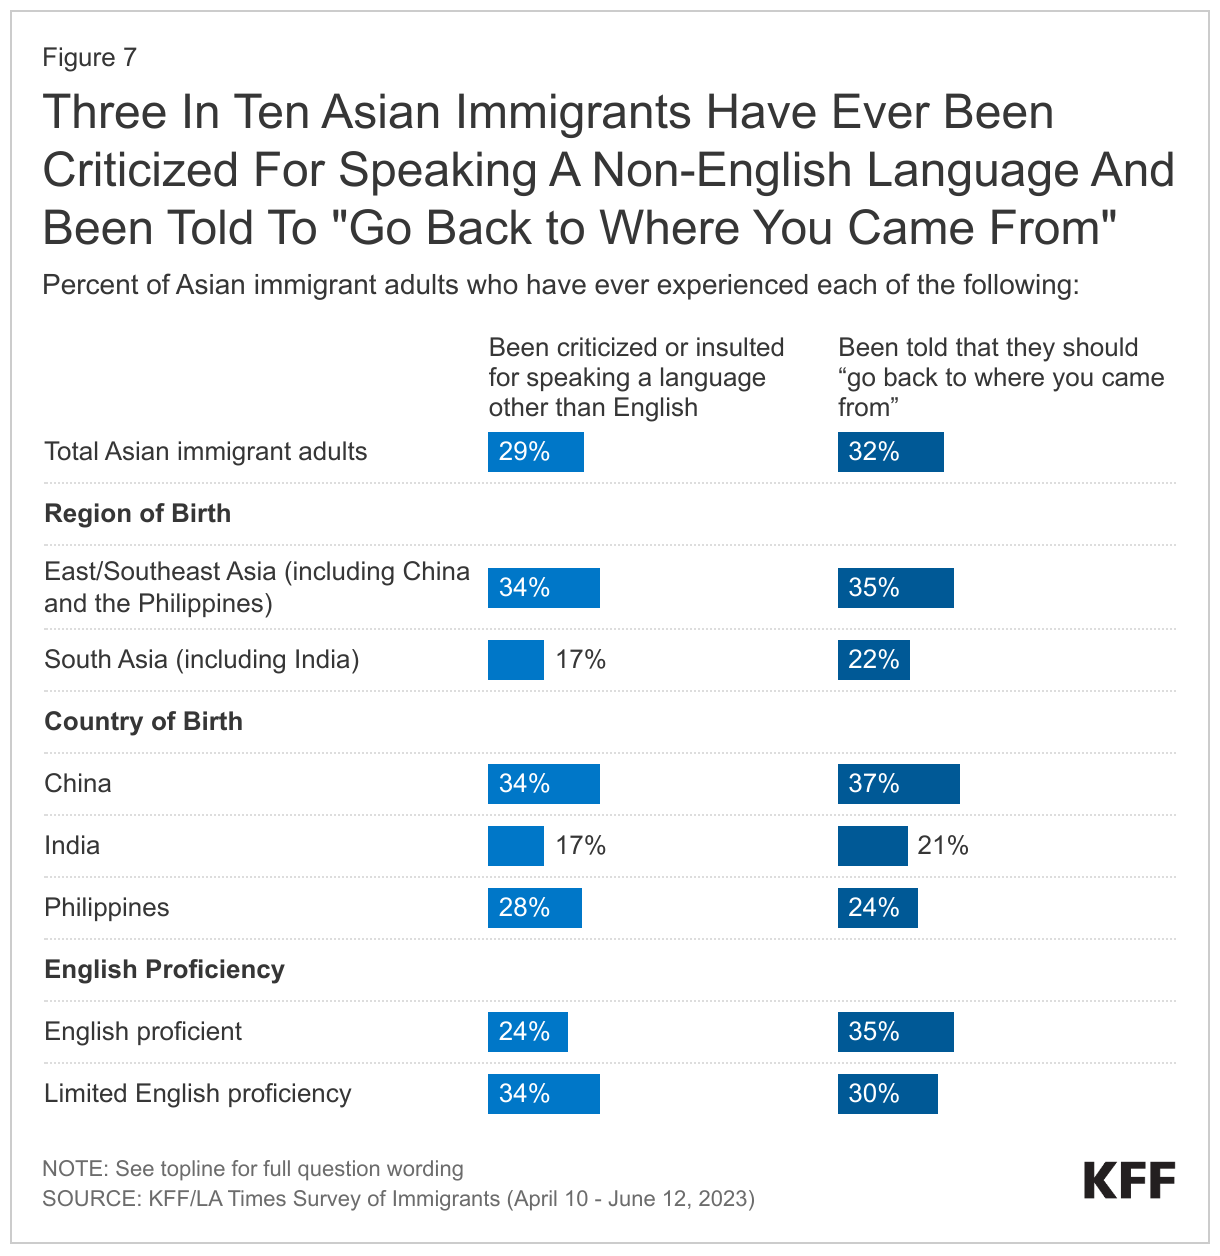
About three in ten Asian immigrants say they have ever experienced anti-immigrant harassment such as being told to go back to where they came from (32%) or being criticized for speaking a language other than English (29%), with higher shares of Chinese immigrants and those with LEP reporting harassment (Figure 7). About one in three East and Southeast Asian immigrants say they have ever been criticized or insulted for speaking a language other than English (34%) or were told to “go back to where you came from” (35%) compared with about one in five South Asian immigrants (17% and 22%, respectively). Chinese immigrants are more likely than Indian and Filipino immigrants to report experiencing these forms of harassment, which may in part, reflect the growth in anti-Chinese rhetoric during the COVID-19 pandemic as well as recent laws restricting actions among Chinese immigrants. In addition, Asian immigrants with LEP (34%) are more likely than their English proficient counterparts (24%) to say they were criticized for speaking a language other than English, although there are no differences in the share saying they have been told “they should go back where you came from” by English proficiency. Roughly twice as many Chinese immigrants (71%) have LEP than do Filipino (34%) or Indian (32%) immigrants, which could further explain some of the differences in experiences of harassment by country of origin.
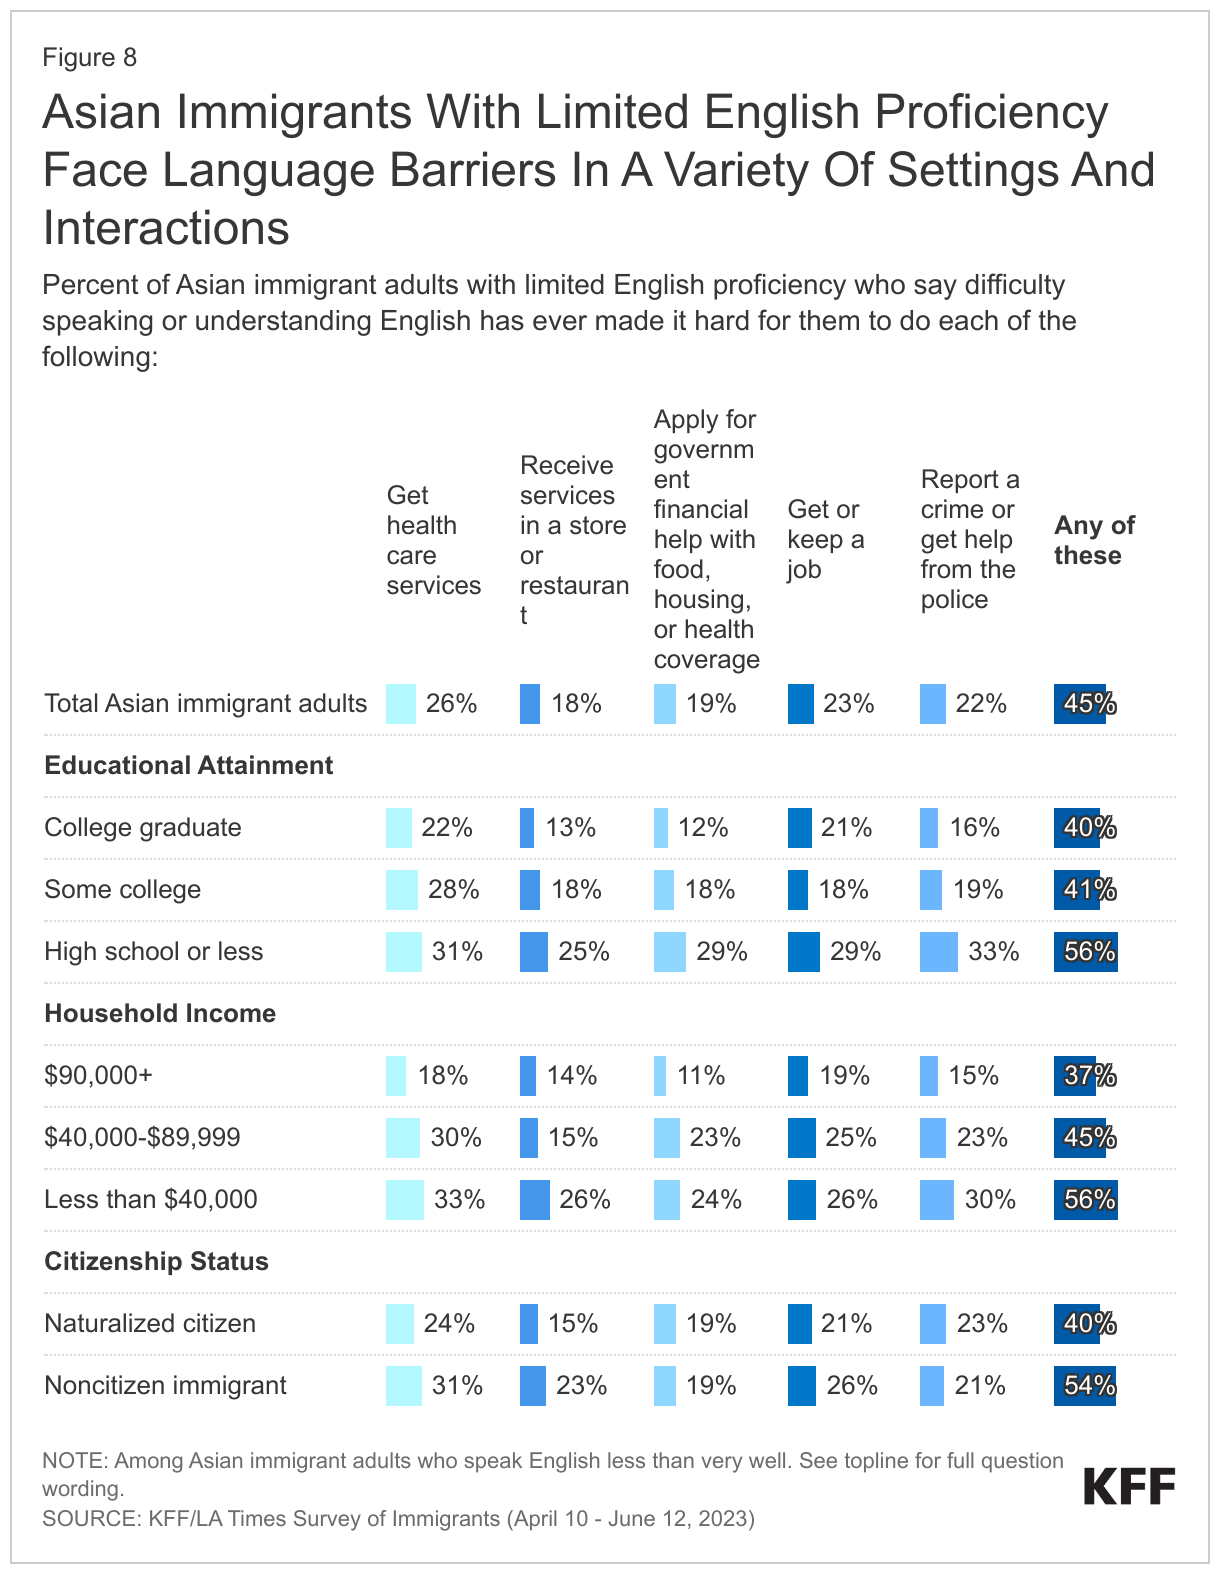
About four in ten (45%) Asian immigrants with LEP say that difficulty speaking or understanding English has made it hard for them to access certain services or complete certain activities, with this share rising to over half among those with LEP who also have lower educational attainment, lower incomes, or are noncitizens. About half (49%) of Asian immigrants have LEP, meaning they speak English less than very well, including 71% of immigrants from China. Among this group, about four in ten(45%) say that difficulty speaking or understanding English has ever made it hard for them to do at least one of the following: get health services (26%), get or keep a job (23%), or get help from the police (22%), apply for government help with food, housing, or health coverage (19%), or receive services in a store or restaurant (18%), (Figure 8). Among Asian immigrants with LEP, those with lower educational attainment, lower incomes (less than $40,000 per year), and who are noncitizens face disproportionate language challenges with over half of these groups experiencing at least one of these difficulties.
Employment and Financial Situation
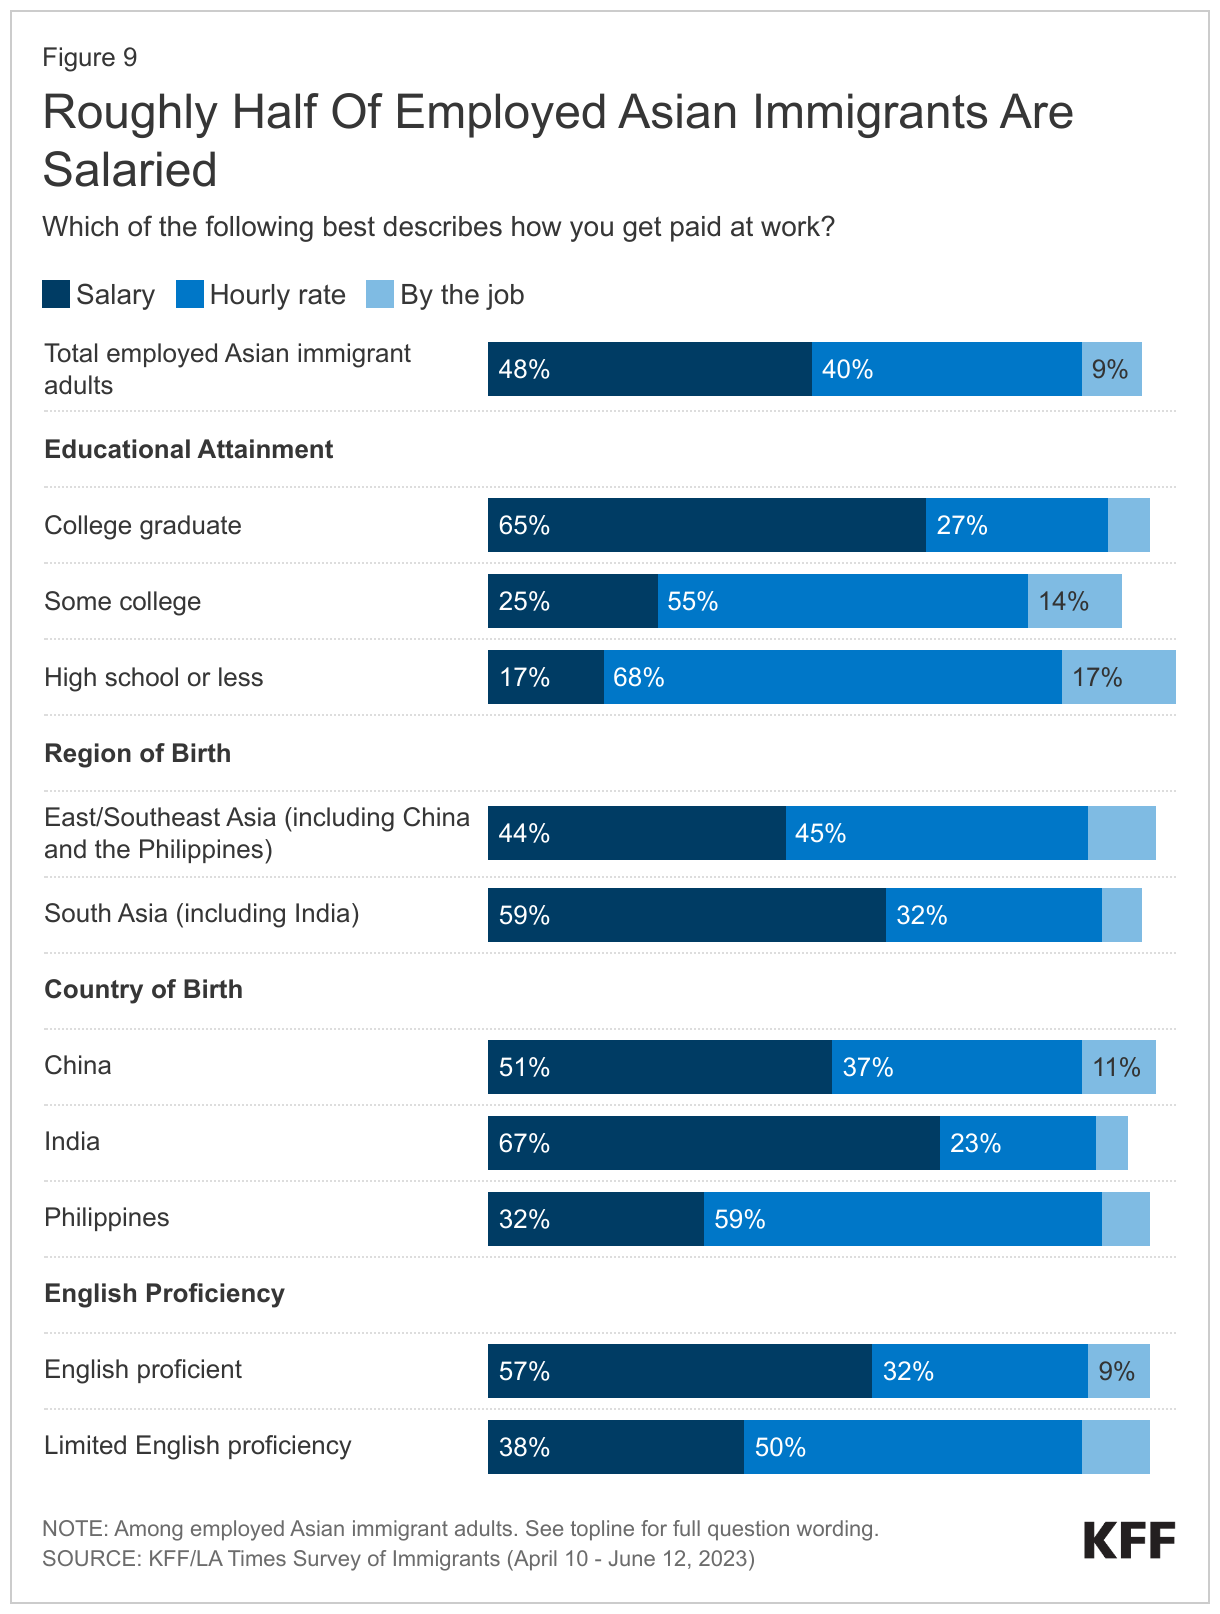
Most Asian immigrants are employed, predominantly in salaried jobs. Two-thirds (64%) of Asian immigrants are employed for pay, including three-quarters (74%) of those ages 18-64. About one in five (17%) of employed Asian immigrants are self-employed or the owner of a business. Asian immigrants are more likely than immigrants overall to be salaried, with about half receiving a salary (48%), four in ten (40%) being paid an hourly rate, and one in ten (9%) being paid by the job (Figure 9). However, pay type varies starkly among Asian immigrants, largely driven by differences in educational attainment. Among Asian immigrants, those who are college graduates are about four times as likely as those with a high school diploma or less (65% vs. 17%) to be in a salaried position. Reflecting these differences, pay type also varies by region and country. For example, about eight in ten (83%) Indian immigrants have a college degree compared with about half of Chinese (56%) and Filipino (52%) immigrants, and consequently are more likely to be salaried (67% vs. 51% vs. 32%, respectively). English proficiency also makes a difference, with half of Asian immigrants with LEP working hourly jobs, compared to about one in three (32%) who are English proficient.
About one in five (22%) employed Asian immigrants say they are overqualified for their current jobs, that is, having more skills and education than the job requires, including about three in ten (31%) lower income Asian immigrants. Employed Asian immigrants with a college degree or higher (22%) or with some college education (33%) are more likely to feel overqualified than those with a high school education or less (9%). Similarly, those with lower incomes (less than $40,000 per year) (31%) are more likely to feel this way compared those with higher incomes (at least $90,000 per year) (18%). These data likely reflect some Asian immigrants taking jobs different from their previous work or training in their countries of origin, as described by some focus group participants.
In Their Own Words: Feelings of Being Overqualified among Asian Immigrant Focus Group Participants
In focus groups, Asian immigrants described taking jobs that required less skills and education compared to those they held in their country of birth.
“I used to work a white-collar job, now I do manual labor. My major [college course program] used to hurt my mind, now it’s my arms and legs.” – 41-year-old Vietnamese immigrant woman in Texas
“When I was in Vietnam, I owned a business, but when I moved here, I worked in a dentist’s office, I had to learn from scratch.” - 58-year-old Vietnamese immigrant woman in California
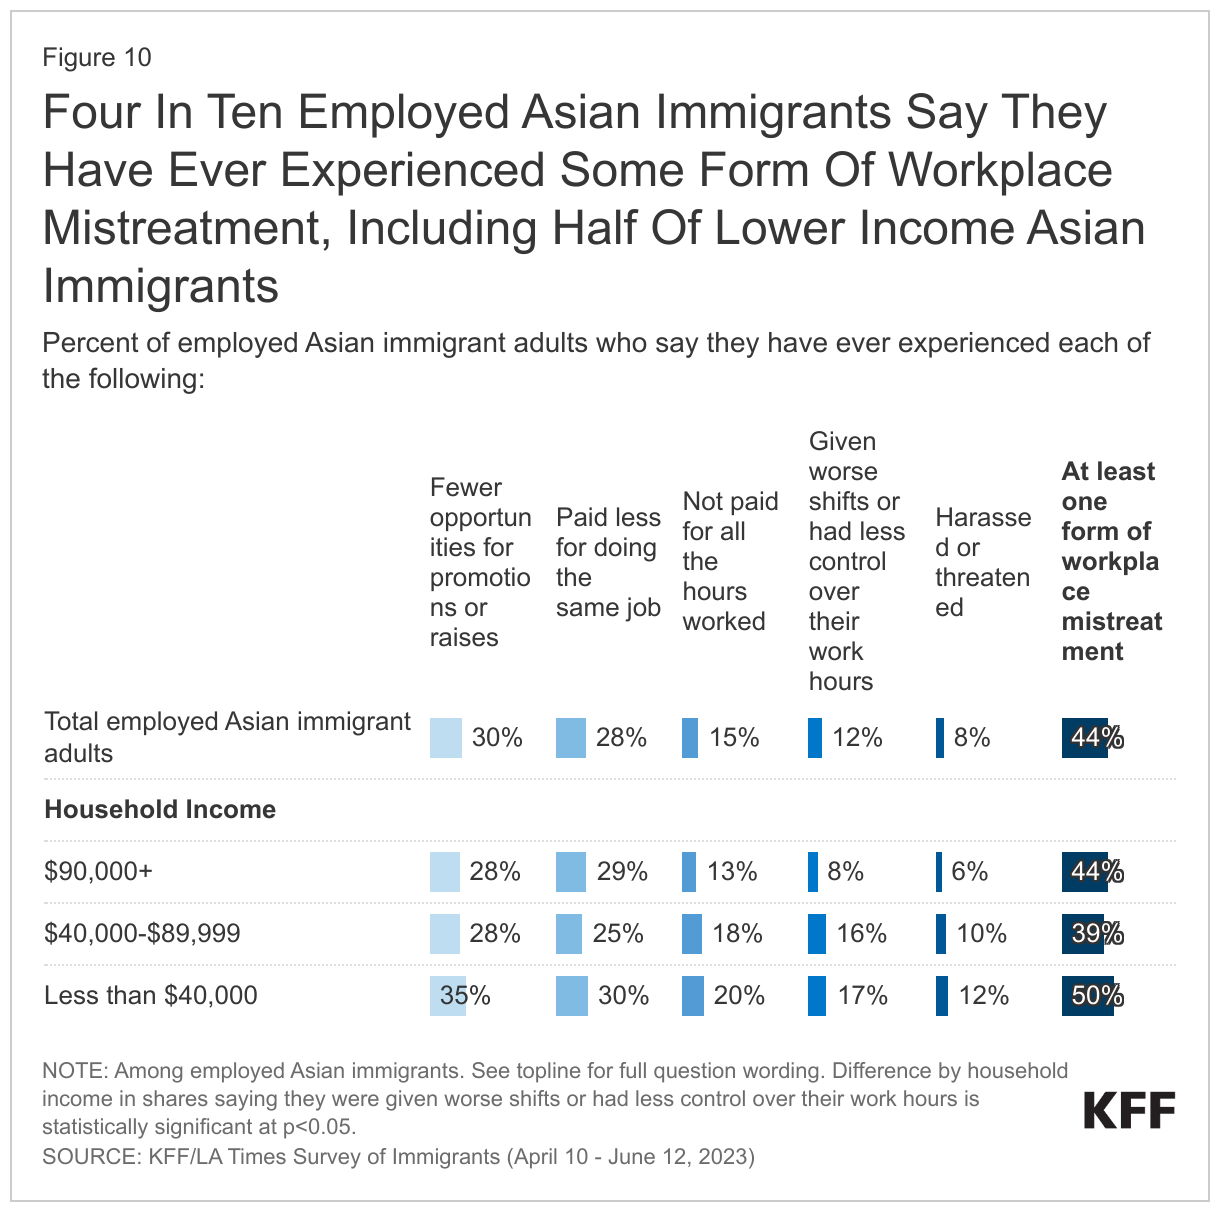
About four in ten (44%) employed Asian immigrants say they have ever experienced at least one form of workplace mistreatment in the U.S. asked about in the survey. These include being given fewer opportunities for promotion (30%), being paid less (28%), not getting paid for all the hours they worked or for overtime (15%), being given worse shifts (12%) than their U.S.-born counterparts, or being harassed or threatened in the workplace because they are an immigrant (8%) (Figure 10). The share who say they were given worse shifts or had less control over their work hours is about twice as high for lower income Asian immigrants (less than $40,000 per year) compared to their higher income counterparts (at least $90,000 per year) (17% vs. 8%).
Asian immigrants have higher incomes than immigrants overall, but income varies widely among subgroups in part due to variations in educational attainment. Many Asian immigrants come to the U.S. on H-1B visas, which are used by the U.S. government to employ immigrants in highly specialized and often technical fields, which has a direct impact on the types of industries Asian immigrants work in as well as on their incomes. Consequently, about four in ten (41%) Asian immigrants live in households with annual incomes of at least $90,000 and an additional one in three (29%) live in households with annual incomes of $40,000 to less than $90,000. About one in four (27%) live in households with lower incomes (less than $40,000 per year). However, income varies widely among Asian immigrants. Those from India (62%) are much more likely to have higher household income (at least $90,000 per year) compared with those from China (41%) and the Philippines (37%). Overall, immigrants from South Asia (51%) are more likely than immigrants from East or Southeast Asia (36%) to have higher household incomes (at least $90,000 per year). This pattern likely reflects differences in educational attainment as about eight in ten Indian immigrants are college graduates compared with about half of Chinese and Filipino immigrants.
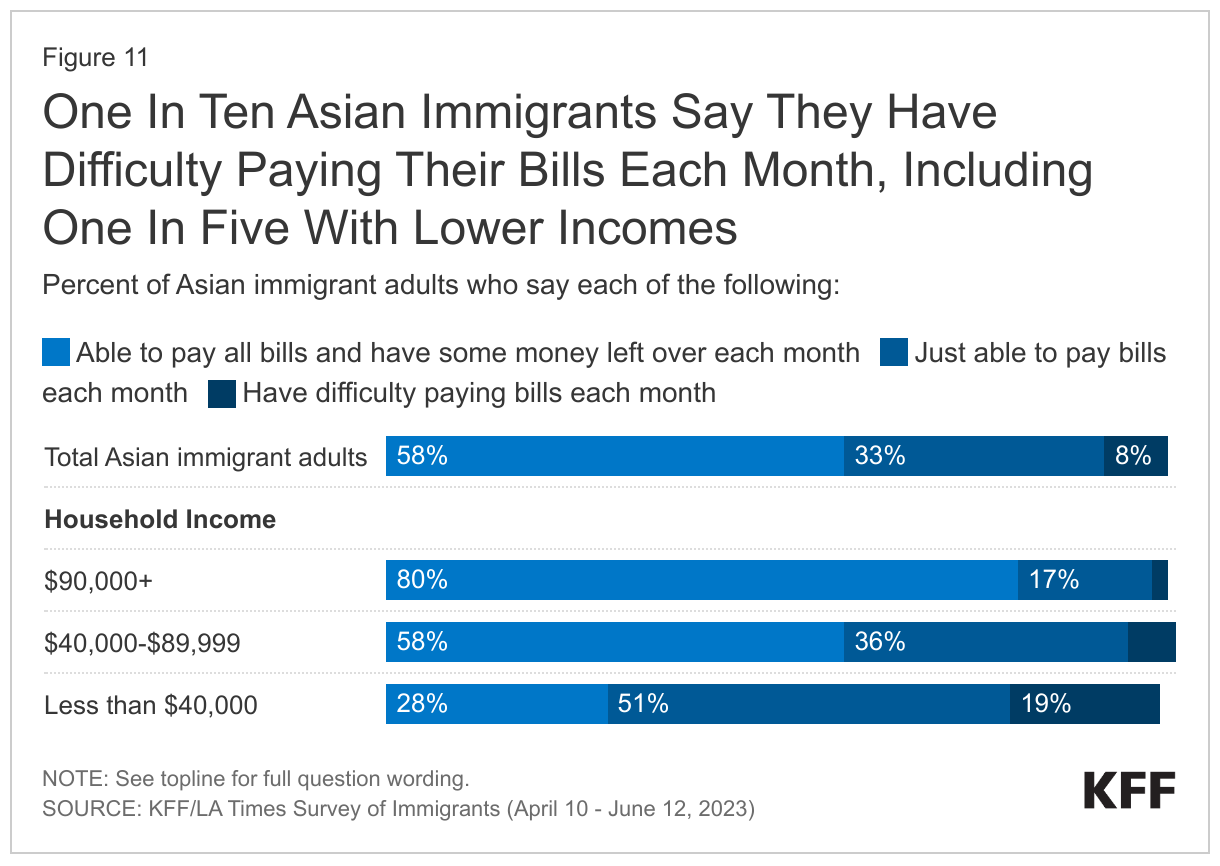
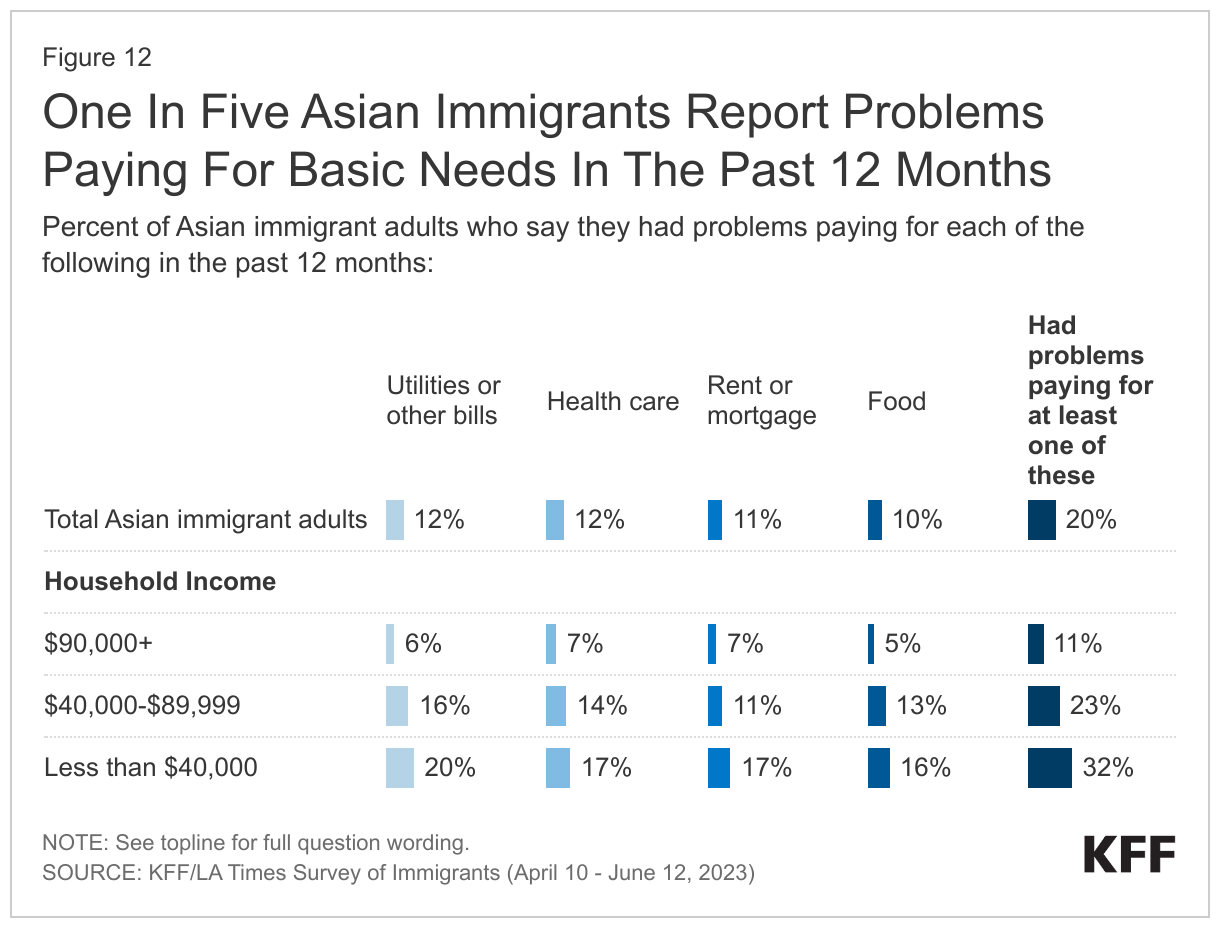
Reflecting these income patterns, most Asian immigrants do not report problems paying for basic needs or monthly bills, but those with lower incomes report more financial difficulties. Most (58%) Asian immigrants say they are able to pay all their monthly bills and have some money left over, (33%) say they are just able to pay their monthly bills, and about one in ten (8%) say they have difficulty paying their bills each month. However, the share who say they have difficulty paying their monthly bills rises to about one in five (19%) among those with lower household incomes (less than $40,000 per year) (Figure 11). Similarly, one in five (20%) Asian immigrants overall say they had problems paying for necessities such as housing, food, health care, or utilities in the past 12 months, but roughly one in three (32%) of those with lower incomes (less than $40,000 per year) say this (Figure 12).
Health And Health Care Experiences
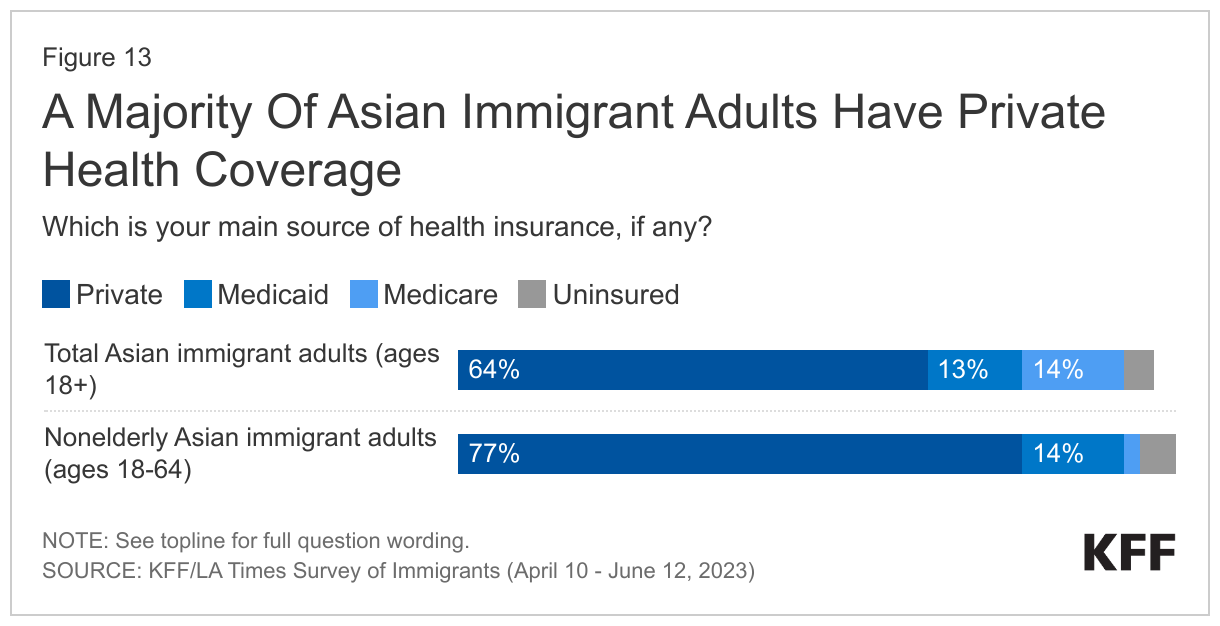
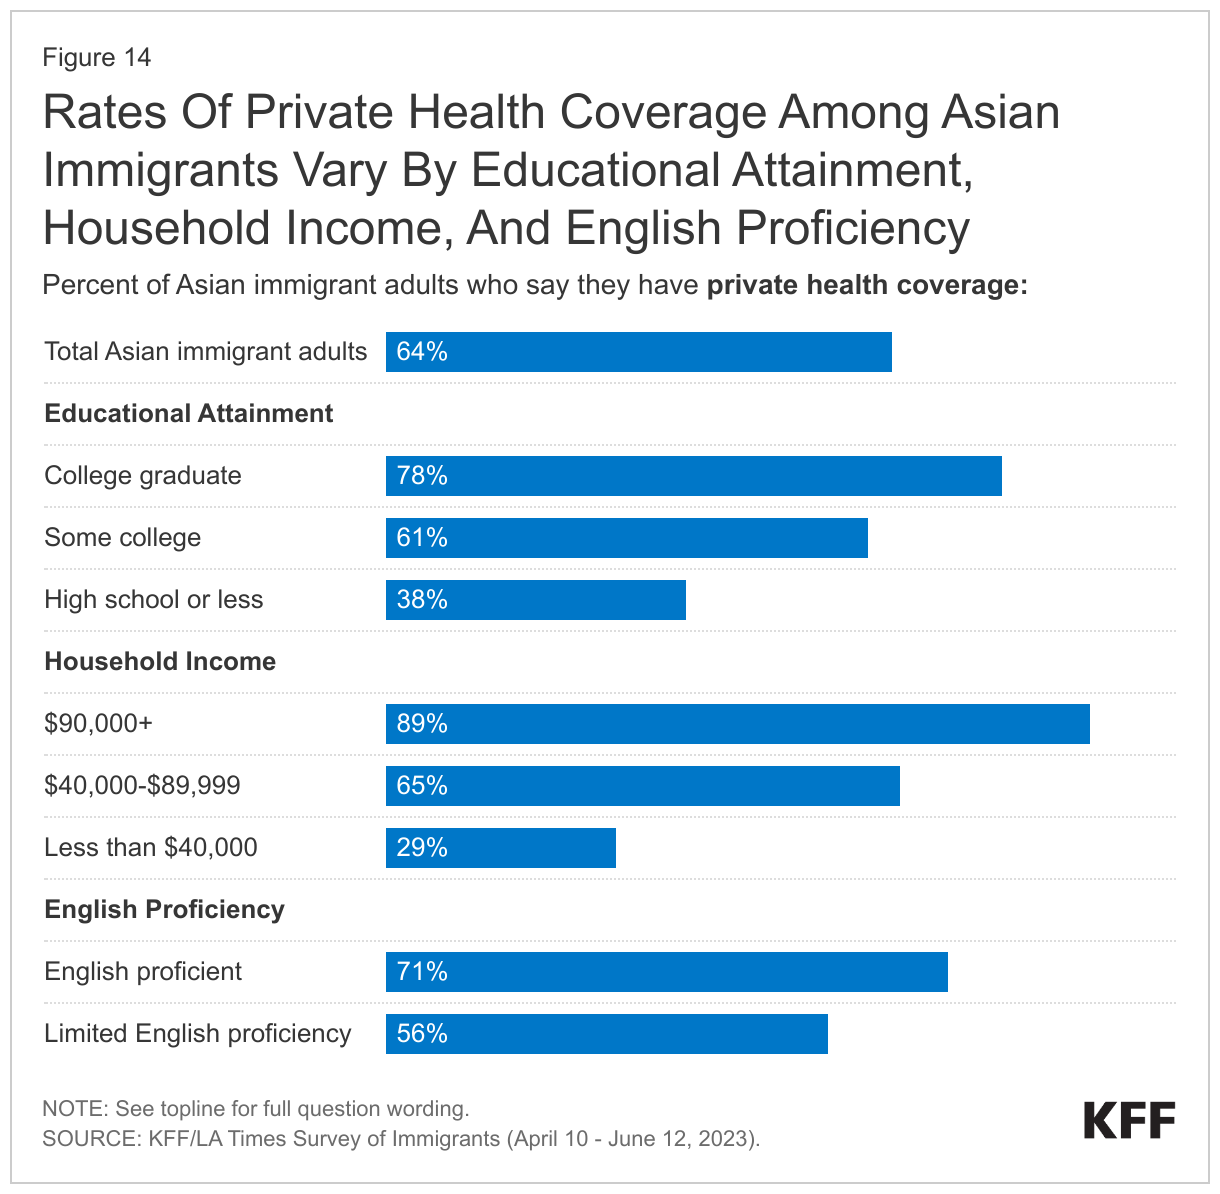
Reflecting their job patterns, a majority (64%) of Asian immigrant adults report having private health insurance coverage and only 4% report being uninsured (Figure 13). High rates of private coverage and low uninsured rates among Asian immigrant adults likely reflect their higher incomes as well as higher rates of employment in management, business, and science occupations, which are more likely to offer employer-sponsored coverage. Asian immigrants with higher educational attainment (78%), higher incomes (at least $90,000 per year) (89%), and those who are English proficient (71%), are more likely than their lower educational attainment (38%), lower income (less than $40,000 per year) (29%), and LEP (56%) counterparts to have private health coverage (Figure 14).
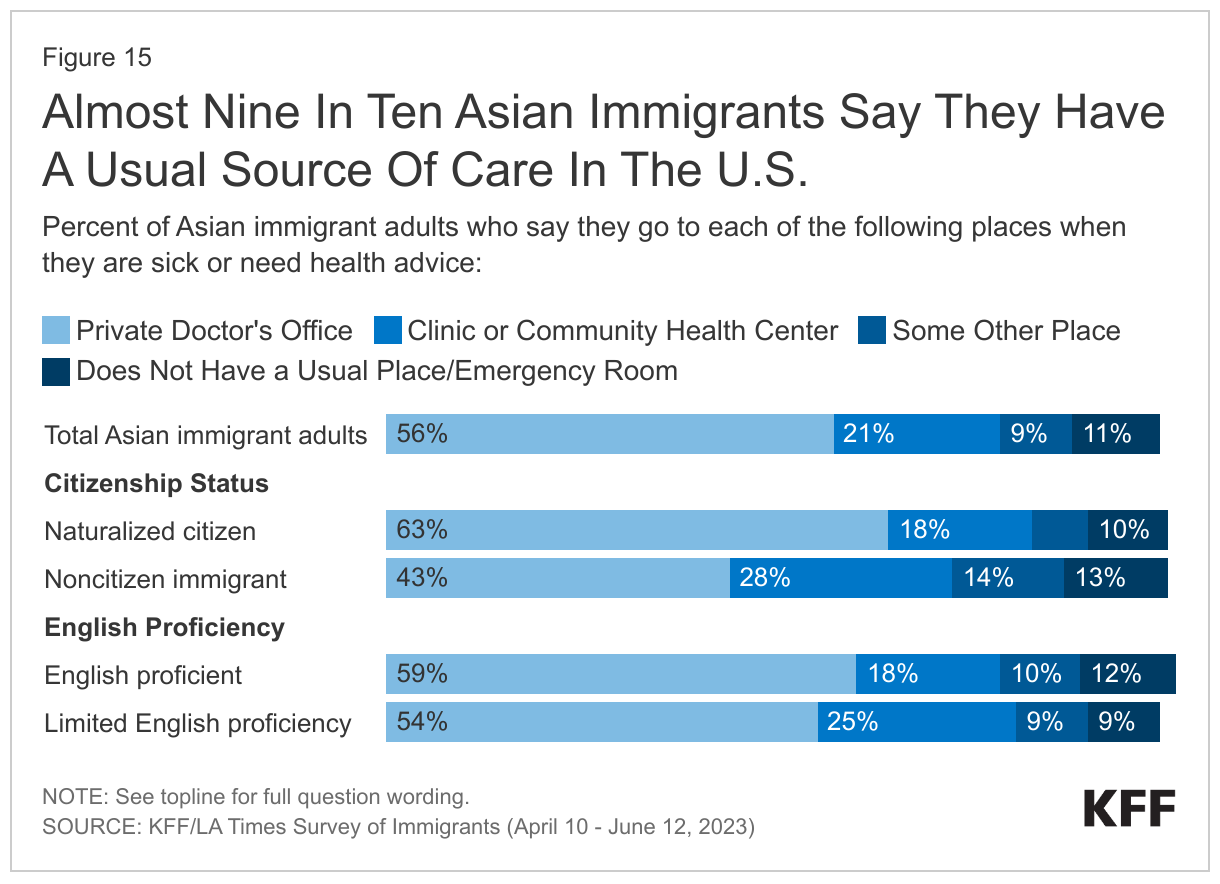
The large majority of Asian immigrants have a usual source of care and a trusted health care provider in the U.S. Reflecting their high rates of health coverage, roughly nine in ten (86%) Asian immigrant adults say they have a place other than an emergency room where they usually go when they are sick or need health advice, with most saying they go to a private doctor’s office (56%) and about one in five (21%) saying they use a community health center (CHC) (Figure 15). Use of CHCs as a usual source of care is higher among Asian immigrants who are noncitizens (28%) and those with LEP (25%) compared with their citizen (18%) and English proficient (18%) counterparts, reflecting their role as a national network of safety-net primary care providers serving low-income and medically underserved communities. Research shows that CHCs offer linguistically and culturally competent care to underserved racial and ethnic groups as well as people with LEP and that these services can positively impact patient satisfaction. About eight in ten Asian immigrants (84%) say they have a trusted health care provider in the U.S. However, noncitizens are less likely than citizens to say they have a trusted provider (74% vs. 90%).
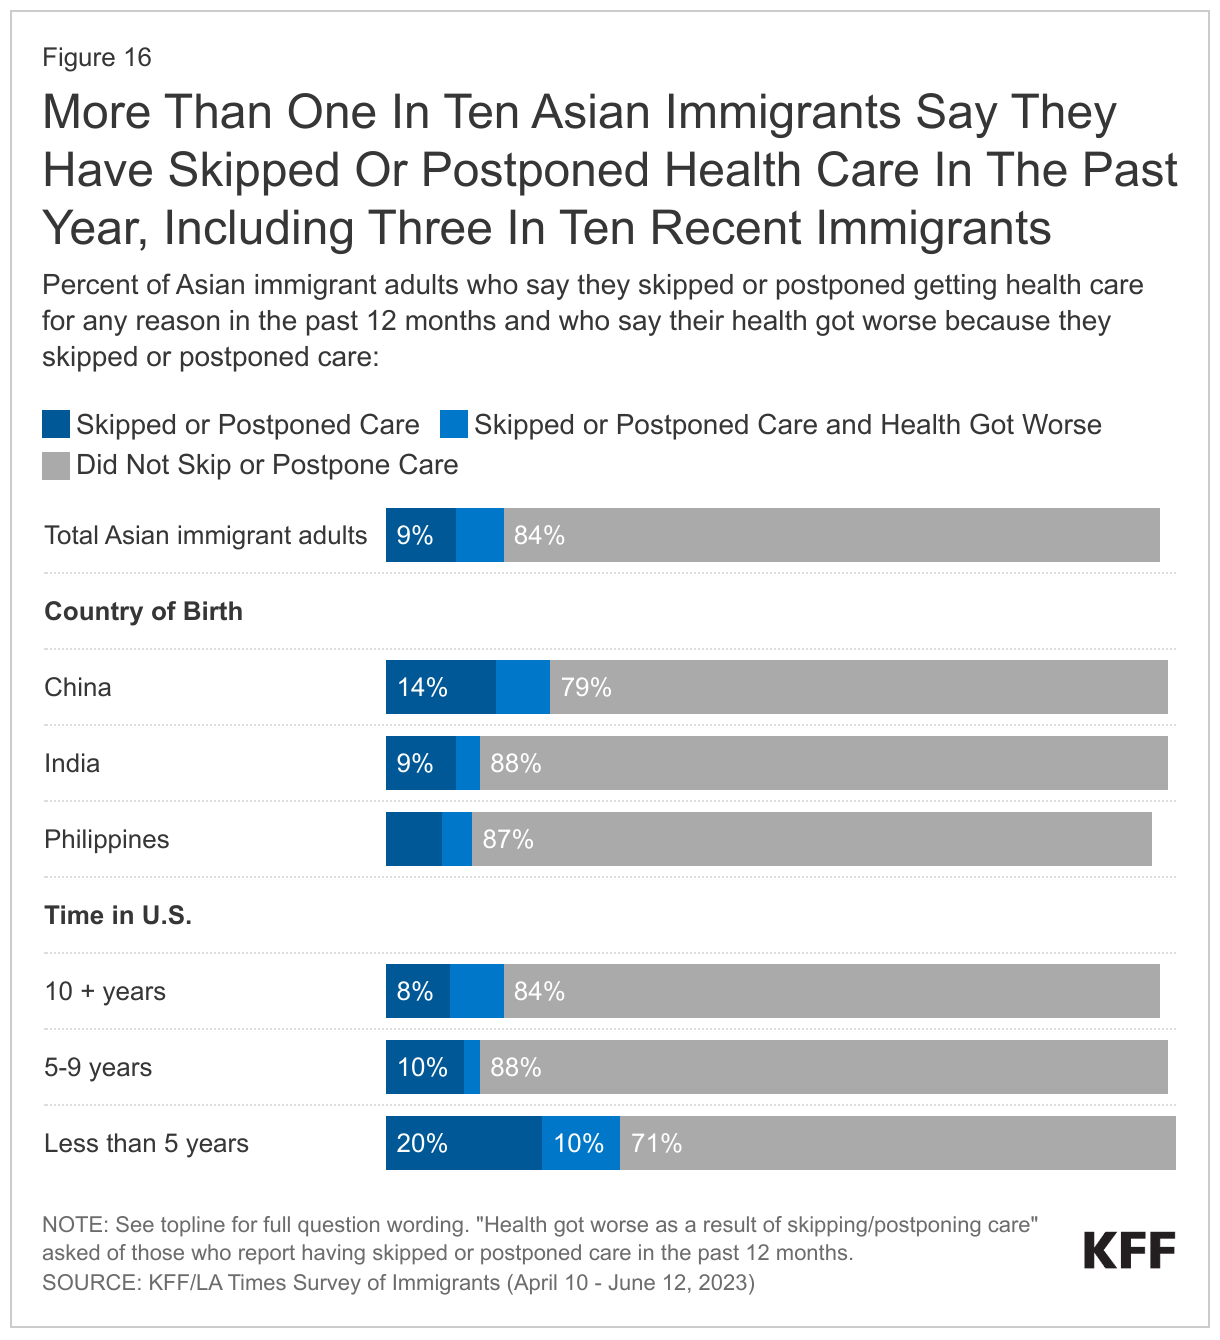
Reflecting that most Asian immigrants have health coverage and a regular source of care, about one in seven (16%) say they skipped or postponed health care services in the past year, but this share rises to about three in ten (29%) among recent immigrants. (Figure 16). Chinese immigrants (21%) also are more likely than Indian (12%) and Filipino (11%) immigrants to say they went without or postponed health care even though there are no significant differences in rates of health coverage and in the shares saying they have a usual source of care by country of birth, suggesting that the differences could be driven by cultural and linguistic barriers experienced by Chinese immigrants or other unidentified factors. Overall, 6% of Asian immigrants (representing 40% of those who skipped or postponed care) say their health got worse as a result of skipping or postponing care.
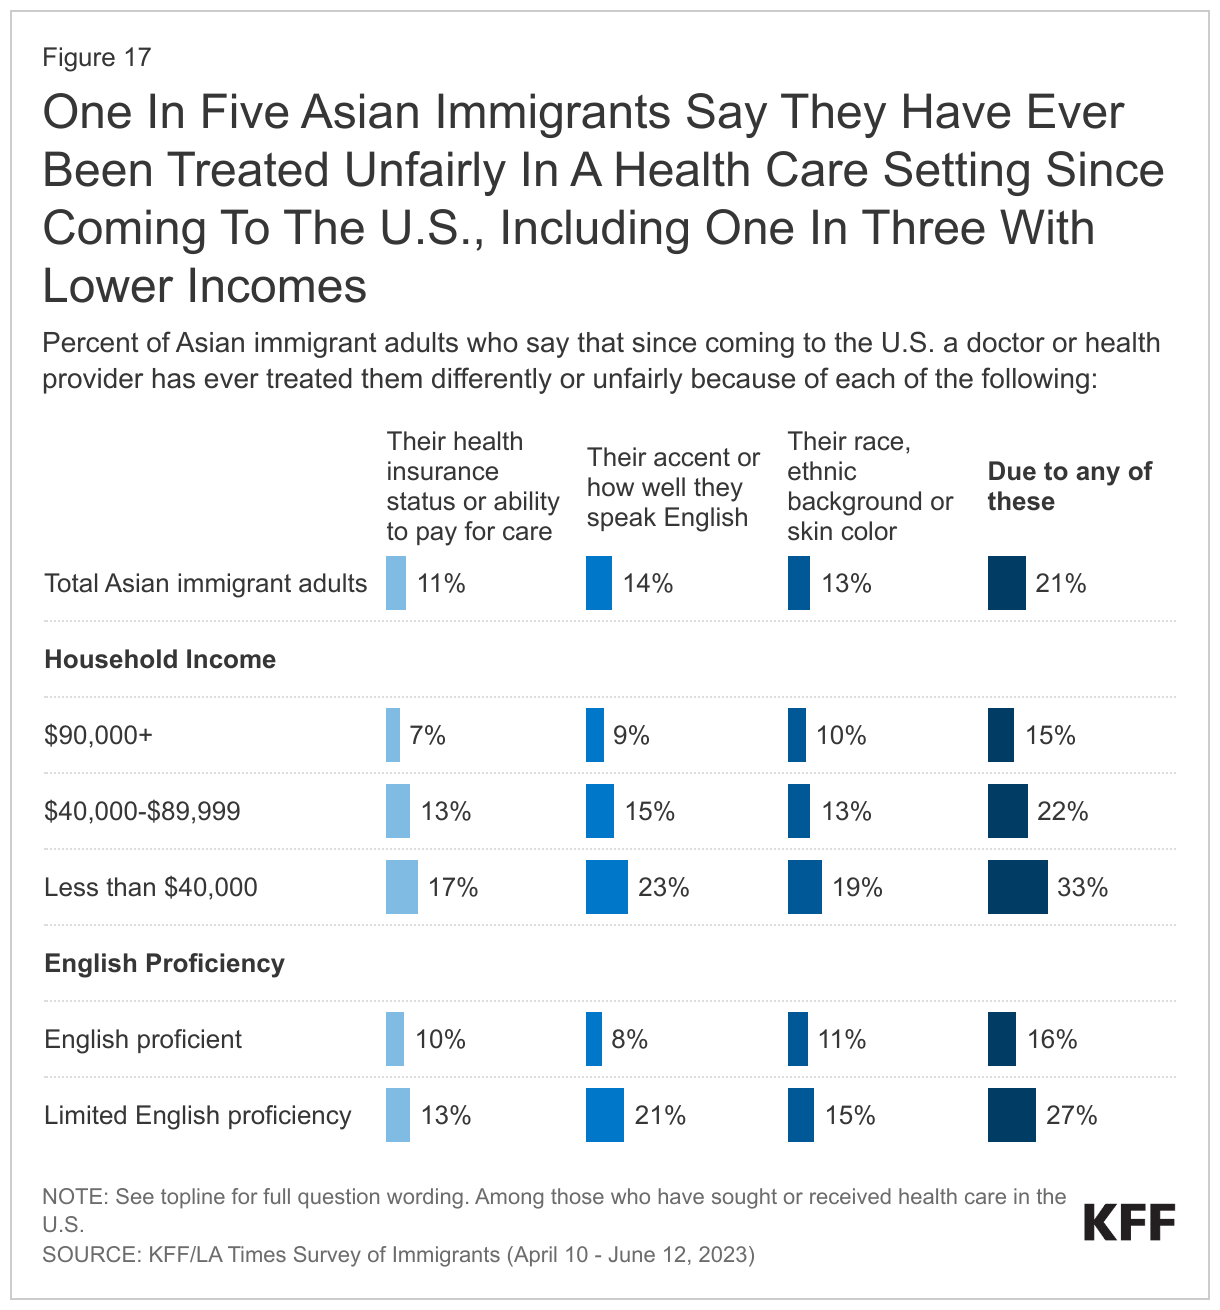
About one in five (21%) Asian immigrants who have sought or received health care in the U.S. say they have ever been treated unfairly by a health care provider, with those who are lower income reporting higher levels of unfair treatment than their higher income counterparts. Overall, 14% of Asian immigrants say they have ever been treated unfairly by a health care provider due to their accent or ability to speak English, 13% report unfair treatment due to their racial or ethnic background or skin color, and 11% cite unfair treatment due to their insurance status or ability to pay (Figure 17). A third (33%) of lower income (less than $40,000 per year) Asian immigrants say that they experienced discrimination or unfair treatment in a health care setting for at least one of these reasons compared with 15% of higher income (at least $90,000 per year) Asian immigrants. Asian immigrants with LEP (27%) also are more likely than their English proficient counterparts (16%) to say they experienced unfair treatment when seeking health care, including one in five (21%) who say it was due to their accent or ability to speak English.
Confusion and Worries About Immigration Policies
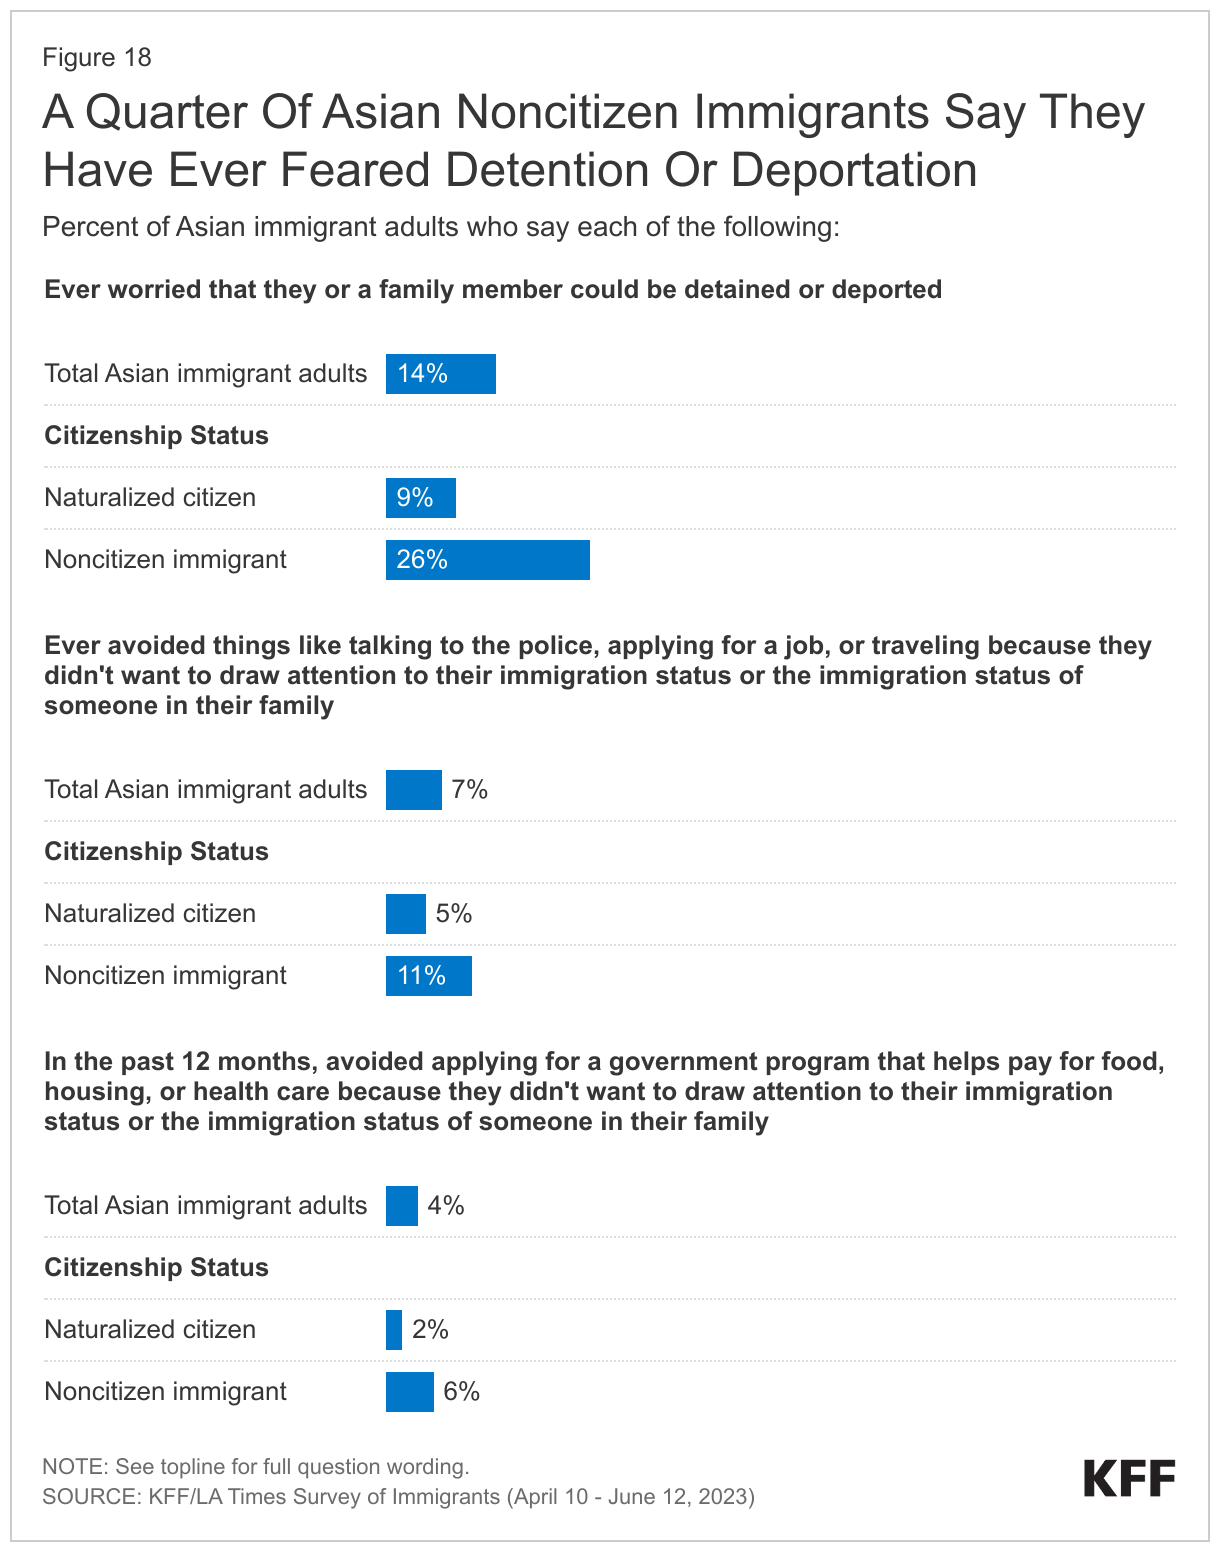
While only 5% of Asian immigrants are likely undocumented, 14% of Asian immigrants overall and 26% of those who are noncitizens say they have ever worried that they or a family member could be detained or deported. Moreover, 7% of Asian immigrants overall and 11% of those who are noncitizens say immigration-related fears have led them to avoid things such as talking to the police, applying for a job, or traveling (Figure 18). Only 4% of Asian immigrants overall say they have avoided applying for a government program that helps pay for food, housing, or health care in the past 12 months because they didn't want to draw attention to their immigration status or the immigration status of someone in their family. This could partly reflect limited need for these types of assistance given that most Asian immigrants do not report financial challenges.
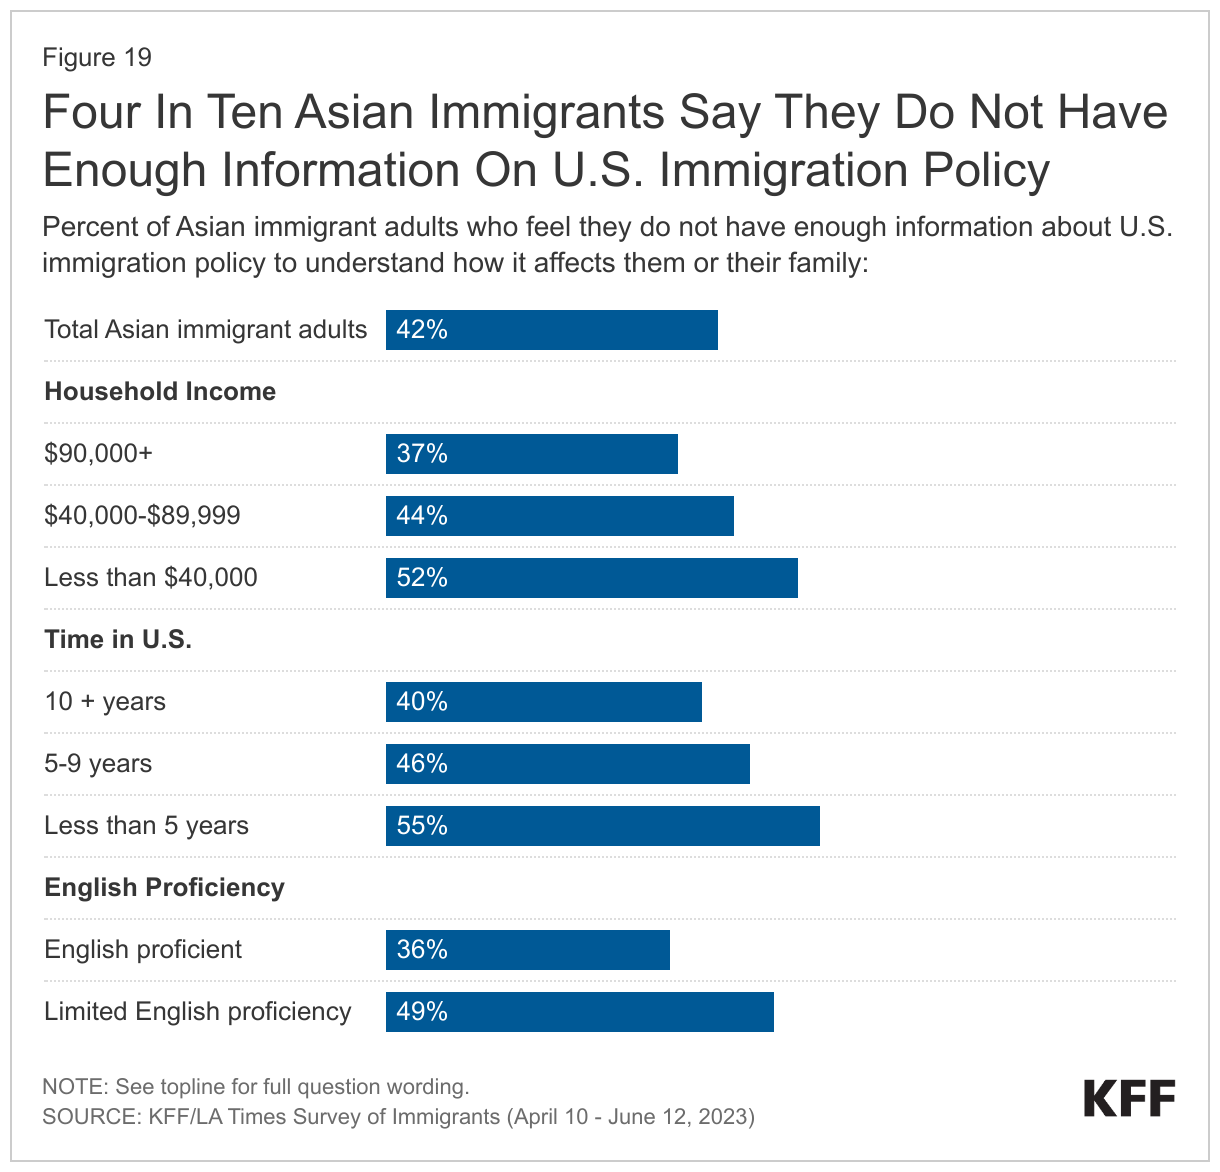
About four in ten (42%) Asian immigrants say they do not have enough information about U.S. immigration policy to understand how it affects them or their family, with shares higher among those with lower incomes, those who have been in the U.S. fewer than five years, and those with LEP (Figure 19). About half of Asian immigrants with lower incomes (less than $40,000 per year) (52%), who have been in the U.S. for fewer than five years (55%), and with LEP (49%) say they do not have enough information about U.S. immigration policies as compared to about four in ten with higher incomes (at least $90,000 per year) (37%), who have been in the country for 10 or more years (40%), and who are English proficient (36%).
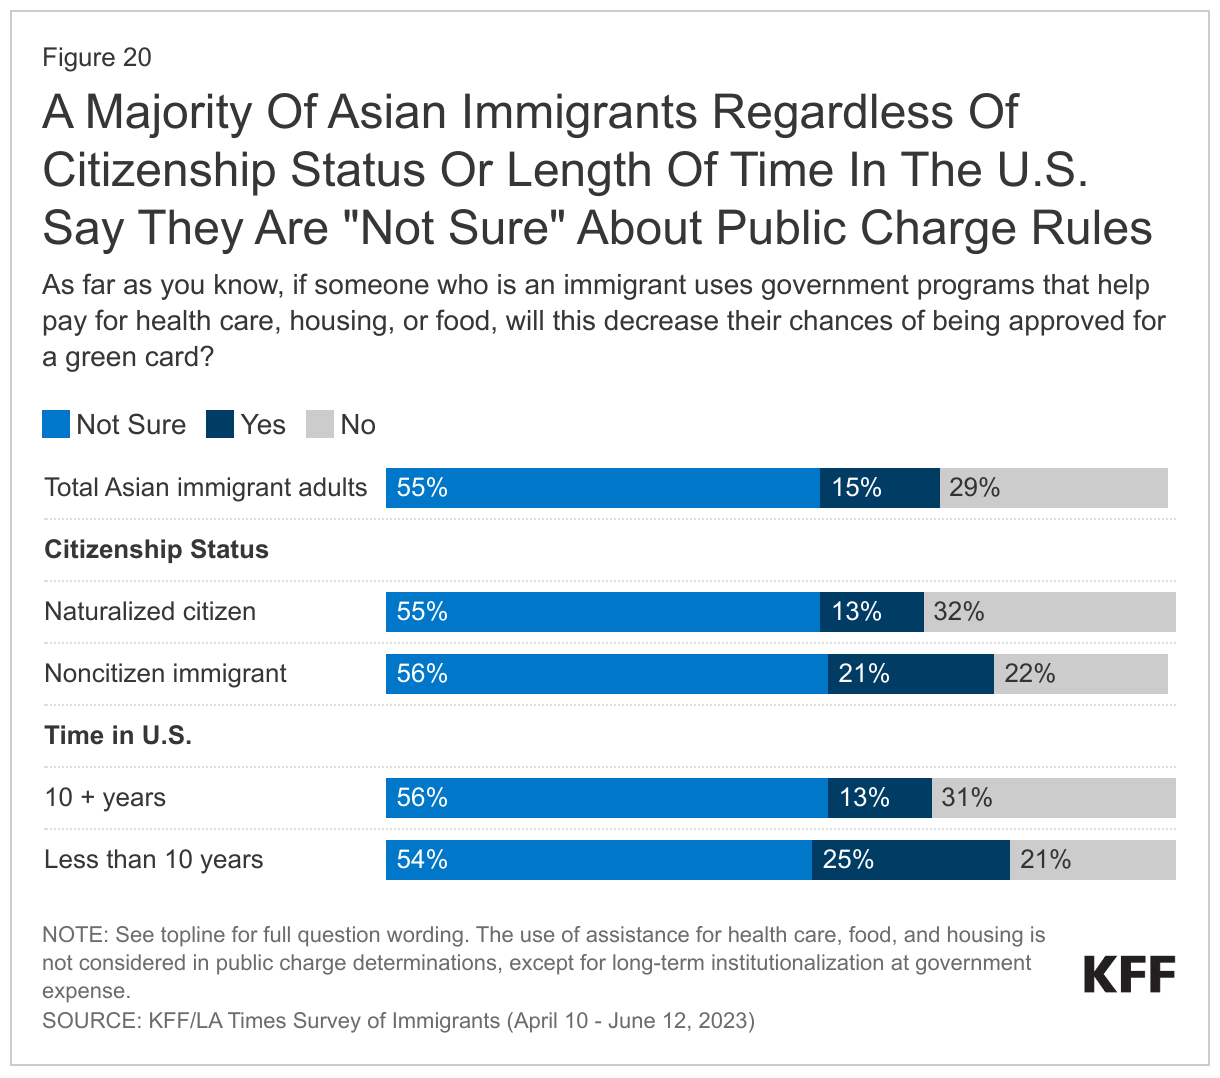
Most Asian immigrants are uncertain about how using assistance for food, housing, and health care may affect one’s immigration status. Under longstanding U.S. policy, federal officials can deny an individual entry to the U.S. or adjustment to lawful permanent resident status (a green card) if they determine the individual is a “public charge” based on their likelihood of becoming primarily dependent on the government for subsistence. In 2019, the Trump Administration made changes to public charge policy that newly considered the use of previously excluded noncash assistance programs for health care, food, and housing in public charge determinations. However, this policy was rescinded by the Biden Administration in 2021, meaning that the use of assistance for health care, food, and housing is not considered for public charge tests, except for long-term institutionalization at government expense. However, a majority (55%) of Asian immigrants say they are “not sure” whether use of public programs that help pay for health care, housing, or food can decrease one’s chances for green card approval and another 15% incorrectly believe this to be the case (say “yes”) (Figure 20). Among Asian immigrants, noncitizens (21%) and those who have been in the country for less than 10 years (25%) are more likely to report an incorrect understanding of the rules compared to their citizen (13%) and 10+ year (13%) immigrant counterparts.
Acknowledgements
KFF would like to thank the Association of Asian Pacific Community Health Organizations, the Black Alliance for Just Immigration, Dr. May Sudhinaraset, the National Immigration Law Center, the National Resource Center for Refugees, Immigrants, and Migrants, and UnidosUS for their invaluable inputs, insights, and suggestions throughout the planning, fielding, and dissemination of this survey project.
Methodology
The KFF/LA Times Survey of Immigrants is a partnership survey conducted by KFF and the LA Times examining the U.S. immigrant experience.
The survey was conducted April 10-June 12, 2023, online, by telephone, and by mail among a nationally representative sample of 3,358 immigrants, defined as adults living in the U.S. who were born outside the U.S. and its territories. Respondents had the option to complete the survey in one of ten languages: English (n=2,435), Spanish (n=627), Chinese (n=171), Korean (n=52), Vietnamese (n=22), Portuguese (n=16), Haitian-Creole (n=13), Arabic (n=9), French (n=9), and Tagalog (n=4). These languages were chosen as they are most commonly spoken by immigrant adults from countries of focus for the survey with limited English proficiency (LEP), based on the 2021 American Community Survey (2021).
Teams from KFF and The Los Angeles Times worked together to develop the questionnaire and both organizations contributed financing for the survey. KFF researchers analyzed the data, and each organization bears the sole responsibility for the work that appears under its name. Sampling, data collection, weighting, and tabulation were managed by SSRS of Glenn Mills, Pennsylvania in collaboration with public opinion researchers at KFF.
Respondents were reached through one of three sampling modes: an address-based sample (ABS) (n=2,661); a random digit dial telephone (RDD) sample of prepaid (pay-as-you go) cell phone numbers (n=565); and callbacks to telephone numbers that that were previously randomly sampled for RDD surveys and were identified as speaking a language other than English or Spanish (n=132). Respondents from all three samples were asked to specify their country of birth and qualified for the survey if they were born outside of the U.S.
Project design was informed by a pilot study conducted from January 31-March 14, 2022 among a sample of 1,089 immigrants in collaboration with SSRS. Prior to fielding the pilot study, KFF and SSRS conducted interviews with experts who had previous experience surveying immigrants. These conversations informed decisions on sampling, modes of data collection, recruitment strategies, and languages of interviews. The pilot test measured incidence of immigrant households across four different sample types and offered a short survey in 8 different languages both online and on the telephone. Based on the results of the pilot test, the following recruitment and data collection protocol was implemented:
Sampling strategy and interview modes:
The ABS was divided into areas (strata), defined by Census tract, based on the incidence of immigrants among the population overall and by countries of origin. Within each stratum, the sample was further divided into addresses that were flagged by Marketing Systems Group (MSG) as possibly occupied by foreign-born adults and unflagged addresses. To increase the likelihood of reaching immigrant adults, strata with higher incidence of immigrant households overall, and of immigrants from certain countries of origin were oversampled.
Households in the ABS were invited to participate through multiple mail invitations: 1) an initial letter in English with a short paragraph of instructions in each of the 10 survey languages on the back; 2) a reminder postcard in English plus up to two additional languages; 3) a follow-up letter accompanied by hardcopy questionnaires in English and one additional language; and 4) a final reminder including short messages in all 10 languages. For mailings 2 and 3, additional languages were chosen by using flags to identify the language other than English likely spoken at home. Invitation letters requested the household member ages 18 or older who was born outside of the U.S. with the most recent birthday to complete the survey in one of three ways: by going online, dialing into a toll-free number, or returning the completed paper questionnaire. In addition, interviewers attempted outbound calls to telephone numbers that were matched to sampled addresses. ABS respondents completed the survey online (n=2,087), over the phone (n=105), or by mail on paper (n=469). The random sample of addresses was provided by MSG.
The RDD sample of prepaid (pay-as-you-go) cell phone numbers was obtained through MSG. The prepaid cell phone component was disproportionately stratified to effectively reach immigrants from different countries based on county-level information. To increase the likelihood of reaching immigrant adults, counties with higher incidence of immigrants overall, and of certain countries of origin were oversampled.
The callback sample included 132 respondents who were reached by calling back telephone numbers that were previously randomly sampled for SSRS RDD surveys within two years and coded by interviewers as non-English or non-Spanish speaking. as having respondents speaking languages other than English or Spanish.
Incentives:
Initial mailings to the ABS sample included $2 as part of the invitation package, and respondents received a $10 incentive if they completed the survey in the first two weeks after the initial mailing. In order to increase participation among under-represented groups, the incentive increased to $20 for those who did not respond within the first two weeks. ABS phone respondents received this incentive via a check received by mail, paper respondents received a Visa gift card by mail, and web respondents received an electronic gift card incentive. Respondents in both phone samples received a $25 incentive via a check received by mail.
Questionnaire design and translation:
In addition to collaboration between KFF and the LA Times, input from organizations and individuals that directly serve or have expertise in issues facing immigrant populations helped shaped the questionnaire. These community representatives were offered a modest honorarium for their time and effort to review questionnaire drafts, provide input, attend meetings, and offer their expertise on dissemination of findings.
After the content of the questionnaire was largely finalized, SSRS conducted a telephone pretest in English and adjustments were made to the questionnaire. Following the English pretest, Research Support Services Inc. (RSS) translated the survey instrument from English into the nine languages outlined above and performed cognitive testing through qualitative interviews in all languages including English. The results of the cognitive testing were used to adjust questionnaire wording in all languages including English to ensure comprehension and cohesiveness across languages and modes of interview. As a final check on translation and its overlay into the web and CATI program, translators from Cetra Language Solution reviewed each question, as it appears in the program, and provided feedback. The questionnaire was revised and finalized based on this feedback.
Data quality checks:
A series of data quality checks were run on the final data. The online questionnaire included two questions designed to establish that respondents were paying attention and cases were monitored for data quality. Fifteen cases were removed from the data because they failed two or more quality checks, failed both attention check questions, or skipped over 50% of survey questions. An additional 67 interviews were removed after deemed ineligible by SSRS researchers (they were not U.S. immigrants).
Weighting:
The combined sample was weighted to adjust for the sampling design and to match the characteristics of the U.S. adult immigrant population, based on data from the Census Bureau’s 2021 American Community Survey (ACS). Weighting was done separately for each of 11 groups defined by country or region of origin (Mexico, China, Other East/Southeast Asia, South Asia, Europe, Central America, South America, Caribbean, Middle East/North Africa, Sub-Sahara Africa, all others). The samples were weighted by sex, age, education, race/ethnicity, census region, number of adults in the household, presence of children in the household, home ownership, time living in the U.S., English proficiency, and U.S. citizenship. The overall sample was also weighted to match the share of U.S. adult immigrants from each country/region of origin group. The weights take into account differences in the probability of selection for each of the three sample types. This includes adjustment for the sample design and geographic stratification, and within household probability of selection. Subgroup analysis includes data checks to ensure that the weighted demographics of subgroups are within reasonable range from benchmarks whenever possible.
The margin of sampling error including the design effect for the full sample is plus or minus 2 percentage points. Numbers of respondents and margins of sampling error for key subgroups are shown in the table below. For results based on other subgroups, the margin of sampling error may be higher. Sample sizes and margins of sampling error for other subgroups are available by request. Sampling error is only one of many potential sources of error and there may be other unmeasured error in this or any other public opinion poll. KFF public opinion and survey research is a charter member of the Transparency Initiative of the American Association for Public Opinion Research.
| Group | N (unweighted) | M.O.S.E. |
| Total | 3,358 | ± 2 percentage points |
| Race/Ethnicity | ||
| Black immigrants | 274 | ± 8 percentage points |
| Hispanic immigrants | 1,207 | ± 4 percentage points |
| Asian immigrants | 1,318 | ± 4 percentage points |
| White immigrants | 495 | ± 6 percentage points |
| Immigration Status | ||
| Naturalized citizen | 2,134 | ± 3 percentage points |
| Green card or valid visa holder | 819 | ± 5 percentage points |
| Likely undocumented | 372 | ± 6 percentage points |
| English Proficiency | ||
| Speaks English only or “very well” | 1,713 | ± 3 percentage points |
| Speaks English “less than very well” | 1,635 | ± 3 percentage points |
Focus group methodology:
As part of this project, KFF conducted 13 focus groups with immigrant adults across the country to help inform survey questionnaire development, provide deeper insights into the experiences of immigrant groups that had a smaller sample size in the survey, and to provide a richer understanding of some of the survey findings.
Two rounds of focus groups were completed. The first round of 6 groups was conducted between September-October 2022 virtually among participants living across the country who are Hispanic immigrants (conducted in Spanish), Asian (excluding Chinese) immigrants (conducted in English), or Chinese immigrants (conducted in Mandarin Chinese). The groups were separated by gender, lasted 90 minutes, and included 5-7 participants each.
The second round of groups were conducted in-person between May-June 2023 in Los Angeles, CA and Fresno, CA with Hispanic immigrants conducted in Spanish; and in Houston, TX and Irvine, CA with Vietnamese immigrants conducted in Vietnamese. In addition, virtual groups were conducted among participants living in the Texas border region (Hispanic immigrants), the Miami, FL region (Haitian immigrants), and nationally (Black immigrants from sub-Saharan Africa). Groups were mixed gender, lasted between 90 minutes and two hours, and were conducted in English, Spanish, Vietnamese, and Haitian-Creole with 5-8 participants each.
For each group, participants were chosen based on the following criteria: Must be at least 18 years of age and have been born outside of the U.S. and its territories; for groups conducted in languages other than English, must speak English “less than very well” and be able to speak conversationally in the group’s language (i.e., Spanish). In addition, groups were chosen to represent a mix of household composition, including at least some participants who are parents; a mix of household income levels, with a preference for recruiting lower income participants; a mix of health insurance types; and a mix of immigration statuses. Goodwin Simon Strategic Research (GSSR) recruited and hosted the first round of focus groups. PerryUndem recruited and hosted the second round of focus groups. The screener questionnaire and discussion guides were developed by researchers at KFF in consultation with the firms who recruited and hosted the groups. Groups were audio and video recorded with participants’ permission. Each participant was given $150-$175 after participating.
Endnotes
- The sample includes 1,318 adults who self-identified as Asian or, in a small number of cases, as Pacific Islander. ↩︎
- Country of birth-level estimates among Asian immigrants are only available for China, India, and the Philippines due to sample size limitations. China includes Macau, Hong Kong, Taiwan, and Mongolia. ↩︎
