Health Care Disparities Among Asian, Native Hawaiian, and Other Pacific Islander (NHOPI) People
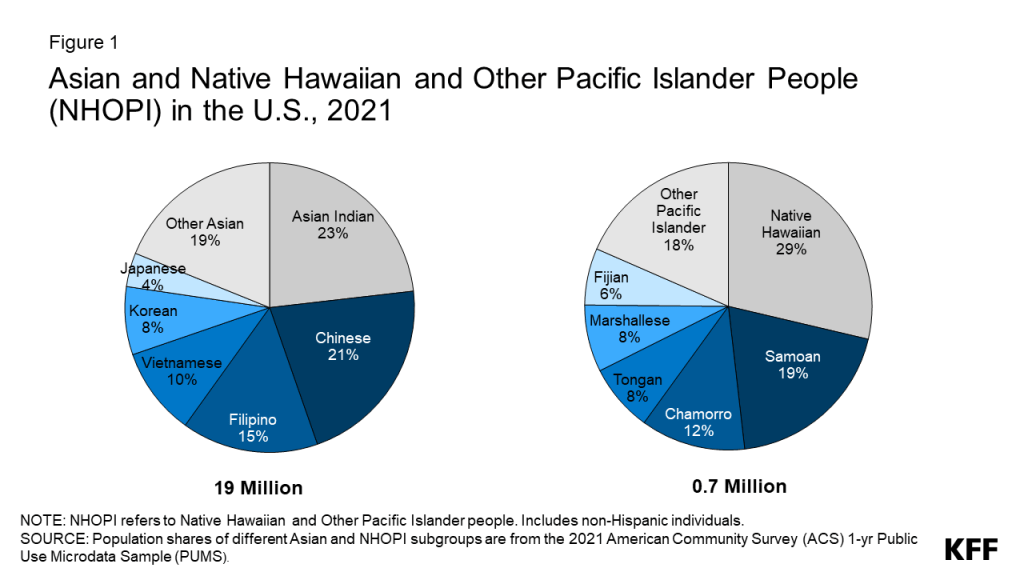
Asian, Native Hawaiian, and Other Pacific Islander (NHOPI) people are a diverse and growing population in the U.S. (Figure 1). Asian people are the fastest-growing racial or ethnic group in the United States, almost doubling from 10.5 million to almost 20 million between 2000 and 2020. In addition, there are nearly 700,000 people in the country who identify as NHOPI. In this data note, we use 2021 American Community Survey (ACS) data to examine how demographic characteristics as well as measures of health coverage and other social and economic factors that drive health and health care vary for Asian and NHOPI people overall and by subgroups. We include data for smaller subgroups wherever available. Instances in which the unweighted sample size for a subgroup is less than 50 – which are smaller than what we would typically include in analysis like this — are noted in the figures, and confidence intervals for those measures are included in the Appendix. Although these small sample sizes may impact the reliability, validity, and reproducibility of data, they are important to include because they point to potential underlying disparities that are hidden without disaggregated data, further exacerbating health inequities.
Examining experiences among Asian and NHOPI people is important since broad data for Asian people often mask underlying disparities among subgroups of the population and disaggregated data are often not available or reported for NHOPI people. Understanding the experiences of Asian and NHOPI people is particularly important at this time given growing concerns about mental health and well-being amid a significant uptick in anti-Asian hate incidents since the pandemic, an increased focus on advancing health equity and addressing racism, and ongoing efforts to improve data collection and reporting, particularly for smaller population groups and subgroups of the broader racial and ethnic categories.
Demographics
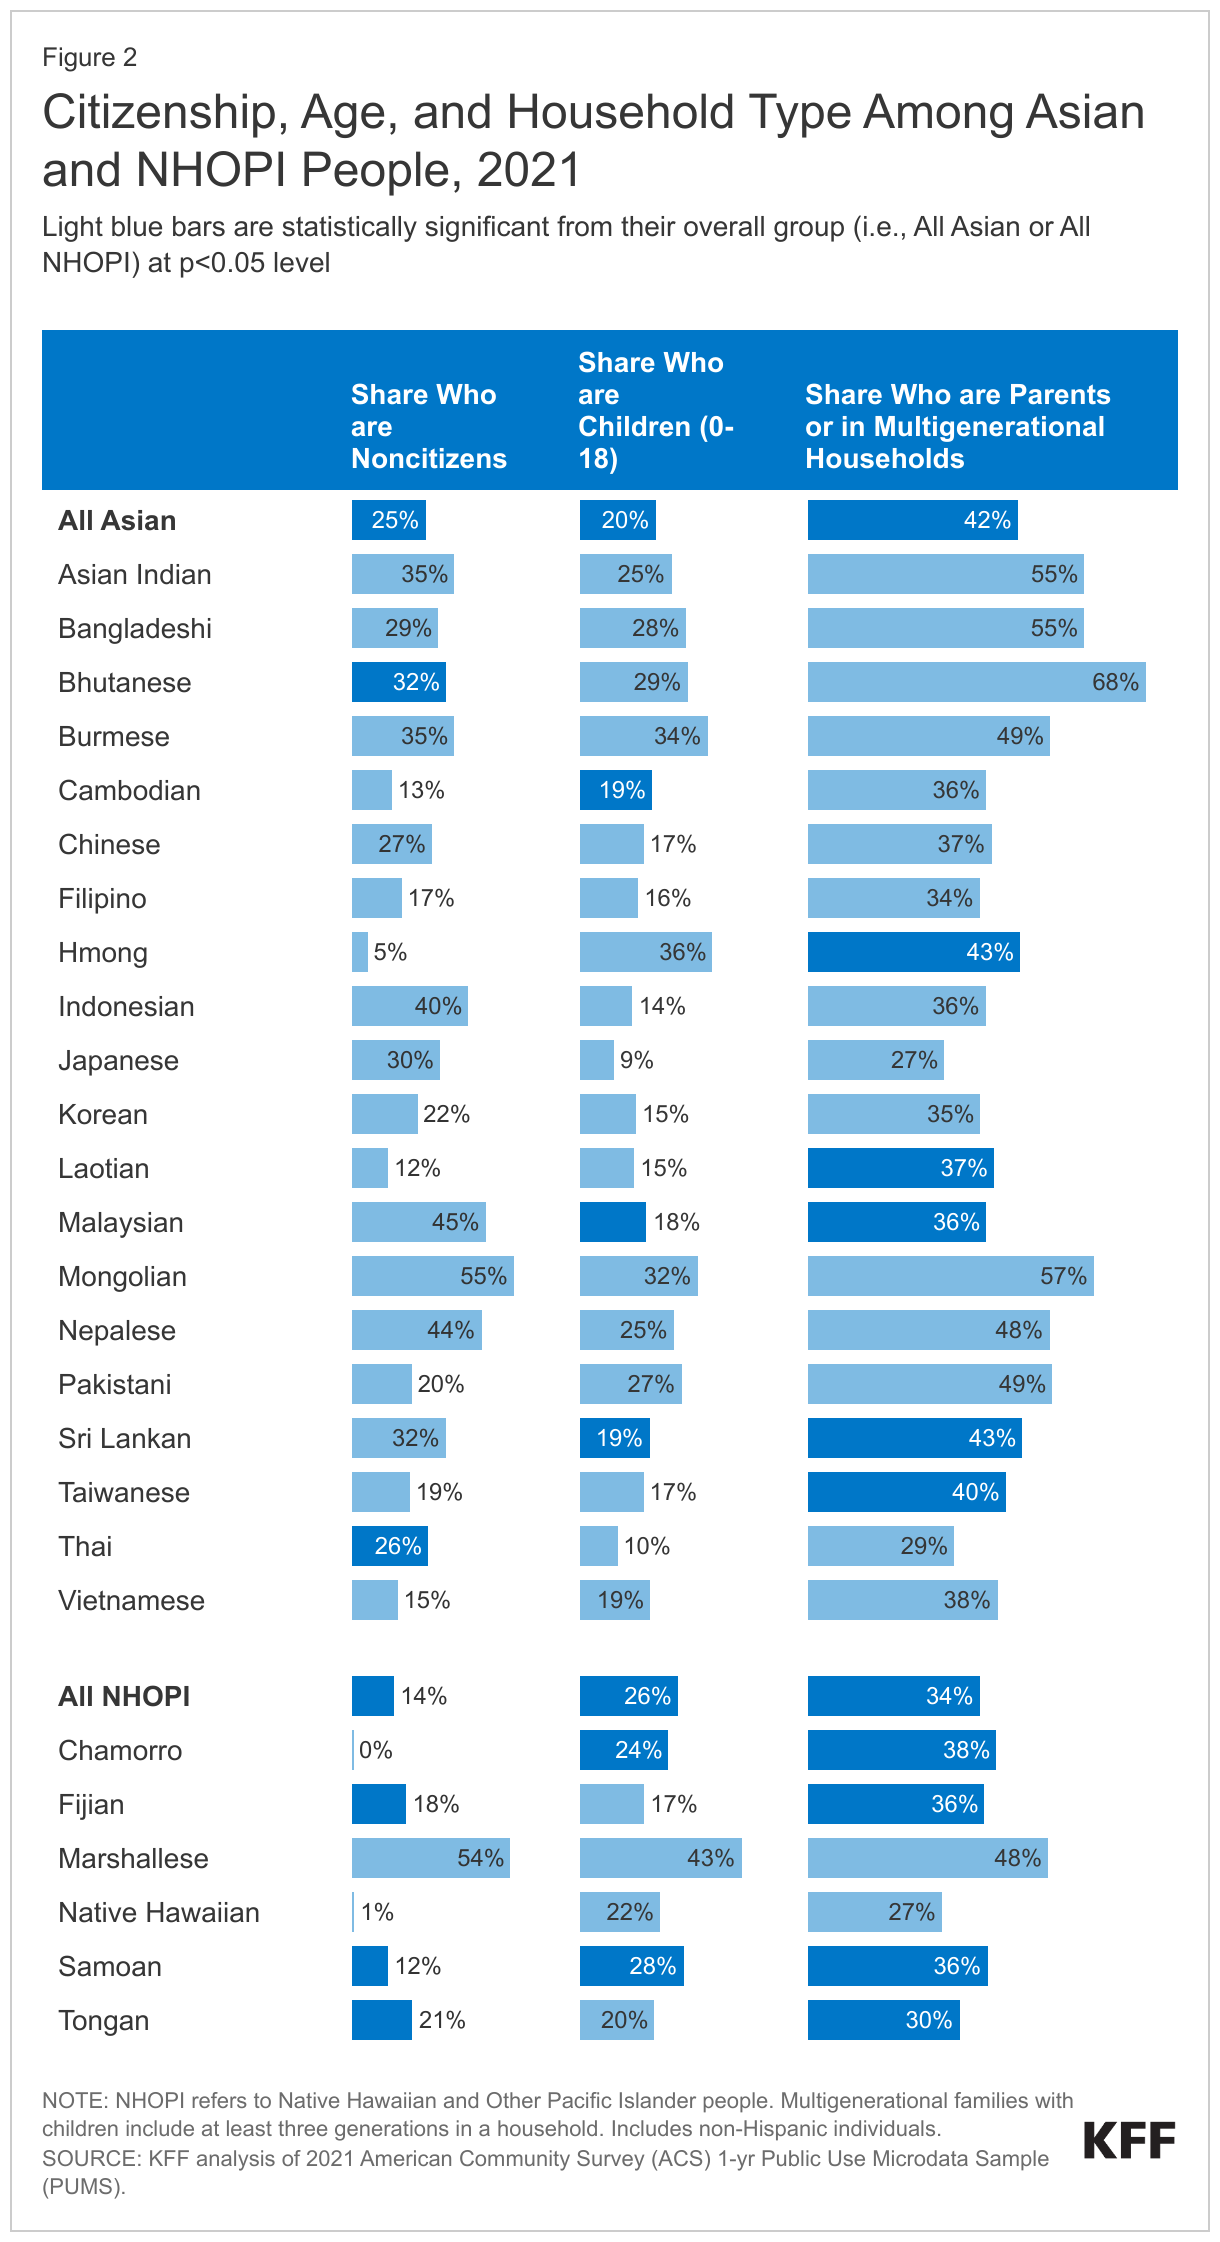
The majority of Asian and NHOPI people in the U.S. are citizens, adults, and many are parents or living in multigenerational households (Figure 2). Asian and NHOPI people included larger shares of noncitizens relative to White people (25% and 14% vs. 1%). One in five Asian (20%) and 19% White people were children, while more than one in four (26%) NHOPI people were children. Larger shares of Asian people lived in households comprised of parents with children or multigenerational households as compared to White people (42% vs. 33%).
Citizenship and household status varied among Asian and NHOPI subgroups: For example, the share of Asian people who are noncitizens ranged from 5% among Hmong people to 55% among Mongolian people. Among NHOPI people, Native Hawaiian and Chamorro people were significantly less likely than NHOPI people overall to be noncitizens (at less than 1%). In contrast, Marshallese people were more likely to be noncitizens (54%). This variation reflects differences in birth citizenship rights across locations to which NHOPI people trace their origins. Specifically, people born in Hawaii and Guam (Chamorro people) are U.S. citizens by birth, while other Pacific Islander people, including those born in in the Marshall Islands, which is part of the Compact of Free Association (COFA) with the U.S are not conferred U.S. citizenship at birth. The share of these groups who are children also ranged widely, from 9% of Japanese people to 36% of Hmong people among Asian subgroups and from 17% of Fijian people to 43% of Marshallese people among NHOPI subgroups. Household composition also varied by subgroup. Among Asian subgroups, the share who were parents or living in multigenerational households ranged from 27% for Japanese people to 68% for Bhutanese people. Among NHOPI subgroups, Native Hawaiian people (27%) were less likely than the group overall to be in a multigenerational household, while Marshallese people were more likely (48%).
Health Coverage
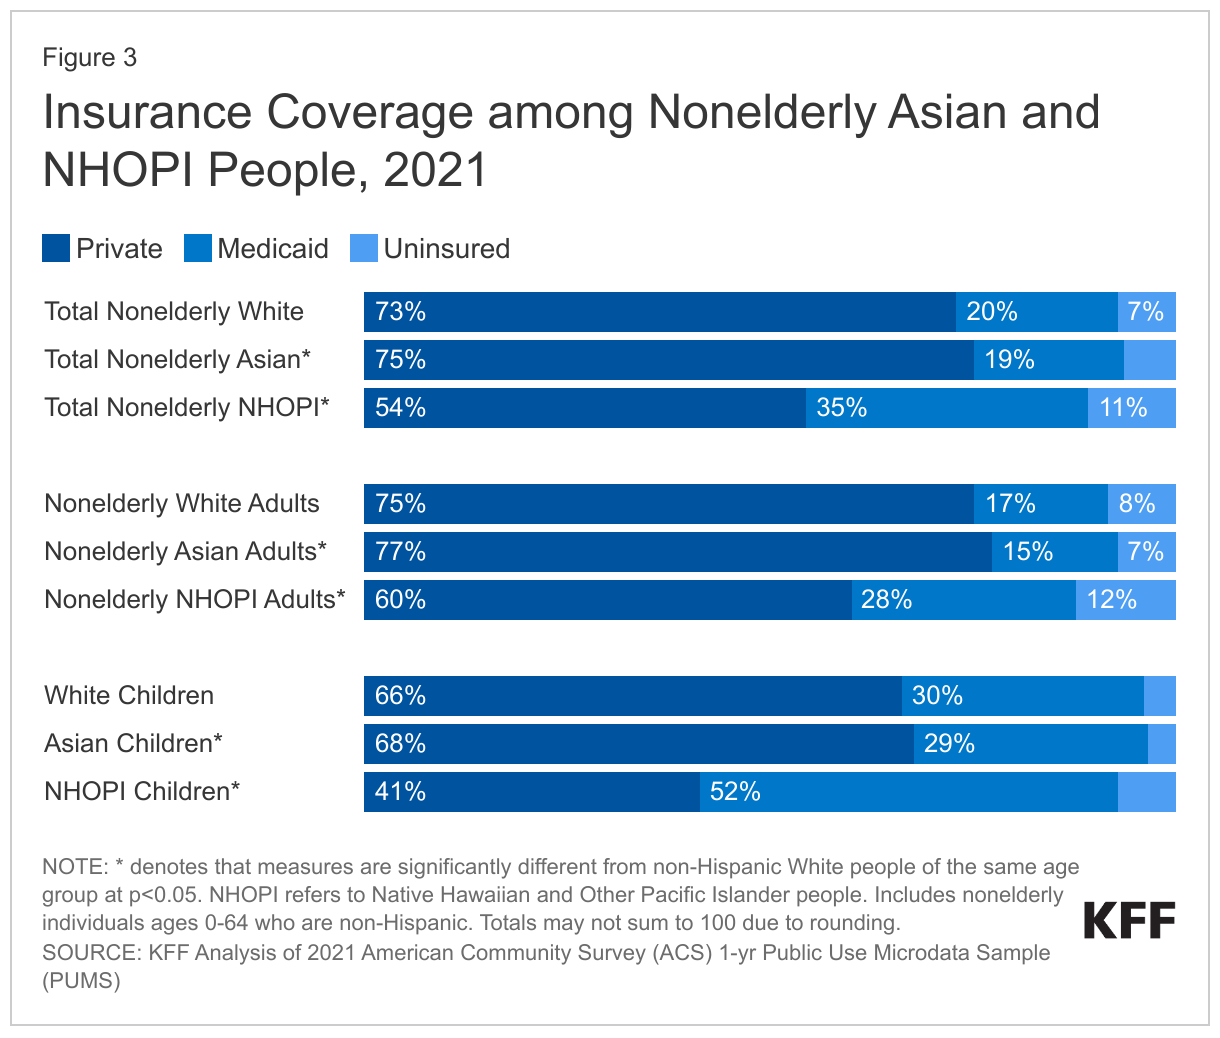
As of 2021, among the nonelderly population, 6% of Asian people and 11% of NHOPI people were uninsured (Figure 3). The uninsured rate for Asian people was slightly lower than the rate for White people (7%), while the rate for NHOPI people was higher. Across both groups, uninsured rates were lower for children compared to nonelderly adults. The shares of Asian people covered by private coverage were higher than the shares for White people and the shares covered by Medicaid were lower. In contrast, NHOPI people were less likely to have private coverage and more likely to be covered by Medicaid, with over half (52%) of NHOPI children being covered by Medicaid or the Children’s Health Insurance Program (CHIP).
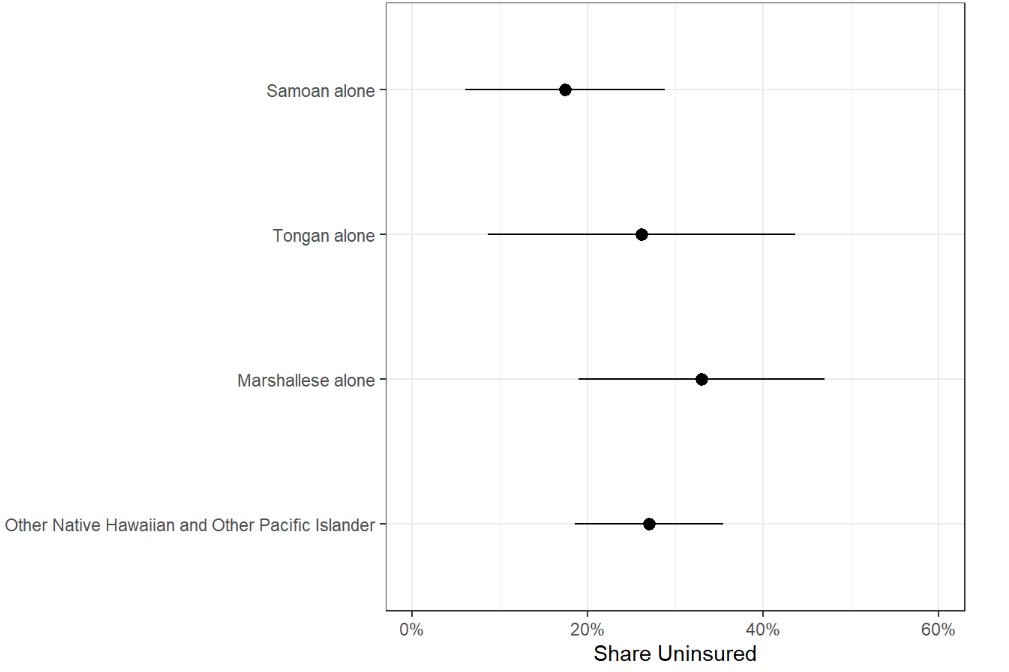
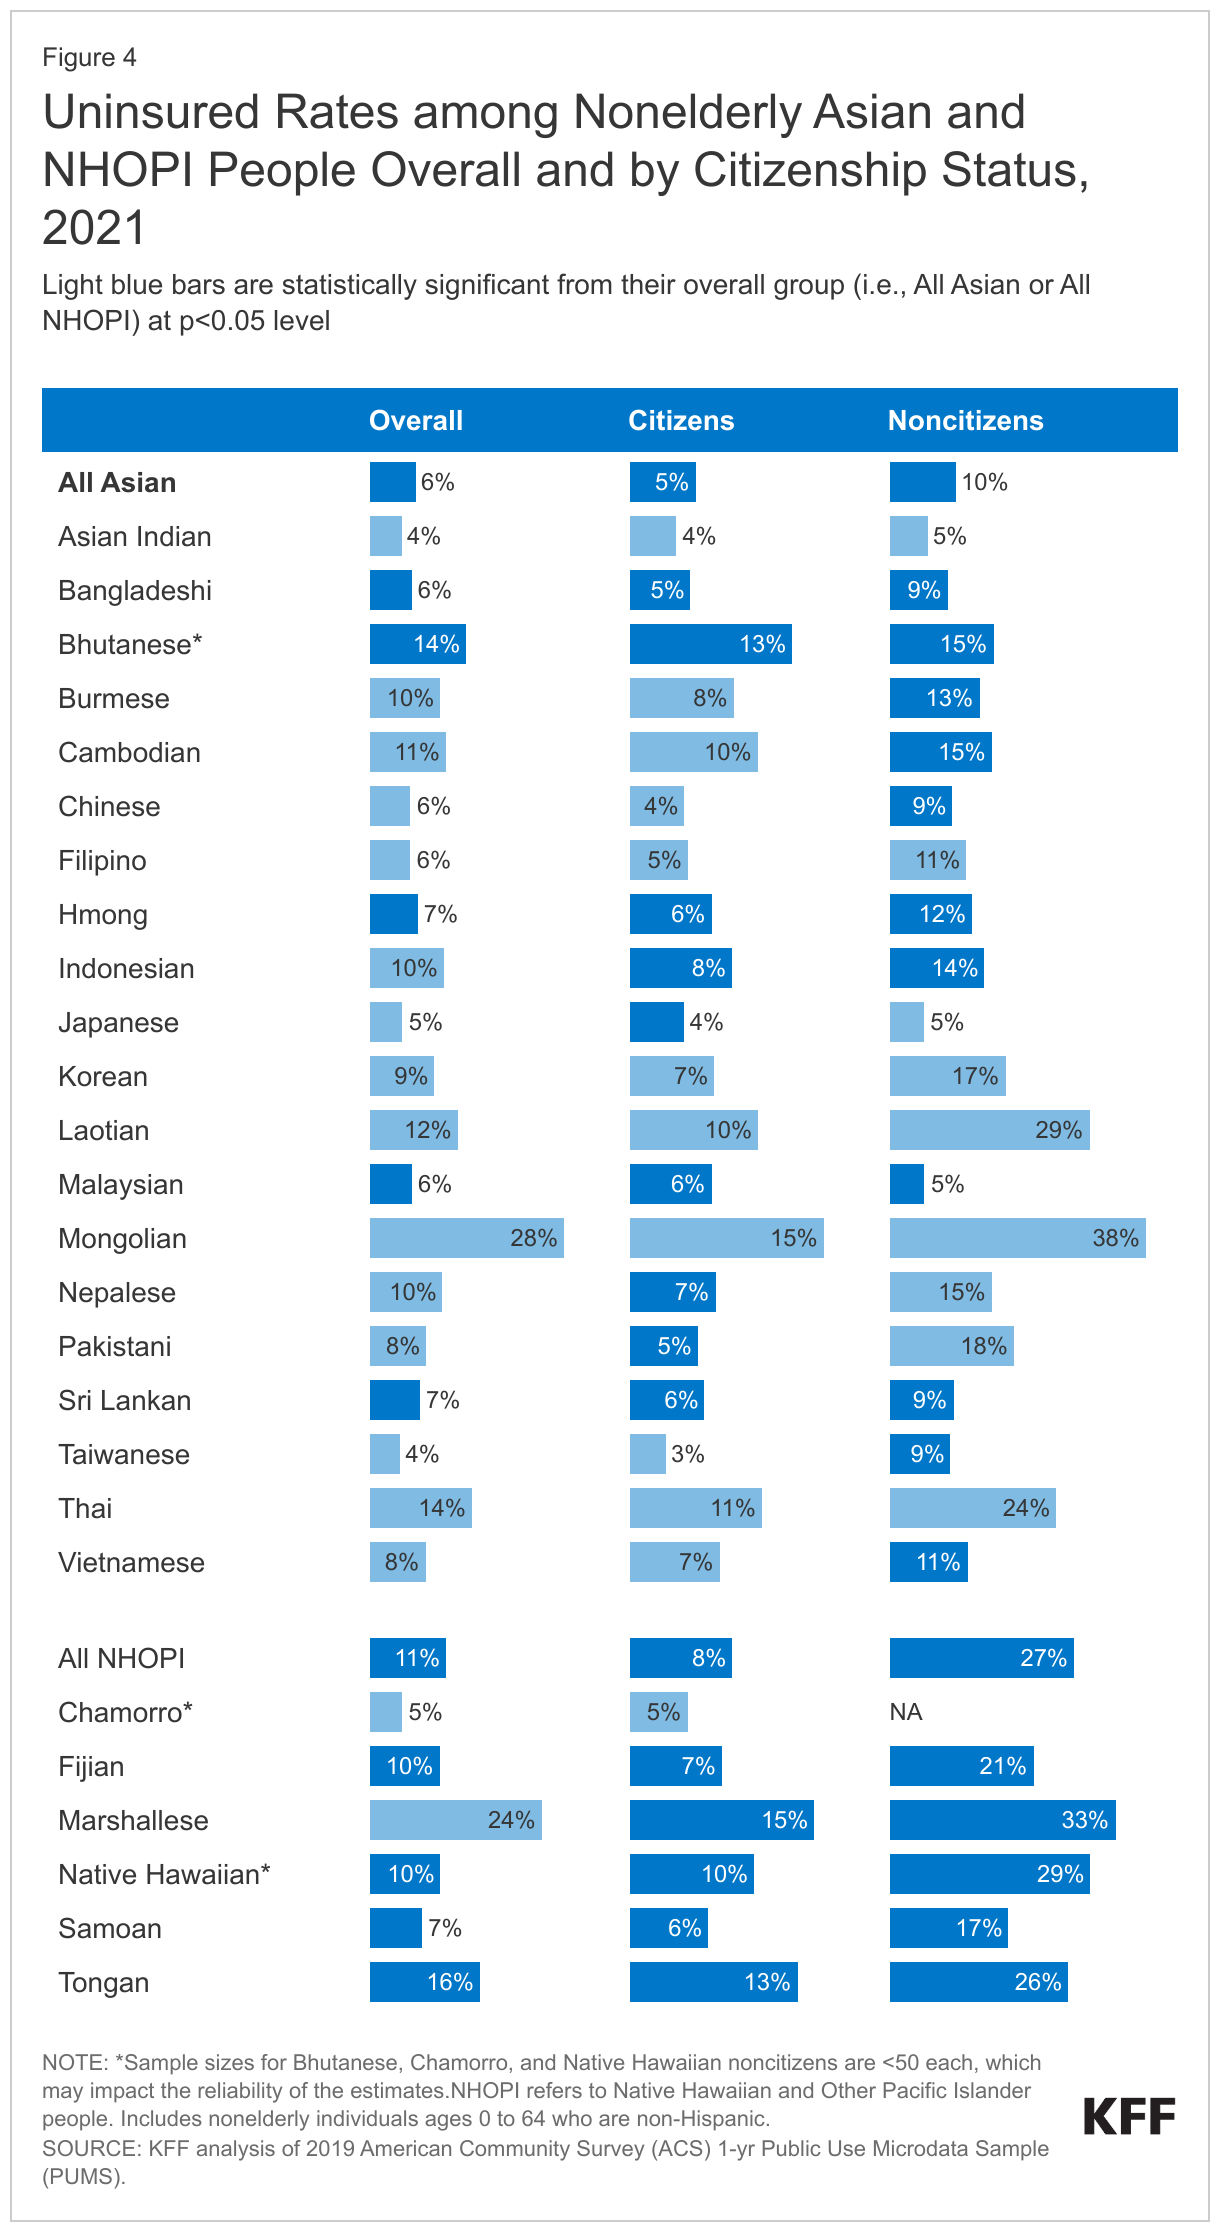
There are wide variations in uninsured rates among Asian and NHOPI subgroups (Figure 4). As of 2021, among nonelderly Asian people, uninsured rates ranged from 4% for Asian Indian and Taiwanese people to 28% for Mongolian people. Among NHOPI people, uninsured rates ranged from 5% for Chamorro people to 24% for Marshallese people, although uninsured rates for other NHOPI subgroups were not statistically significantly different from nonelderly NHOPI people overall. Uninsured rates further varied by citizenship status, with higher uninsured rates for noncitizens across most groups. Among nonelderly Asian noncitizens, uninsured rates varied from 5% for Japanese people to 38% for Mongolian people. There were no statistically significant differences in uninsured rates among nonelderly NHOPI noncitizens. Of note, the sample sizes for some noncitizen subgroups were small (<50), which can lead to a higher degree of uncertainty, i.e., larger confidence intervals for their measures. Confidence intervals for each subgroup measure in Figure 4 can be found in the Appendix.
Socioeconomic Differences
A variety of social and economic factors influence individuals’ access to health coverage, their ability to access health care, and their overall well-being. While as a broad group Asian people often fare similar to or better than White people across many of these measures, some subgroups fare worse. On the other hand, NHOPI people generally fare worse than their White counterparts across a range of social and economic measures.
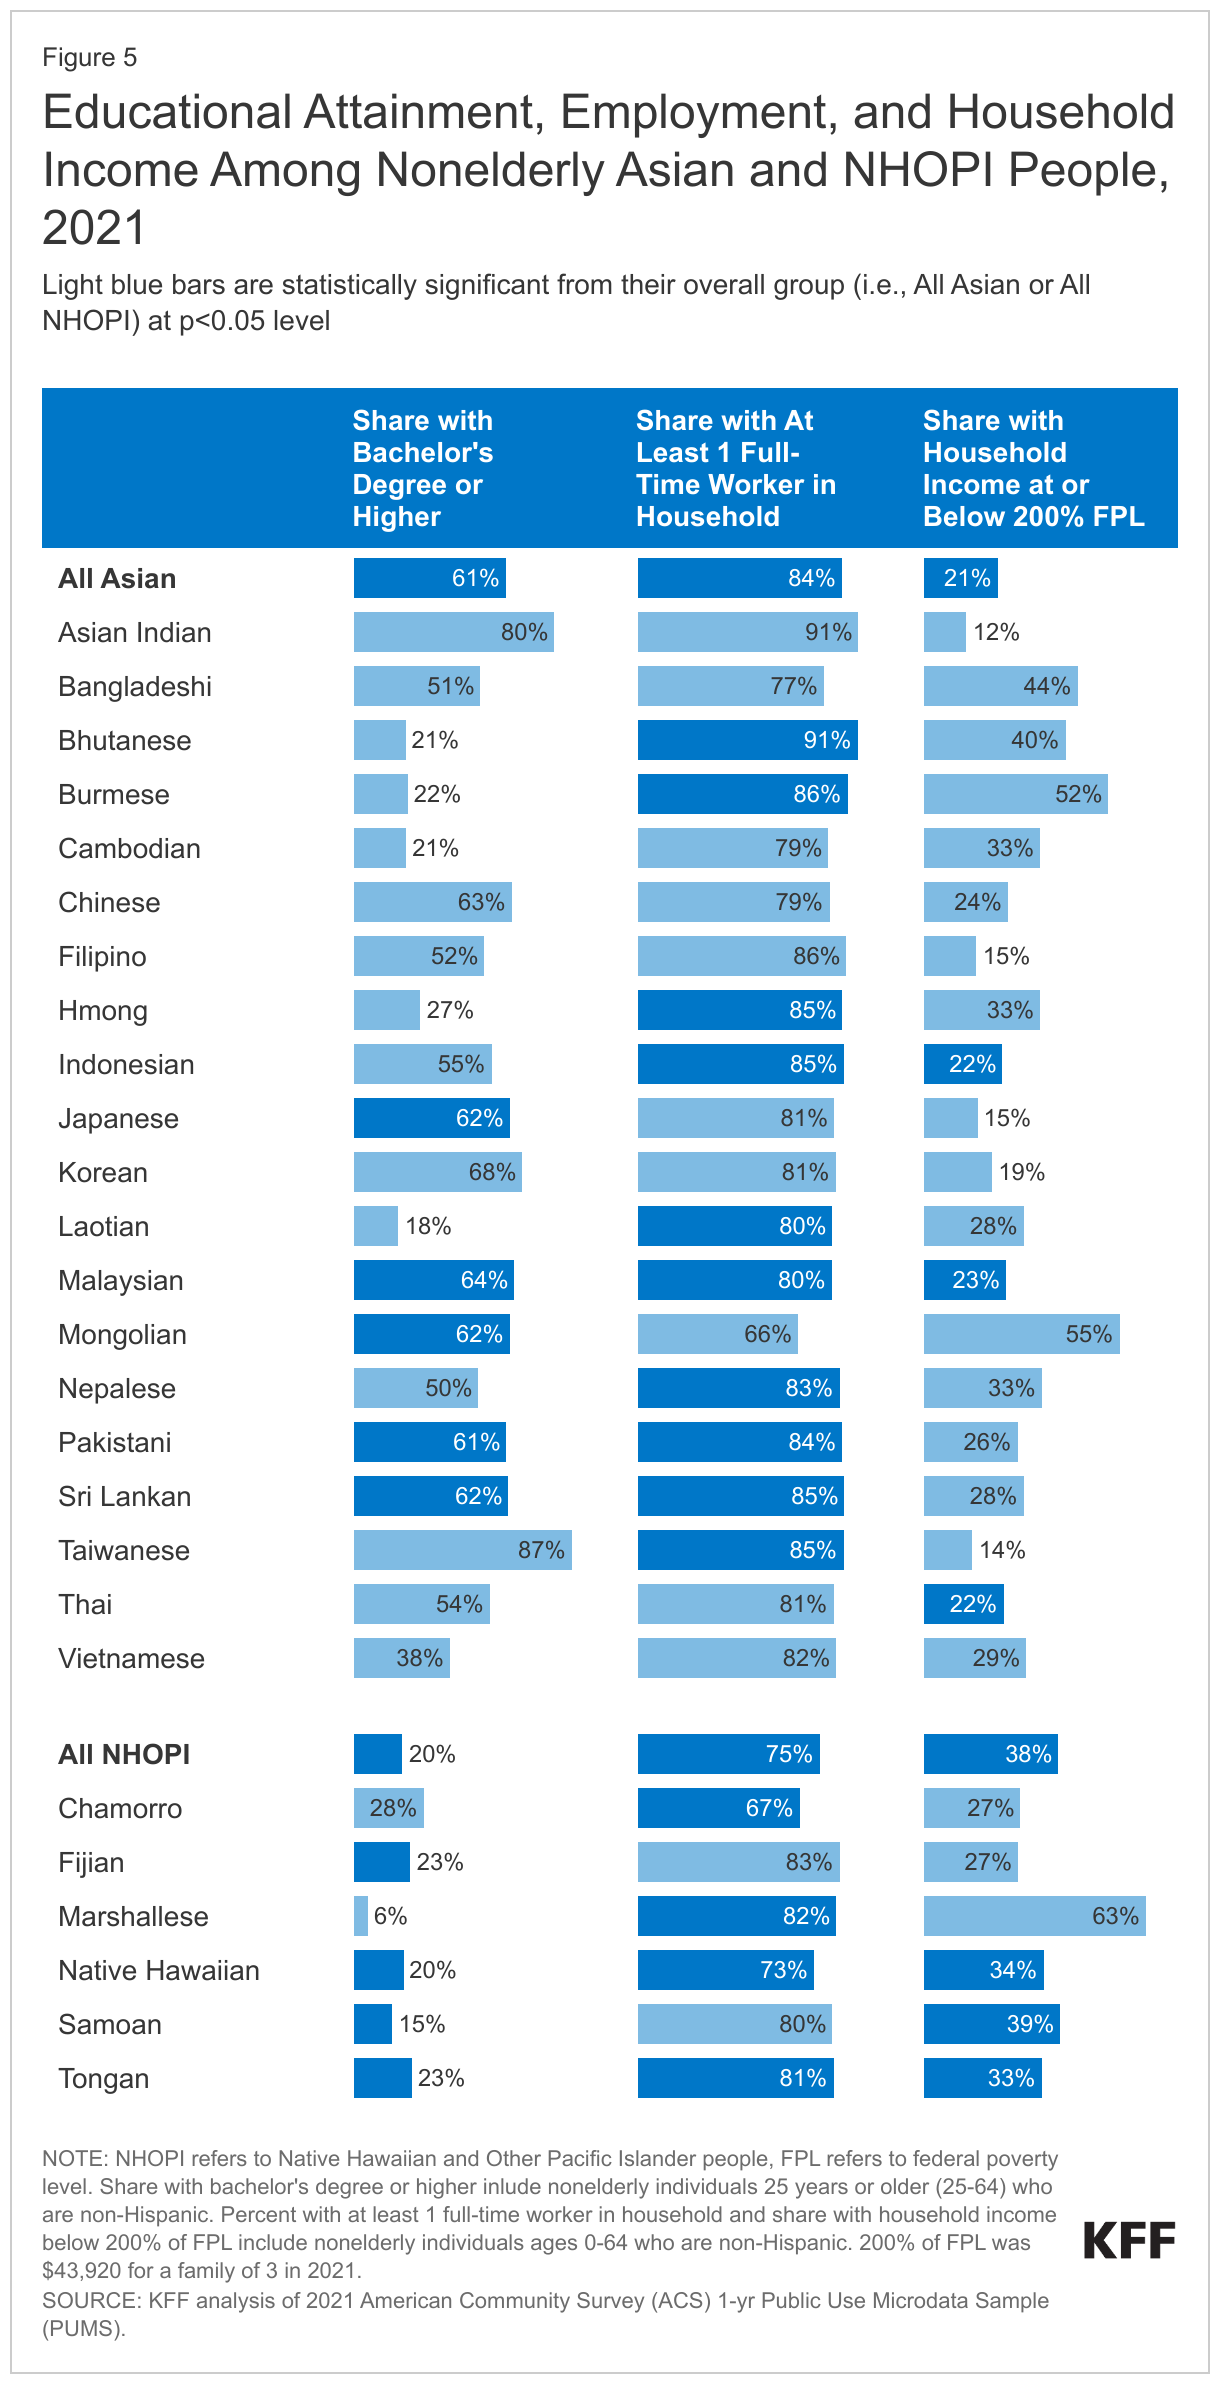
Data show variations in socioeconomic measures among nonelderly Asian and NHOPI subgroups, which may contribute to the differences in health coverage (Figure 5). Among Asian subgroups, there was an almost five-fold difference in the share of people who have received a bachelor’s degree or higher, with 18% of Laotian people having a bachelor’s degree or higher as compared to 87% of Taiwanese people. Overall educational attainment is lower among NHOPI people, with a lower share of Marshallese people (6%) having a bachelor’s degree or higher compared to nonelderly NHOPI overall, and a higher of Chamorro people (28%) having at least a college degree. The share of Asian households with at least one full-time worker also varied by subgroup, ranging from 66% among nonelderly Mongolian people to 91% among nonelderly Asian Indian people. Among NHOPI people, Fijian and Samoan people were slightly more likely than the overall group to have at least one full-time worker. Similarly, household income among Asian subgroups varied widely with the share of nonelderly people who lived in a low-income household (below 200% of the federal poverty level or $43,920 for a family of 3 in 2021) ranging from 12% among Asian Indian people to 55% among Mongolian people and 52% among Burmese people. Some of these differences are likely driven by differences in citizenship and visa status. For example, those entering the U.S. with work visas likely have higher median household incomes compared to those that entered as asylees and/or refugees. Many Burmese people immigrate to the U.S. as refugees fleeing war in their home country, which could contribute towards their lower household incomes. On the other hand, higher earning groups such as Taiwanese people and Asian Indian people usually immigrate through work visas. Despite eight in ten nonelderly Marshallese people living in a household with at least one full-time worker, 63% lived in a low-income household, while only 27% of Chamorro and Fijian people were low-income. Lower educational attainment as well as higher shares of noncitizens may in part explain the higher shares of Marshallese people living in low-income households.
Key Issues Looking Ahead
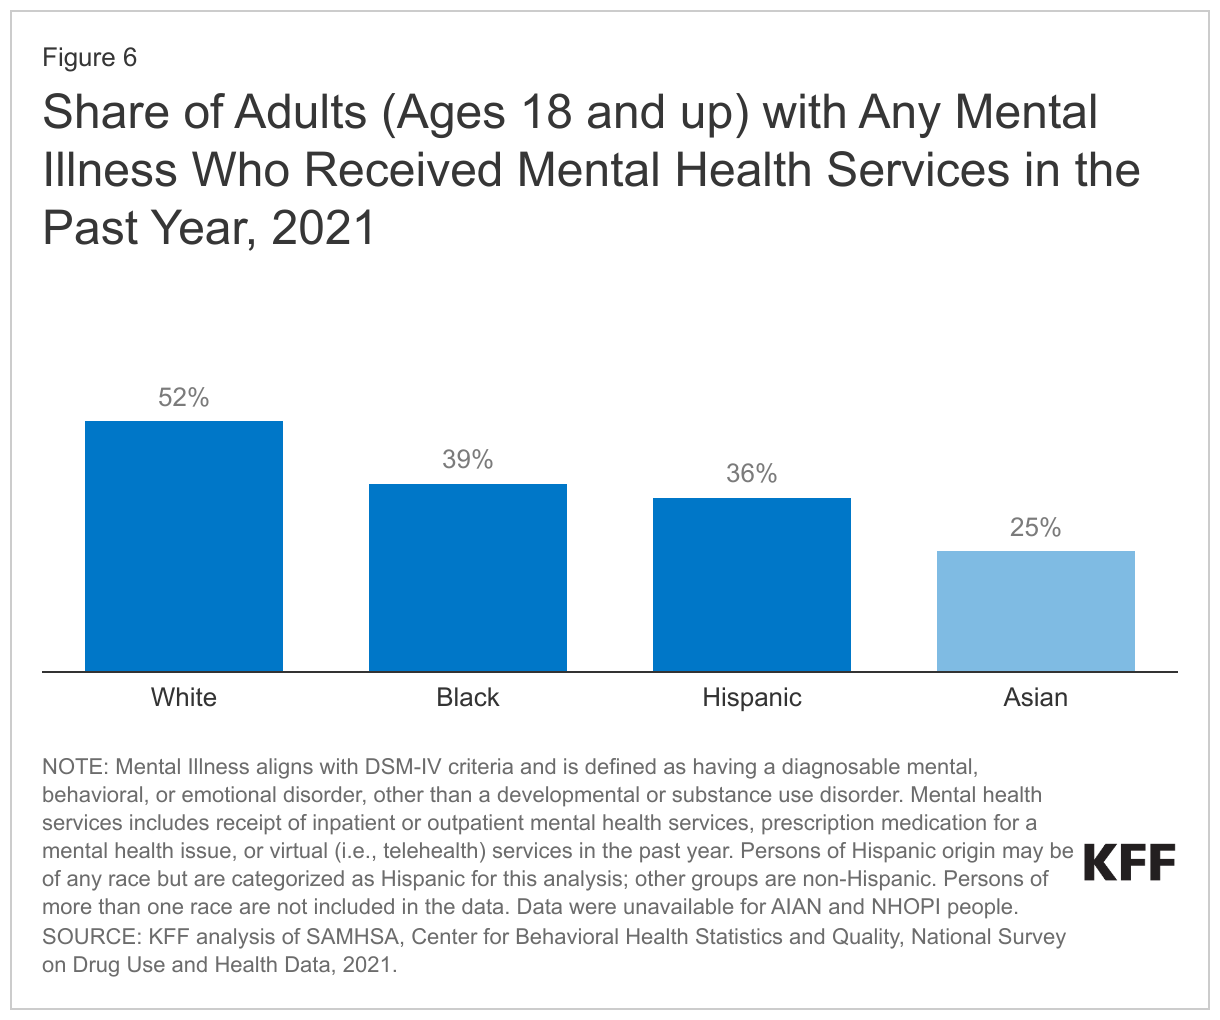
Understanding the experiences of Asian and NHOPI people is of particular importance at this time given growing concerns about mental health and well-being amid a significant uptick in anti-Asian hate incidents. The COVID-19 pandemic and underlying racism and discrimination have contributed to a significant rise in hate crimes against Asian people in the United States, which have contributed to deteriorating mental health among Asian people. In a 2021 survey, a majority of Asian Americans cited COVID cases being first reported in China and President Trump as major reasons for discrimination against the Asian and Pacific Islander community. Against the backdrop of these anti-Asian sentiments and actions, two tragic mass shootings occurred around this past Lunar New Year, of whom many of the victims were Asian. These tragic events and their devasting impacts on the community have highlighted the importance of understanding and addressing mental health needs among Asian and NHOPI people. Although overall rates of mental illness are generally lower among Asian people compared to White people, this finding may reflect underdiagnosis and underreporting. It also may mask variations in mental health among subgroups of the population. Among people with mental illness, Asian people are less likely to utilize mental health services compared to other racial and ethnic groups. In 2021, among adults with any mental illness in the past year, only 25% of Asian adults reported receiving mental health services compared to 52% of White adults (Figure 6). Data on utilization were not available for NHOPI people. Moreover, data show rising rates of suicide death among Asian and Pacific Islander adolescents (ages 12-17). Although they have lower rates of suicide deaths compared to their White peers, suicides were the leading cause of death among Asian and Pacific Islander children ages 10-14 and the second leading cause among those between the ages of 15 and 35 in 2020, and suicide death rates more than doubled among this population from 2010 (2.2 per 100,000) to 2020 (5.0 per 100,000).
In the wake of the COVID-19 pandemic, there has been a heightened awareness and focus on addressing health disparities, including recognizing the ongoing impacts of historic actions and policies on health disparities today. Anti-Asian racism is not new within the United States. Anti-Asian sentiments and related Sinophobia are embedded in U.S. history, as evidenced by the implementation of the Chinese Exclusion Acts in the late 1800s and the incarceration of Japanese Americans in the twentieth century. Historical actions have also contributed to ongoing trauma and negative health outcomes for NHOPI people. In the 19th century, the U.S. began substantial expansion across the Pacific Ocean which included the colonization of many of the Pacific Islands, and the overthrow of the Hawaiian monarchy. Since occupation, the United States’ colonial, post-colonial, and military actions in the region have resulted in adverse socioeconomic, health, and environmental pollution-related legacies among local and Indigenous populations. In addition to these historic actions and their aftermath, Asian and NHOPI people have faced ongoing stresses associated with the perpetual foreigner and model minority stereotypes, and acculturation.
The federal government has taken several actions focused on advancing health equity broadly and in response to the rise in Asian hate and anti-Asian violence, specifically. Early in his presidency, President Biden issued a series of executive orders focused on advancing health equity, including orders that outlined equity as a priority for the federal government broadly and as part of the pandemic response and recovery efforts. Federal agencies were directed with developing Equity Action Plans that outlined concrete strategies and commitments to addressing systemic barriers across the federal government. In 2021, Congress enacted the COVID-19 Hate Crimes Act in response to the increase in anti-Asian violence during the pandemic. During that time, the Biden Administration also released Executive Order 14031 “Advancing Equity, Justice, and Opportunity for Asian Americans, Native Hawaiians, and Pacific Islanders," which established the White House Initiative on Asian Americans, Native Hawaiians, and Pacific Islanders (WHIAANHPI). The WHIAANHPI is committed to advancing equity for Asian Americans, Native Hawaiians, and Pacific Islanders (AANHPI) by investing in AANHPI communities and responding to the spikes in anti-Asian violence. In January 2023, the White House announced its National Strategy to Advance Equity, Justice, and Opportunity for Asian American, Native Hawaiian, and Pacific Islander (AA and NHPI) Communities.
As part of efforts to address disparities and advance health equity, there are efforts underway to expand and improve availability of disaggregated data, including for Asian and NHOPI people. As shown in this analysis, Asian and NHOPI people have diverse characteristics and experiences that influence their health and health care. These differences point to the importance of having disaggregated data for Asian and NHOPI groups to identify disparities and direct efforts to address them. The Biden Administration has charged the government with addressing the systemic lack of disaggregated AANHPI data in federal statistical systems. The Interagency Working Group on Equitable Data in collaboration with the WHIANHPI is also working to improve research on policy and program outcomes for AANHPI communities. In April 2022, the working group released its Equitable Data Working Group Report, which highlighted the need to generate disaggregated data, increase access to disaggregated data, conduct equity assessments of federal programs, and emphasize accountability to communities in the United States. The Office of Management and Budget released proposals in January 2023 to update the minimum standards for collecting and presenting data on race and ethnicity for all federal reporting, including providing a separate racial category for people who identify as Middle Eastern or North African and moving to collect race and ethnicity through a combined single question instead of asking about Hispanic or Latino ethnicity in a separate question from race.
Appendix
Figure 4a: Share of All Nonelderly Uninsured Asian People, 2021

Figure 4b: Share of Nonelderly Uninsured Asian Citizens, 2021
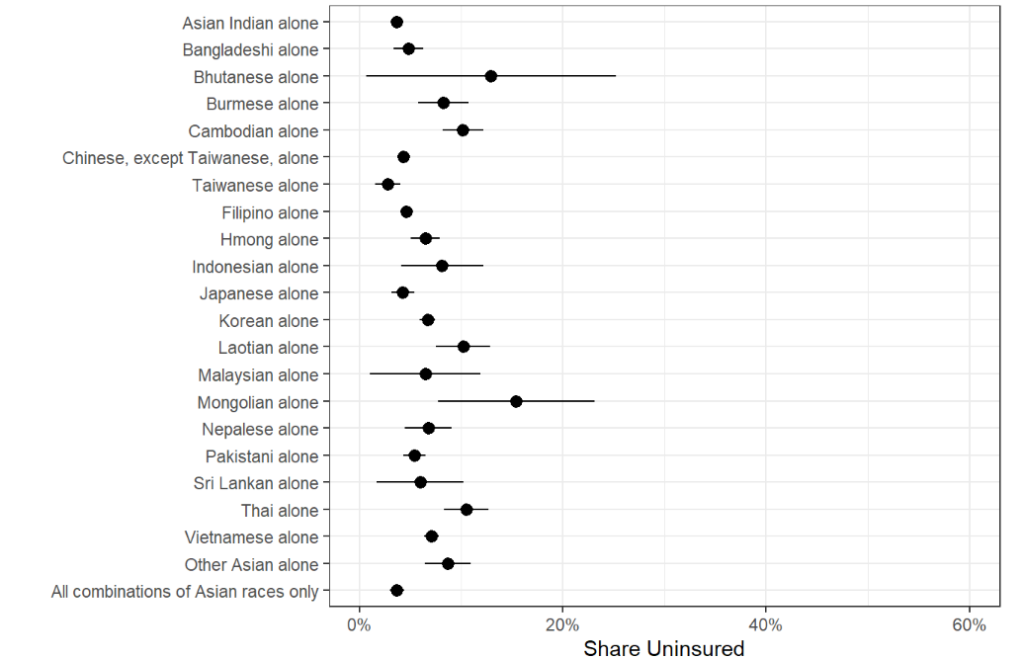
Figure 4c: Share of Nonelderly Uninsured Asian Noncitizens, 2021
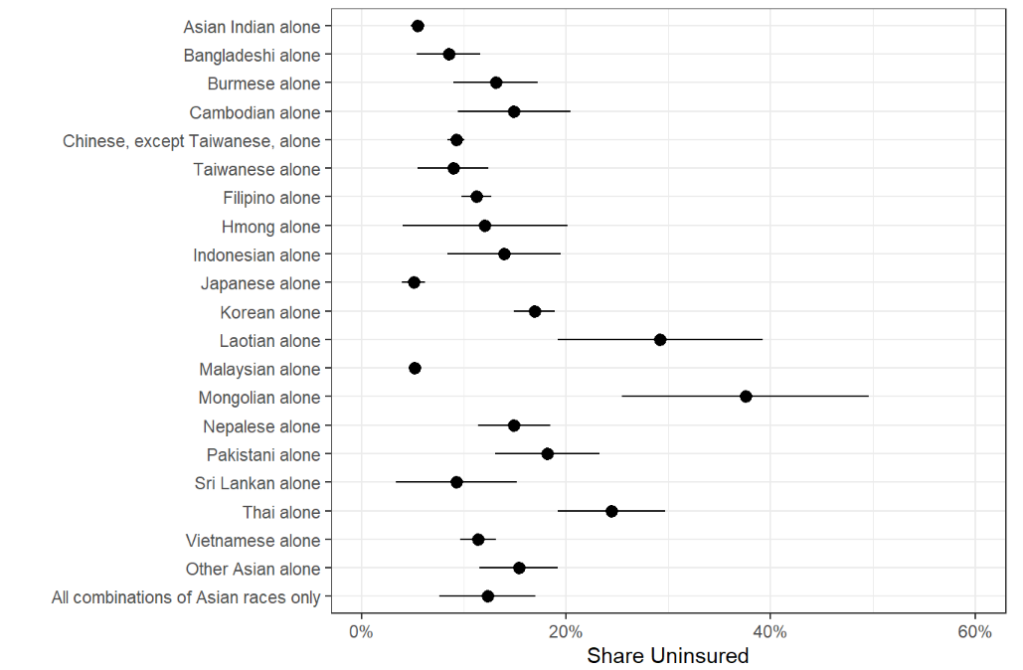
Figure 4d: Share of All Nonelderly Uninsured NHOPI People, 2021
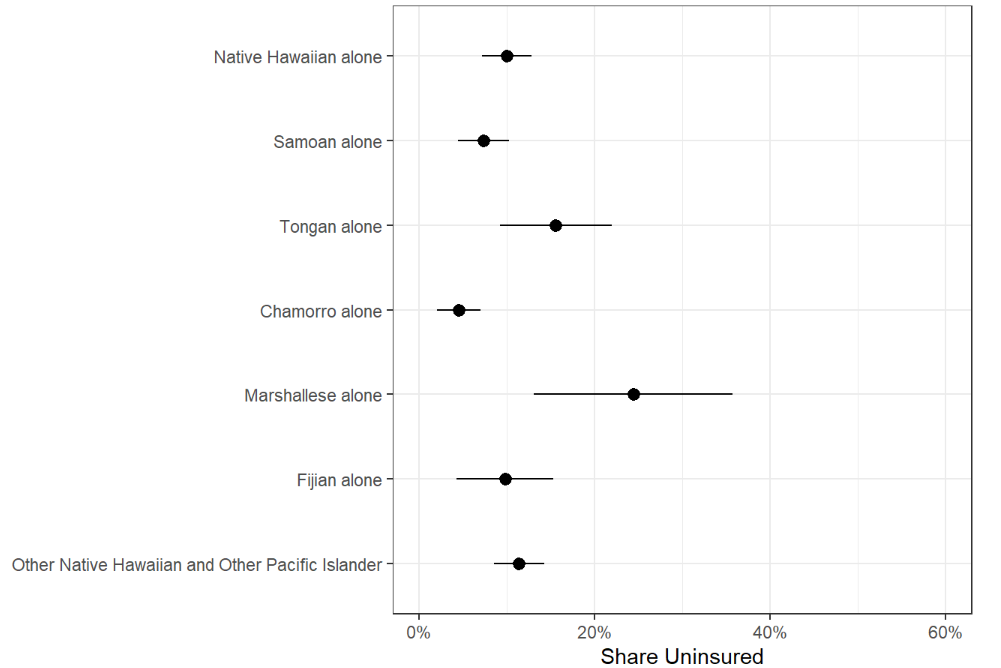
Figure 4e: Share of Nonelderly Uninsured NHOPI Citizens, 2021
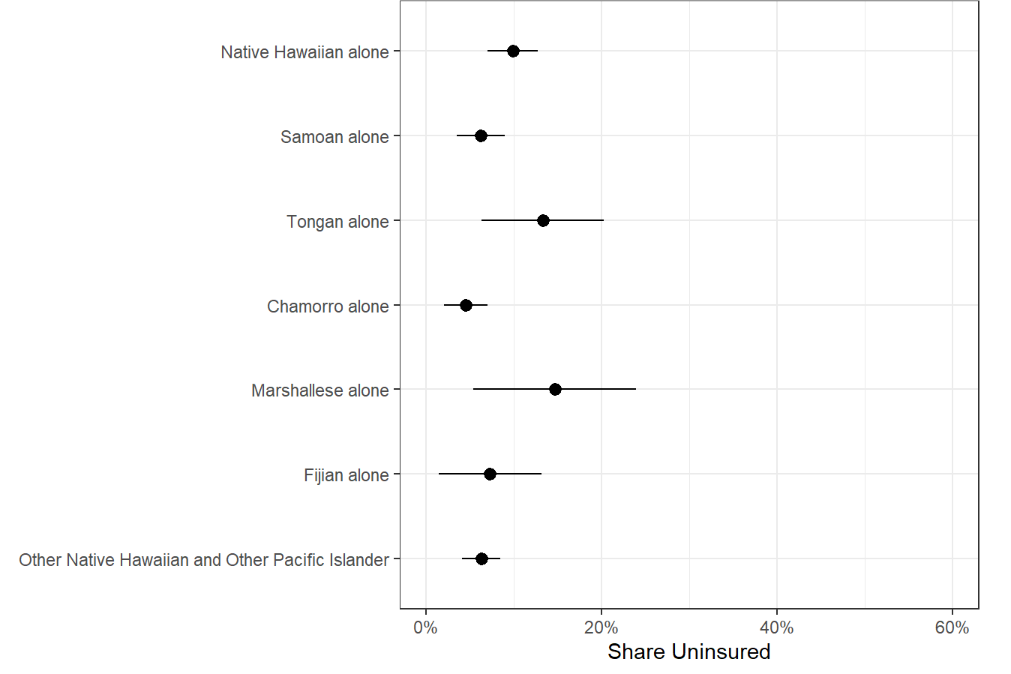
Figure 4f: Share of Nonelderly Uninsured NHOPI Noncitizens, 2021