Dental, Hearing, and Vision Costs and Coverage Among Medicare Beneficiaries in Traditional Medicare and Medicare Advantage
Notably missing among covered benefits for older adults and people with long-term disabilities who have Medicare coverage are dental, hearing, and vision services, except under limited circumstances. Results from a recent KFF poll indicate that 90% of the public says expanding Medicare to include dental, hearing, vision is a “top” or “important” priority for Congress. Policymakers are proposing to add coverage for these services as part of budget reconciliation legislation, and a provision to add these benefits to traditional Medicare was included in the version of H.R. 3 that passed the House of Representatives in the 116th Congress.
The Biden Administration endorsed improving access to these benefits for Medicare beneficiaries in the FY2022 budget. Addressing these gaps in Medicare benefits is grounded in a substantial body of research showing that untreated dental, vision, and hearing problems can have negative physical and mental health consequences. Adding these benefits to Medicare would increase federal spending, and they will be competing against other priorities in the budget reconciliation debate.
Dental, hearing, and vision services are typically offered by Medicare Advantage plans, but the extent of that coverage and the value of these benefits varies. Some beneficiaries in traditional Medicare may have private coverage or coverage through Medicaid for these services, but many do not. As a result, beneficiaries who need dental, vision, or hearing care may forego getting the care or treatment they need or face out-of-pocket costs that can run into the hundreds and even thousands of dollars for expensive dental treatment, hearing aids, or corrective eyewear.
In a separate KFF analysis, we analyzed dental coverage, use, and out-of-pocket spending among Medicare beneficiaries and provided an in-depth look at coverage of dental services in Medicare Advantage plans. In this brief, we build on our prior work by analyzing hearing and vision use, out-of-pocket spending and cost-related barriers to care among beneficiaries in traditional Medicare and Medicare Advantage, incorporating top-level findings from our analysis of dental services to provide a comprehensive profile of dental, hearing, and vision benefits in Medicare Advantage plans. The analysis of spending, use, and cost-related barriers to care is based on self-reported data by beneficiaries in both traditional Medicare and Medicare Advantage from the 2018 and 2019 Medicare Current Beneficiary Survey, and analysis of Medicare Advantage plan benefits is based on the 2021 Medicare Advantage Enrollment and Benefit files for data on individual Medicare Advantage plans (see Methods for details).
Findings
Dental, Hearing, and Vision Use and Spending
- Difficulty with hearing and vision is relatively common among Medicare beneficiaries, with close to half (44%, or 25.9 million) of beneficiaries reporting difficulty hearing and more than one third (35% or 20.2 million beneficiaries) reporting difficulty seeing in 2019. These percentages may understate the share of beneficiaries who have problems with hearing or vision in that some beneficiaries who wear corrective eyewear or hearing aids do not report having difficulties. For example, among the 83% of Medicare beneficiaries who report wearing eyeglasses or contact lenses, only 32% say they have vision difficulties, while of the 14% of beneficiaries who report using a hearing aid, 65% say they have hearing difficulties. The lower overall rate of hearing aid use, relative to the rate of reported hearing difficulties, may be a function of affordability, considering the relatively high cost of hearing aids and limited availability of lower-cost options for hearing technology.
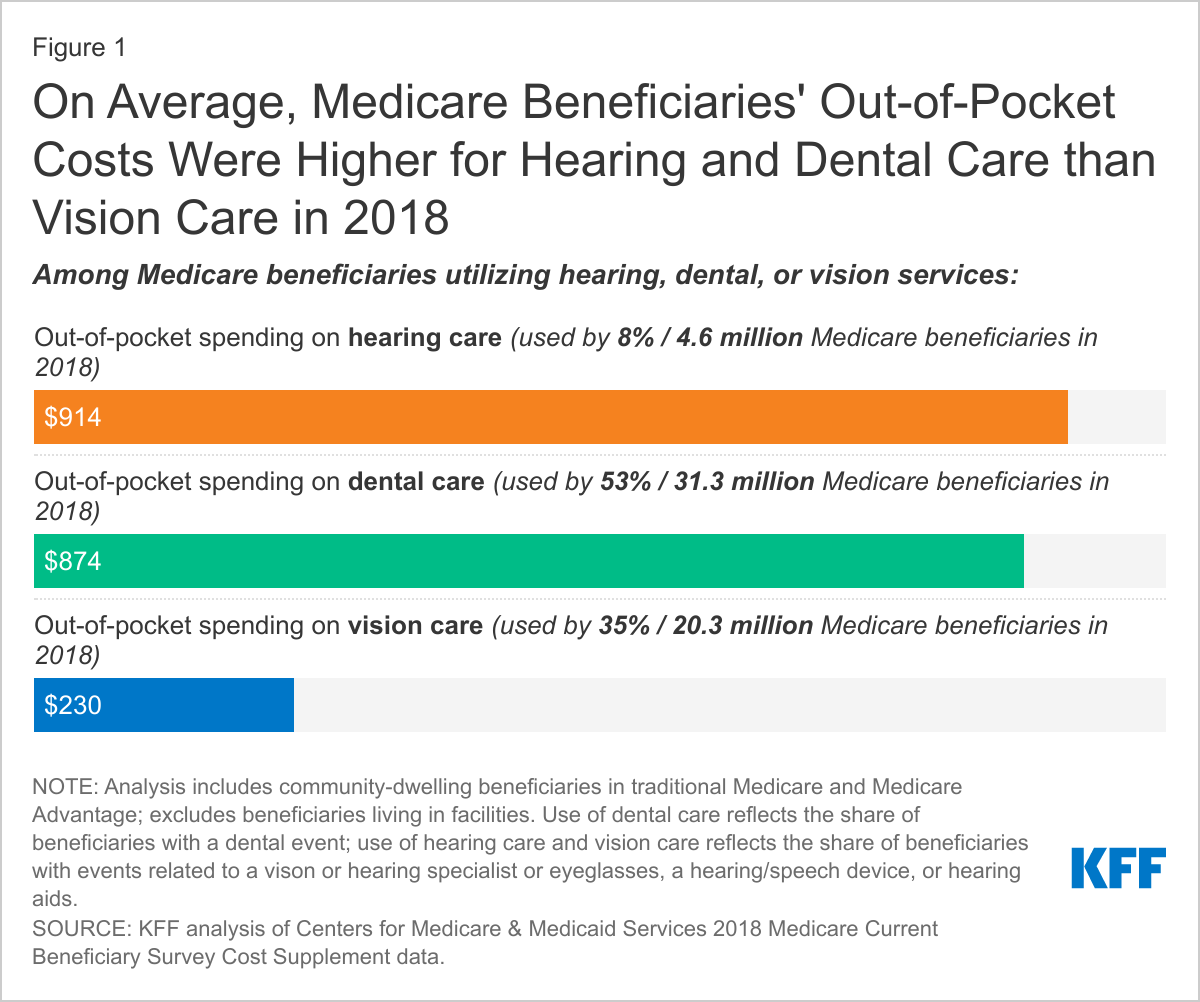
- A larger share of Medicare beneficiaries used dental services than either hearing or vision services in 2018. In 2018, 53% (31.3 million) of beneficiaries reported having a dental visit within the past year, 35% (20.3 million) used vision services, and 8% (4.6 million) used hearing services (Figure 1).
- On average, out-of-pocket spending on hearing and dental care by Medicare beneficiaries who used these services in 2018 was higher than spending on vision care by beneficiaries who used vision services that year. Among beneficiaries who used each type of service, average spending was $914 for hearing care, $874 for dental care, and $230 for vision care (Figure 1).
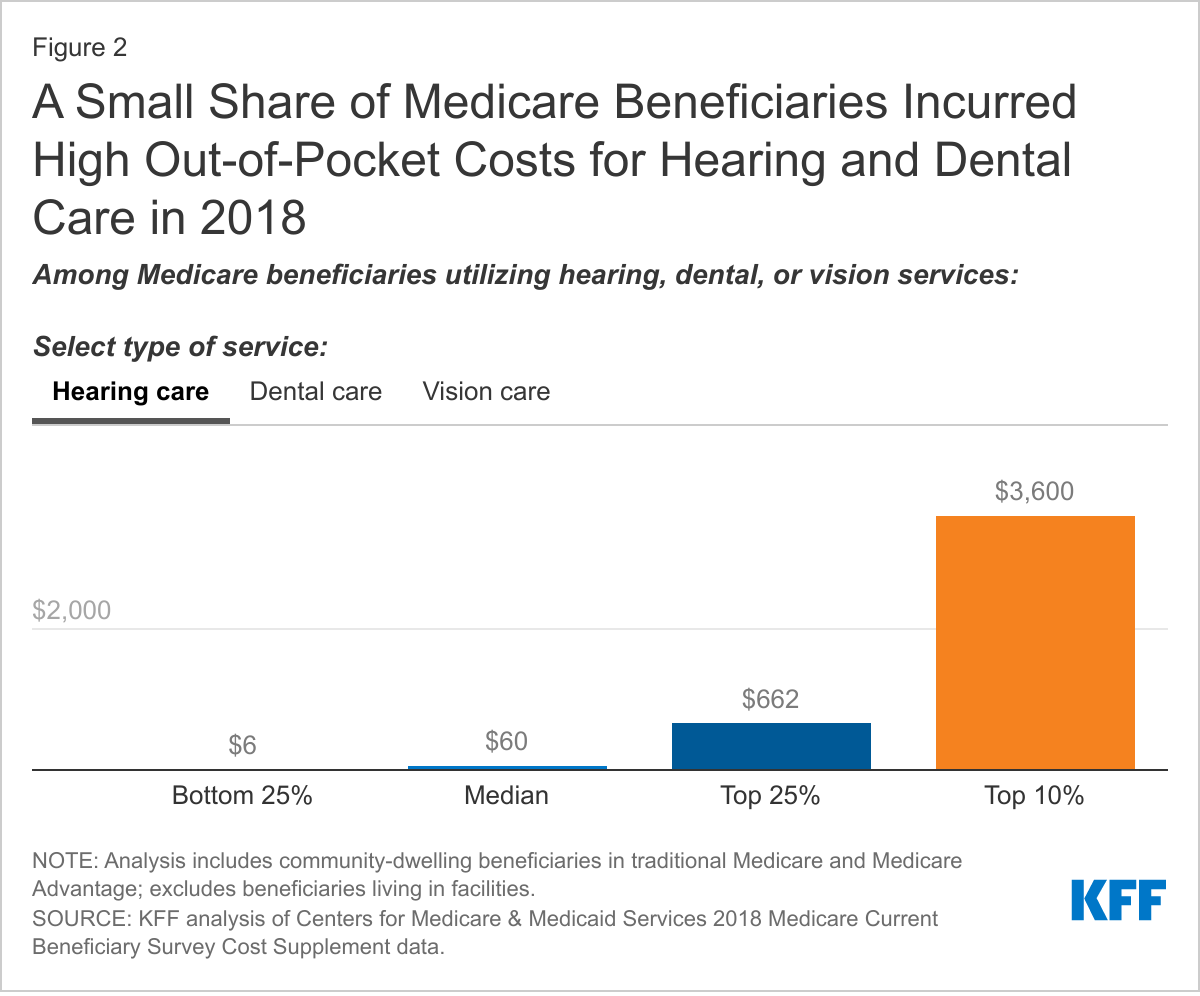
- The distribution of out-of-pocket spending on dental and hearing services is highly skewed, with a small share of users incurring significant out-of-pocket costs (likely associated with the purchase of costly equipment such as hearing aids, or expensive dental procedures, such as implants). For example, in 2018, among beneficiaries who used dental services, beneficiaries in the top 10% in terms of their out-of-pocket costs (2.7 million beneficiaries) spent $2,136 or more on their dental care, while among beneficiaries who used hearing services, beneficiaries in the top 10% in terms of out-of-pocket costs (0.4 million beneficiaries) spent $3,600 or more on these services (Figure 2). Conversely, half of beneficiaries who used dental services had out-of-pocket spending below $244 for their dental care; half of those who used vision services had out-of-pocket spending below $130 for their vision care; and half of those who used hearing services had out-of-pocket spending below $60 for their hearing care.
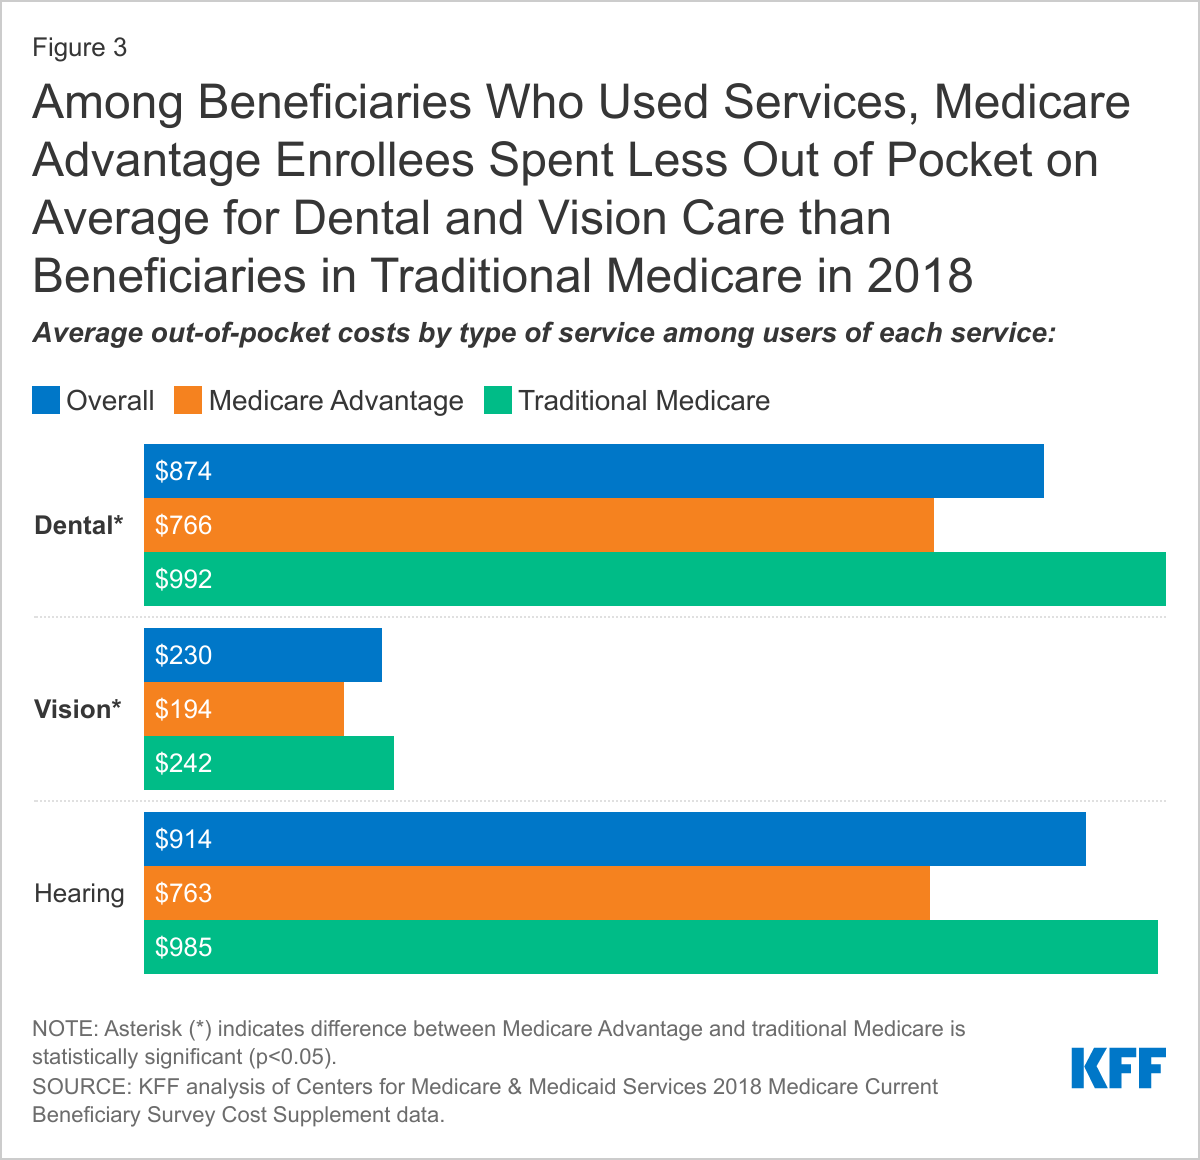
- Among users of these services, beneficiaries enrolled in Medicare Advantage plans spent less out of pocket for dental and vision care than beneficiaries in traditional Medicare in 2018, but there was no difference between the two groups in spending on hearing care. Both groups spent substantially more for dental and hearing services than vision services. For dental services, average out-of-pocket spending was $766 among beneficiaries in Medicare Advantage and $992 among beneficiaries in traditional Medicare (Figure 3). For vision services, average out-of-pocket spending was $194 among beneficiaries in Medicare Advantage and $242 among beneficiaries in traditional Medicare. Most Medicare Advantage enrollees had coverage for some dental, vision and hearing benefits, as described below, but still incurred out-of-pocket costs for these services.
- Lower average out-of-pocket spending among Medicare Advantage enrollees for dental and vision care is likely due to several factors. Most Medicare Advantage enrollees have coverage for dental, hearing, and vision services through their plan (as described below), which helps to improve the affordability of these services. Lower out-of-pocket spending among Medicare Advantage enrollees may also be related to lower overall income levels among these beneficiaries. Previous KFF analysis showed that average out-of-pocket spending on dental care rises with income because higher income beneficiaries are more able to afford such expenses, not because they have greater dental needs. It is possible that some traditional Medicare beneficiaries used more, or more expensive, types of dental and vision care than those in Medicare Advantage, contributing to their higher average out-of-pocket costs for these services. Due to data limitations, it is not possible to assess how utilization of dental, vision, or hearing care differed between Medicare Advantage and traditional Medicare enrollees.
- About one in six Medicare beneficiaries reported in 2019 that there was a time in the last year that they could not get dental, hearing, or vision care, and among those who reported access problems, cost was a major barrier.
- Overall, in 2019, 16% of Medicare beneficiaries, or 9.5 million, reported that there was a time in the last year that they could not get dental, hearing, or vision care. This includes 12% of Medicare beneficiaries who said they could not get dental care, 6% who couldn’t get vision care, and 3% who couldn’t get hearing care (Figure 4).
- Similar shares of beneficiaries in both traditional Medicare and Medicare Advantage reported access problems in the last year for dental, hearing, or vision services (16% and 17%, respectively).
- Among the 20.2 million beneficiaries who reported difficulty seeing, 11% (2.1 million beneficiaries) said there was a time in the last year they could not get vision care, and among the 25.9 million beneficiaries who reported difficulty hearing, 7% (1.8 million beneficiaries) said there was a time in the last year they could not get hearing care.
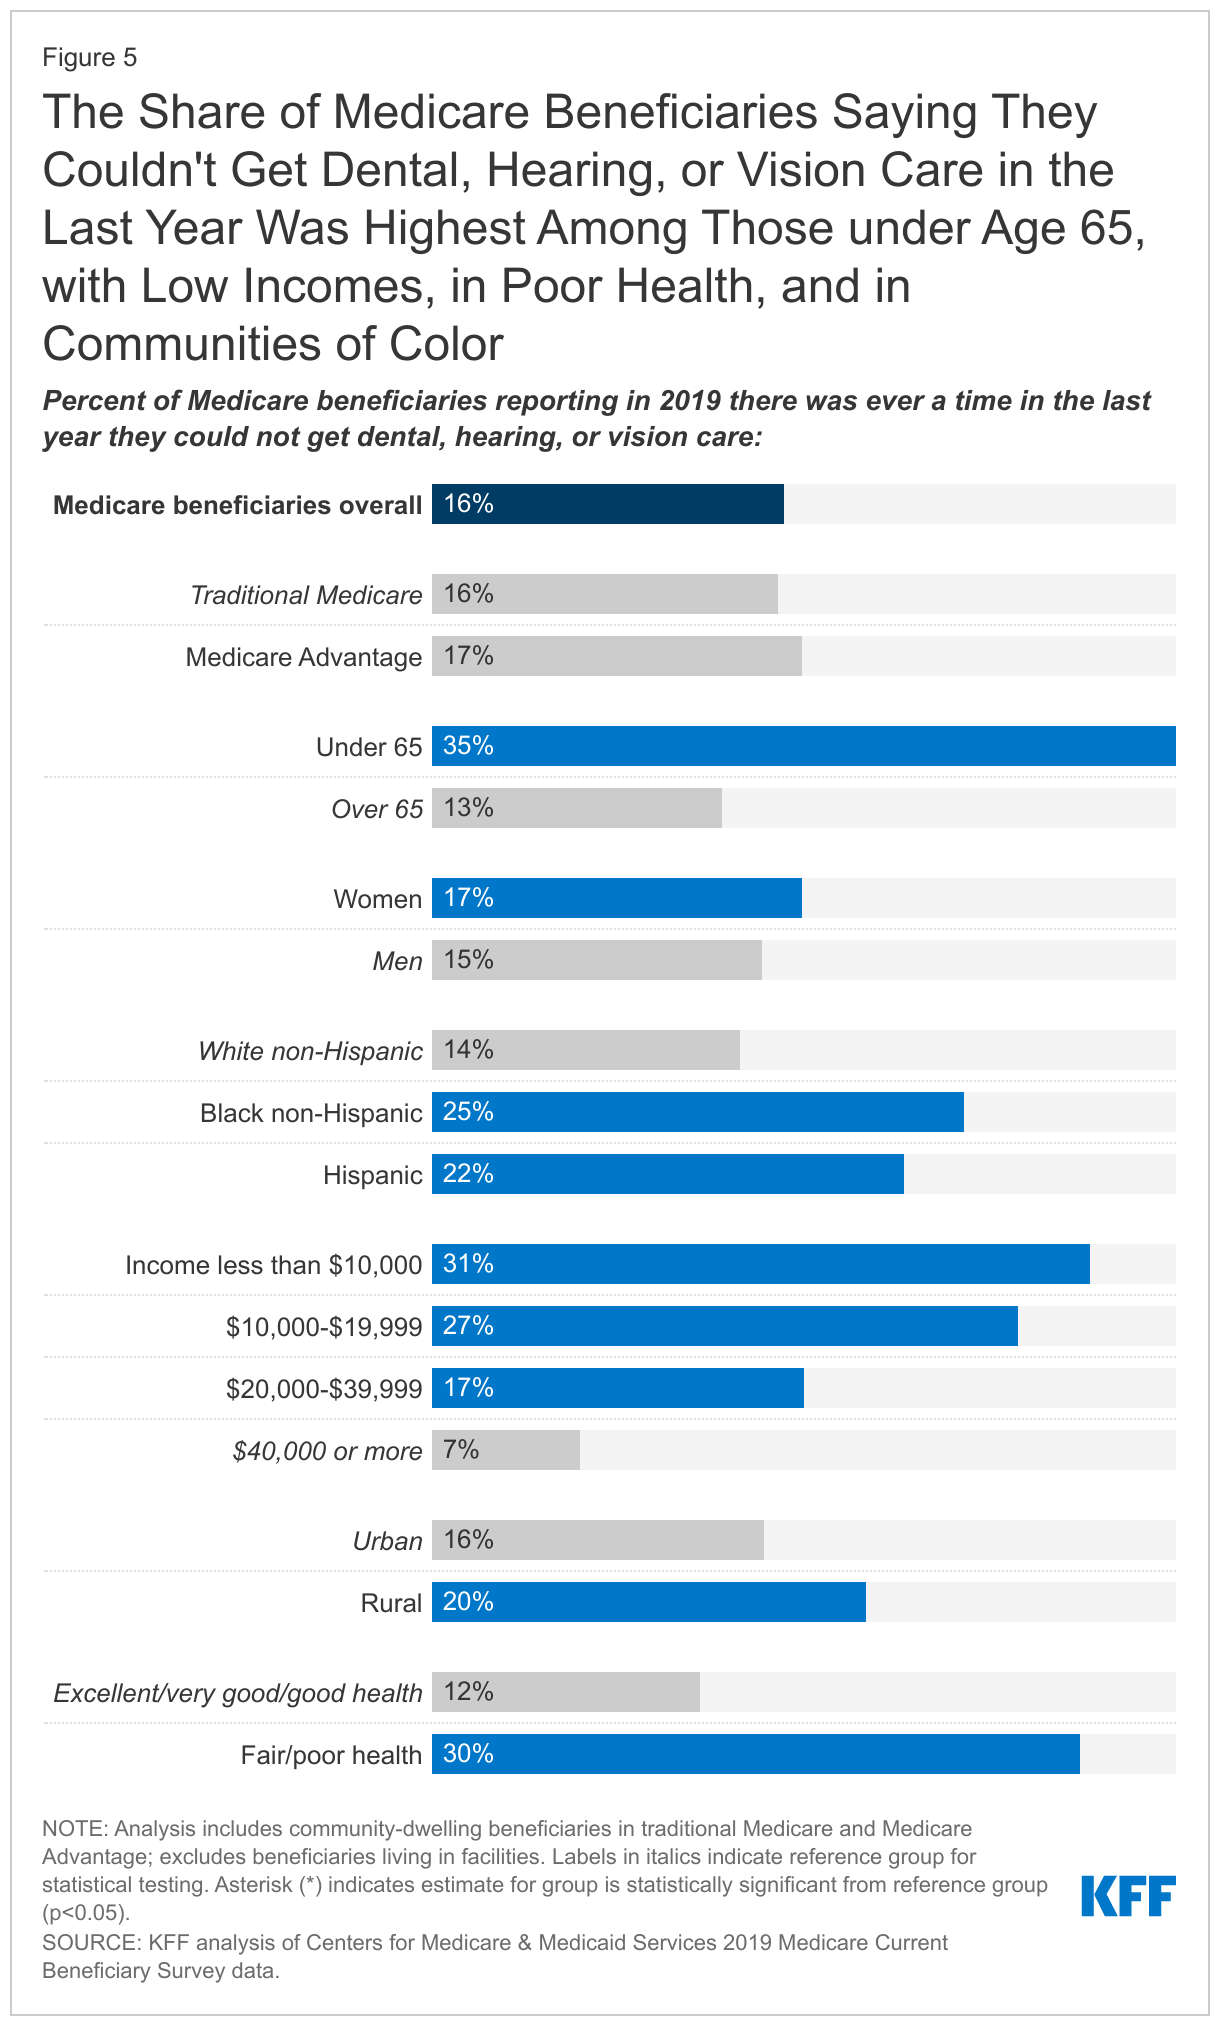
- Medicare beneficiaries more likely to report difficulty getting dental, hearing, or vision care include beneficiaries under age 65 with long-term disabilities (35%); with low incomes (e.g., 31% for those with income under $10,000); in fair or poor health (30%); enrolled in both Medicare and Medicaid (35%); Black and Hispanic beneficiaries (25% and 22%, respectively); and residing in rural areas (20%) (Figure 5).
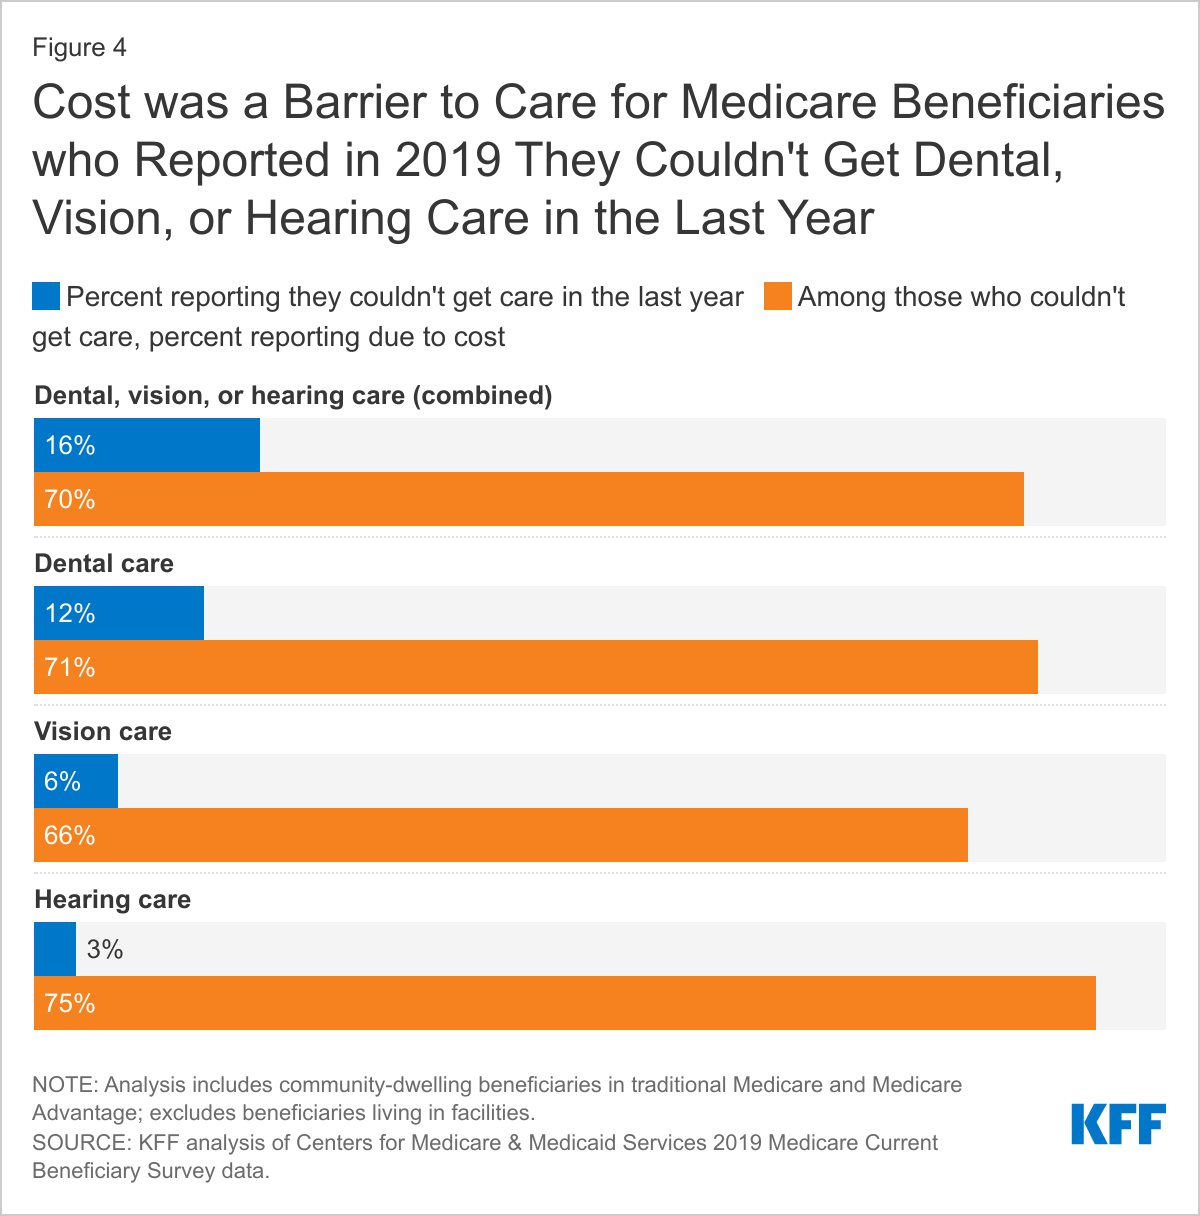
- Among the 16% of beneficiaries who said that there was a time in the last year that they could not get dental, hearing, or vision care, a majority (70%) said that it was due to cost (Figure 4). This includes 75% of those who couldn’t get hearing care, 71% of those who couldn’t get dental care, and 66% of those who couldn’t get vision care.
- Among beneficiaries in traditional Medicare and Medicare Advantage who reported access problems in the last year for dental, hearing, or vision care, roughly 7 in 10 beneficiaries in both groups said that cost was a barrier to getting these services (72% and 70%, respectively).
- Beneficiaries more likely to report cost as a barrier to dental, hearing, or vision care include those under age 65 with long-term disabilities (76%); with low incomes (e.g., 72% for those with incomes under $10,000); and in fair/poor health (75%).
What Dental, Hearing, and Vision Benefits Are Offered by Medicare Advantage Plans?
Most Medicare Advantage plans provide some coverage of routine dental, vision, and hearing benefits, unlike traditional Medicare. Plans can use rebate dollars – a portion of the difference between their bid to cover Medicare Parts A and B services and the benchmark – to provide supplemental benefits, such as dental, hearing, and vision benefits. Plans also use rebate dollars to lower enrollee cost sharing and reduce premiums, and for administrative expenses and profit. According to MedPAC, about 21% of rebate dollars in 2021, or $29 per enrollee per month, were used to cover supplemental benefits not covered by traditional Medicare.
Dental Benefits
In 2021, 94% of Medicare Advantage enrollees or 16.6 million people, are in a plan that offers access to some dental coverage. Virtually all Medicare Advantage enrollees have access to preventive dental benefits and most have access to more extensive dental benefits, according to a prior KFF analysis. Most enrollees with access to more extensive benefits are typically subject to annual dollar limits on coverage, which averages $1,300.
Among Medicare Advantage enrollees with access to dental coverage:
- Most (86%) of these enrollees are offered both preventive and more extensive dental benefits.
- More than three in four (78%) Medicare Advantage enrollees who are offered more extensive coverage are in plans with annual dollar limits on dental coverage, with an average limit of $1,300 in 2021. More than half (59%) of these enrollees are in a plan with a maximum dental benefit of $1,000 or less.
- Nearly two-thirds of Medicare Advantage enrollees (64%) with access to preventive benefits, such as oral exams, cleanings, and/or x-rays, pay no cost sharing for these services, though their coverage is typically subject to an annual dollar cap. The most common coinsurance for more extensive dental services, such as fillings, extractions, and root canals, is 50%.
- About 10% of Medicare Advantage beneficiaries are required to pay a separate premium to access any dental benefits. For additional and more detailed information about dental benefits offered by Medicare Advantage plans, see “Medicare and Dental Coverage: A Closer Look.”
Hearing Benefits
In 2021, 97% of Medicare Advantage enrollees or 17.1 million people, have access to a hearing benefit. Among these enrollees, virtually all (95%) are in plans that provide access to both hearing exams and hearing aids (either outer ear, inner ear, or over the ear). Hearing aid coverage is typically subject to annual dollar limits on coverage or frequency limits, with an average dollar limit of $960 and the most common frequency limit of one set of aids per year.
Among Medicare Advantage enrollees who have access to hearing coverage:
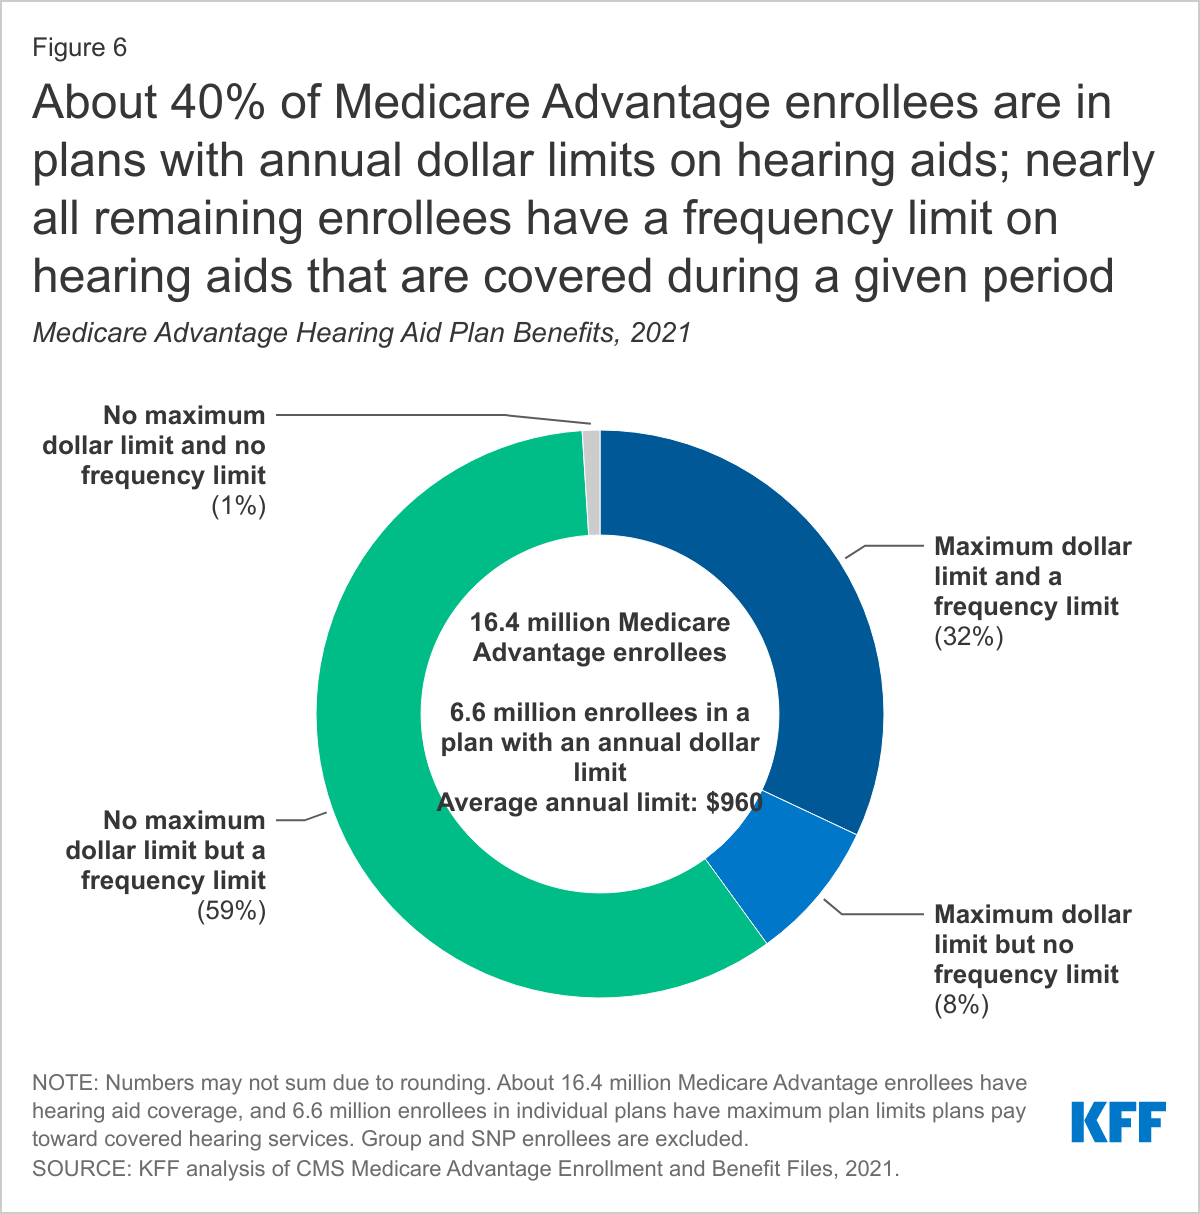
- Virtually everyone with hearing aid coverage is subject to either annual dollar limits on coverage, frequency limits on covered services, or both (Figure 6).
- Nearly a third (32%) of Medicare Advantage enrollees are in plans with a maximum dollar limit the plan will pay annually toward hearing aid coverage as well as frequency limits on hearing aid coverage; about 8% are in plans with maximum dollar limits, but do not have frequency limits. For those in plans with maximum annual dollar limits, the average limit is $960 in 2021, ranging from $66 up to $4,000.
- Nearly 6 in 10 enrollees (59%) are in plans that do not have maximum dollar limits on hearing aid coverage but do have a frequency limit on how often hearing aids are covered; 1% of enrollees have neither a maximum annual dollar limit nor a frequency limit on hearing aids.
- Medicare Advantage enrollees are often subject to limits in the frequency of obtaining certain covered hearing-related services.
- Among enrollees with access to hearing exams, virtually all enrollees (98%) are in plans that limit the number of hearing exams, with the most common limit being no more than once per year.
- Of the 69% of enrollees with access to fitting and evaluation for hearing aids, about 88% are in plans that have frequency limits on those services, with the most common limit being no more than once per year.
- Most enrollees (91%) are in plans with frequency limits on the number of hearing aids they can receive in a given period. The most common limit is one set (one for each ear) per year (58%), followed by one set every two years (28%), and one set every three years (14%).
- Hearing exams are often covered without cost sharing, but hearing aids are typically subject to cost-sharing requirements, and enrollees who do not face cost sharing for hearing aids are usually subject to annual dollar limits.
- Nearly three quarters of all enrollees (74%) are in plans that do not require cost sharing for hearing exams, while 11% of enrollees are in plans that report cost sharing for hearing exams, with the majority being copays, which range from $15 to $50. Data on cost sharing is missing for plans that cover the remaining 15% of enrollees (see Methods for more information).
- Of those enrollees with access to fitting and evaluations of hearing aids as part of their plan, more than half (61%) of enrollees are in plans that do not require cost sharing for these services. About 5% of enrollees are in plans that require cost sharing for fittings and evaluations, nearly all copays, which range from $15 to $50.
- About 60% of enrollees are in plans that require cost sharing for hearing aids, which can range from $5 up to $3,355. Nearly one quarter of enrollees (22%) pay no cost sharing for any type of hearing aid, but virtually all these enrollees are in plans with a maximum annual limit.
Vision Benefits
In 2021, 99% of Medicare Advantage enrollees or 17.5 million people, have access to some vision coverage. Among these enrollees, virtually all (93%) are in plans that provide access to both eye exams and eyewear (contacts and/or eyeglasses). Most enrollees do not pay cost sharing for eyewear, but nearly all vision coverage is subject to annual dollar limits on coverage, averaging $160.
Among Medicare Advantage enrollees who have access to vision coverage:
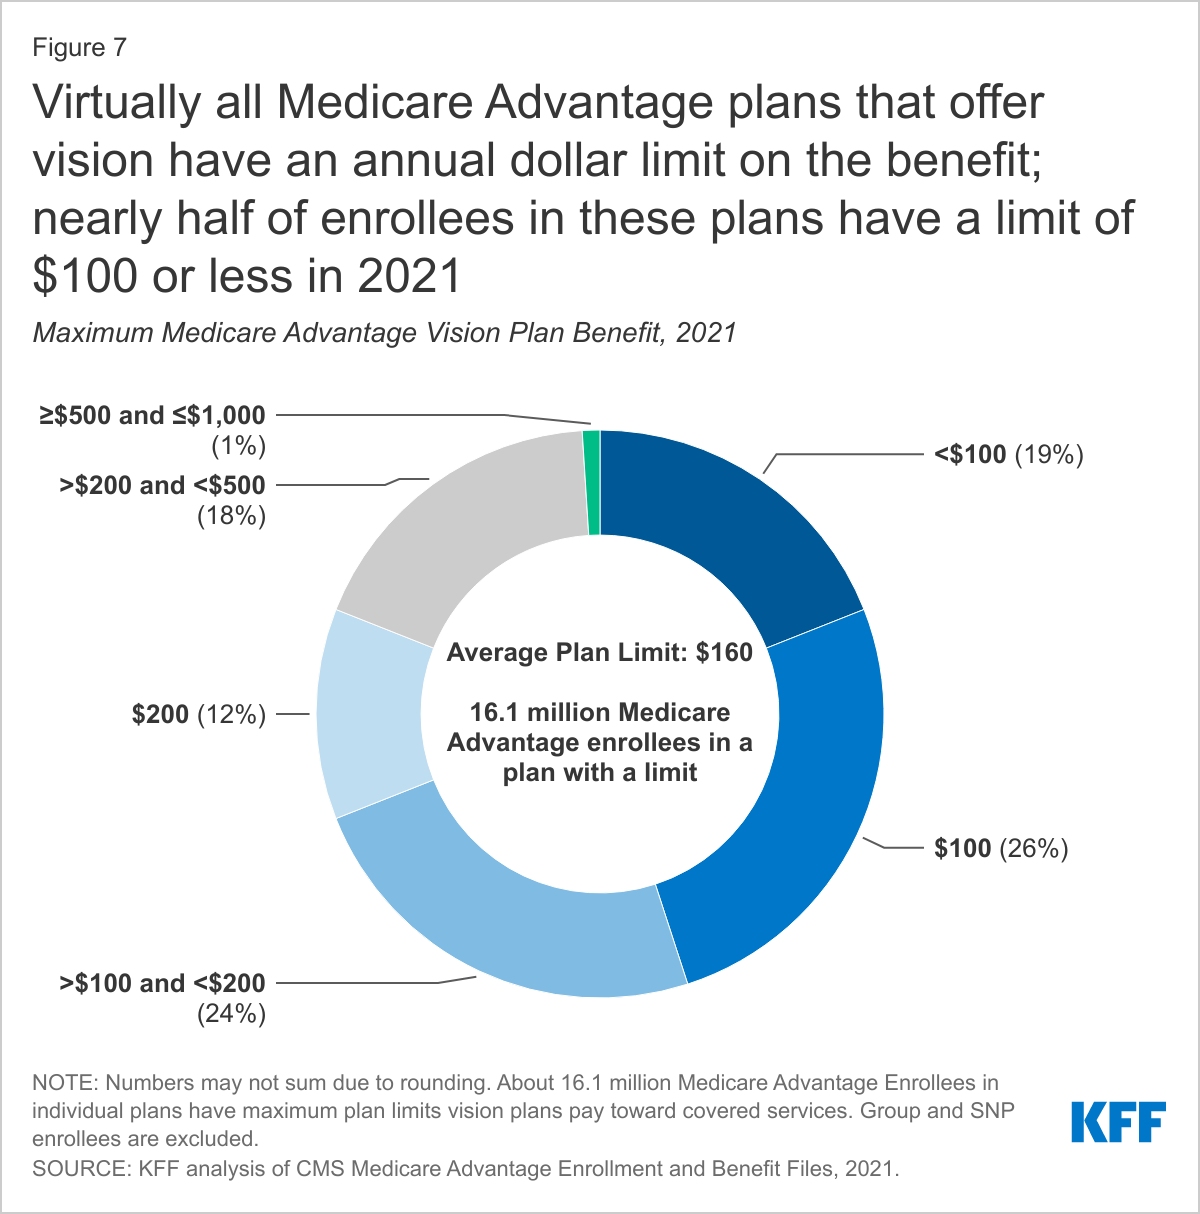
- Virtually all (99%) Medicare Advantage enrollees offered both eye exams and eyewear coverage are in plans with annual dollar limits on vision coverage, with an average limit of $160 in 2021. Nearly half (45%) of these enrollees are in a plan with a maximum vision care benefit of $100 or less (Figure 7).
- For vision benefits, Medicare Advantage enrollees are often limited in terms of the frequency of obtaining certain covered services.
- Among enrollees with access to eye exams, nearly all enrollees (94%) are in plans that limit the number of covered eye exams, with the most common limit being no more than once per year.
- More than half of enrollees (58%) in plans that cover eyeglasses are limited in how often they can get a new pair. Among those with a limit on eyeglasses, the most common limit is one pair per year (52%), followed by one pair every two years (47%).
- Among plans that cover contact lenses, one third of enrollees (33%) are in plans that have frequency limits on contact lenses, typically once per year.
- Virtually all enrollees in plans without quantity limits on eyeglasses or contact lenses are limited by an annual dollar cap, as noted above.
- Vision exams are often covered without cost sharing, and eyewear is also often covered without cost sharing but is always subject to annual dollar limits.
- Most enrollees (71%) pay no cost sharing for eye exams, while about 14% of enrollees are in plans that report cost sharing for eye exams, with virtually all requiring copays, ranging from $5 to $20. Data on cost sharing is missing for plans that cover the remaining 15% of enrollees.
- Around two-thirds of Medicare Advantage enrollees pay no cost sharing for eyeglasses or contact lenses (66% and 64% respectively), but all these enrollees are in plans that have an annual maximum dollar limit on coverage. About 2% of enrollees are in plans that require cost sharing for either eyeglasses or contacts, with nearly all requiring copays; these enrollees are also subject to an annual dollar cap.
In conducting this analysis of Medicare Advantage benefits, we found that plans do not use standard language when defining their benefits and include varying levels of detail, making it challenging for consumers or researchers to compare the scope of covered benefits across plans. Our analyses take into account benefits, as described in the Medicare Advantage Plan Benefit files, which includes annual limits on plan benefits, frequency limits on obtaining covered services, and cost-sharing requirements, but does not take into account plan restrictions that may affect access, such as type or model of hearing aids covered, type of eyeglasses or lenses covered (e.g. bifocals, graduated lenses), the extent to which prior authorization rules are imposed, or network restrictions on suppliers.
Discussion
While some Medicare beneficiaries have insurance that helps cover some dental, hearing, and vision expenses (such as Medicare Advantage plans), the scope of that coverage is often limited, leading many on Medicare to pay out-of-pocket or forego the help they need due to costs. Traditional Medicare generally does not cover routine dental, hearing, or vision services, and coverage for these services under Medicare Advantage varies.
Based on self-reported data, use of dental, hearing, and vision services ranges widely among Medicare beneficiaries overall, with just over half of all beneficiaries reporting that they used dental services in 2018, roughly one-third using vision services, and fewer than one in 10 using hearing services. While it is not the case that use of these services is indicated or required annually for everyone on Medicare, our analysis shows that vision and hearing difficulty is not uncommon among Medicare beneficiaries and cost prevented many beneficiaries in both traditional Medicare and Medicare Advantage plans who sought dental, hearing, or vision care from getting it in 2019.
Medicare Advantage plans are the leading source of dental coverage for people with Medicare, and a main source of coverage for hearing and vision. According to our analysis of plan benefit data, most Medicare Advantage plans provide access to these benefits; only 6% of enrollees are in plans that do not cover dental benefits, 3% are in plans that do not cover hearing exams and/or aids, and 1% are in plans that do not cover eye exams/glasses. While the scope of coverage varies across Medicare Advantage plans, there are some common features within each category. Nearly all Medicare Advantage enrollees with access to dental coverage have preventive benefits, and most have access to more extensive dental benefits, though cost sharing for more extensive services is typically 50% for in-network care, and subject to an annual cap on plan payments. Almost all Medicare Advantage enrollees have access to both hearing exams and hearing aid coverage; hearing aid coverage is subject to either a maximum annual dollar cap and/or frequency limits on how often plans cover the service. Virtually all Medicare Advantage enrollees have access to both vision exams and eyewear coverage, and this coverage is typically subject to maximum annual limits, averaging about $160 per year.
Policymakers are considering adding dental, hearing, and vision benefits to Medicare as part of the budget reconciliation bill – a change that would be the largest expansion of Medicare benefits since the Part D drug benefit was launched in 2006. These program improvements would lead to higher federal spending of $358 billion over 10 years (2020-2029), including $238 billion for dental and oral health care, $89 billion for hearing care, and $30.1 billion for vision care, according to a Congressional Budget Office estimate of the version of H.R.3 passed by the House in 2019. Additionally, in a July 2021 executive order, President Biden called for the Secretary of Health and Human Services to issue a proposed rule that would allow hearing aids to be sold over-the-counter, as allowed under the FDA Reauthorization Act of 2017 – a move that could help make hearing aids more affordable for people with hearing difficulties who may be foregoing purchasing them due to cost. Expanding Medicare coverage for dental, hearing, and vision services and making lower-cost hearing aids available would address significant gaps in coverage and could alleviate cost concerns related to these services for people on Medicare.
This work was supported in part by the AARP Public Policy Institute. We value our funders. KFF maintains full editorial control over all of its policy analysis, polling, and journalism activities.
Methods
Our analysis of dental, hearing, and vision out-of-pocket spending and cost-related barriers to care is based on data from the 2018 and 2019 Medicare Current Beneficiary Survey (MCBS). For the analysis of problems getting care due to cost, we relied on the 2019 MCBS Survey File topical segment “Access to Care, Medical Appointments” (ACCSSMED) to identify community-dwelling beneficiaries who reported that they couldn’t get dental, hearing, or vision care in the last year because of cost. This analysis was weighted to represent the ever-enrolled population, using the ACCSSMED topical segment weight ‘ACSEWT’.
Respondents were coded as having hearing difficulty if they reported having “a little trouble hearing”, “a lot of trouble hearing”, or deafness/serious difficulty hearing.
Respondents were coded as having vision difficulty if they reported having “a little trouble seeing”, “a lot of trouble seeing”, blindness, or blindness/difficulty seeing even with glasses. This analysis was weighted to represent the ever-enrolled population, using the weight ‘EEYRSWGT’.
For the analysis of out-of-pocket spending on dental, hearing, and vision services, we relied on the 2018 MCBS Cost Supplement data, which includes survey-reported events for these services since they are generally not Medicare-covered services and therefore there are no Medicare claims. We identified dental events based on the Dental segment, and vision and hearing events using the Medical Provider Events (MPE) segment. We subset the file to beneficiaries with hearing events, which were identified as medical provider specialty events for an audiologist or hearing therapist or where the type of event was for a hearing or speech device or a hearing aid, and beneficiaries with vision events, which were identified as medical provider specialty events for an optometrist or where the type of event was for eyeglasses. We analyzed out-of-pocket spending on dental, hearing, and vision services (separately) among community-dwelling beneficiaries overall, and among the subset of community-dwelling beneficiaries who were coded as having a dental, vision, or hearing event. This analysis was weighted to represent the ever-enrolled population, using the Cost Supplement weight ‘CSEVRWGT’. We also analyzed out-of-pocket spending among community-dwelling beneficiaries who reported having difficulty hearing or difficulty seeing.
The Medicare Advantage Enrollment and Benefit files for 2021 were used to look at dental, hearing, and vision coverage for beneficiaries enrolled in individual Medicare Advantage plans (e.g., excludes Special Needs Plans, employer-group health plans, and Medicare-Medicaid Plans (MMPs)). This analysis includes enrollees in the 50 states, Washington D.C., and Puerto Rico. Plans with enrollment of 10 or fewer people were also excluded because we are unable to obtain accurate enrollment numbers. For cost-sharing amounts for dental, vision, and hearing coverage, many plans do not report these figures, and in cases where enrollee cost sharing does not add up to 100%, it is due to plans not reporting this data. Due to data limitations, we examine benefits offered, but are unable to analyze the extent to which enrollees in Medicare Advantage plans use supplemental benefits specifically offered by their plan, such as dental, hearing and vision, because encounter data for these benefits are not available. It is also unclear from the plan Benefit files the extent to which plans limit the type of eyeglasses or hearing aids, impose network restrictions or prior authorization.