Medicaid Home & Community-Based Services: People Served and Spending During COVID-19
Key Takeaways
The COVID-19 pandemic brought new focus to the long-standing unmet need for home and community-based services (HCBS) among seniors and people with disabilities and direct care workforce shortages. Recognizing Medicaid’s role as the primary payer for HCBS, the American Rescue Plan Act (ARPA) temporarily increased federal funding to support Medicaid HCBS. The Build Back Better Act, passed by the House in November 2021, would provide $150 billion in new federal funds for Medicaid HCBS, including a permanent increase in the federal matching rate. This issue brief presents FY 2020 state-level data on the number of people receiving Medicaid HCBS and HCBS spending. This is the latest data available, and the first since the onset of the COVID-19 pandemic. The data were collected in KFF’s 19th survey of state officials administering Medicaid HCBS programs in all 50 states and DC. A related brief presents the latest data and highlights themes in key state policy choices about optional HCBS. Key findings include the following:
- Nationally, 3.0 million people receive HCBS through waivers, and over 2.5 million people receive HCBS as part of the state plan benefit package (primarily home health and personal care services). The data do not allow us to present a total number of people who receive HCBS because some people receive services through both waivers and state plan benefits. Most people receiving HCBS get services that are provided at state option, which results in substantial variation among states.
- If passed, the BBBA would provide states with permanent enhanced federal matching funds for HCBS, which could allow them to serve more people. States may be more likely to increase the number of people receiving waiver services (which can be capped) if they know they can count on enhanced federal funds without an expiration date. The new funding also could enable states to offer optional services that they do not currently provide. To receive BBBA funds, states would have to assess the current availability of HCBS and identify access barriers to address.
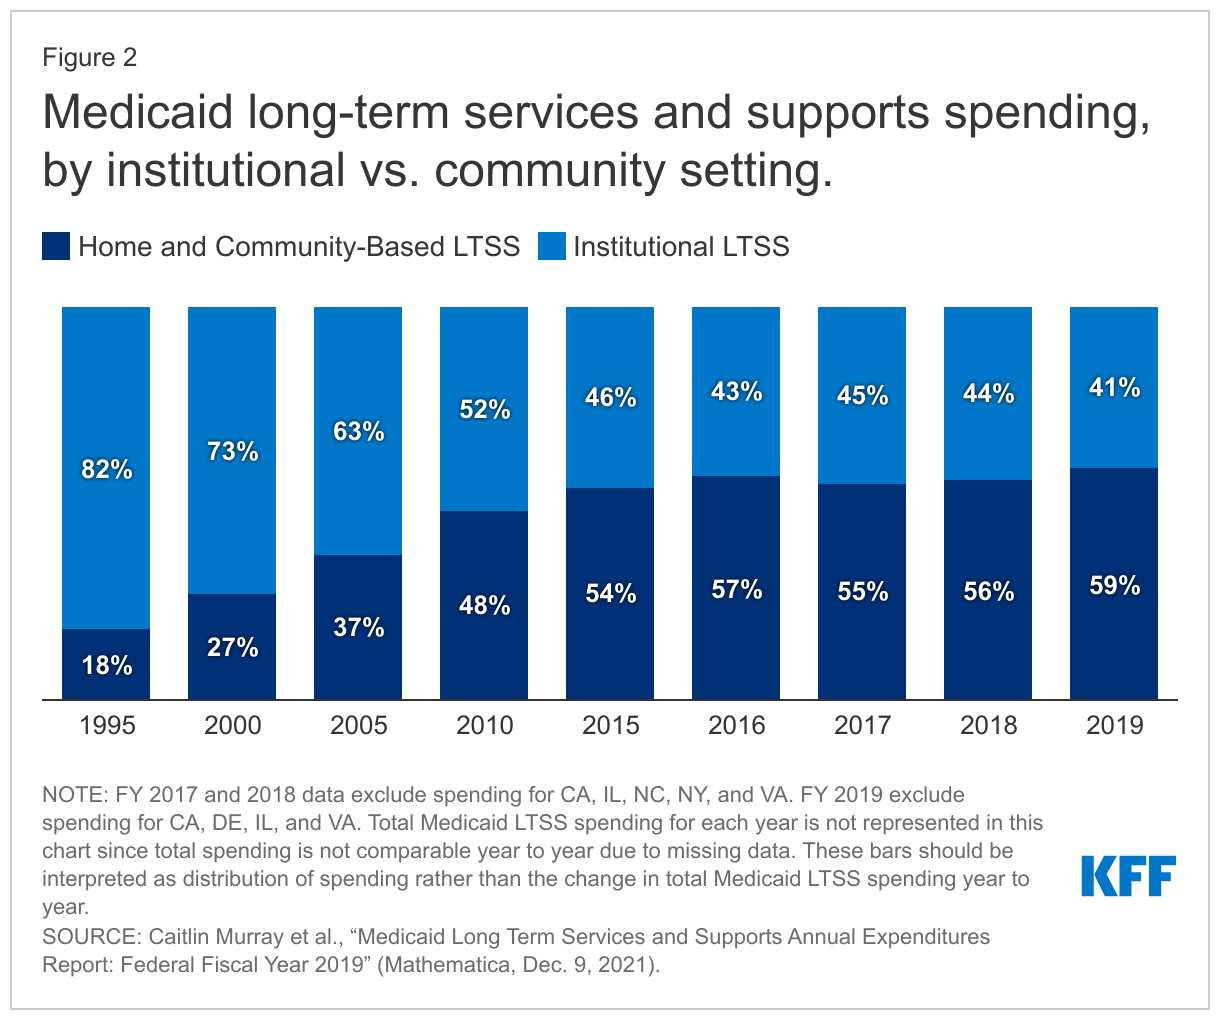
- Joint federal and state Medicaid HCBS spending totaled $116 billion in FY 2020, with the vast majority (96%) for optional services. Waivers continue to comprise the majority of people receiving HCBS and spending. Among waiver target populations, spending for people with intellectual and developmental disabilities (I/DD) is disproportionate to the number of people served because per person costs for this population ($48,900) are higher than per person costs for seniors and adults with physical disabilities ($17,600). Under federal law, services in nursing homes are mandatory, but most HCBS are optional. According to other data, in FY 2019, spending on HCBS accounted for 59% of total Medicaid long-term services and supports (LTSS) spending. The trend toward increased HCBS spending has occurred over the last decade, and interest in expanding HCBS as an alternative to institutional LTSS has increased due to the pandemic.
- As passed by the House, BBBA would provide states with an additional six percentage points on their current federal matching rate for HCBS, an estimated $150 billion in new federal funds over 10 years. Increased federal funds without an expiration date could allow states to make longer term investments needed to expand HCBS (by serving more people and/or offering additional services) and support the direct care workforce (by increasing provider payment rates and requiring providers in turn to raise worker wages and supporting worker training).
Looking ahead, the COVID-19 pandemic and the aging population are expected to continue to influence Medicaid HCBS. Substantial variation in state HCBS eligibility, spending, and benefits persists across states. Over the past year, states have received temporary enhanced federal HCBS funding from the ARPA. Permanent enhanced funding for Medicaid HCBS, passed by the House and pending consideration in Senate in the Build Back Better budget reconciliation package, could support state efforts to not only recover from the pandemic but also improve the HCBS delivery infrastructure and expand services to fill existing and anticipated unmet needs. FY 2020 data about the number of people receiving HCBS and HCBS spending may be the baseline from which to assess the impact of ARPA, and if passed, Build Back Better Act, funds in terms of both expanding the number of people served and expanding the scope of services for people already receiving some HCBS who may still have unmet needs.
Issue Brief
Introduction
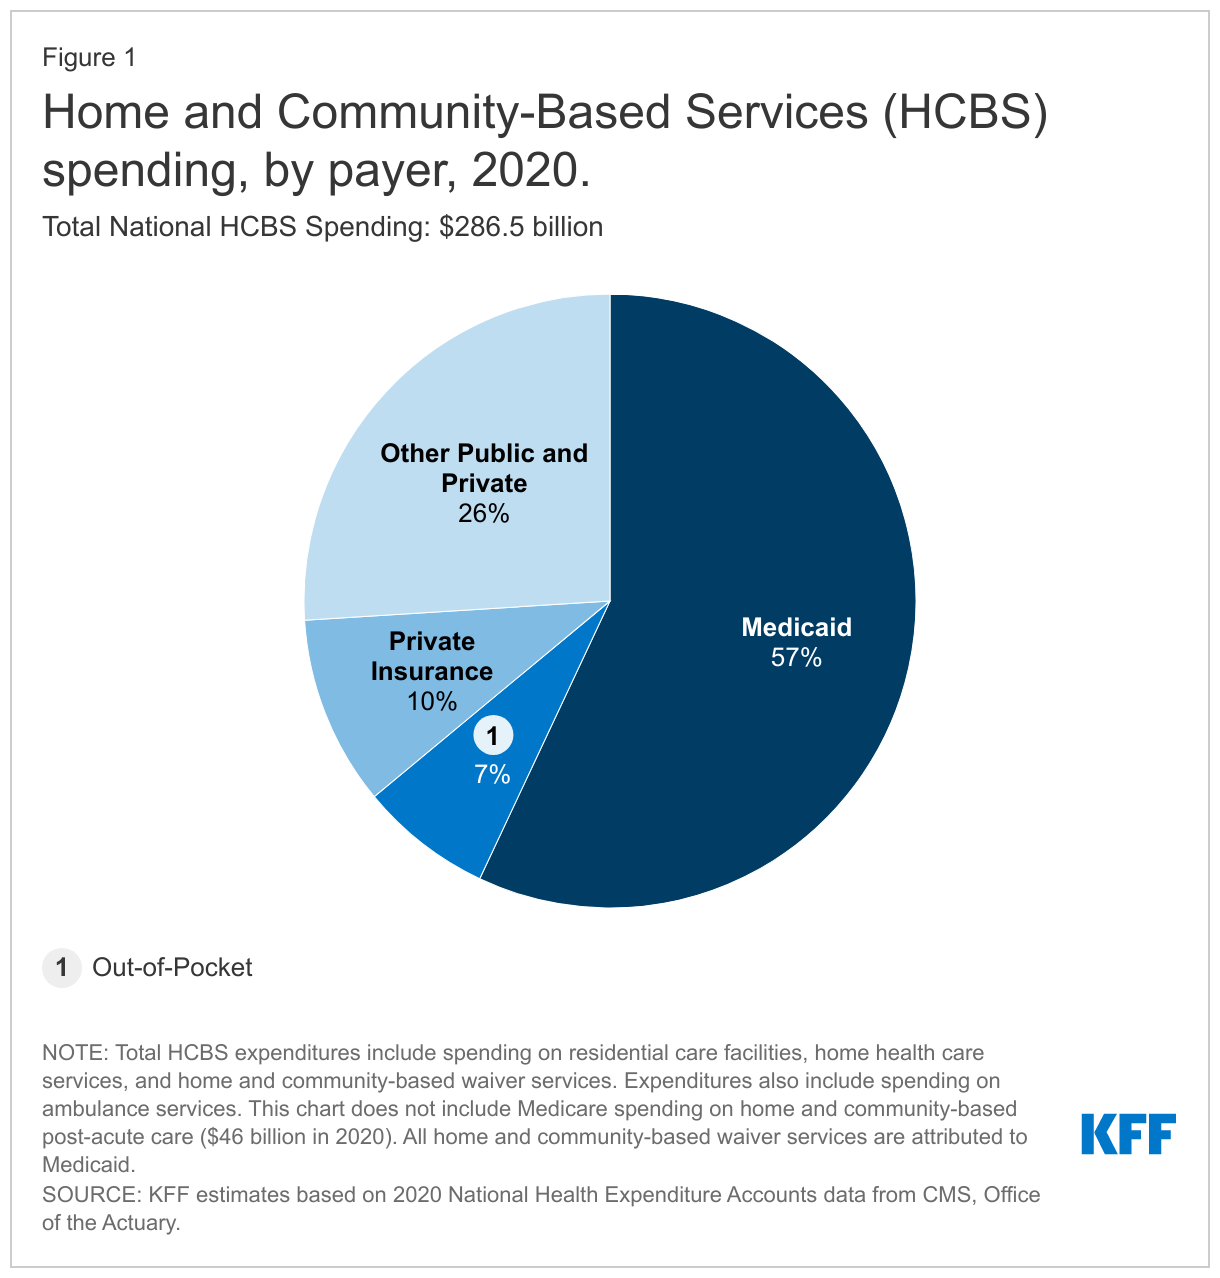
The COVID-19 pandemic has disproportionately affected seniors and people with disabilities who rely on long-term services and supports (LTSS) to meet daily self-care and independent living needs and the direct care workers who provide these services. As the primary source of funding for home and community-based services (HCBS), state Medicaid programs have faced long-standing challenges related to the aging population, direct care workforce shortages, and an insufficient supply of affordable accessible housing. All of these challenges pre-dated and have been intensified by the pandemic. At the same time, existing financing sources have been insufficient to meet the need for HCBS. In an October 2021 KFF poll, 18% of adults said that they or a family member need new or additional support from paid nurses or aides beyond what they currently receive. Cost is the most common reason cited by people who have not received needed support. Private insurance and out-of-pocket spending account for small shares of HCBS financing compared to Medicaid (Figure 1),1 and Medicare coverage is limited to short-term post-acute — not long-term — care.
Though Medicaid finances the majority of HCBS, the optional nature of most aspects of Medicaid HCBS eligibility and benefits results in substantial variation across states. State Medicaid programs must cover LTSS in nursing homes, while nearly all HCBS are optional. States have made significant shifts in addressing this historical bias toward institutional LTSS, with spending on HCBS surpassing spending on institutional care for the first time in FY 2013.2 The rate of the increase in the share of LTSS spending devoted to HCBS appears to have slowed in FY 2017 and FY 2018, at least in part due to the omission of data from some states.3 HCBS account for 59% of LTSS spending in FY 2019, the highest share to date, though the national data mask notable state-level variation (Figure 2).4
This issue brief presents FY 2020 state-level data on the number of people receiving Medicaid HCBS and HCBS spending. This is the latest data available, and the first since the onset of the COVID-19 pandemic. The data were collected in KFF’s 19th survey of state officials administering Medicaid HCBS programs in all 50 states and DC, fielded from March through August 2021.5 An earlier brief presented survey findings about state policies adopted in response to the pandemic and the pandemic’s impact on people receiving Medicaid HCBS and providers. A related brief presents the latest data and highlights themes in 10 key state policy choices about optional HCBS.
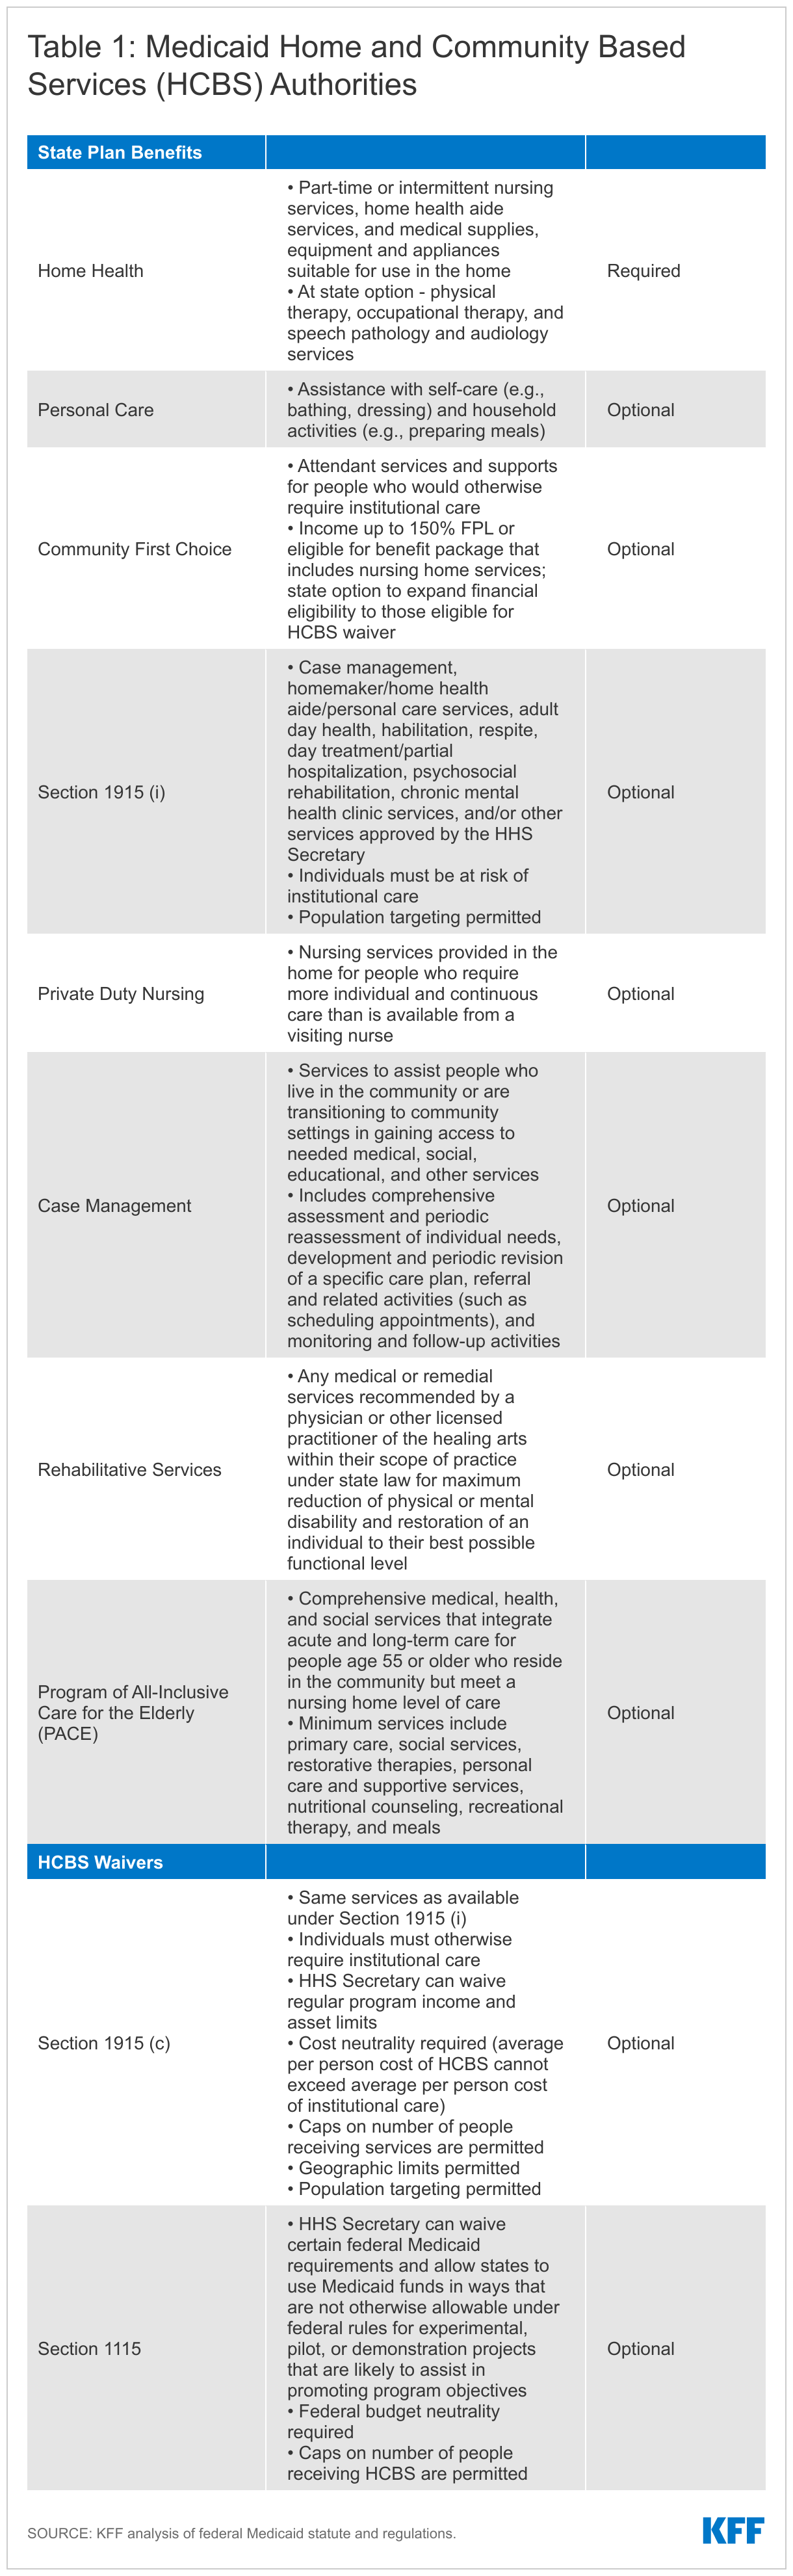
Overall, 47 states responded to this year’s survey, though response rates for particular questions varied.6 Prior years’ data is used to supplement missing data for states that did not submit complete survey responses, as indicated in the Table Notes. In the few instances where prior years’ data is unavailable, we indicate when state-level data are omitted from totals. The survey findings encompass four Medicaid HCBS state plan benefits (home health, personal care, Section 1915 (i), and Community First Choice (CFC)) and two waiver authorities (Section 1915 (c) and Section 1115).7 Table 1 describes each HCBS authority, and Appendix Tables 1 through 6 contain detailed state-level data to accompany our findings.
This year, we expanded the scope of the survey to include four additional state plan HCBS benefits: private duty nursing, case management, rehabilitative services, and Program for All-Inclusive Care for the Elderly (PACE). These benefits account for a smaller share of people receiving Medicaid HCBS and spending compared to the benefits traditionally encompassed in our survey, yet they contribute to a more complete picture of Medicaid’s role in providing HCBS for seniors and people with disabilities. While we do not include these additional benefits in our main survey findings due to incomplete responses, Appendix Tables 7 through 10 provide state-level data about the number of people receiving these services and spending for states that responded to the new questions.
How Do People Access Medicaid HCBS?
There are multiple pathways through which seniors and people with disabilities can receive Medicaid HCBS. Depending on states’ choices about which optional Medicaid eligibility pathways and benefits to offer, some people may have their HCBS needs met through the state plan benefit package alone, while others may need to access a waiver.
Traditionally, Medicaid benefits are provided through the state plan benefit package, which can include HCBS. Nearly all HCBS (except home health state plan services) are offered at state option. States can choose to provide a variety of HCBS -- such as personal care to help with bathing or preparing meals, therapies to help people regain or acquire self-care and independent living skills, and assistive technology – in their state plan benefit package. People can gain access to state plan benefits, including HCBS, through Medicaid eligibility pathways based on low income (including the ACA Medicaid expansion), old age, or disability. State plan benefits are provided to all Medicaid enrollees for whom they are medically necessary.8 Table 1 below describes the various HCBS benefit types.
States also can use waivers to provide Medicaid HCBS. HCBS waivers allow states to expand financial eligibility for HCBS and offer an HCBS benefit package targeted to a specific population, such as people with intellectual or developmental disabilities (I/DD) or people with physical disabilities. Unlike state plan benefits, waivers allow states to limit the number of people served.
How Many People Receive Medicaid HCBS?
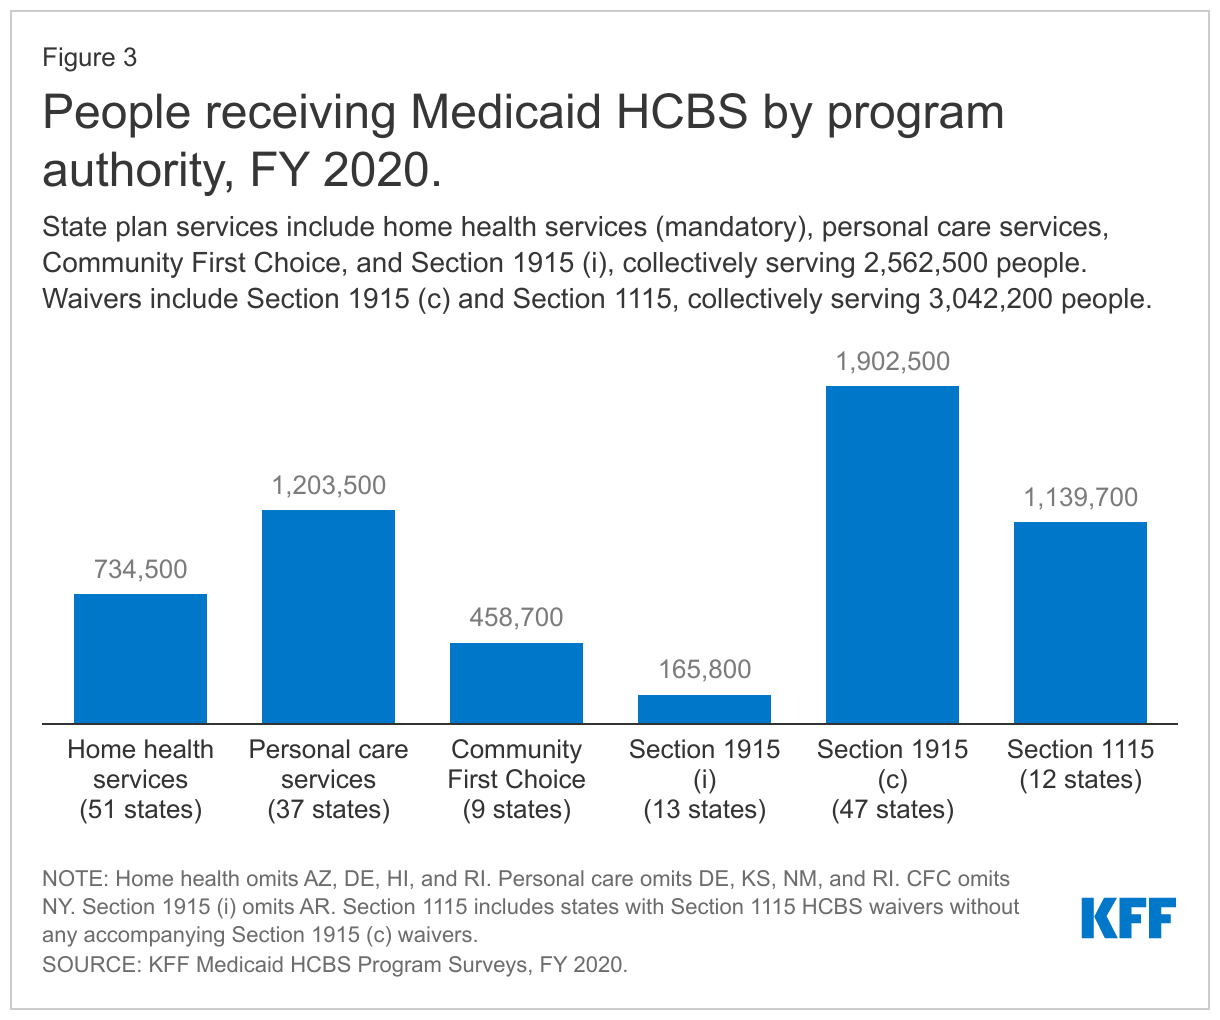
The vast majority of people receiving Medicaid HCBS receive benefits provided at state option. The number of people receiving Medicaid HCBS ranges from nearly 166,000 receiving Section 1915 (i) state plan services to 1.9 million receiving Section 1915 (c) waiver services (Figure 3 and Appendix Table 1).9 The total number of people receiving HCBS across all authorities is not presented because individuals may receive services under more than one authority. Among the state plan HCBS authorities, the greatest number of people receive personal care services, followed by home health services.10 Waivers continue to be the most commonly used optional HCBS authority, with all states offering at least one HCBS waiver. Personal care services are the most commonly offered HCBS state plan option. Fewer states offer Section 1915 (i) or CFC (Figure 3 and Appendix Table 1).
How Much Does Medicaid Spend on HCBS?
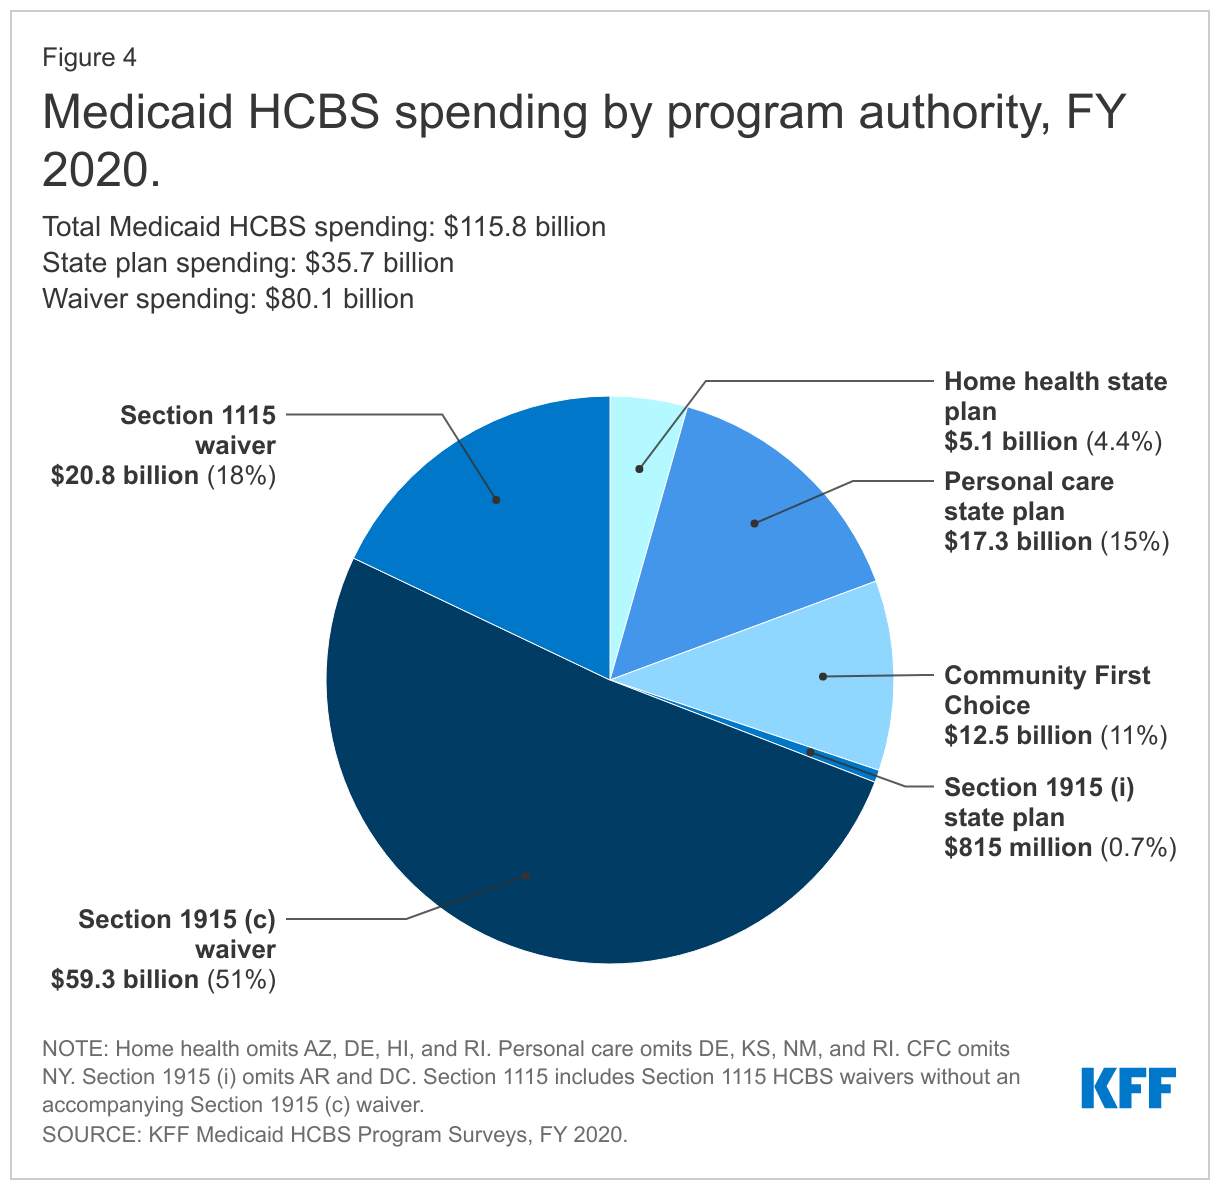
Services provided at state option account for nearly all HCBS spending, with just four percent of total HCBS spending devoted to mandatory home health state plan services.11 Medicaid HCBS spending totaled nearly $116 billion in FY 2020 (Figure 4 and Appendix Table 2).12 Waivers make up over two-thirds of total HCBS spending, while spending under a state plan authority is under one-third of total HCBS spending.13 Among the state plan HCBS authorities, personal care services and CFC account for the largest shares of spending (Figure 4).
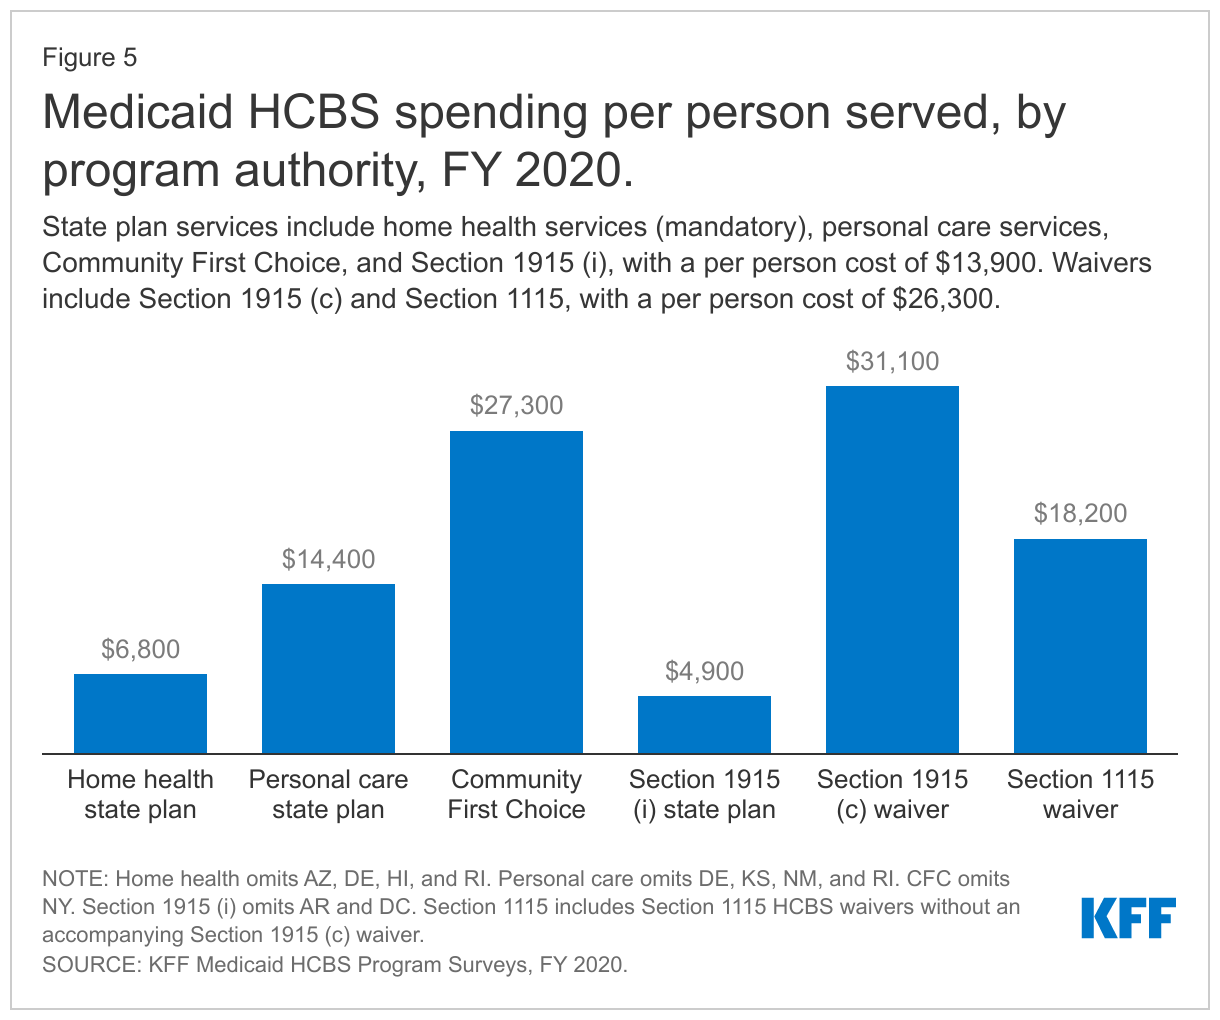
Per person spending varies among the different HCBS authorities, with per person spending for Section 1915 (c) HCBS waivers generally higher than per person spending for state plan HCBS (Figure 5 and Appendix Table 3). HCBS waivers generally have a higher per person cost compared to state plan HCBS because waivers include a benefit package with multiple types of services as opposed to the single type or narrower range of services typically provided in a state plan category. Additionally, waivers generally require individuals receiving services to meet an institutional level of care and therefore are likely to serve people with more extensive, and costlier, needs. Per person spending for CFC state plan services is similar to per person spending for waivers, likely reflecting the greater intensity of these attendant services compared to other types of state plan HCBS. Relatively lower per person spending on home health state plan services compared to other authorities may reflect shorter periods of utilization compared to people receiving Section 1915 (c) waiver services who typically do so over an extended period, due to chronic long-term needs.
How Have HCBS Changed from FY 2019 to FY 2020?
Nationally, there was modest spending growth and modest changes in the number of people receiving HCBS from FY 2019 to FY 2020, though some states experienced larger changes. States that experienced changes frequently attributed them to the COVID-19 pandemic. Some states cited the pandemic as driving increases in the number of people served and/or spending on state plan HCBS, while other states identified the pandemic as contributing to decreases in these areas. States identified a growing senior population and the pandemic as driving increases in the number of people served and/or spending in HCBS waivers. Very few states identified downward pressures leading to decreases in the number of people served or spending in HCBS waivers.
States that experienced growth in the number of people served and/or spending in HCBS waivers from FY 2019 to FY 2020, and provided an explanation for the change include the following:
- Pennsylvania added 32,000 new people to its Section 1915 (c) waiver serving seniors and non-elderly adults with physical disabilities, leading to a 28% increase in people served and a 39% increase ($2.1 billion) in spending.
- Washington’s Section 1115 HCBS waiver grew by 800 people (27%) and spending increased by $9.6 million (41%), attributed to a growing senior population and the pandemic.
- Delaware experienced a 16% increase (258 people) in the number of people served in its Section 1915 (c) waiver for people with I/DD, as a result of expanding eligibility to individuals living with family members at home. Delaware also attributed a 12% increase ($18.6 million) in spending for this waiver to an increased need for behavioral support services.
- New Jersey increased the number of people served by 10% (2,700) in its Section 1115 HCBS waiver serving seniors, non-elderly adults with physical disabilities, and people with I/DD. Despite the increase in the number of people served, spending growth was negligible.
- New York added 29,000 new people (7%) to its Section 1115 HCBS waiver serving seniors, non-elderly adults with physical disabilities, and people with I/DD. This resulted in a 17% increase ($1.6 billion) in spending.
States that experienced an increase in the number of people served and/or spending for state plan HCBS from FY 2019 to FY 2020, and provided an explanation for the change include the following:
- Idaho added 11,900 people receiving Section 1915 (i) HCBS (22%), citing population growth, adoption of the ACA Medicaid expansion, the COVID-19 public health emergency (PHE), and increased need for behavioral health services for children with serious emotional disturbance.
- Ohio had 6,000 more people receiving Section 1915 (i) services (32%), due to increased provider and community awareness and increased need due to a high prevalence of chronic conditions and severe and persistent mental illness.
States that experienced a decrease in the number of people served and/or spending for state plan HCBS from FY 2019 to FY 2020, and provided an explanation for the change include the following:
- Iowa had 2,000 fewer people receiving state plan home health services (-14%) and 200 fewer people receiving Section 1915 (i) services (-2%), attributed to the pandemic and direct care workforce shortages which decreased in-home service utilization.
- Nevada had 1,300 fewer people receiving home health state plan services (-82%), noting that individuals sought to decrease services due to fear of infection during the pandemic.
How Many People Are Served and How Much is Spent, by Target Population?
There are two HCBS authorities that allow states to target services to a specific population of seniors and/or people with disabilities (Table 1). States use Section 1915 (c) waivers to offer an HCBS benefit package targeted to a specific population who would otherwise need institutional services.14 The Section 1915 (i) state plan option allows states to offer an HCBS benefit package targeted to a specific population who has functional needs that are less than an institutional level of care. Below, we present findings about the number of people served and spending for these authorities by target population.
Section 1915 (c) Waivers
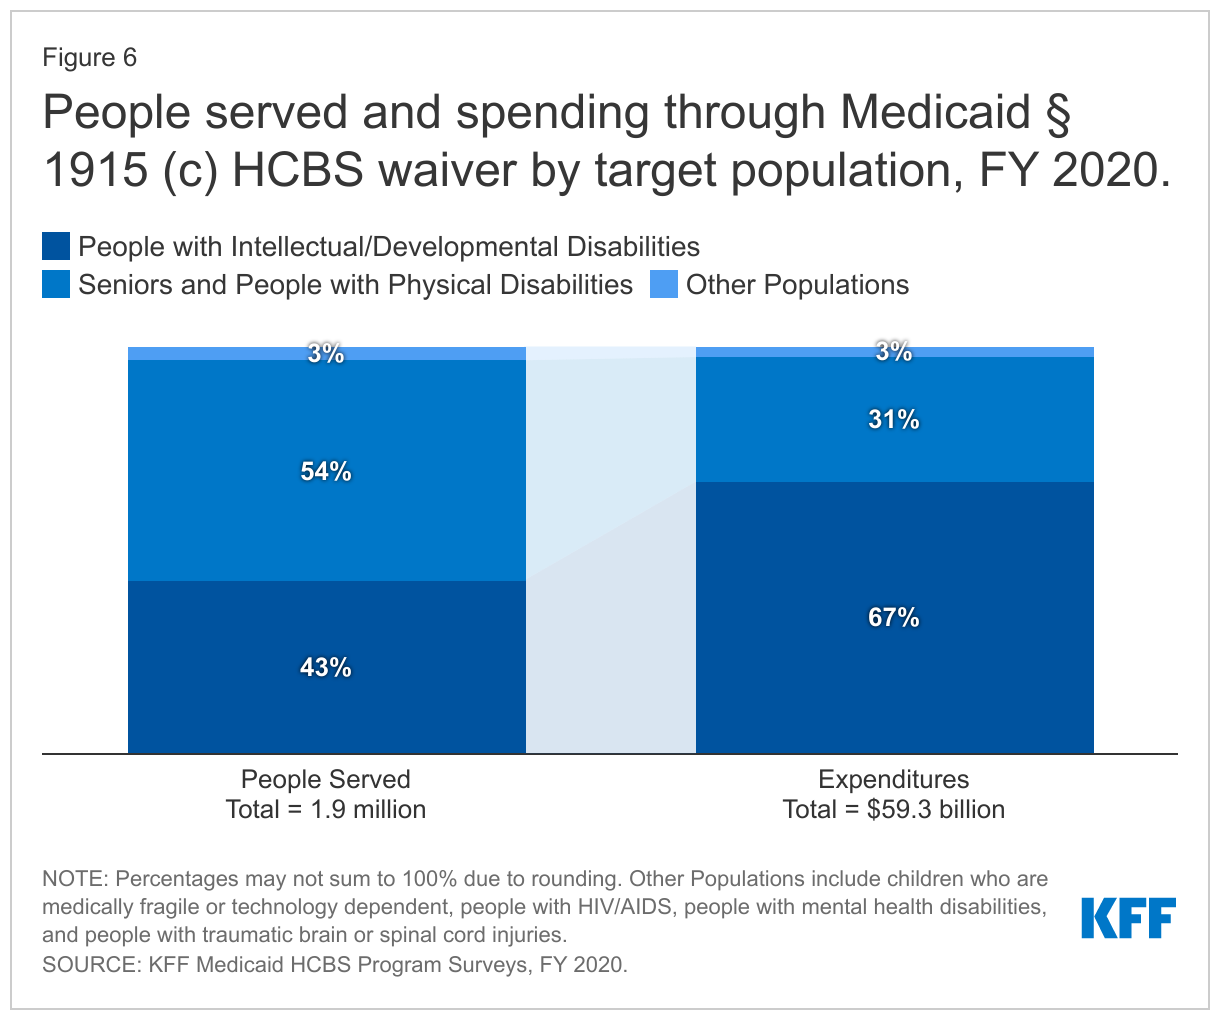
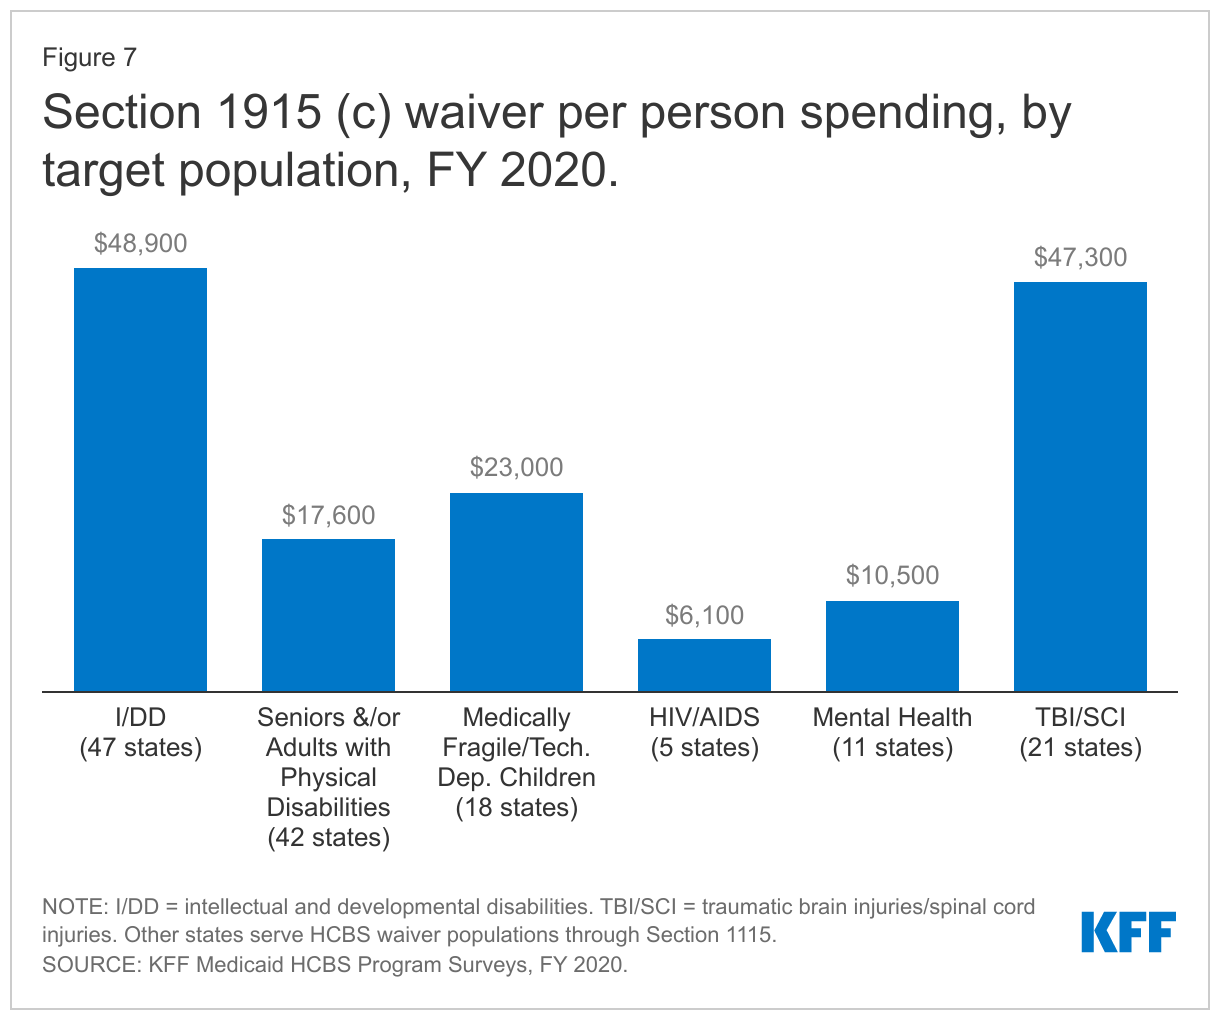
People with I/DD, seniors, and people with physical disabilities account for the vast majority of people receiving services and spending in Section 1915 (c) waivers. However, because per person spending for people with I/DD is more than two and one-half times higher than per person spending for seniors and adults with physical disabilities, the I/DD population accounts for a disproportionately high share of total Section 1915 (c) waiver spending (67%), compared to the share of people with I/DD receiving Section 1915 (c) services (43%) (Figure 6 and Appendix Tables 4 and 5).15 Spending for people with I/DD is consistently disproportionate to the number of people served as a result of their generally more intensive needs. By contrast, seniors and people with physical disabilities comprise over half of all people receiving Section 1915 (c) waiver services and 30 percent of spending.16 Per person spending for other waiver populations varies, led by over $47,000 for people with traumatic brain or spinal cord injuries (TBI/SCI),17 with relatively lower amounts for children who are medically fragile or technology dependent,18 people with HIV/AIDS,19 and people with mental health disabilities20 (Figure 7 and Appendix Table 6). However, these four groups combined represent a small share of people receiving Section 1915 (c) waiver services and spending.
Section 1915 (i) State Plan Option
People with I/DD, primarily in California, account for the majority of both people receiving services and spending in the 13 states offering the Section 1915 (i) state plan option.21 Similar to the pattern in Section 1915 (c) waivers, per person spending for people with I/DD receiving Section 1915 (i) services is more than twice as high ($5,400) as per person spending for seniors and adults with physical disabilities ($2,400). However, unlike Section 1915 (c) waivers, seniors and adults with physical disabilities account for very small shares of people receiving Section 1915 (i) services and spending.22 People with mental health disabilities are the second largest target population of those receiving services and spending under Section 1915 (i), with per person spending at $3,600.23 Ohio serves the largest number of individuals (25,000) with mental health disabilities through Section 1915 (i), while Iowa comprises most of the spending for this population ($110 million). Lower per person spending for Section 1915 (i) state plan HCBS compared to Section 1915 (c) waivers could reflect a more limited scope benefit package and/or the fact that people receiving Section 1915 (i) services have fewer and/or less intensive needs (less than an institutional level of care) than those receiving Section 1915 (c) waiver services (who must meet an institutional level of care).
Looking Ahead
While there was modest spending growth and modest changes in the number of people receiving HCBS nationally from FY 2019 to FY 2020, some states experienced larger changes. States that experienced changes attributed them to the COVID-19 pandemic and resulting PHE, along with an aging population. Both of these factors are expected to continue to influence Medicaid HCBS, as states respond to the pandemic’s ongoing effects and look ahead to the eventual unwinding of PHE emergency authorities and the growing unmet need for HCBS. Across states, substantial variation persists in optional policy choices related to HCBS and in the share of LTSS spending devoted to HCBS compared to institutional care.
Congress has provided states with temporary enhanced federal funds for Medicaid HCBS, which can help states respond to the pandemic, though states’ ability to make longer-term systemic changes to expand HCBS and the direct care workforce may depend on whether Congress adopts a permanent federal funding increase for HCBS. The American Rescue Plan Act (ARPA), passed in March 2021, provides states with temporary enhanced federal HCBS funding, available for 12 months. The Build Back Better budget reconciliation package would provide $150 billion in new federal funds for Medicaid HCBS, including a permanent increase in federal matching funds for HCBS. This legislation was passed by the House in November 2021, but its future remains uncertain in the Senate. Permanent enhanced funding for Medicaid HCBS, if authorized by Congress, could support state efforts to not only recover from the pandemic but also improve the HCBS delivery infrastructure and expand services to fill existing unmet needs and prepare to serve the growing aging population. FY 2020 data about the number of people receiving HCBS and HCBS spending may be the baseline from which to assess the impact of ARPA, and if passed, the Build Back Better Act, HCBS funds in terms of both expanding the number of people served and expanding the scope of services for people already receiving some HCBS who may still have unmet needs.
We appreciate the contributions of KFF fall 2021 intern Avirut Mehta in data checking and preparing figures and tables for this brief.
Appendix
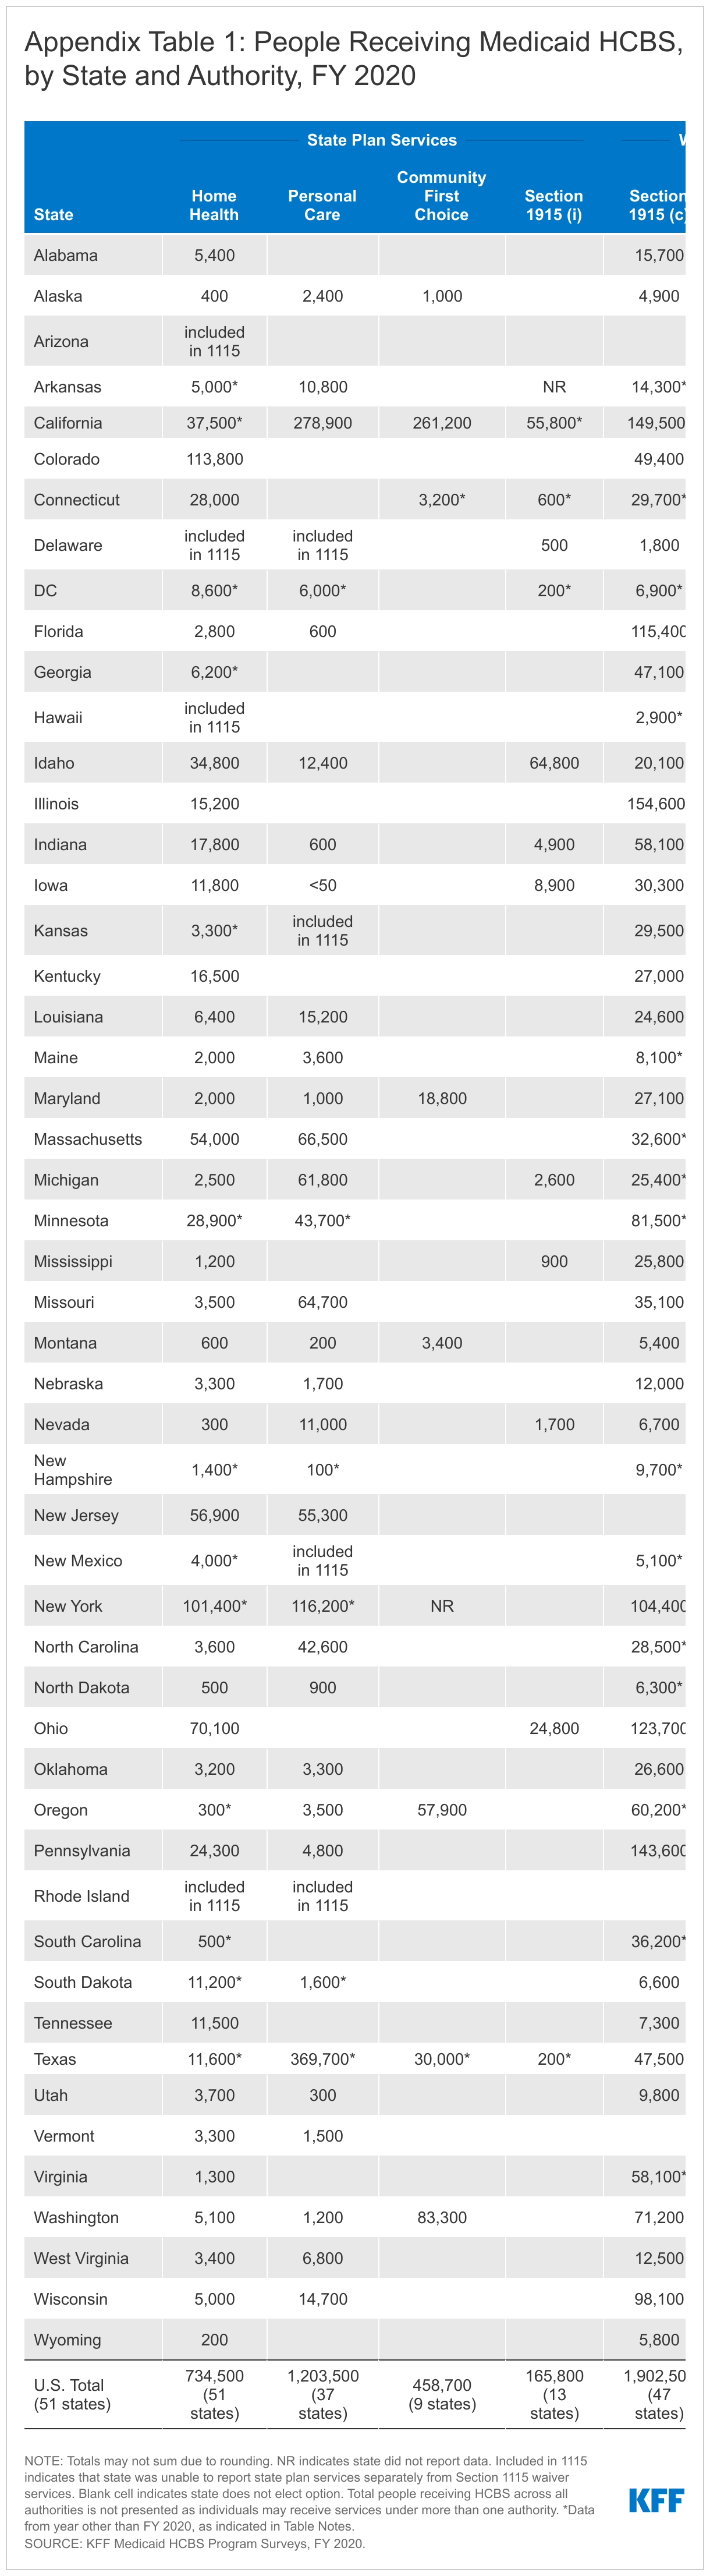
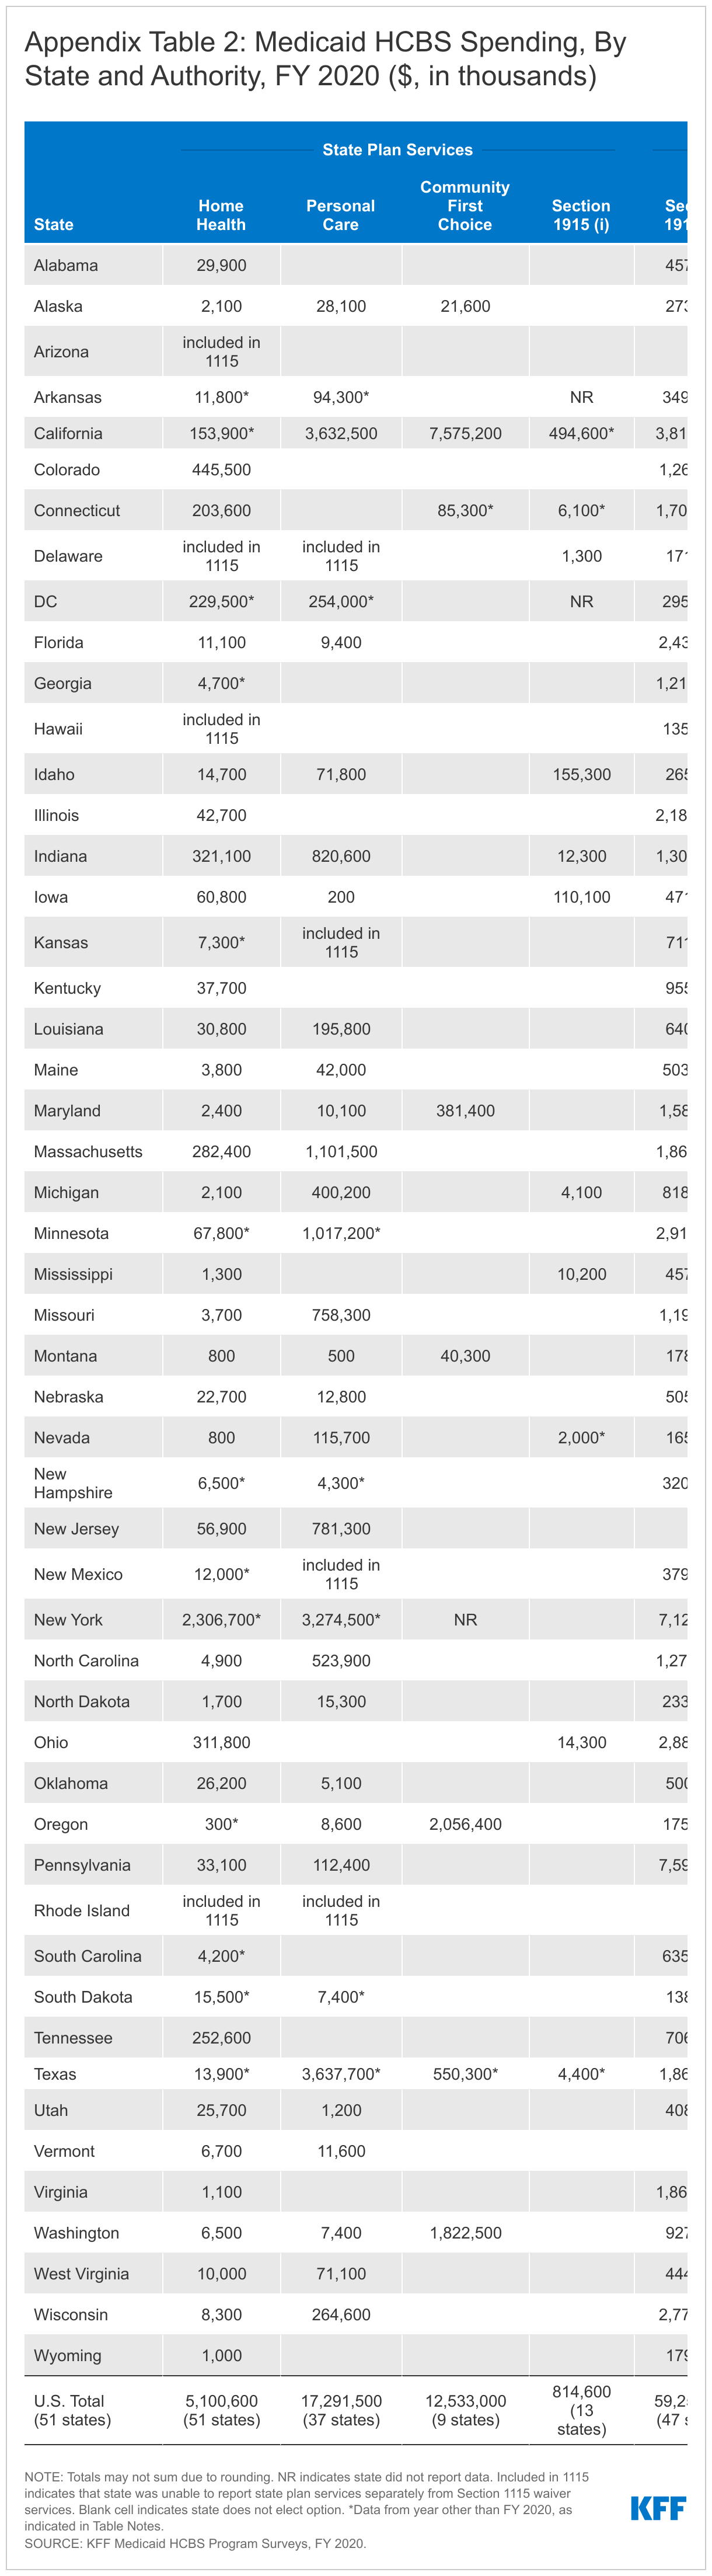
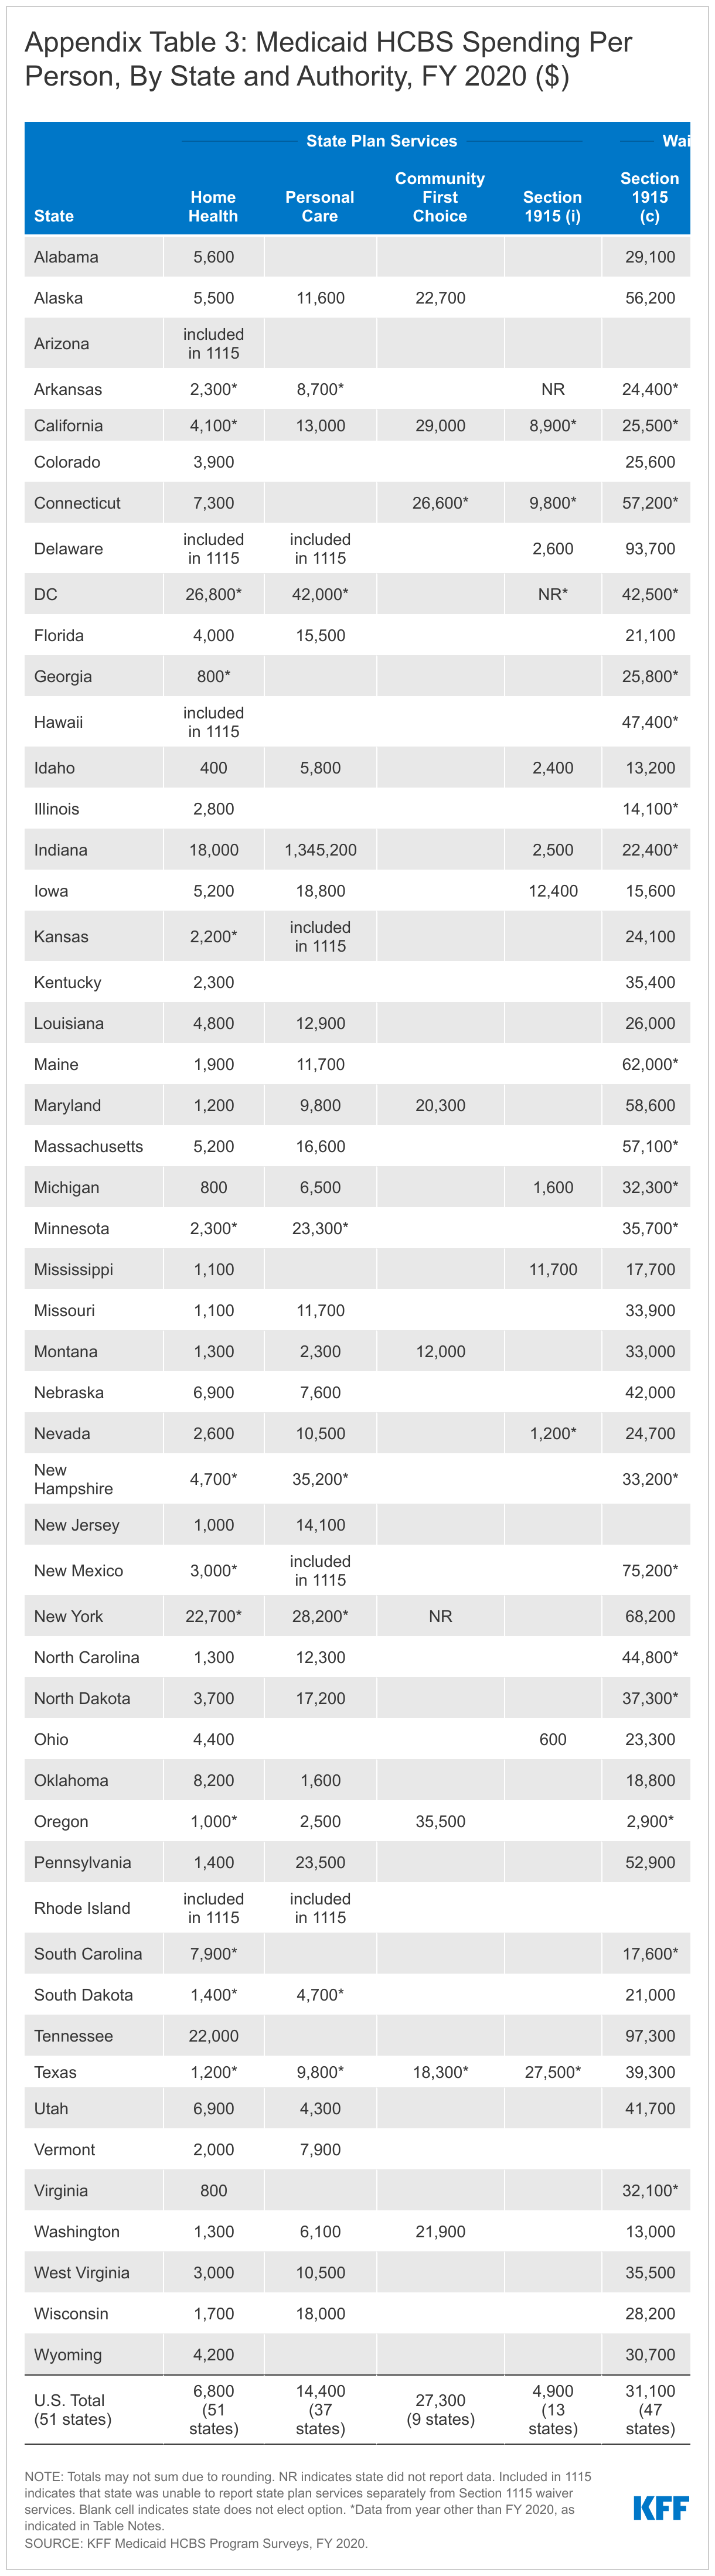
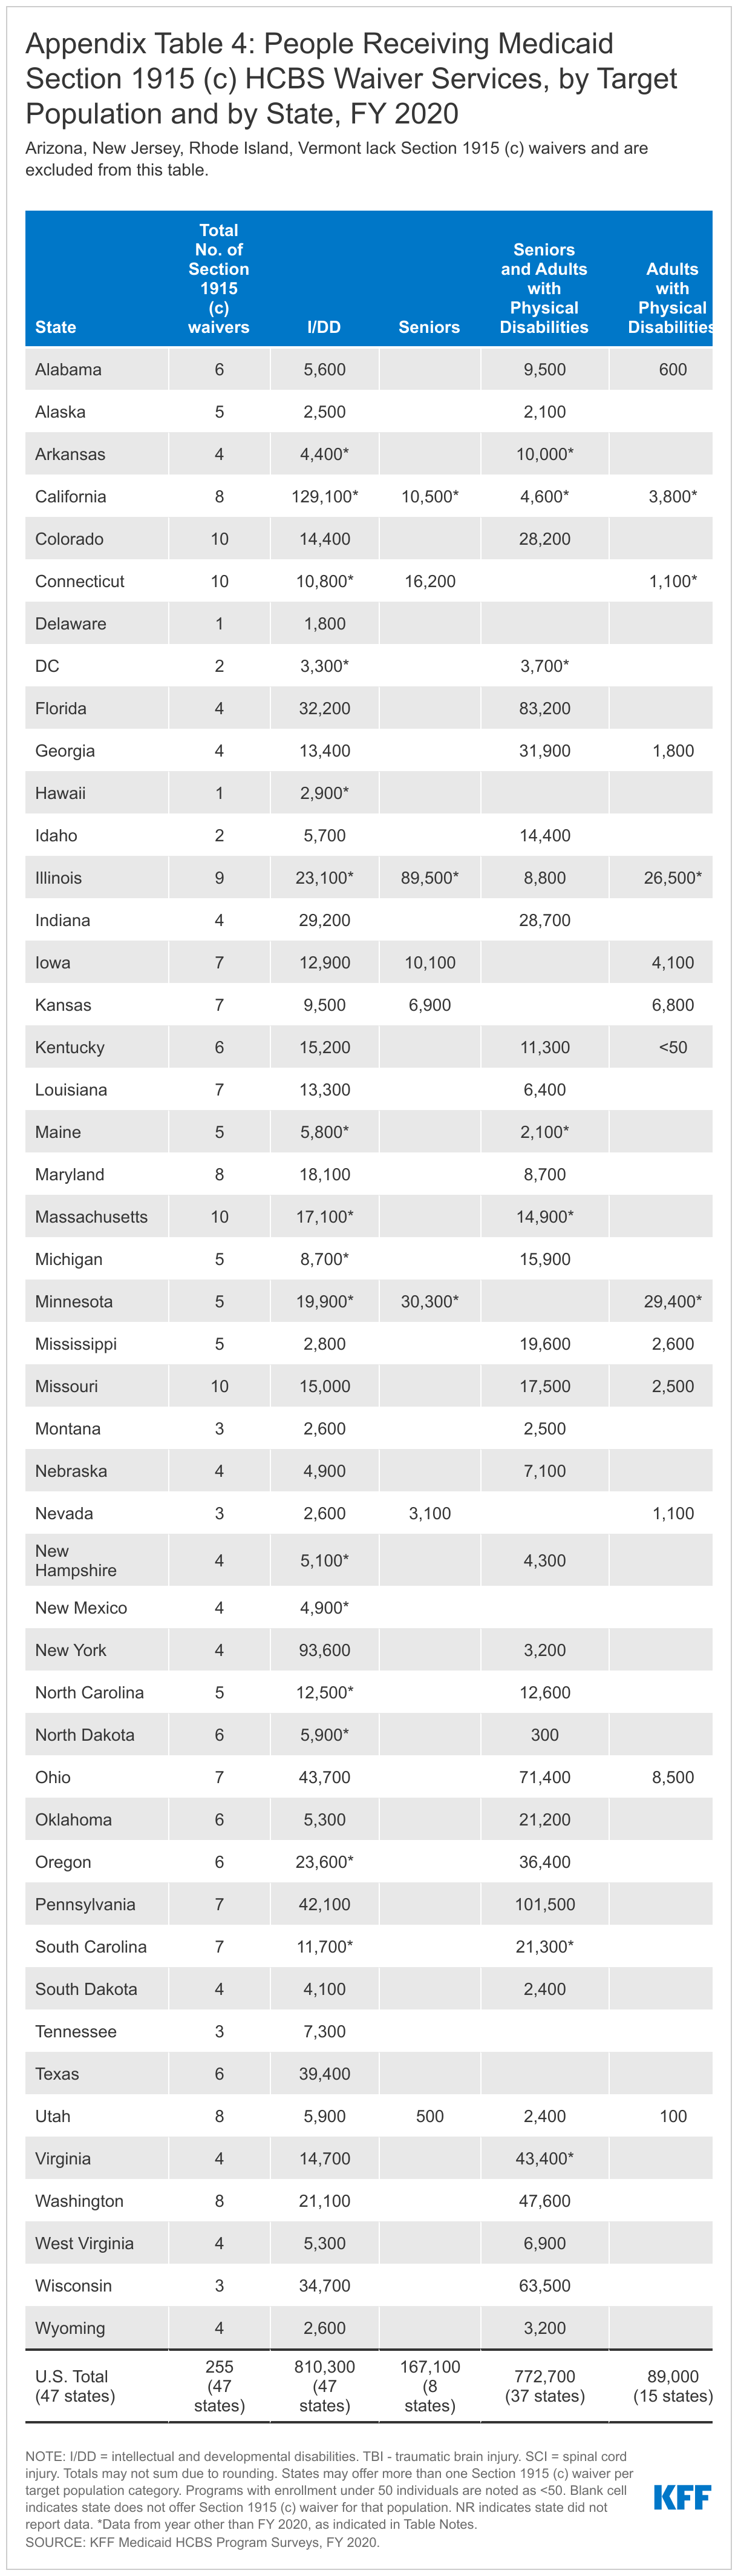
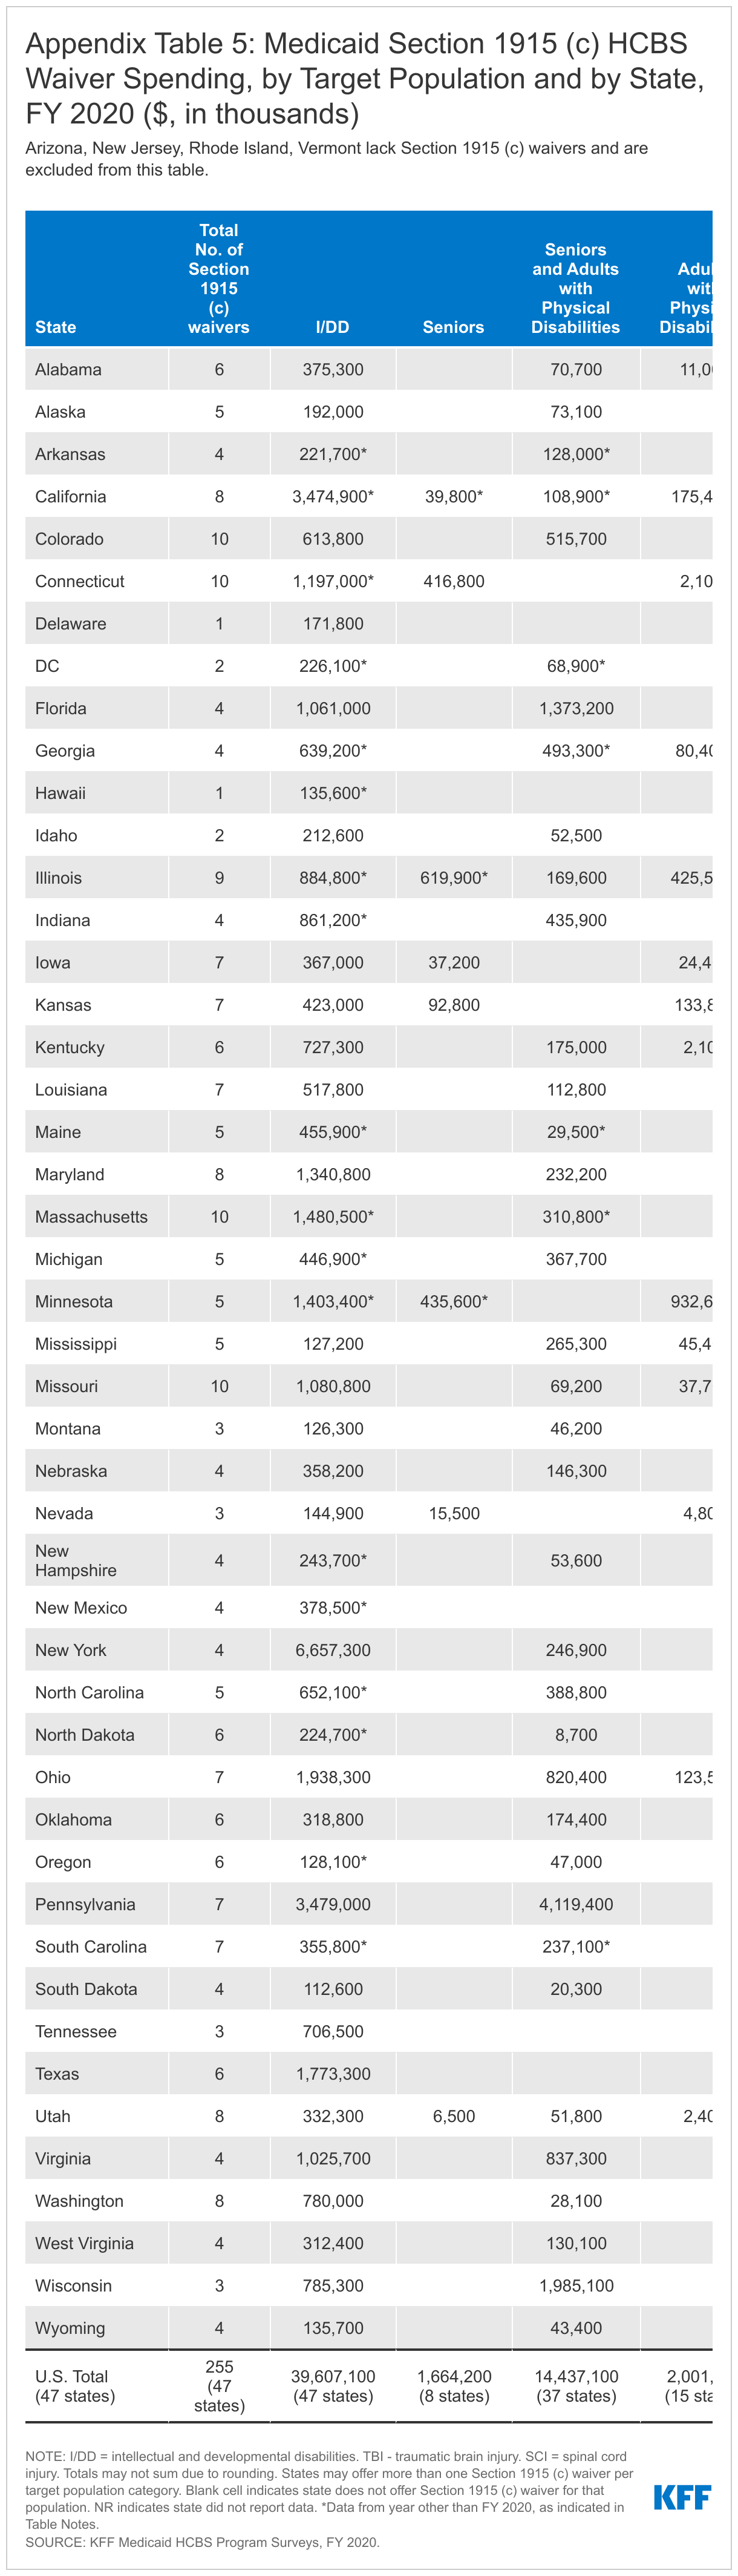
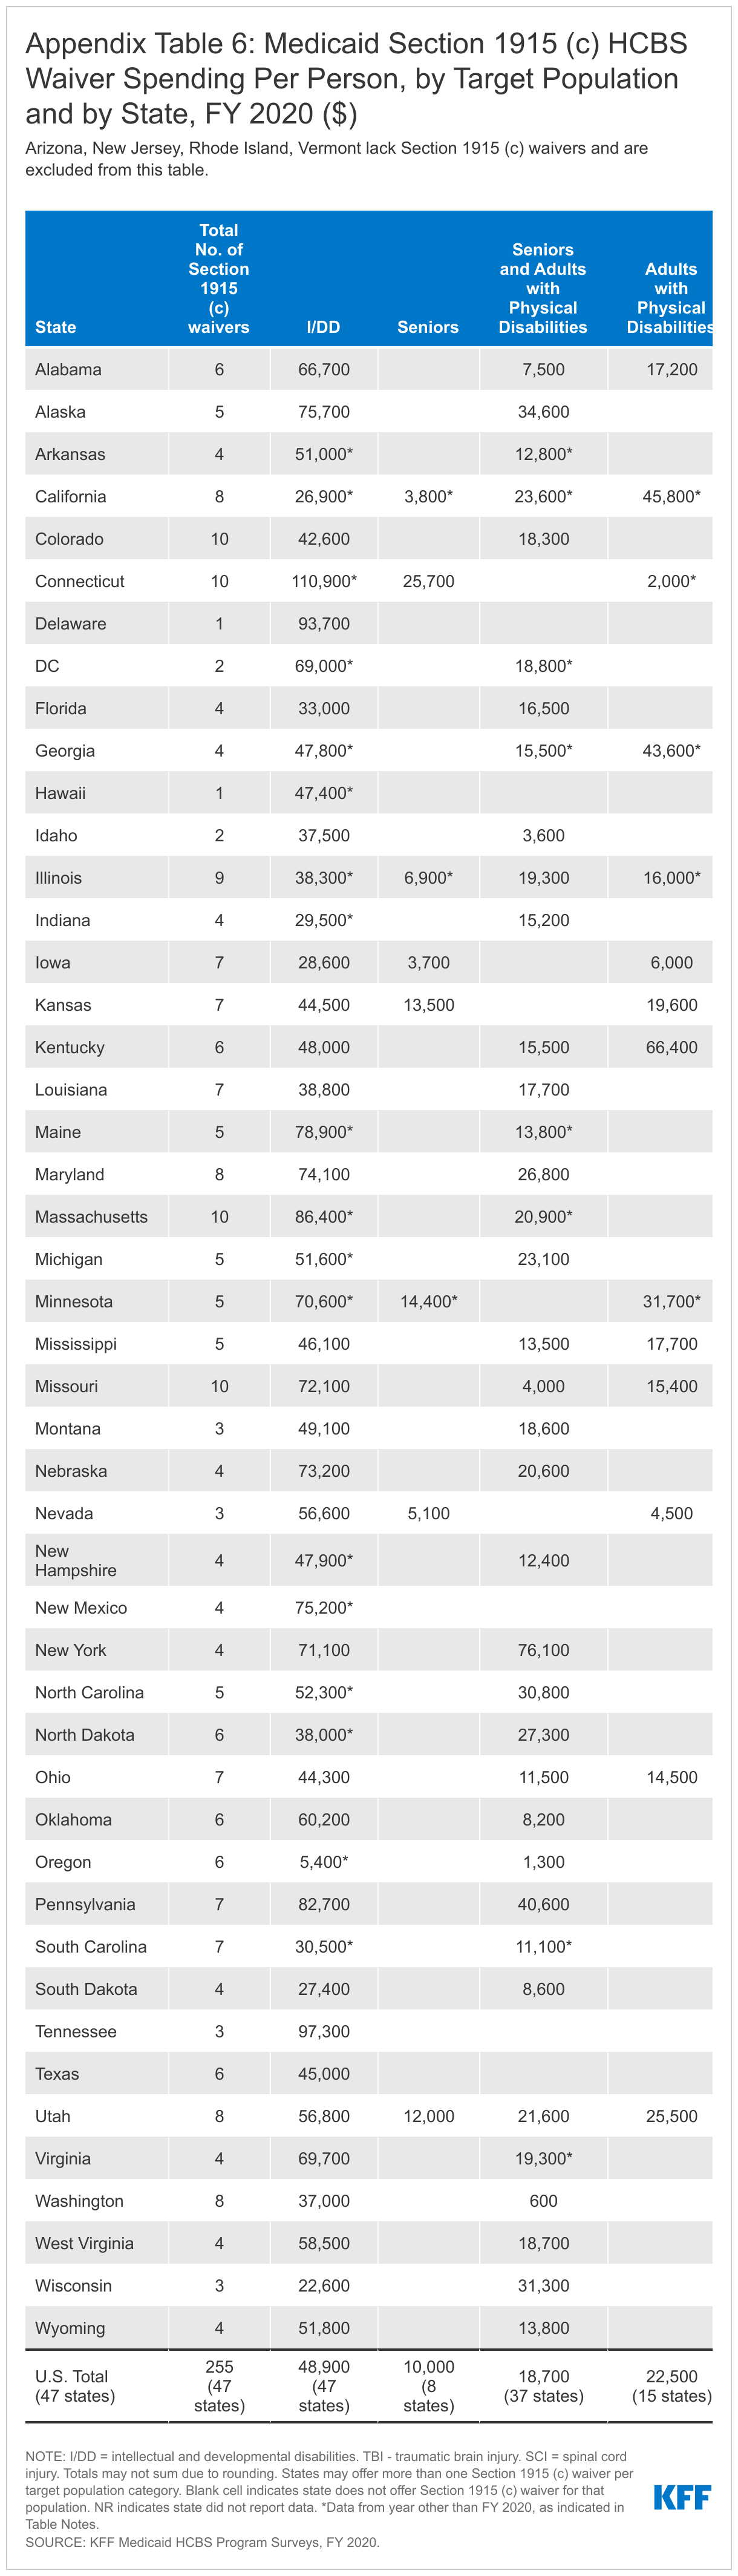
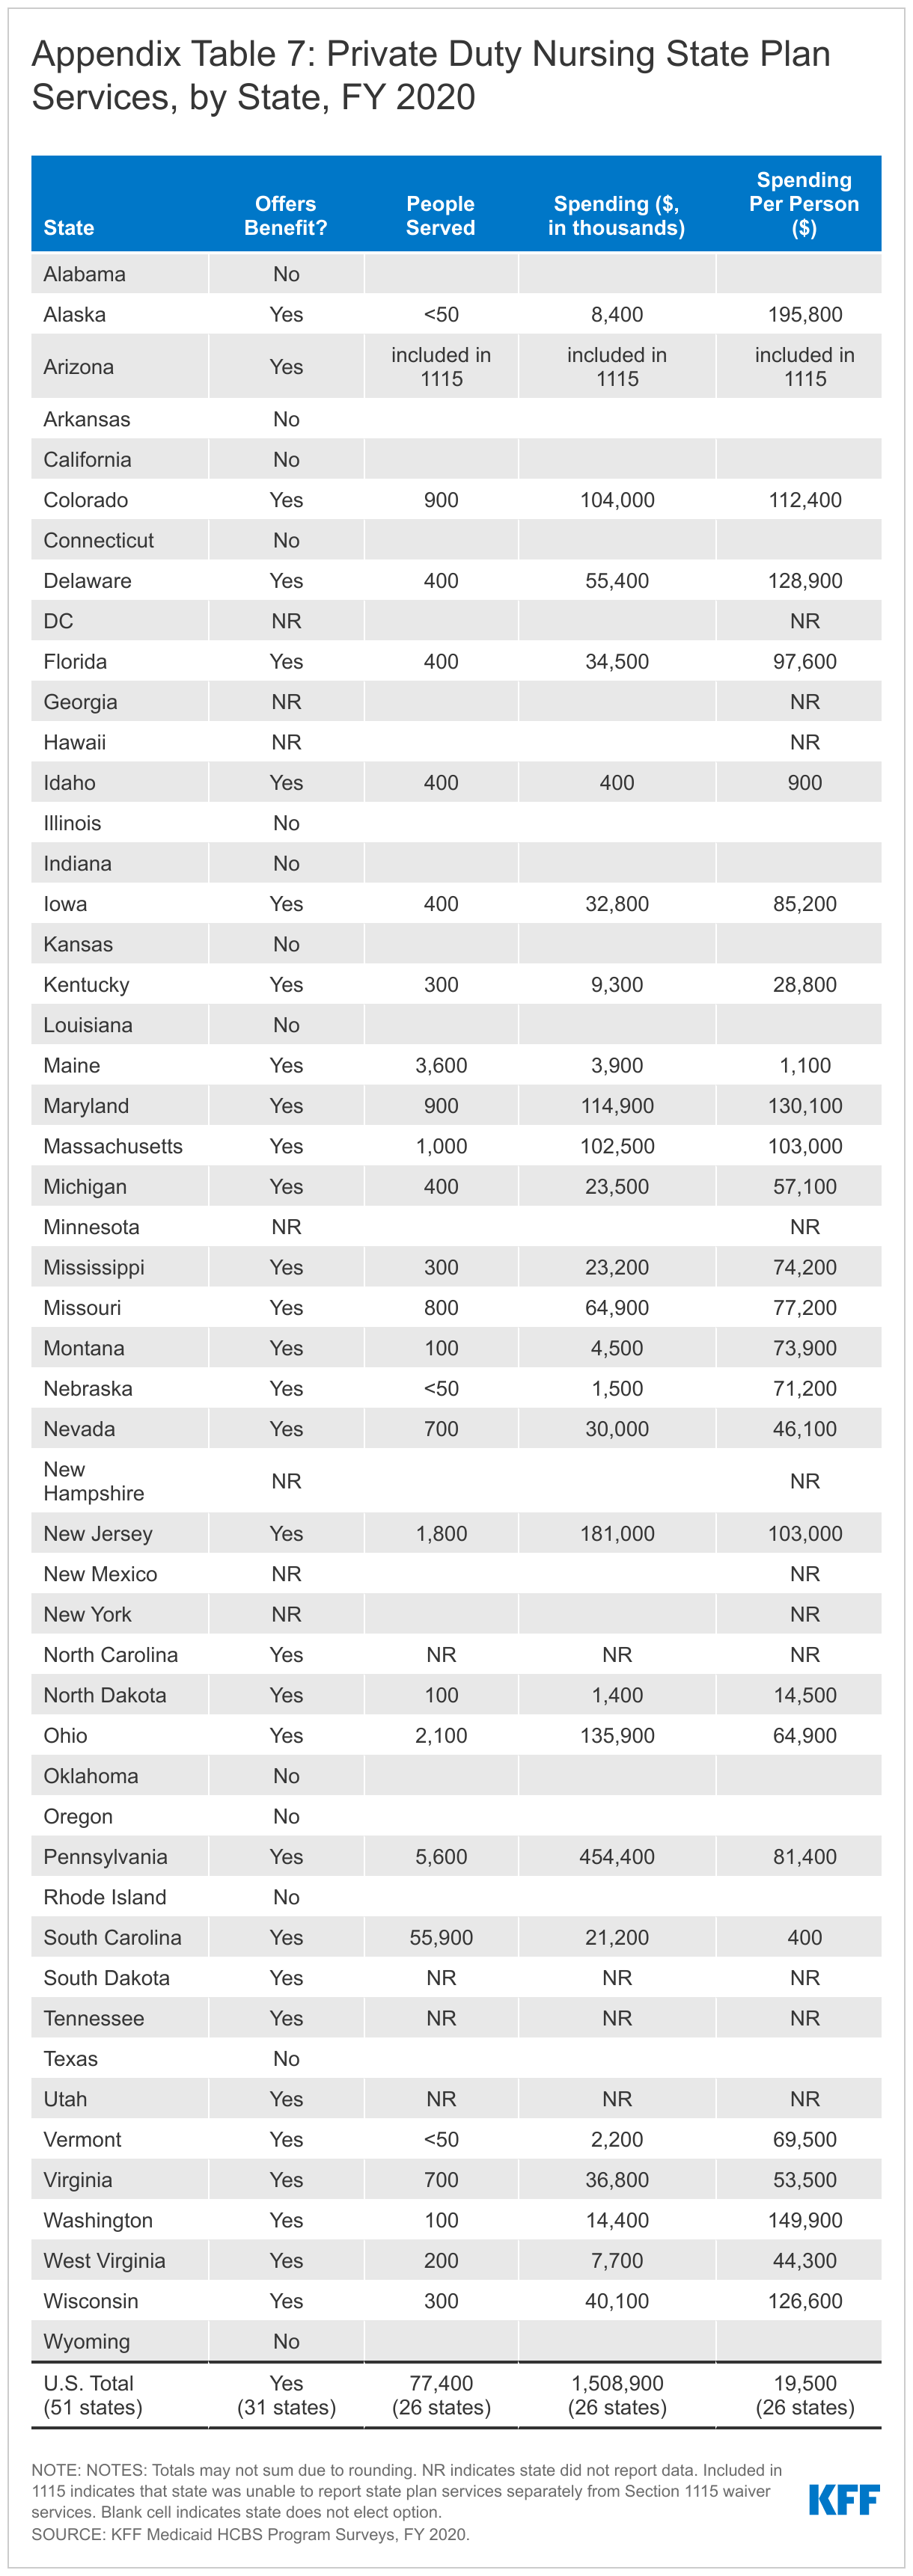
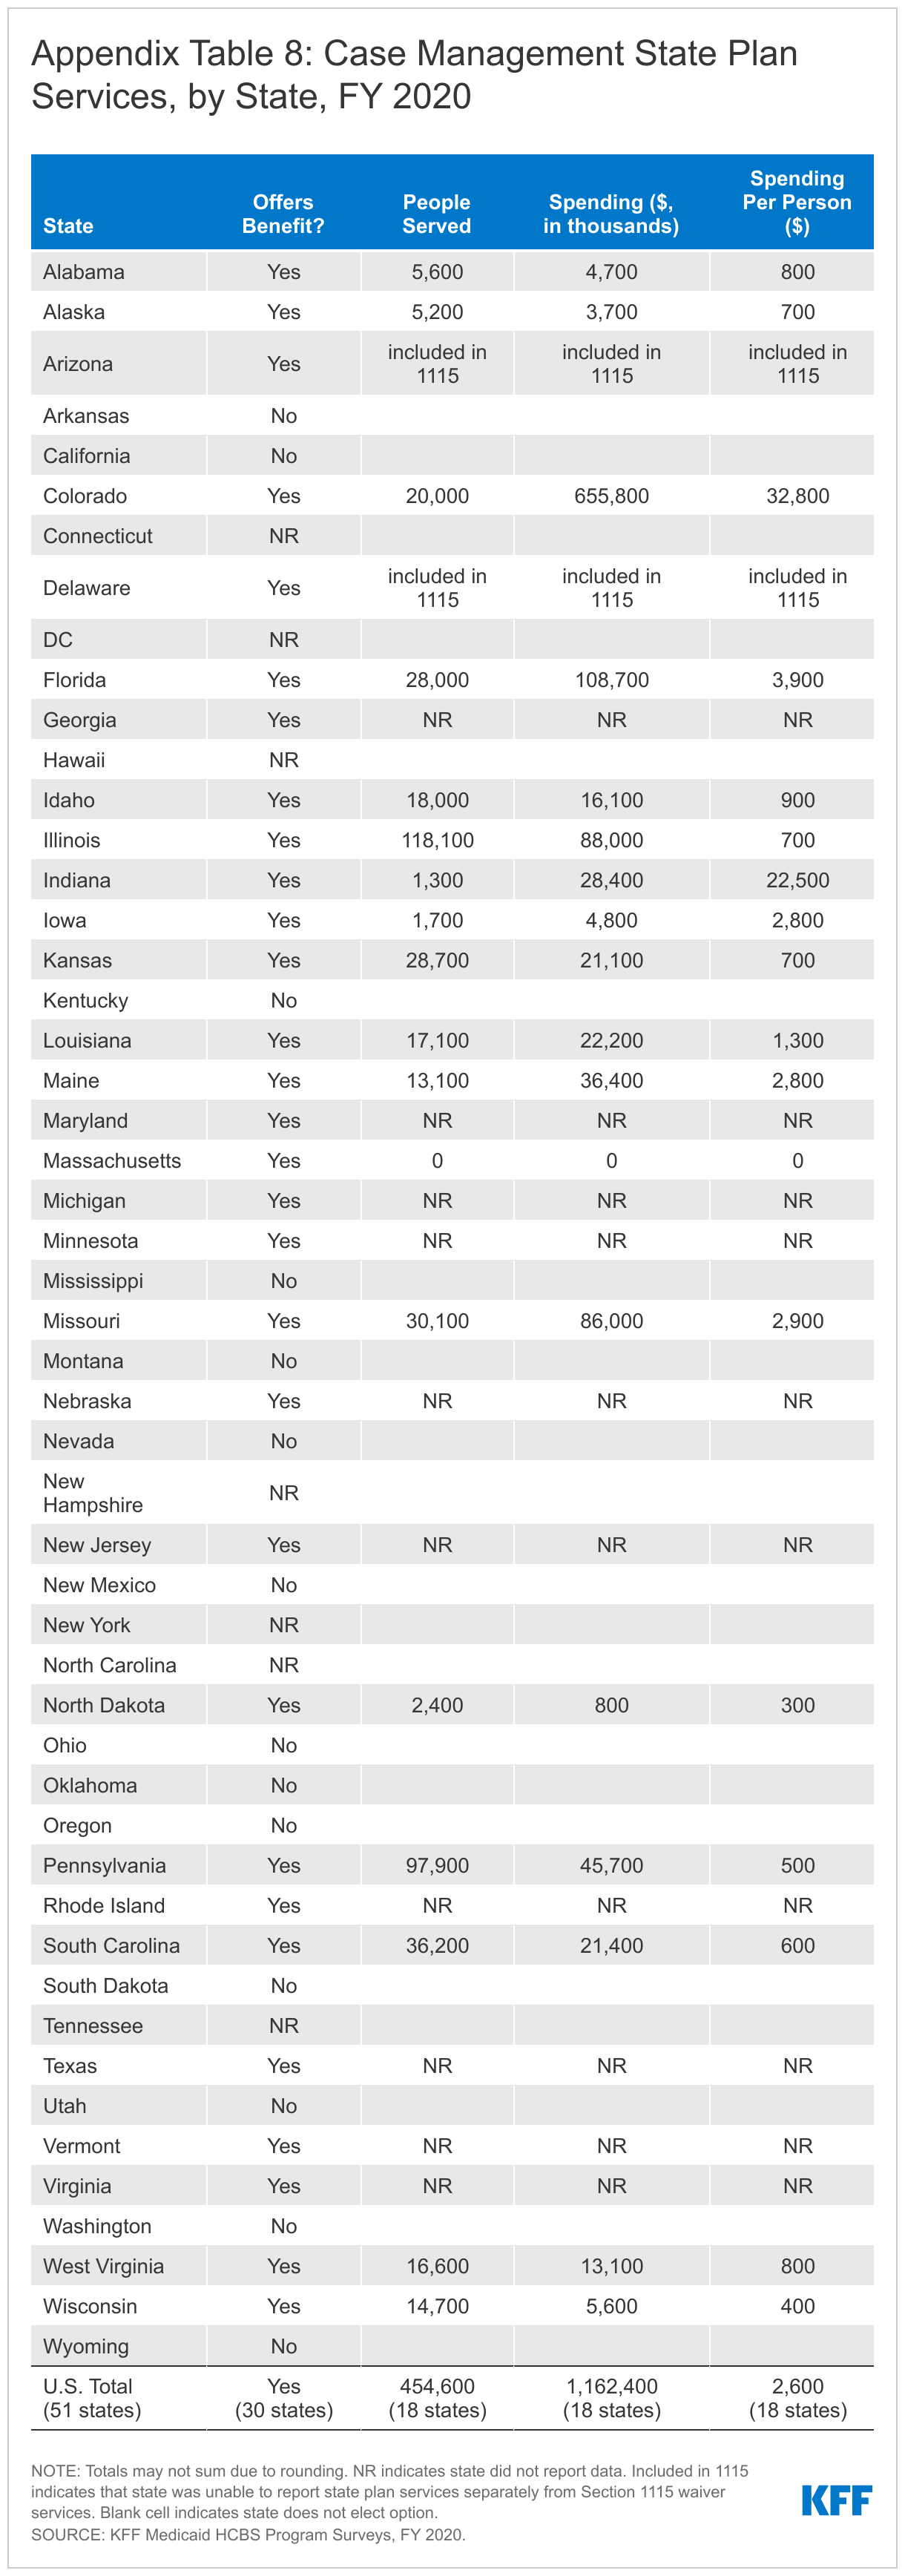
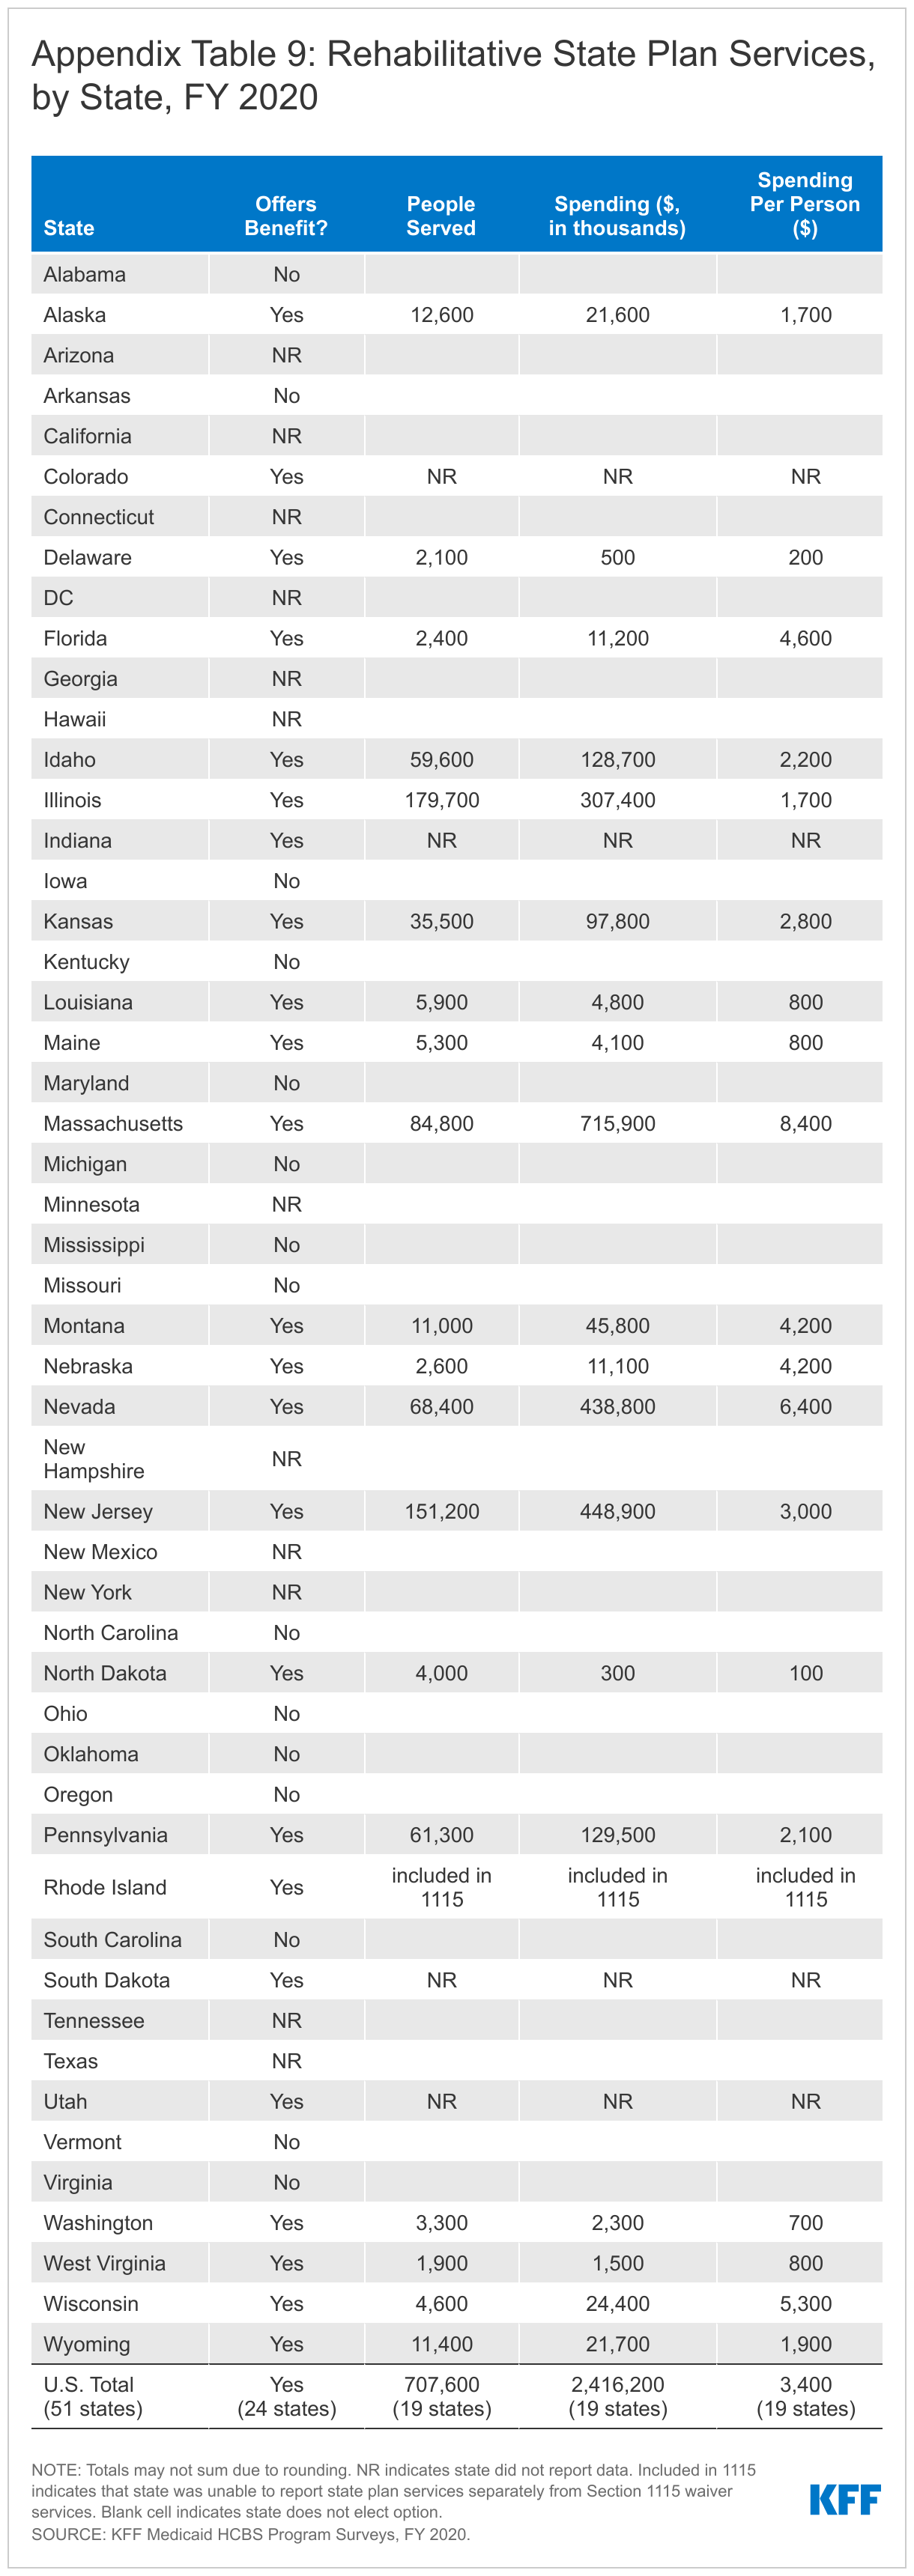
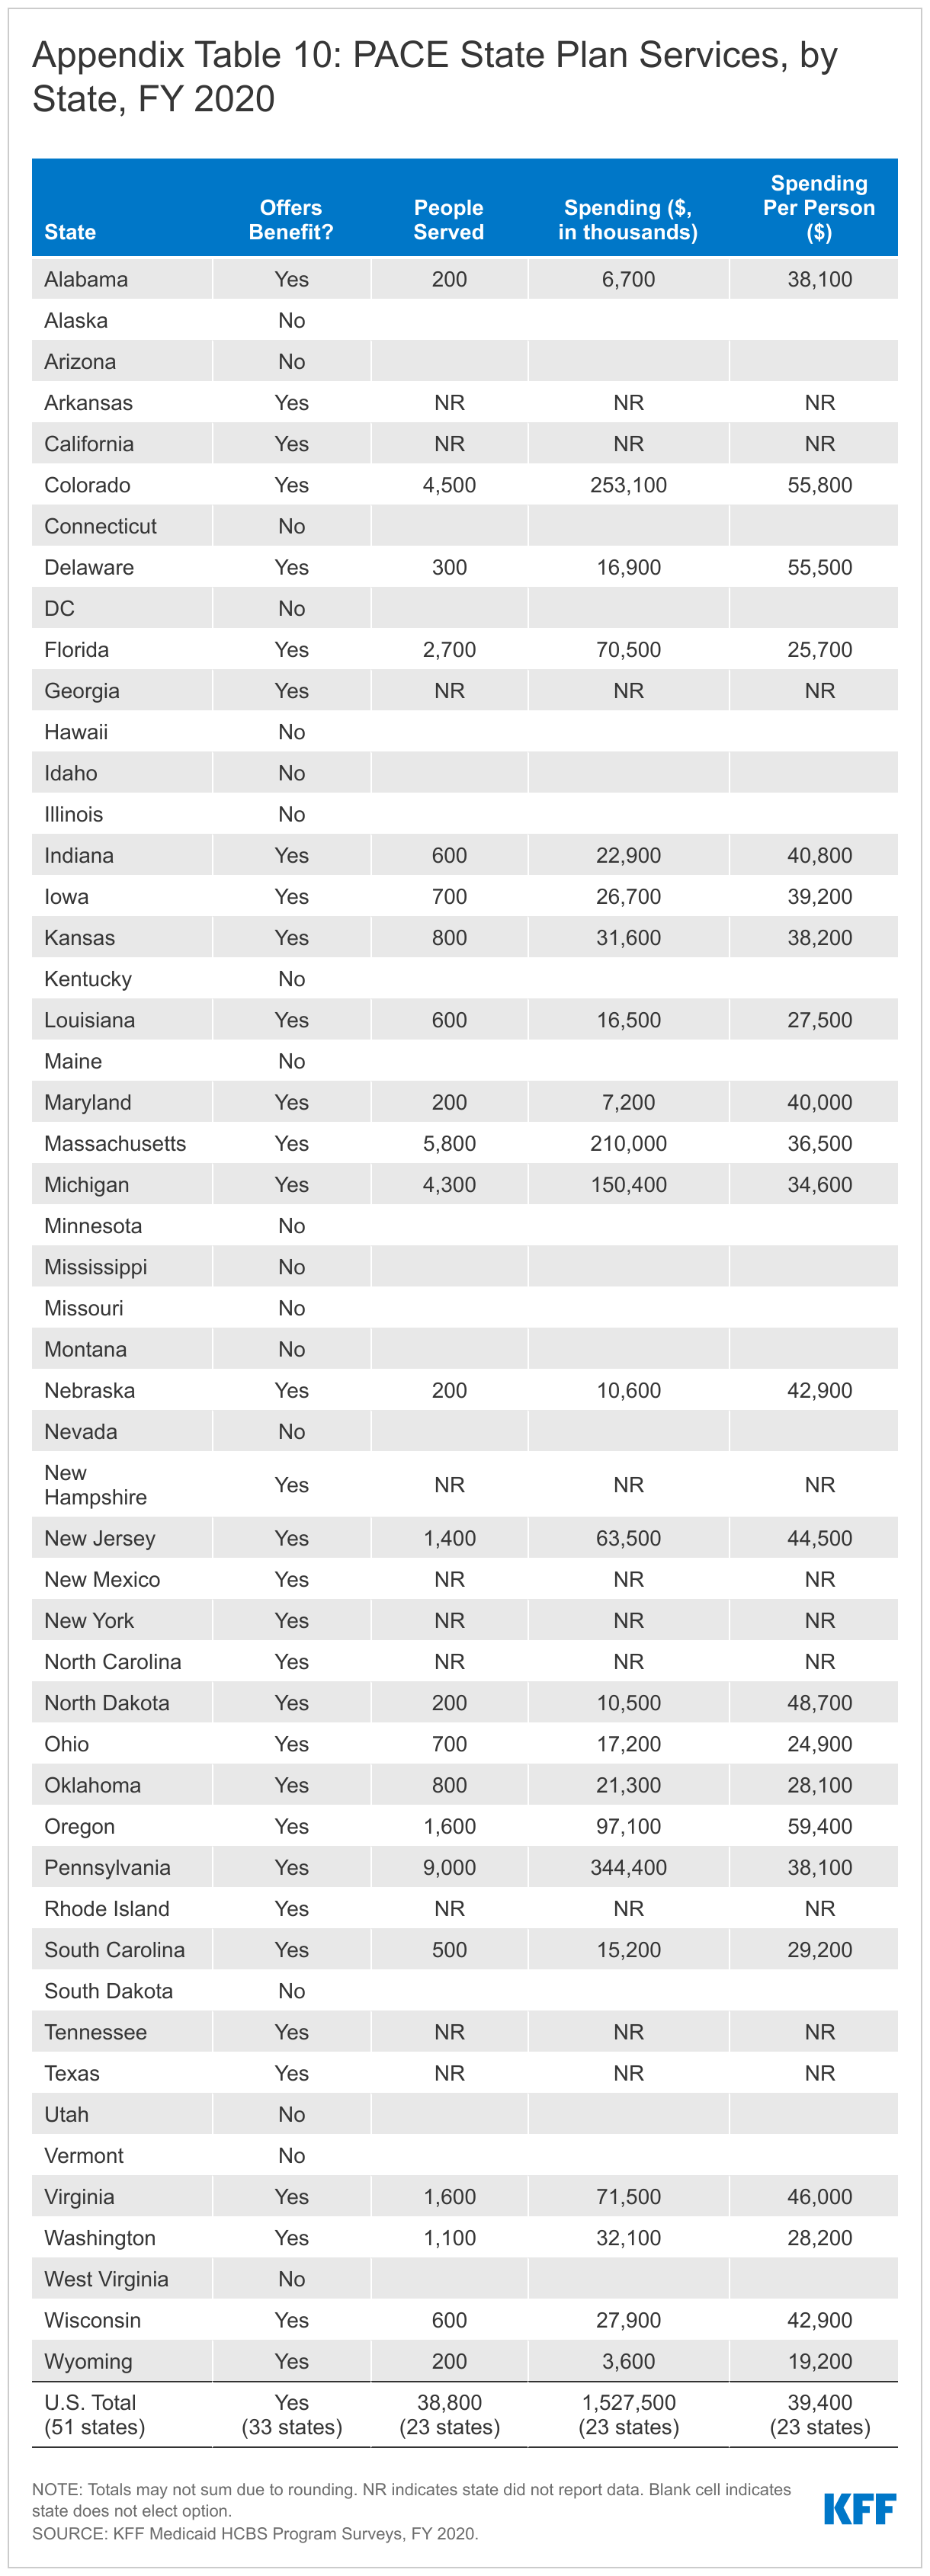
Table Notes
Arkansas: Home health data are from 2017. Personal care data are from 2018. Waiver data are from 2016 (#936 I/DD) and 2019 (#195 seniors/adults with physical disabilities, #400 seniors/adults with physical disabilities).
California: Home health data are from 2016. 1915 (i) and waiver data are from 2018.
Connecticut: CFC, 1915 (i), and waiver data are from 2018 (#301 adults with physical disabilities, #302 TBI/SCI, #993 I/DD, #4110 children).
DC: Home health, personal care, and waiver data are from 2017. 1915 (i) data are from 2016.
Georgia: Home health and waiver data are from 2018.
Hawaii: Section 1915 (c) and Section 1115 waiver data are from 2018.
Kansas: Home health data are from 2018.
Illinois: Waiver data are from 2018 (#143 seniors) and 2019 (#142 adults with physical disabilities, #202 HIV/AIDS, #278 children, #329 TBI/SCI, #350 I/DD, #464 I/DD, #473 I/DD).
Indiana: Waiver data are from 2019 (#378 I/DD, #387 I/DD).
Maine: Waiver data are from 2018 (#467 I/DD) and 2019 (#159 I/DD, #276 seniors/adults with physical disabilities, #995 I/DD, #1082 TBI/SCI).
Massachusetts: Waiver data are from 2018 (#59 seniors/adults with physical disabilities) and 2019 (#359 TBI/SCI, #826 I/DD, #827 I/DD, #828 I/DD, #1027 seniors/adults with physical disabilities, #1028 seniors/adults with physical disabilities, #40207 I/DD, #40701 TBI/SCI, #40702 TBI/SCI).
Michigan: Waiver data are from 2018 (#167 I/DD) and 2019 spending-only (#438 mental health, #4110 I/DD).
Minnesota: Home health, personal care, and waiver data are from 2018.
Nevada: 1915 (i) data are from 2018.
New Hampshire: Home health and personal care data are from 2015. Waiver data are from 2016 (#397 I/DD) and 2018 (#53 I/DD, #4177 TBI/SCI).
New Mexico: Home health and waiver data are from 2018.
New York: Home health and personal care data are from 2017.
North Carolina: Waiver data are from 2016 (#432 I/DD).
North Dakota: Waiver data are from 2019 spending-only (#568 children, #834 children, #842 I/DD).
Oregon: Home health data are from 2018. Waiver data are from 2019 (#117 I/DD, #375 I/DD, #565 children, #40193 children, 40194 I/DD).
South Carolina: Home health and waiver data are from 2018 (#237 I/DD, #675 children, #40181 seniors/adults with physical disabilities) and 2019 (#186 HIV/AIDS, #284 TBI/SCI, #405 seniors/adults with physical disabilities, #676 I/DD).
South Dakota: Home health and personal care data are from 2018.
Tennessee: Home health data are from 2018.
Texas: Home health, personal care, CFC, and 1915 (i) data are from 2018.
Virginia: Waiver data are from 2018 (#321 seniors/adults with physical disabilities).
Endnotes
- These spending totals may not align with other sources due to differences in state reporting or which services are included in the definition of HCBS. ↩︎
- Factors contributing to this trend include enrollee preferences for HCBS, the fact that states are encouraging HCBS as an alternative to typically more costly institutional care, and states’ community integration obligations under the Americans with Disabilities Act (ADA) and the Supreme Court’s Olmstead decision. In Olmstead, the Supreme Court held that the unjustified institutionalization of people with disabilities is illegal discrimination that violates the ADA. ↩︎
- The FY 2017 and 2018 data omit California, Illinois, New York, North Carolina, and Virginia. ↩︎
- The FY 2019 data omit California, Delaware, Illinois, and Virginia. ↩︎
- Due to the pandemic, KFF did not survey states in calendar year 2020, so this year’s survey also collected FY 2019 data to account for the missed year. ↩︎
- The four states that did not respond are Hawaii, District of Columbia, Minnesota, and New Mexico. In certain areas, states’ previously reported data and supplemental research by KFF helped to calculate national totals. ↩︎
- Section 1115 HCBS waivers are included in our survey only if the state does not have an accompanying Section 1915 (c) waiver. ↩︎
- However, states can limit the number of people receiving Section 1915 (i) state plan services by restricting functional eligibility criteria for future enrollees if the number of people receiving services will exceed the state’s initial estimate. ↩︎
- Number of people served was not reported for CFC in NY and Section 1915 (i) in AR. ↩︎
- These totals omit people receiving services in the following states that deliver state plan HCBS through Section 1115 capitated managed care waivers and cannot report the unduplicated number of people receiving state plan HCBS separate from the total number of people receiving Section 1115 waiver services: AZ (home health), DE (home health and personal care), HI (home health), KS (personal care), NM (personal care), RI (home health and personal care). ↩︎
- States report total spending for home health state plan services, which may include a small amount of spending for optional services. The home health state plan benefit must include nursing services, home health aide services, and medical supplies, equipment, and appliances. States also may choose to cover physical, occupational, and/or speech/language therapy as part of the home health state plan benefit. ↩︎
- Spending data was not reported for CFC in NY and Section 1915 (i) in AR and DC. ↩︎
- The home health and personal care state plan option totals omit spending for state plan HCBS in the following states that provide these services through Section 1115 capitated waivers and cannot report state plan HCBS spending separate from total Section 1115 waiver spending: AZ (home health), DE (home health and personal care), HI (home health), KS (personal care), NM (personal care), RI (home health and personal care). ↩︎
- States also may use Section 1115 HCBS waivers to target services to particular populations. We do no analyze Section 1115 waivers by target population because states may include more than one population within a single waiver; instead, we report total Section 1115 HCBS spending across all waiver populations. ↩︎
- 47 states offer Section 1915 (c) waivers targeted to people with I/DD. The other four states (AZ, NJ, RI, and VT) serve their entire I/DD waiver populations under Section 1115. In addition, two states (NY and TN) serve some people with I/DD under Section 1115 and others under Section 1915 (c). ↩︎
- 42 states offer Section 1915 (c) waivers targeted to seniors and/or adults with physical disabilities. The other nine states (AZ, DE, HI, NJ, NM, RI, TN, TX, and VT) serve all senior and adult with physical disabilities waiver populations under Section 1115. In addition, three states (CA, NY, and WA) serve some seniors and adults with physical disabilities under Section 1115 and others under Section 1915 (c). ↩︎
- 21 states offer Section 1915 (c) waivers targeted to people with TBI/SCI. Another four states (DE, RI, VT, and WA) serve people with TBI/SCI under Section 1115. ↩︎
- 18 states offer Section 1915 (c) waivers targeted to children who are medically fragile or technology dependent. Another two states (HI and RI) serve children who are medically fragile or technology dependent under Section 1115. ↩︎
- Five states offer Section 1915 (c) waivers targeted to people with HIV/AIDS. Another three states (DE, HI, and RI) serve people with HIV/AIDS under Section 1115. ↩︎
- 11 states offer Section 1915 (c) waivers targeted to people with mental health disabilities. Another two states (DE and RI) serve people with mental health disabilities under Section 1115. In addition, WA serves some people with mental health disabilities under Section 1115 and others under Section 1915 (c). ↩︎
- These data include four states (CA, DE, ID, MS) that serve people with I/DD under Section 1915 (i). ID serves both people with I/DD and children with serious emotional disturbance under Section 1915 (i). ID did not report the number of people served and spending by target population, so all data are attributed to people with I/DD. ↩︎
- Four states (CT-seniors only, DC, MI, NV) serve seniors and/or people with physical disabilities under Section 1915 (i). ↩︎
- These data include four states (IA, IN, OH, TX) that serve people with mental health disabilities under Section 1915 (i). ID also serves children with serious emotional disturbance under Section 1915 (i) but was unable to report data by target population, so all ID Section 1915 (i) data are attributed its I/DD target population. AR also serves people with behavioral health needs under Section 1915 (i) but did not report the number of people served or spending. AR SPA #18-0017 (approved Dec. 19, 2018, effective March 1, 2019), https://www.medicaid.gov/sites/default/files/State-resource-center/Medicaid-State-Plan-Amendments/Downloads/AR/AR-18-017.pdf. ↩︎