2012 Employer Health Benefits Survey
Abstract
To view the 2013 Employer Health Benefits Survey, click here.
This annual survey of employers provides a detailed look at trends in employer-sponsored health coverage, including premiums, employee contributions, cost-sharing provisions, and other relevant information. The survey continues to document employer’s implementation of health reform with question on the percent of firms with grandfathered health plans and enrollment of adult children due to the new health reform law. The 2012 survey included 3,326 randomly selected public and private firms with three or more employees (2,121 of which responded to the full survey and 1,205 of which responded to an additional question about offering coverage). Researchers at the Kaiser Family Foundation, NORC at the University of Chicago, and Health Research & Educational Trust designed and analyzed the survey.
Pulling It Together, From Drew Altman
Health Affairs Article
Additional Resources:
- Chart Pack (.pdf) | Chart Pack (Slideshow)
- 2012 Supplementary Survey
- Technical Supplement: Standard Error Tables for Selected Estimates
Related Analysis:
- The Prevalence and Cost of Deductibles in Employer Sponsored Insurance: A View from the 2012 Employer Health Benefits Survey
- Premiums, Cost Sharing, and Coverage at Public, Private, and Non-Profit Employers: A View from the 2012 Employer Health Benefits Survey
- A Comparison of the Availability and Cost of Coverage for Workers in Small Firms and Large Firms: A View from the 2012 Employer Health Benefits Survey
Archive of All Employer Health Benefits Surveys
Report
Section 1: Cost of Health Insurance
The average annual premiums in 2012 are $5,615 for single coverage and $15,745 for family coverage. Average premiums increased 3% for single coverage and 4% for family coverage in the last year. Consistent with recent years, average family premiums for small firms (3-199 workers) ($15,253) are significantly lower than average family premiums for larger firms (200 or more workers) ($15,980).
Premium Costs for Single and Family Coverage
- The average premium for single coverage in 2012 is $468 per month or $5,615 per year (Exhibit 1.1). The average premium for family coverage is $1,312 per month or $15,745 per year (Exhibit 1.1).
- The average annual premiums for covered workers in HDHP/SOs are lower for single ($4,928) and family coverage ($14,129) than the overall average premiums for covered workers. Average annual premiums for PPO plans are higher for single coverage ($5,850) and family coverage ($16,356) than the overall average premiums for covered workers (Exhibit 1.1).
- The average premium for family coverage for covered workers in small firms (3-199 workers) ($15,253) is lower than the average premium for covered workers in large firms (200 or more workers) ($15,980) (Exhibit 1.2). The average single premiums in small firms (3-199 workers) and larger firms do not differ significantly.
- Average single and family premiums for covered workers are higher in the Northeast ($5,964 and $17,099) and lower in the South ($5,445 and $14,988) than the average premiums for covered workers in all other regions (Exhibit 1.3).
- Covered workers in firms where 35% or more of the workers are age 26 or younger have lower average single and family premiums ($4,961 and $14,217) than covered workers in firms where a lower percentage of workers are age 26 or younger ($5,669 and $15,871). Covered workers in firms where 35% or more of the workers are age 50 or older have higher average single and family premiums ($5,860 and $16,392) than covered workers in firms where a lower percentage of workers are age 50 or older ($5,440 and $15,281) (Exhibit 1.5) and (Exhibit 1.6).
- Covered workers in firms with a large percentage of lower-wage workers (at least 35% of workers earn $24,000 per year or less) have lower average single and family premiums ($5,135 and $14,694) than covered workers in firms with a smaller percentage of lower-wage workers ($5,673 and $15,871). Covered worker in firms with a large percentage of higher-wage workers (at least 35% of workers earn $55,000 per year or more) have higher average single and family premiums ($5,789 and $16,427) than covered workers in firms with a smaller percentage of higher-wage workers ($5,448 and $15,087) (Exhibit 1.5) and (Exhibit 1.6).
- There is considerable variation in premiums for both single and family coverage.
- Eighteen percent of covered workers are employed by firms that have a single premium at least 20% higher than the average single premium, while 19% of covered workers are in firms that have a single premium less than 80% of the average single premium (Exhibit 1.7) and (Exhibit 1.8).
- For family coverage, 19% of covered workers are employed in a firm that has a family premium at least 20% higher than the average family premium, while 20% of covered workers are in firms that have a family premium less than 80% of the average family premium (Exhibit 1.7) and (Exhibit 1.8).
Premium Changes Over Time
- The average annual single premium ($5,615) in 2012 is 3% higher than the average annual single premium in 2011 ($5,429), and the average annual family premium ($15,745) is 4% higher than the average annual family premium last year ($15,073) (Exhibit 1.11).
- The $15,745 average annual family premium in 2012 is 30% higher than the average family premium in 2007 and 97% higher than the average family premium in 2002 (Exhibit 1.11).
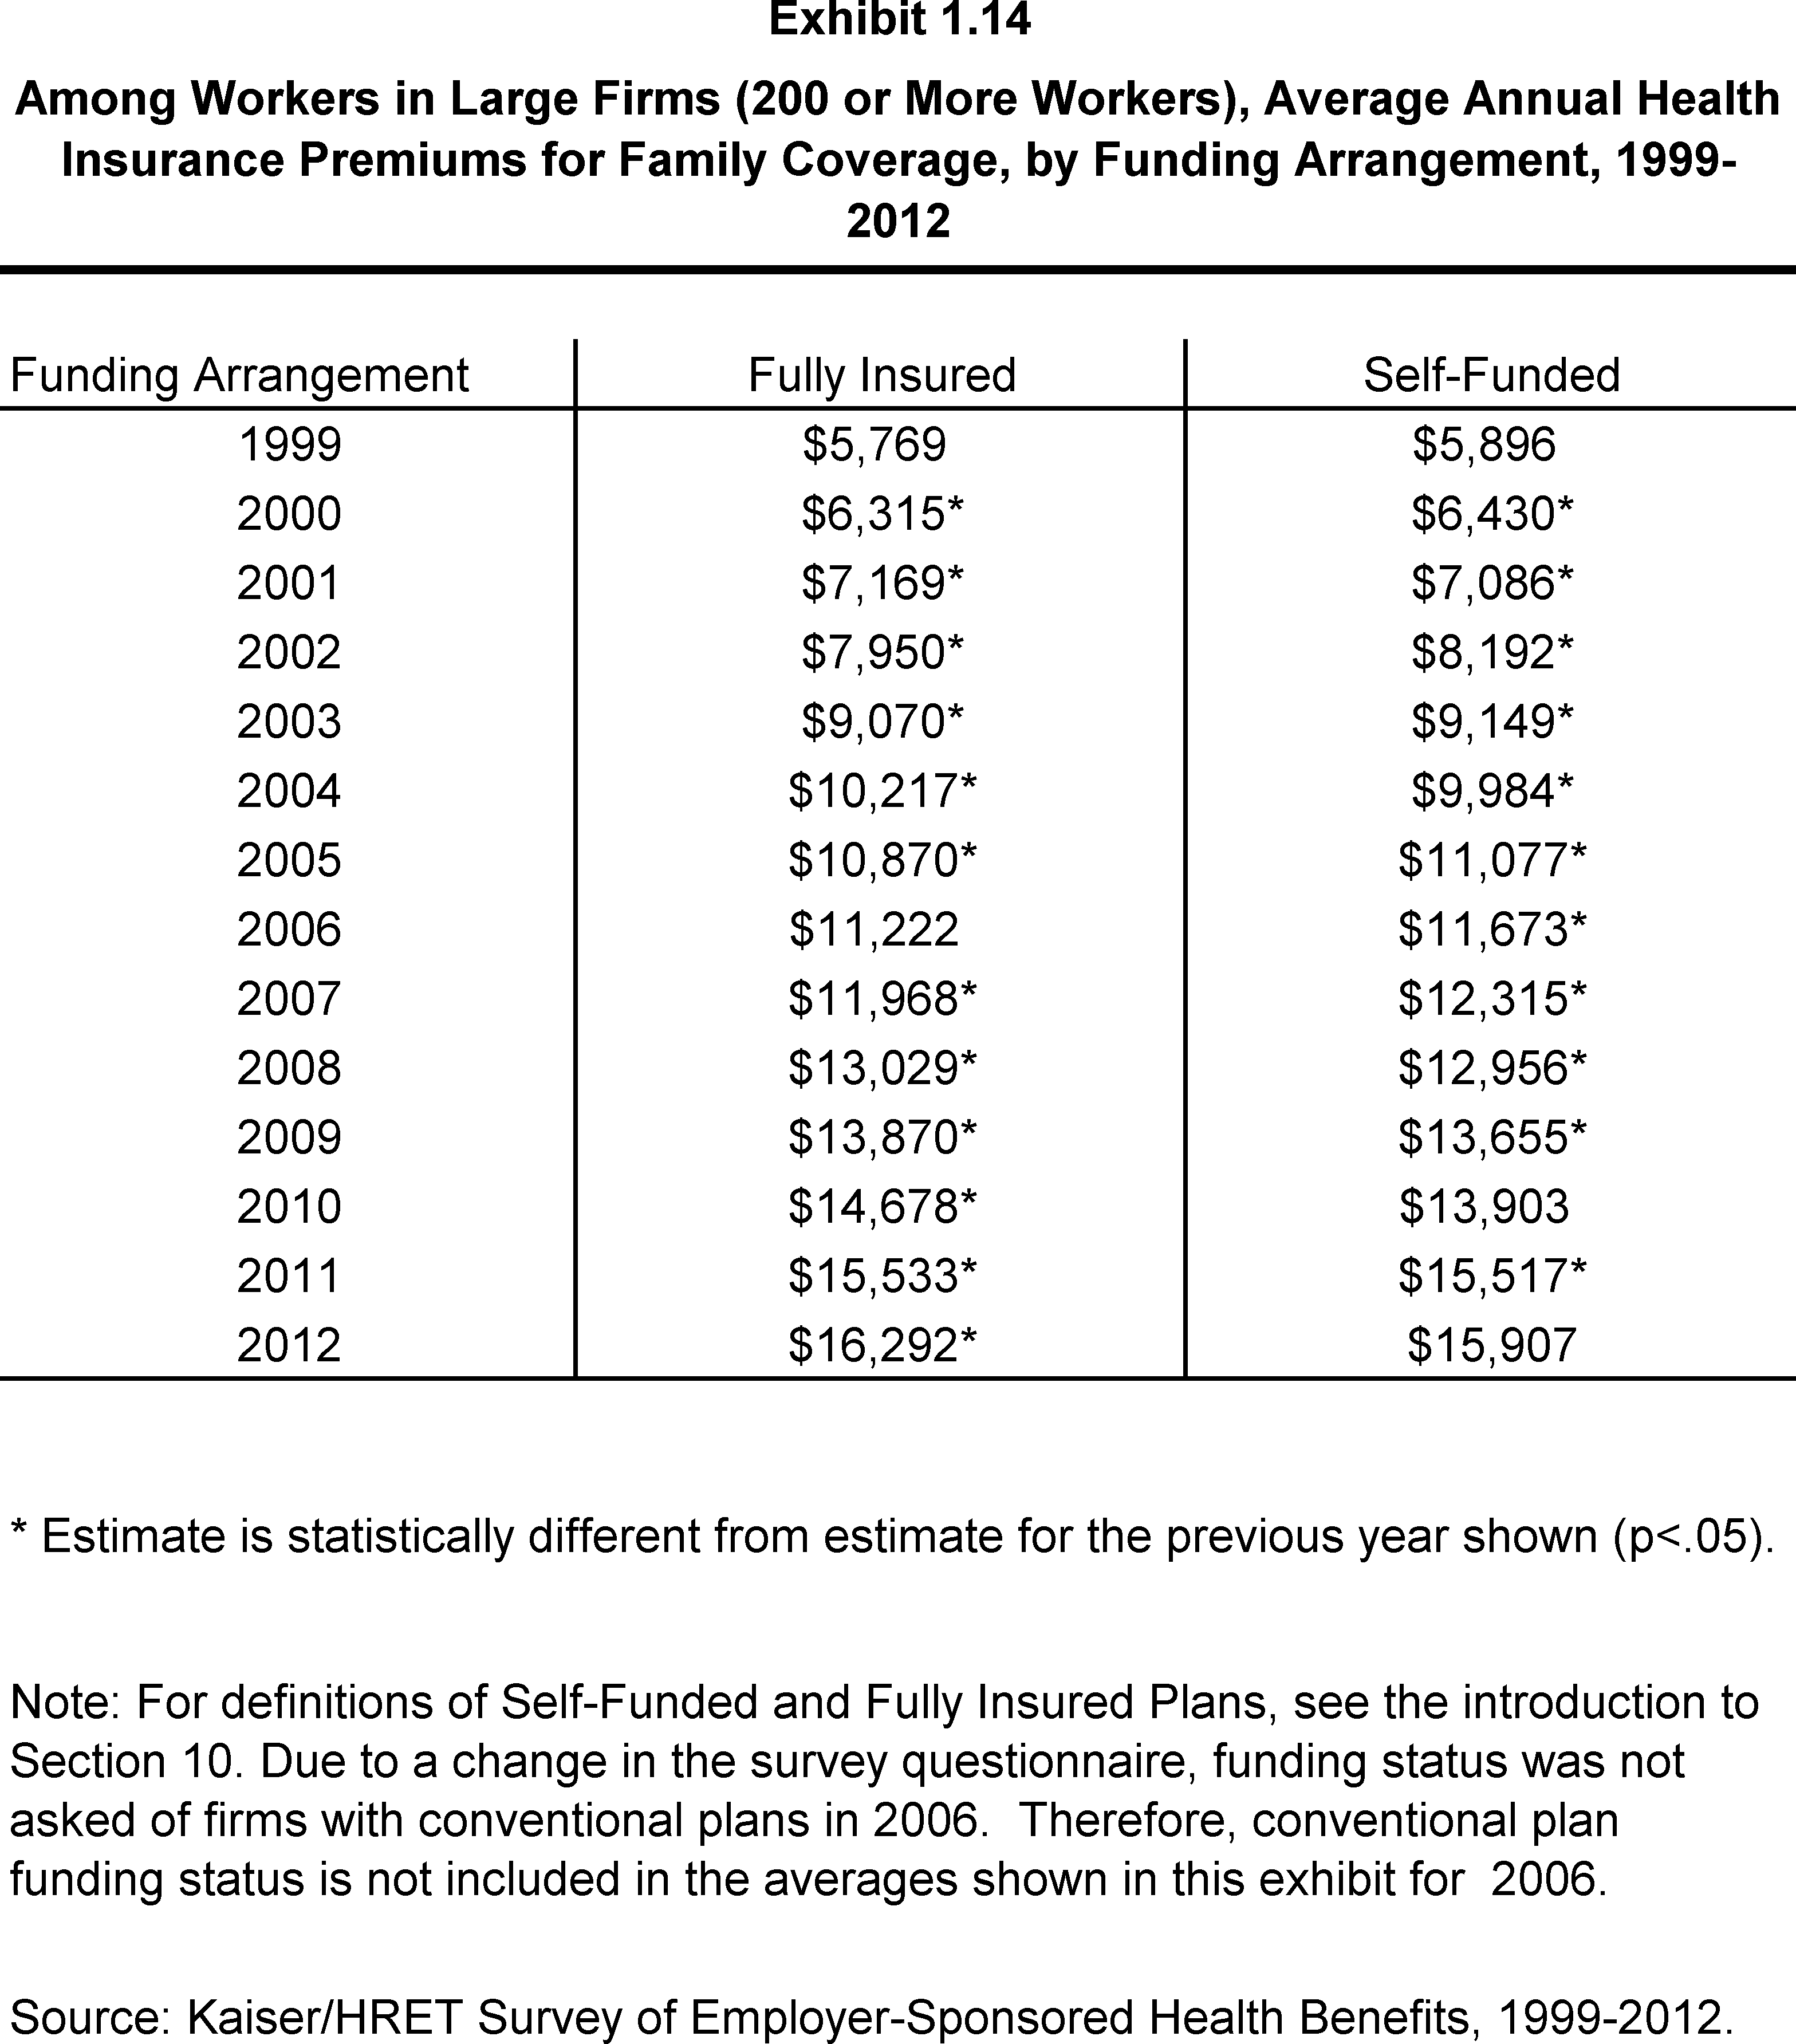
- For large firms (200 or more workers), the average family premium for covered workers in firms that are fully insured has grown at a similar rate to premiums for workers in fully or partially self-funded firms from 2007 to 2012 (36% in fully insured firms vs. 29% in self-funded firms) and from 2002 to 2012 (105% in fully insured firms vs. 94% in self-funded firms) (Exhibit 1.14).
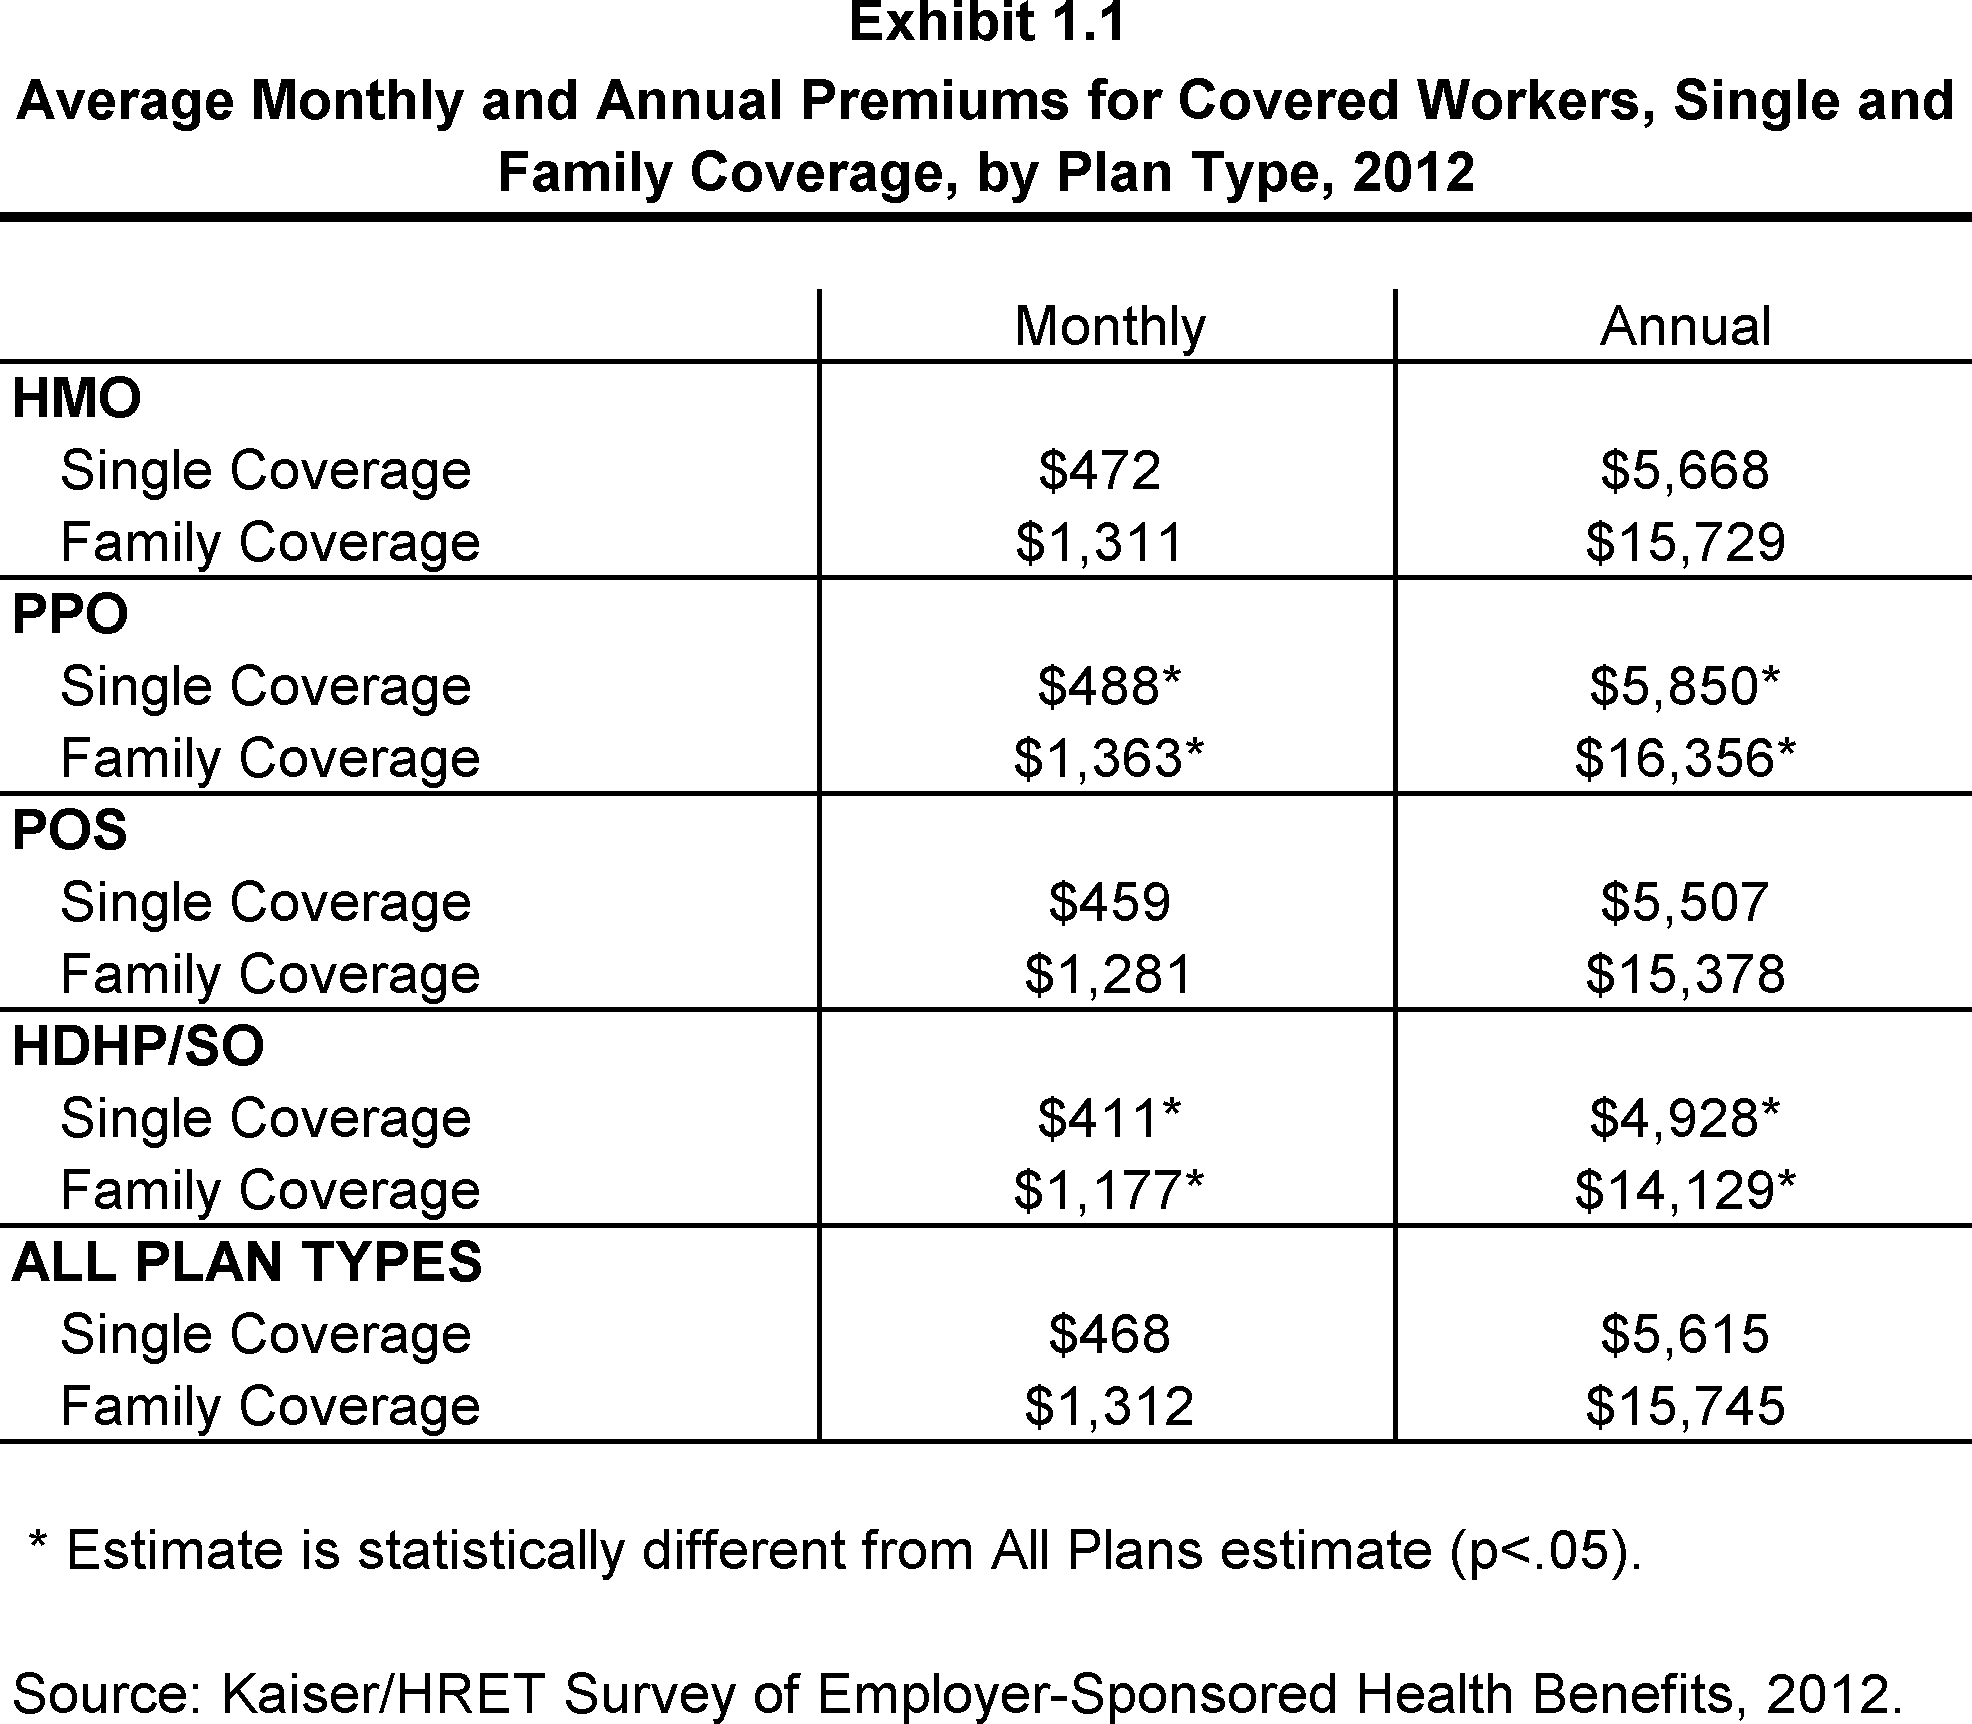
Average Monthly and Annual Premiums for Covered Workers, Single and Family Coverage, by Plan Type, 2012
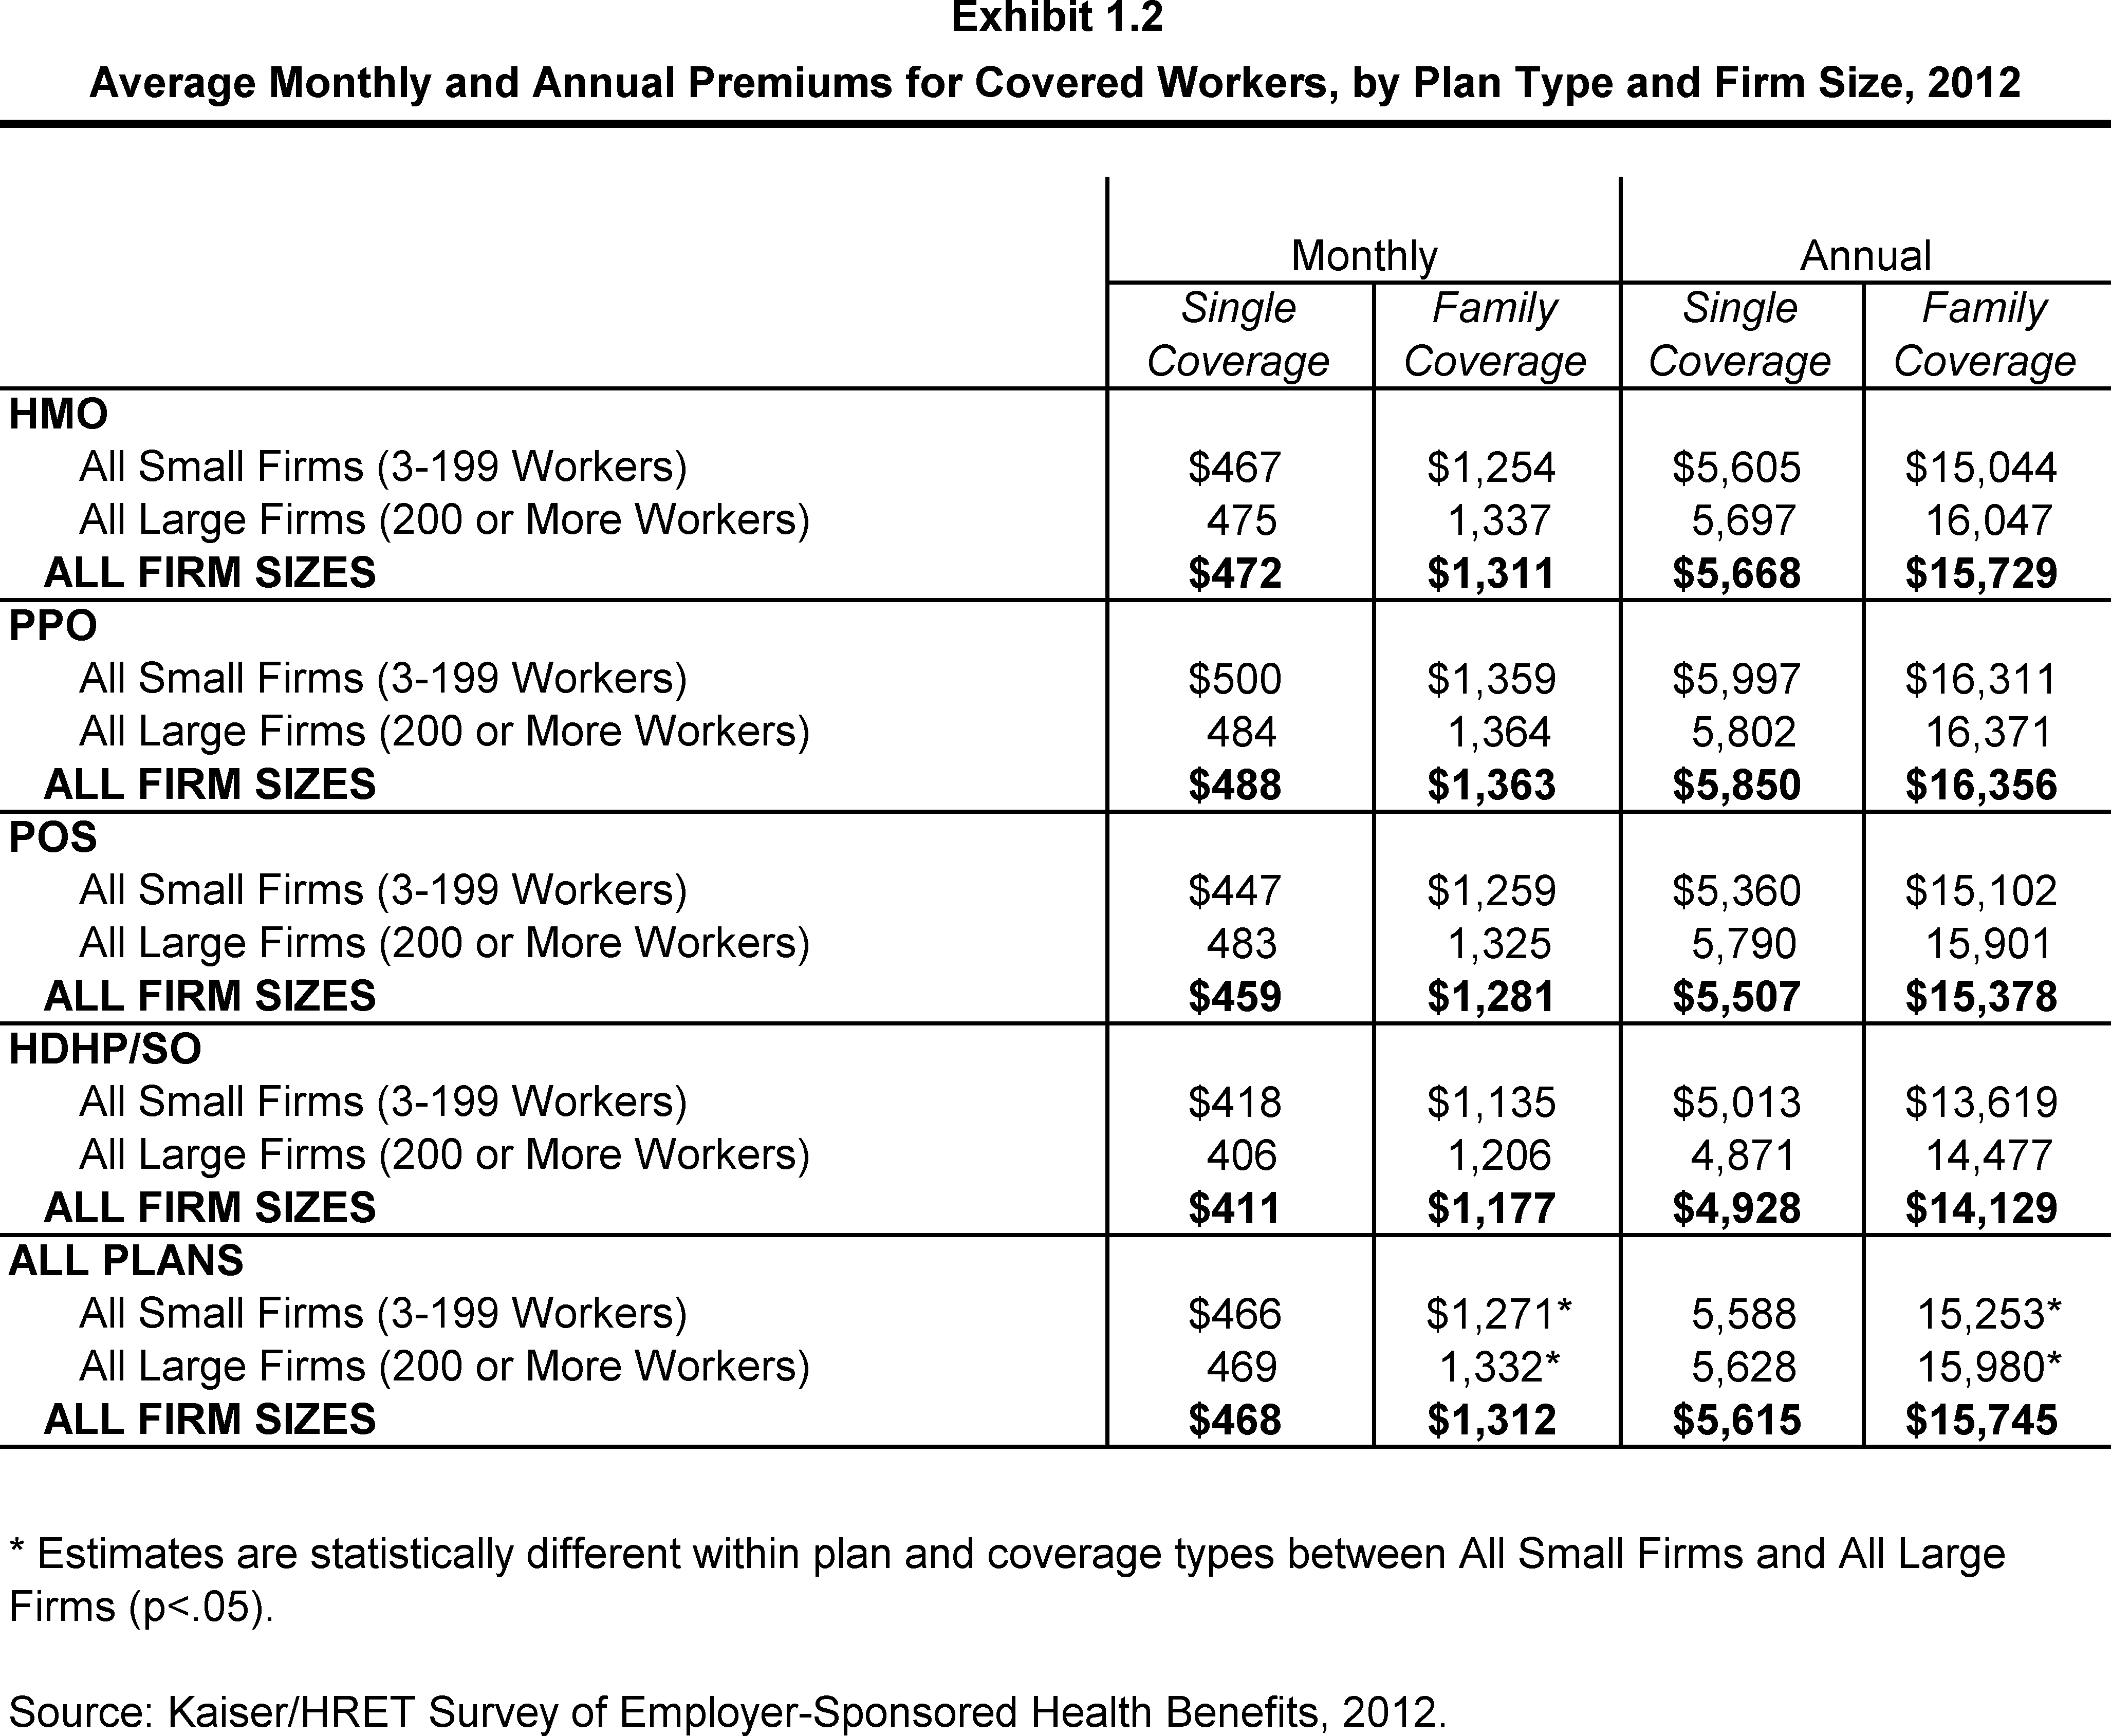
Average Monthly and Annual Premiums for Covered Workers, by Plan Type and Firm Size, 2012
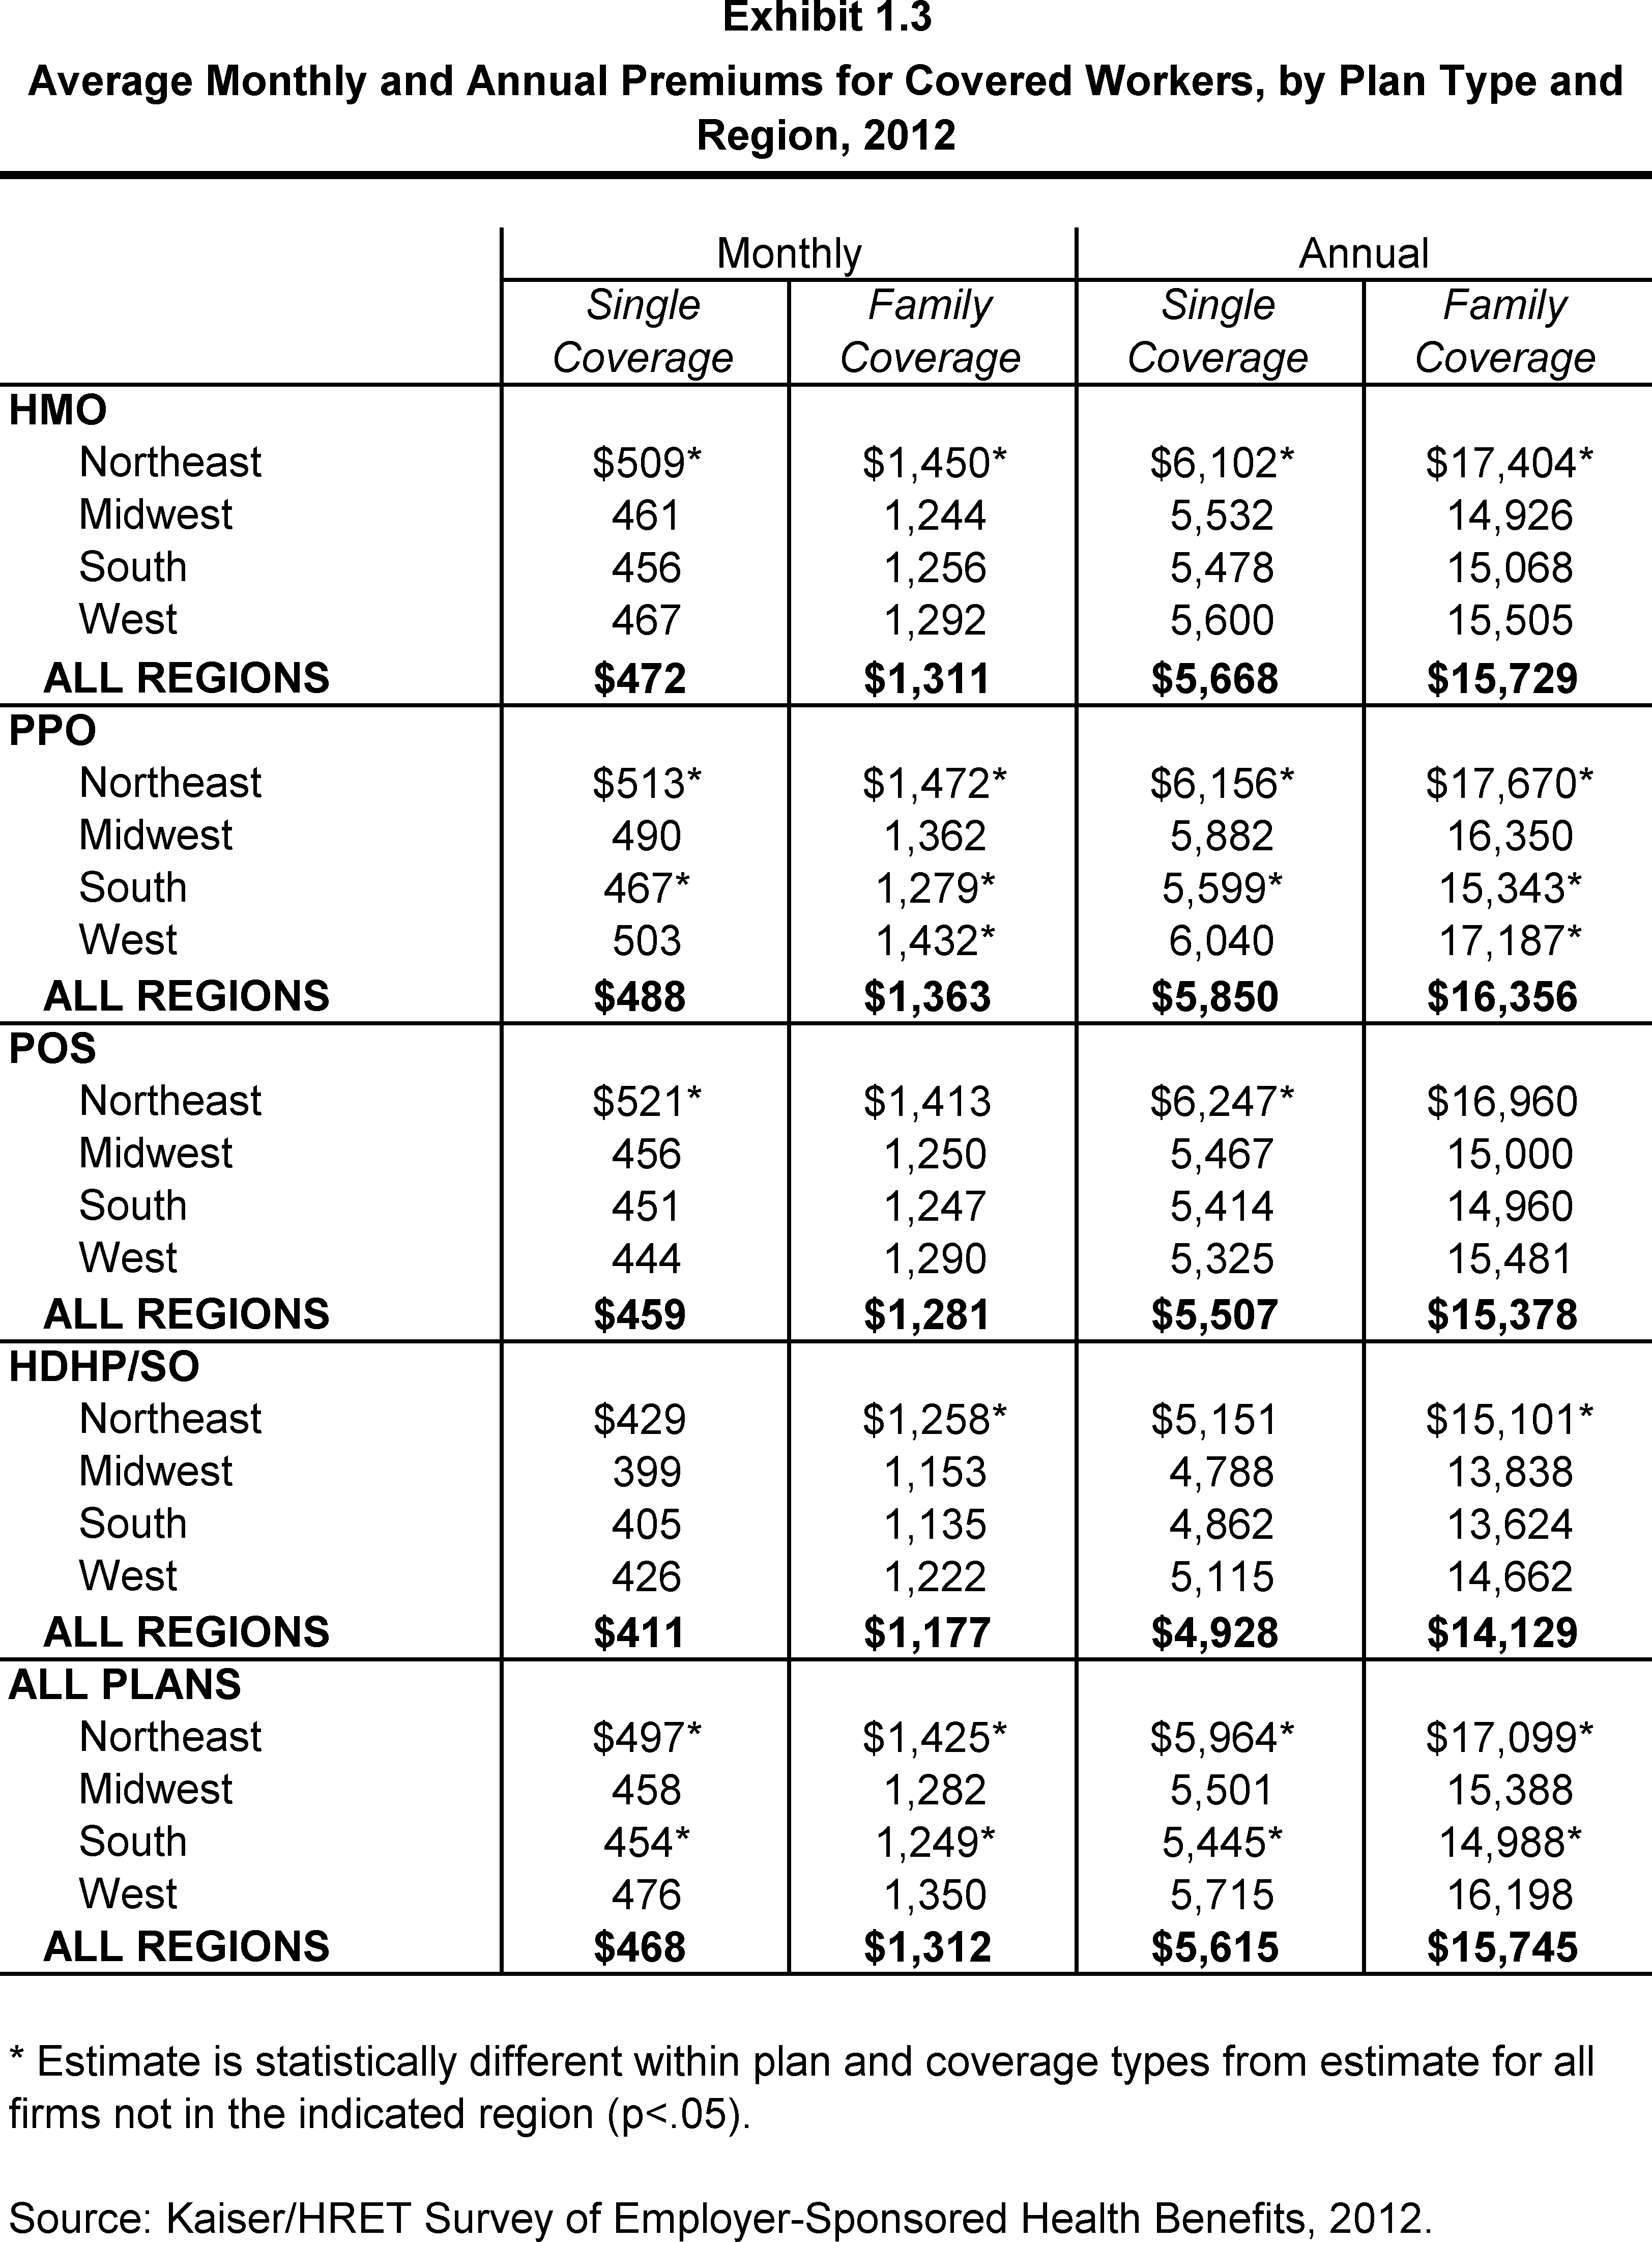
Average Monthly and Annual Premiums for Covered Workers, by Plan Type and Region, 2012
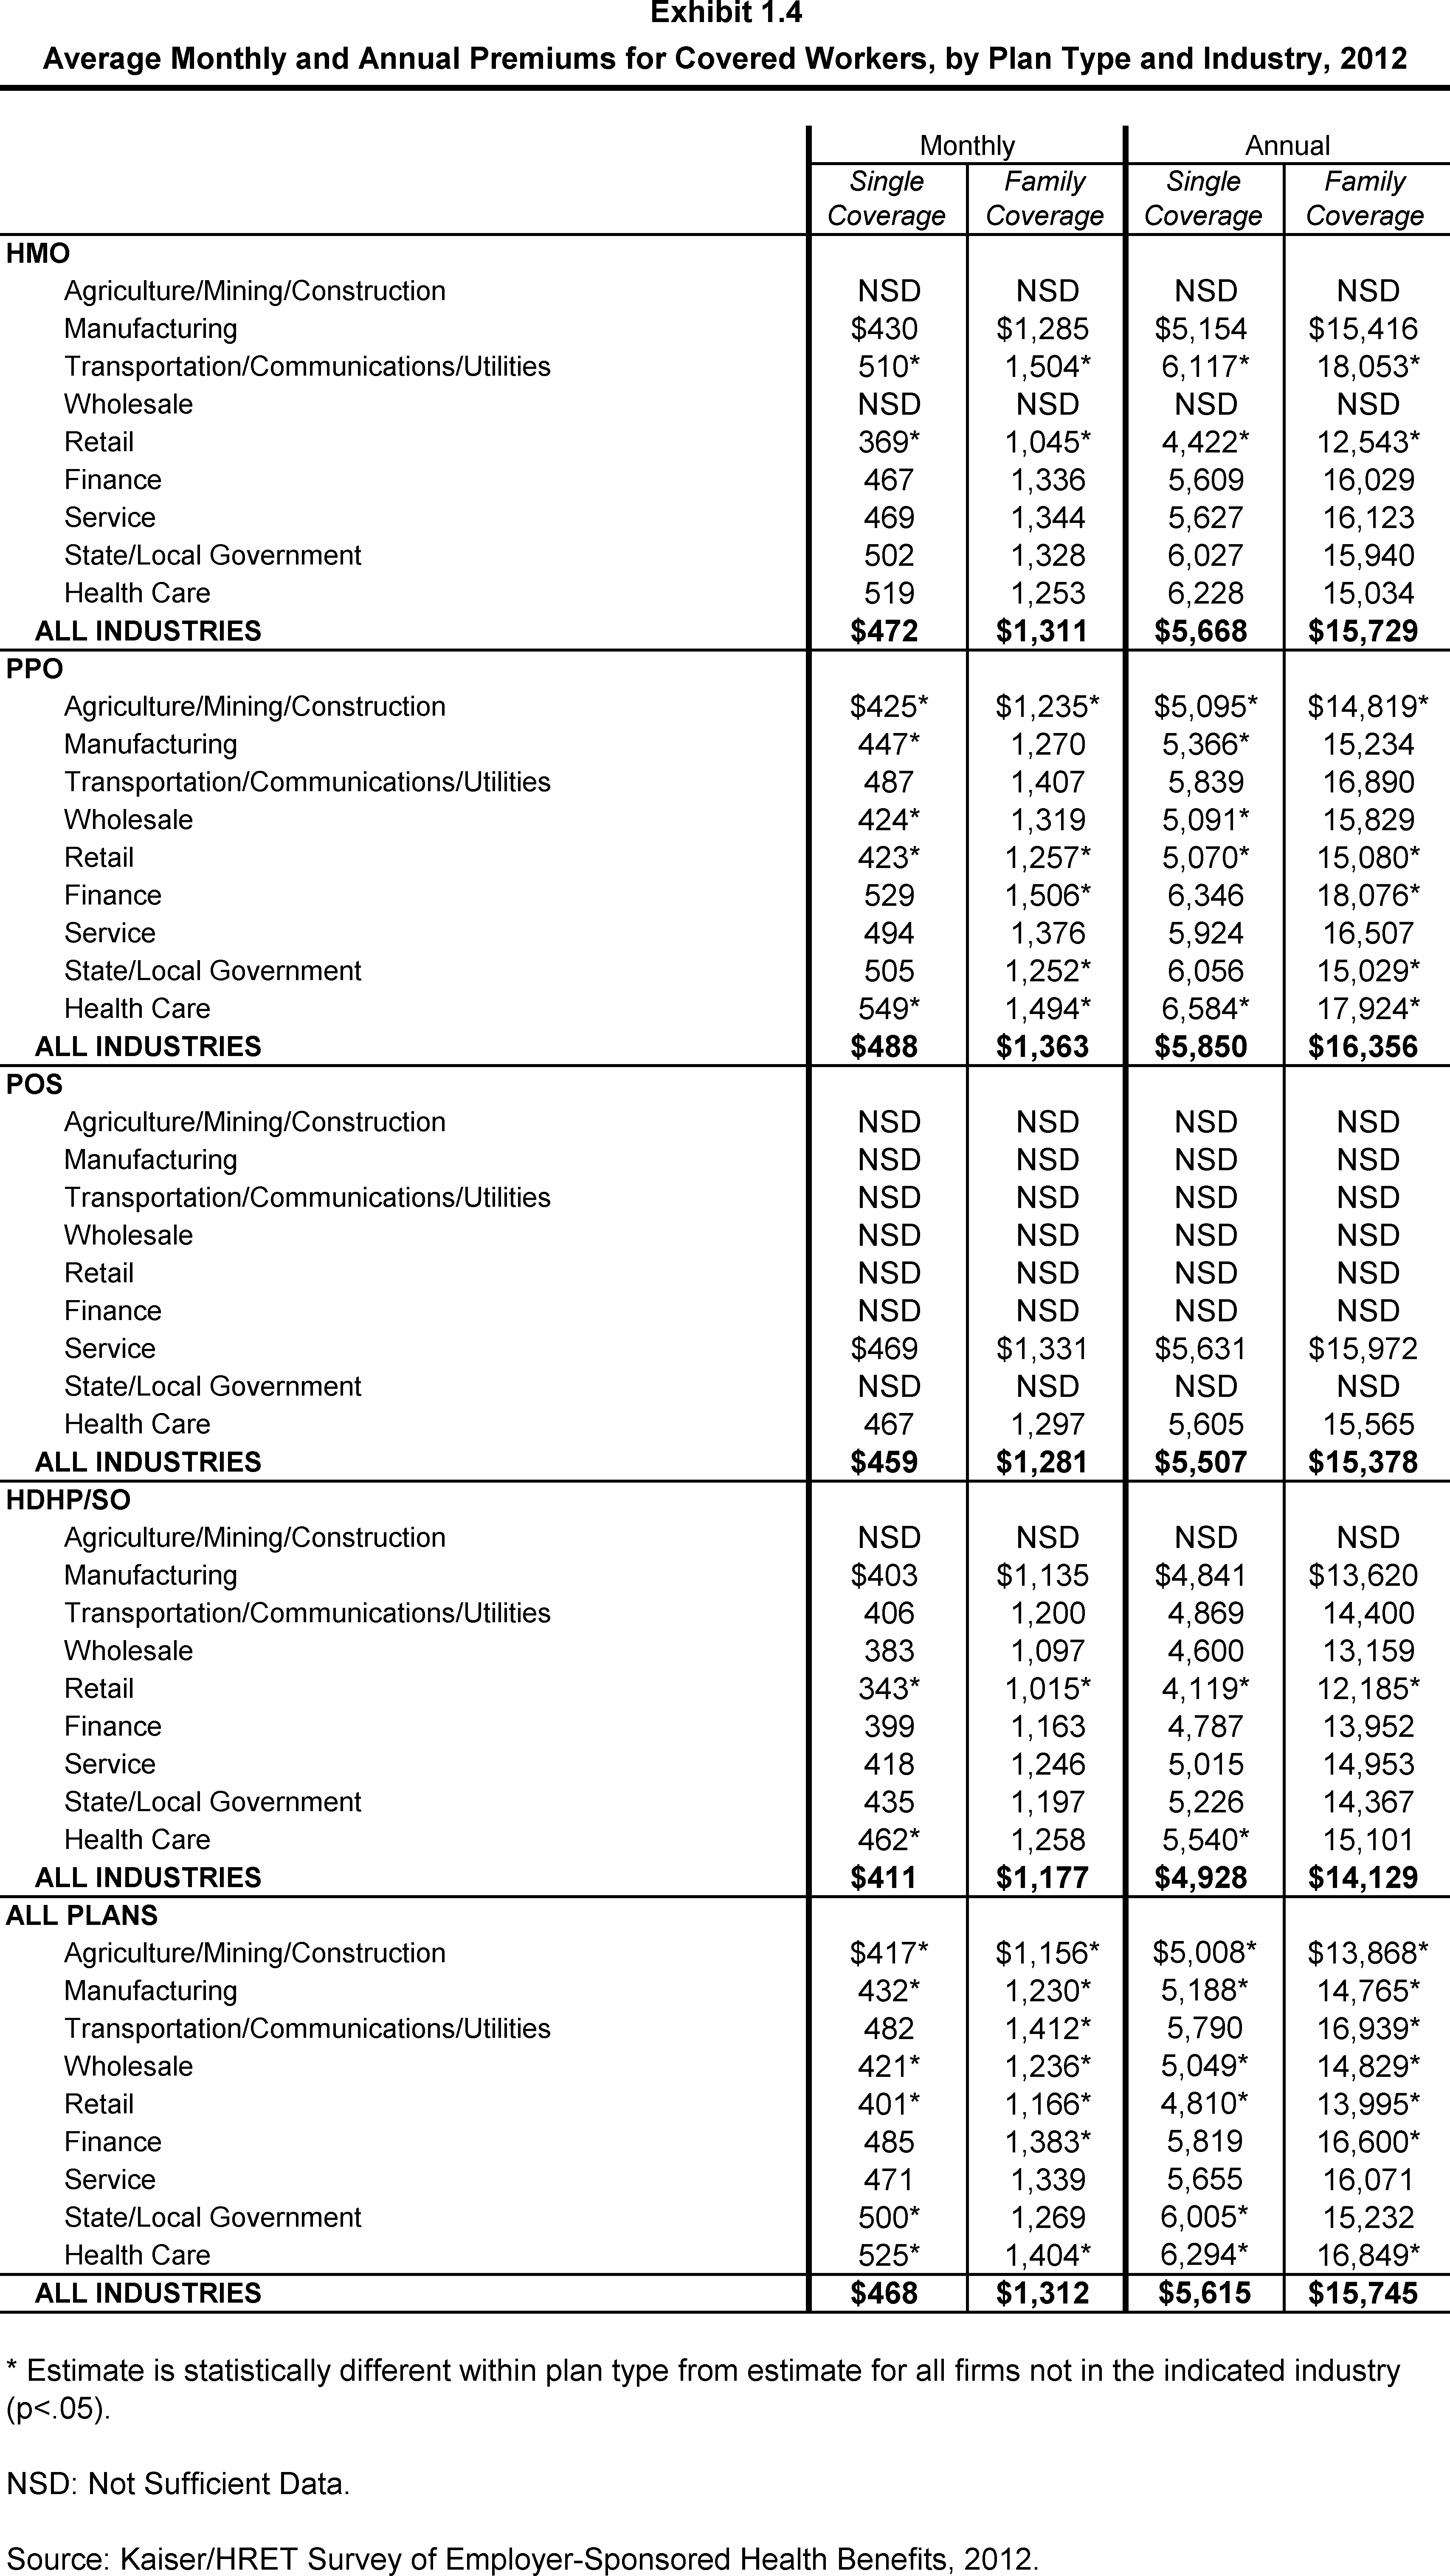
Average Monthly and Annual Premiums for Covered Workers, by Plan Type and Industry, 2012
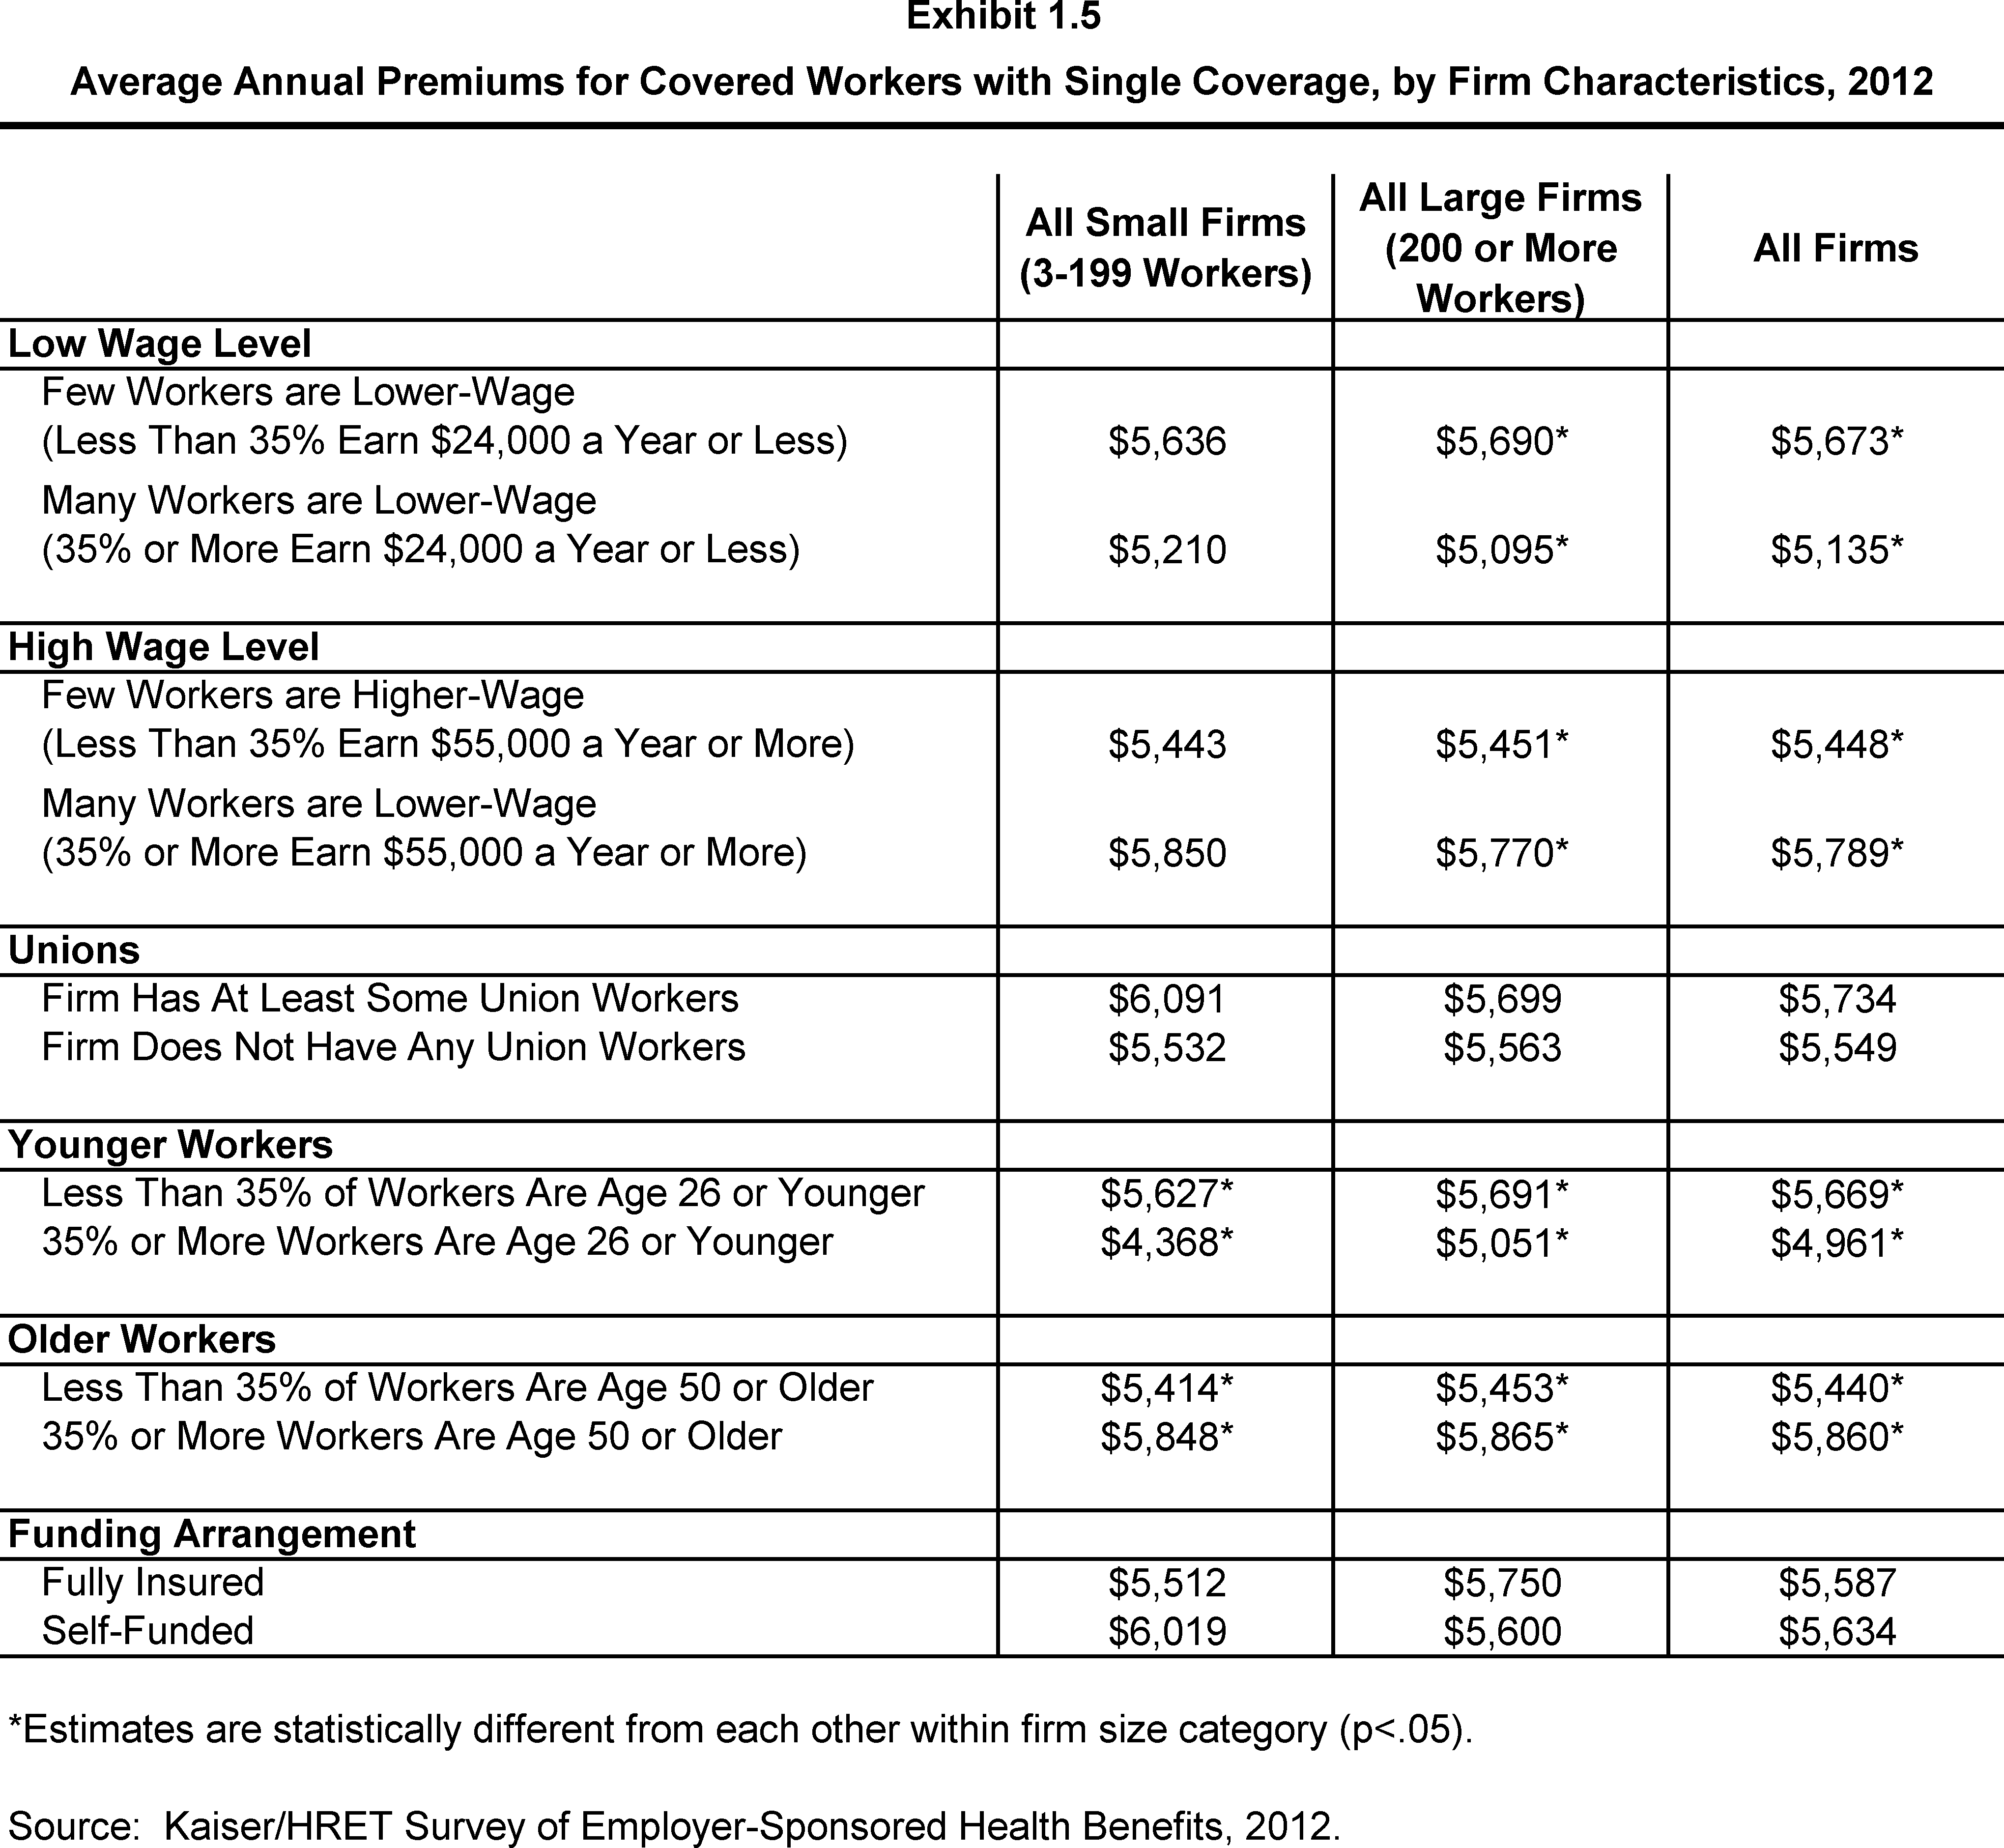
Average Annual Premiums for Covered Workers with Single Coverage, by Firm Characteristics, 2012
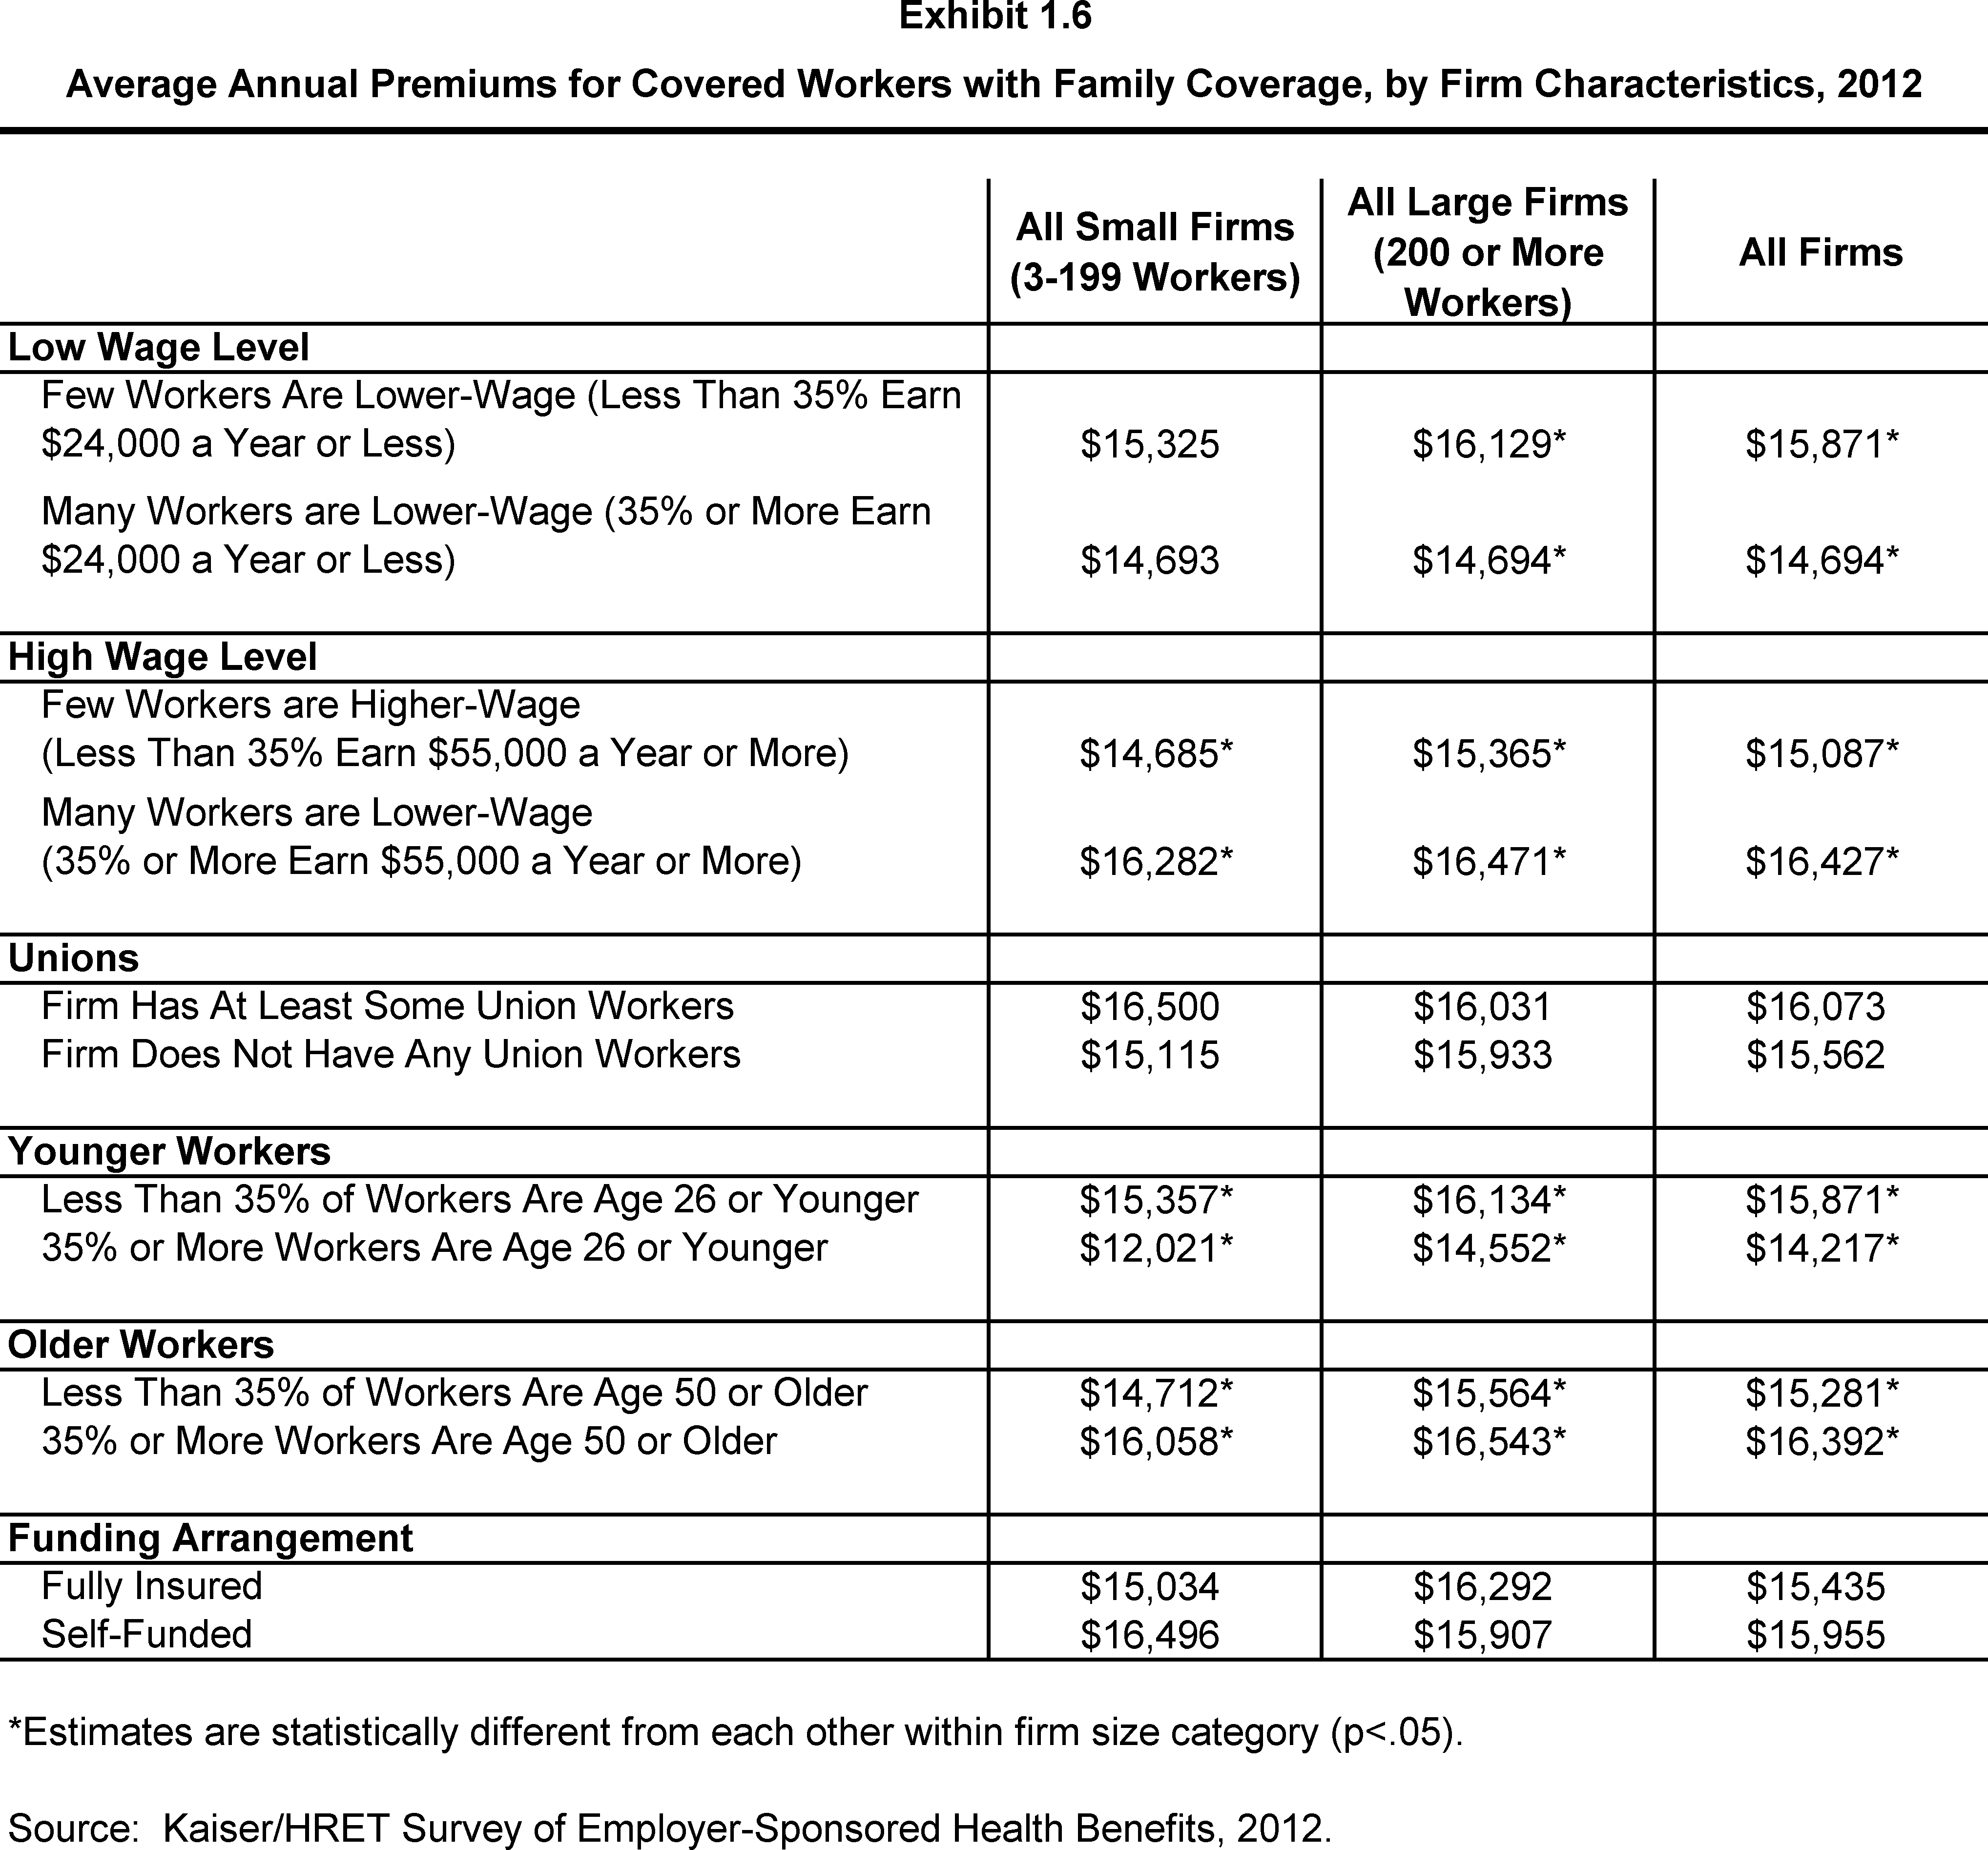
Average Annual Premiums for Covered Workers with Family Coverage, by Firm Characteristics, 2012
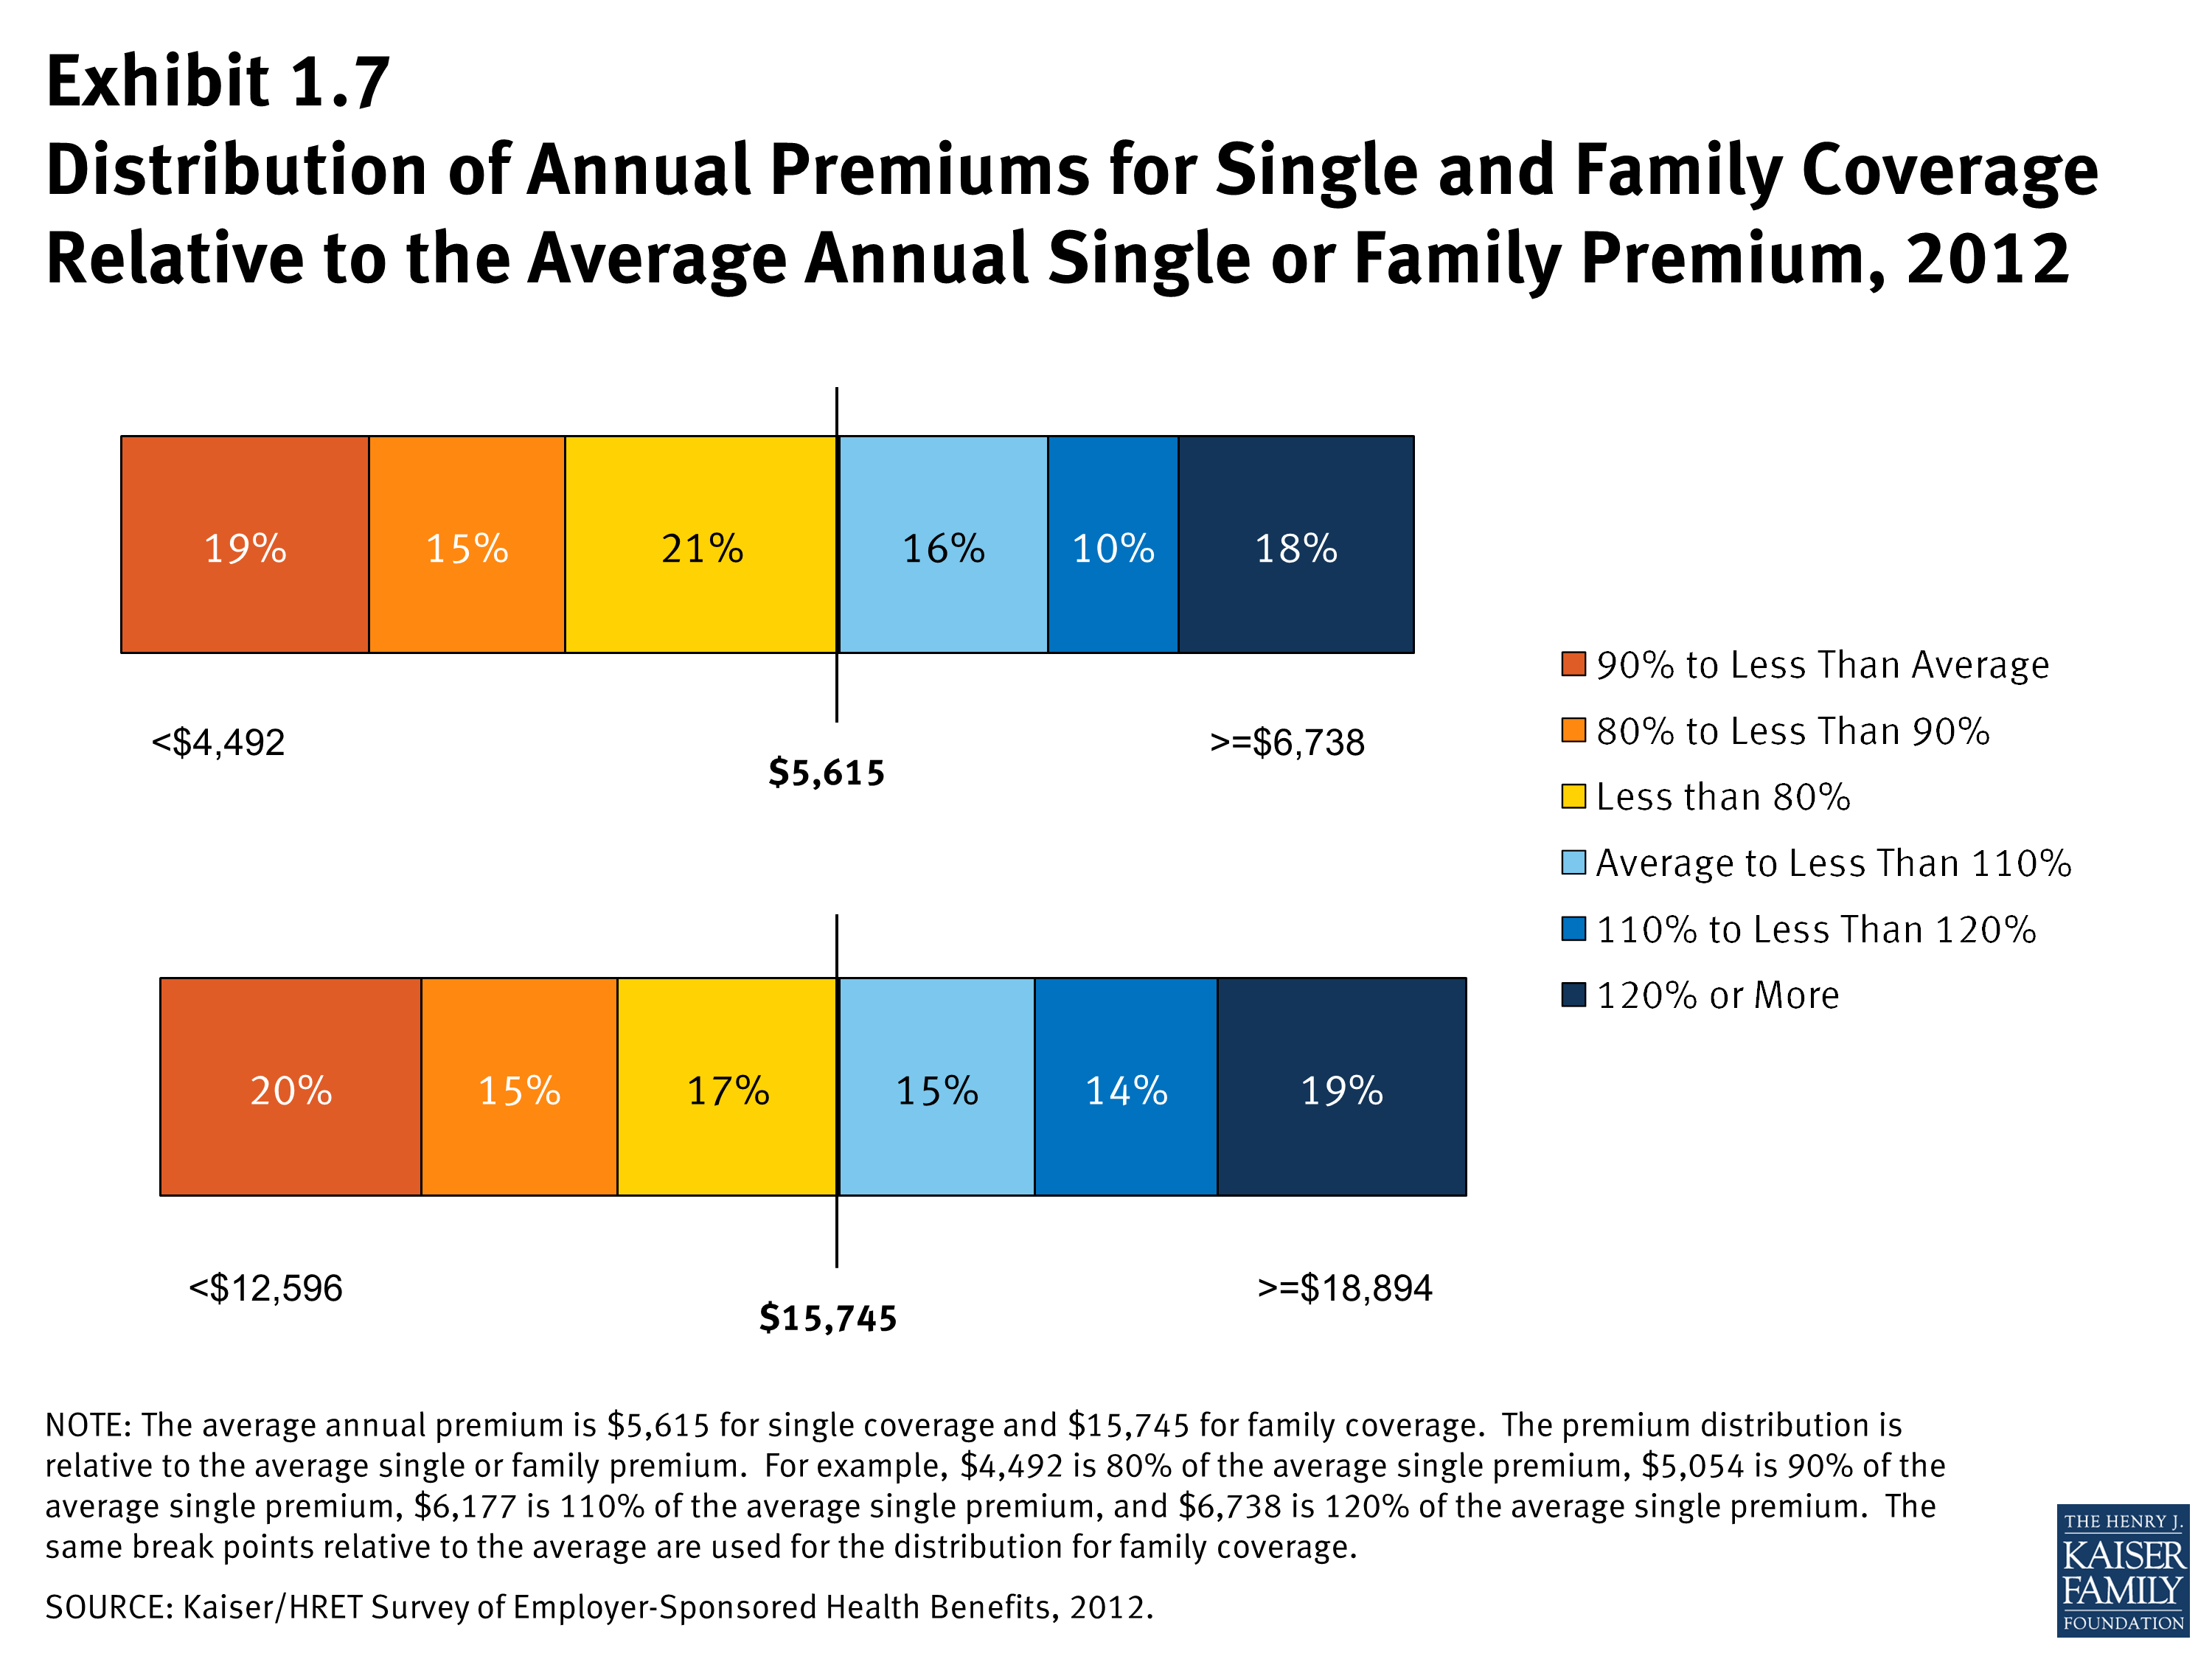
Distribution of Annual Premiums for Single and Family Coverage Relative to the Average Annual Single or Family Premium, 2012
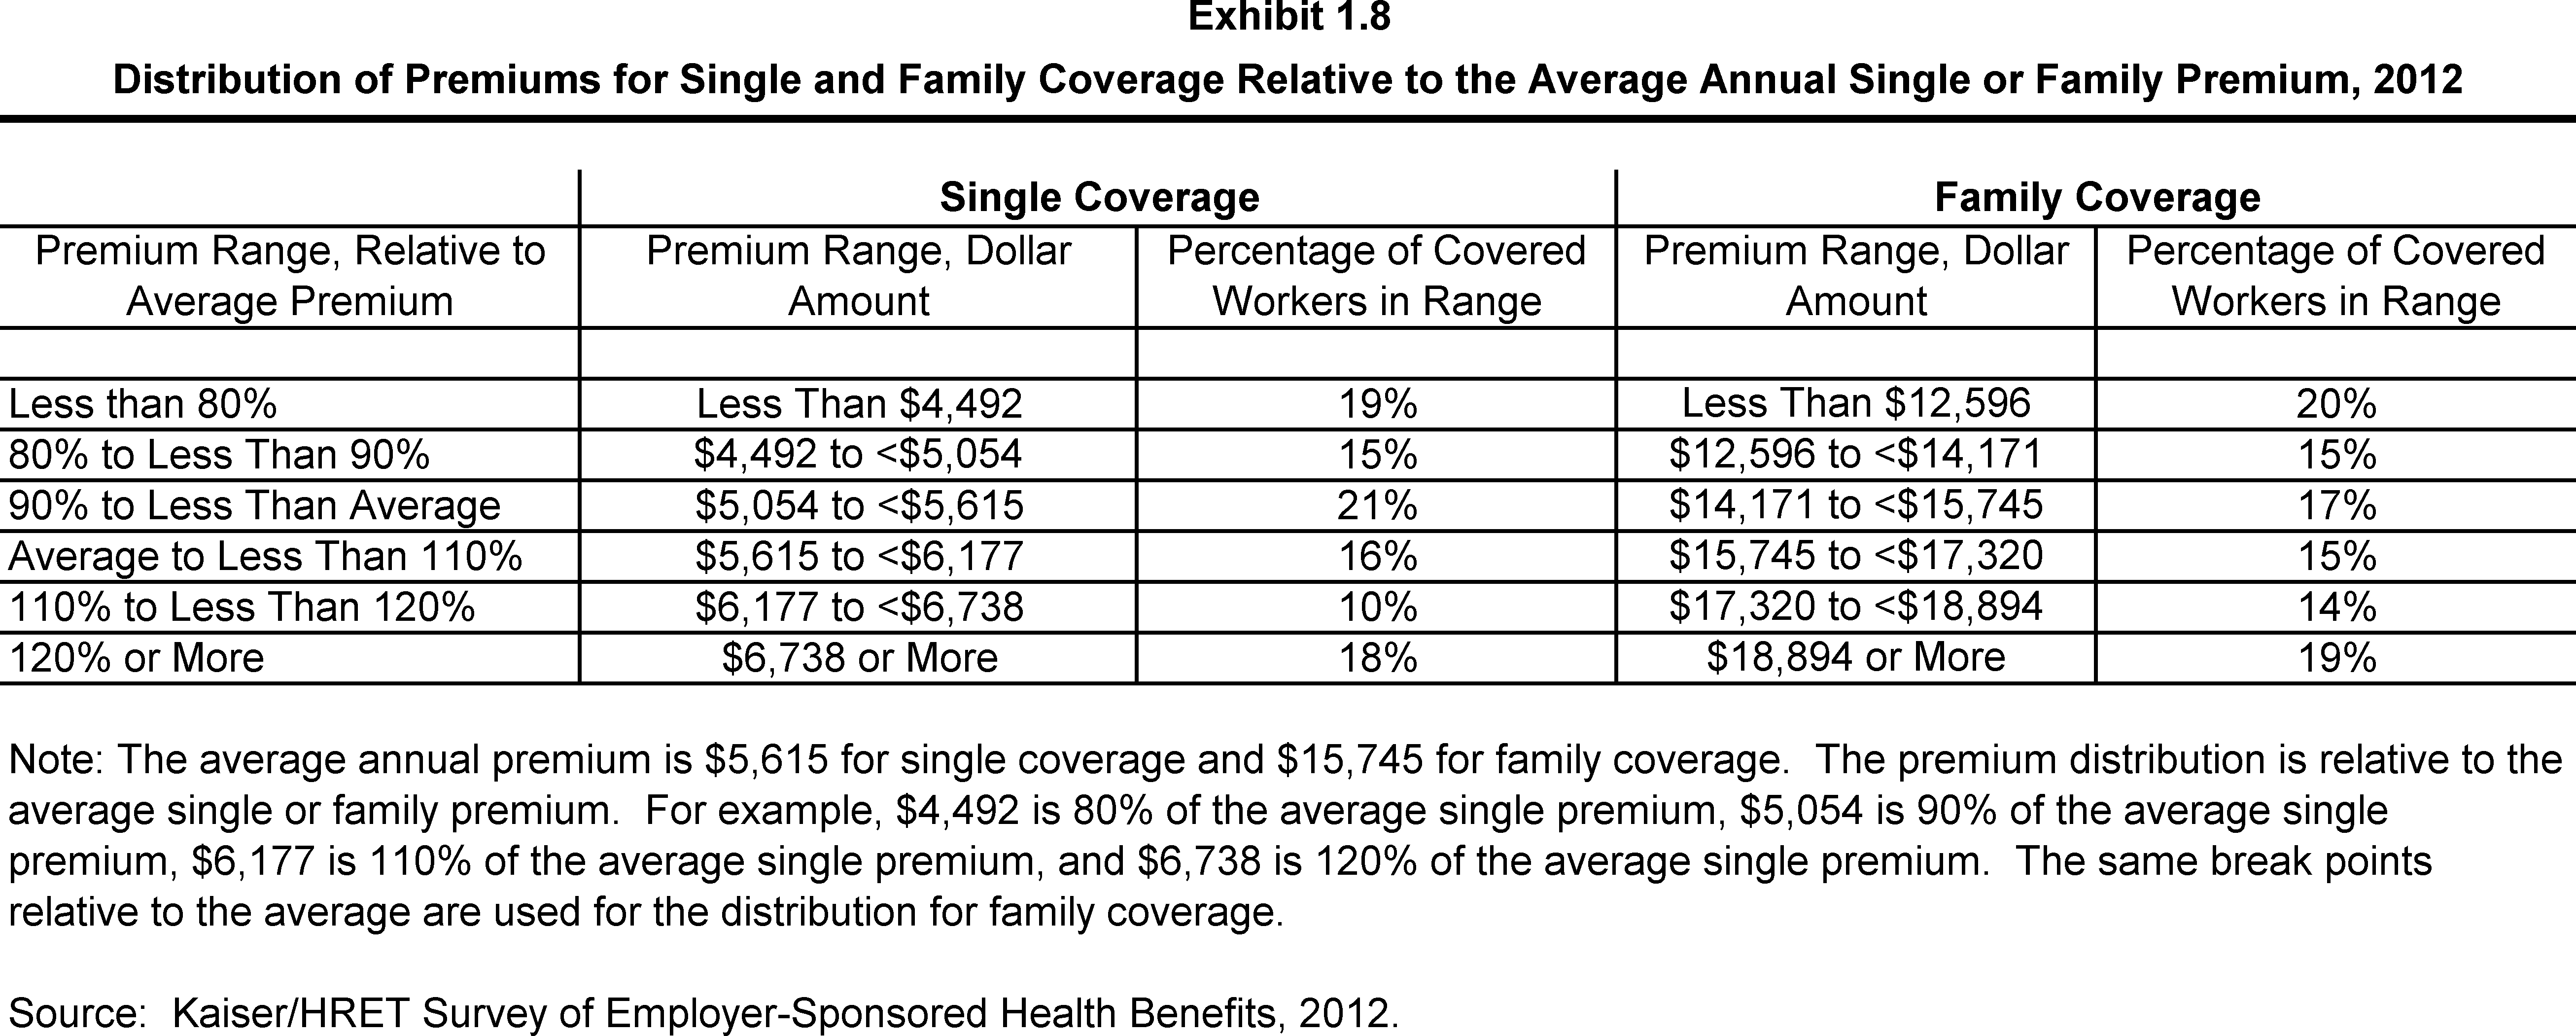
Distribution of Premiums for Single and Family Coverage Relative to the Average Annual Single or Family Premium, 2012

Distribution of Annual Premiums for Covered Workers with Single Coverage, 2012
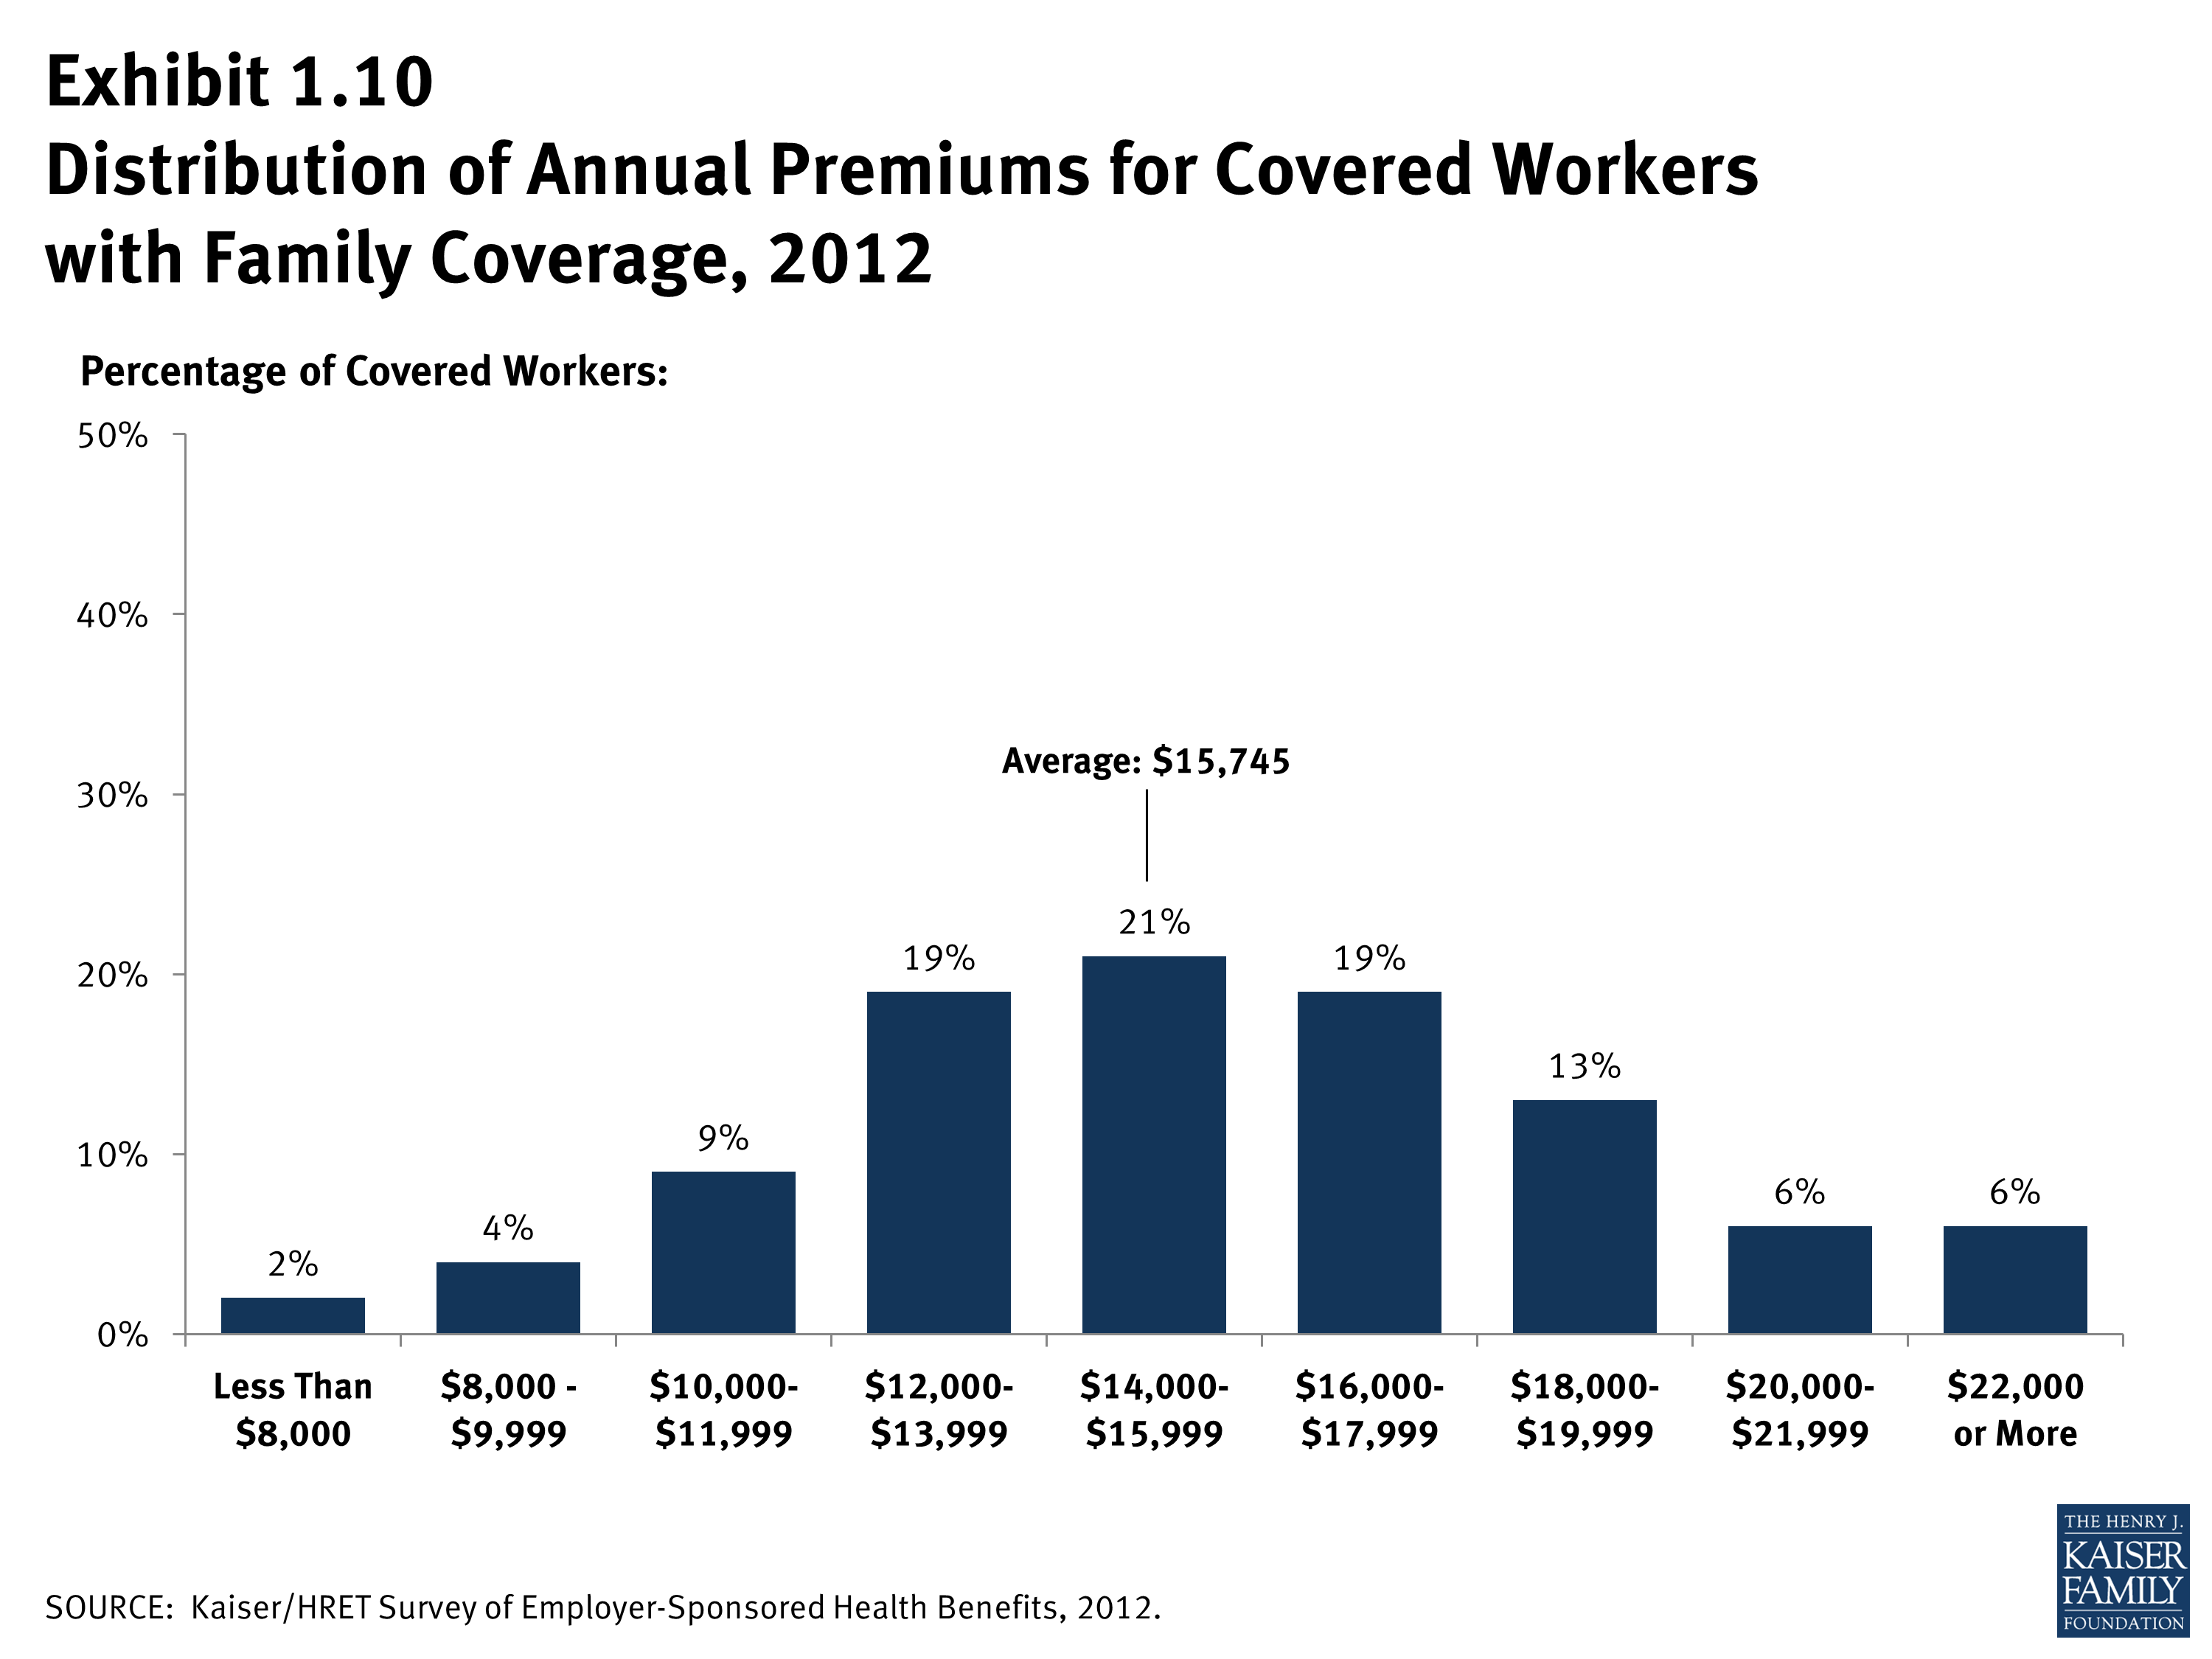
Distribution of Annual Premiums for Covered Workers with Family Coverage, 2012
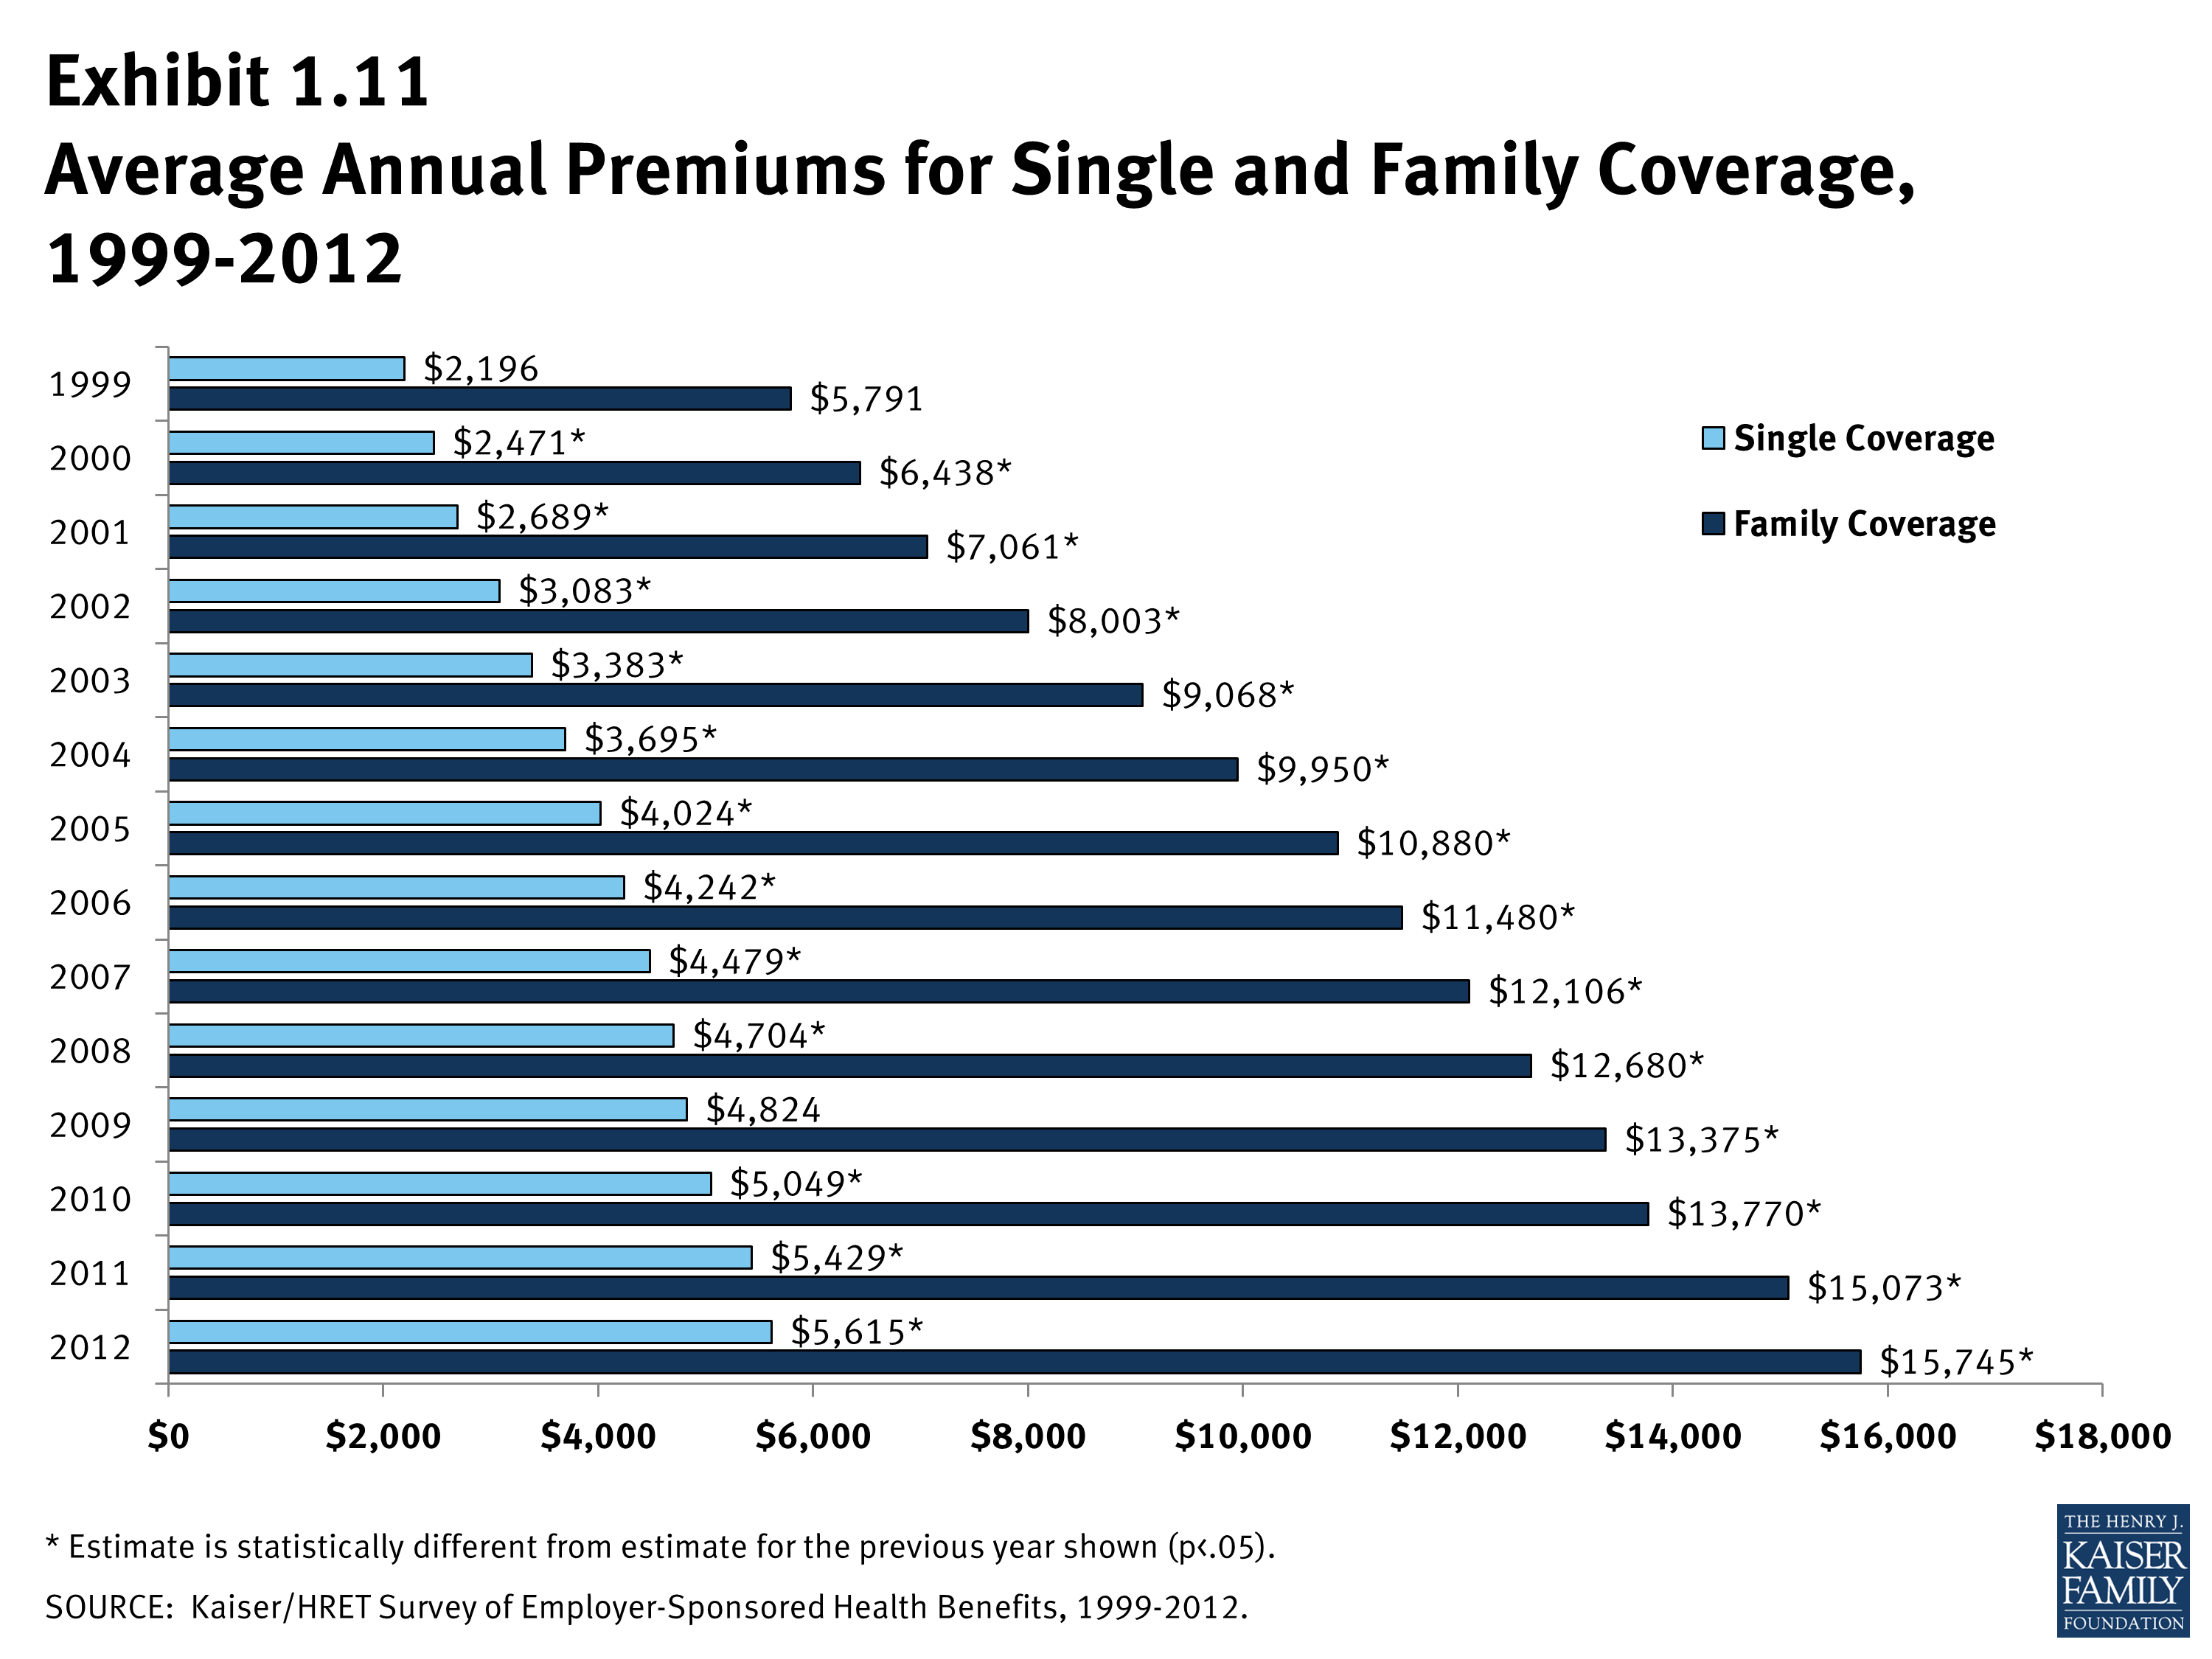
Average Annual Premiums for Single and Family Coverage, 1999-2012
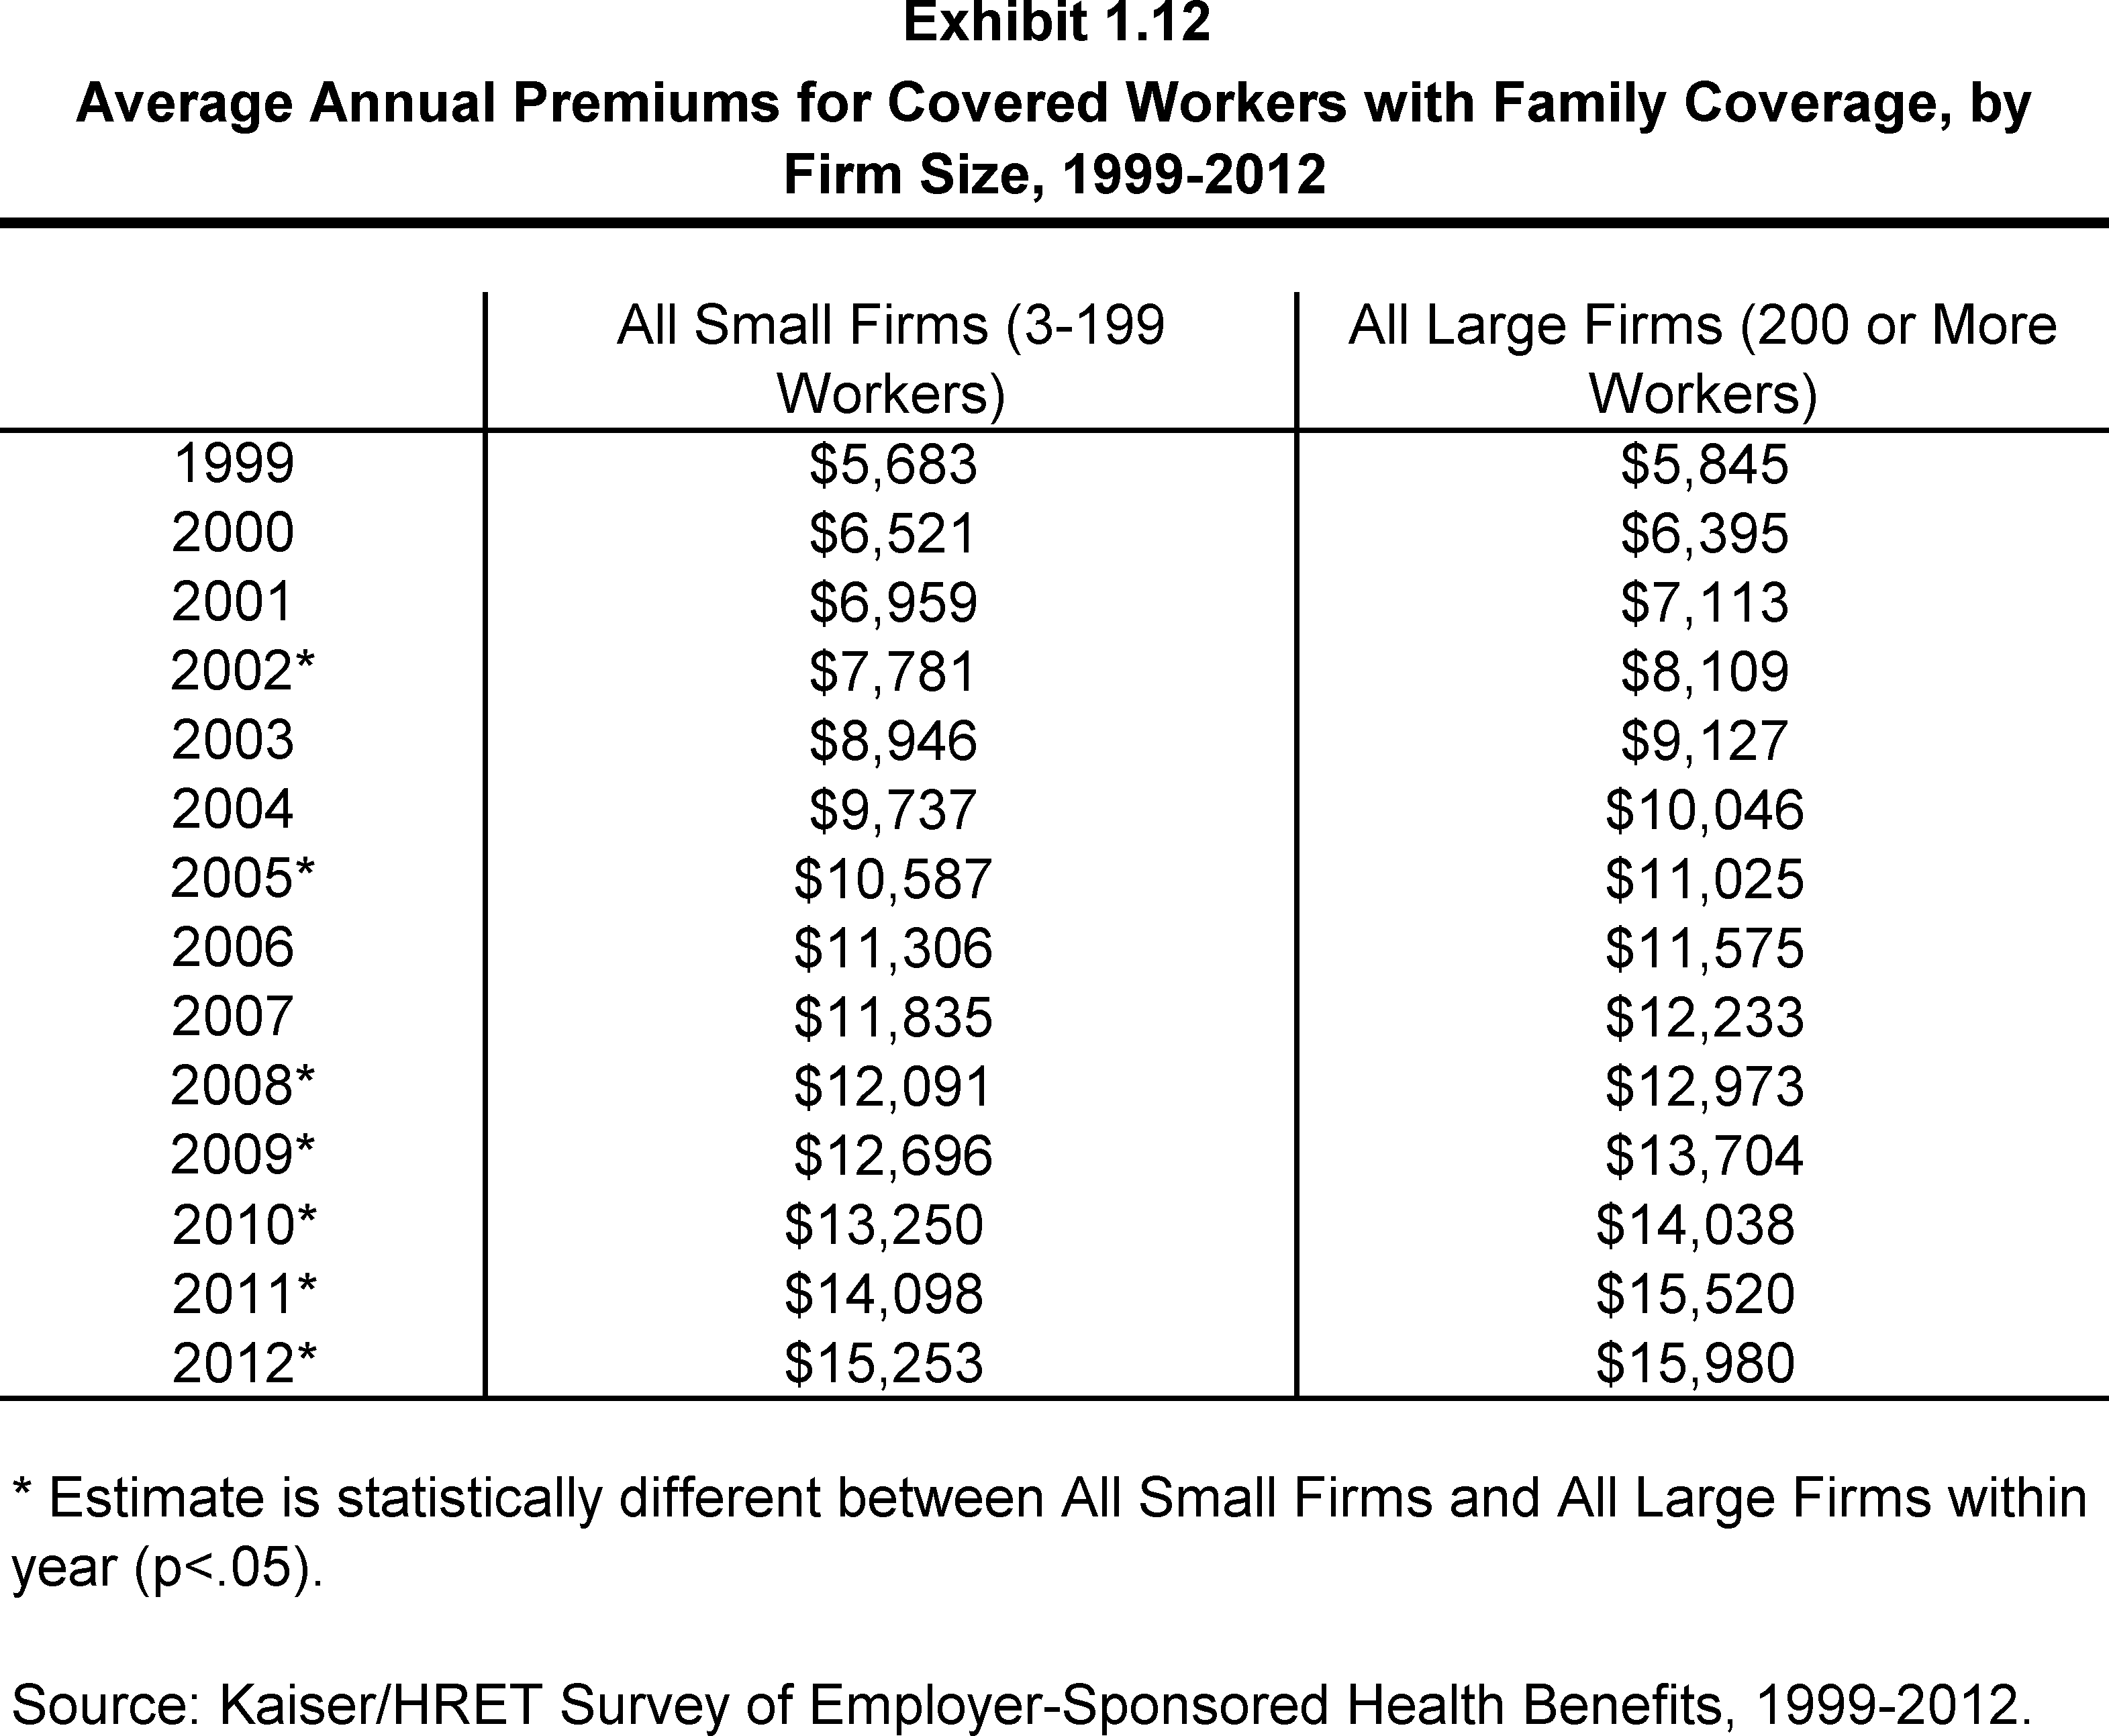
Average Annual Premiums for Covered Workers with Family Coverage, by Firm Size, 1999-2012
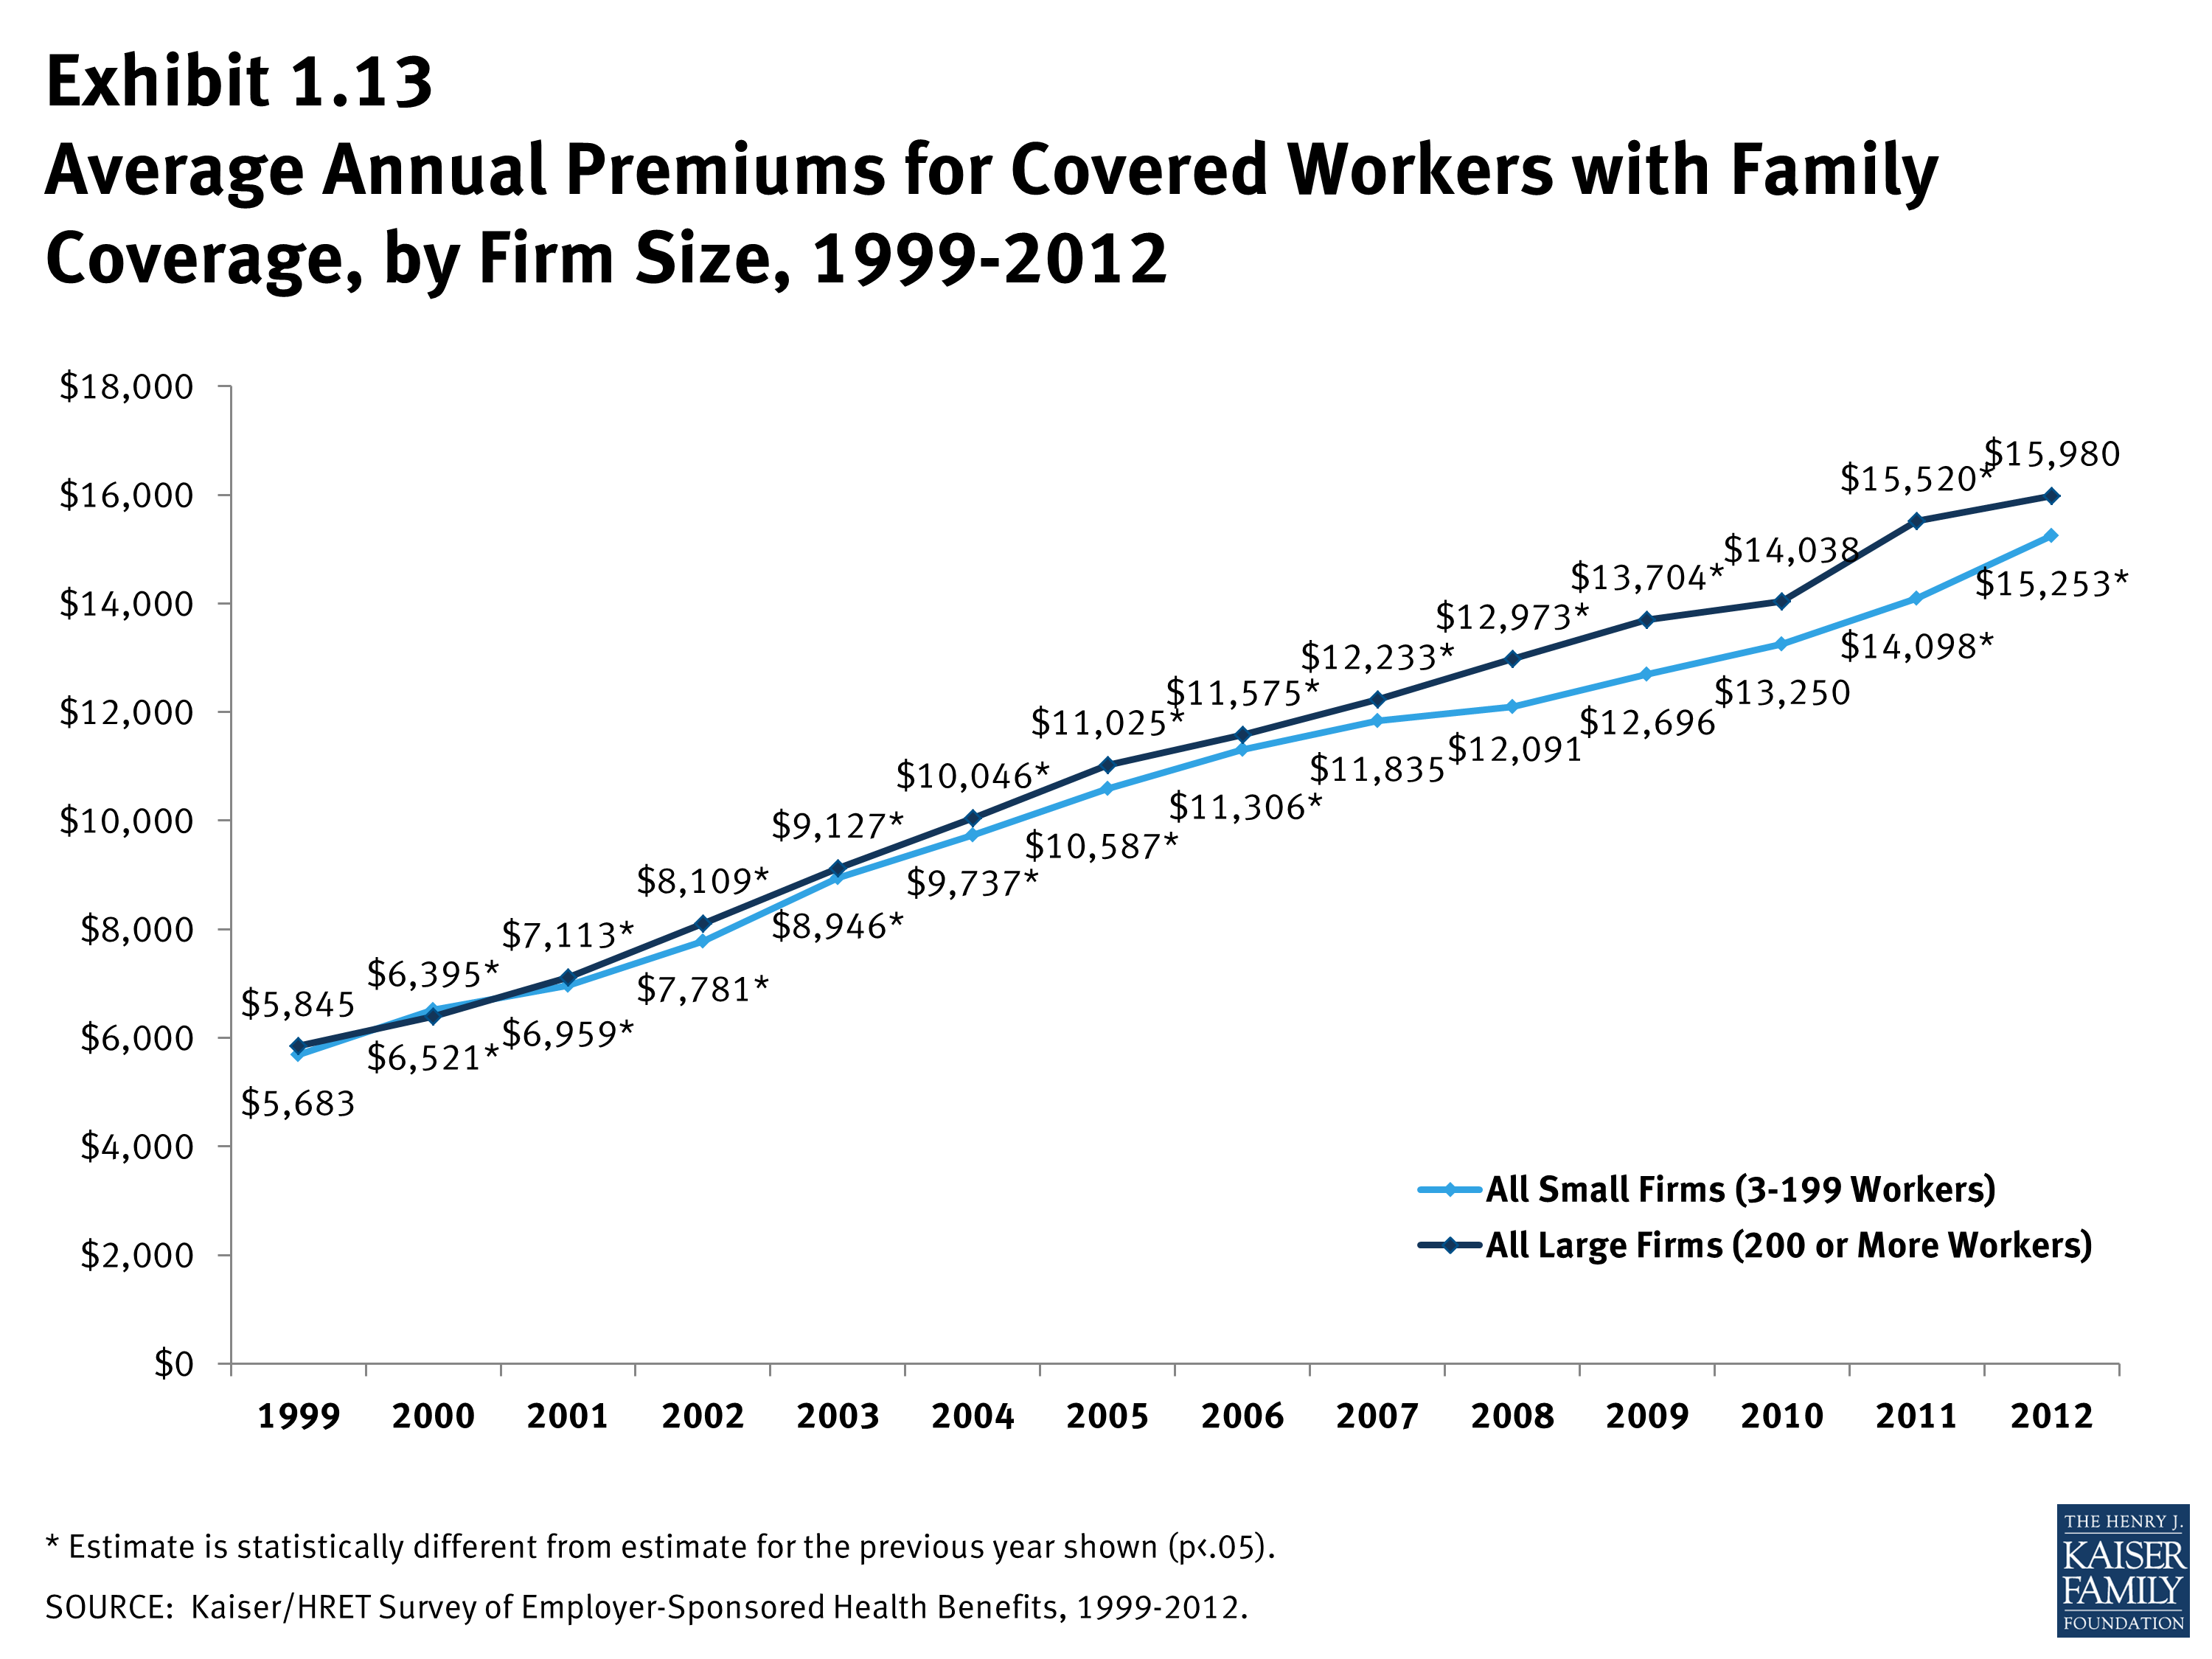
Average Annual Premiums for Covered Workers with Family Coverage, by Firm Size, 1999-2012
Among Workers in Large Firms (200 or More Workers), Average Annual Health Insurance Premiums for Family Coverage, by Funding Arrangement, 1999-2012
Section 2: Health Benefit Offer Rates
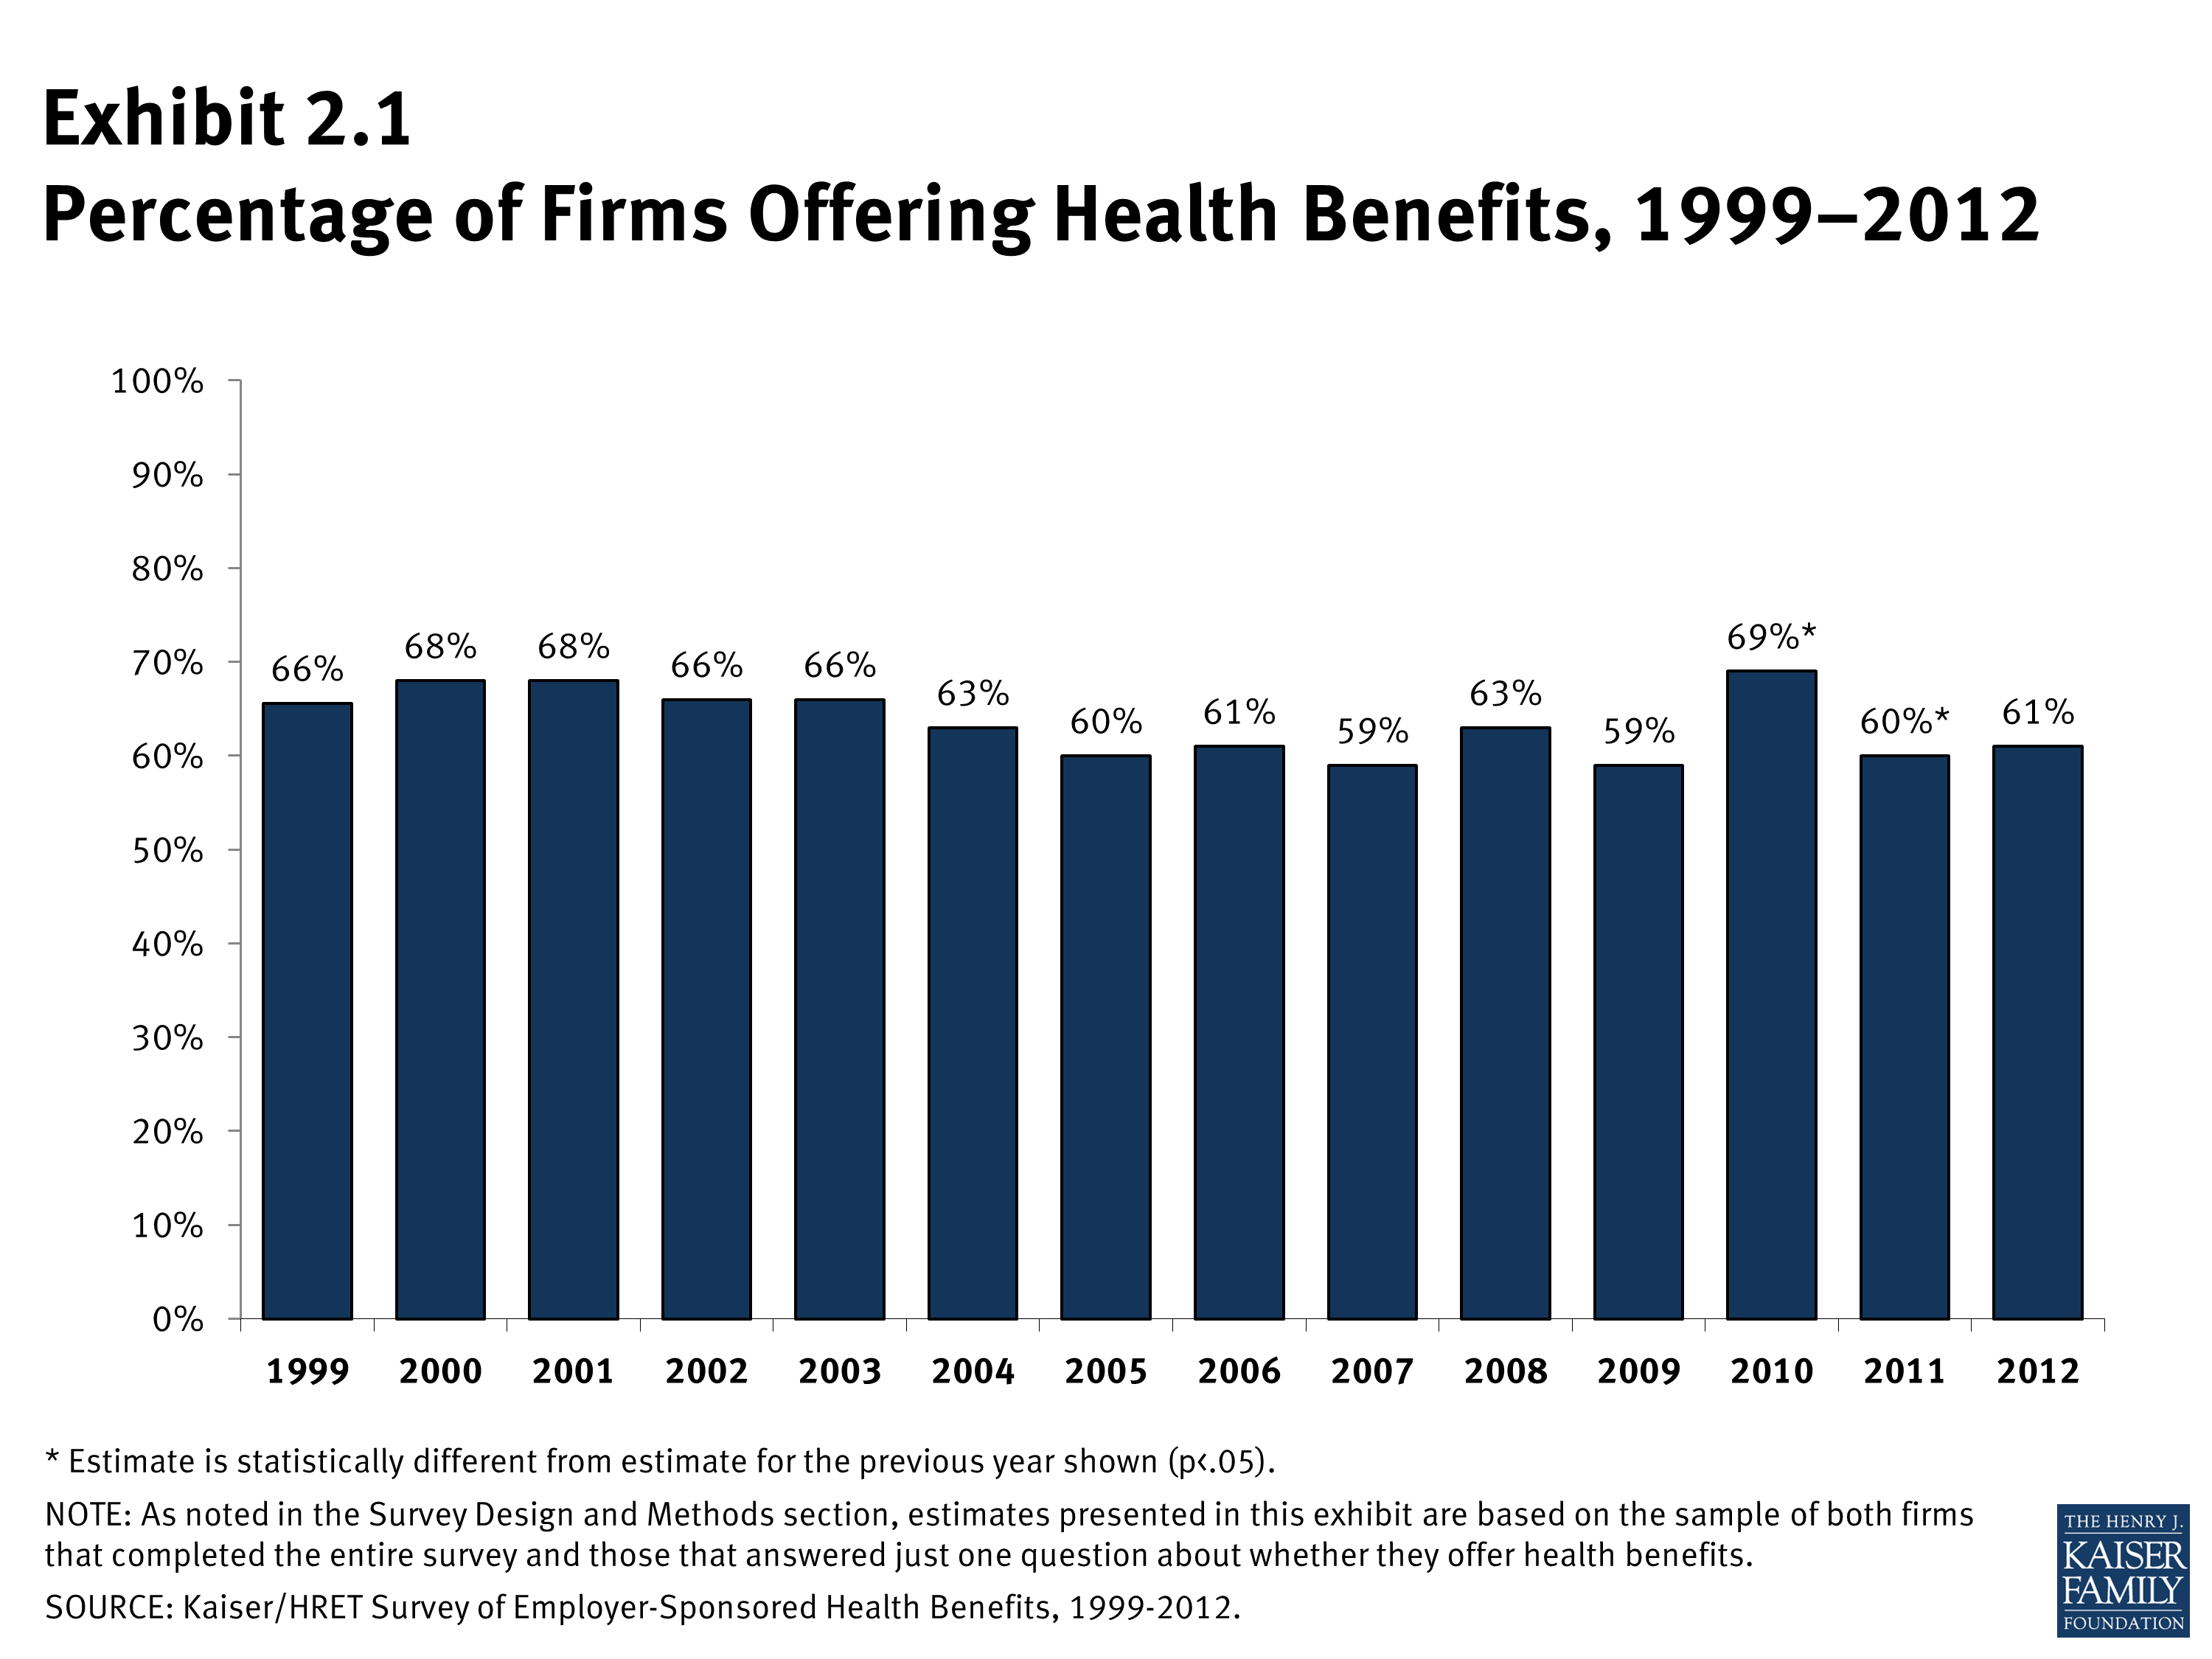
While nearly all large firms (200 or more workers) offer health benefits, small firms (3-199 workers) are significantly less likely to do so. The percentage of all firms offering health benefits in 2012 (61%) is statistically unchanged from 2011 (60%), and also similar to the reported percentages from 2004 through 2009. 1
- In 2012, 61% of firms offer health benefits, unchanged from the 60% reported in 2011 (Exhibit 2.1).
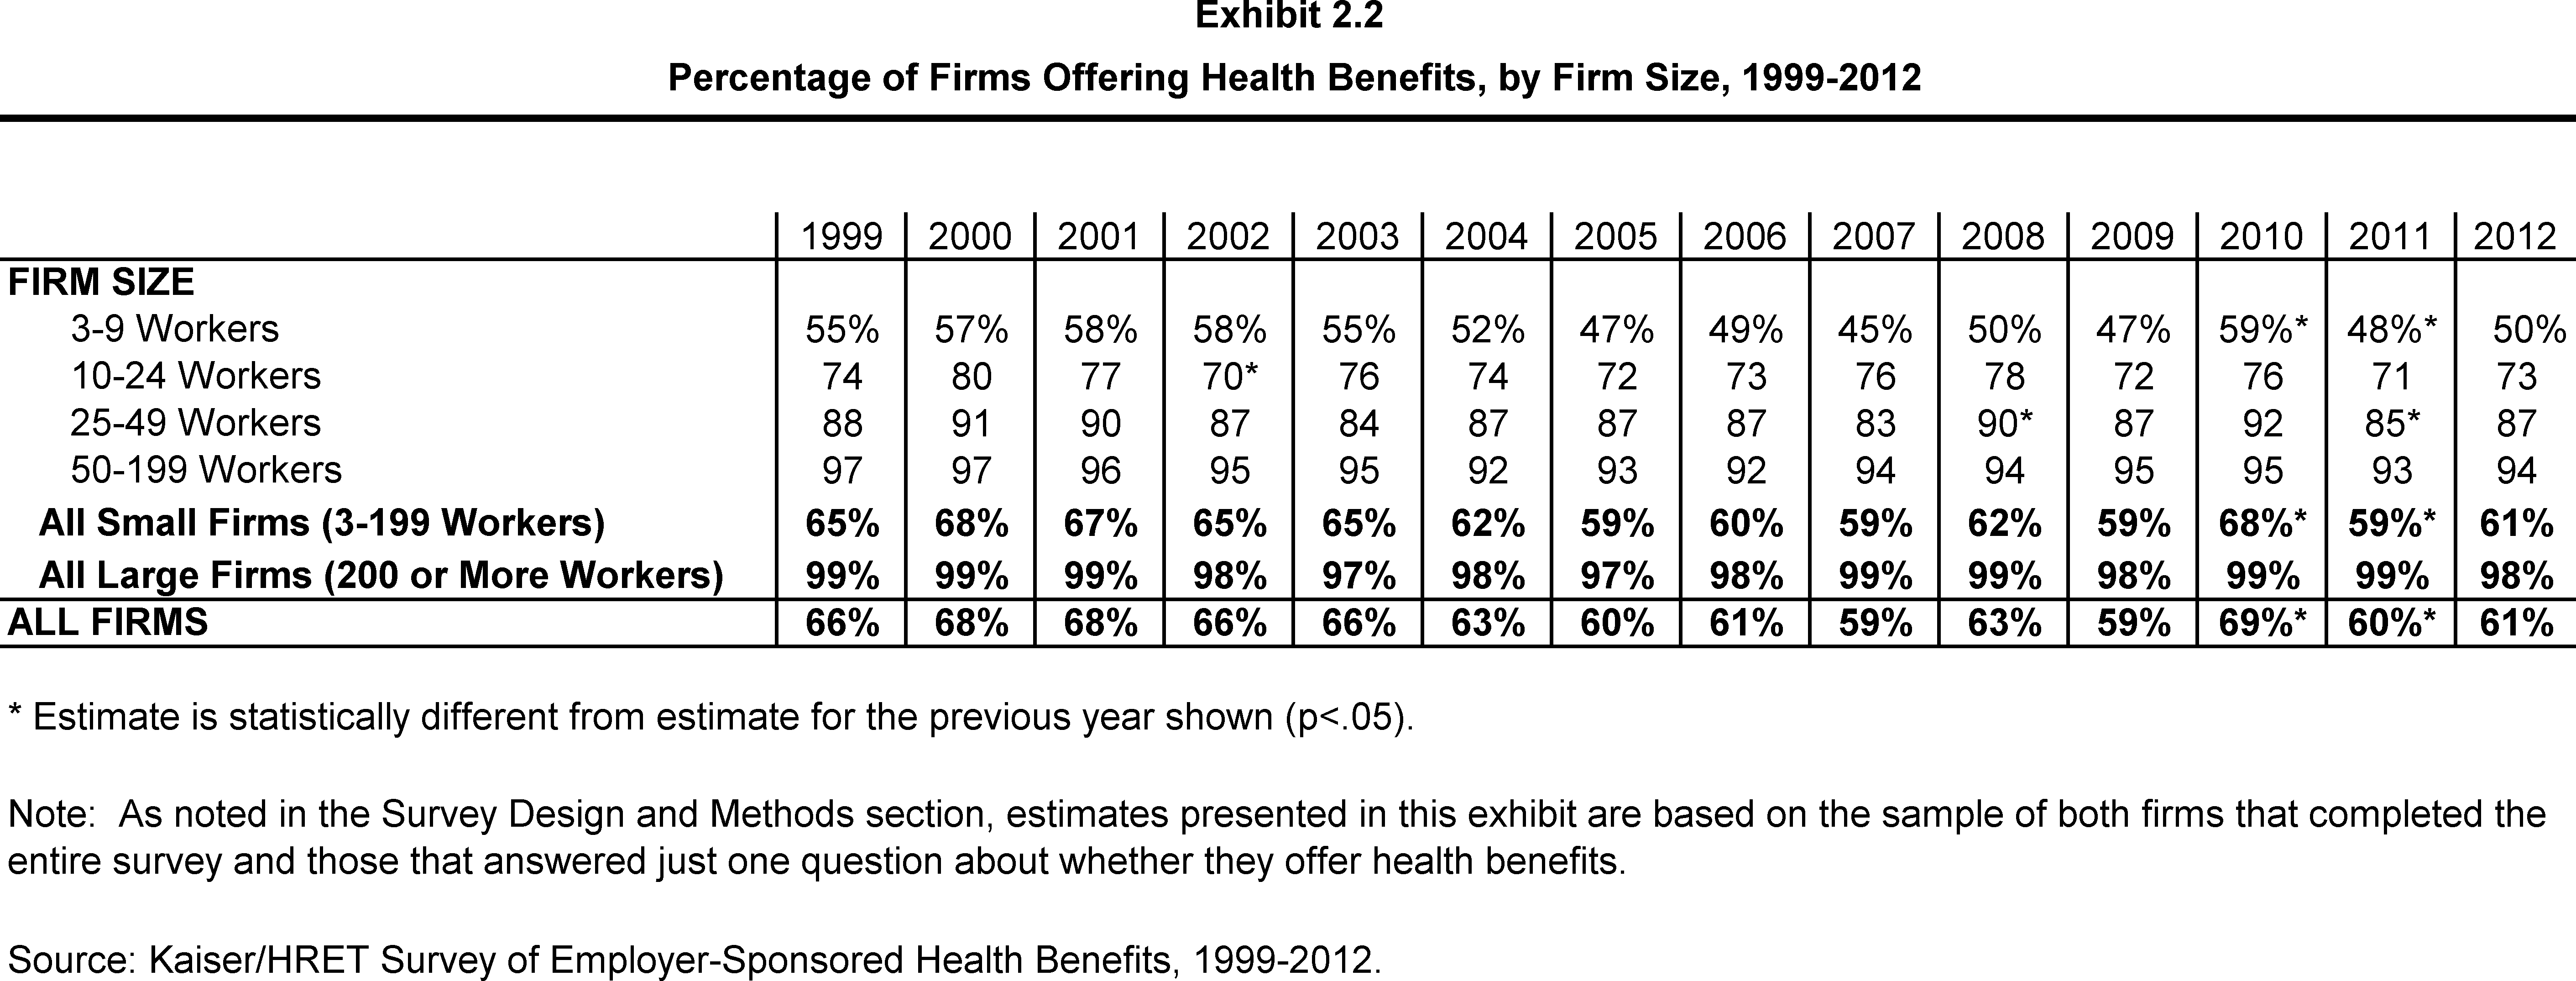
- Similar to 2011, 98% of large firms (200 or more workers) offer health benefits in 2012 (Exhibit 2.2). In contrast, only 61% of small firms (3-199 workers) offer health benefits in 2012.
- Between 1999 and 2012, the offer rate for large firms (200 or more workers) has consistently remained at or above 97%. Among small firms (3-199 workers), the offer rate has varied from a high of 68% in 2000 and 2010, to a low of 59% in 2005, 2007, 2009, and 2011 (Exhibit 2.2). Since most firms in the country are small, variation in the overall offer rate is driven primarily by changes in the percentages of the smallest firms (3-9 workers) offering health benefits.
- Offer rates vary across different types of firms.
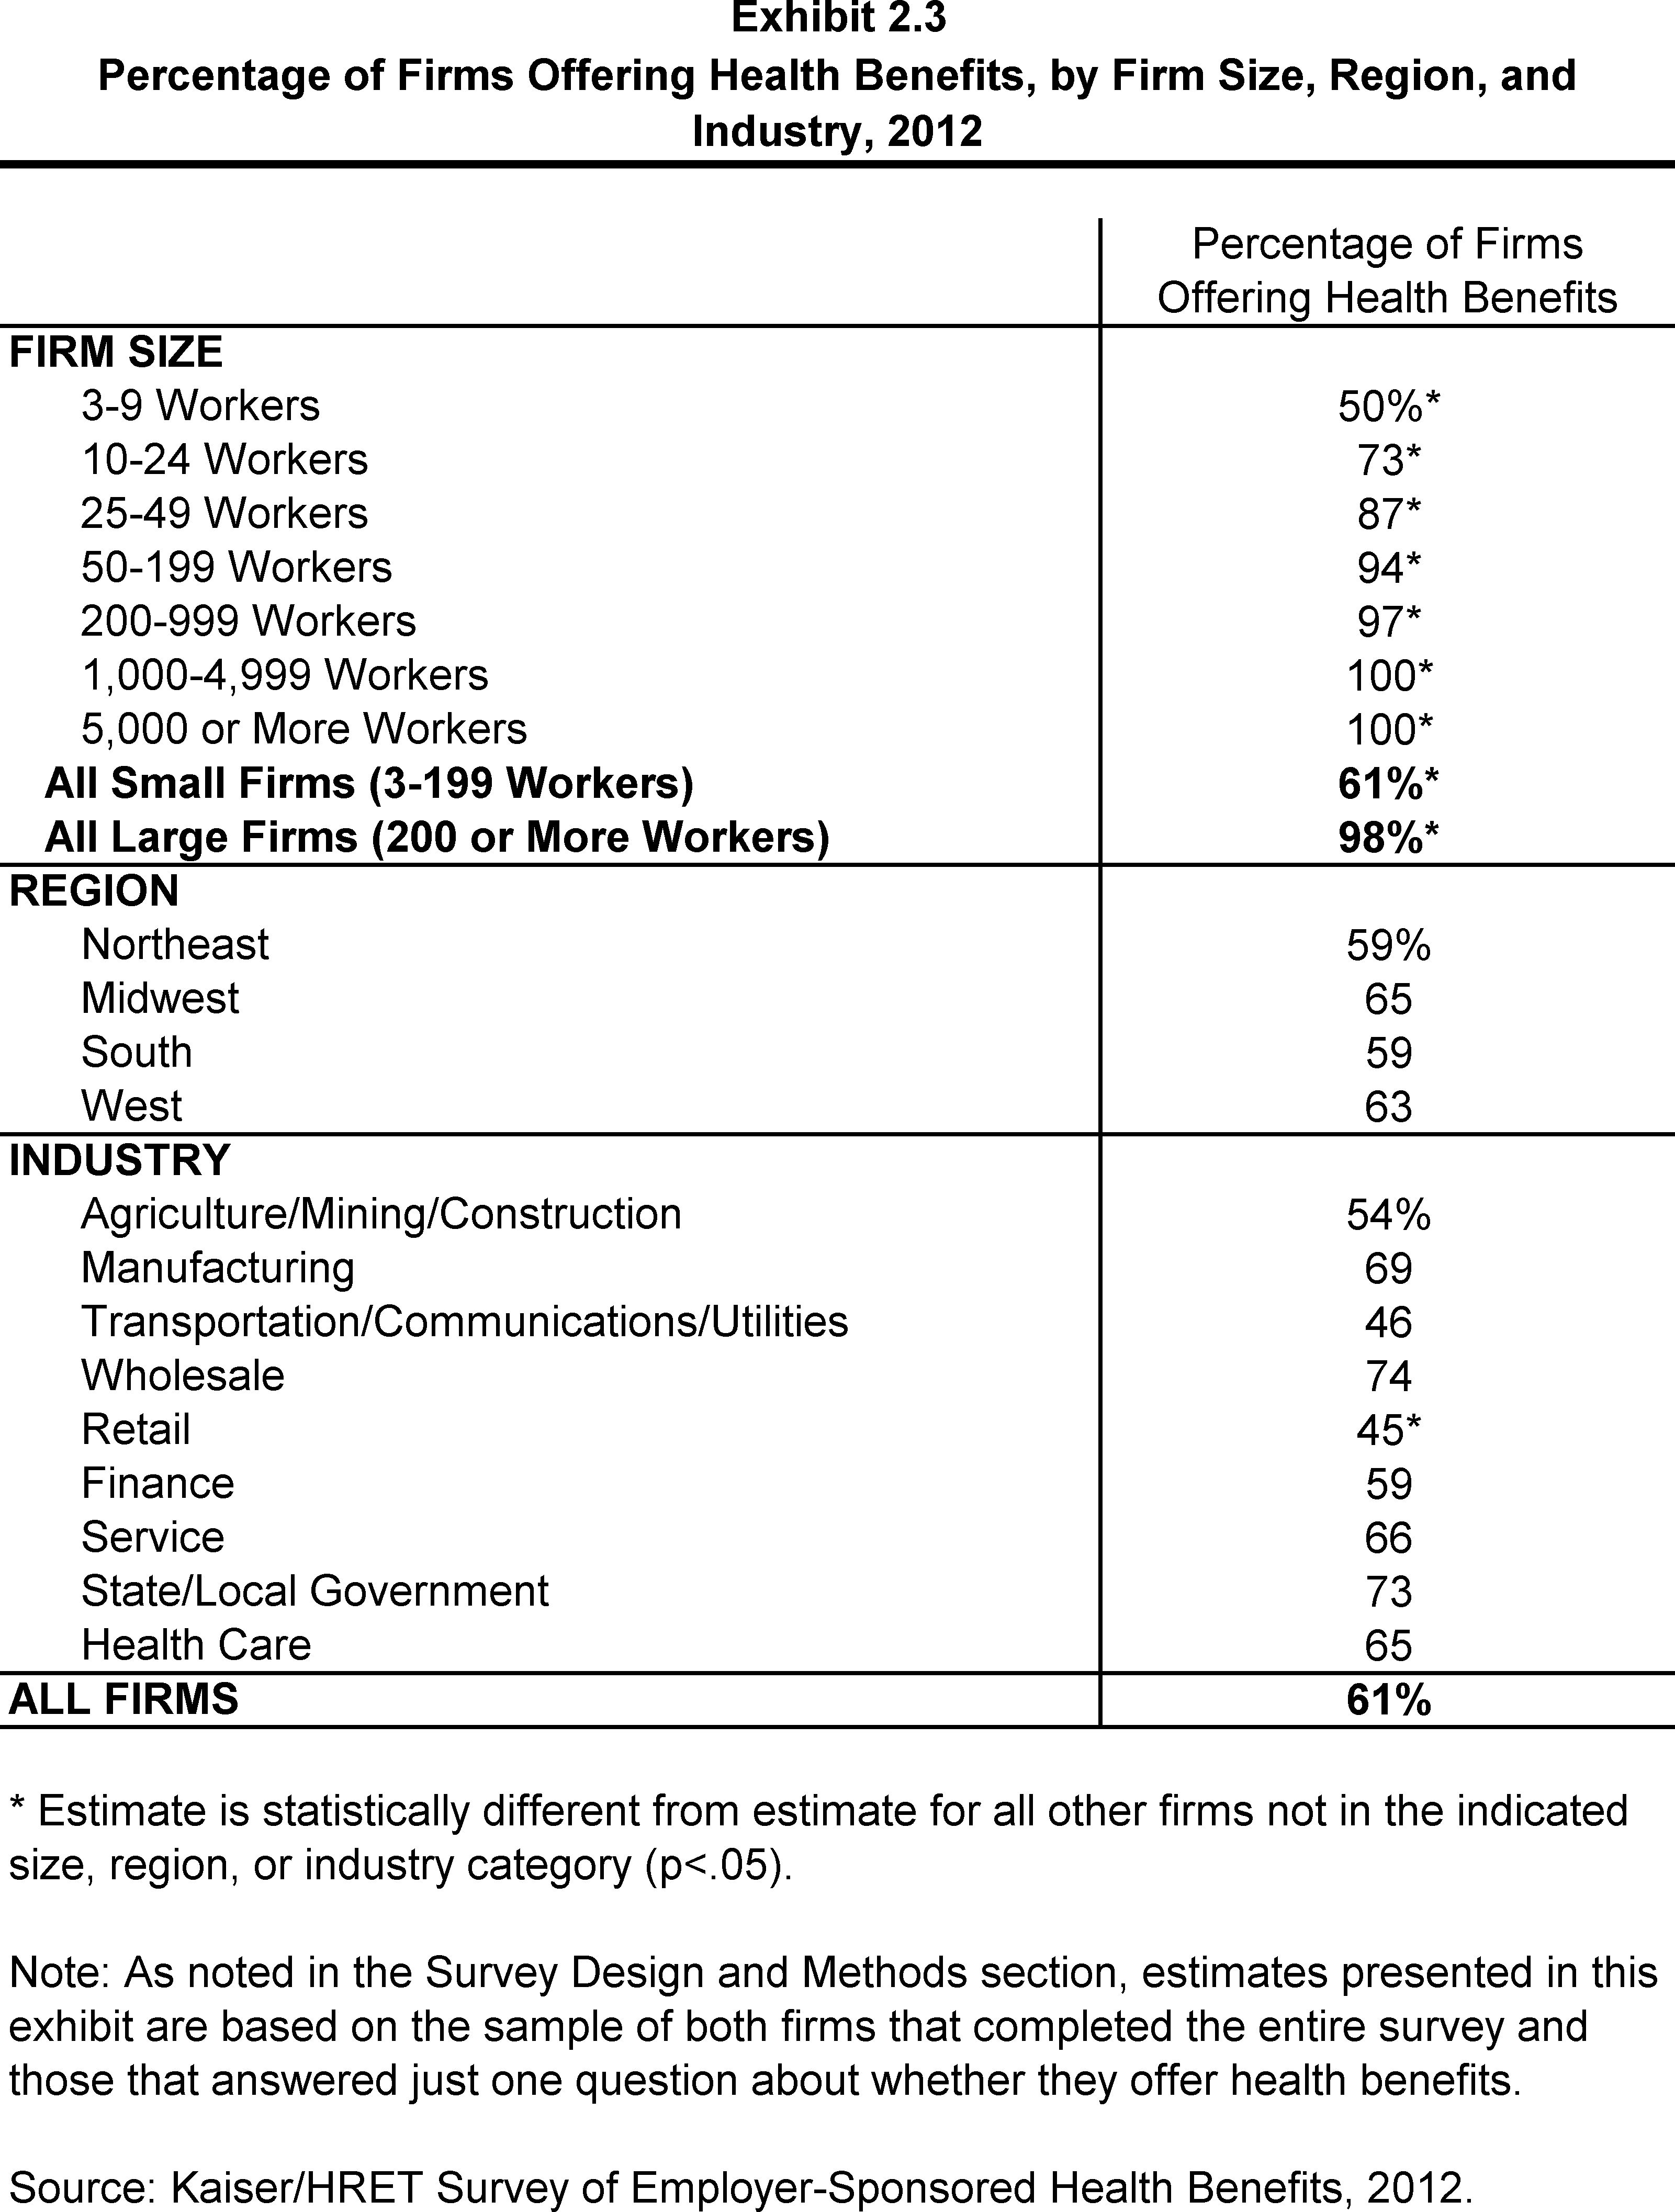
- Smaller firms are less likely to offer health insurance: 50% of firms with 3 to 9 workers offer coverage, compared to 73% of firms with 10 to 24 workers, 87% of firms with 25 to 49 workers, and 94% of firms with 50 to 199 employees (Exhibit 2.3).
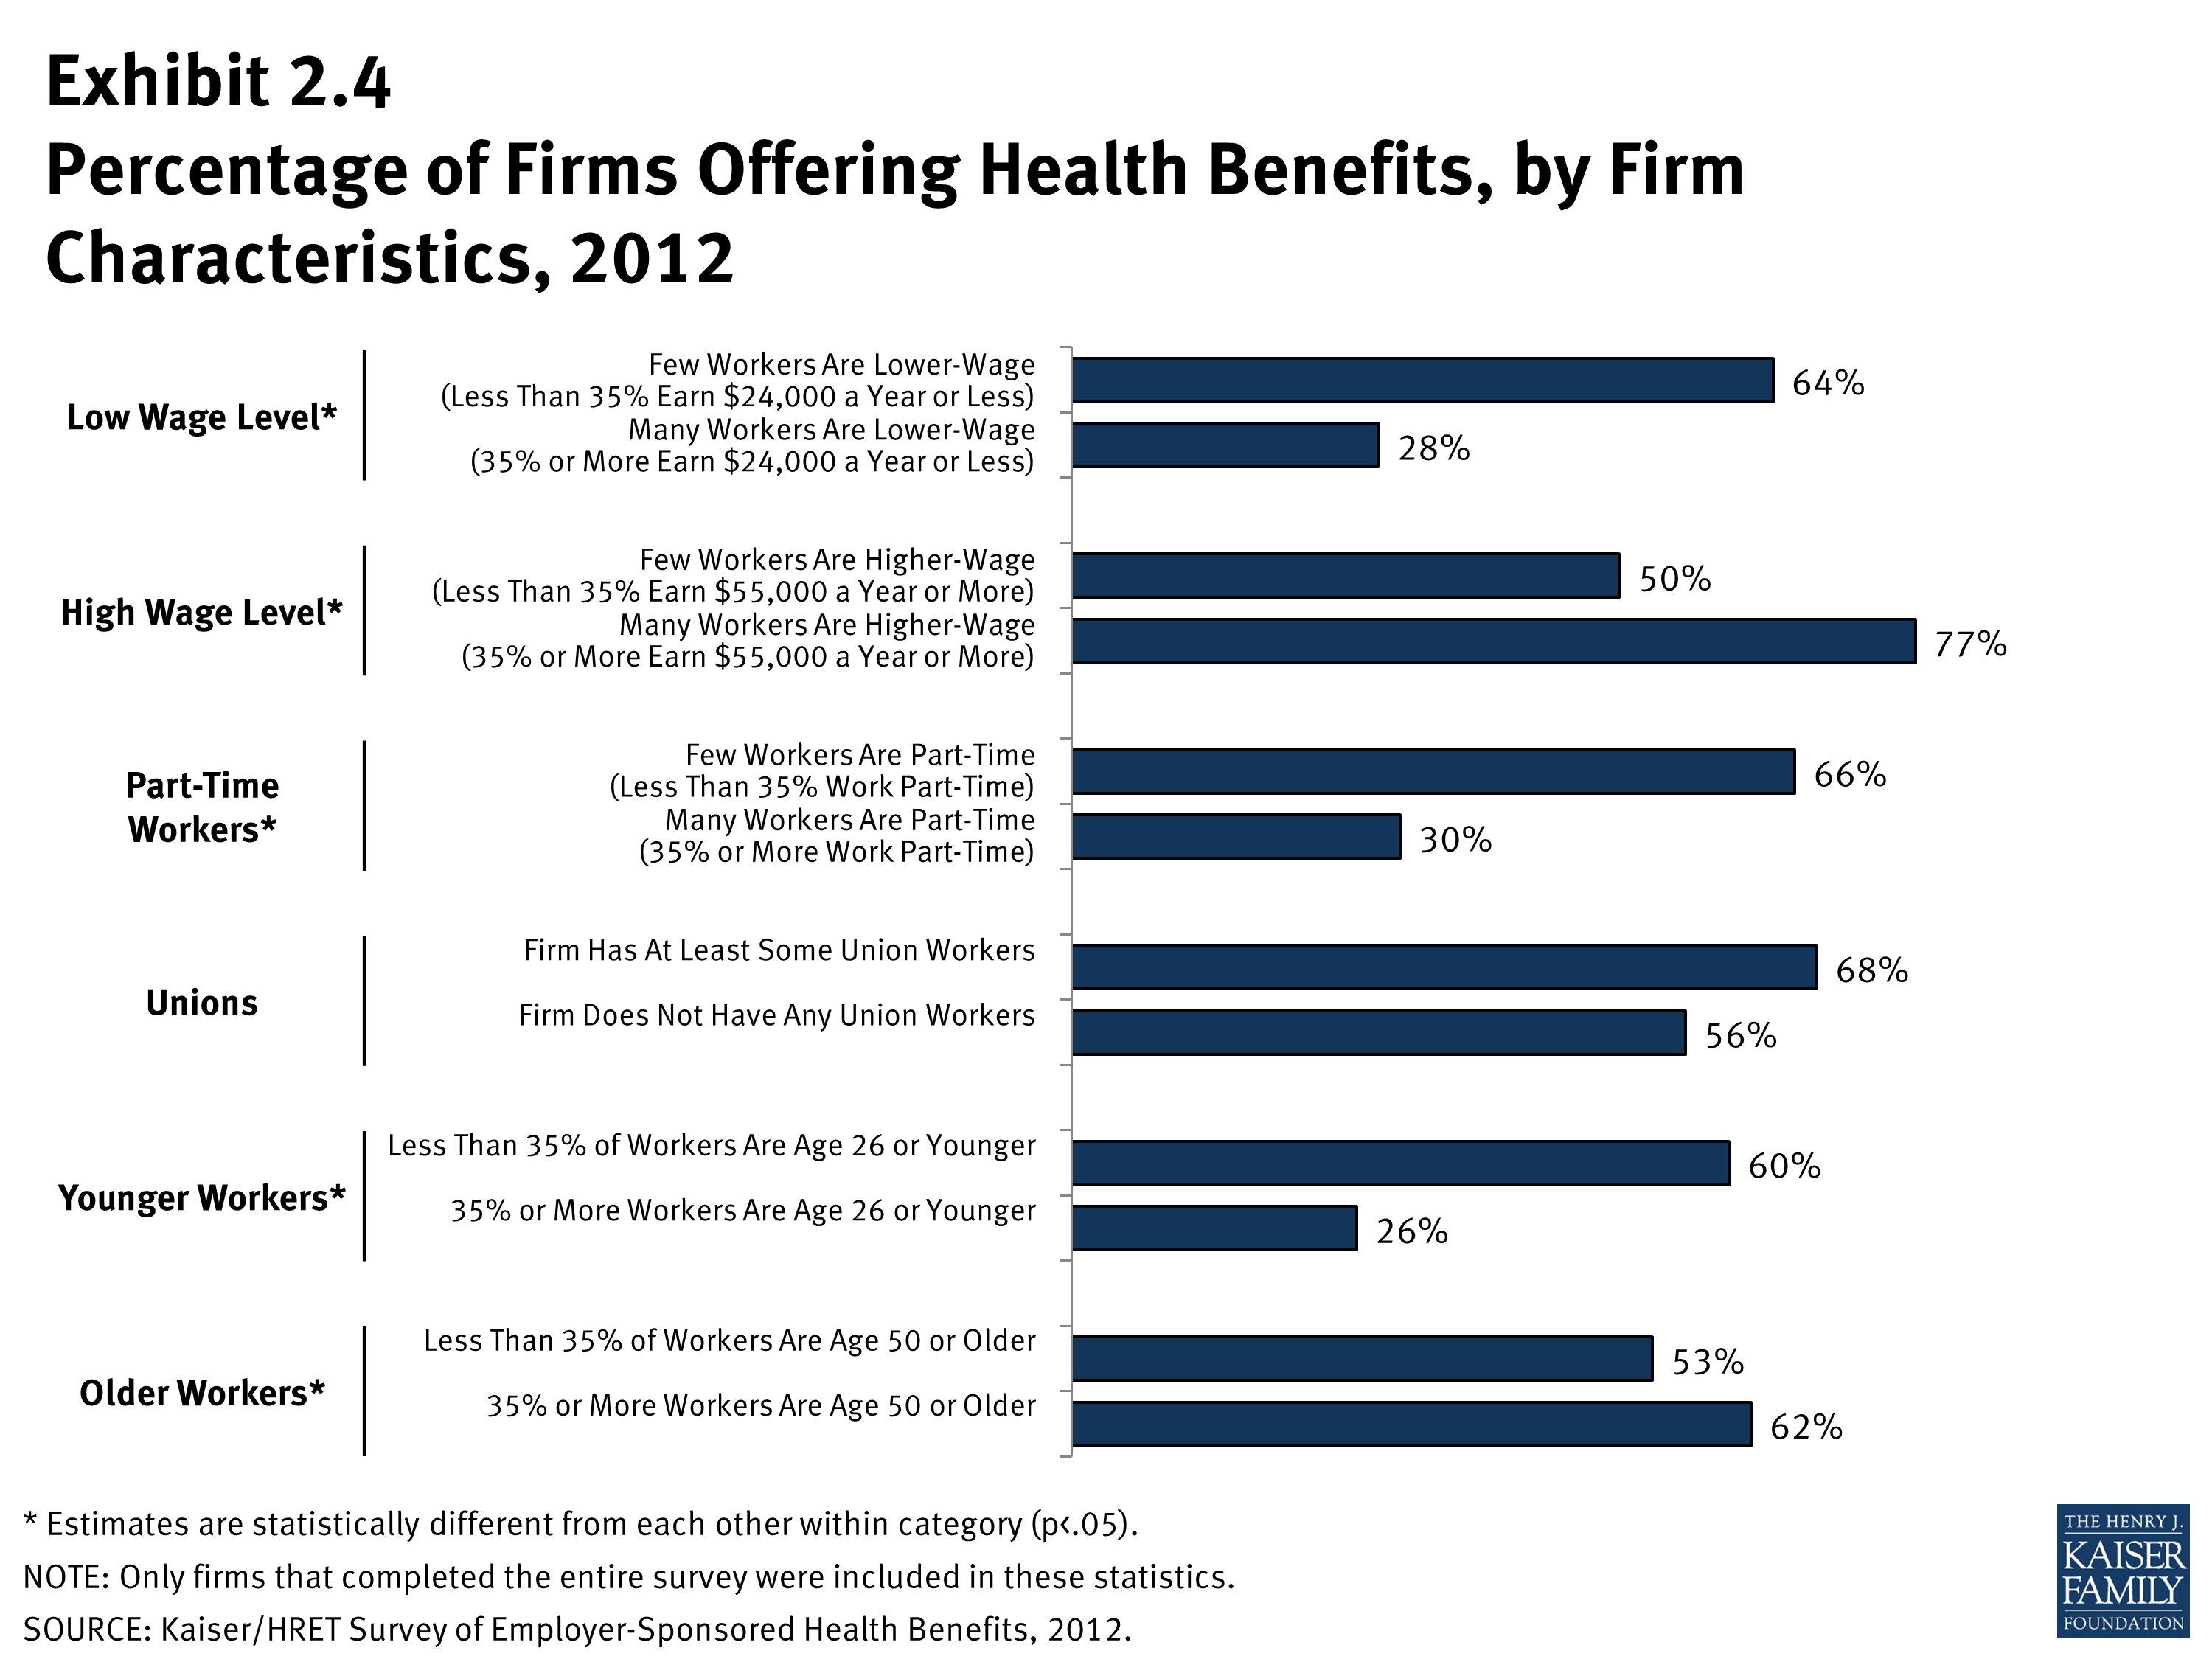
- Firms with fewer lower-wage workers (less than 35% of workers earn $24,000 or less annually) are significantly more likely to offer health insurance than firms with many lower-wage workers (35% or more of workers earn $24,000 or less annually). While 64% of firms with fewer lower-wage workers offer health benefits, only 28% of firms with many lower-wage workers do (Exhibit 2.4). The offer rate for firms with many lower-wage workers is not significantly different from the 28% reported in 2011. We observe a similar pattern among firms with many higher-wage workers (35% or more of workers earn $55,000 or more annually) (Exhibit 2.4).
- The age of the workforce significantly affects the probability of a firm offering health benefits. Firms where 35% or more of its workers are age 26 or younger are less likely to offer health benefits than firms where less than 35% of workers are age 26 or younger (26% and 60%, respectively) (Exhibit 2.4).
- Among firms offering health benefits, relatively few offer benefits to their part-time and temporary workers.
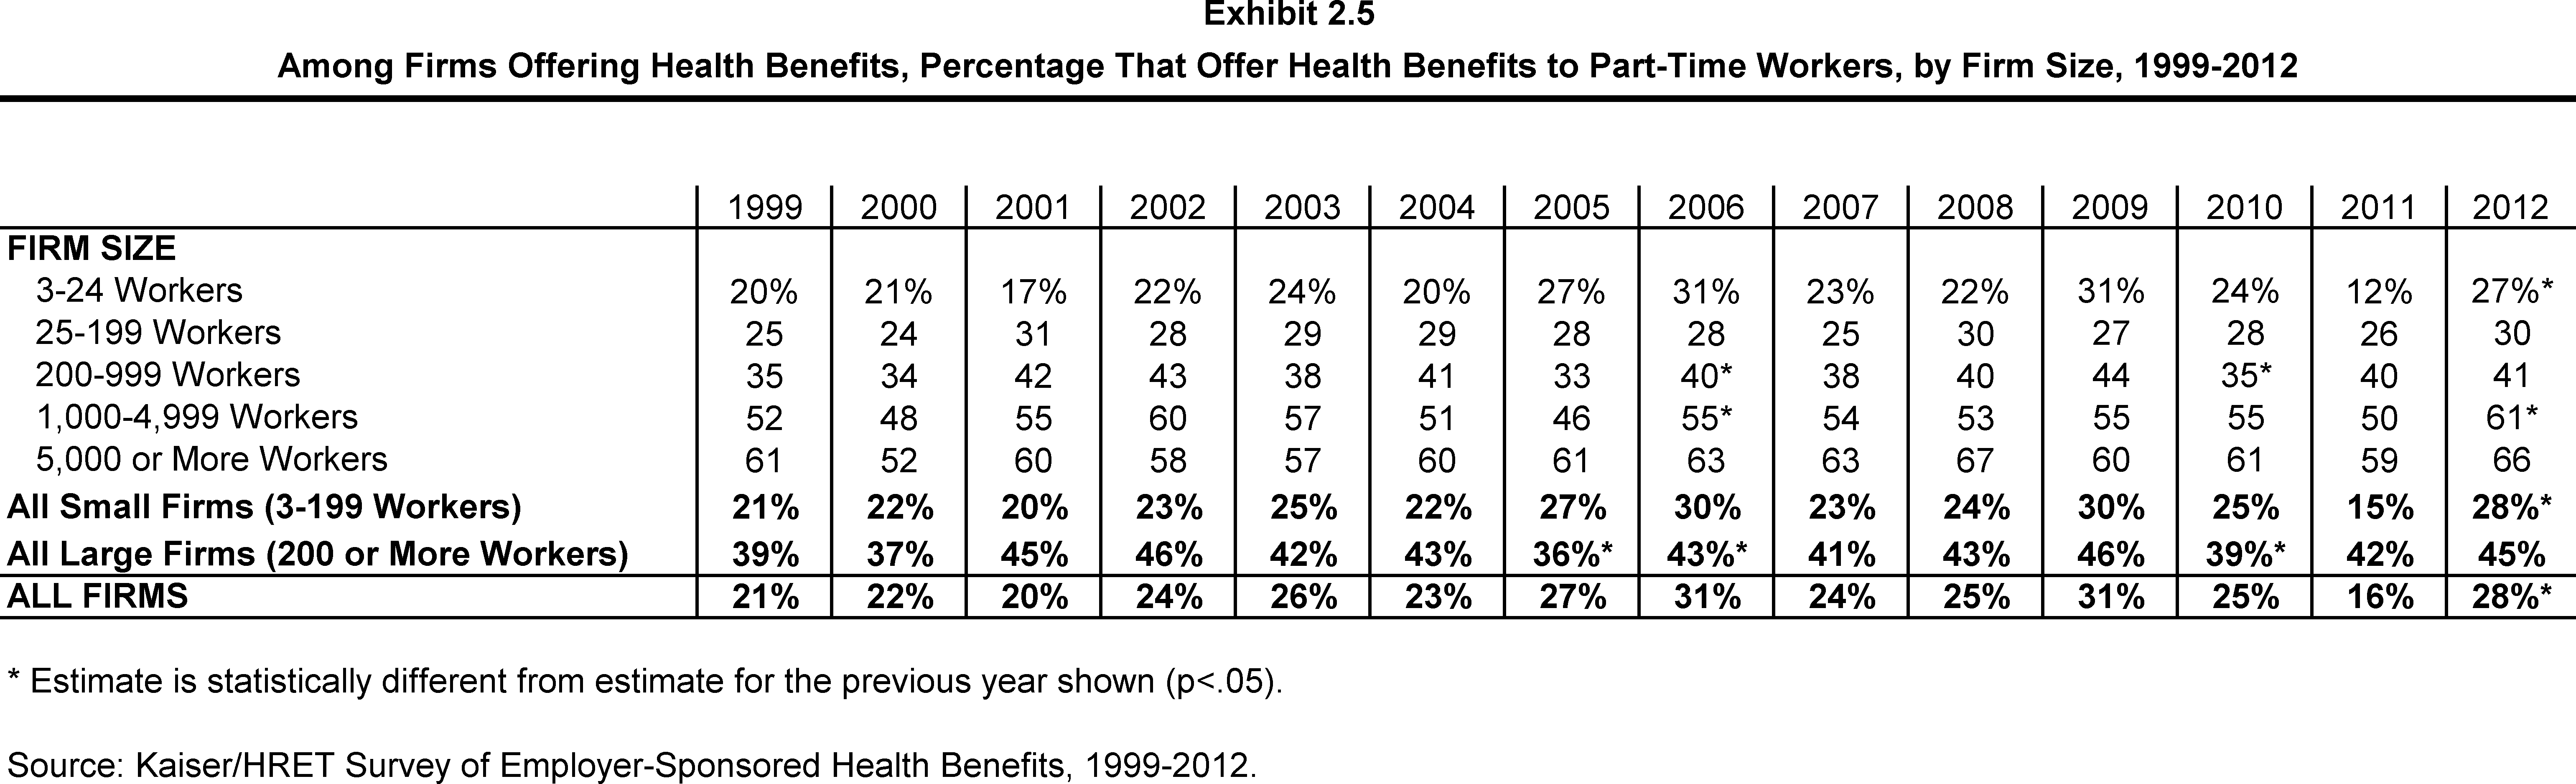
- In 2012, 28% of all firms that offer health benefits offer them to part-time workers, a significant increase from the 16% reported in 2011 but similar to the 25% reported in 2010 (Exhibit 2.5). Firms with 200 or more workers are more likely to offer health benefits to part-time employees than firms with 3 to 199 workers (45% vs. 28%) (Exhibit 2.7).
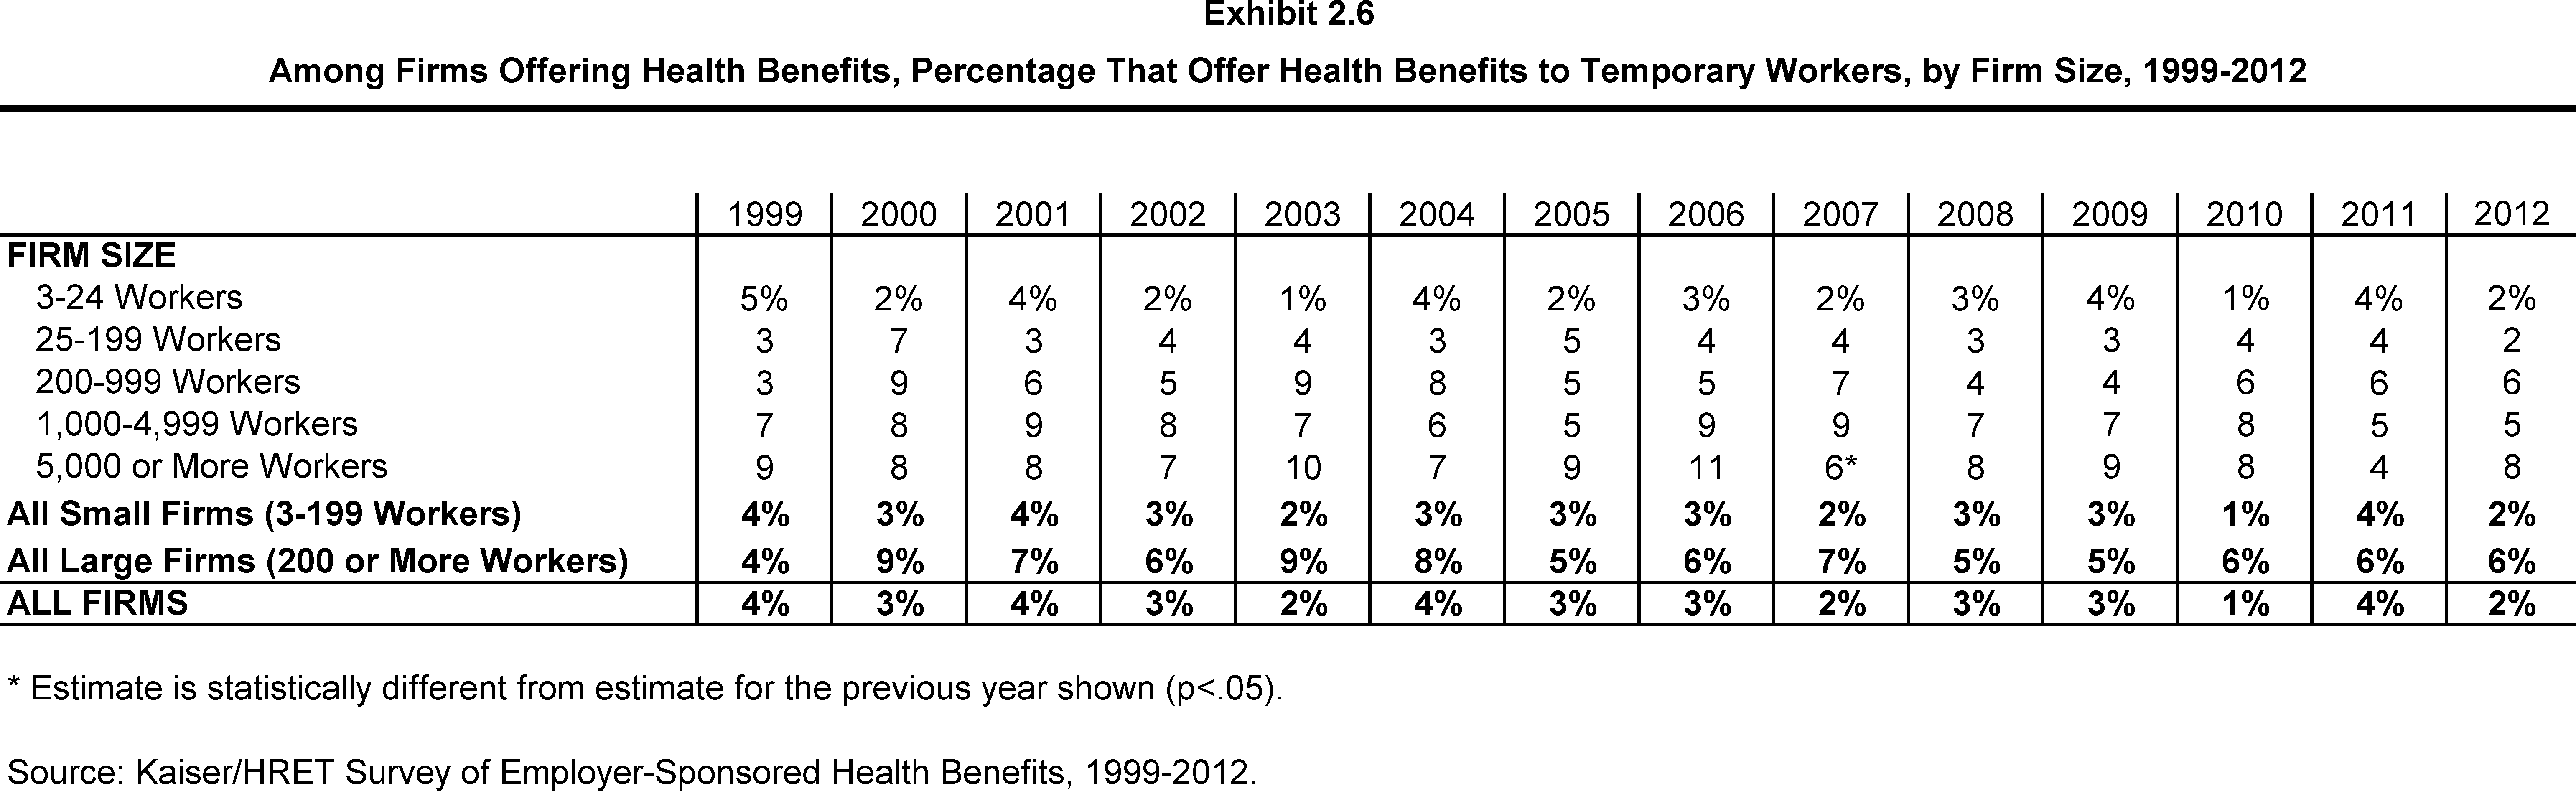
- Consistently, a very small percentage (2% in 2012) of firms offering health benefits have offered them to temporary workers (Exhibit 2.6). The percentage of firms offering temporary workers benefits is lower at small firms (3-199 workers) than large firms (200 or more workers) (2% vs. 6%) (Exhibit 2.8).
Dental and Vision Benefits
- Fifty-four percent of firms offering health benefits offer or contribute to a dental insurance benefit for their employees that are separate from any dental coverage the health plans might include. This is not statistically different from the 46% reported in 2010, which is the last time we asked about dental benefits (Exhibit 2.10). Large firms (200 or more workers) are far more likely than small firms (3–199 workers) to offer or contribute to a separate dental health benefit, at 89% versus 53% (Exhibit 2.9).
- Twenty-seven percent of firms offer or contribute to a vision benefit for their employees that is separate from any vision coverage the health plan might include, which is significantly more than the 17% reported in 2010, the last time we asked about vision benefits (Exhibit 2.10). Though large firms (200 or more workers) are more likely than small firms (3–199 workers) to offer or contribute to a separate vision care benefit, at 62% versus 27% (Exhibit 2.9), significantly more firms in both groups offered vision benefits in 2012 compared with 2010 (Exhibit 2.10).
Domestic Partner Benefits
- In 2012, more firms offer benefits to unmarried opposite and same-sex domestic partners.
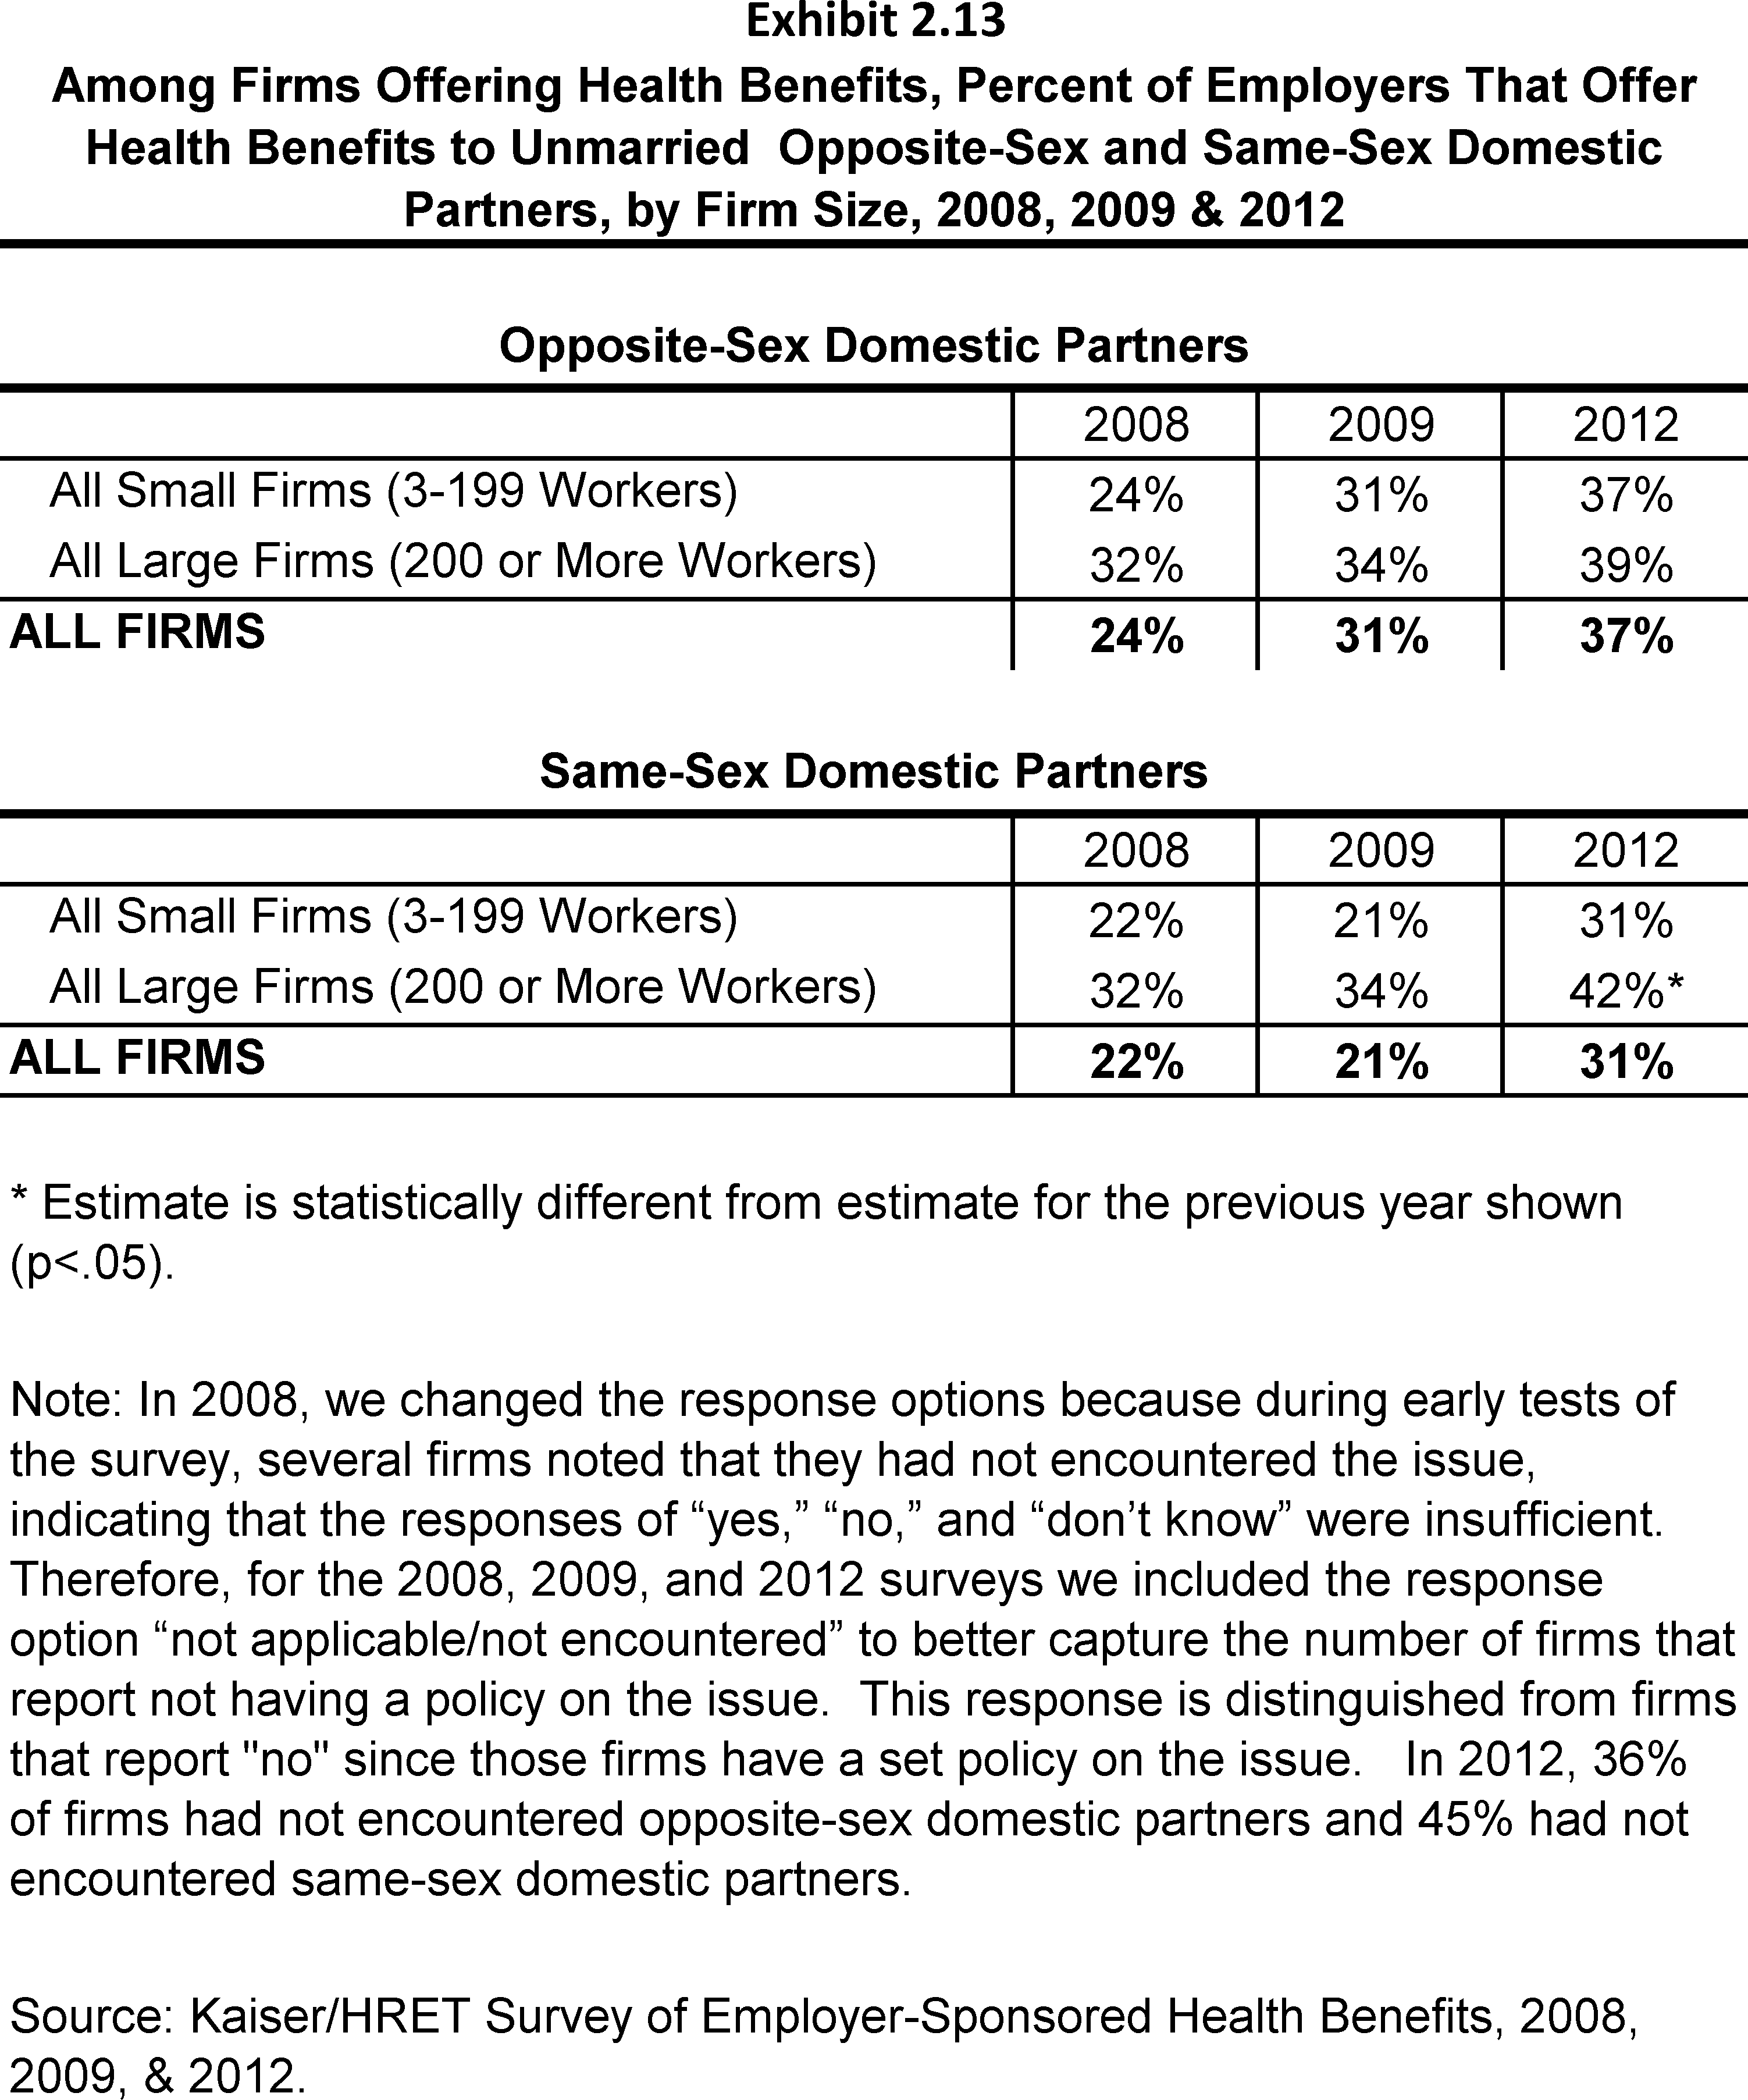
- In 2012, 37% of all firms offer health benefits to unmarried opposite-sex partners, while in 2009, 31% of firms did so. An even larger increase in the past four years may be observed in the percentage of firms offering health benefits to unmarried same-sex domestic partners. In 2009, 21% of all firms offered benefits to same-sex domestic partners; in 2012, this percentage increased to 31% of firms (Exhibit 2.13).
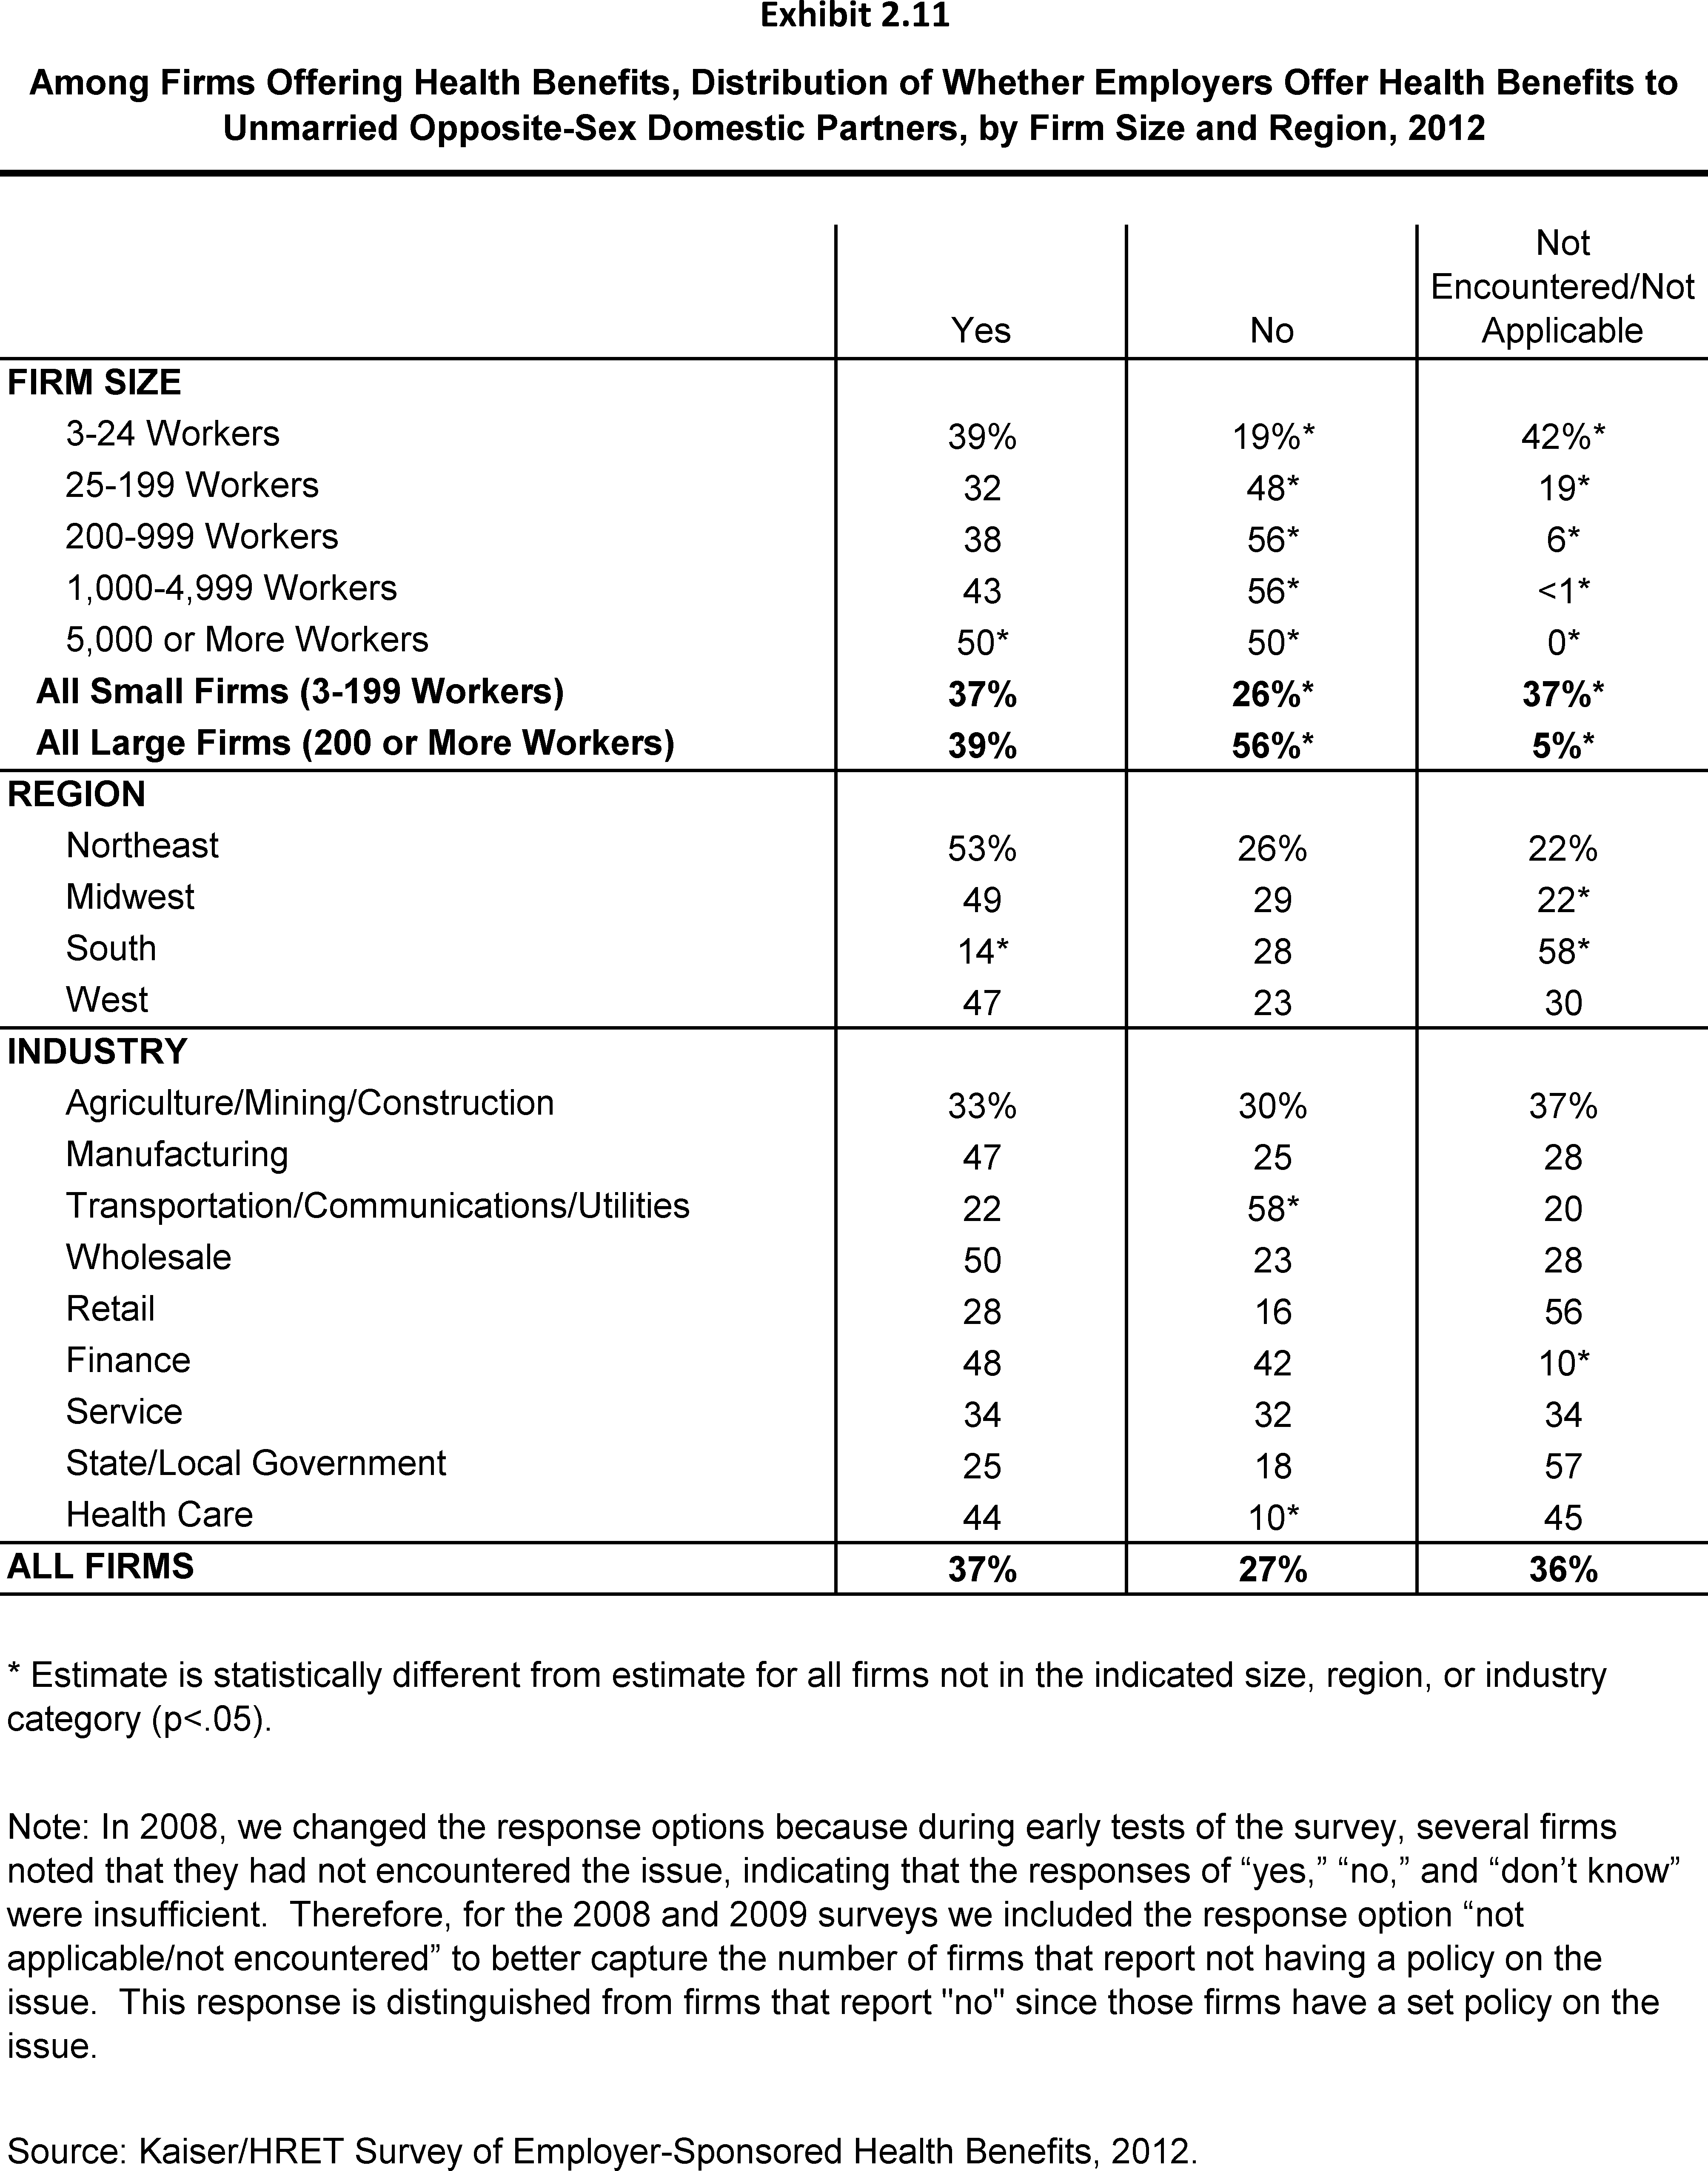
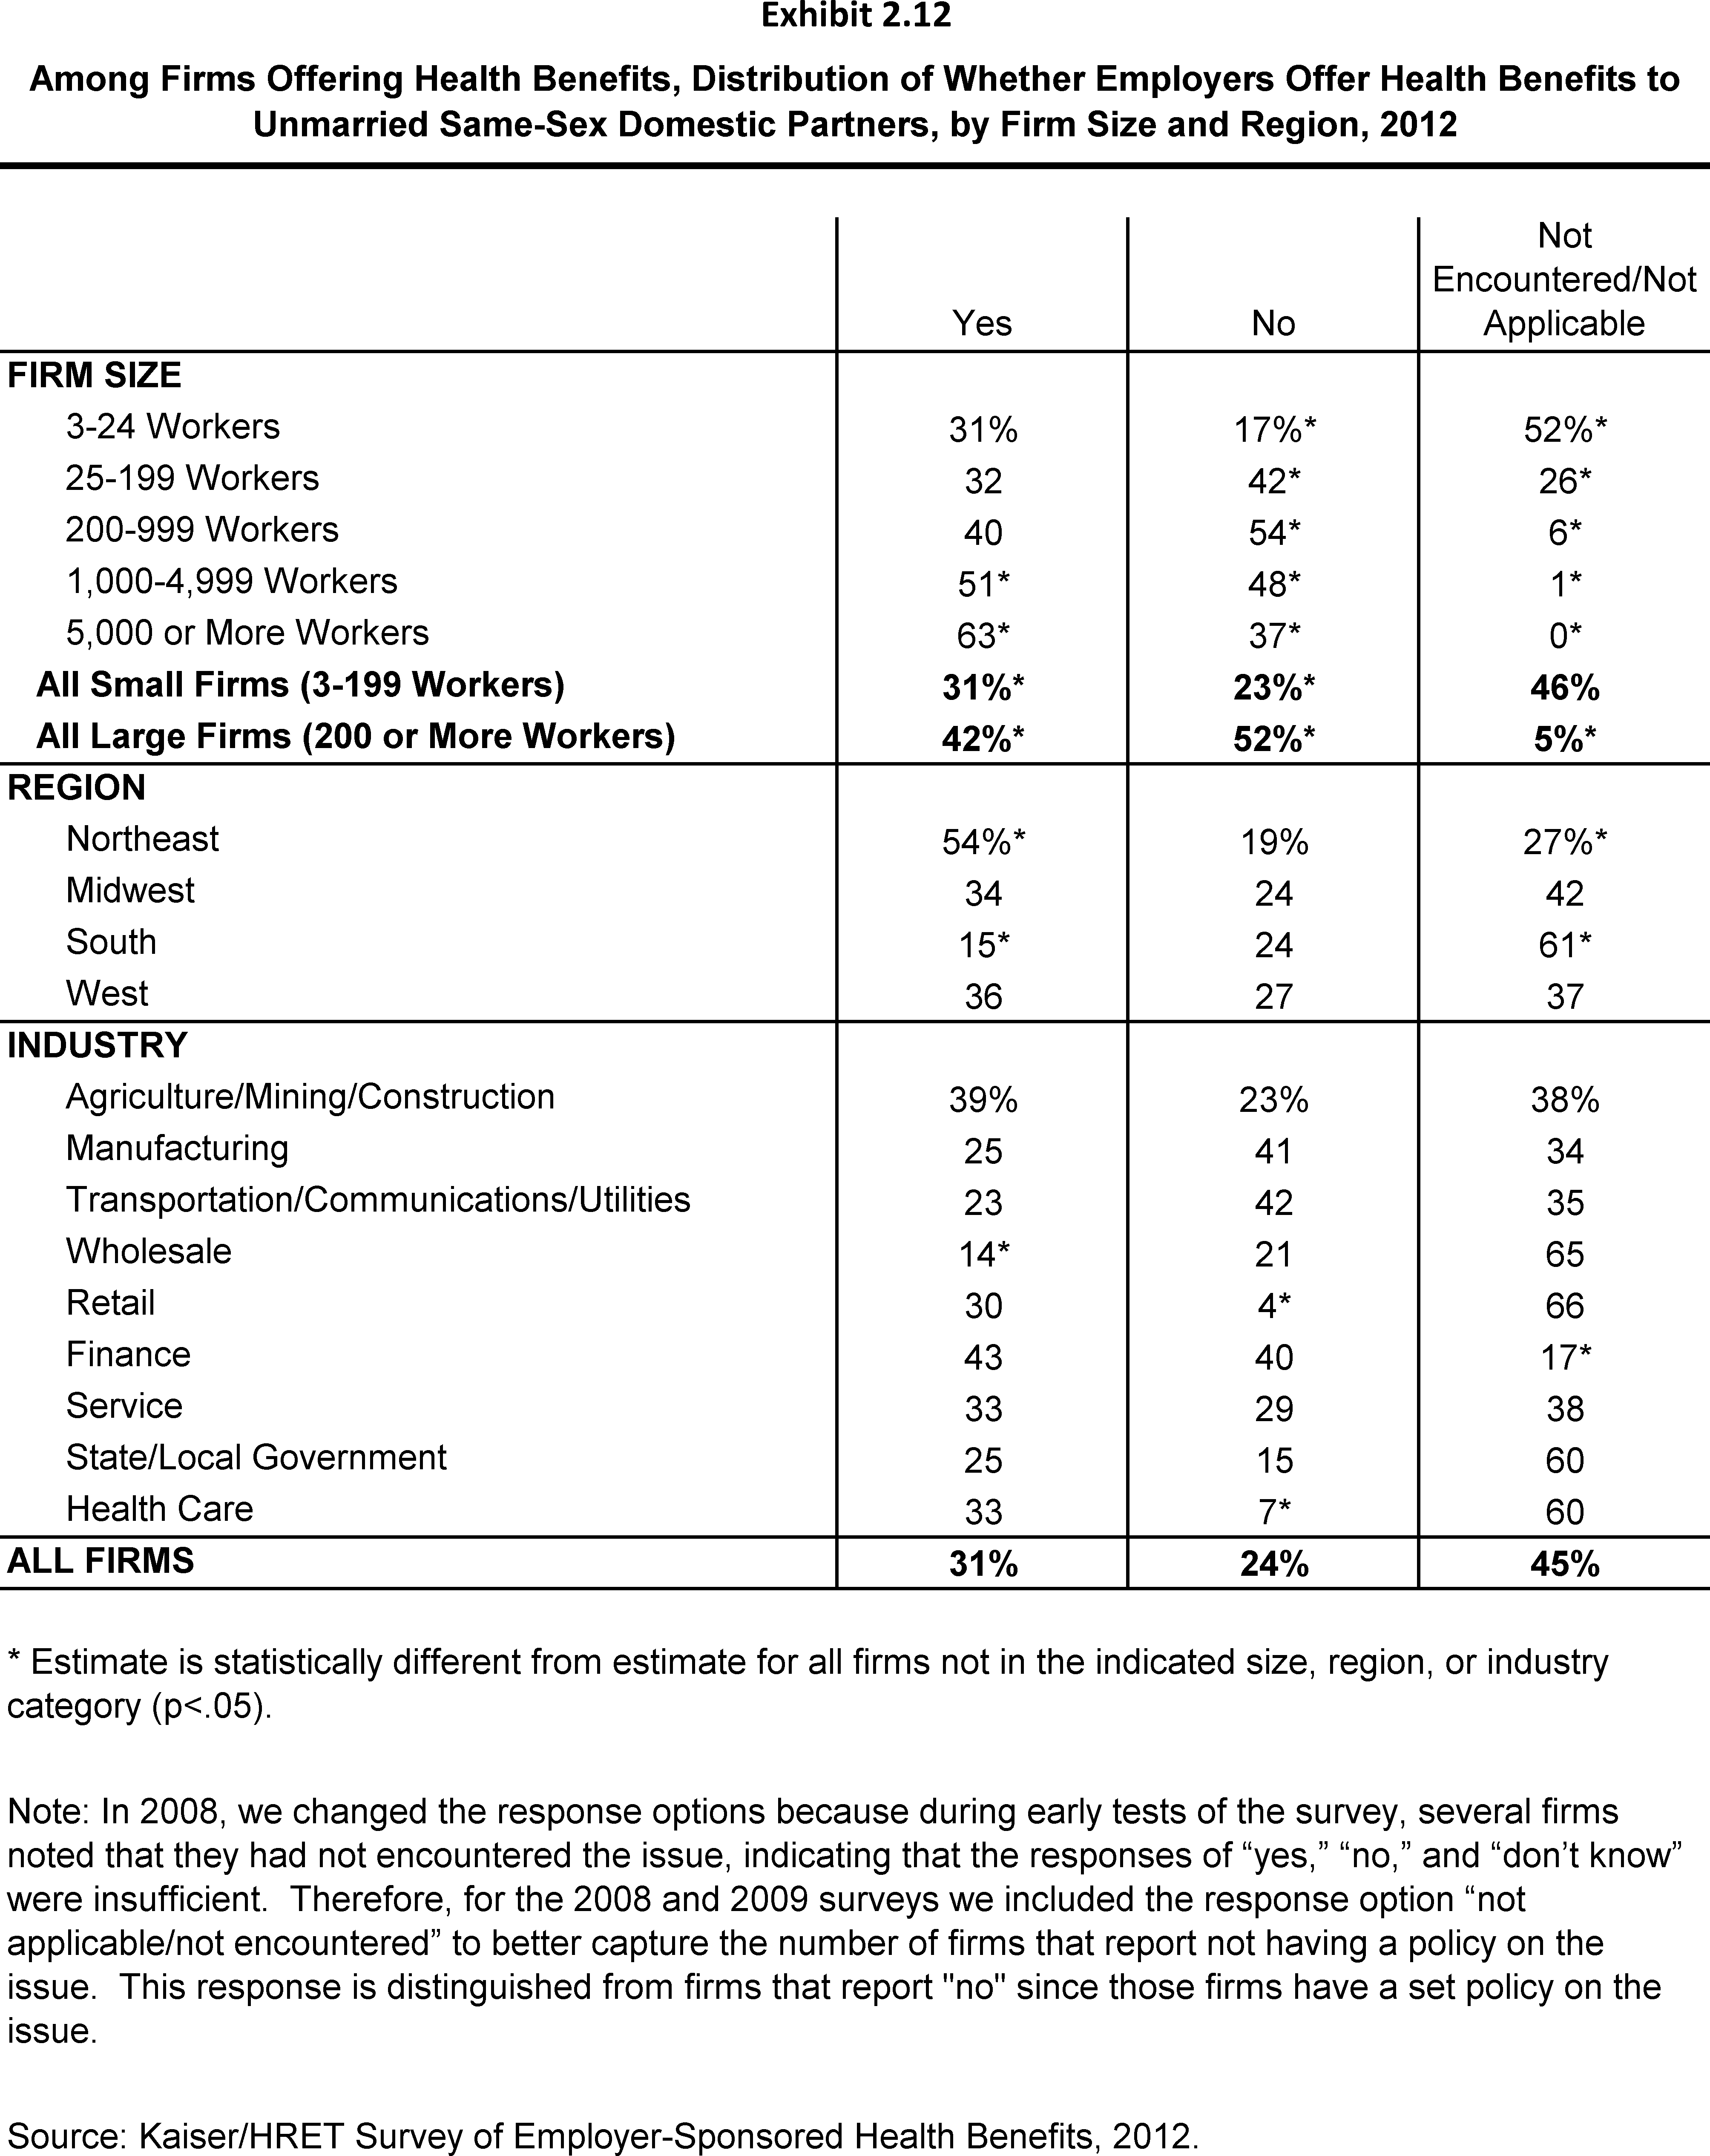
- When asked if they offer health benefits to opposite or same-sex domestic partners, however, many firms report that they have not encountered domestic partners. For example, many small firms may not have any employees who are in either an opposite or same-sex domestic partnerships. Regarding health benefits for opposite-sex domestic partners, 36% of firms report in 2012 that they have not encountered this need or that the question was not applicable. More small firms (37%) compared to large firms (5%) indicate that they have not encountered this need or that the question was not applicable (Exhibit 2.11). Regarding health benefits for same-sex domestic partners, 45% of firms report that they have not encountered the need or that the question was not applicable. More small firms (3–199 workers) (46%) than larger firms (5%) report that they have not encountered same-sex domestic partners (Exhibit 2.12).
- Firms in the Northeast are more likely (54%) and firms in the South are less likely (15%) to offer health benefits to unmarried same-sex domestic partners than firms in other regions (Exhibit 2.12). Similarly, firms in the South are less likely (14%) to offer health benefits to unmarried opposite-sex domestic partners than firms in other regions (Exhibit 2.11).
Firms Not Offering Health Benefits
- The survey asks firms that do not offer health benefits if they have offered insurance or shopped for insurance in the recent past, and about their most important reasons for not offering. Because such a small percentage of large firms report not offering health benefits, we present responses for the 39% of employers with 3 to 199 workers that do not offer health benefits.
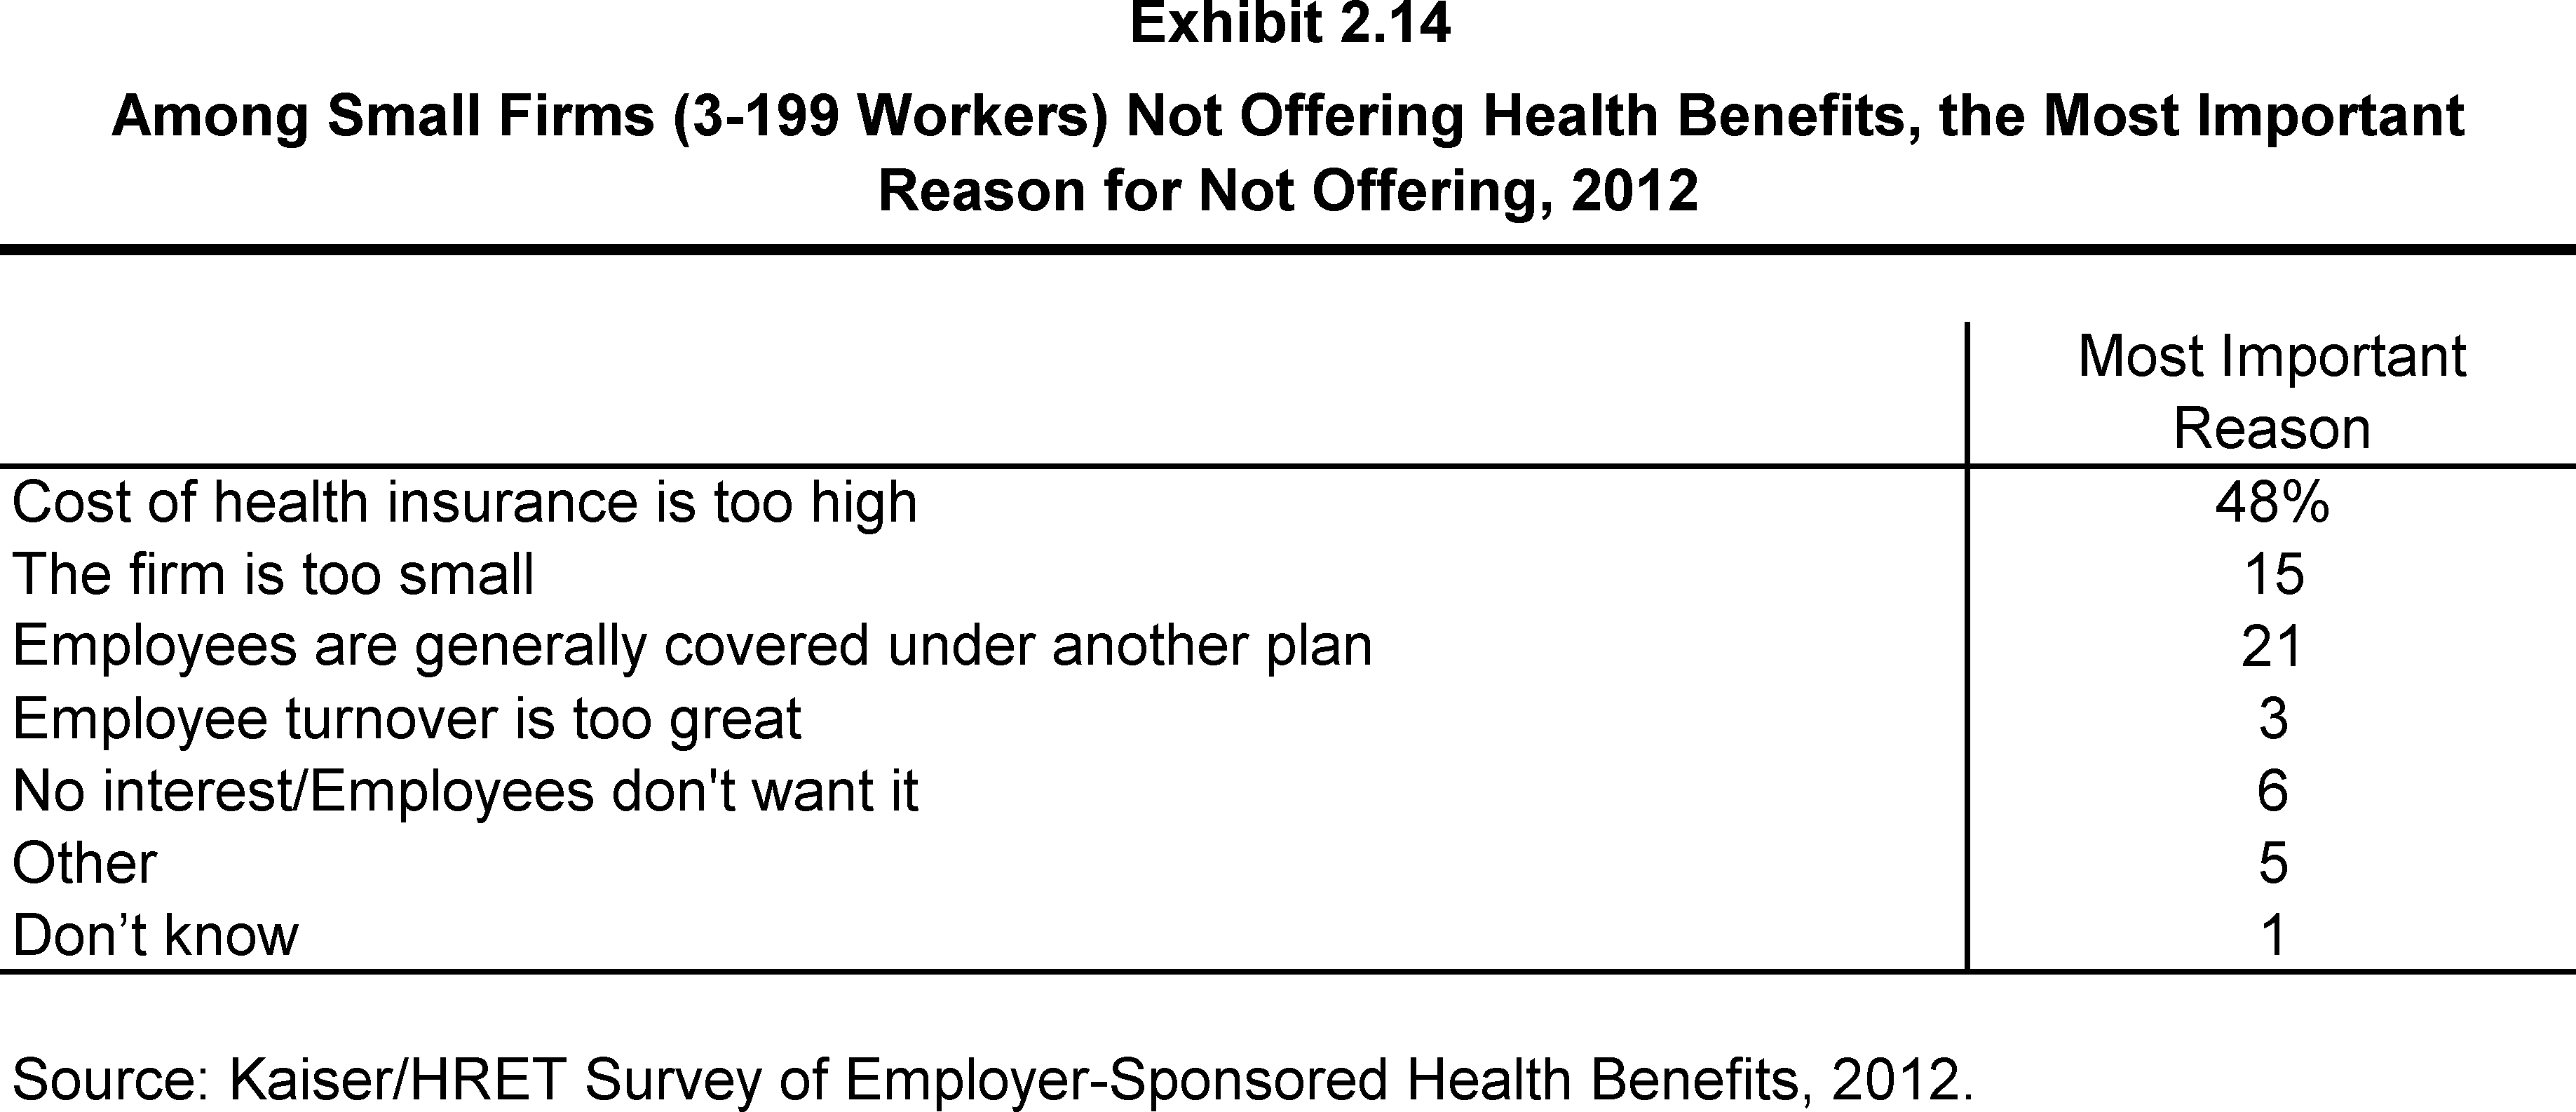
- The cost of health insurance remains the primary reason cited by firms for not offering health benefits. Among small firms (3-199 workers) not offering health benefits, 48% cite high cost as “the most important reason” for not doing so, followed by: employees are covered elsewhere (21%) and firm is too small (15%) (Exhibit 2.14).
- Many non-offering small firms have either offered health benefits in the past five years, or shopped for coverage recently.
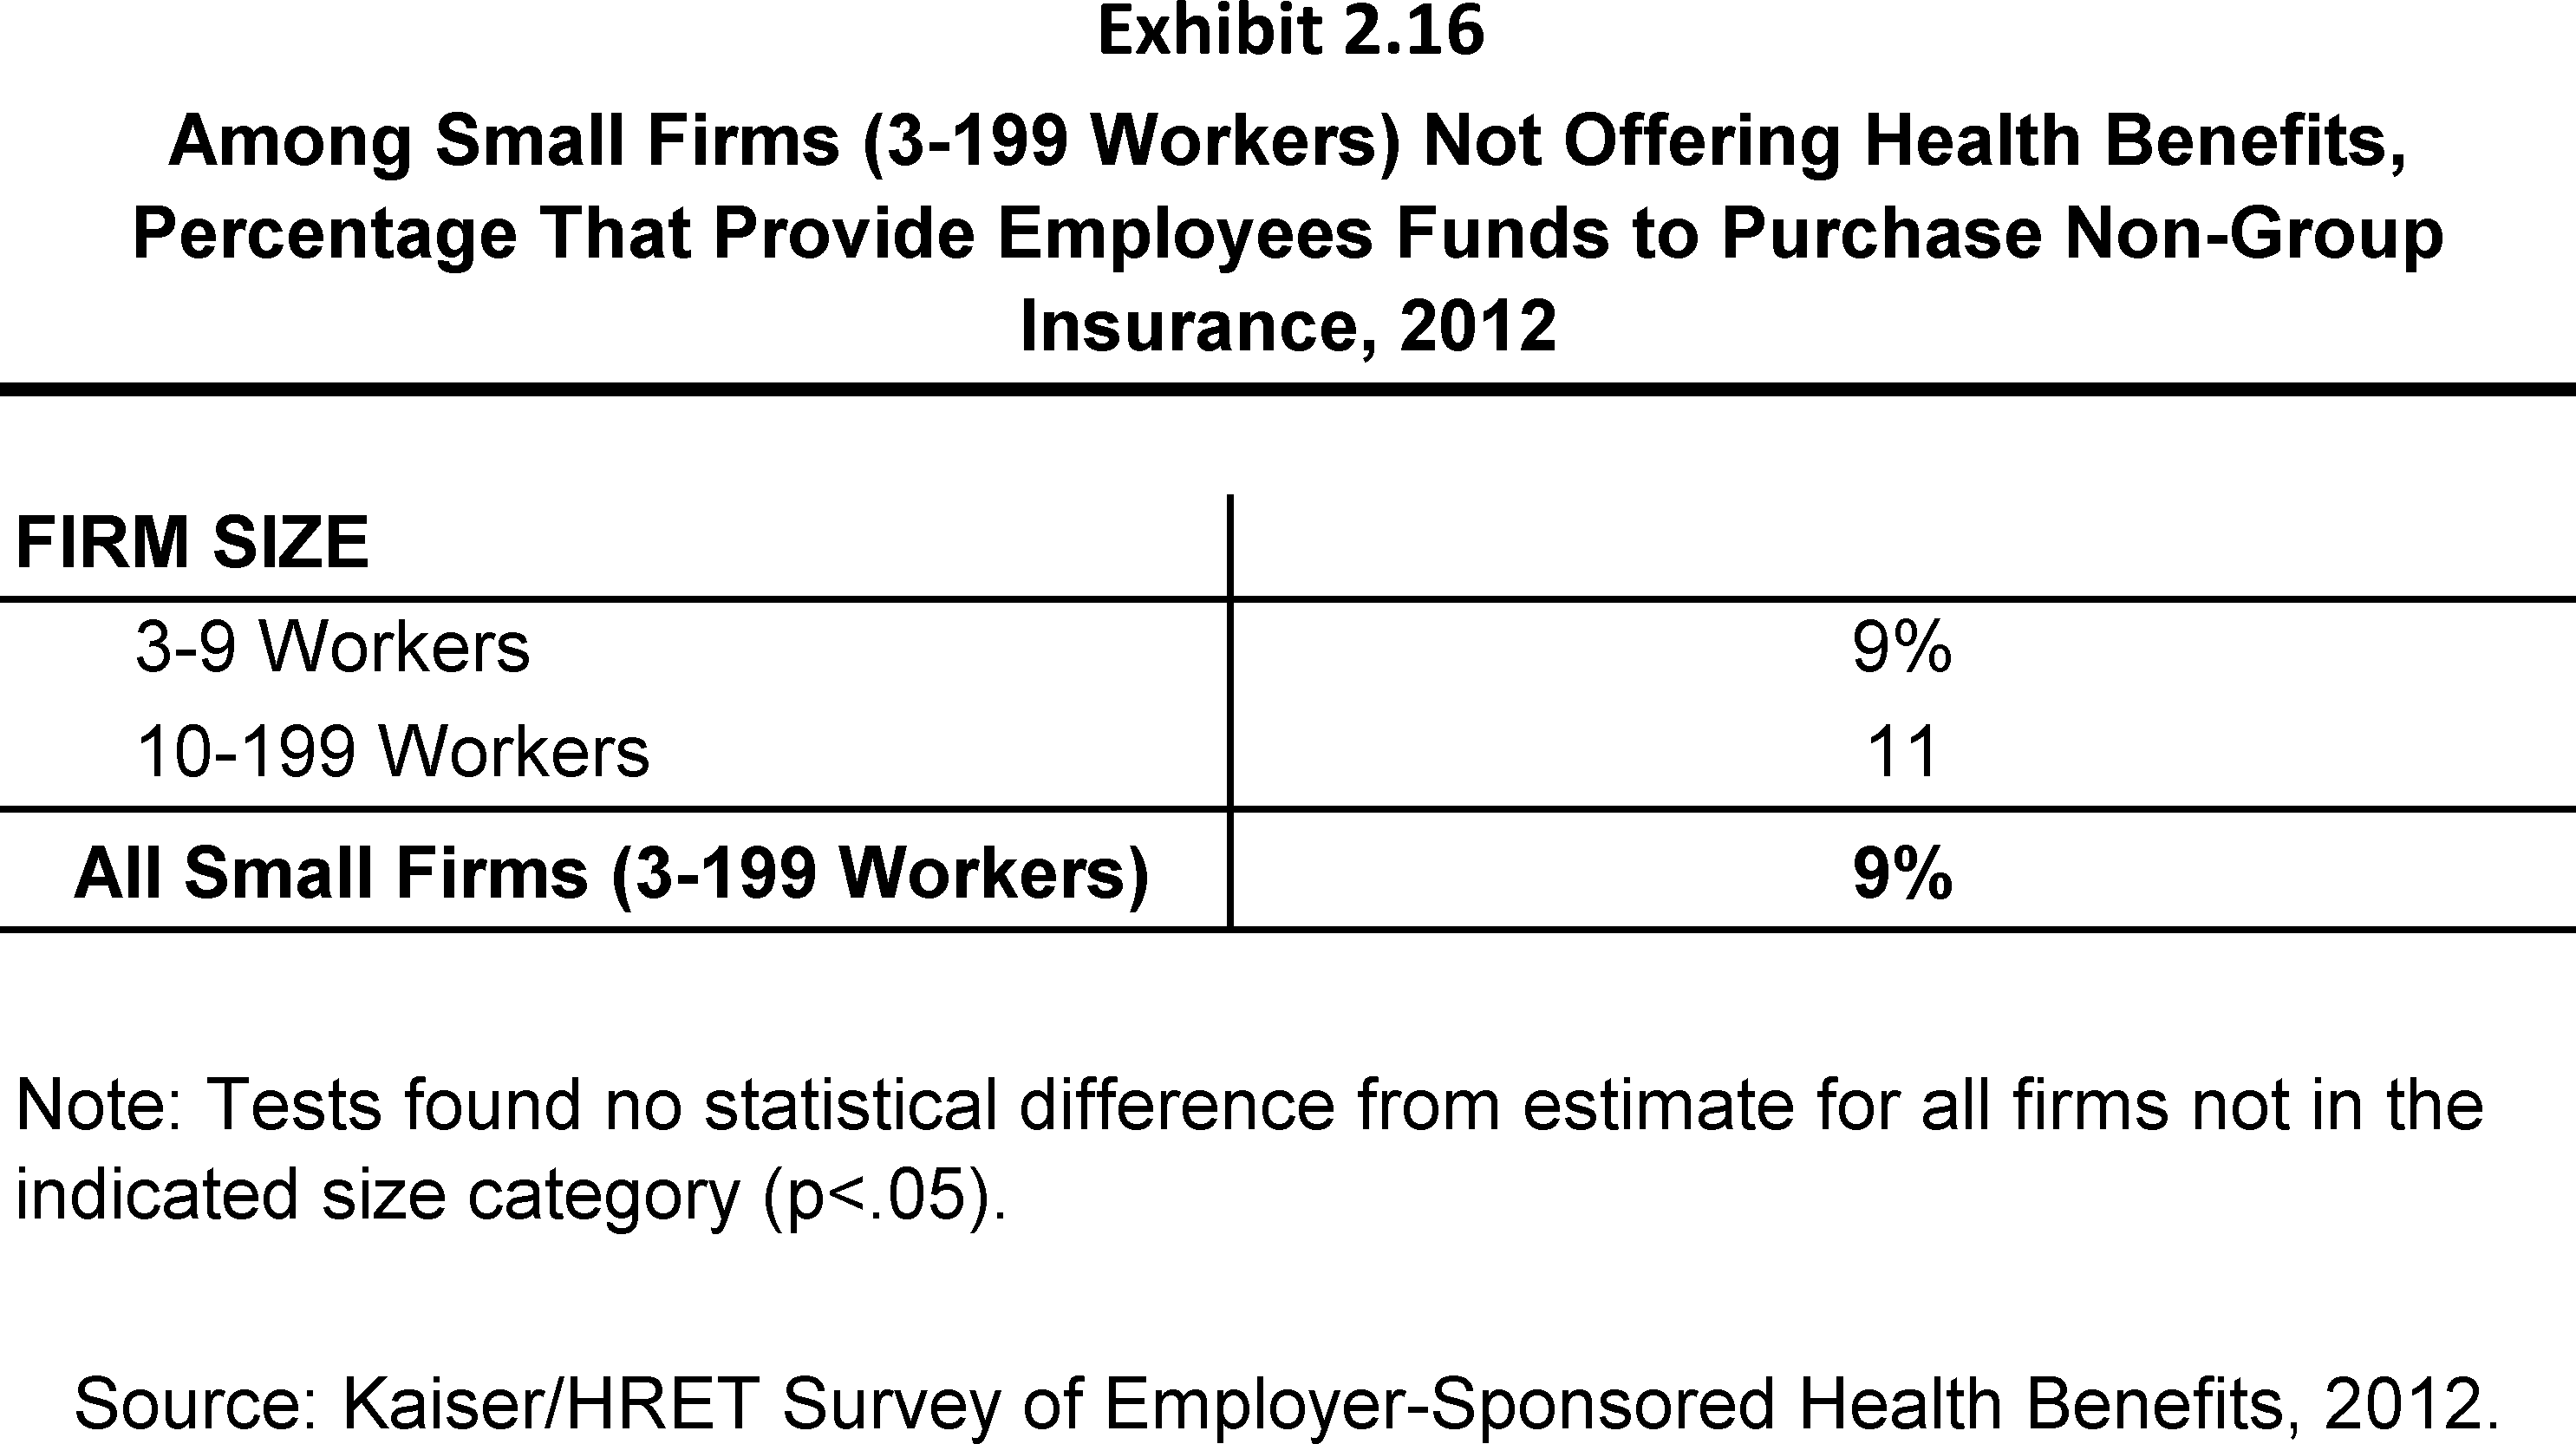
- Among non-offering small firms (3-199 workers), 9% report that they provide funds to their employees to purchase health insurance through the individual (non-group) market (Exhibit 2.16).
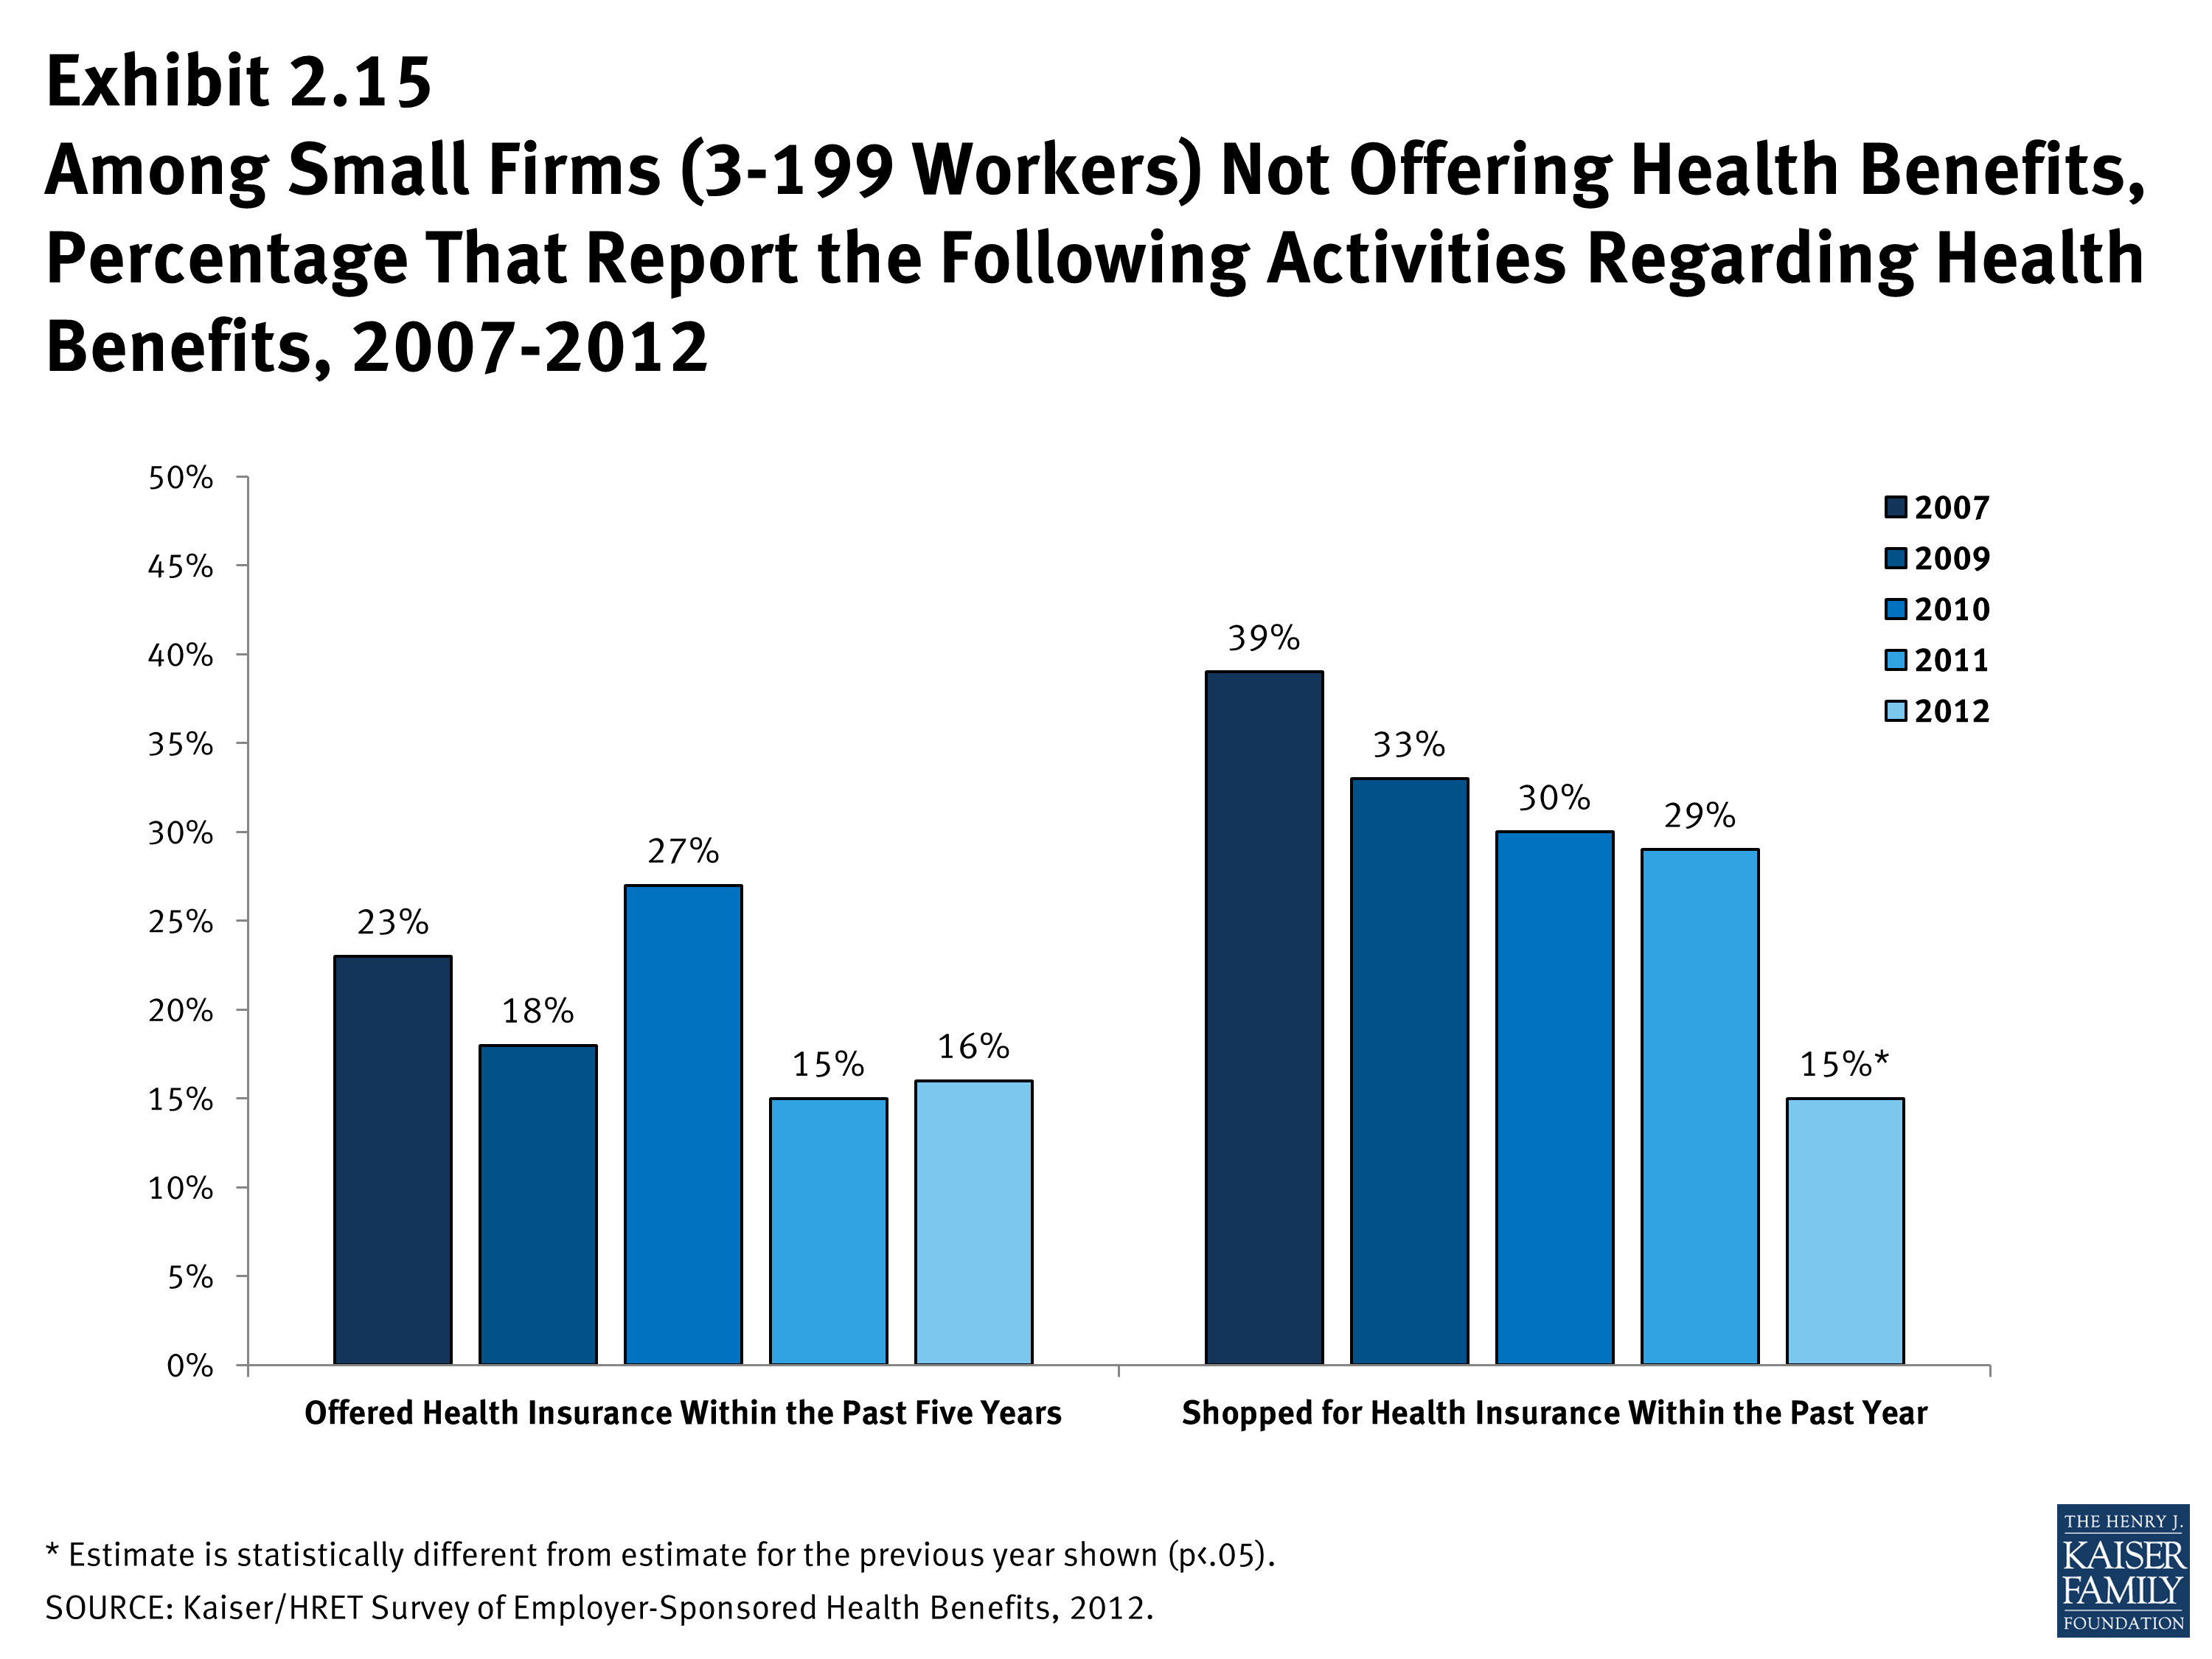
- Sixteen percent of non-offering small firms (3-199 workers) have offered health benefits in the past five years, while 15% have shopped for coverage in the past year (Exhibit 2.15). Sixteen percent of those that stopped offering within the past five years reported doing so in just the past 12 months.
Percentage of Firms Offering Health Benefits, 1999–2012
Percentage of Firms Offering Health Benefits, by Firm Size, 1999-2012
Percentage of Firms Offering Health Benefits, by Firm Size, Region, and Industry, 2012
Percentage of Firms Offering Health Benefits, by Firm Characteristics, 2012
Among Firms Offering Health Benefits, Percentage That Offer Health Benefits to Part-Time Workers, by Firm Size, 1999-2012
Among Firms Offering Health Benefits, Percentage That Offer Health Benefits to Temporary Workers, by Firm Size, 1999-2012
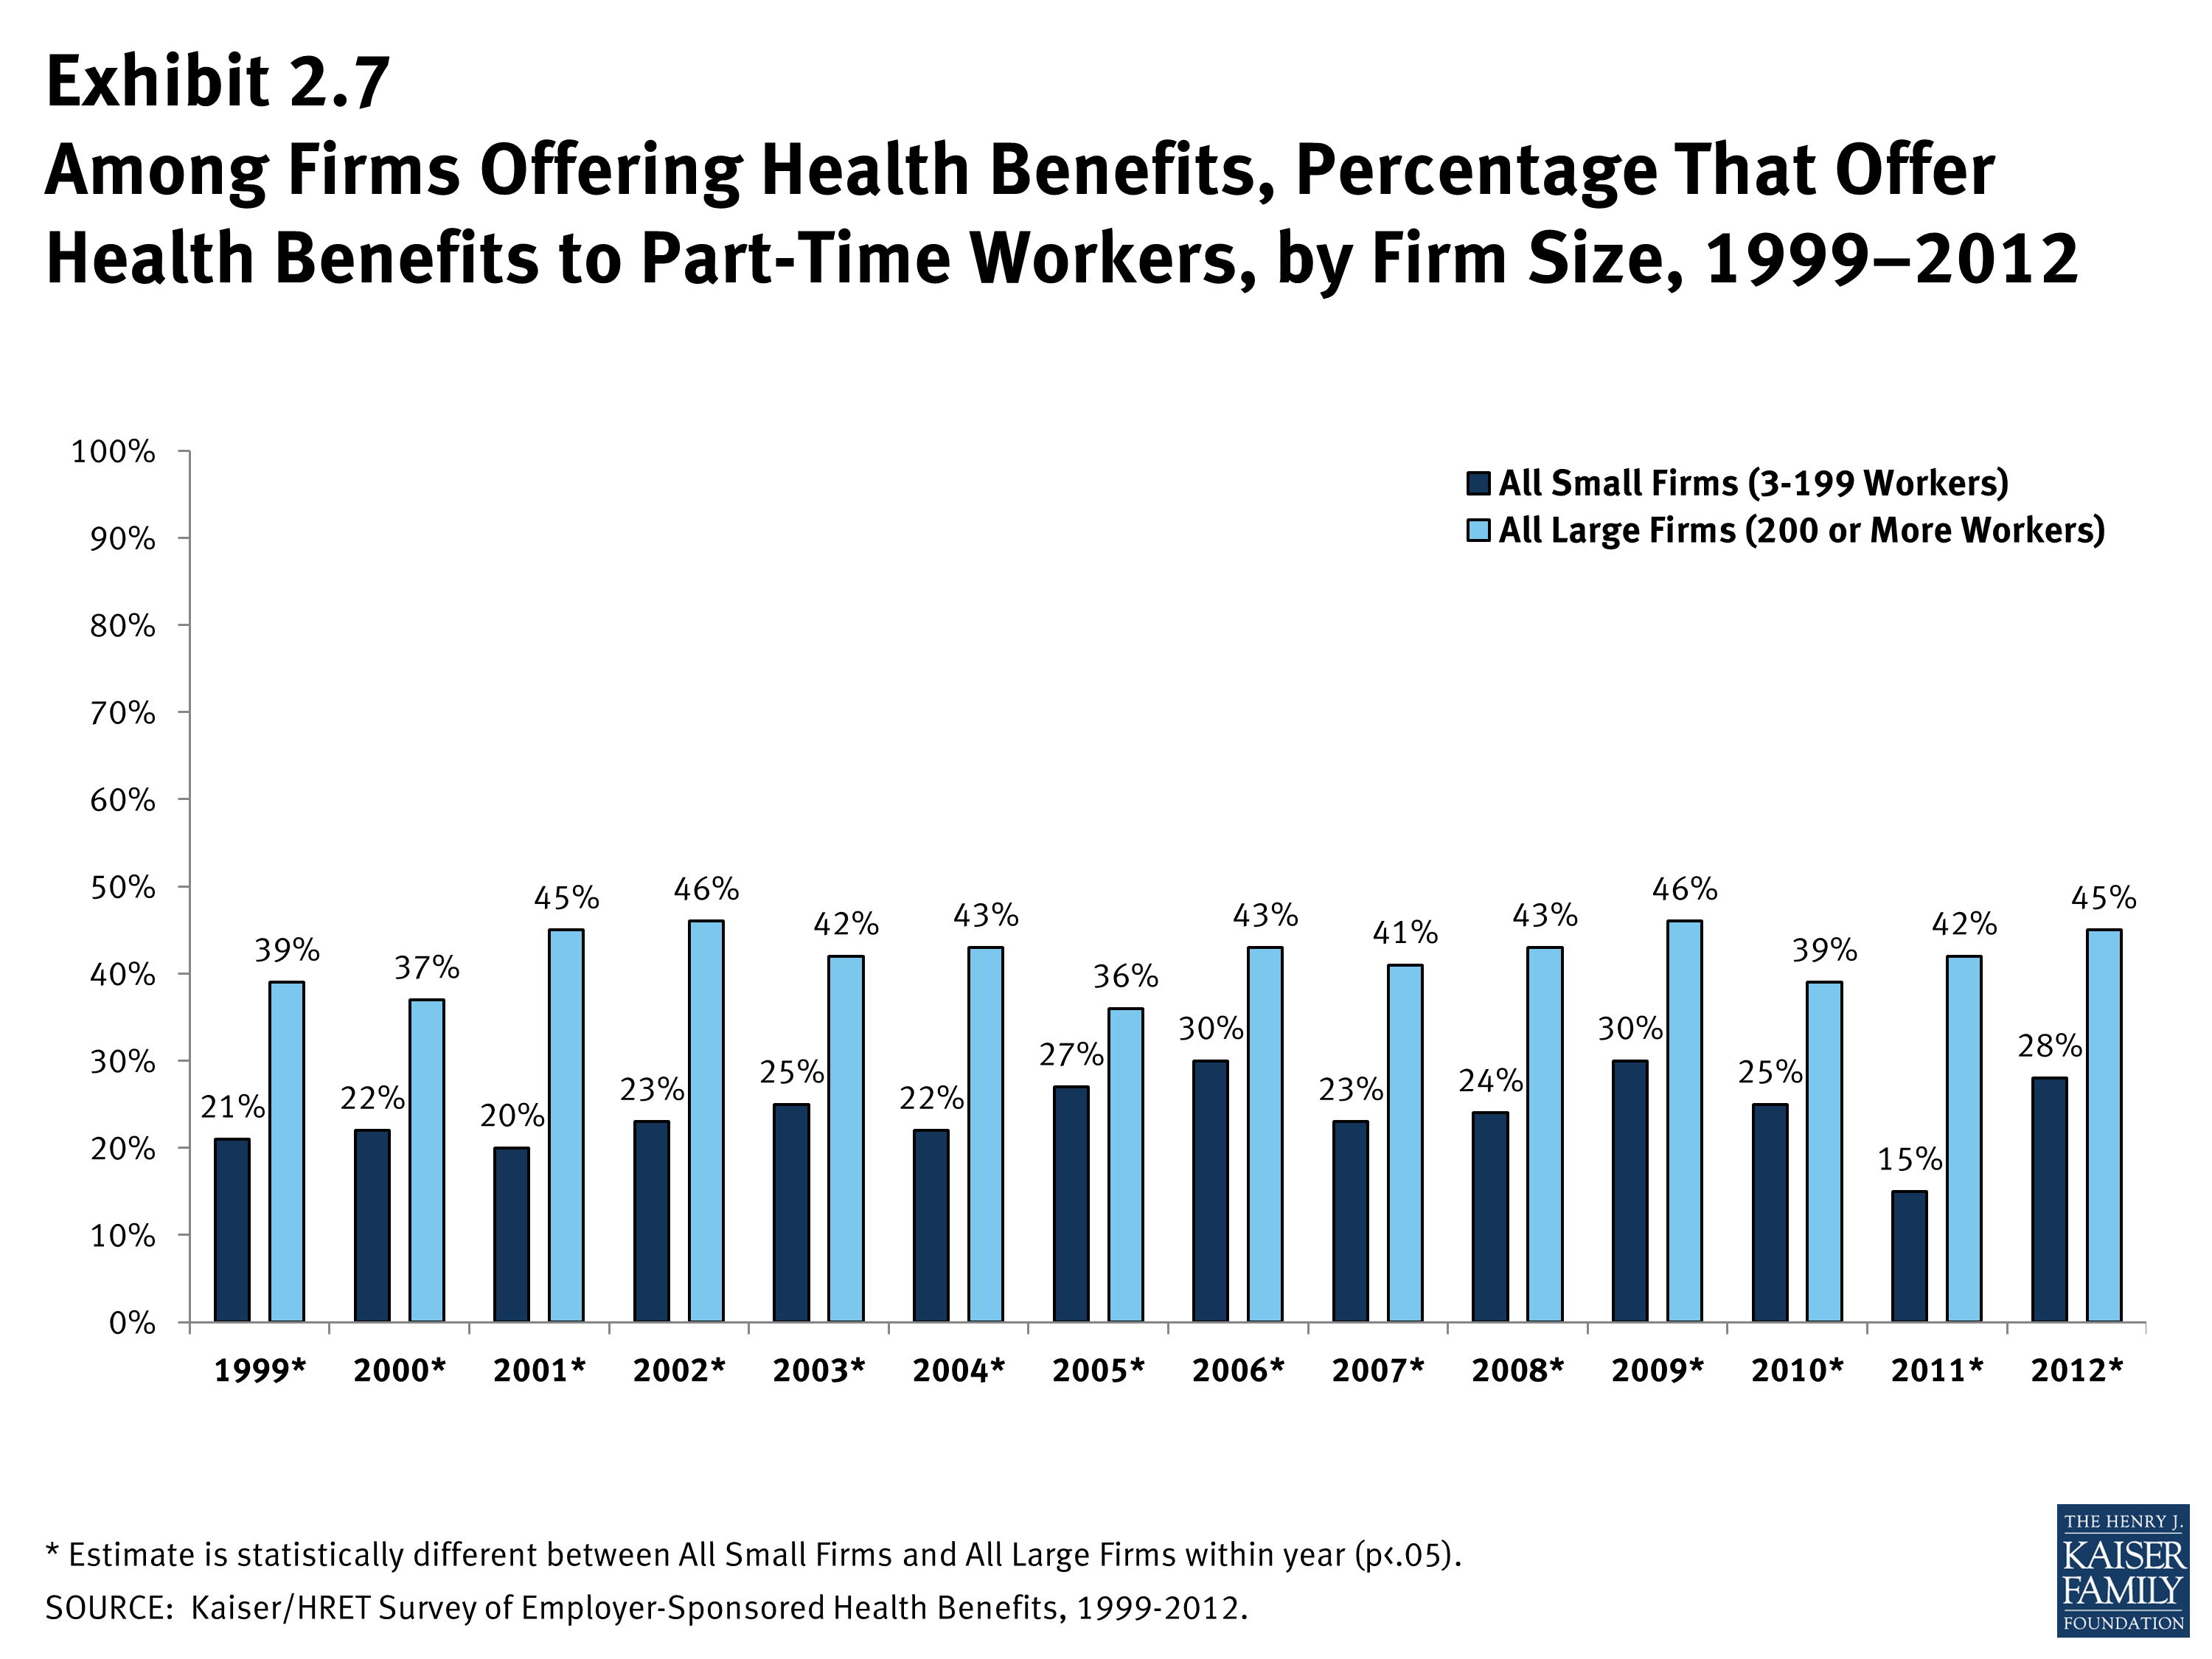
Among Firms Offering Health Benefits, Percentage That Offer Health Benefits to Part-Time Workers, by Firm Size, 1999–2012
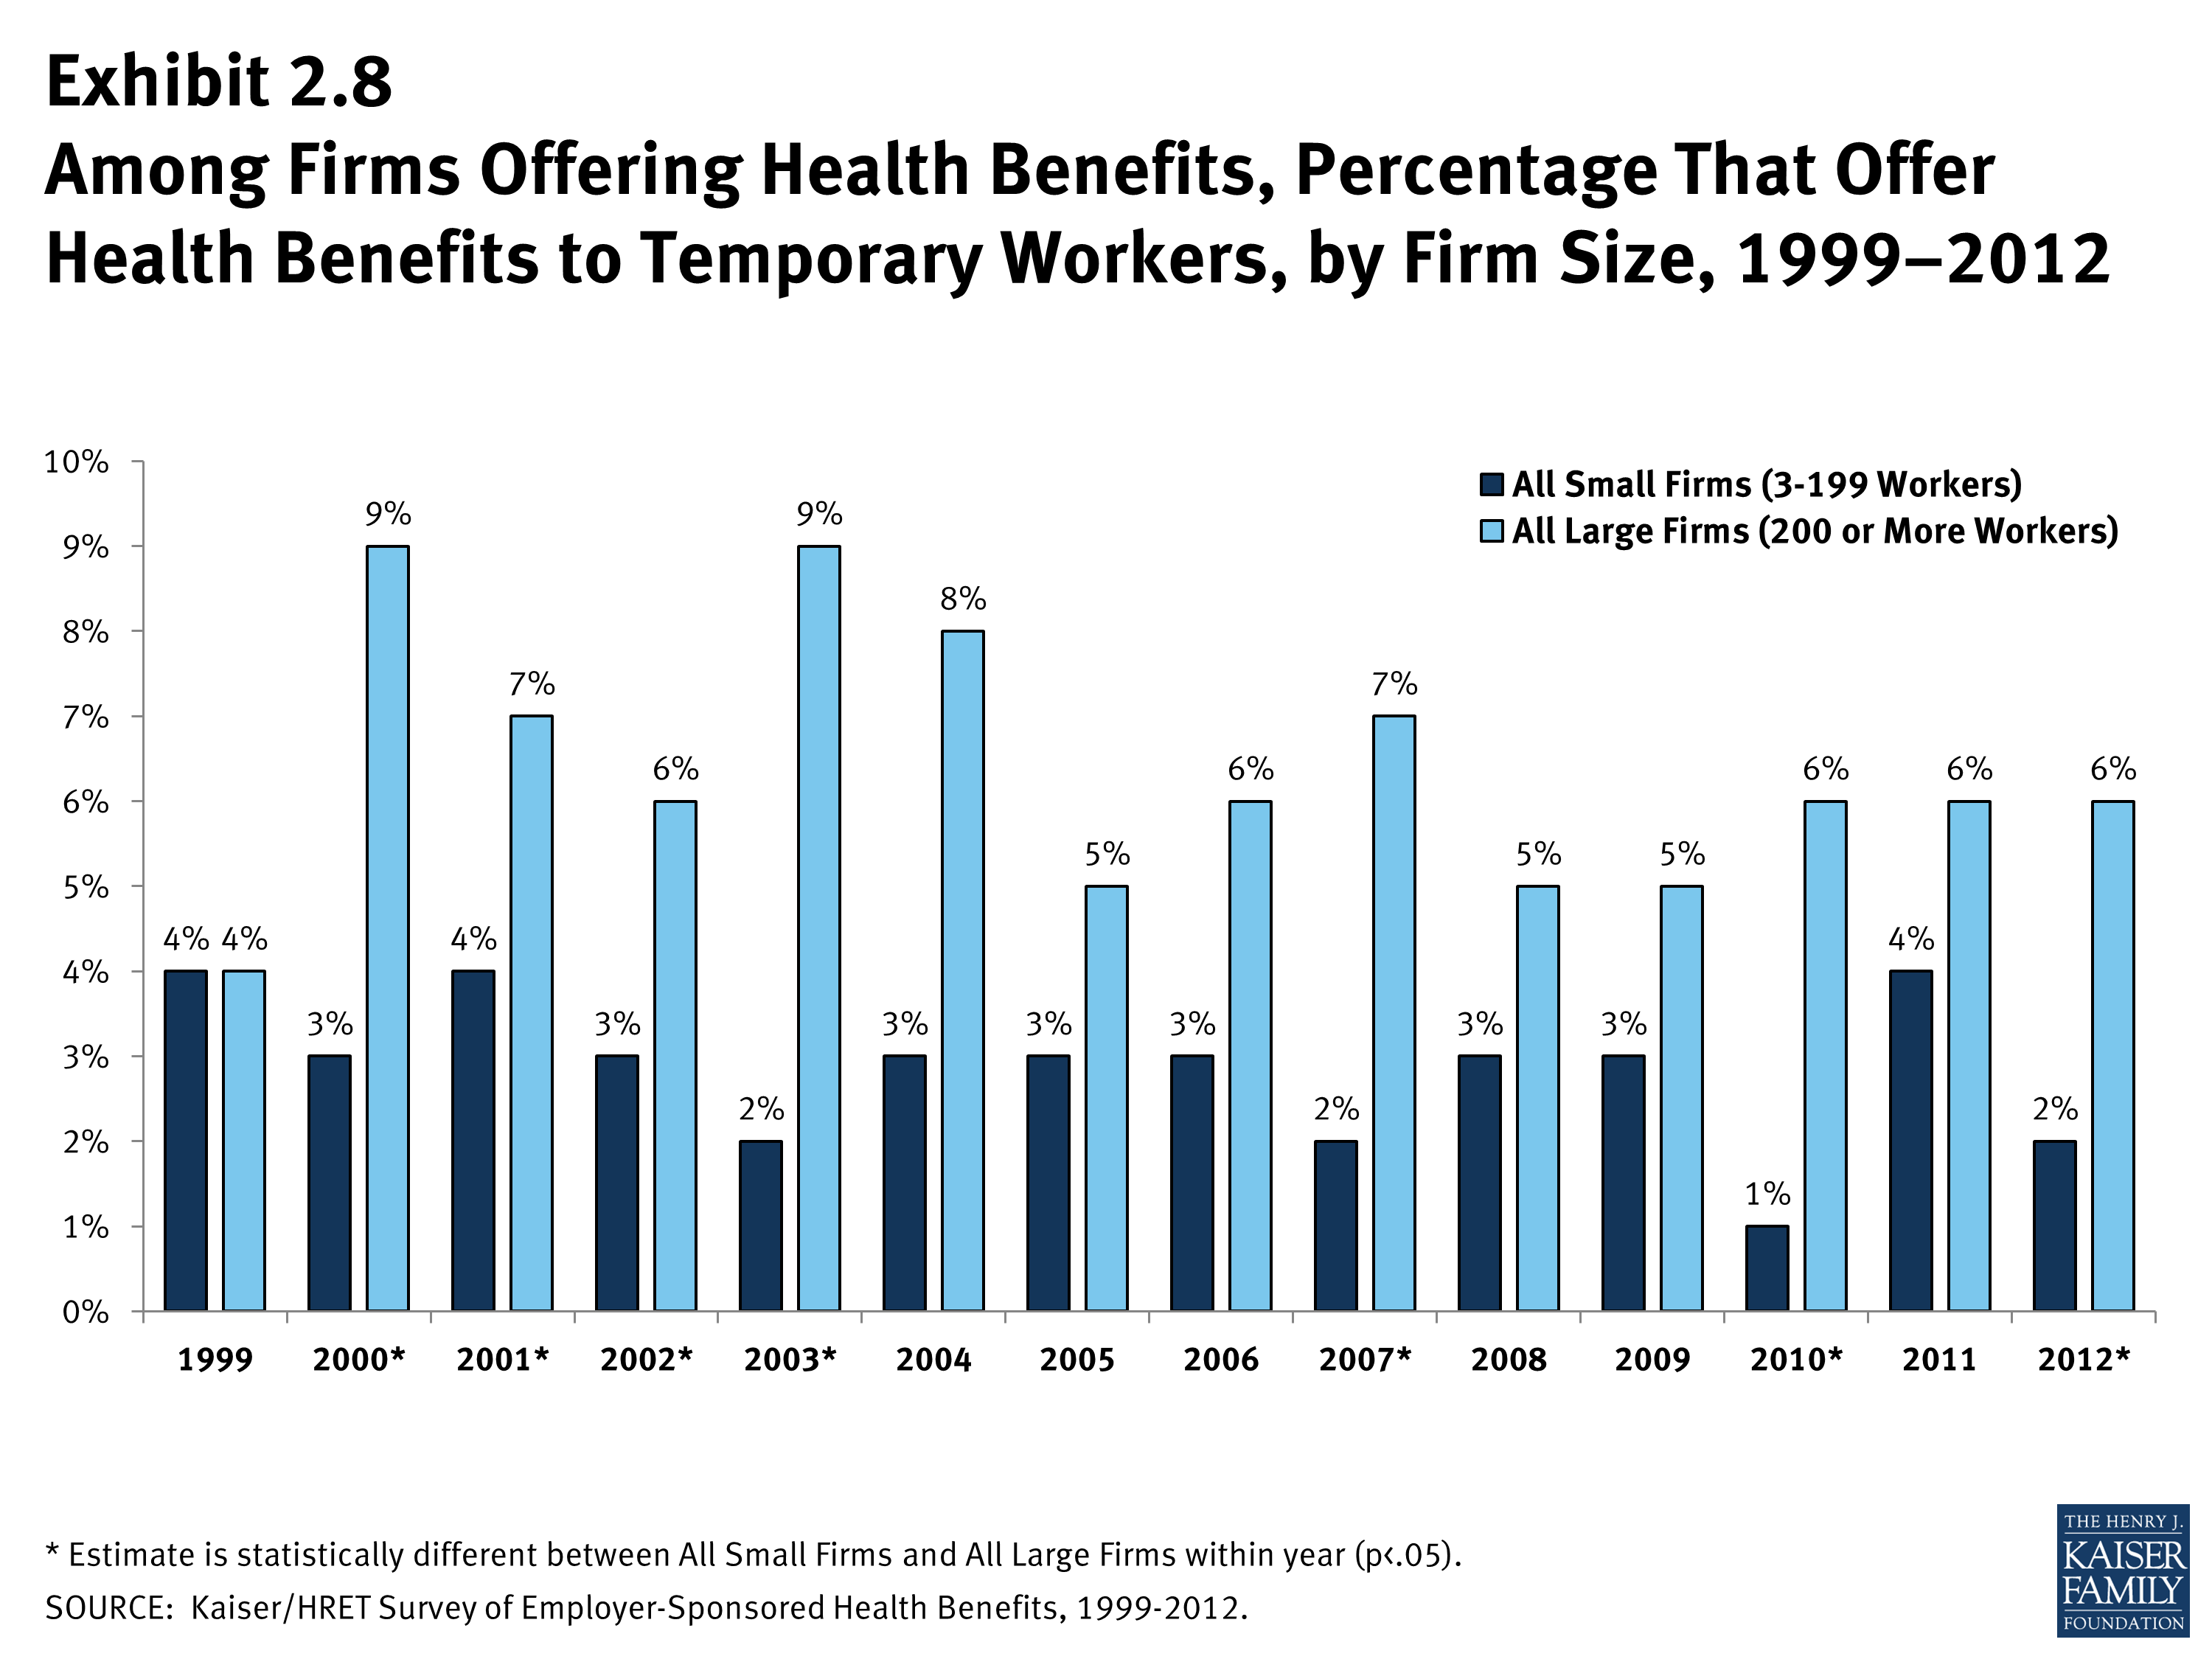
Among Firms Offering Health Benefits, Percentage That Offer Health Benefits to Temporary Workers, by Firm Size, 1999–2012
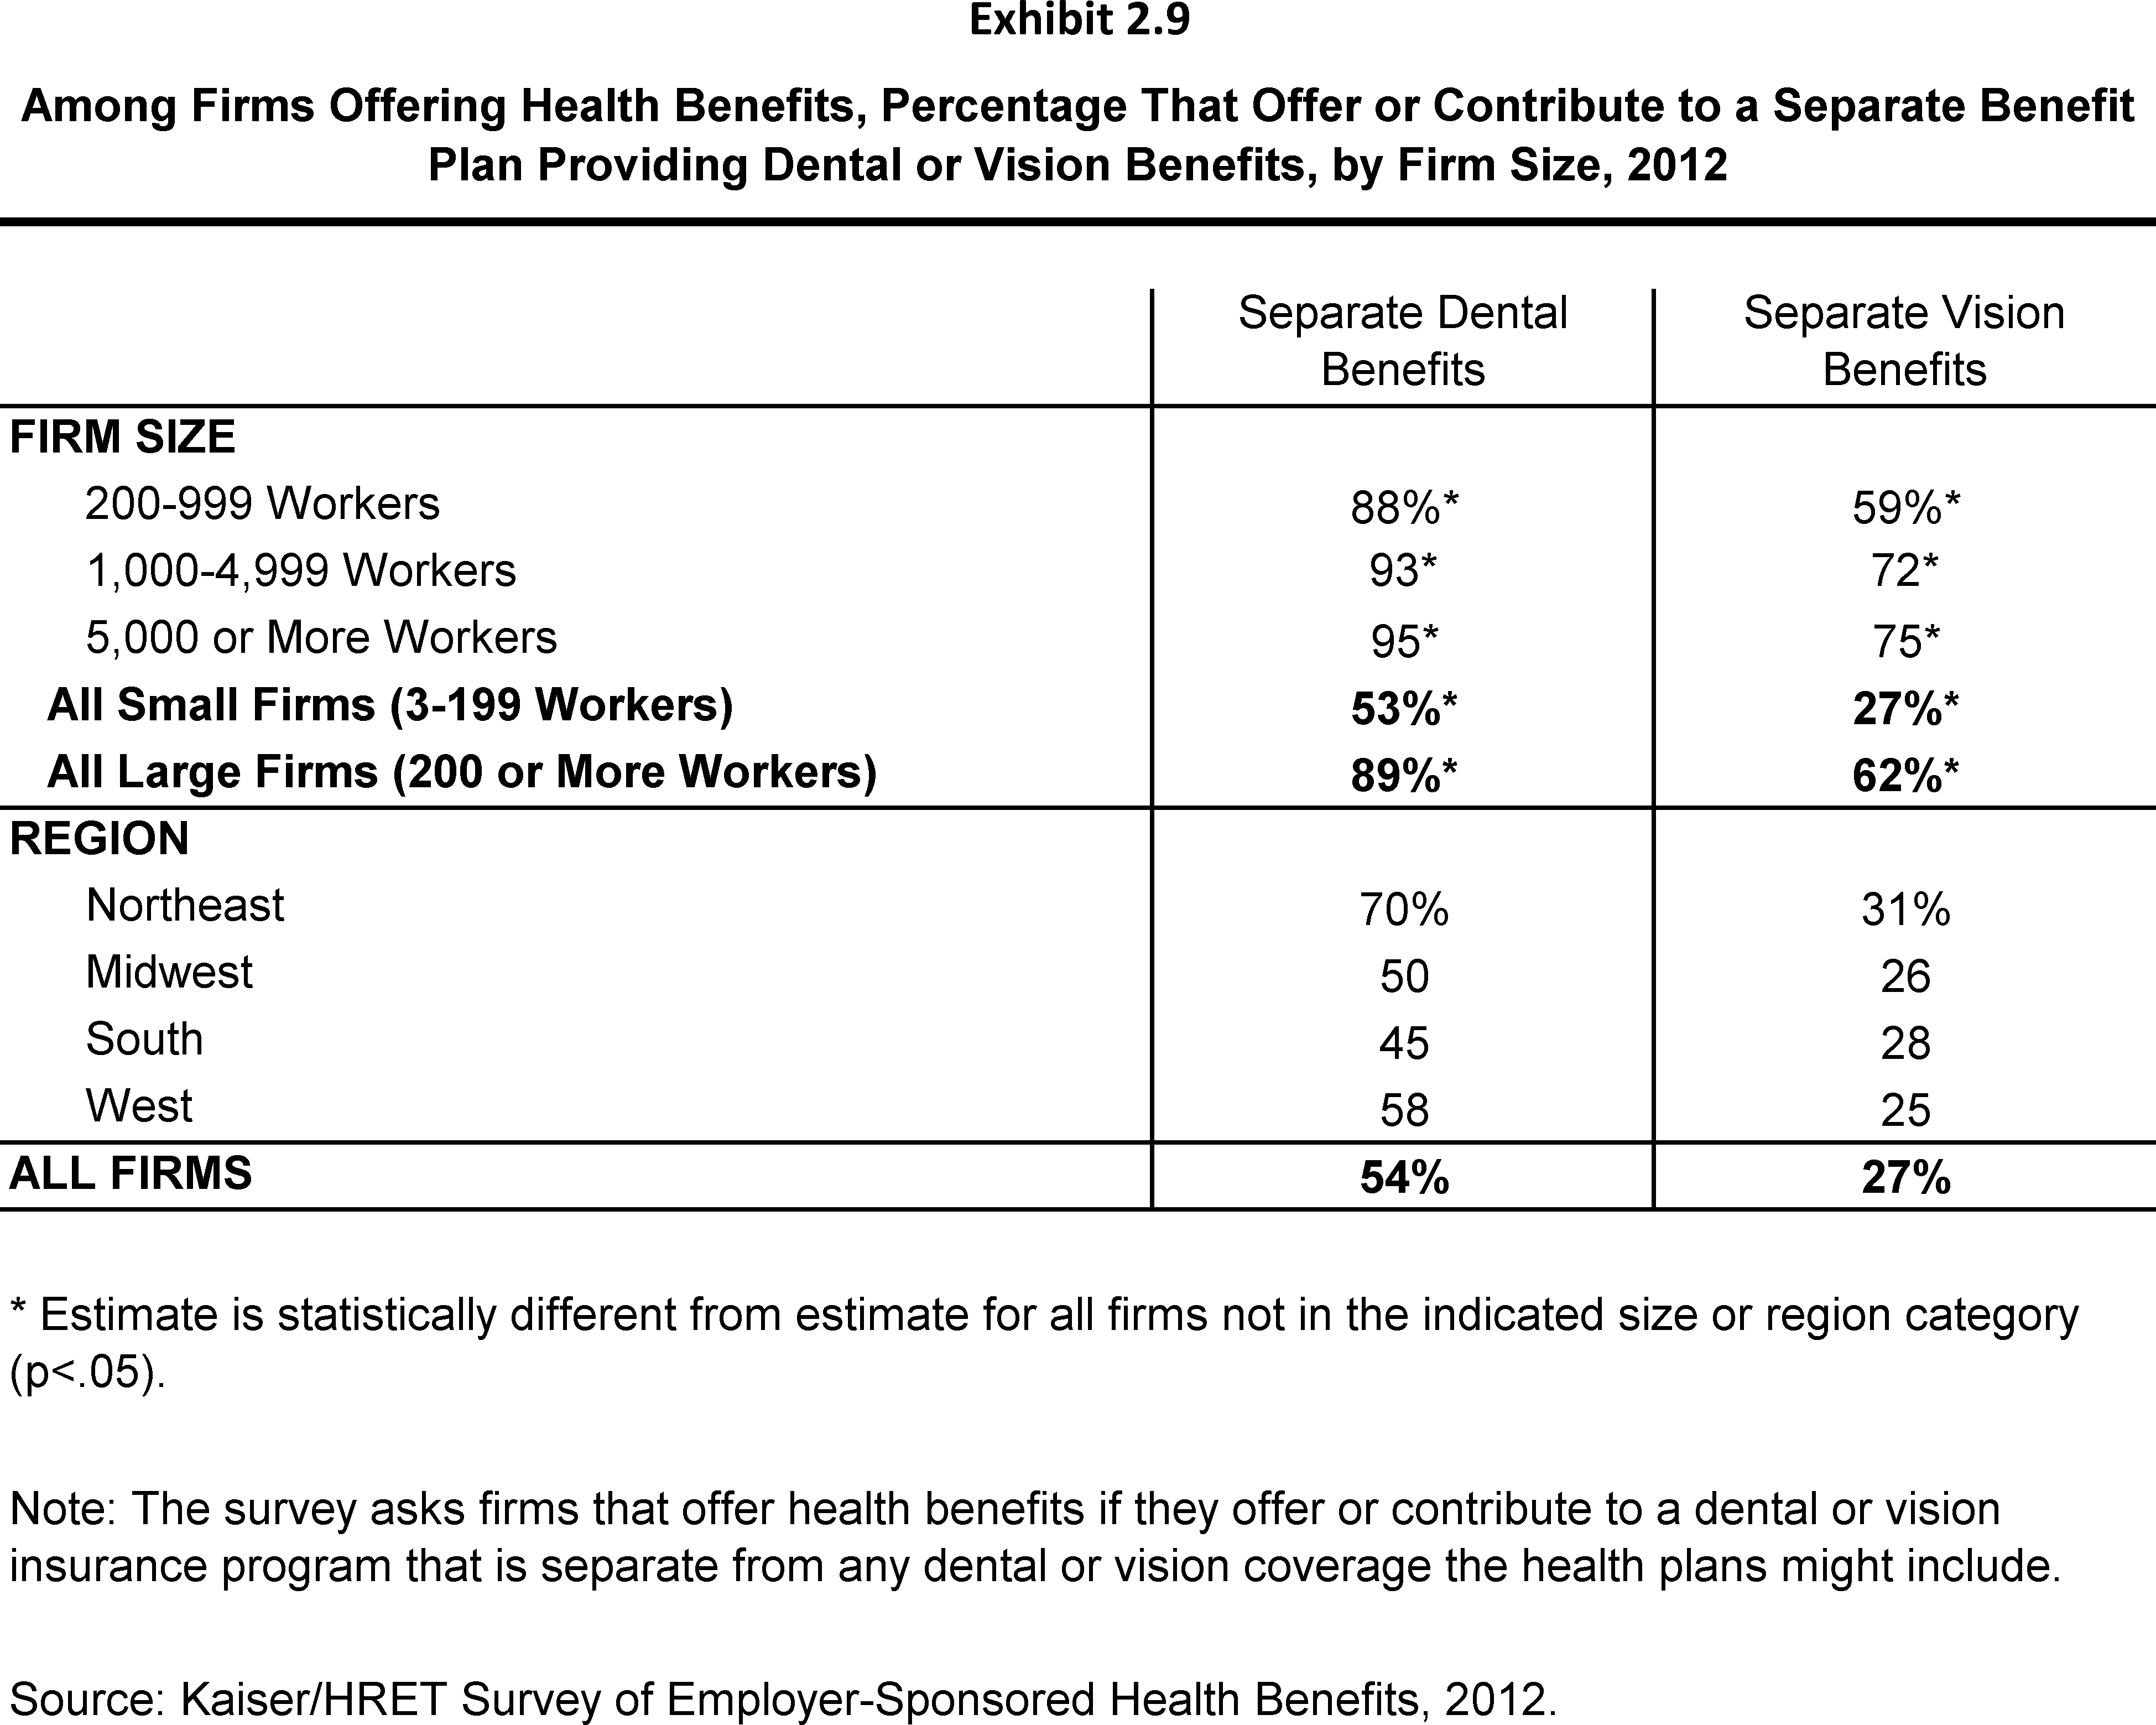
Among Firms Offering Health Benefits, Percentage That Offer or Contribute to a Separate Benefit Plan Providing Dental or Vision Benefits, by Firm Size, 2012
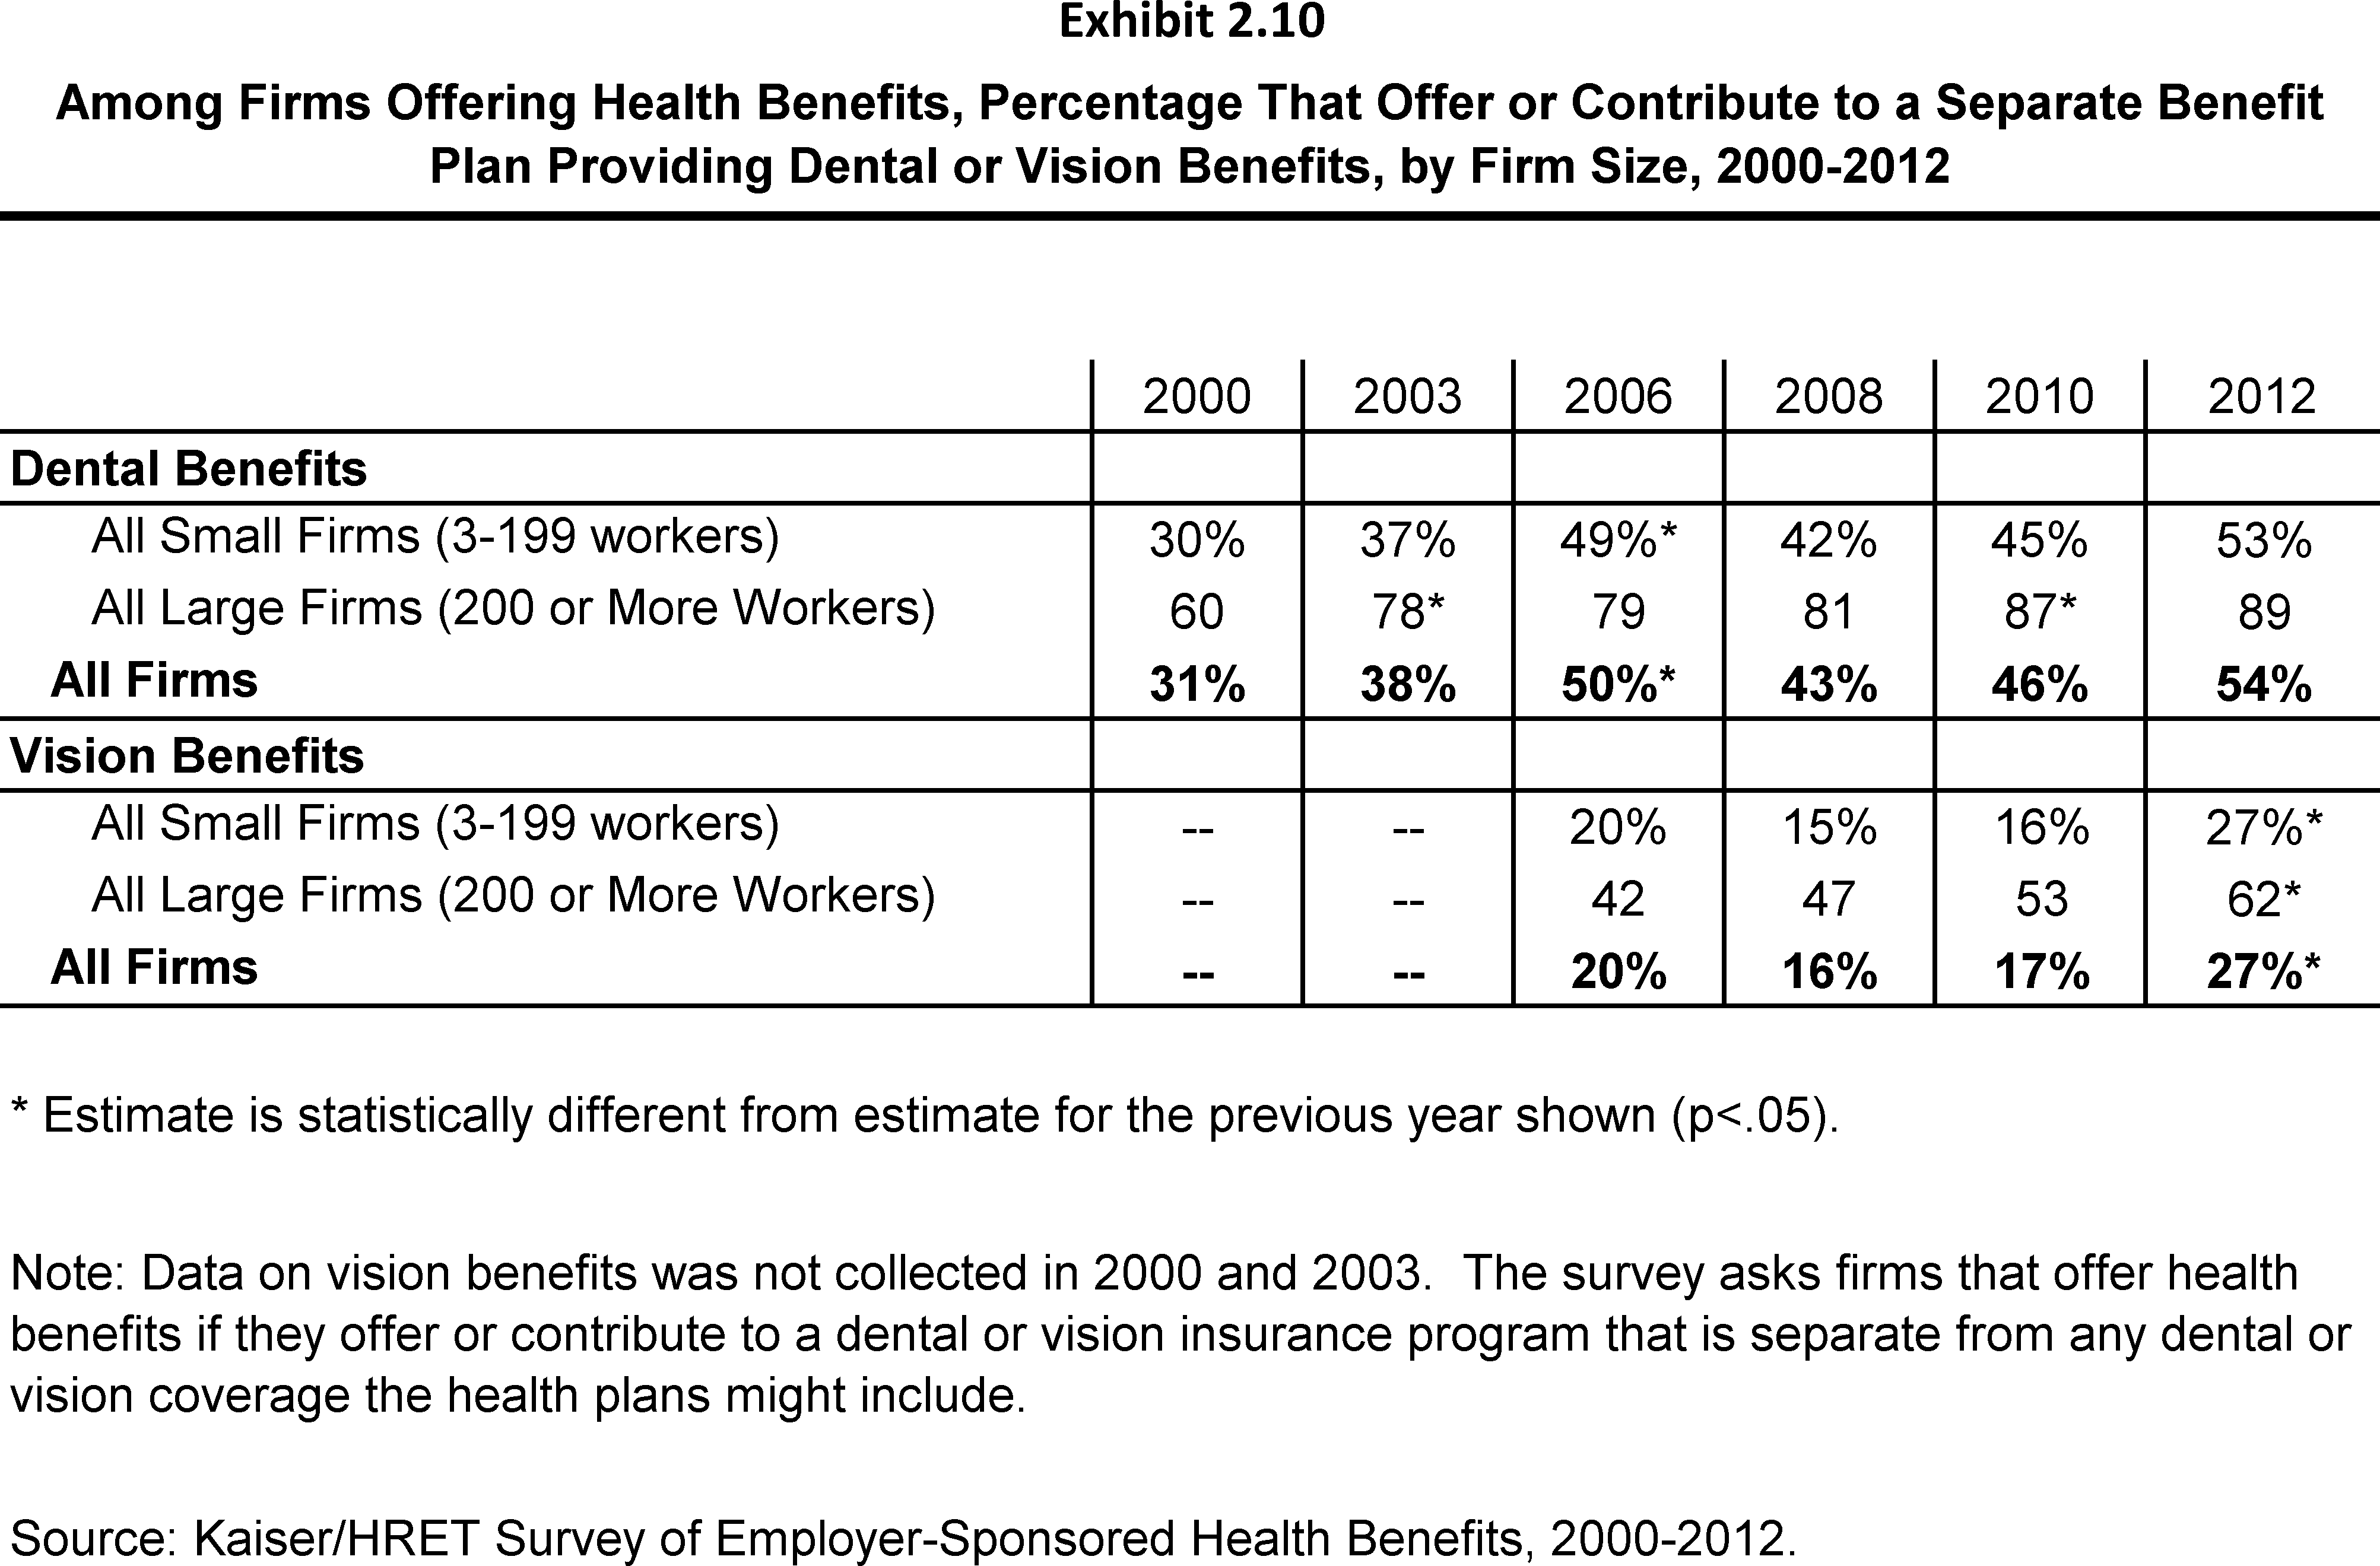
Among Firms Offering Health Benefits, Percentage That Offer or Contribute to a Separate Benefit Plan Providing Dental or Vision Benefits, by Firm Size, 2000-2012
Among Firms Offering Health Benefits, Distribution of Whether Employers Offer Health Benefits to Unmarried Opposite-Sex Domestic Partners, by Firm Size and Region, 2012
Among Firms Offering Health Benefits, Distribution of Whether Employers Offer Health Benefits to Unmarried Same-Sex Domestic Partners, by Firm Size and Region, 2012
Among Firms Offering Health Benefits, Percent of Employers That Offer Health Benefits to Unmarried Opposite-Sex and Same-Sex Domestic Partners, by Firm Size, 2008, 2009 & 2012
Among Small Firms (3-199 Workers) Not Offering Health Benefits, the Most Important Reason for Not Offering, 2012
Among Small Firms (3-199 Workers) Not Offering Health Benefits, Percentage That Report the Following Activities Regarding Health Benefits, 2007-2012
Among Small Firms (3-199 Workers) Not Offering Health Benefits, Percentage That Provide Employees Funds to Purchase Non-Group Insurance, 2012
Section 3: Employee Coverage, Eligibility, and Participation
Employers are the principal source of health insurance in the United States, providing health benefits for about 149 million nonelderly people in America.1 Most workers are offered health coverage at work, and the majority of workers who are offered coverage take it. Workers may not be covered by their own employer for several reasons: their employer may not offer coverage, they may be ineligible for benefits offered by their firm, they may choose to elect coverage through their spouse’s employer, or they may refuse coverage from their firm.
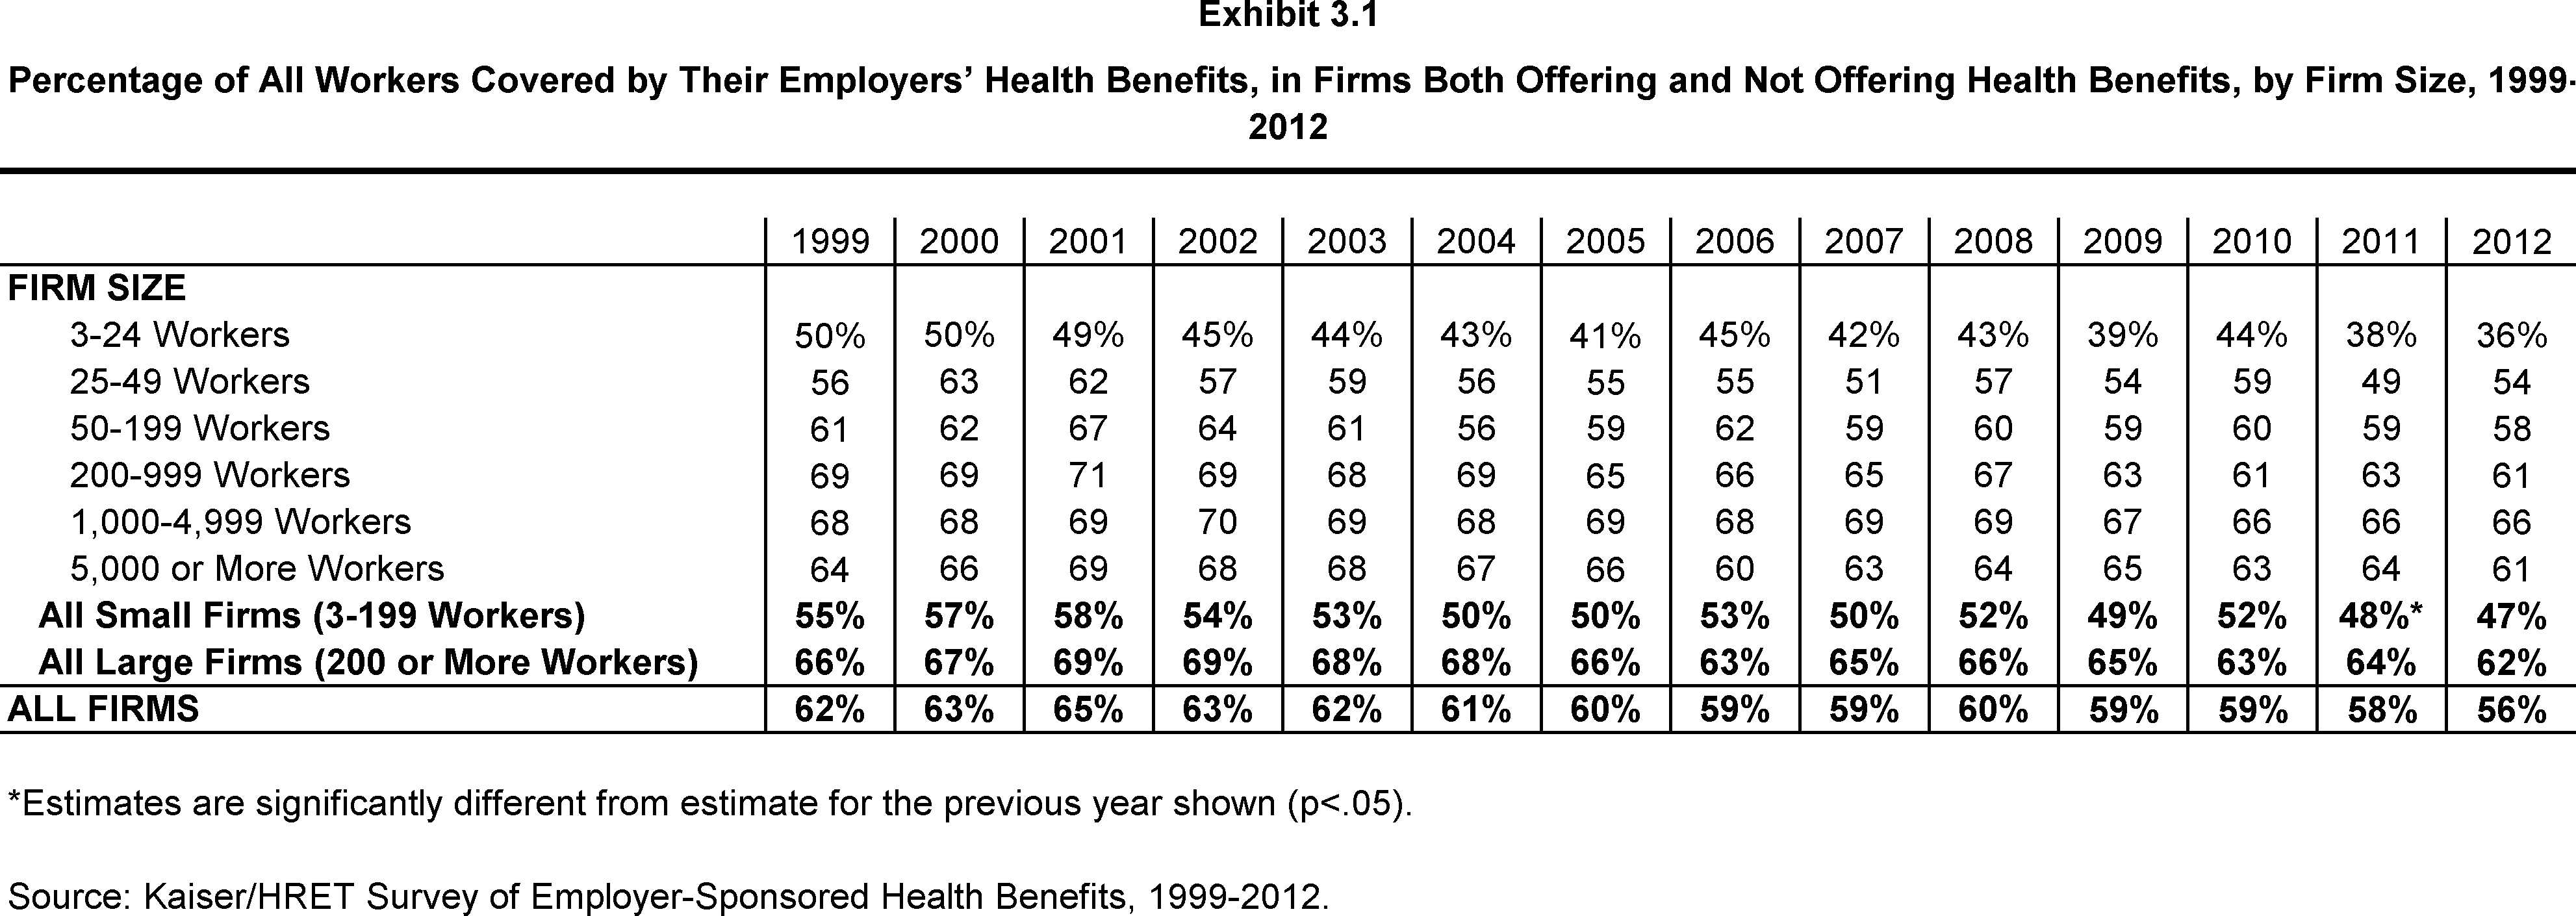
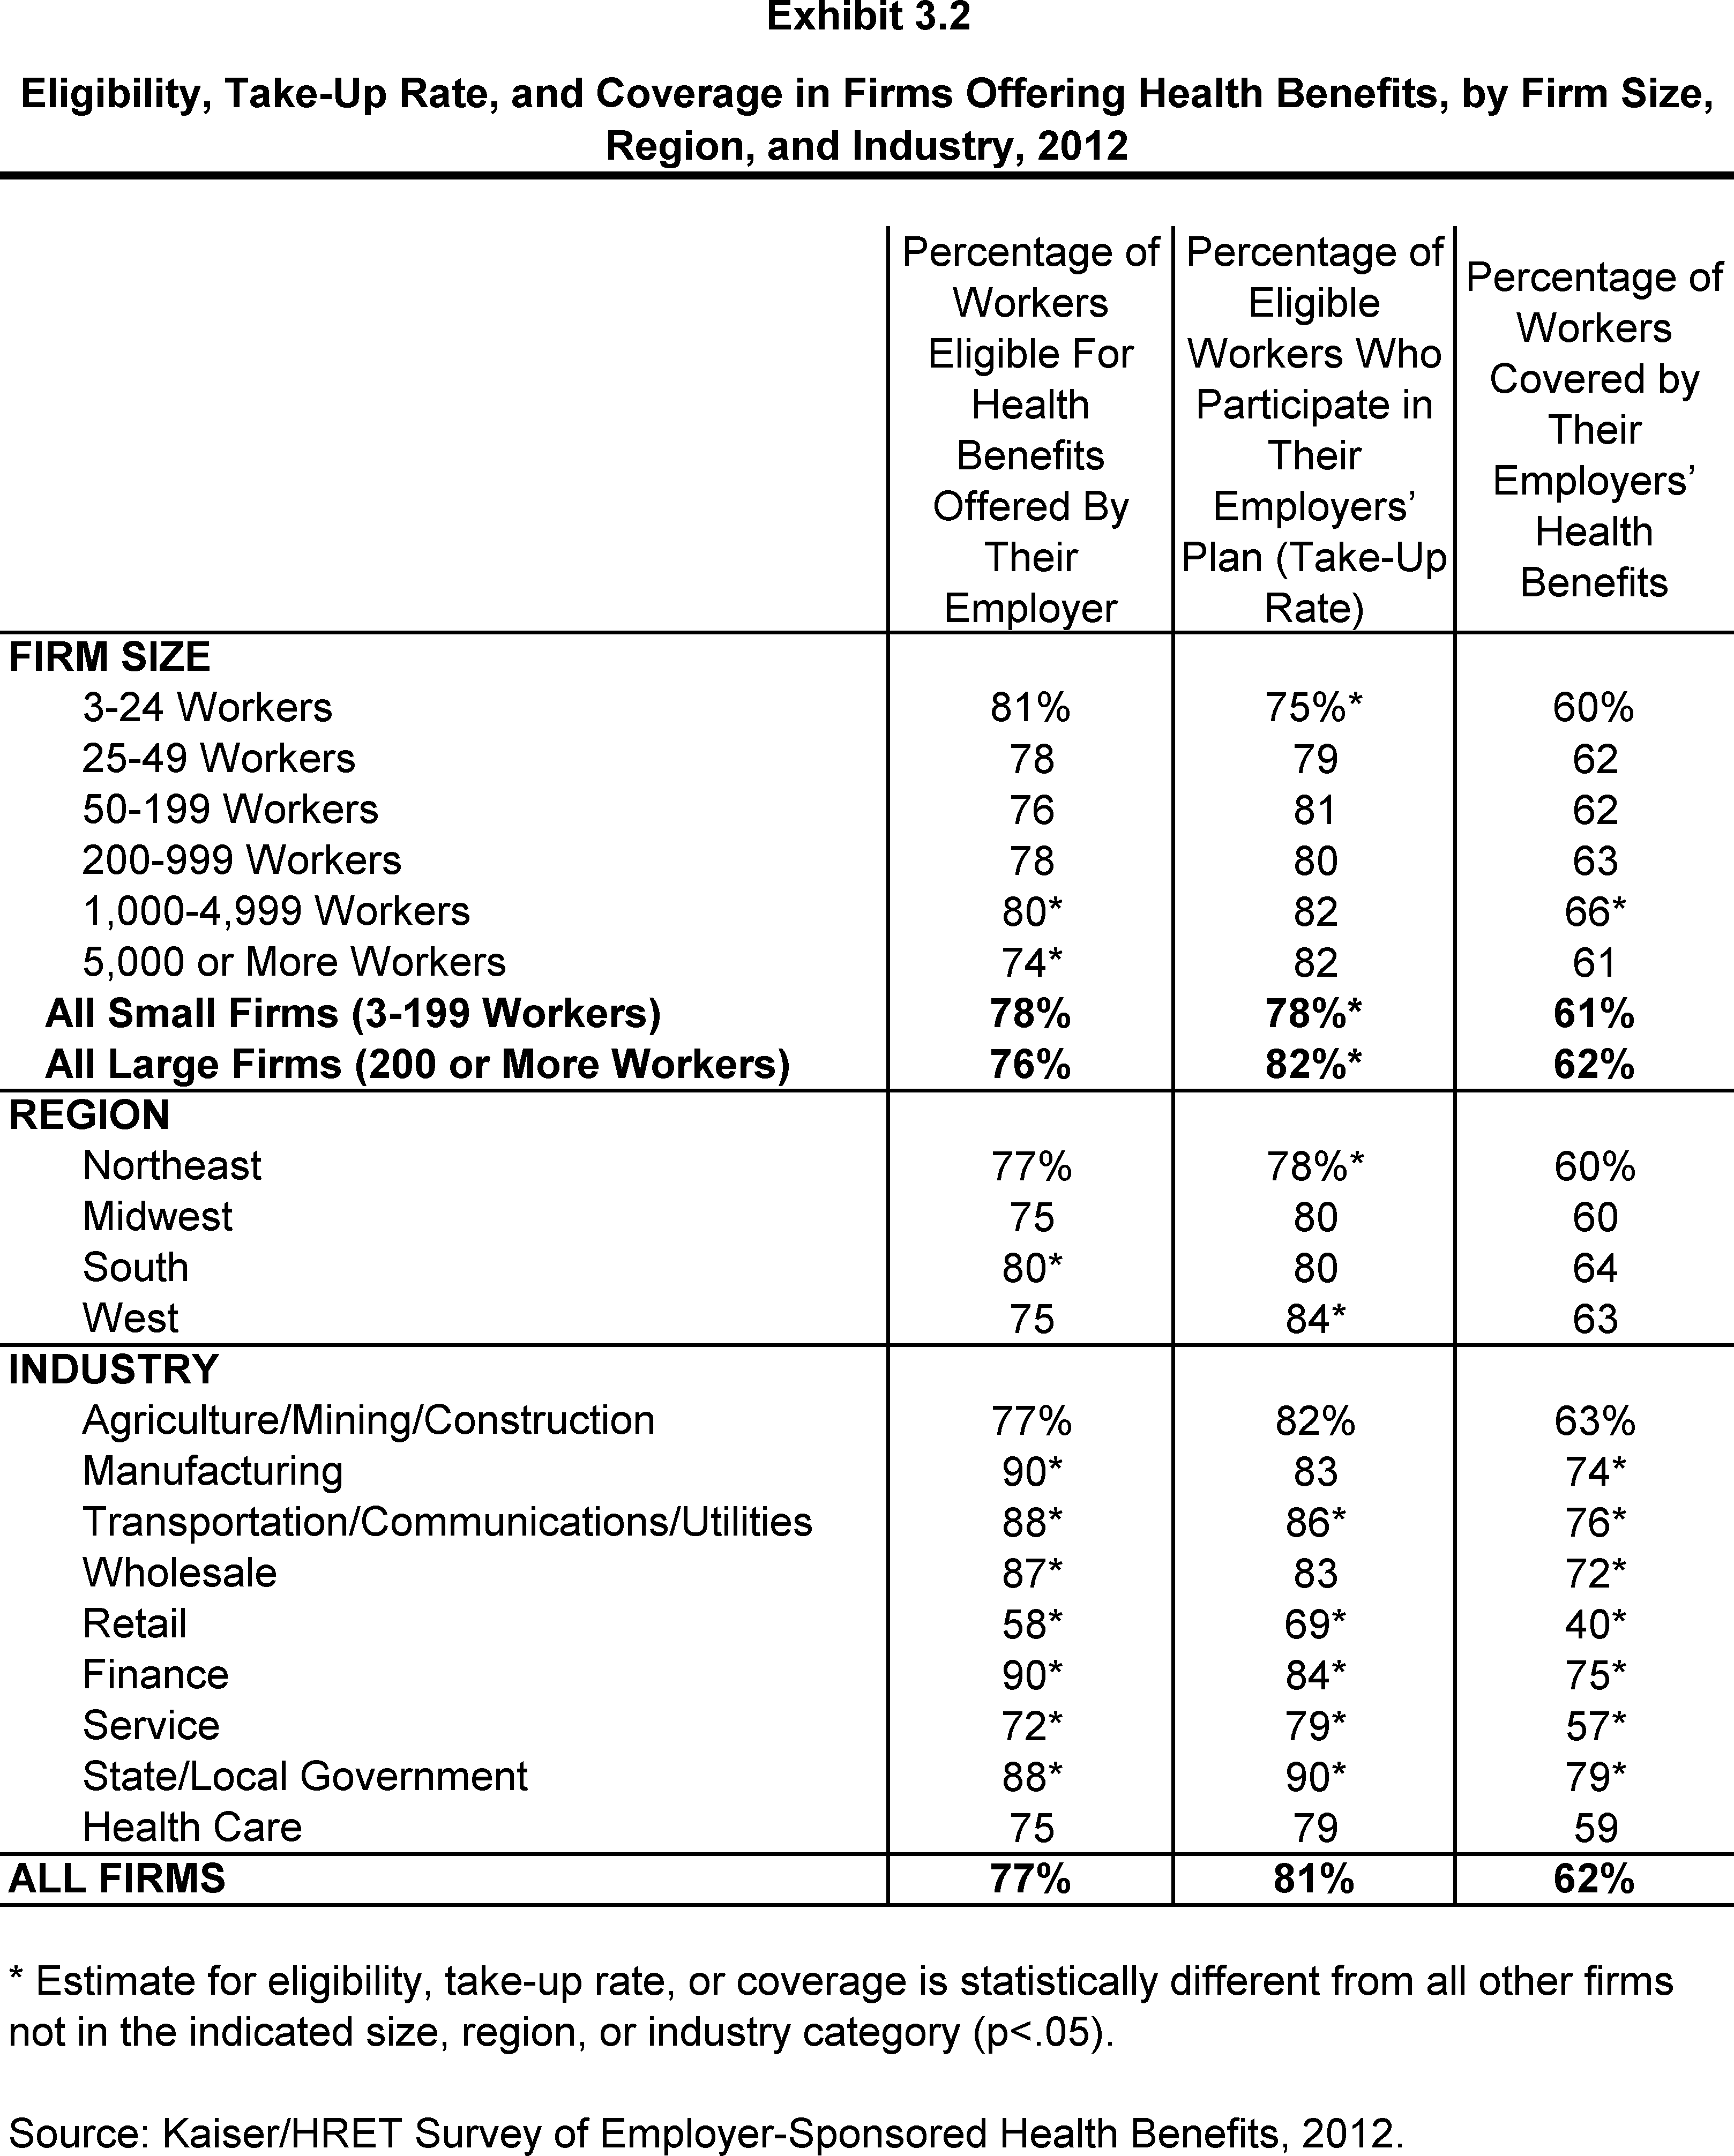
- Among firms offering health benefits, 62% percent of workers are covered by health benefits through their own employer (Exhibit 3.2). When considering both firms that offer health benefits and those that don’t, 56% of workers are covered under an employer plan (Exhibit 3.1). This coverage rate has remained stable over time.
- Not all employees are eligible for the health benefits offered by their firm, and not all eligible employees take up the offer of coverage. The share of workers covered in a firm is a product of both the percentage of workers who are eligible for the firm’s health insurance and the percentage who choose to “take up” (i.e., elect to participate in) the benefit.
- Seventy-seven percent of workers in firms offering health benefits are eligible for the coverage offered by their employer (Exhibit 3.2).
- Eligibility varies considerably by wage level. Employees in firms with a lower proportion of lower-wage workers (less than 35% of workers earn $24,000 or less annually) are more likely to be eligible for health benefits than employees in firms with a higher proportion of lower-wage workers (where 35% or more of workers earn $24,000 or less annually) (79% vs. 66%). We observe a similar pattern among firms with many higher-wage workers (35% or more of workers earn $55,000 or more annually) (82% vs. 73%) (Exhibit 3.3).
- Eligibility also varies by the age of the workforce. Those in firms with fewer younger workers (less than 35% of workers are age 26 or younger) are more likely to be eligible for health benefits than are workers in firms with many younger workers (35% or more of workers are age 26 or younger), at 79% versus 60% (Exhibit 3.3).
- Employees who are offered health benefits generally elect to take up the coverage. In 2012, 81% of eligible workers take up coverage when it is offered to them, the same as the 81% reported last year (Exhibit 3.2). 2
- The likelihood of a worker accepting a firm’s offer of coverage also varies by firm wage level. Eligible employees in firms with a lower proportion of lower-wage workers are more likely to take up coverage (82%) than eligible employees in firms with a higher proportion of lower-wage workers (35% or more of workers earn $24,000 or less annually) (71%) (Exhibit 3.4). Similar patterns are seen in firms with a higher proportion of younger workers, with workers in these firms being less likely to take up coverage than those in firms with a smaller share of younger workers (71% vs. 81%).
- The rate of coverage varies by certain firm characteristics.
- There is significant variation by industry in the coverage rate among workers in firms offering health benefits. For example, only 40% of workers in retail firms are covered by health benefits offered by their firm, compared to 79% of workers in state and local government, and 76% of workers in the transportation/communications/utilities industry category (Exhibit 3.2).
- Among workers in firms offering health benefits, those in firms with relatively few part-time workers (less than 35% of workers are part-time) are much more likely to be covered by their own firm than workers in firms with a greater percentage (35% or more) of part-time workers (68% vs. 37%) (Exhibit 3.5).
- Among workers in firms offering health benefits, those in firms with fewer lower-wage workers (less than 35% of workers earn $24,000 or less annually) are more likely to be covered by their own firm than workers in firms with many lower-wage workers (35% or more of workers earn $24,000 or less annually) (65% vs. 47%) (Exhibit 3.5). A comparable pattern exists in firms with a larger proportion of higher wage workers (35% or more earn $55,000 or more annually).
- Among workers in firms offering health benefits, those in firms with fewer younger workers (less than 35% of workers are age 26 or younger) are more likely to be covered by their own firm than workers in firms with many younger workers (35% or more of workers are age 26 or younger) (64% vs. 43%) (Exhibit 3.5).
Average Waiting Periods
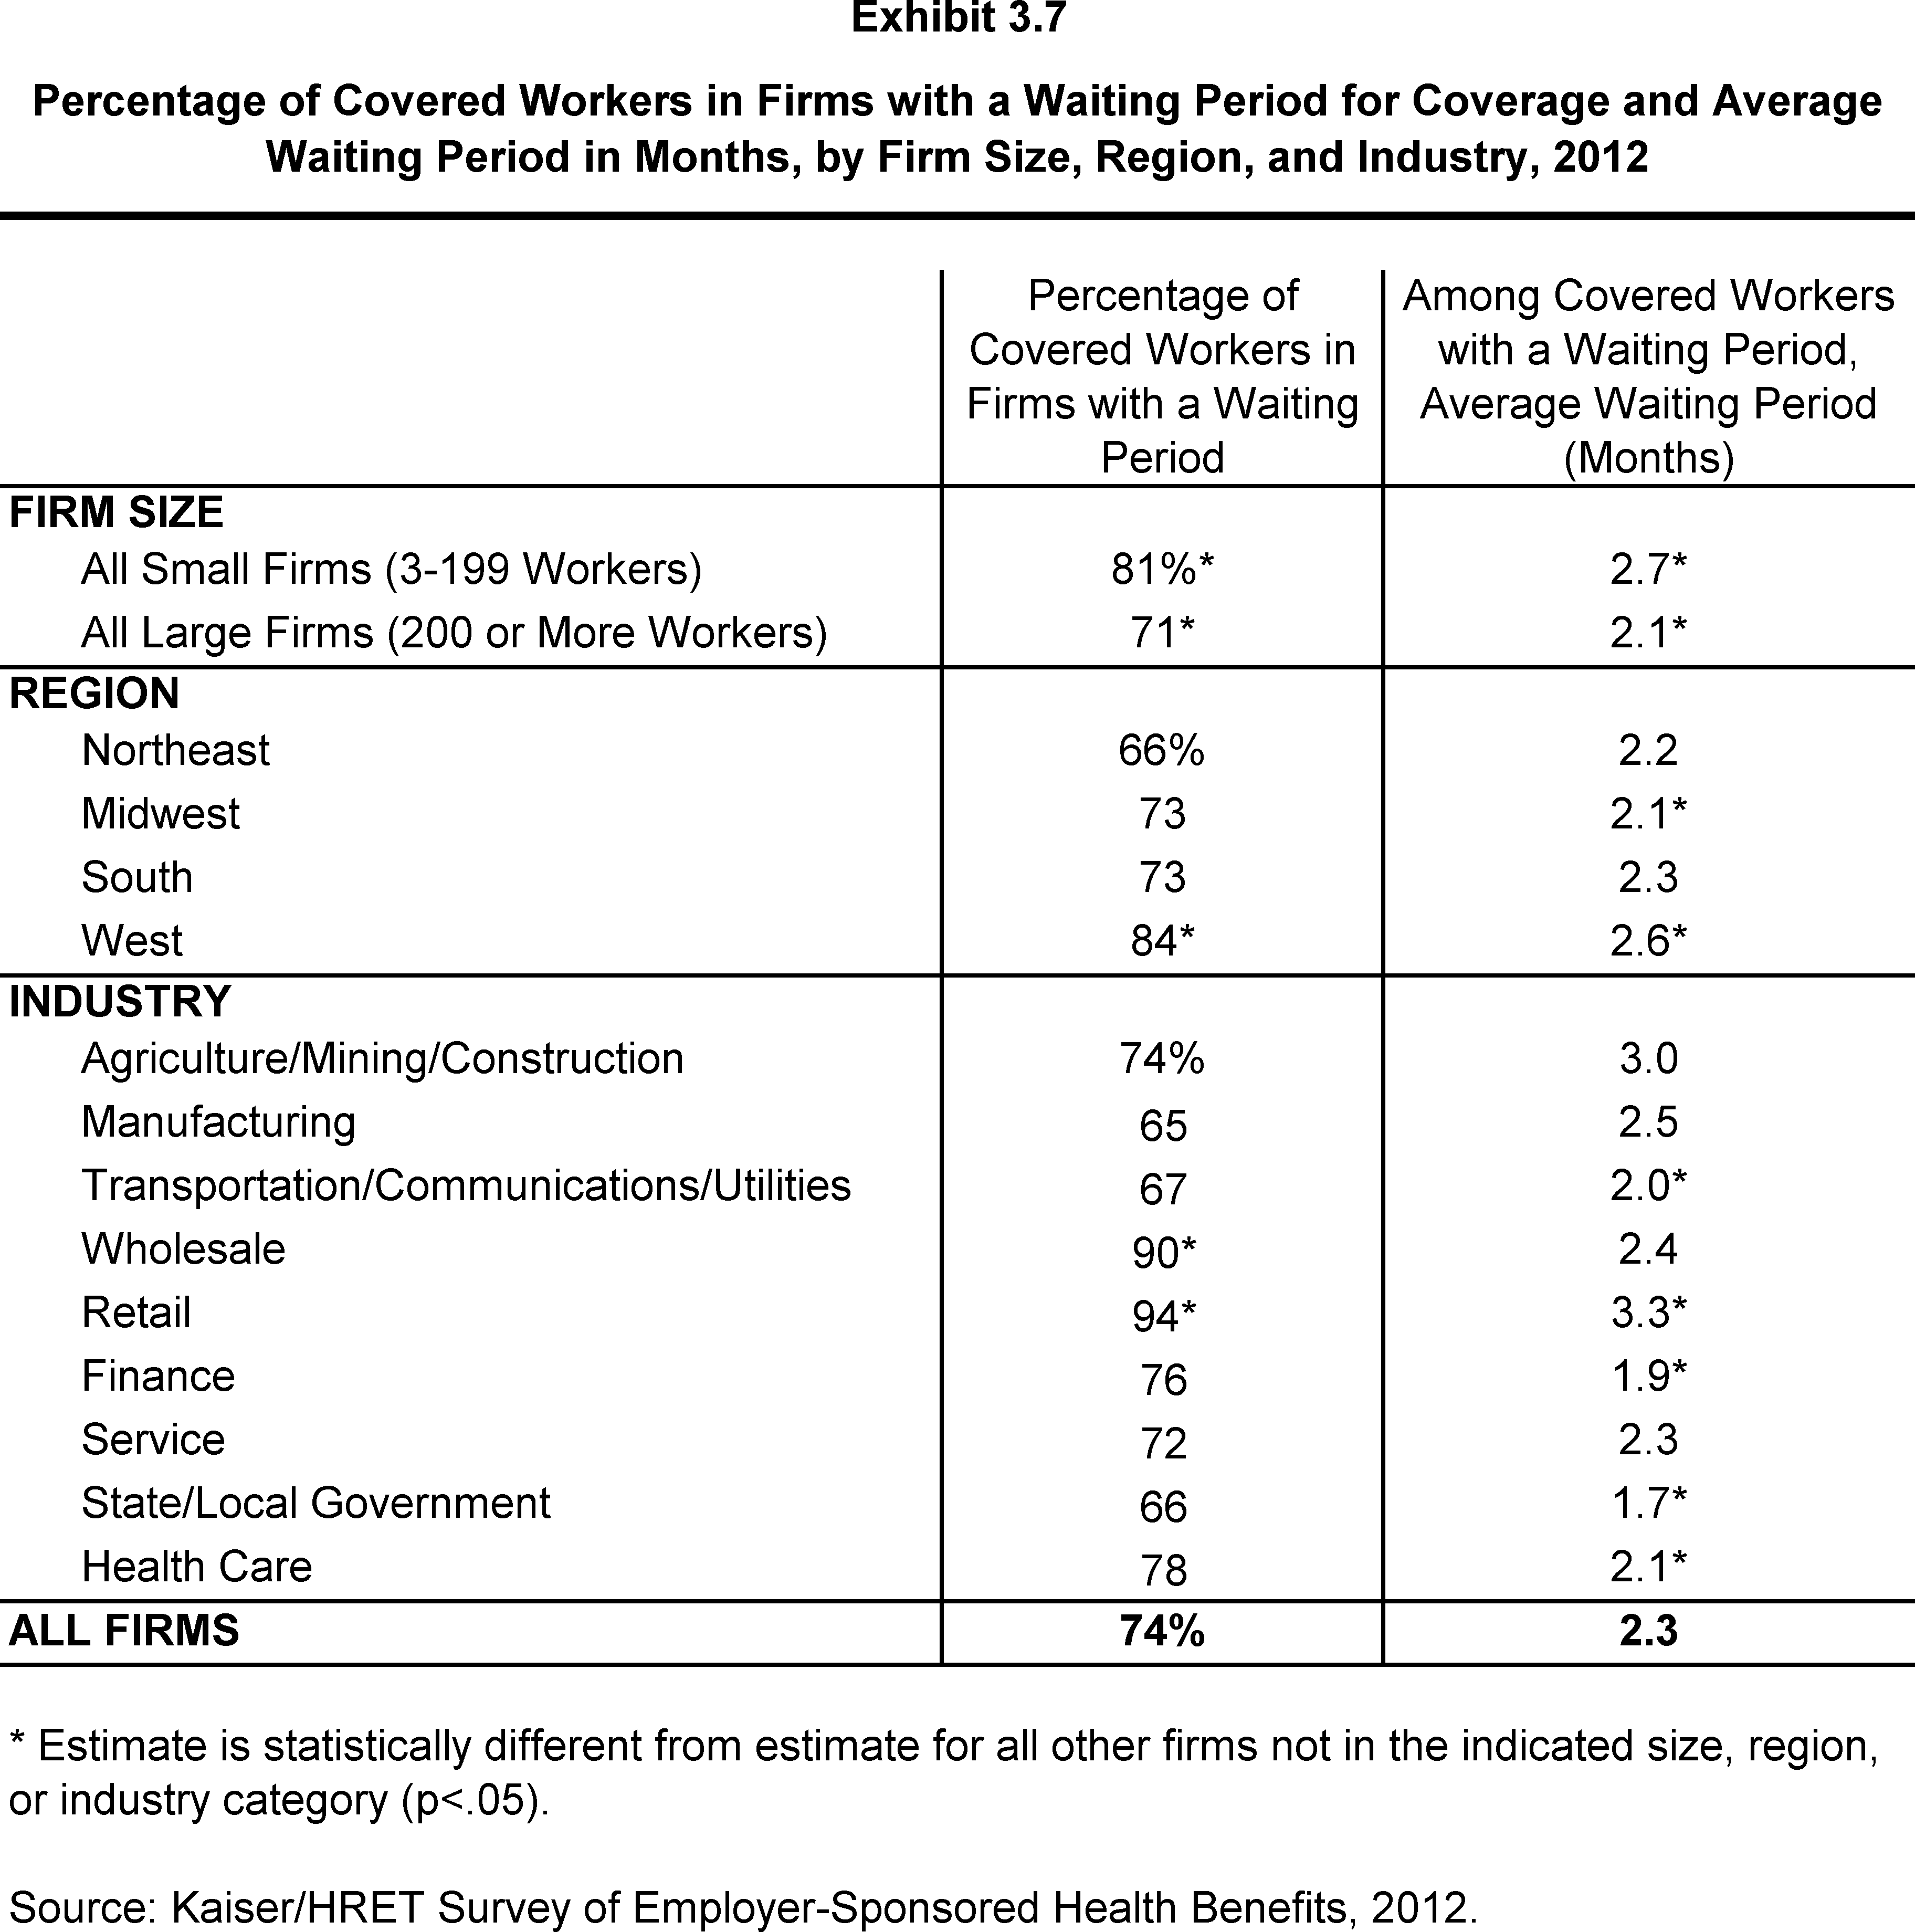
- Seventy-four percent of covered workers face a waiting period before coverage is available. Covered workers in small firms (3-199 workers) are more likely than those in large firms to have a waiting period, at 81% versus 71% (Exhibit 3.7). Workers in the West also are more likely to face a wait for coverage (84%).
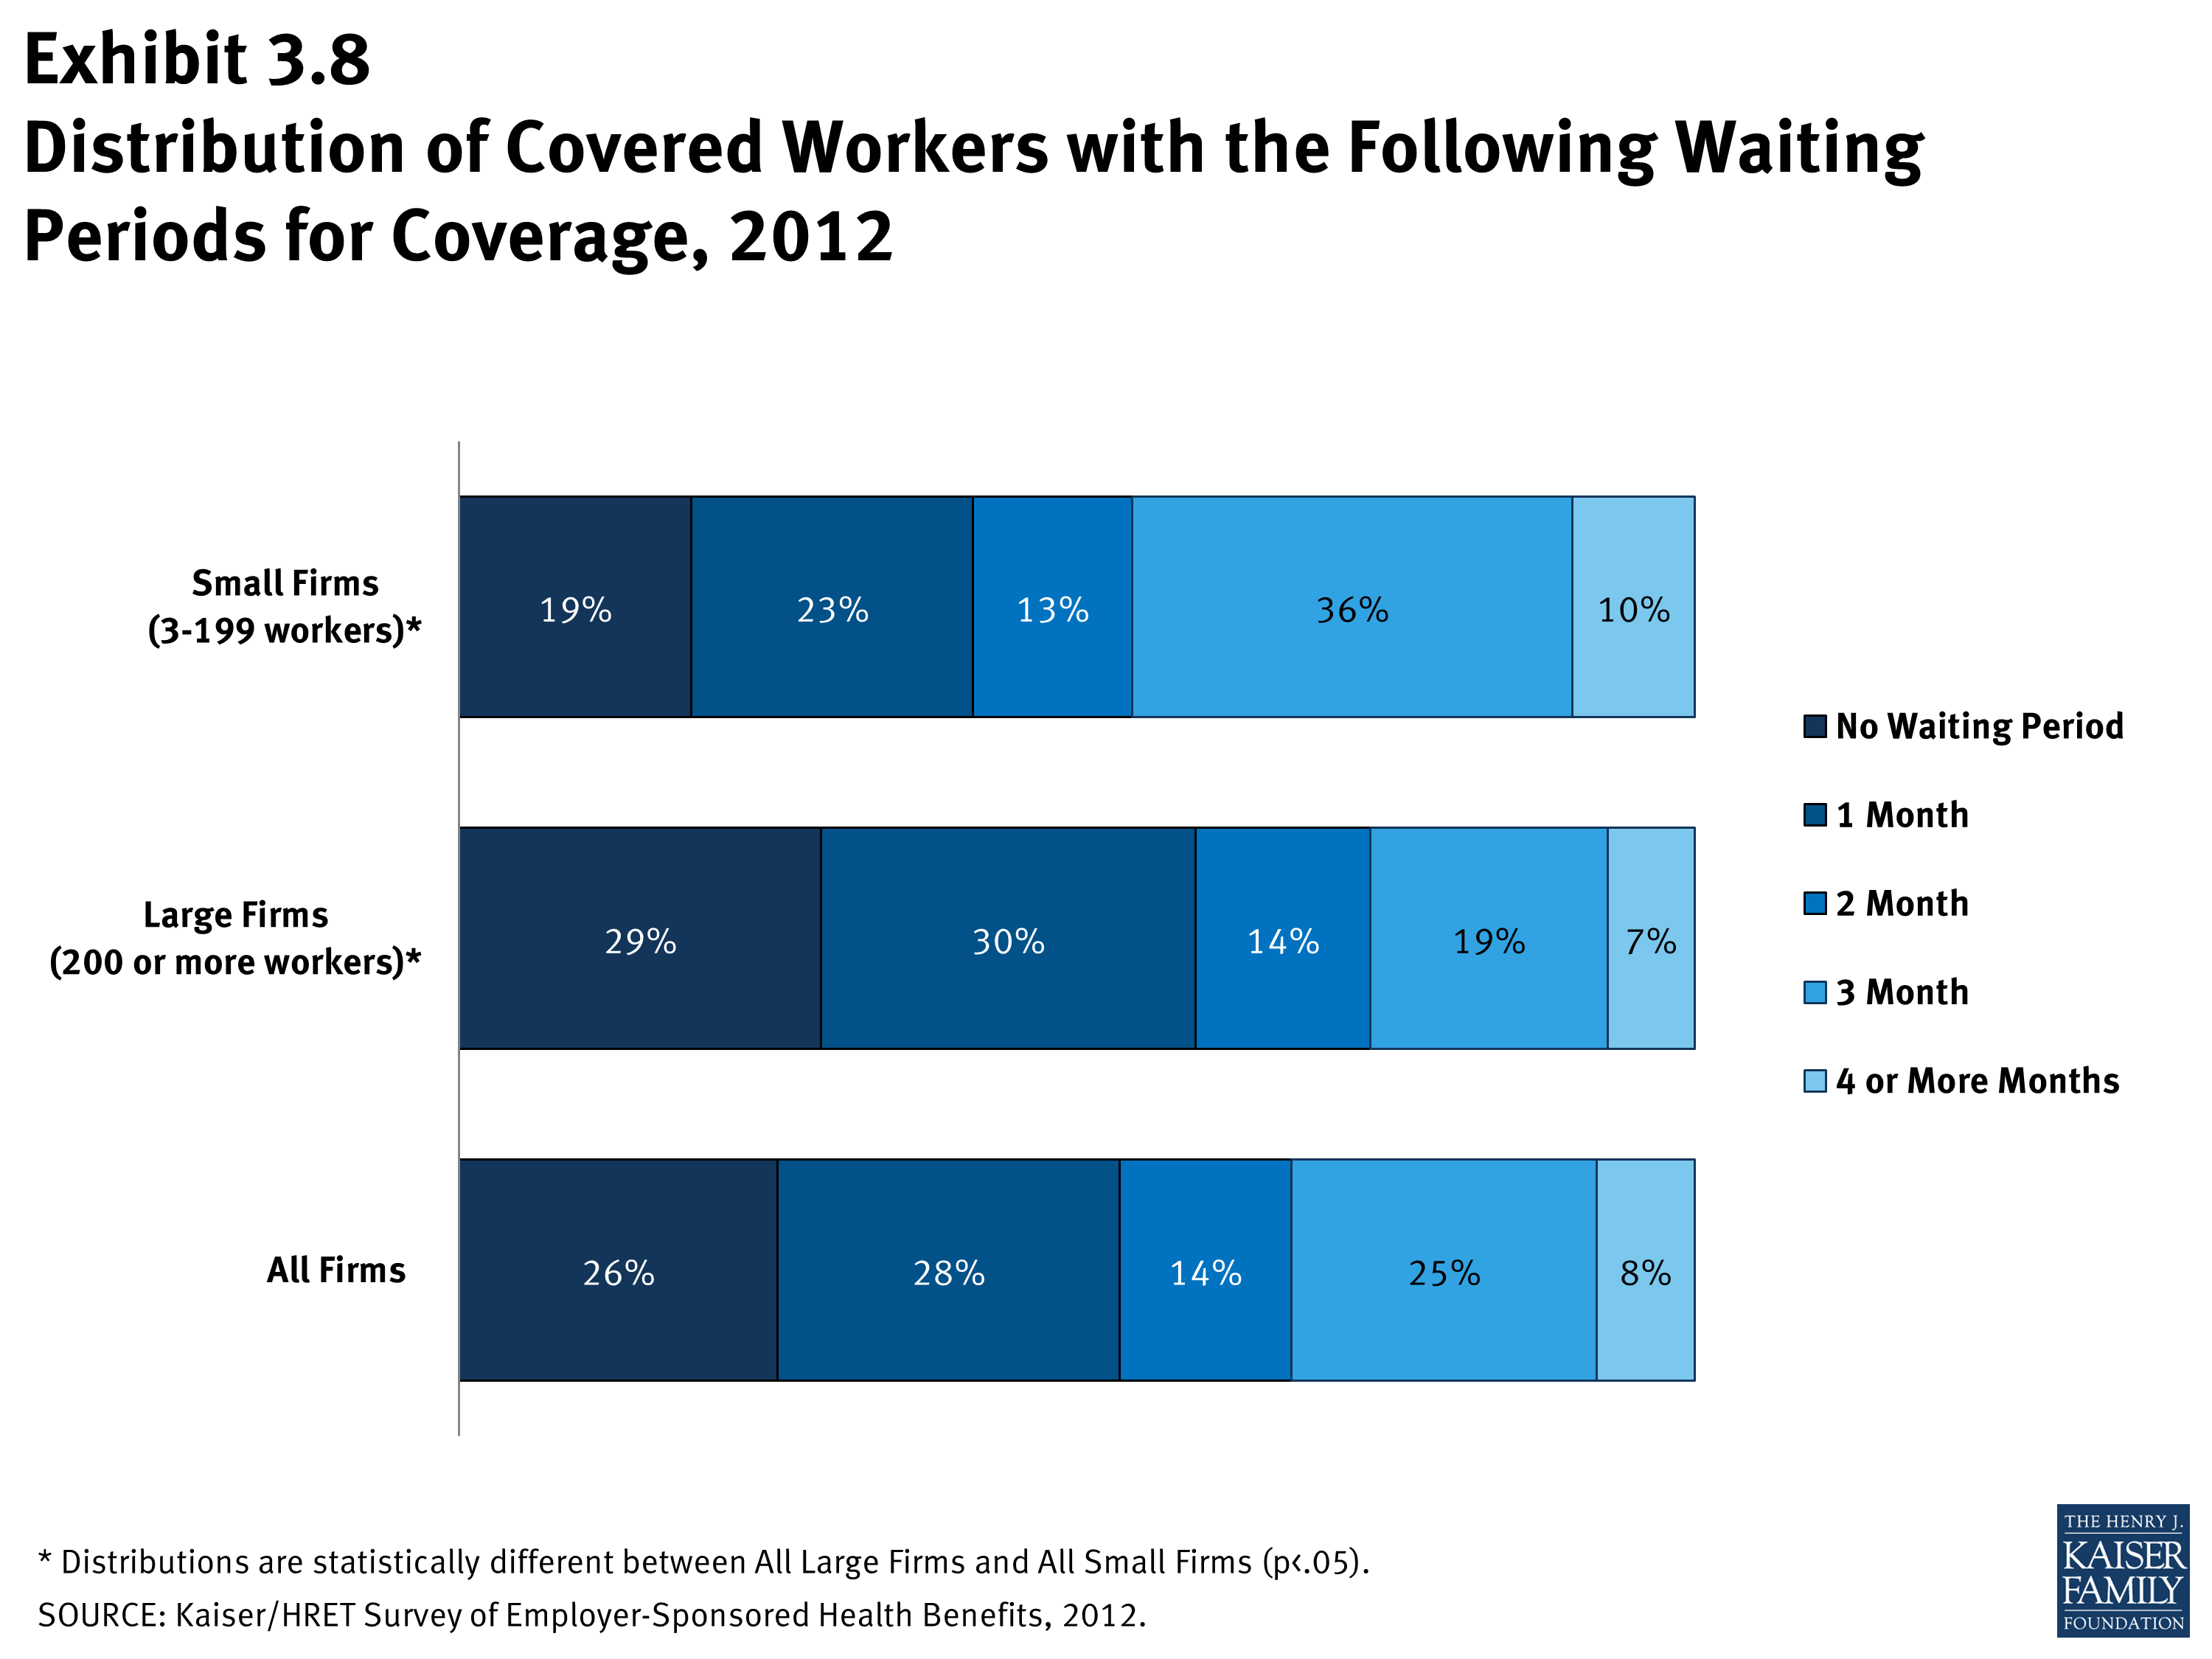
- The average waiting period among covered workers who face a waiting period is 2.3 months (Exhibit 3.7). While 33% of covered workers face a waiting period of 3 months or more, only 8% face a waiting period of 4 months or more. Workers in small firms (3-199 workers) are more likely to have longer waiting periods than workers in larger firms (Exhibit 3.8).
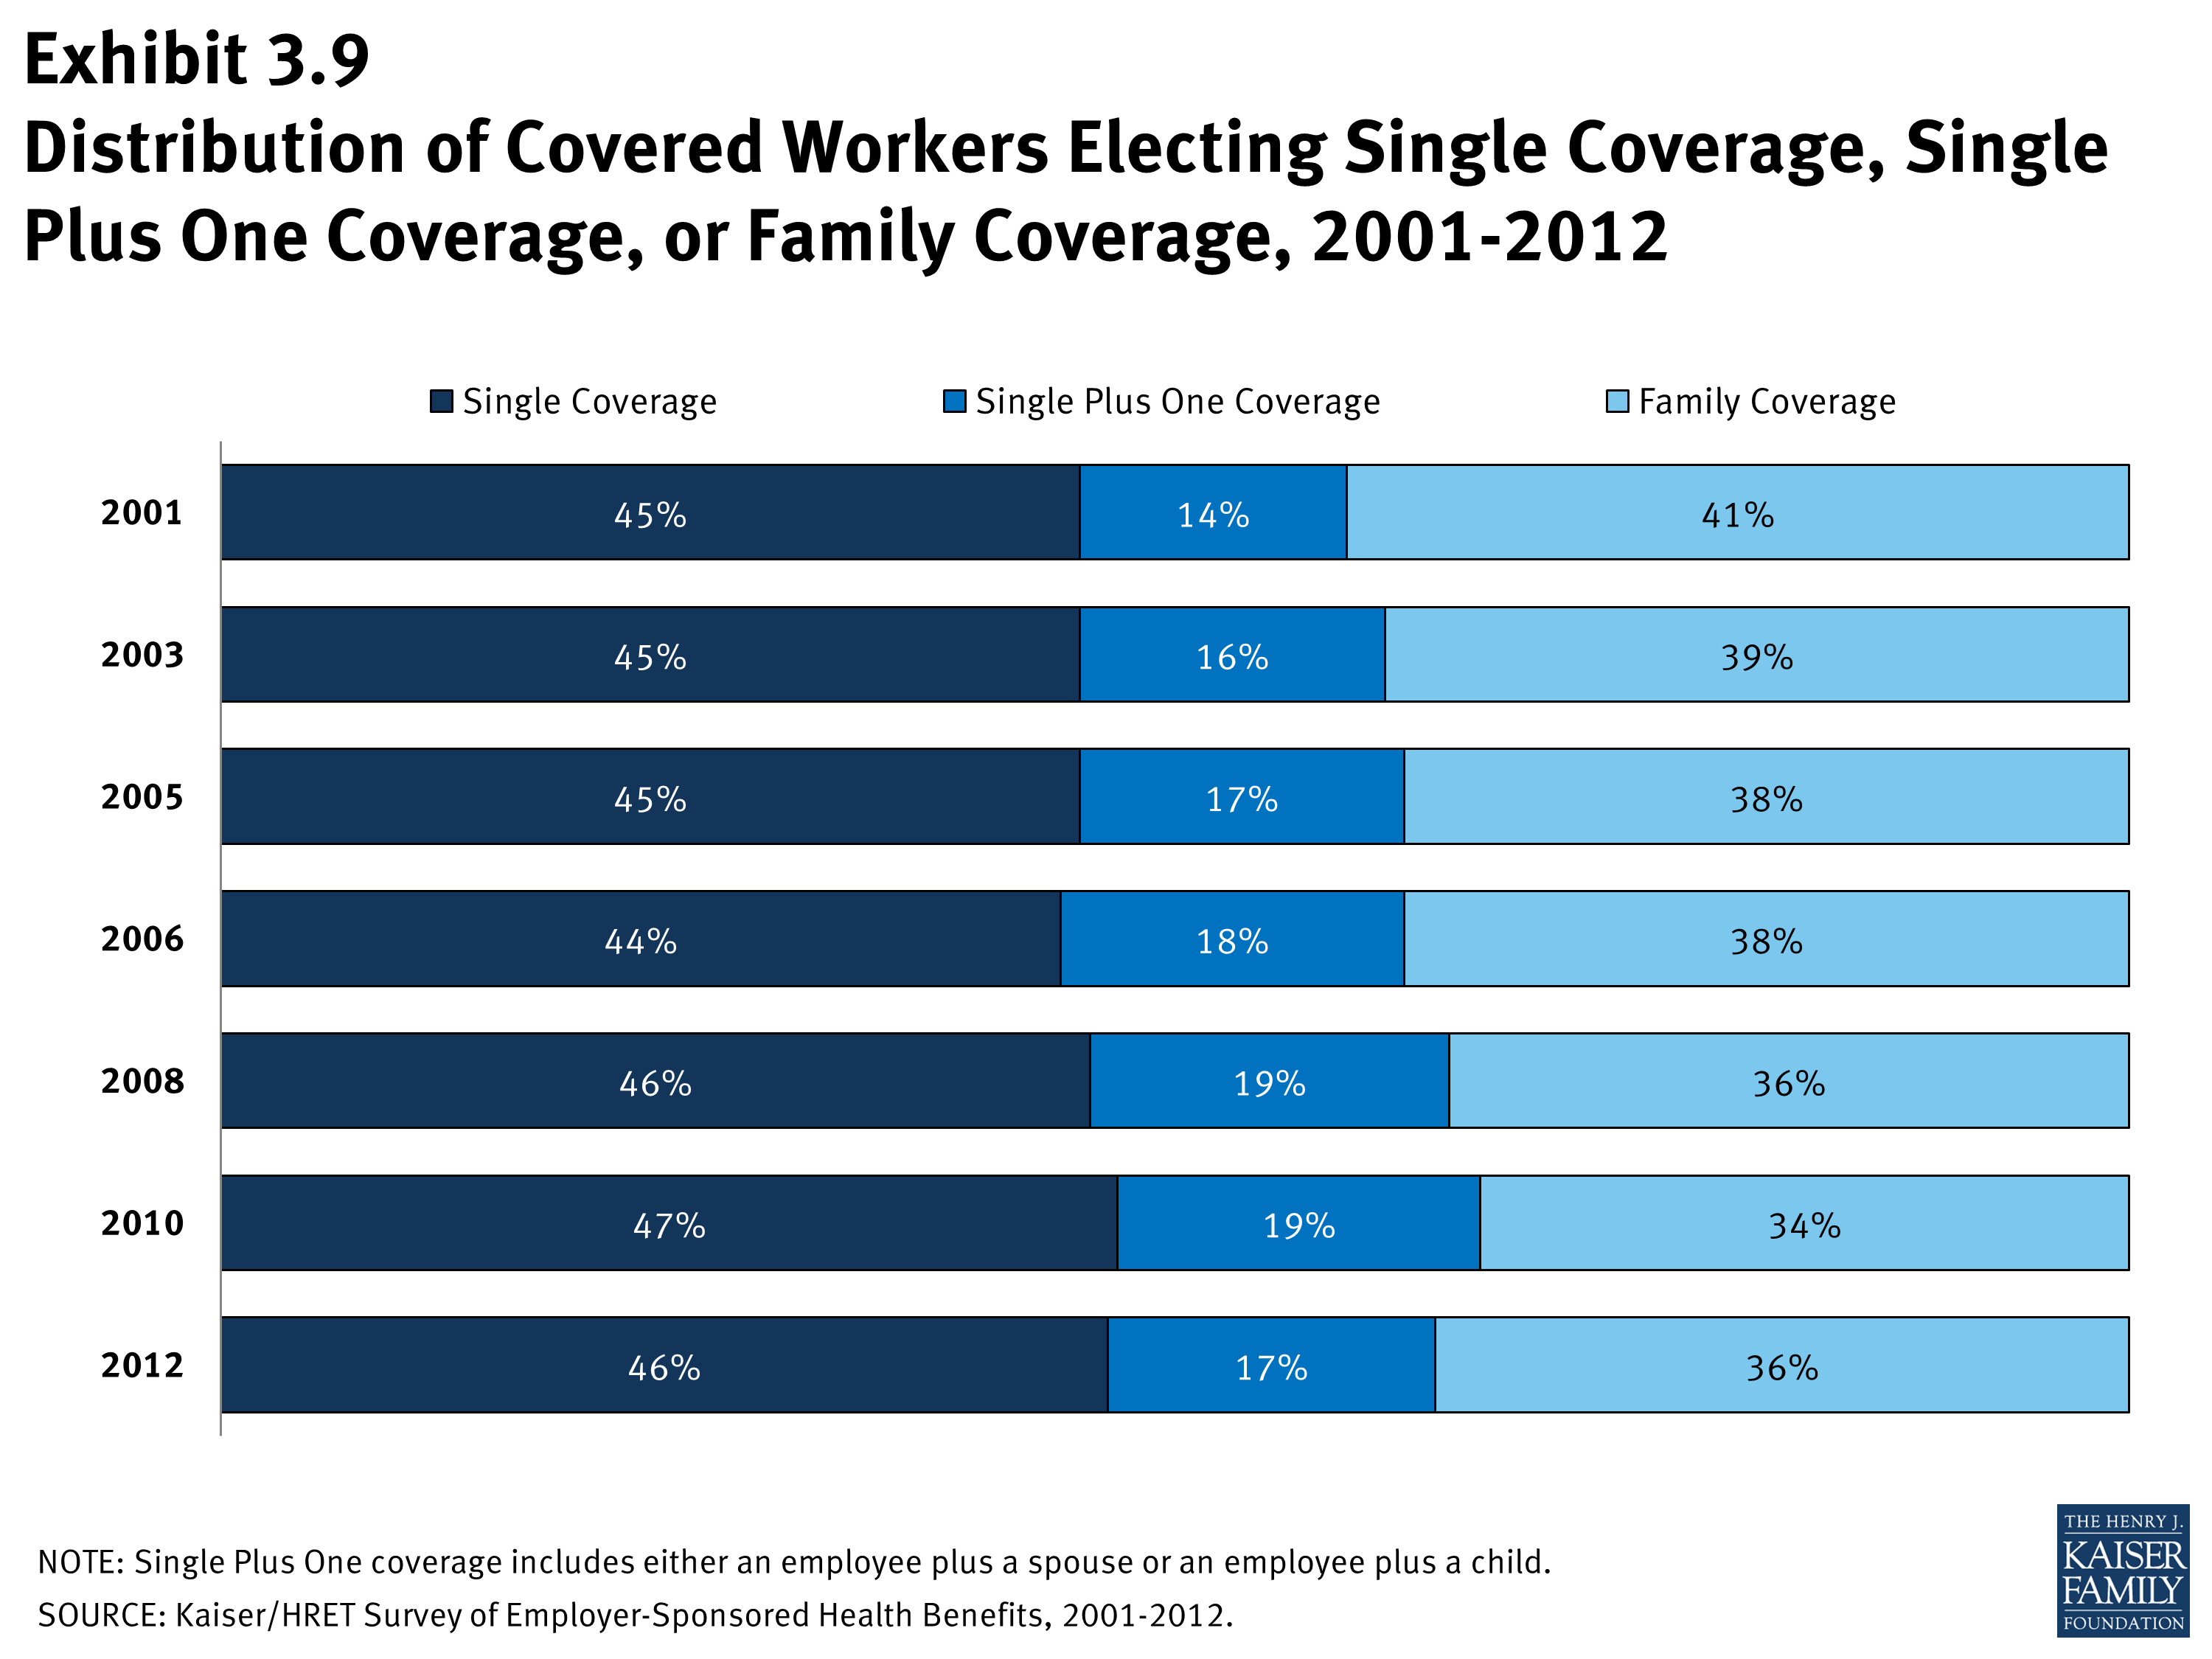
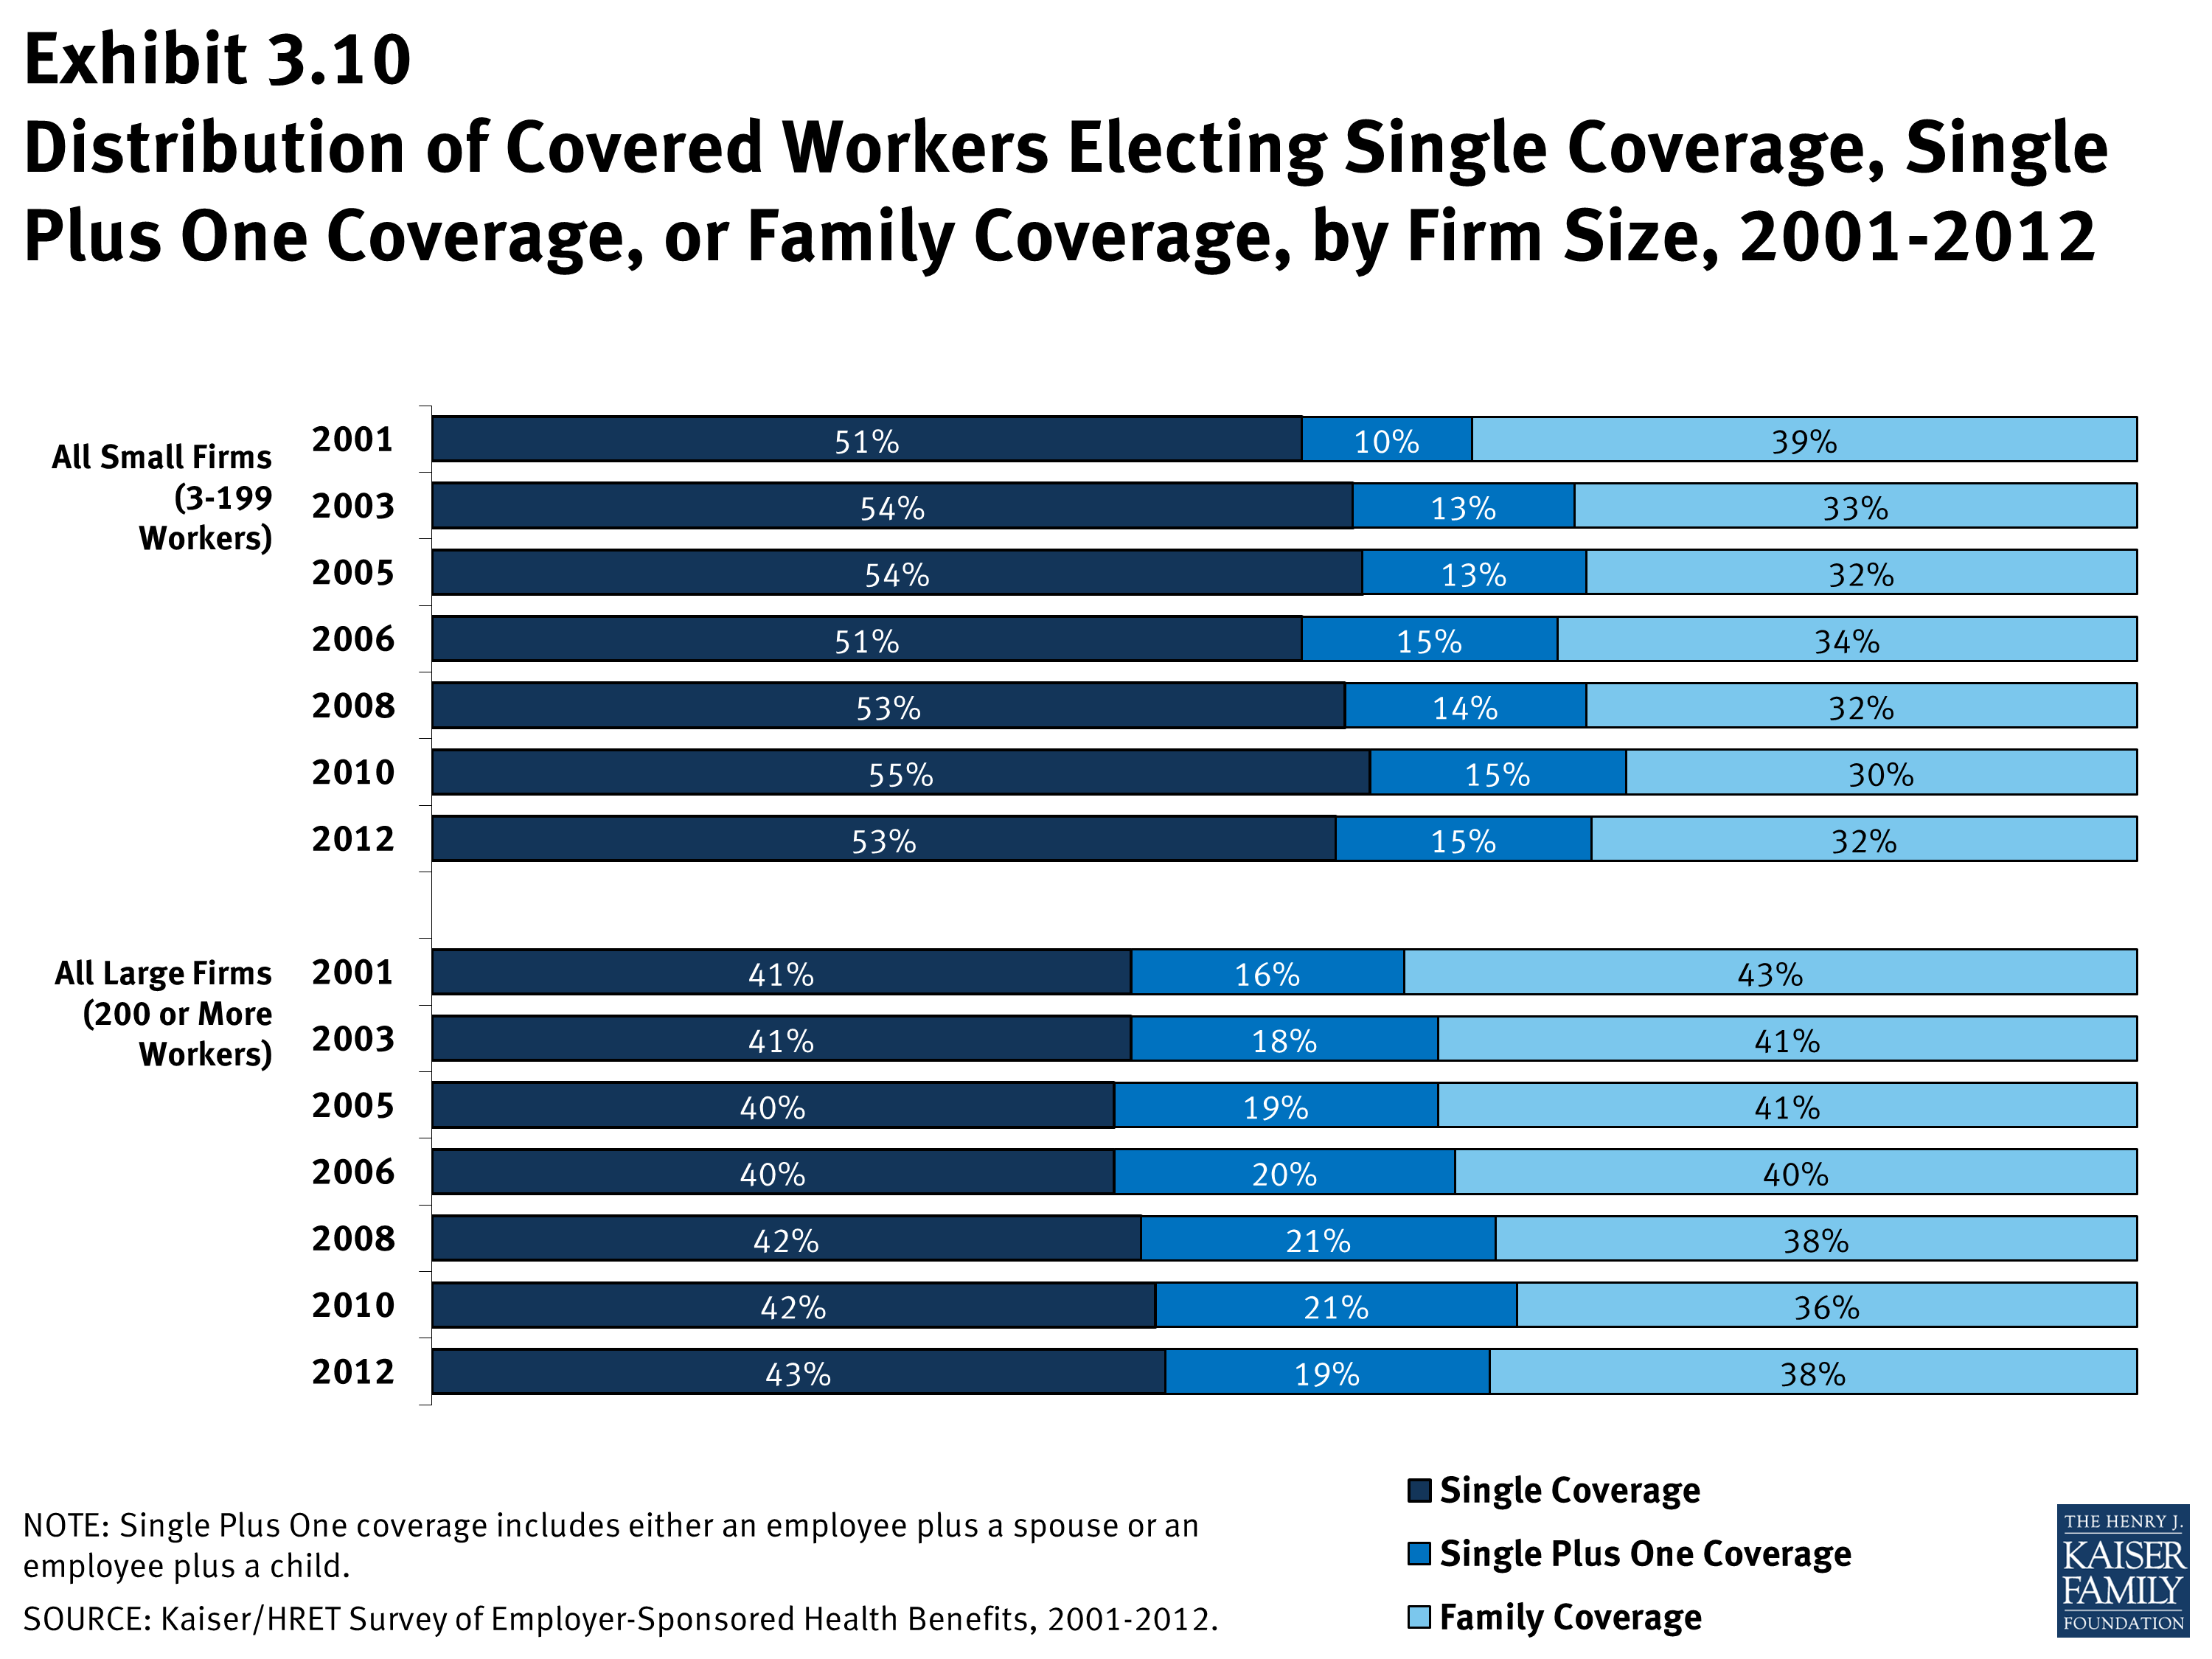
- The distribution of covered workers electing single coverage, single plus one coverage, or family coverage is 46%, 17%, and 36% respectively in 2012 (Exhibit 3.9). The distribution of enrollment in single coverage, single plus one and family coverage has remained stable over time.
Percentage of All Workers Covered by Their Employers’ Health Benefits, in Firms Both Offering and Not Offering Health Benefits, by Firm Size, 1999-2012
Eligibility, Take-Up Rate, and Coverage in Firms Offering Health Benefits, by Firm Size, Region, and Industry, 2012
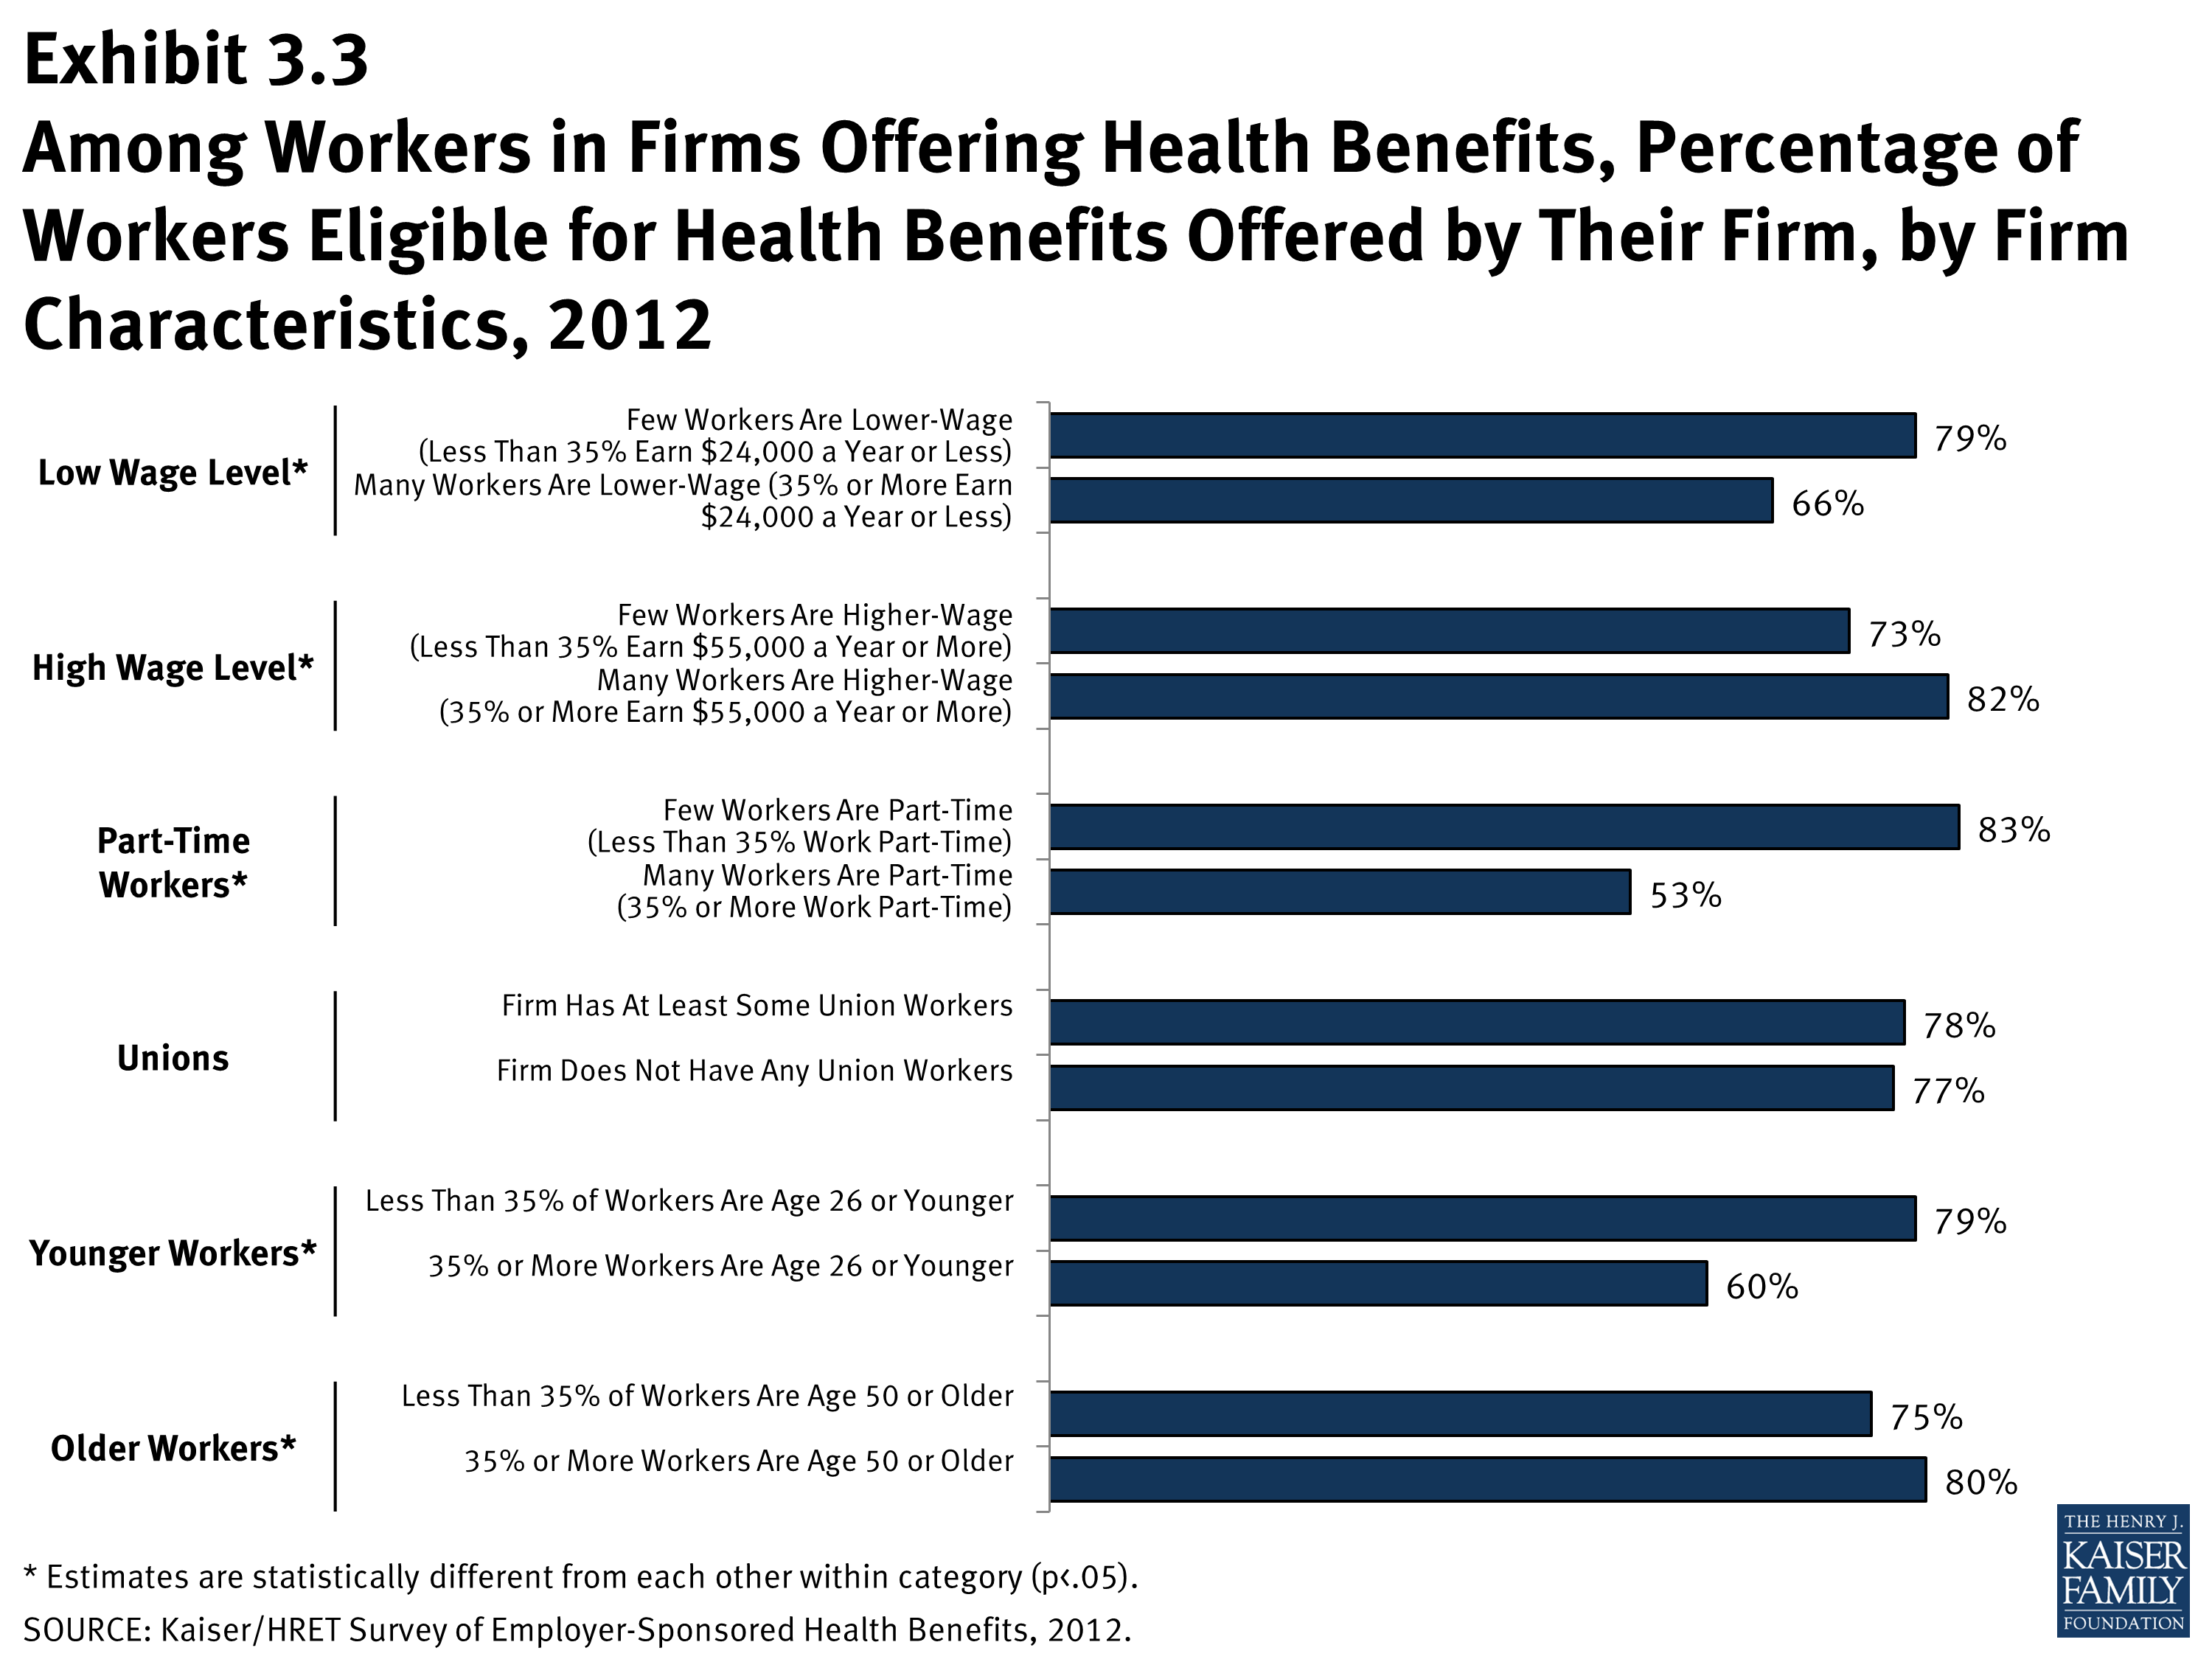
Among Workers in Firms Offering Health Benefits, Percentage of Workers Eligible for Health Benefits Offered by Their Firm, by Firm Characteristics, 2012
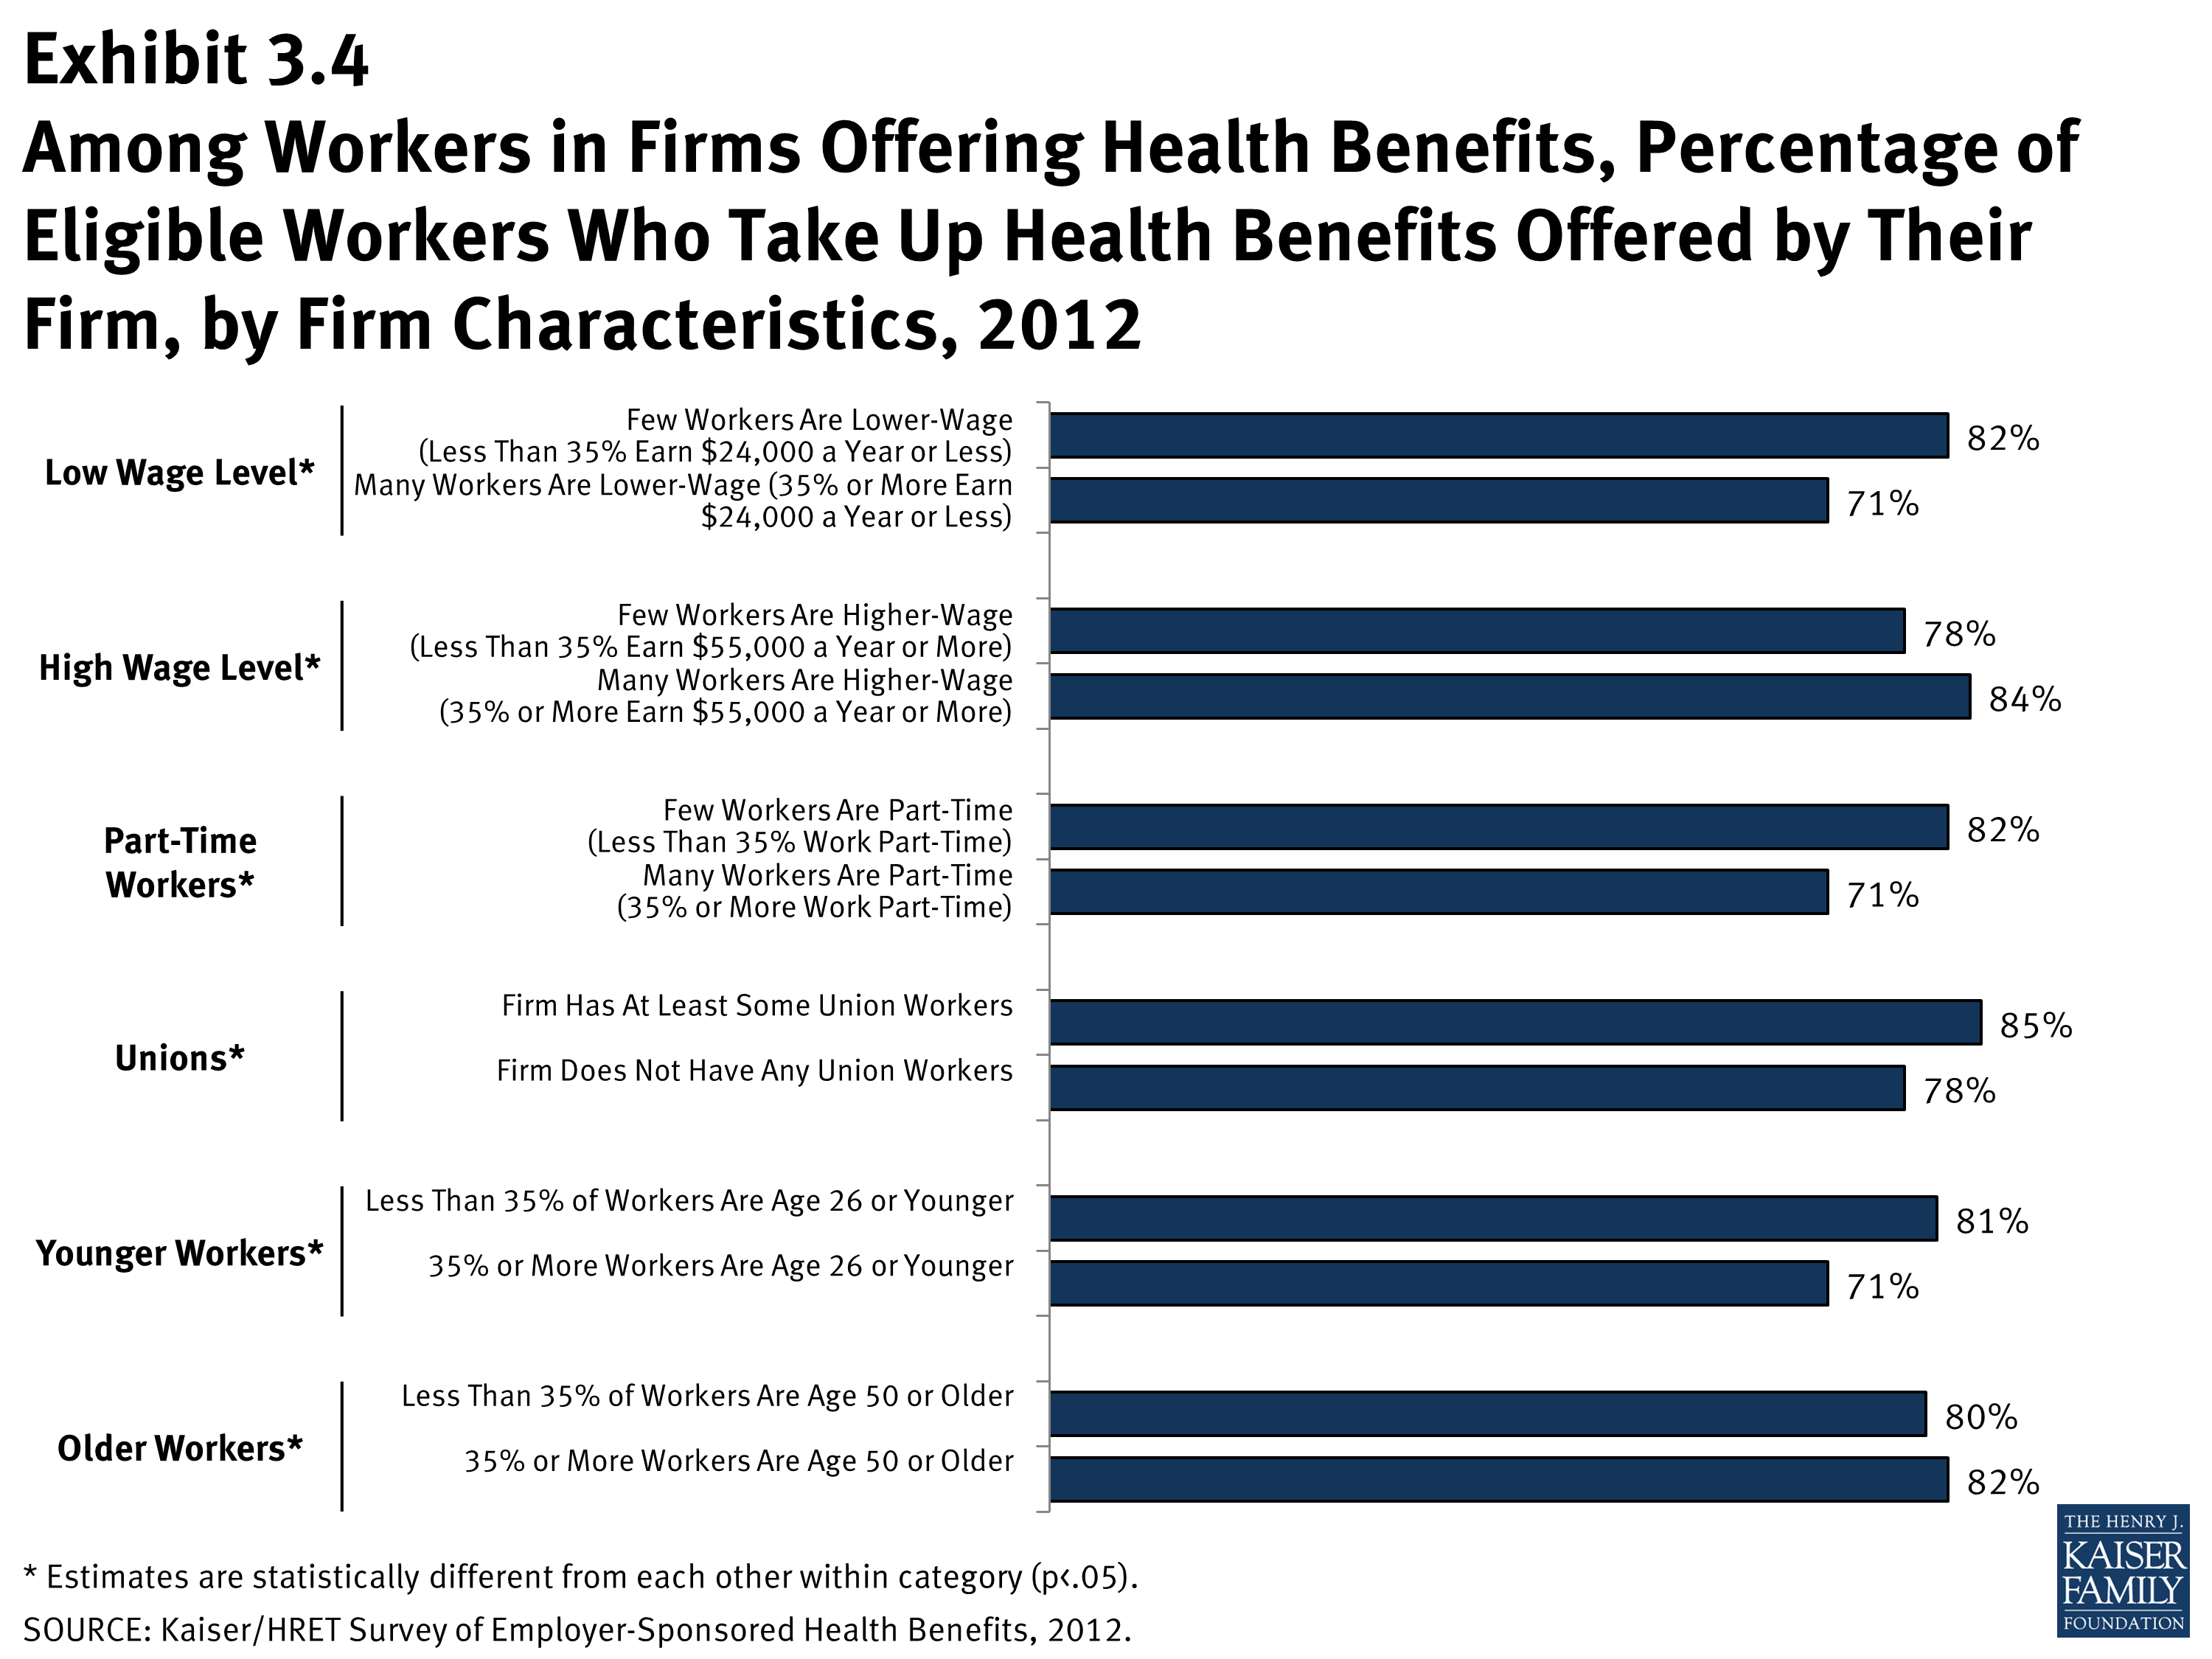
Among Workers in Firms Offering Health Benefits, Percentage of Eligible Workers Who Take Up Health Benefits Offered by Their Firm, by Firm Characteristics, 2012
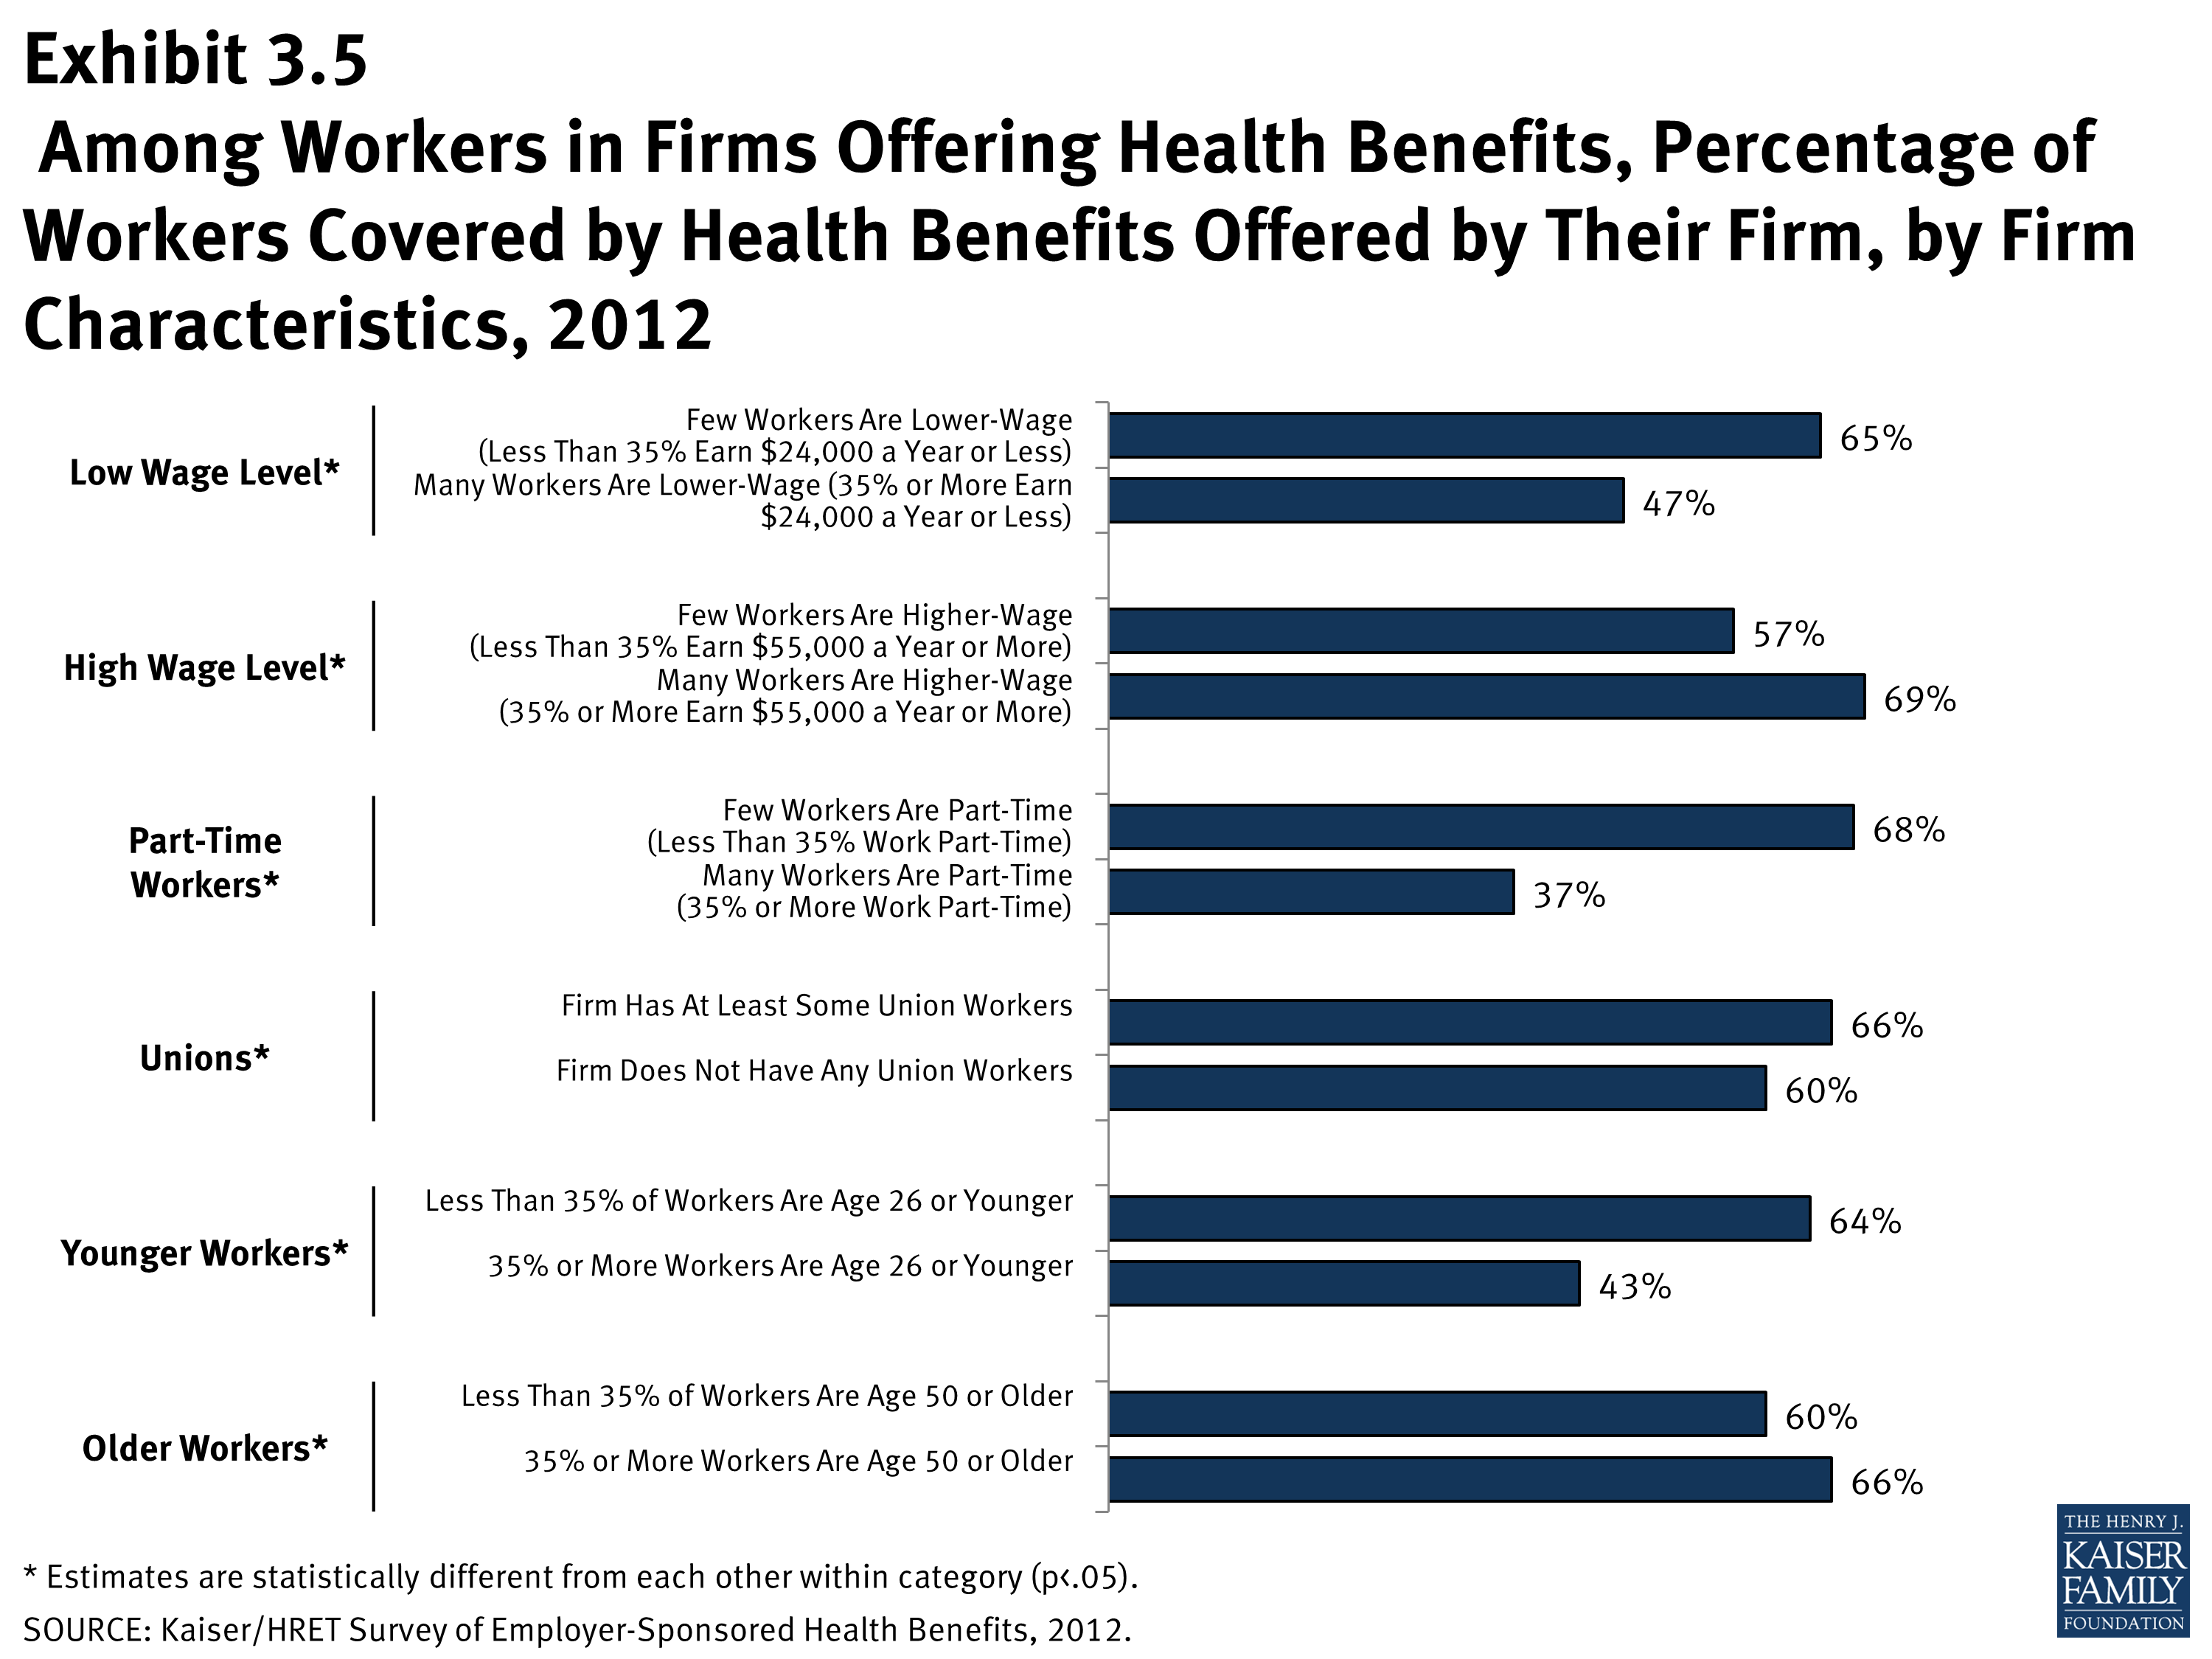
Among Workers in Firms Offering Health Benefits, Percentage of Workers Covered by Health Benefits Offered by Their Firm, by Firm Characteristics, 2012
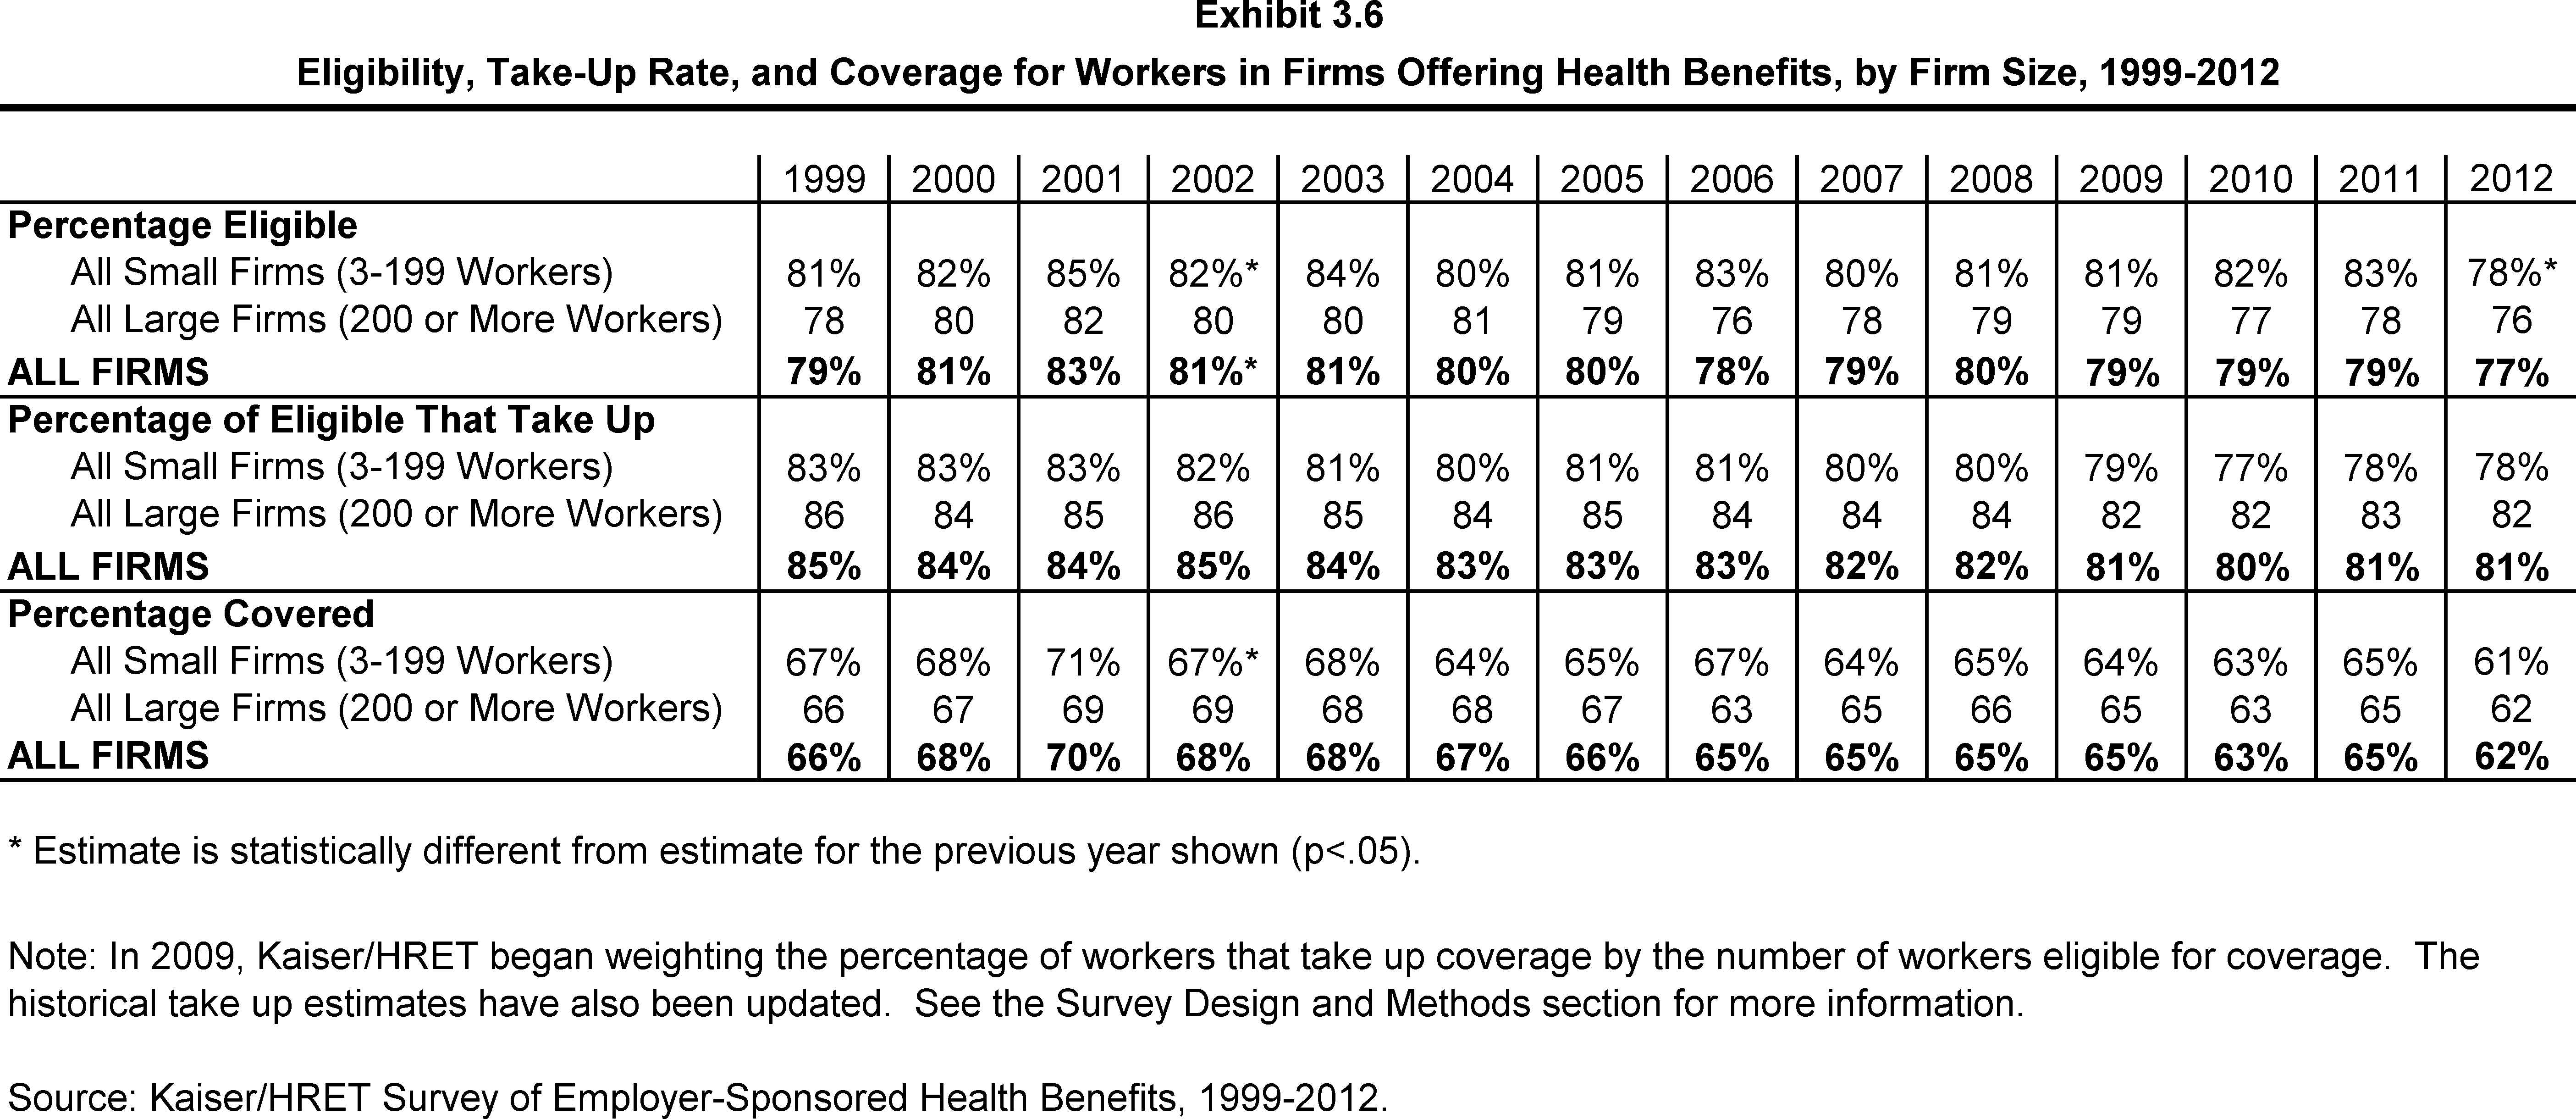
Eligibility, Take-Up Rate, and Coverage for Workers in Firms Offering Health Benefits, by Firm Size, 1999-2012
Percentage of Covered Workers in Firms with a Waiting Period for Coverage and Average Waiting Period in Months, by Firm Size, Region, and Industry, 2012
Distribution of Covered Workers with the Following Waiting Periods for Coverage, 2012
Distribution of Covered Workers Electing Single Coverage, Single Plus One Coverage, or Family Coverage, 2001-2012
Distribution of Covered Workers Electing Single Coverage, Single Plus One Coverage, or Family Coverage, by Firm Size, 2001-2012
Section 4: Types of Plans Offered
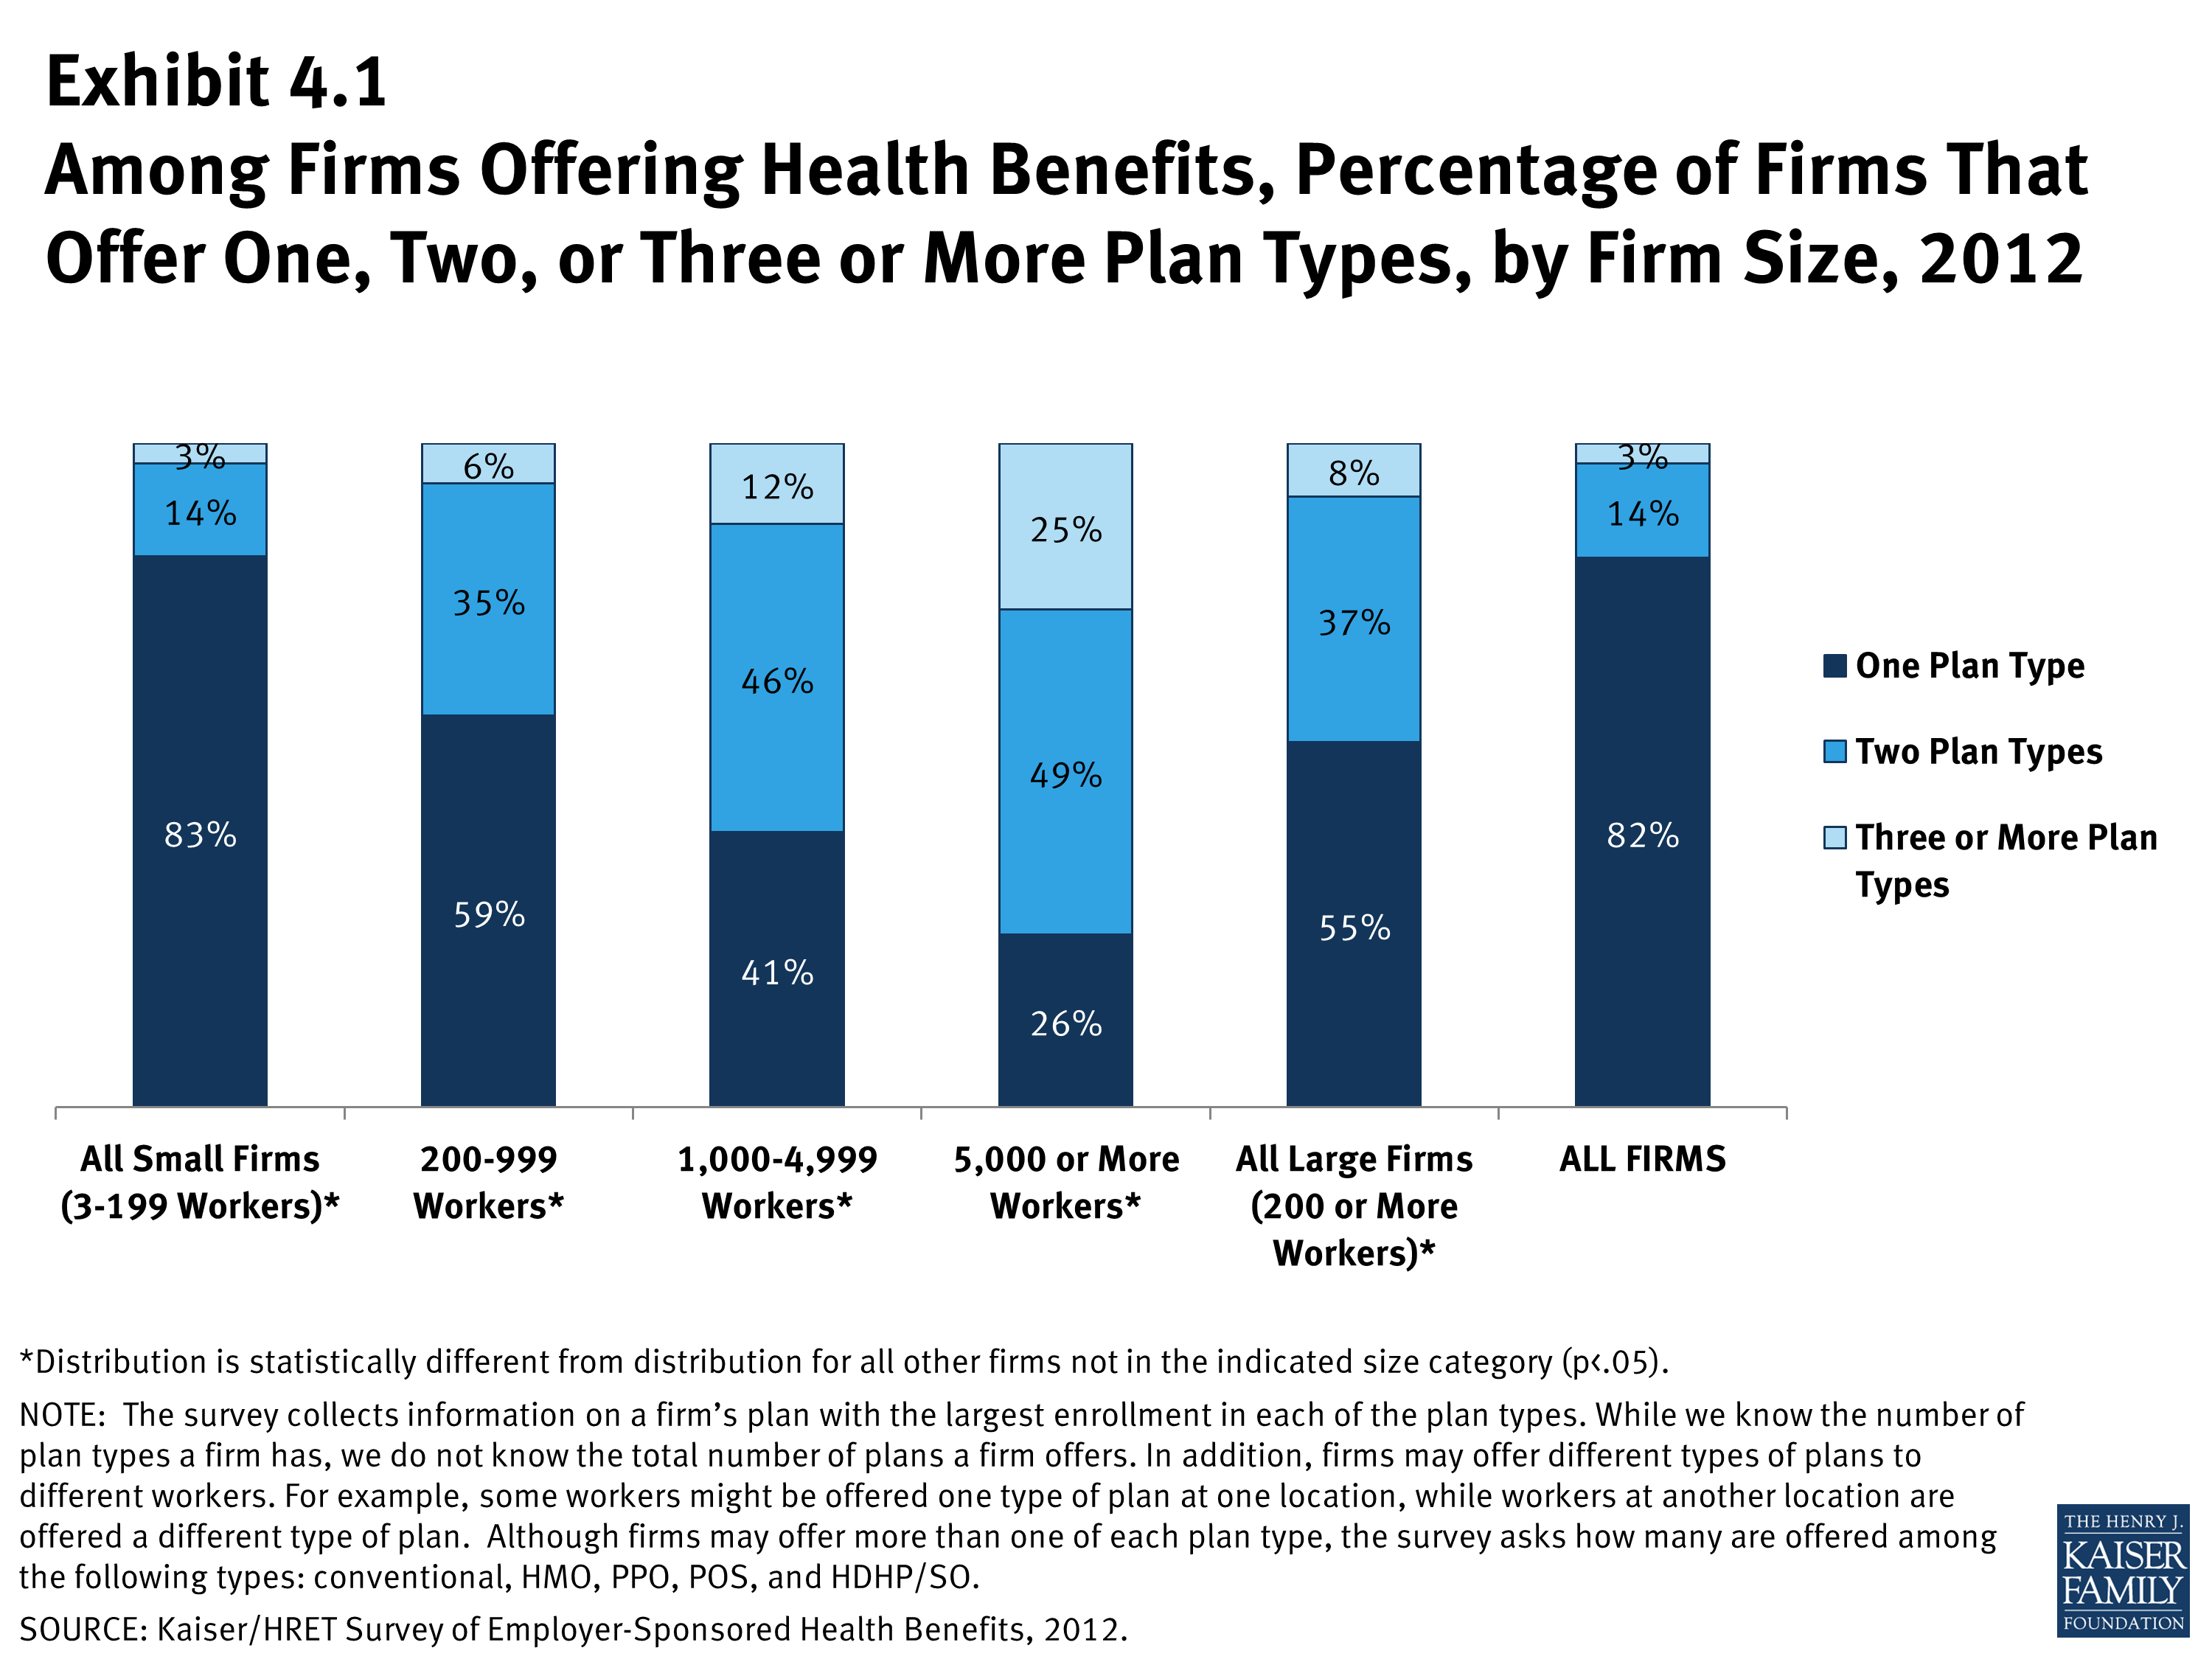
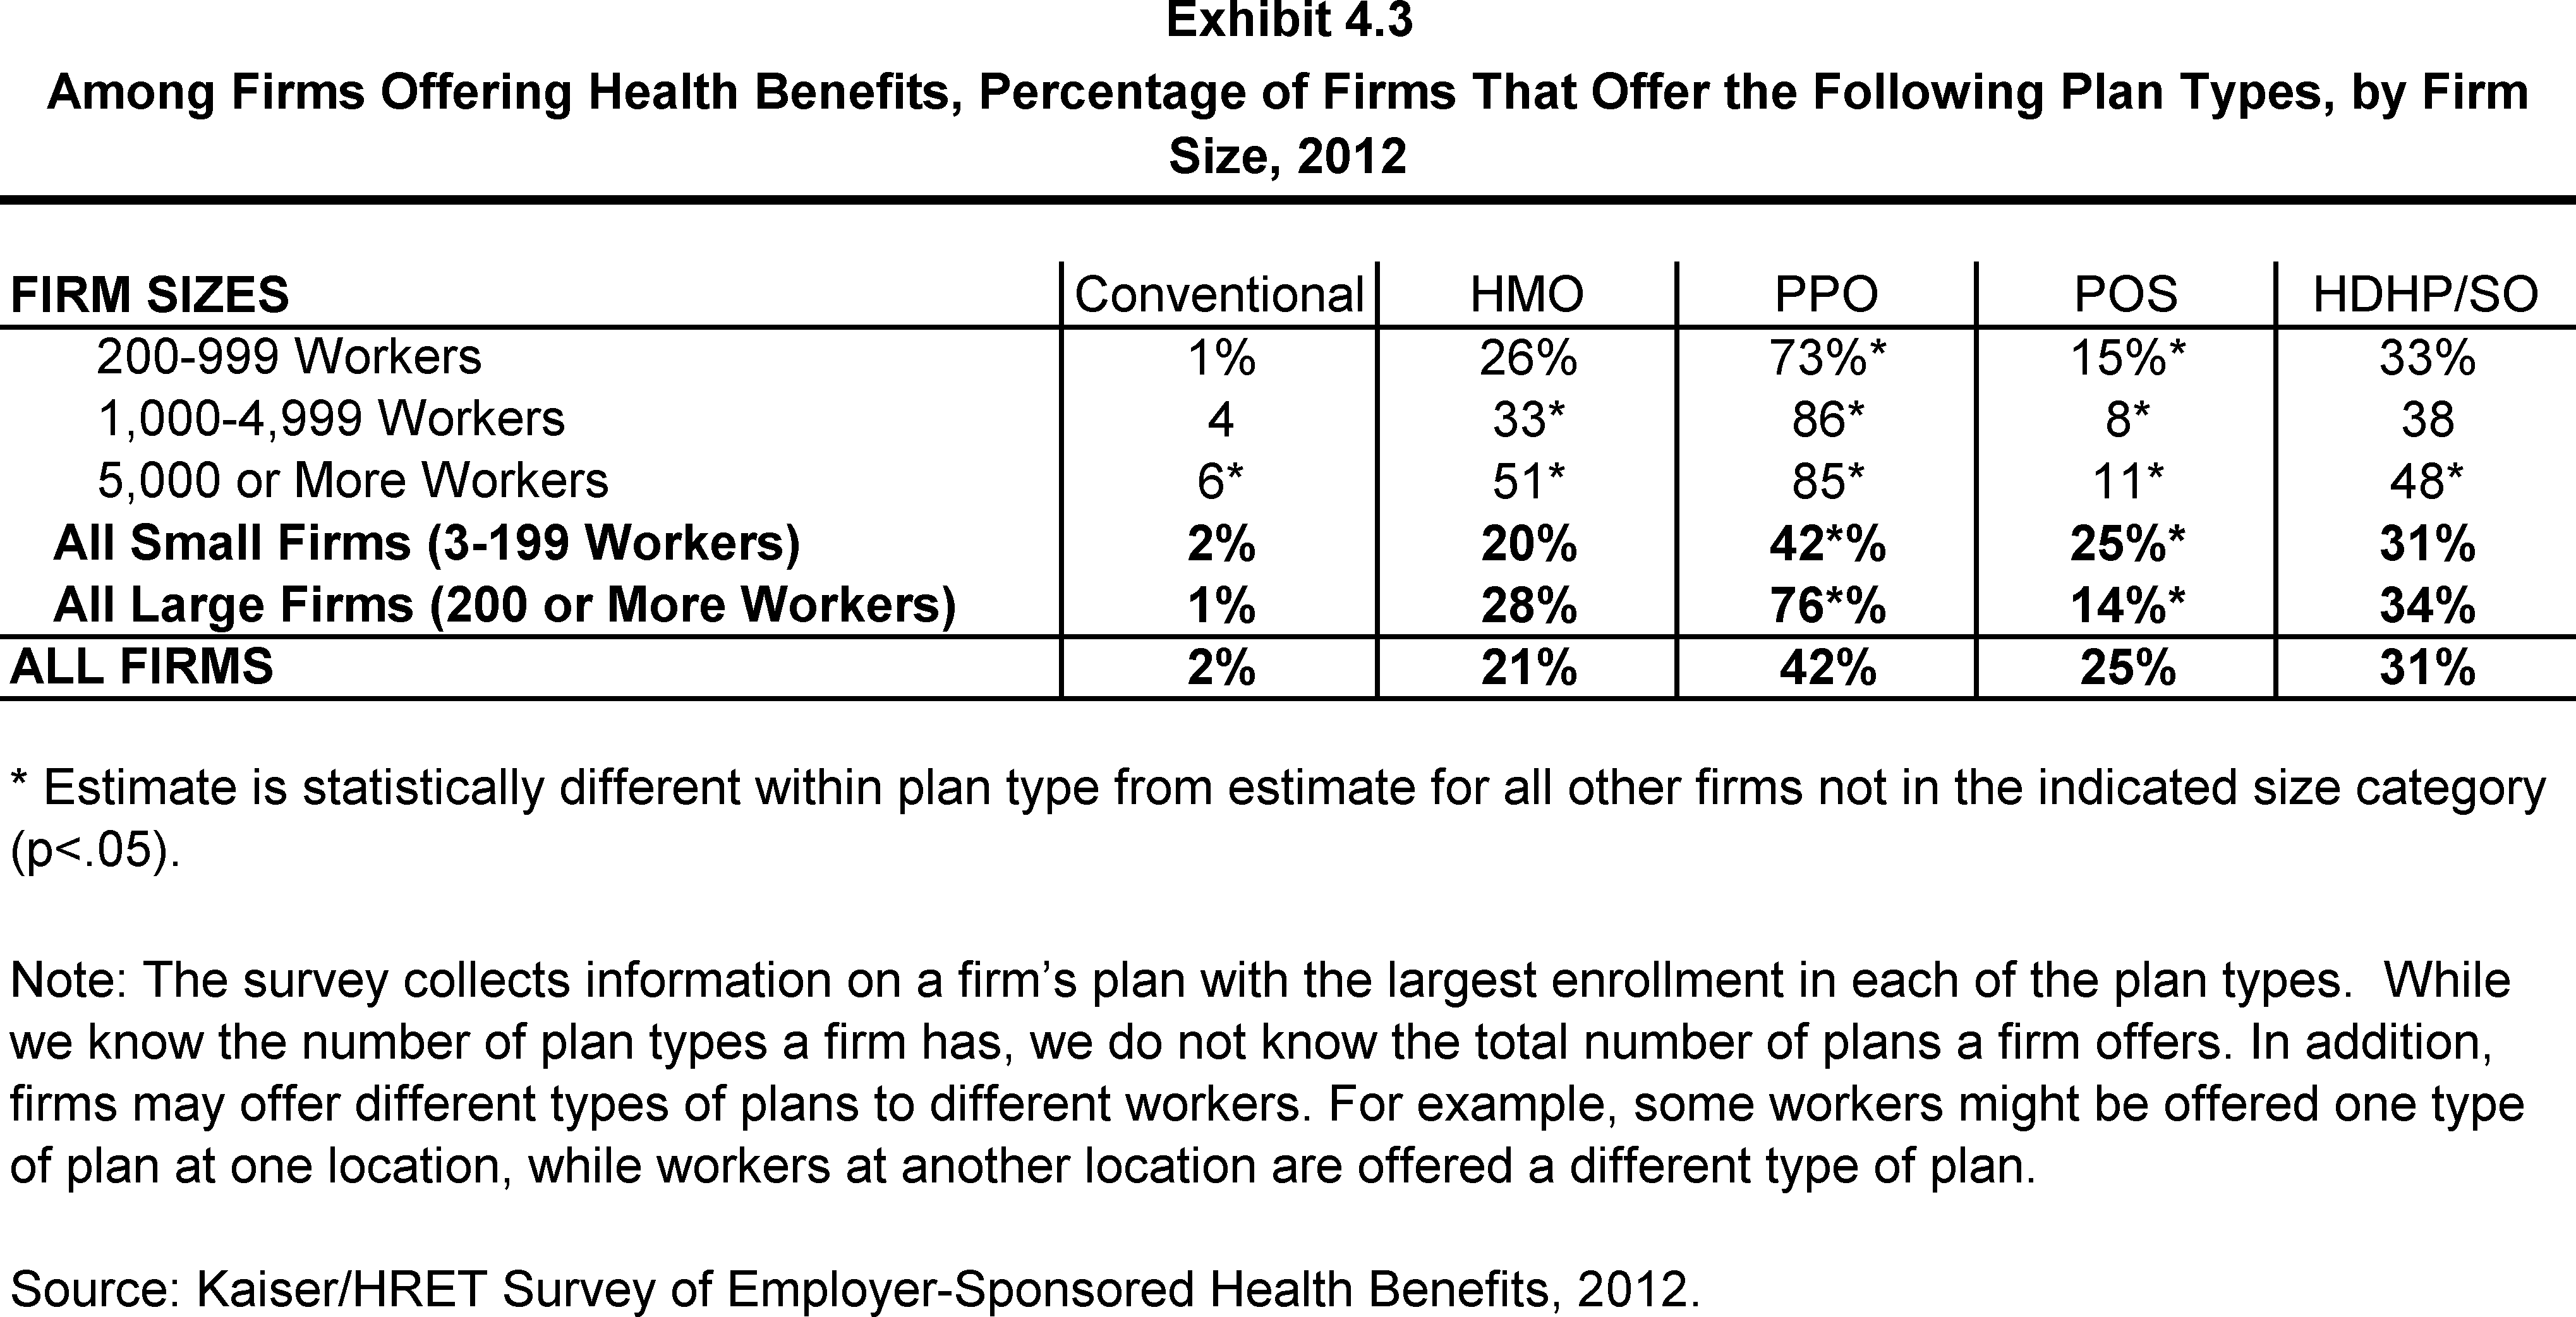
Most firms that offer health benefits offer only one type of health plan (82%) (See Text Box). Larger firms are more likely to offer more than one type of health plan. Employers are most likely to offer their workers a PPO, HMO, or HDHP/SO plan and are least likely to offer a conventional plan.
- Eighty-two percent of firms offering health benefits in 2012 offer only one type of health plan. Large firms (200 or more workers) are more likely to offer more than one plan type than small firms (3-199 workers): 45% vs. 17% (Exhibit 4.1).
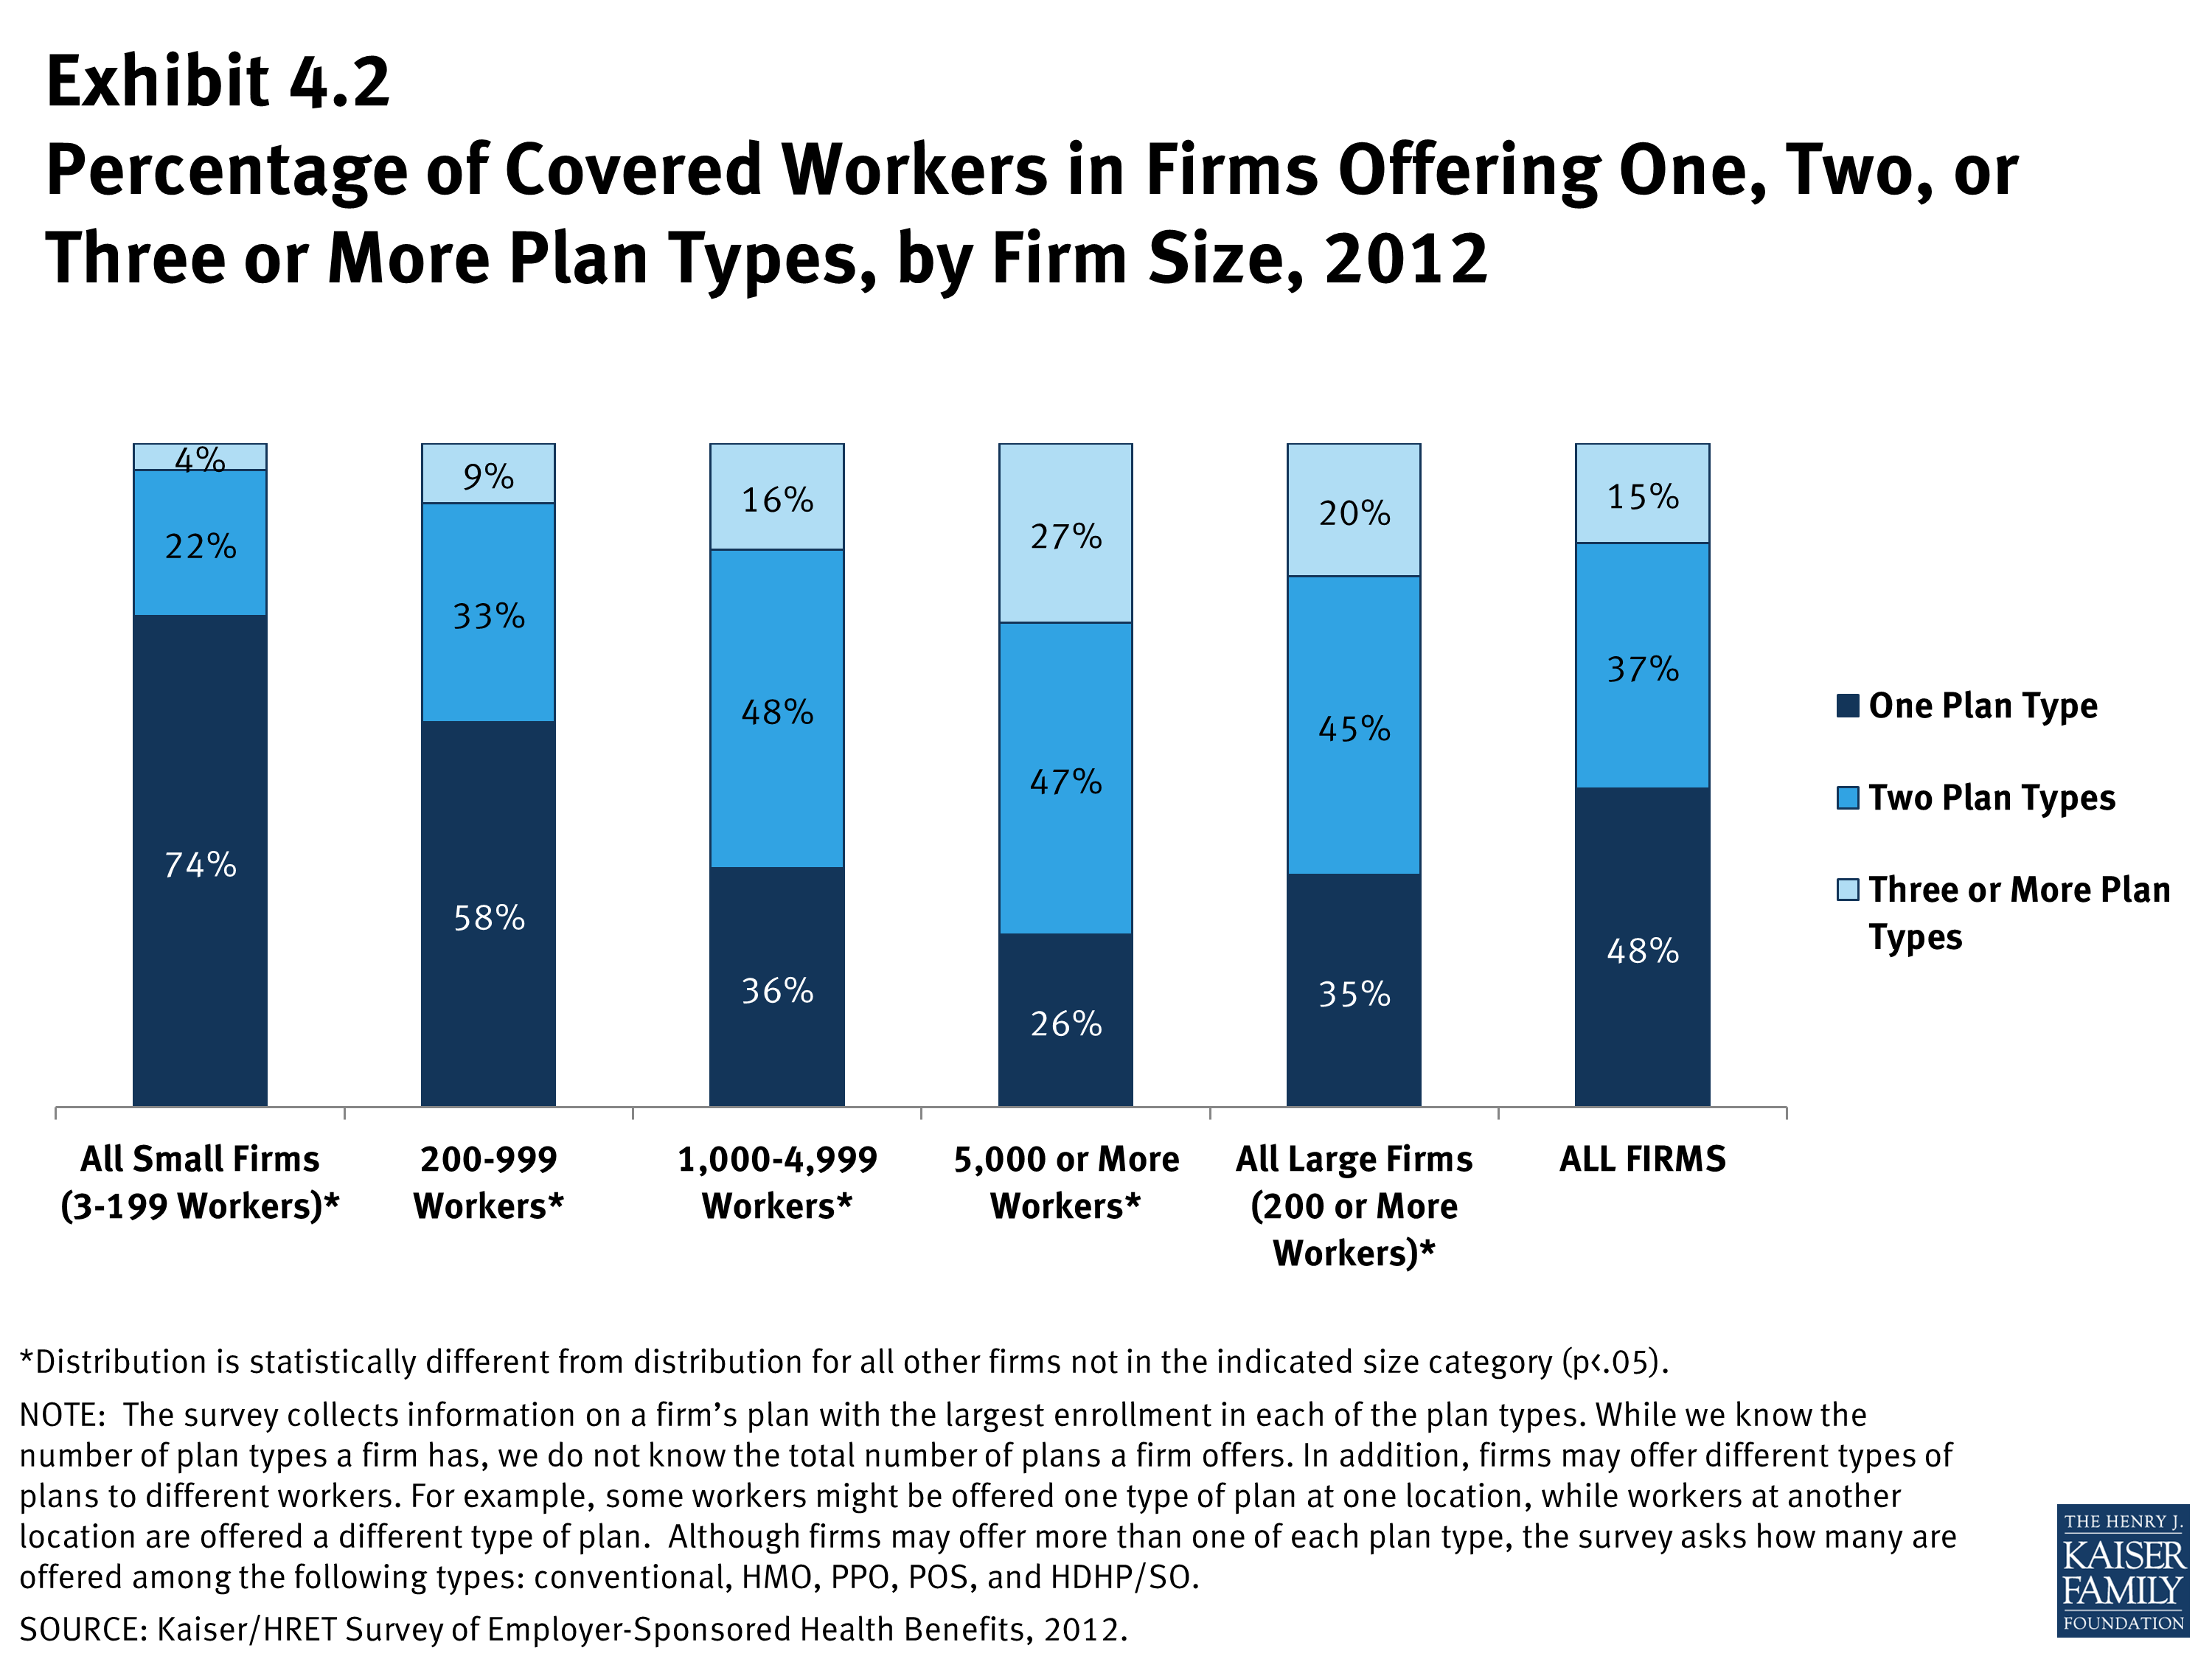
- Over half (52%) of covered workers are employed in a firm that offers more than one health plan type. Sixty-five percent of covered workers in large firms (200 or more workers) are employed by a firm that offers more than one plan type, compared to 26% in small firms (3-199 workers) (Exhibit 4.2).
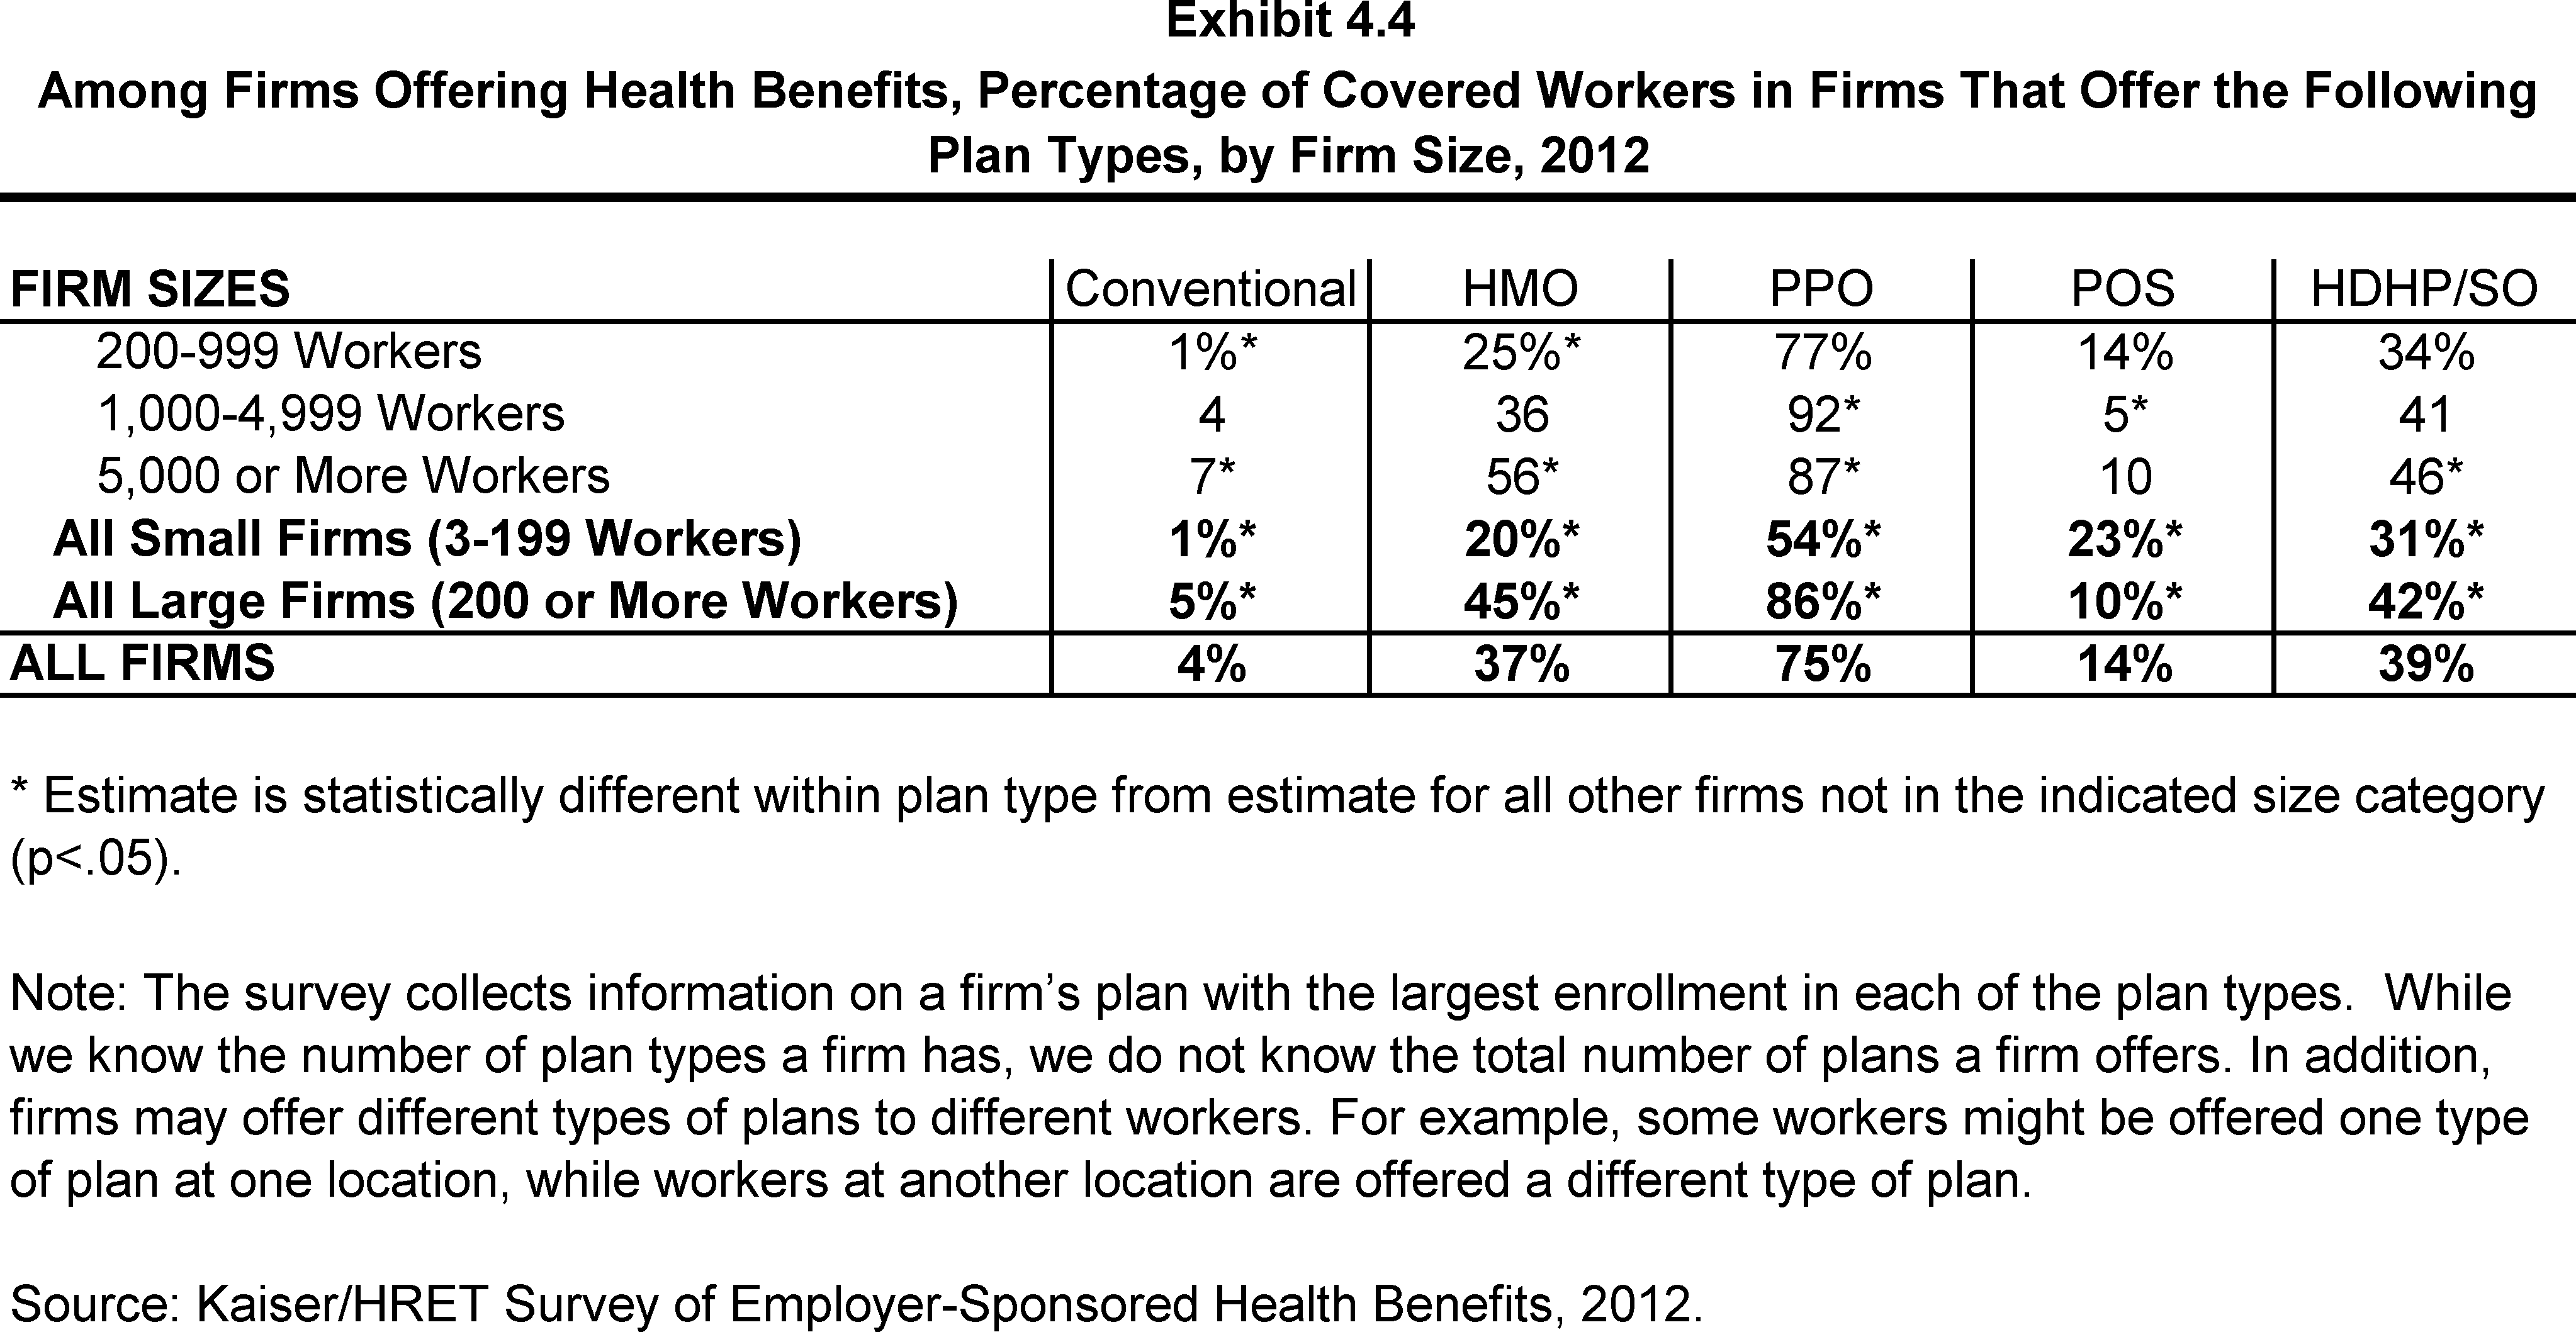
- Three quarters (75%) of covered workers in firms offering health benefits work in a firm that offers one or more PPOs; 39% work in firms that offer one or more HDHP/SOs; 37% work in firms that offer one or more HMOs; 14% work in firms that offer one or more POS plans; and 4% work in firms that offer one or more conventional plans (Exhibit 4.4). 1
The survey collects information on a firm’s plan with the largest enrollment in each of the plan types. While we know the number of plan types a firm has, we do not know the total number of plans a firm offers. In addition, firms may offer different types of plans to different workers. For example, some workers might be offered one type of plan at one location, while workers at another location are offered a different type of plan.
Among Firms Offering Health Benefits, Percentage of Firms That Offer One, Two, or Three or More Plan Types, by Firm Size, 2012
Percentage of Covered Workers in Firms Offering One, Two, or Three or More Plan Types, by Firm Size, 2012
Among Firms Offering Health Benefits, Percentage of Firms That Offer the Following Plan Types, by Firm Size, 2012
Among Firms Offering Health Benefits, Percentage of Covered Workers in Firms That Offer the Following Plan Types, by Firm Size, 2012
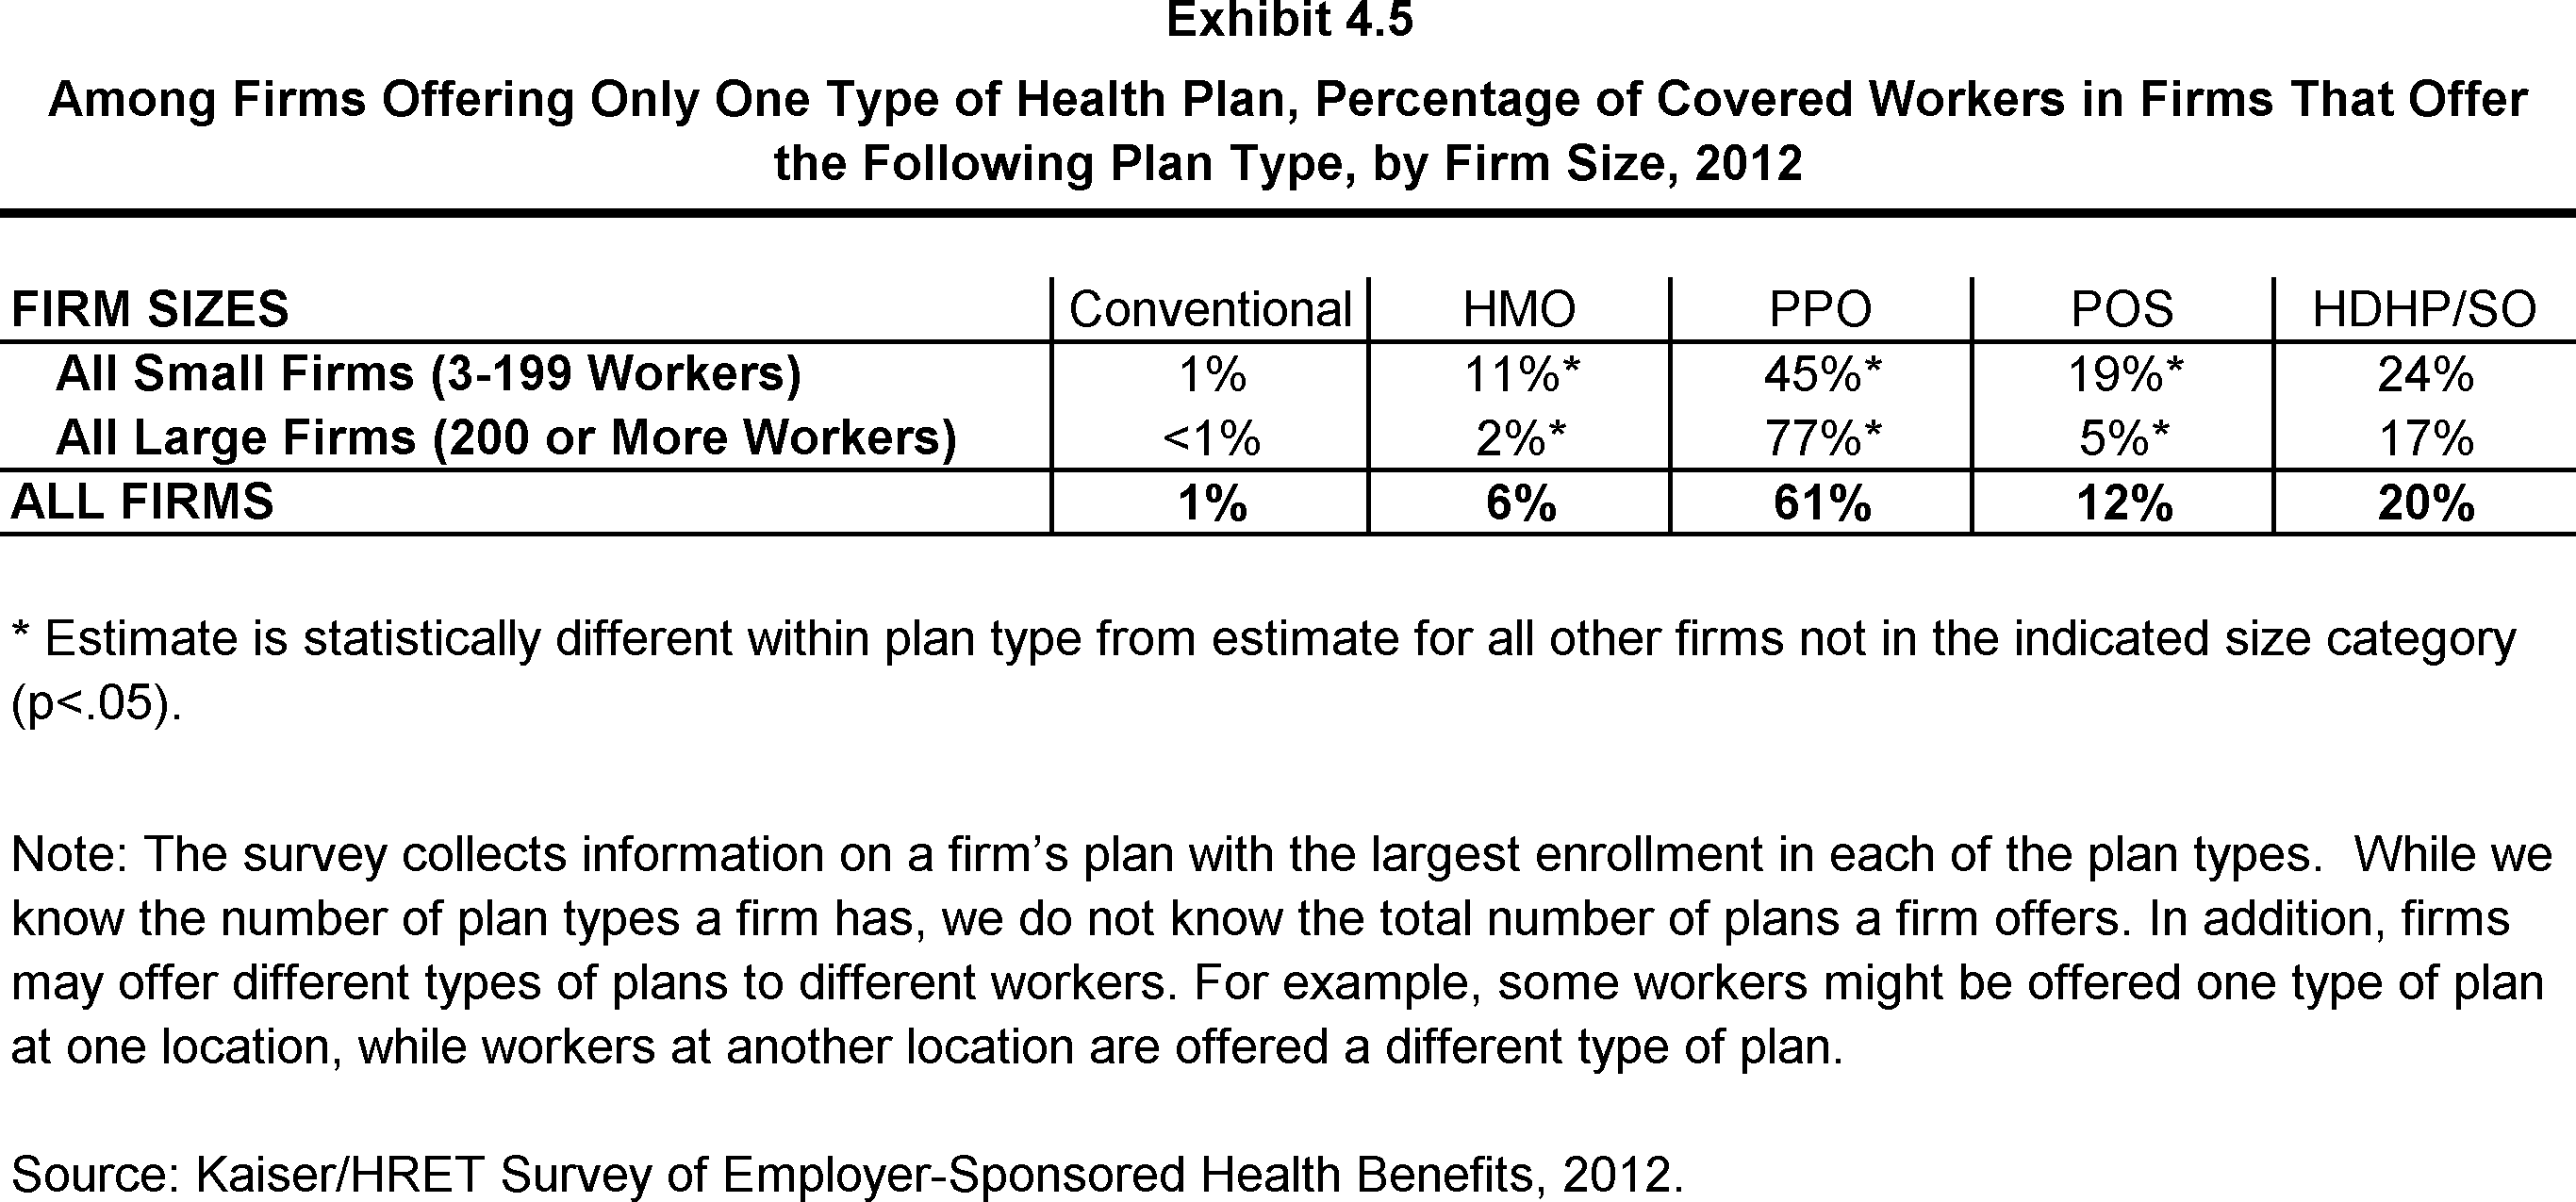
Among Firms Offering Only One Type of Health Plan, Percentage of Covered Workers in Firms That Offer the Following Plan Type, by Firm Size, 2012
Section 5: Market Shares of Health Plans
Enrollment remains highest in PPOs, with more than half of covered workers, followed by HDHP/SOs, HMOs, POS plans, and conventional plans. PPOs remain more popular for covered workers in large firms and HDHP/SO and POS plans are relatively more popular in smaller firms.
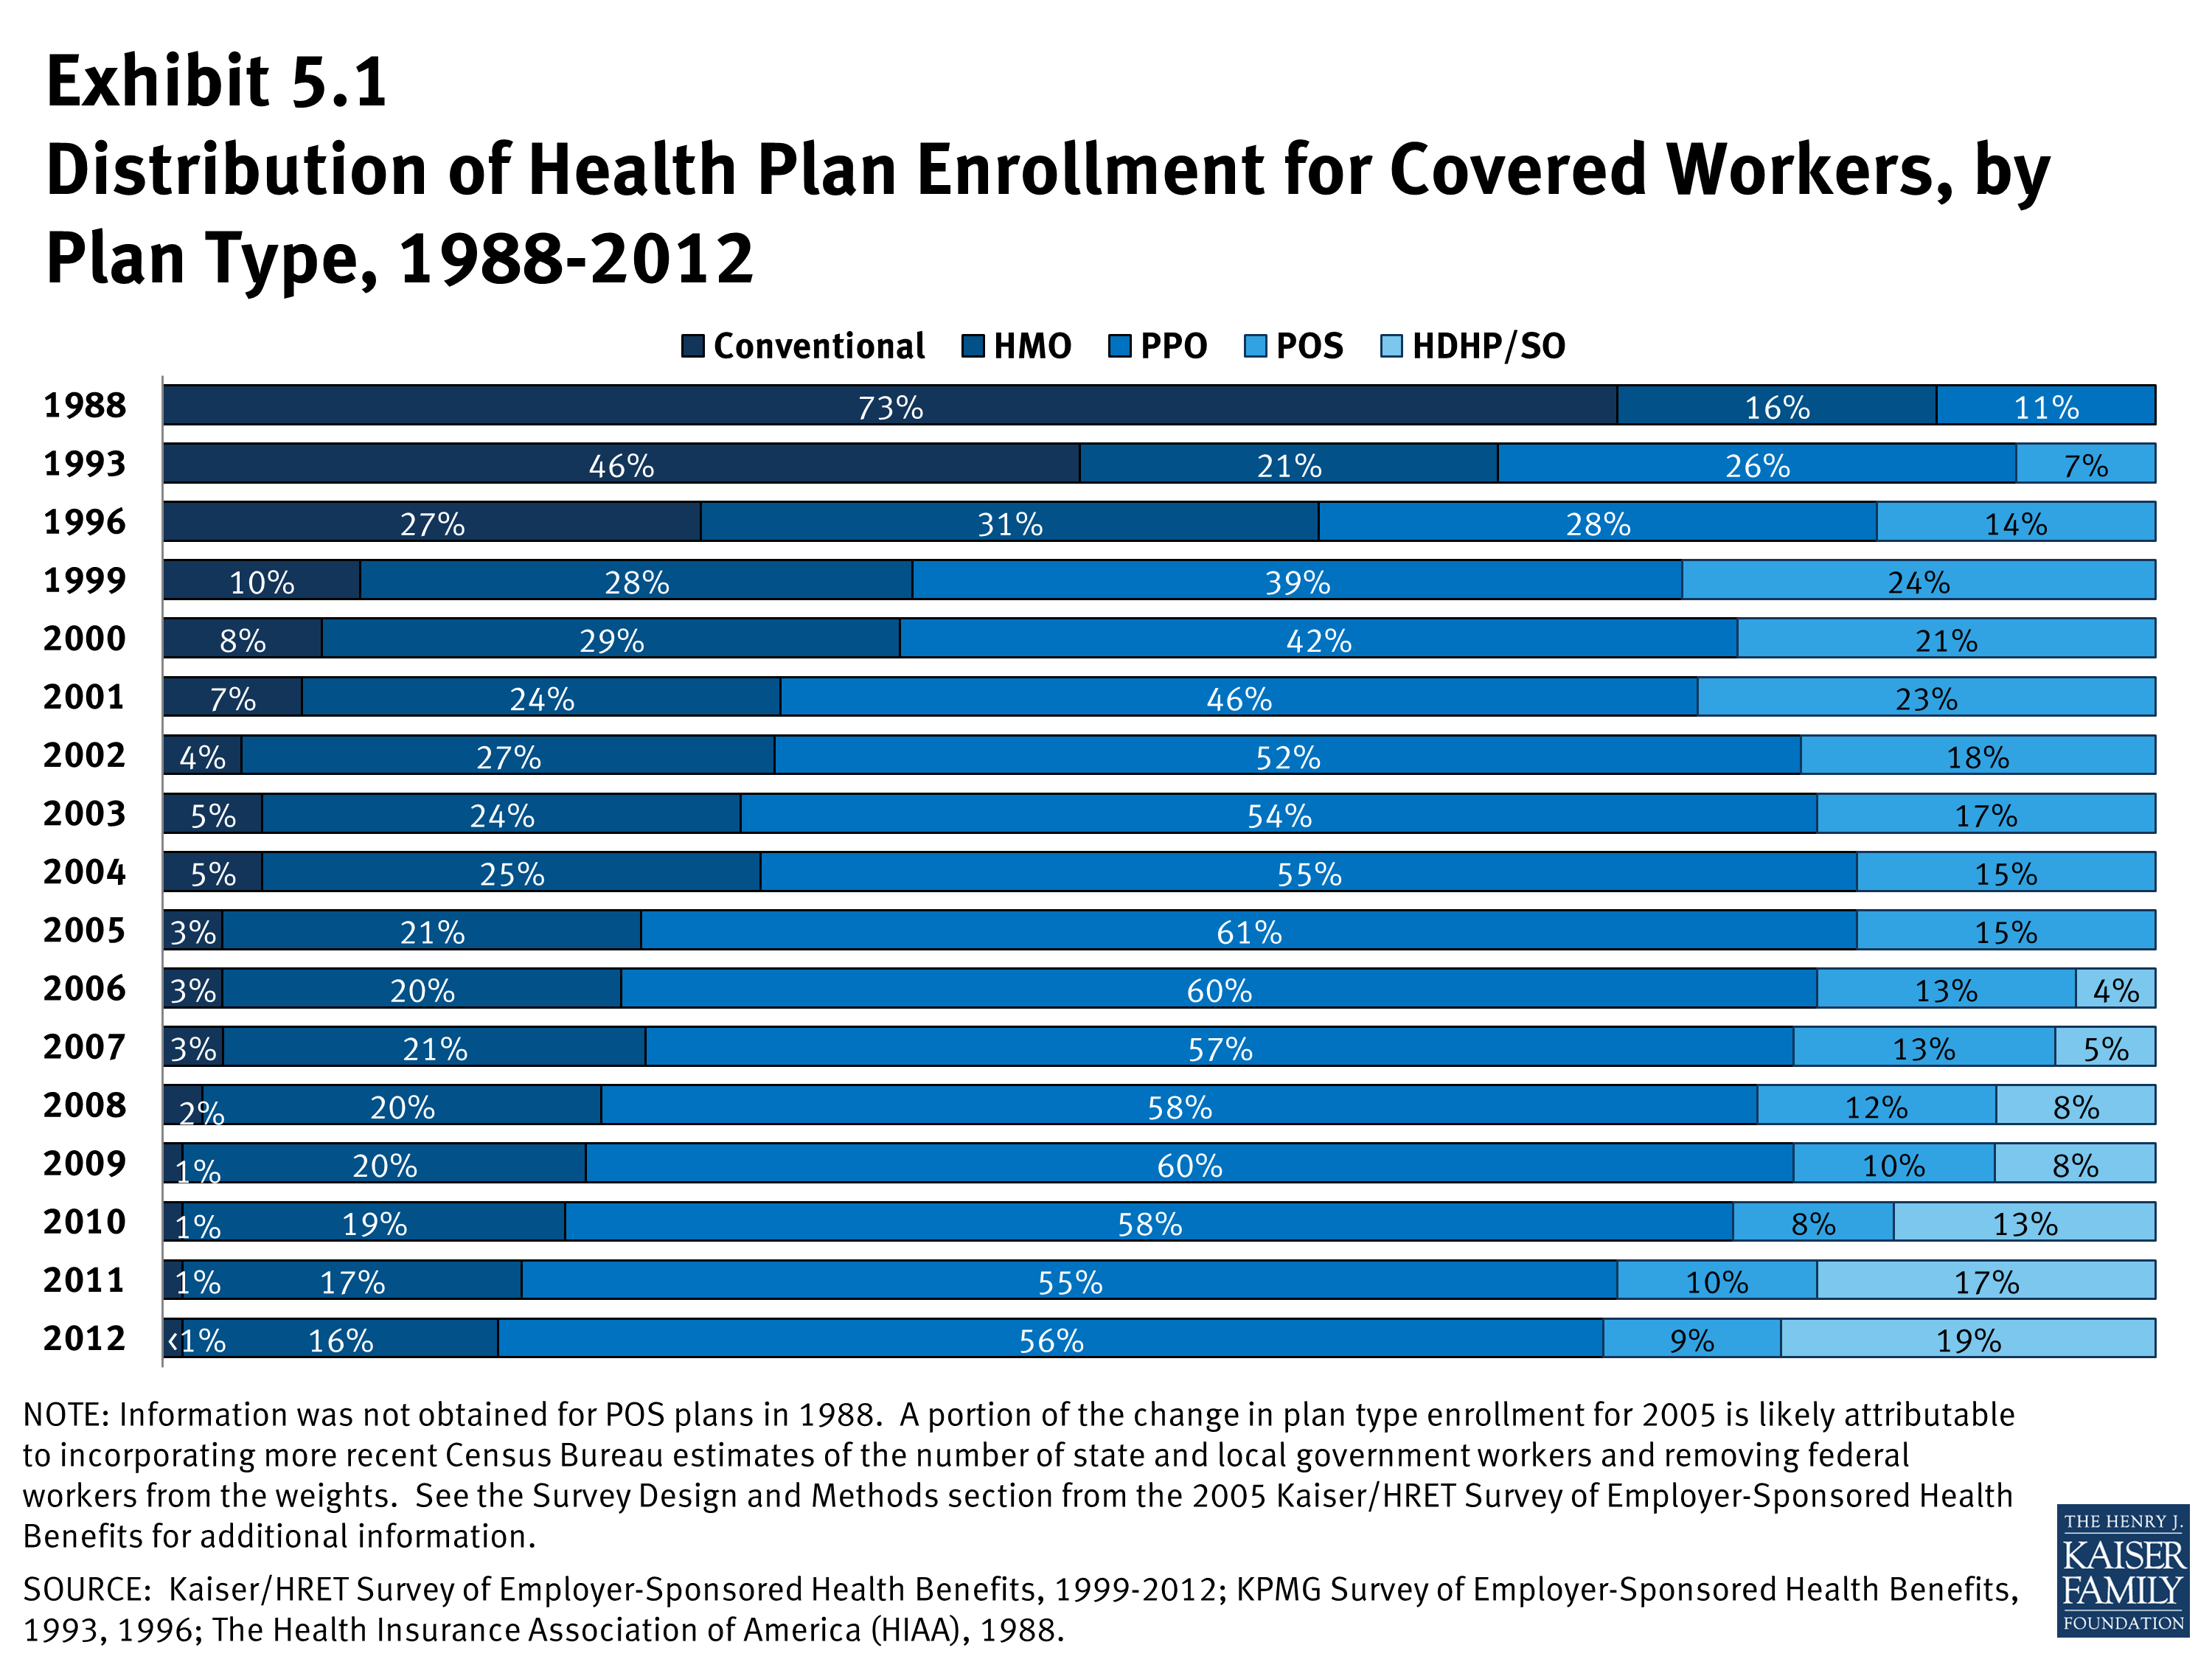
- Fifty-six percent of covered workers are enrolled in PPOs, followed by HDHP/SOs (19%), HMOs (16%), POS plans (9%), and conventional plans (<1%) (Exhibit 5.1).
- After two years of significant increases in the percentage of covered workers enrolled in HDHP/SO plans (8% in 2009, 13% in 2010, and 17% in 2011), there was a similar level of enrollment in 2012 (19%) compared to last year (Exhibit 5.1).
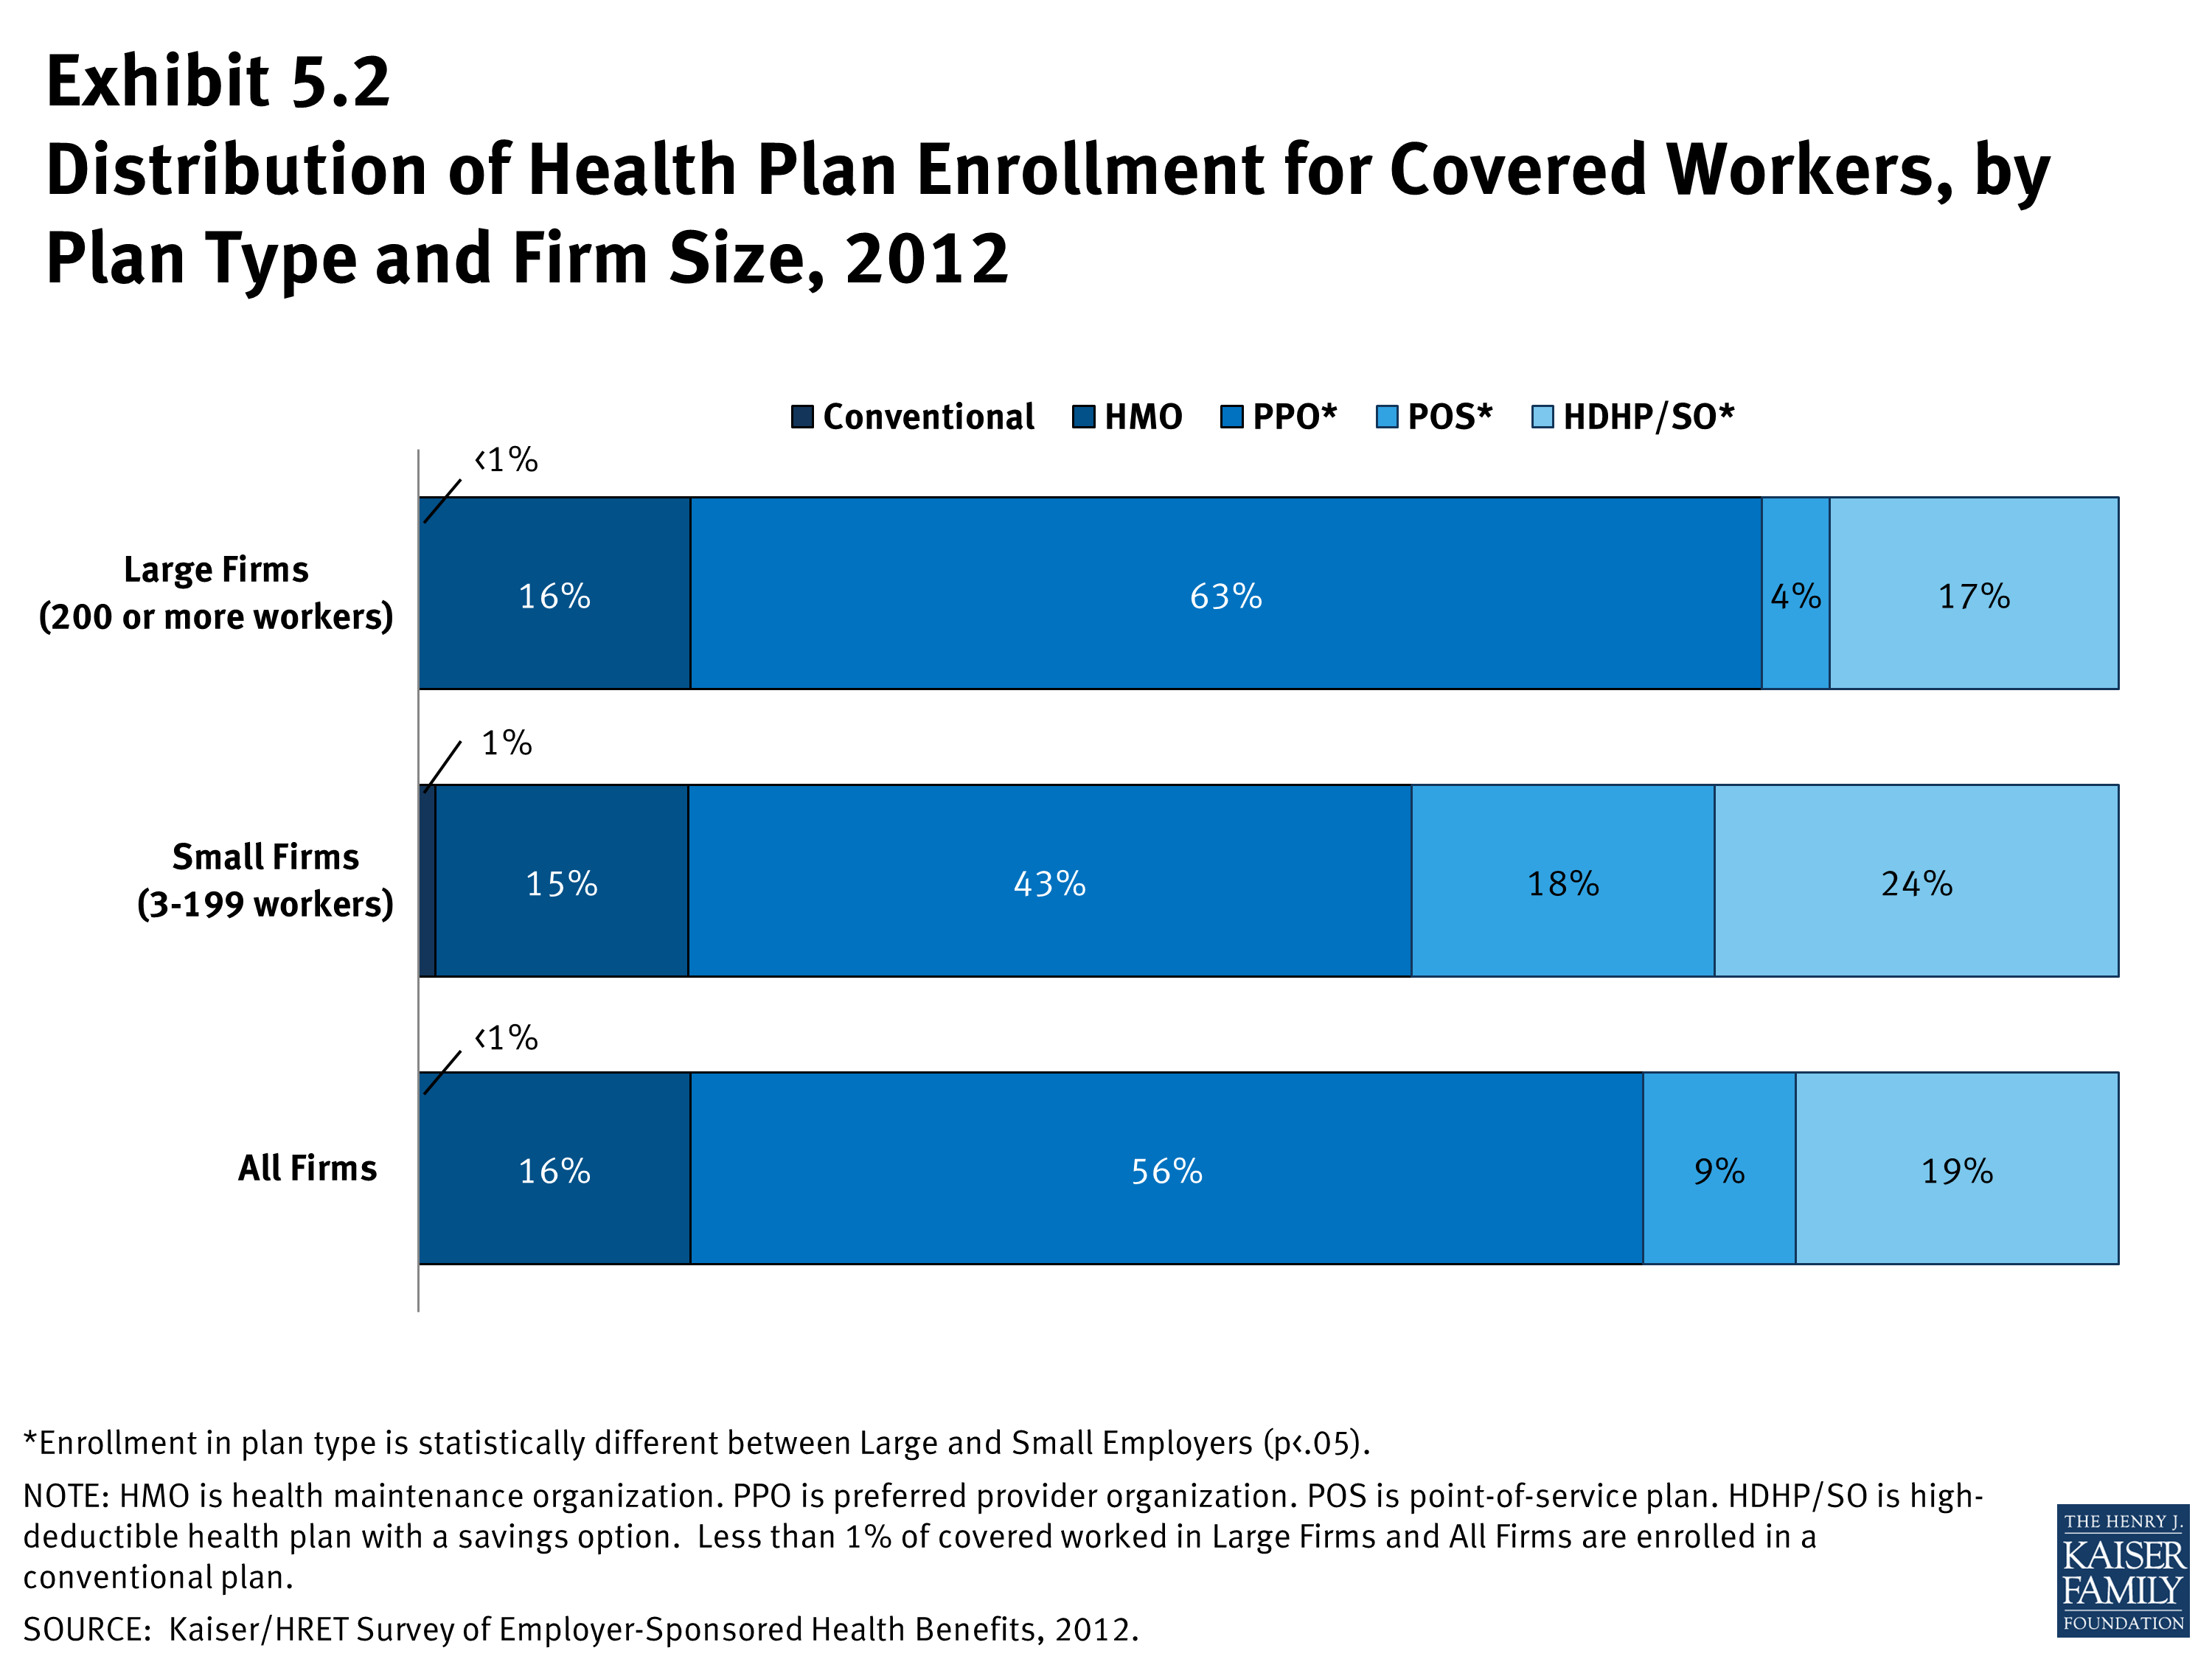
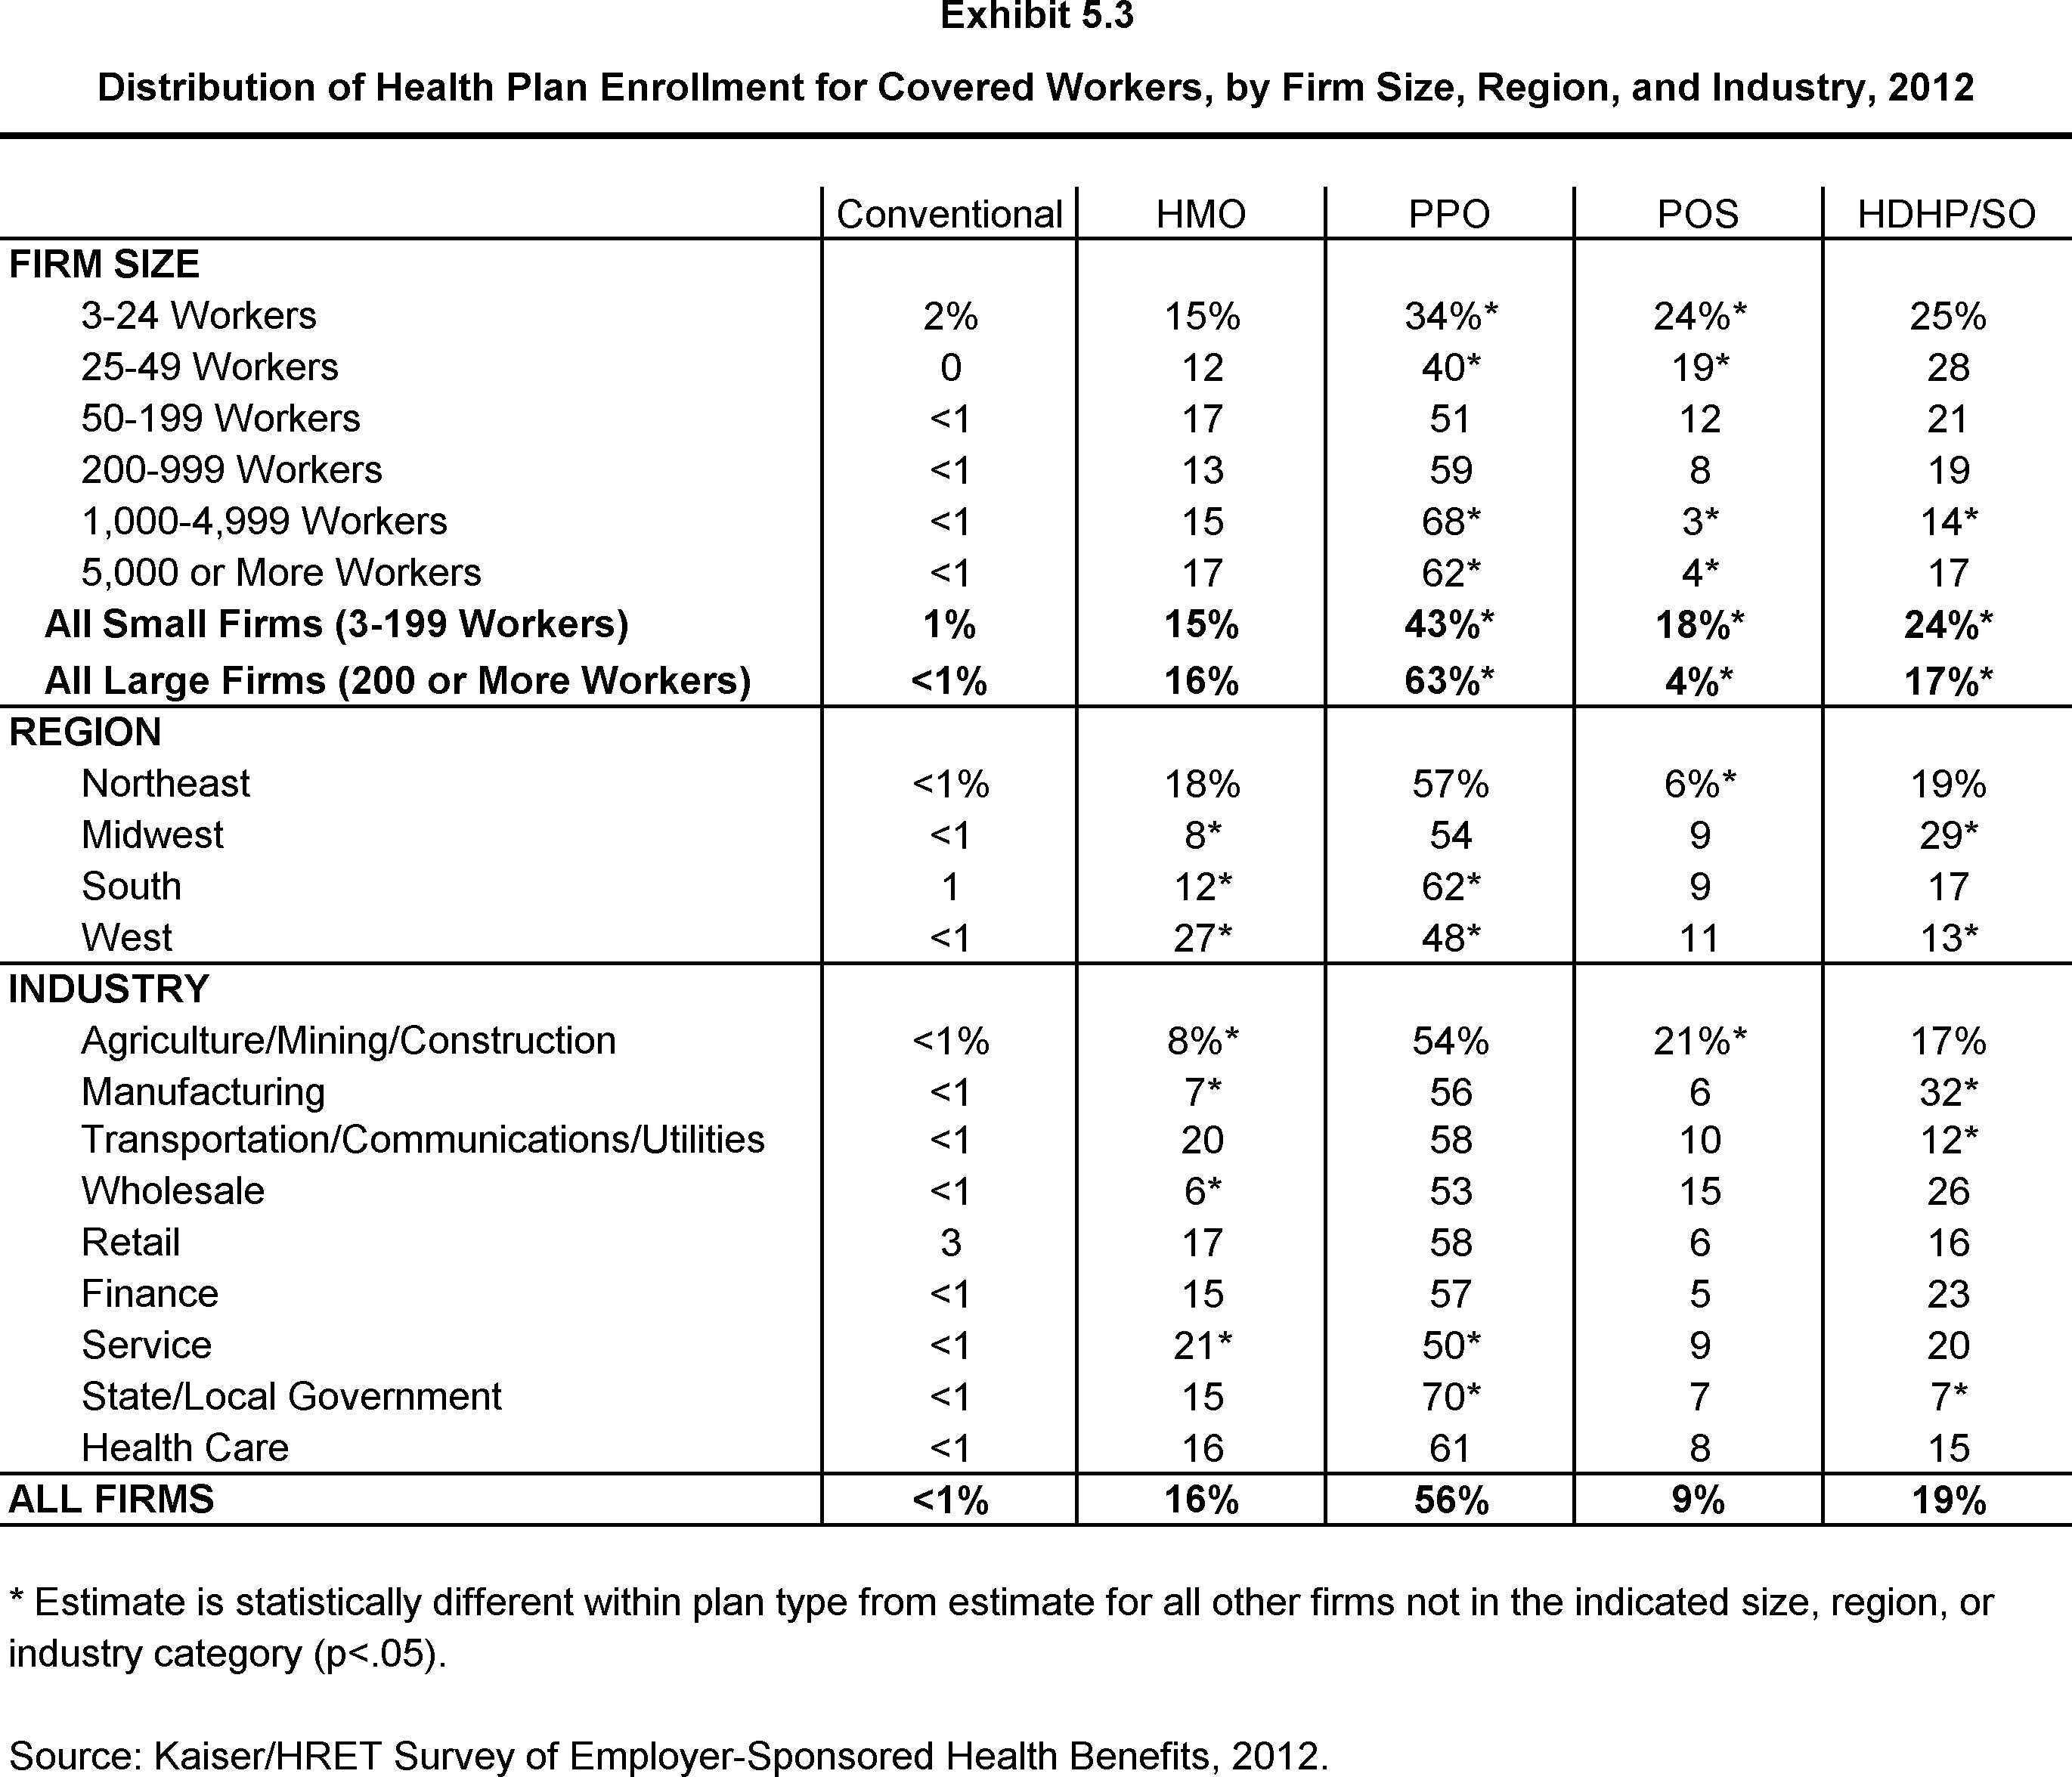
- Plan enrollment patterns vary by firm size. Workers in large firms (200 or more workers) are more likely than workers in small firms (3-199 workers) to enroll in PPOs (63% vs. 43%). Workers in small firms are more likely than workers in large firms to enroll in POS plans (18% vs. 4%) and HDHP/SO plans (24% vs. 17%) (Exhibit 5.3).
- Plan enrollment patterns also differ across regions.
- HMO enrollment is significantly higher in the West (27%) and significantly lower in the South (12%) and Midwest (8%) (Exhibit 5.3).
- Workers in the South (62%) are more likely to be enrolled in PPO plans than workers in other regions; workers in the West (48%) are less likely to be enrolled in a PPO (Exhibit 5.3).
- Enrollment in HDHP/SOs is higher among workers in the Midwest (29%) than in other regions (Exhibit 5.3).
Distribution of Health Plan Enrollment for Covered Workers, by Plan Type, 1988-2012
Distribution of Health Plan Enrollment for Covered Workers, by Plan Type and Firm Size, 2012
Distribution of Health Plan Enrollment for Covered Workers, by Firm Size, Region, and Industry, 2012
Section 6: Worker and Employer Contributions for Premiums
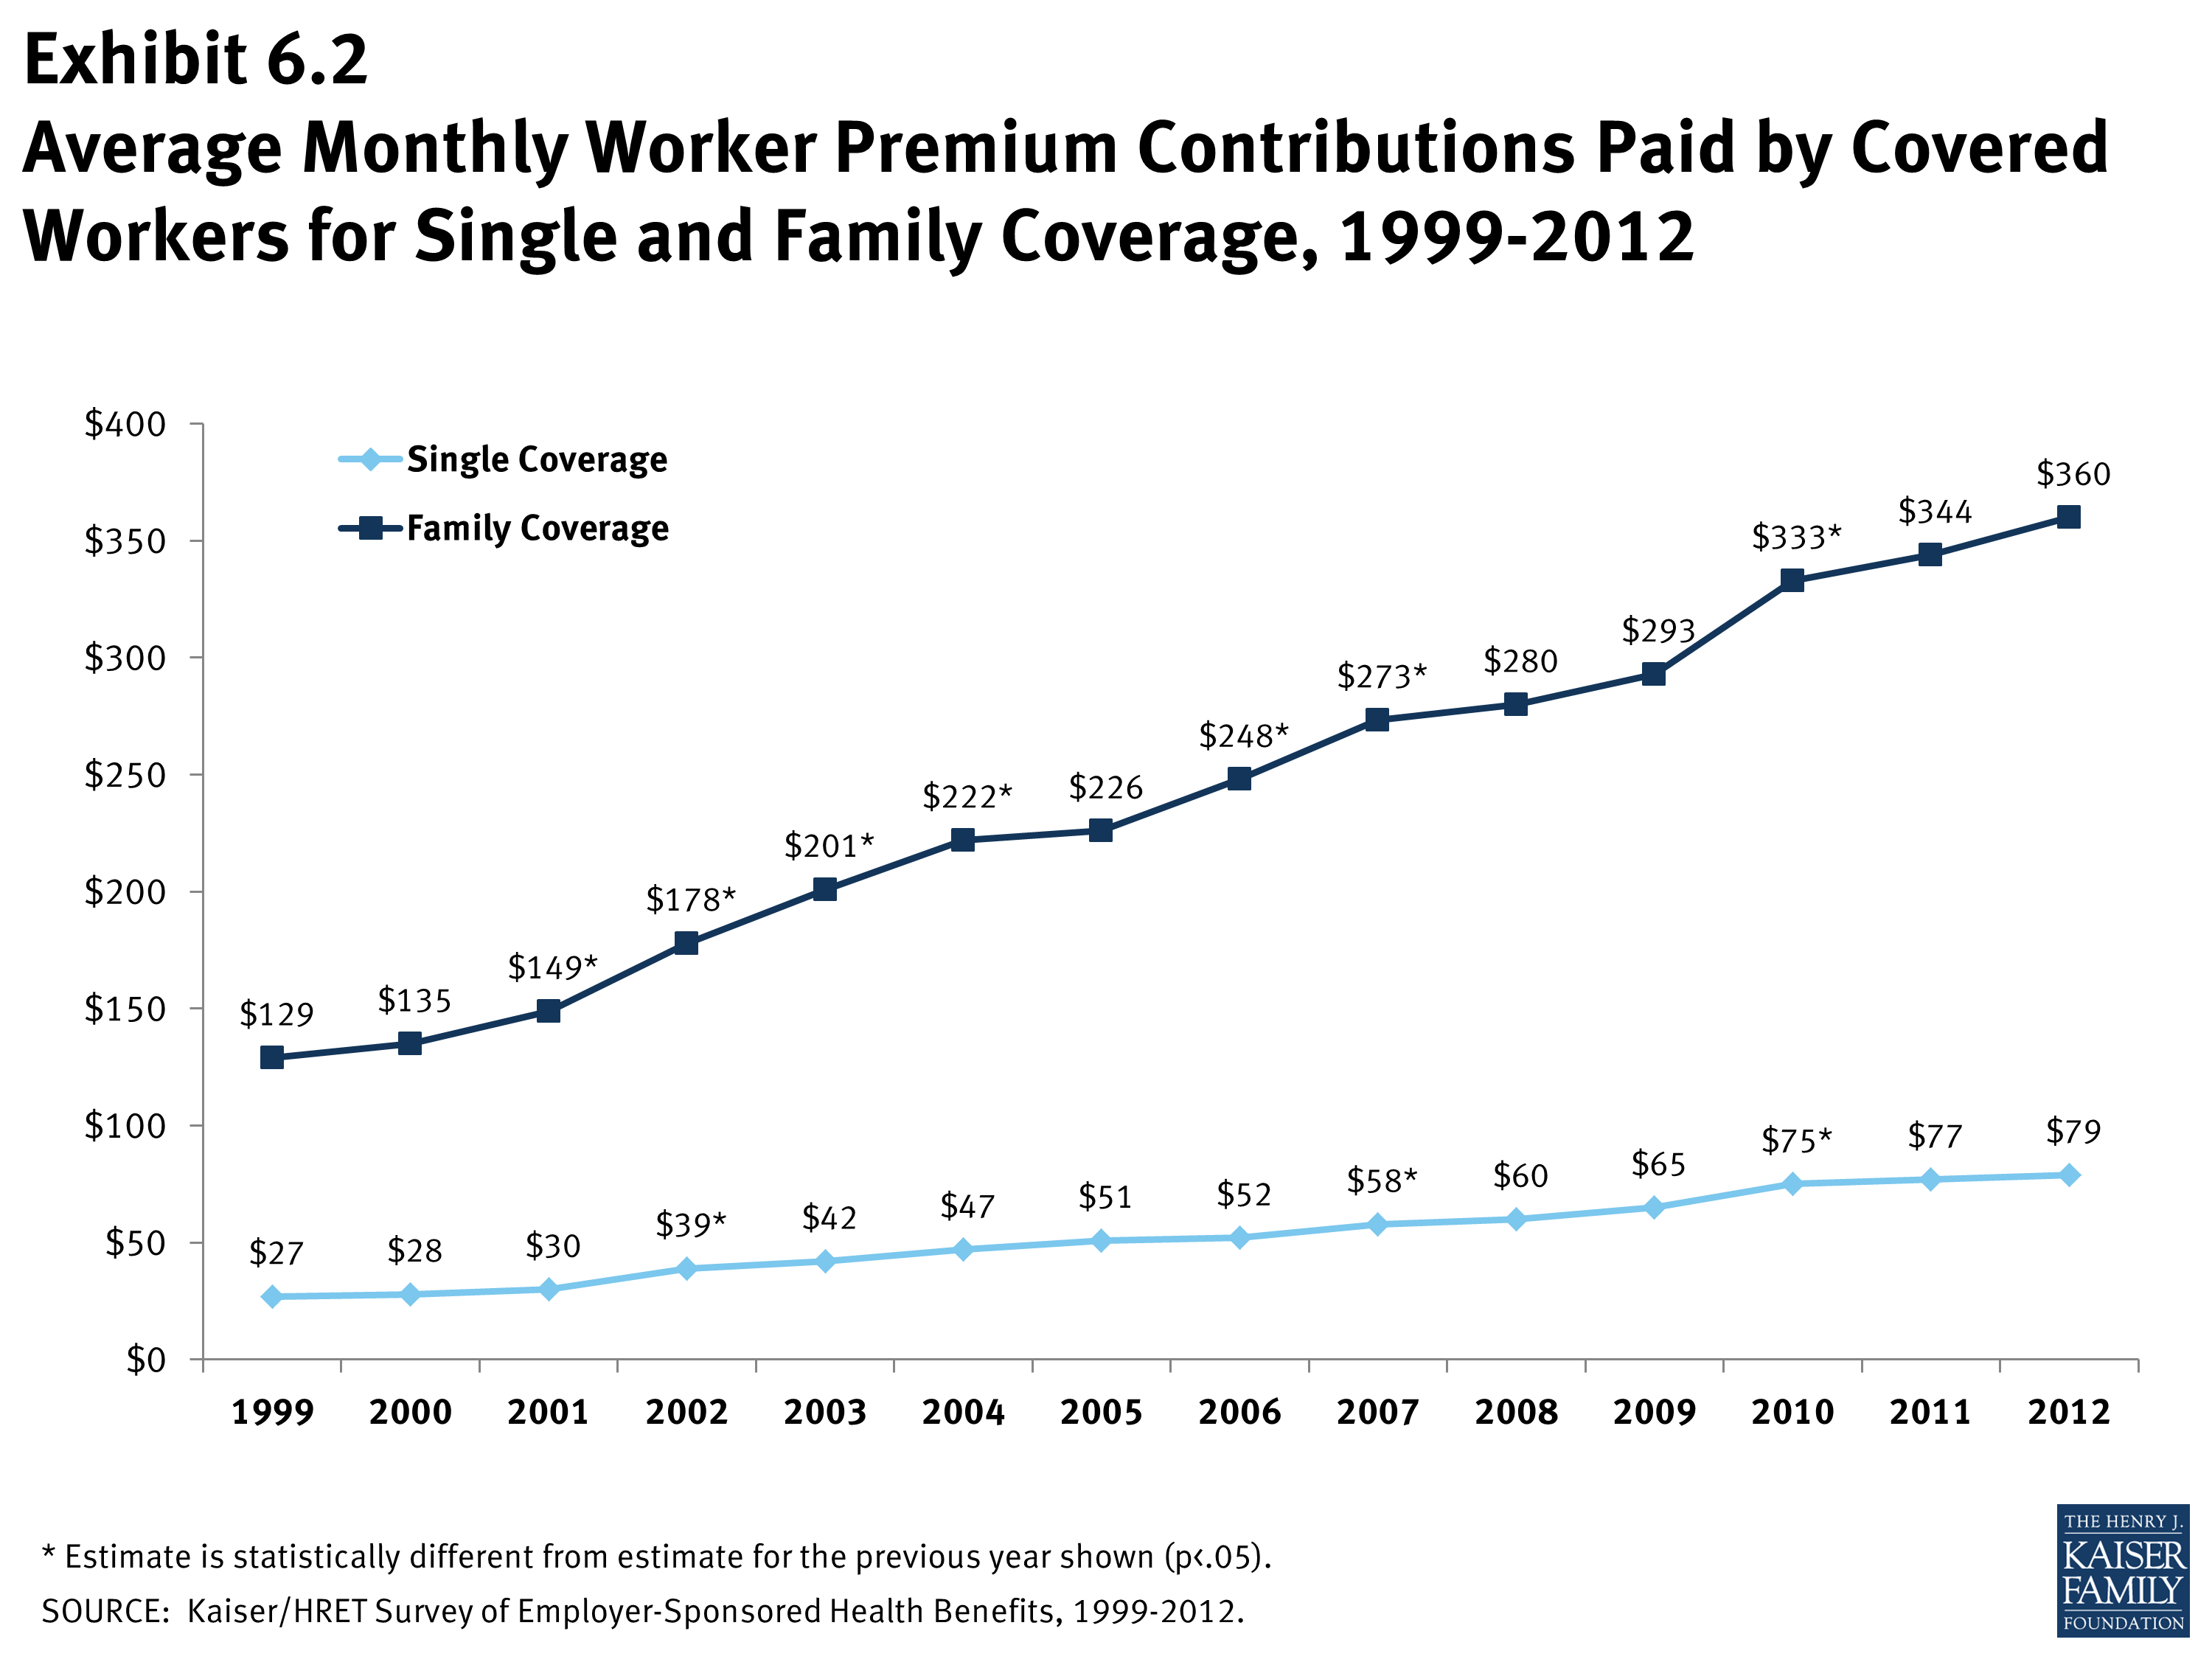
Premium contributions by covered workers average 18% for single coverage and 28% for family coverage. 1 The average monthly worker contributions are $79 for single coverage ($951 annually) and $360 for family coverage ($4,316 annually). These percentage and dollar values are similar to the values reported in 2011.
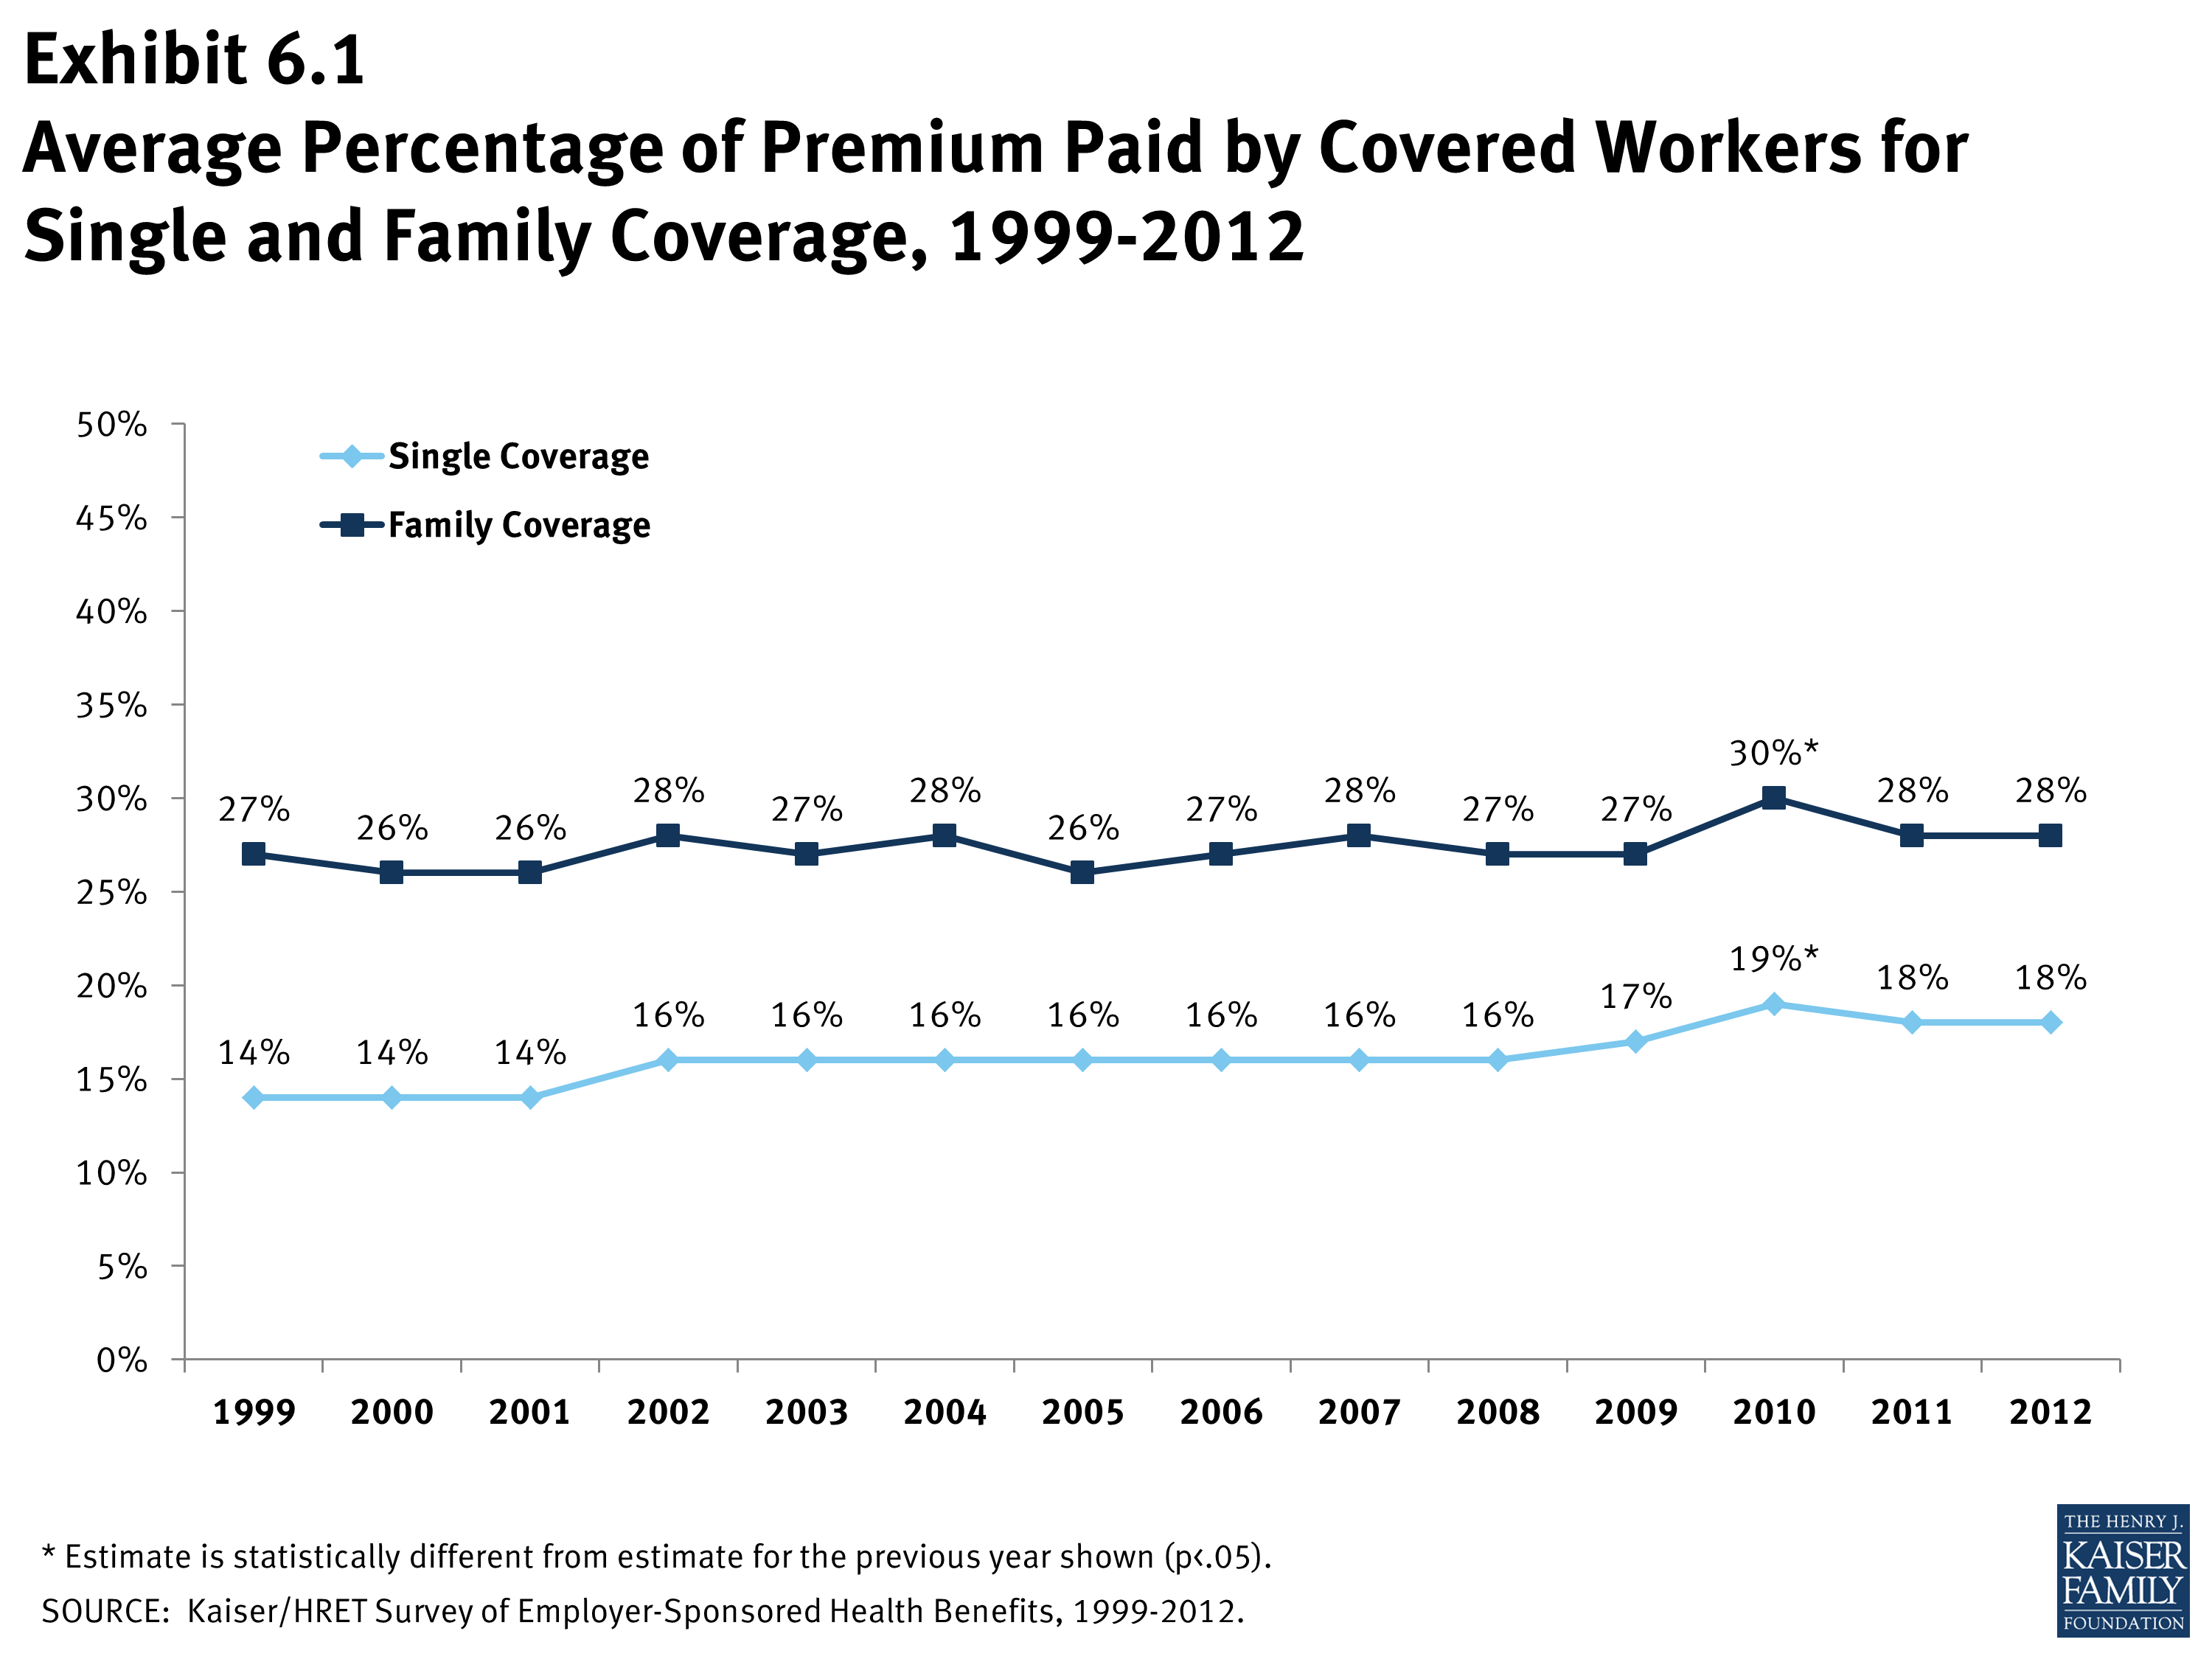
- In 2012, covered workers on average contribute 18% of the premium for single coverage and 28% of the premium for family coverage, the same contribution percentages reported for 2011 (Exhibit 6.1).
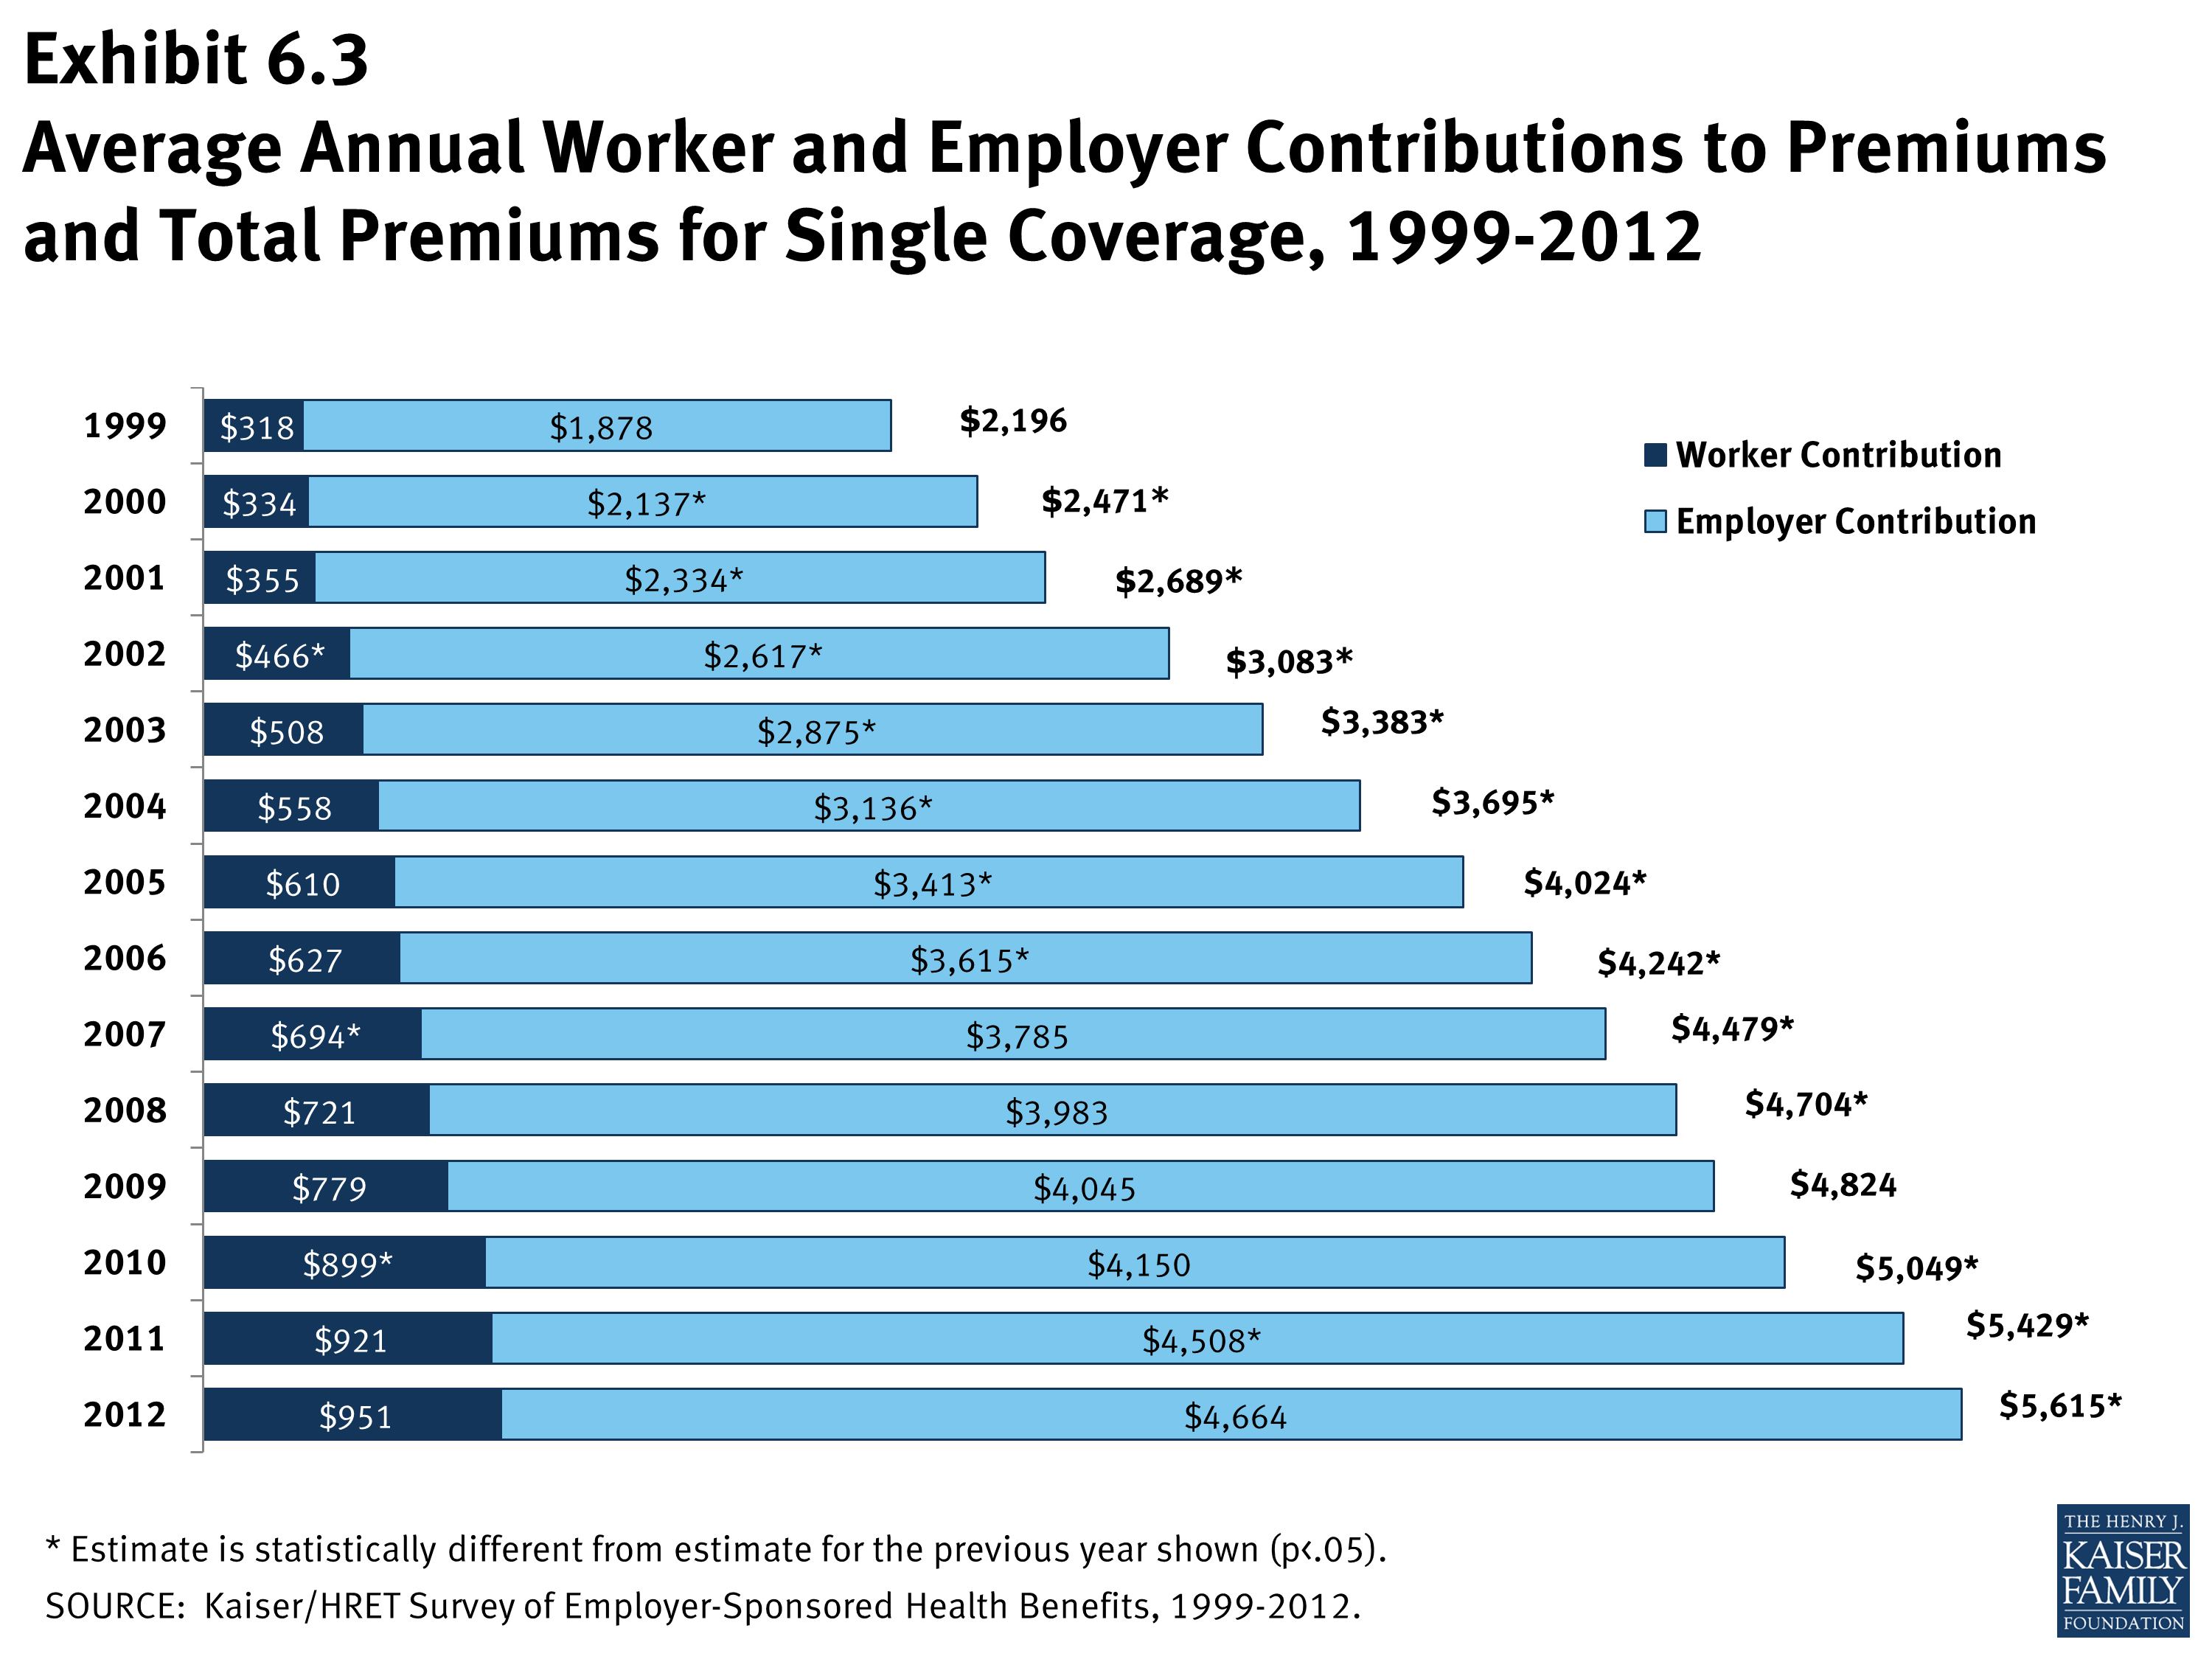
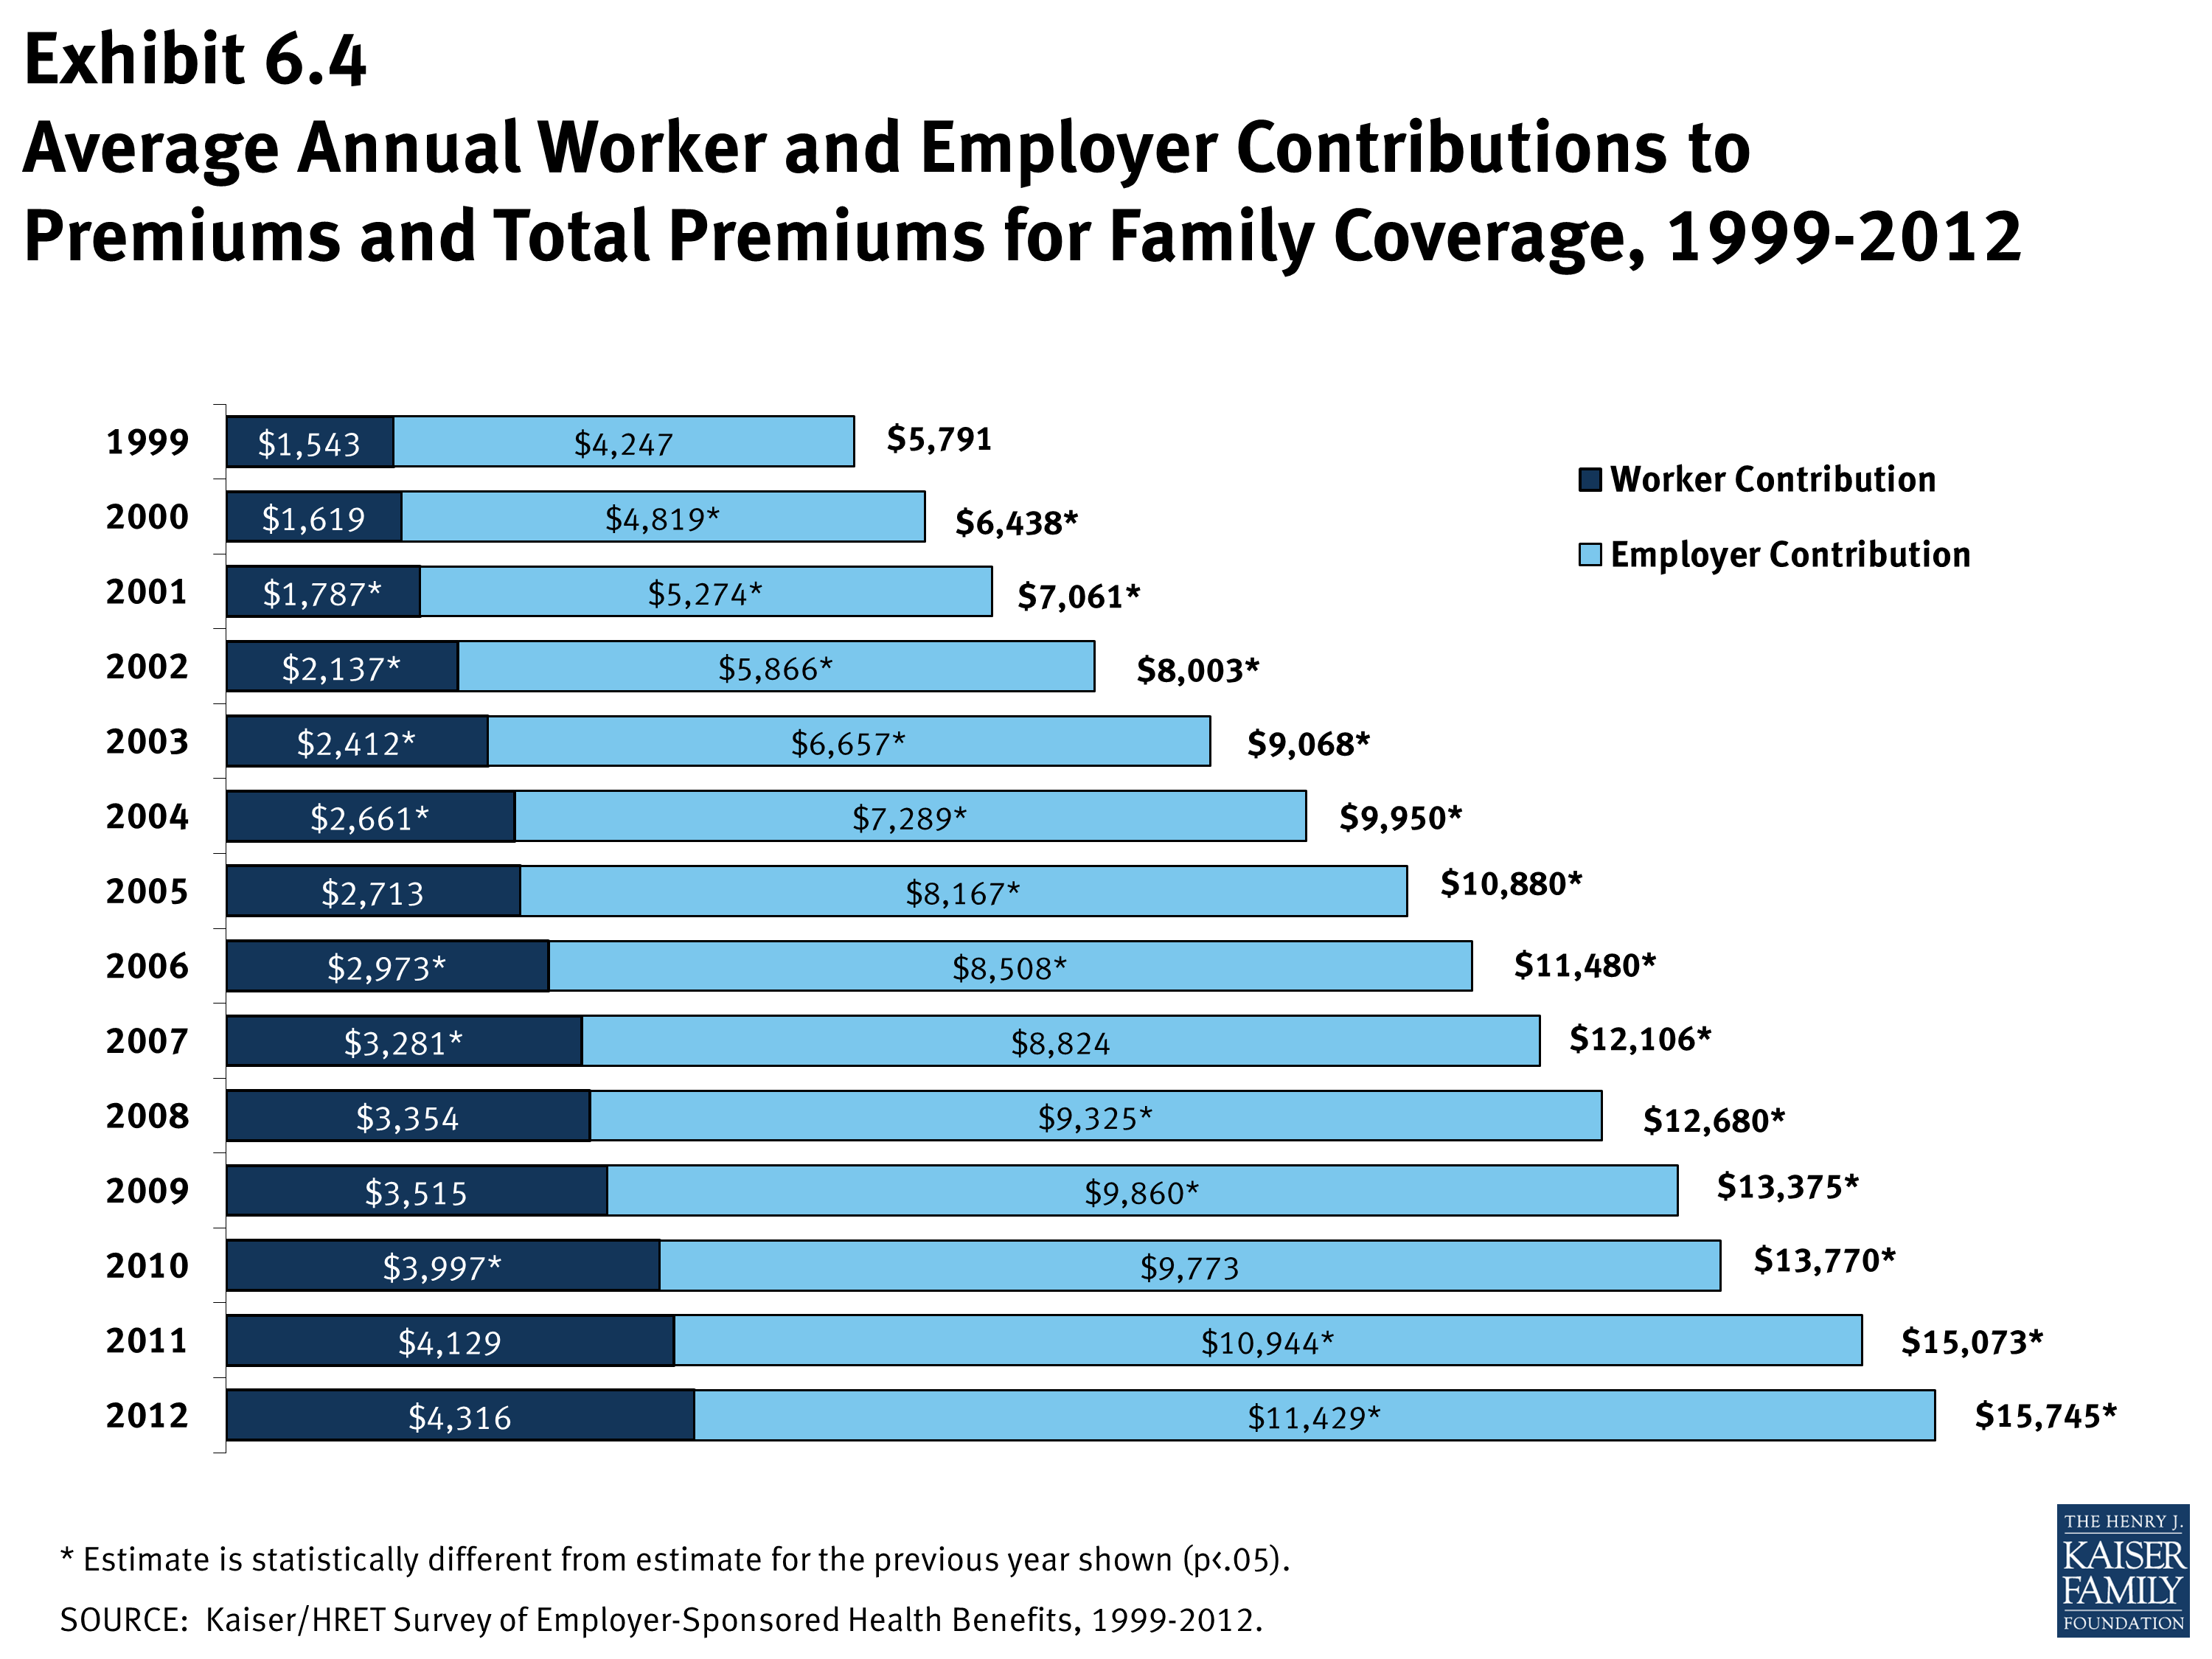
- On average, workers with single coverage contribute $79 per month ($951 annually), and workers with family coverage contribute $360 per month ($4,316 annually), towards their health insurance premiums, similar to the amounts reported in 2011 (Exhibit 6.2), (Exhibit 6.3), and (Exhibit 6.4).
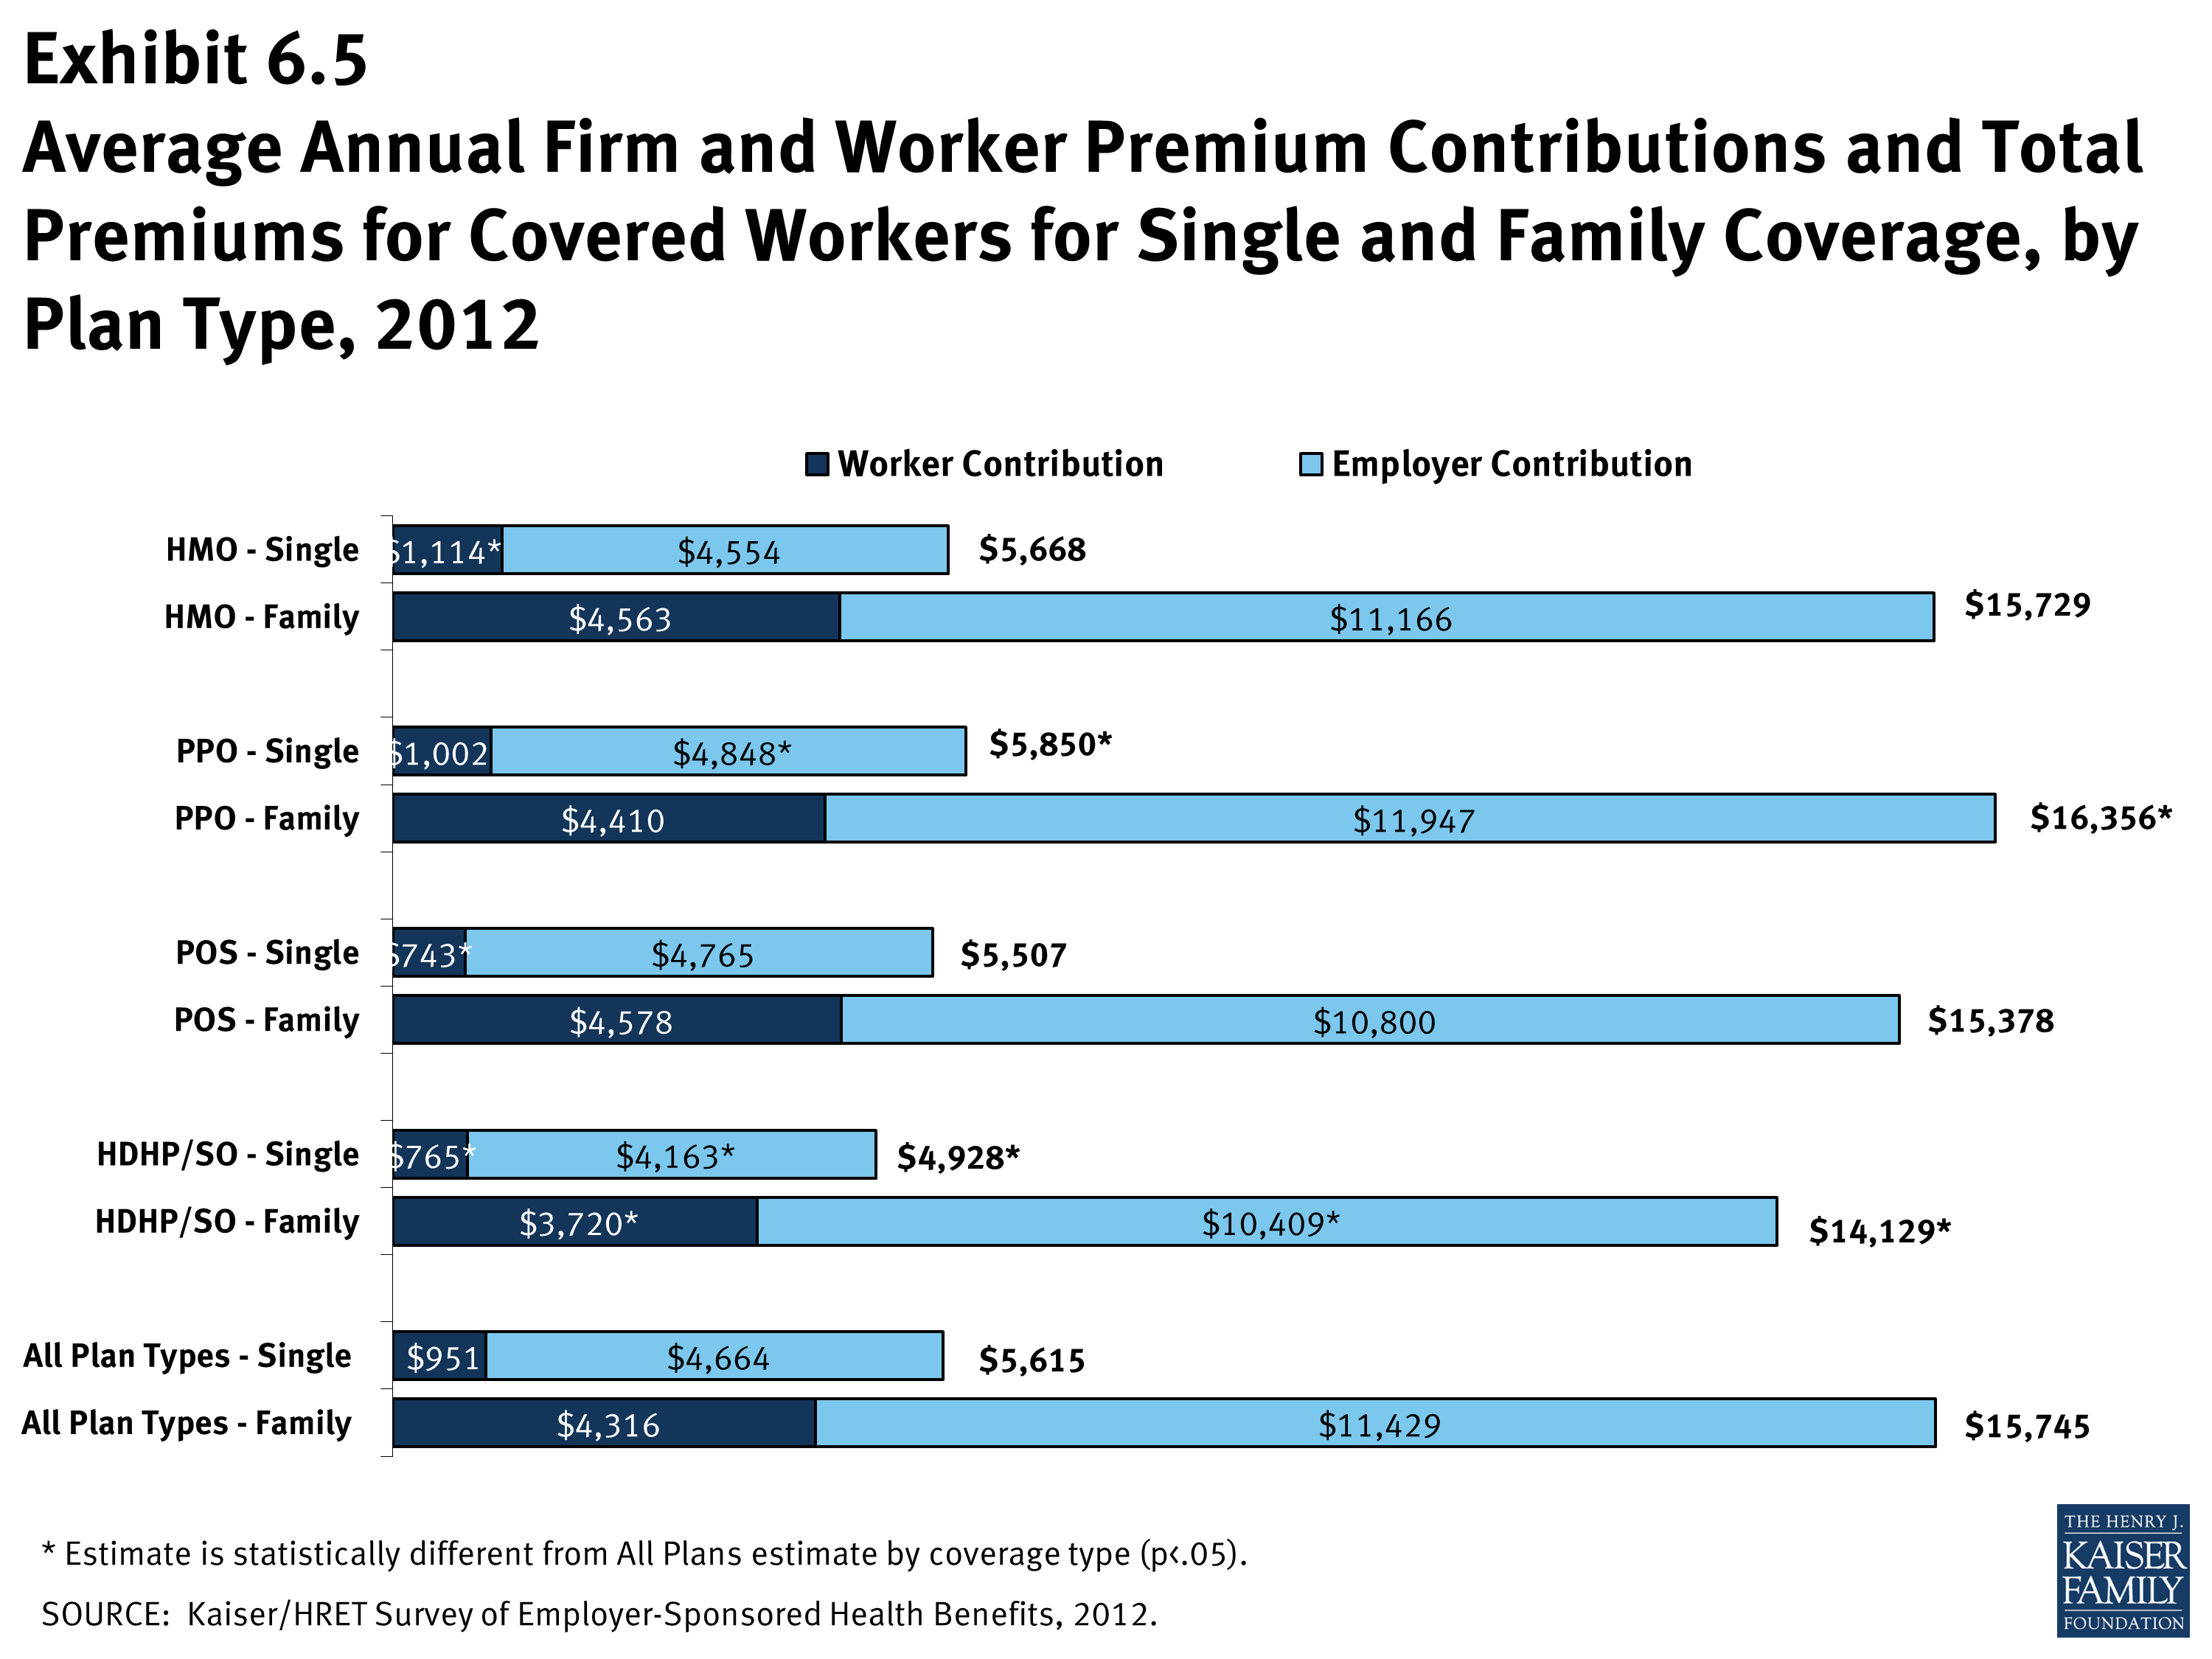
- Worker contributions in HDHP/SOs are lower than the overall average worker contributions for both single and family coverage ($765 and $3,720) (Exhibit 6.5).
- Worker contributions in POS plans are lower for single coverage ($743) compared to the overall average worker contribution for single coverage. Worker contributions in HMO plans are higher for single coverage ($1,114) than the overall average worker contribution amounts (Exhibit 6.5).
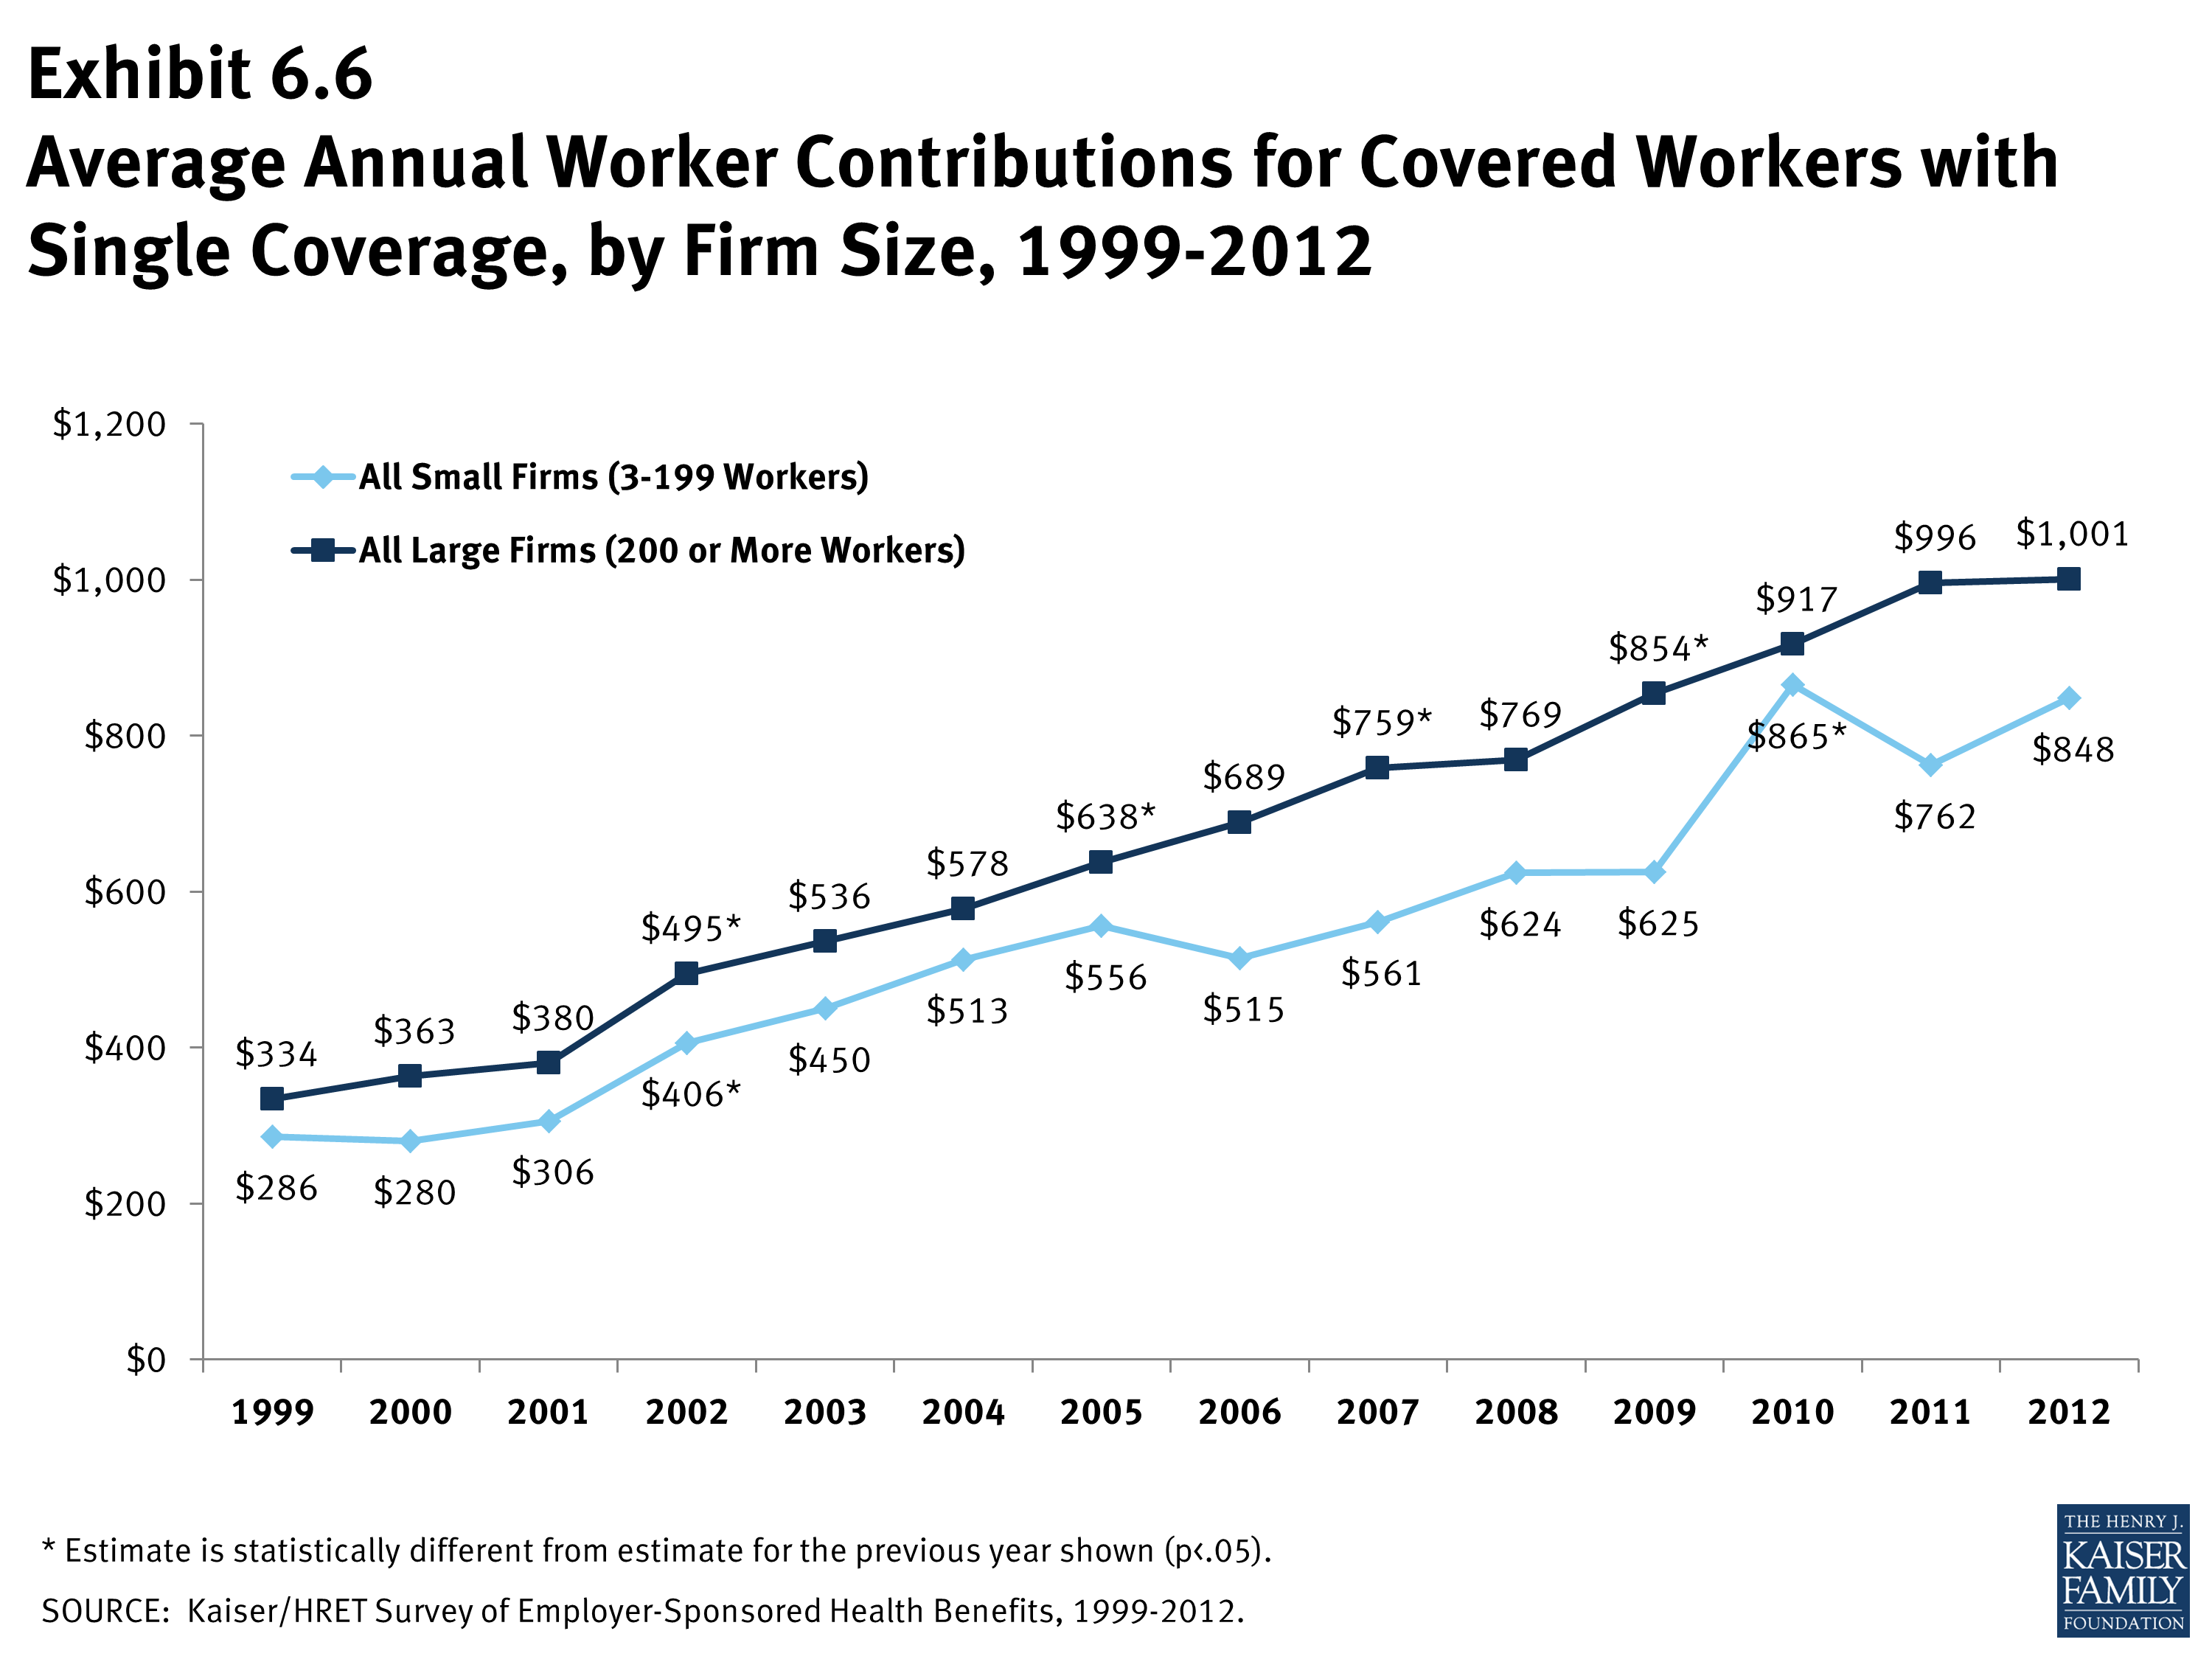
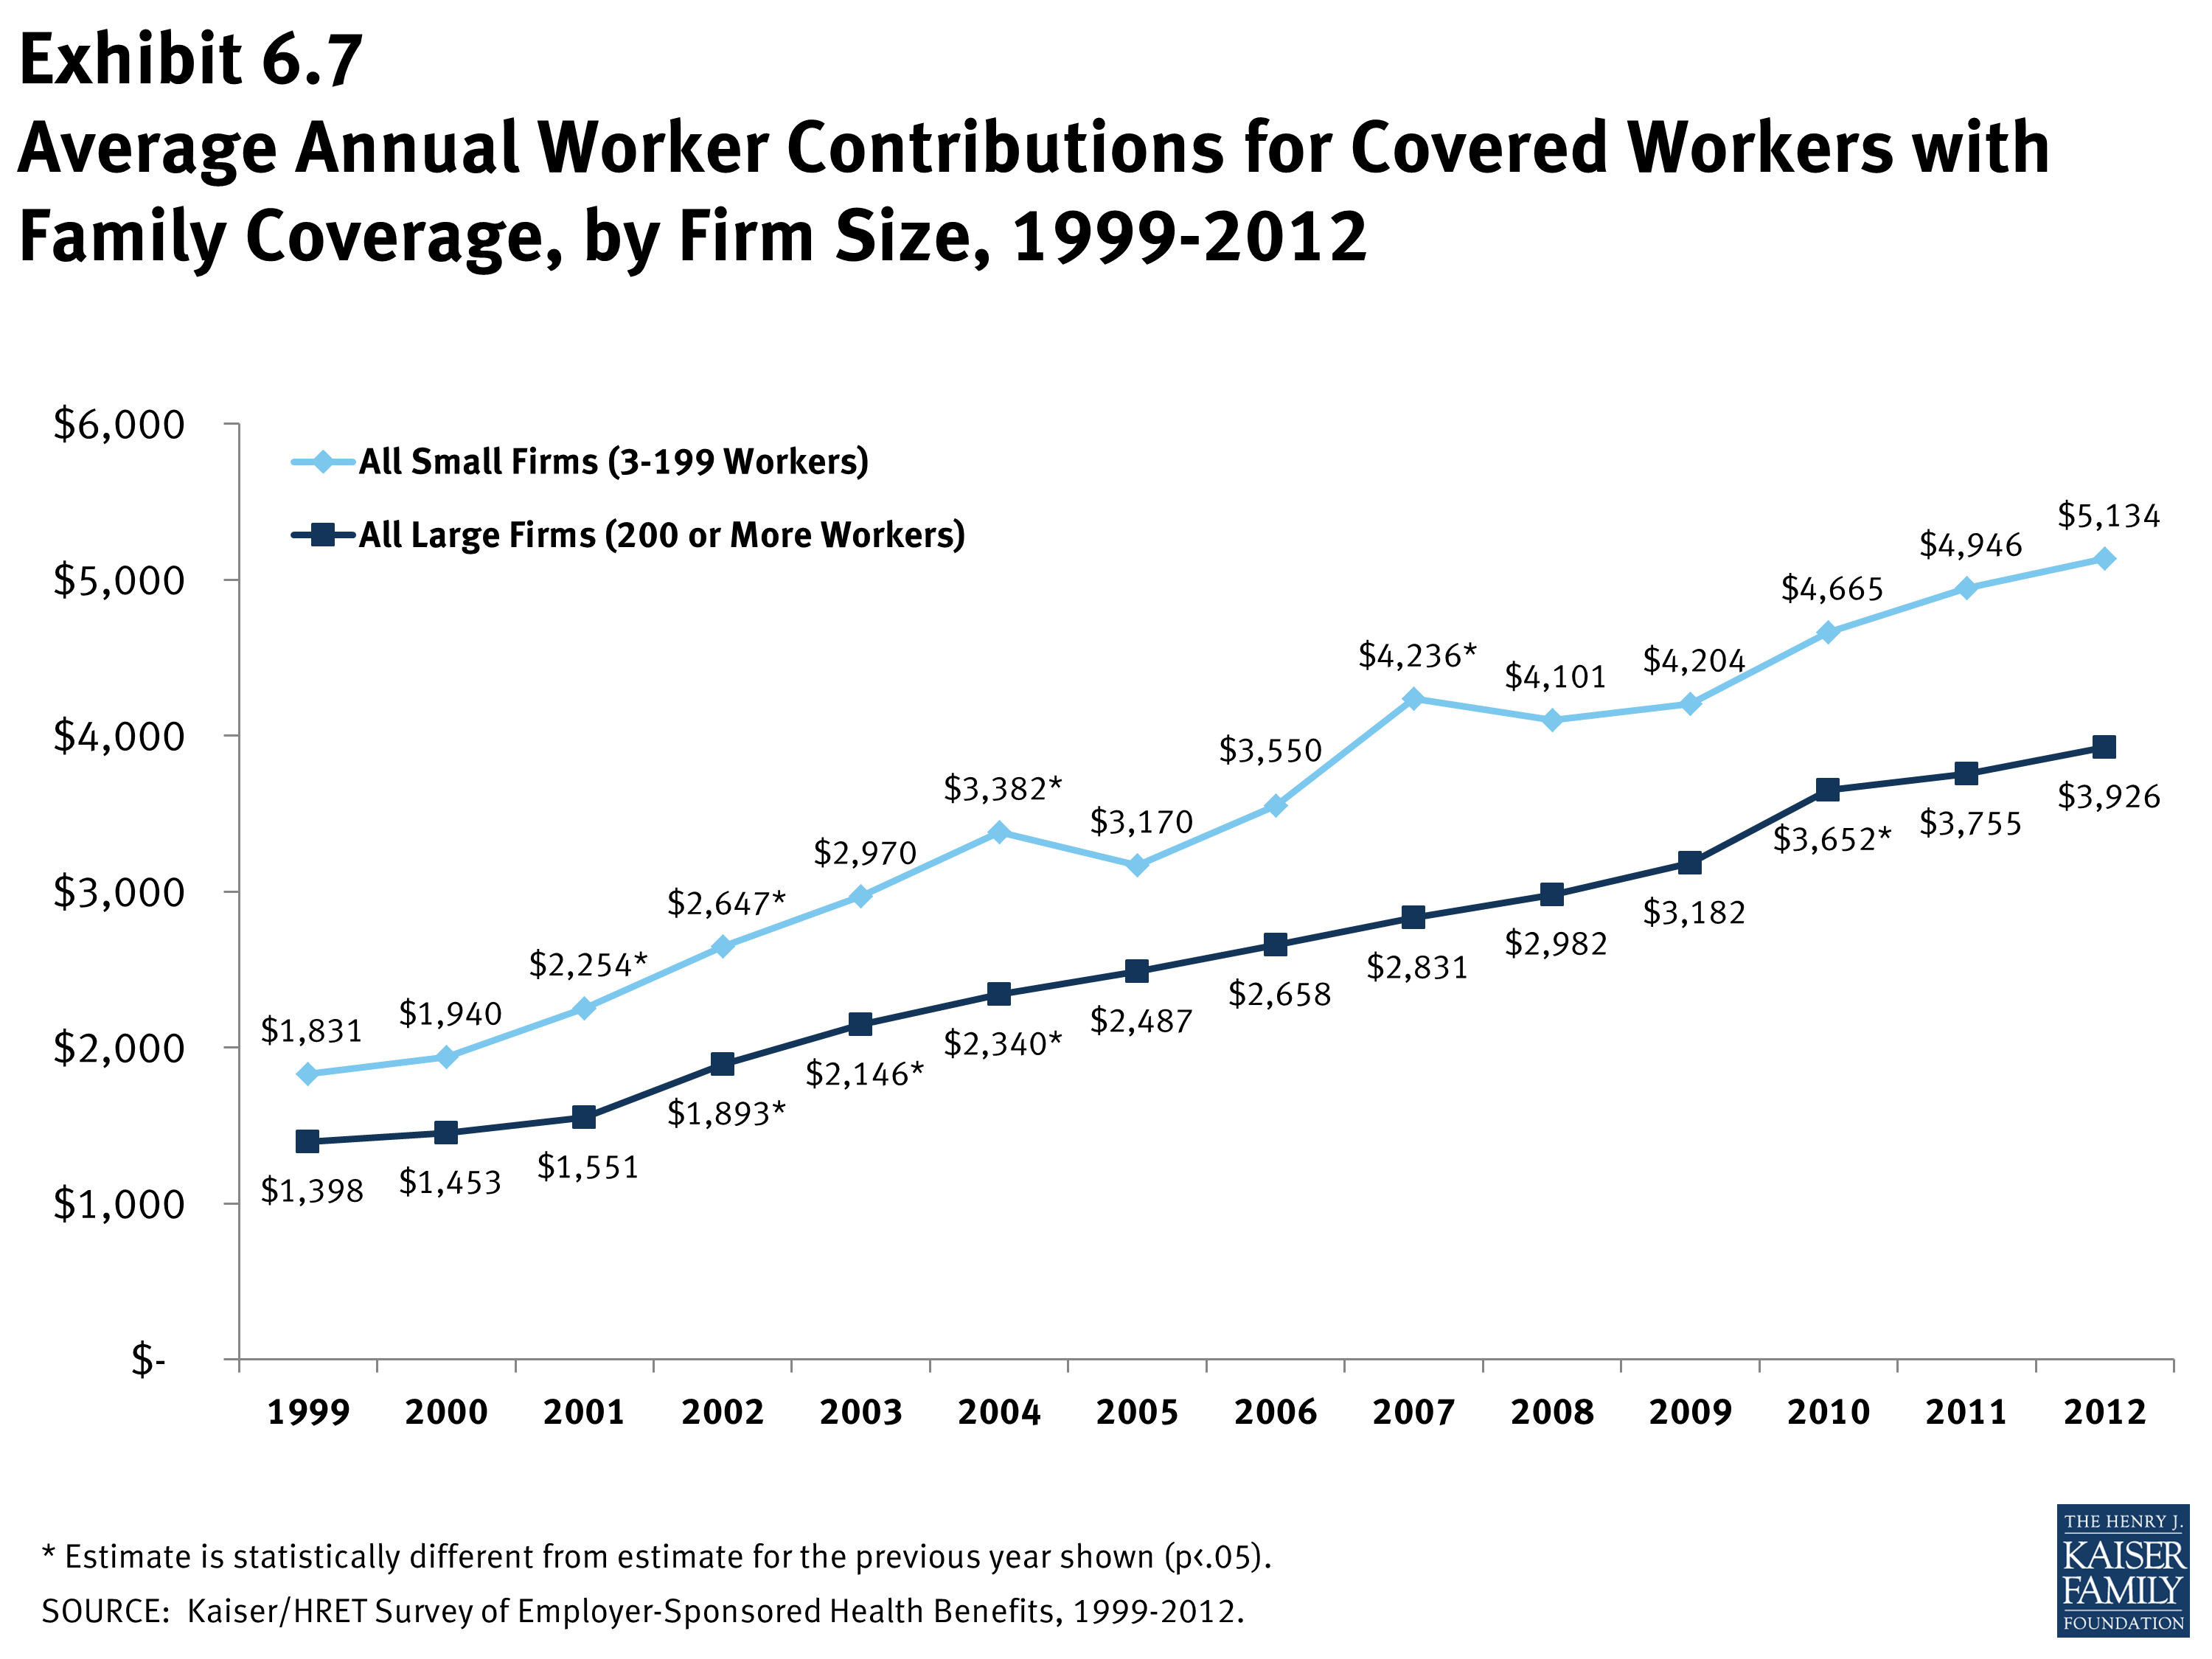
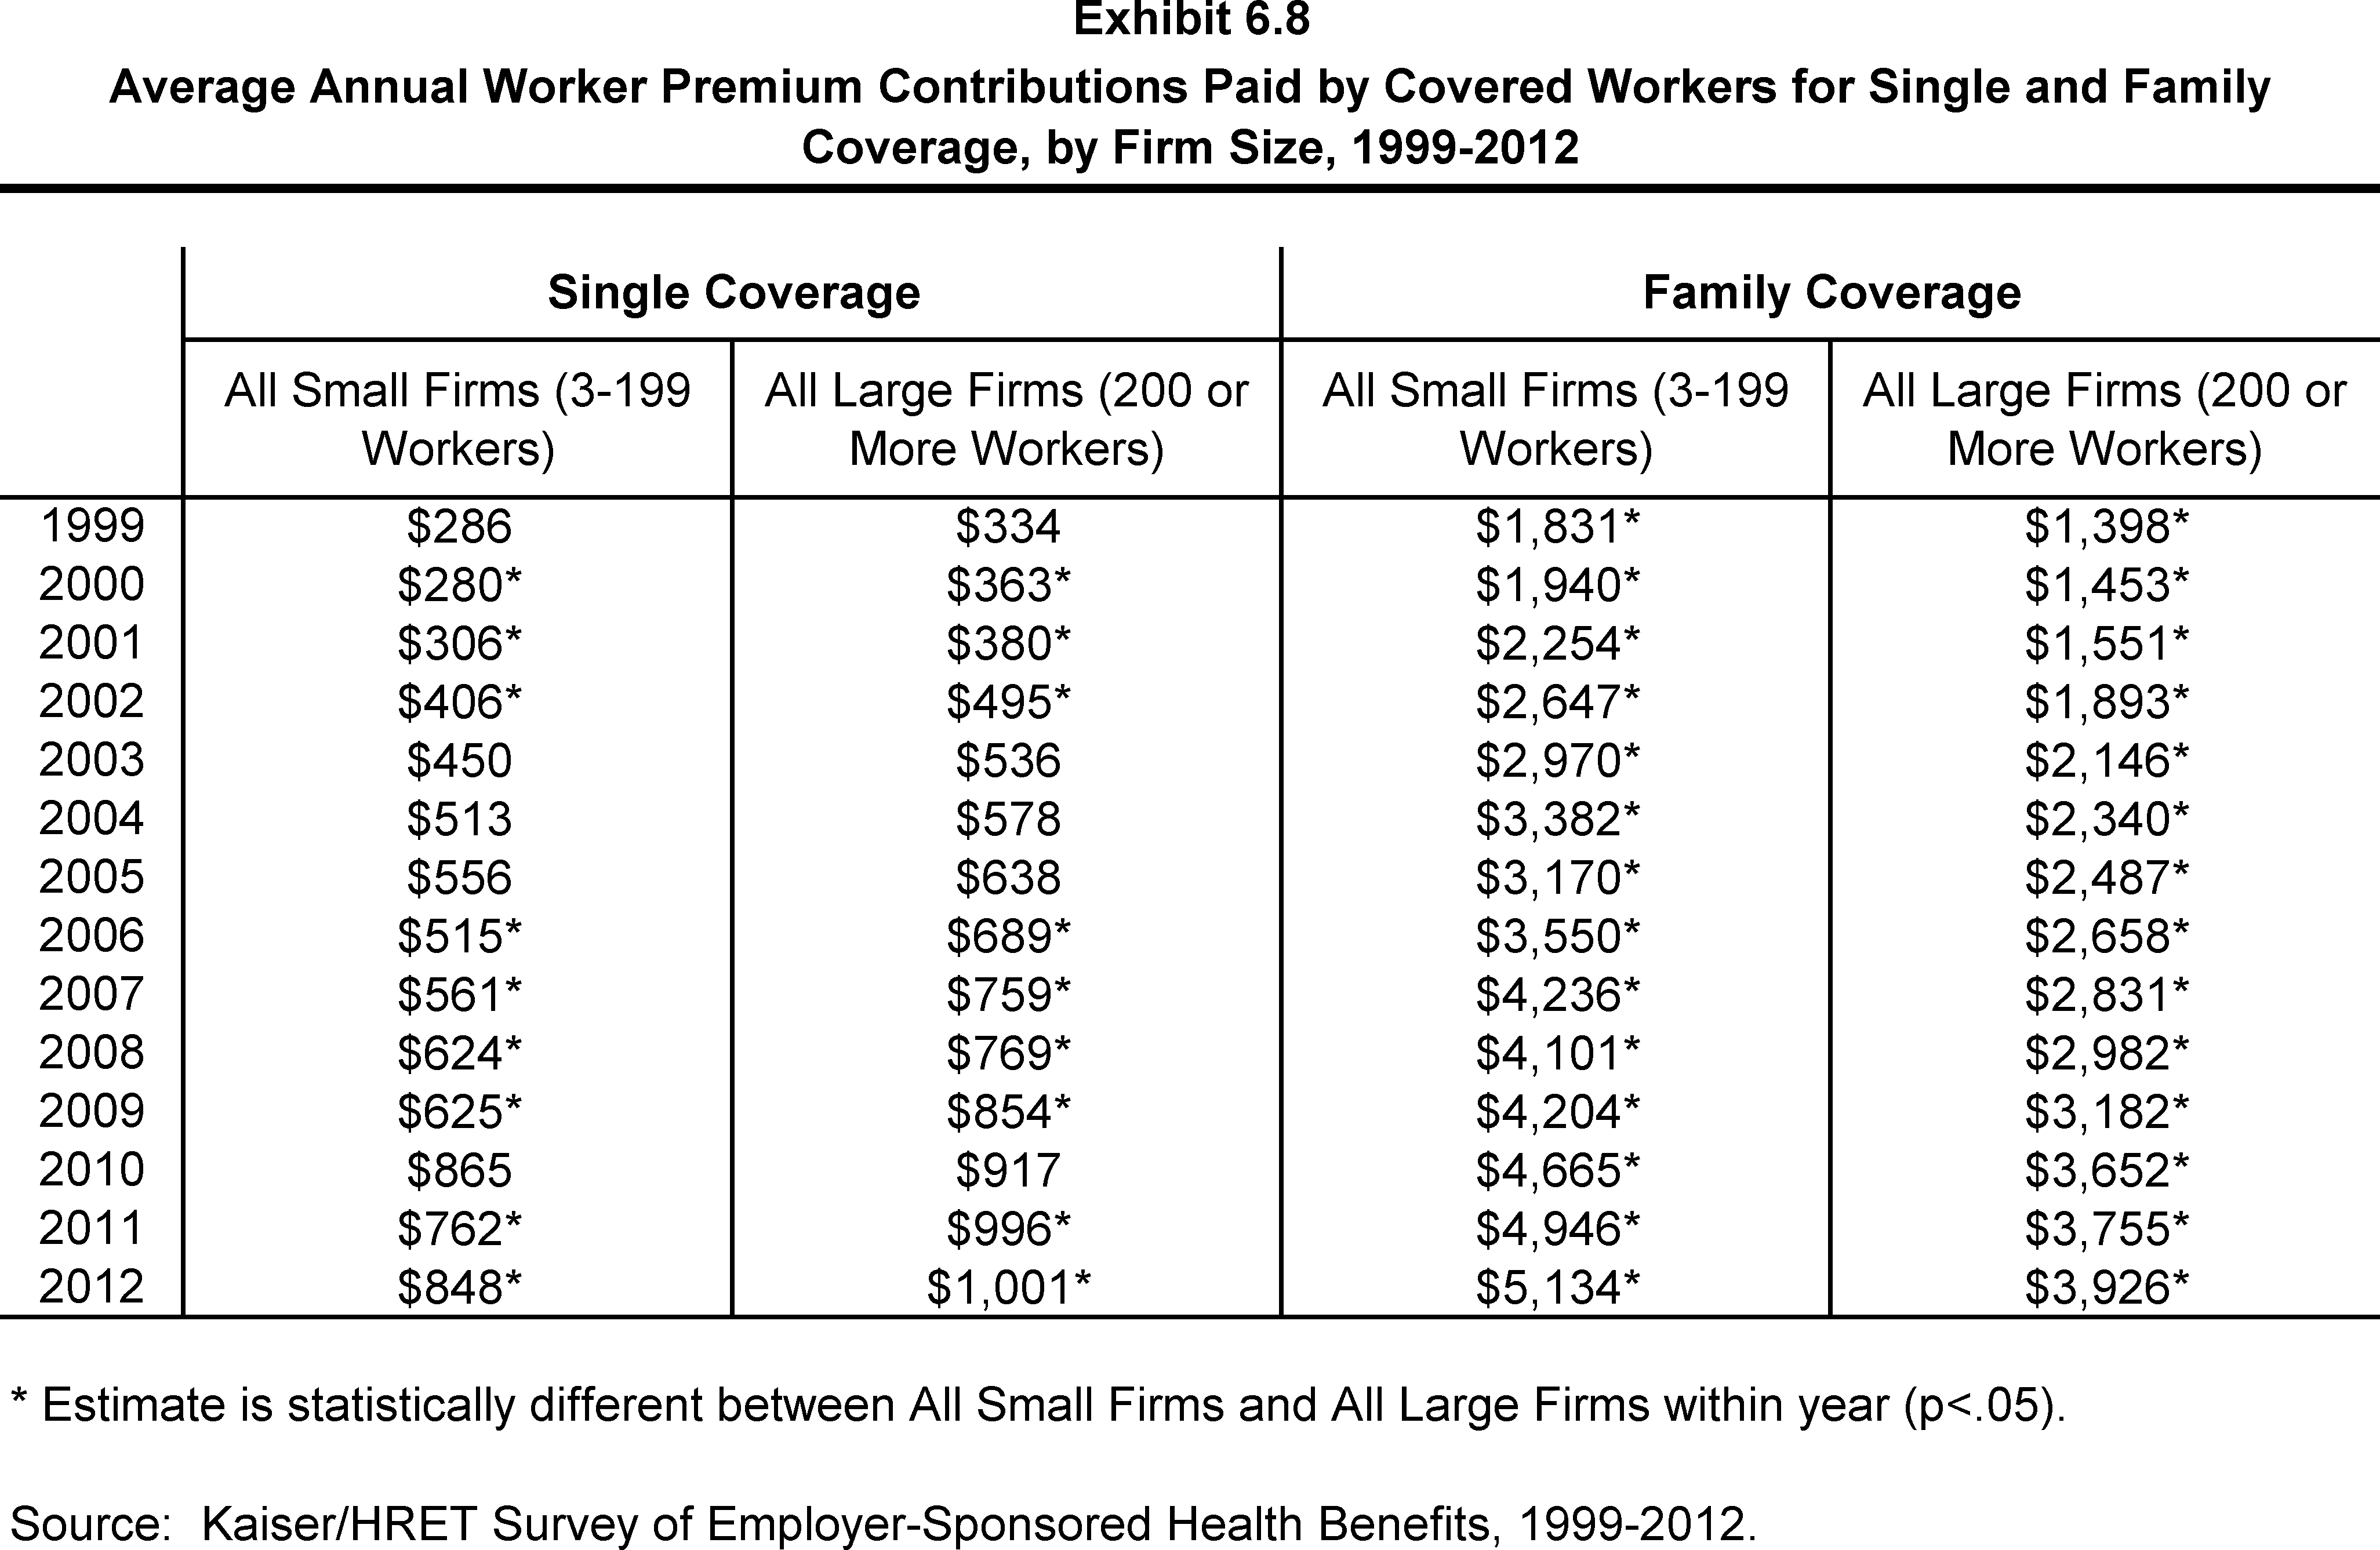
- Workers in small firms (3-199 workers) contribute a lower amount annually for single coverage than workers in large firms (200 or more workers), $848 vs. $1,001. In contrast, workers in small firms with family coverage contribute significantly more annually than workers with family coverage in large firms, ($5,134 vs. $3,926) (Exhibit 6.8).
- There is a great deal of variation in worker contributions to premiums.
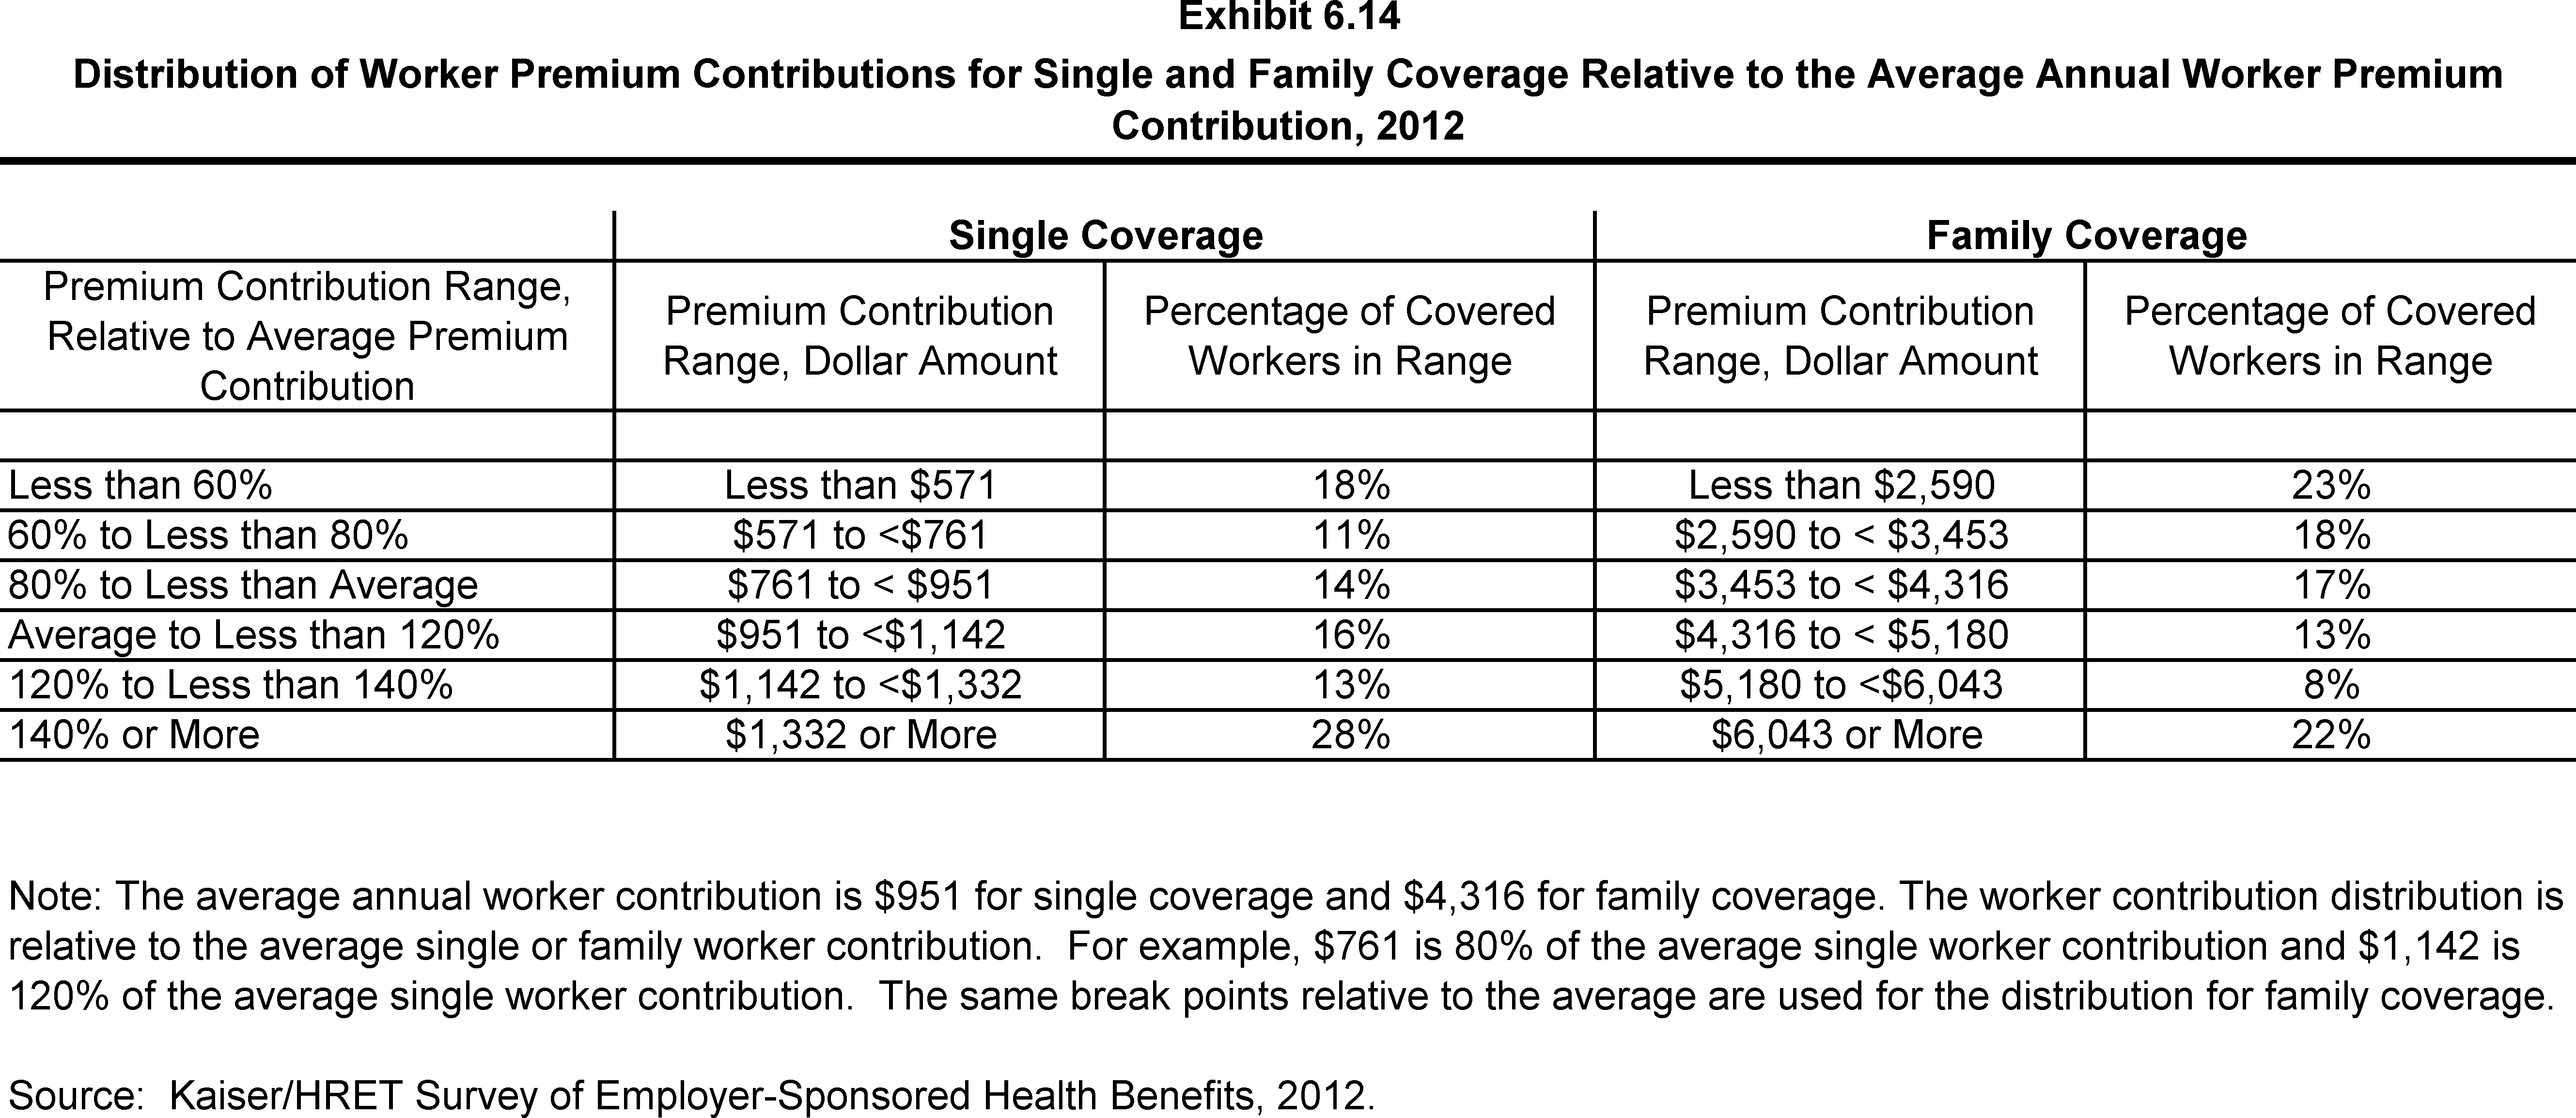
- Twenty-eight percent of covered workers contribute $1,332 or more annually (140% or more of the average worker contribution) for single coverage, while 18% of covered workers have an annual worker contribution of less than $571 less than (60% of the average worker contribution) (Exhibit 6.14).
- For family coverage, 22% of covered workers contribute $6,043 or more annually (140% or more of the average worker contribution), while 23% of covered workers have an annual worker contribution of less than $2,590 (less than 60% of the average worker contribution) (Exhibit 6.14).
- The majority of covered workers are employed by a firm that contributes at least half of the premium.
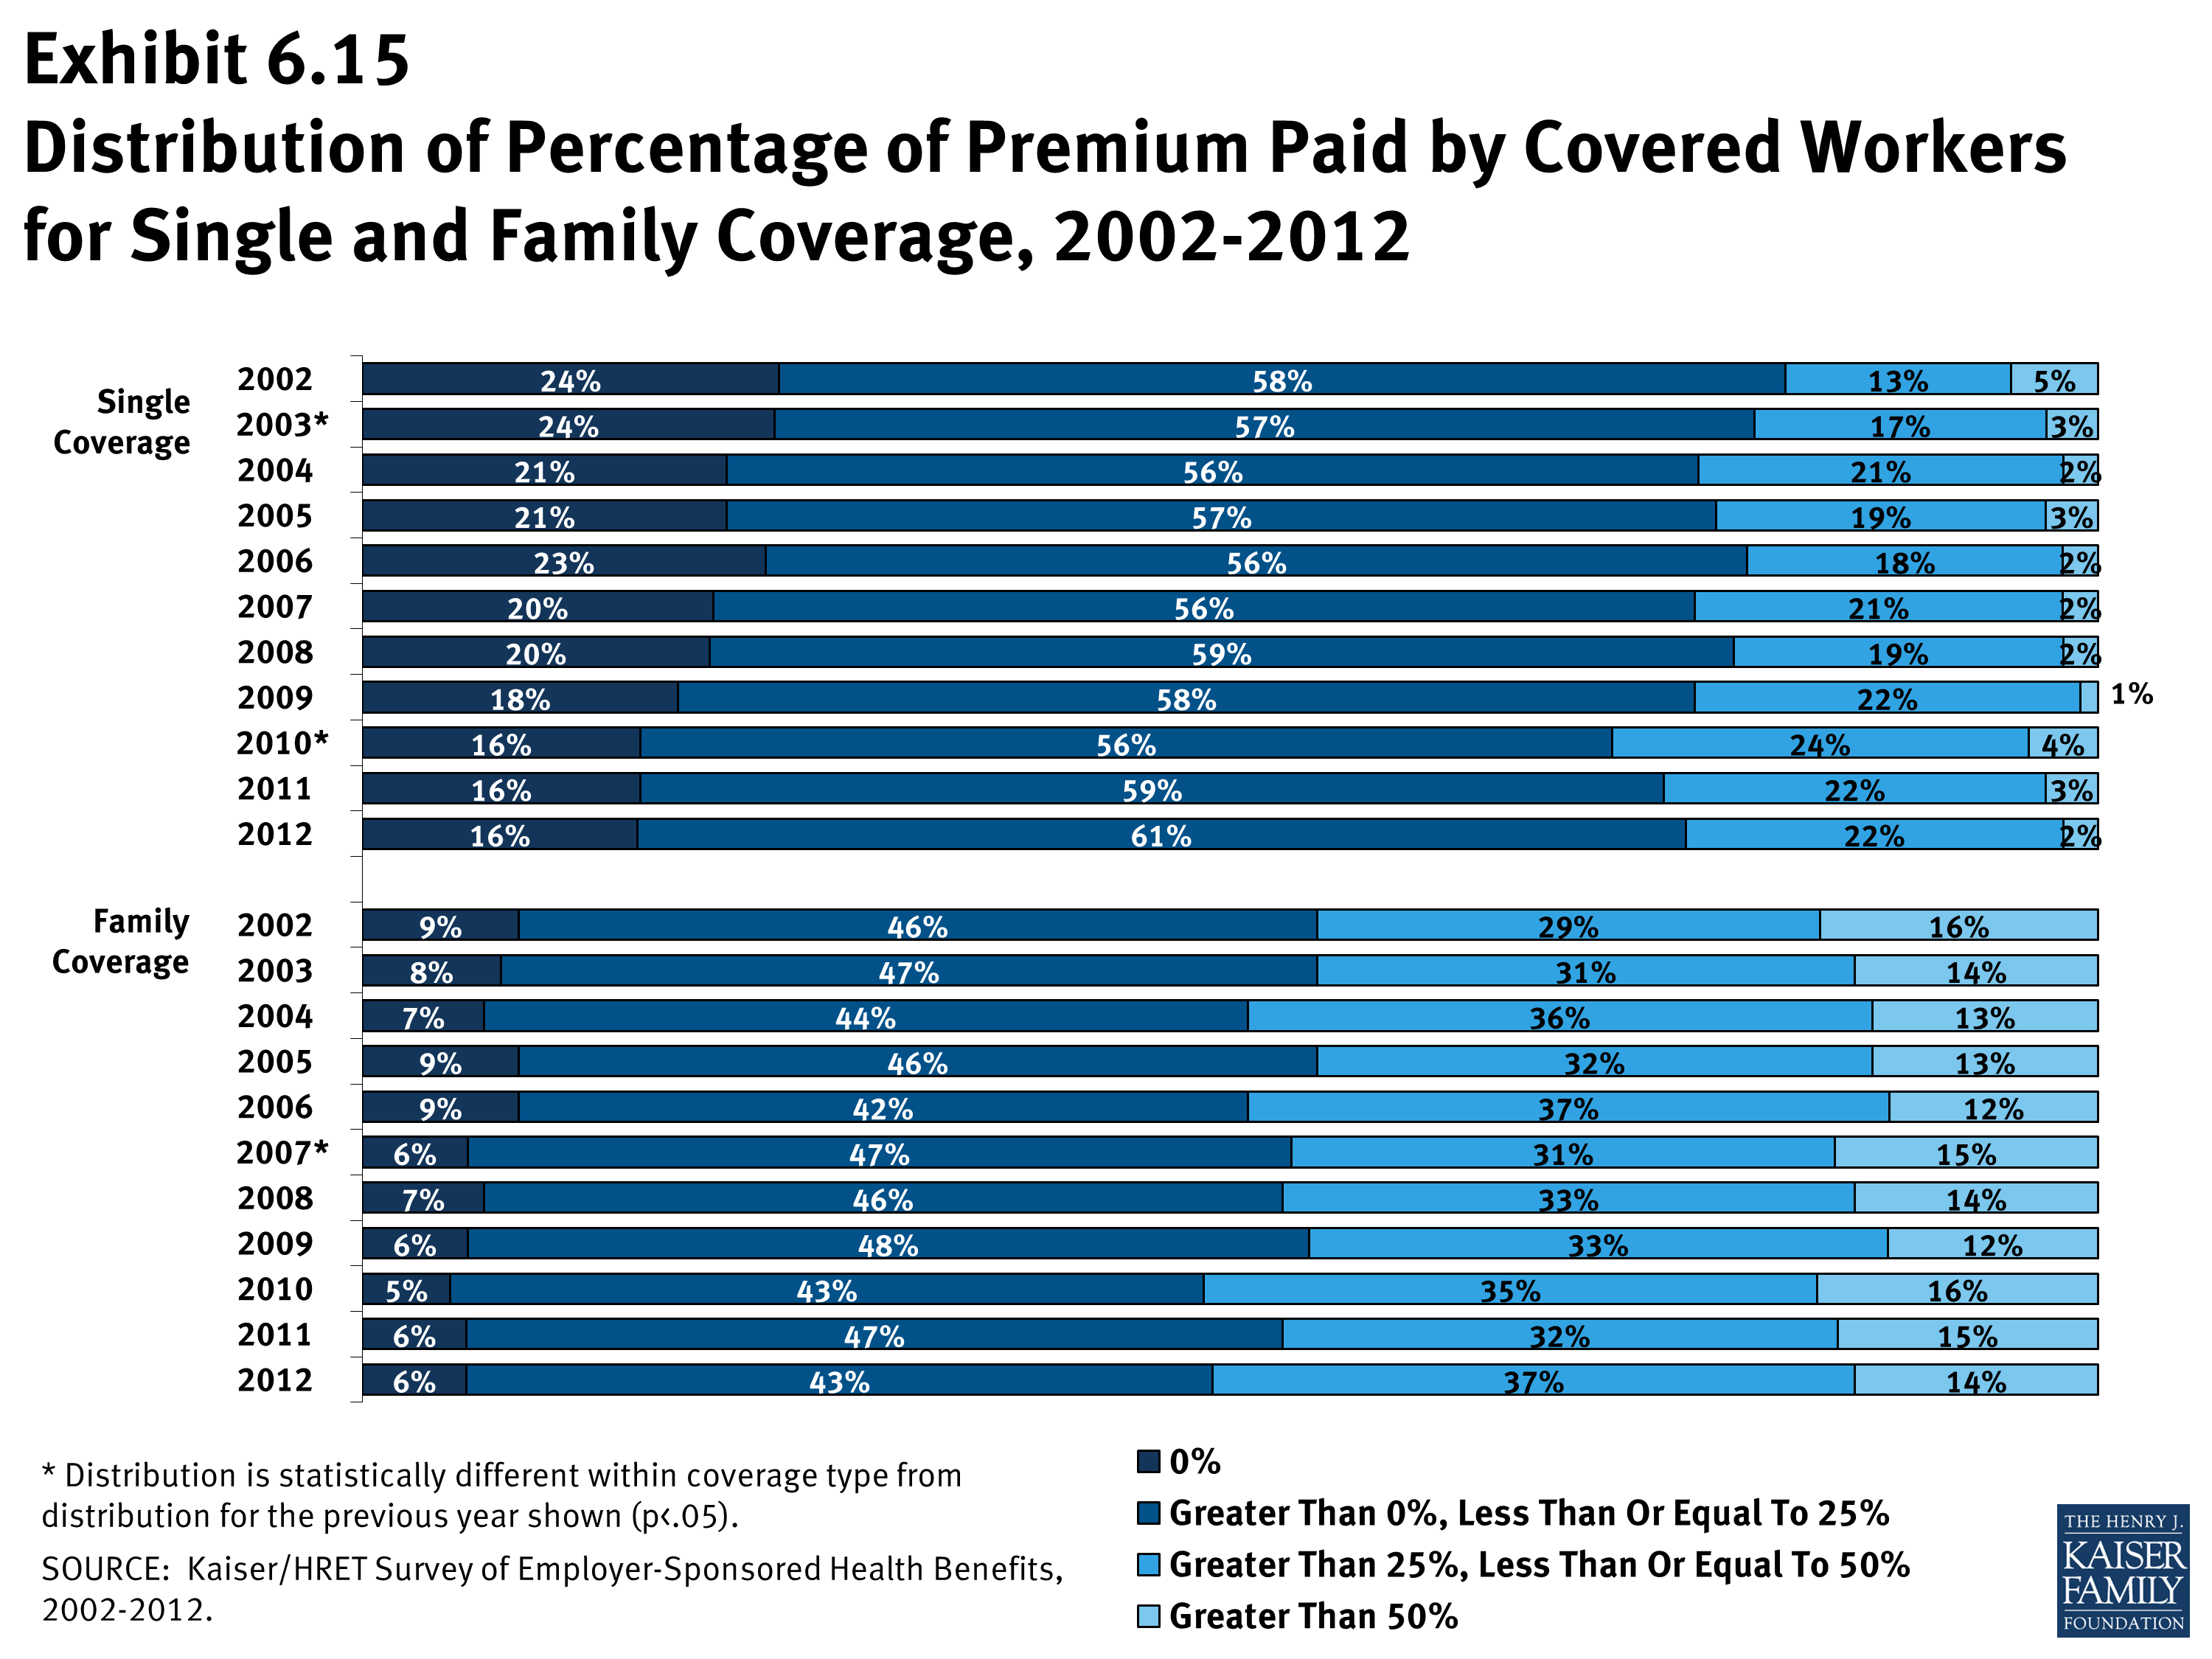
- Sixteen percent of covered workers with single coverage and 6% of covered workers with family coverage work for a firm that pays 100% of the premium (Exhibit 6.15).
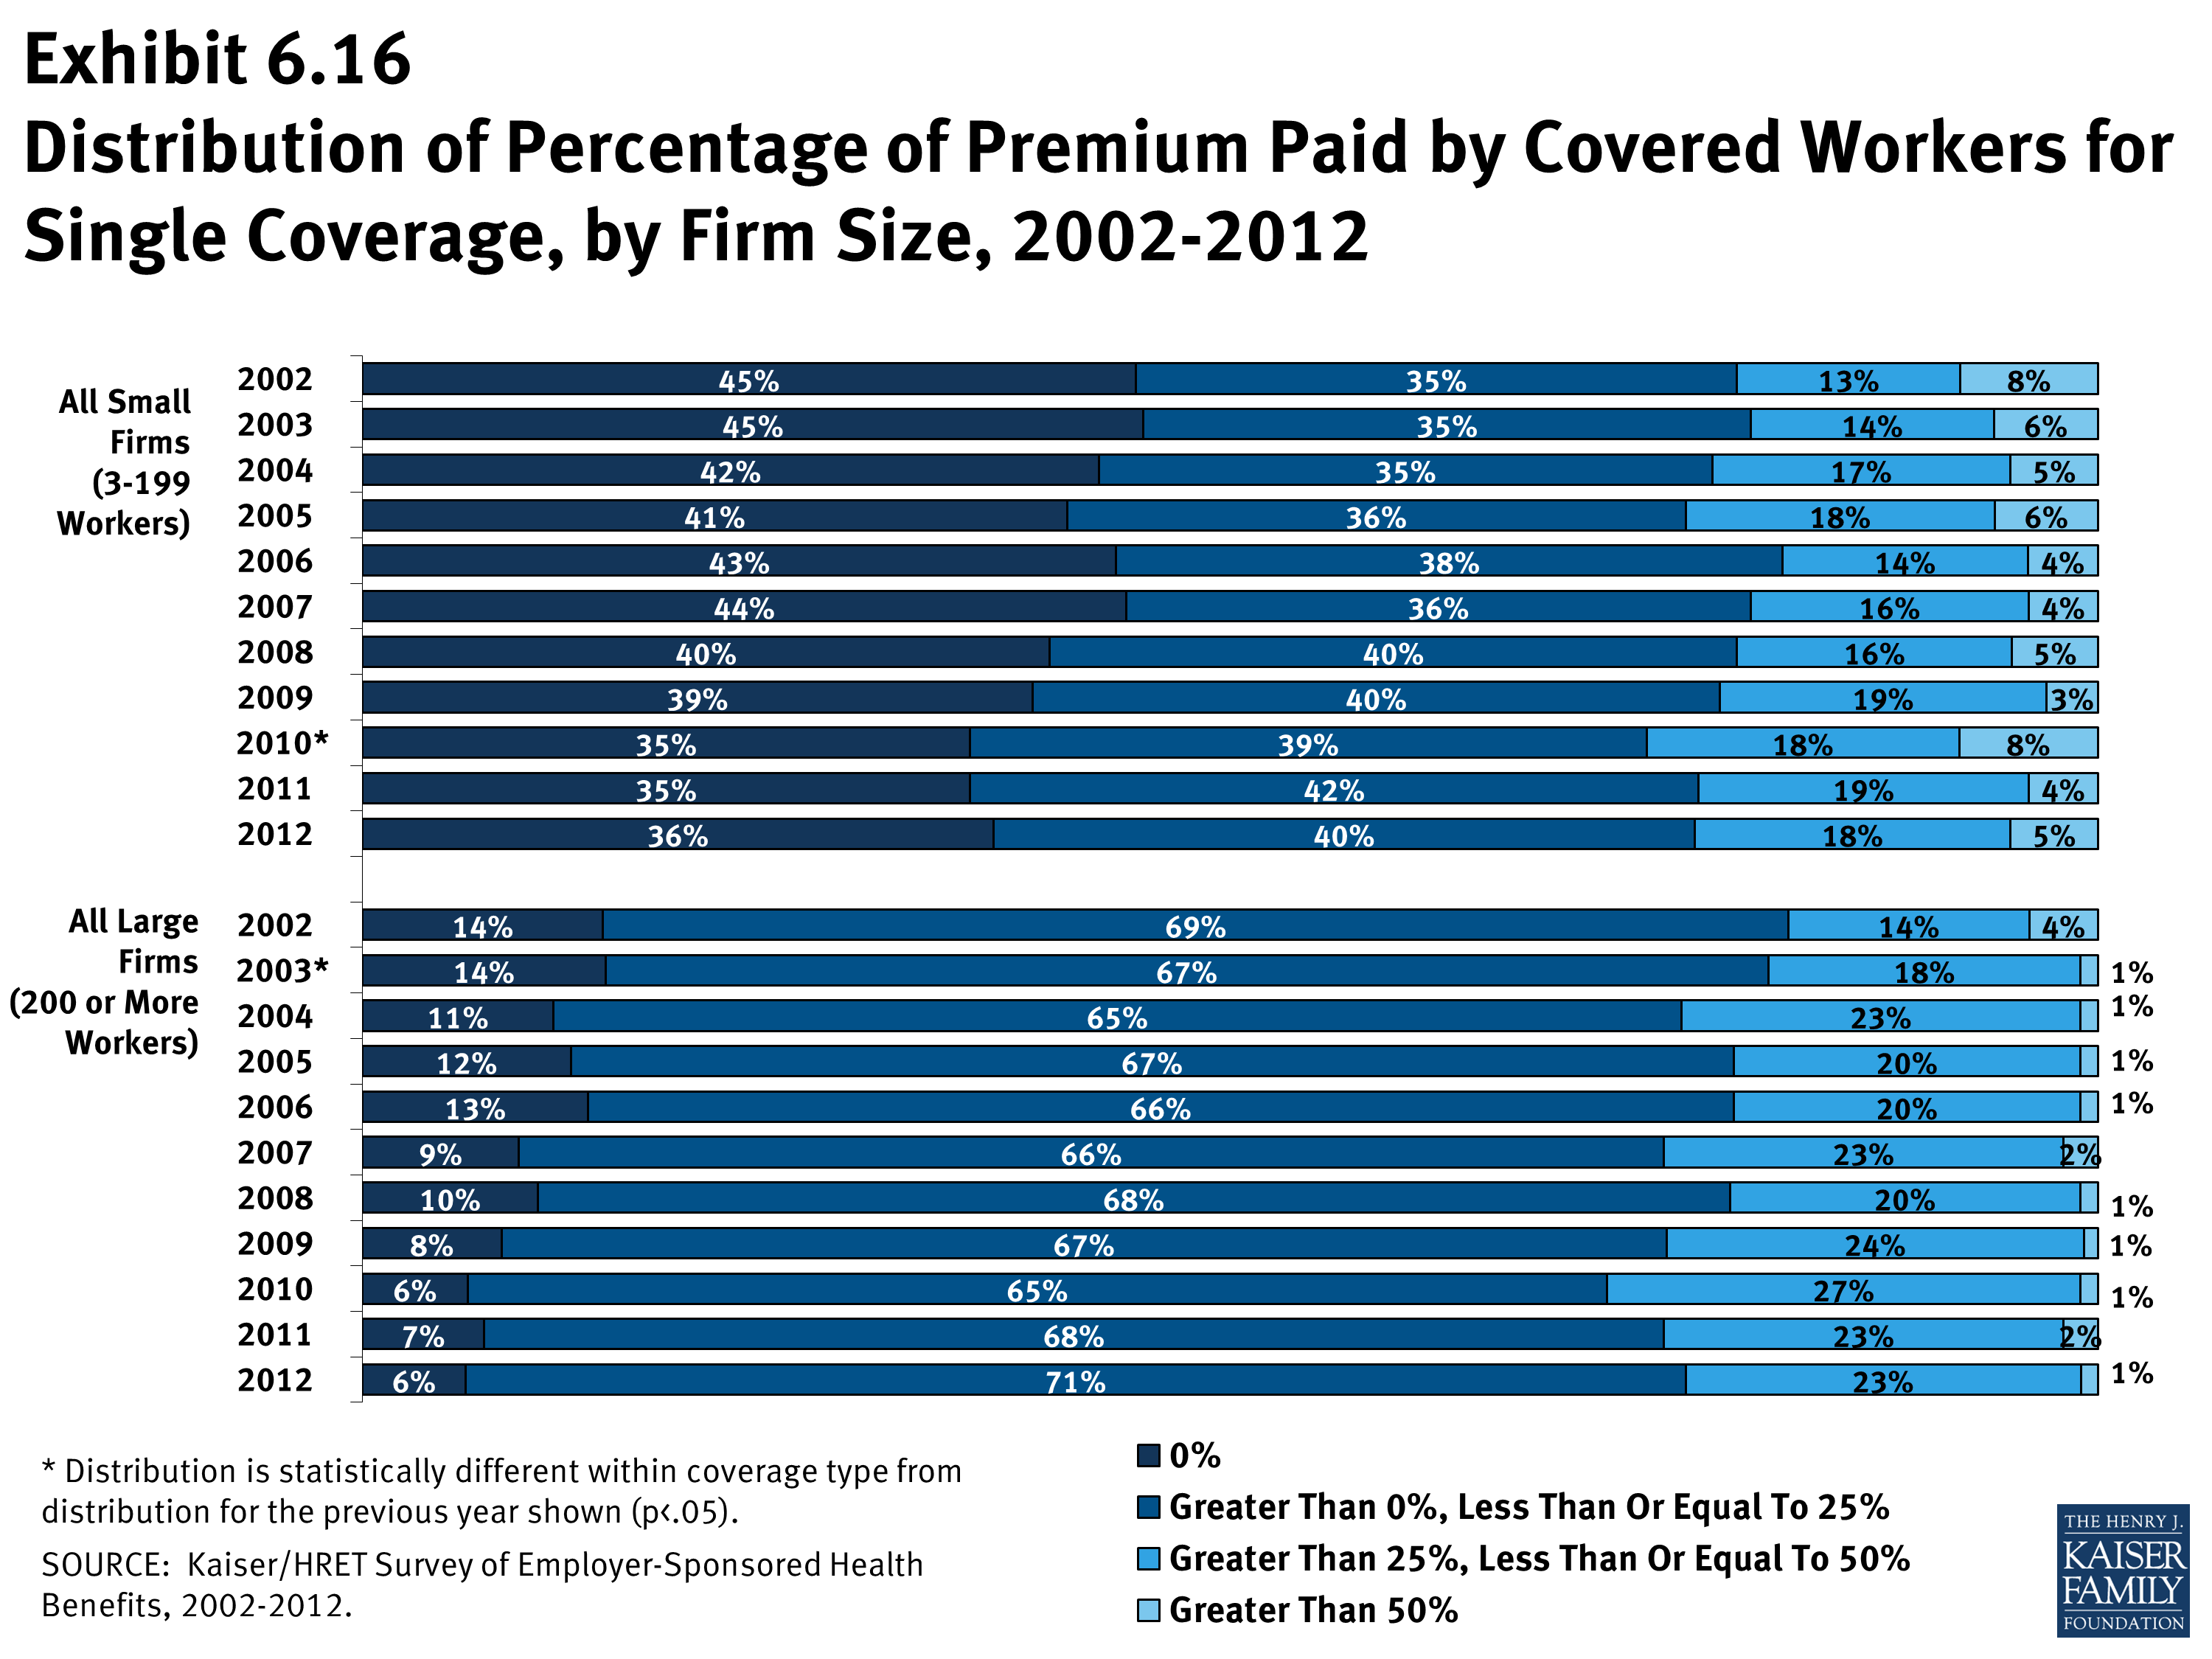
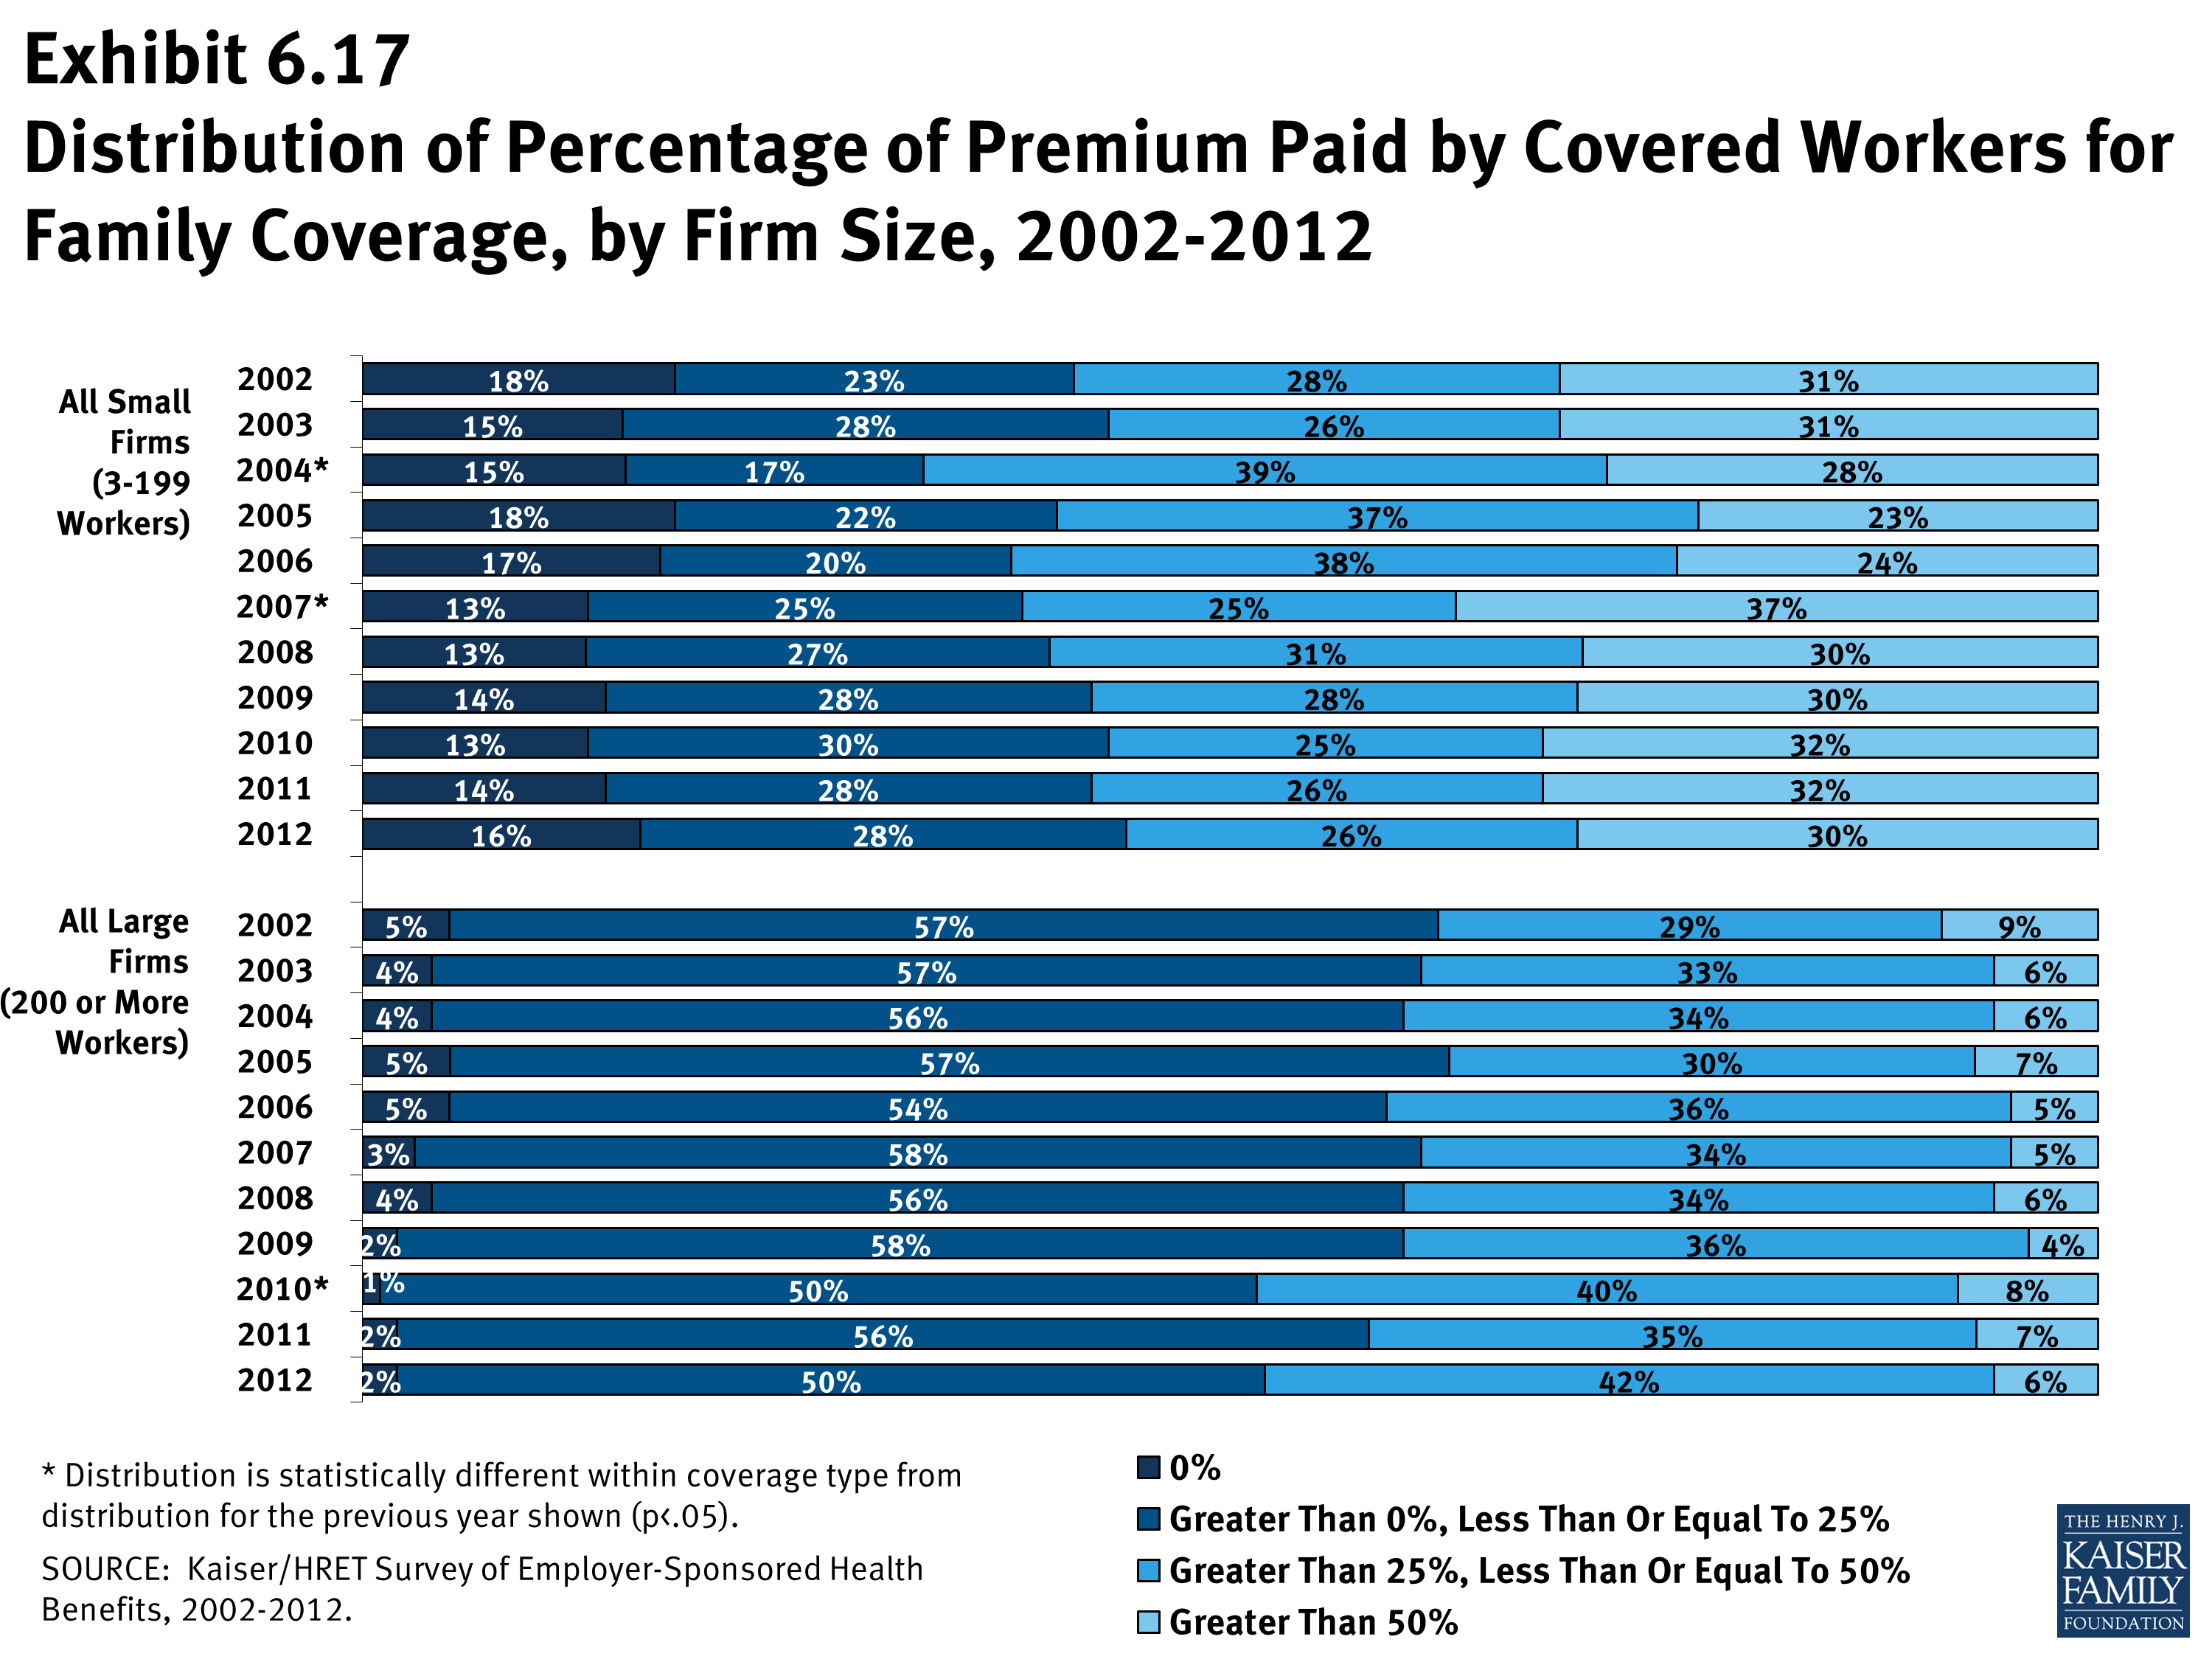
- Covered workers in small firms (3-199 workers) are more likely to work for a firm that pays 100% of the premium than workers in large firms (200 or more workers). Thirty-six percent of covered workers in small firms have an employer that pays the full premium for single coverage, compared to 6% of covered workers in large firms (Exhibit 6.16). For family coverage, 16% percent of covered workers in small firms have an employer that pays the full premium, compared to 2% of covered workers in large firms (Exhibit 6.17).
- Five percent of covered workers in small firms (3-199 workers) contribute more than 50% of the premium for single coverage, compared to 1% of covered workers in large firms (200 or more workers) (Exhibit 6.16). For family coverage, 30% of covered workers in small firms work in a firm where they must contribute more than 50% of the premium, compared to 6% of covered workers in large firms (Exhibit 6.17).
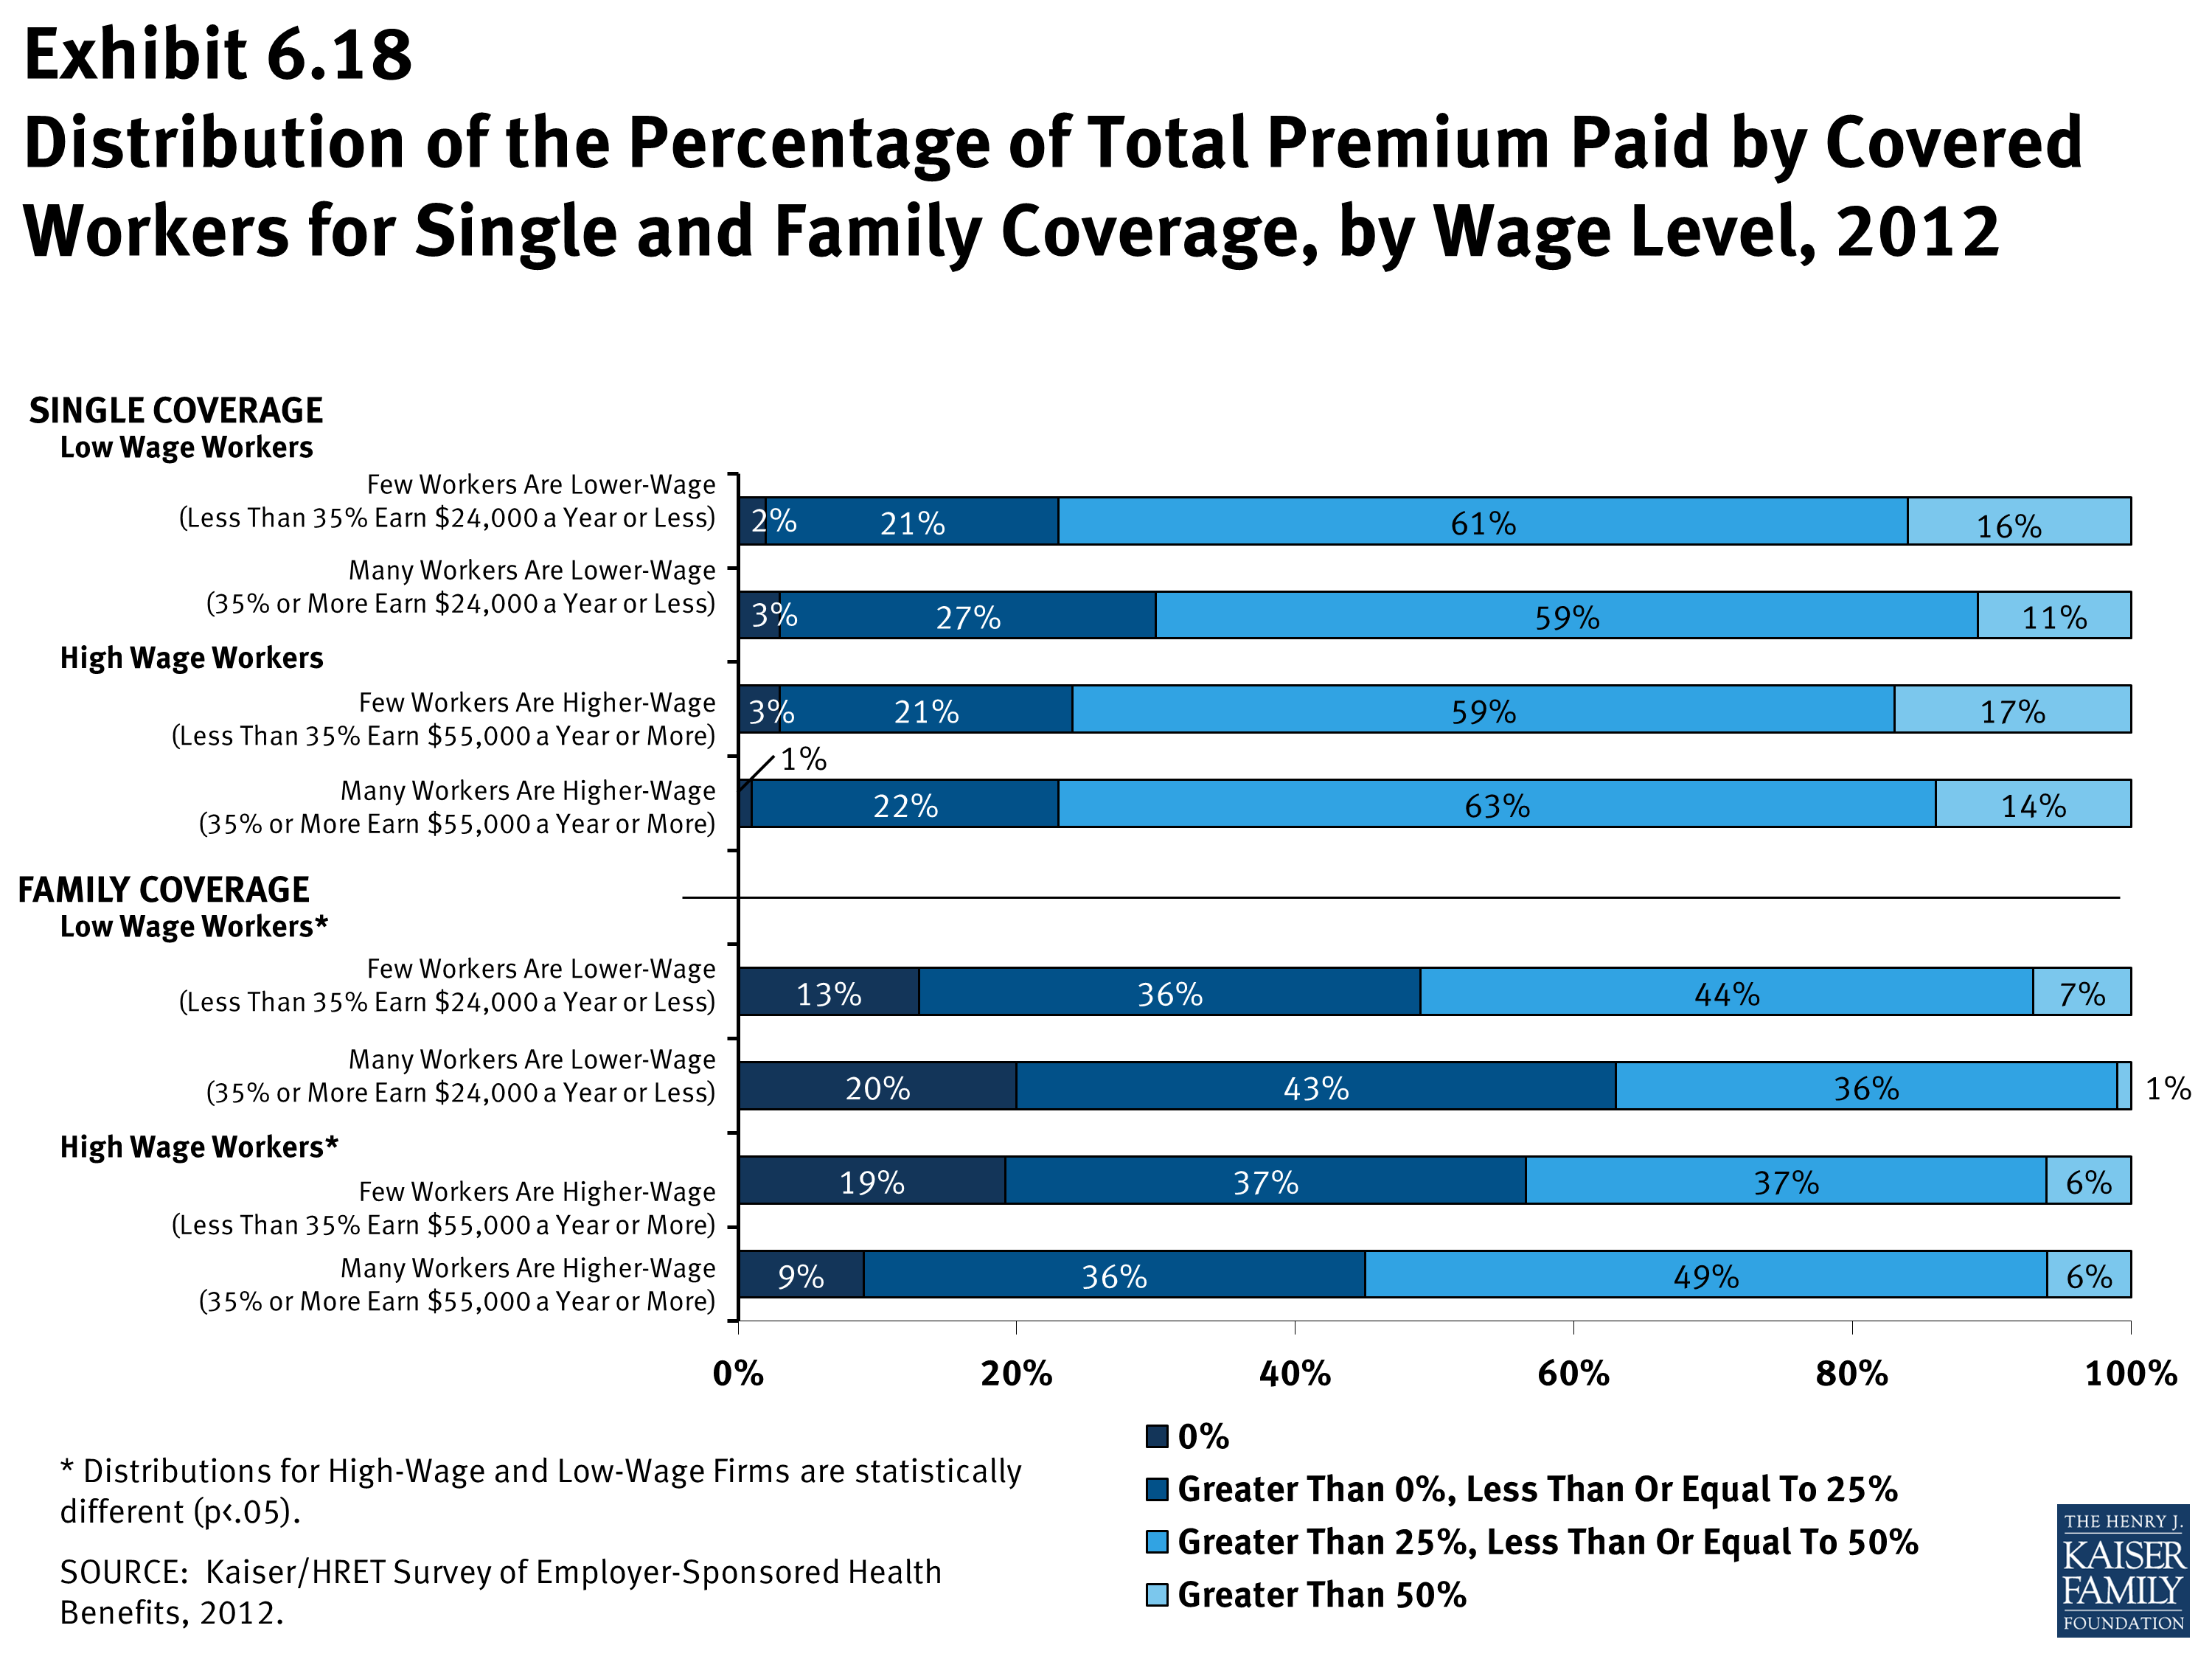
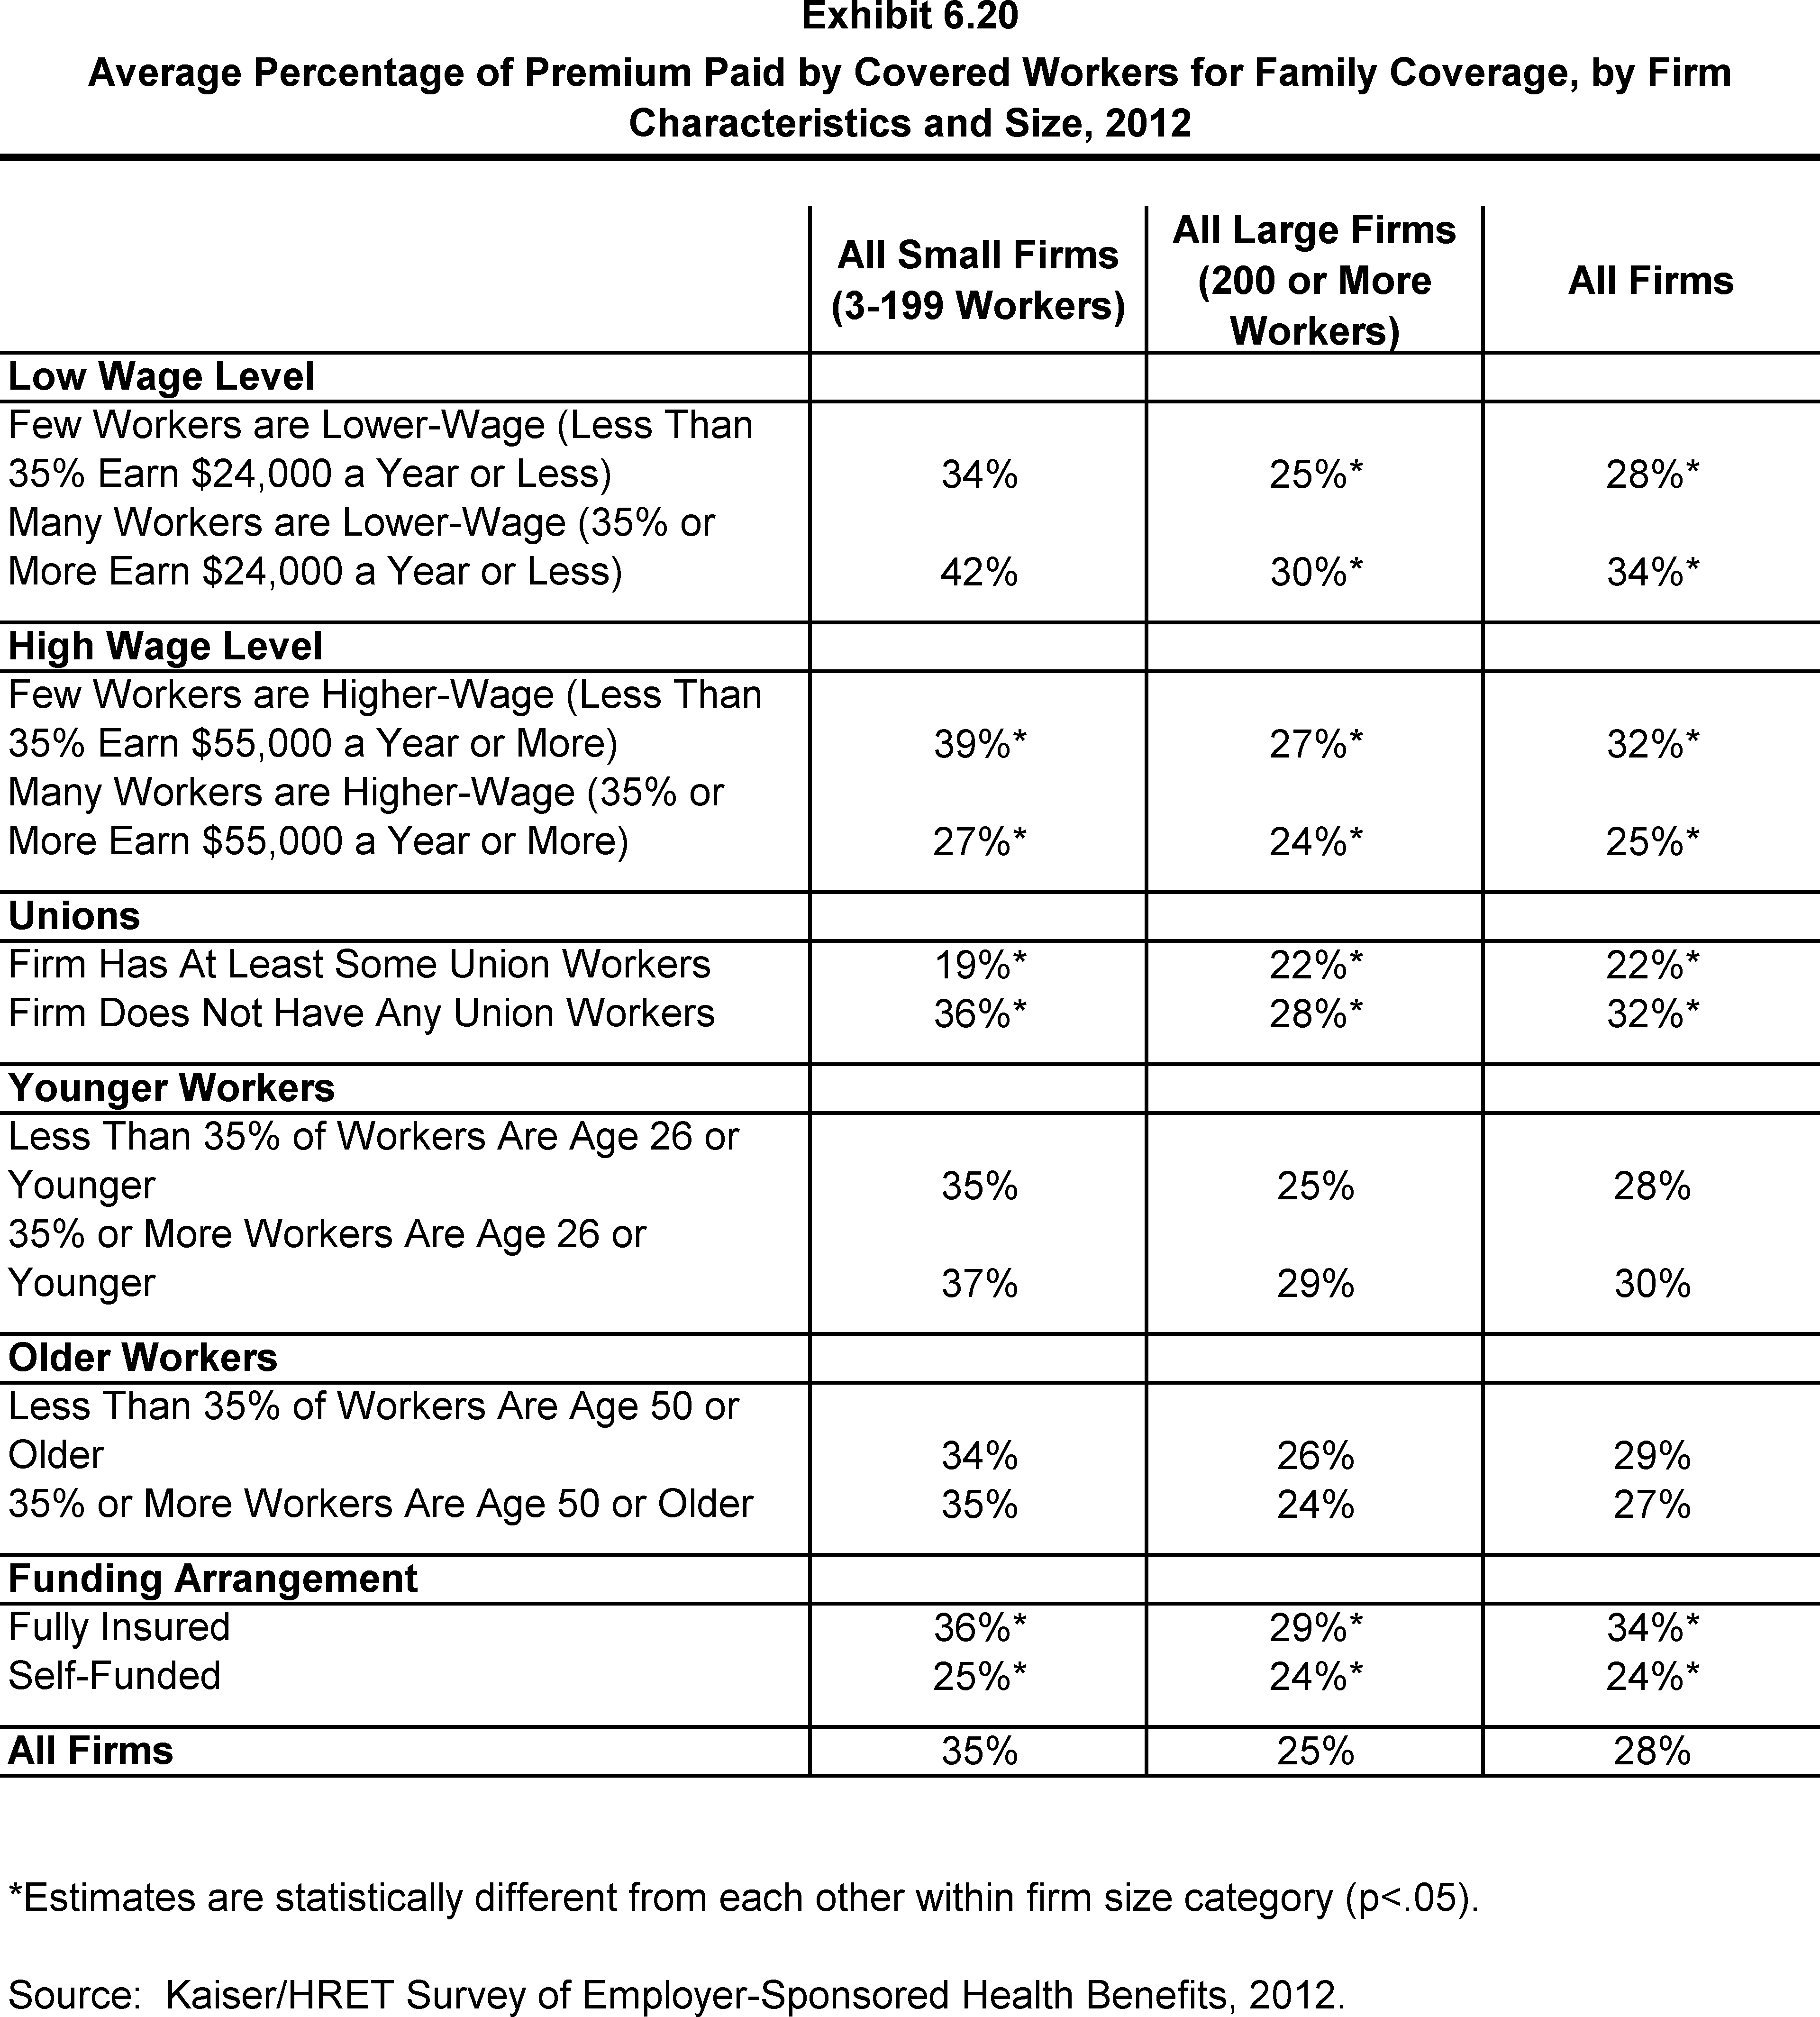
- The percentage of the premium paid by covered workers varies by several firm characteristics.
- For family coverage, workers in firms with many lower-wage workers (35% or more earn $24,000 or less annually) contribute a greater percentage of the premium than those in firms with fewer lower-wage workers (less than 35% earn $24,000 or less annually) (34% vs. 28%) (Exhibit 6.20).
- Workers with family coverage in firms that have at least some union workers contribute a significantly lower percentage of the premium than those in firms without any union workers (22% vs. 32%) (Exhibit 6.20).
- For workers with family coverage in large firms (200 or more workers), the average percentage contribution for workers in firms that are partially or completely self-funded is lower than the average percentage contributions for workers in firms that are fully insured (24% vs. 29%) 2 (Exhibit 6.20).
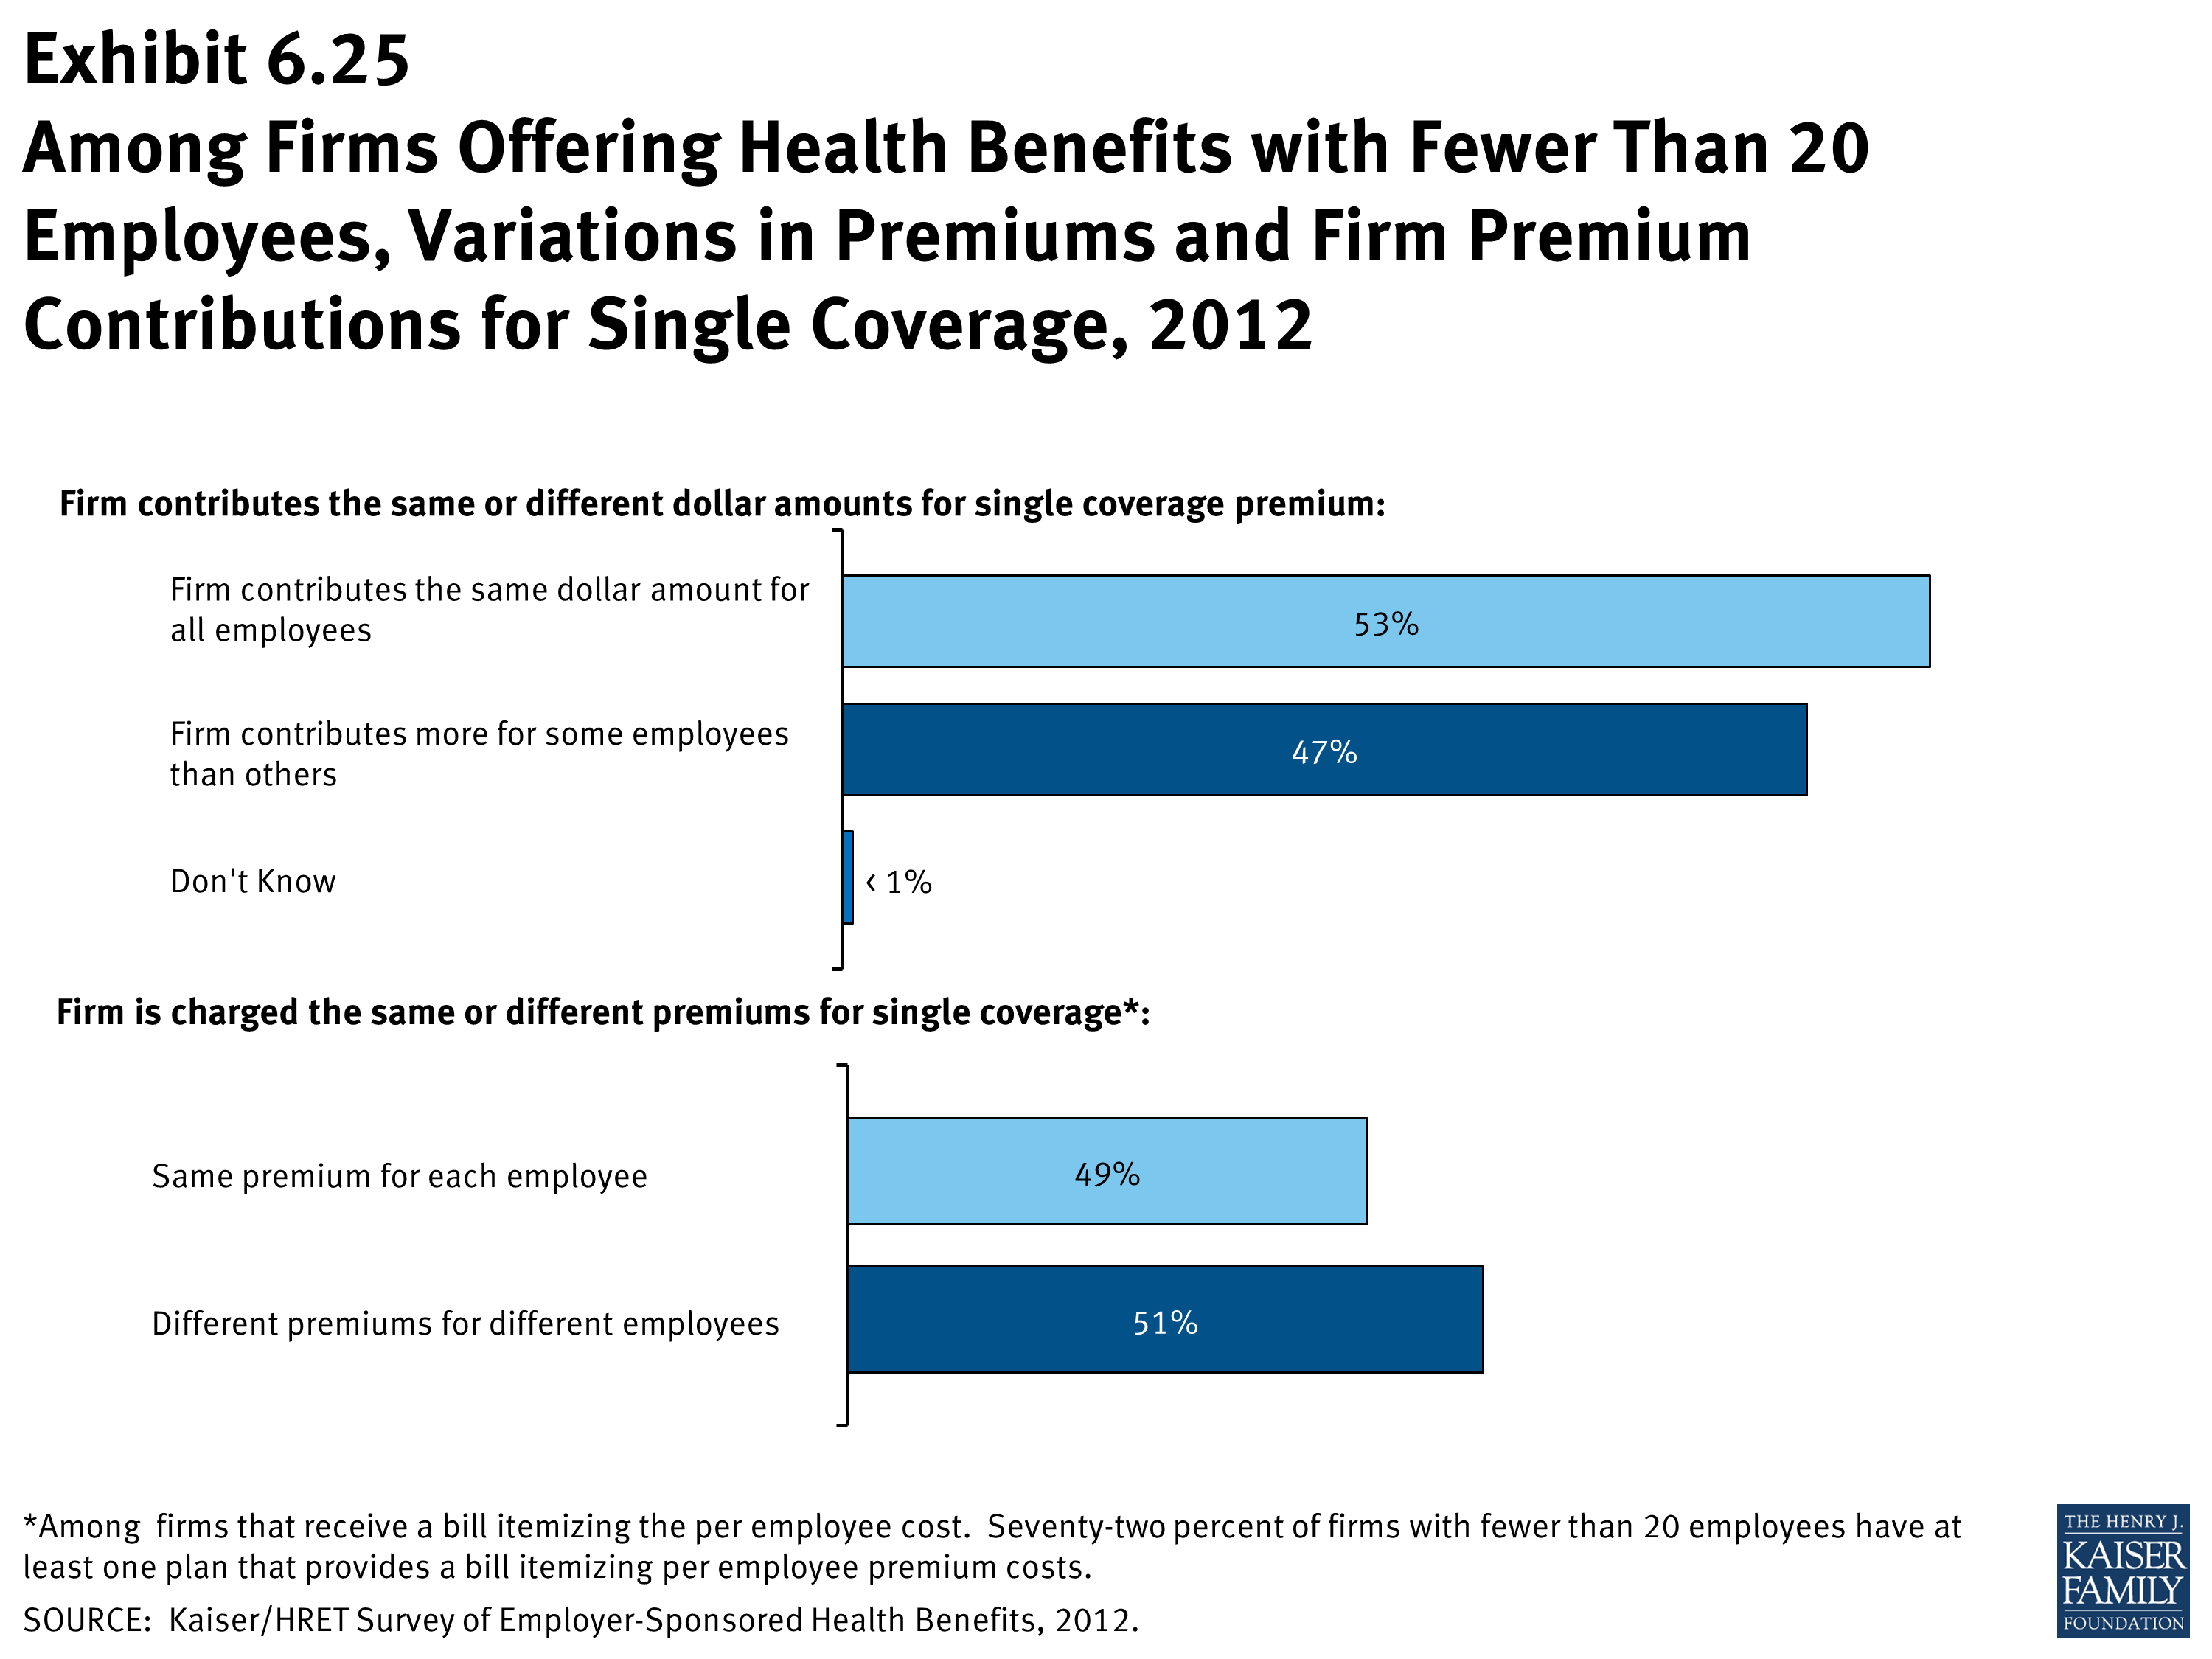
- Among firms offering health benefits with fewer than 20 employees nearly half (47%) contribute different dollar amounts toward premiums for different employees (Exhibit 6.25).
- Among firms offering health benefits with fewer than 20 employees, 72% have at least one plan that provides a bill itemizing per employee premium costs. Of these firms, 51% report being charged a different premium amount for different employees (Exhibit 6.25).
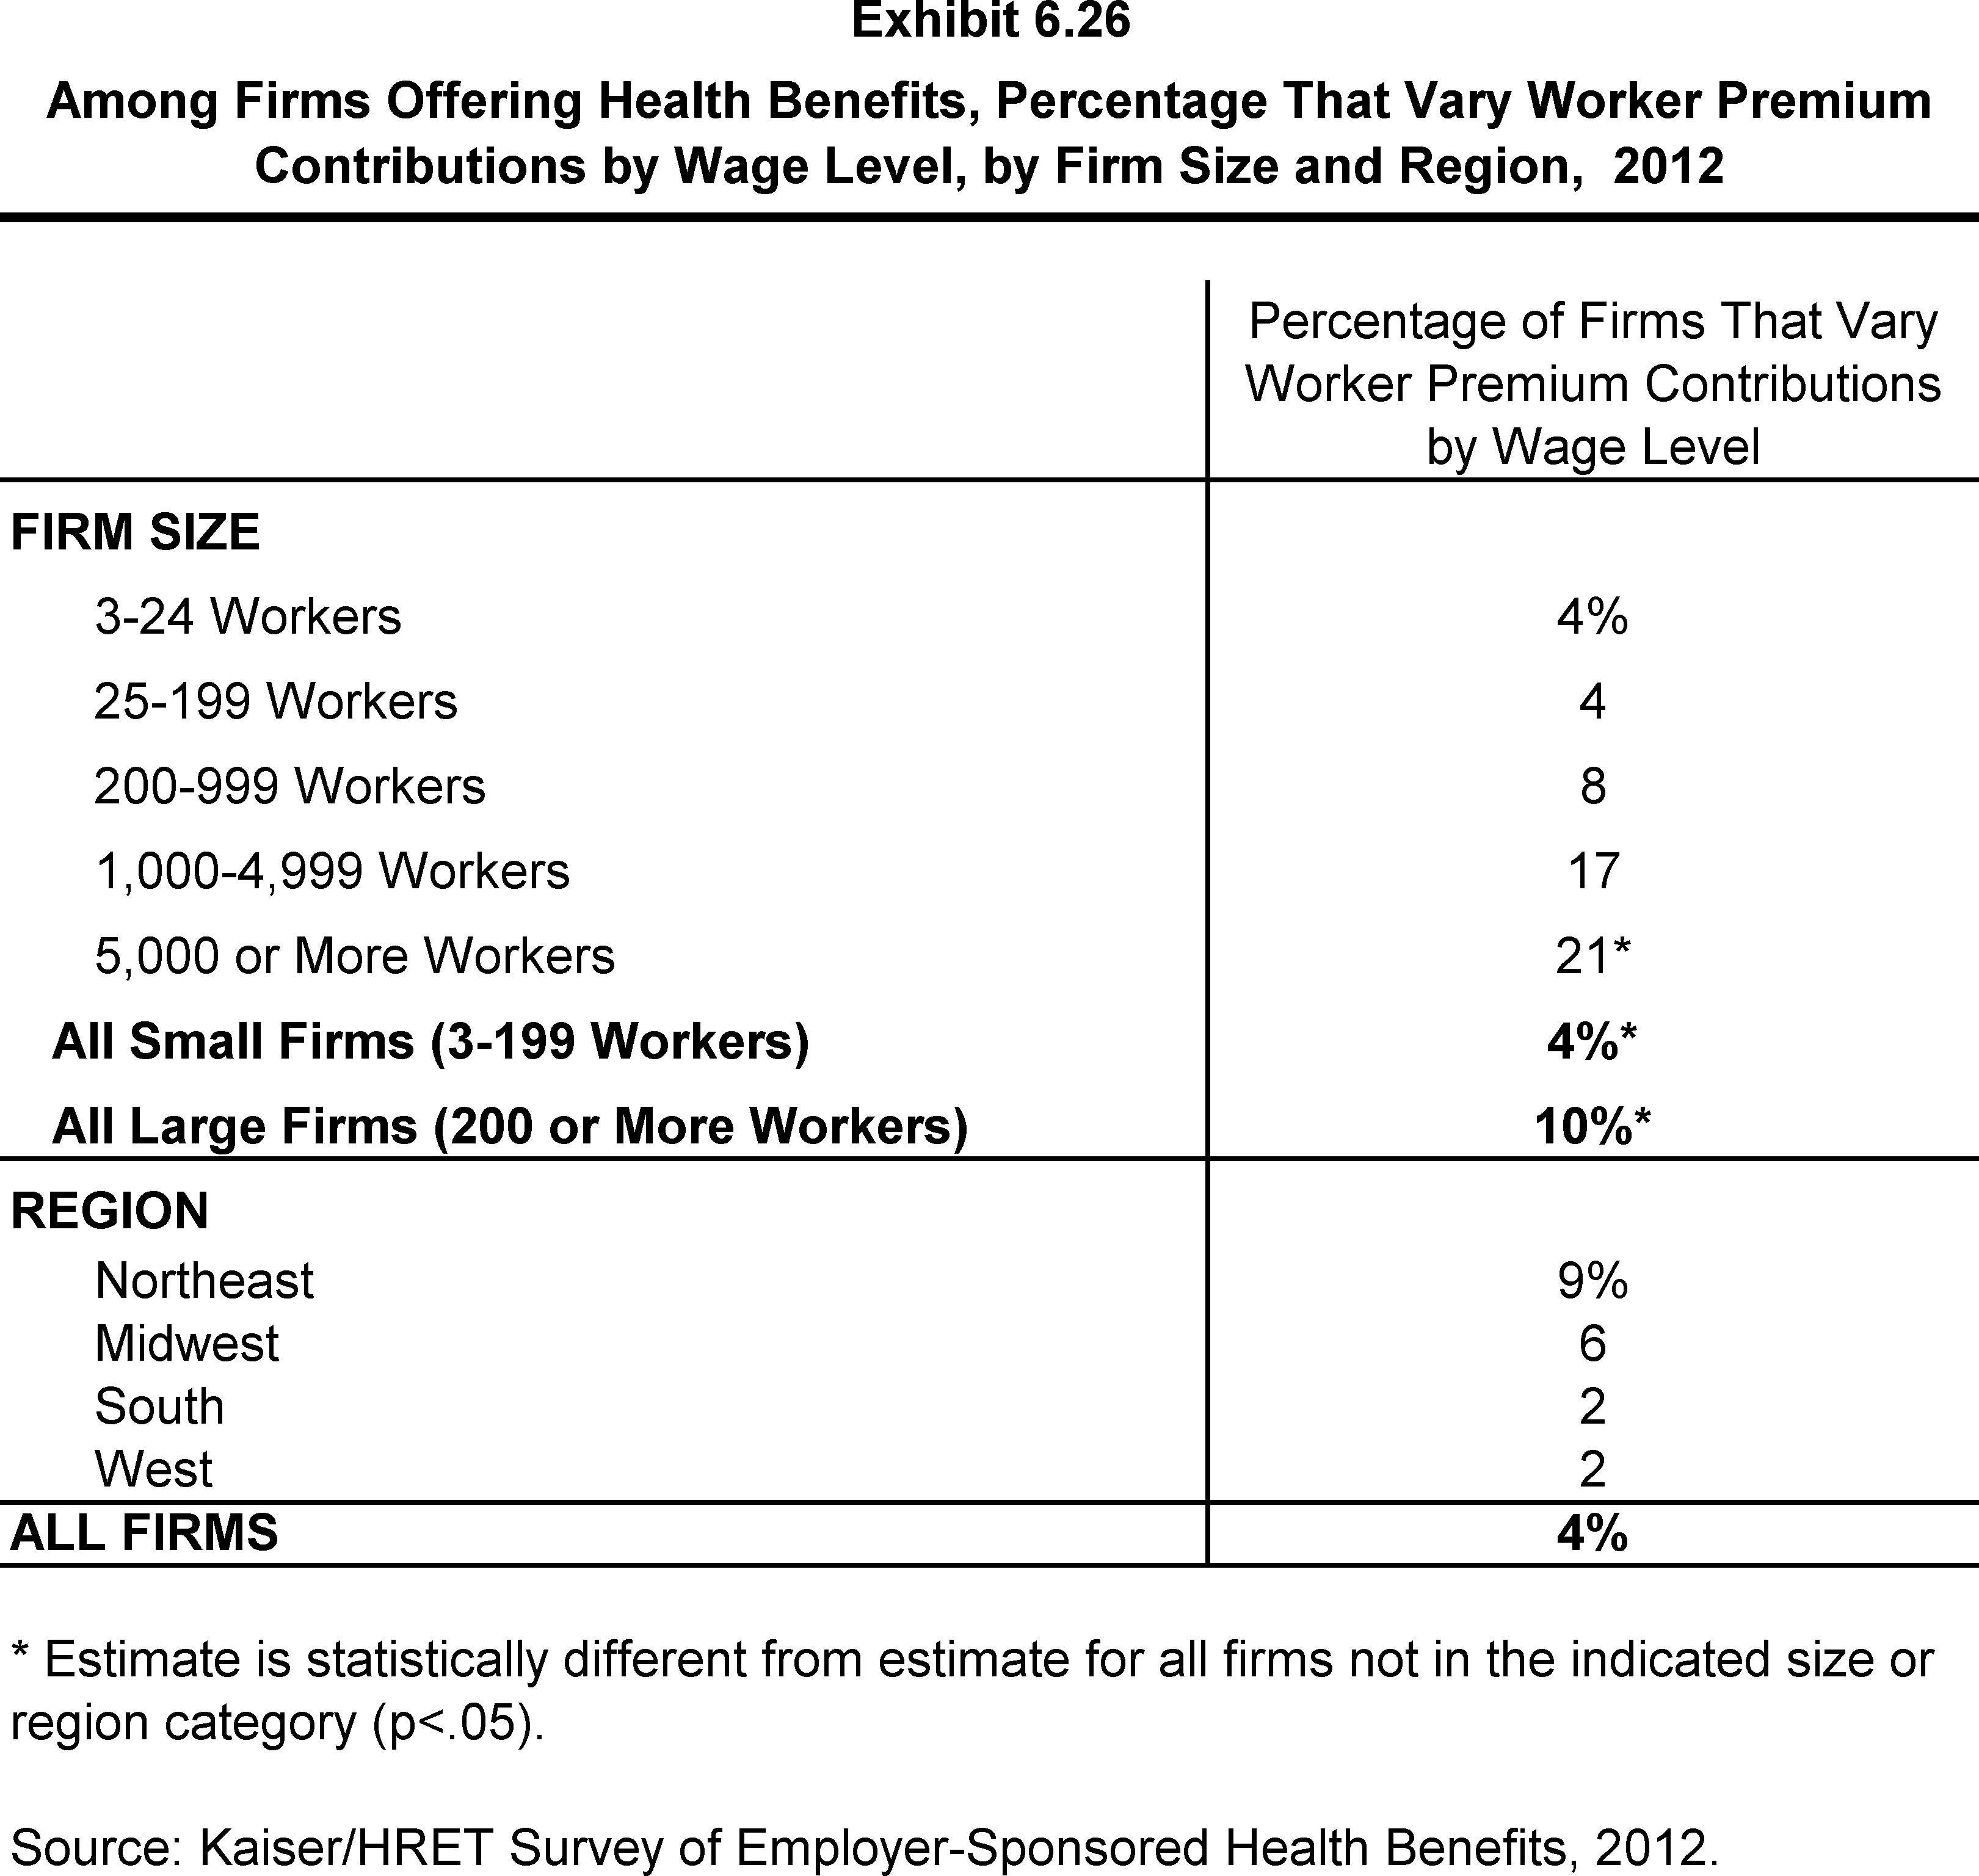
- Among firms offering health benefits, 4% vary worker premium contributions by wage level. Large firms (200 or more workers) are more likely to vary contributions by wage level than small firms (10% vs. 4%) (Exhibit 6.26).
Average Percentage of Premium Paid by Covered Workers for Single and Family Coverage, 1999-2012
Average Monthly Worker Premium Contributions Paid by Covered Workers for Single and Family Coverage, 1999-2012
Average Annual Worker and Employer Contributions to Premiums and Total Premiums for Single Coverage, 1999-2012
Average Annual Worker and Employer Contributions to Premiums and Total Premiums for Family Coverage, 1999-2012
Average Annual Firm and Worker Premium Contributions and Total Premiums for Covered Workers for Single and Family Coverage, by Plan Type, 2012
Average Annual Worker Contributions for Covered Workers with Average Annual Worker Contributions for Covered Workers with
Average Annual Worker Contributions for Covered Workers with Family Coverage, by Firm Size, 1999-2012
Average Annual Worker Premium Contributions Paid by Covered Workers for Single and Family Coverage, by Firm Size, 1999-2012
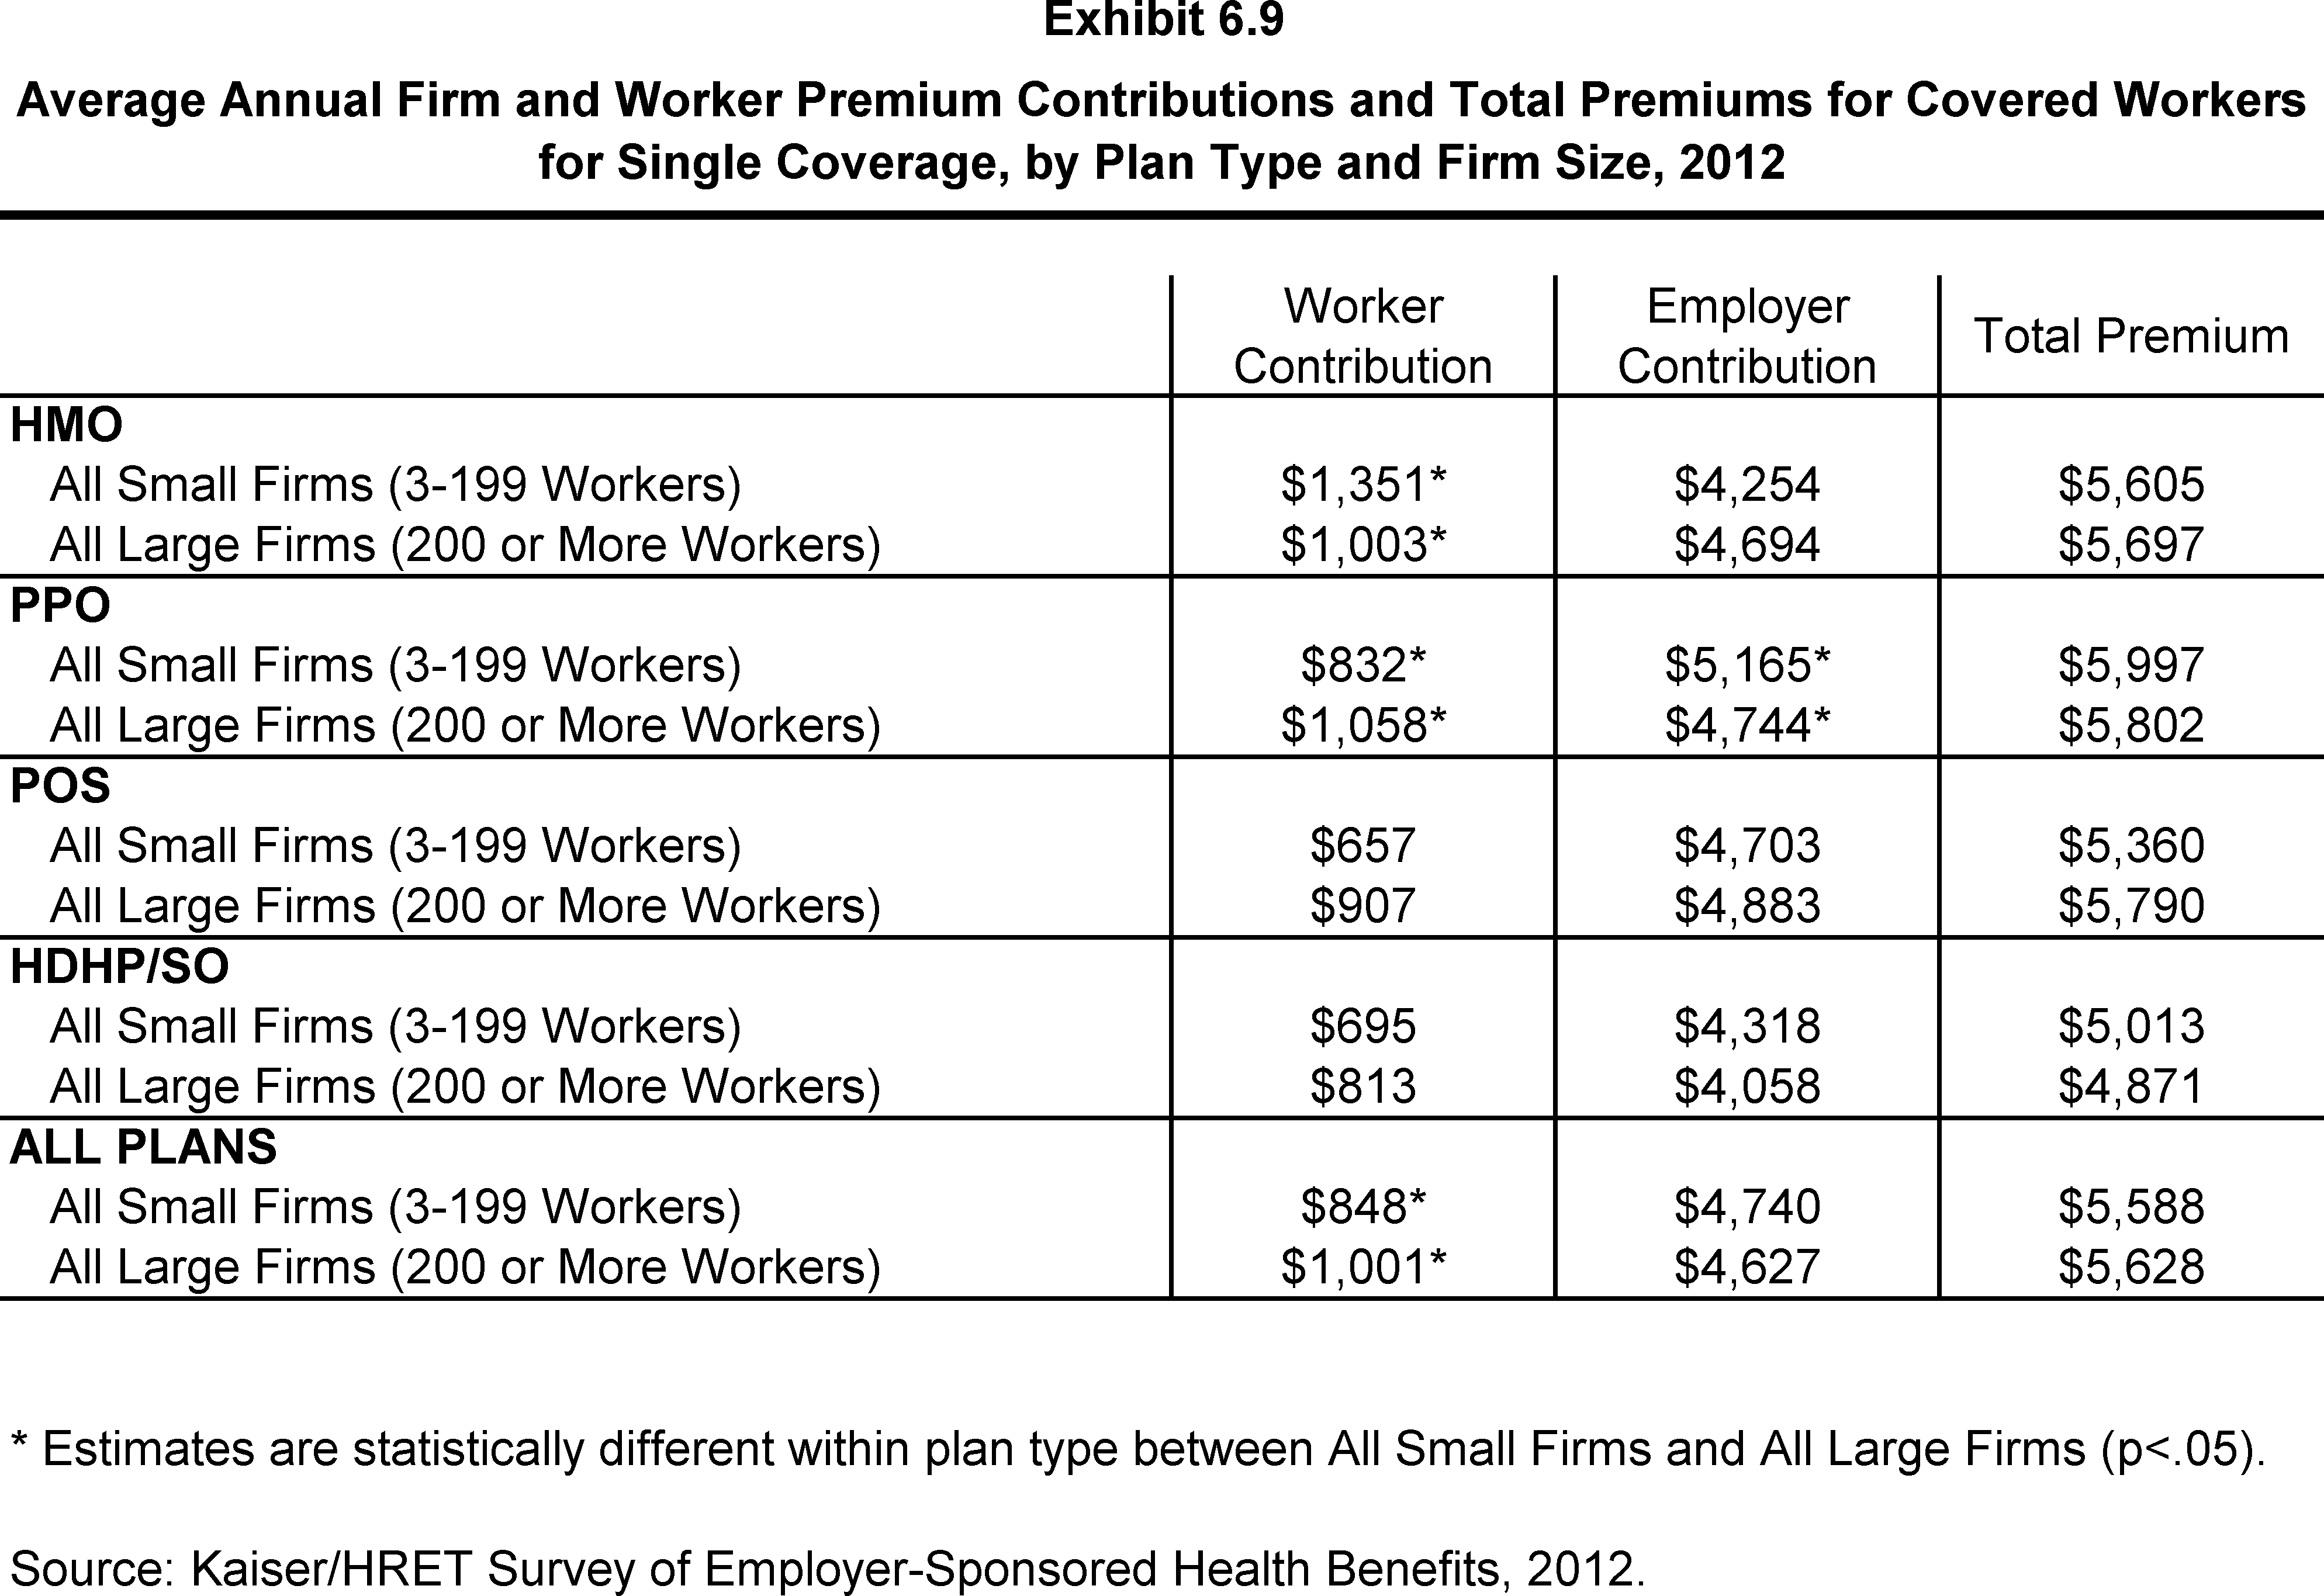
Average Annual Firm and Worker Premium Contributions and Total Premiums for Covered Workers for Single Coverage, by Plan Type and Firm Size, 2012
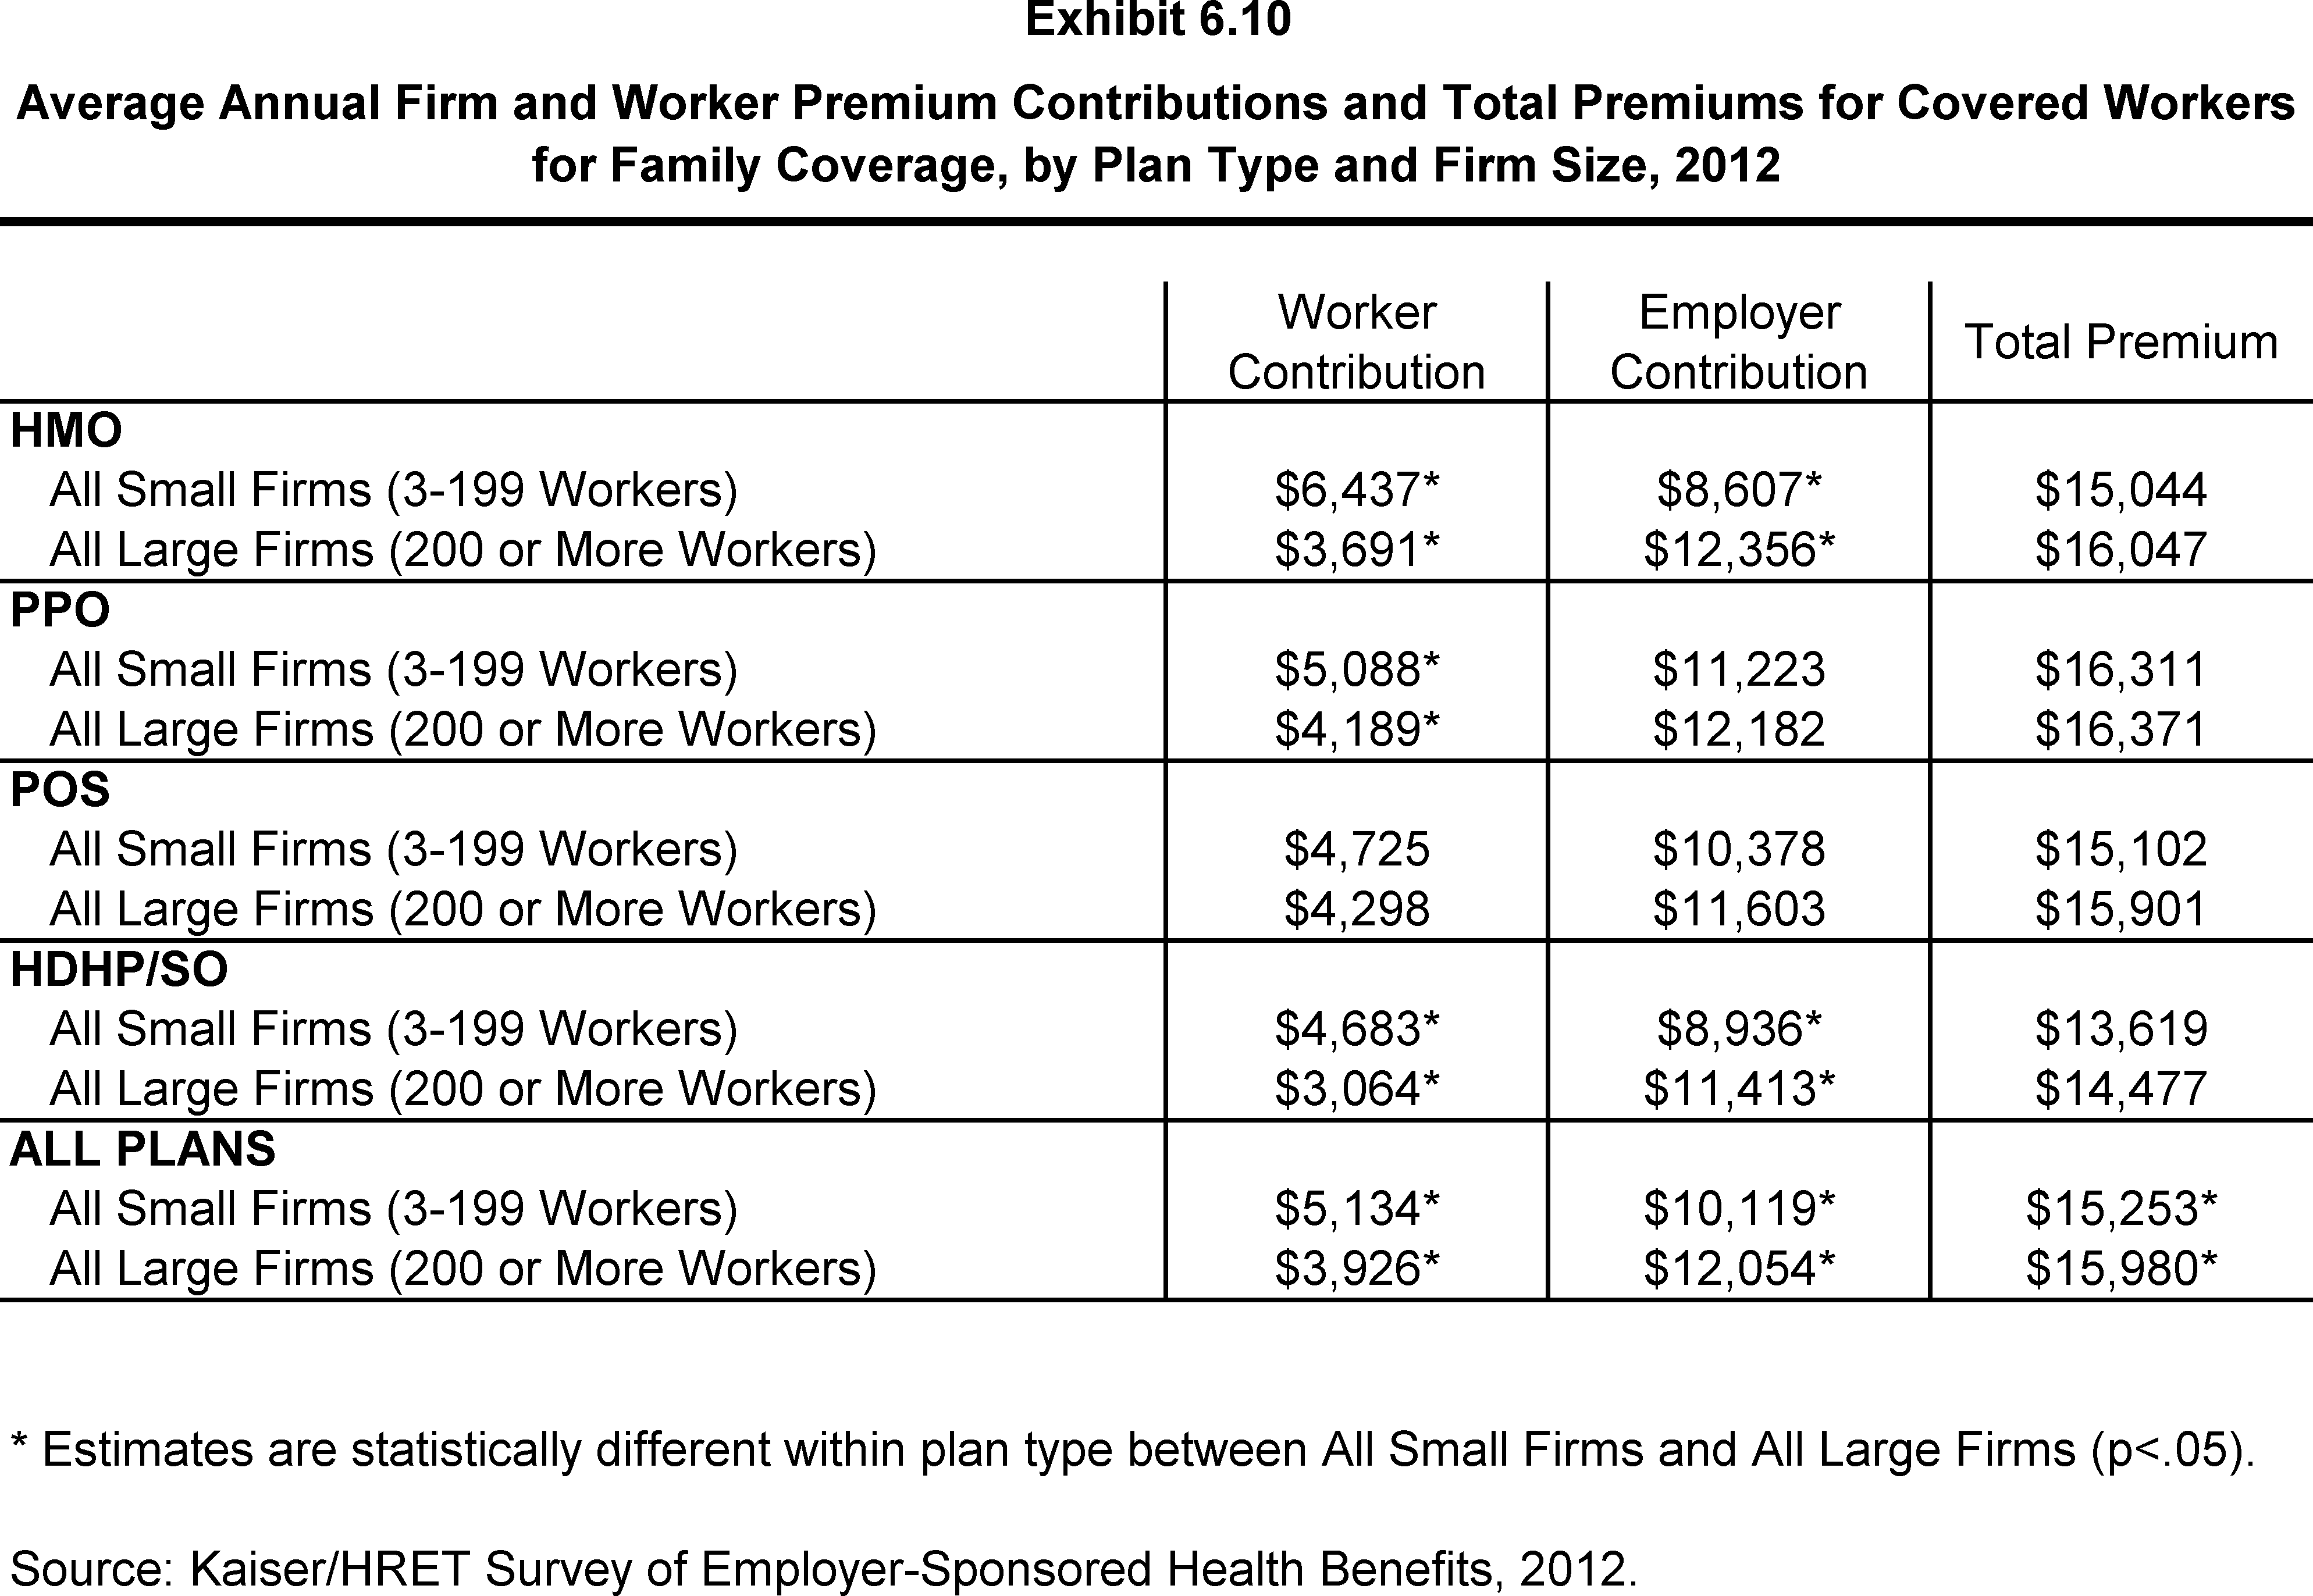
Average Annual Firm and Worker Premium Contributions and Total Premiums for Covered Workers for Family Coverage, by Plan Type and Firm Size, 2012
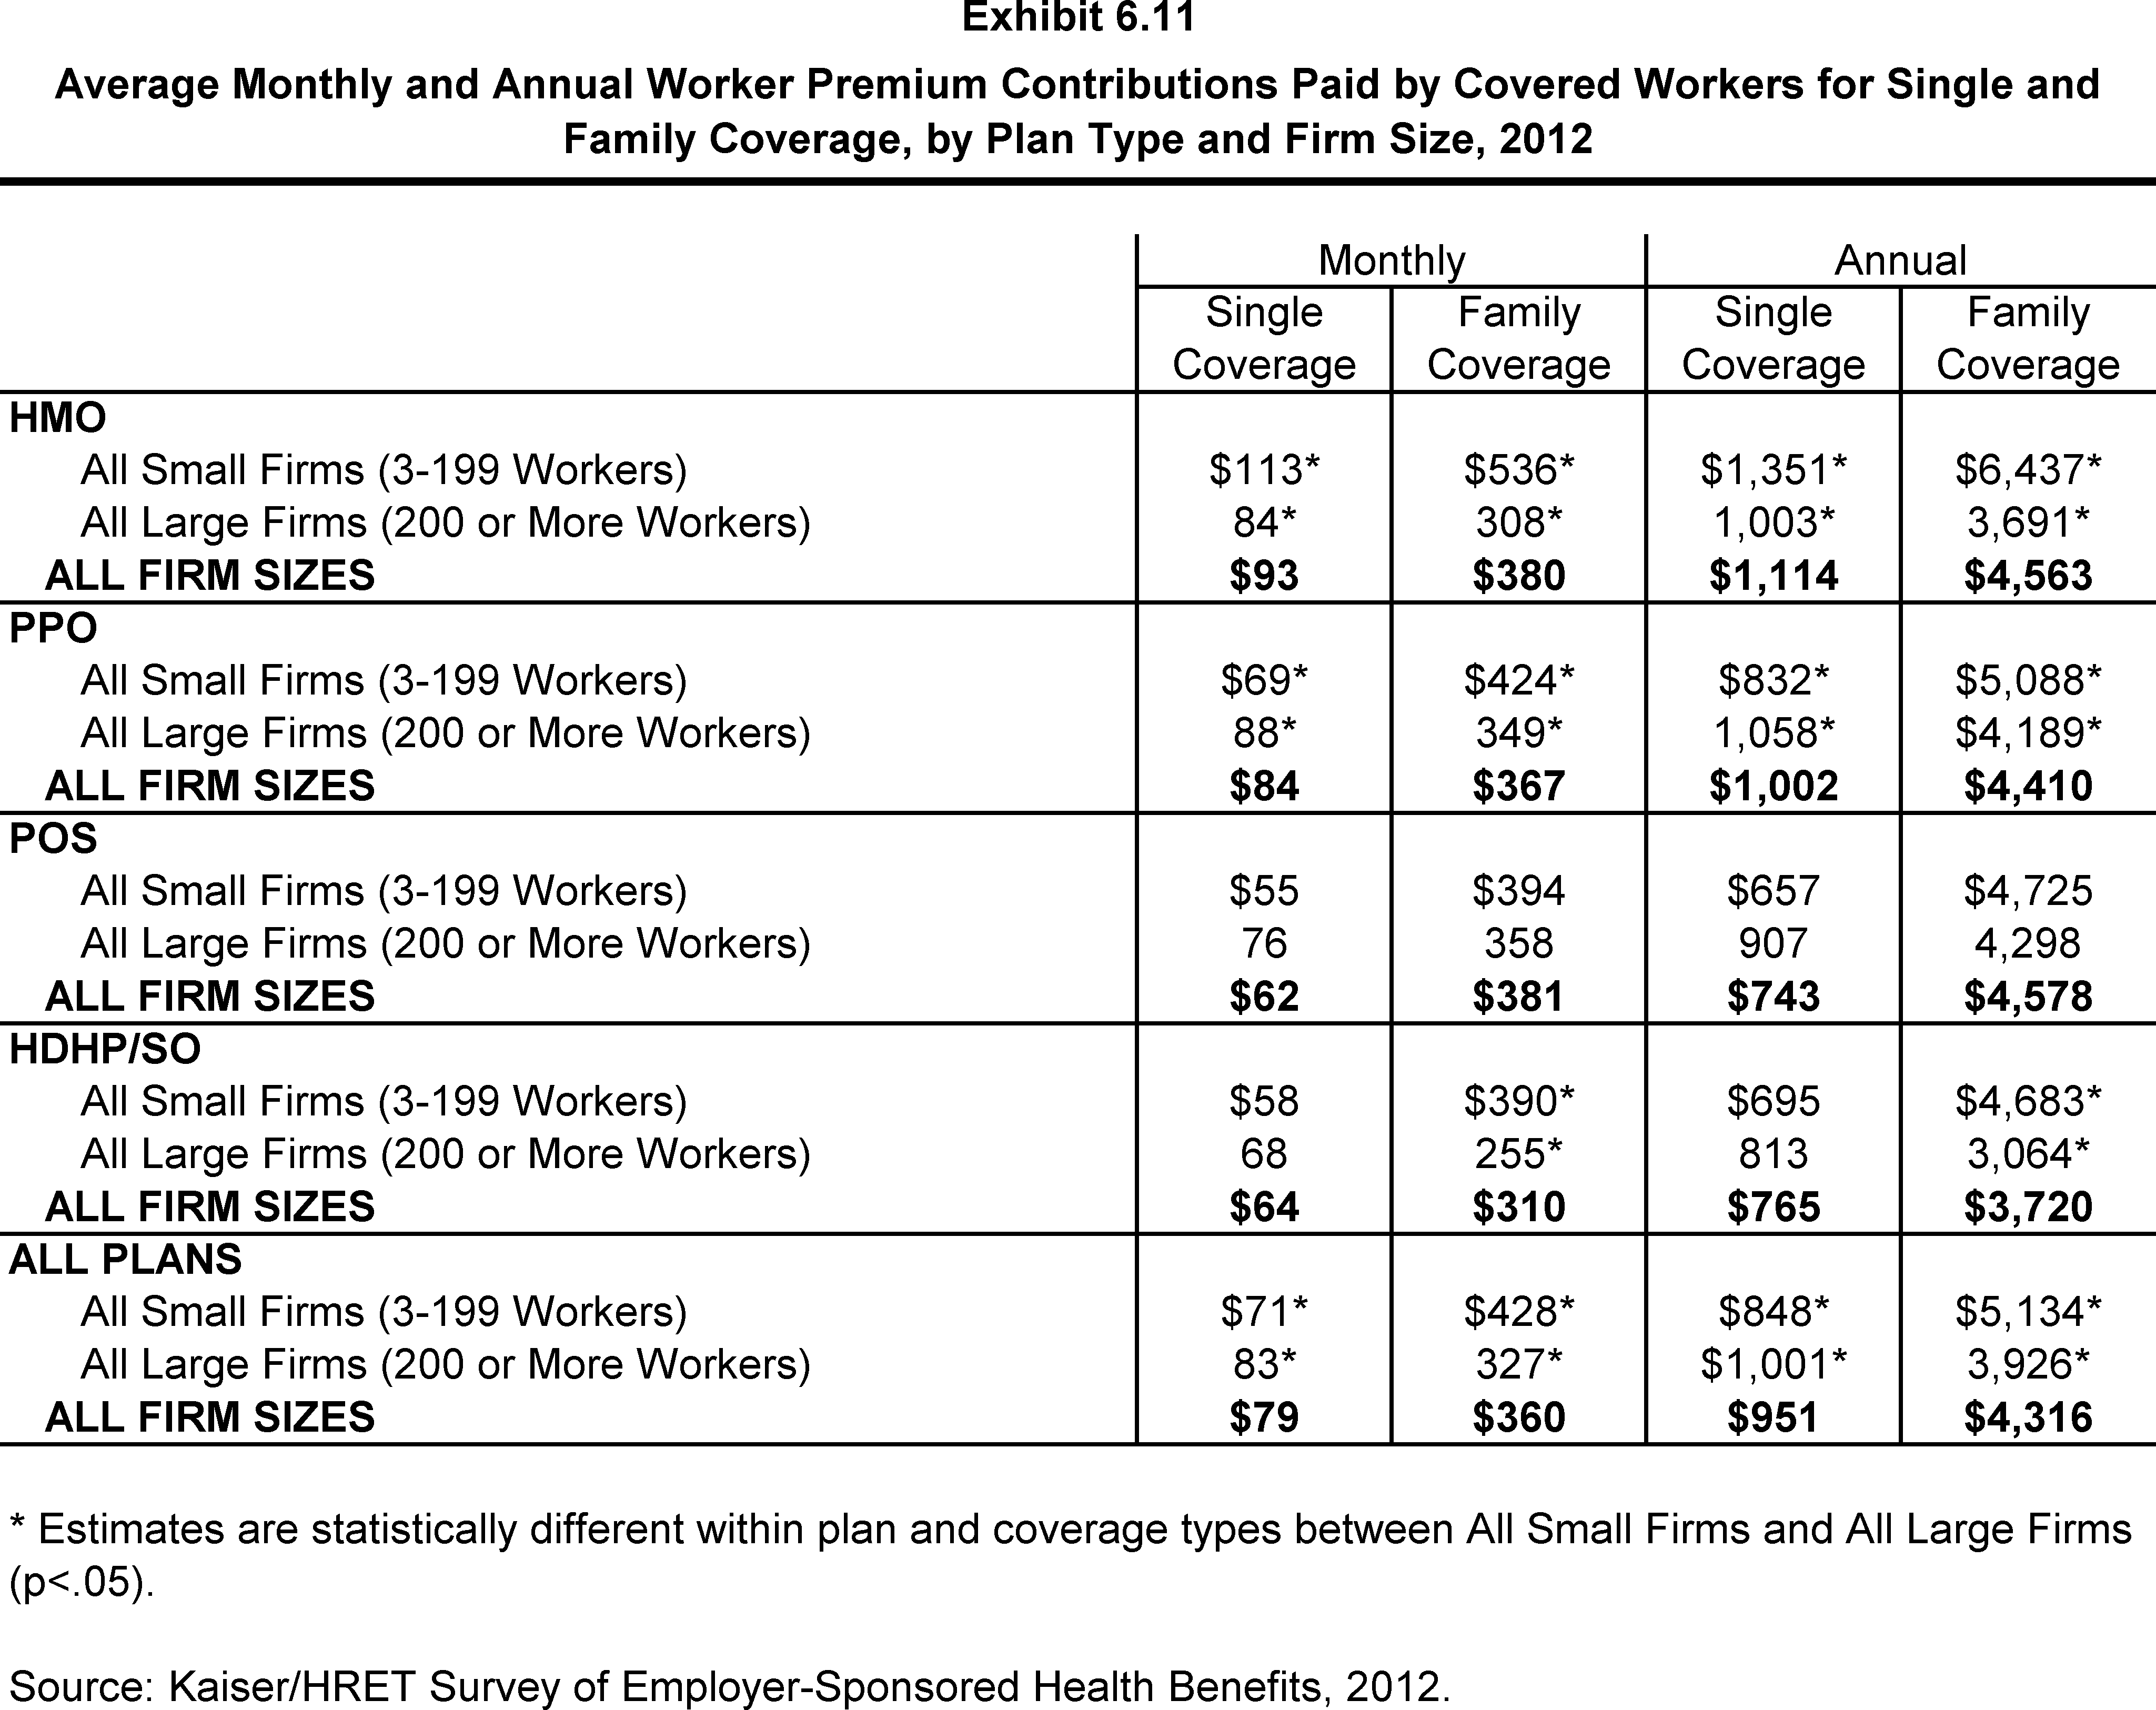
Average Monthly and Annual Worker Premium Contributions Paid by Covered Workers for Single and Family Coverage, by Plan Type and Firm Size, 2012
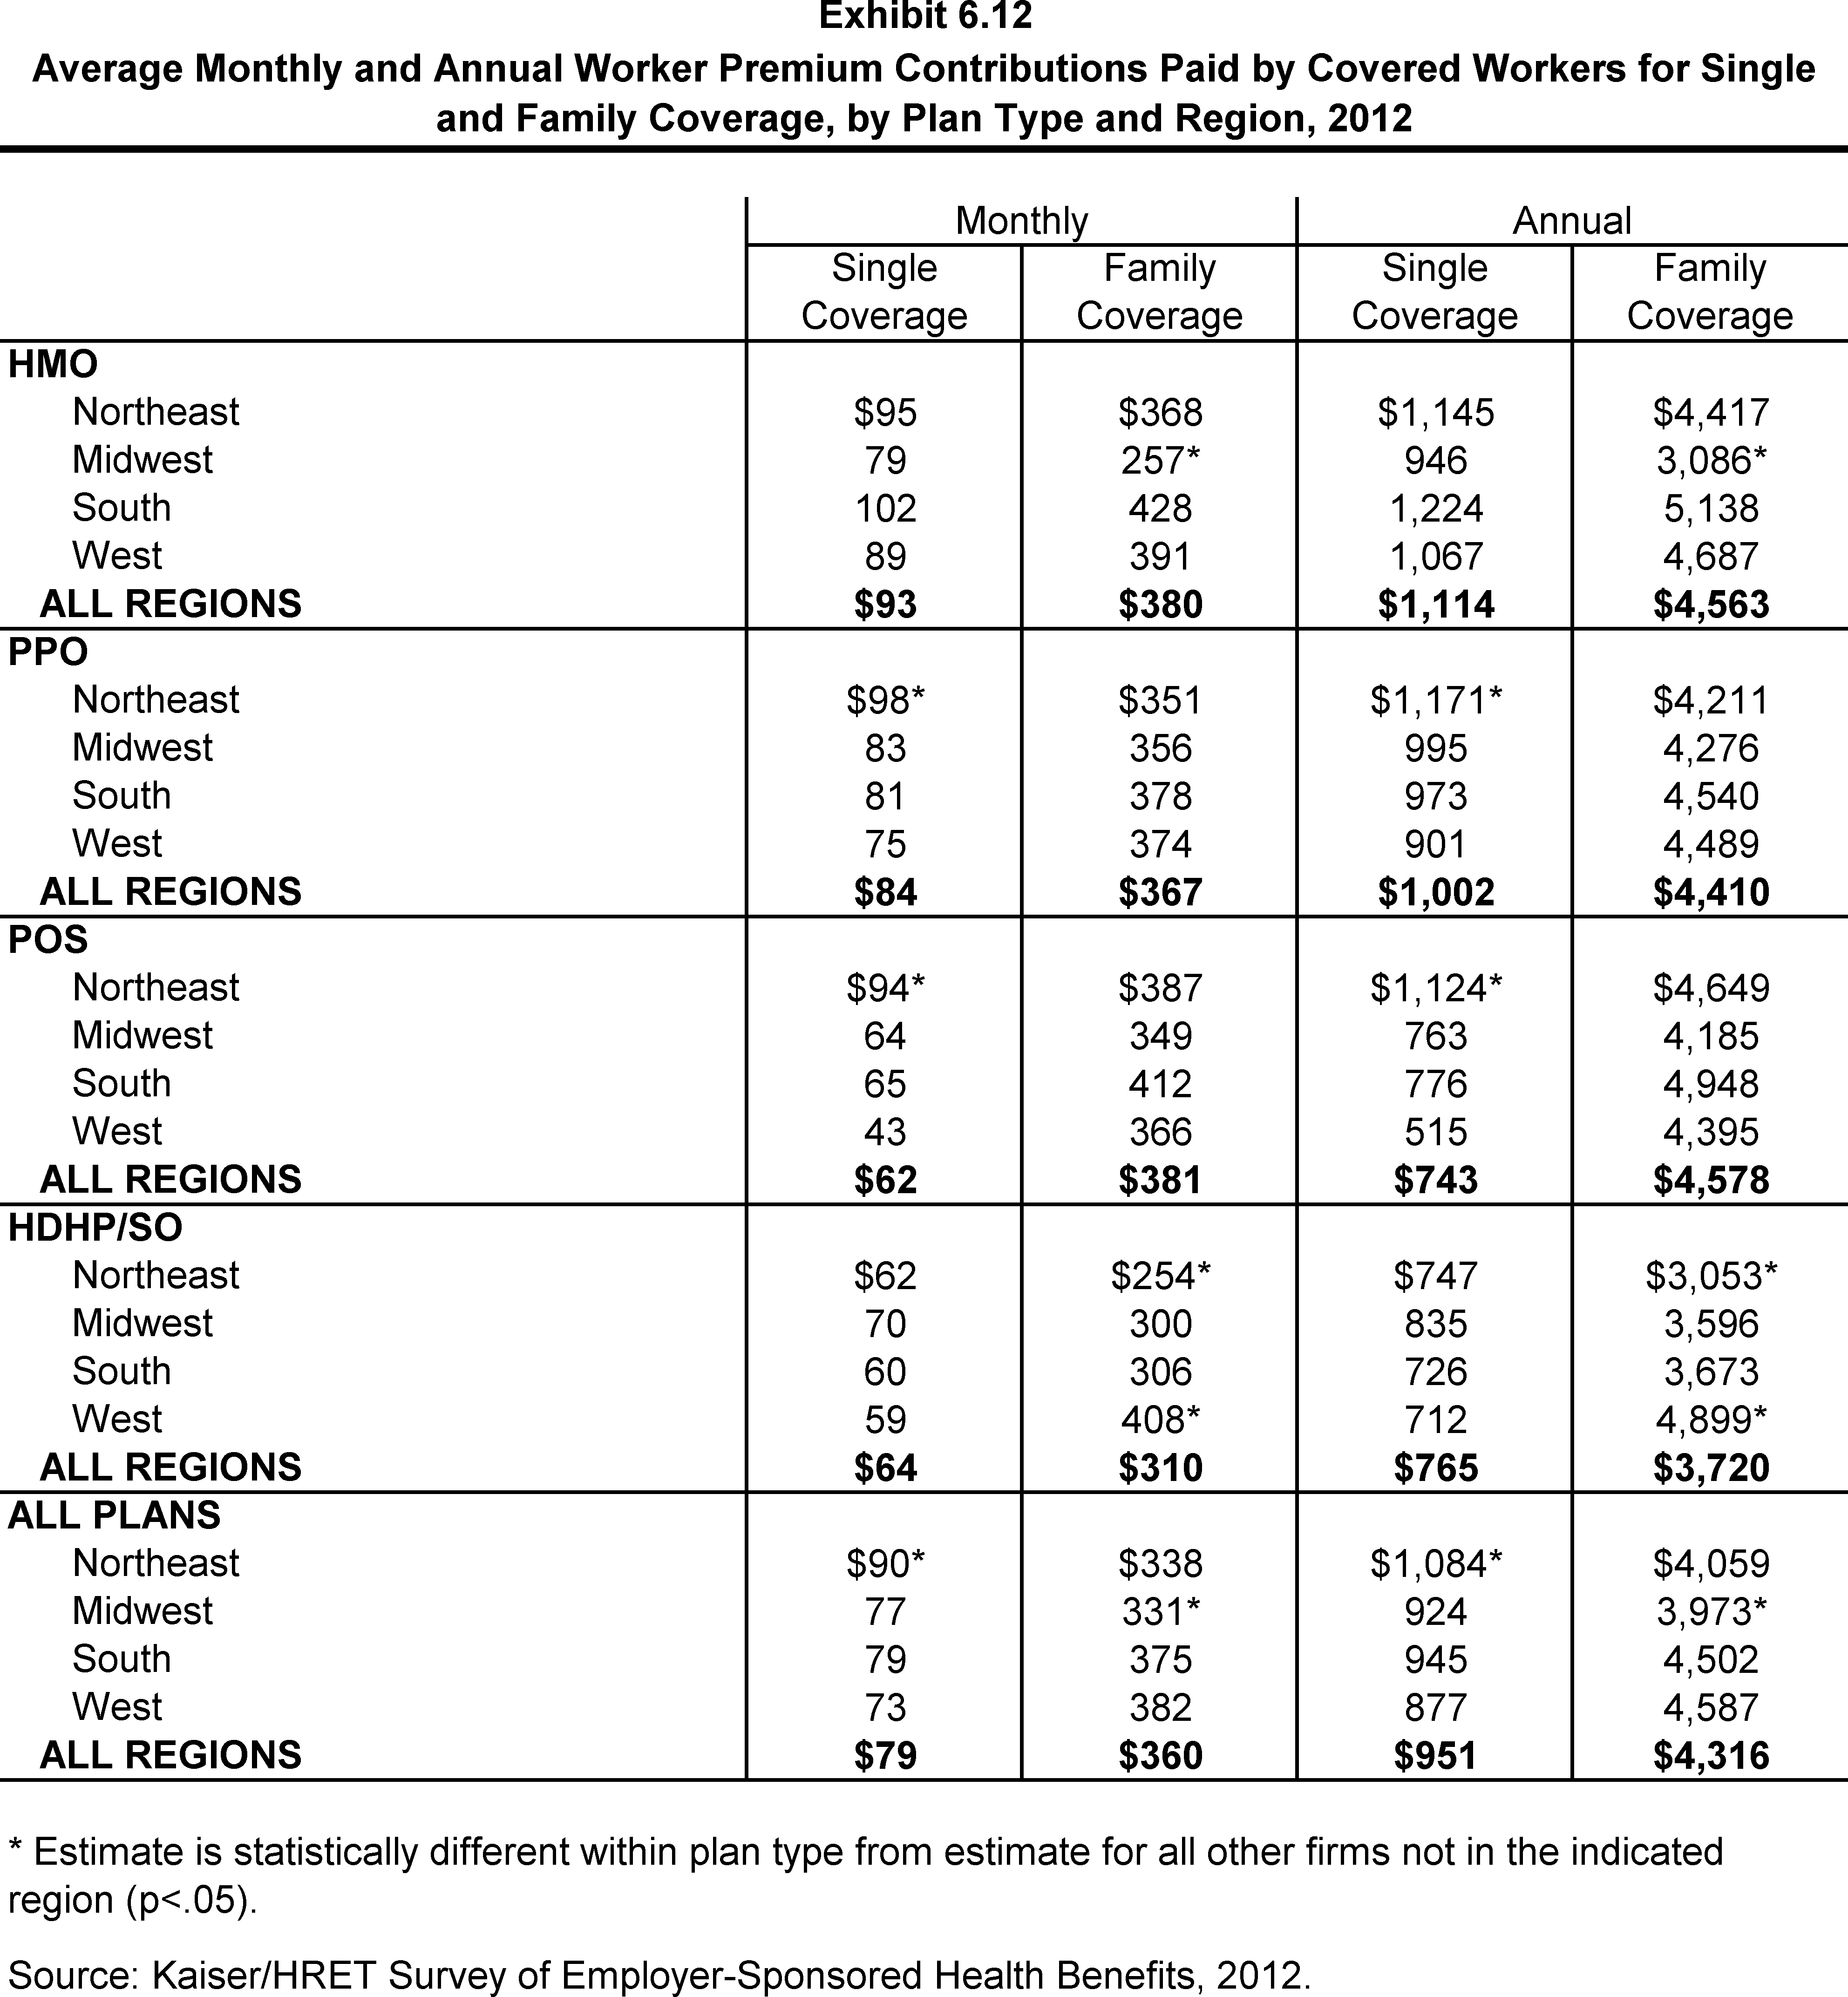
Average Monthly and Annual Worker Premium Contributions Paid by Covered Workers for Single and Family Coverage, by Plan Type and Region, 2012
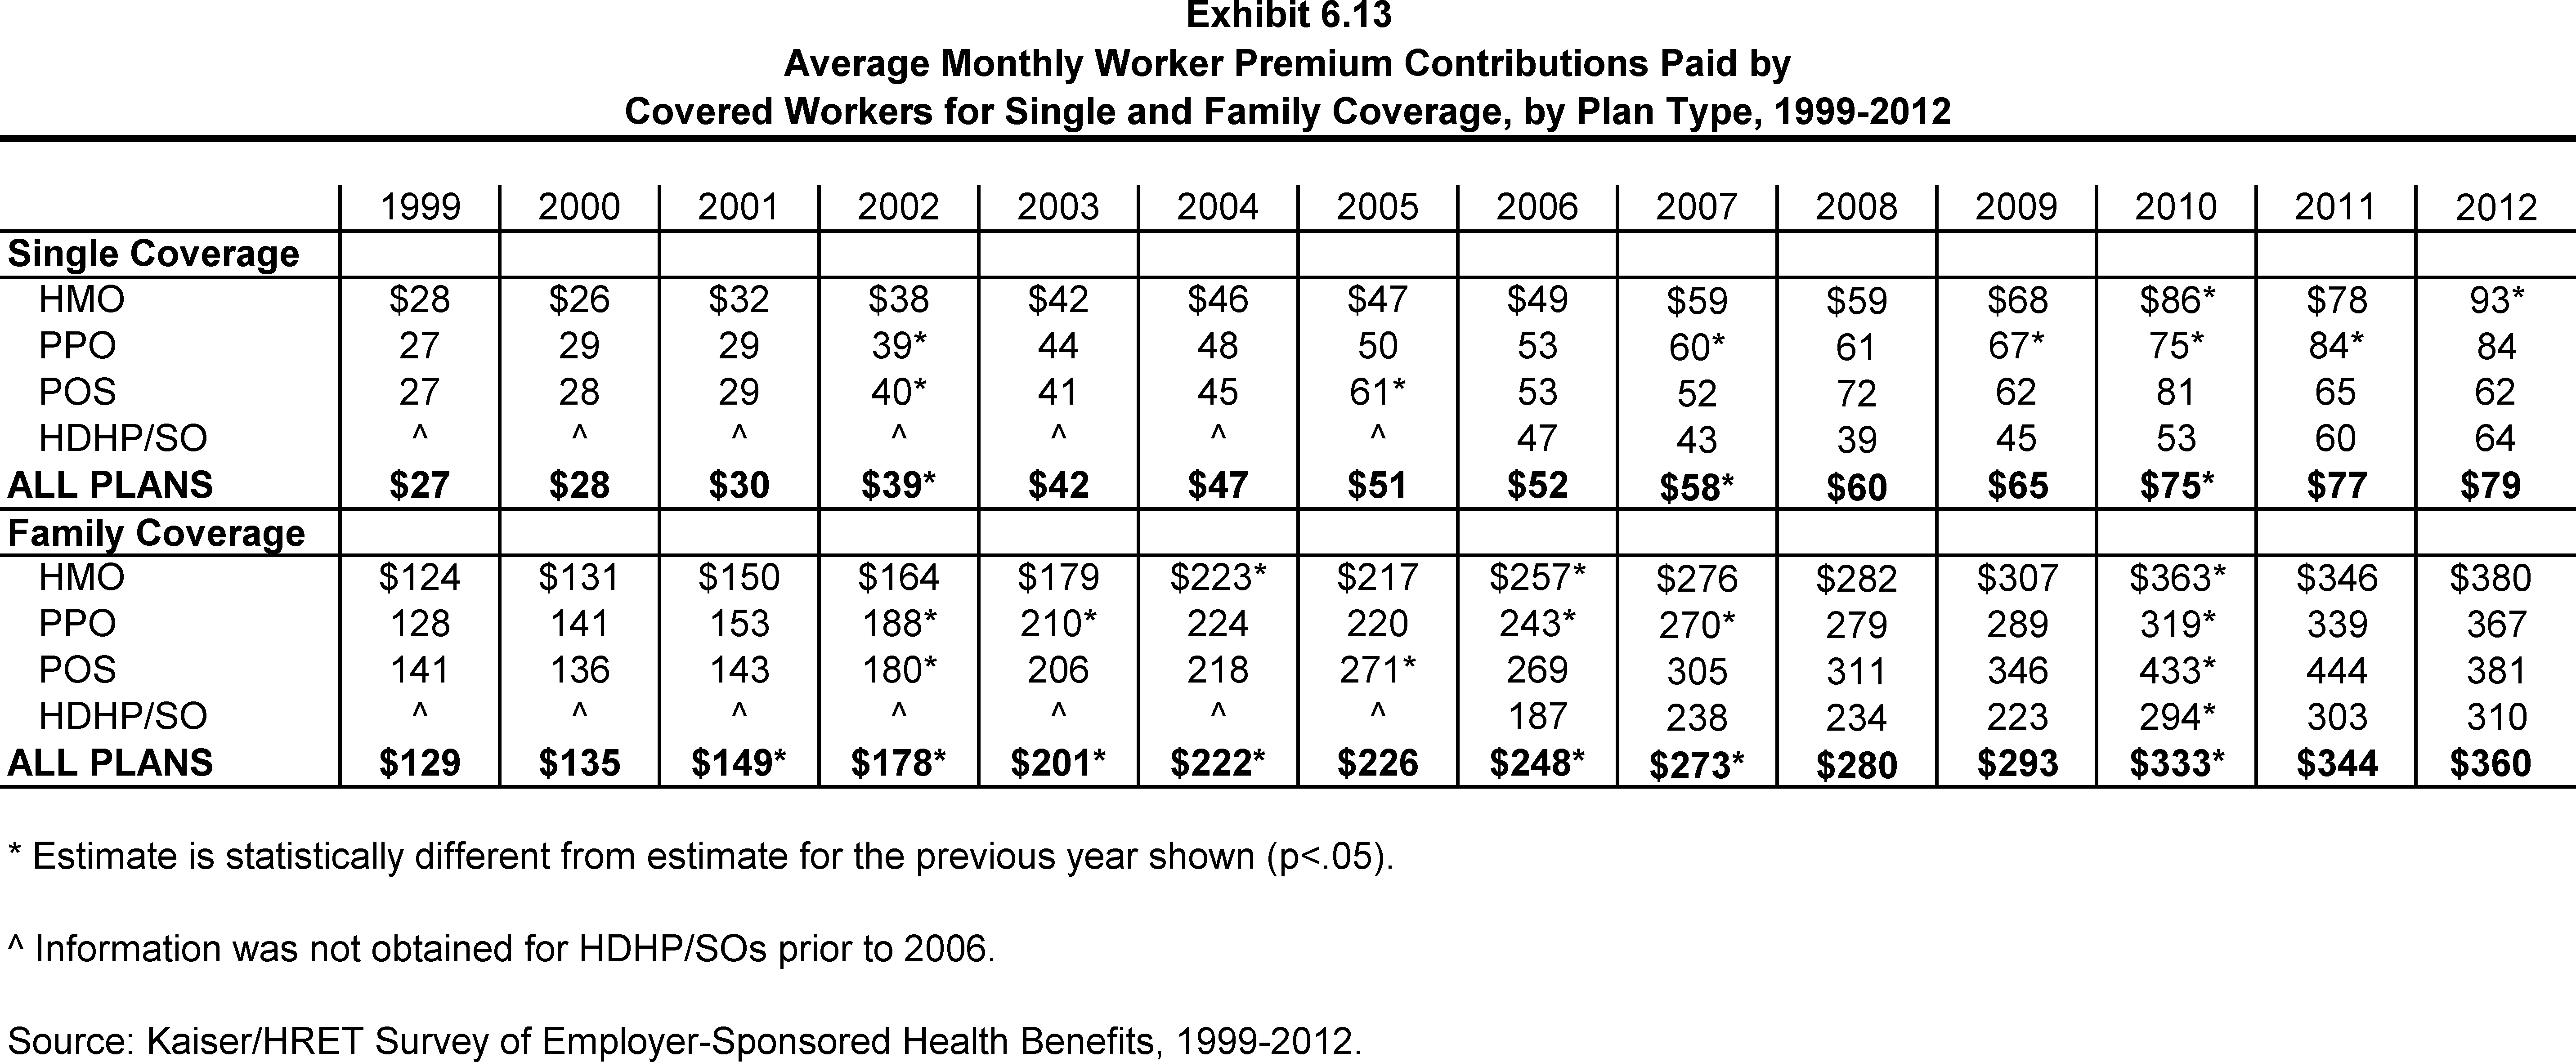
Average Monthly Worker Premium Contributions Paid by Covered Workers for Single and Family Coverage, by Plan Type, 1999-2012
Distribution of Worker Premium Contributions for Single and Family Coverage Relative to the Average Annual Worker Premium Contribution, 2012
Distribution of Percentage of Premium Paid by Covered Workers for Single and Family Coverage, 2002-2012
Distribution of Percentage of Premium Paid by Covered Workers for Single Coverage, by Firm Size, 2002-2012
Distribution of Percentage of Premium Paid by Covered Workers for Family Coverage, by Firm Size, 2002-2012
Distribution of the Percentage of Total Premium Paid by Covered Workers for Single and Family Coverage, by Wage Level, 2012
Average Percentage of Premium Paid by Covered Workers for Single Coverage, by Firm Characteristics and Size, 2012
Average Percentage of Premium Paid by Covered Workers for Family Coverage, by Firm Characteristics and Size, 2012
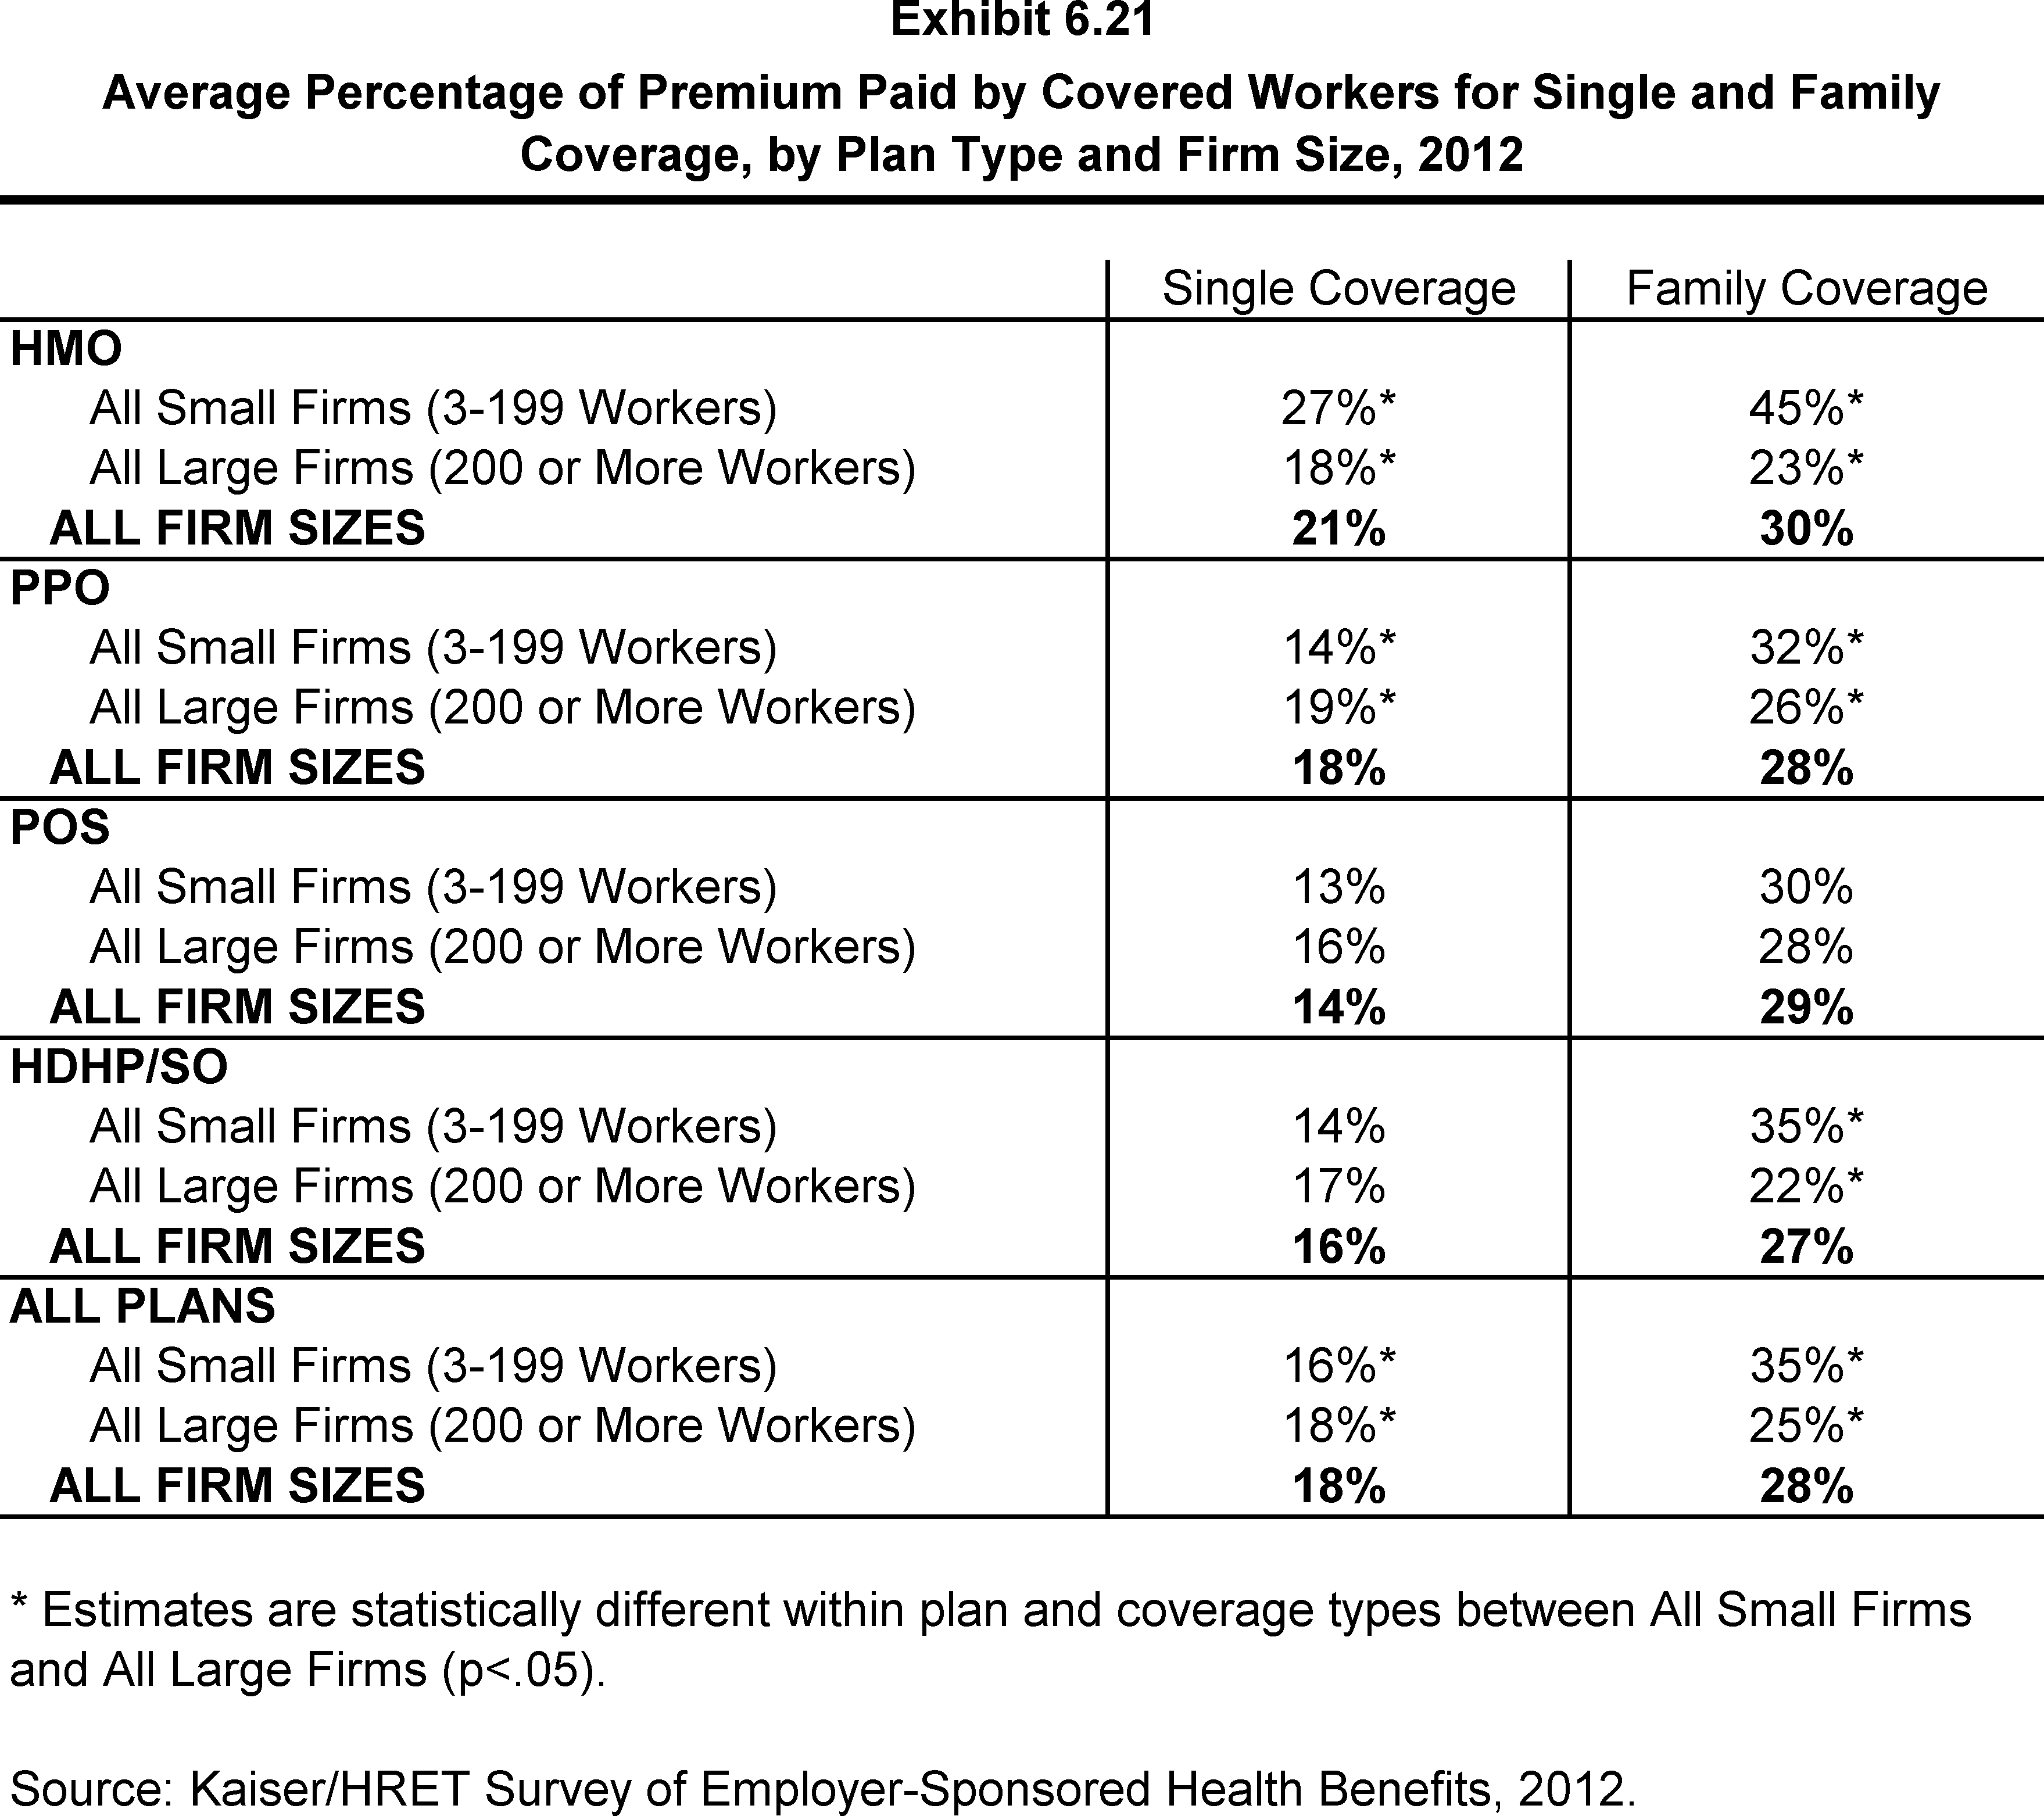
Average Percentage of Premium Paid by Covered Workers for Single and Family Coverage, by Plan Type and Firm Size, 2012
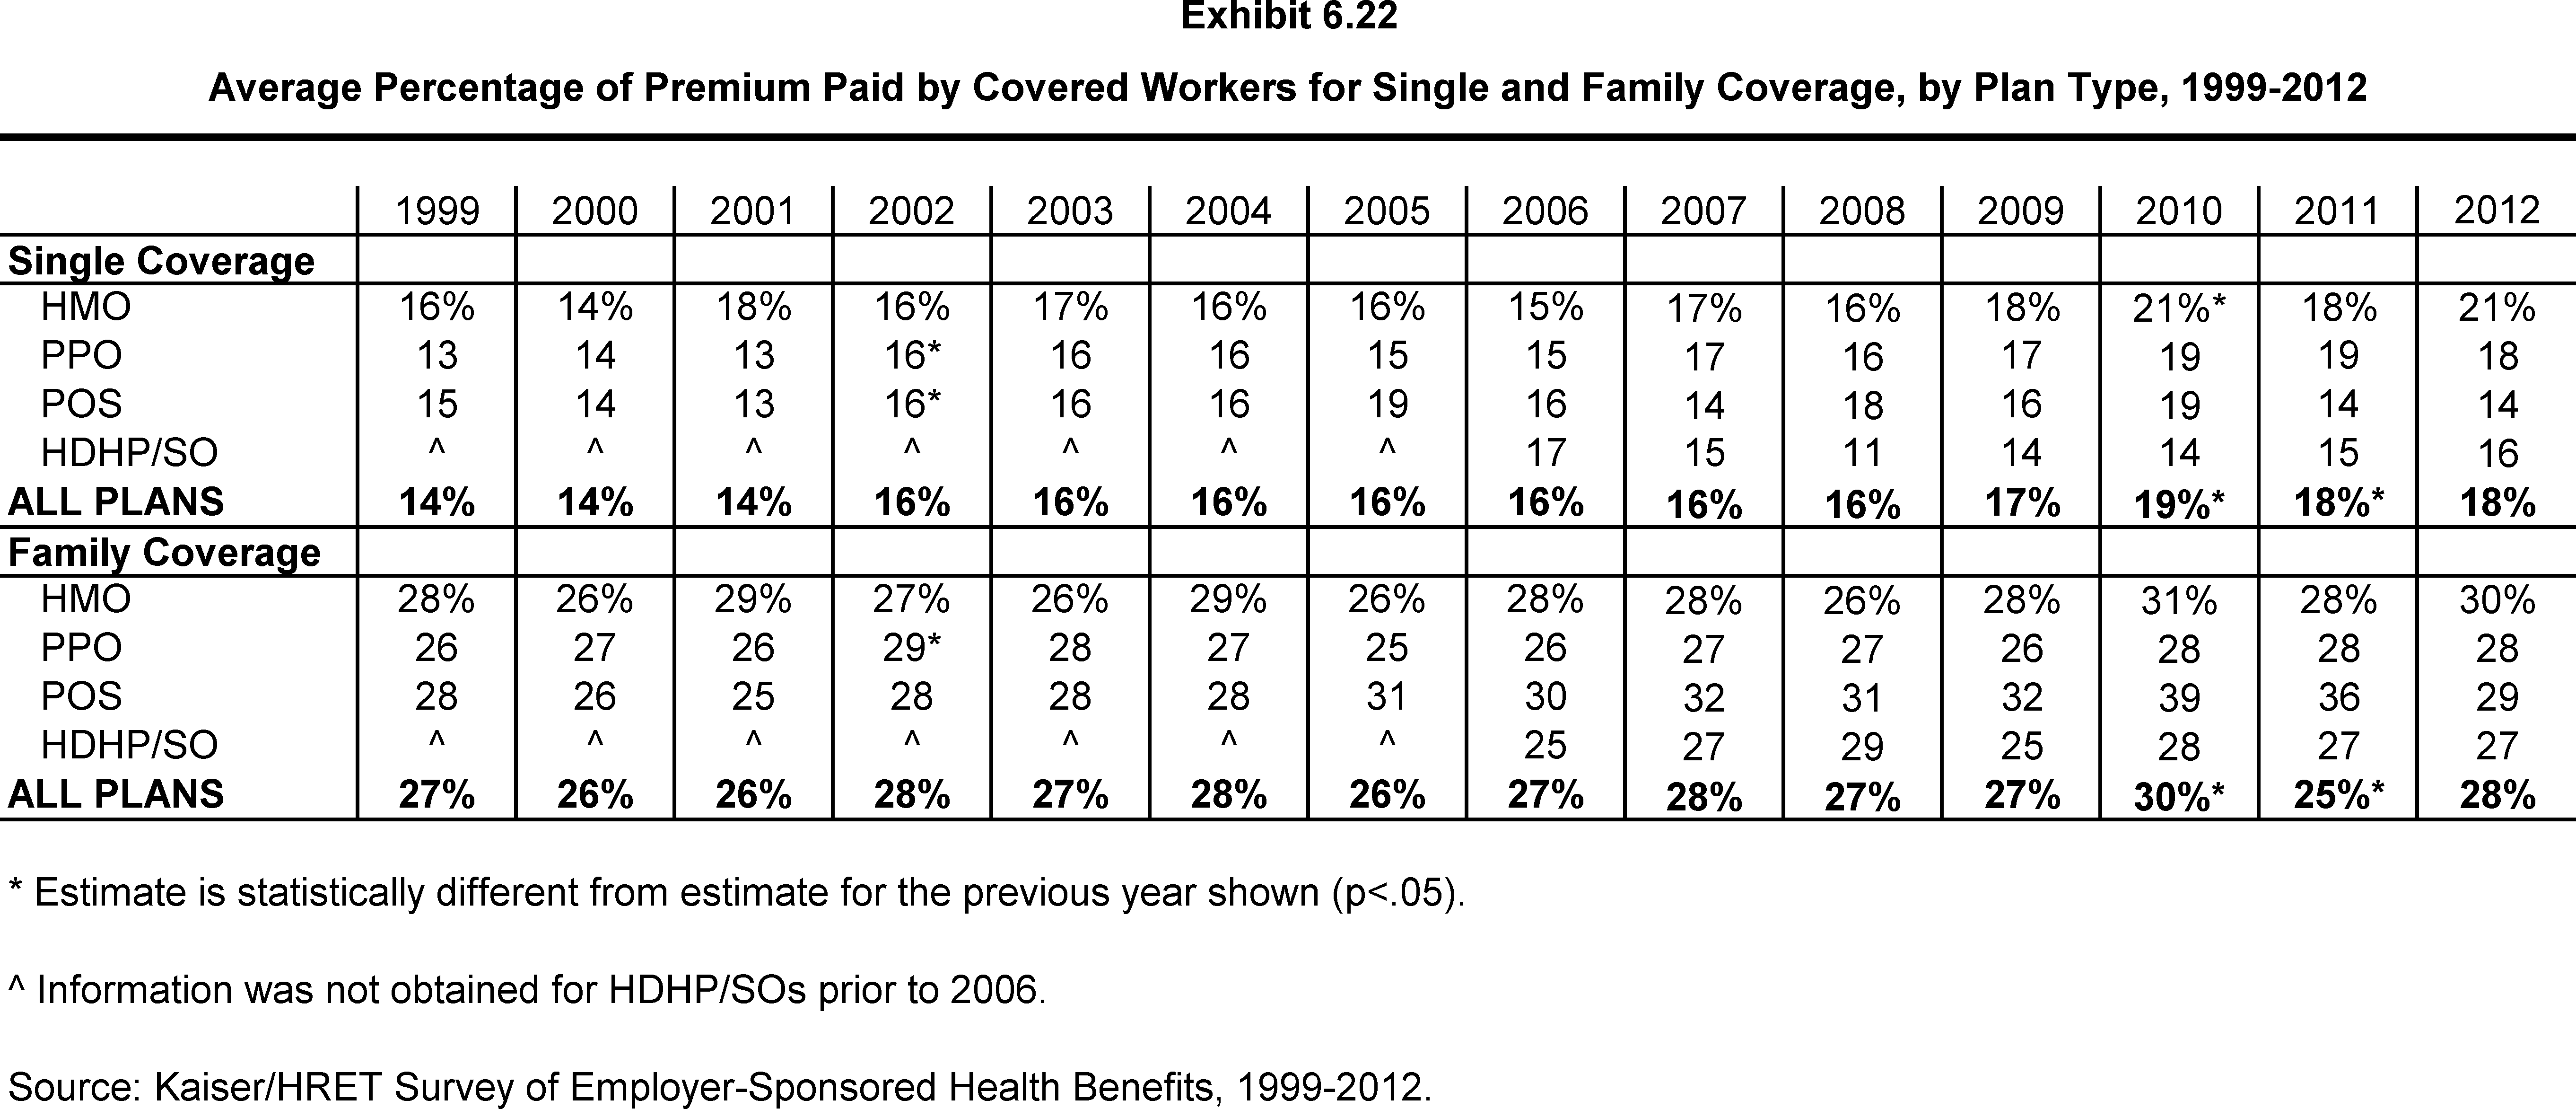
Average Percentage of Premium Paid by Covered Workers for Single and Family Coverage, by Plan Type, 1999-2012
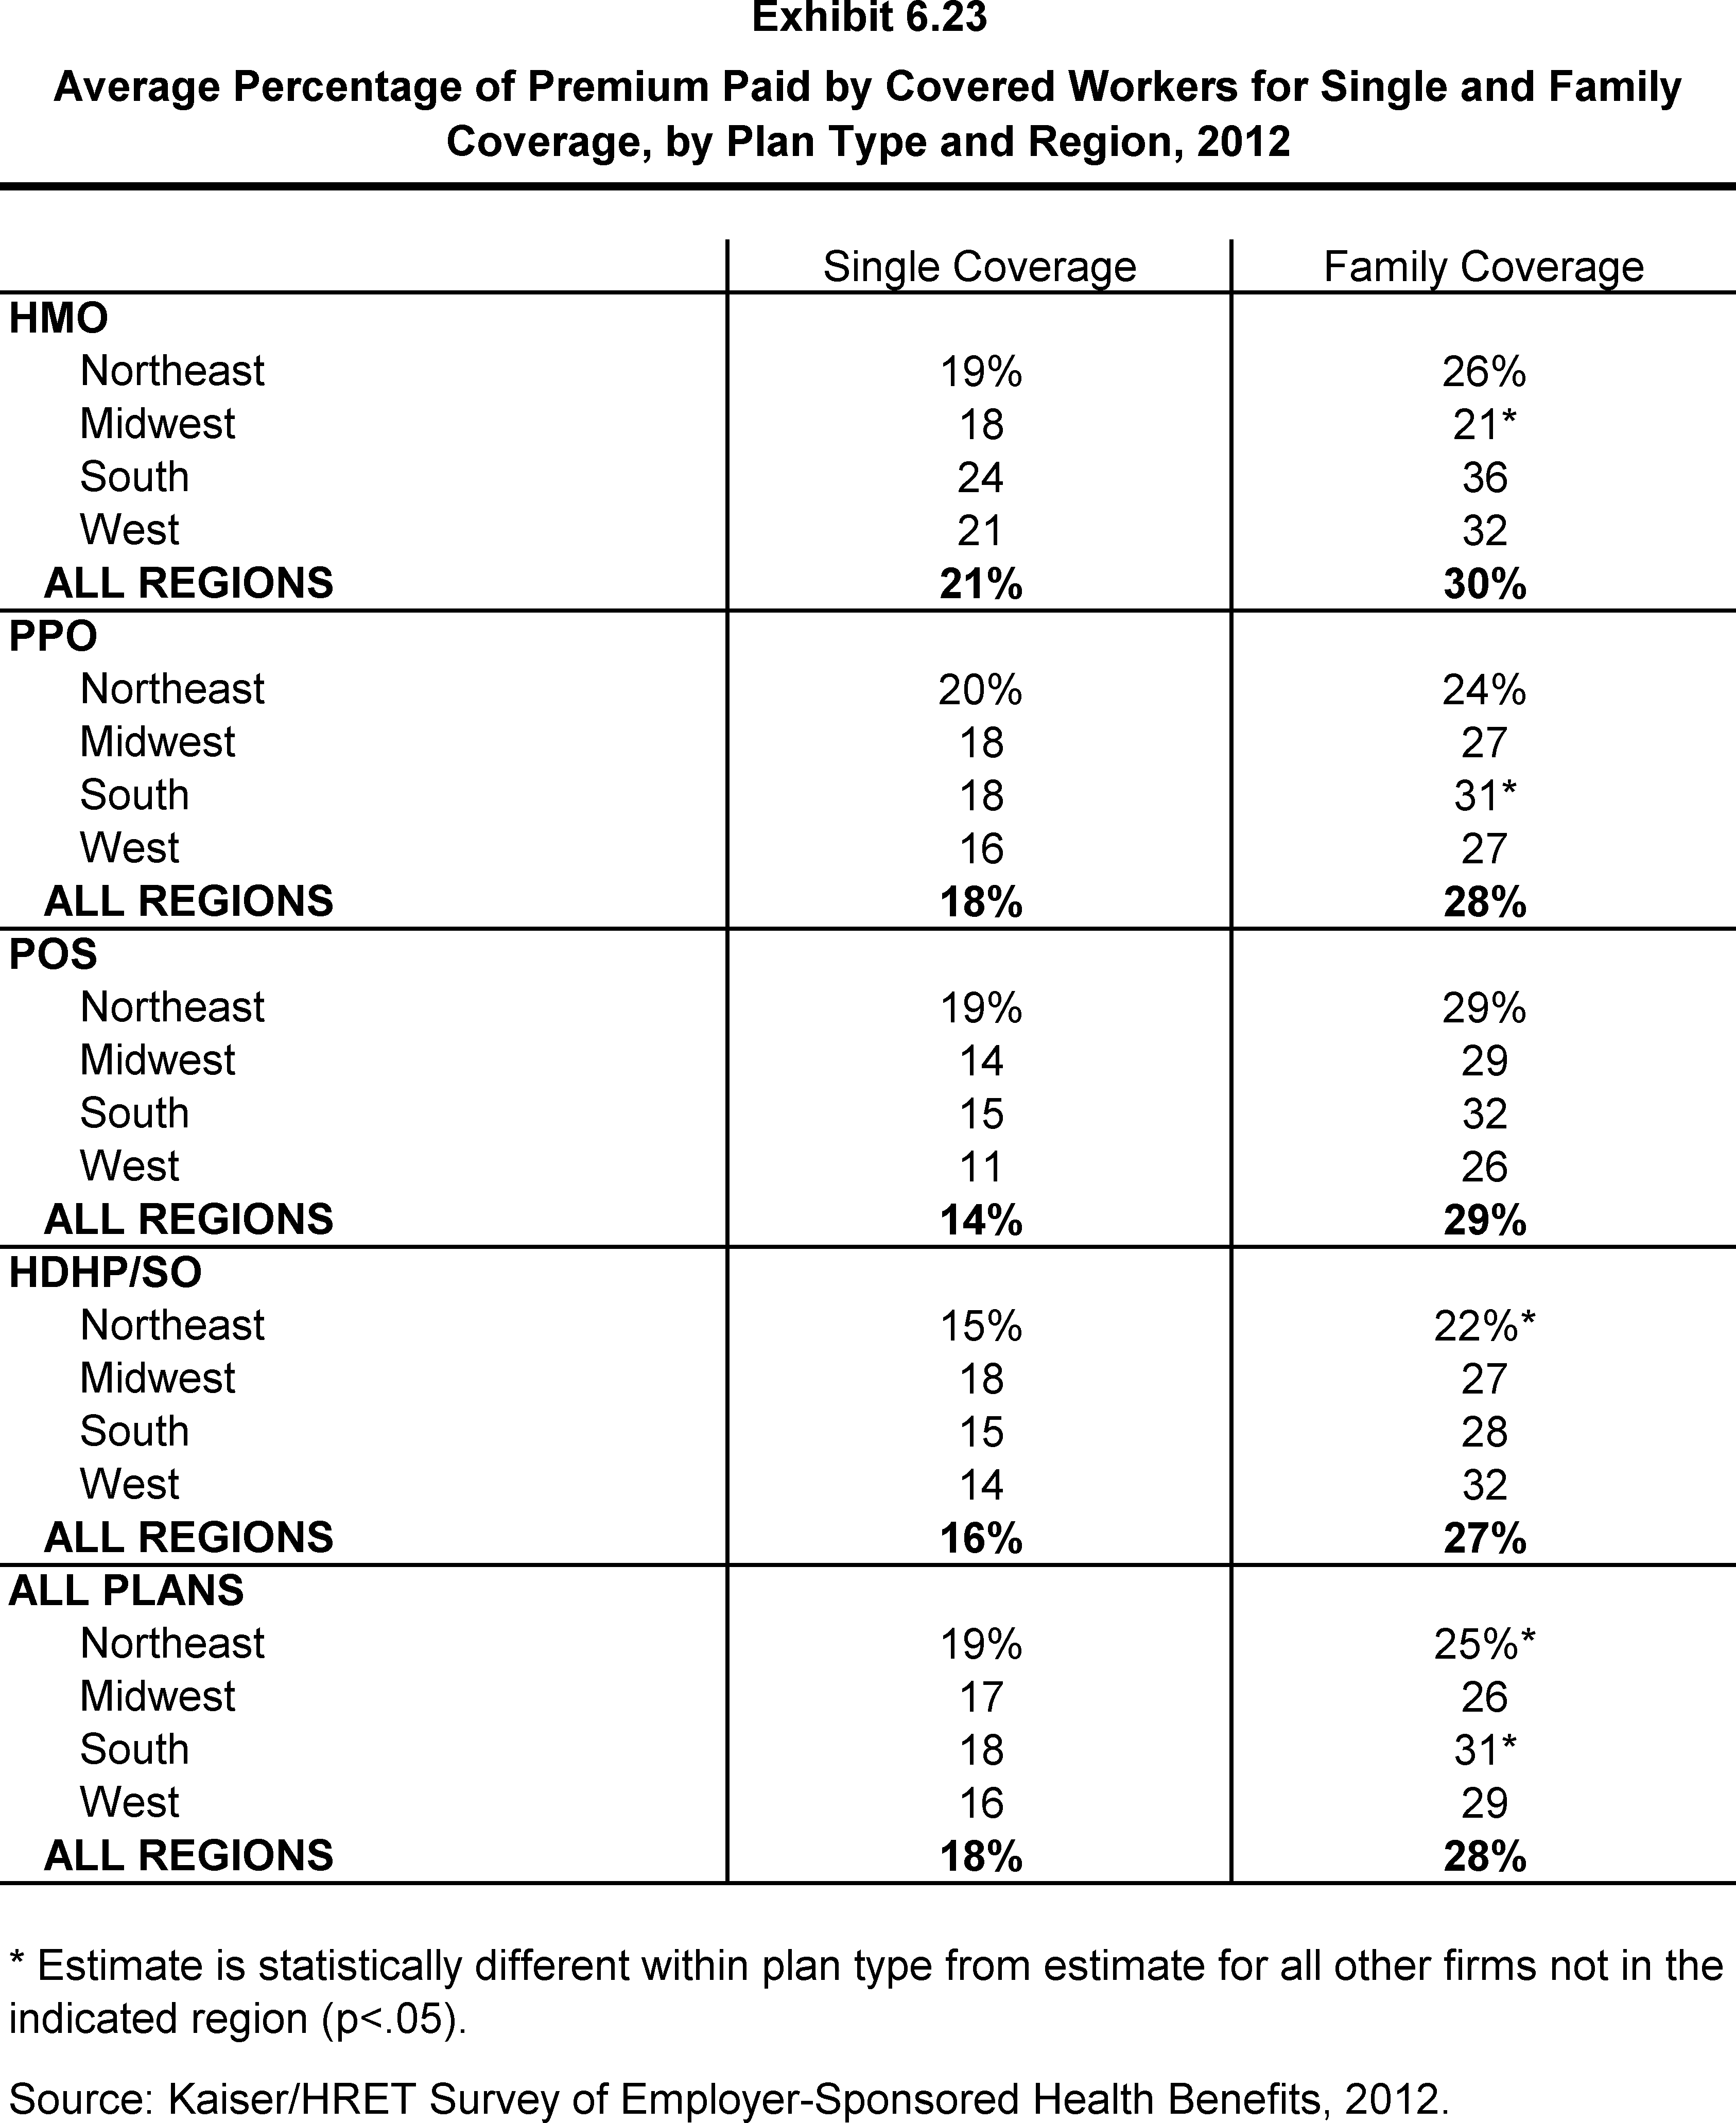
Average Percentage of Premium Paid by Covered Workers for Single and Family Coverage, by Plan Type and Region, 2012
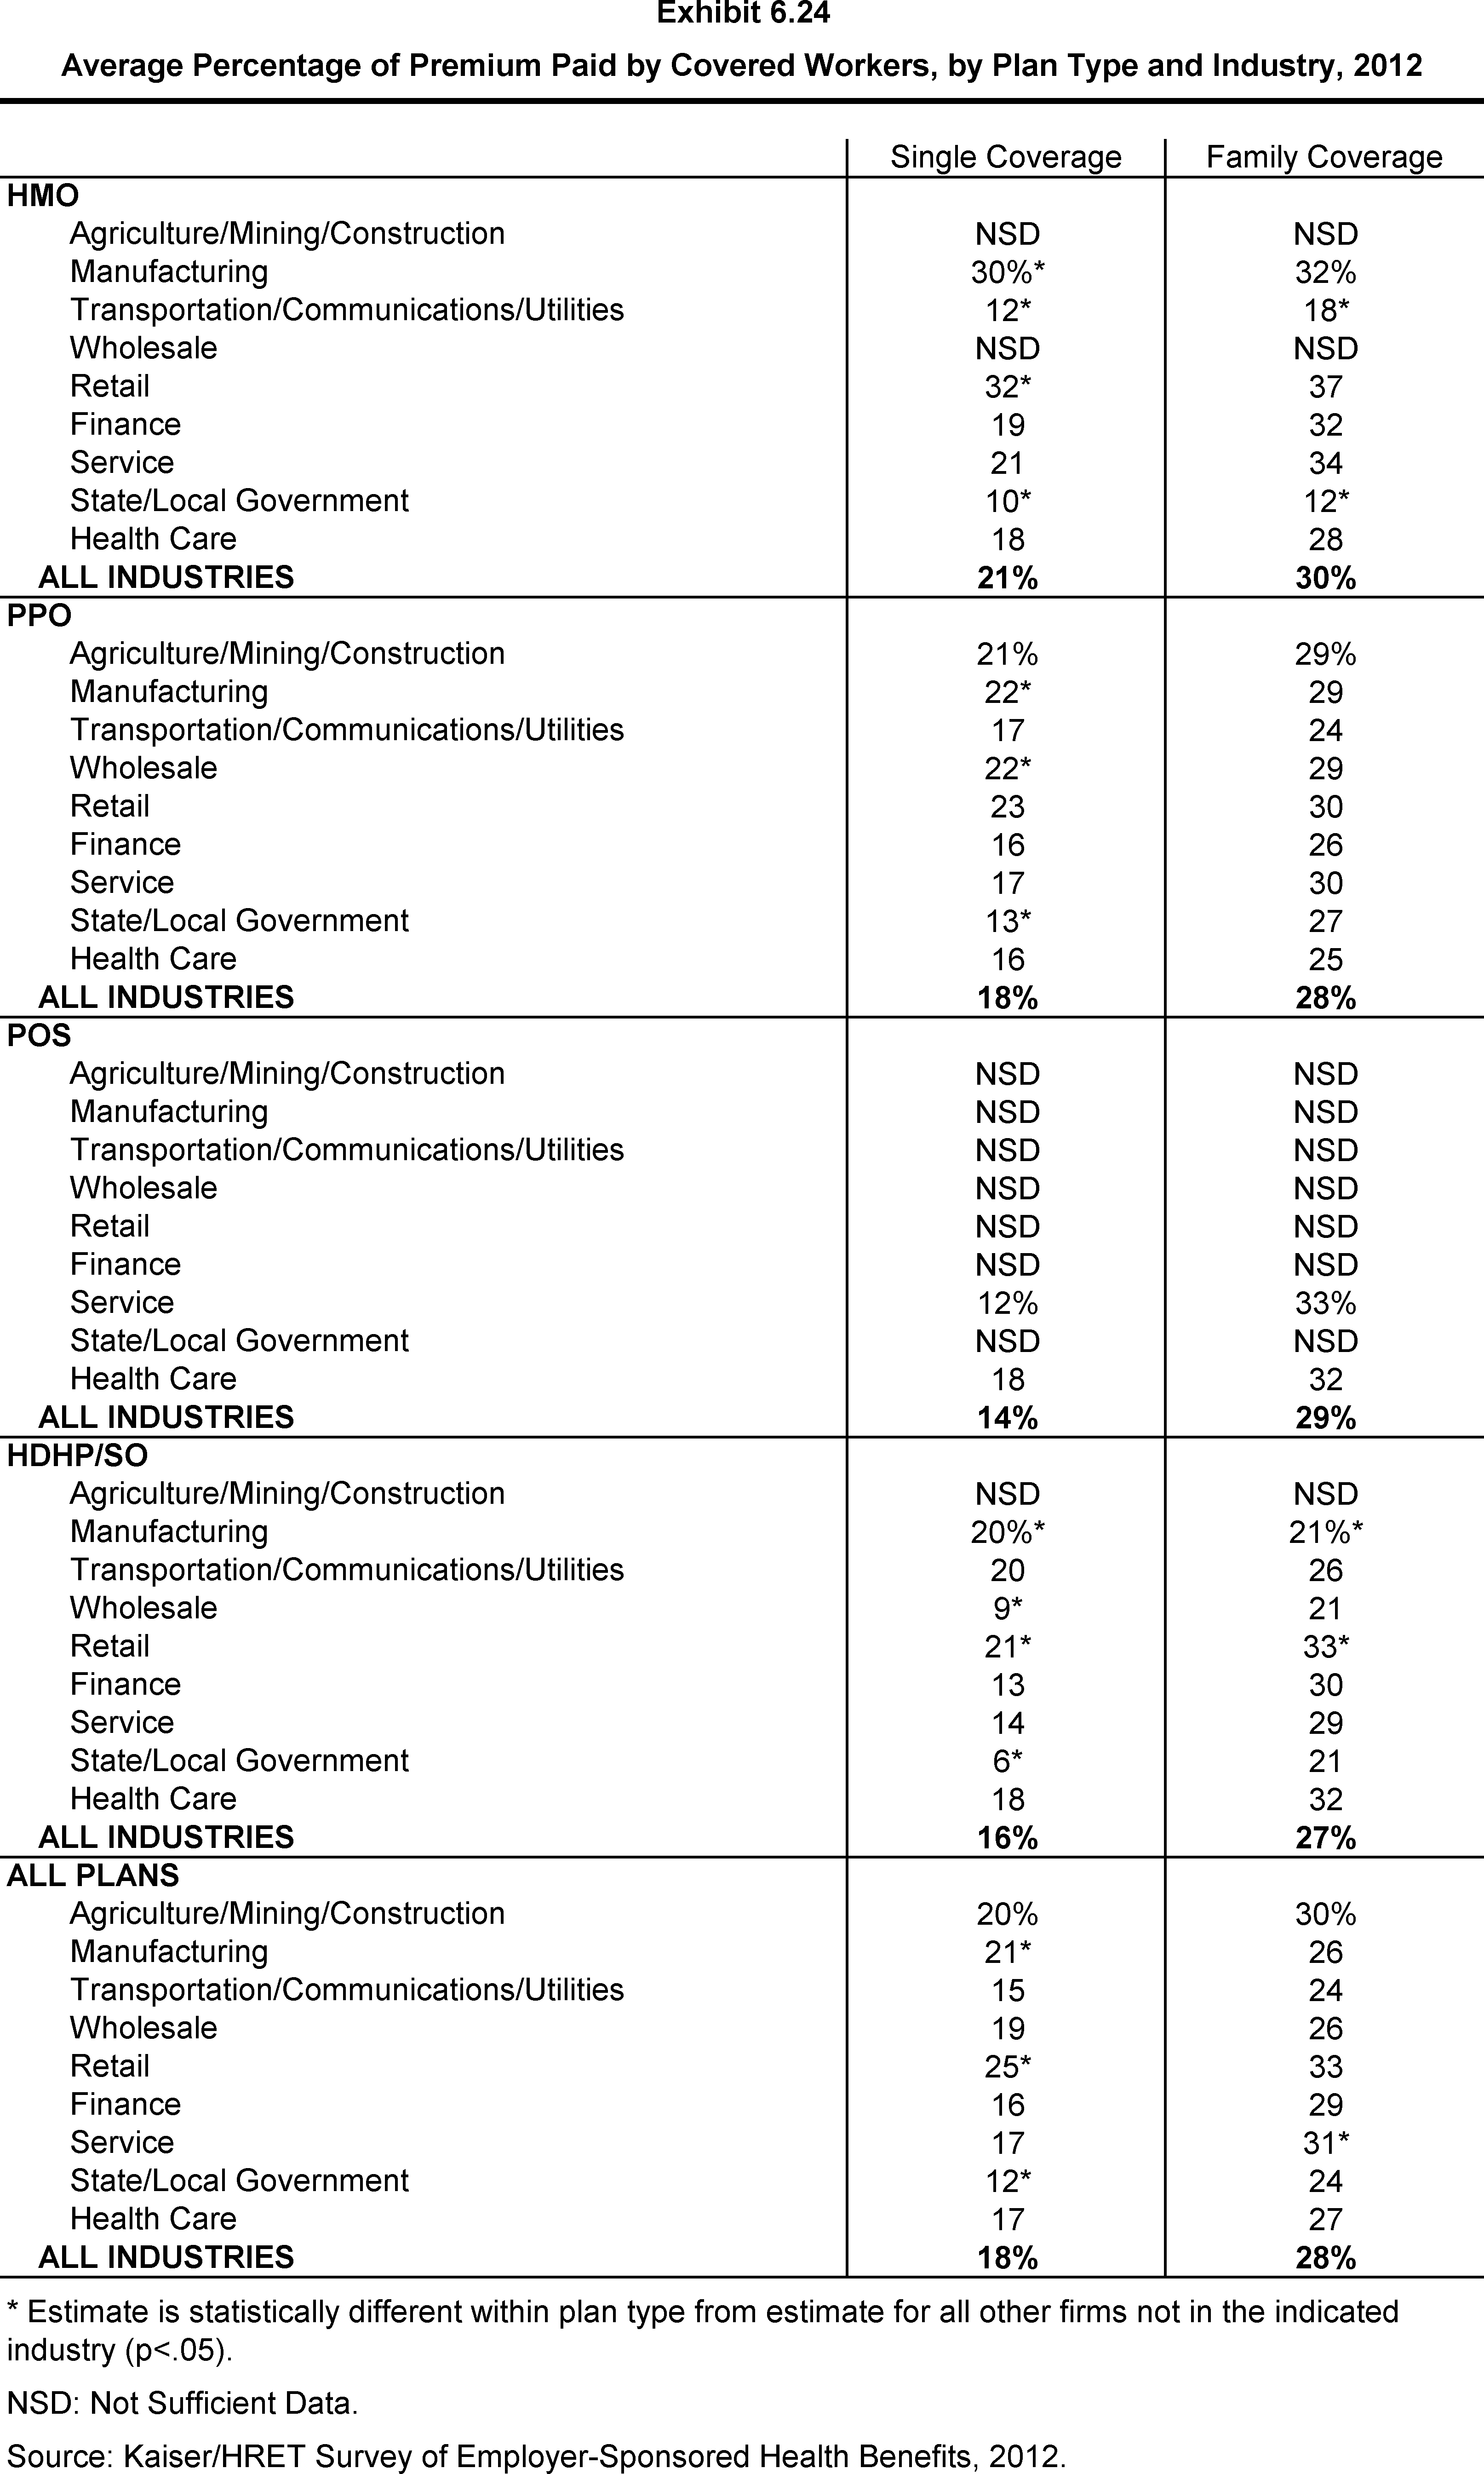
Average Percentage of Premium Paid by Covered Workers, by Plan Type and Industry, 2012
Among Firms Offering Health Benefits with Fewer Than 20 Employees, Variations in Premiums and Firm Premium Contributions for Single Coverage, 2012
Among Firms Offering Health Benefits, Percentage That Vary Worker Premium Contributions by Wage Level, by Firm Size and Region, 2012
Section 7: Employee Cost Sharing
In addition to any required premium contributions, covered workers may face cost sharing for the medical services they use. Cost sharing for medical services can take a variety of forms, including deductibles (an amount that must be paid before some or all services are covered), copayments (fixed dollar amounts), and/or coinsurance (a percentage of the charge for services). The type and level of cost sharing often vary by the type of plan in which the worker is enrolled. Cost sharing may also vary by the type of service, such as office visits, hospitalizations, or prescription drugs.
The cost-sharing amounts reported here are for covered workers using services provided in-network by participating providers. Plan enrollees receiving services from providers that do not participate in plan networks often face higher cost sharing and may be responsible for charges that exceed plan allowable amounts. The framework of this survey does not allow us to capture all of the complex cost-sharing requirements in modern plans, particularly for ancillary services (such as durable medical equipment or physical therapy) or cost-sharing arrangements that vary across different settings (such as tiered networks). Therefore, we do not collect information on all plan provisions and limits that affect enrollee out-of-pocket liability.
General Annual Deductibles
- A general annual deductible is an amount that must be paid by the enrollee before all or most services are covered by their health plan. The likelihood of having a deductible varies by plan type.
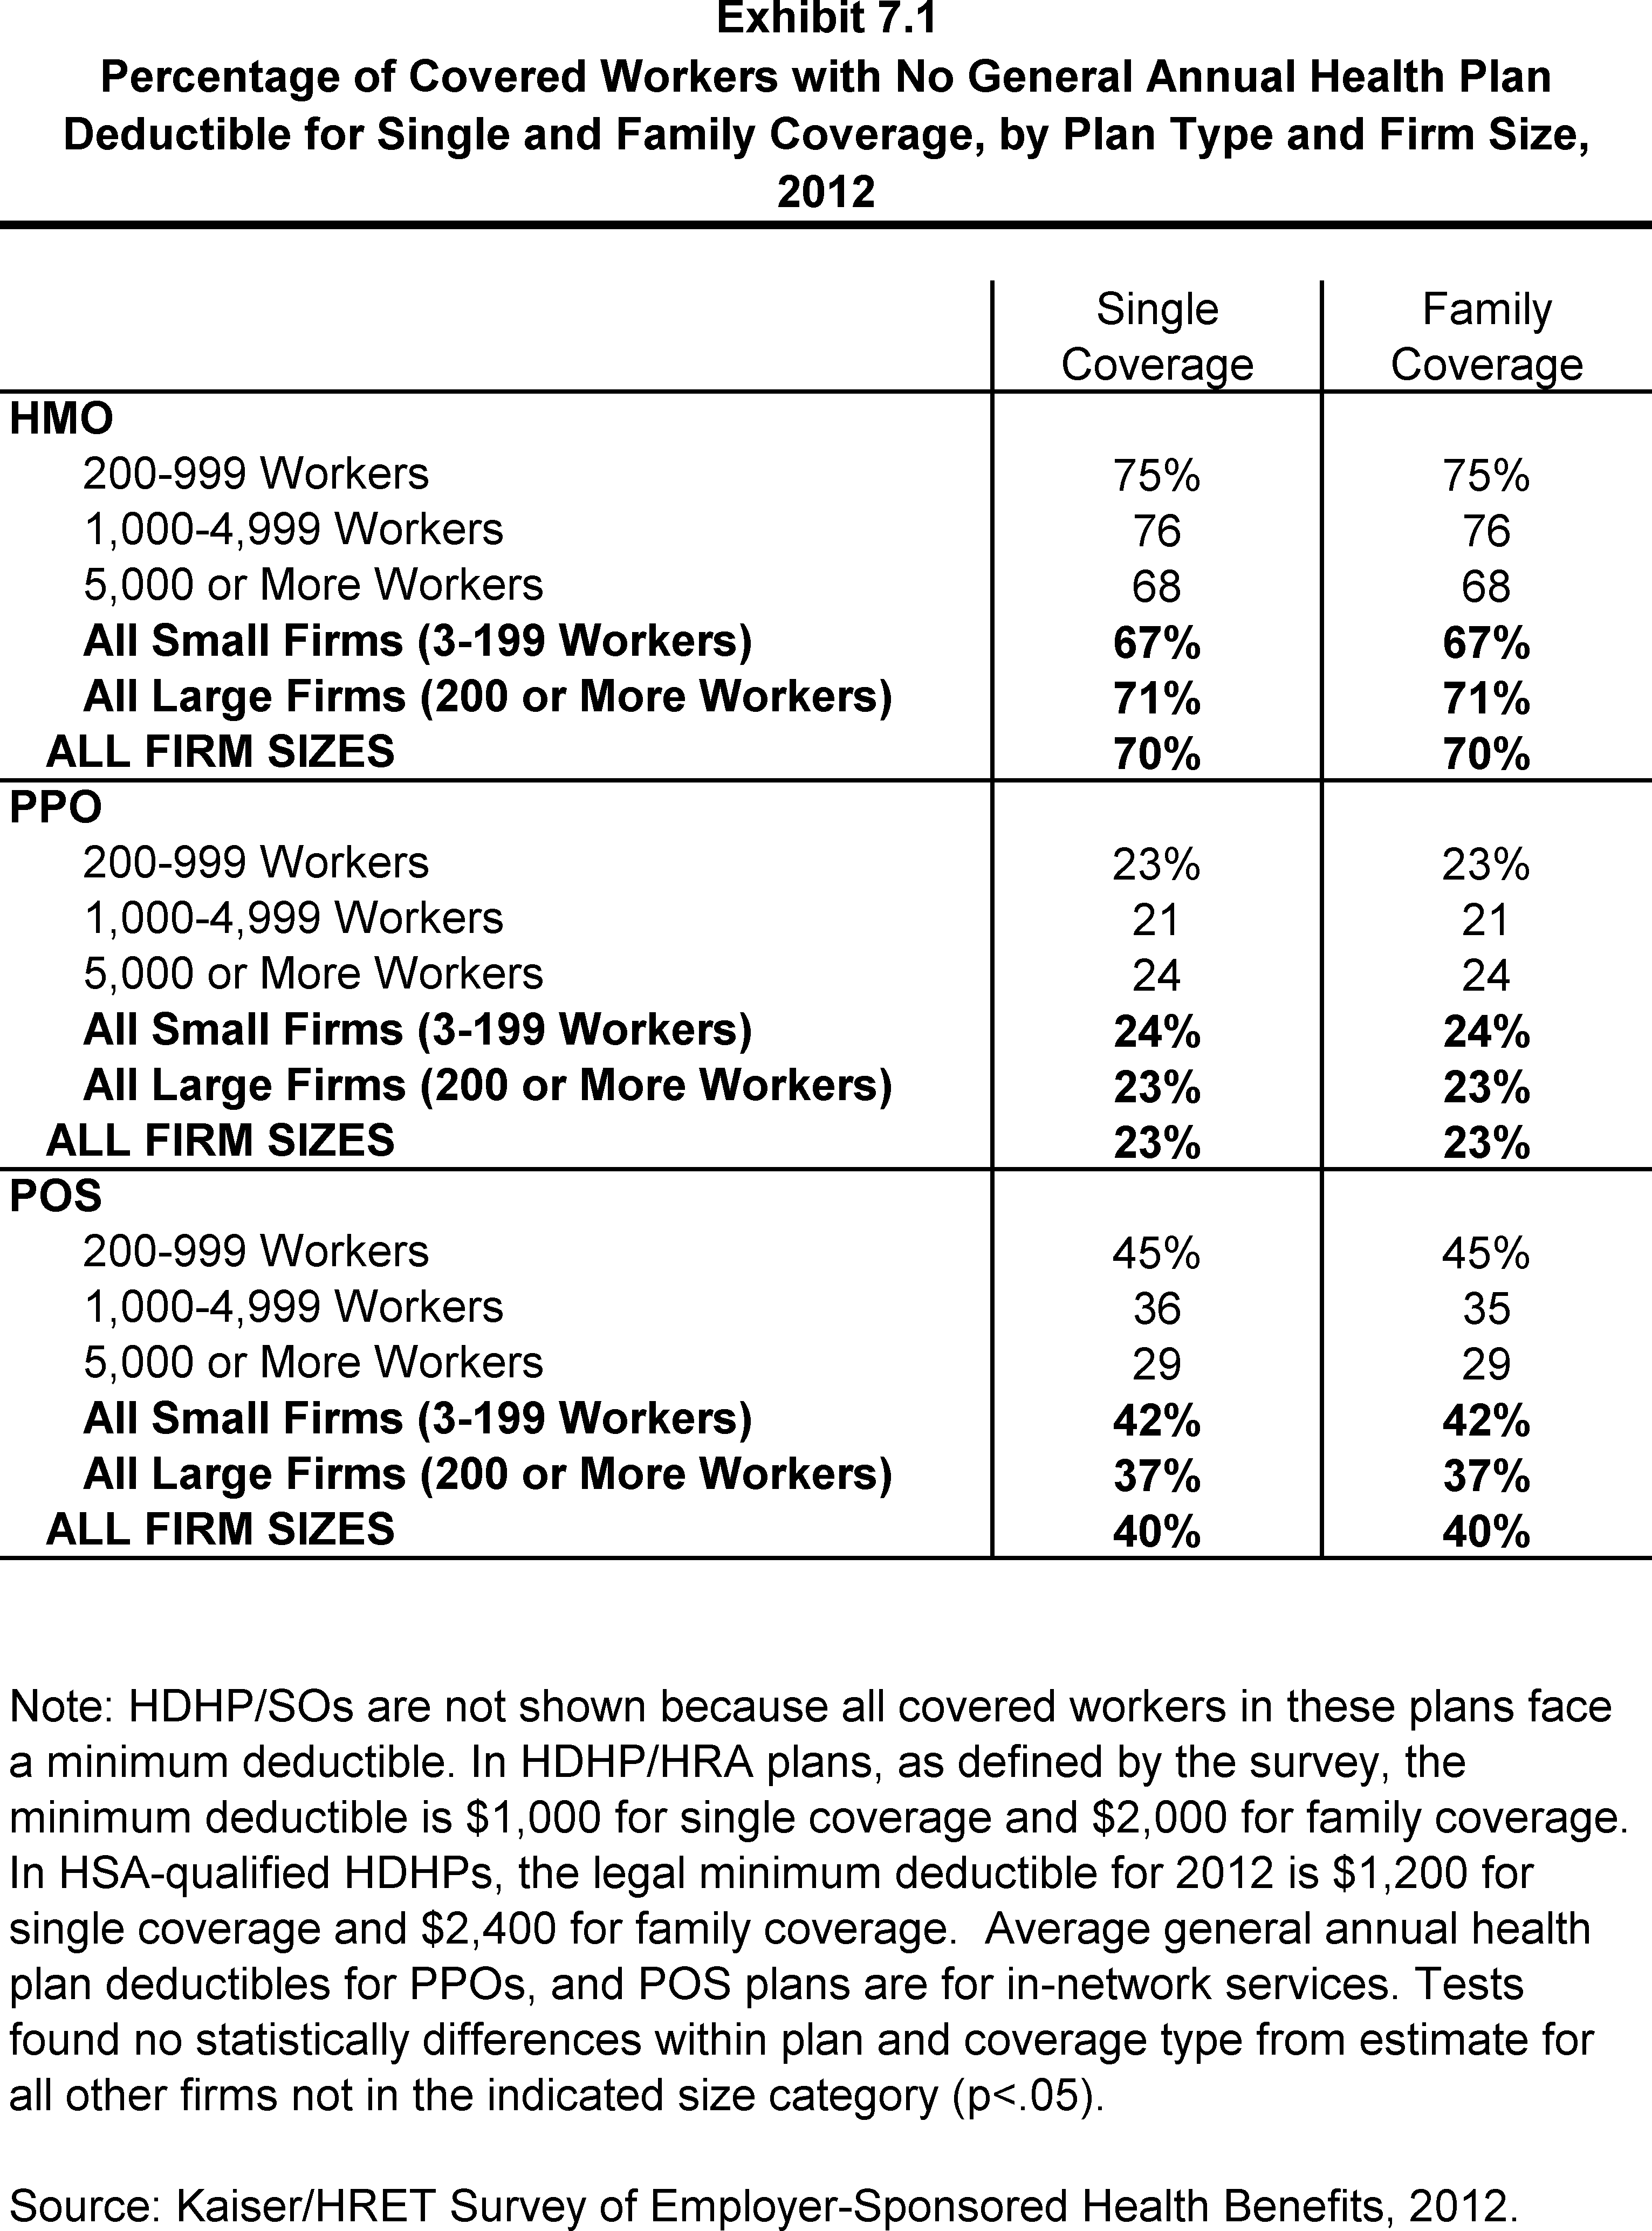
- Workers in HMOs are less likely to have a general annual deductible for single coverage compared to workers in other plan types. Seventy percent of workers in HMOs do not have a general annual deductible, compared to 40% of workers in POS plans and 23% of workers in PPOs (Exhibit 7.1).
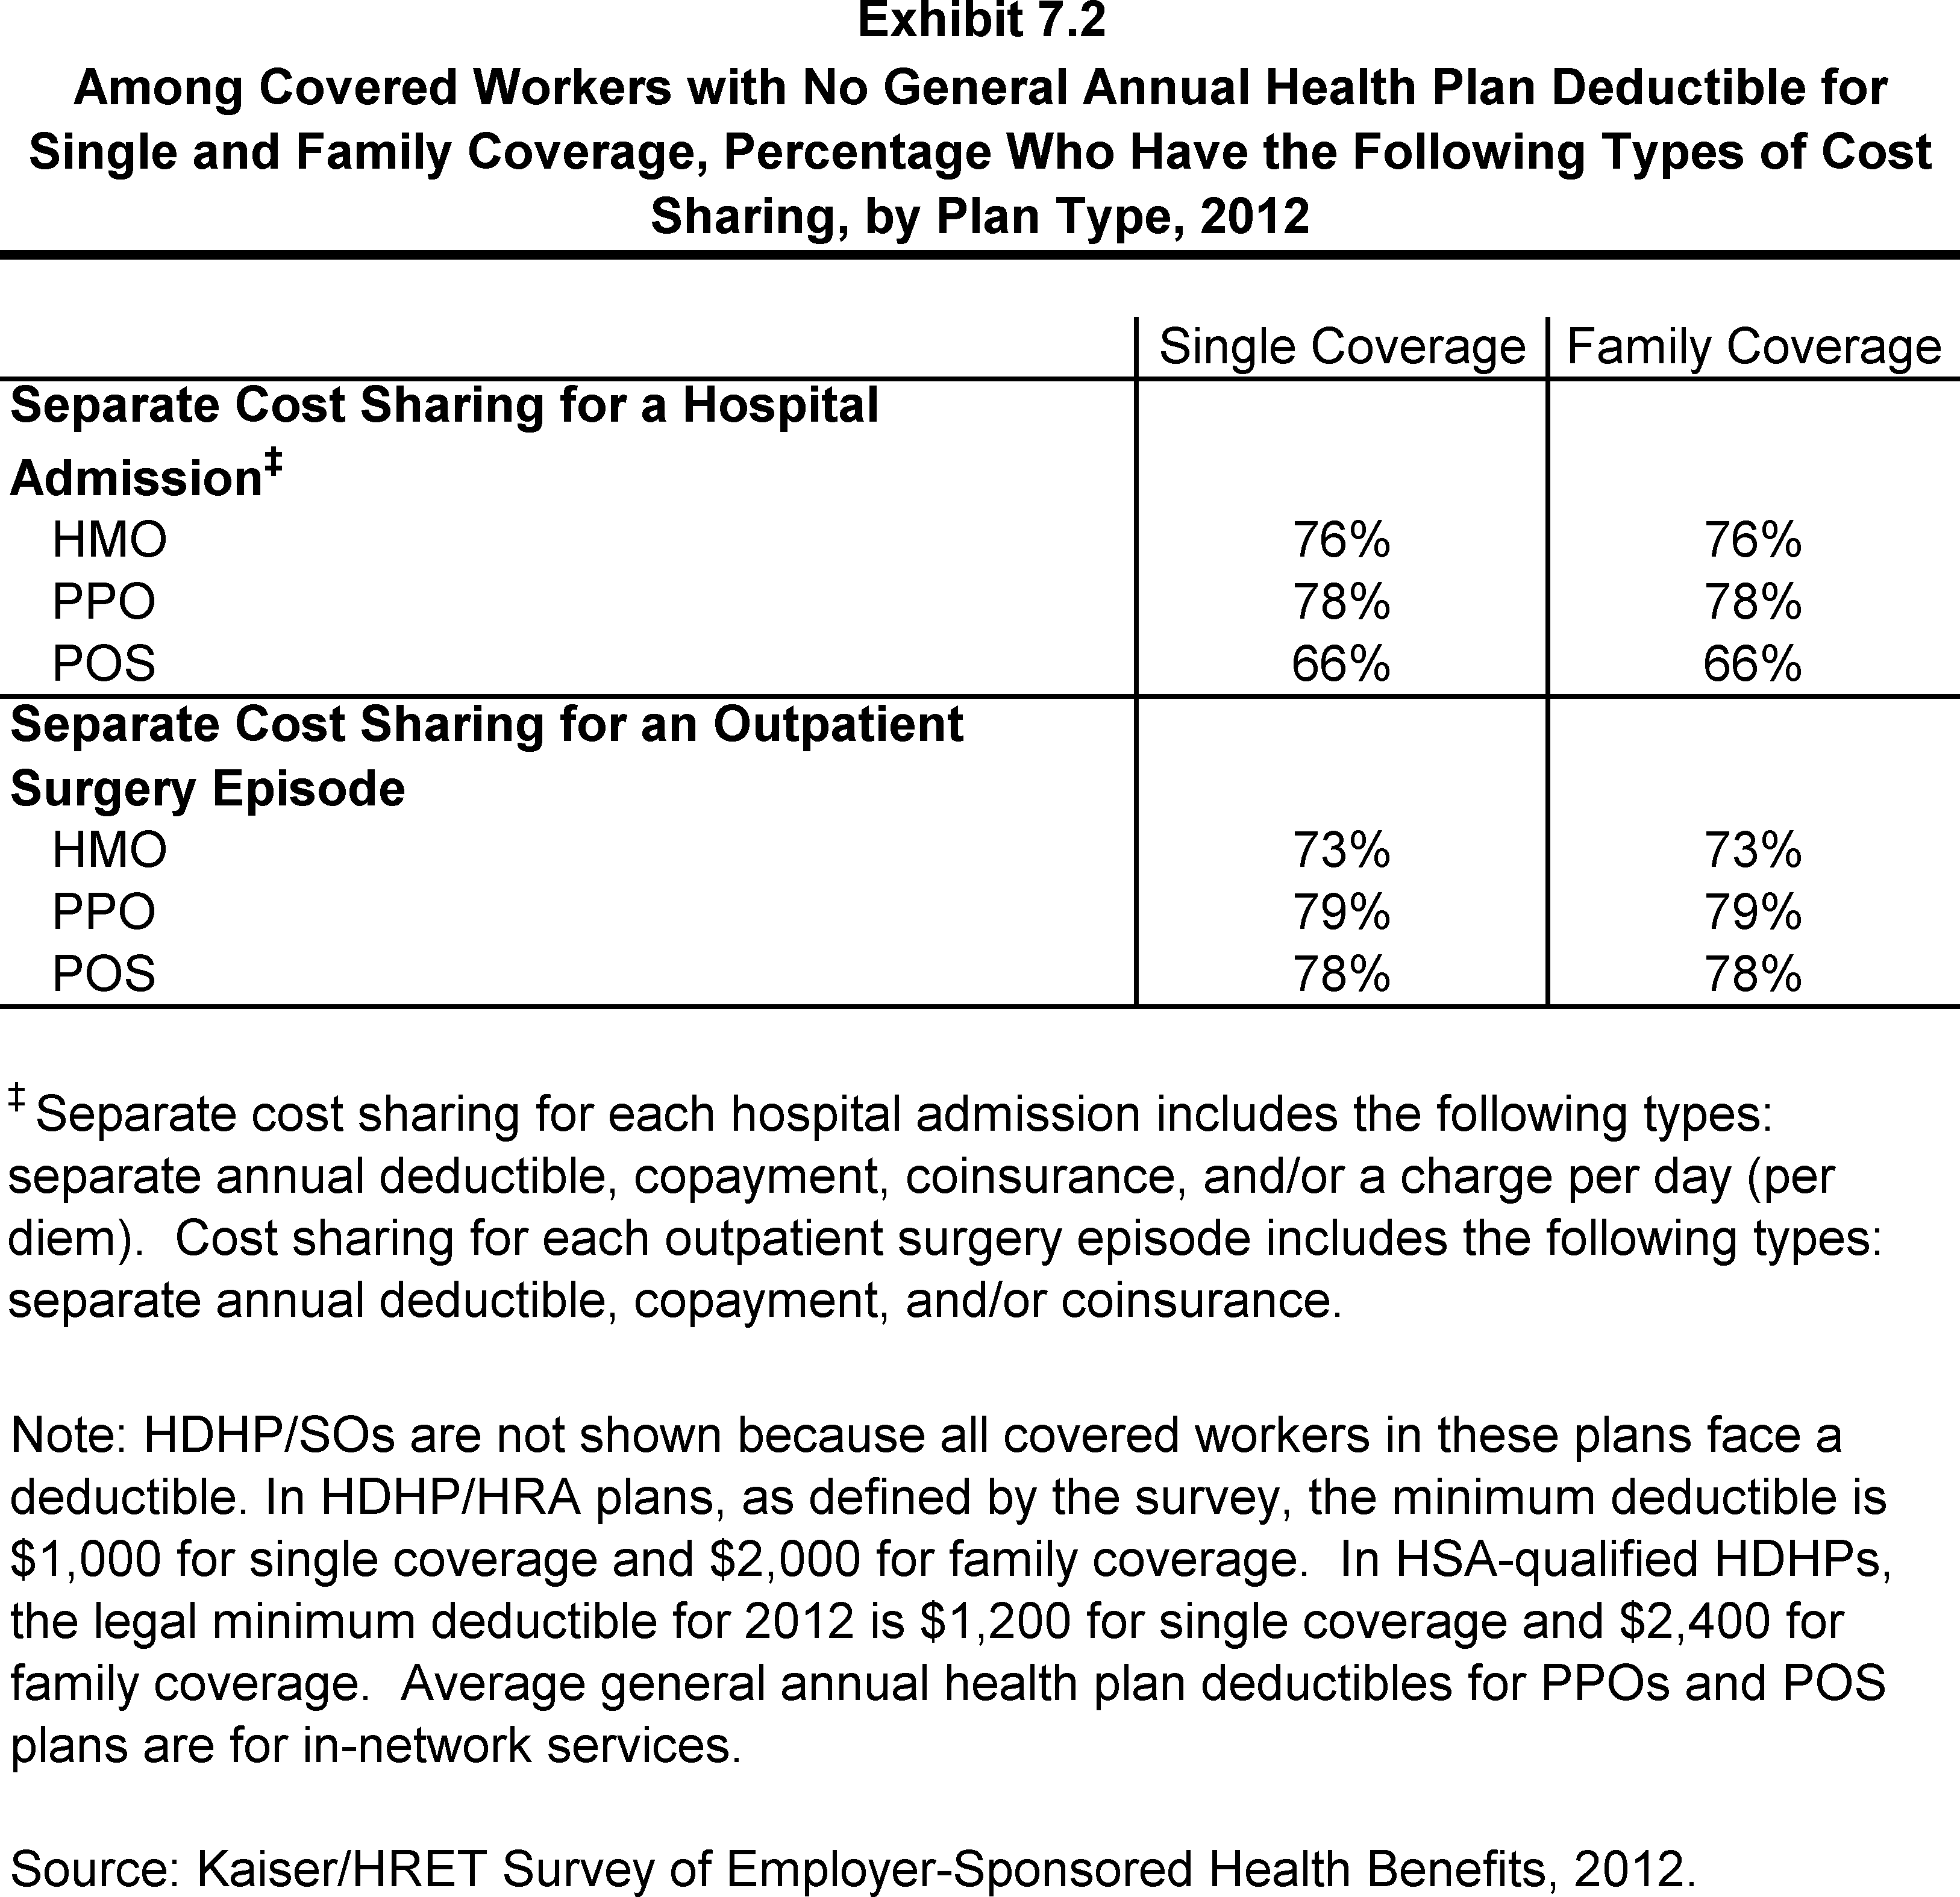
- Workers without a general annual plan deductible often have other forms of cost sharing for medical services. For workers without a general annual deductible for single coverage, 76% in HMOs, 78% in PPOs, and 66% in POS plans are in plans that require cost sharing for hospital admissions. The percentages are similar for family coverage (Exhibit 7.2).
- General annual deductibles vary greatly by plan type and firm size.
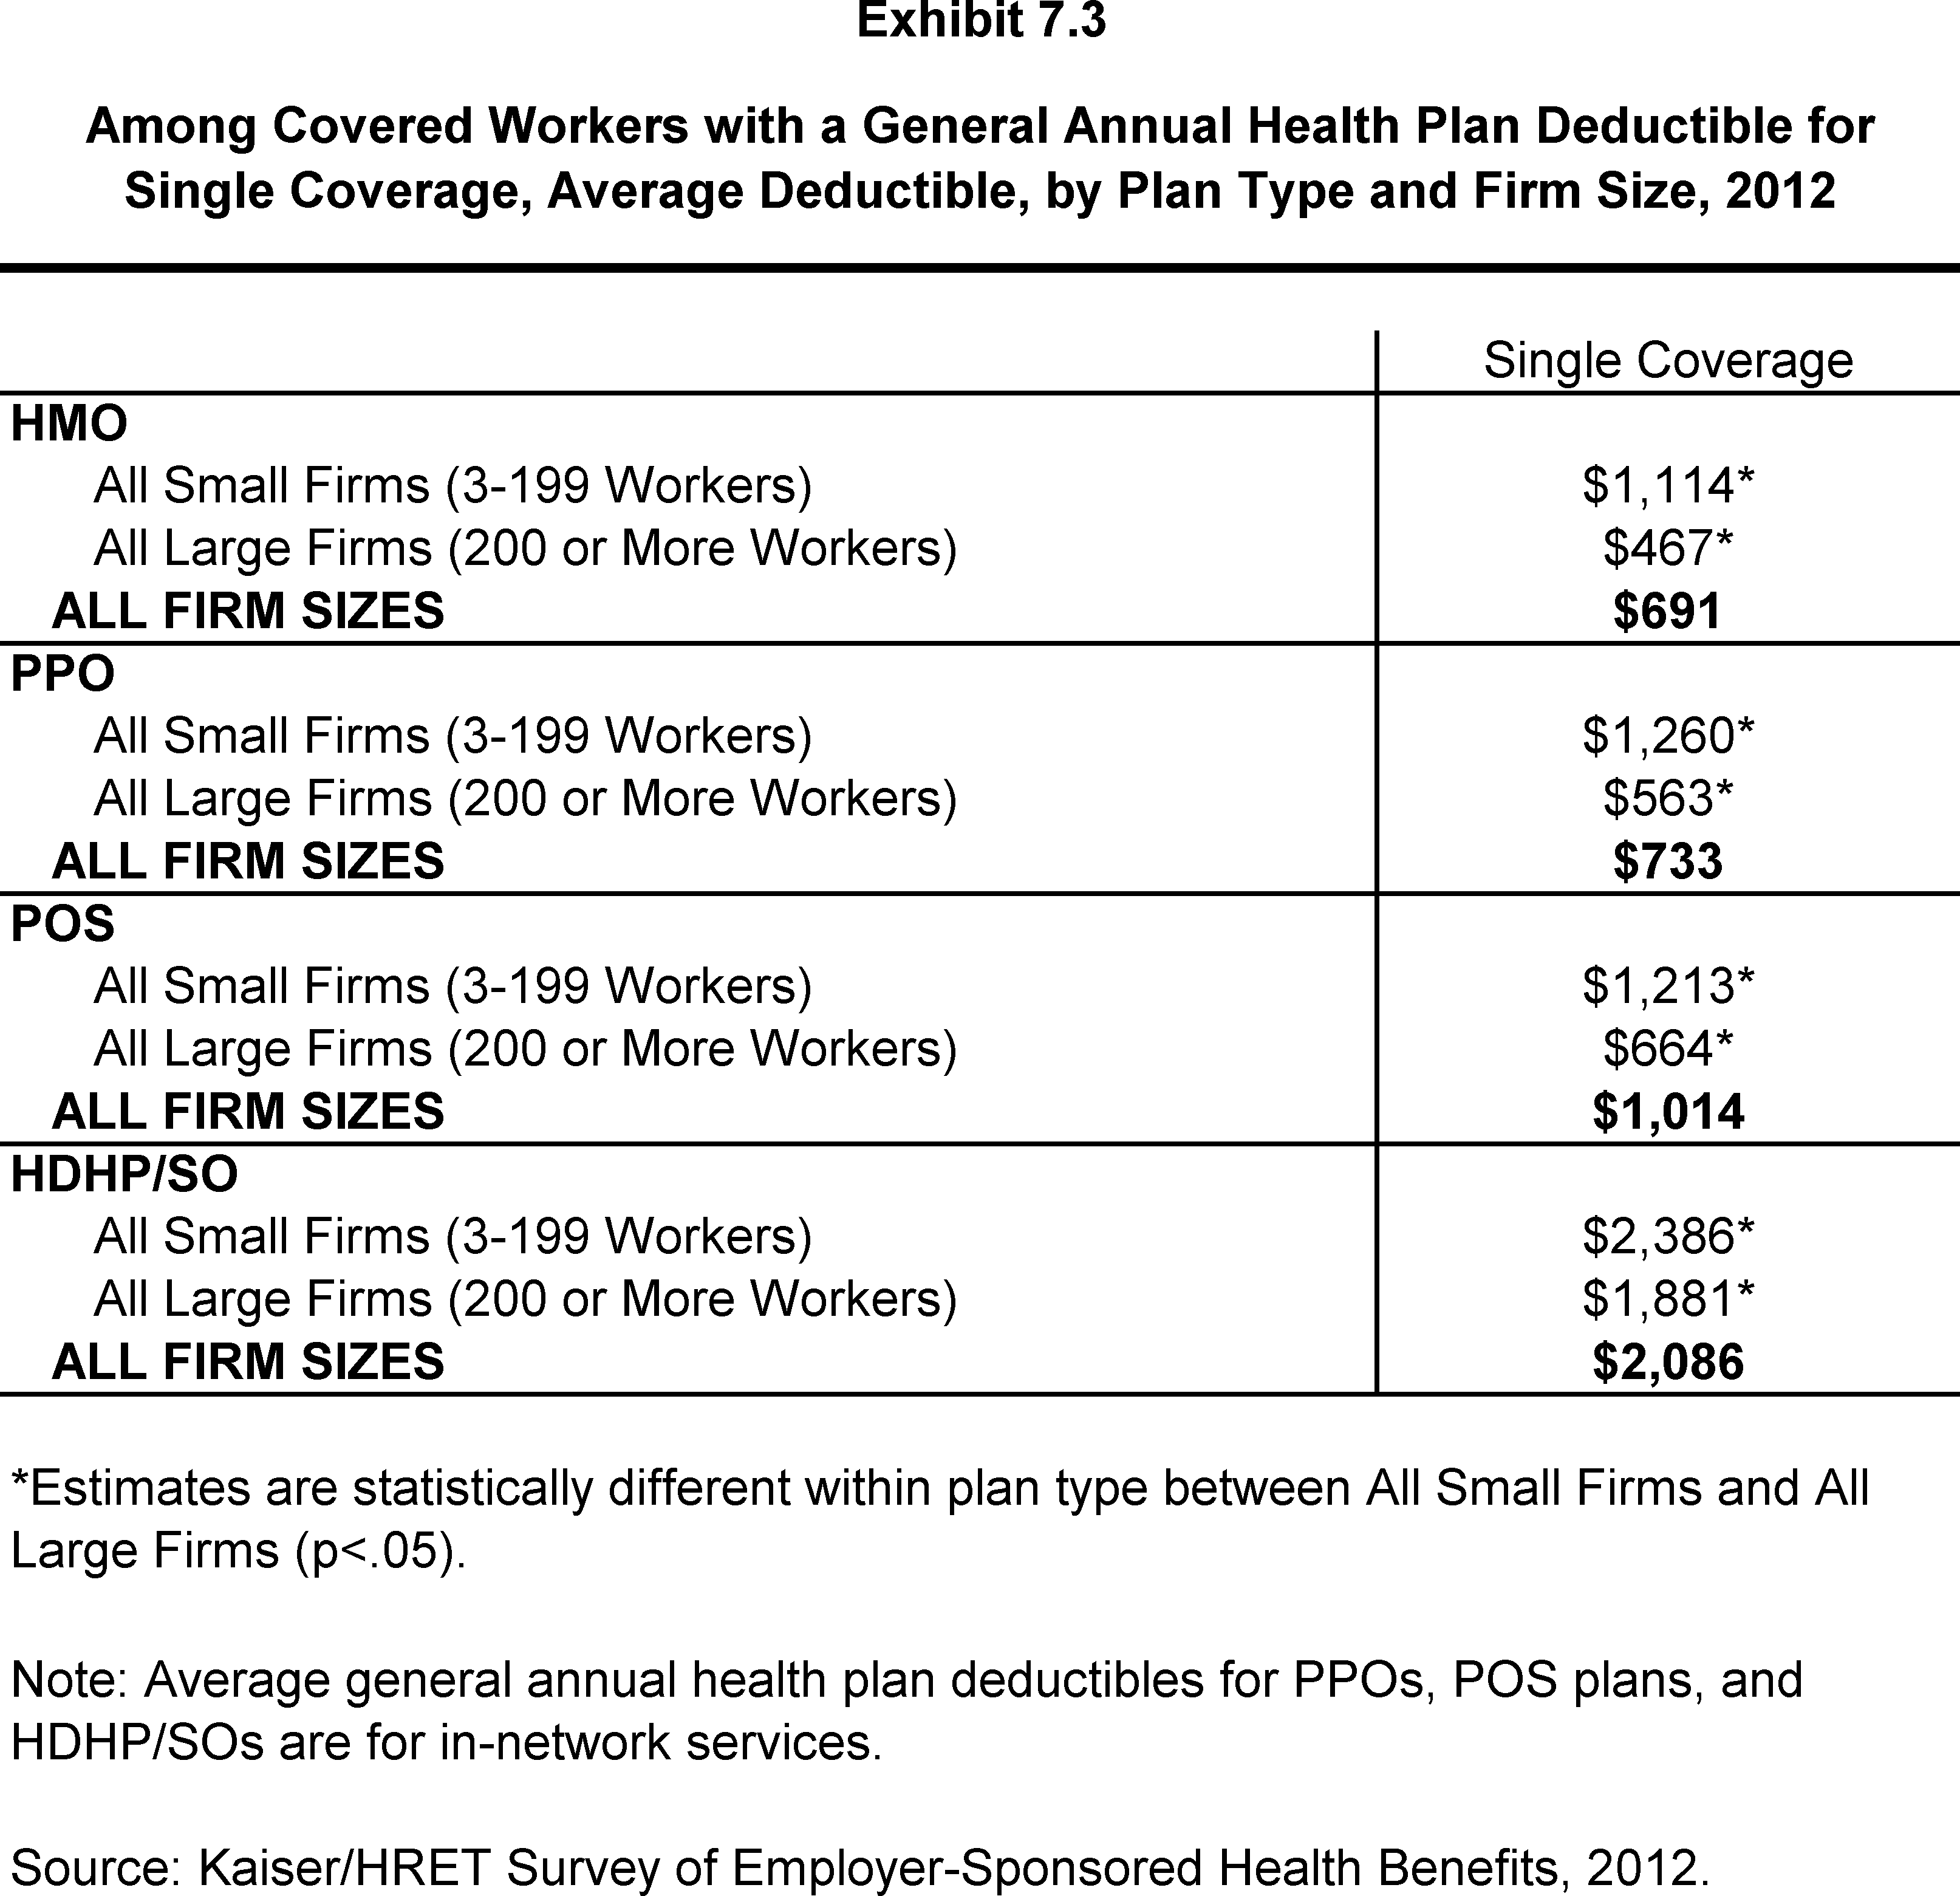
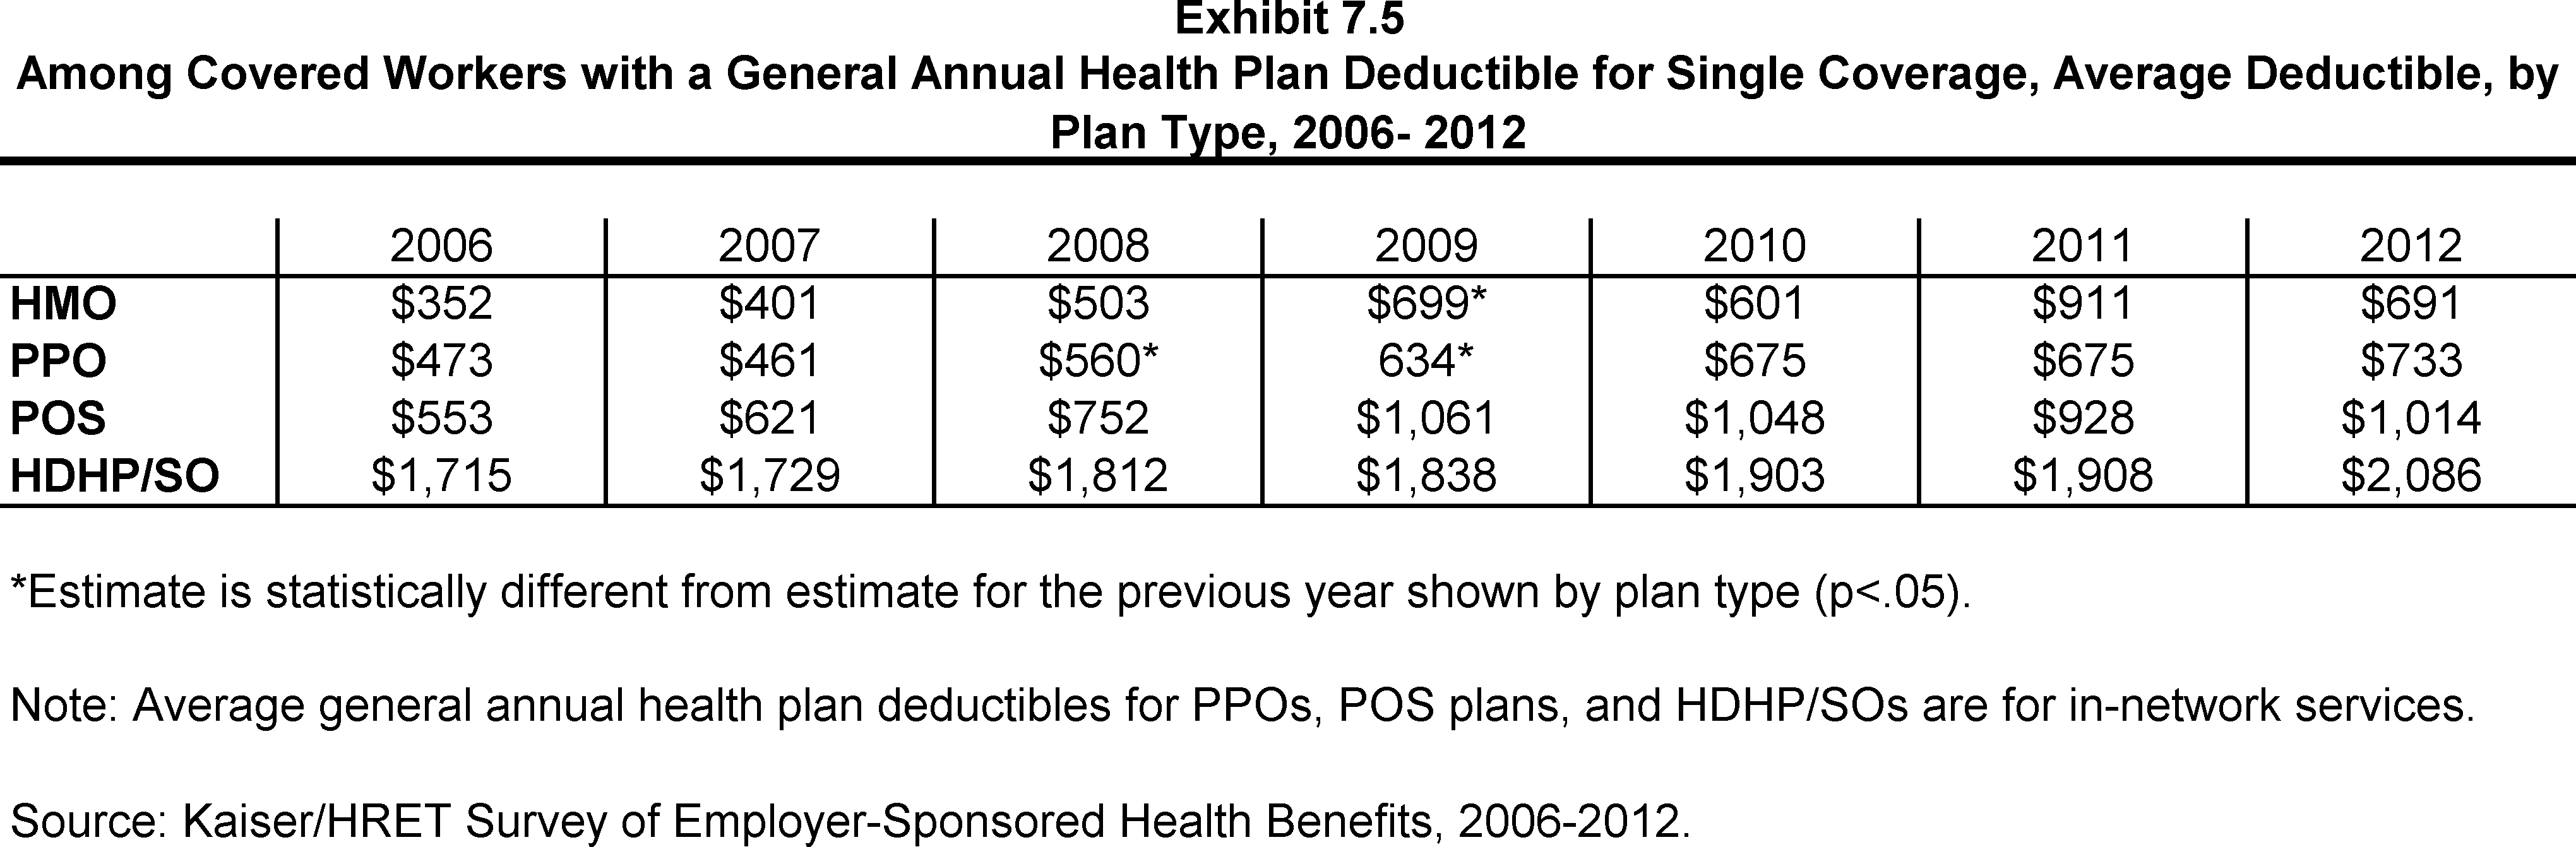
- The average annual deductibles among those workers with a deductible for single coverage are $691 for HMOs, $733 for PPOs, $1,014 for POS plans, and $2,086 for HDHP/SOs (Exhibit 7.3). There is no statistically significant change in deductible amounts from 2011 to 2012 for any plan type (Exhibit 7.5).
- Deductibles are generally higher for covered workers in plans sponsored by small firms (3-199 workers) than for covered workers in large firms (200 or more workers) (Exhibit 7.3). For covered workers in PPOs, deductibles in small firms are more than twice as large as in large firms ($1,260 vs. $563).
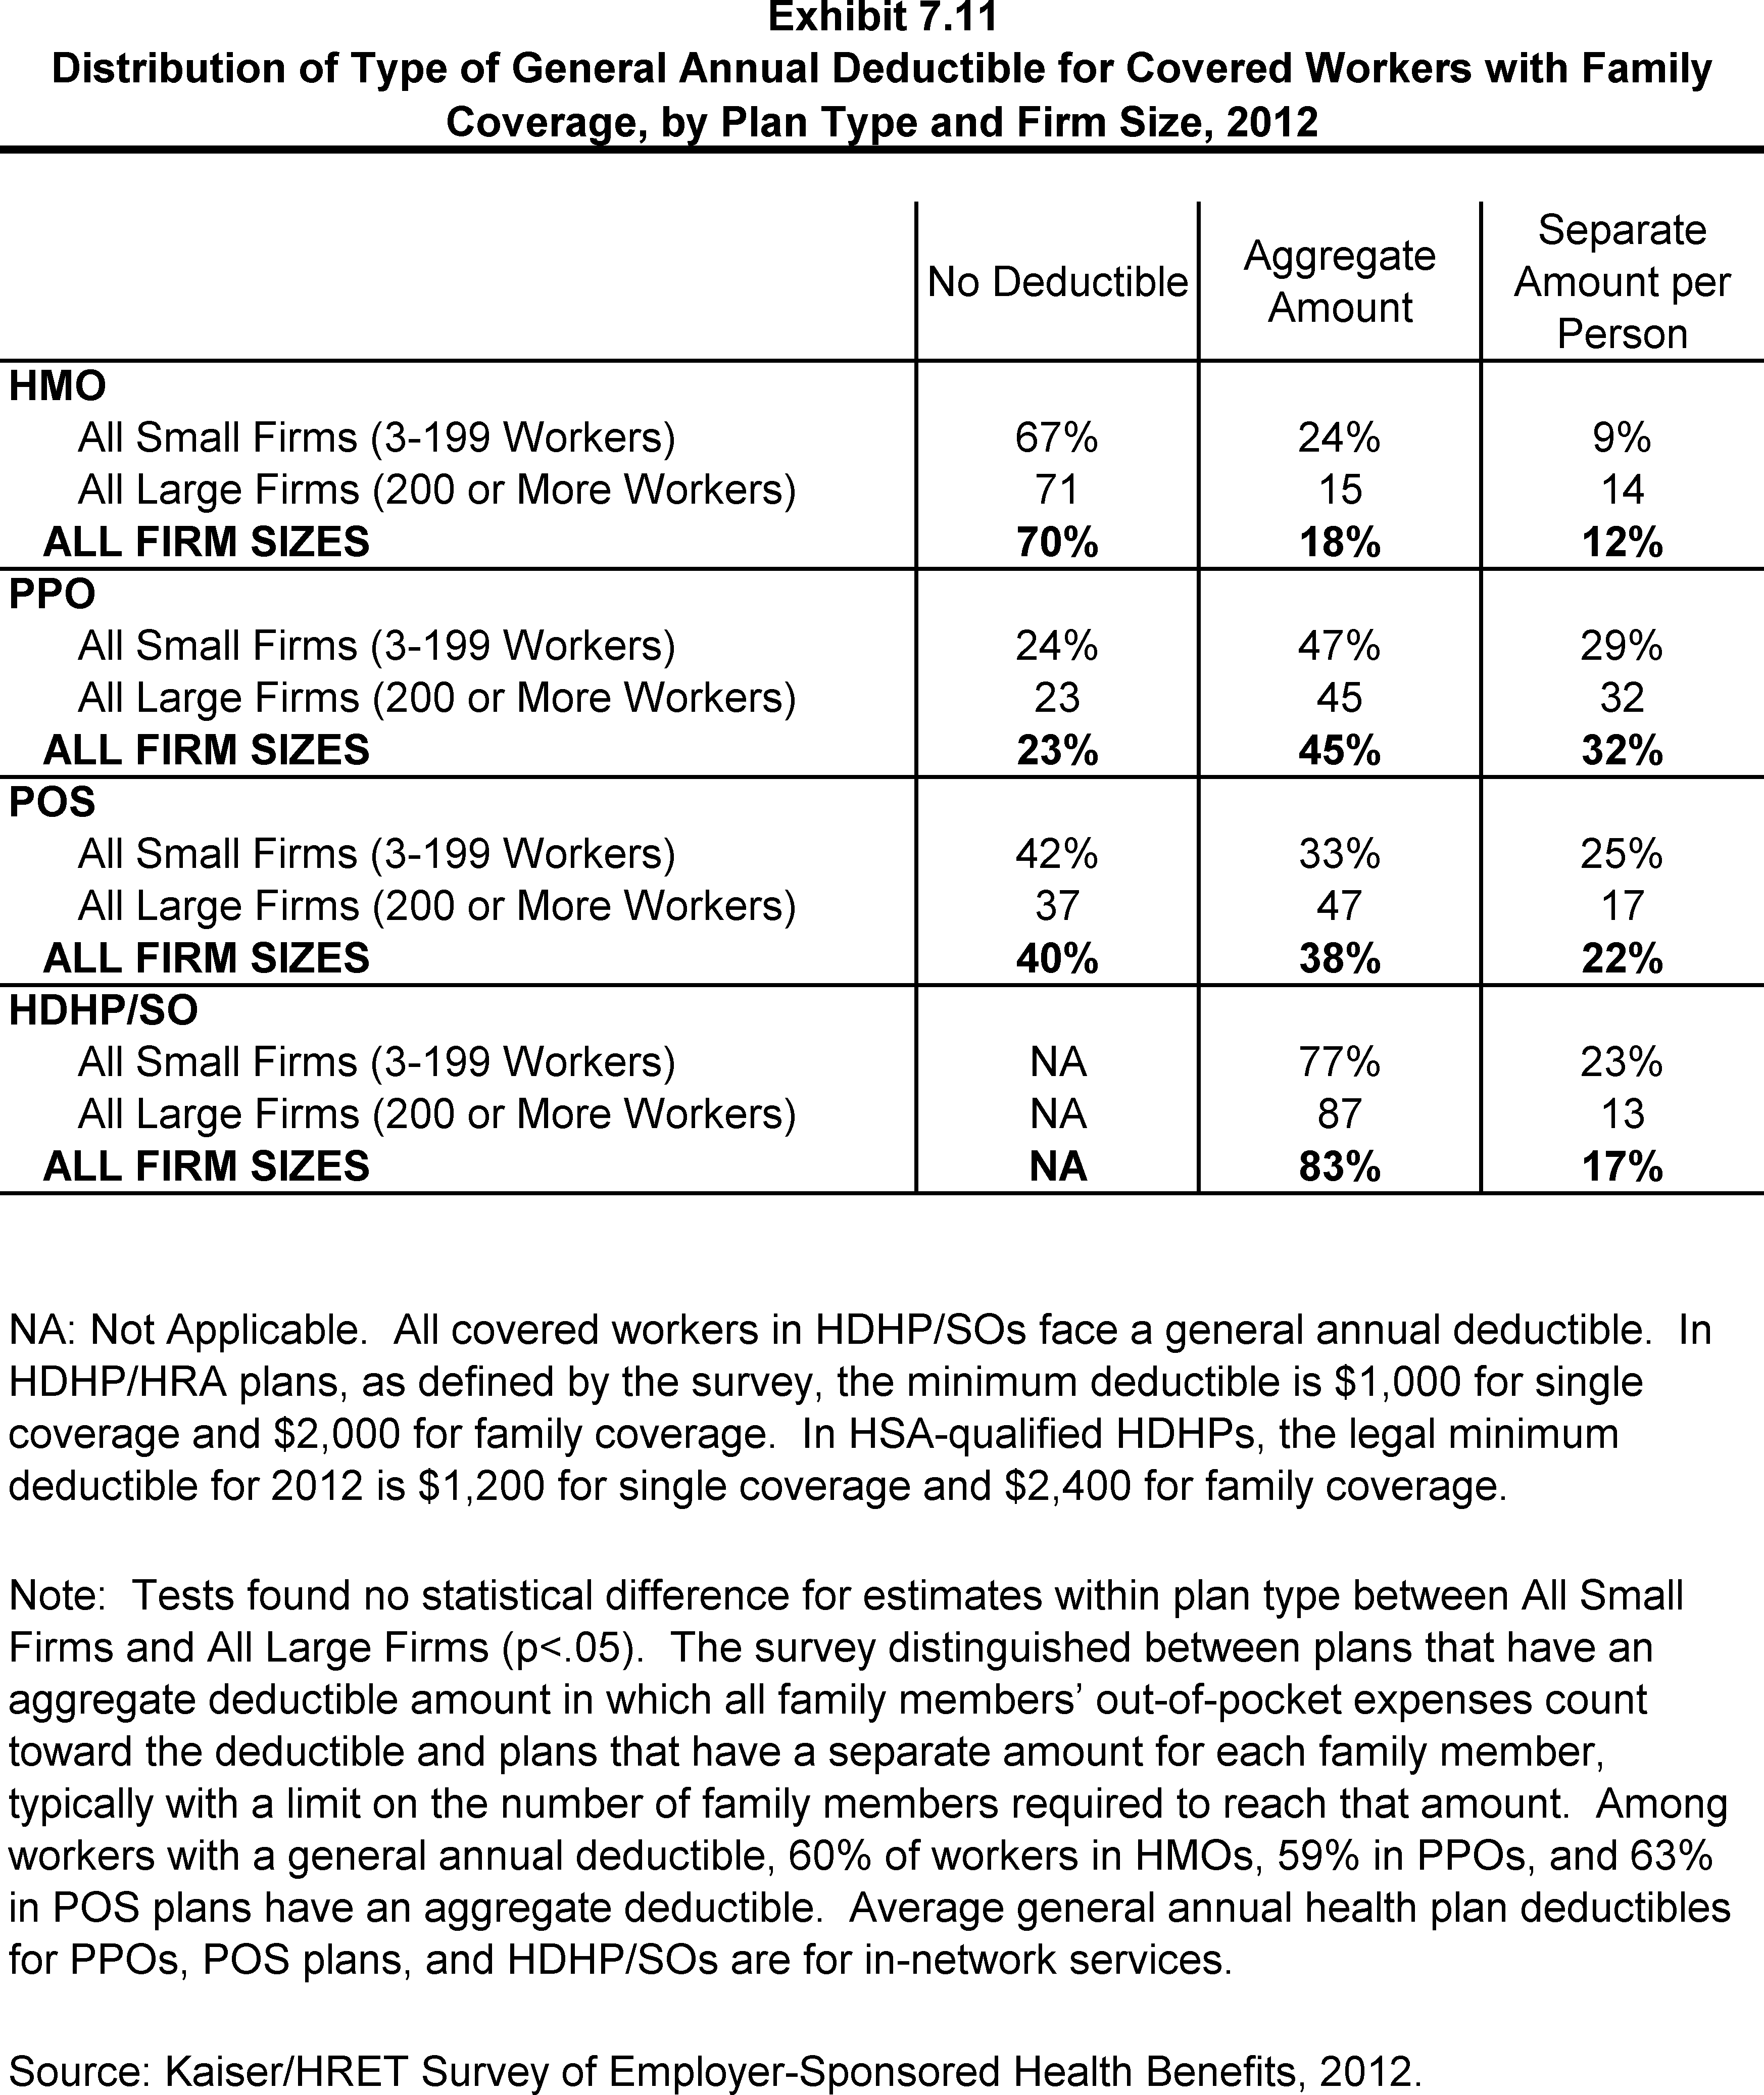
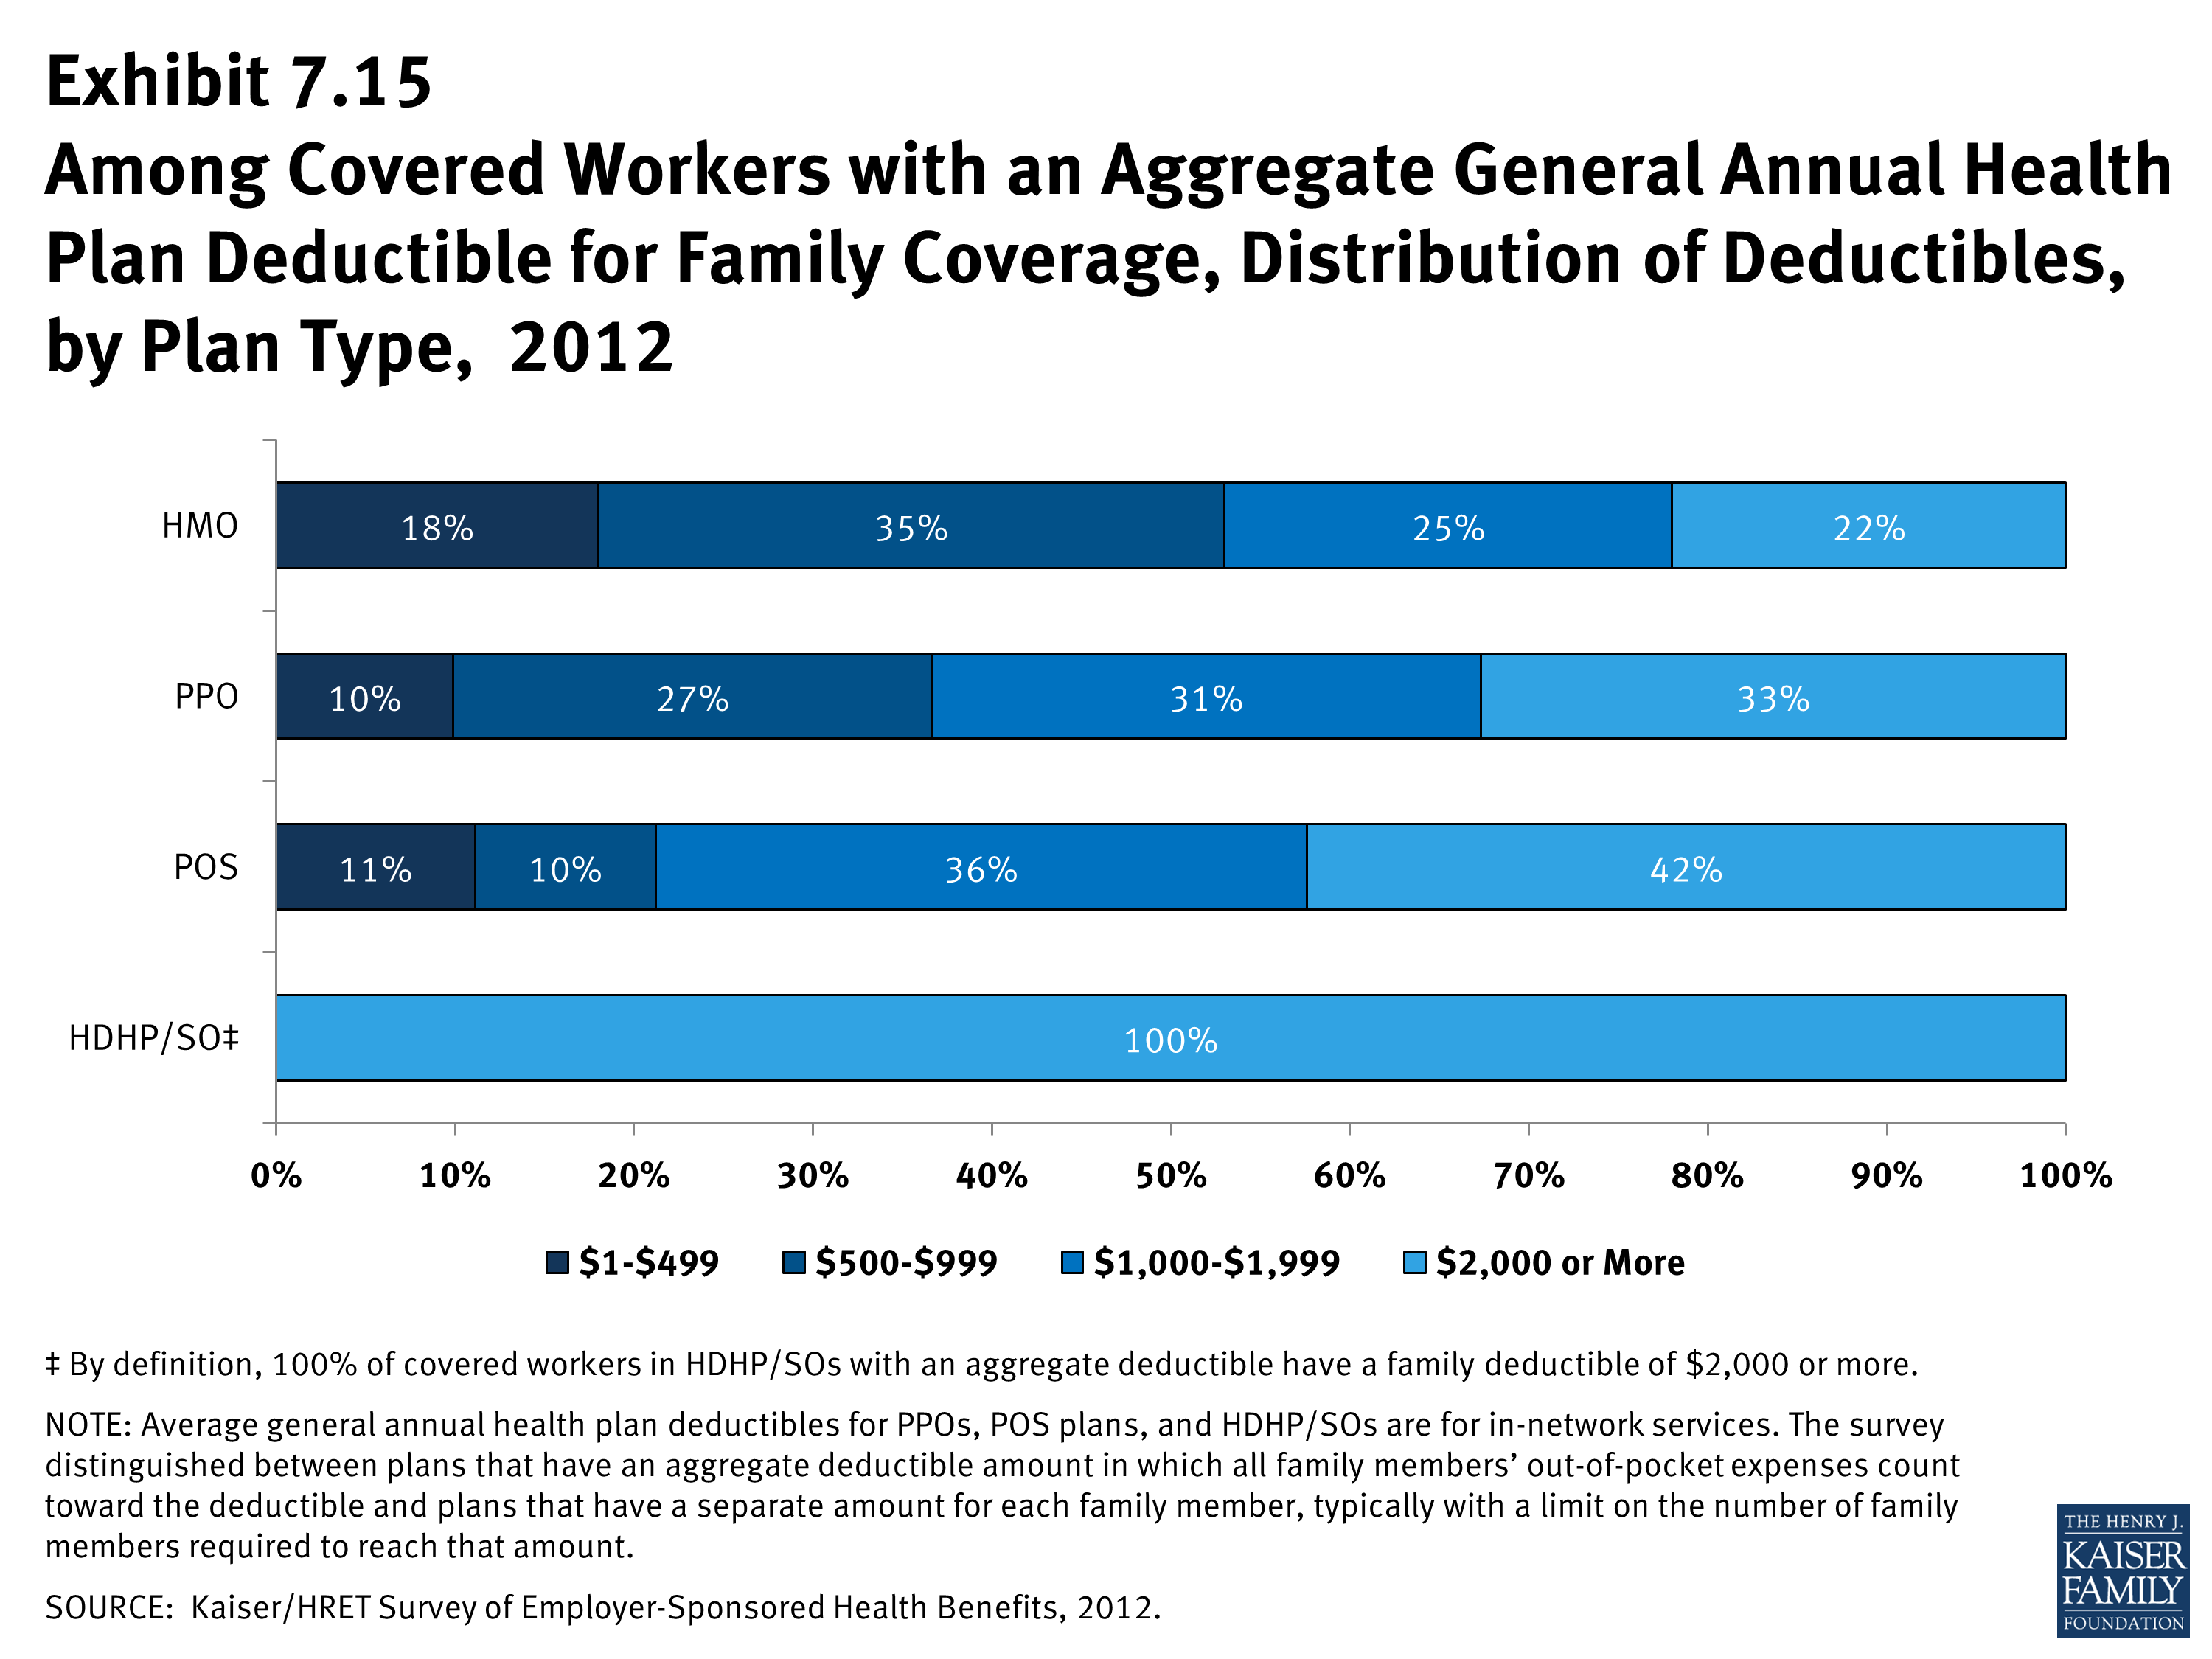
- For family coverage, the majority of workers with general annual deductibles have an aggregate deductible, meaning all family members’ out-of-pocket expenses count toward meeting the deductible amount. Among those with a general annual deductible for family coverage, the percentage of covered workers with an average aggregate general annual deductible is 60% for workers in HMOs, 59% for workers in PPOs, 63% for workers in POS plans and 83% for workers in HDHP/SOs (Exhibit 7.11).
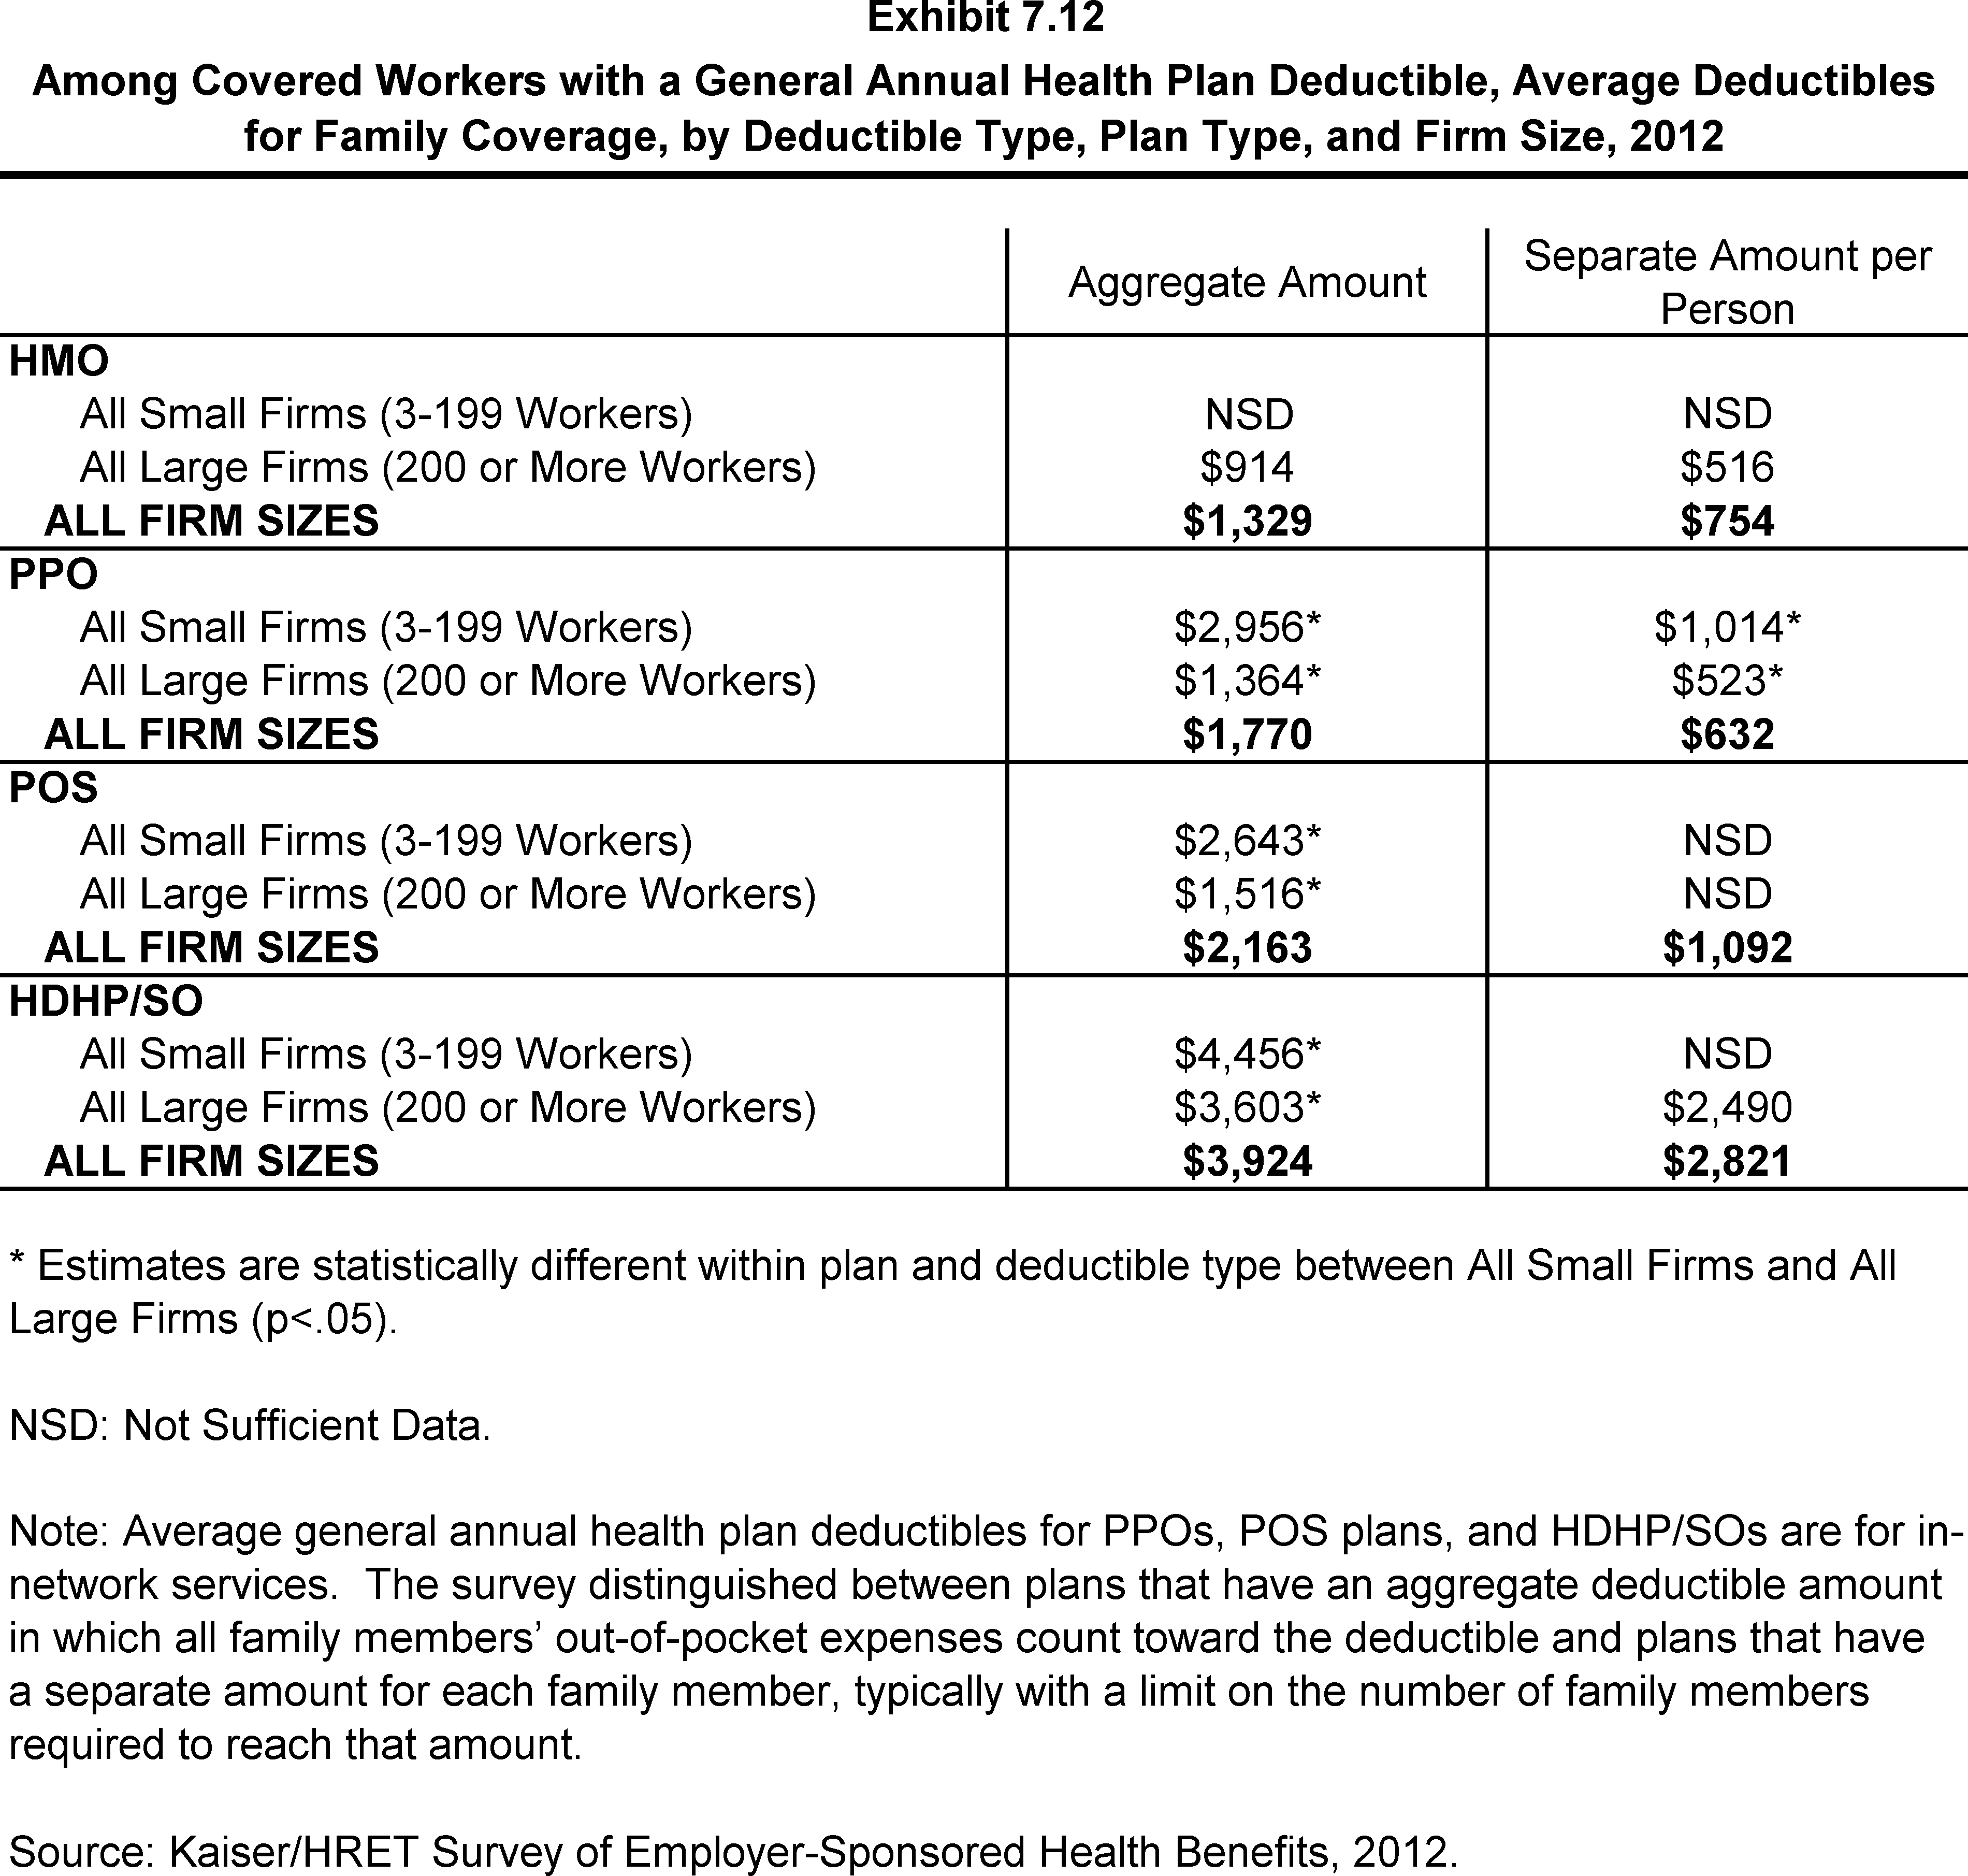
- The average amounts for workers with an aggregate deductible for family coverage are $1,329 for HMOs, $1,770 for PPOs, $2,163 for POS plans, and $3,924 for HDHP/SOs (Exhibit 7.12).
- The other type of family deductible, a separate per-person deductible, requires each family member to meet a separate per-person deductible amount before the plan covers expenses for that member. Most plans with separate per-person family deductibles consider the deductible met for all family members if a prescribed number of family members each reach their separate deductible amounts.
- For covered workers in health plans that have separate per-person general annual deductible amounts for family coverage, the average plan deductible amounts are $754 for HMOs, $632 for PPOs, $1,092 for POS plans, and $2,821 for HDHP/SOs (Exhibit 7.13).
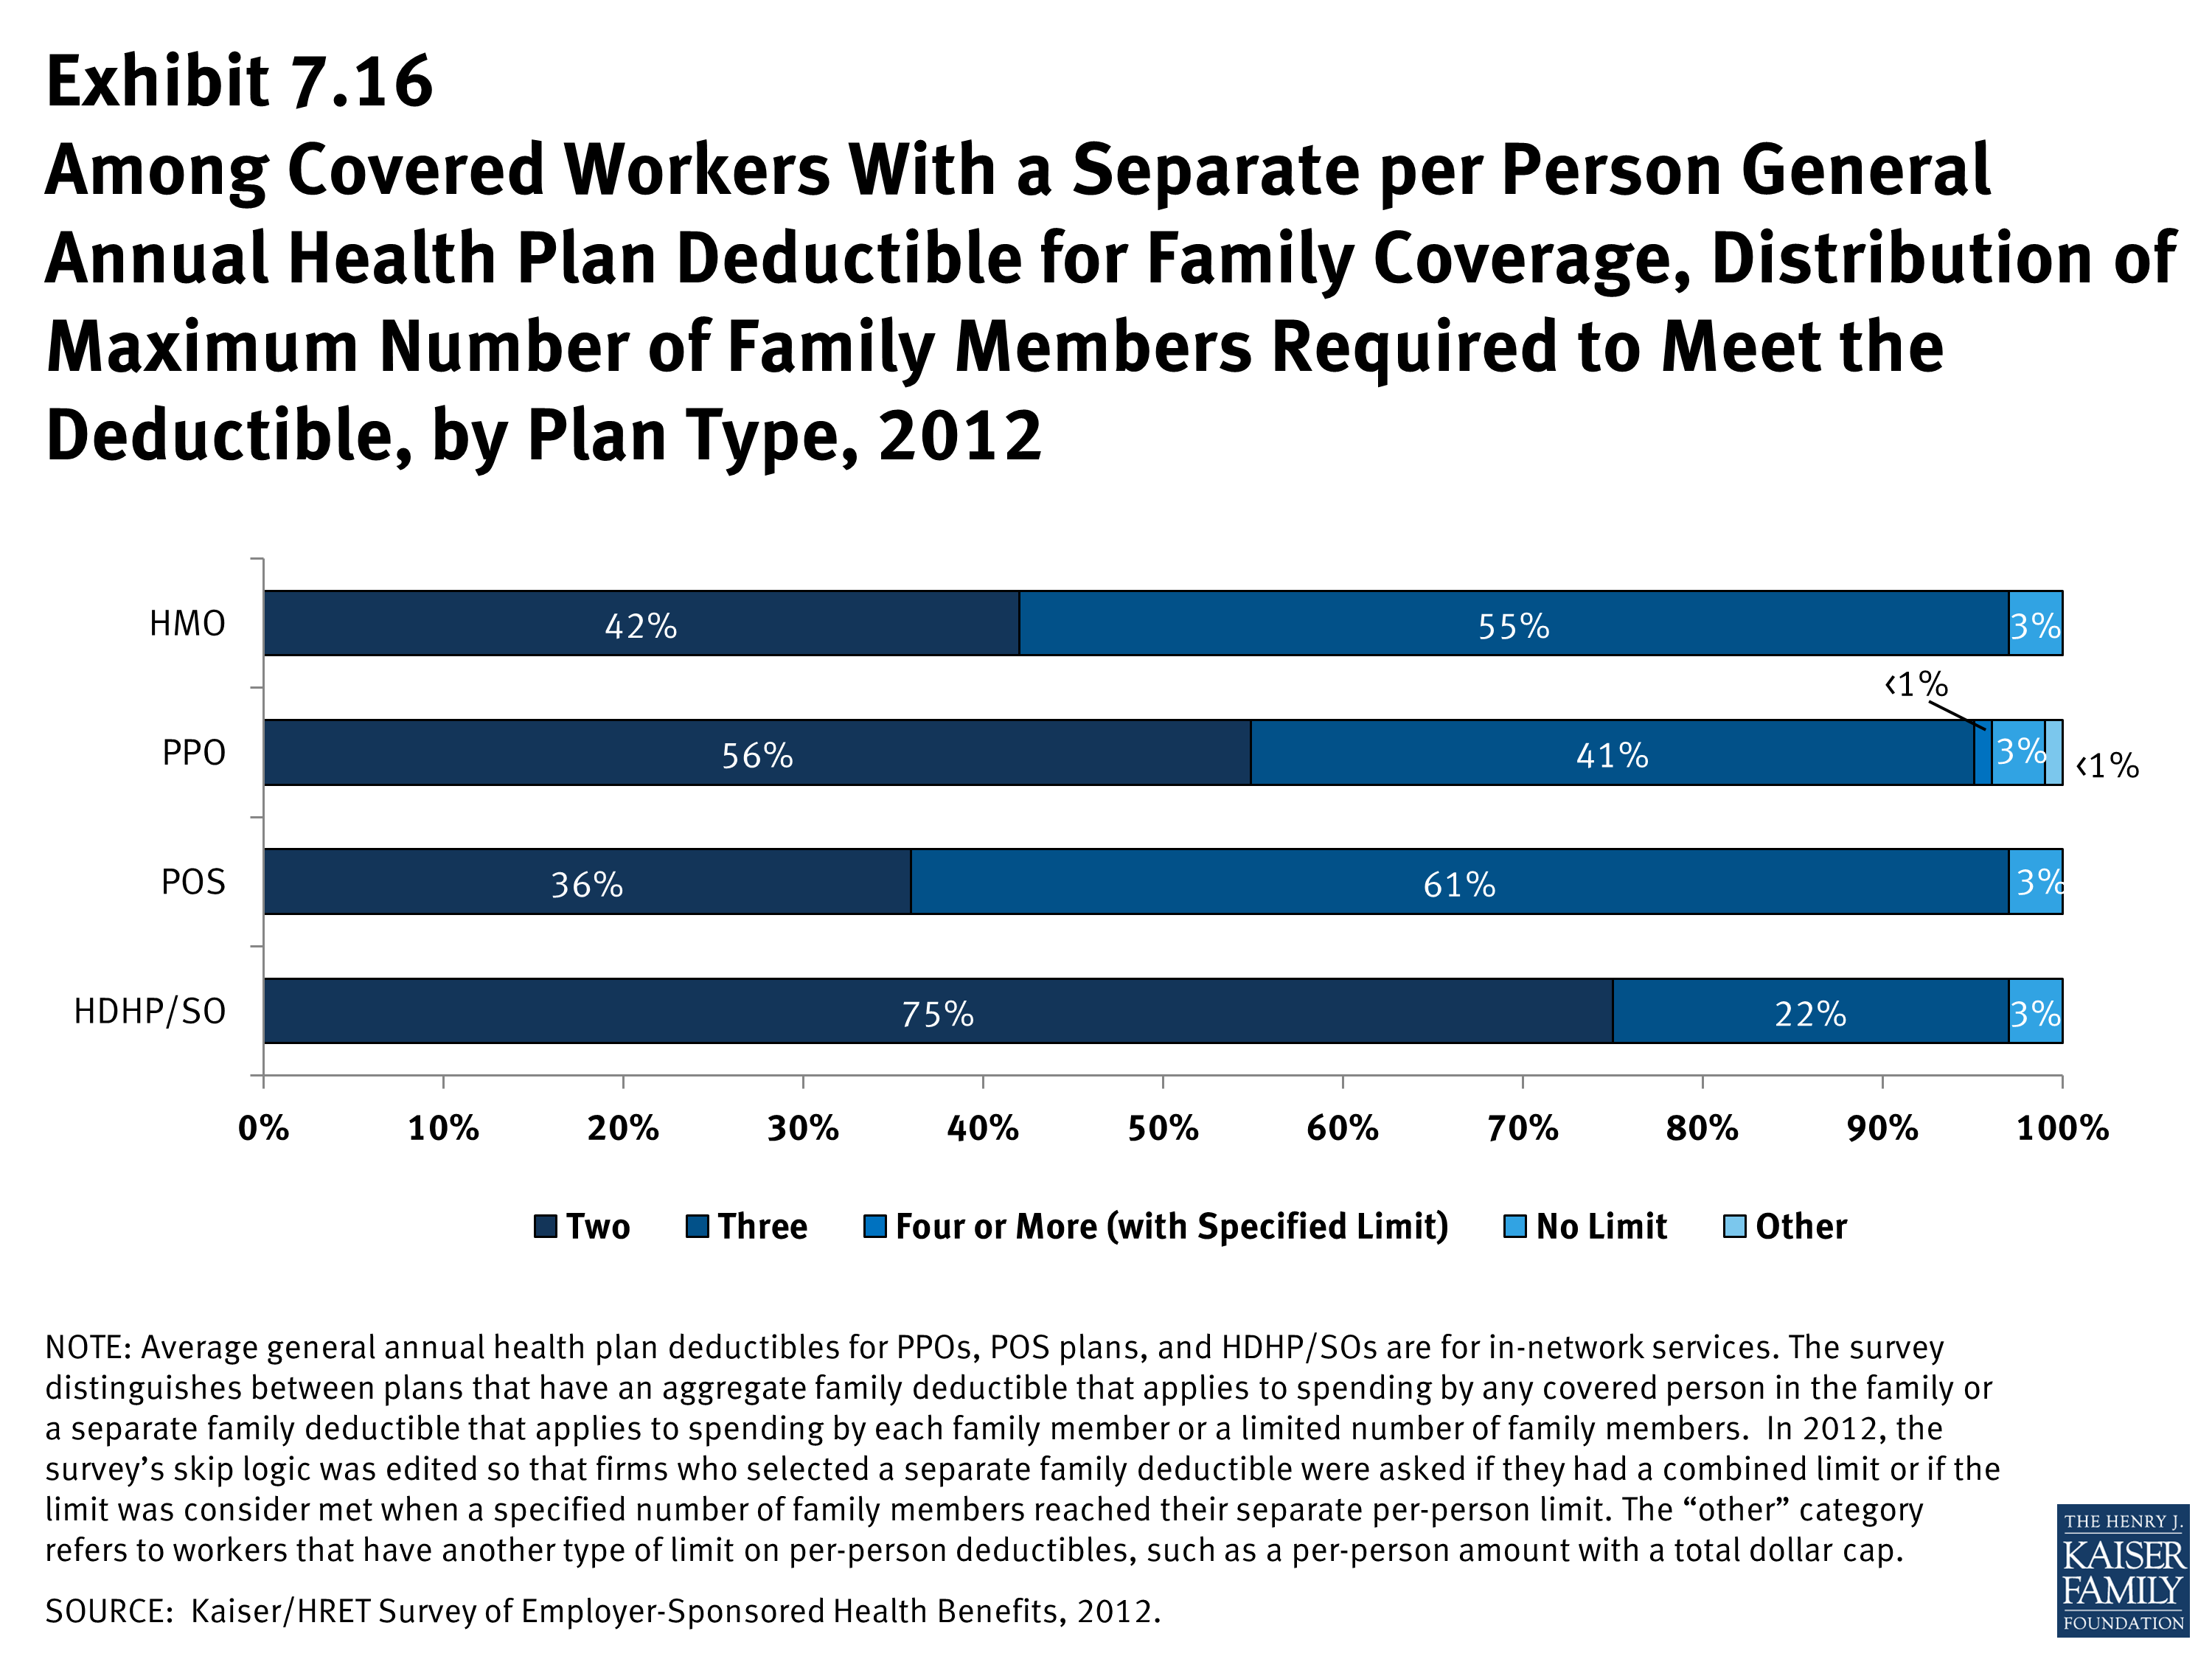
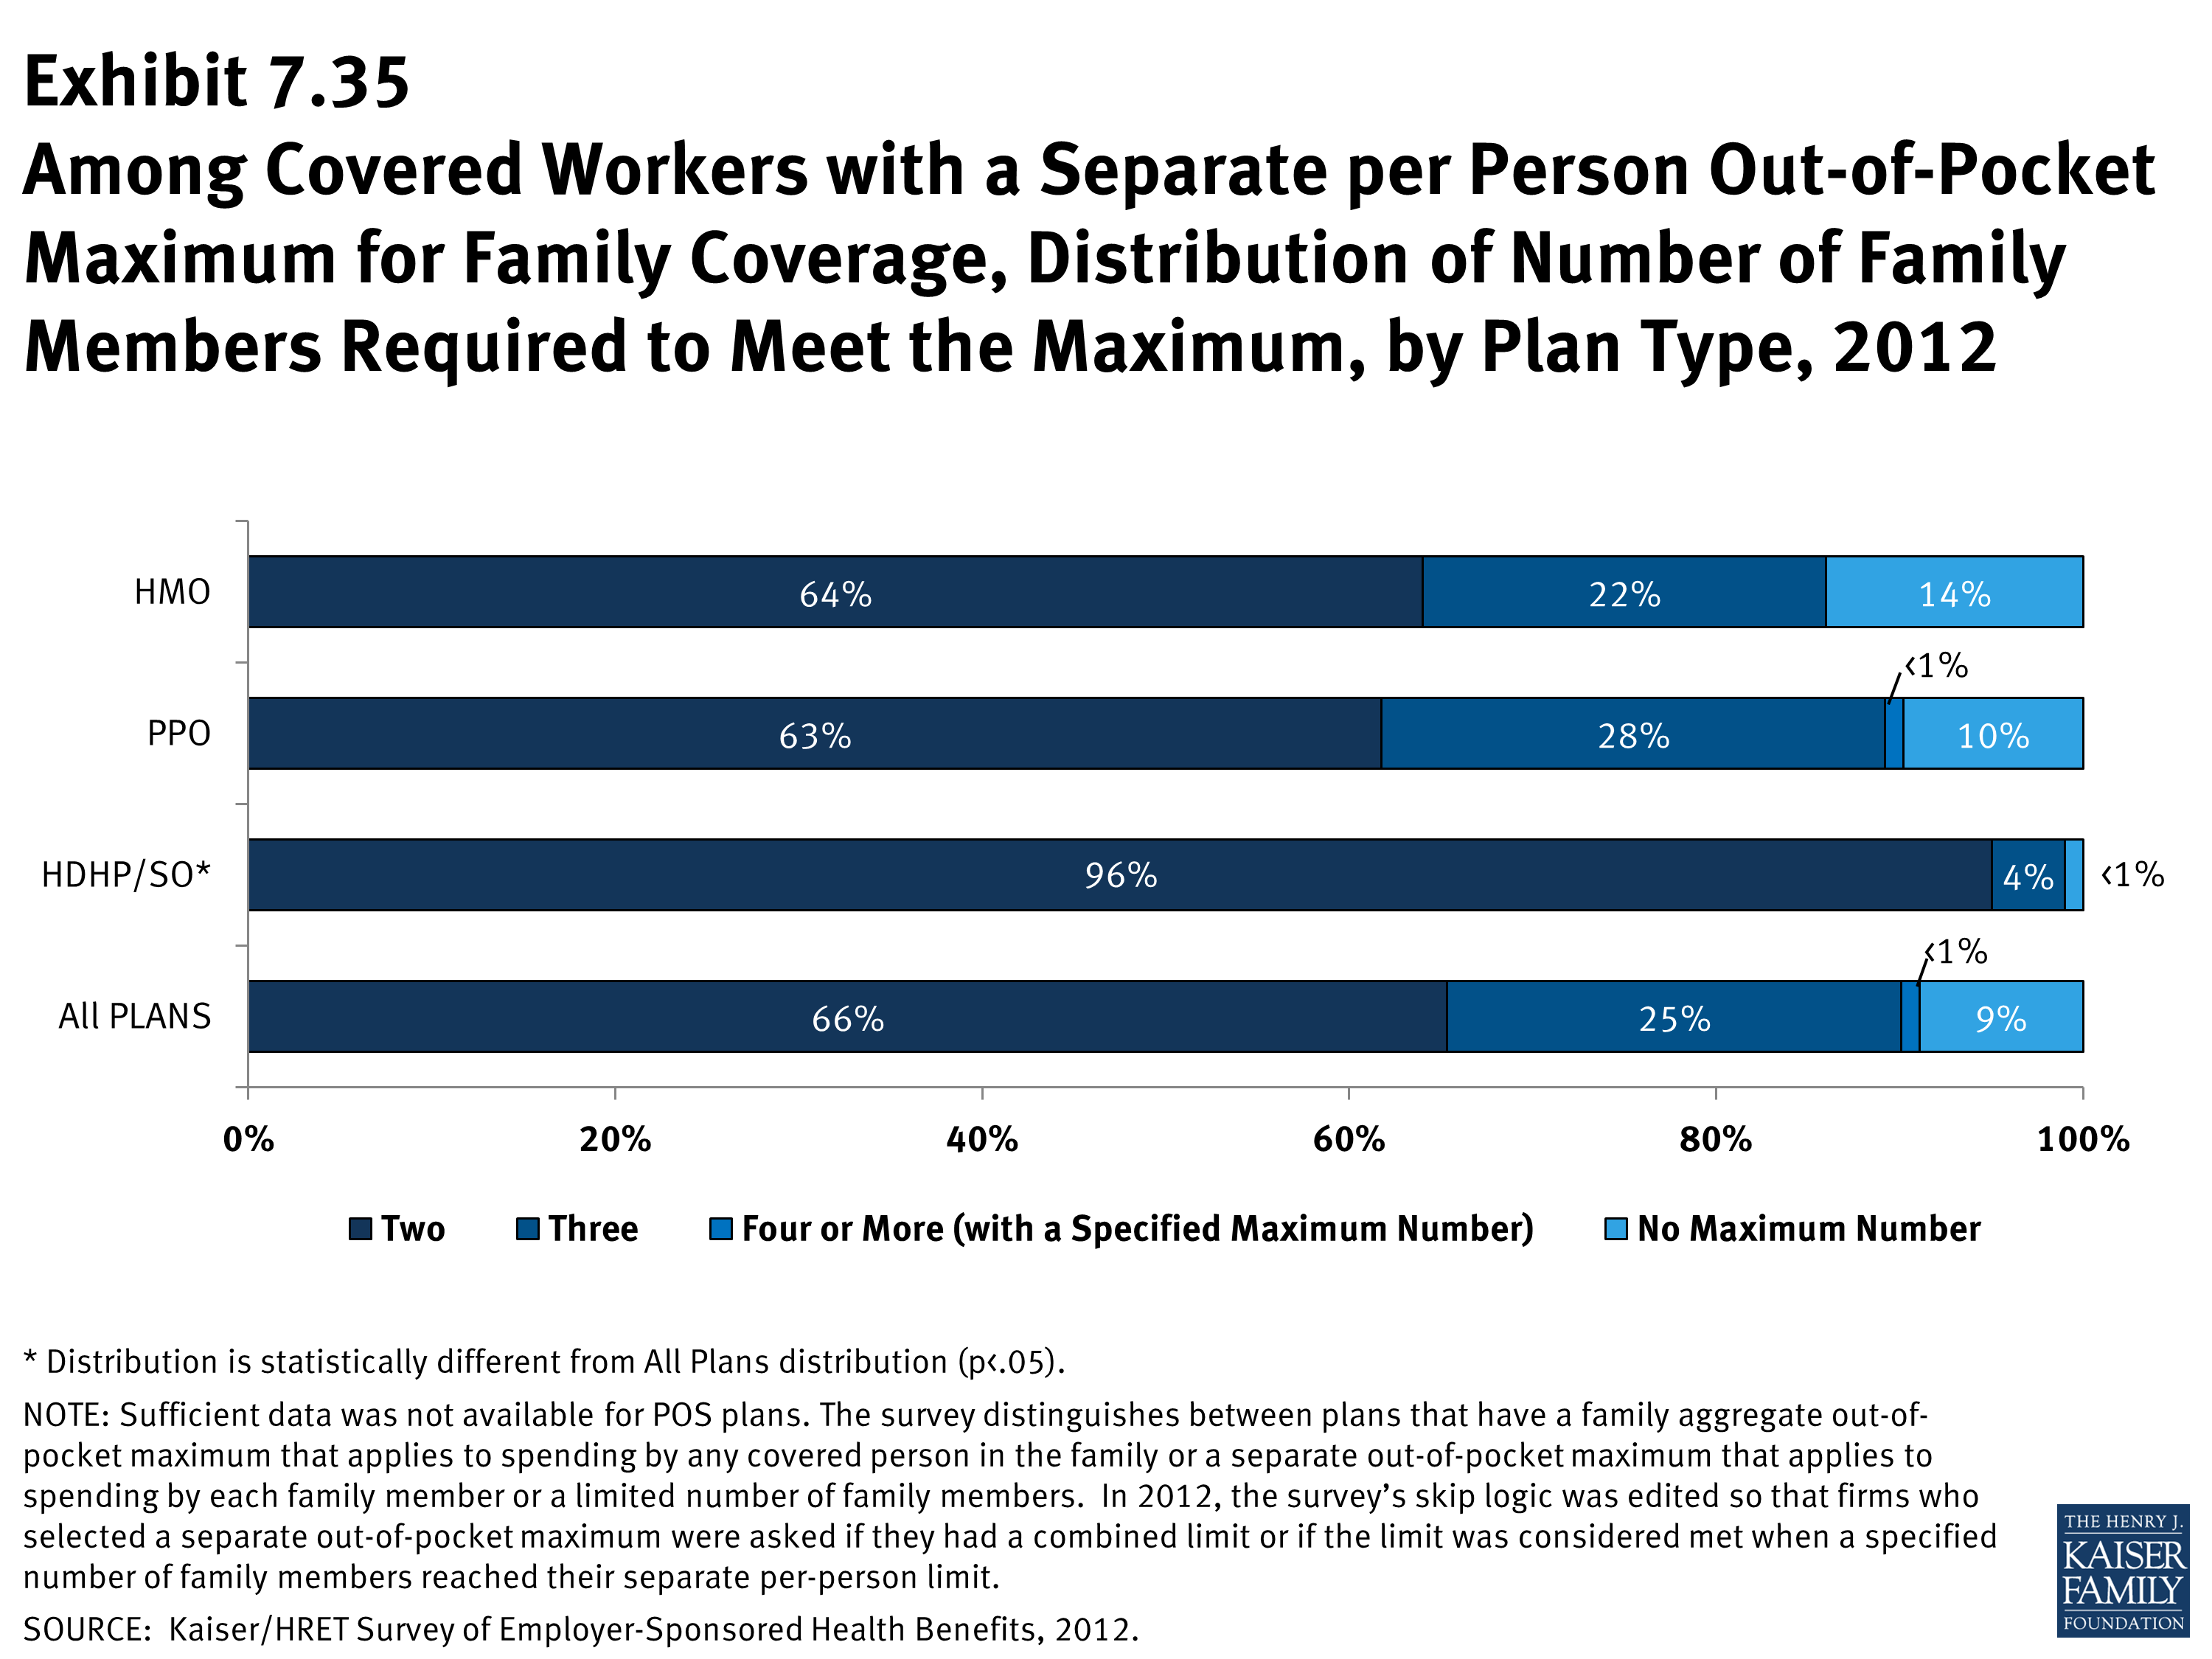
- Most covered workers in plans with a separate per-person general annual deductible for family coverage have a limit to the number of family members required to meet the separate deductible amounts (Exhibit 7.16). 1 Among those workers in plans with a limit on the number of family members, the most frequent number of family members required to meet the separate deductible amounts is three for HMO and POS plans, and two for PPOs and HDHP/SOs.
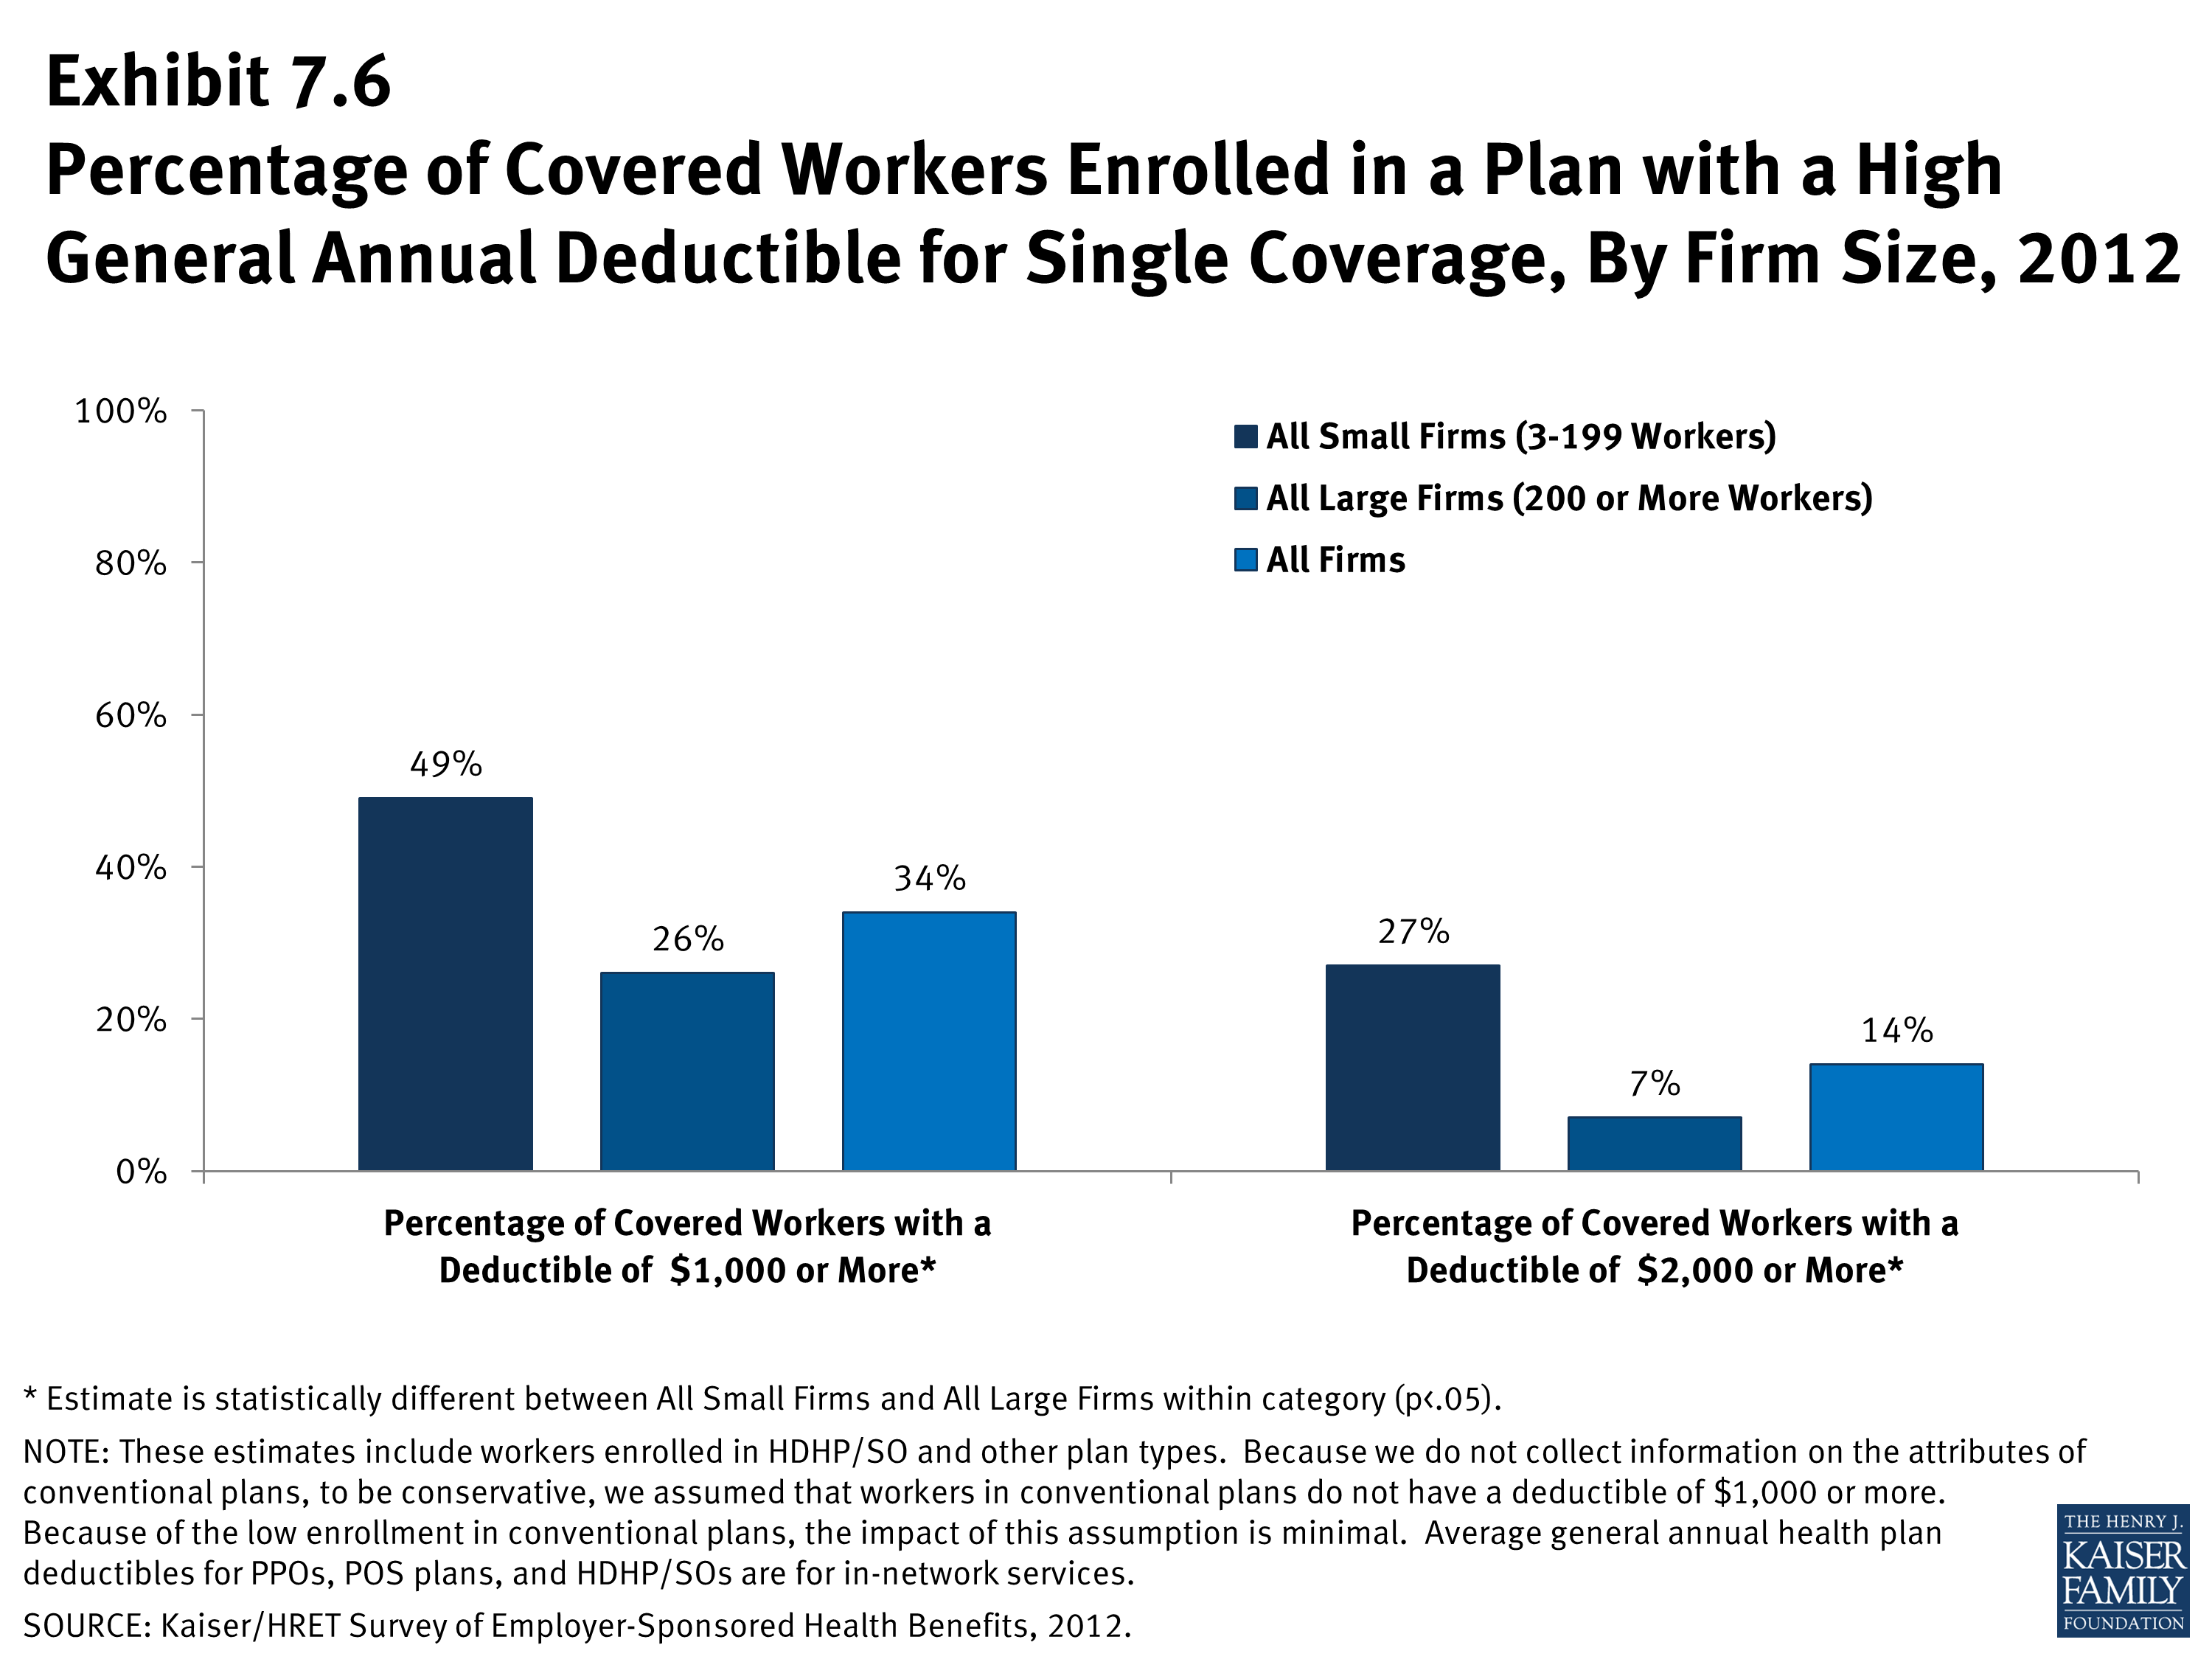
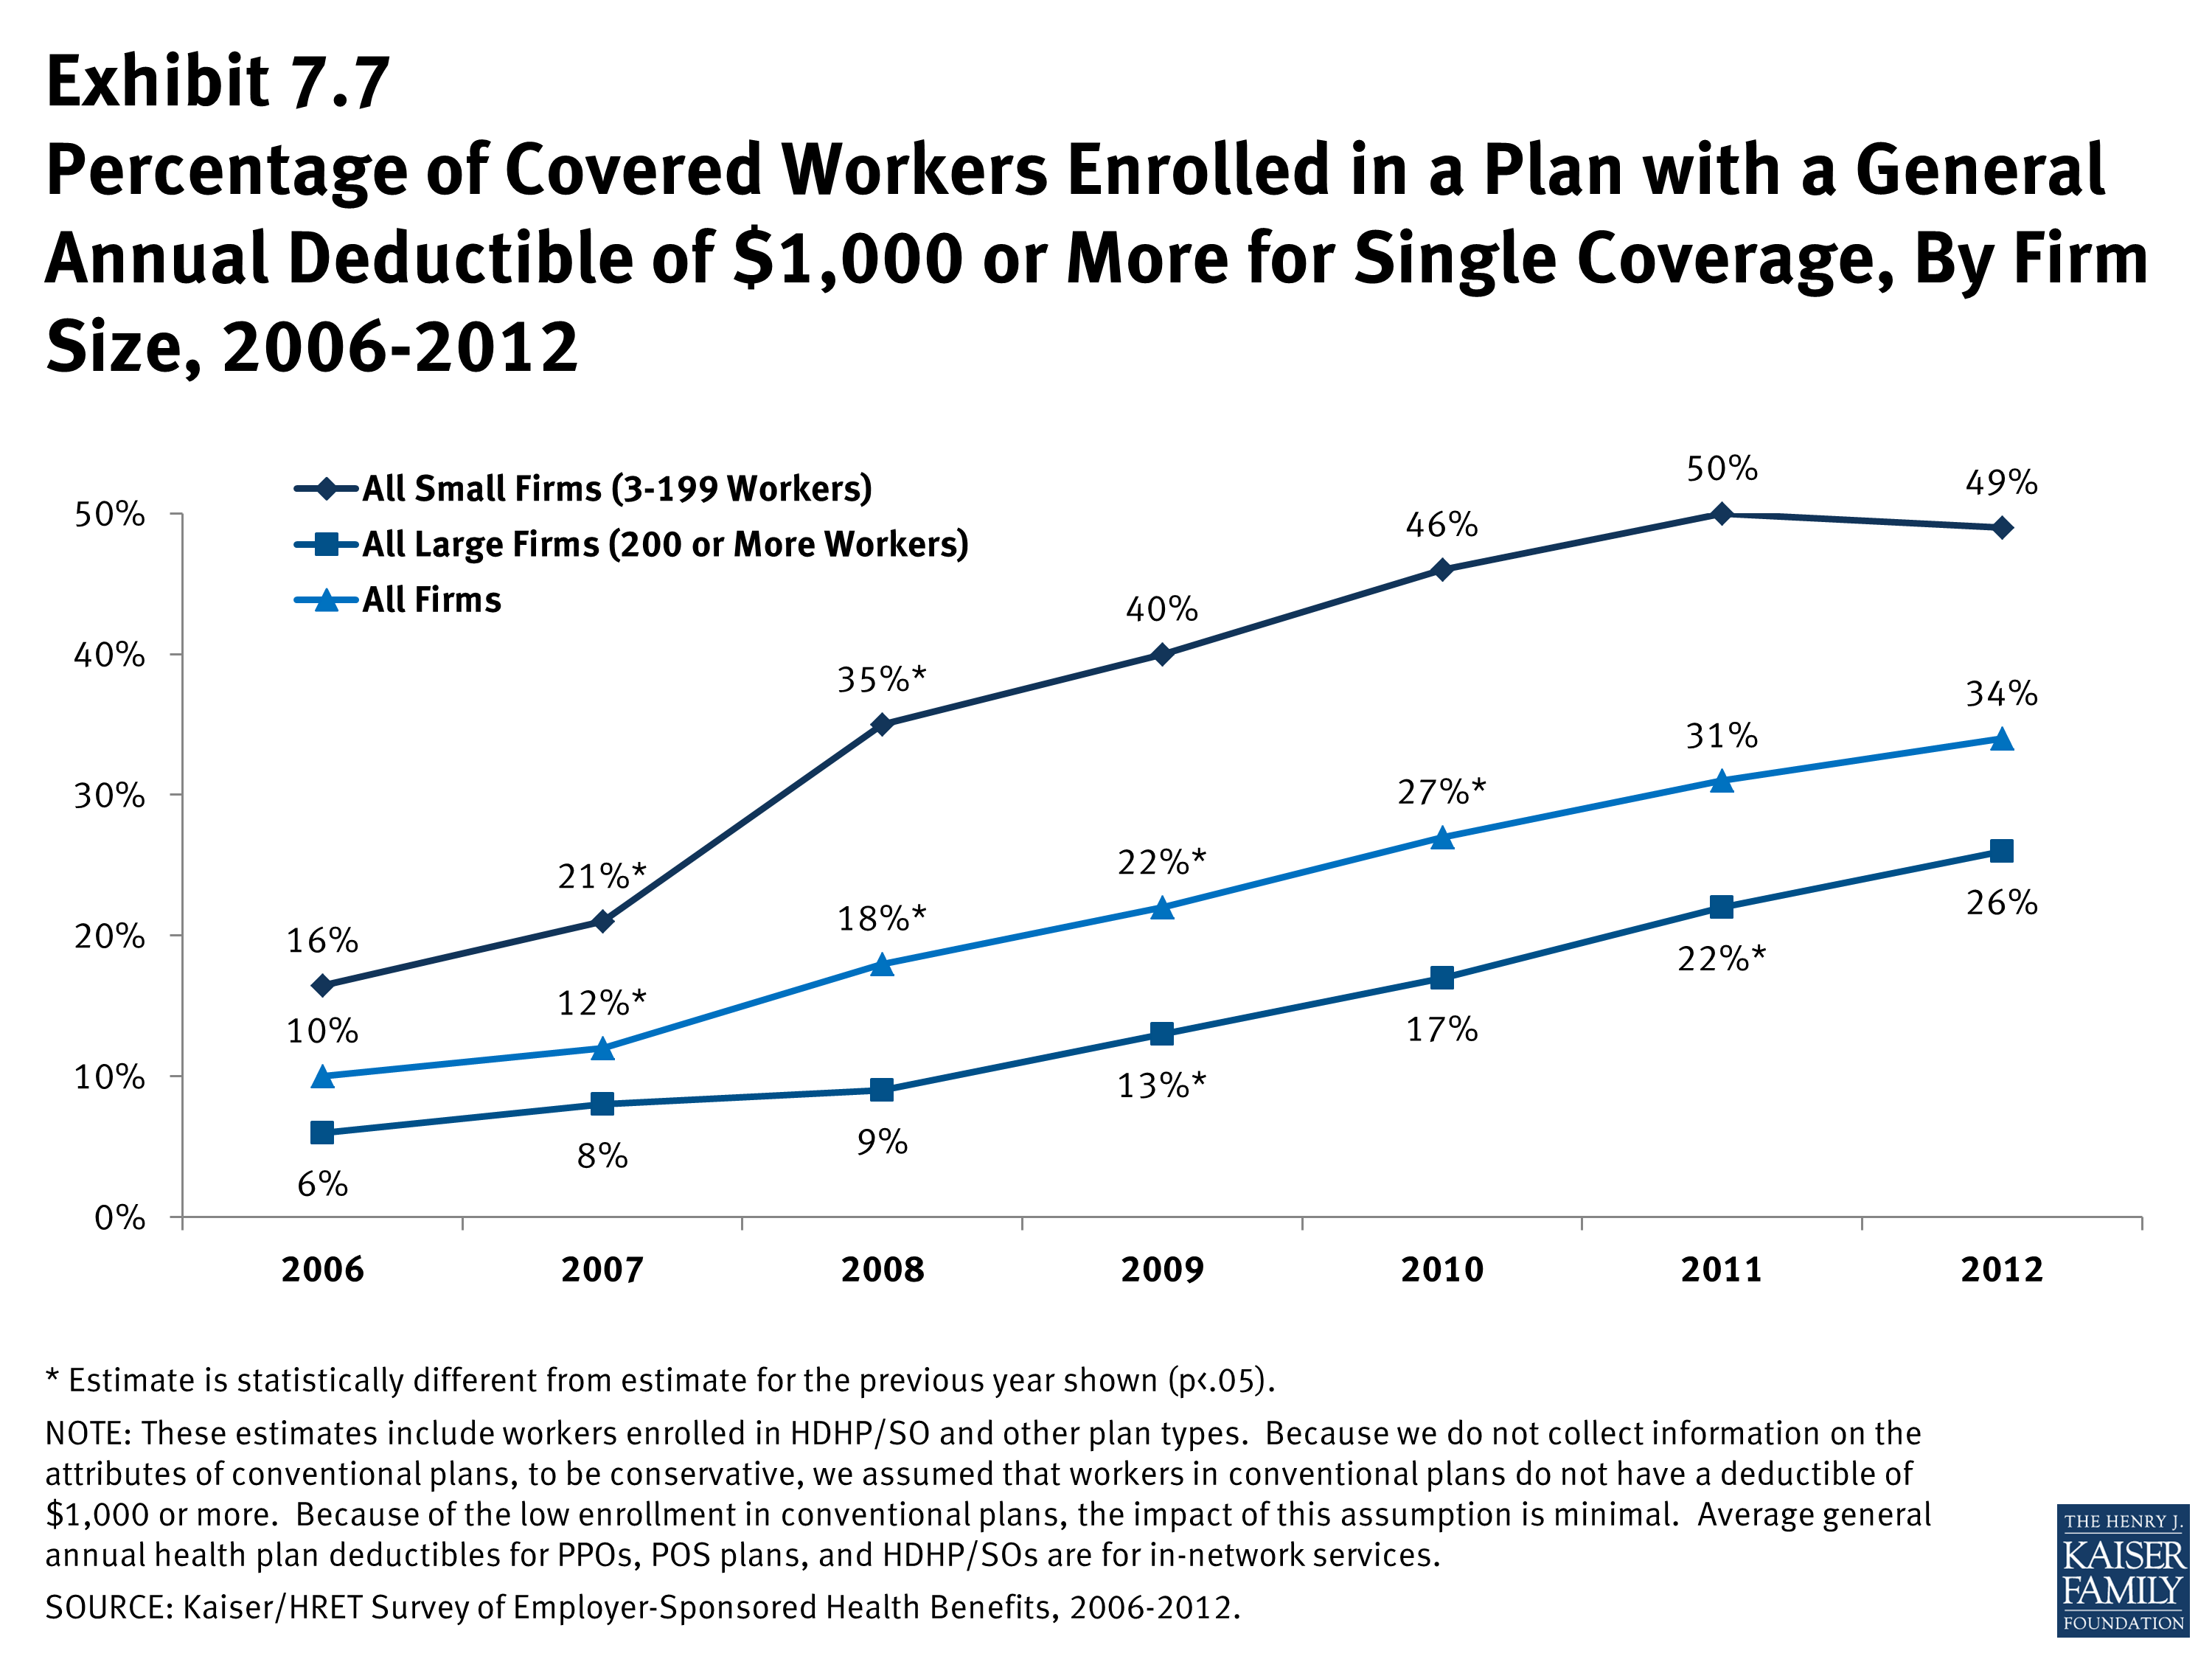
- Thirty-four percent of covered workers are in plans with a deductible of $1000 or more for single coverage, similar to the percentage (31%) in 2011 (Exhibit 7.7).
- Over the last five years, the percentage of covered workers with a deductible of $1,000 or more for single coverage has increased from 12% to 34% (Exhibit 7.7). Workers in small firms (3-199 workers) are more likely to have a general annual deductible of $1,000 or more for single coverage than workers in large firms (200 or more workers) (49% vs. 26%) (Exhibit 7.6).
- The majority of covered workers with a deductible are in plans where the deductible does not have to be met before certain services, such as physician office visits or prescription drugs, are covered.
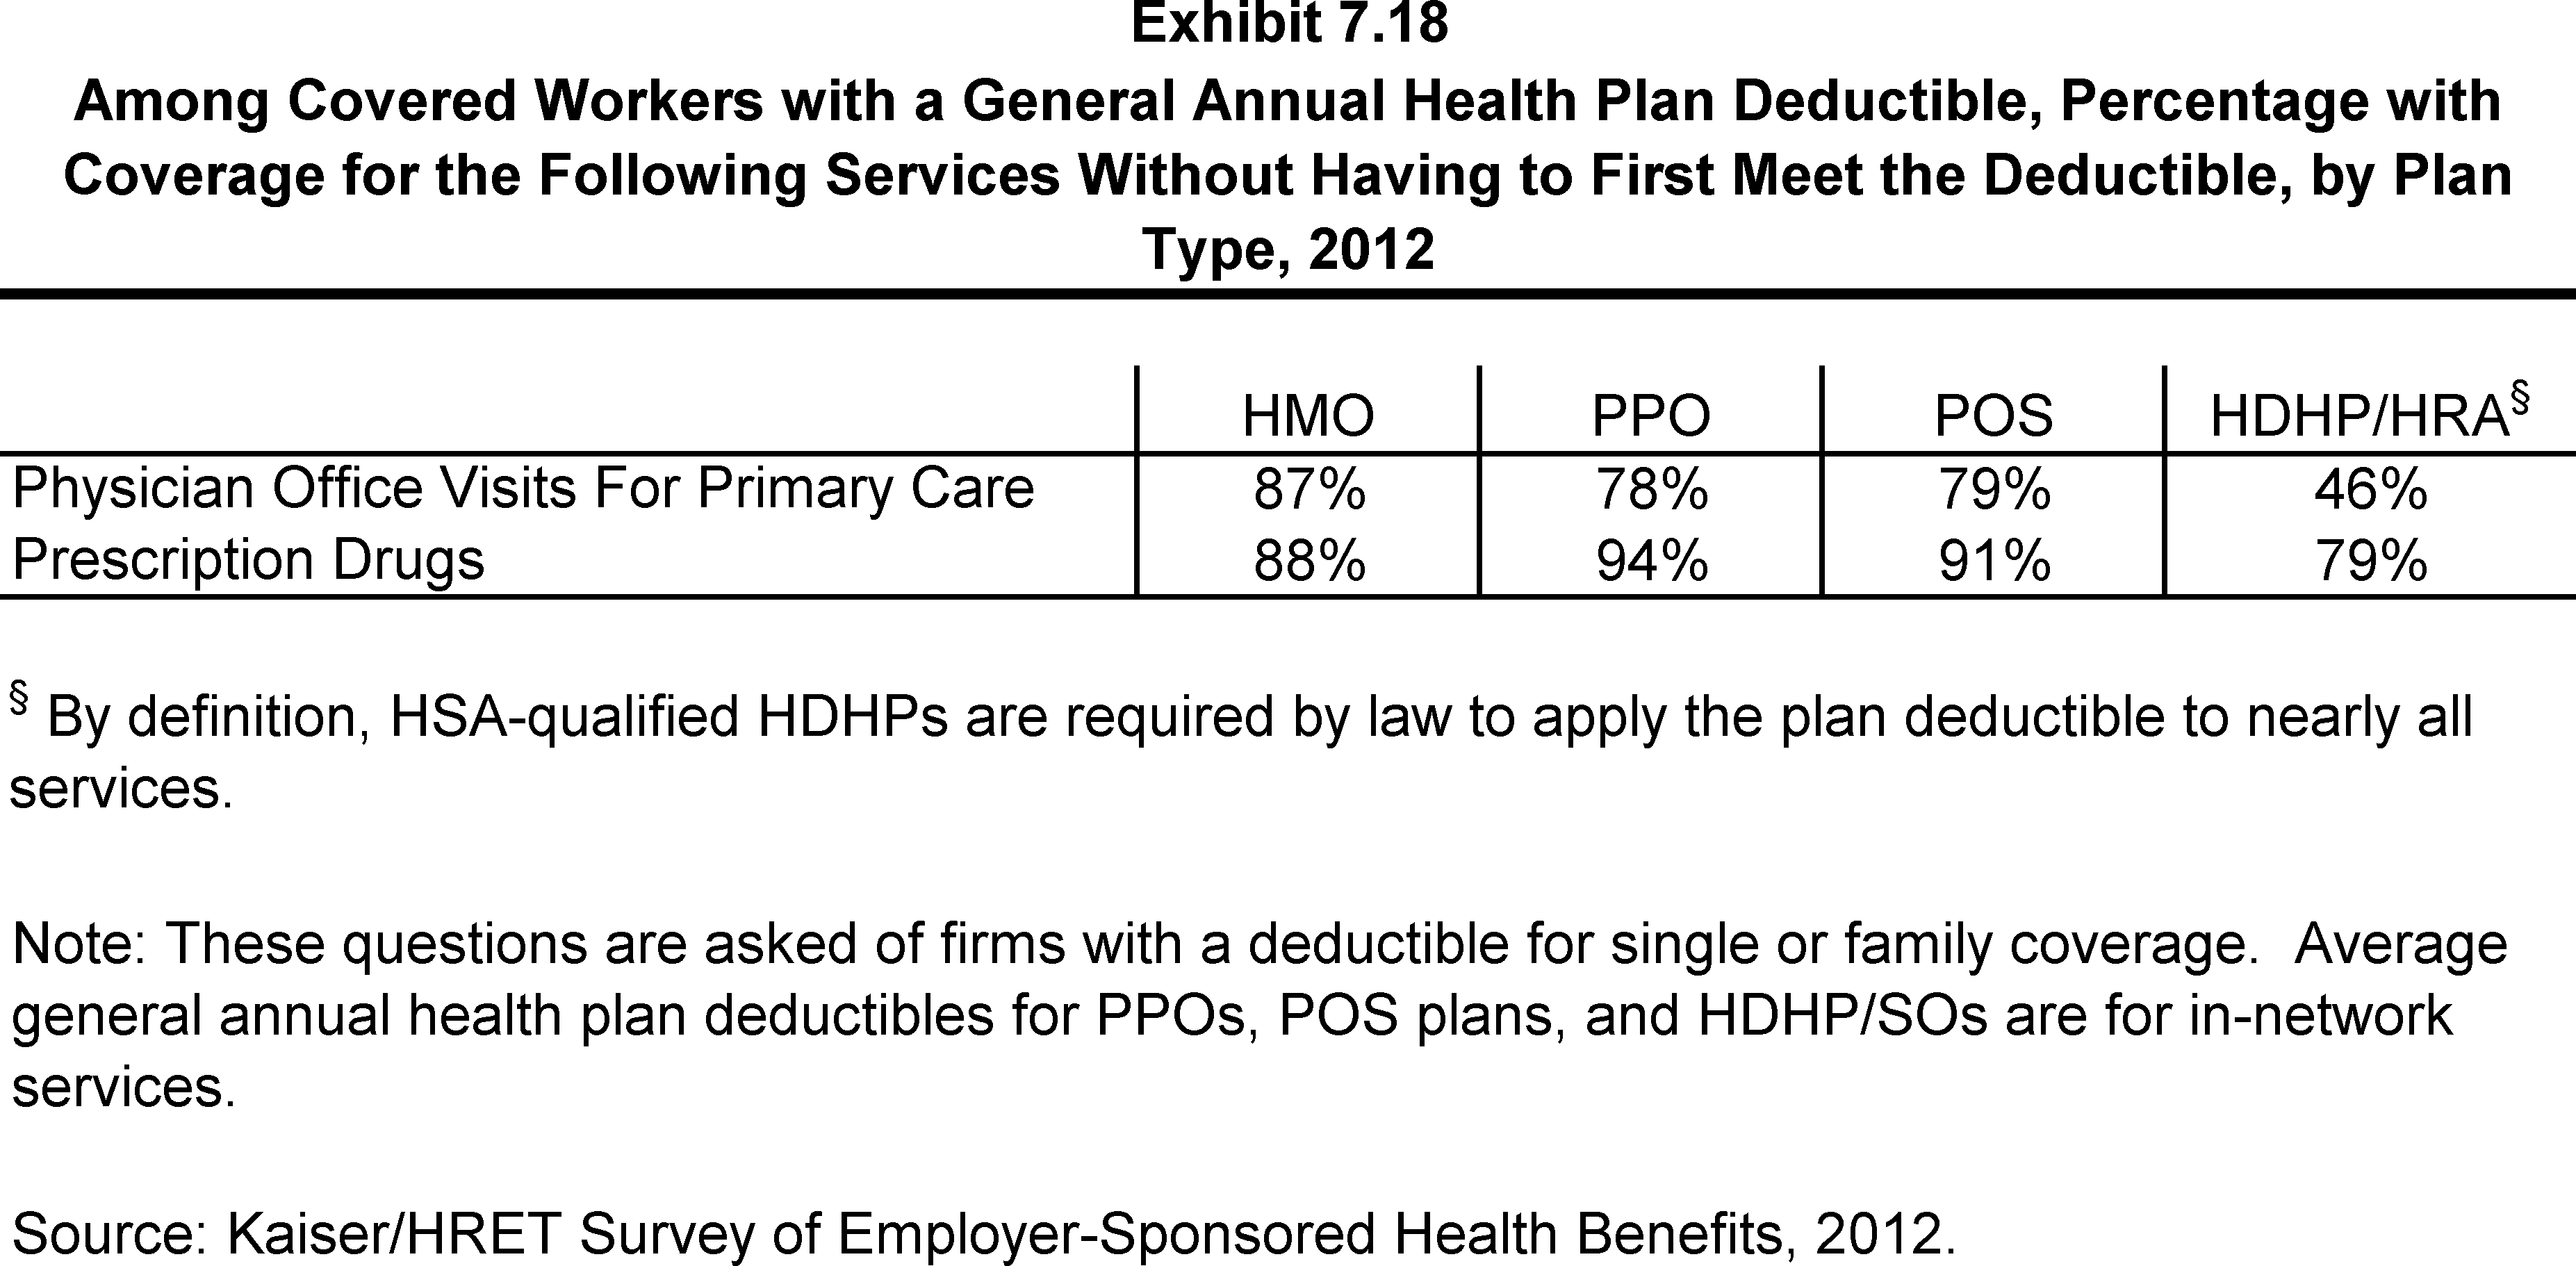
- Large majorities of covered workers (87% in HMOs, 78% in PPOs, and 79% in POS plans) with general plan deductibles are enrolled in plans where the deductible does not have to be met before physician office visits for primary care are covered (Exhibit 7.18).
- Similarly, among workers with a general annual deductible, large shares of covered workers in HMOs (88%), PPOs (94%), and POS plans (91%) are enrolled in plans where the general annual deductible does not have to be met before prescription drugs are covered (Exhibit 7.18).
Hospital and Outpatient Surgery Cost Sharing
- In order to better capture the prevalence of combinations of cost sharing for inpatient hospital stays and outpatient surgery, the survey was changed to ask a series of yes or no questions beginning in 2009. The new format allowed respondents to indicate more than one type of cost sharing for these services, if applicable. Previously, the questions asked respondents to select just one response from a list of types of cost sharing, such as separate deductibles, copayments, coinsurance, and per diem payments (for hospitalization only). Due to the change in question format, the distribution of workers with types of cost sharing does not equal 100% as workers may face a combination of types of cost sharing. In addition, the average copayment and coinsurance rates for hospital admissions include workers who may have a combination of types of cost sharing.
- Whether or not a worker has a general annual deductible, most workers face additional types of cost sharing when admitted to a hospital or having outpatient surgery (such as a copayment, coinsurance, or a per diem charge).
- For hospital admissions, 58% of covered workers have coinsurance and 17% have copayments. Lower percentages of workers have per day (per diem) payments (4%), a separate hospital deductible (3%), or both copayments and coinsurance (9%), while 19% have no additional cost sharing for hospital admissions after any general annual deductible has been met (Exhibit 7.19). The average coinsurance rate is 18%; the average copayment is $263 per hospital admission; the average per diem charge is $221; and the average separate annual hospital deductible is $548 (Exhibit 7.21).
- The cost-sharing provisions for outpatient surgery are similar to those for hospital admissions, as most workers have coinsurance or copayments. Fifty-nine percent of covered workers have coinsurance and 19% have copayments for an outpatient surgery episode. In addition, 3% have a separate annual deductible for outpatient surgery, and 6% have both copayments and coinsurance, while 20% have no additional cost sharing after any general annual deductible has been met (Exhibit 7.20). For covered workers with cost sharing, the average coinsurance is 18%, the average copayment is $127, and the average separate annual outpatient surgery deductible is $544 (Exhibit 7.21).
Cost Sharing for Physician Office Visits
- The majority of covered workers are enrolled in health plans that require cost sharing for an in-network physician office visit, in addition to any general annual deductible. 2
- The most common form of physician office visit cost sharing for in-network services is copayments. Seventy-three percent of covered workers have a copayment for a primary care physician office visit and 17% have coinsurance. For office visits with a specialty physician, 73% of covered workers have copayments and 19% have coinsurance. Workers in HMOs, PPOs, and POS plans are much more likely to have copayments than workers in HDHP/SOs for both primary care and specialty care physician office visits. For example, the majority of workers in HDHP/SOs have coinsurance (53%) or no cost sharing after the general annual plan deductible is met (30%) for primary care physician office visits (Exhibit 7.22).
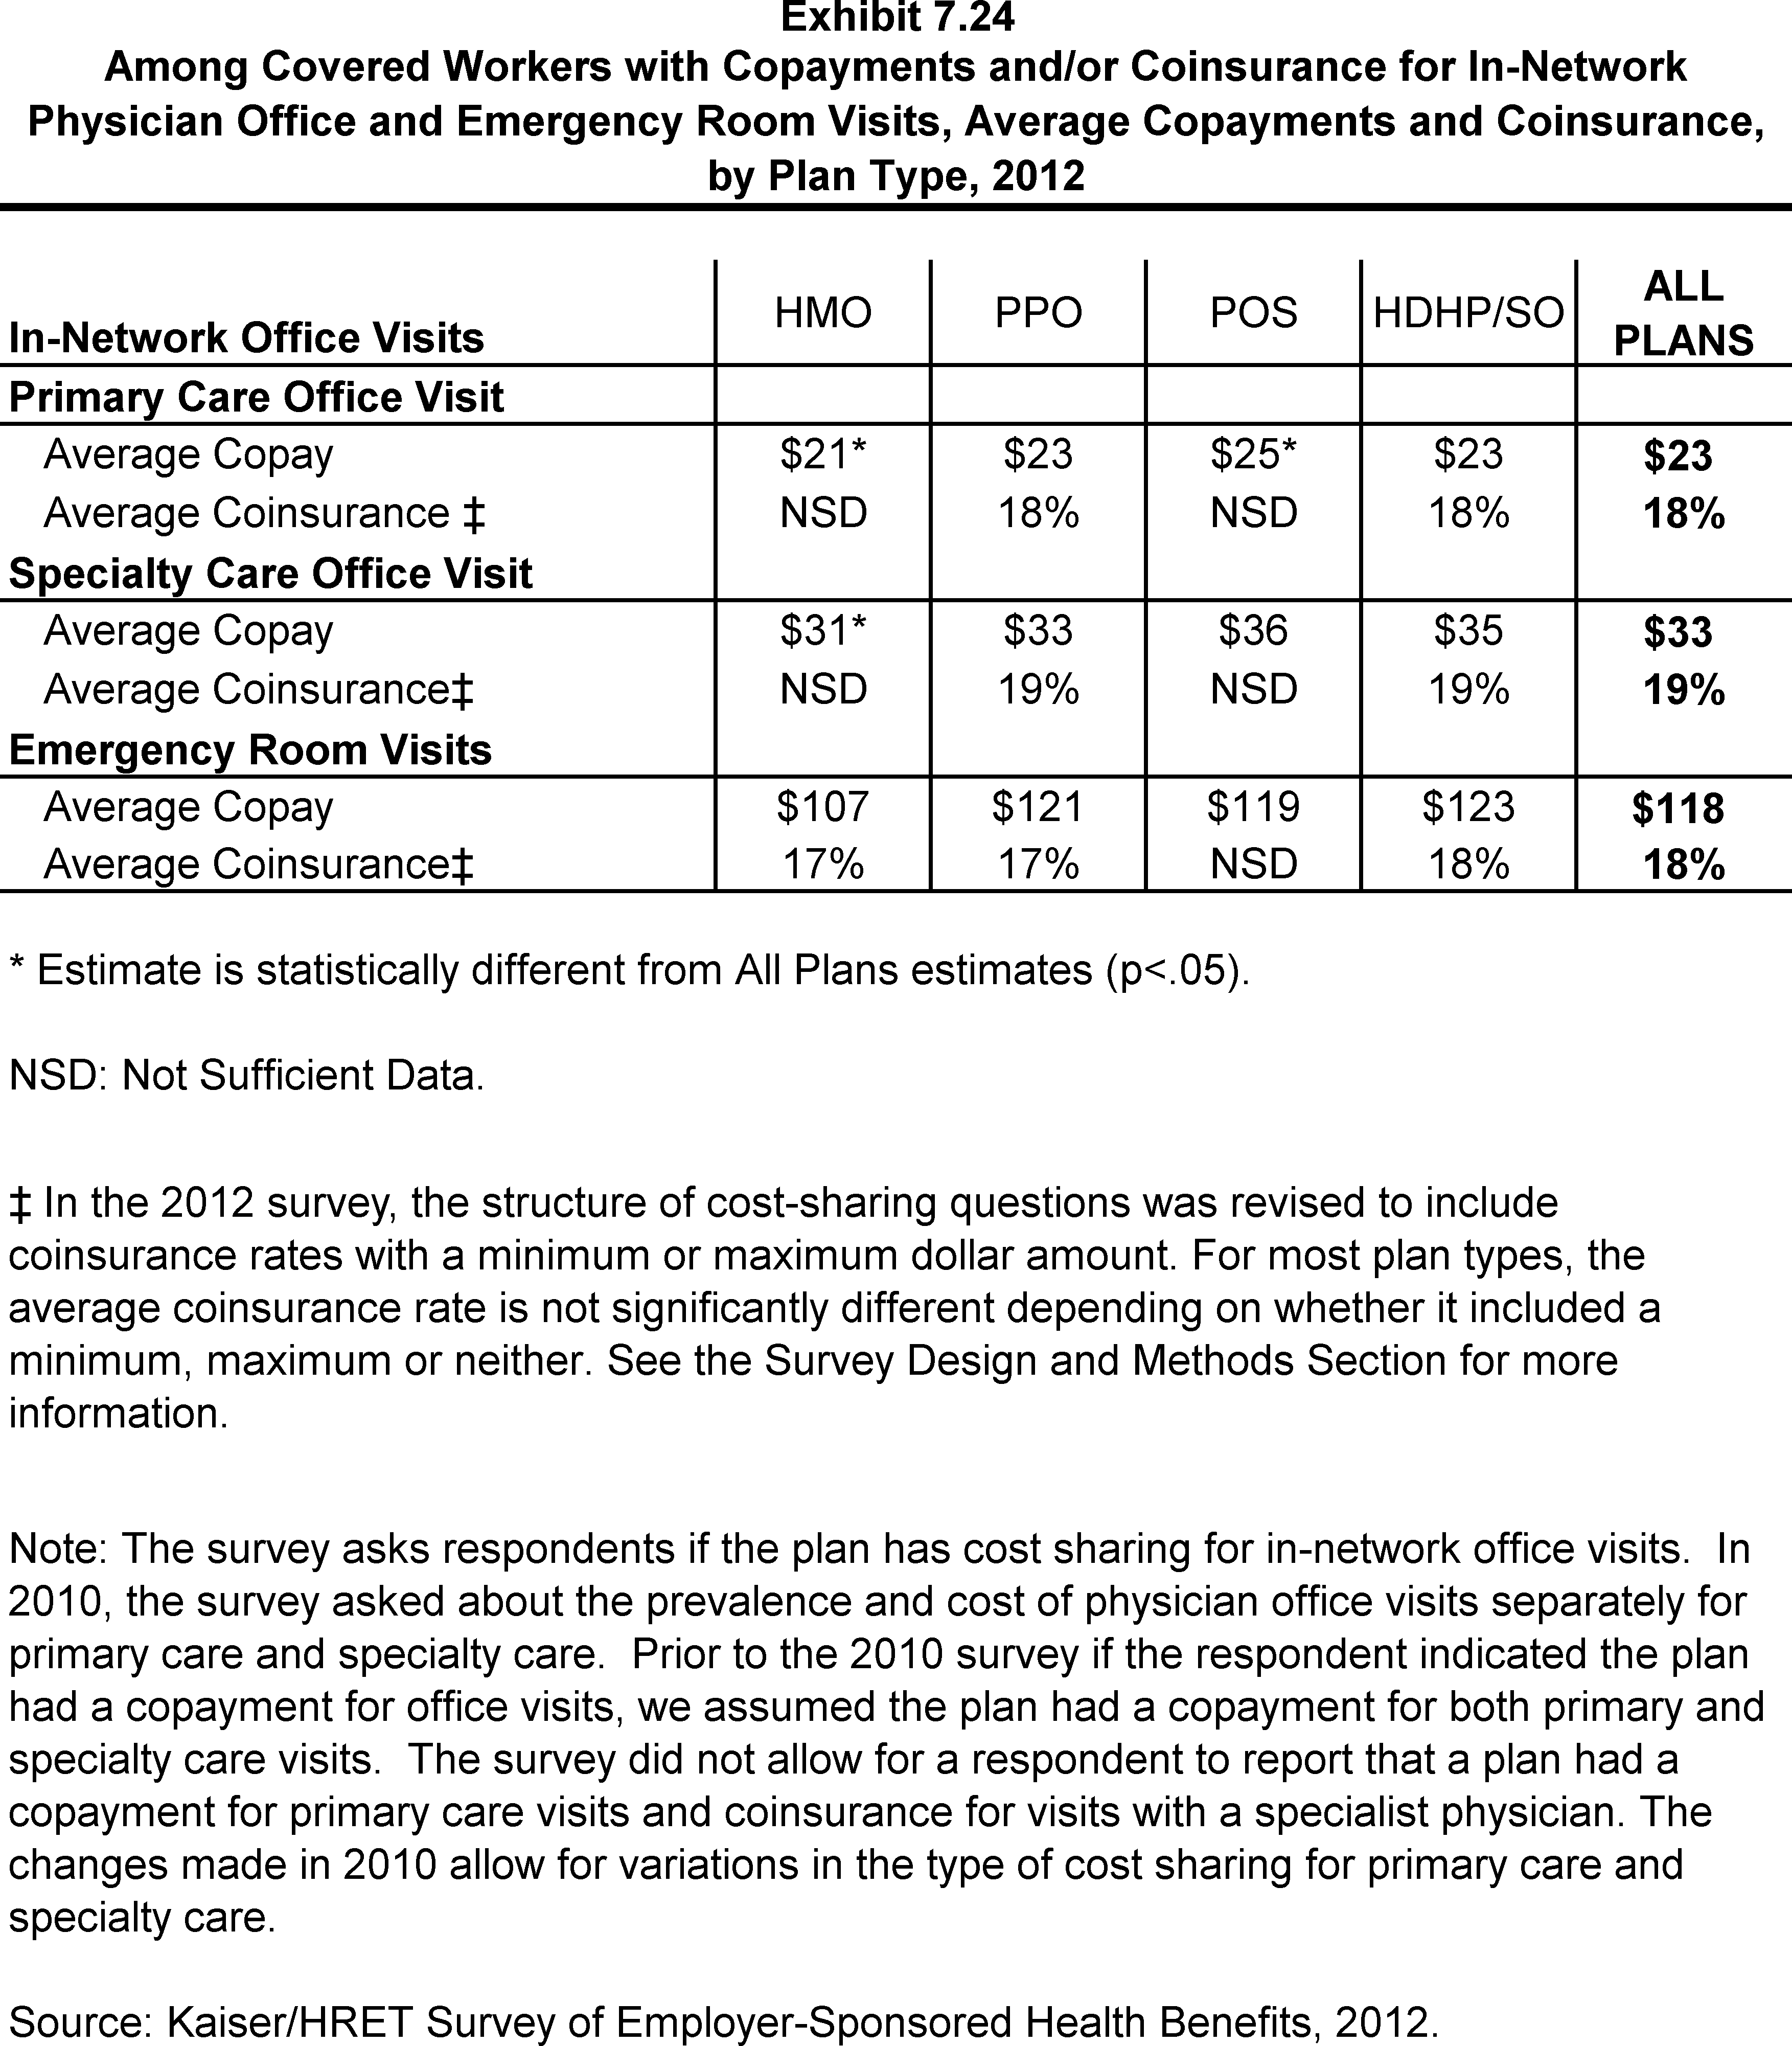
- Among covered workers with a copayment for in-network physician office visits, the average copayment is $23 for primary care and $33 for specialty physicians (Exhibit 7.24), similar to $22 and $32 reported in 2011.
- Among workers with coinsurance for in-network physician office visits, the average coinsurance rates are 18% for a visit with a primary care physician and 19% for a visit with a specialist (Exhibit 7.24).
Emergency Room Visit Cost Sharing
- The large majority of covered workers have cost sharing when they visit an emergency room.
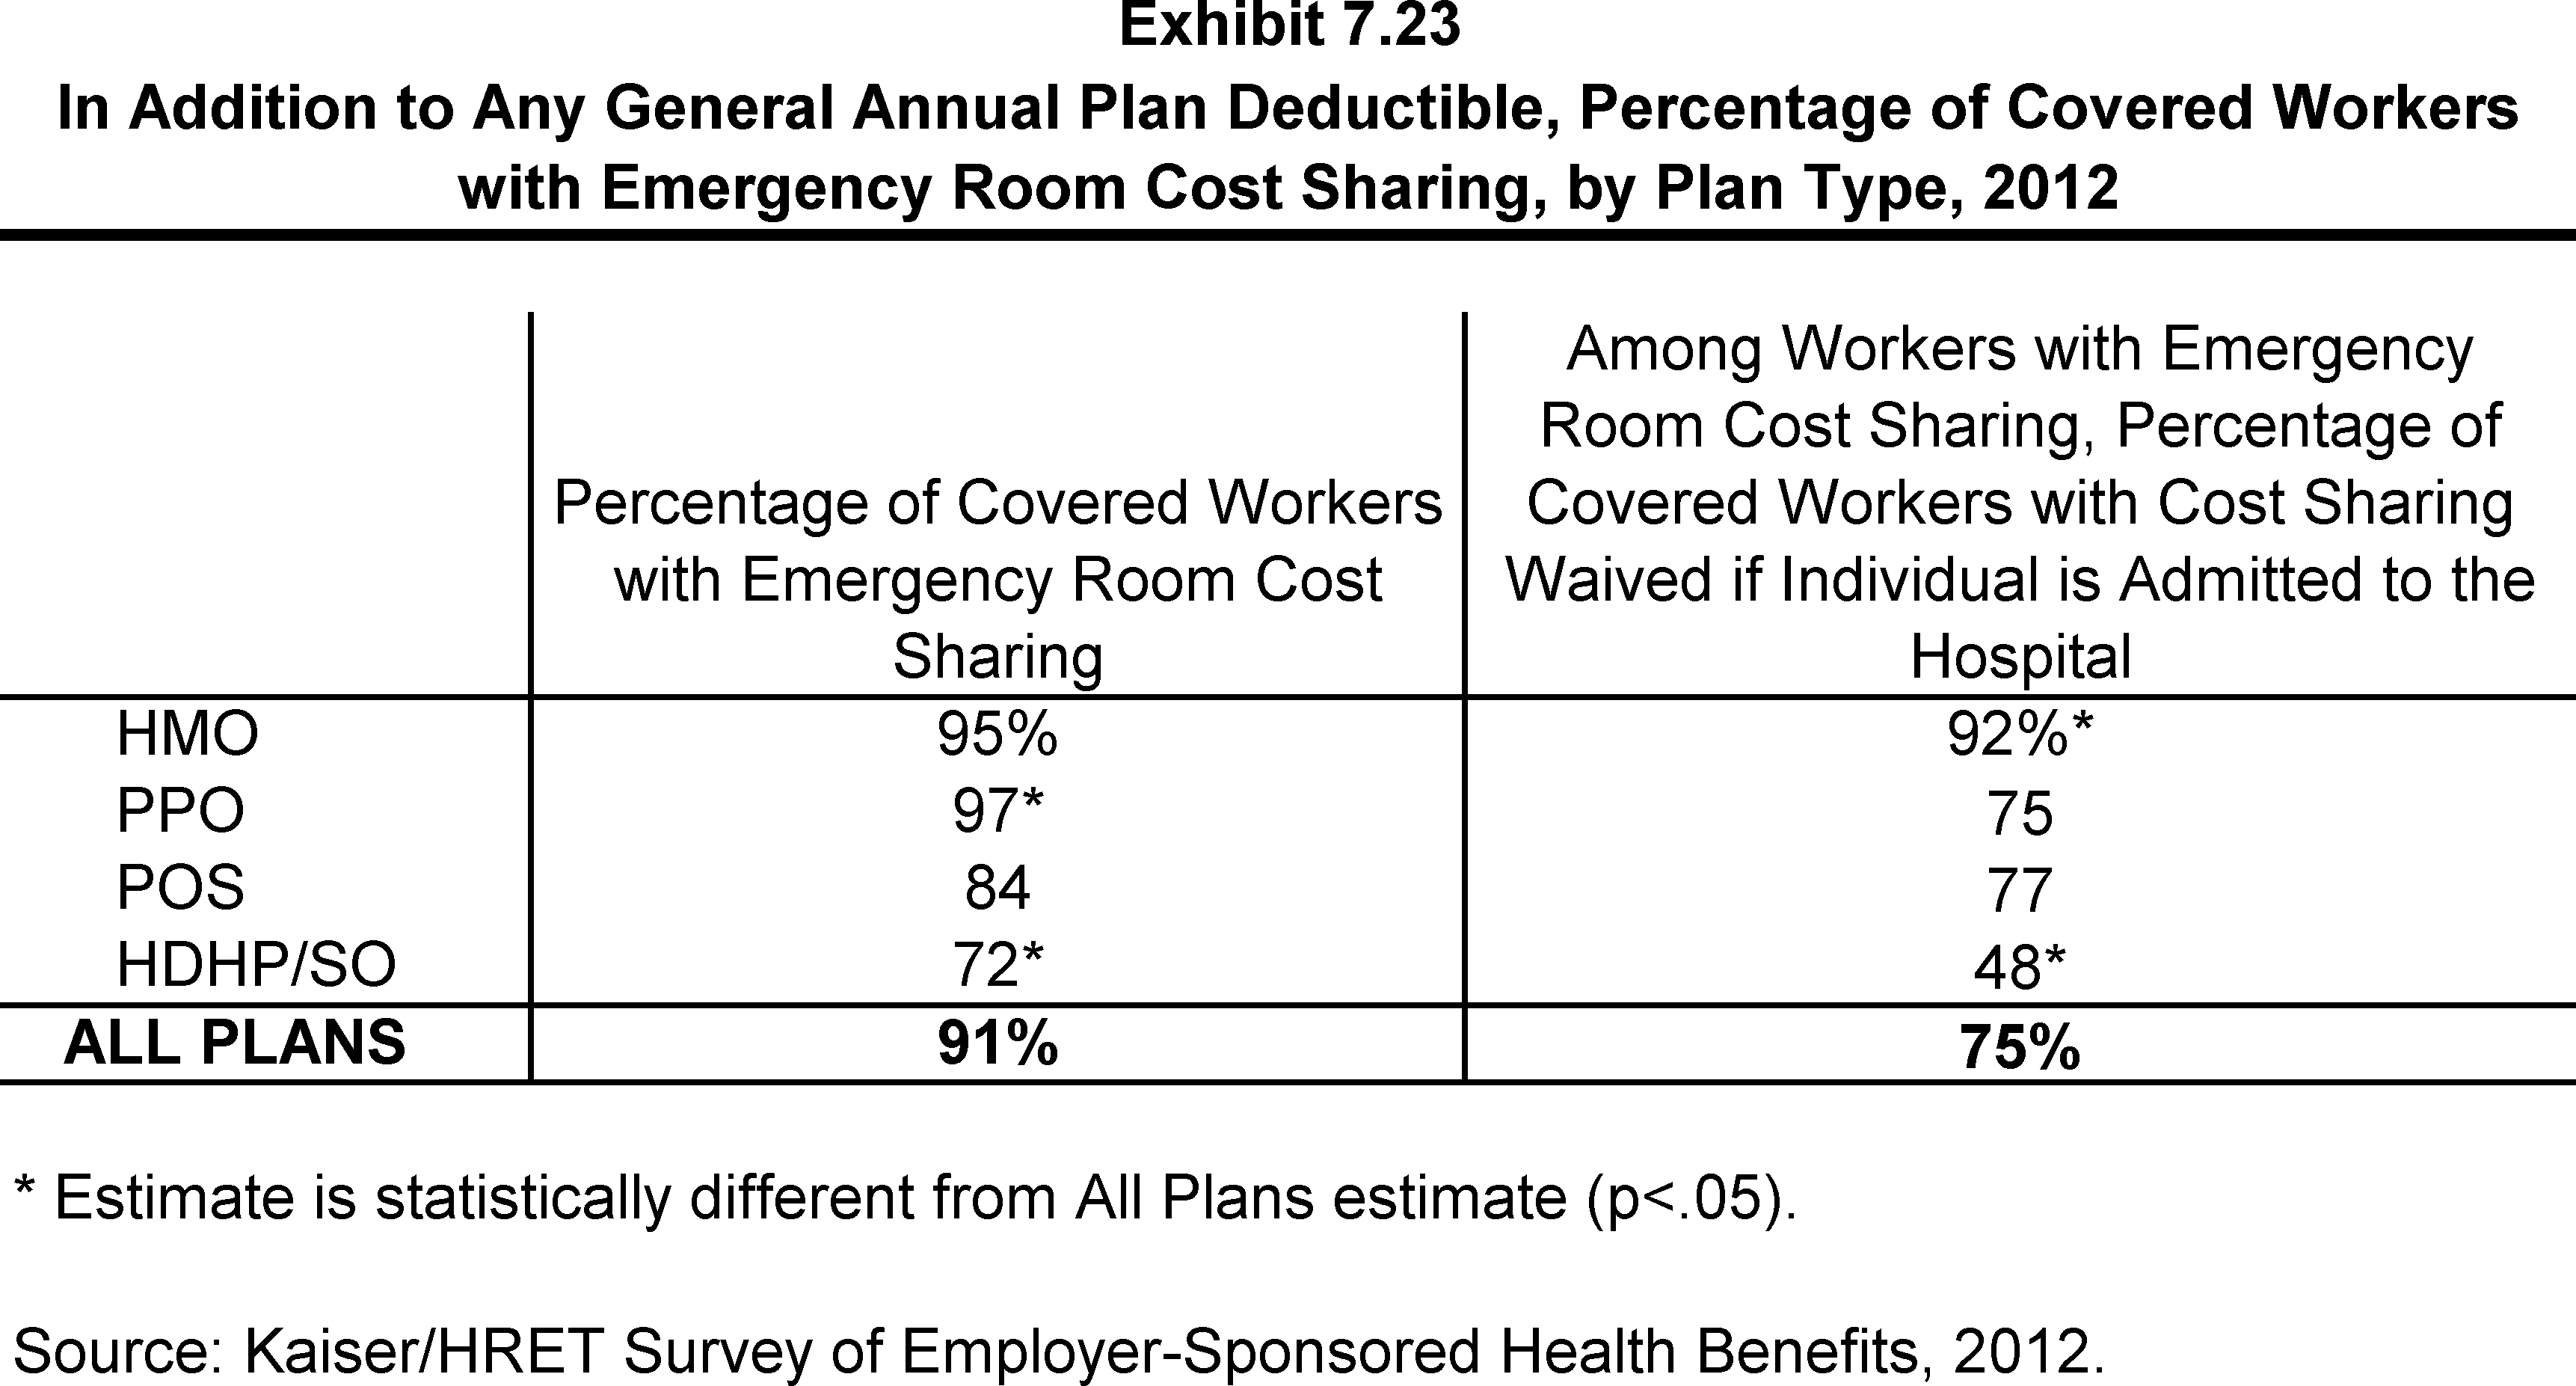
- Ninety-one percent of covered workers have cost sharing for emergency room visits (Exhibit 7.23). Fifty-eight percent of workers pay a copayment while 22% pay coinsurance (Exhibit 7.22). The average copayment is $118 while the average coinsurance is 18% (Exhibit 7.24). 3
- Covered workers may find their emergency room cost sharing is waived if they are admitted to the hospital. Among workers with cost sharing for emergency room visits, 75% have the cost sharing waived if they are admitted to the hospital (Exhibit 7.23).
- Ninety-one percent of covered workers have cost sharing for emergency room visits (Exhibit 7.23). Fifty-eight percent of workers pay a copayment while 22% pay coinsurance (Exhibit 7.22). The average copayment is $118 while the average coinsurance is 18% (Exhibit 7.24). 3
Out-Of-Pocket Maximum Amounts
- Most covered workers are in a plan that partially or totally limits the cost sharing that a plan enrollee must pay in a year. These limits are generally referred to as out-of-pocket maximum amounts. Enrollee cost sharing, such as deductibles, office visit cost sharing, or spending on prescription drugs, may or may not apply to the out-of-pocket maximum. Therefore, the survey asks what types of out-of-pocket expenses plans count when determining whether a covered worker has met the plan out-of-pocket maximum. When a plan does not count certain types of spending, it effectively increases the amount a worker may pay out-of-pocket.
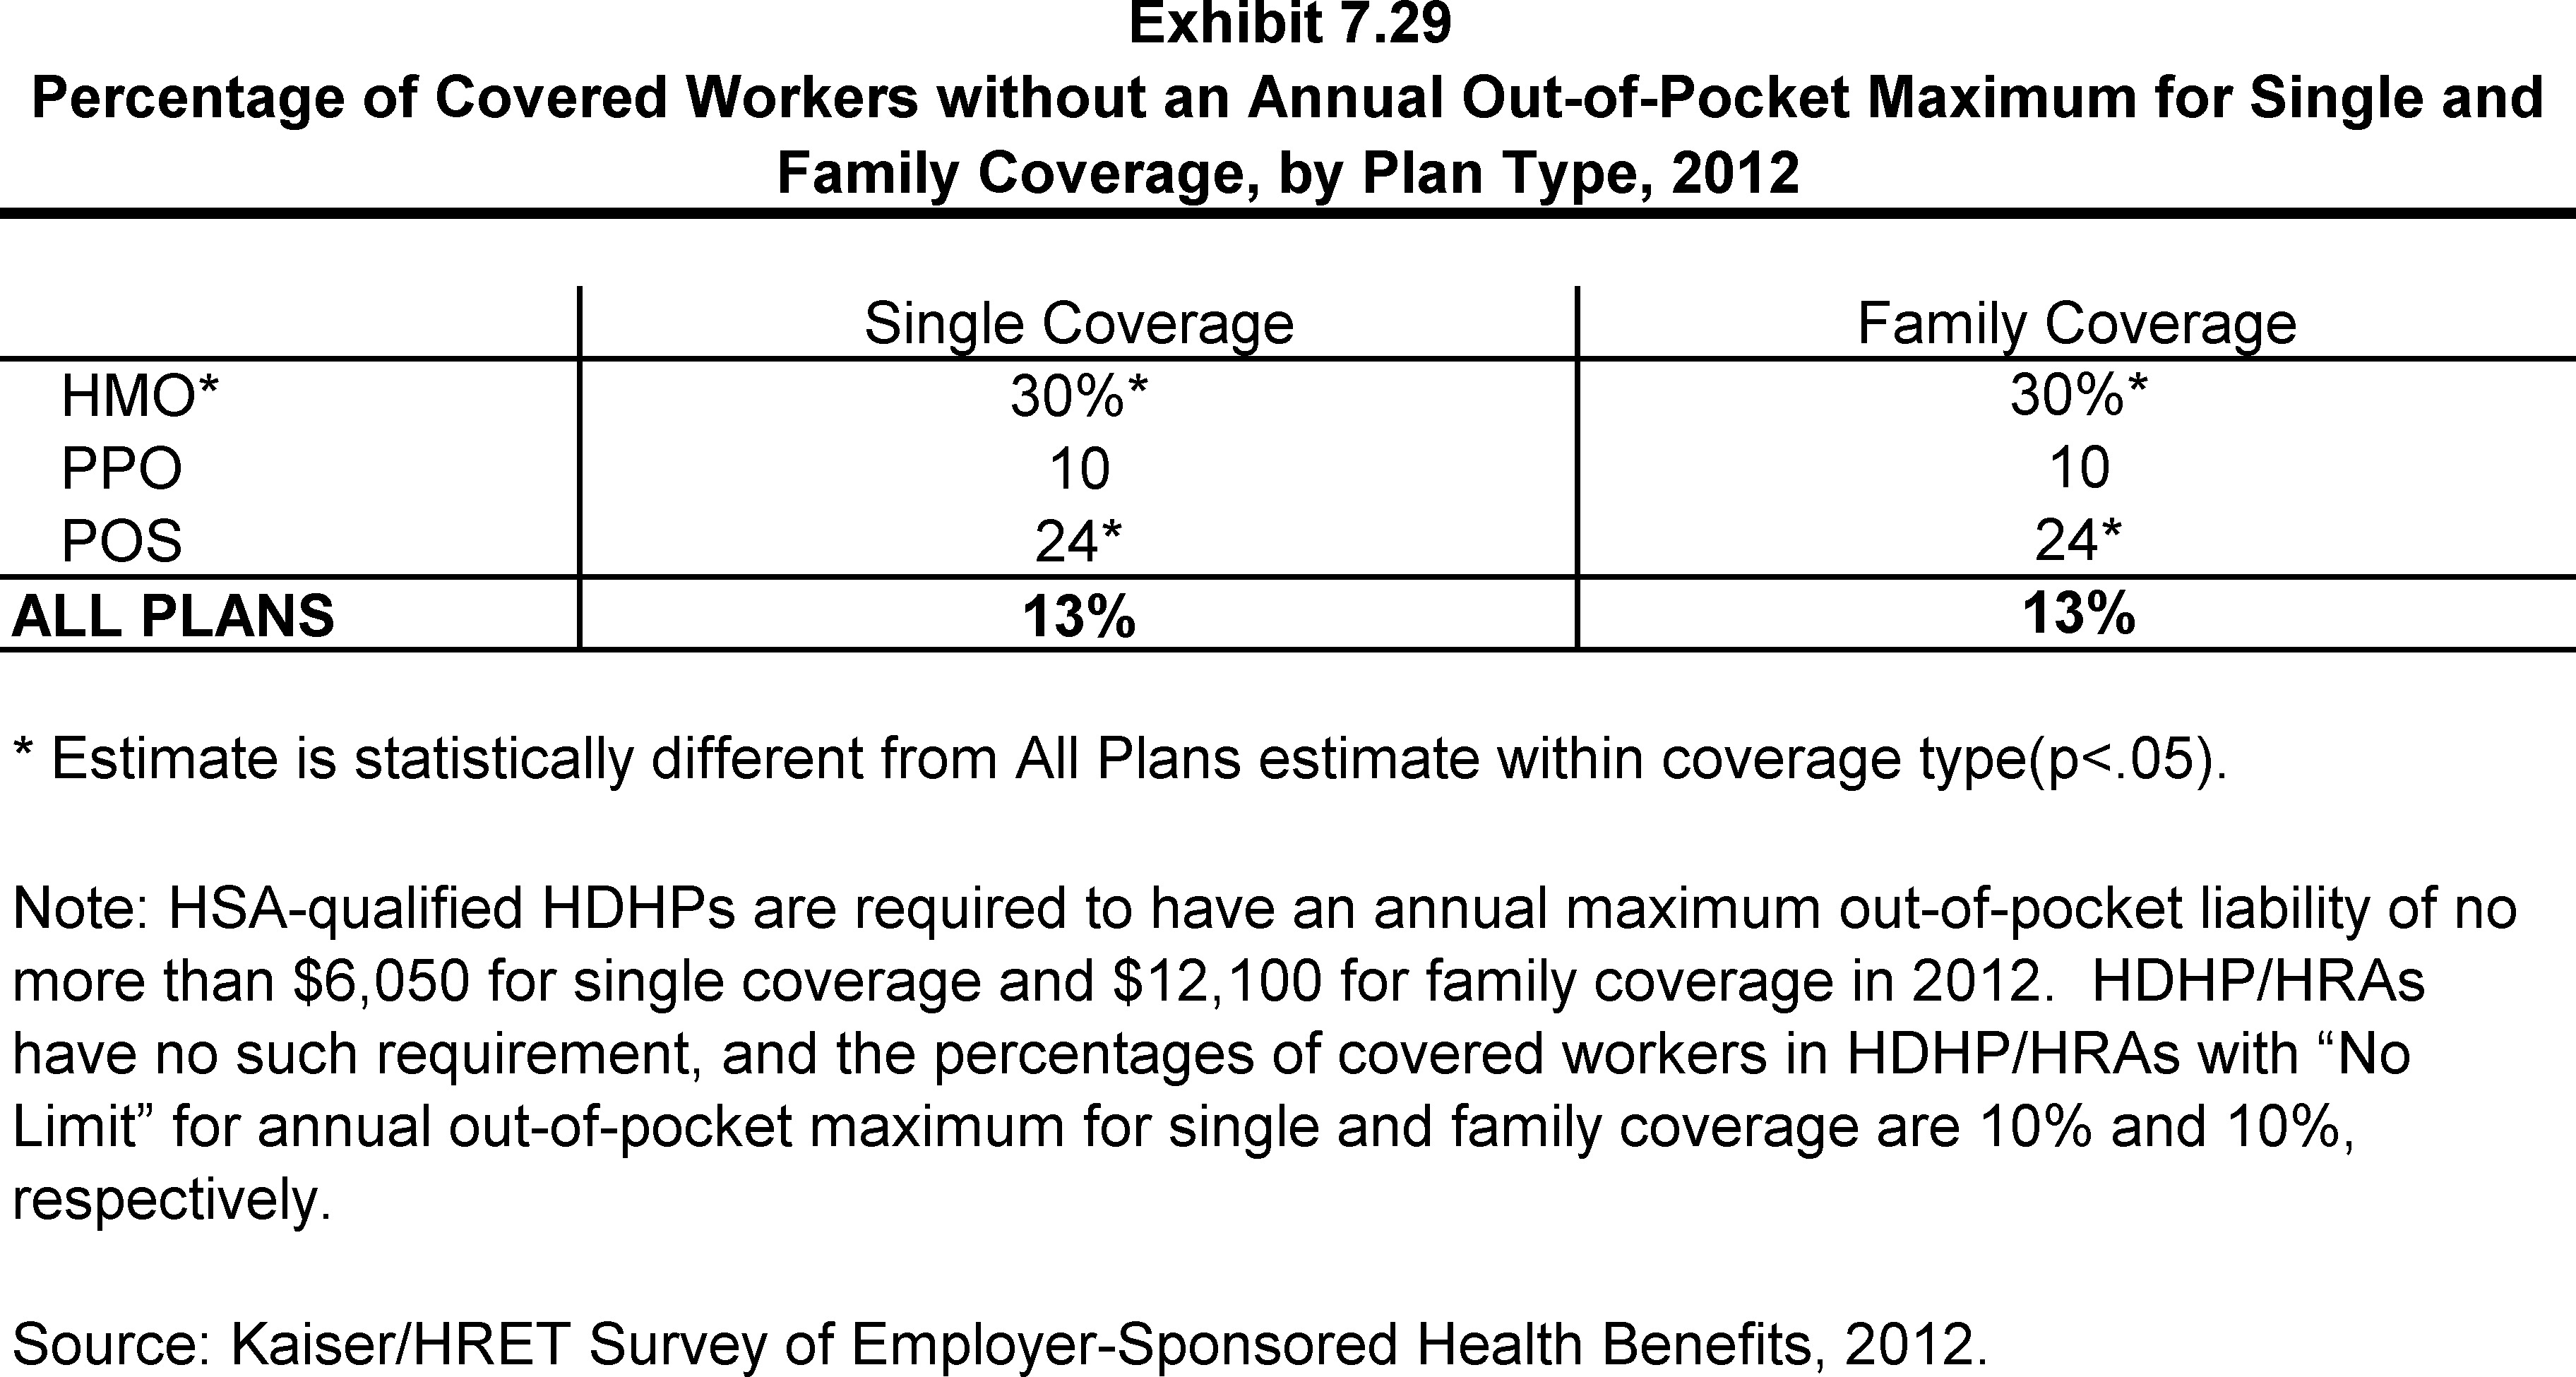
- Thirteen percent of covered workers are in a plan that does not limit the amount of cost sharing enrollees have to pay for either single or family coverage (Exhibit 7.29). Covered workers in small firms (3 to 199 workers) are more likely to be in a plan without a limit on cost sharing than workers in larger firms (22% vs. 9%) (Exhibit 7.32).
- Covered workers with single or family coverage in HMOs (30%) are more likely to be enrolled in a plan that does not limit the amount of cost sharing than workers in PPOs (10%) (Exhibit 7.29).
- Covered workers without an out-of-pocket maximum, however, may not have large cost-sharing responsibilities. For example, 76% of covered workers in HMOs with no out-of-pocket maximum for single coverage have no general annual deductible, only 4% have coinsurance for a hospital admission and less than 1% have coinsurance for outpatient surgery episodes.
- HSA-qualified HDHPs are required by law to have an out-of-pocket maximum of no more than $6,050 for single coverage and $12,100 for family coverage in 2012. HDHP/HRAs have no such requirement, and among workers enrolled in these plans, 10% have no out-of-pocket maximum for single or family coverage.
- For covered workers with out-of-pocket maximums, there is wide variation in spending limits.
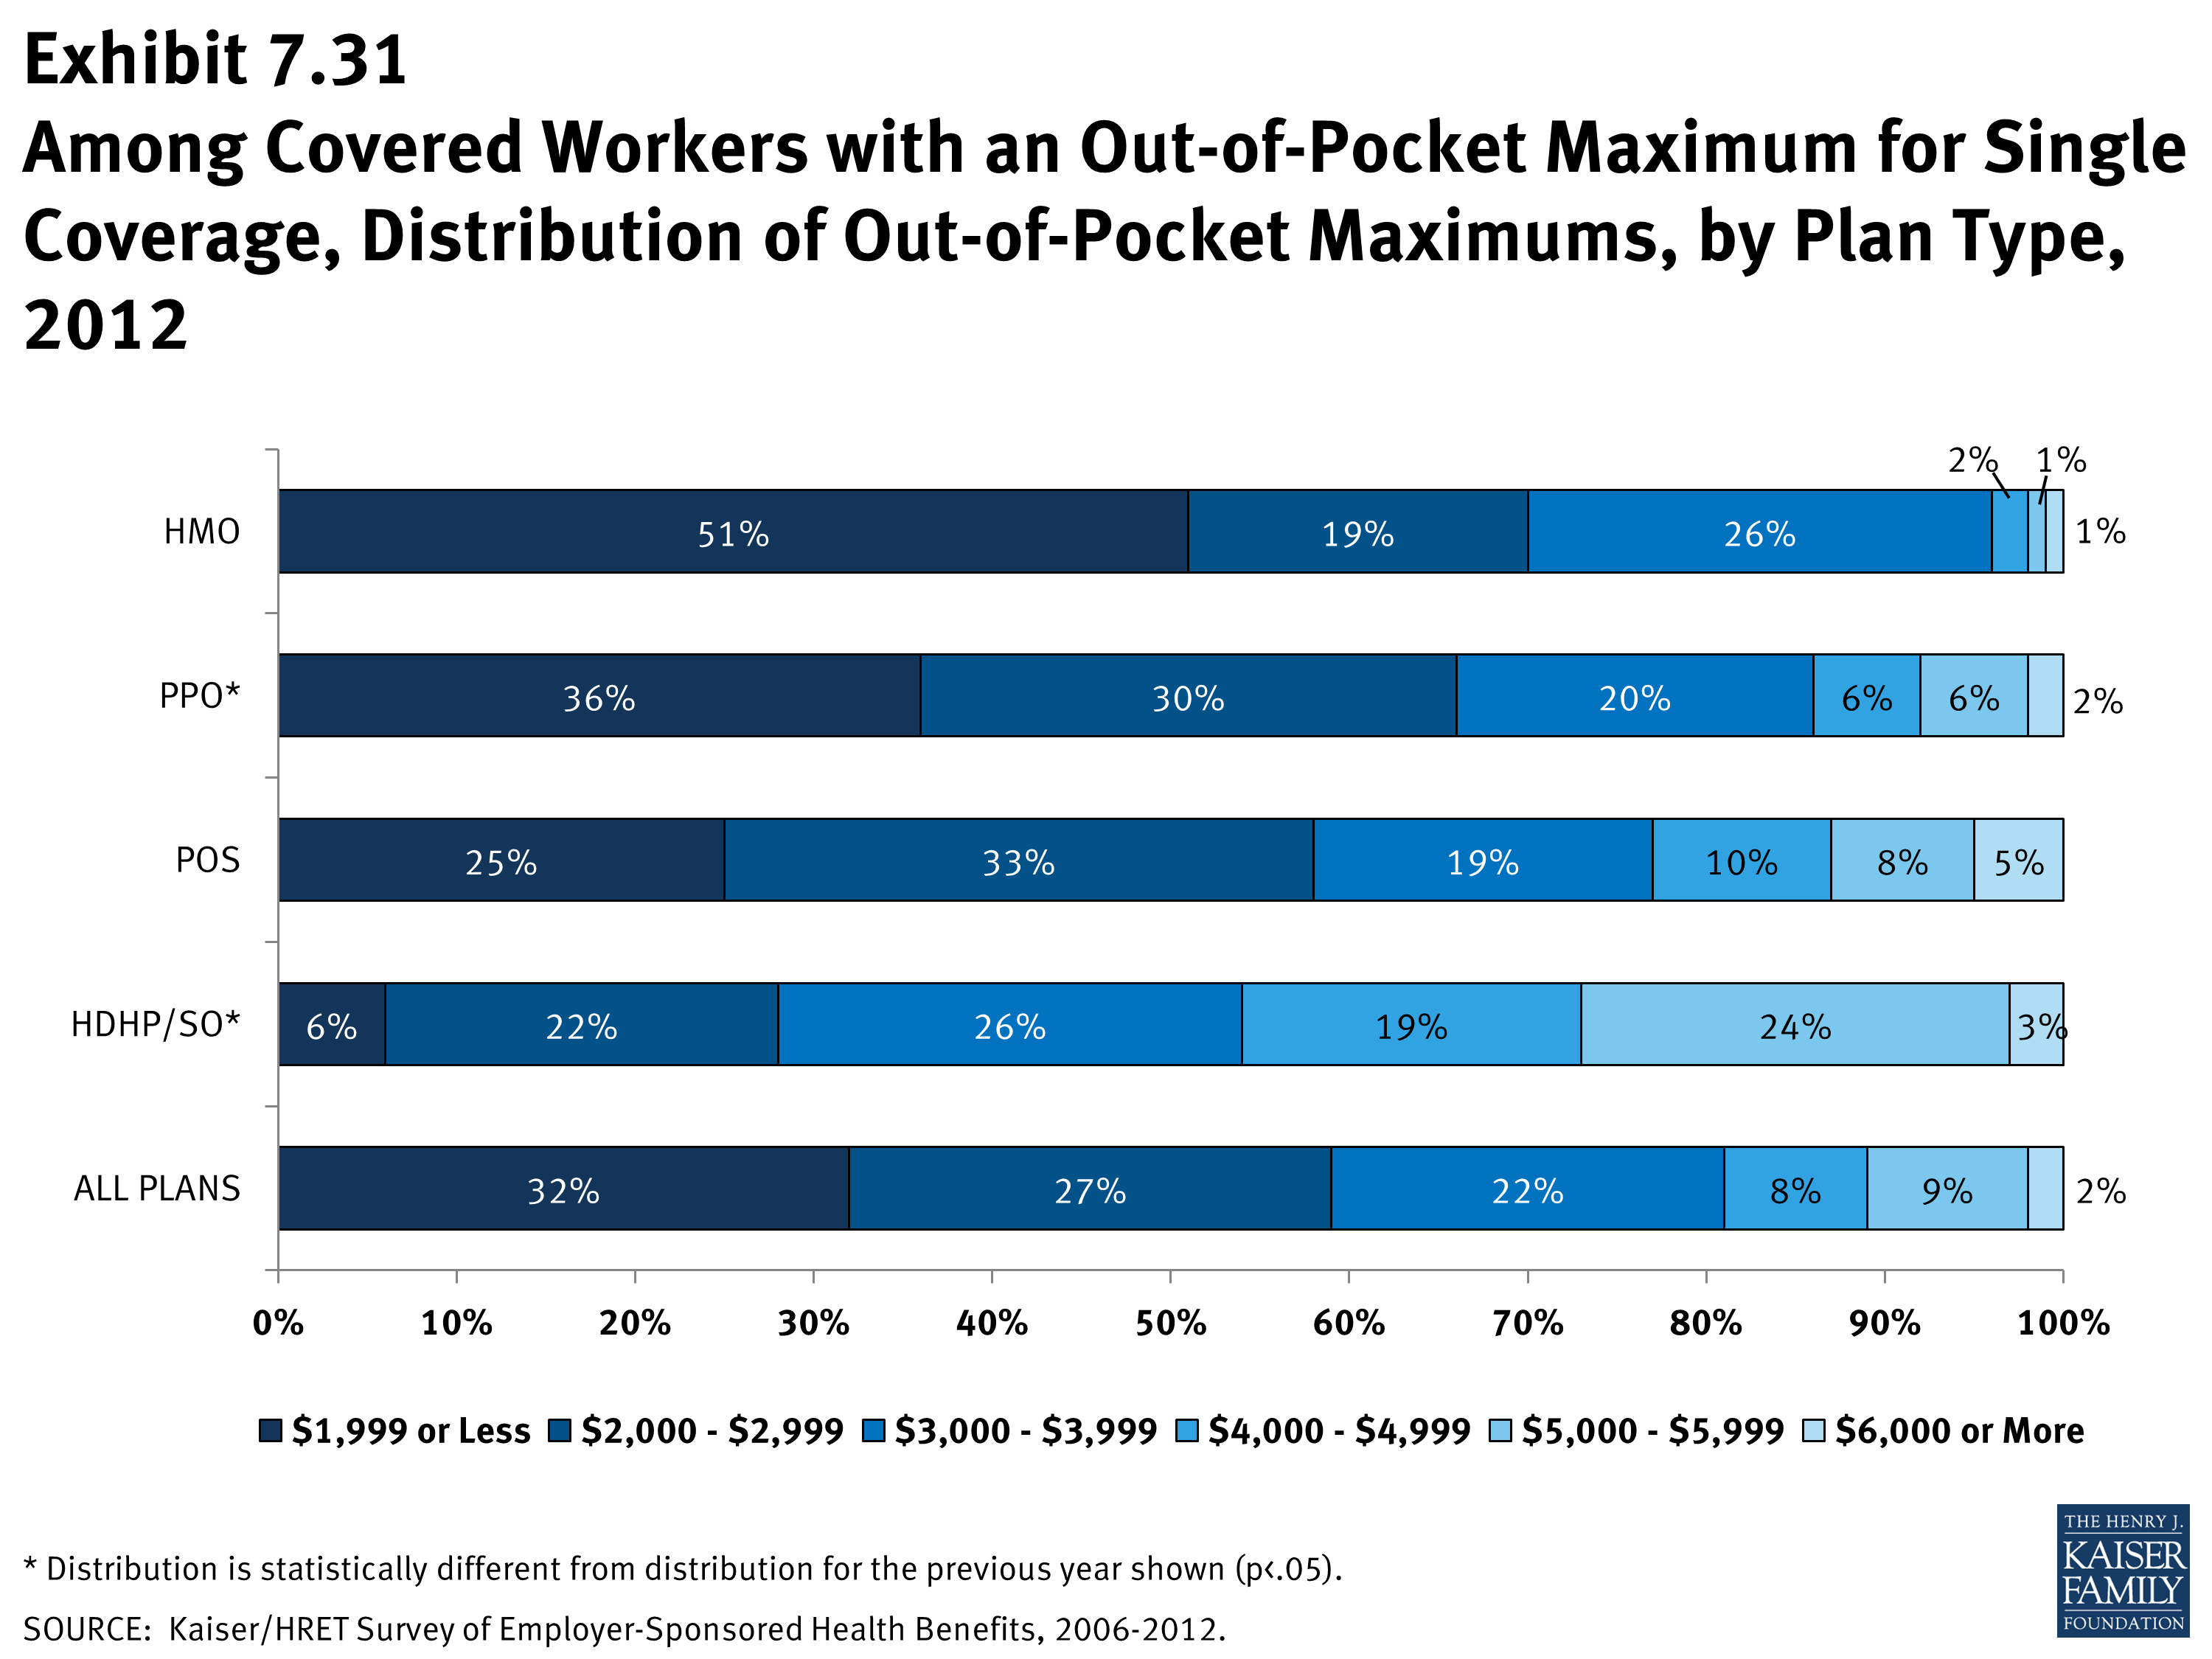
- Thirty-two percent of workers with an out-of-pocket maximum for single coverage have an out-of-pocket maximum of less than $2,000, while 41% have an out-of-pocket maximum of $3,000 or more (Exhibit 7.31). Covered workers with an out-of-pocket maximum in small firms (3 to 199 workers) are more likely than such workers in larger firms to be covered by a plan with an out-of-pocket maximum of $3,000 or more (54% vs. 36%).
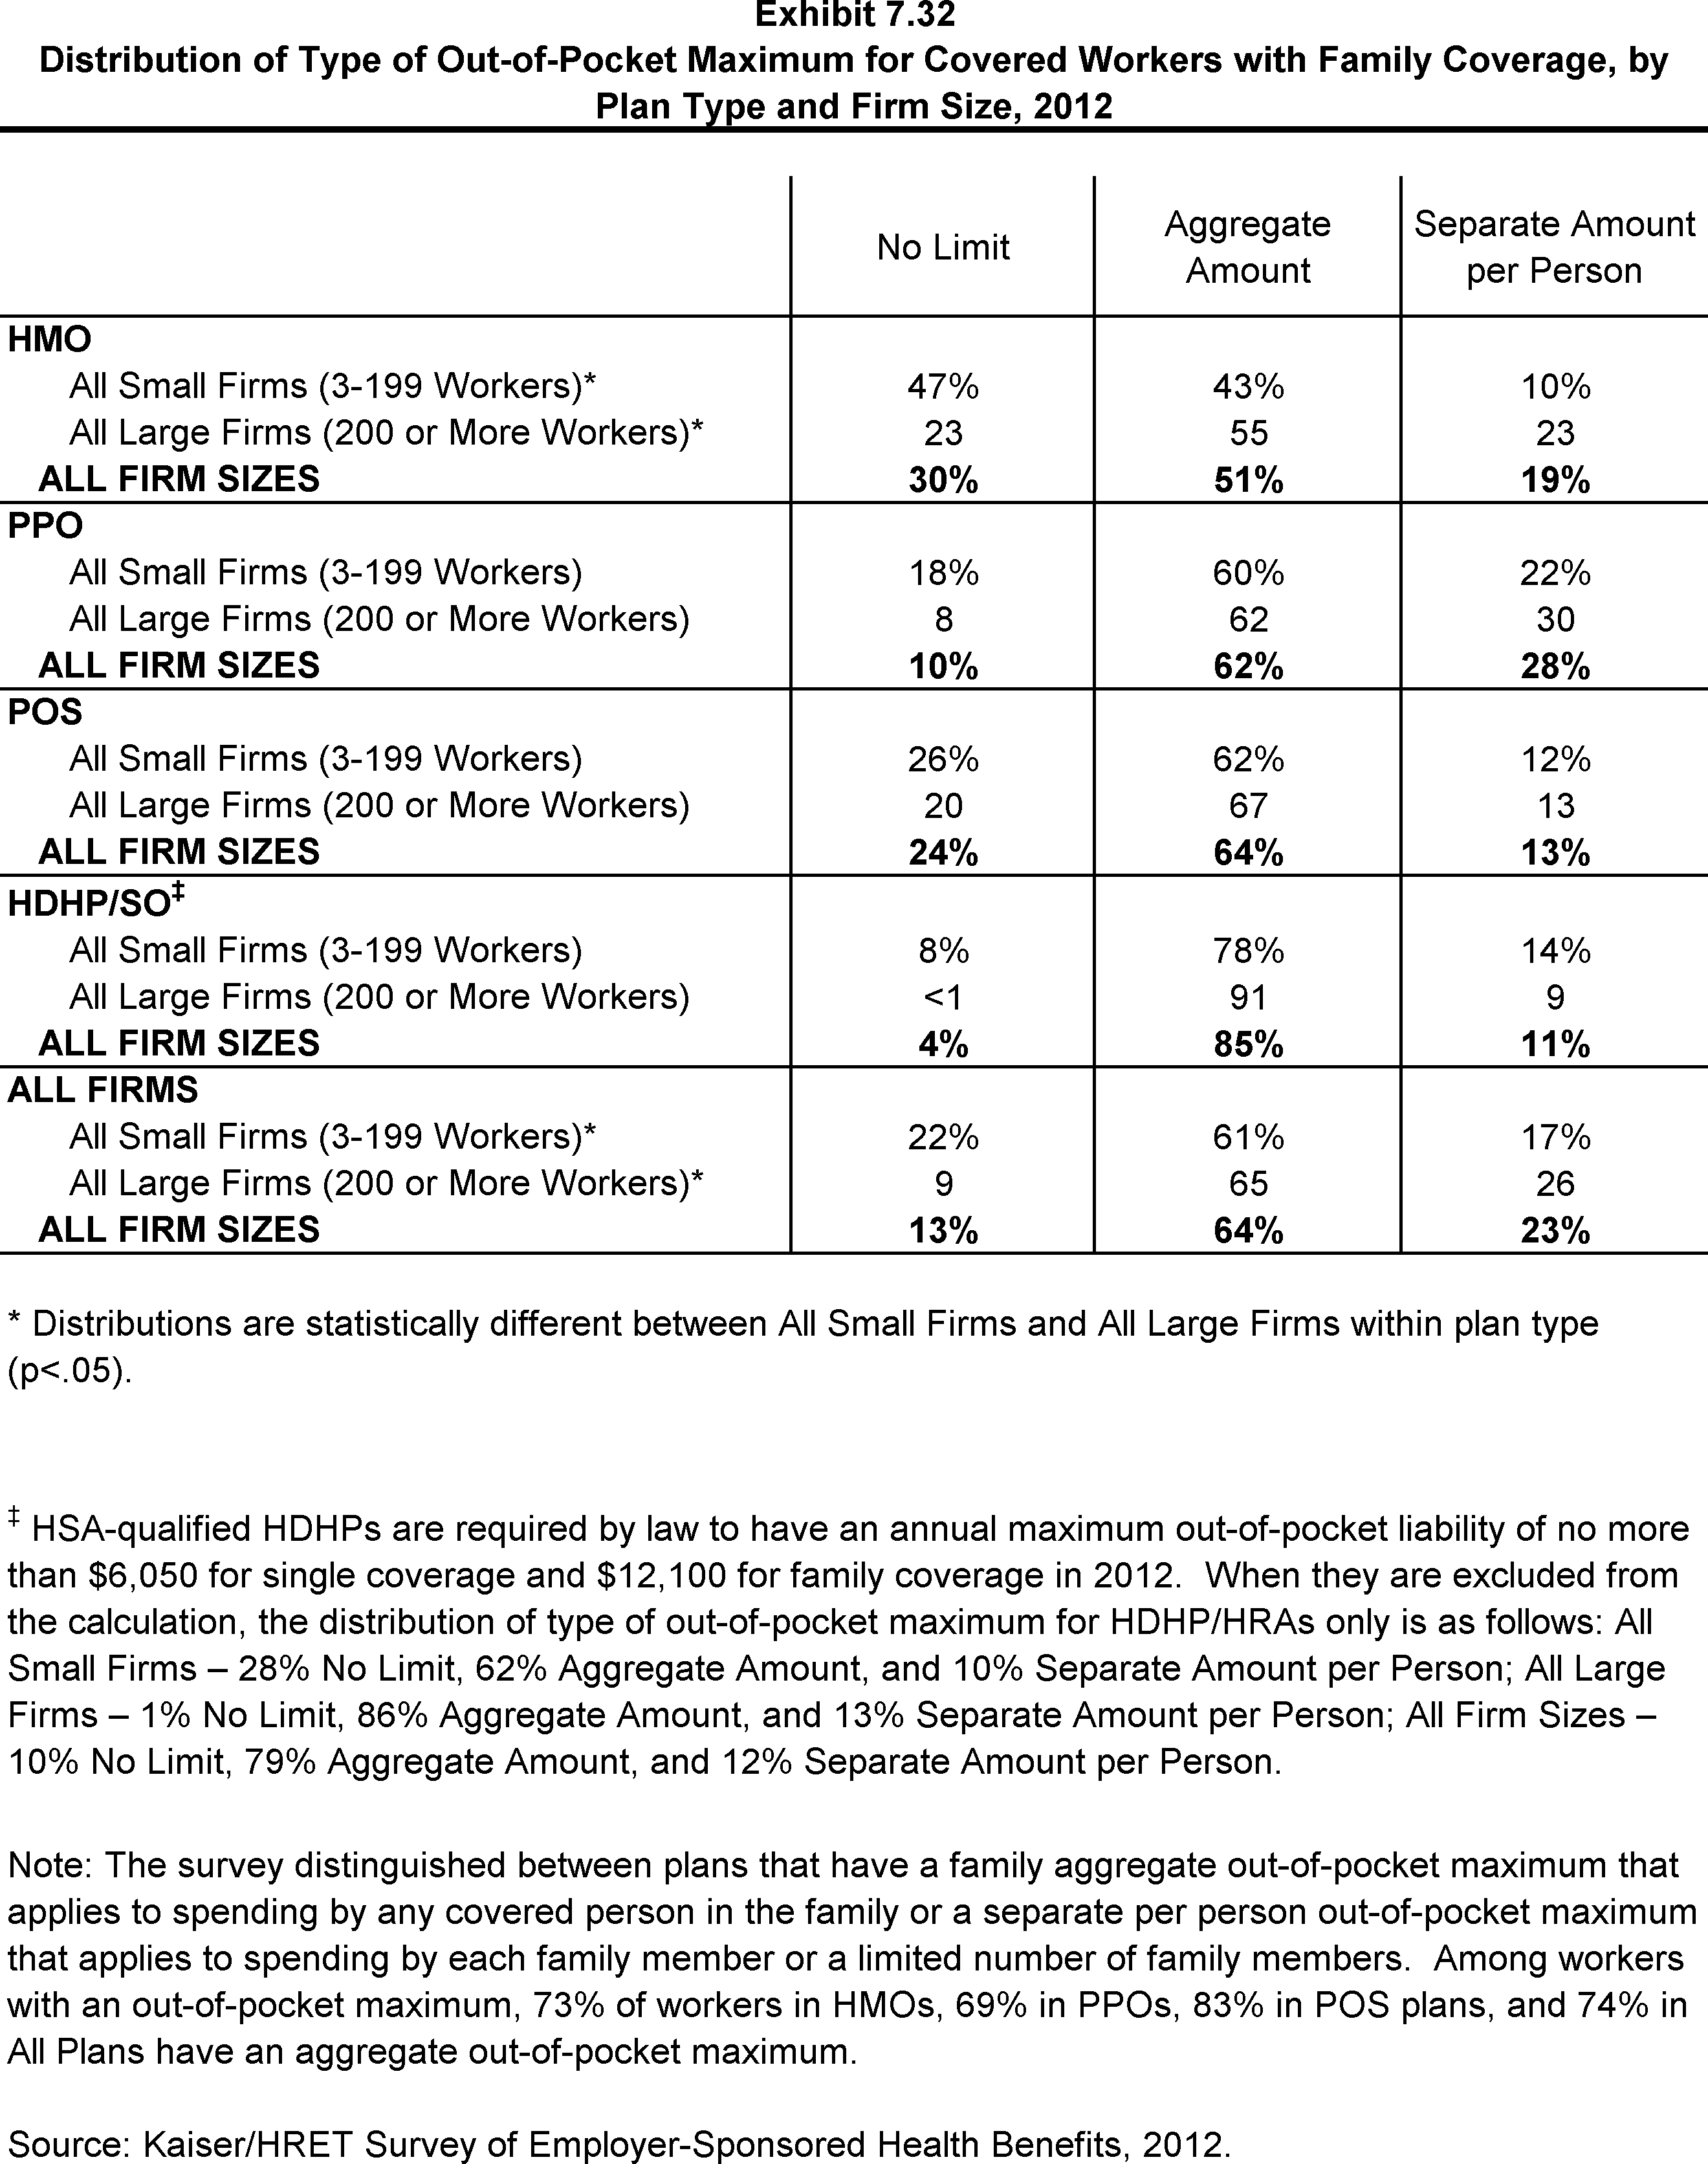
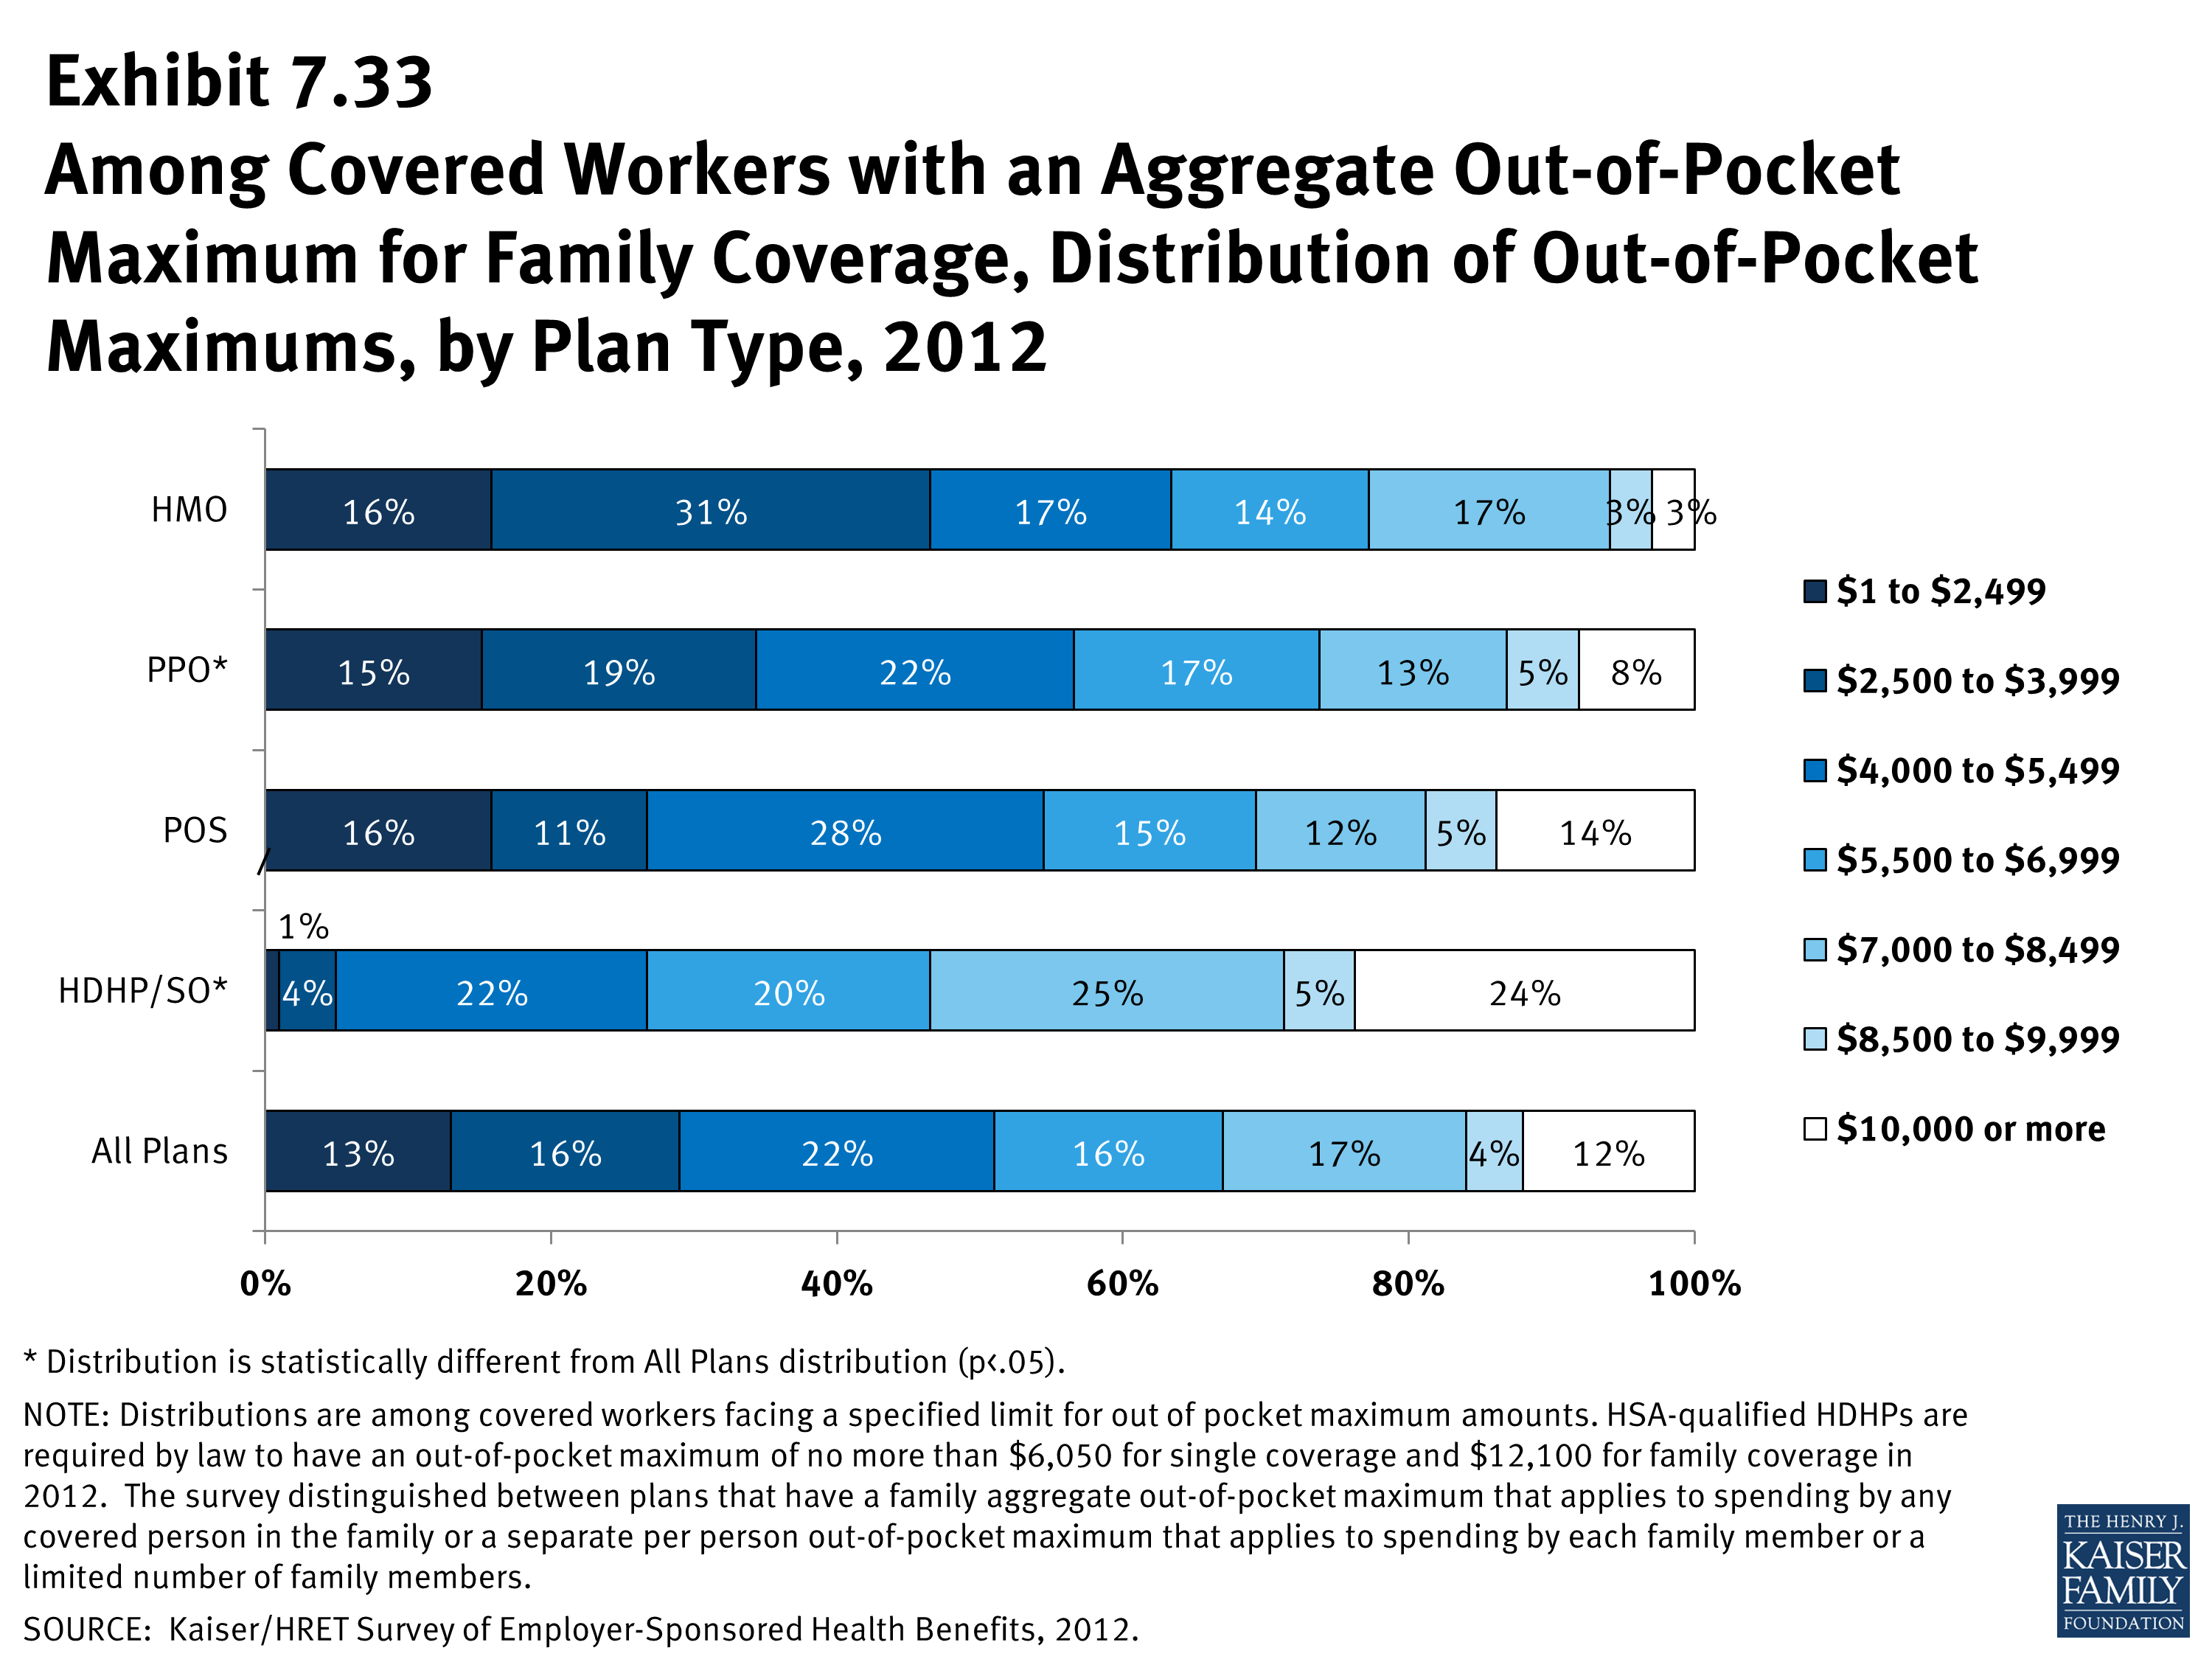
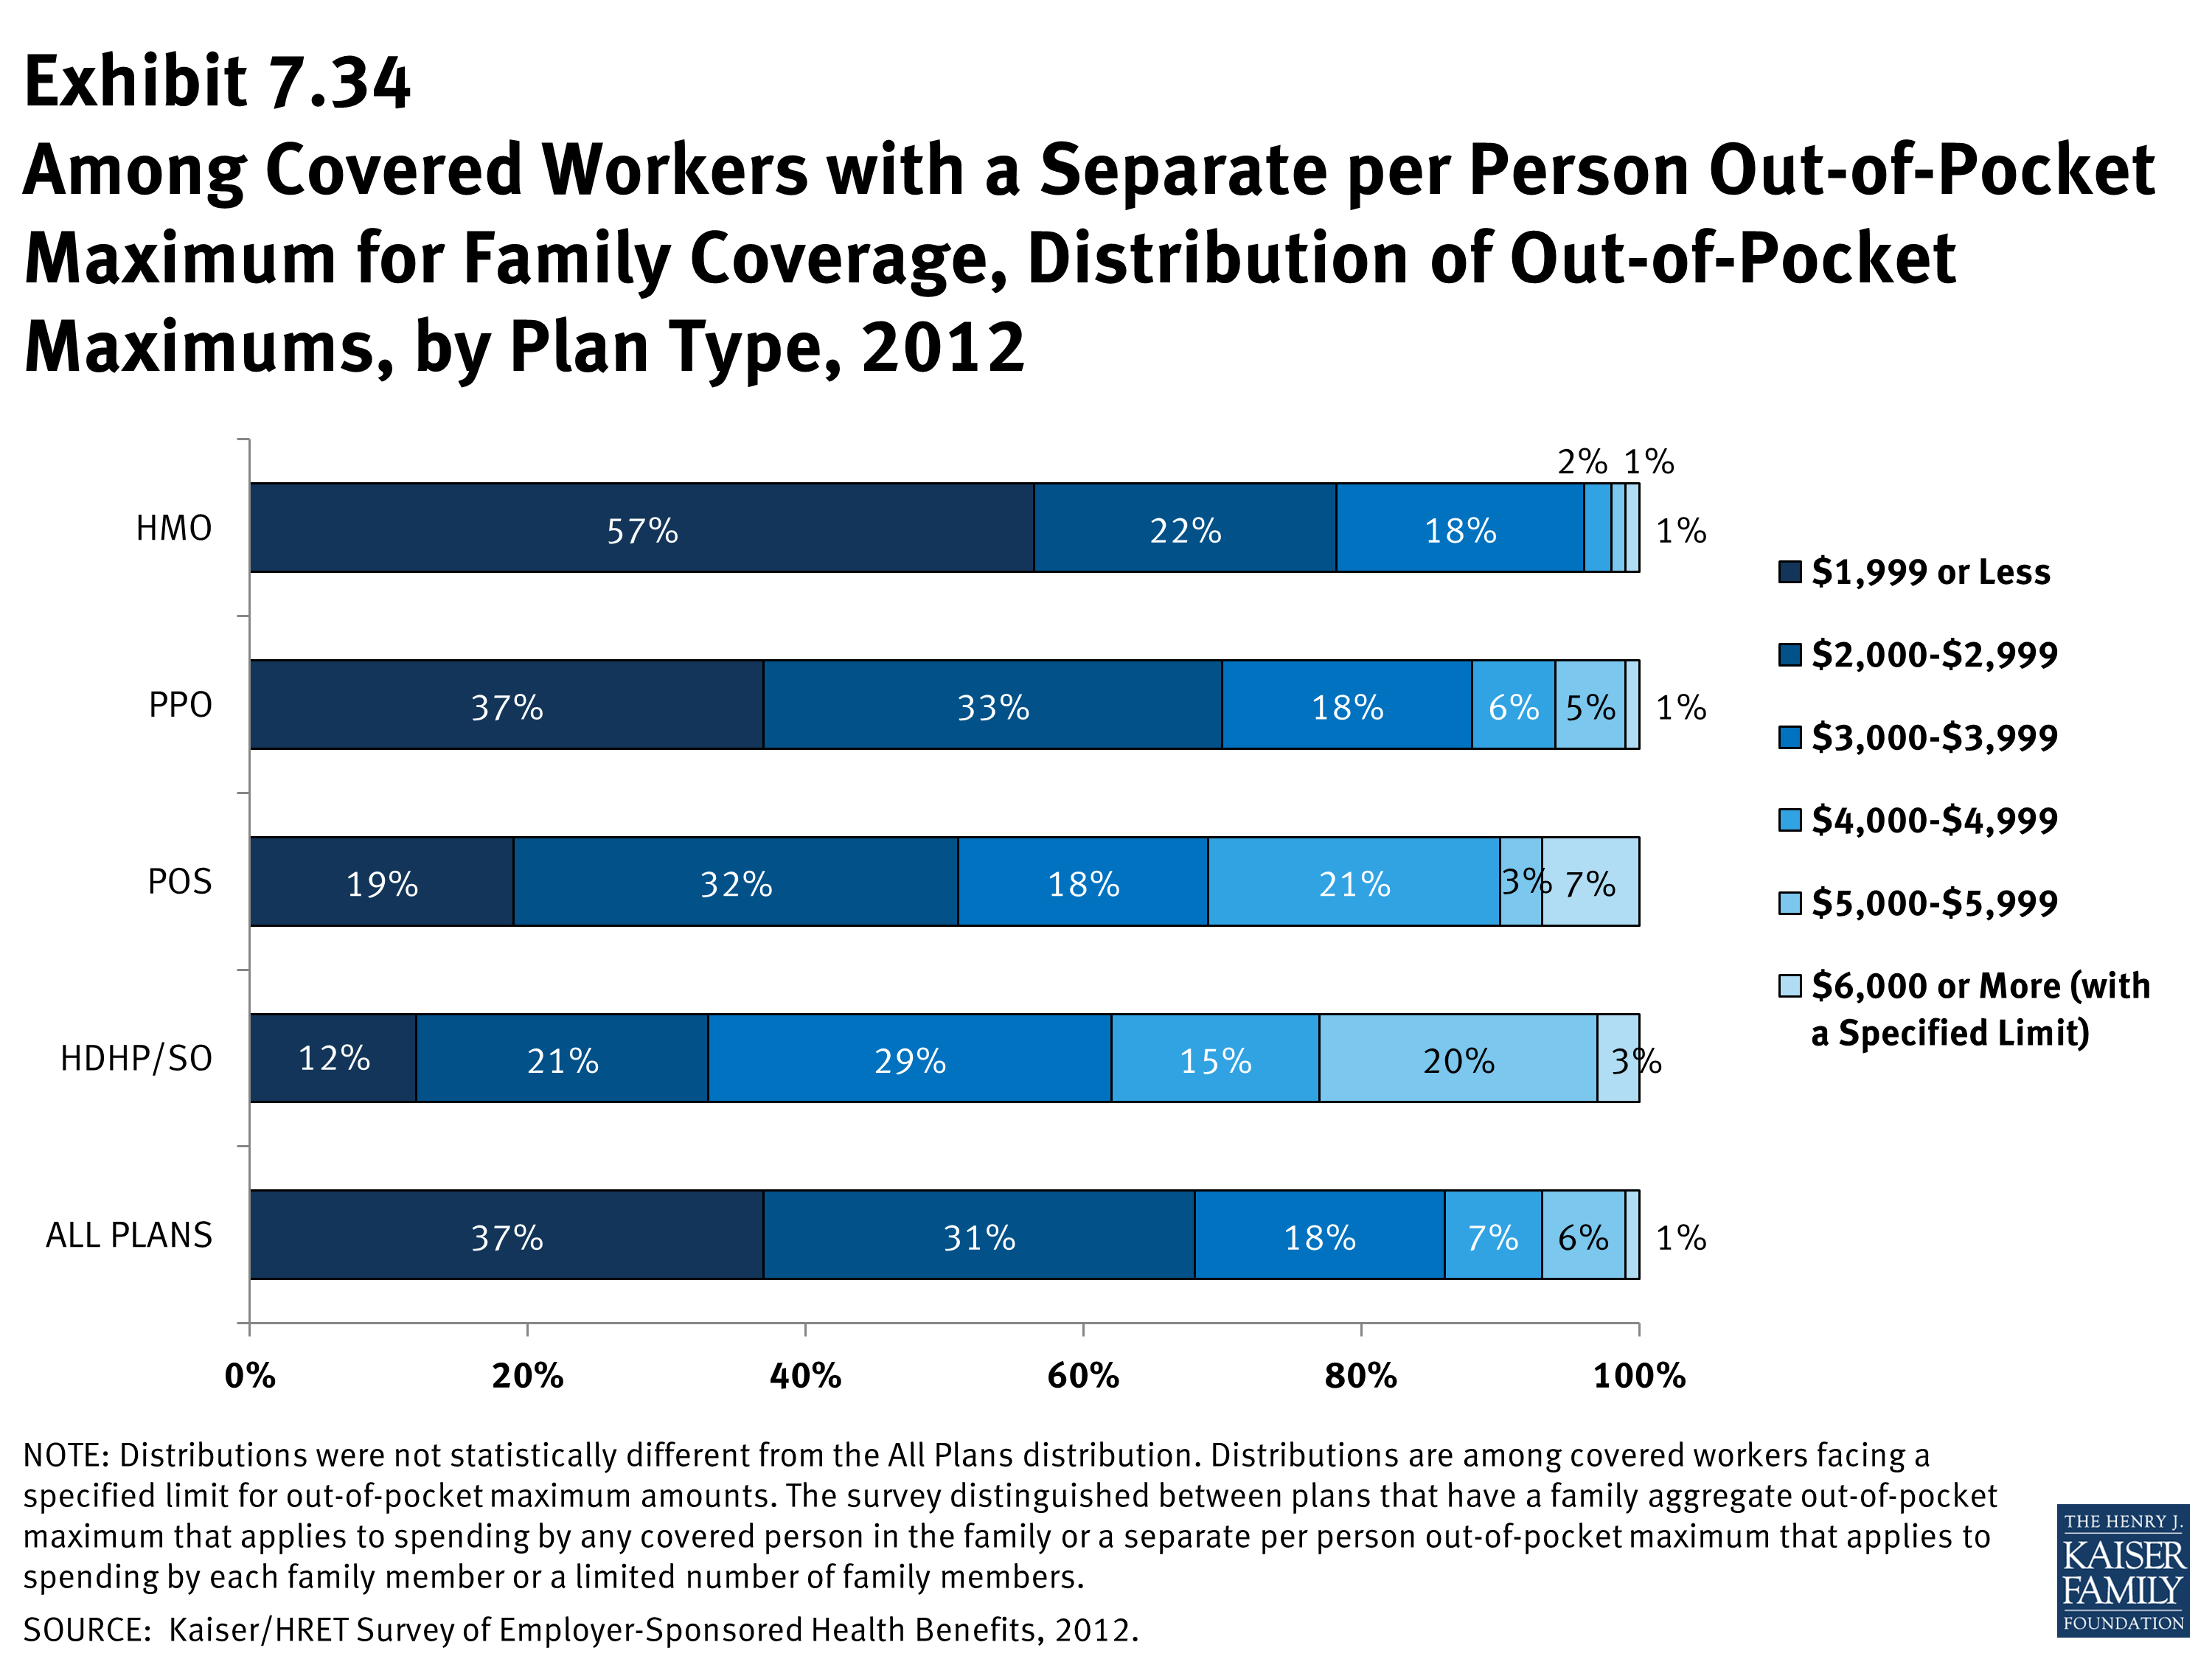
- Like deductibles, some plans have an aggregate out-of-pocket maximum amount for family coverage that applies to cost sharing for all family members, while others have a per-person out-of-pocket maximum that limits the amount of cost sharing that the family must pay on behalf of each family member. For covered workers with an aggregate out-of-pocket maximum for family coverage, 29% have an out-of-pocket maximum of less than $4,000 and 16% have an out-of-pocket maximum of $8,500 or more (Exhibit 7.33). Among workers with separate per-person out-of-pocket limits for family coverage, 86% have out-of-pocket maximums of less than $4,000 (Exhibit 7.34).
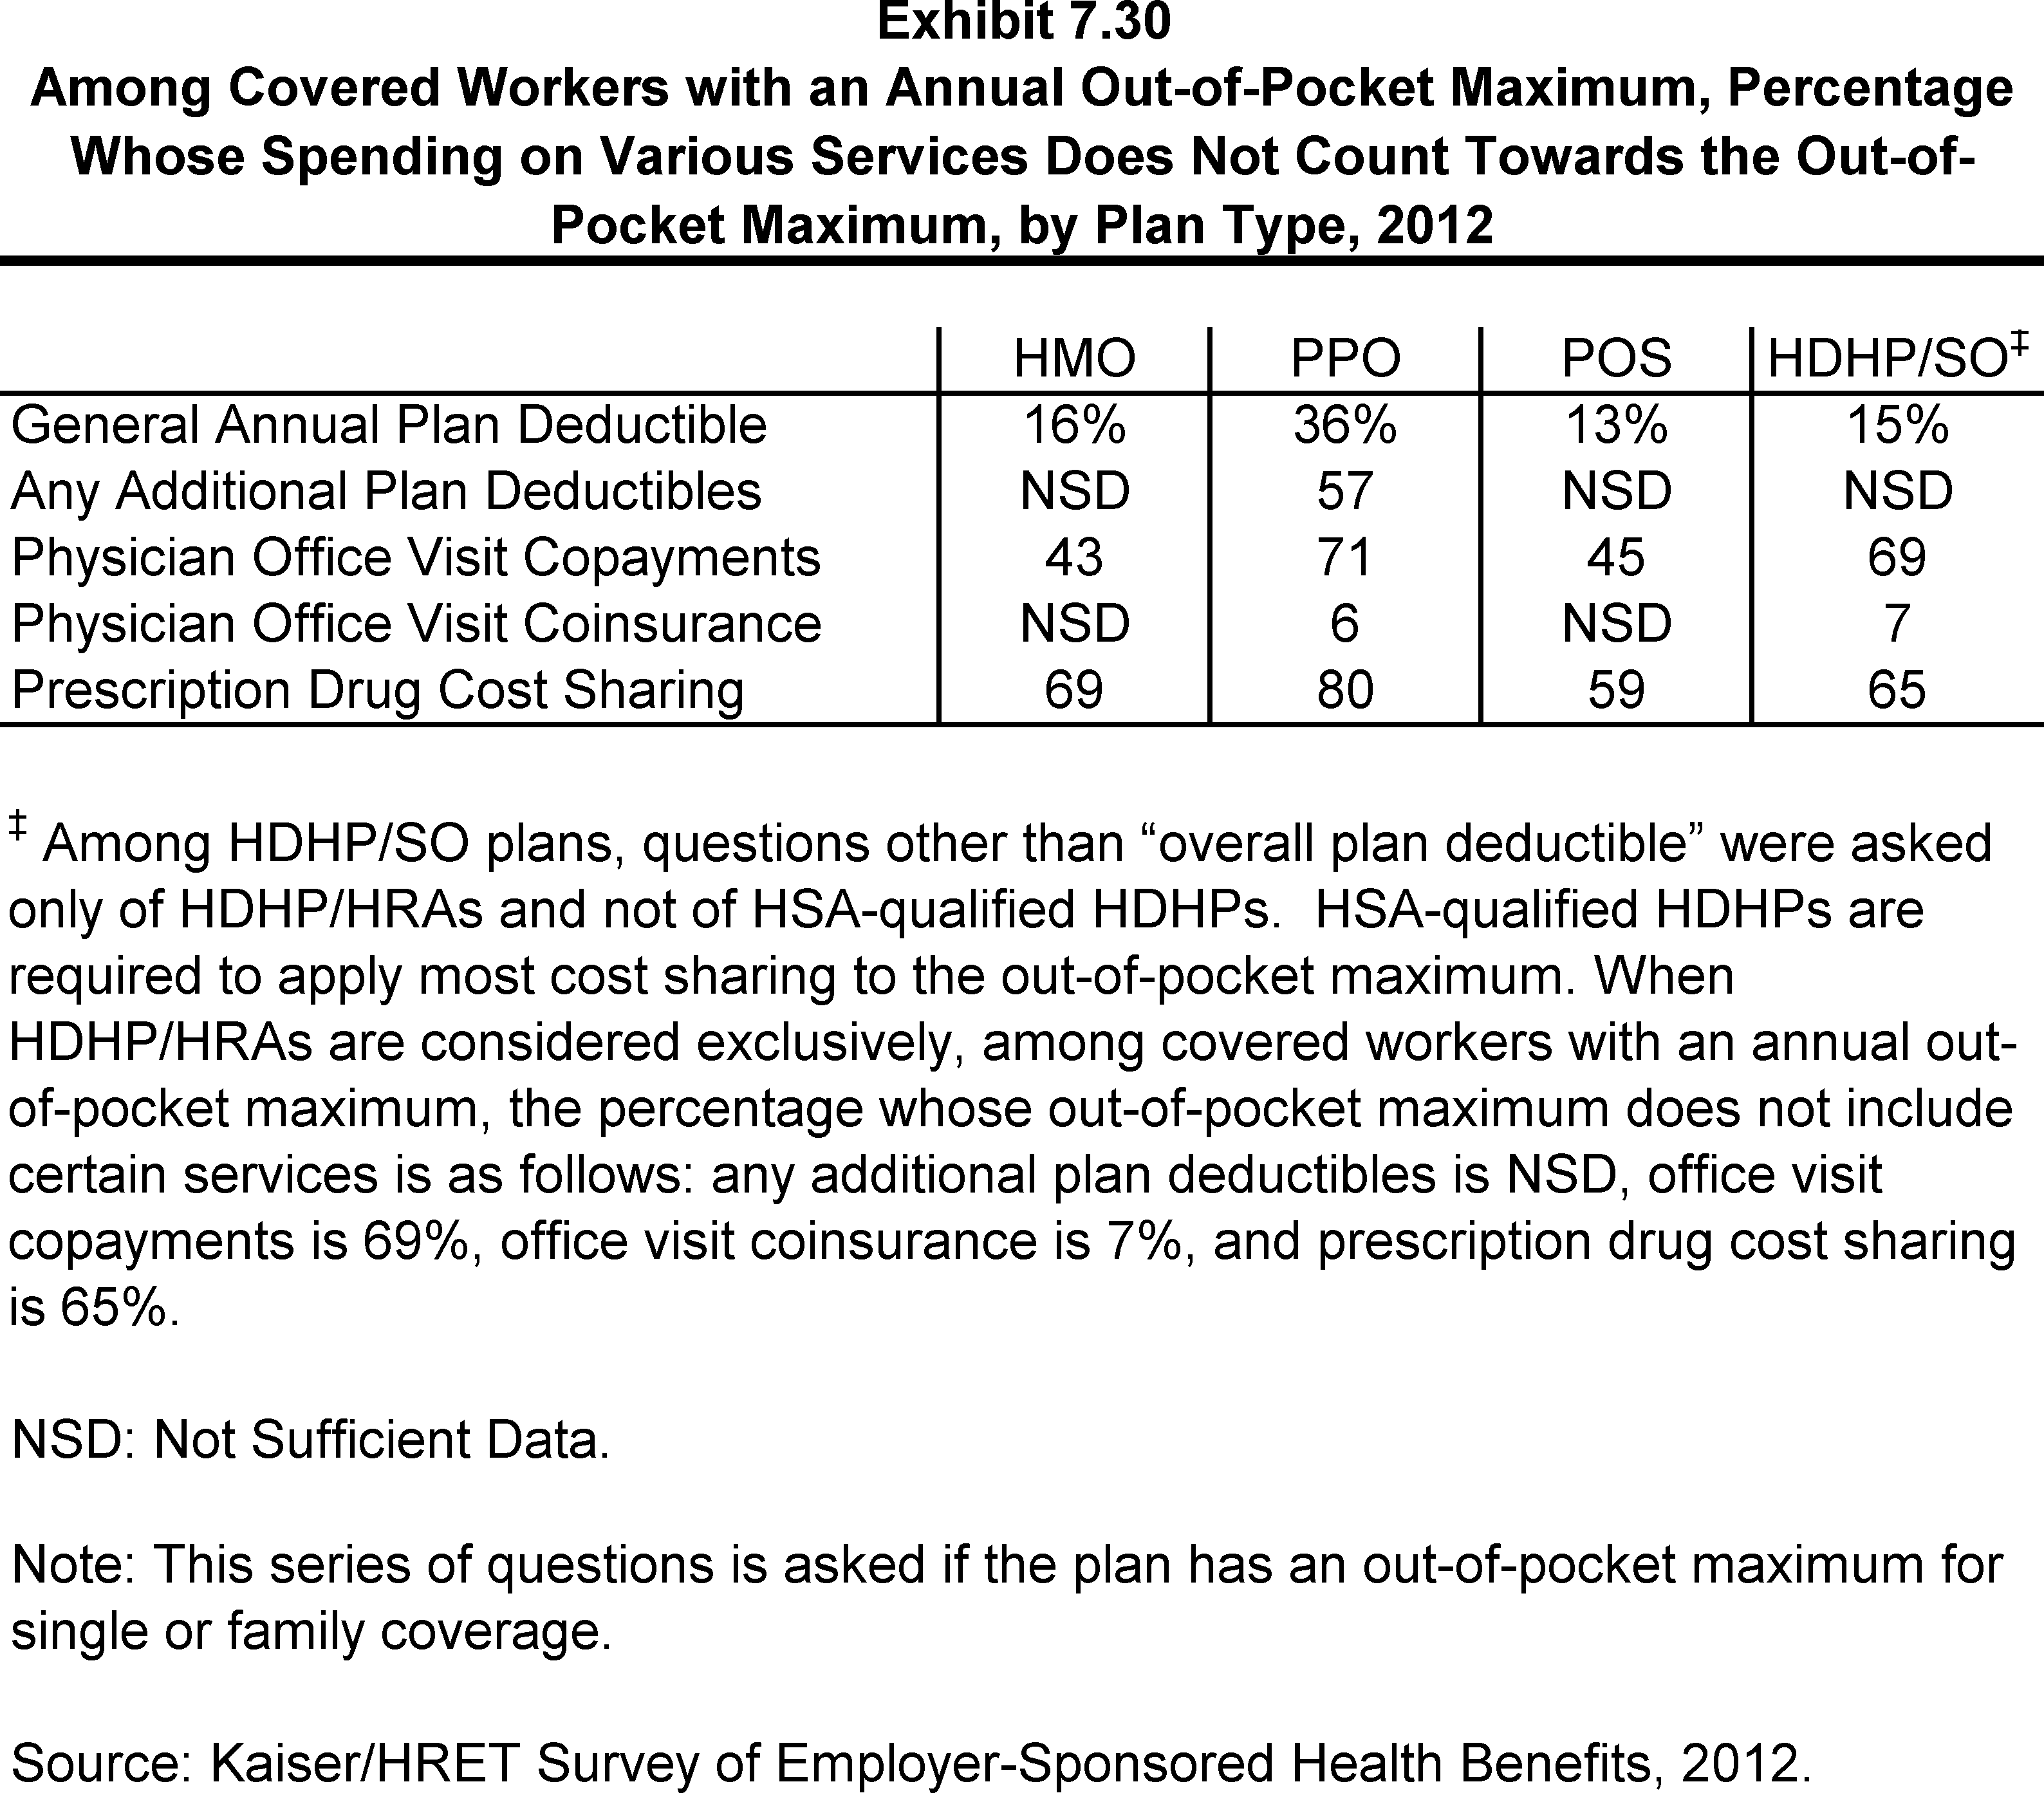
- As noted above, covered workers with an out-of-pocket maximum may be enrolled in a plan where not all spending counts toward the out-of-pocket maximum, potentially exposing workers to higher out-of-pocket spending.
- Among workers enrolled in PPO plans with an out-of-pocket maximum for single or family coverage, 36% are in plans that do not count spending for the general annual plan deductible toward the out-of-pocket limit (Exhibit 7.30).
- It is more common for covered workers to be in plans that do not count prescription drug cost sharing toward the out-of-pocket limit. Eighty percent of workers enrolled in PPO plans and 69% enrolled in HMO plans with an out-of-pocket maximum for single or family coverage are in plans that do not count prescription drug spending towards the out-of-pocket maximum (Exhibit 7.30).
Percentage of Covered Workers with No General Annual Health Plan Deductible for Single and Family Coverage, by Plan Type and Firm Size, 2012
Among Covered Workers with No General Annual Health Plan Deductible for Single and Family Coverage, Percentage Who Have the Following Types of Cost Sharing, by Plan Type, 2012
Among Covered Workers with a General Annual Health Plan Deductible for Single Coverage, Average Deductible, by Plan Type and Firm Size, 2012
Among Covered Workers with a General Annual Health Plan Deductible for Single Coverage, Average Deductible, by Plan Type and Region, 2012
Among Covered Workers with a General Annual Health Plan Deductible for Single Coverage, Average Deductible, by Plan Type, 2006- 2012
Percentage of Covered Workers Enrolled in a Plan with a High General Annual Deductible for Single Coverage, By Firm Size, 2012
Percentage of Covered Workers Enrolled in a Plan with a General Annual Deductible of $1,000 or More for Single Coverage, By Firm Size, 2006-2012
Percentage of Covered Workers Enrolled in a Plan with a General Annual Deductible of $2,000 or More for Single Coverage, By Firm Size, 2006-2012
Among Covered Workers with a General Annual Health Plan Deductible for Single PPO Coverage, Distribution of Deductibles, 2006-2012
Among Covered Workers With a General Annual Health Plan Deductible for Single POS Coverage, Distribution of Deductibles, 2006-2012
Distribution of Type of General Annual Deductible for Covered Workers with Family Coverage, by Plan Type and Firm Size, 2012
Among Covered Workers with a General Annual Health Plan Deductible, Average Deductibles for Family Coverage, by Deductible Type, Plan Type, and Firm Size, 2012
Among Covered Workers with an Aggregate General Annual Health Plan Deductible for Family Coverage, Average Deductibles, by Plan Type, 2006-2012
Among Covered Workers with a Separate Per Person General Annual Health Plan Deductible for Family Coverage, Distribution of Deductibles, by Plan Type, 2012
Among Covered Workers with an Aggregate General Annual Health Plan Deductible for Family Coverage, Distribution of Deductibles, by Plan Type, 2012
Among Covered Workers With a Separate per Person General Annual Health Plan Deductible for Family Coverage, Distribution of Maximum Number of Family Members Required to Meet the Deductible, by Plan Type, 2012
Among Covered Workers With an Aggregate General Annual Health Plan Deductible for Family Coverage, Distribution of Aggregate Deductibles, by Plan Type, 2006-2012
Among Covered Workers with a General Annual Health Plan Deductible, Percentage with Coverage for the Following Services Without Having to First Meet the Deductible, by Plan Type, 2012
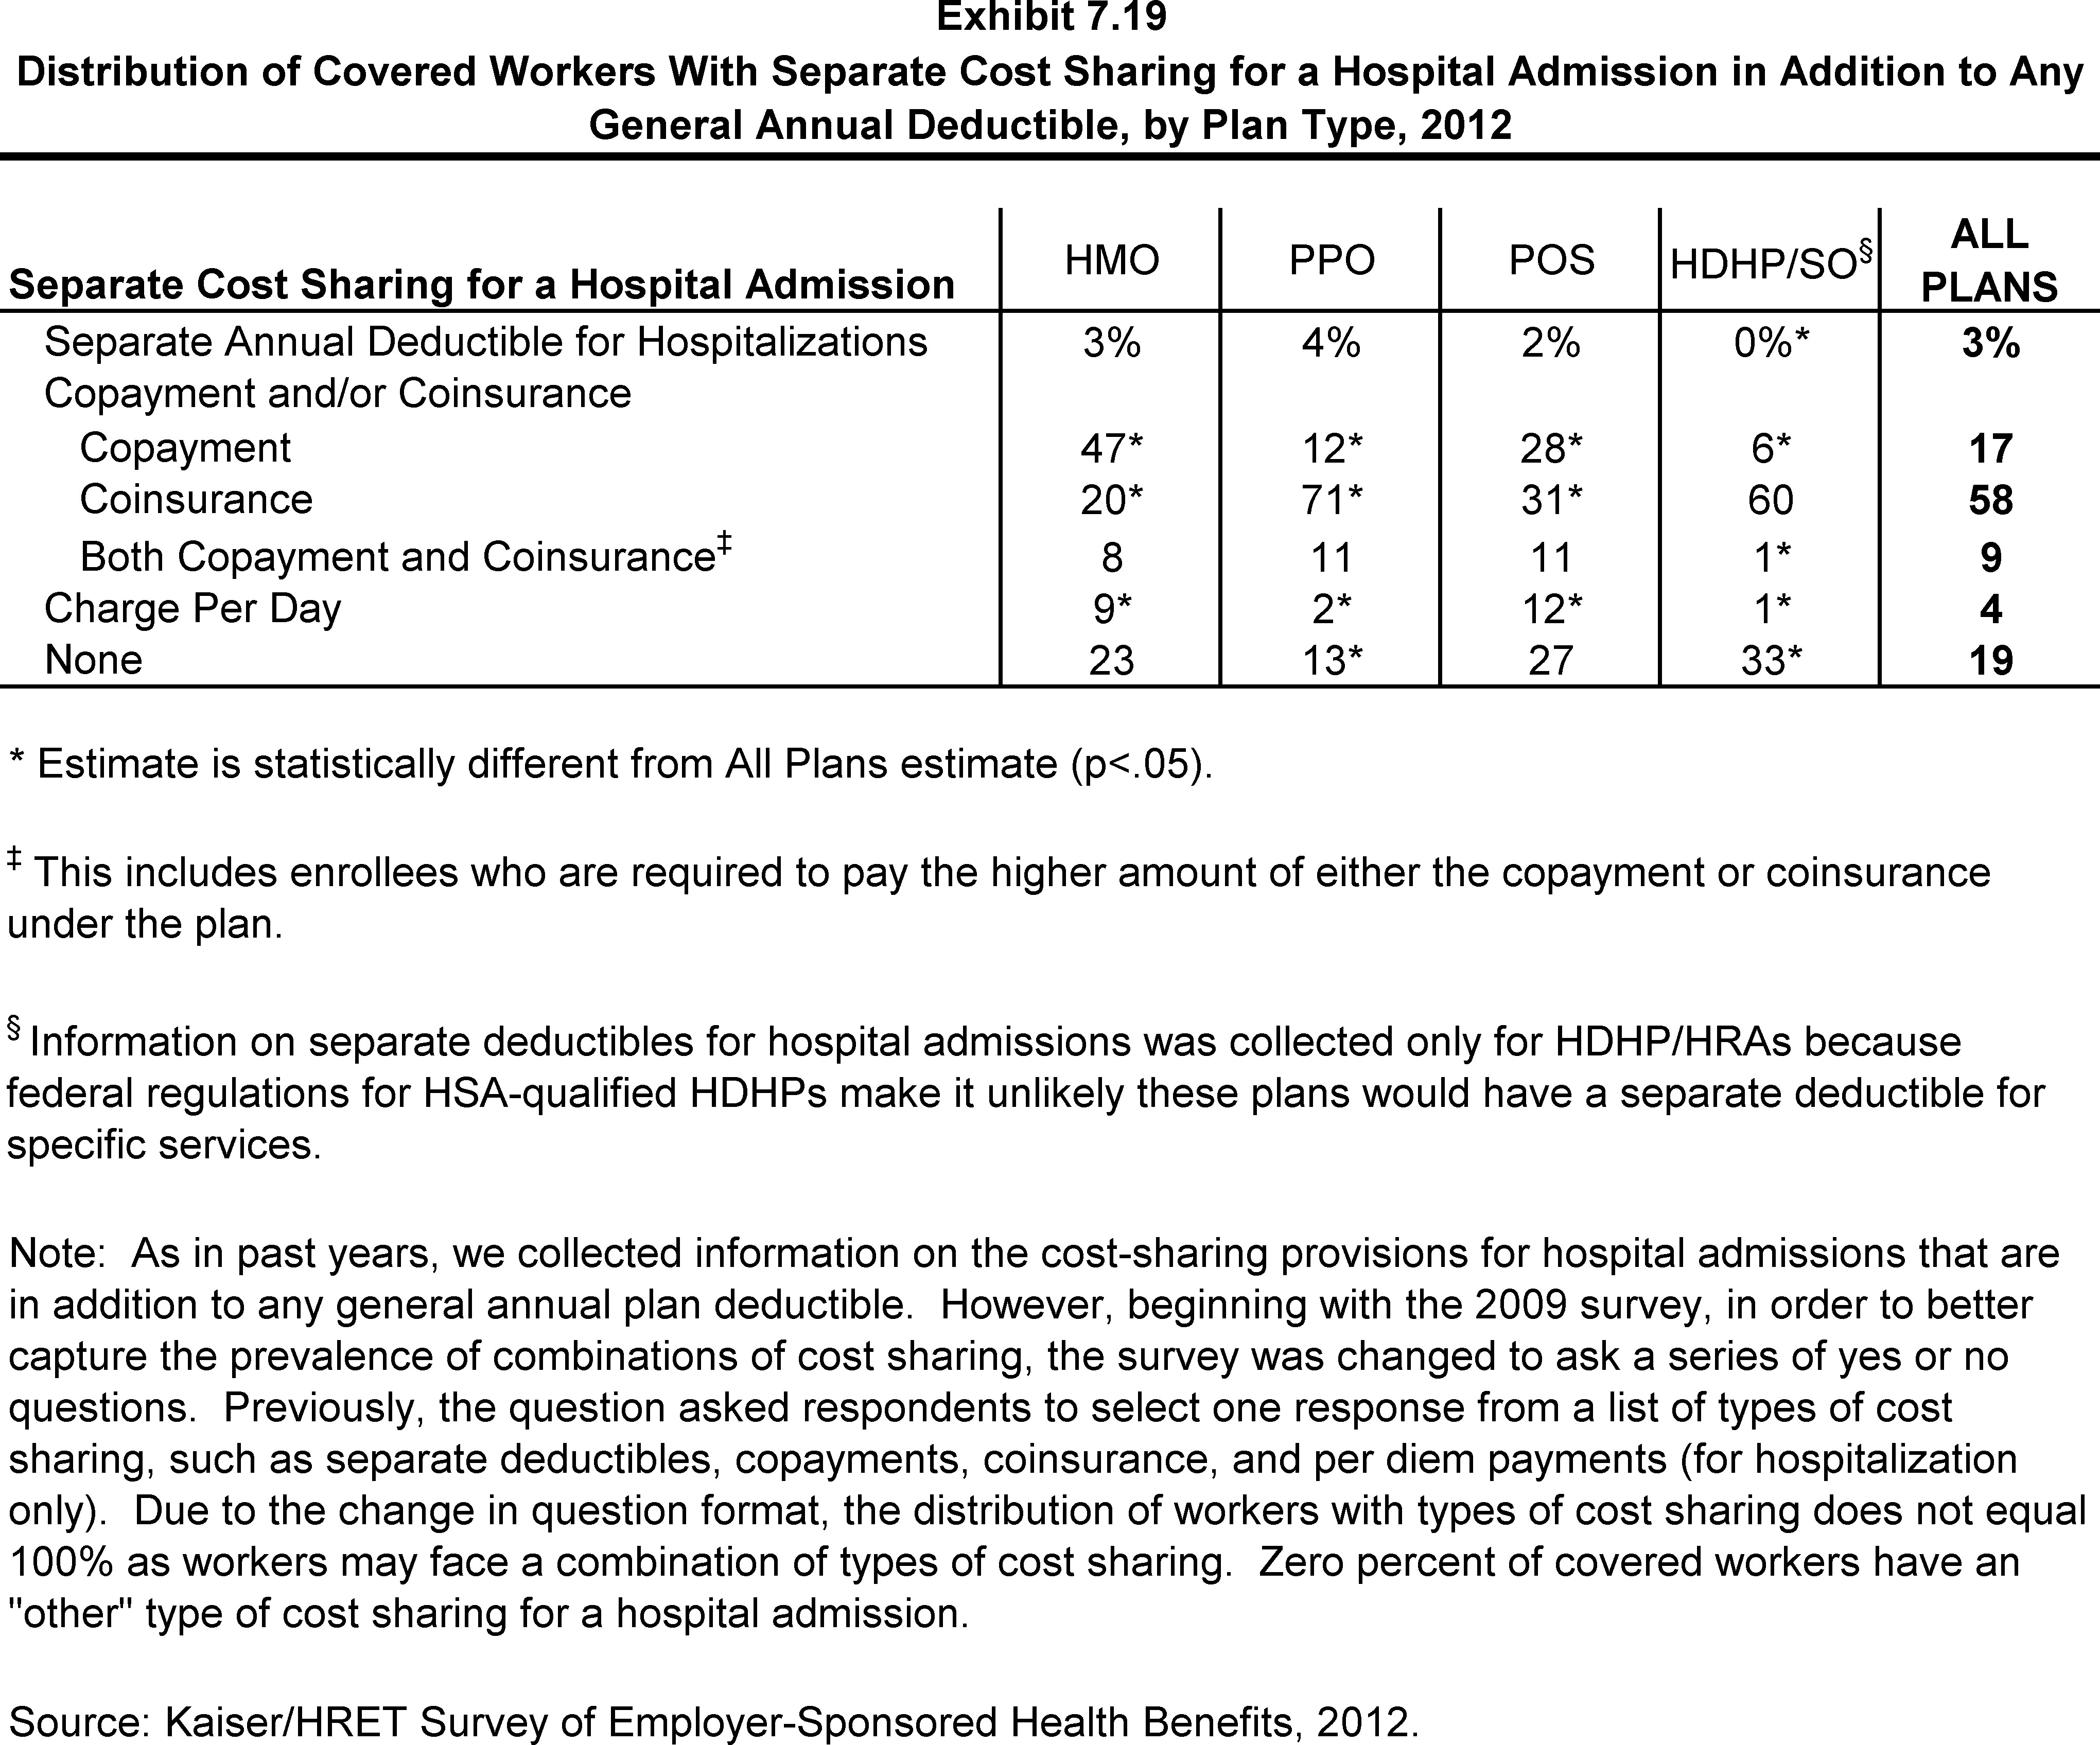
Distribution of Covered Workers With Separate Cost Sharing for a Hospital Admission in Addition to Any General Annual Deductible, by Plan Type, 2012
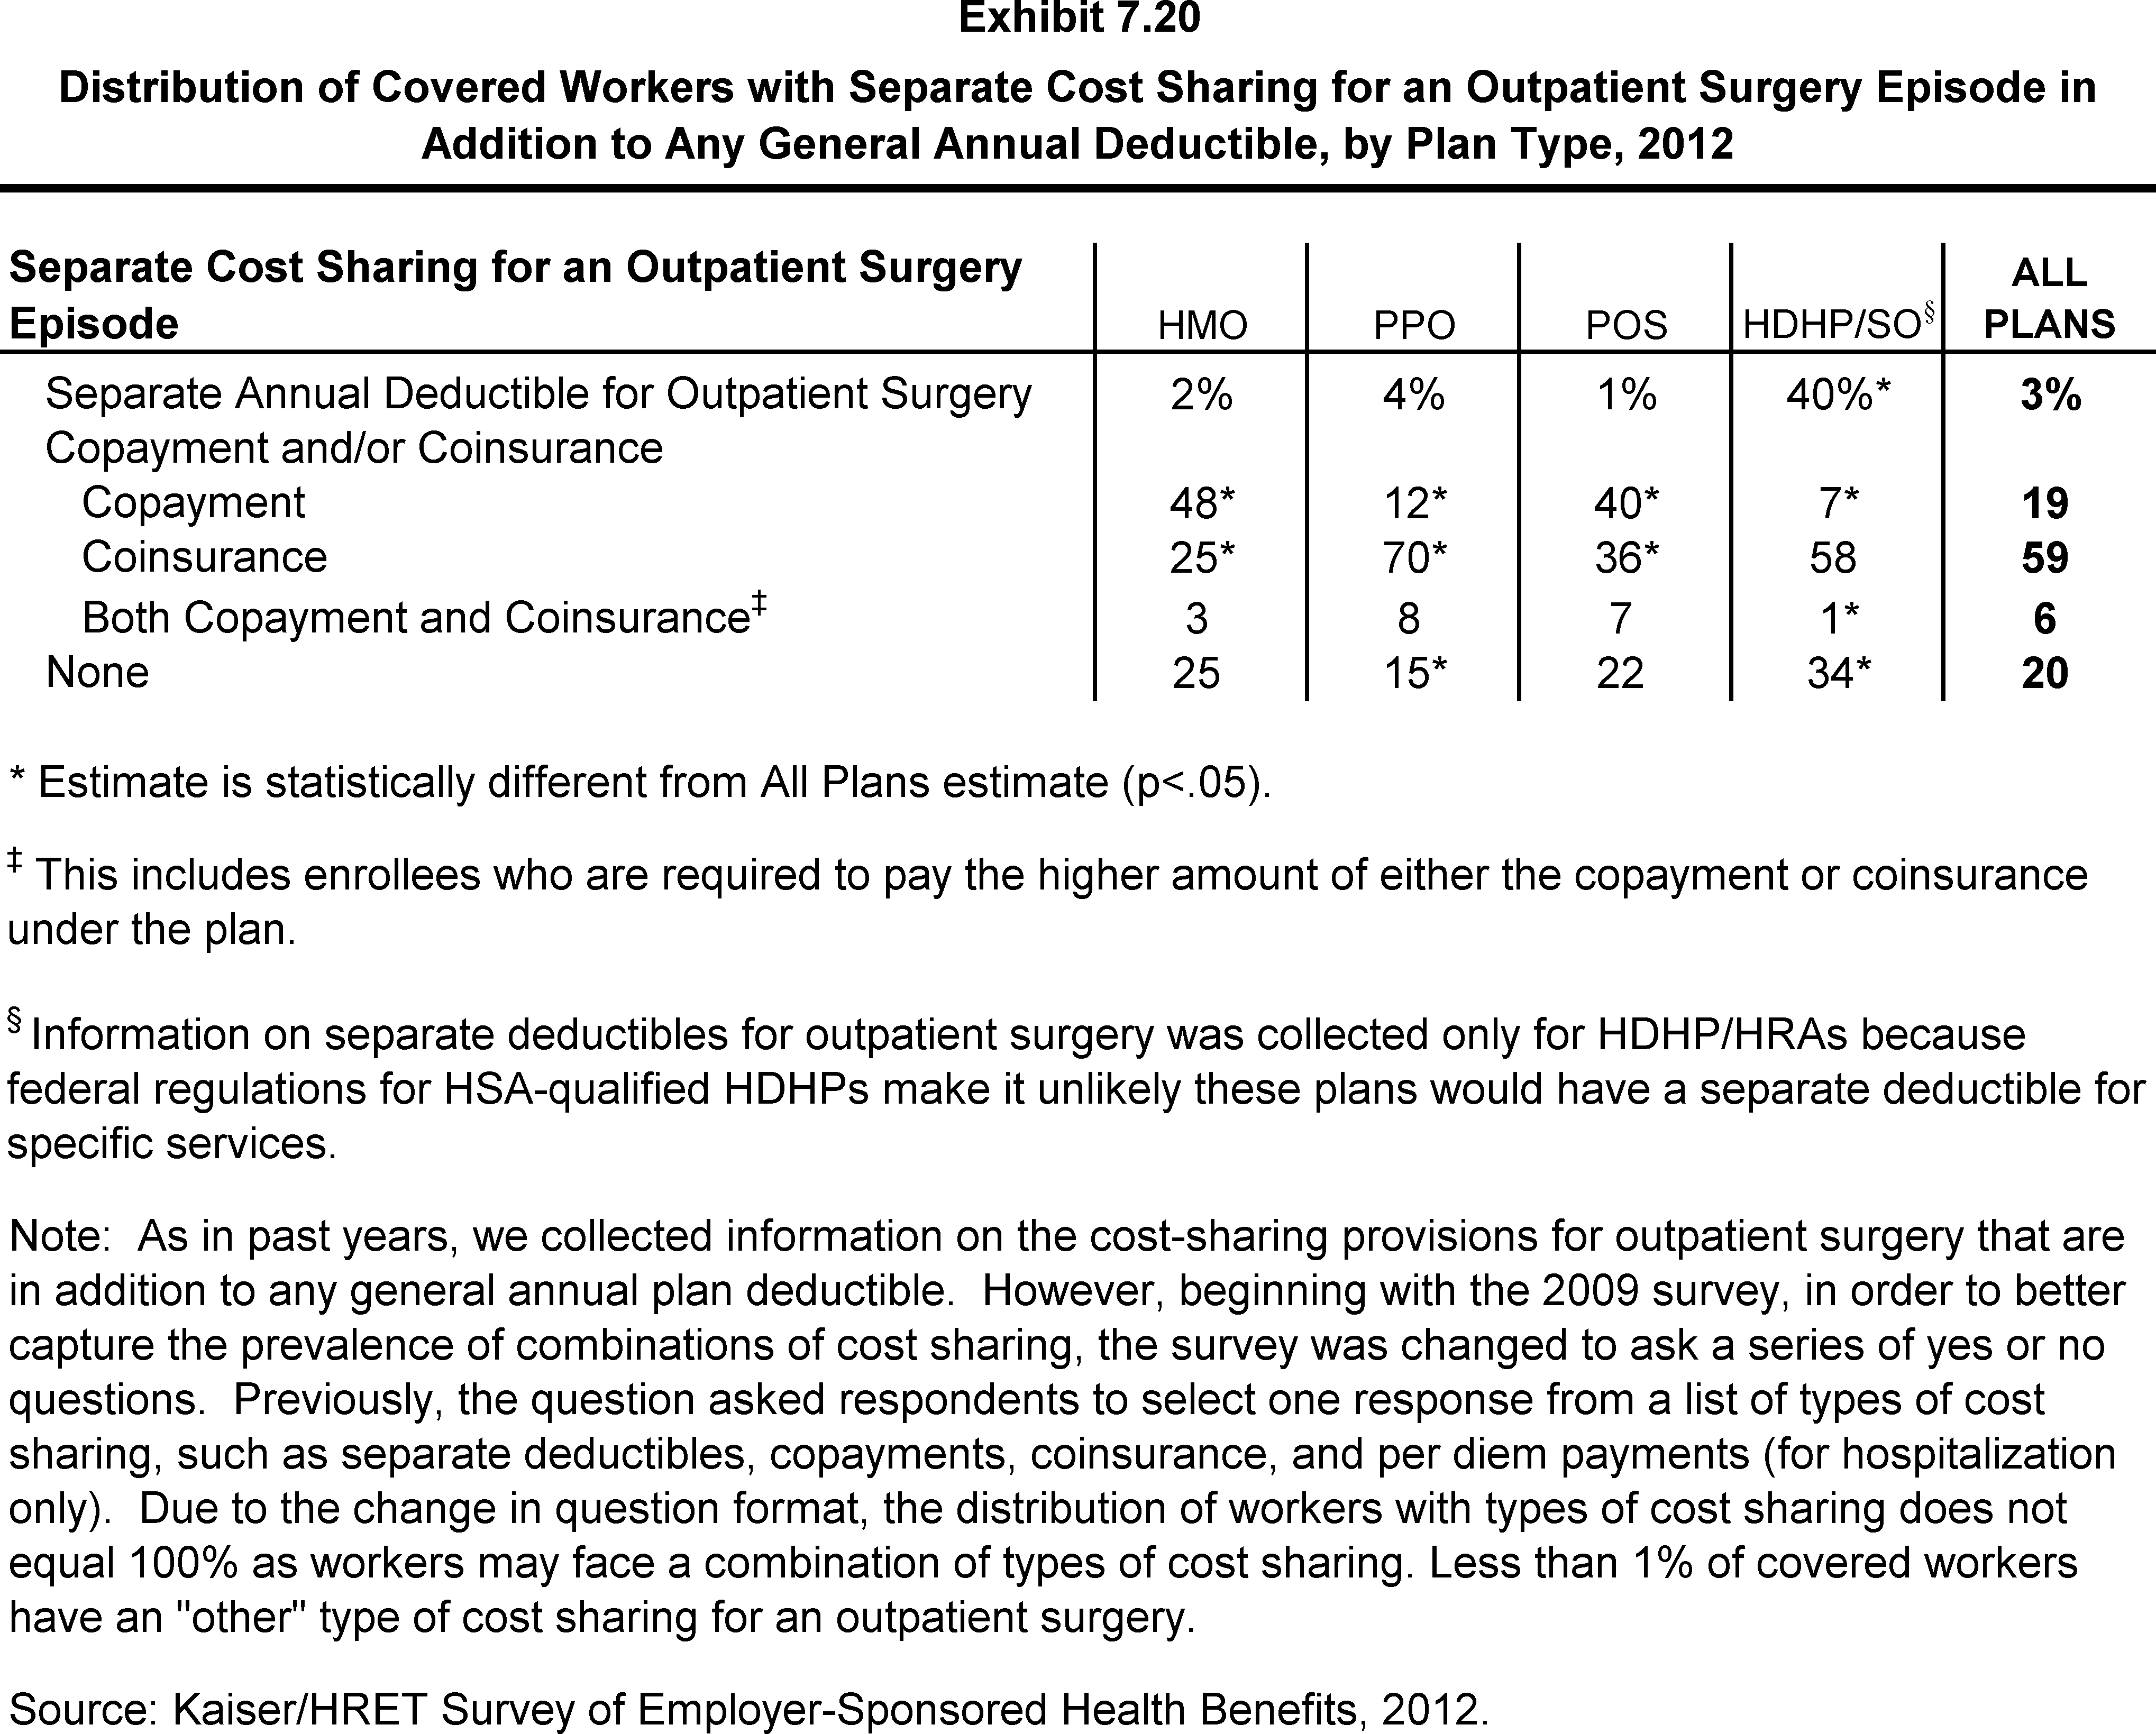
Distribution of Covered Workers with Separate Cost Sharing for an Outpatient Surgery Episode in Addition to Any General Annual Deductible, by Plan Type, 2012
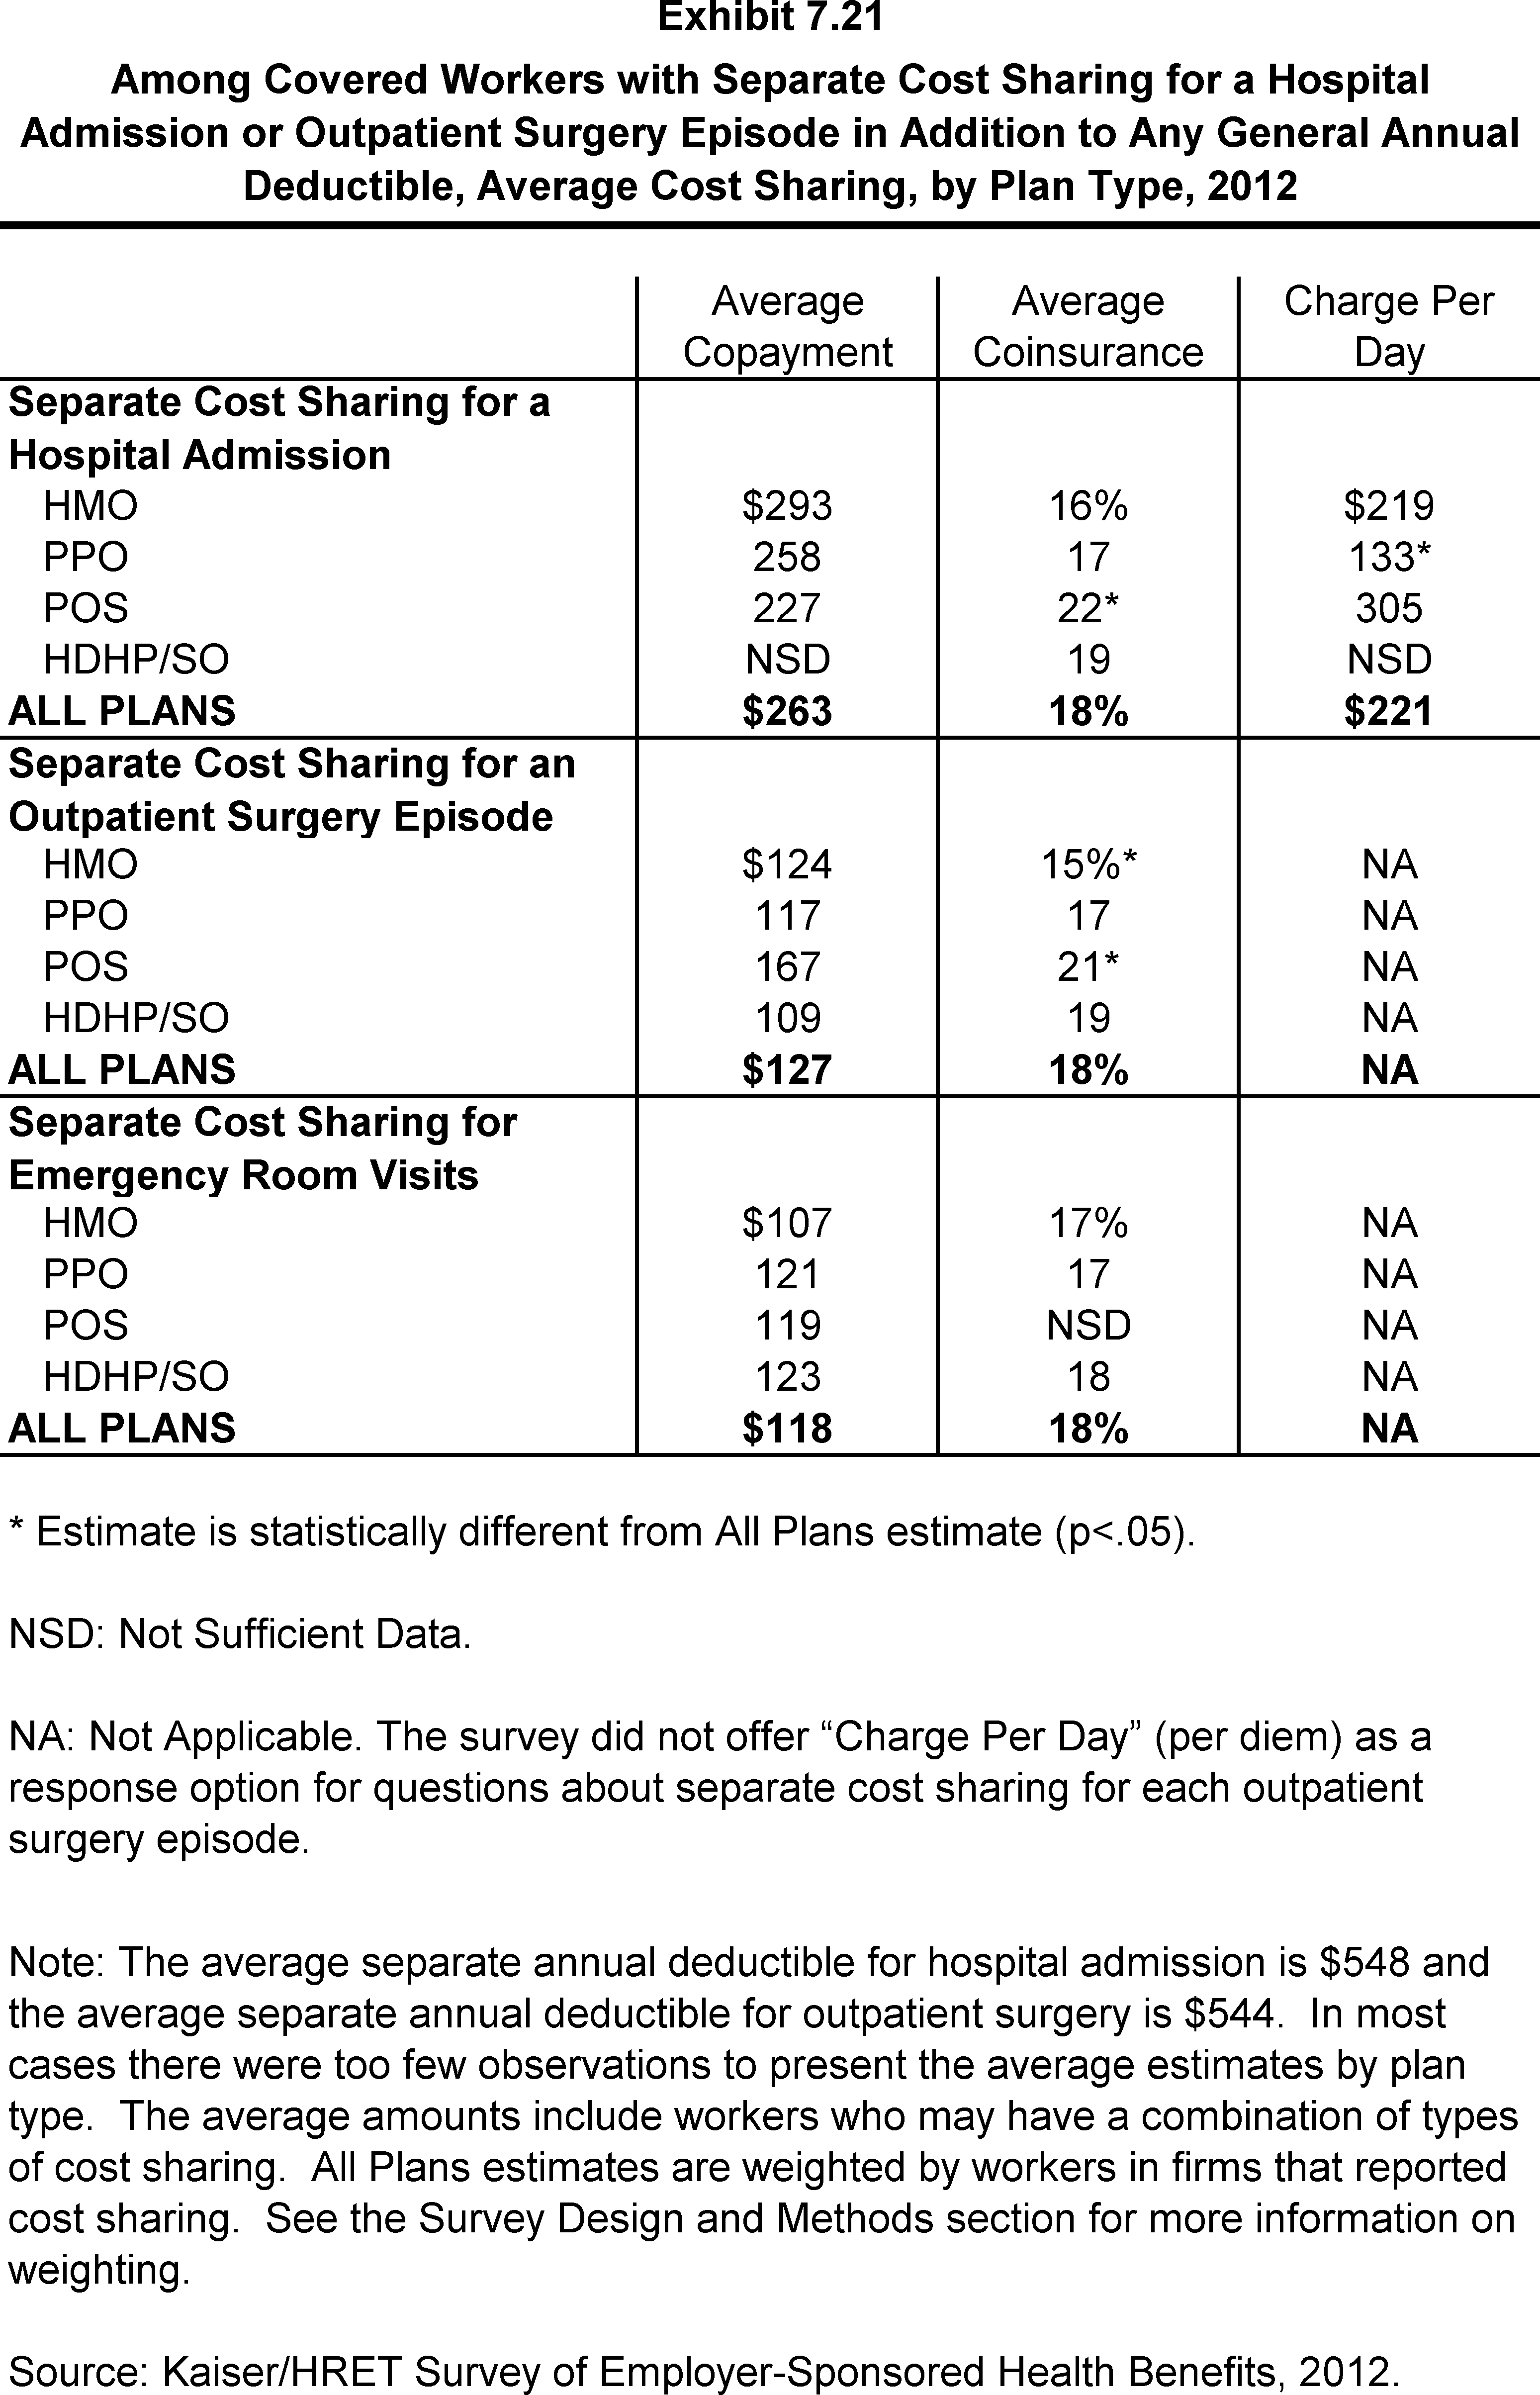
Among Covered Workers with Separate Cost Sharing for a Hospital Admission or Outpatient Surgery Episode in Addition to Any General Annual Deductible, Average Cost Sharing, by Plan Type, 2012
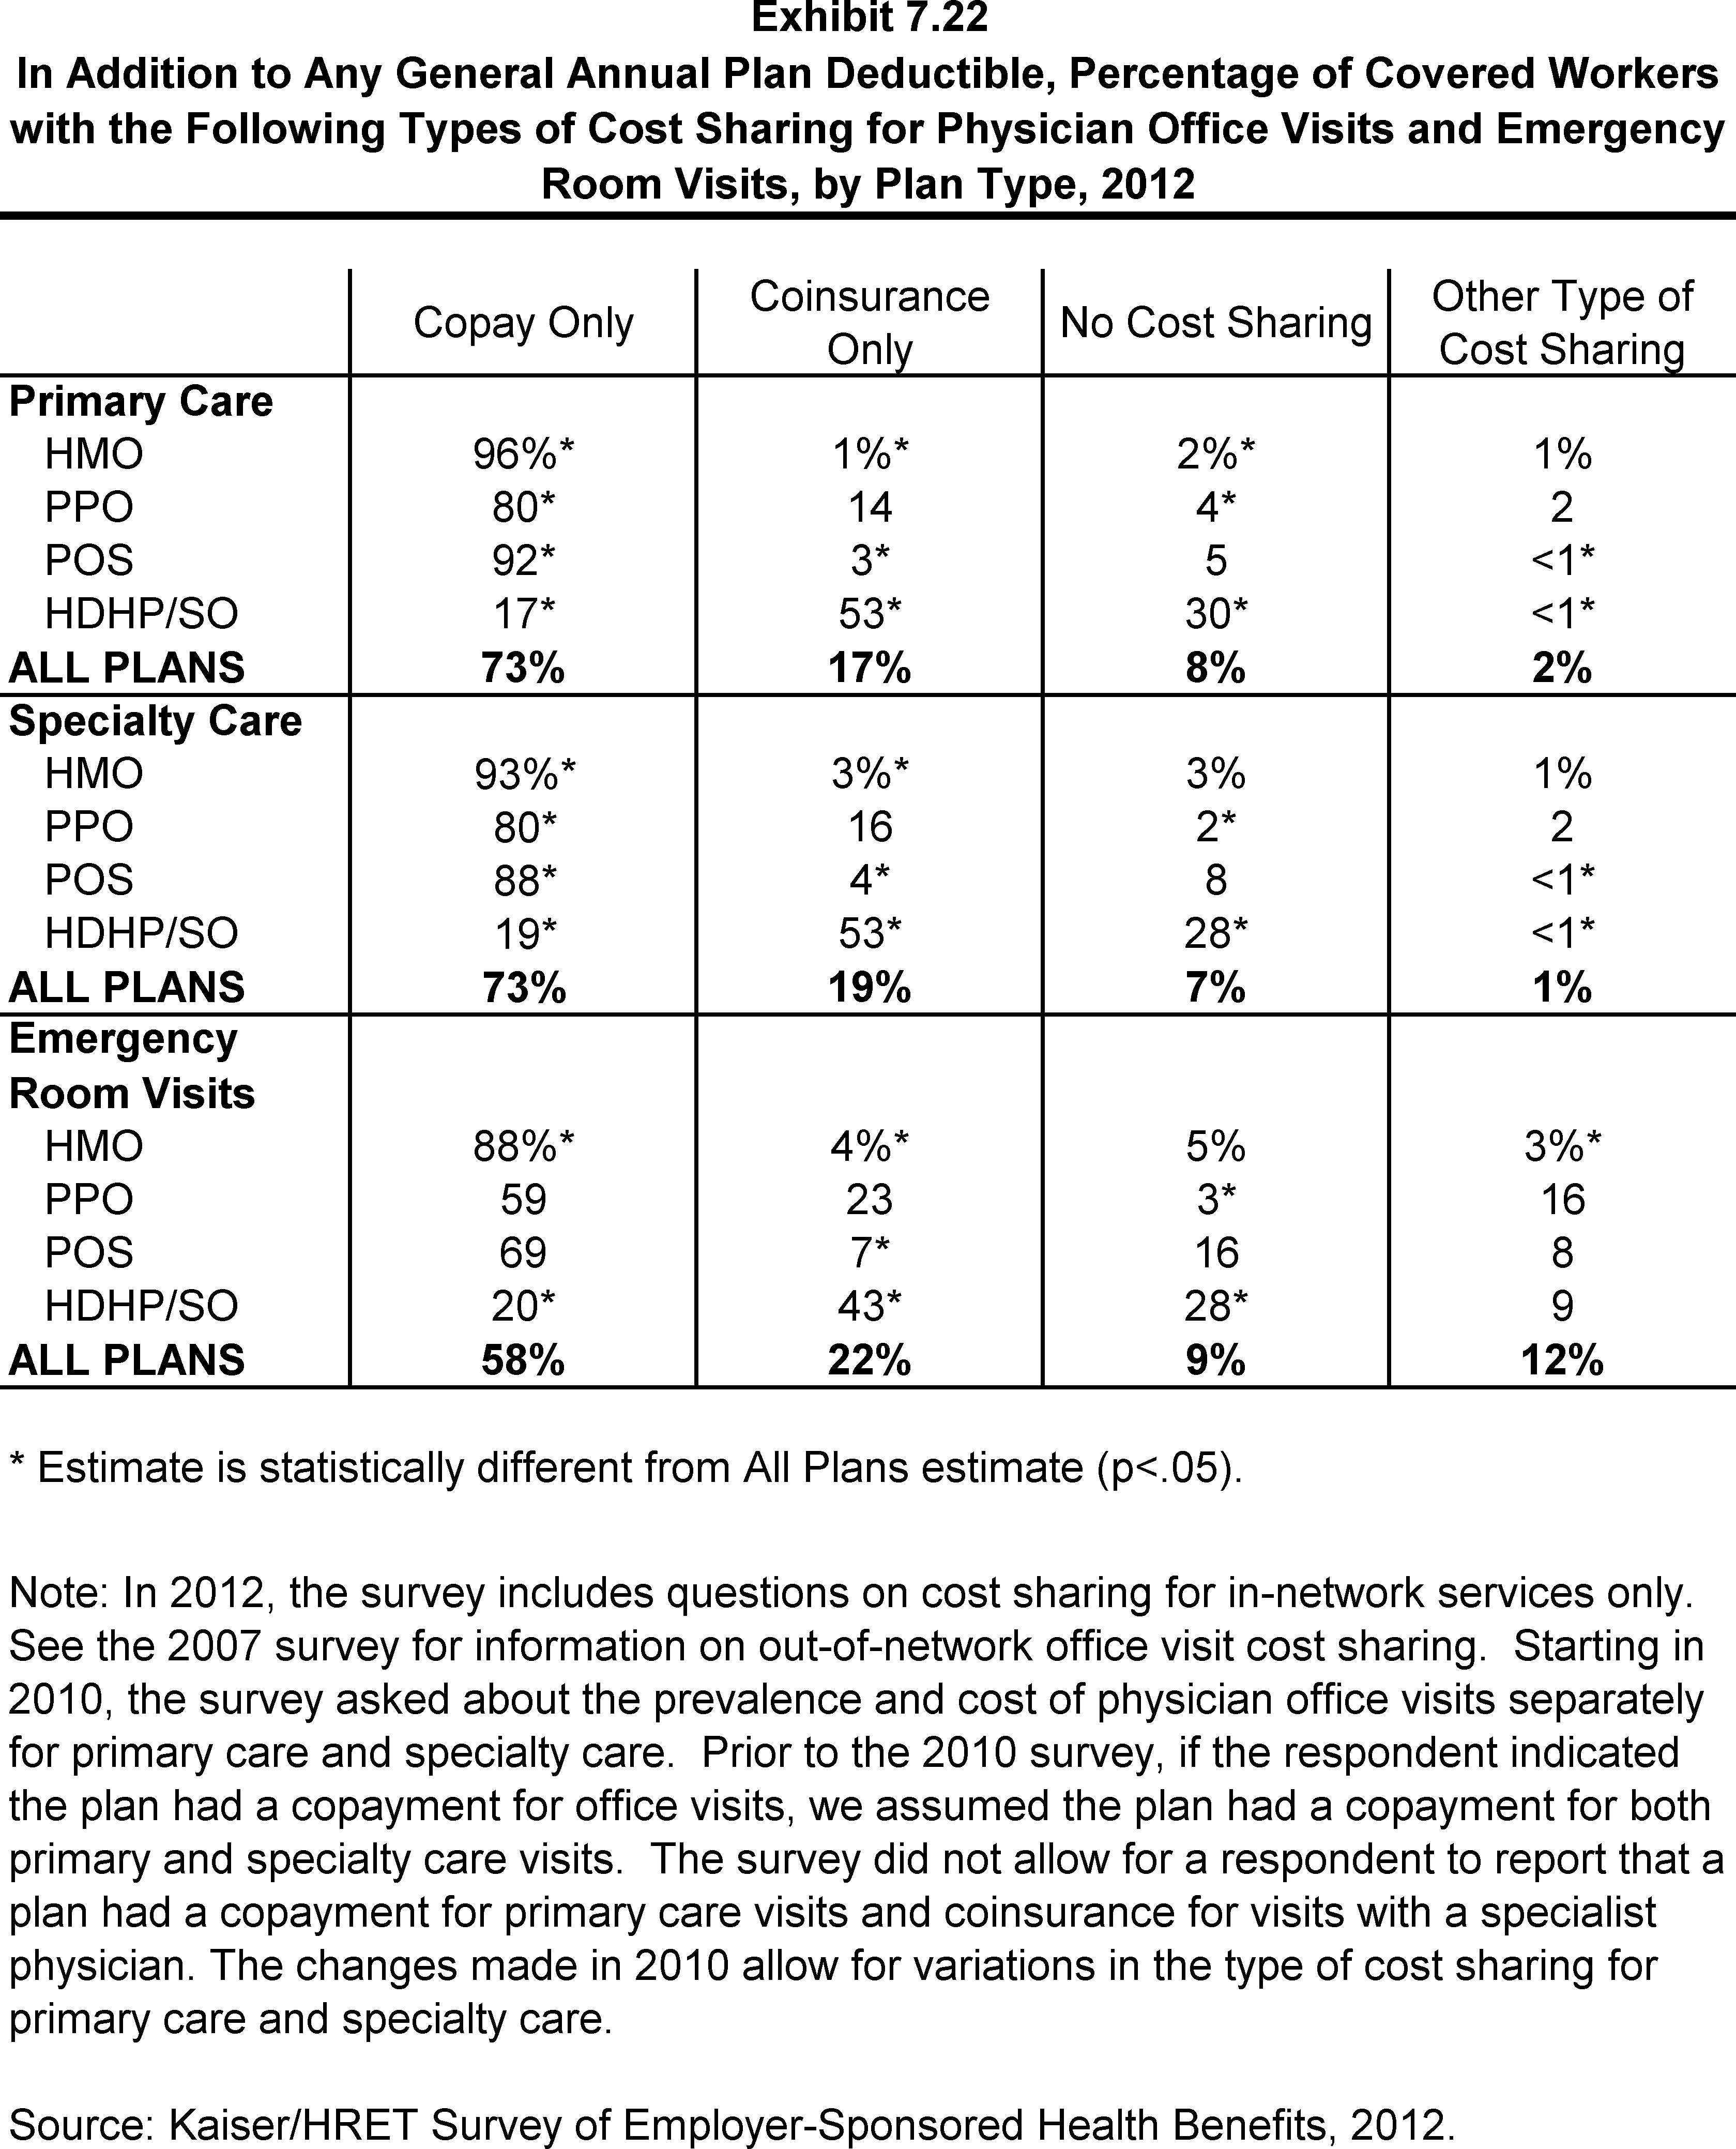
In Addition to Any General Annual Plan Deductible, Percentage of Covered Workers with the Following Types of Cost Sharing for Physician Office Visits and Emergency Room Visits, by Plan Type, 2012
In Addition to Any General Annual Plan Deductible, Percentage of Covered Workers with Emergency Room Cost Sharing, by Plan Type, 2012
Among Covered Workers with Copayments and/or Coinsurance for In-Network Physician Office and Emergency Room Visits, Average Copayments and Coinsurance, by Plan Type, 2012
Among Covered Workers with Copayments for a Physician Office Visit with a Primary Care Physician, Distribution of Copayments, by Plan Type, 2012
Among Covered Workers with Copayments for a Physician Office Visit with a Specialty Care Physician, Distribution of Copayments, by Plan Type, 2012
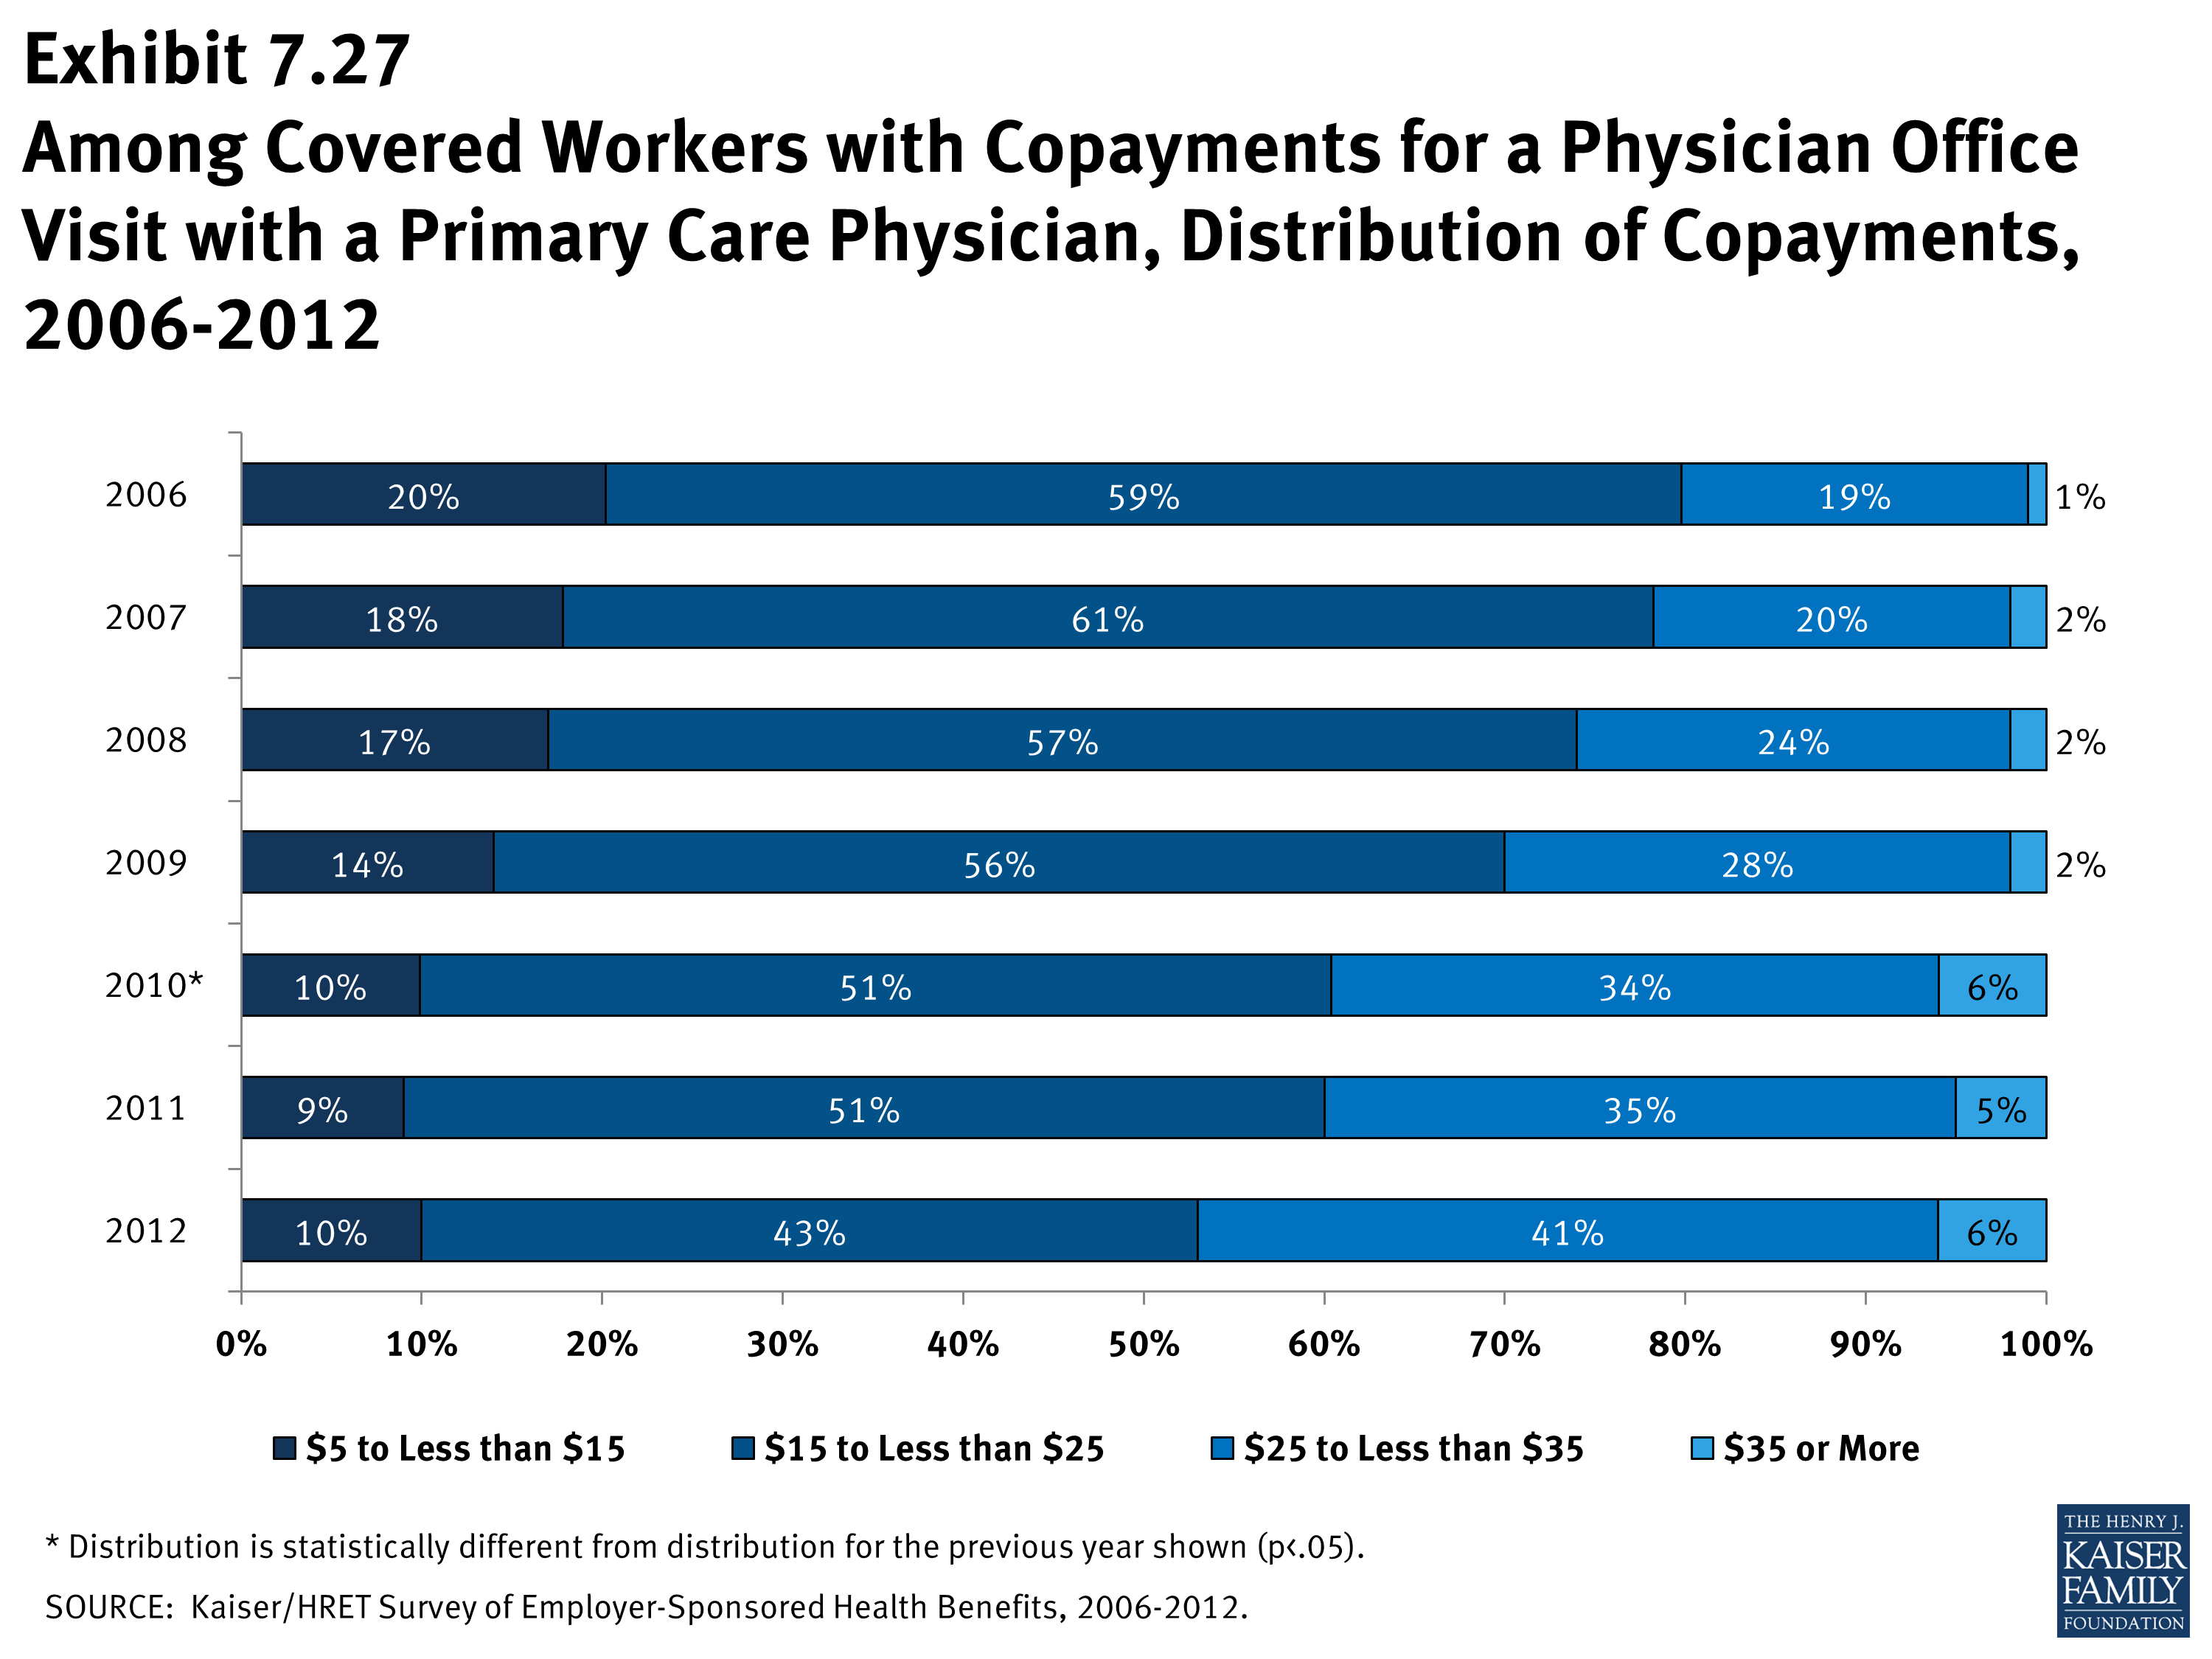
Among Covered Workers with Copayments for a Physician Office Visit with a Primary Care Physician, Distribution of Copayments, 2006-2012
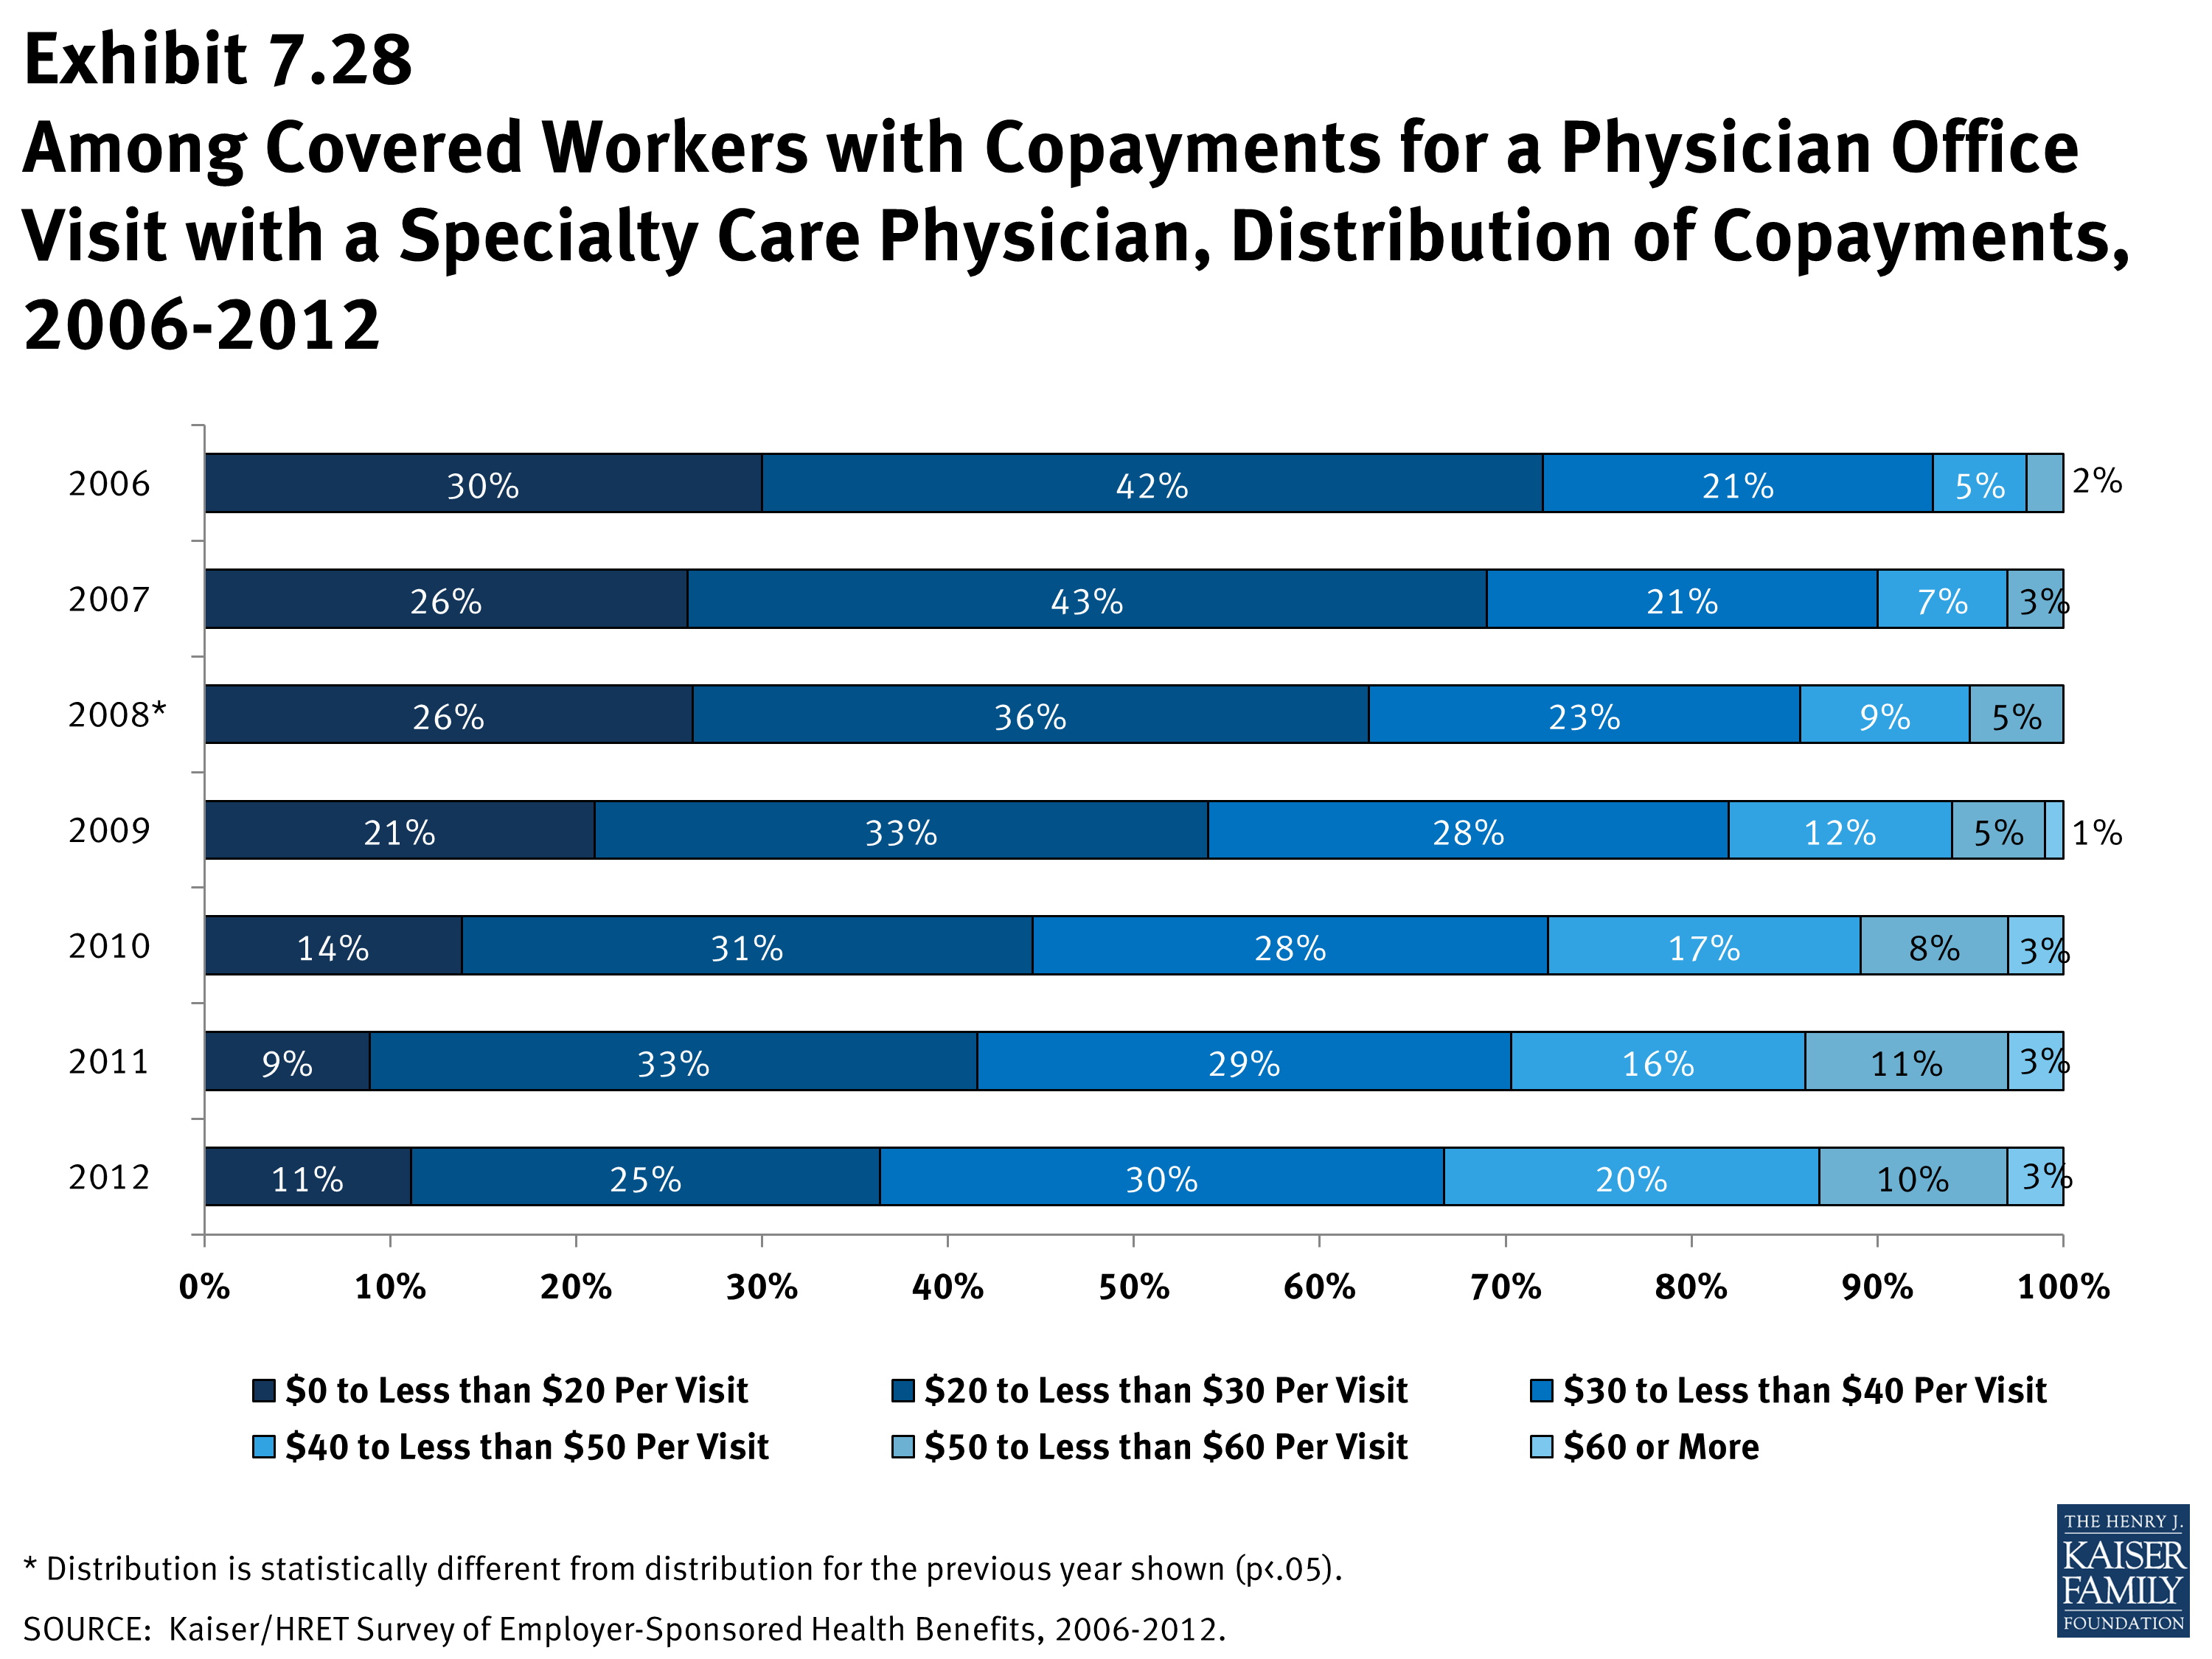
Among Covered Workers with Copayments for a Physician Office Visit with a Specialty Care Physician, Distribution of Copayments, 2006-2012
Percentage of Covered Workers without an Annual Out-of-Pocket Maximum for Single and Family Coverage, by Plan Type, 2012
Among Covered Workers with an Annual Out-of-Pocket Maximum, Percentage Whose Spending on Various Services Does Not Count Towards the Out-of-Pocket Maximum, by Plan Type, 2012
Among Covered Workers with an Out-of-Pocket Maximum for Single Coverage, Distribution of Out-of-Pocket Maximums, by Plan Type, 2012
Distribution of Type of Out-of-Pocket Maximum for Covered Workers with Family Coverage, by Plan Type and Firm Size, 2012
Among Covered Workers with an Aggregate Out-of-Pocket Maximum for Family Coverage, Distribution of Out-of-Pocket Maximums, by Plan Type, 2012
Among Covered Workers with a Separate per Person Out-of-Pocket Maximum for Family Coverage, Distribution of Out-of-Pocket Maximums, by Plan Type, 2012
Among Covered Workers with a Separate per Person Out-of-Pocket Maximum for Family Coverage, Distribution of Number of Family Members Required to Meet the Maximum, by Plan Type, 2012
Section 8: High-Deductible Health Plans with Savings Option
Changes in law over the past few years have permitted the establishment of new types of savings arrangements for health care. The two most common are health reimbursement arrangements (HRAs) and health savings accounts (HSAs). HRAs and HSAs are both financial accounts that workers or their family members can use to pay for health care services. These savings arrangements are often (or, in the case of HSAs, always) paired with health plans with high deductibles. The survey treats high-deductible plans that can be paired with a savings option as a distinct plan type – High-Deductible Health Plan with Savings Option (HDHP/SO) – even if the plan would otherwise be considered a PPO, HMO, POS plan, or conventional health plan. Specifically for the survey, HDHP/SOs are defined as (1) health plans with a deductible of at least $1,000 for single coverage and $2,000 for family coverage1 offered with an HRA (referred to as HDHP/HRAs); or (2) high-deductible health plans that meet the federal legal requirements to permit an enrollee to establish and contribute to an HSA (referred to as HSA-qualified HDHPs).2
Percentage of Firms Offering HDHP/HRAs and HSA-Qualified HDHPs, and Enrollment
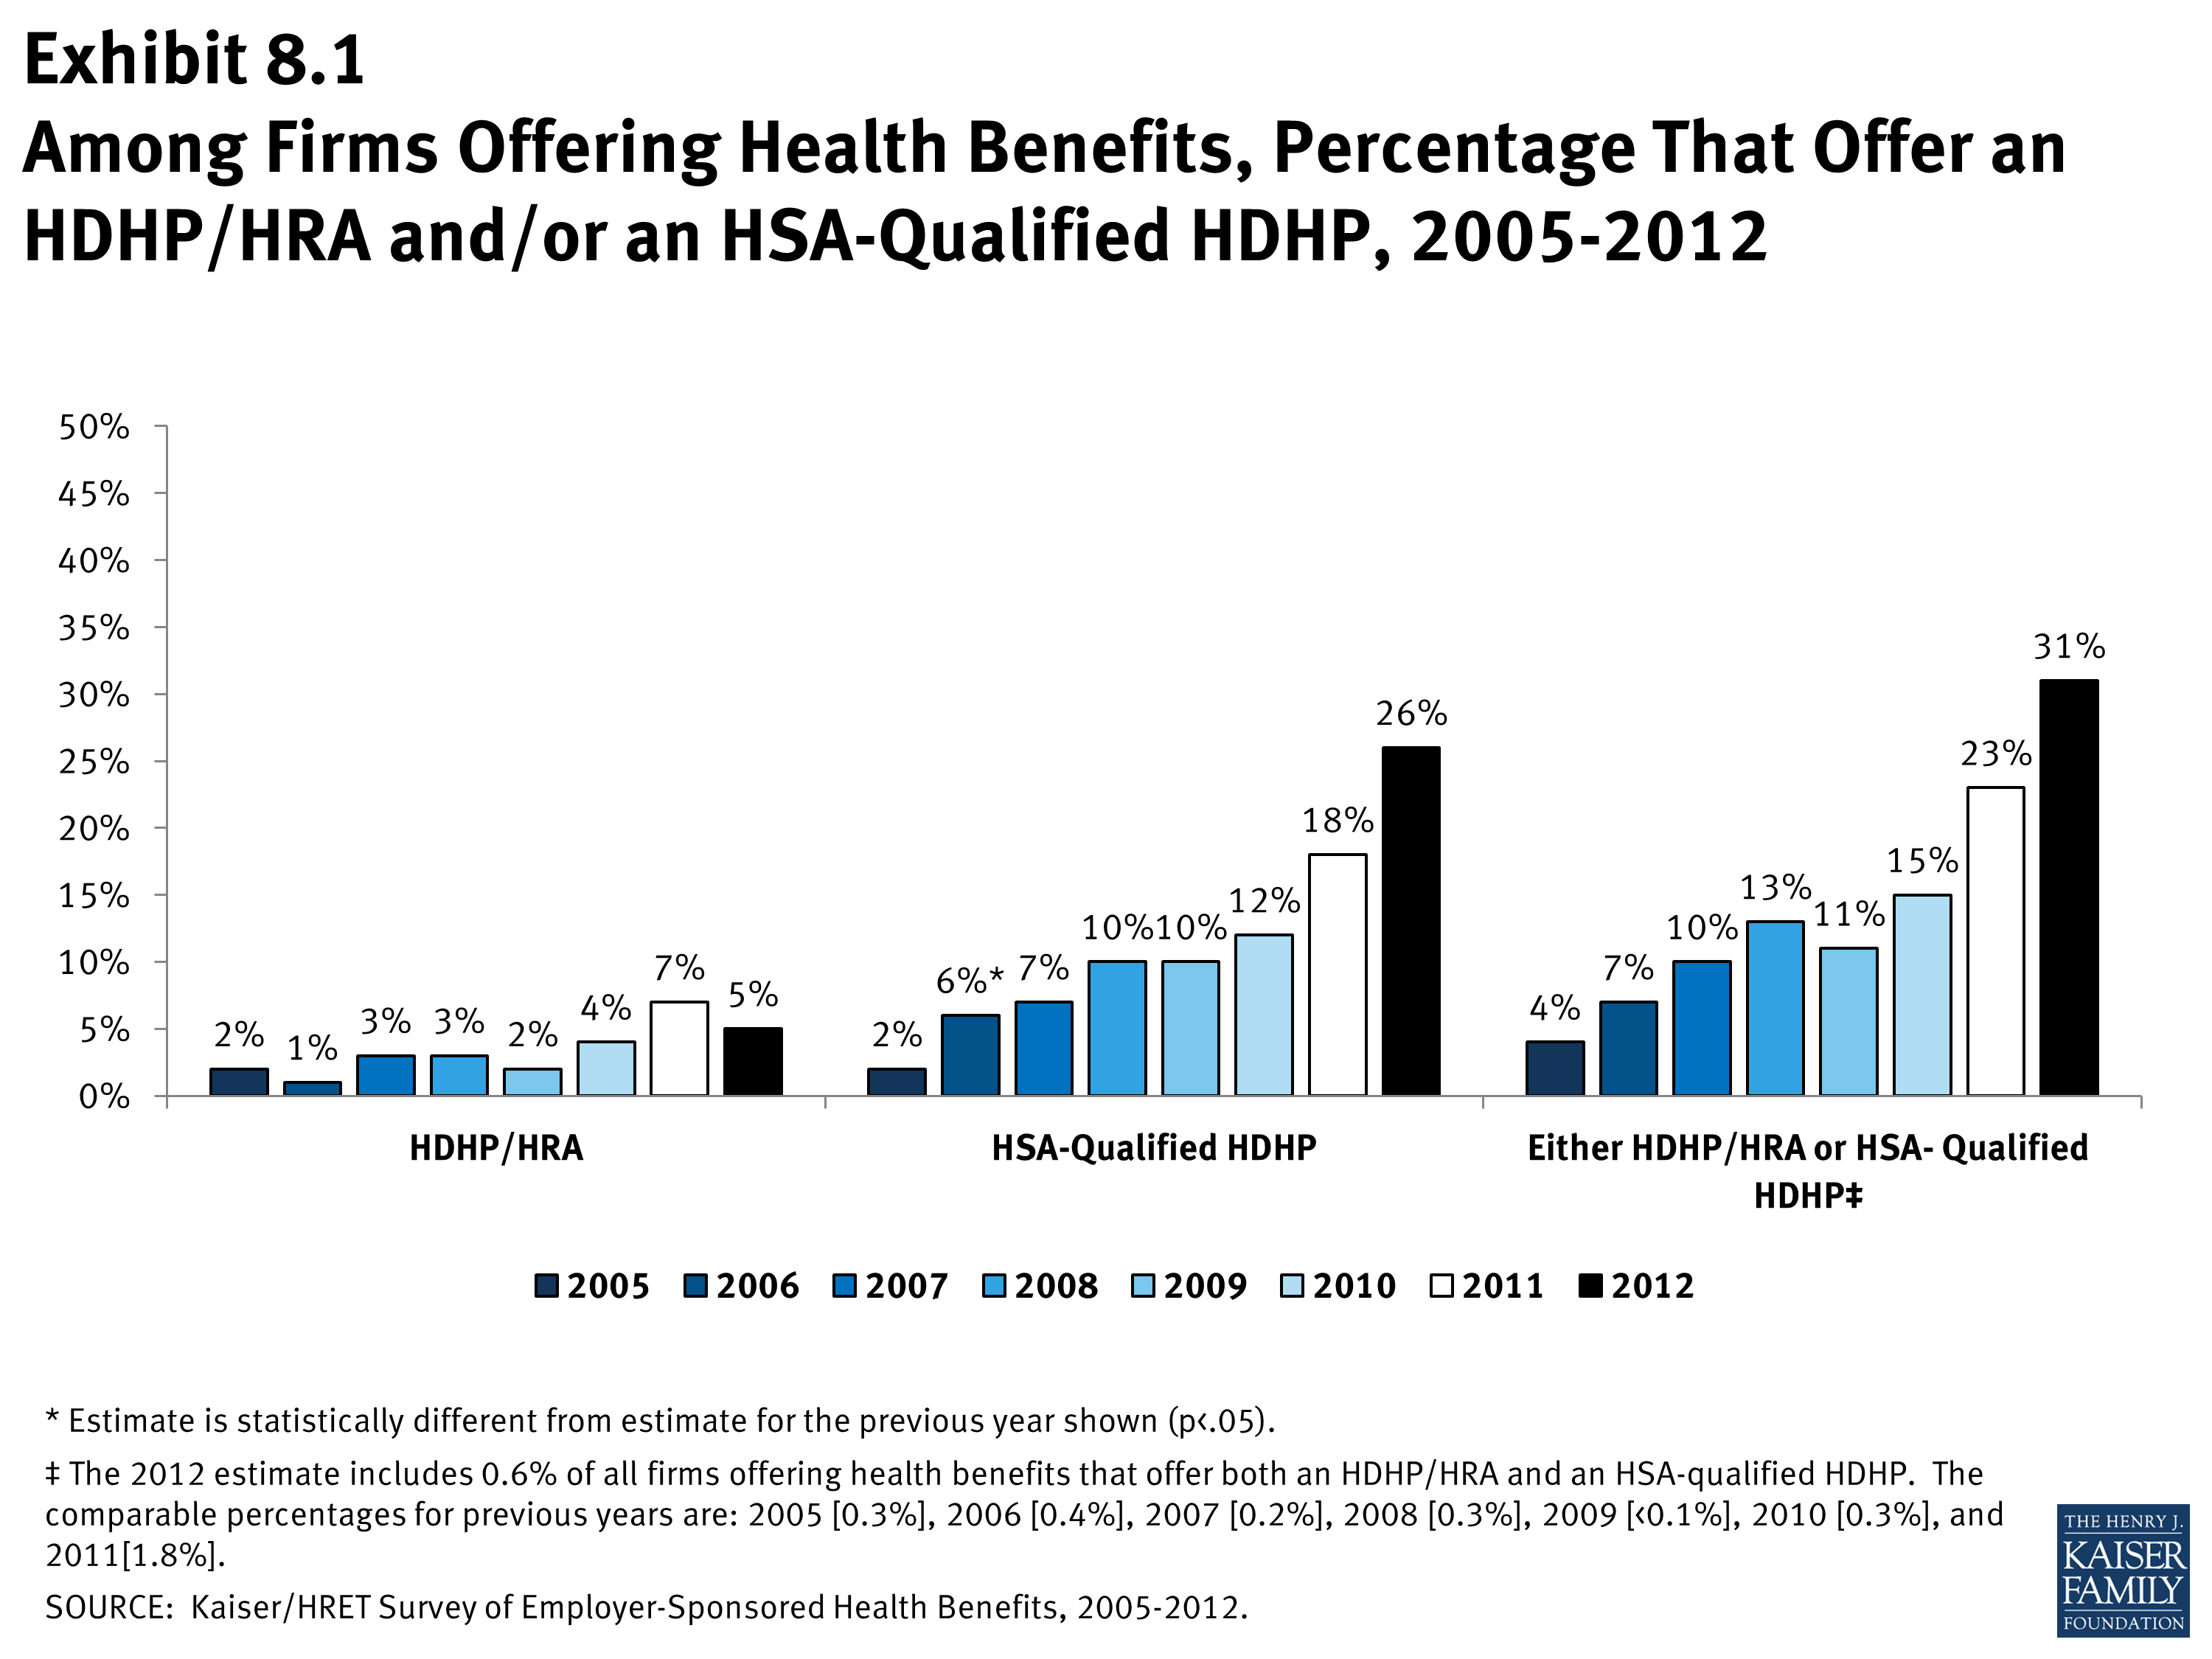
- Thirty-one percent of firms offering health benefits offer an HDHP/HRA or an HSA-qualified HDHP. Among firms offering health benefits, 5% offer an HDHP/HRA and 26% offer an HSA-qualified HDHP (Exhibit 8.1).
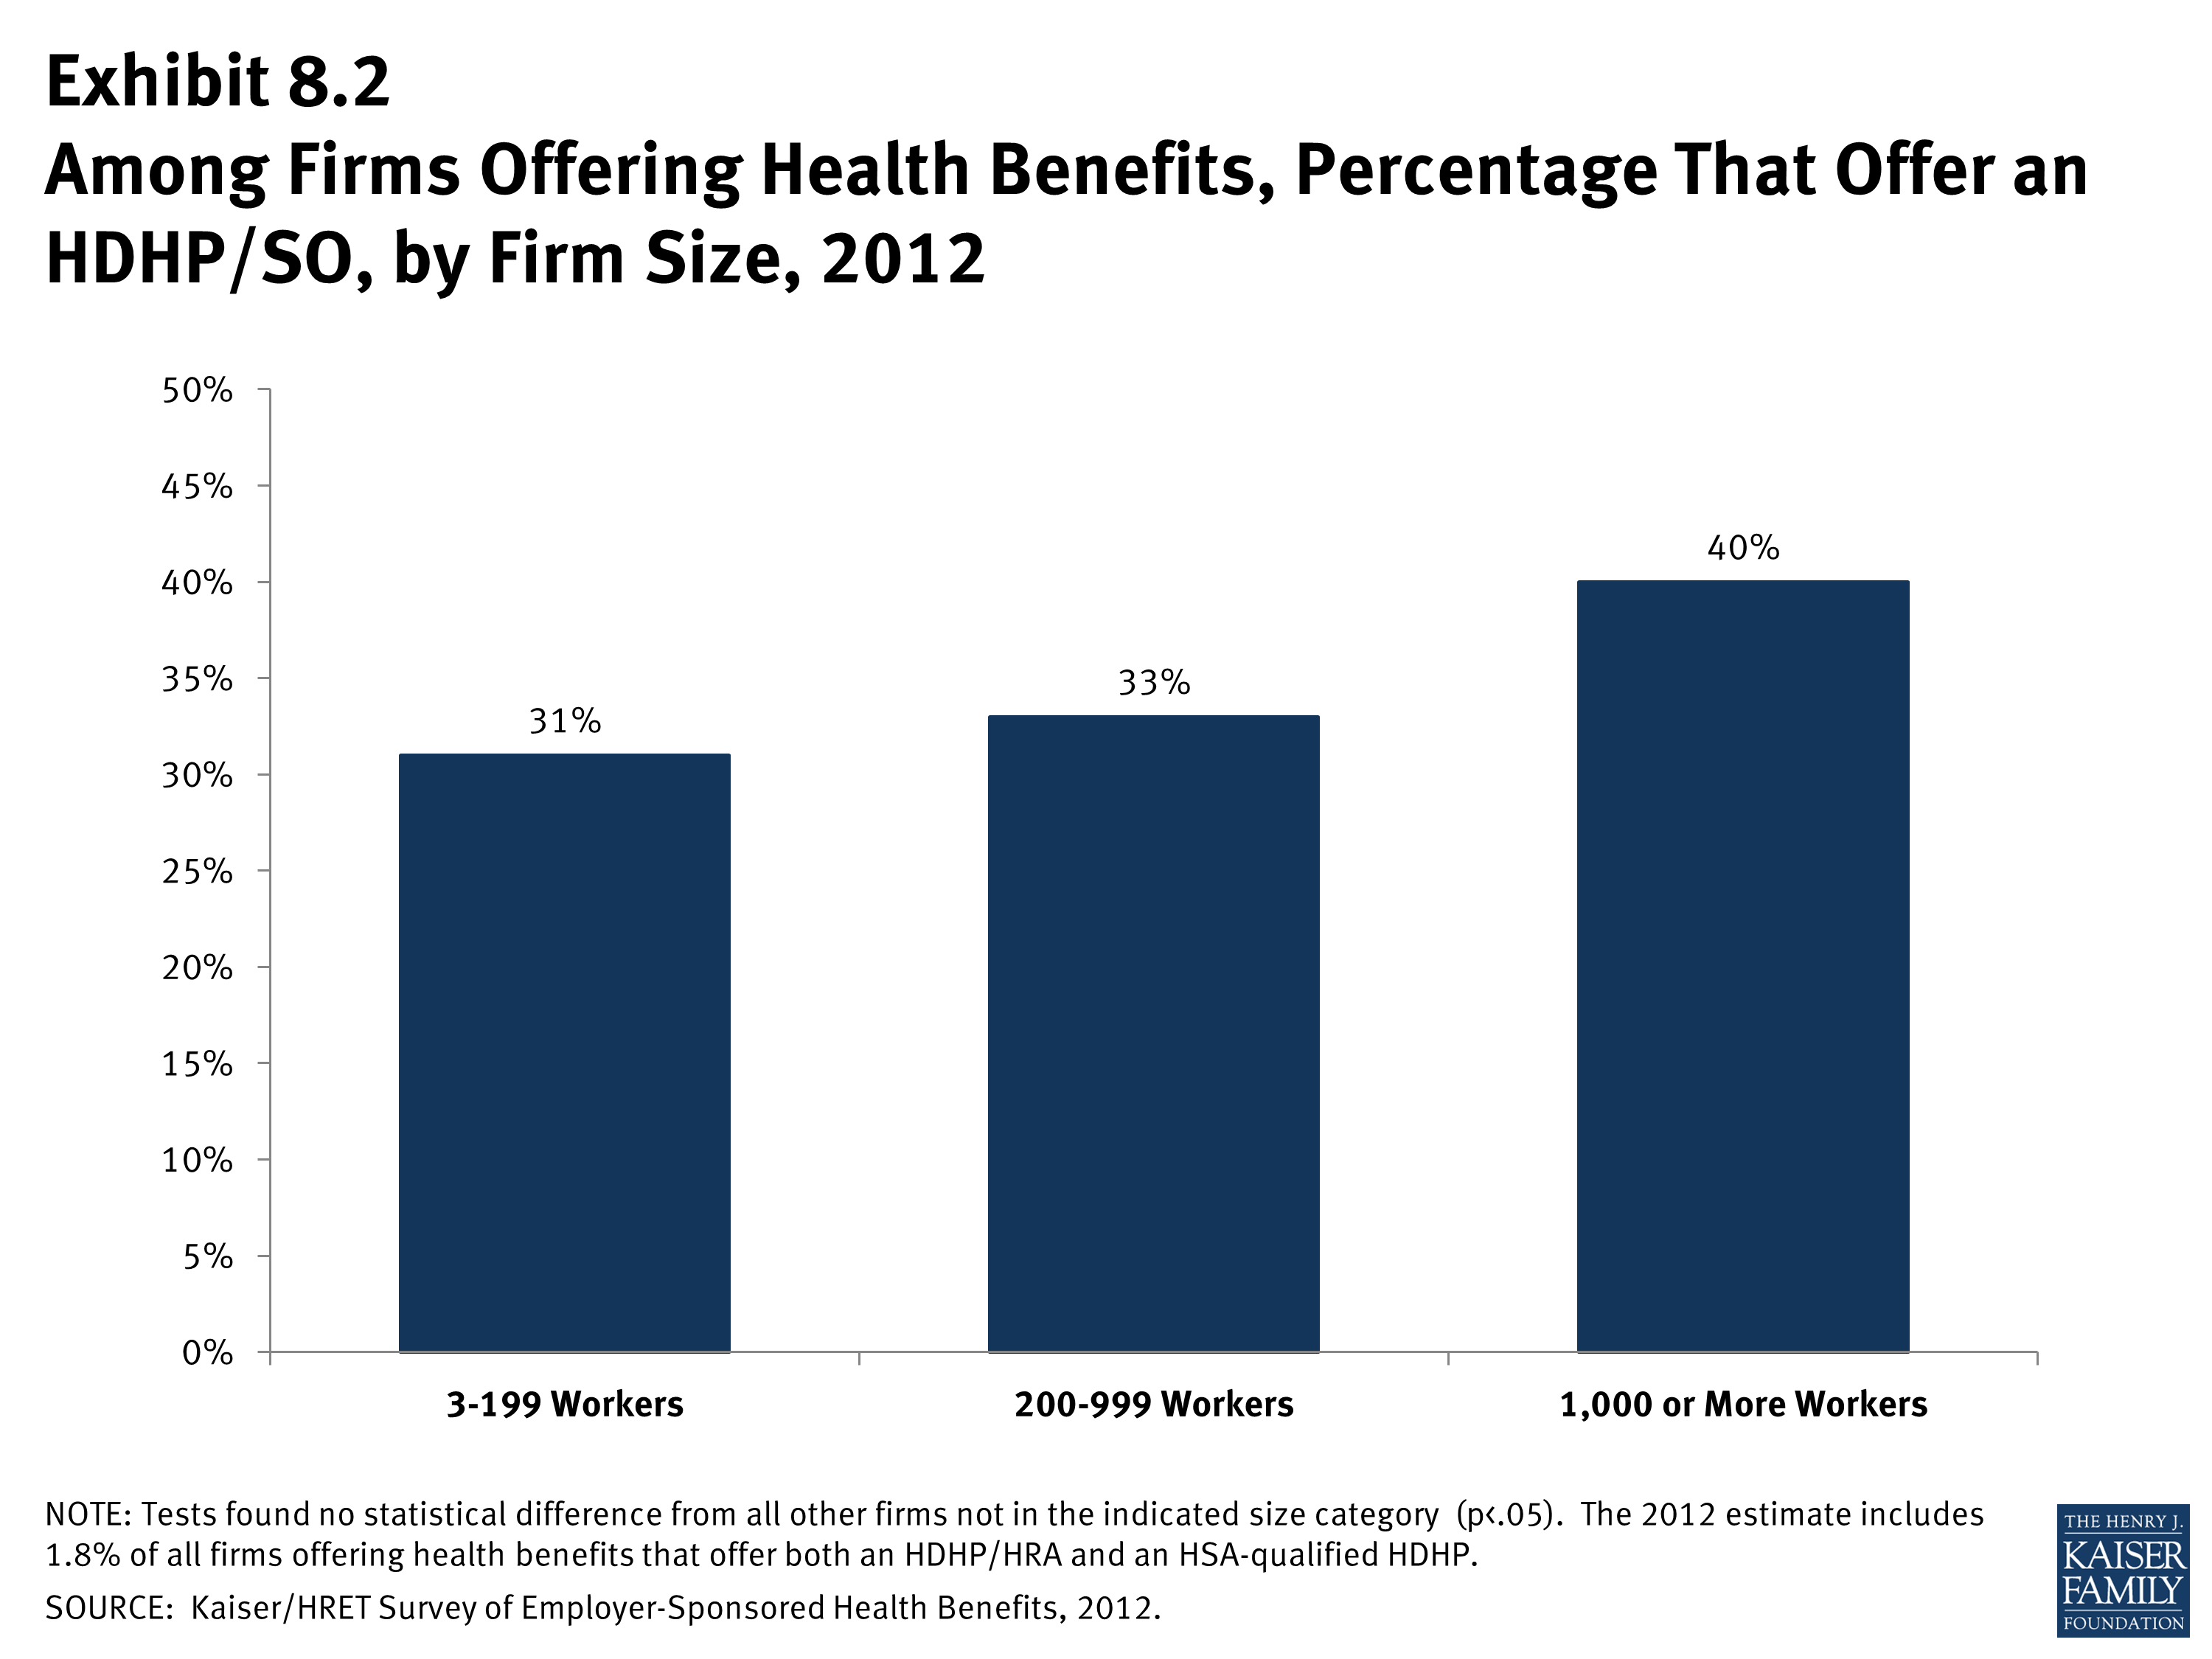
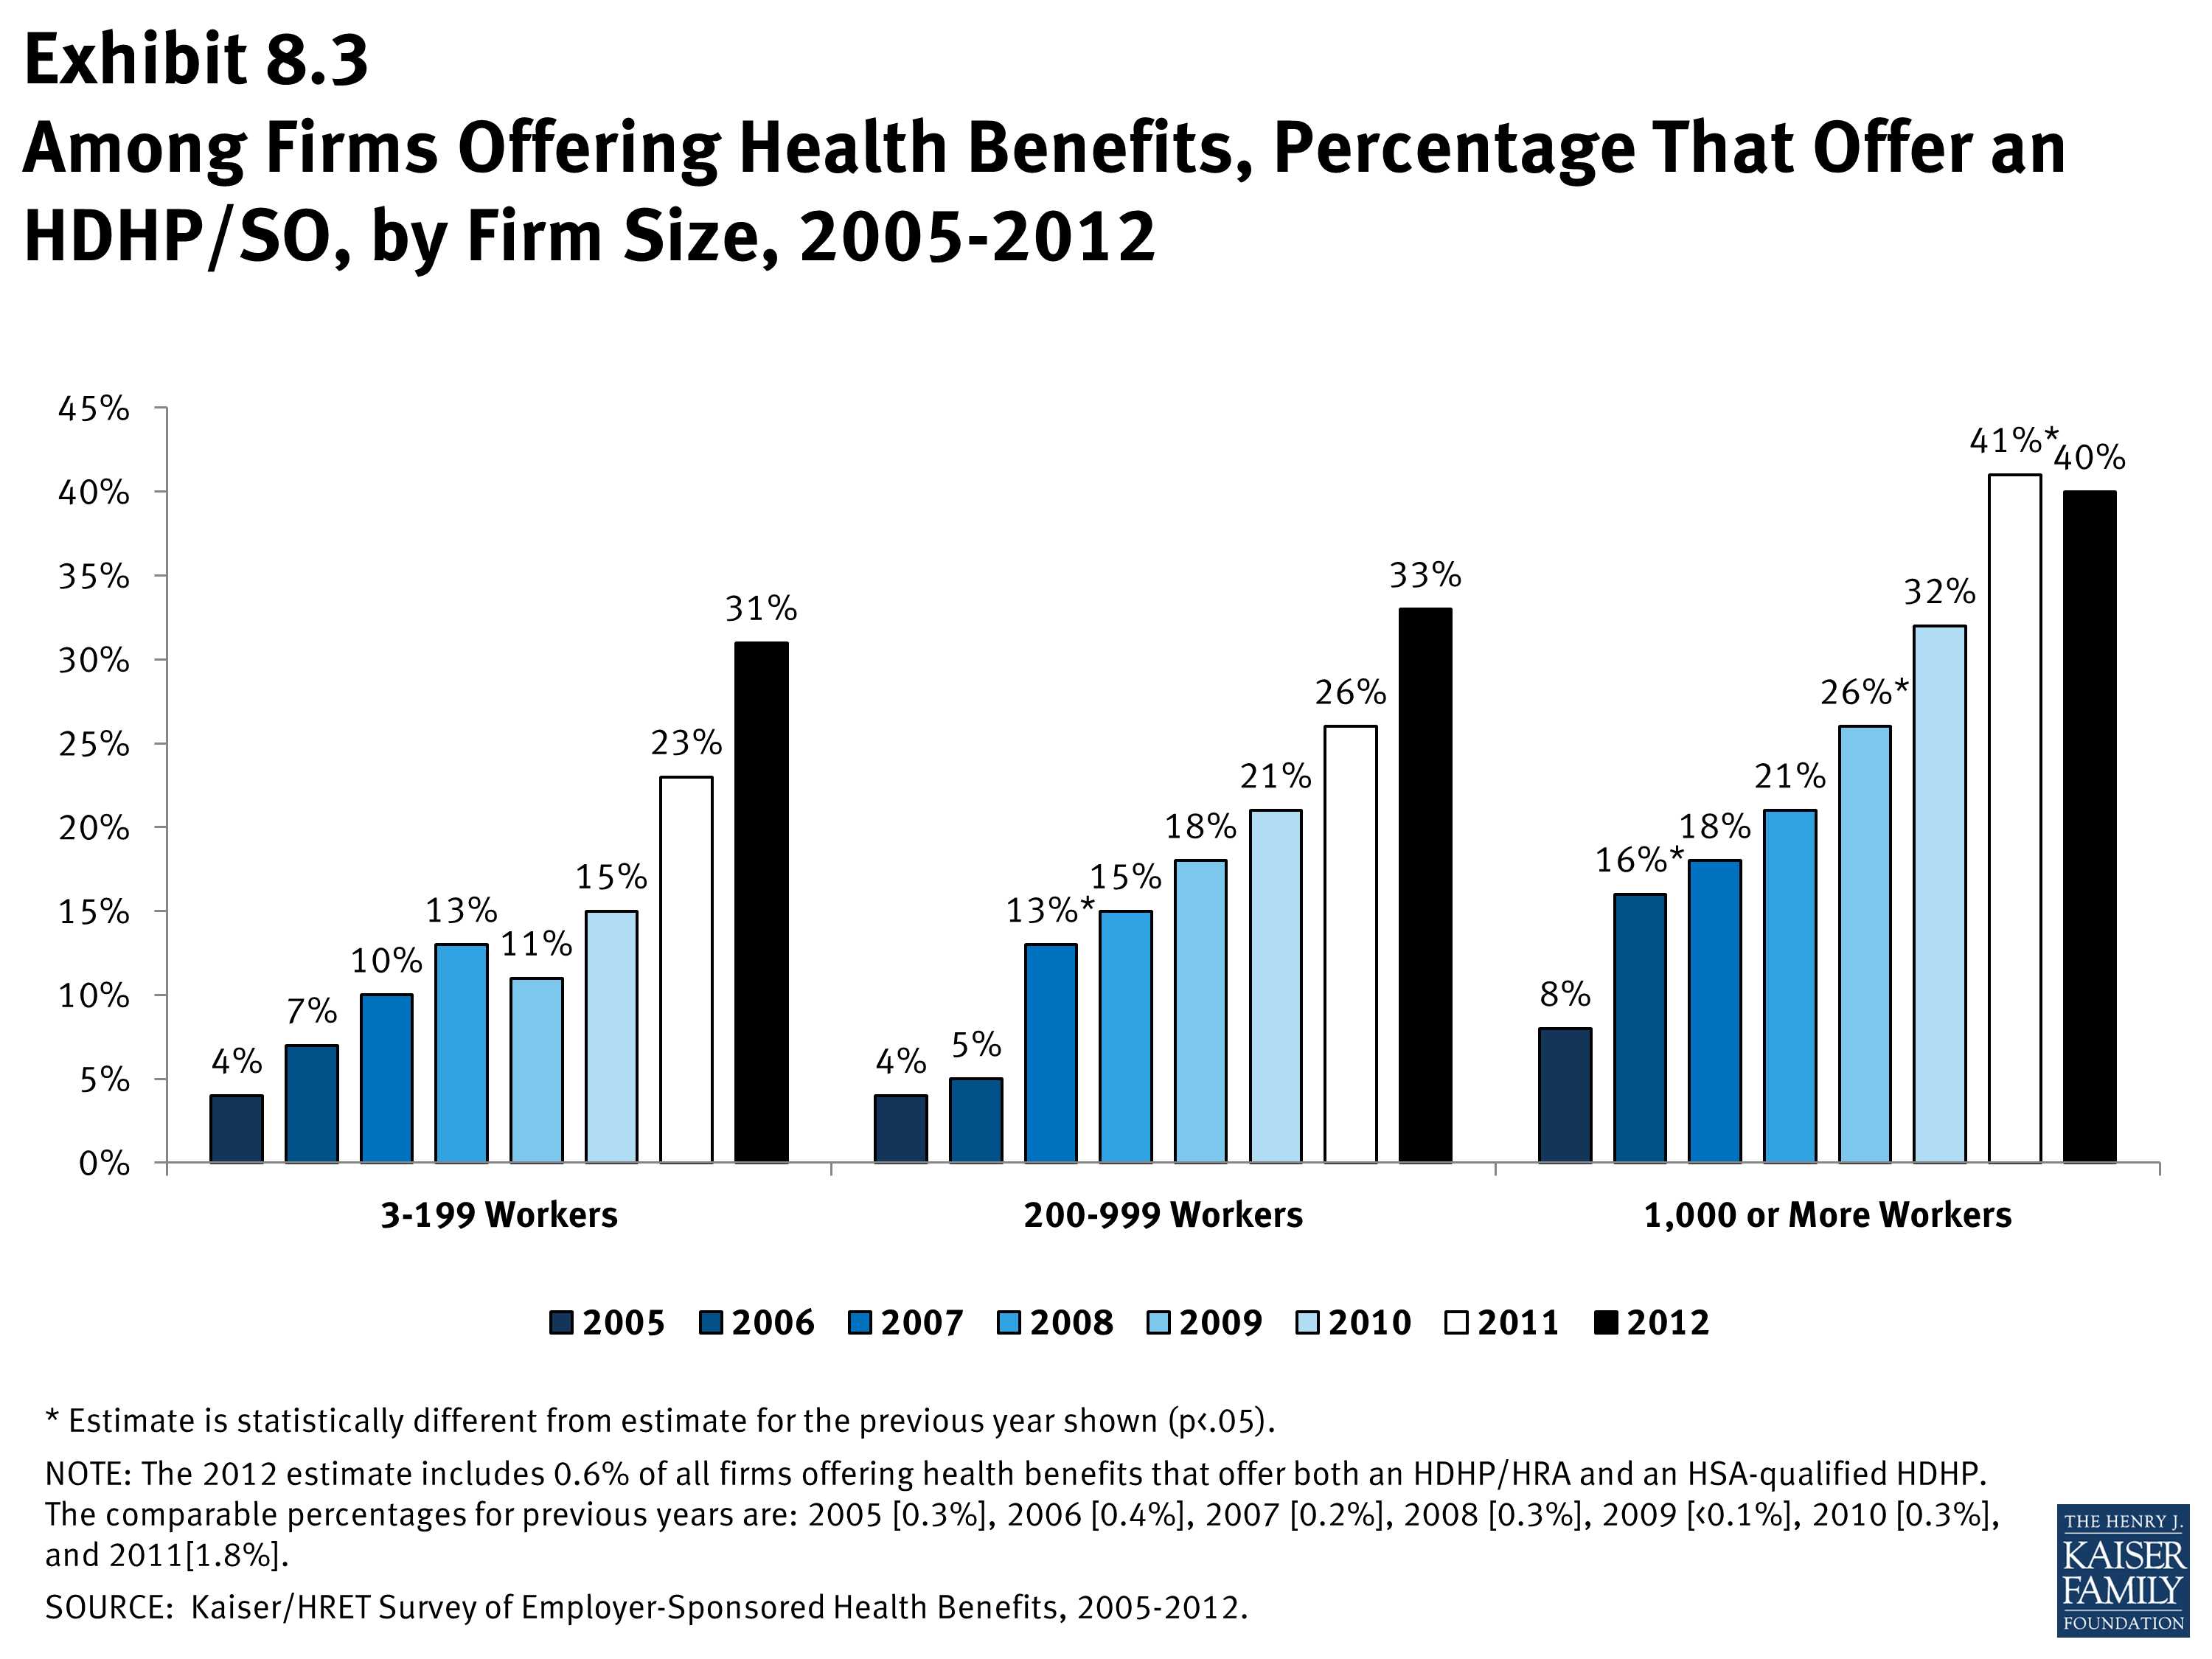
- Firms with 5,000 or more workers are significantly more likely to offer an HDHP/SO than smaller firms. Forty-eight percent of firms with 5,000 or more workers offer an HDHP/SO, compared to 31% of firms with 3 to 199 workers, 33% of firms with 200-999 workers, or 38% of firms with 1,000 to 4,999 workers (Exhibit 8.2).
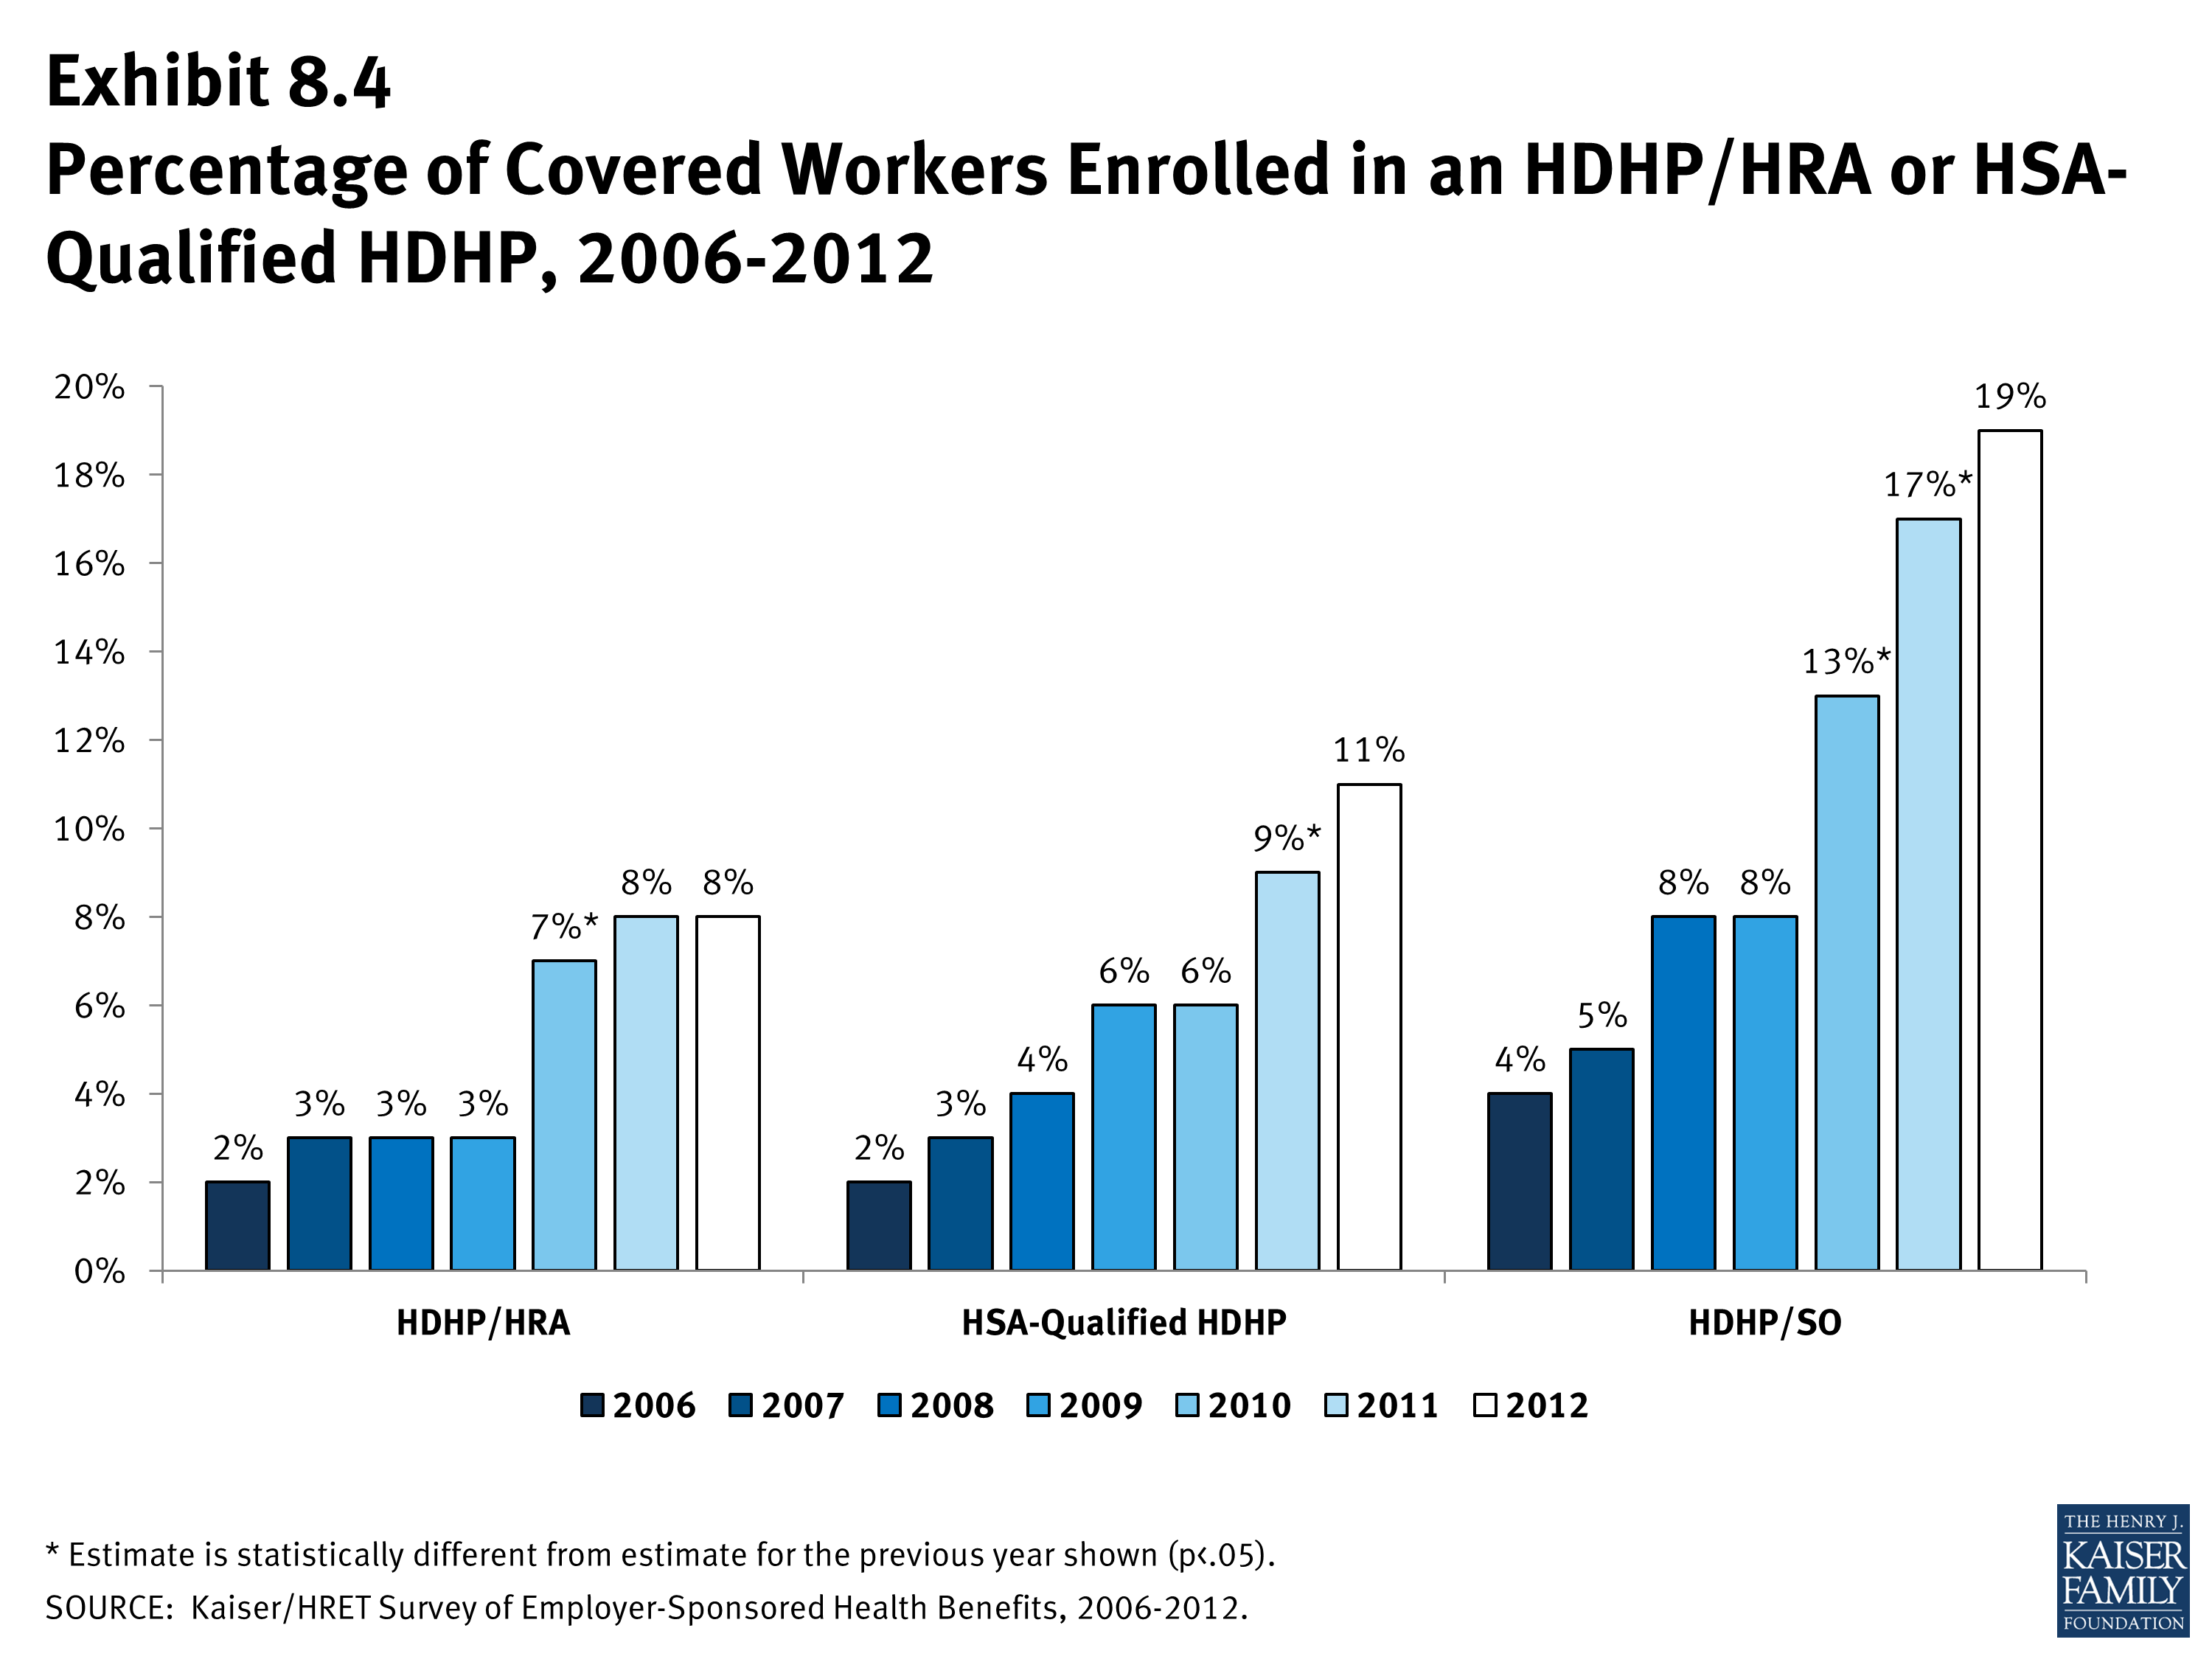
- Nineteen percent of covered workers are enrolled in an HDHP/SO in 2012, similar to the 17% enrolled last year (Exhibit 8.4). Enrollment in HDHP/SOs had increased significantly in previous years (13% in 2010; 8% in 2009).
- Eight percent of covered workers are enrolled in HDHP/HRAs in 2012, and 11% percent of covered workers are enrolled in HSA-qualified HDHPs (Exhibit 8.4).
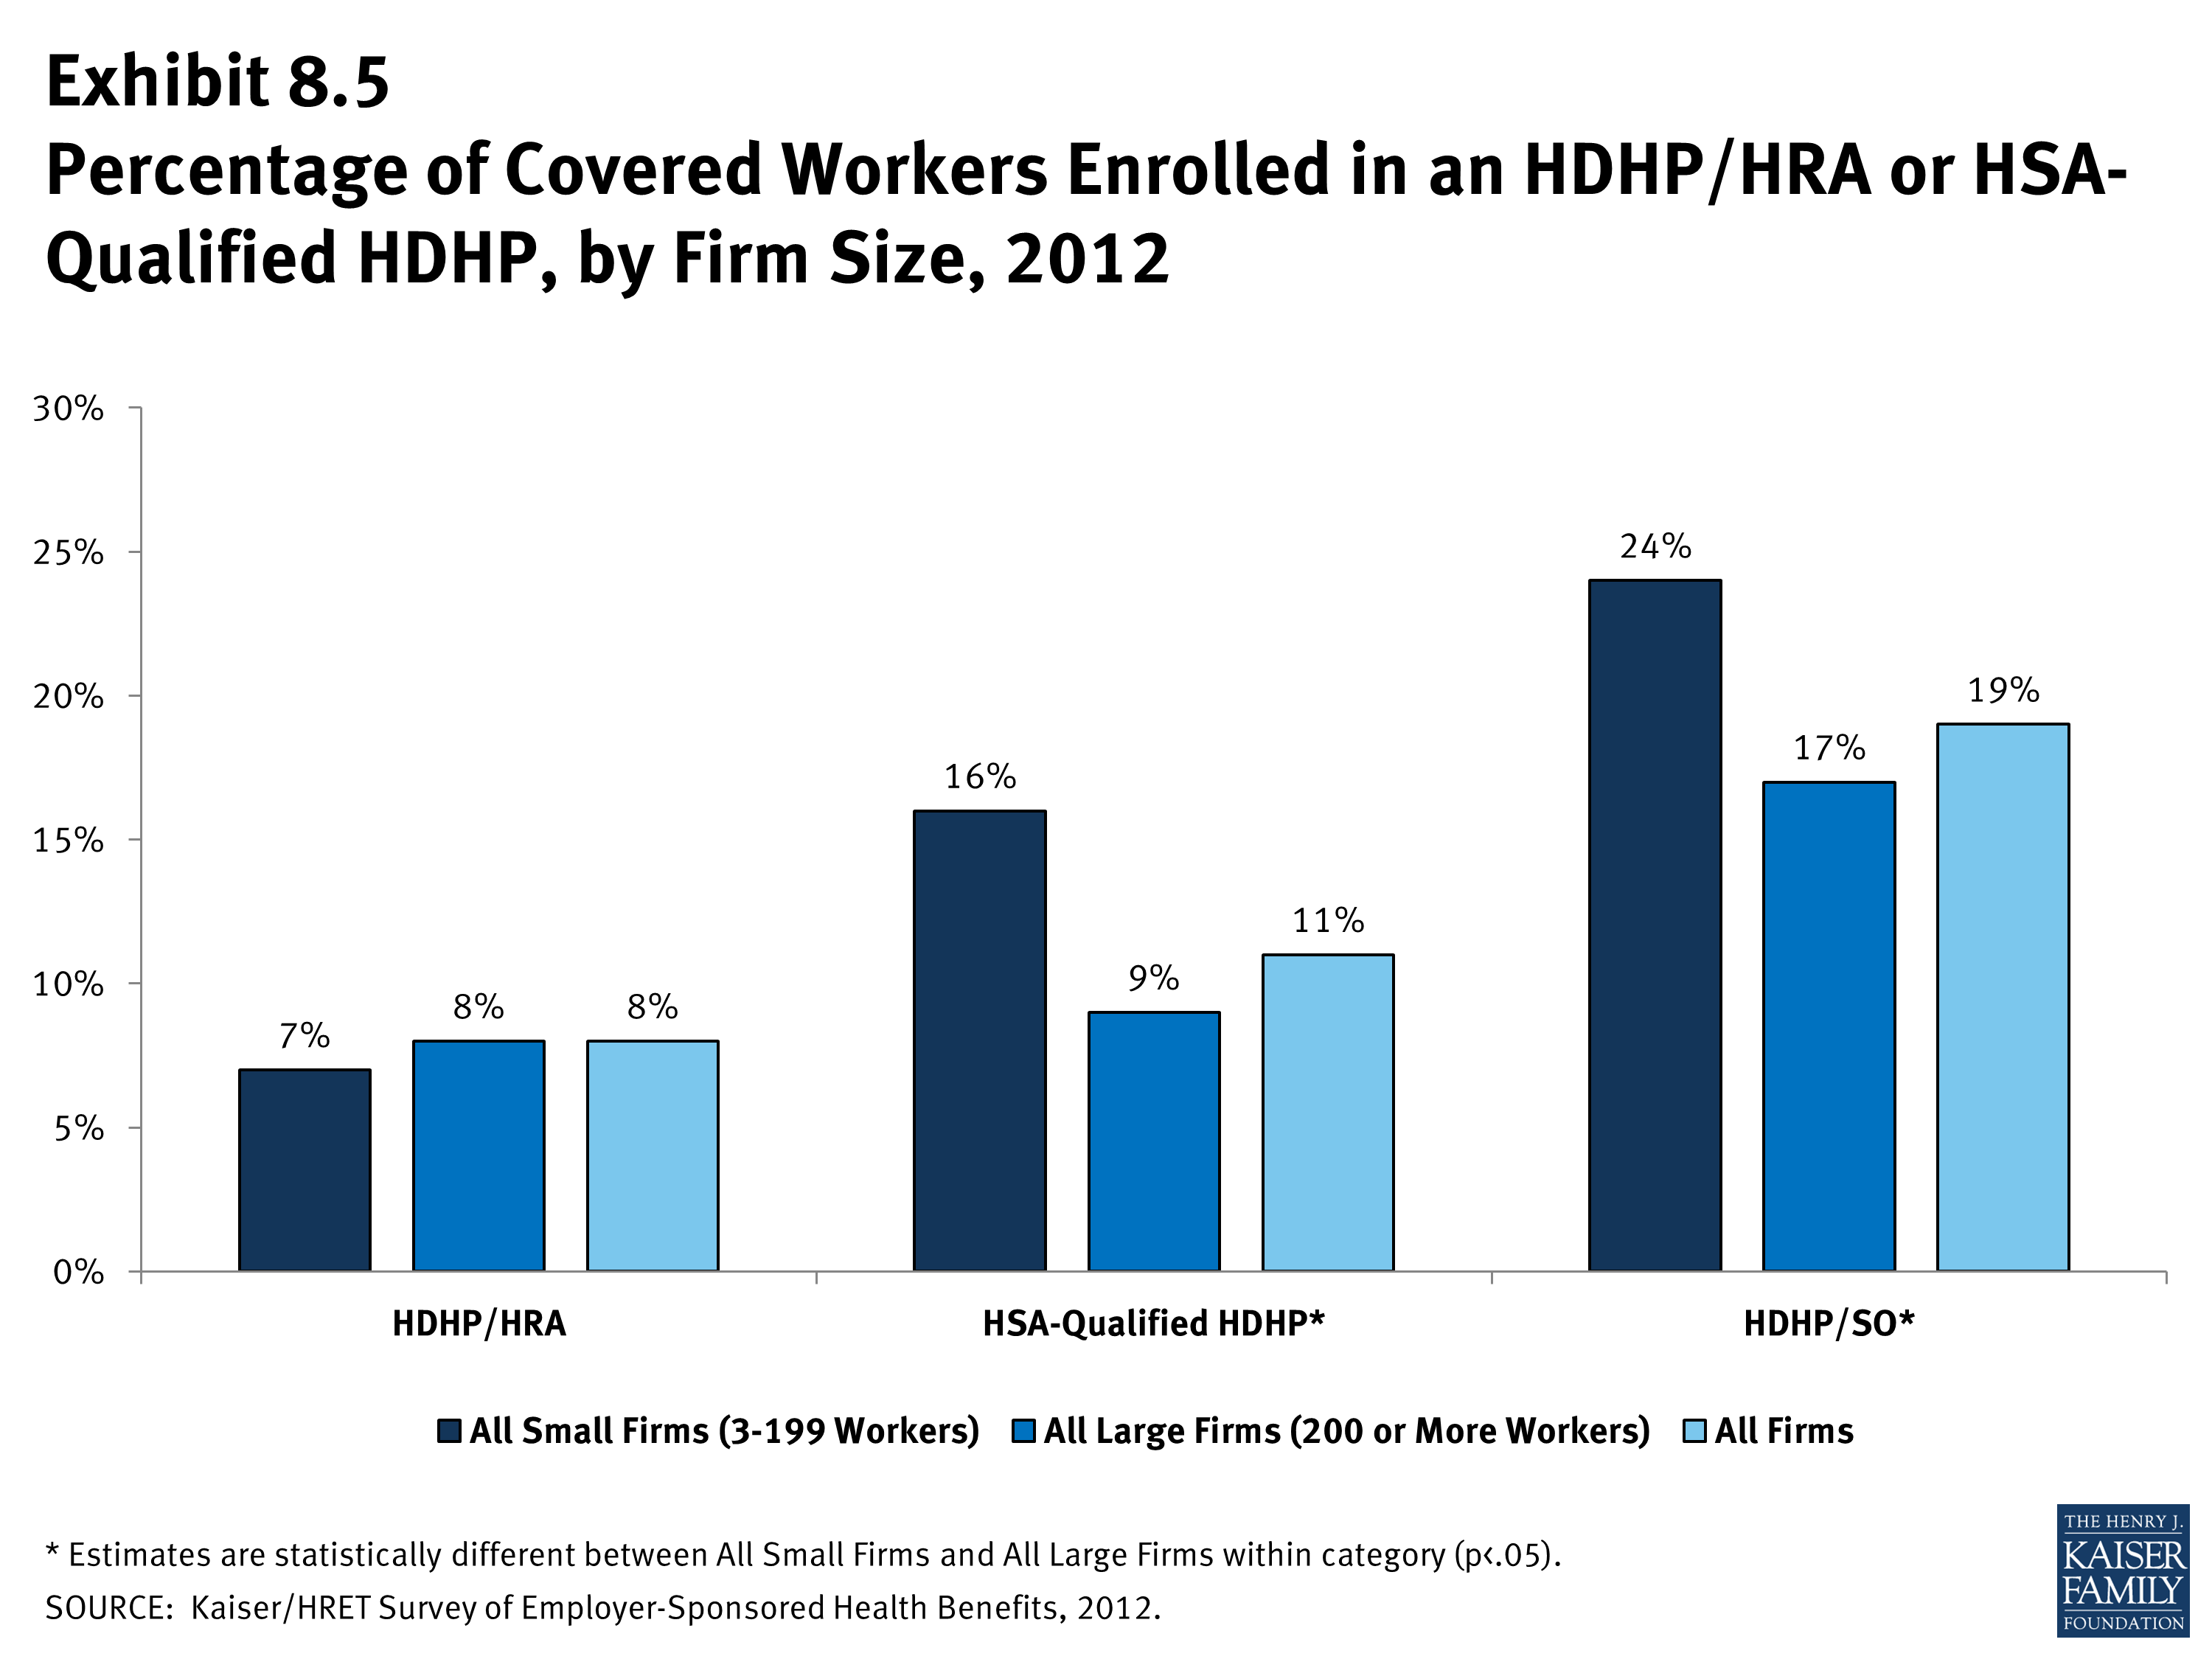
- Twenty-four percent of covered workers in small firms (3-199 workers) are enrolled in HDHP/SOs, compared to 17% of workers in large firms (200 or more workers) (Exhibit 8.5).
- The percentage of workers in small firms (3-199 workers) enrolled in HSA-qualified HDHP/SOs is higher than the percentage of workers in large firms enrolled in HSA-qualified HDHP/SOs (16% vs. 9%) (Exhibit 8.5).
Plan Deductibles
- As expected, workers enrolled in HDHP/SOs have higher deductibles than workers enrolled in HMOs, PPOs, or POS plans.
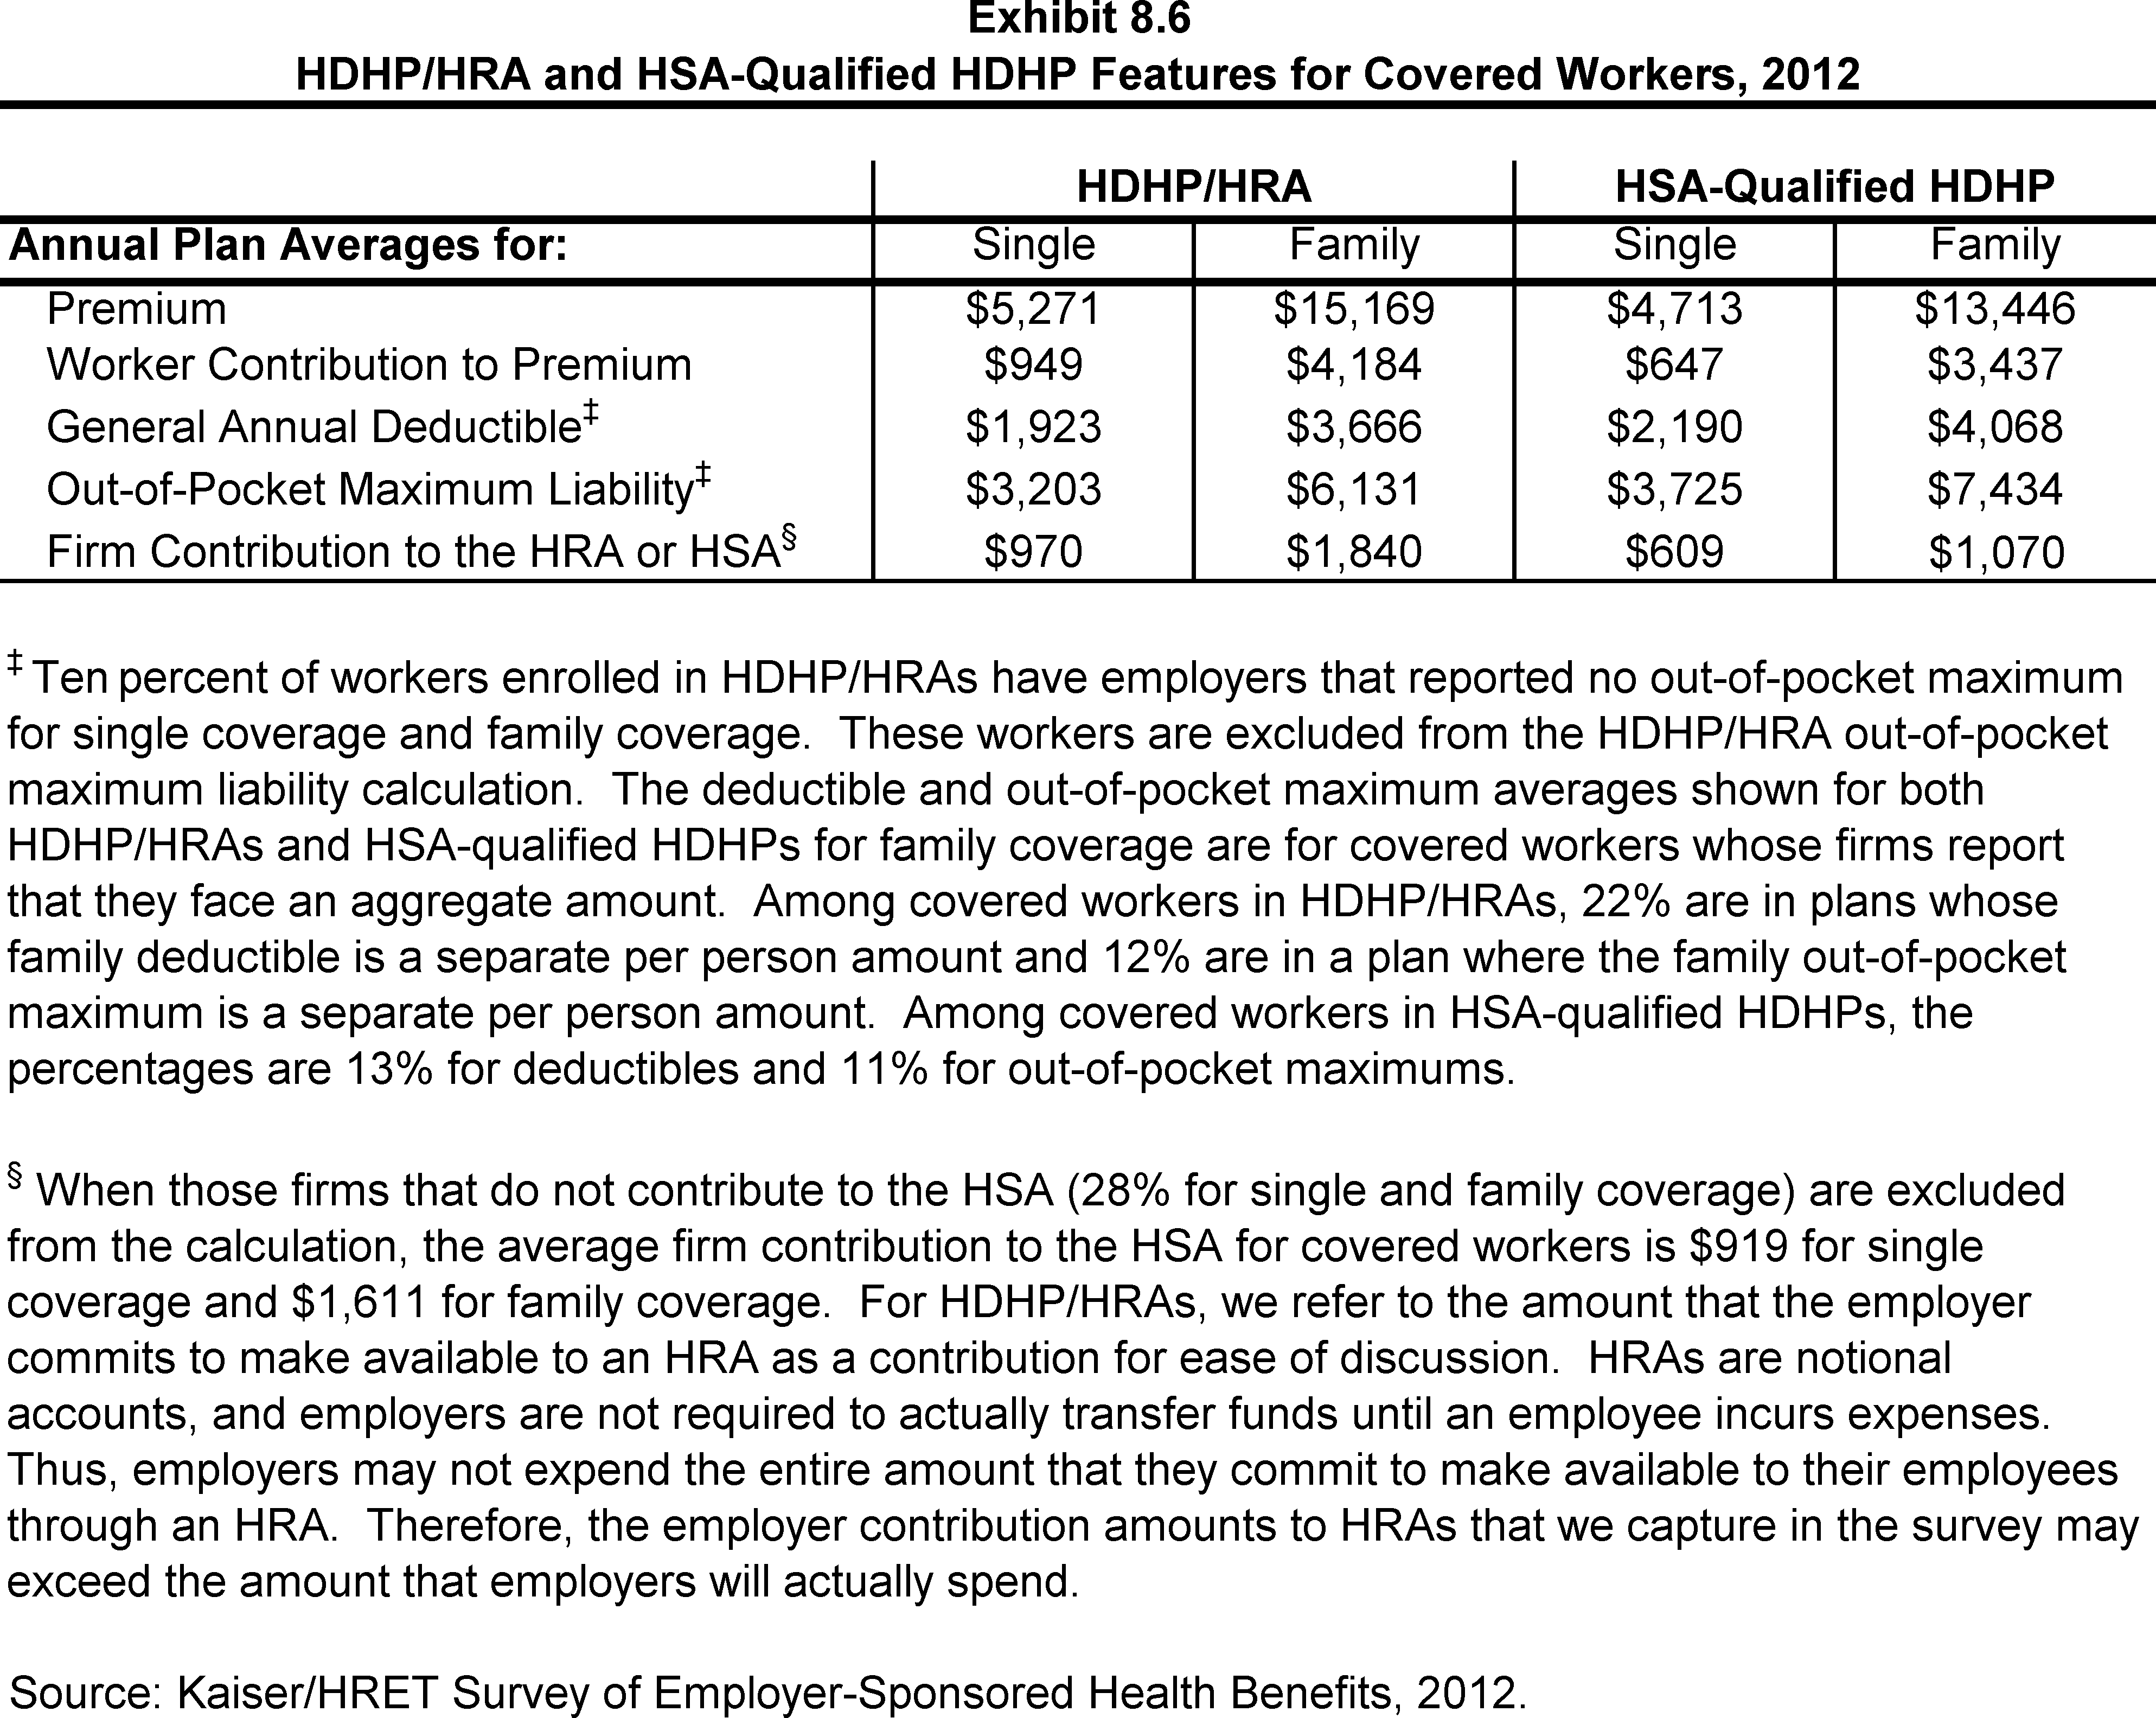
- The average general annual deductible for single coverage is $1,923 for HDHP/HRAs and $2,190 for HSA-qualified HDHPs (Exhibit 8.6). These averages are similar to the amounts reported in recent years. There is wide variation around these averages (Exhibit 8.8).
- Since 2006, the survey has collected information on two types of family deductibles. The survey asks employers whether the family deductible amount is (1) an aggregate amount (i.e., the out-of-pocket expenses of all family members are counted until the deductible is satisfied), or (2) a per-person amount that applies to each family member (typically with a limit on the number of family members that would be required to meet the deductible amount).
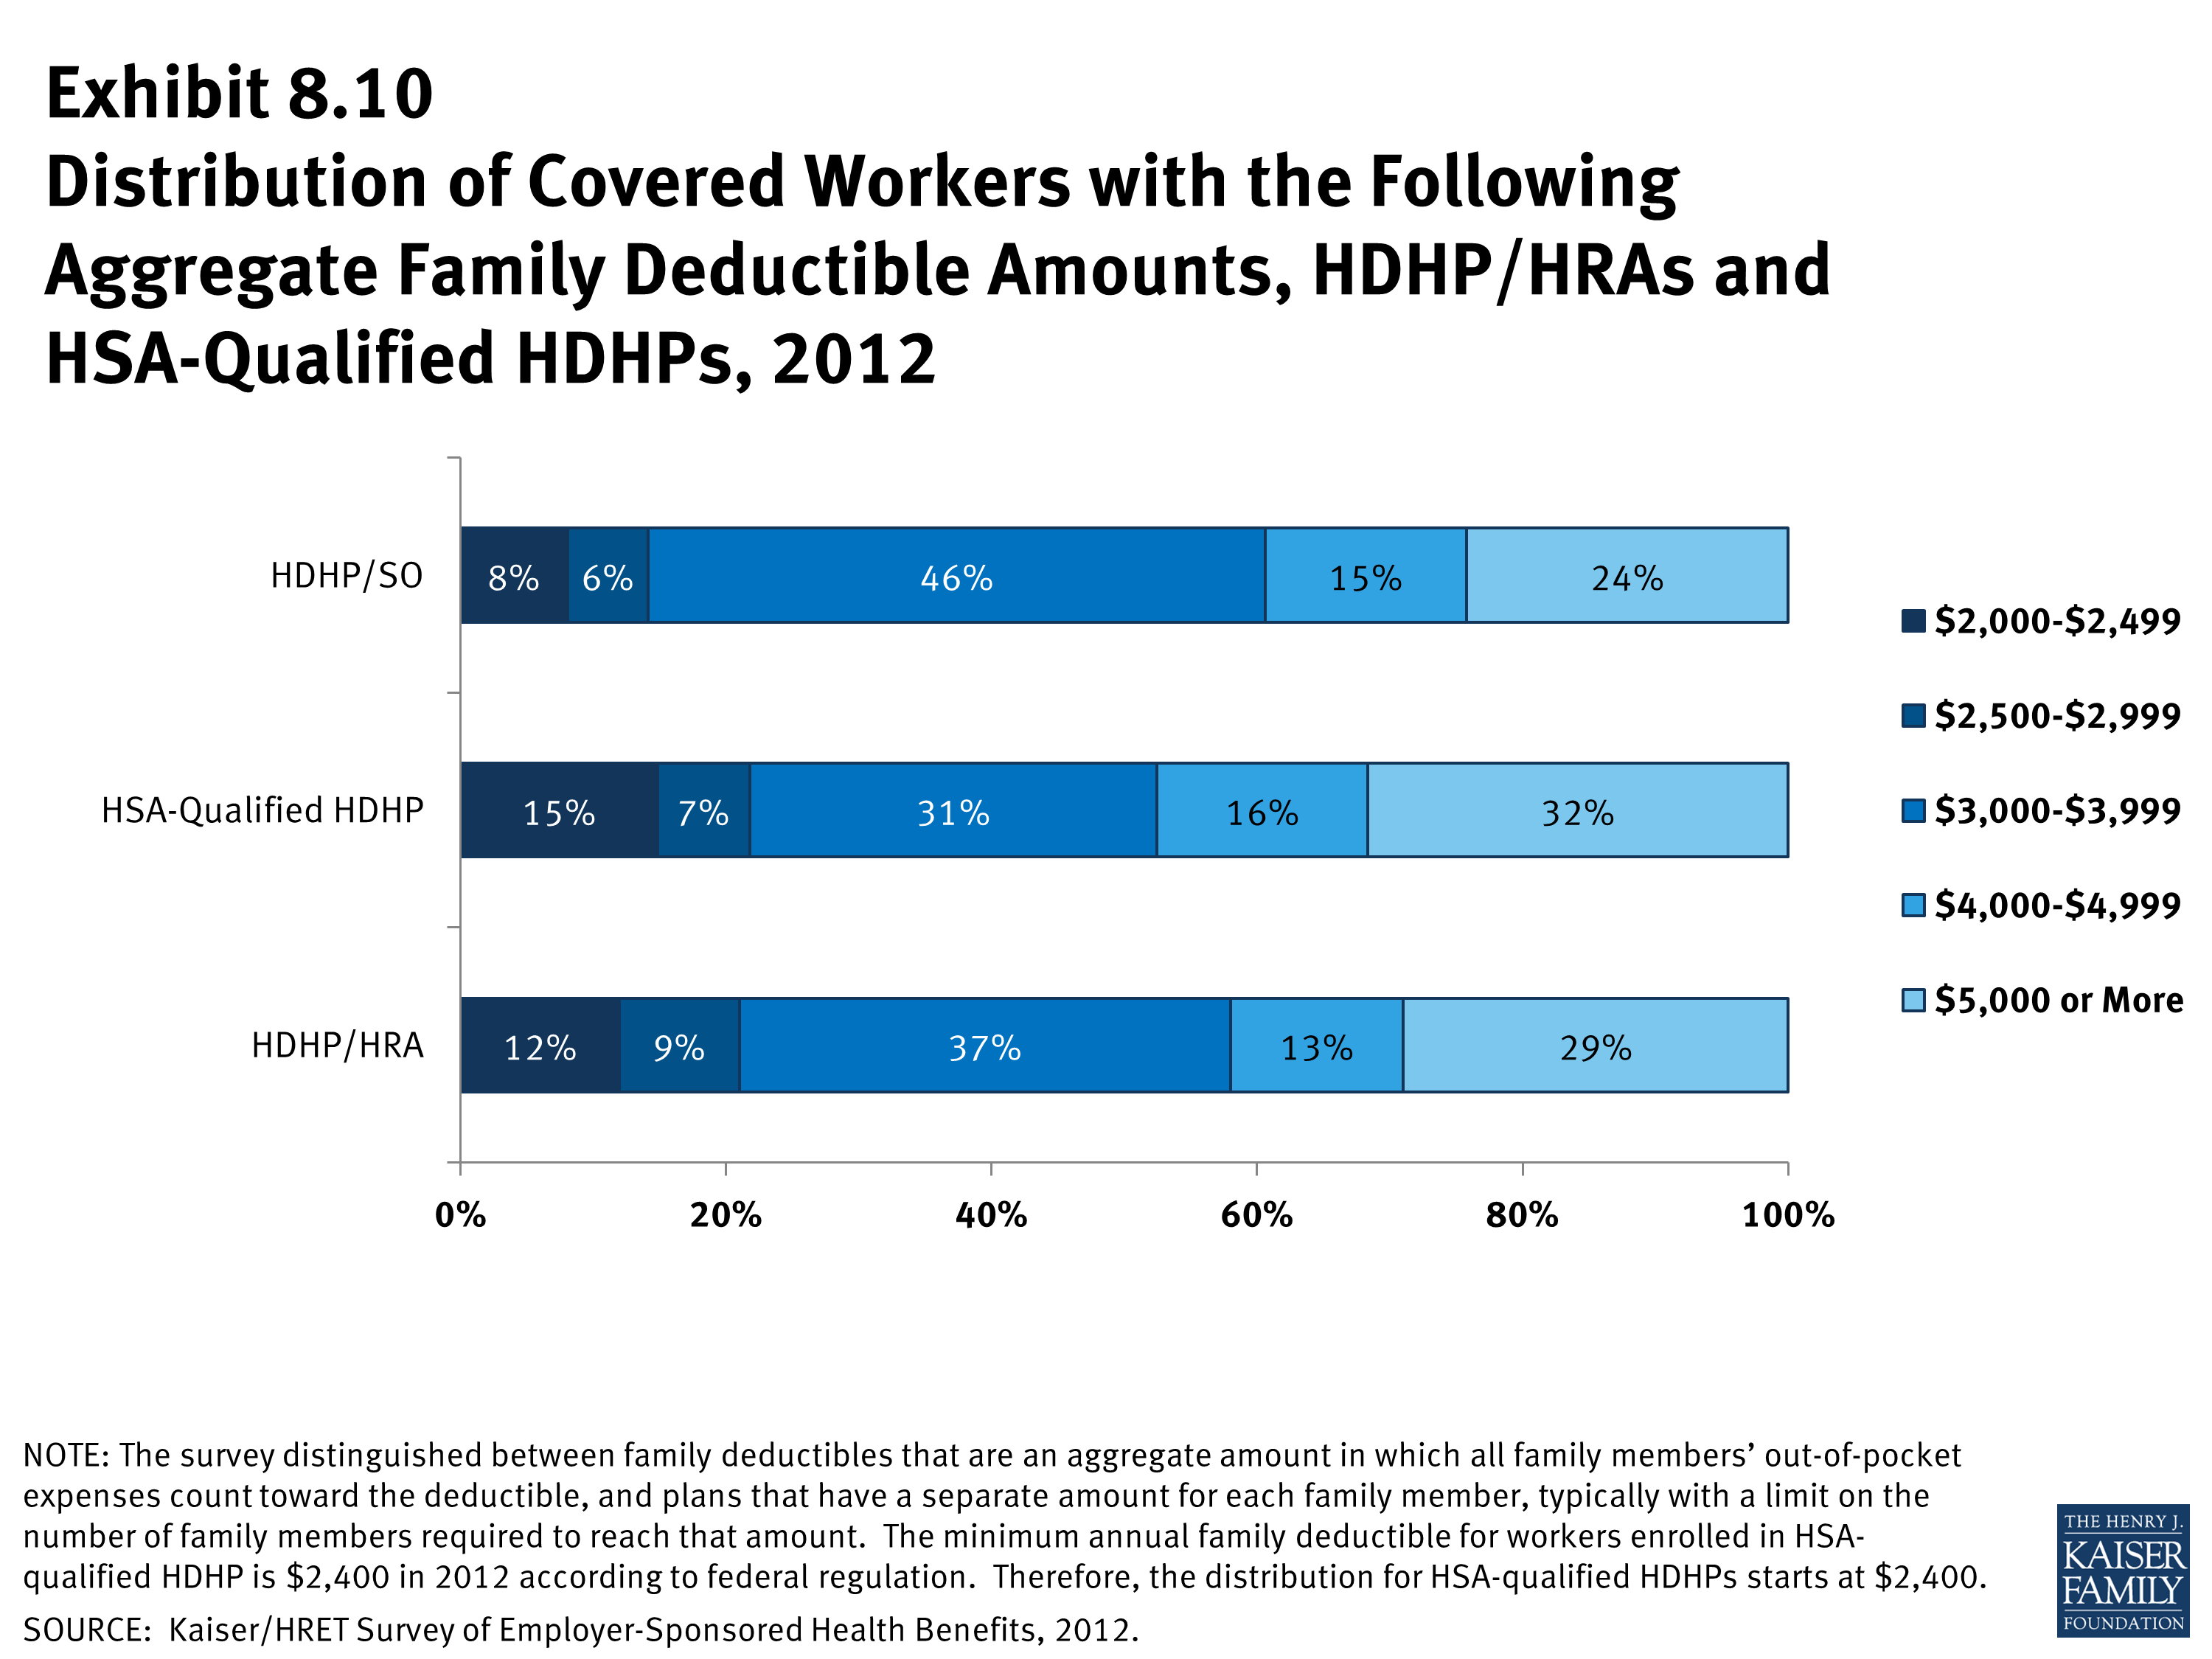
- The average aggregate deductibles for workers with family coverage are $3,666 for HDHP/HRAs and $4,068 for HSA-qualified HDHPs (Exhibit 8.6). There is wide variation around these average amounts for family coverage (Exhibit 8.10).
Out-of-Pocket Maximum Amounts
- HSA-qualified HDHPs are legally required to have a maximum annual out-of-pocket liability of no more than $6,050 for single coverage and $12,100 for family coverage in 2012. HDHP/HRAs have no similar requirement.
- The average annual out-of-pocket maximum for single coverage is $3,203 for HDHP/HRA4 and $3,725 for HSA-qualified HDHPs (Exhibit 8.6).
- As with deductibles, the survey asks employers whether the family out-of-pocket maximum liability is (1) an aggregate amount that applies to spending by any covered person in the family, or (2) a separate per person amount that applies to spending by each family member or a limited number of family members. The survey also asks whether spending by enrollees on various services counts towards meeting the plan out-of-pocket maximum.
- Among covered workers with family coverage whose out-of-pocket maximum is an aggregate amount that applies to spending by any covered person in the family, the average annual out-of-pocket maximums are $6,131 for HDHP/HRAs and $7,434 for HSA-qualified HDHPs (Exhibit 8.6).
Premiums
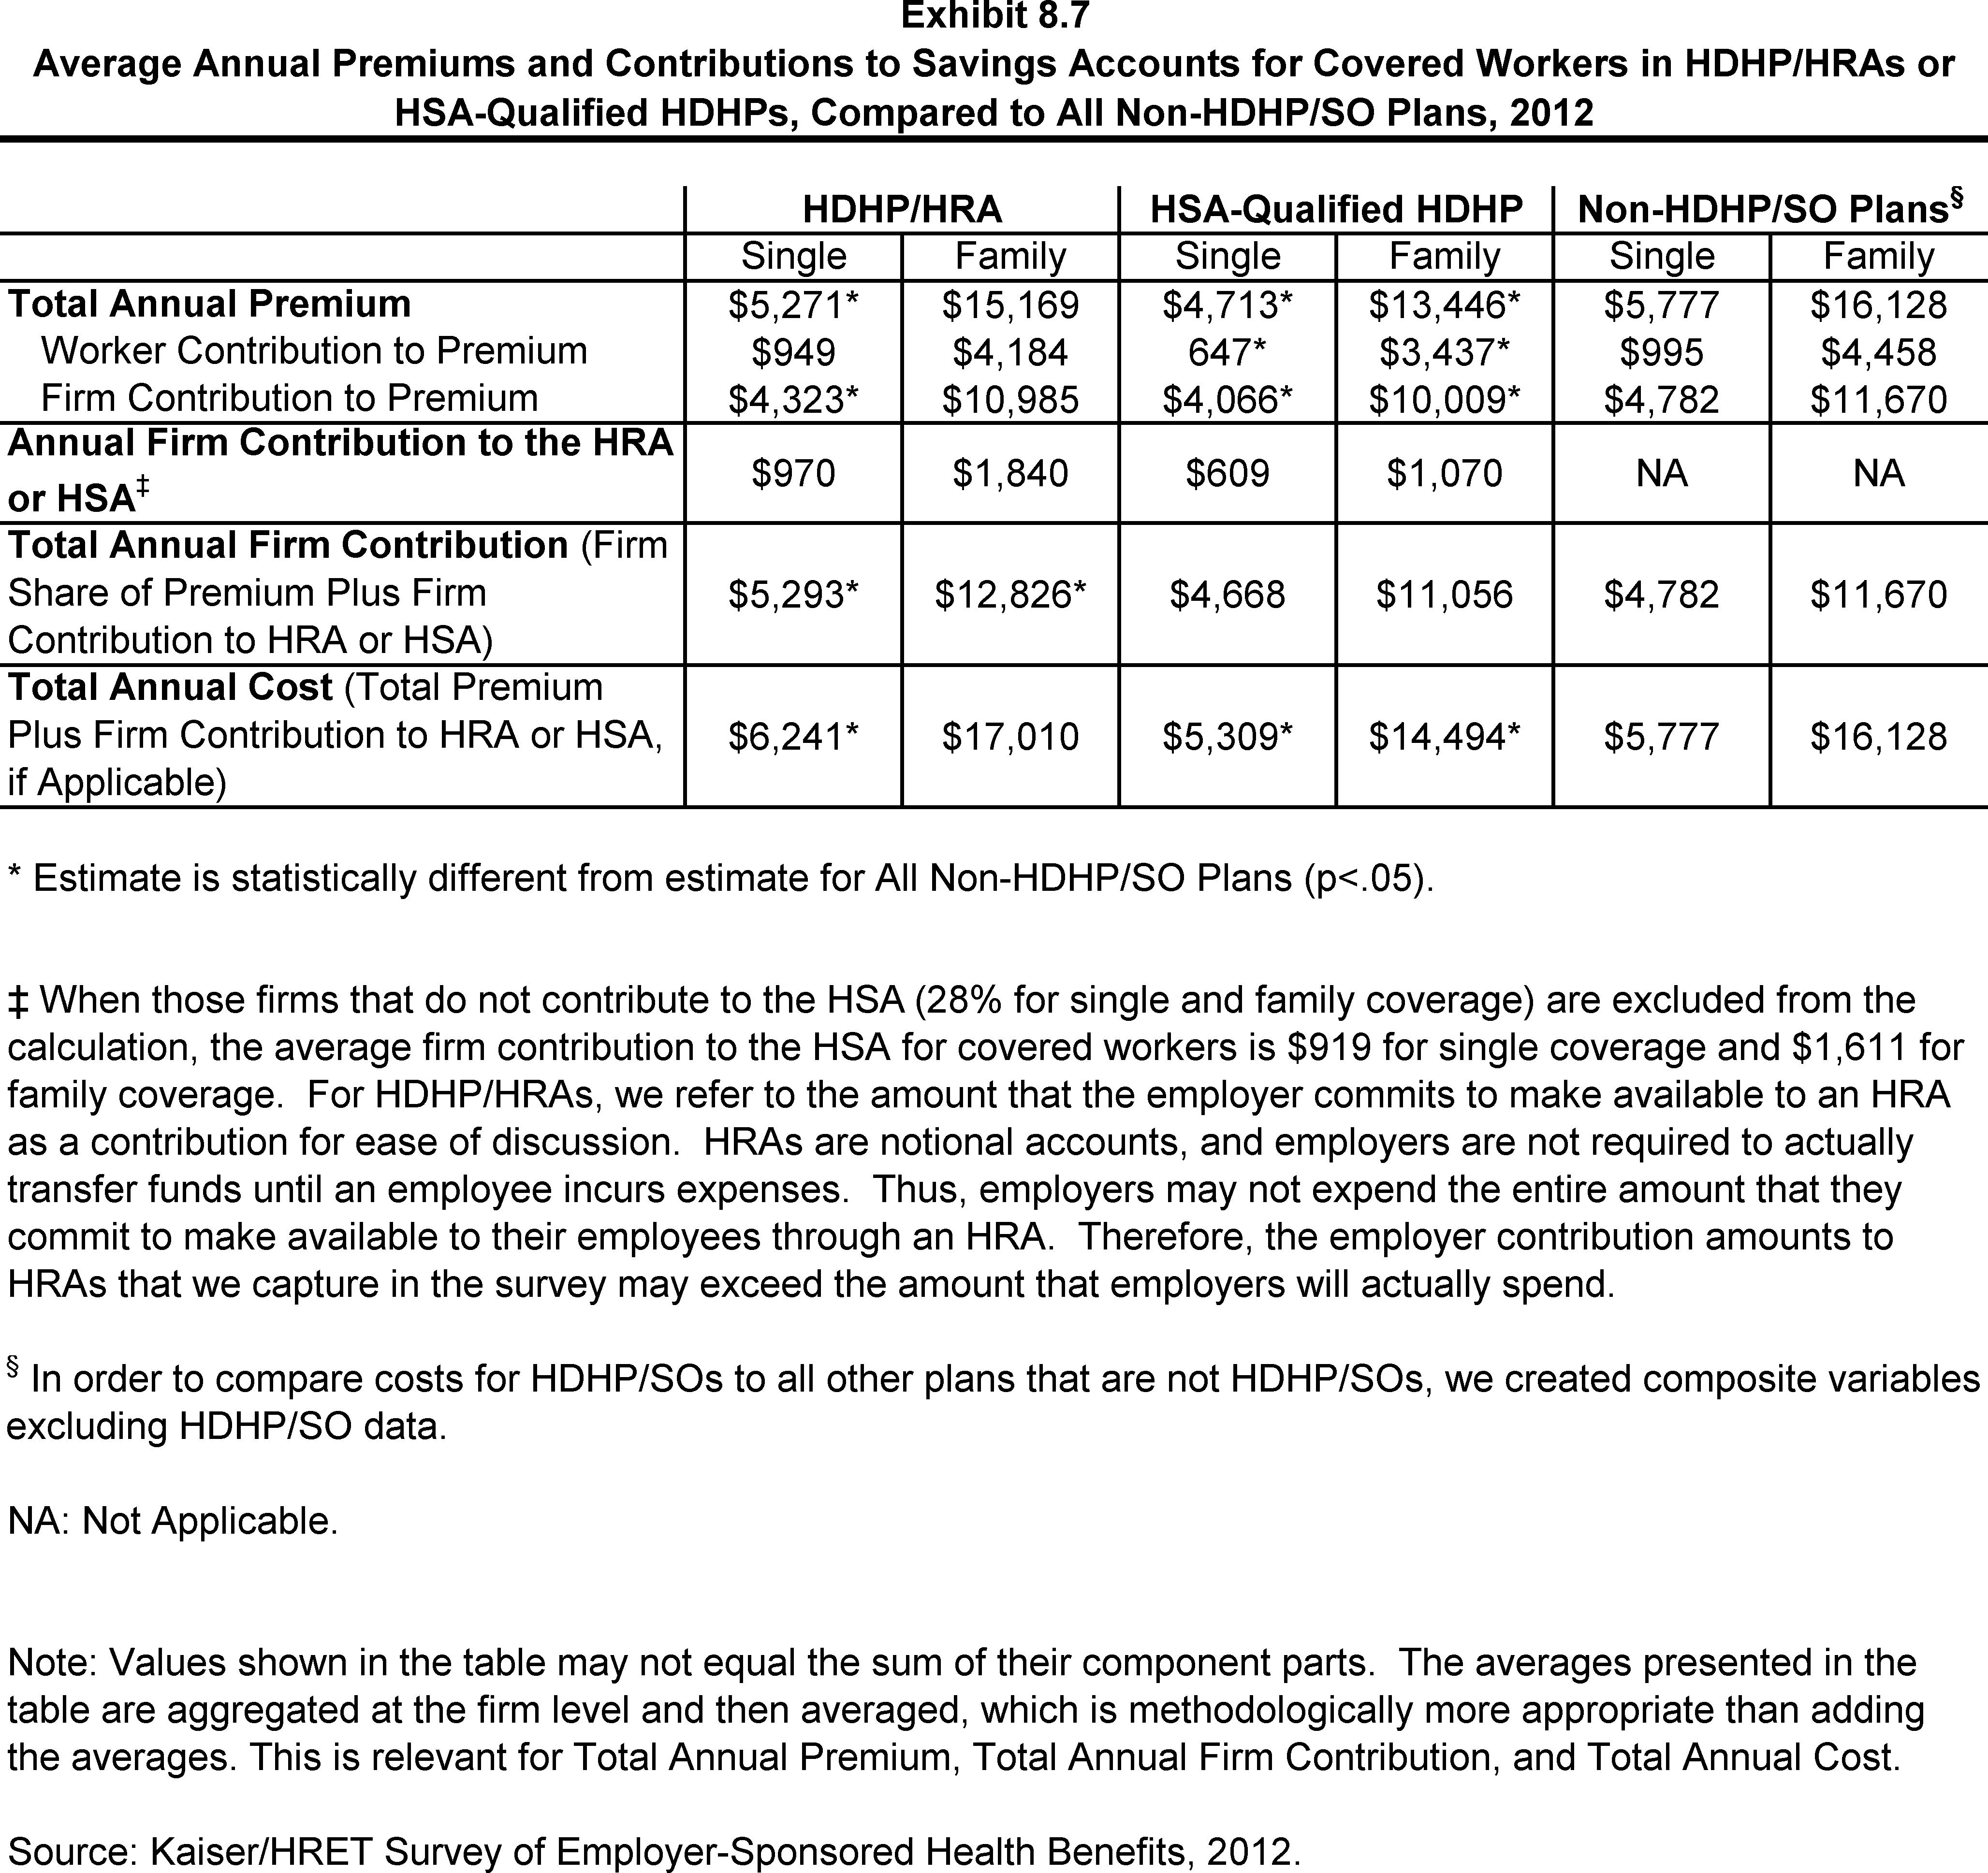
- In 2012, the average annual premiums for HDHP/HRAs are $5,271 for single coverage and $15,169 for family coverage. For single coverage, the HDHP/HRA average premium for covered workers is significantly lower than the average premium for covered workers in plans that are not HDHP/SOs (Exhibit 8.7).
- The average annual premium for workers in HSA-qualified HDHPs is $4,713 for single coverage and $13,446 for family coverage. These amounts are lower than the average single and family premium for workers in plans that are not HDHP/SOs (Exhibit 8.7).
Worker Contributions to Premiums
- The average annual worker contributions to premiums for workers enrolled in HDHP/HRAs are $949 for single coverage and $4,184 for family coverage (Exhibit 8.6).
- The average annual worker contributions to premiums for workers in HSA-qualified HDHPs are $647 for single coverage and $3,437 for family coverage (Exhibit 8.6).
The average contribution for single coverage for workers in HSA-qualified HDHPs is significantly less than the average premium contribution made by covered workers in plans that are not HDHP/SOs (Exhibit 8.7).
Employer Contributions to Premiums and Savings Options
- Employers contribute to HDHP/SOs in two ways: through their contributions toward the premium for the health plan and through their contributions (if any, in the case of HSAs) to the savings account option (i.e., the HRAs or HSAs themselves).
- Looking just at the annual employer contributions to premiums, covered workers in HDHP/HRAs on average receive employer contributions of $4,323 for single coverage and $10,985 for family coverage. The average employer contribution for single coverage in HDHP/HRAs is significantly less than the average employer premium contribution for plans that are not HDHP/SOs. (Exhibit 8.7).
- The average annual employer contributions to premiums for workers in HSA-qualified HDHPs are $4,066 for single coverage and $10,009 for family coverage. These amounts are lower than the average contributions for single or family coverage for workers in plans that are not HDHP/SOs (Exhibit 8.7).
- When looking at employer contributions to the savings option, workers enrolled in HDHP/HRAs receive, on average, an annual employer contribution to their HRA of $970 for single coverage and $1,840 for family coverage (Exhibit 8.7).
- HRAs are generally structured in such a way that employers may not actually spend the whole amount that they make available to their employees’ HRAs.5 Amounts committed to an employee’s HRA that are not used by the employee generally roll over and can be used in future years, but any balance may revert back to the employer if the employee leaves his or her job. Thus, the employer contribution amounts to HRAs that we capture in the survey may exceed the amount that employers will actually spend.
- Workers enrolled in HSA-qualified HDHPs on average receive an annual employer contribution to their HSA of $609 for single coverage and $1,070 for family coverage (Exhibit 8.7).
- In some cases, employers that sponsor HSA-qualified HDHP/SOs do not make contributions to HSAs established by their employees. Twenty-eight percent of employers offering single and family coverage through HSA-qualified HDHPs do not make contributions towards the HSAs that their workers establish (Exhibit 8.7). Thirty-four percent of workers with single or family coverage in an HSA-qualified HDHP do not receive an account contribution from their employer (Exhibit 8.13) and (Exhibit 8.14).
- The average HSA contributions reported above include the portion of covered workers whose employer contribution to the HSA is zero. When those firms that do not contribute to the HSA are excluded from the calculation, the average employer contribution for covered workers is $919 for single coverage and $1,611 for family coverage (Exhibit 8.7).
- Employer contributions to savings account options (i.e., the HRAs and HSAs themselves) for their employees can be added to their health plan premium contributions to calculate total employer contributions toward HDHP/SOs.
- For HDHP/HRAs, the average annual total employer contribution for covered workers is $5,293 for single coverage and $12,826 for family coverage. The average total employer contribution amounts for single and family coverage in HDHP/HRAs are higher than the average amount that employers contribute towards single and family coverage in health plans that are not HDHP/SOs (Exhibit 8.7).
- For HSA-qualified HDHPs, the average annual total employer contribution for covered workers is $4,668 for single coverage and $11,056 for workers with family coverage. The total amounts contributed for workers in HSA-qualified HDHPs for single and family coverage are similar to the amounts contributed for workers not in HDHP/SOs (Exhibit 8.7).
Among Firms Offering Health Benefits, Percentage That Offer an HDHP/HRA and/or an HSA-Qualified HDHP, 2005-2012
Among Firms Offering Health Benefits, Percentage That Offer an HDHP/SO, by Firm Size, 2012
Among Firms Offering Health Benefits, Percentage That Offer an HDHP/SO, by Firm Size, 2005-2012
Percentage of Covered Workers Enrolled in an HDHP/HRA or HSA-Qualified HDHP, 2006-2012
Percentage of Covered Workers Enrolled in an HDHP/HRA or HSA-Qualified HDHP, by Firm Size, 2012
HDHP/HRA and HSA-Qualified HDHP Features for Covered Workers, 2012
Average Annual Premiums and Contributions to Savings Accounts for Covered Workers in HDHP/HRAs or HSA-Qualified HDHPs, Compared to All Non-HDHP/SO Plans, 2012
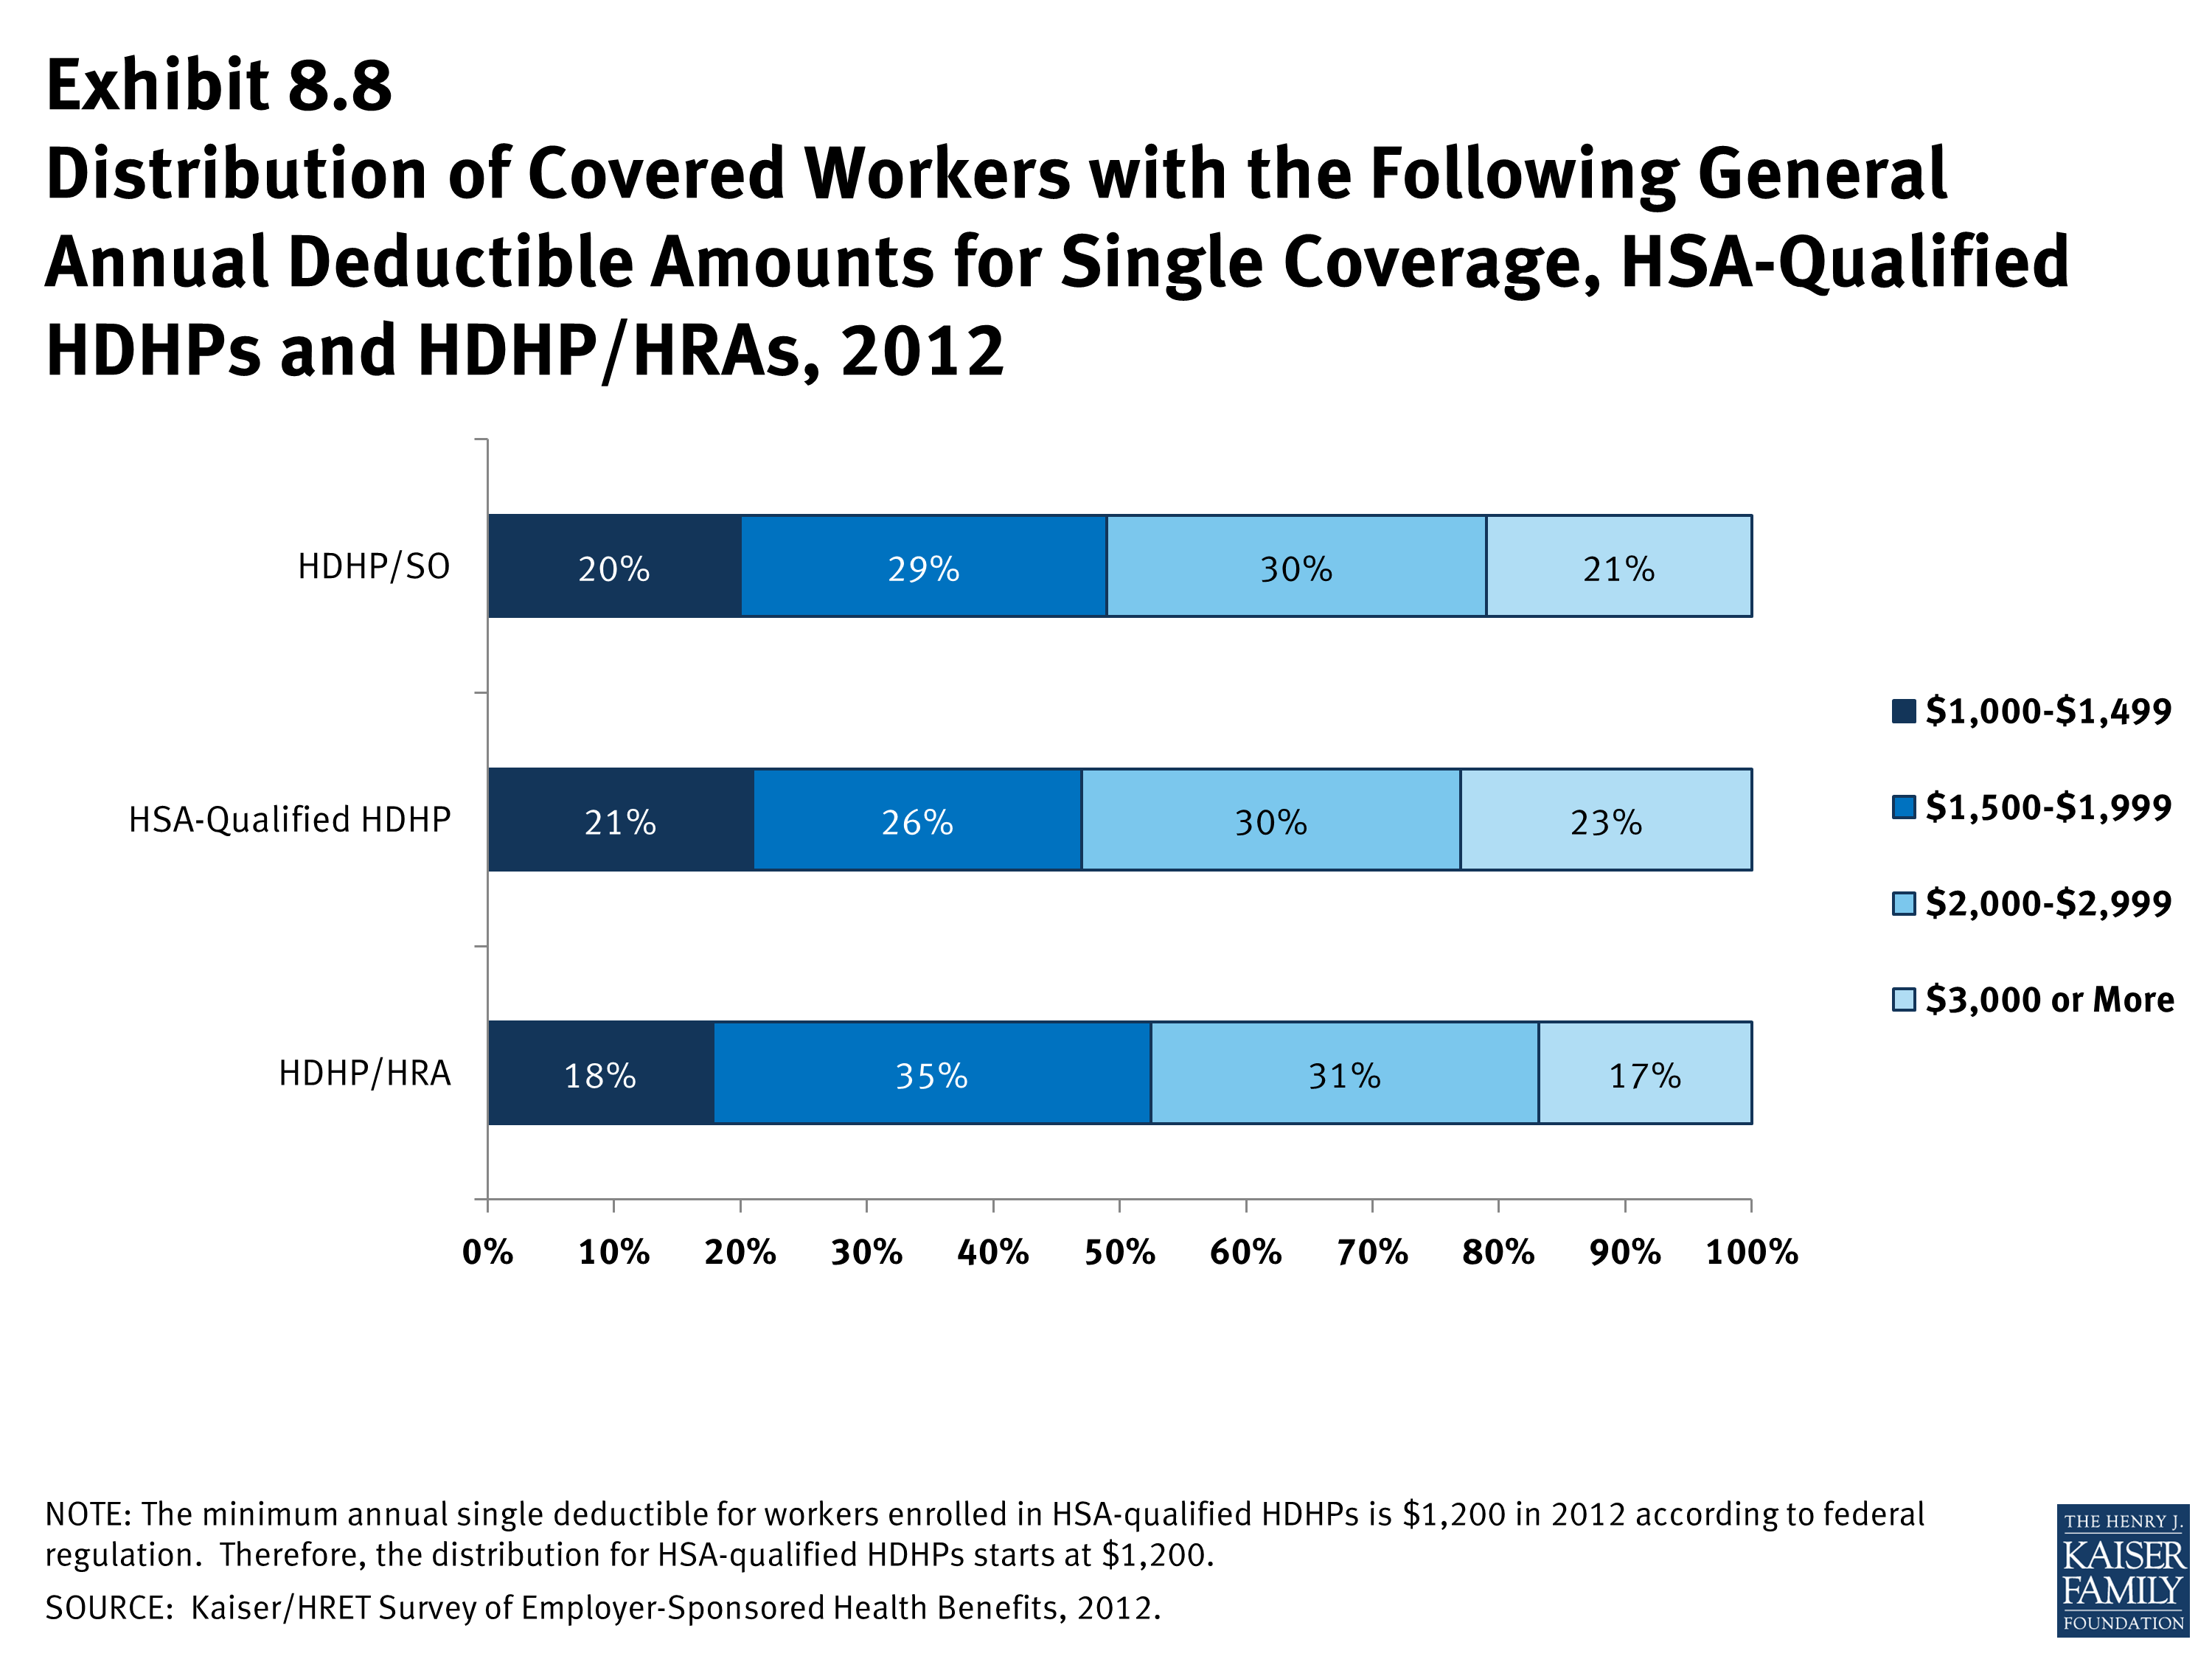
Distribution of Covered Workers with the Following General Annual Deductible Amounts for Single Coverage, HSA-Qualified HDHPs and HDHP/HRAs, 2012
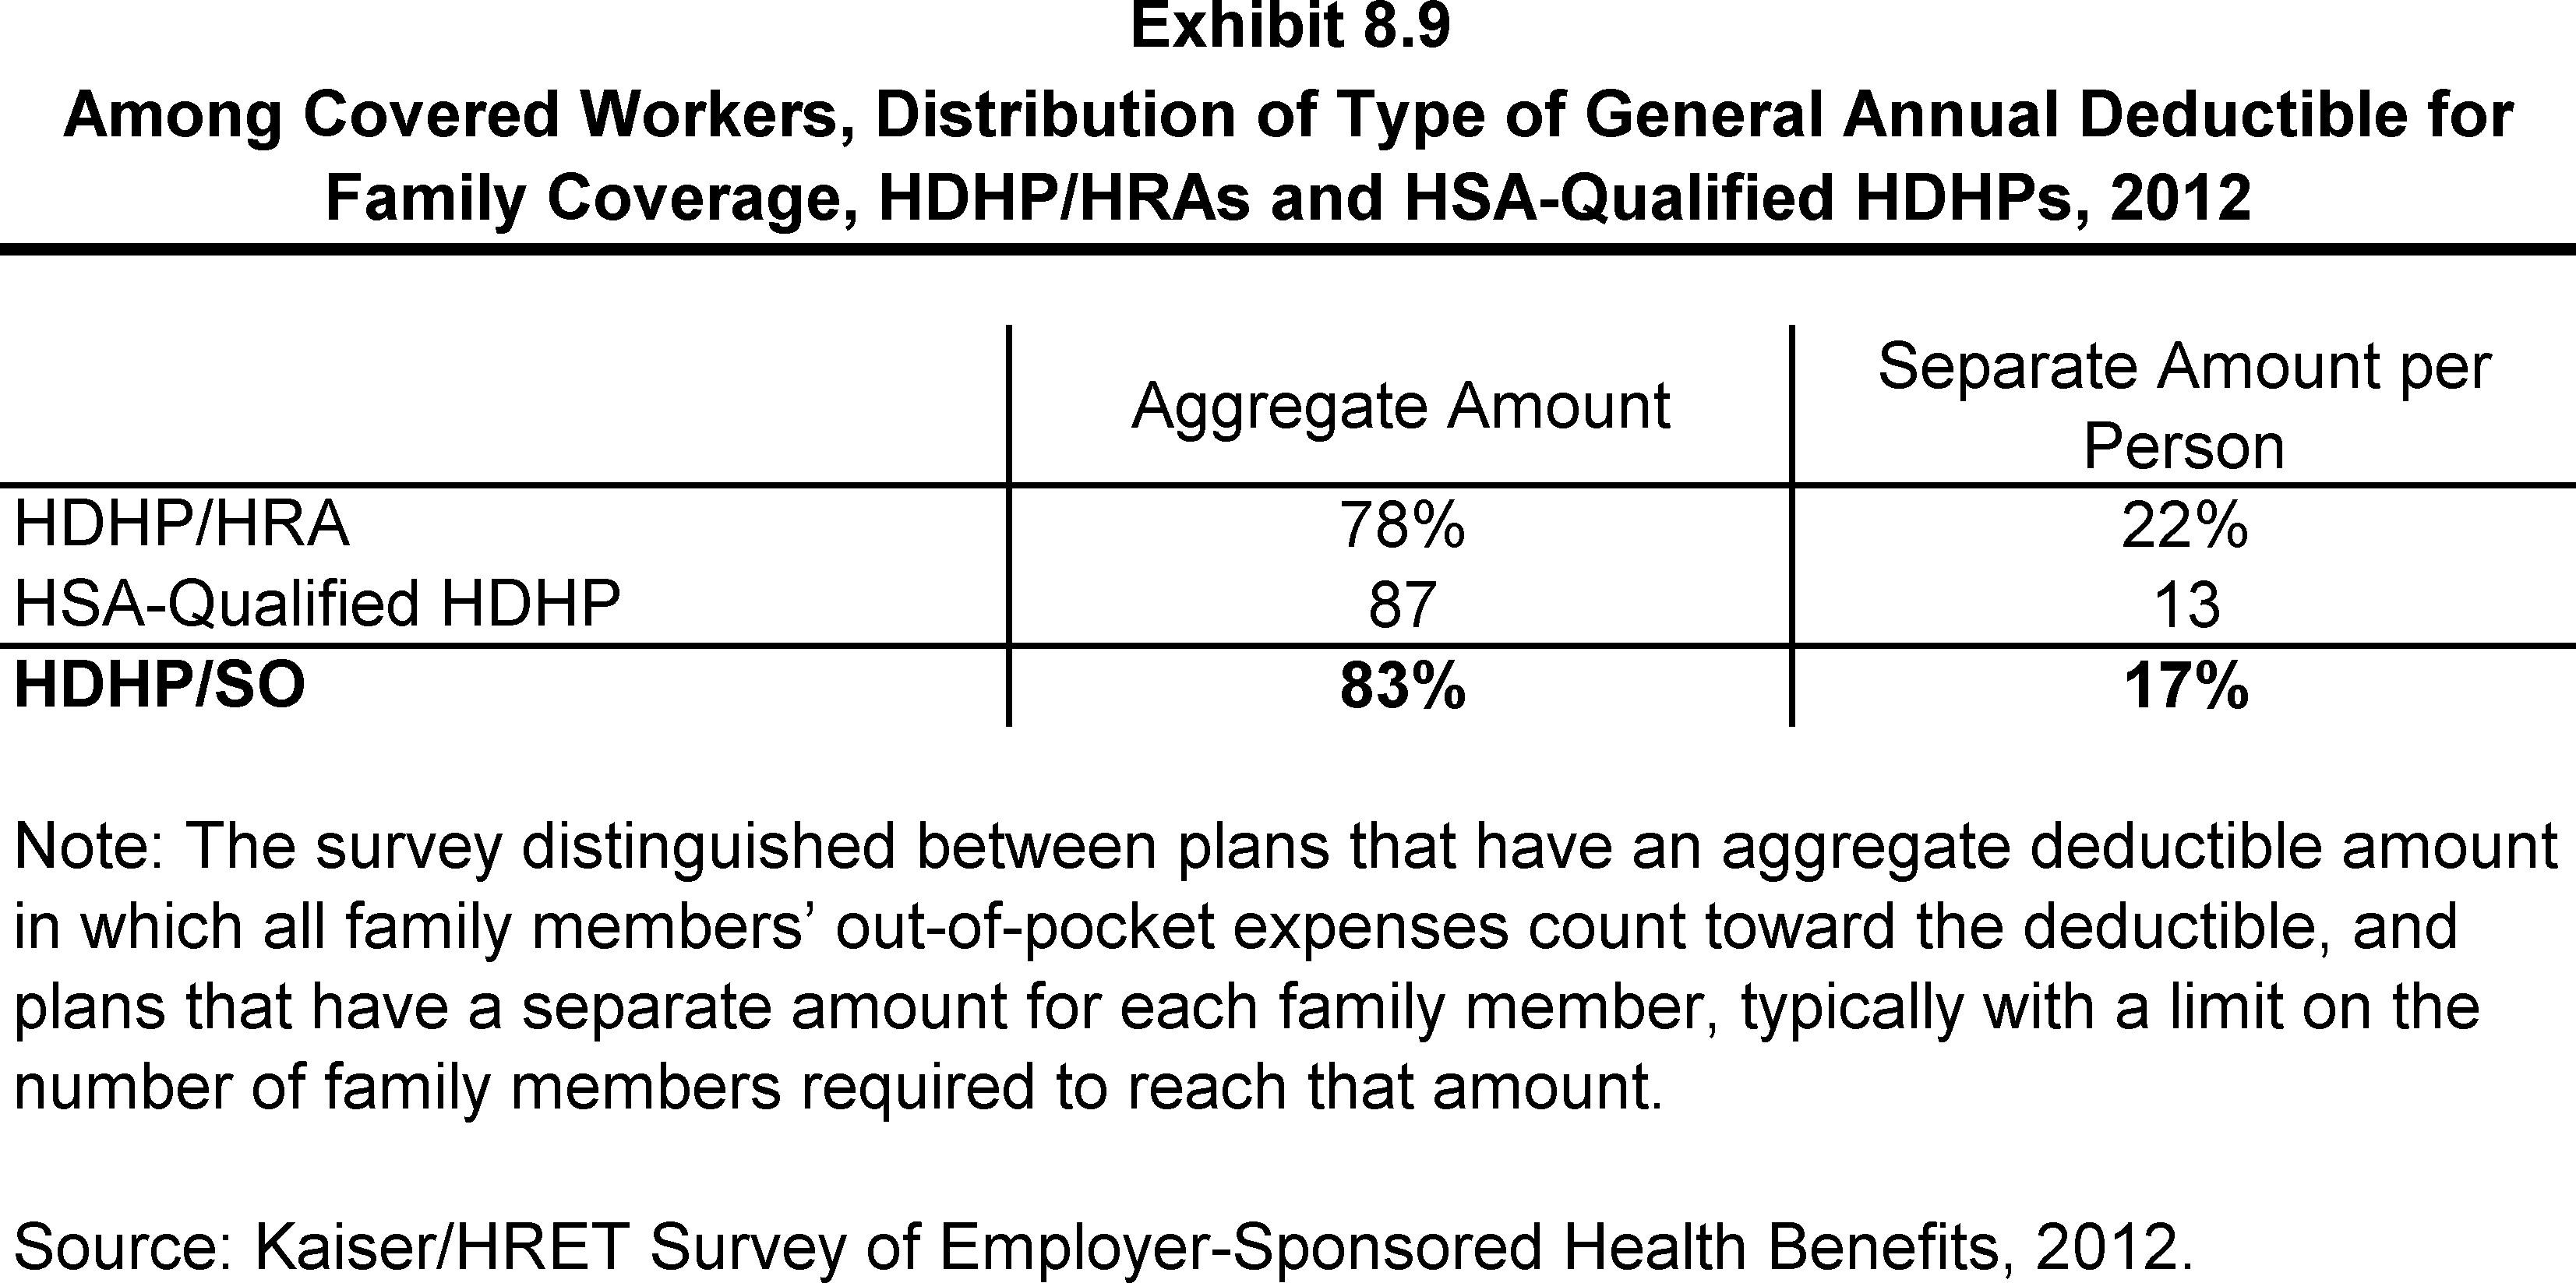
Among Covered Workers, Distribution of Type of General Annual Deductible for Family Coverage, HDHP/HRAs and HSA-Qualified HDHPs, 2012
Distribution of Covered Workers with the Following
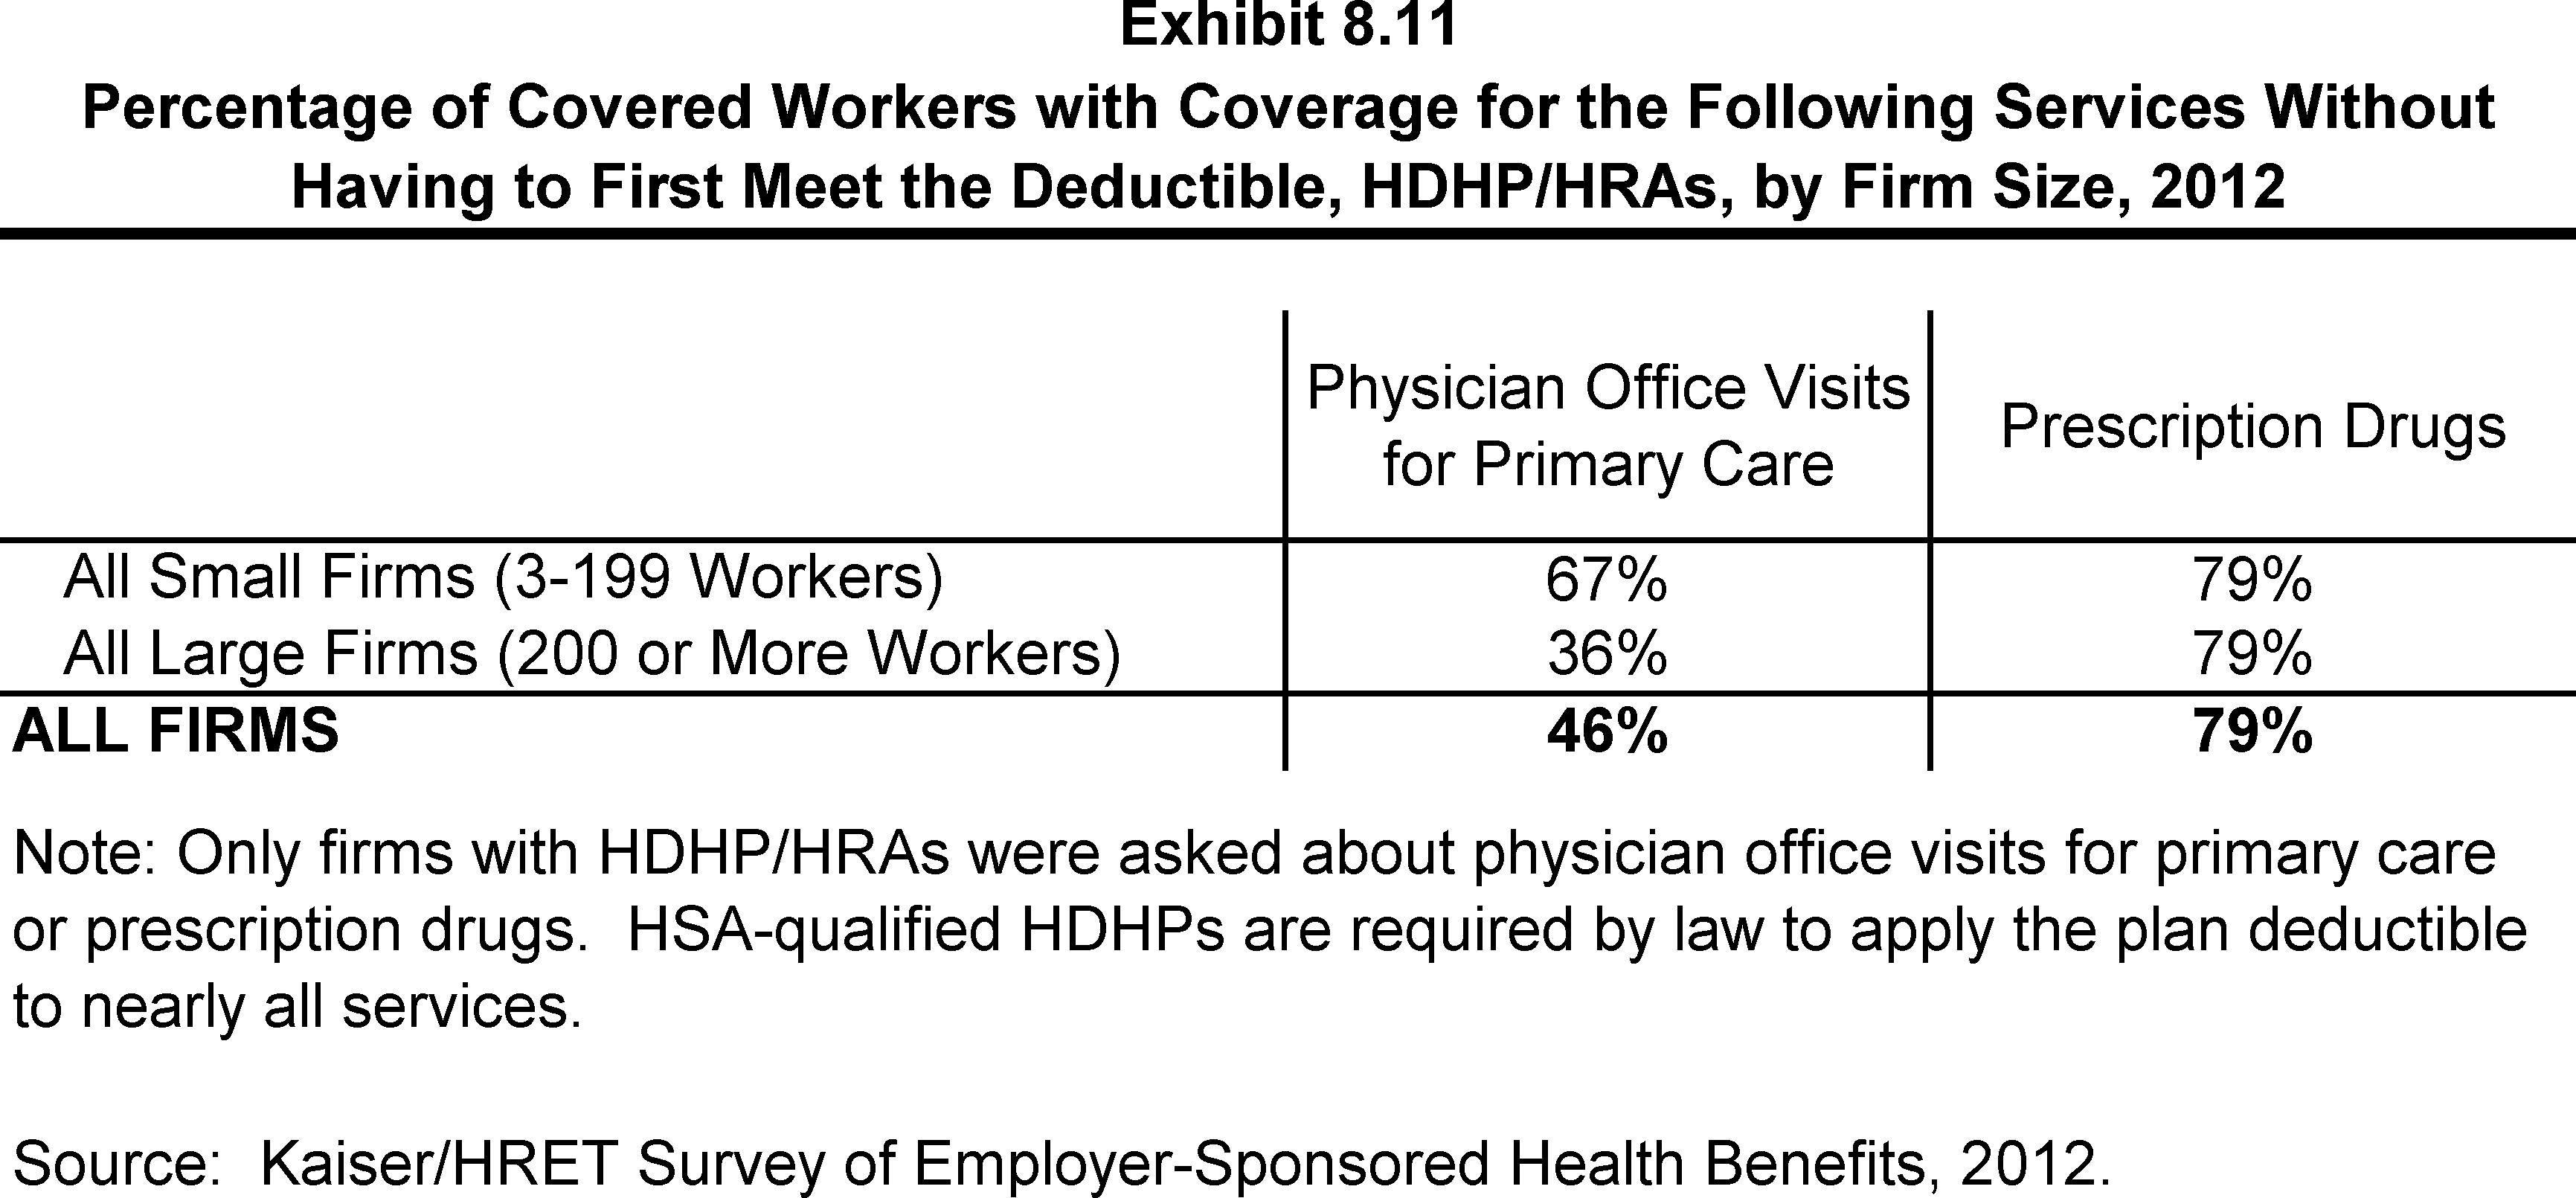
Percentage of Covered Workers with Coverage for the Following Services Without Having to First Meet the Deductible, HDHP/HRAs, by Firm Size, 2012
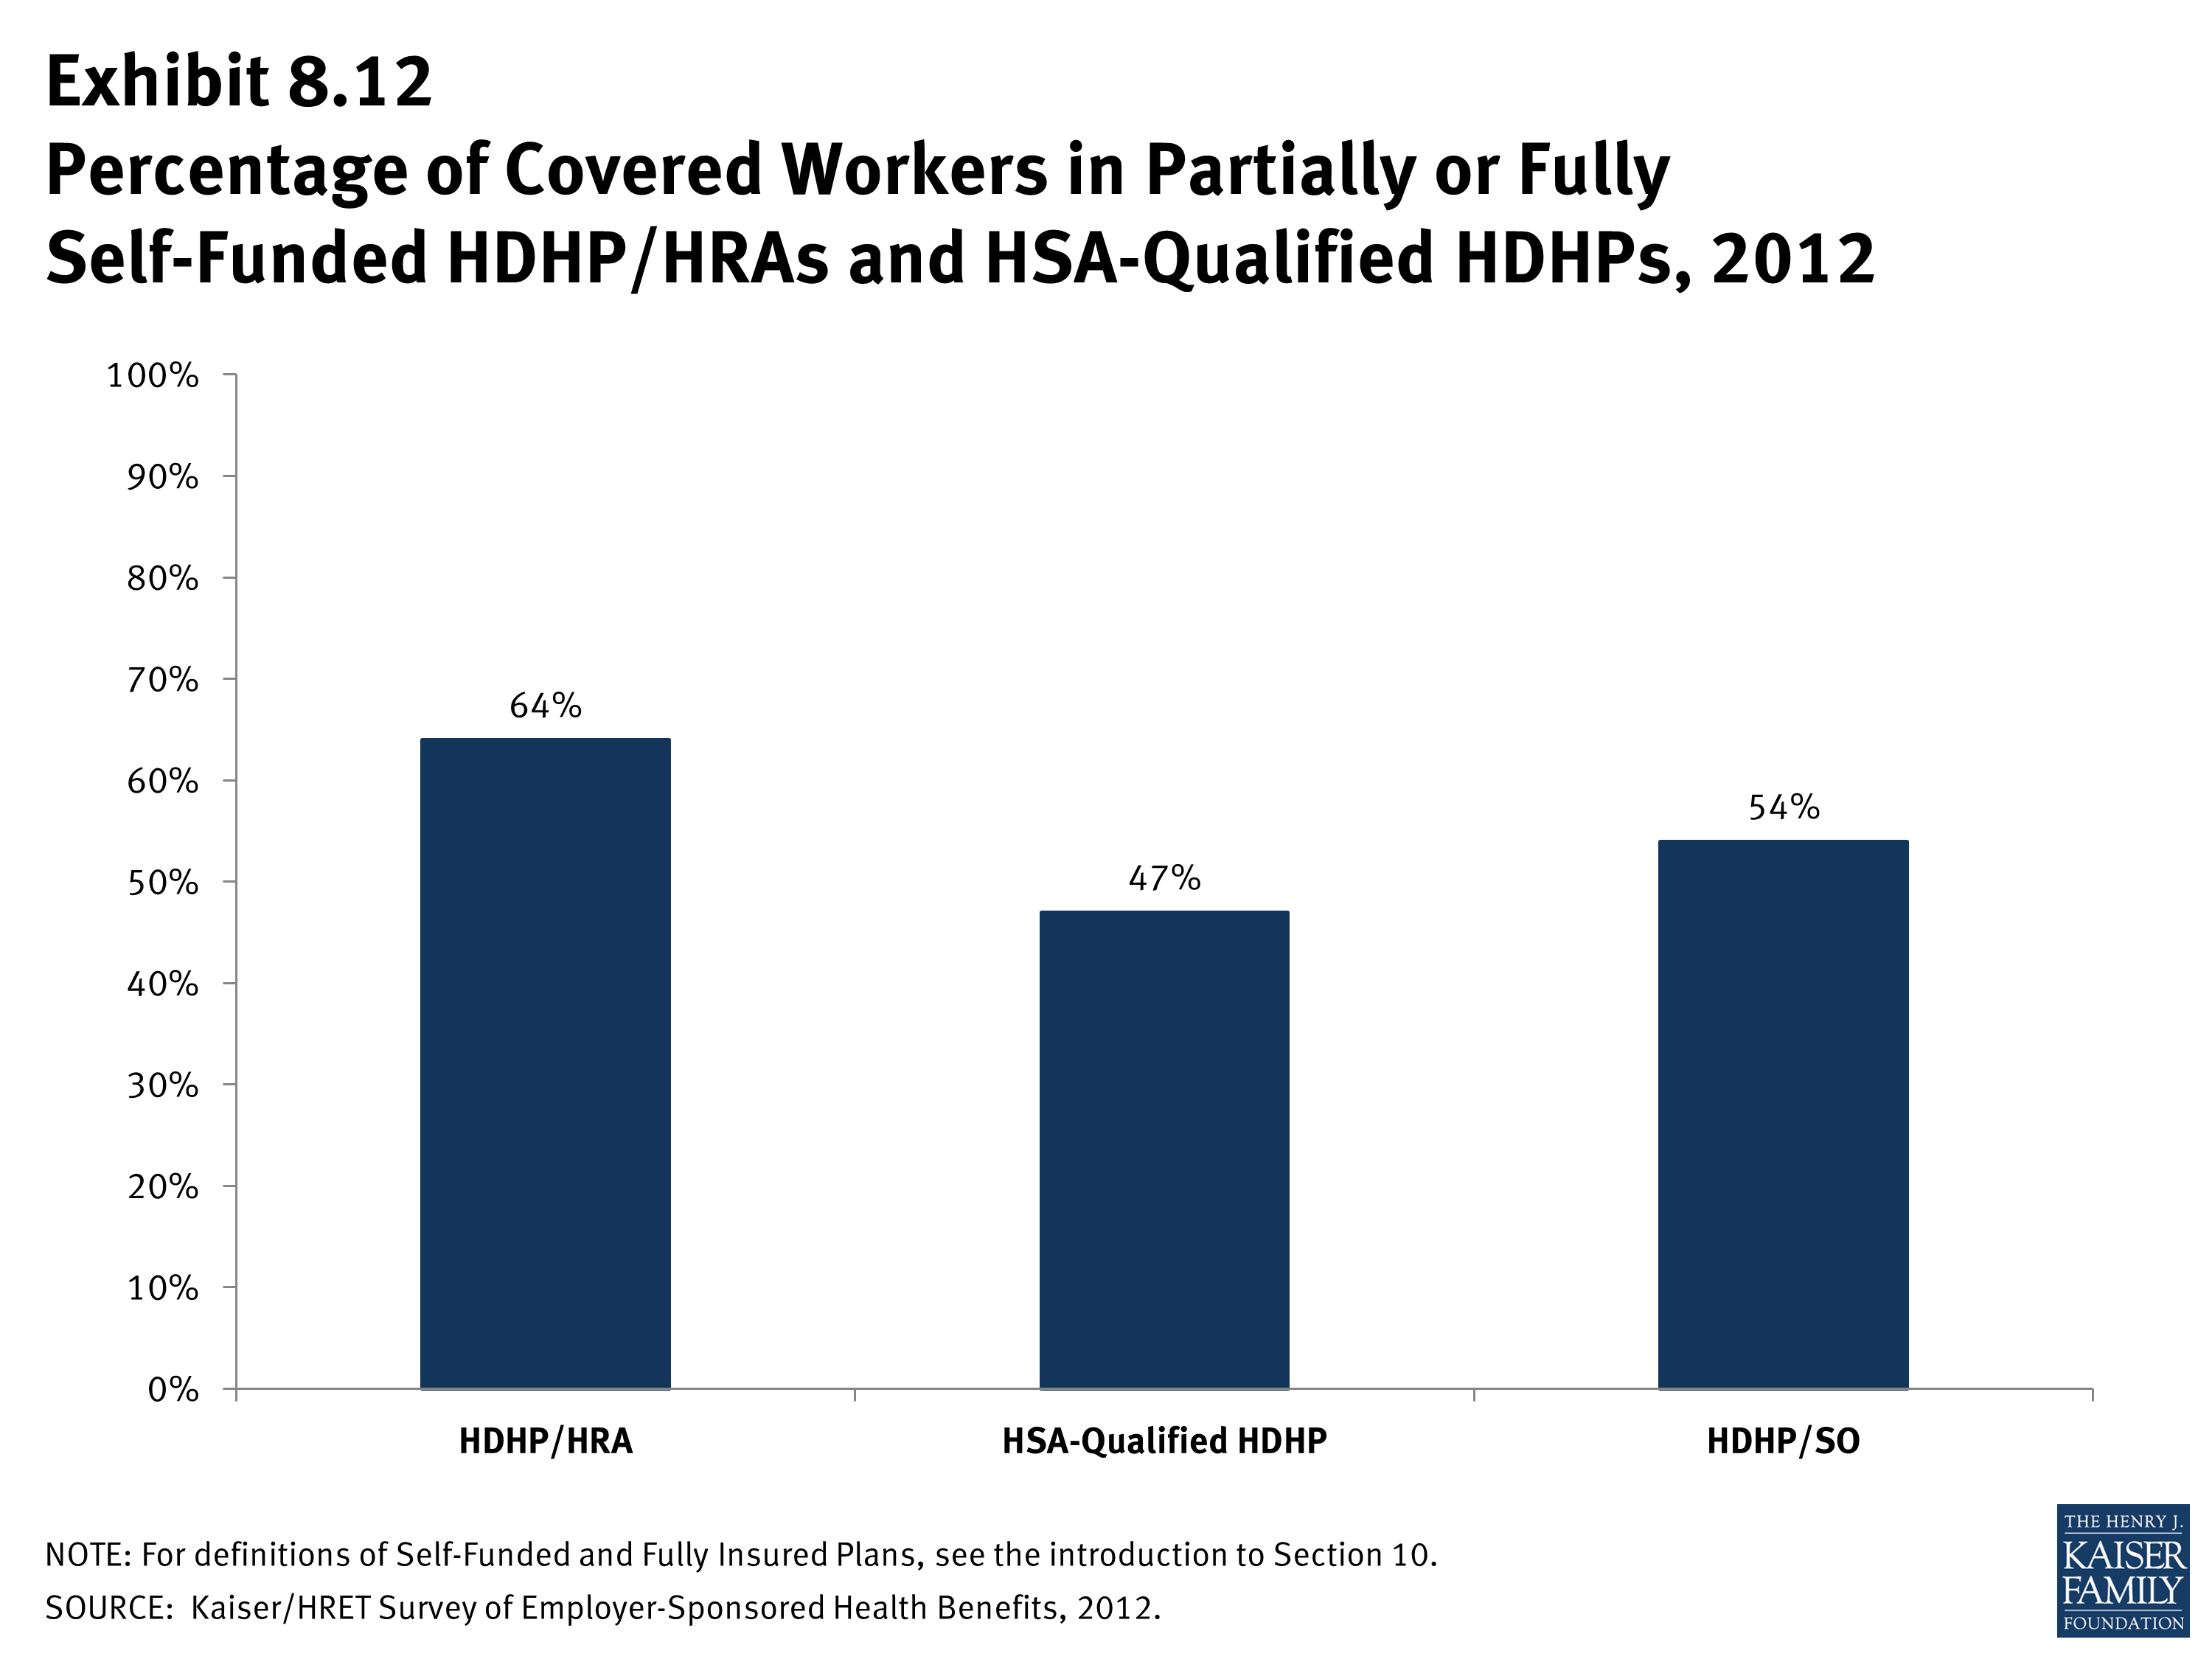
Percentage of Covered Workers in Partially or Fully
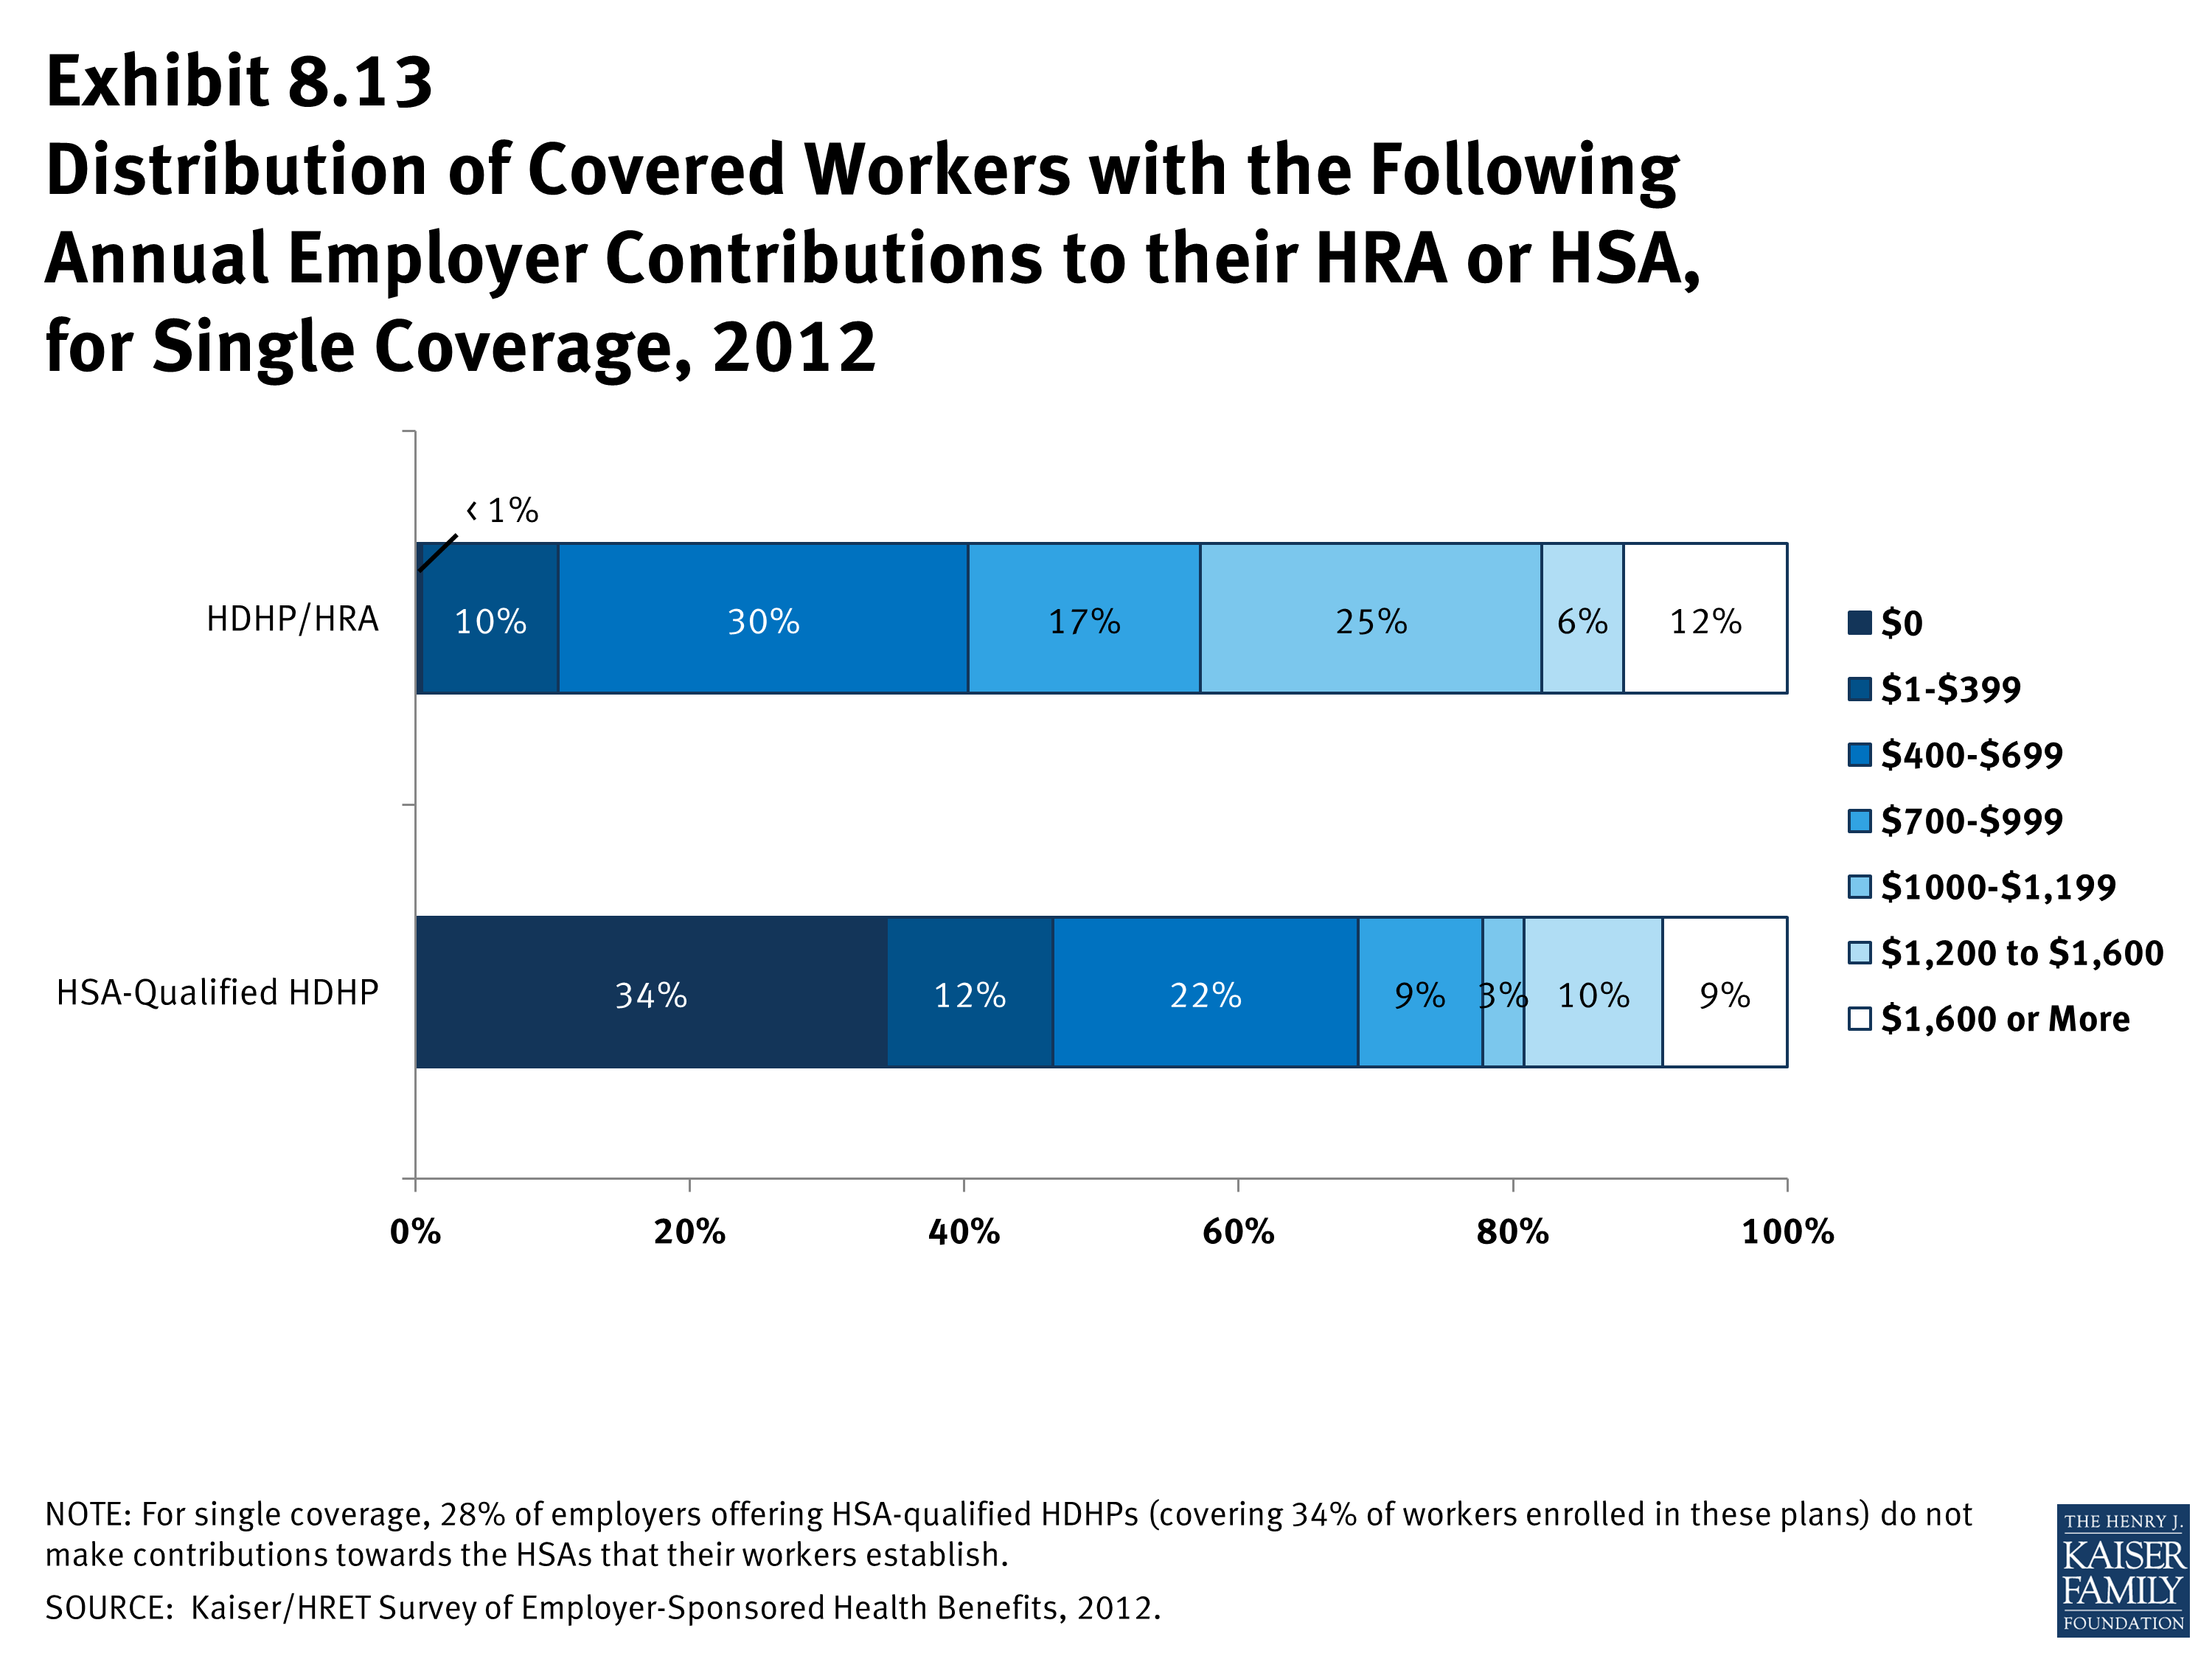
Distribution of Covered Workers with the Following
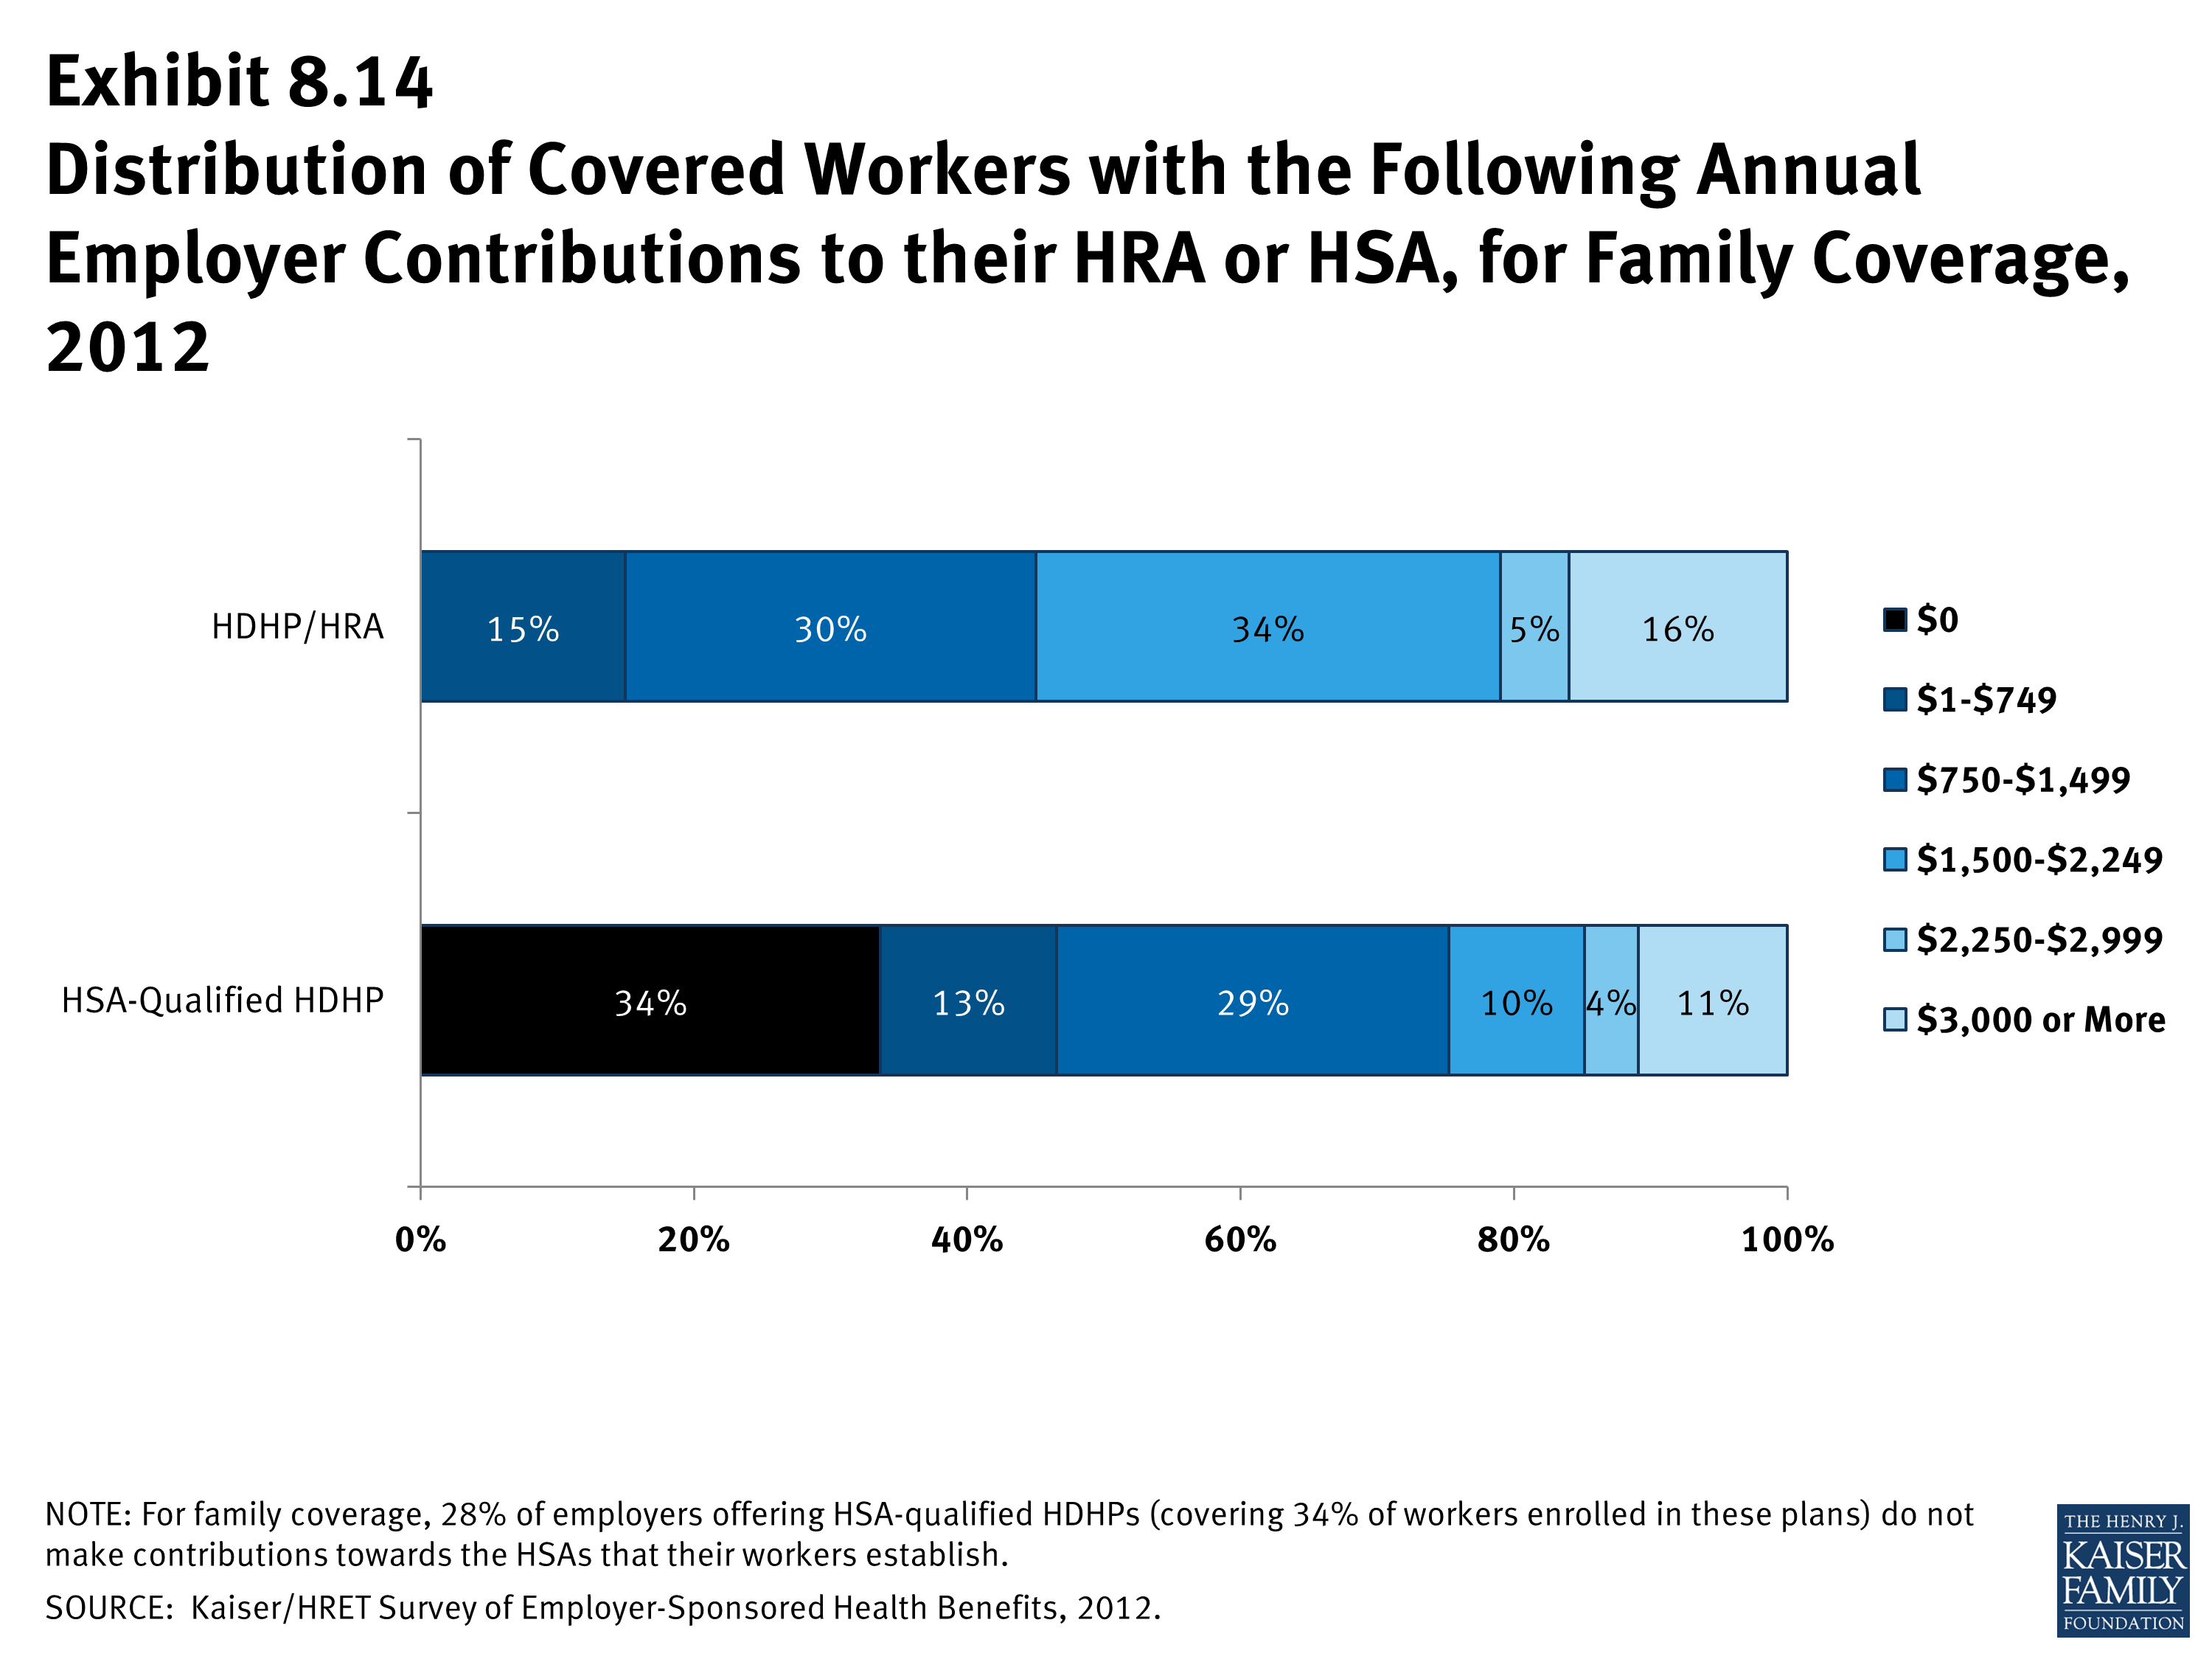
Distribution of Covered Workers with the Following Annual Employer Contributions to their HRA or HSA, for Family Coverage, 2012
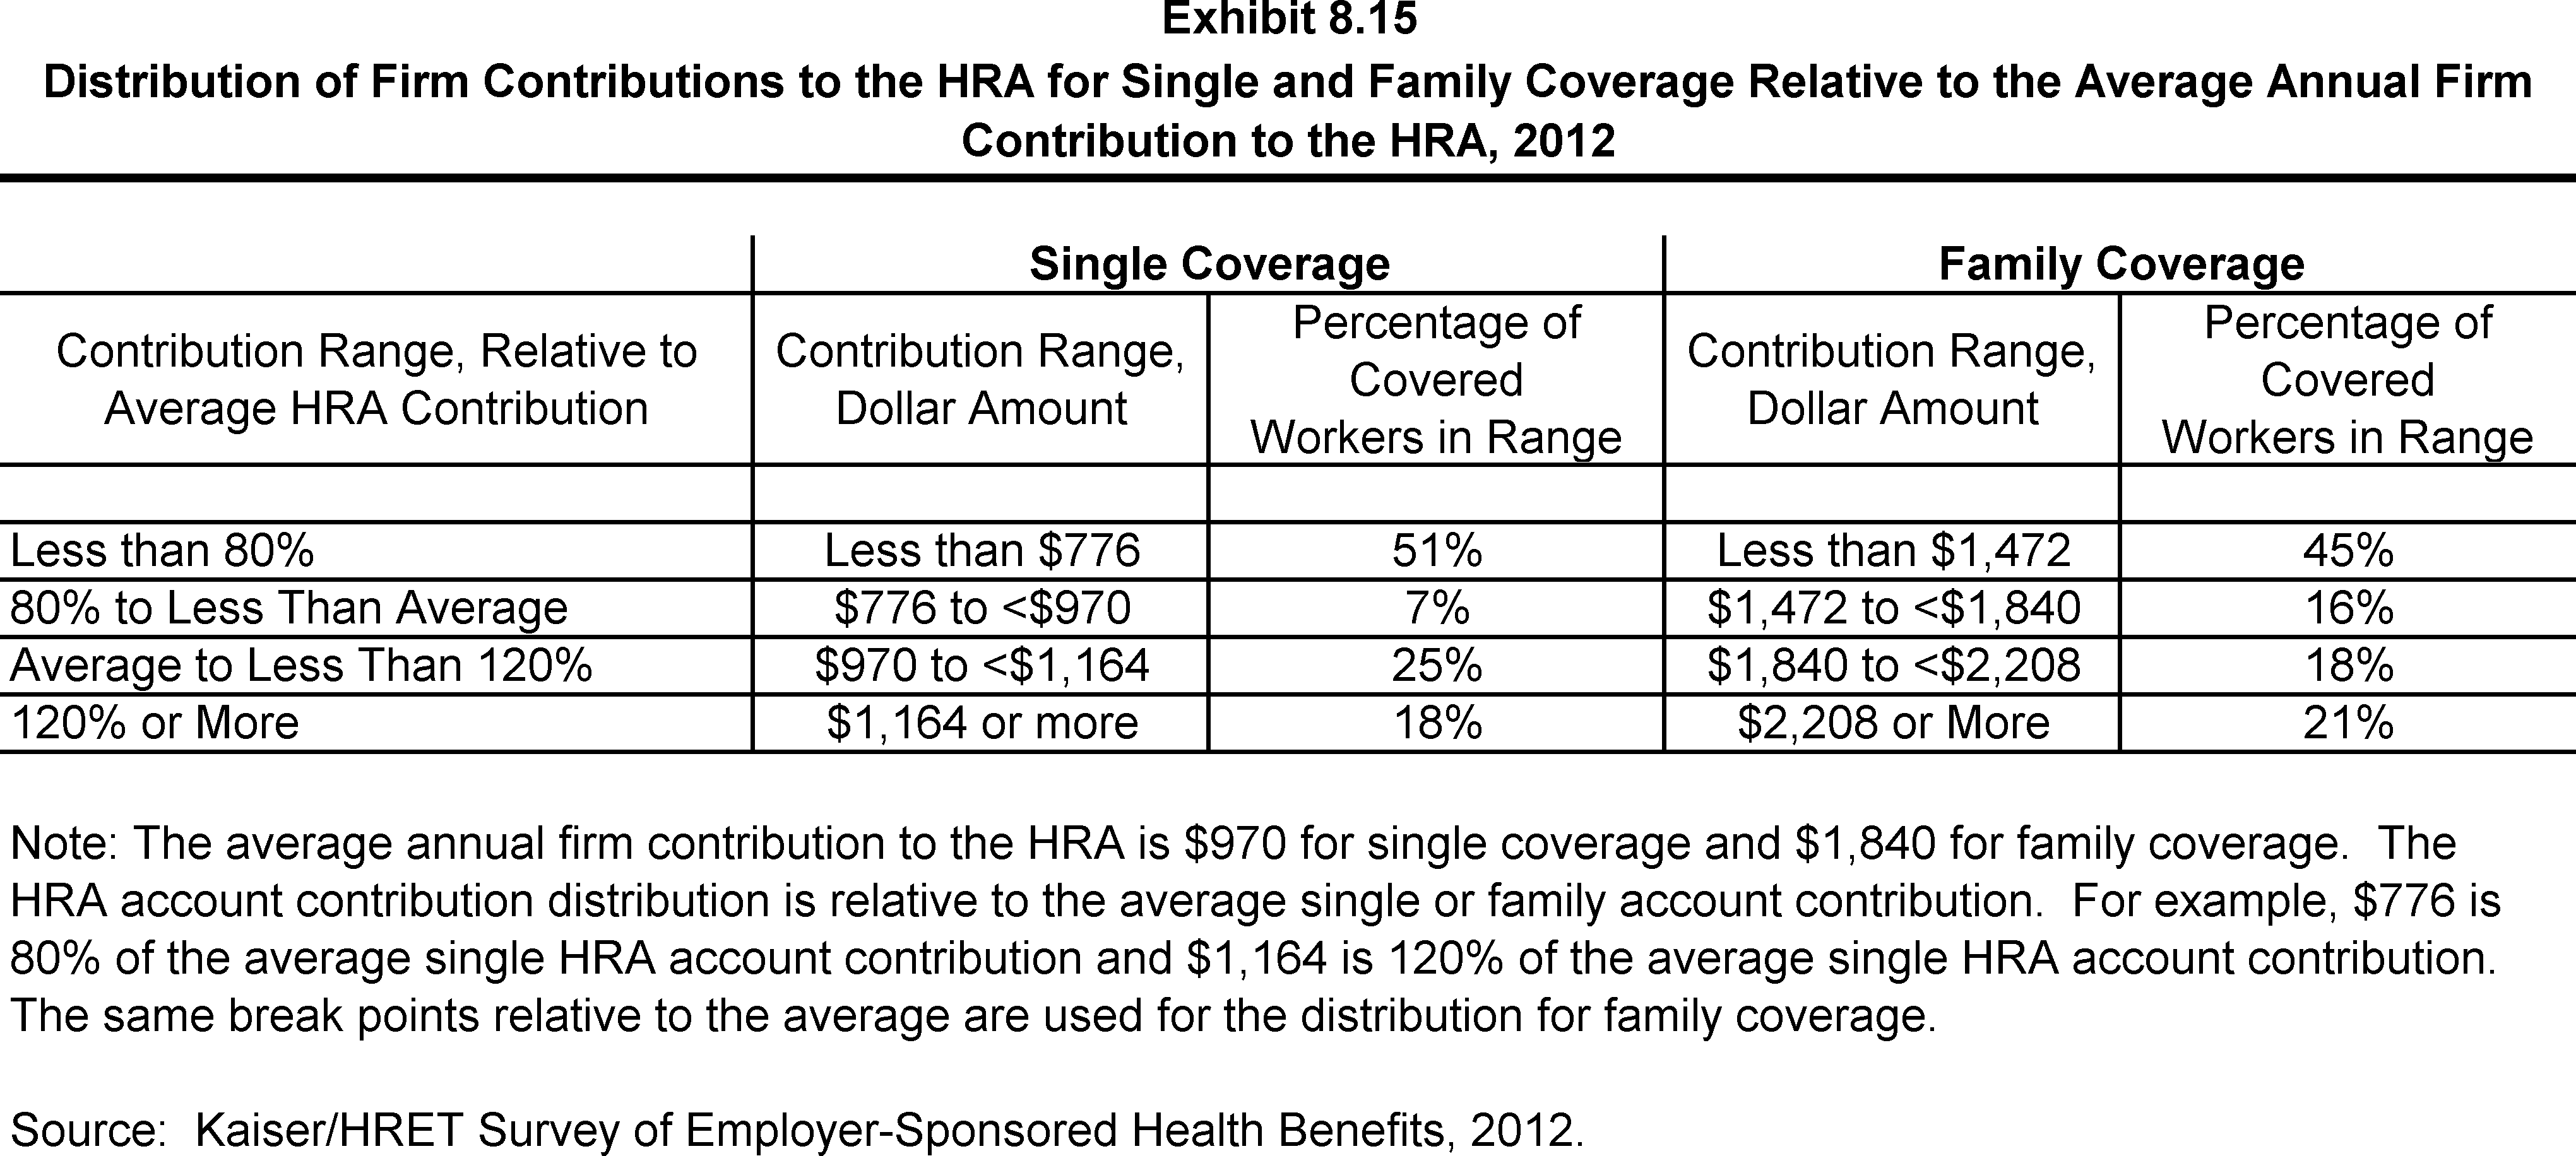
Distribution of Firm Contributions to the HRA for Single and Family Coverage Relative to the Average Annual Firm Contribution to the HRA, 2012
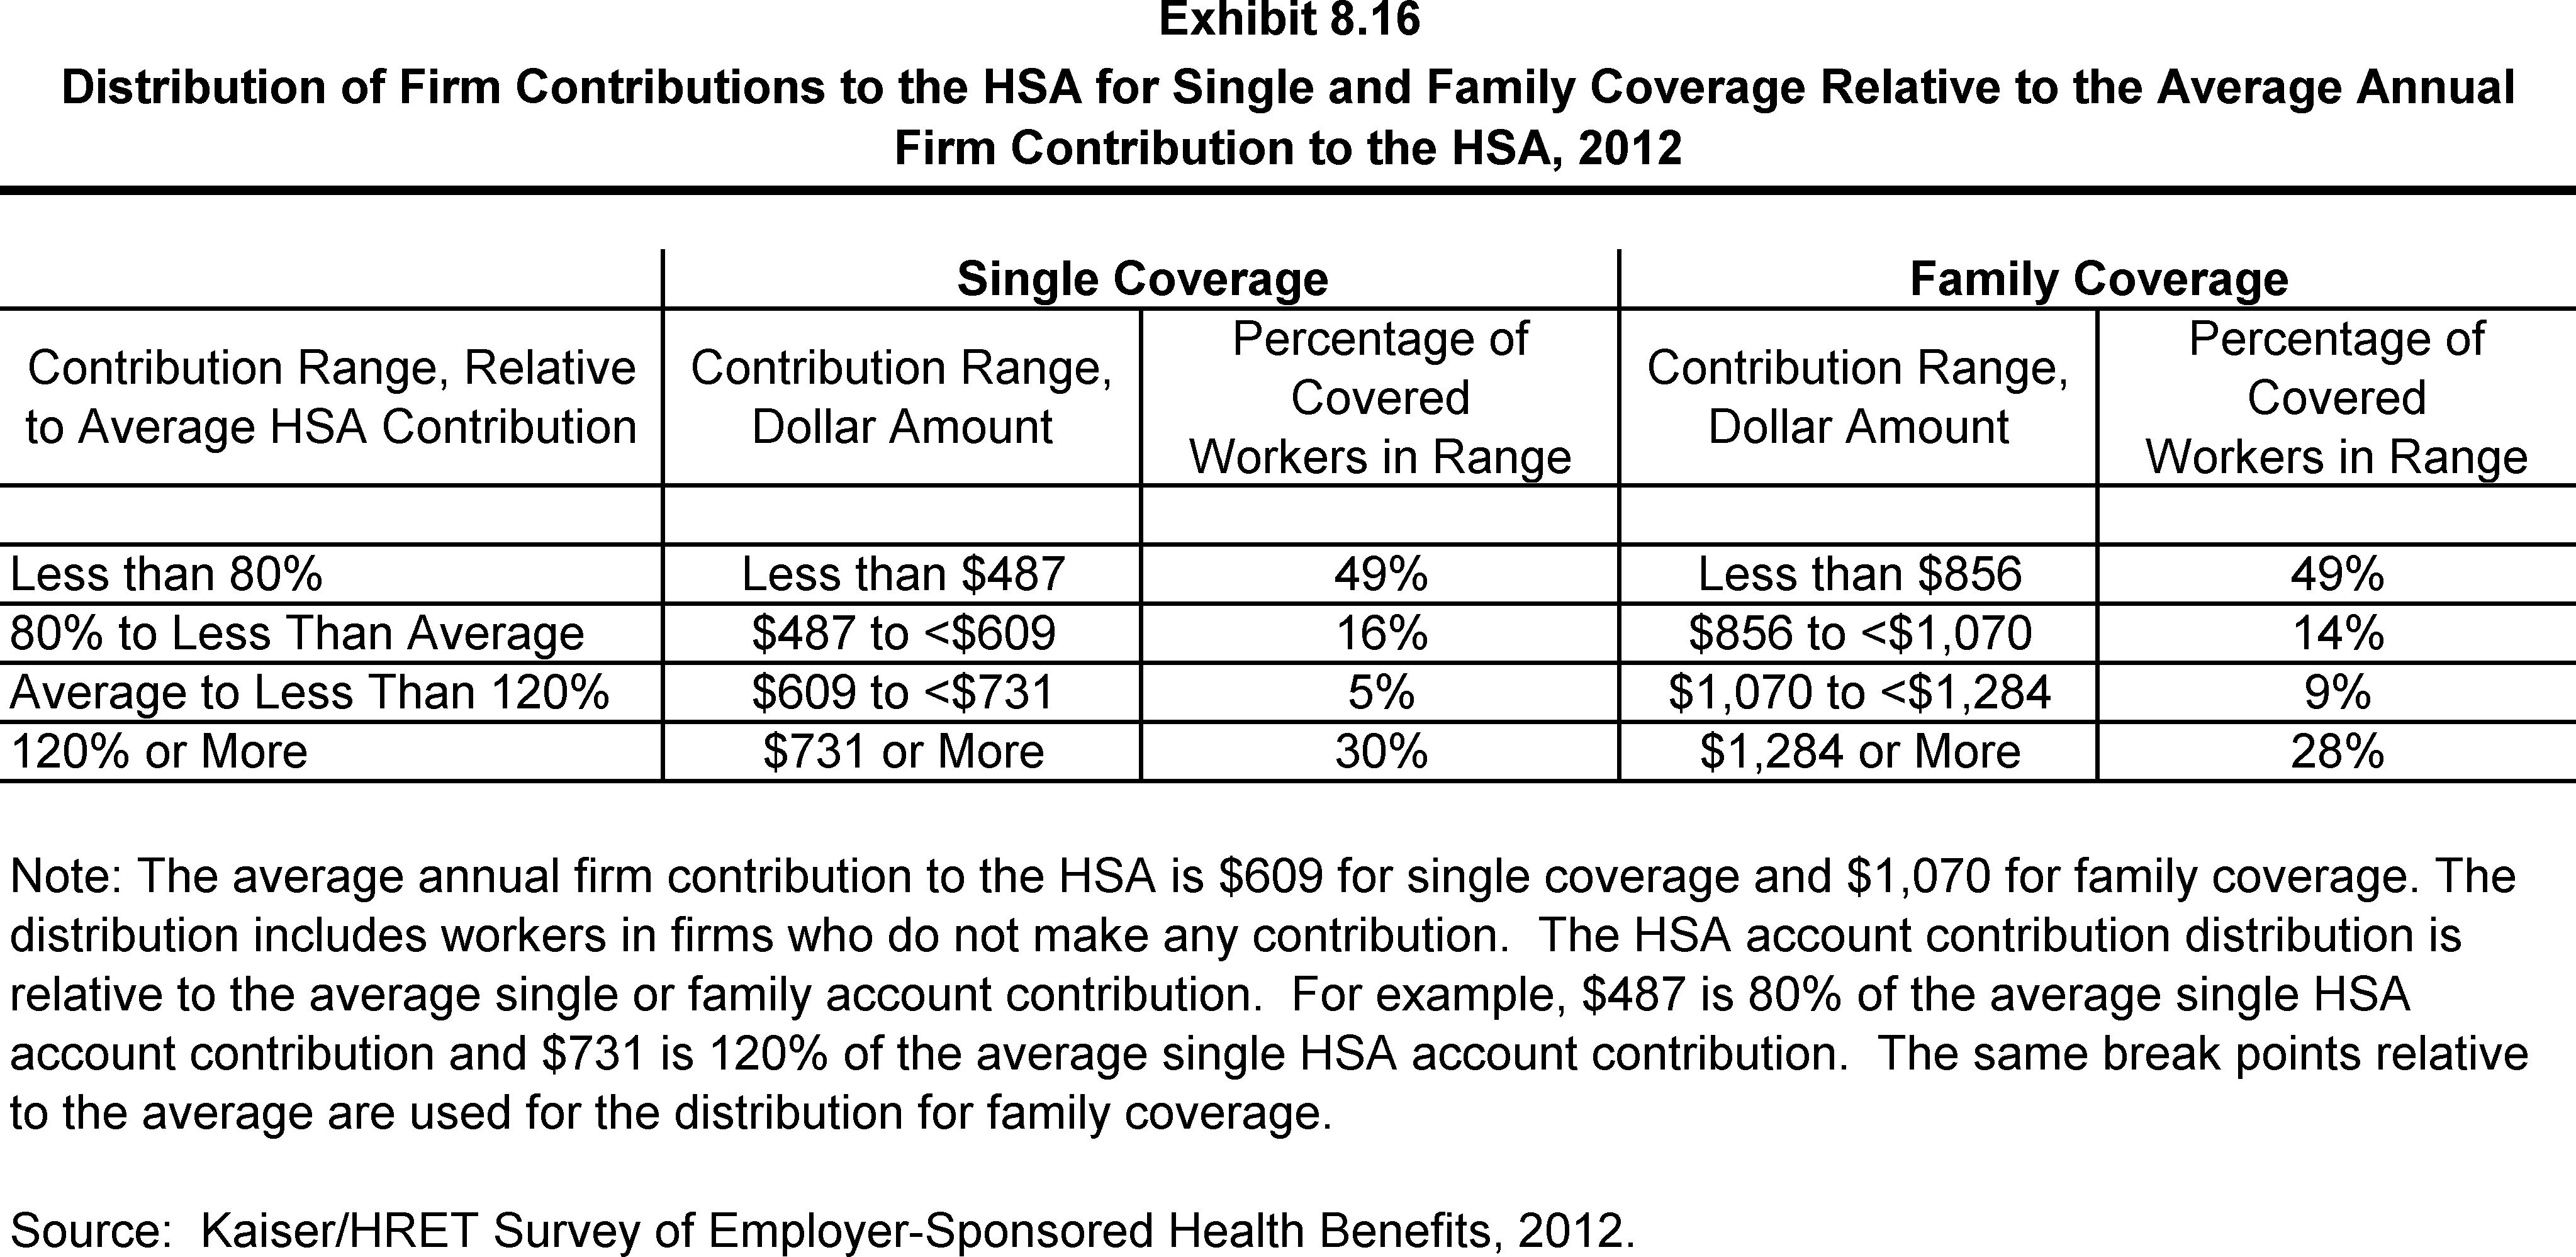
Distribution of Firm Contributions to the HSA for Single and Family Coverage Relative to the Average Annual Firm Contribution to the HSA, 2012
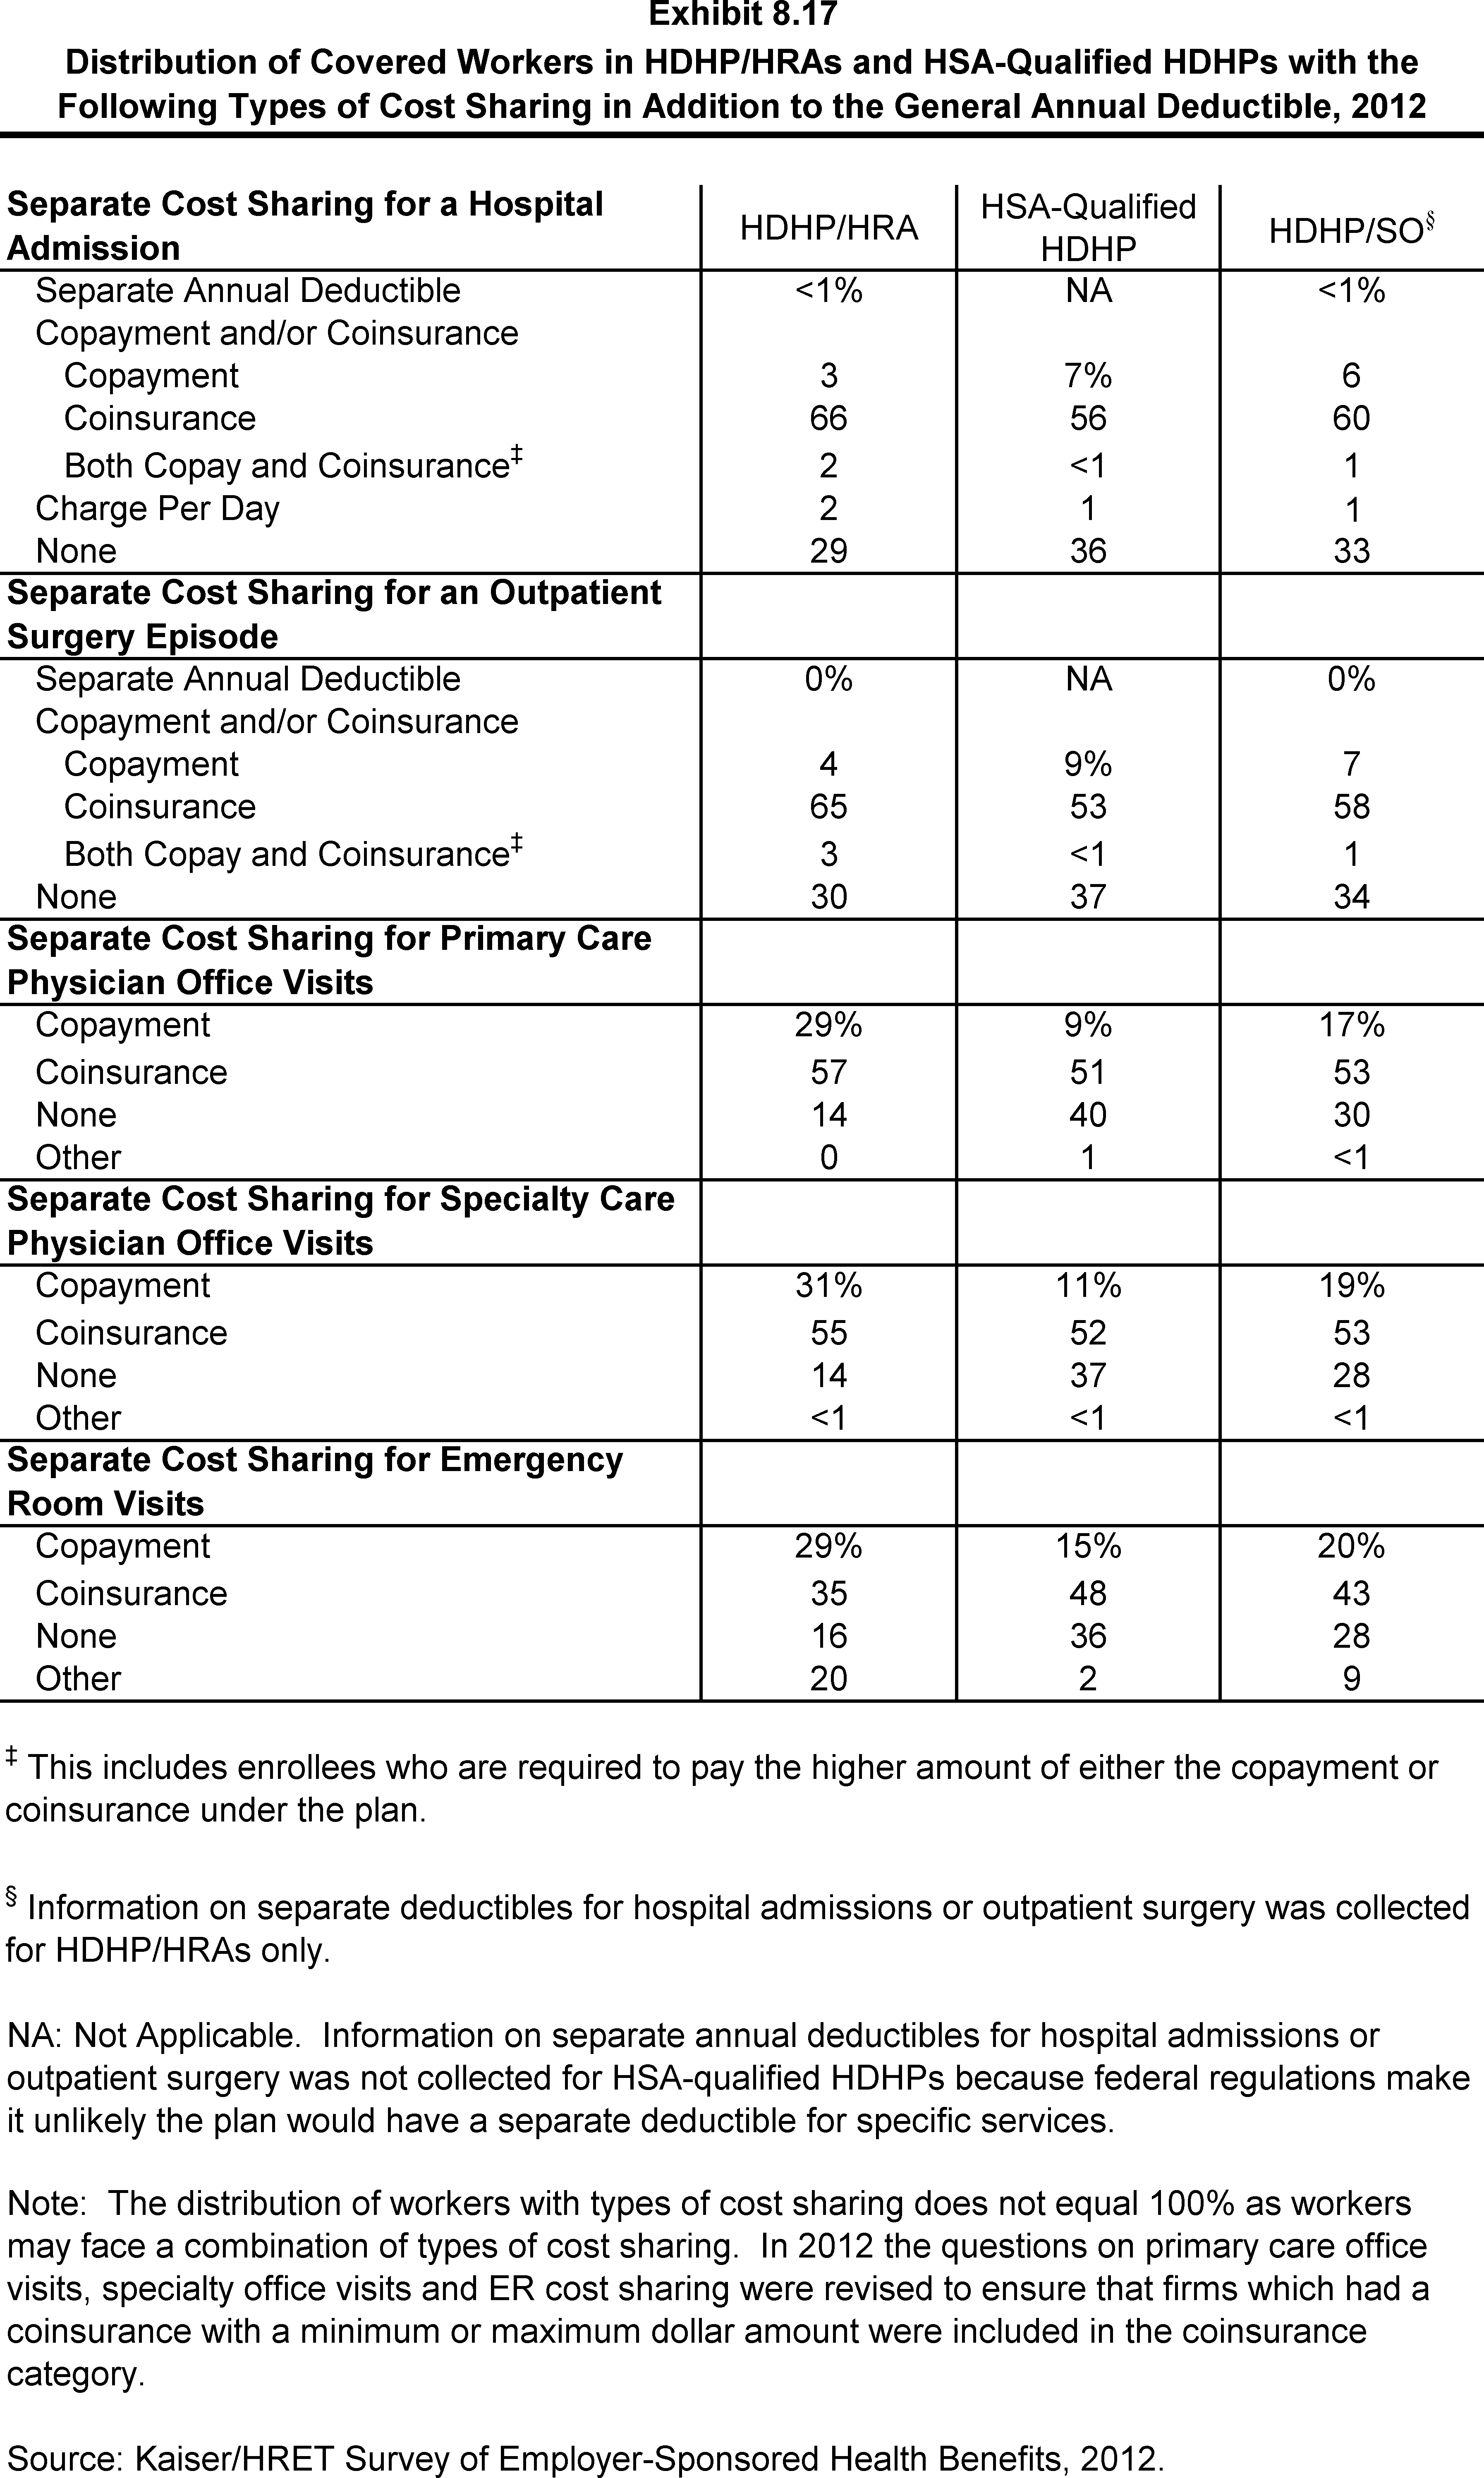
Distribution of Covered Workers in HDHP/HRAs and HSA-Qualified HDHPs with the Following Types of Cost Sharing in Addition to the General Annual Deductible, 2012
Section 9: Prescription Drug Benefits
Almost all covered workers have coverage for prescription drugs. More than three in four covered workers are in plans with three or more cost-sharing tiers for prescription drugs. Copayments rather than coinsurance continue to be the dominant form of cost sharing for prescription drugs.
- As in prior years, nearly all (99%) covered workers in employer-sponsored plans have a prescription drug benefit.
- A large majority of covered workers (87%) in 2012 have a tiered cost-sharing formula for prescription drugs (Exhibit 9.1). Cost-sharing tiers generally refer to a health plan placing a drug on a formulary or preferred drug list, which classifies drugs as generic, preferred, or nonpreferred. Over the past years, an increasing number of plans have created a fourth tier of drug cost sharing, which may be used for lifestyle drugs or expensive biologics.
- Seventy-eight percent of covered workers are enrolled in plans with three, four, or more tiers of cost sharing for prescription drugs, a similar percentage as the last two years (Exhibit 9.1).
- HDHP/SOs have different cost-sharing patterns for prescription drugs than other plan types. Only 55% of covered workers in HDHP/SOs are in a plan with three or more tiers of cost sharing for prescription drugs; 19% are in plans that pay 100% of prescription costs once the plan deductible is met (Exhibit 9.2).
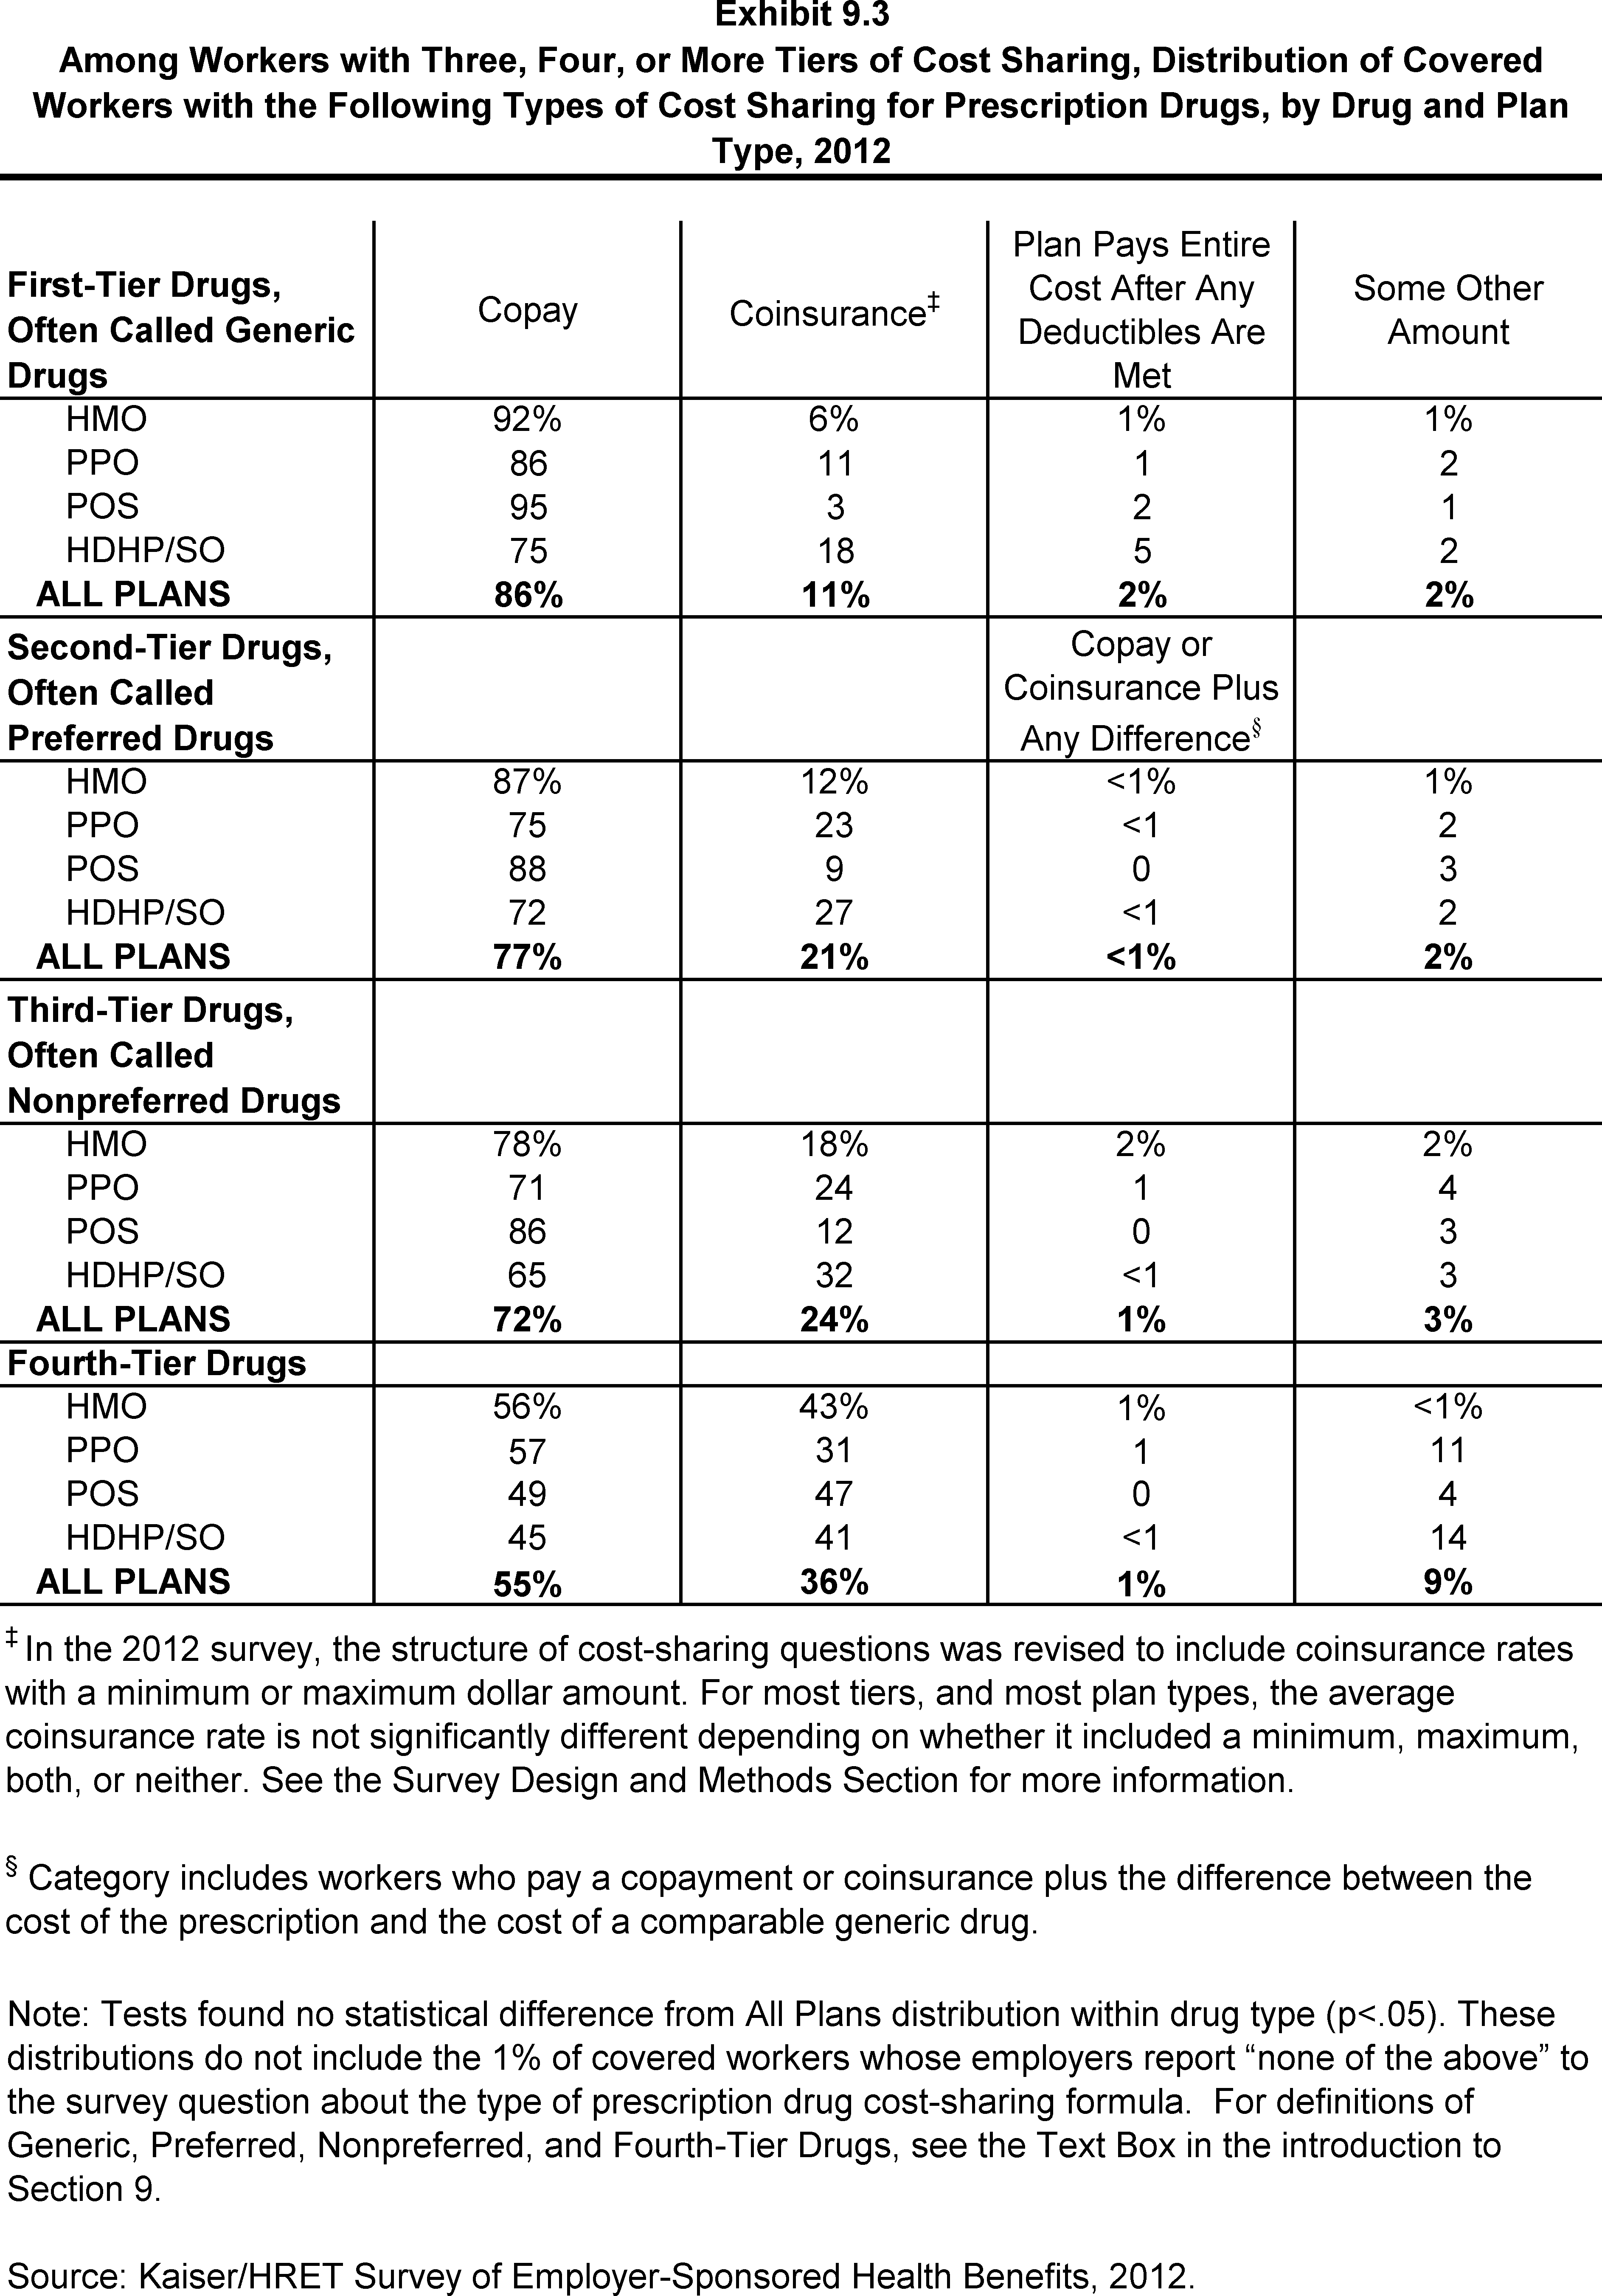
- Among workers covered by plans with three or more tiers of cost sharing for prescription drugs, a large majority face copayments rather than coinsurance (Exhibit 9.3). The percentages differ slightly across drug types because some plans have copayments for some drug tiers and coinsurance for other drug tiers.
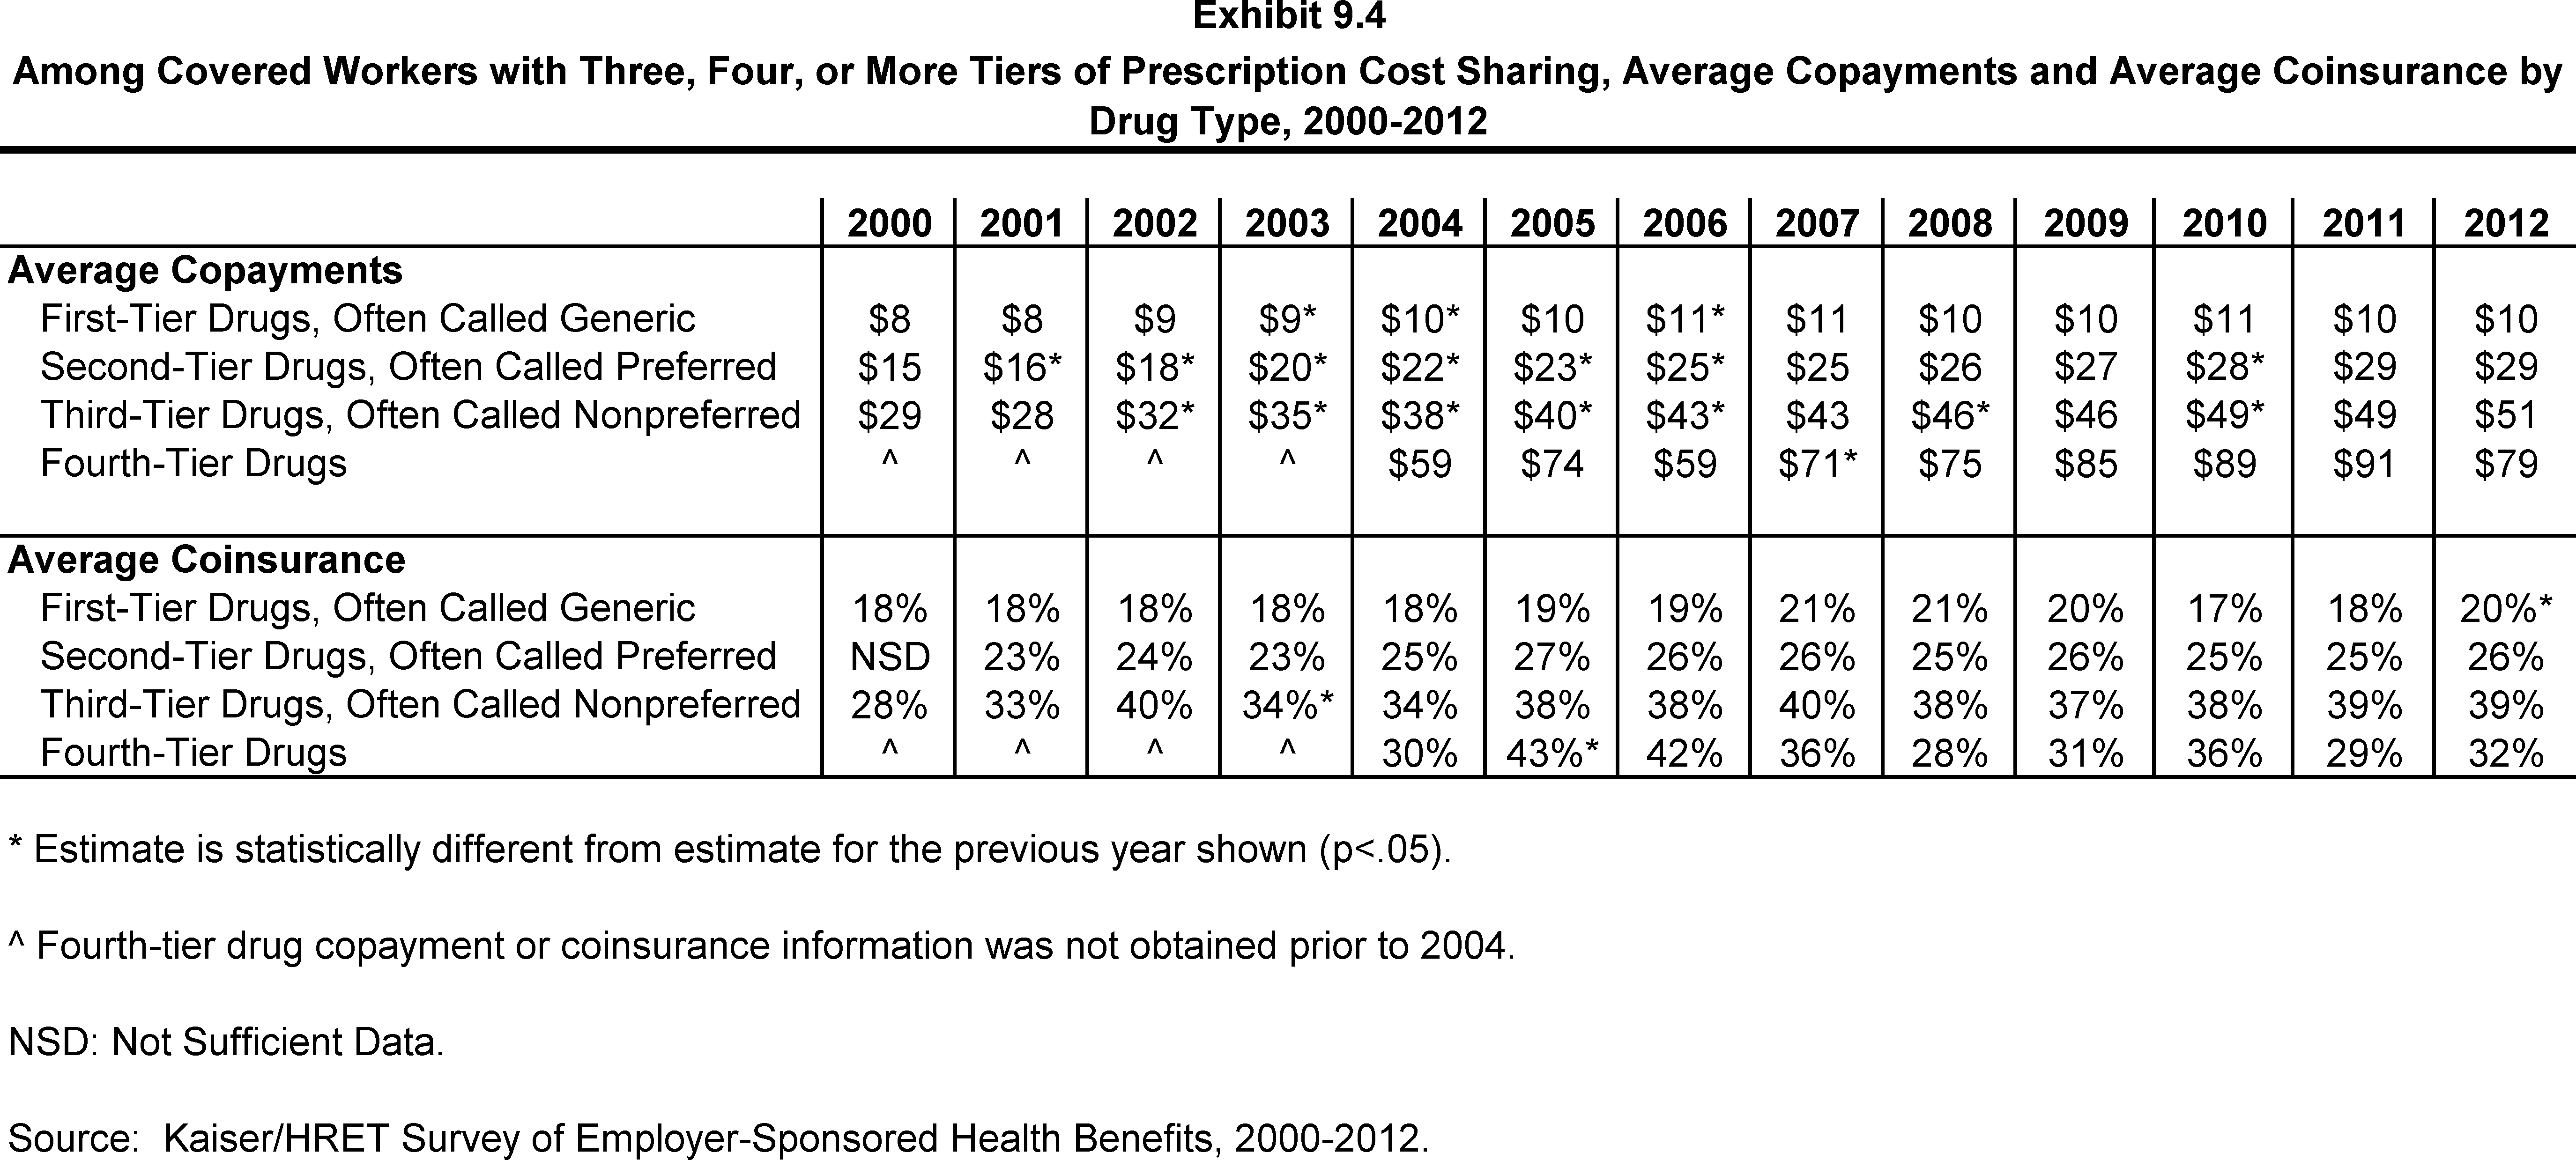
- For covered workers in plans with three, four, or more tiers of cost sharing for prescription drugs, the average drug copayments for first-tier drugs ($10) and second-tier drugs ($29), third-tier drugs ($51), and fourth-tier ($79) are comparable to the amounts reported in 2011 ($10, $29, $49, and $91, respectively) (Exhibit 9.4).
- For covered workers in plans with three, four, or more tiers of cost sharing for prescription drugs who face coinsurance rather than copayments, coinsurance levels average 20% for first-tier drugs, 26% for second-tier drugs, and 39% for third-tier drugs. All of the estimates are similar to last year except for the average coinsurance for first-tier drugs (20%) which is statistically different from 2011 (18%) (Exhibit 9.4).
- Fourteen percent of covered workers are in a plan that has four or more tiers of cost sharing for prescription drugs (Exhibit 9.1). For covered workers in plans with three or more cost-sharing tiers, 55% face a copayment for fourth-tier drugs and 36% face coinsurance (Exhibit 9.3).
- The average copayment for a fourth-tier drug is $79 and the average coinsurance is 32%. These amounts are not statistically different from the amounts reported in 2011 (Exhibit 9.4).
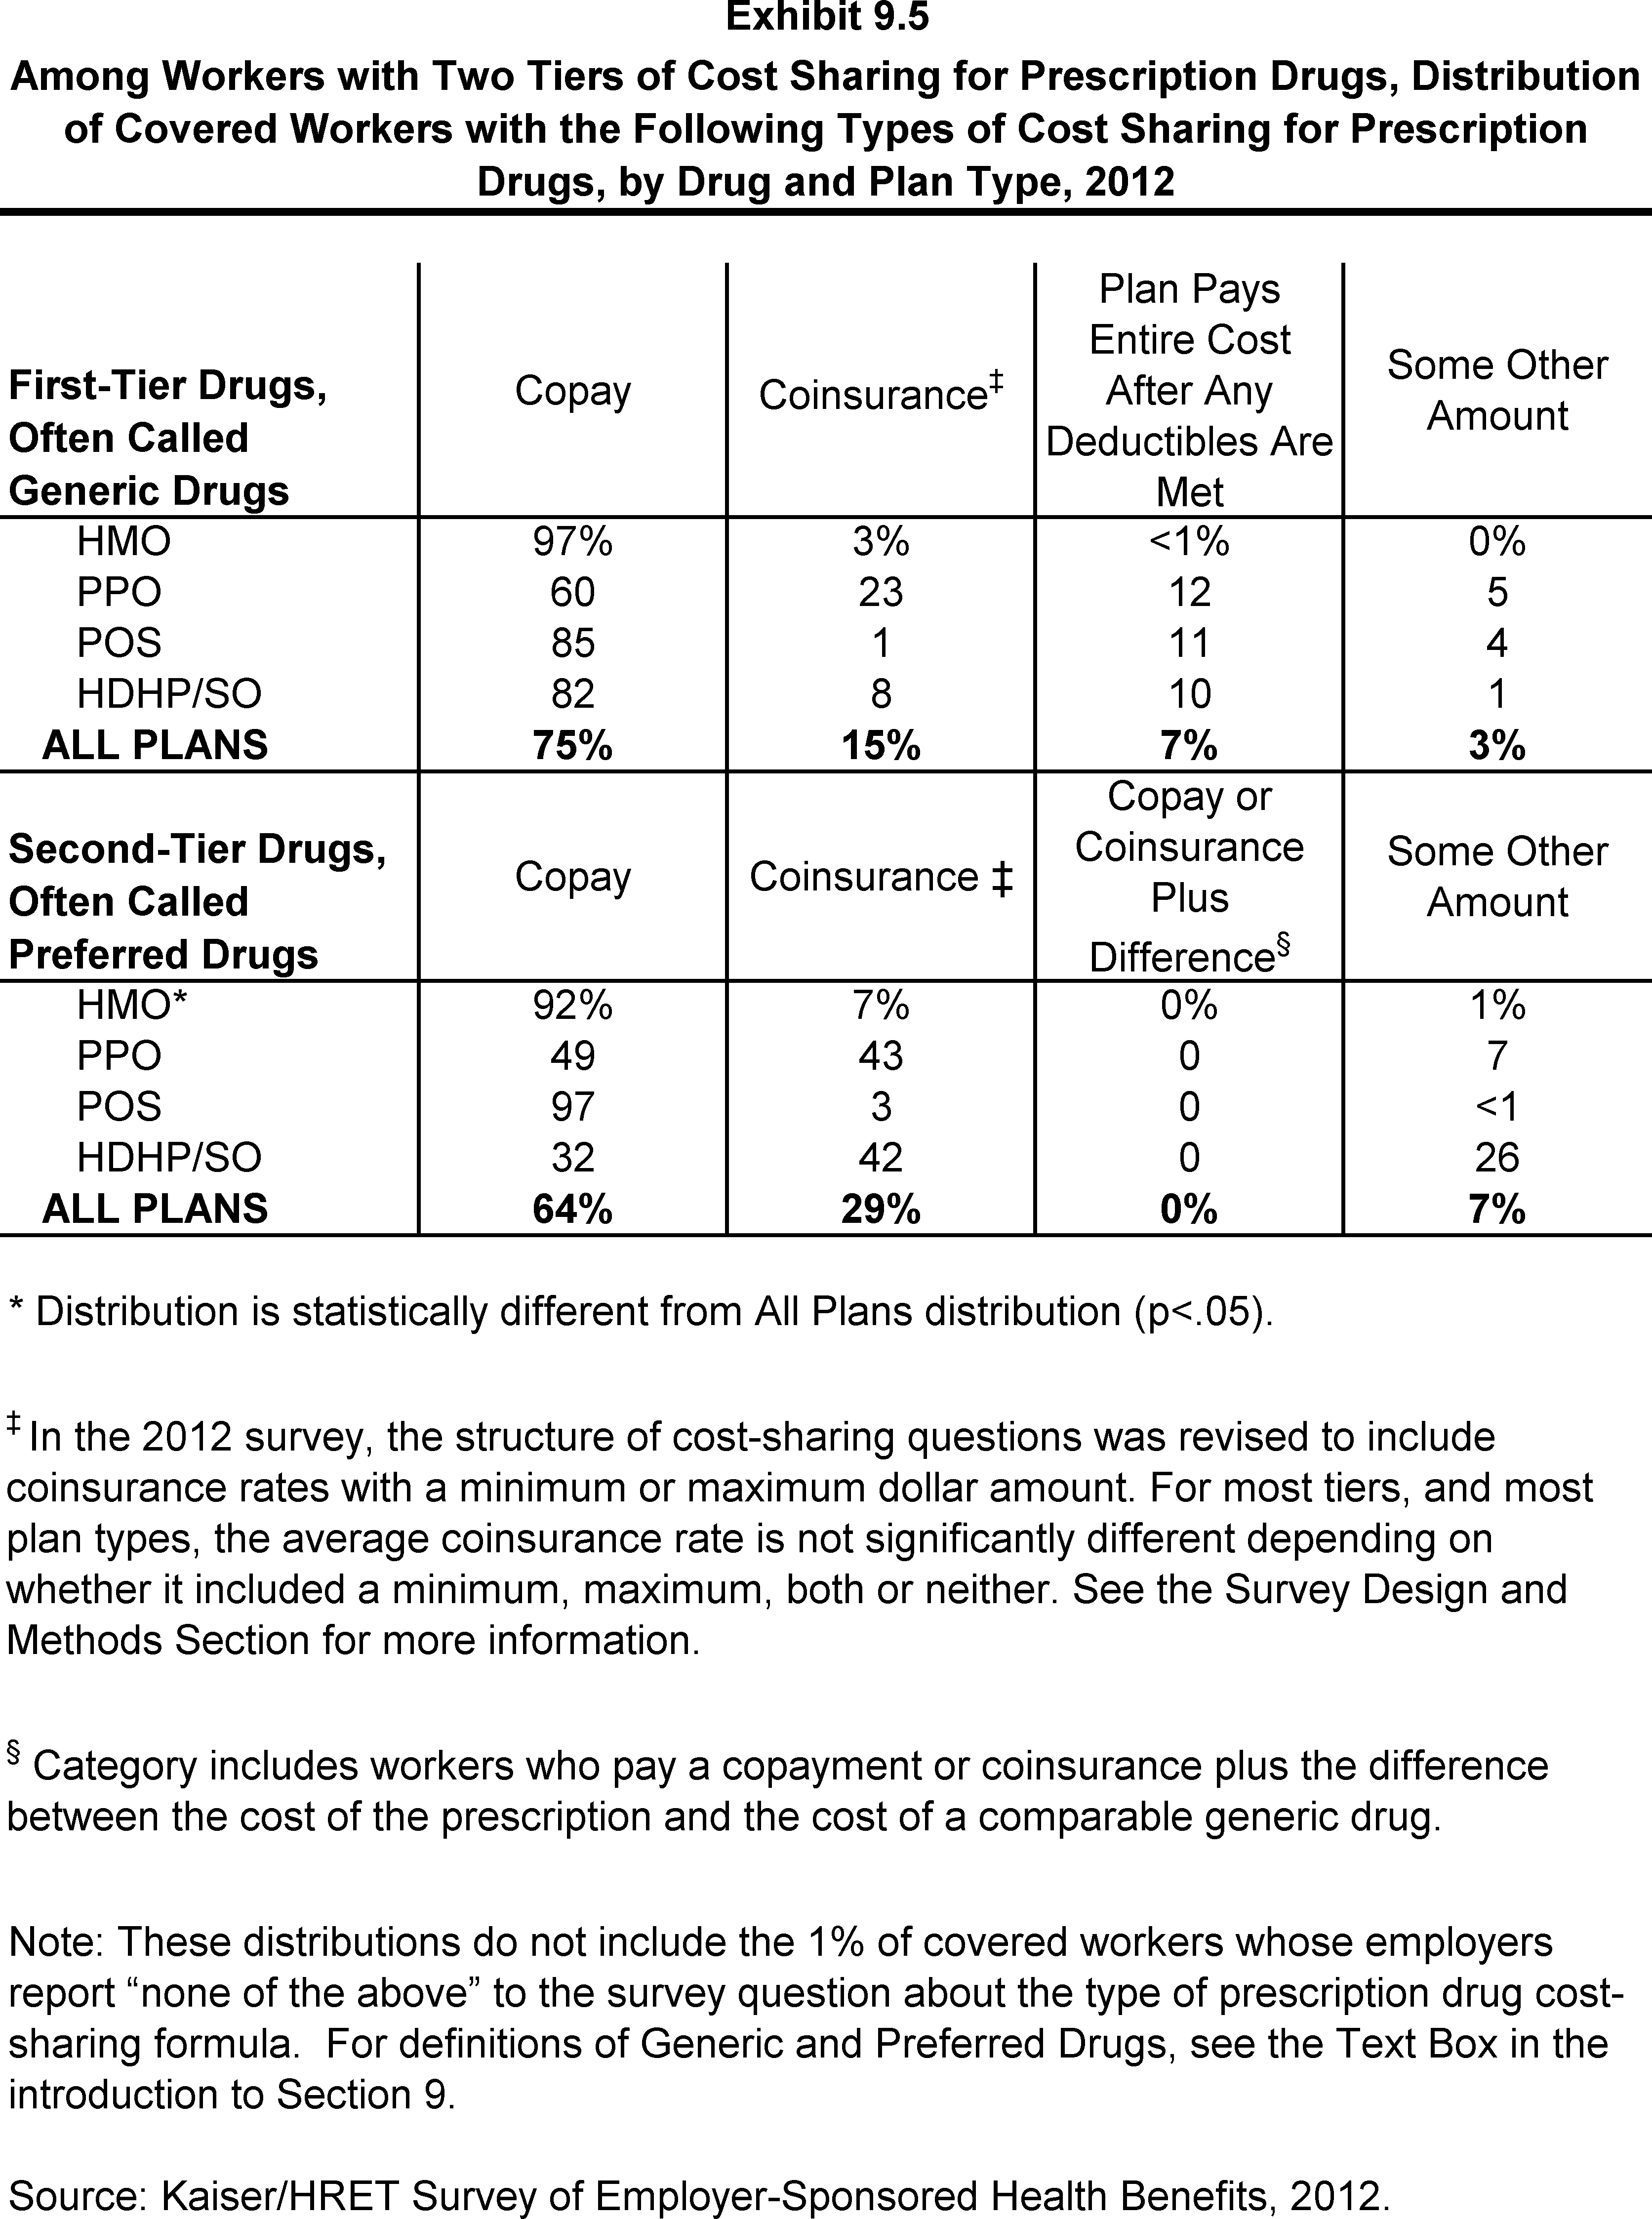
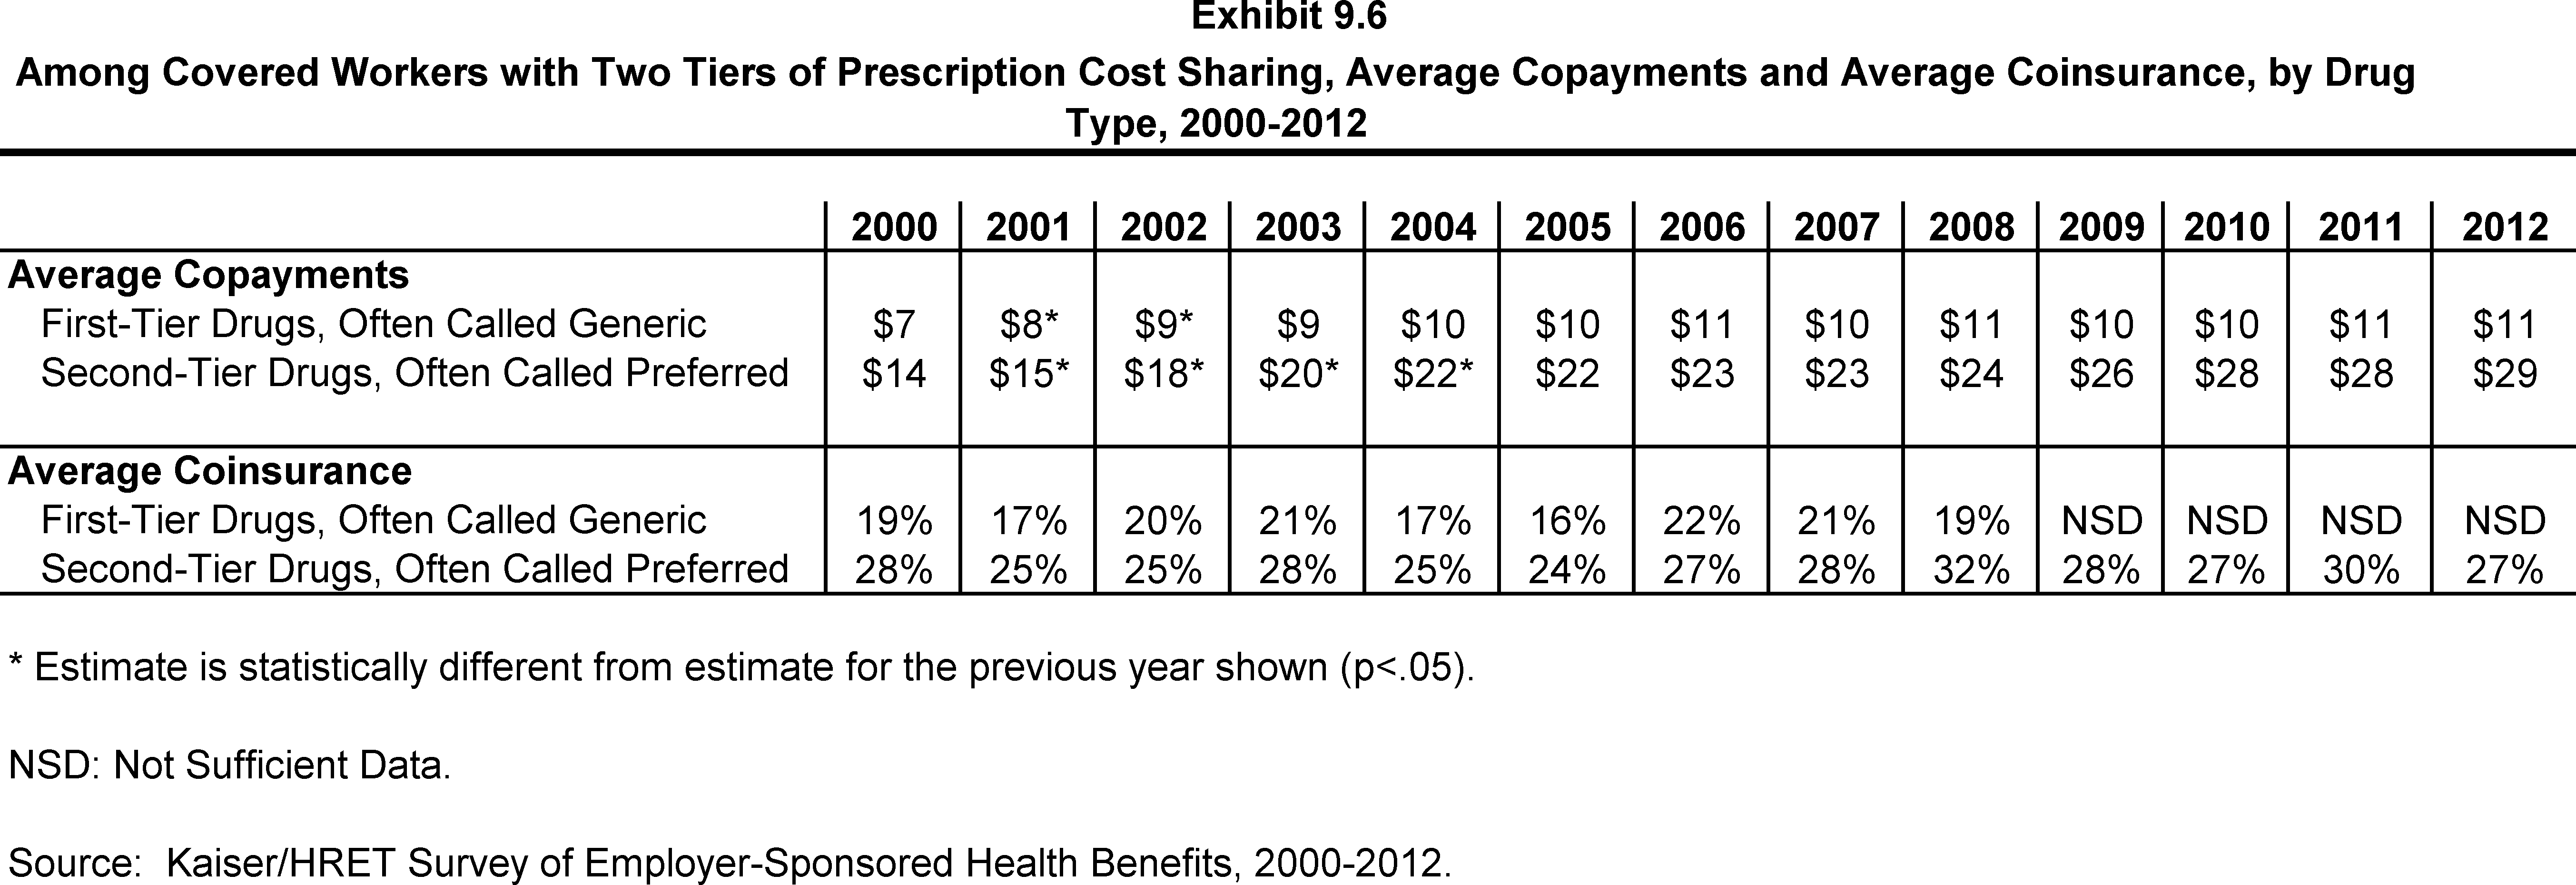
- Ten percent of covered workers are in a plan that has two tiers for prescription drug cost sharing (Exhibit 9.1). Similar to workers in plans with more cost-sharing tiers, copayments are more common than coinsurance for workers in plans with two tiers (Exhibit 9.5). The average copayment for the first tier is $11, and the average copayment for the second tier is $29. The average coinsurance rate for the second tier is 27% (Exhibit 9.6).
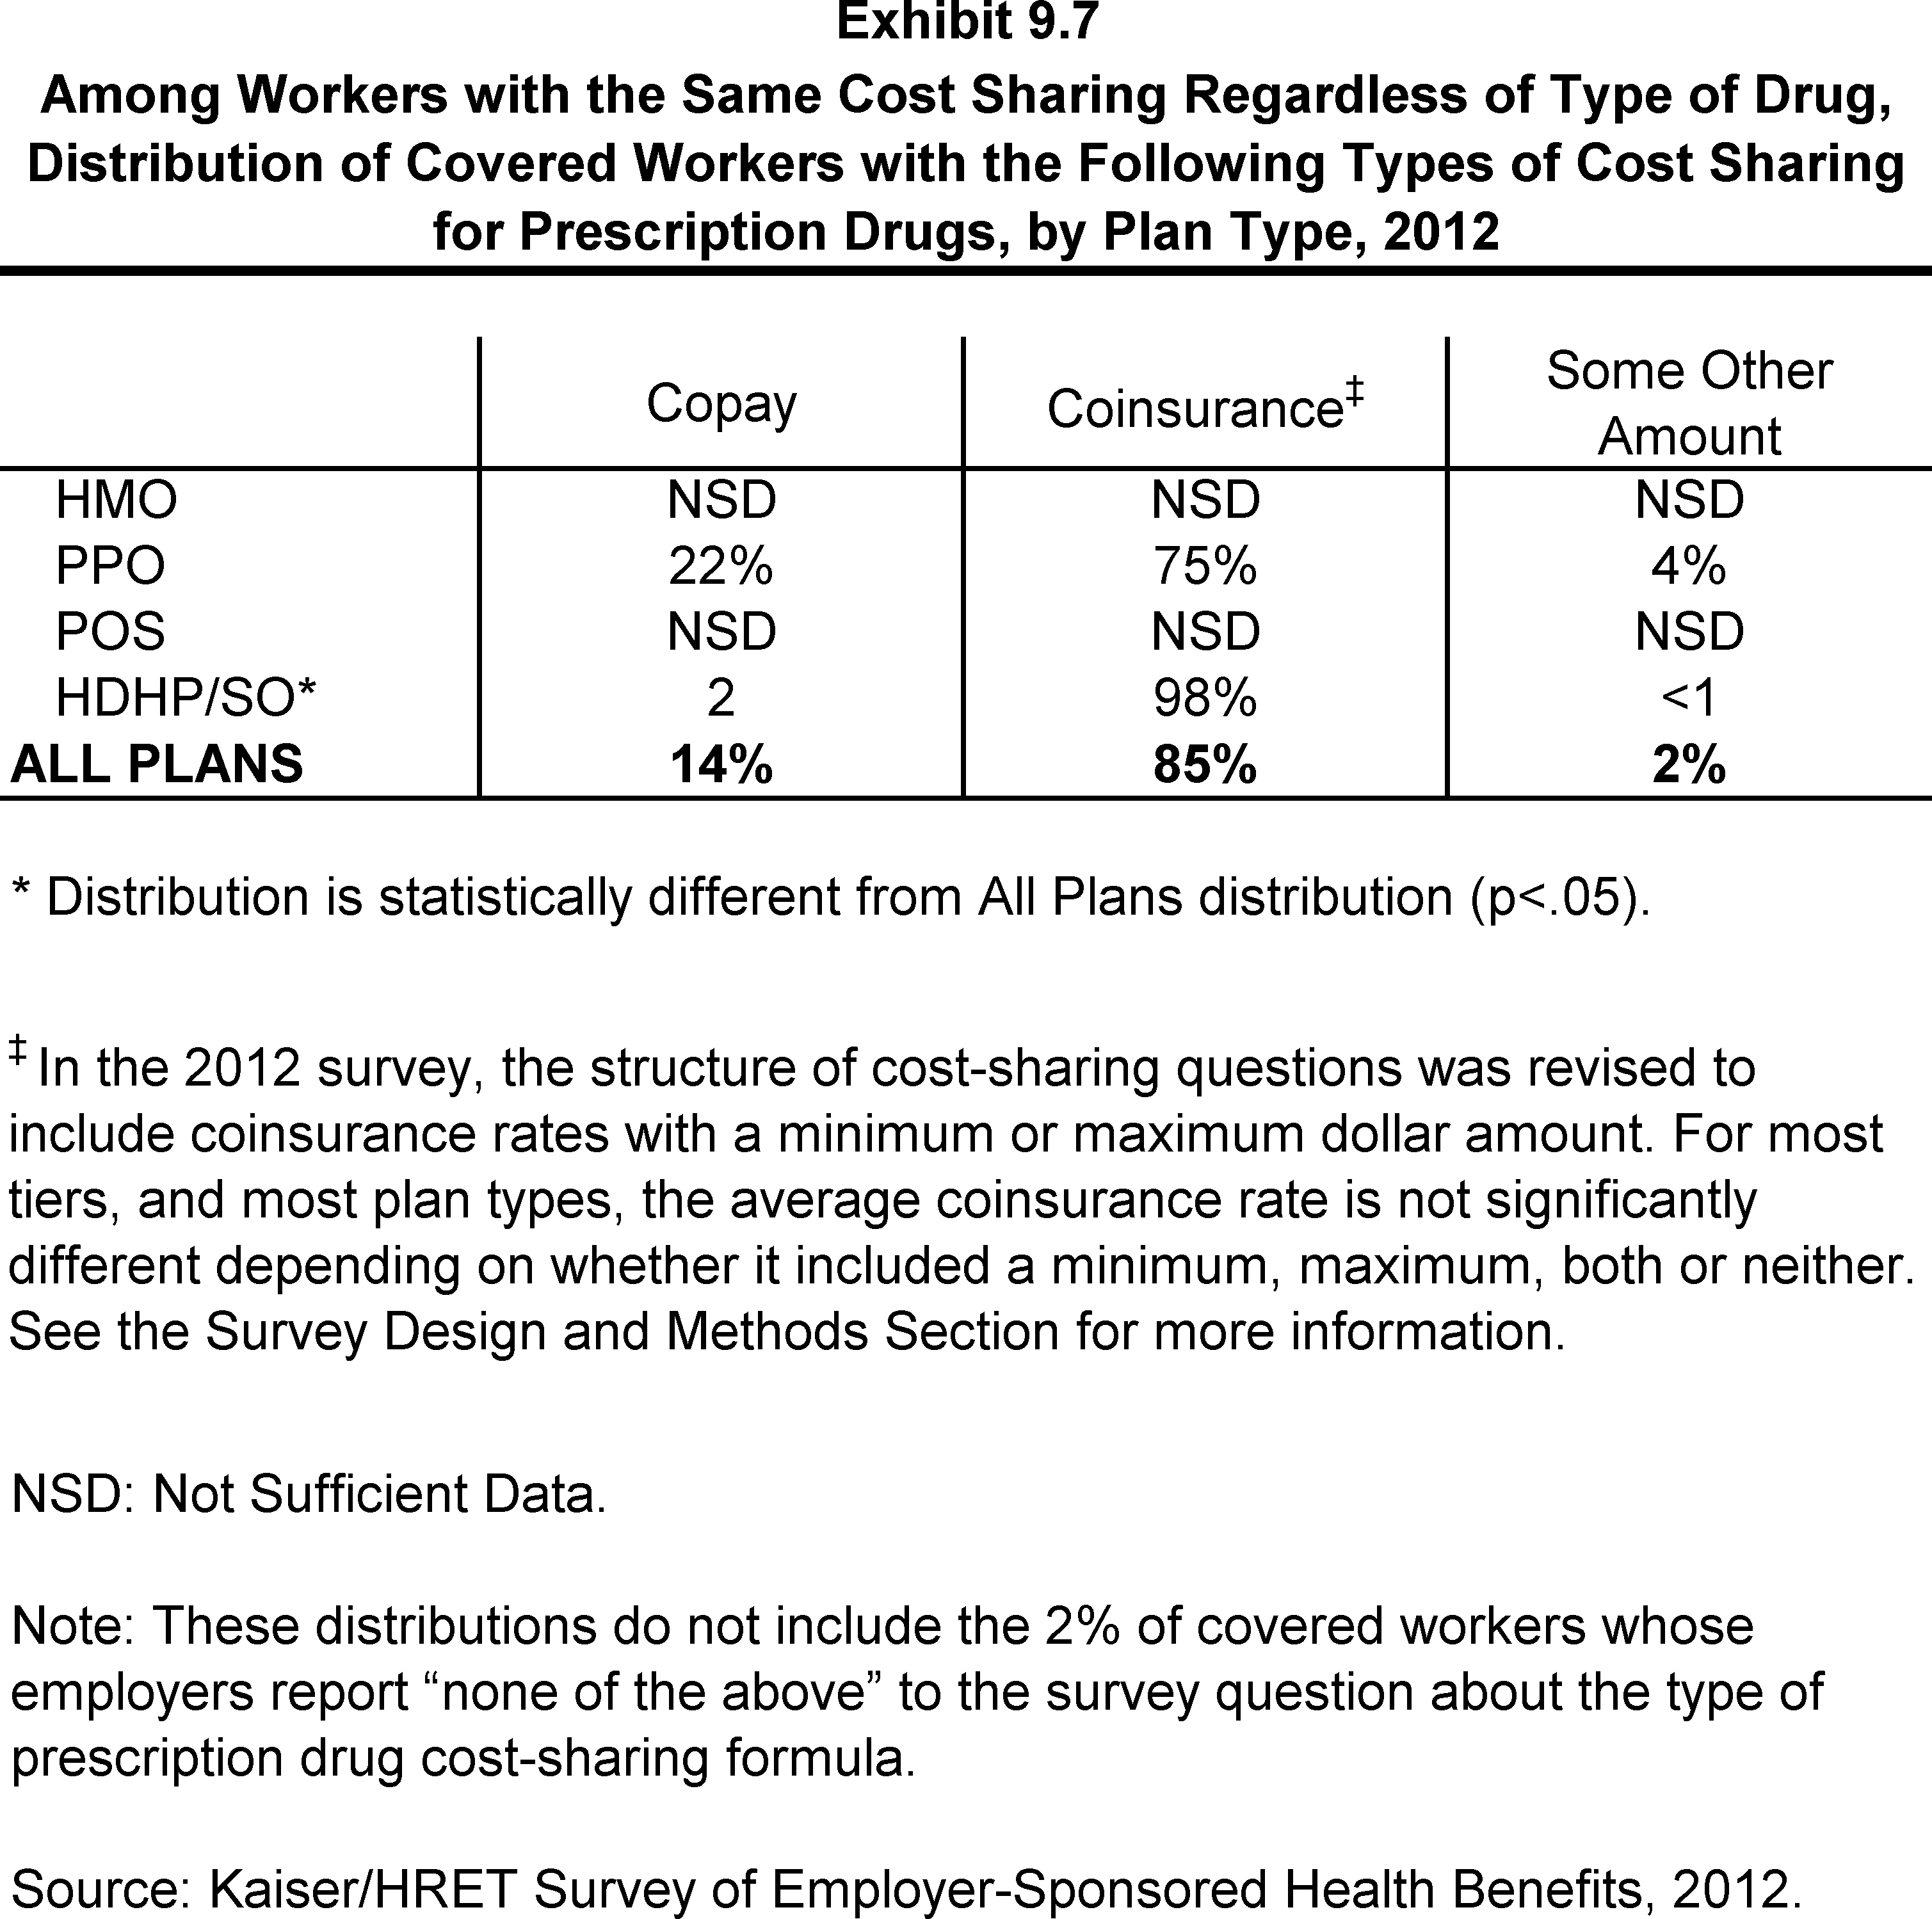
- Six percent of covered workers are covered by plans in which cost sharing is the same regardless of the type of drug chosen (Exhibit 9.1). Among these covered workers, 14% have copayments and 85% have coinsurance (Exhibit 9.7).
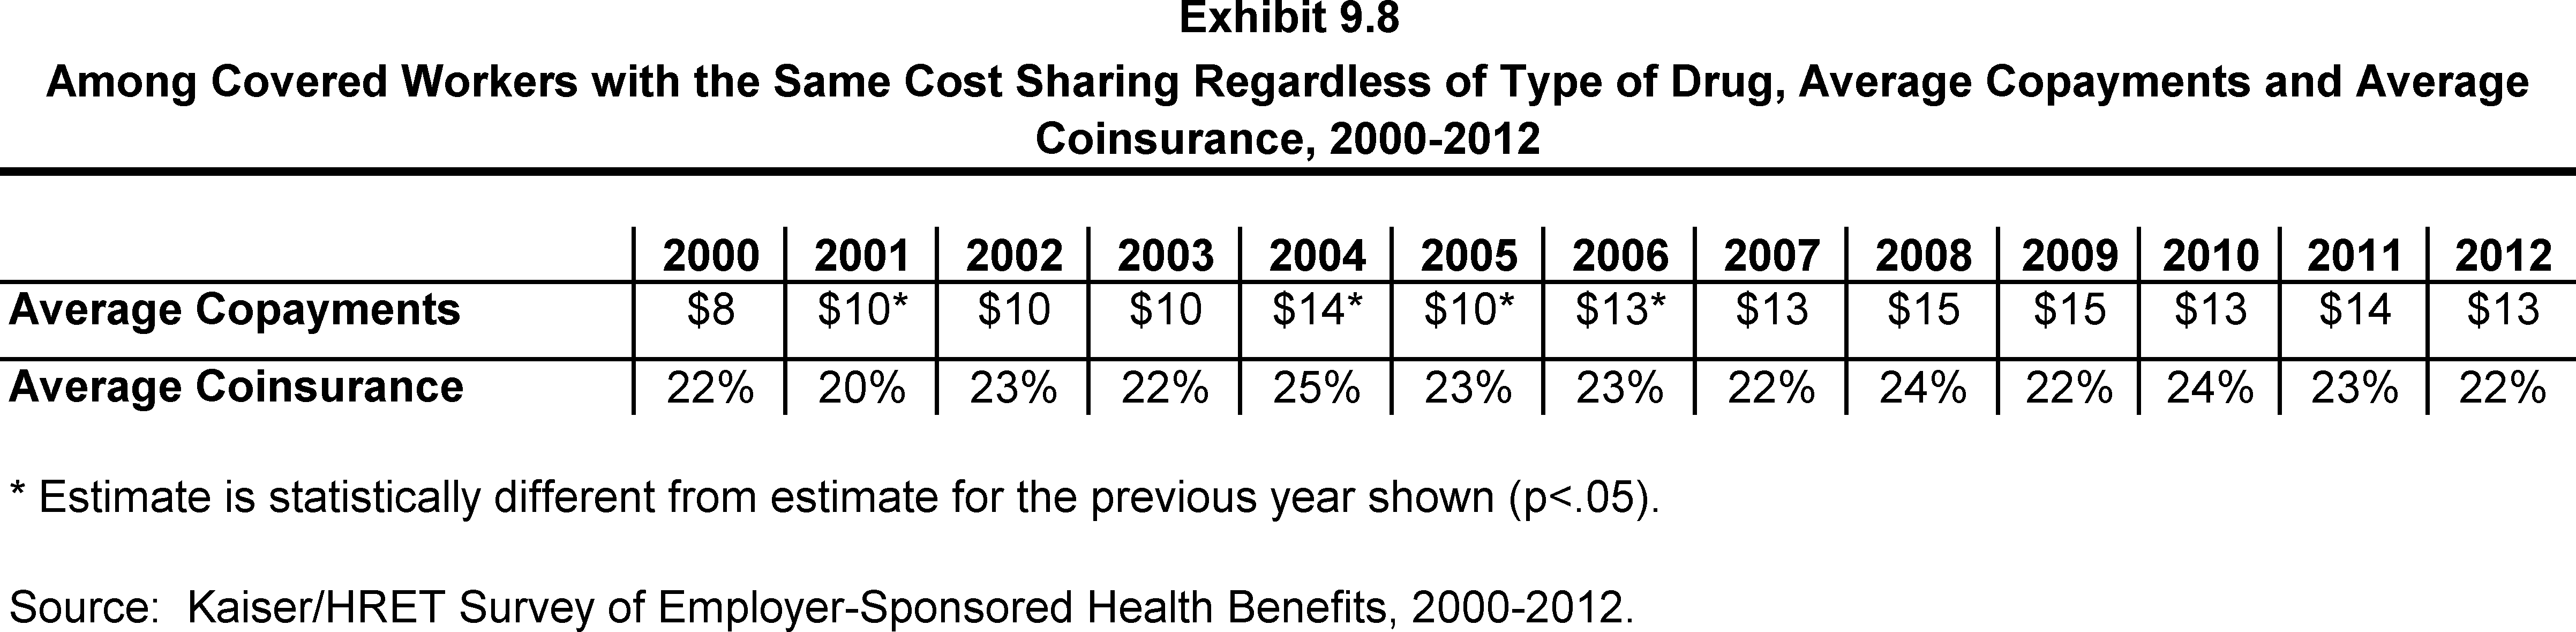
- For those workers with the same cost sharing regardless of the type of drug, the average copayment is $13 and the average coinsurance is 22% (Exhibit 9.8).
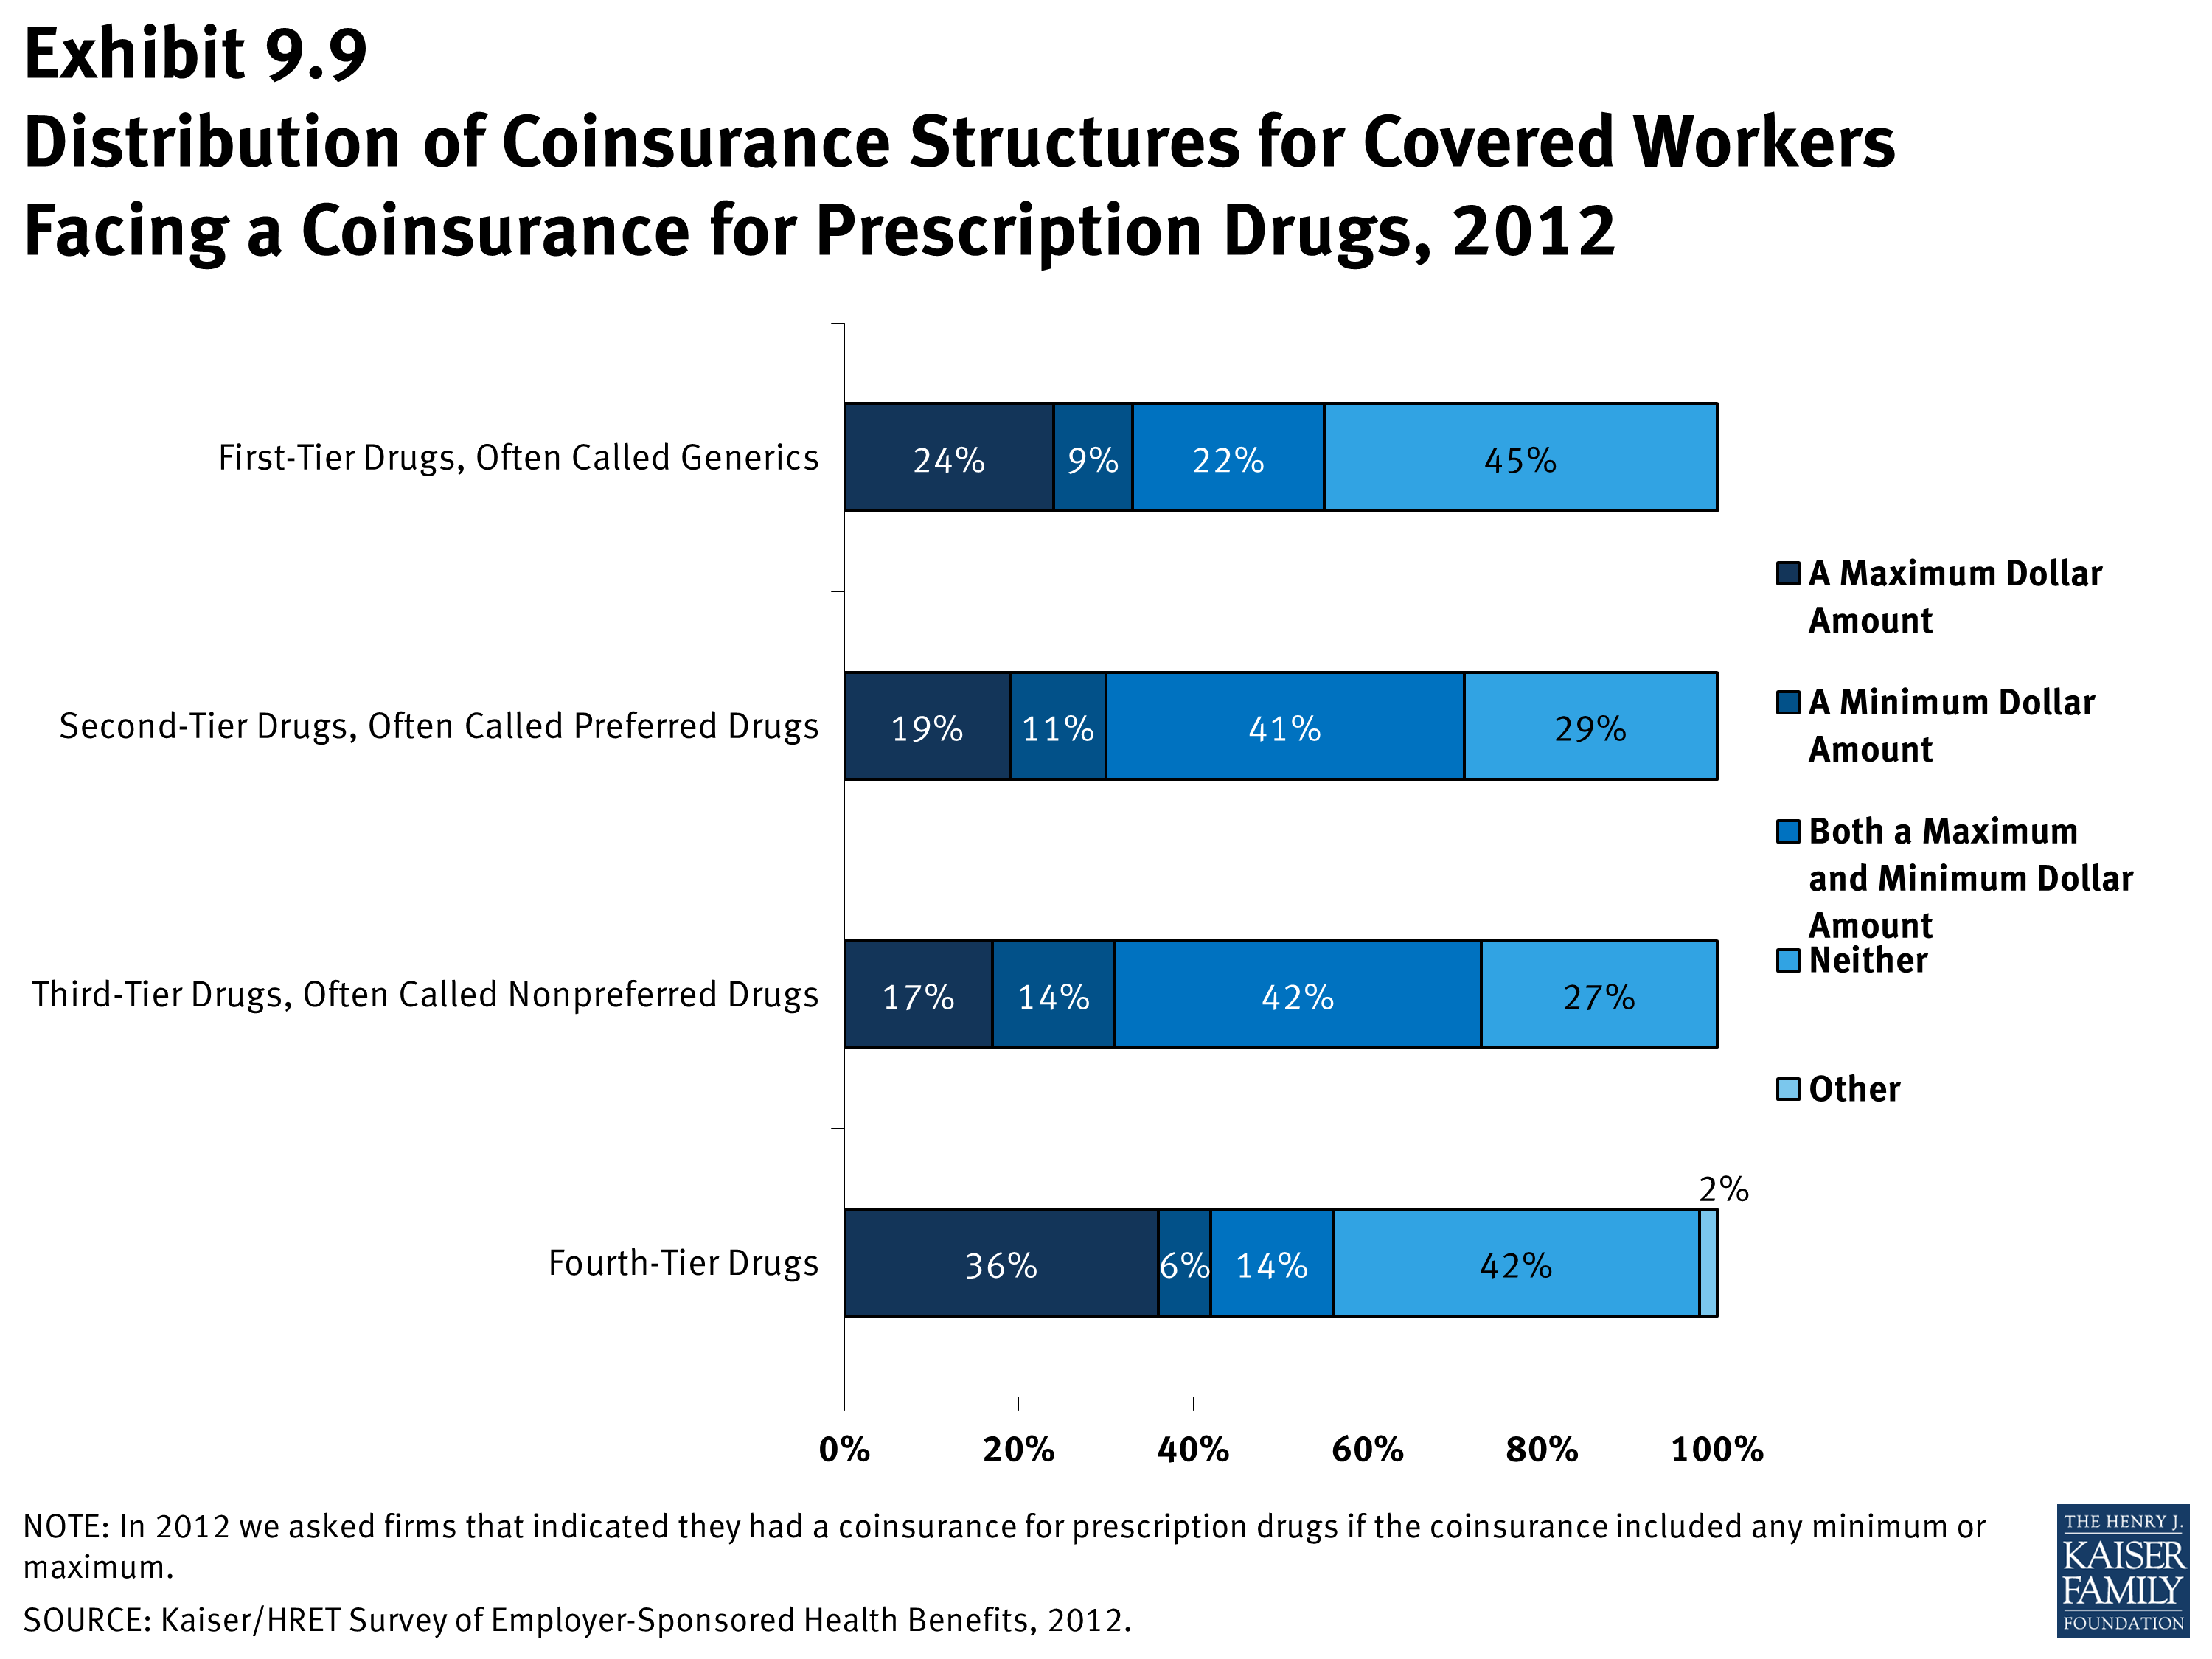
- Coinsurance rates for prescription drugs often have maximum or minimum dollar amounts associated with the coinsurance rate. Twenty-four percent of workers with a coinsurance rate have a maximum dollar amount attached to the coinsurance rate, 9% have a minimum, and 22% have both for first-tier drugs (Exhibit 9.9).
- Small percentages of covered workers are enrolled in plans in which they have a separate prescription drug deductible or annual out-of-pocket limit that applies to prescription drugs only.
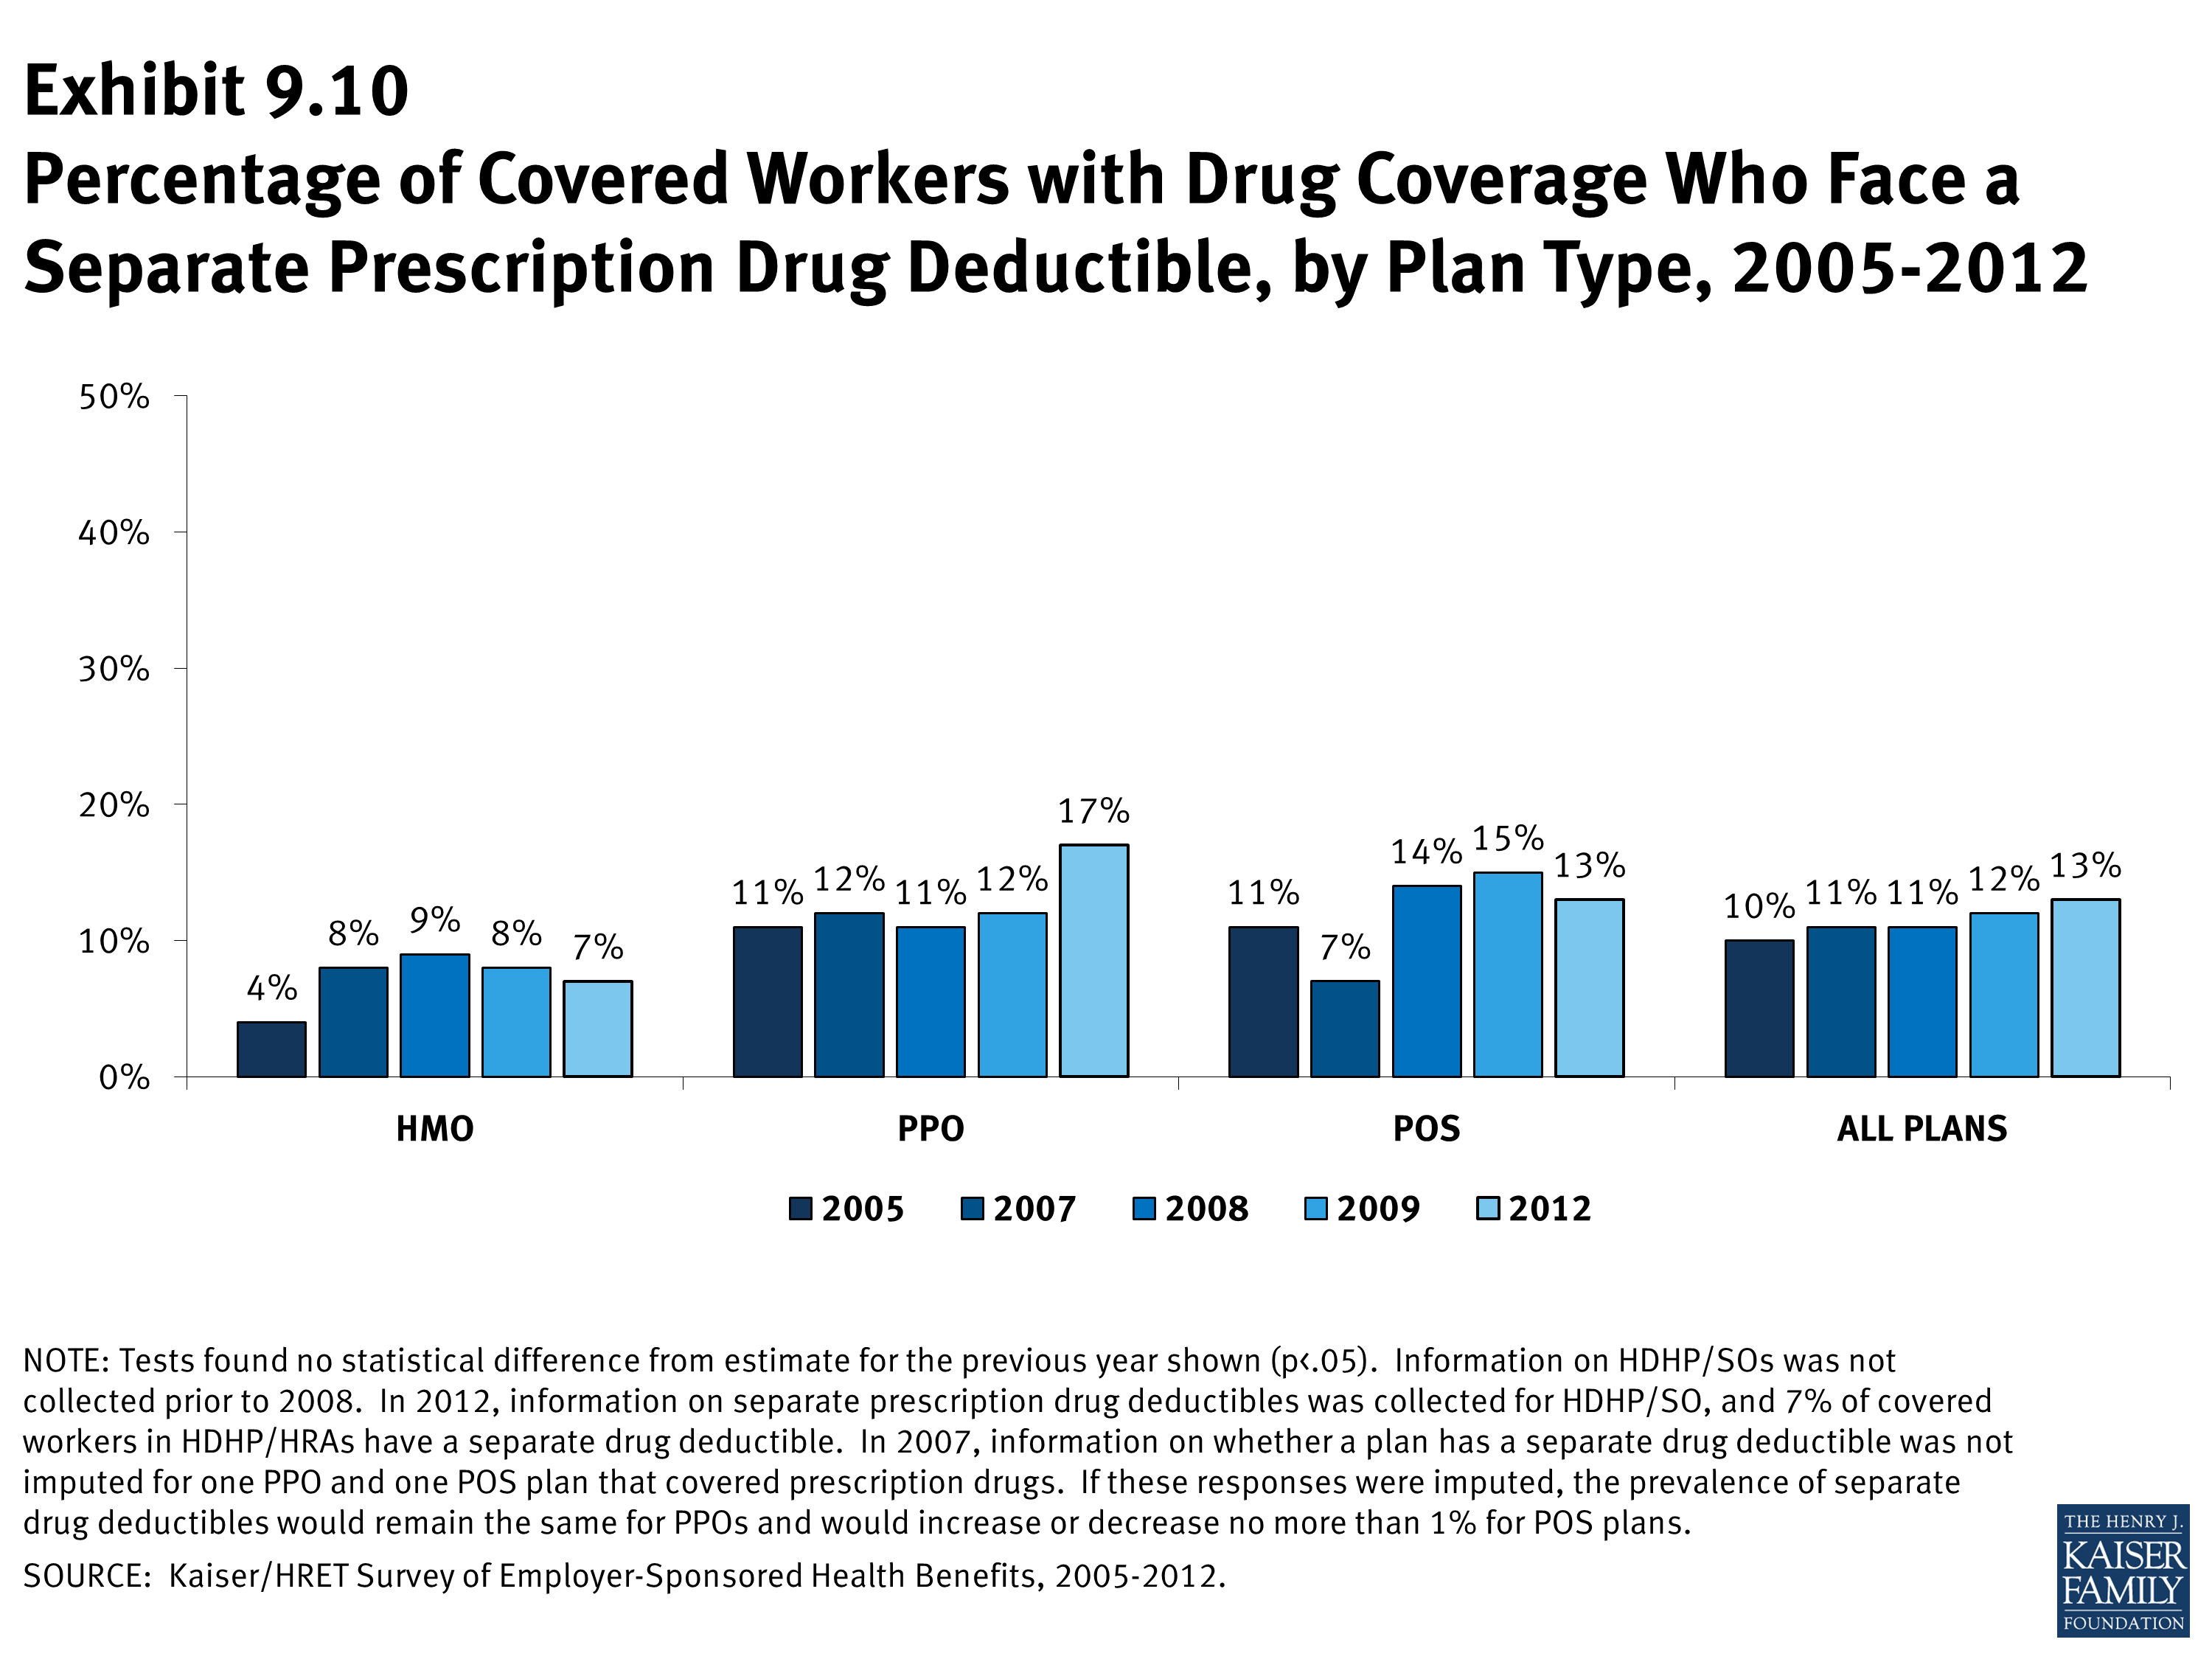
- Thirteen percent of covered workers with prescription drug coverage are in plans with a separate prescription drug deductible that is in addition to any general annual deductible the plan might have, similar to the 12% in 2009 (Exhibit 9.10). Seventeen percent of covered workers in PPOs have a separate drug deductible (Exhibit 9.10).
- Of firms with an annual deductible for prescription drugs, 69% of covered workers are in plans where the deductible applies to every tier.
- For those with a separate drug deductible, the average annual deductible amount is $145.
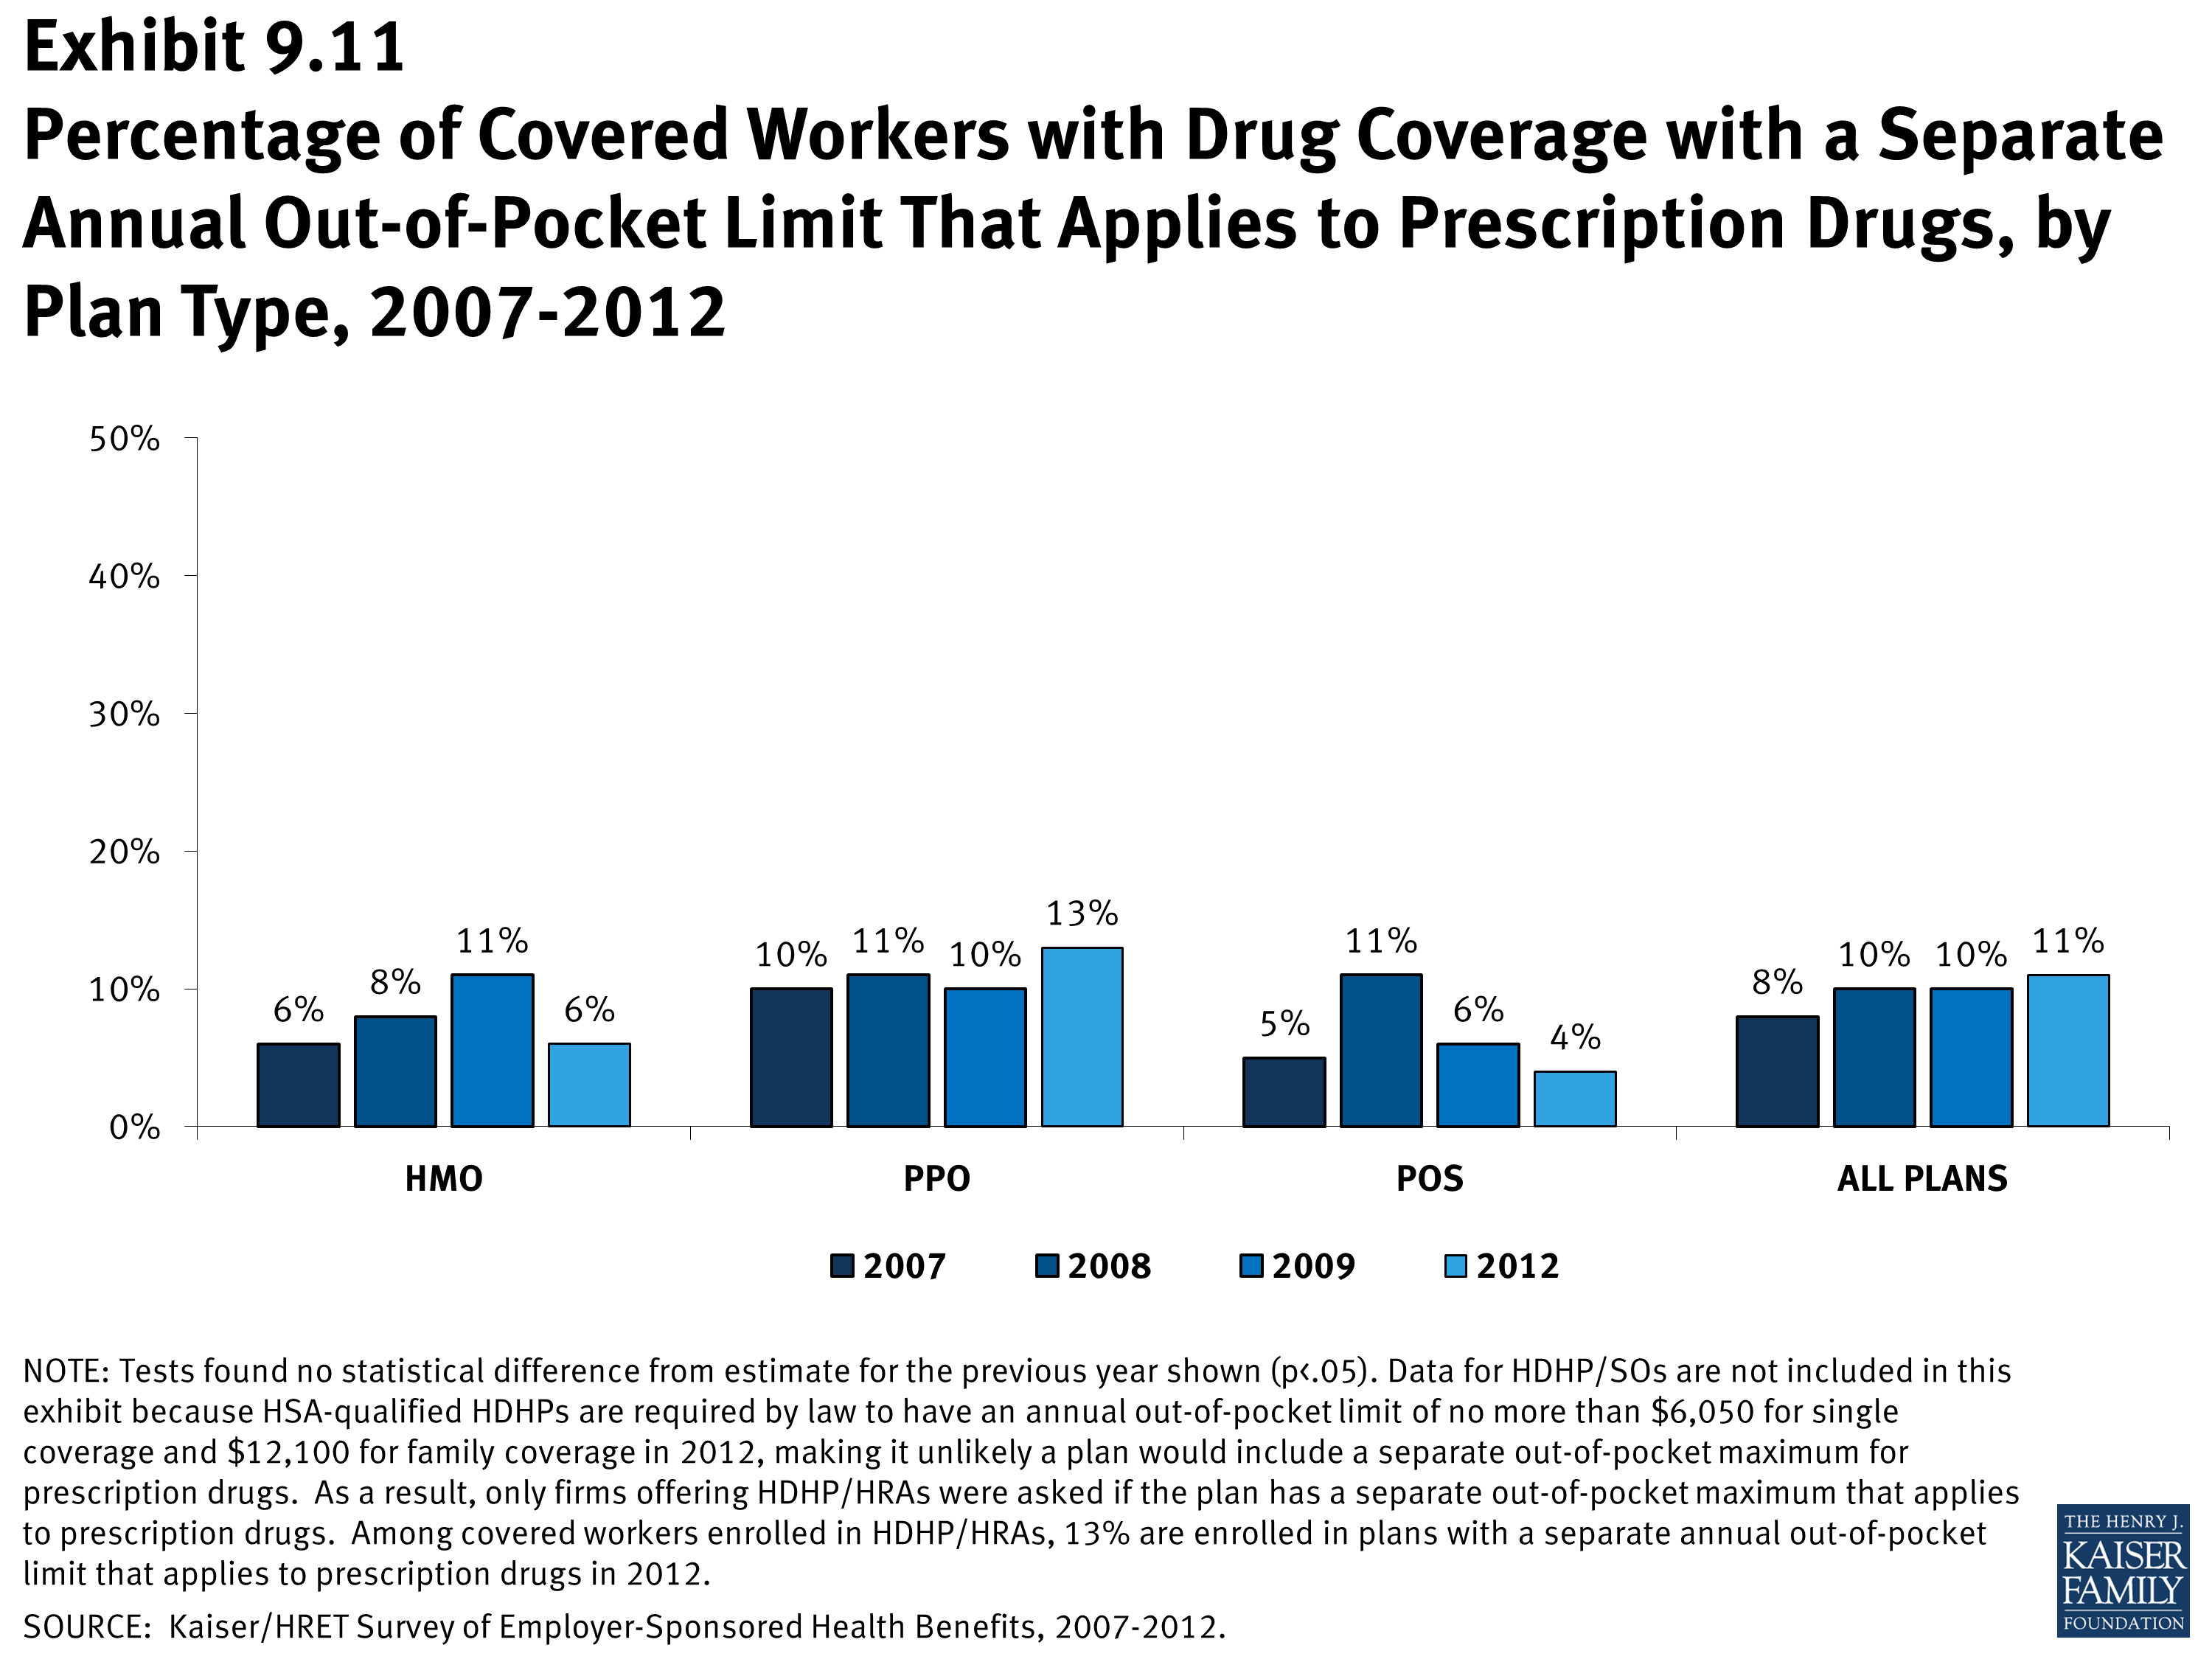
- Similarly, 11% of covered workers with coverage for prescription drugs are in plans with a separate prescription drug annual out-of-pocket limit (Exhibit 9.11), statistically unchanged from 2009.
- For those with a separate prescription drug annual out of pocket limit, the average annual deductible amount is $1,722.
Generic drugs: A drug product that is no longer covered by patent protection and thus may be produced and/or distributed by multiple drug companies.
Preferred drugs: Drugs included on a formulary or preferred drug list; for example, a brand-name drug without a generic substitute.
Nonpreferred drugs: Drugs not included on a formulary or preferred drug list; for example, a brand-name drug with a generic substitute.
Fourth-tier drugs: New types of cost-sharing arrangements that typically build additional layers of higher copayments or coinsurance for specifically identified types of drugs, such as lifestyle drugs or biologics.
Brand-name drugs: Generally, a drug product that is covered by a patent and is thus manufactured and sold exclusively by one firm. Cross-licensing occasionally occurs, allowing an additional firm to market the drug. After the patent expires, multiple firms can produce the drug product, but the brand name or trademark remains with the original manufacturer’s product.
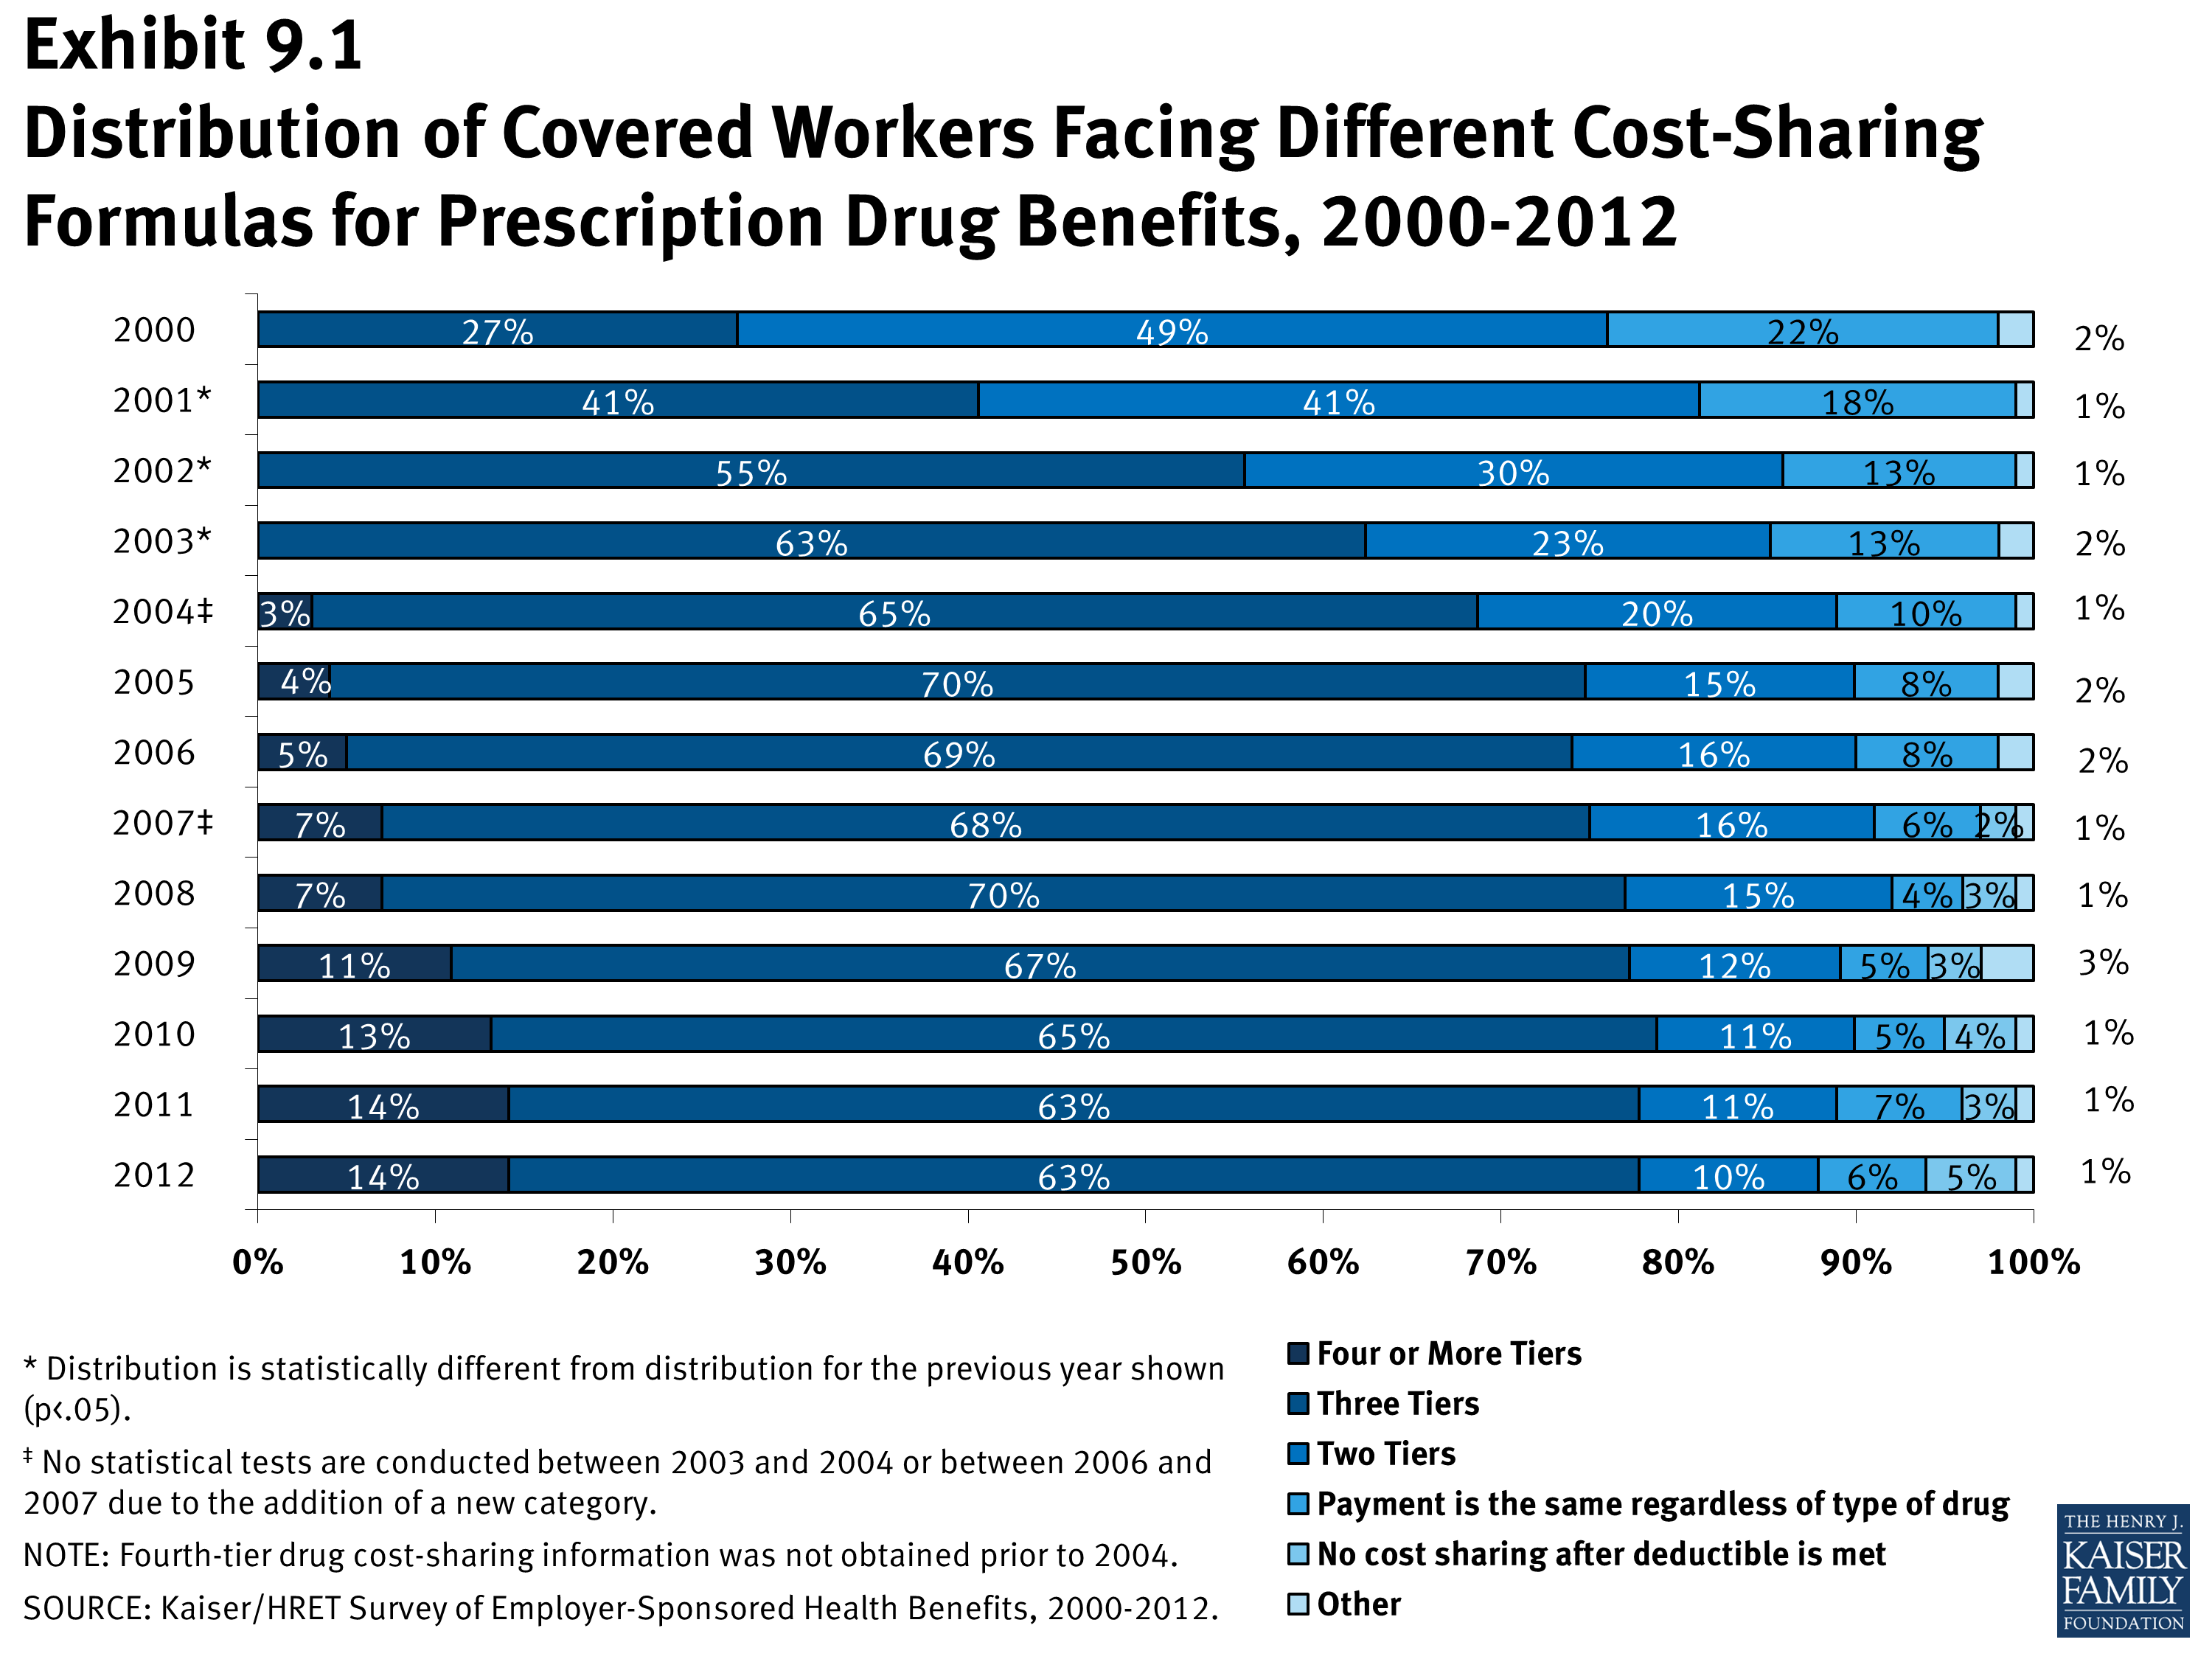
Distribution of Covered Workers Facing Different Cost-Sharing Formulas for Prescription Drug Benefits, 2000-2012
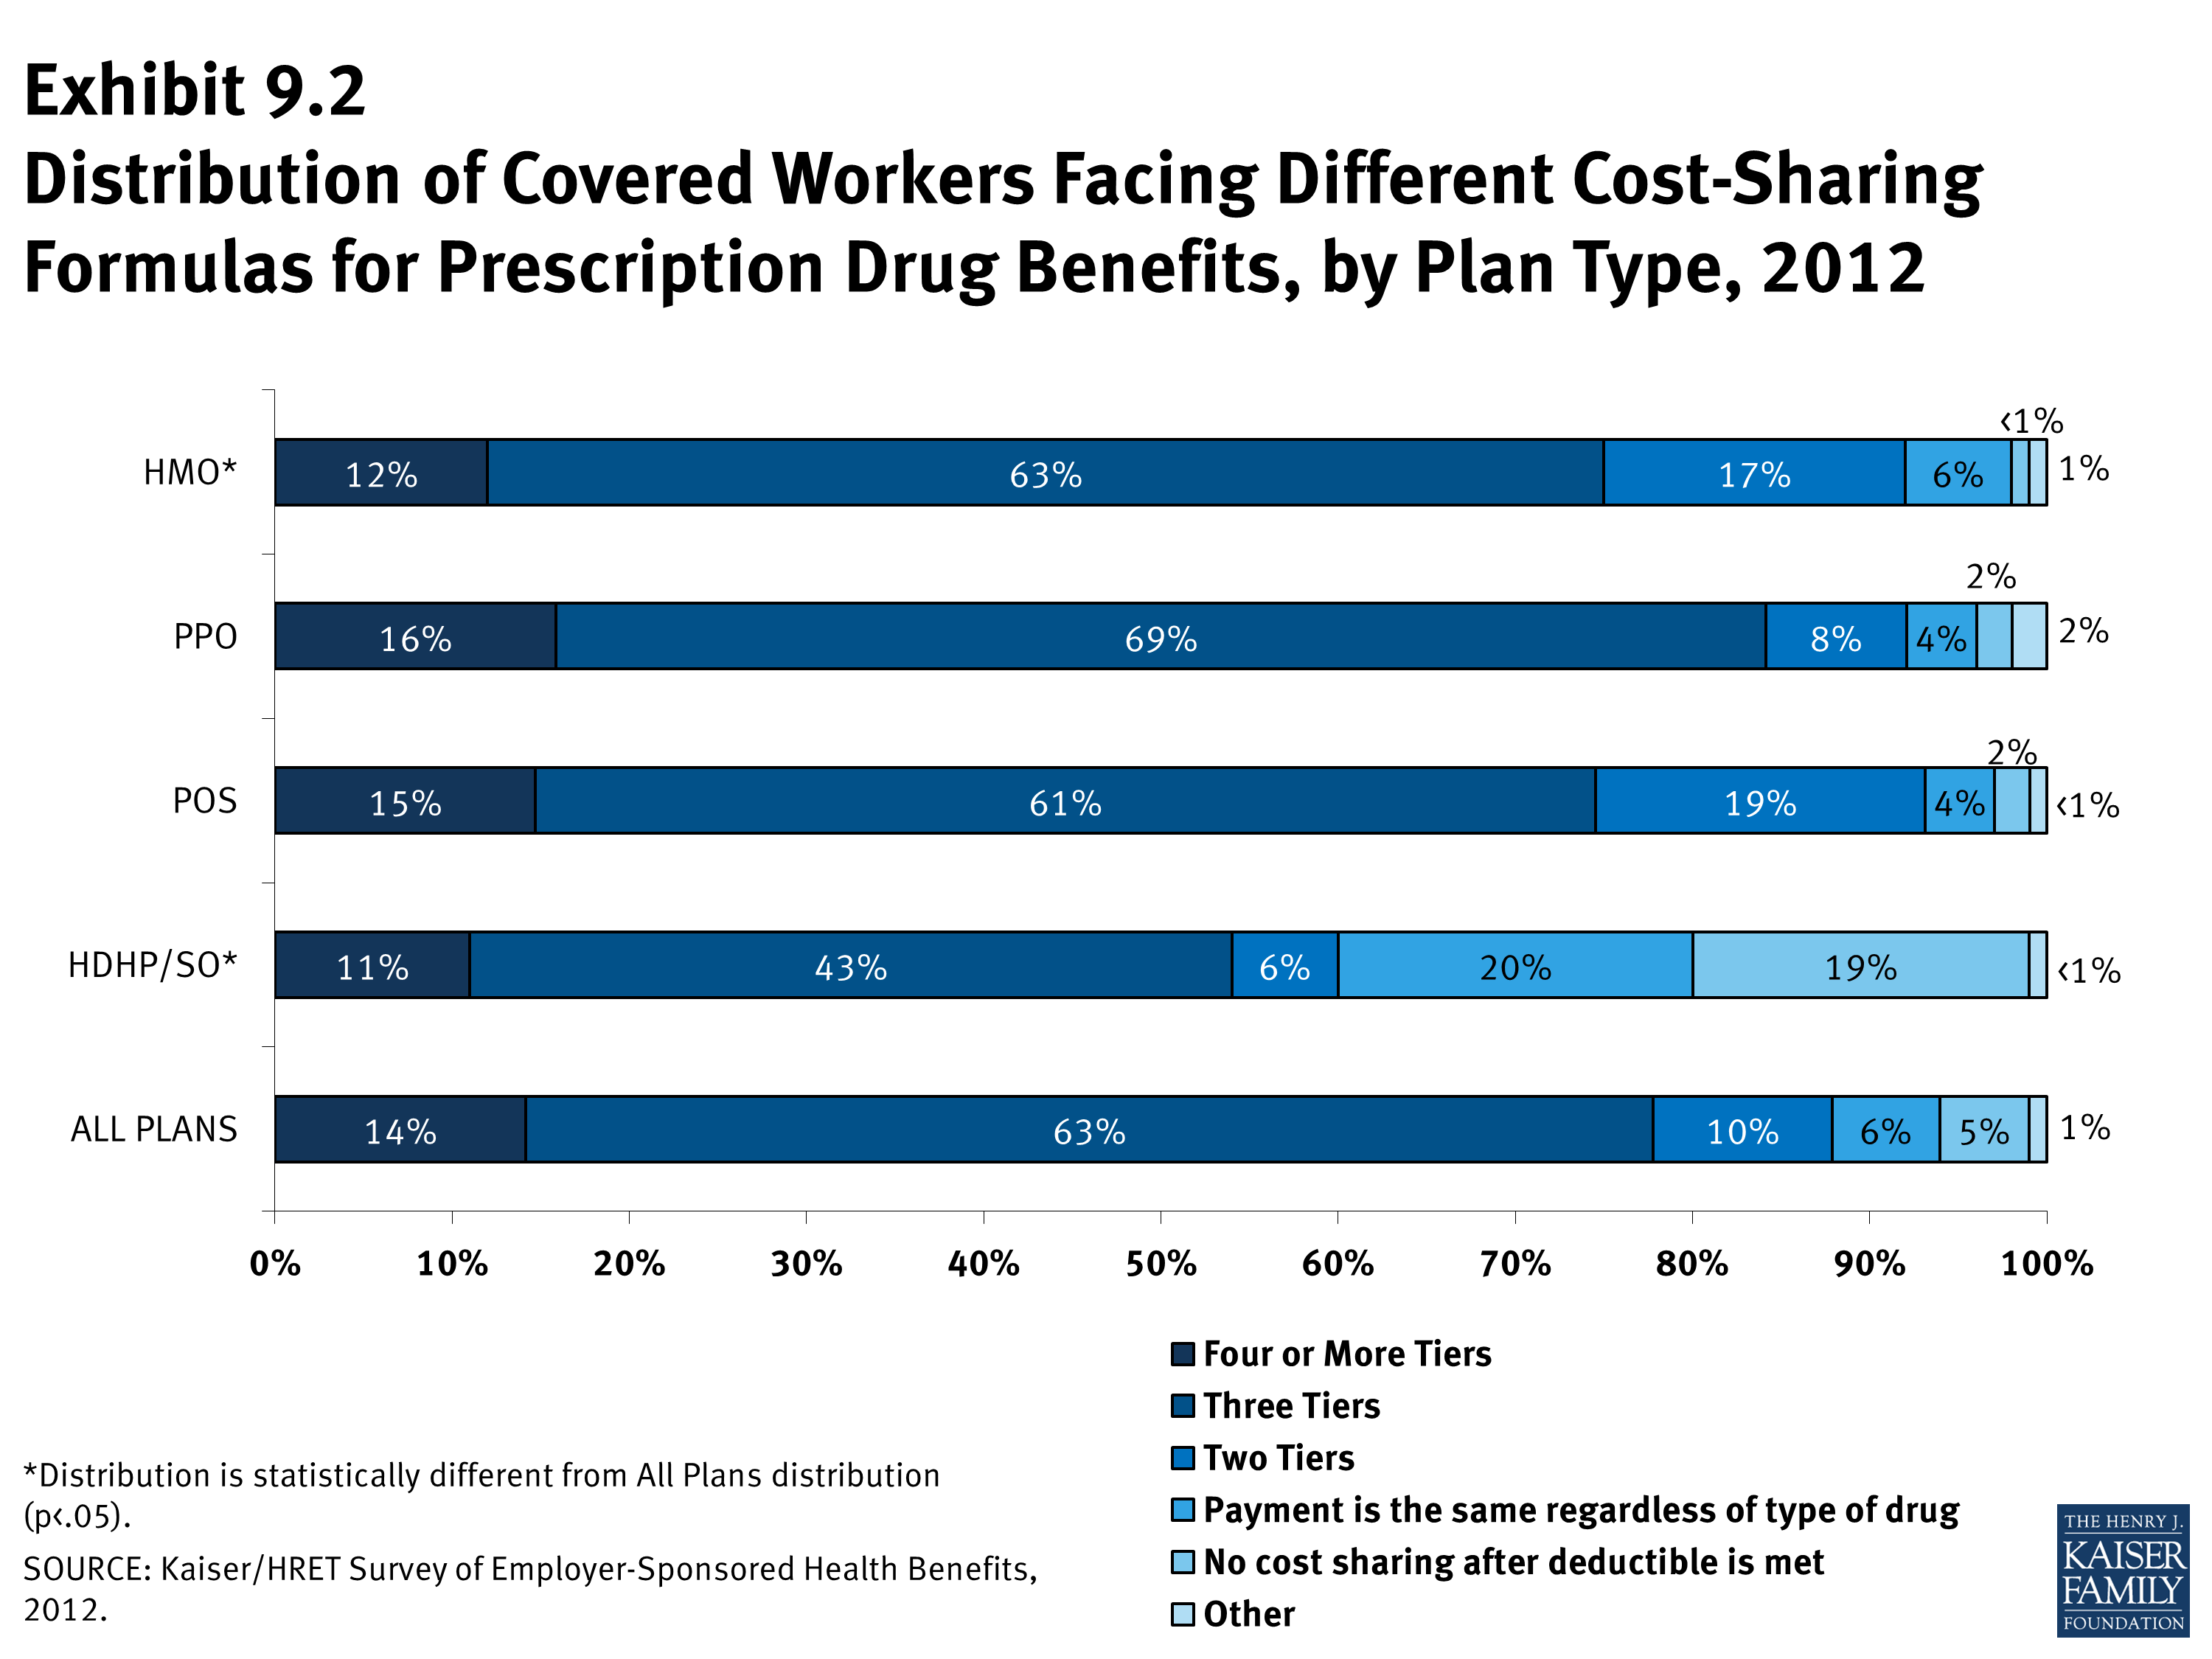
Distribution of Covered Workers Facing Different Cost-Sharing Formulas for Prescription Drug Benefits, by Plan Type, 2012
Among Workers with Three, Four, or More Tiers of Cost Sharing, Distribution of Covered Workers with the Following Types of Cost Sharing for Prescription Drugs, by Drug and Plan Type, 2012
Among Covered Workers with Three, Four, or More Tiers of Prescription Cost Sharing, Average Copayments and Average Coinsurance by Drug Type, 2000-2012
Among Workers with Two Tiers of Cost Sharing for Prescription Drugs, Distribution of Covered Workers with the Following Types of Cost Sharing for Prescription Drugs, by Drug and Plan Type, 2012
Among Covered Workers with Two Tiers of Prescription Cost Sharing, Average Copayments and Average Coinsurance, by Drug Type, 2000-2012
Among Workers with the Same Cost Sharing Regardless of Type of Drug, Distribution of Covered Workers with the Following Types of Cost Sharing for Prescription Drugs, by Plan Type, 2012
Among Covered Workers with the Same Cost Sharing Regardless of Type of Drug, Average Copayments and Average Coinsurance, 2000-2012
Distribution of Coinsurance Structures for Covered Workers Facing a Coinsurance for Prescription Drugs, 2012
Percentage of Covered Workers with Drug Coverage Who Face a Separate Prescription Drug Deductible, by Plan Type, 2005-2012
Percentage of Covered Workers with Drug Coverage with a Separate Annual Out-of-Pocket Limit That Applies to Prescription Drugs, by Plan Type, 2007-2012
Section 10: Plan Funding
Federal law (the Employee Retirement Income Security Act of 1974, or ERISA) exempts self-funded plans from state insurance laws, including reserve requirements, mandated benefits, premium taxes, and consumer protection regulations. Three in five covered workers are in a self-funded health plan. Self-funding is common among larger firms because they can spread the risk of costly claims over a large number of employees and dependents. Many self-funded plans use insurance, often called stoploss coverage, to limit the plan sponsors liability for very large claims. Almost three in five covered workers in self-funded plans are in plans with stoploss protection.
- Sixty percent of covered workers are in a self-funded plan, the same percentage reported in 2011 (Exhibit 10.1). The percentage of covered workers who are in a plan that is completely or partially self-funded has increased over time from 49% in 2000 and 54% in 2005.
- The percentage of covered workers differs by plan type: 70% of covered workers in PPOs, 54% in HDHP/SOs, 38% in conventional health plans, 37% in HMOs, and 29% in POS plans are in a self-funded plan (Exhibit 10.4).
- As expected, covered workers in large firms (200 or more workers) are more likely to be in a self-funded plan than covered workers in small firms (3-199 workers) (81% vs. 15%) (Exhibit 10.3). The percentage of covered workers in self-funded plans increases as the number of employees in a firm increases. Seventy-eight percent of covered workers in firms with 1,000 to 4,999 workers and 93% of covered workers in firms with 5,000 or more workers are in self-funded plans in 2012 (Exhibit 10.3).
Self-Funded Plan: An insurance arrangement in which the employer assumes direct financial responsibility for the costs of enrollees medical claims. Employers sponsoring self-funded plans typically contract with a third-party administrator or insurer to provide administrative services for the self-funded plan. In some cases, the employer may buy stop-loss coverage from an insurer to protect the employer against very large claims.
Fully Insured Plan: An insurance arrangement in which the employer contracts with a health plan that assumes financial responsibility for the costs of enrollees medical claims.
- Fifty-nine percent of workers in self-funded health plans are in plans that have stoploss insurance (Exhibit 10.9). Stoploss coverage limits the amount that a plan sponsor has to pay in claims. Stoploss coverage may limit the amount of claims that must be paid for each employee or may limit the total amount the plan sponsor must pay for all claims over the plan year.
- Eighty-nine percent of covered workers in self-funded plans that have stoploss protection are in plans where the stoploss insurance limits the amount that the plan must spend on each employee (Exhibit 10.10).1
- Firms with per enrollee stoploss coverage were asked for the dollar amount where the stoploss coverage would start to pay for most or all of the claim (called an attachment point). The average attachment point in large firms (200 or more workers) is $223,233 (Exhibit 10.10).2
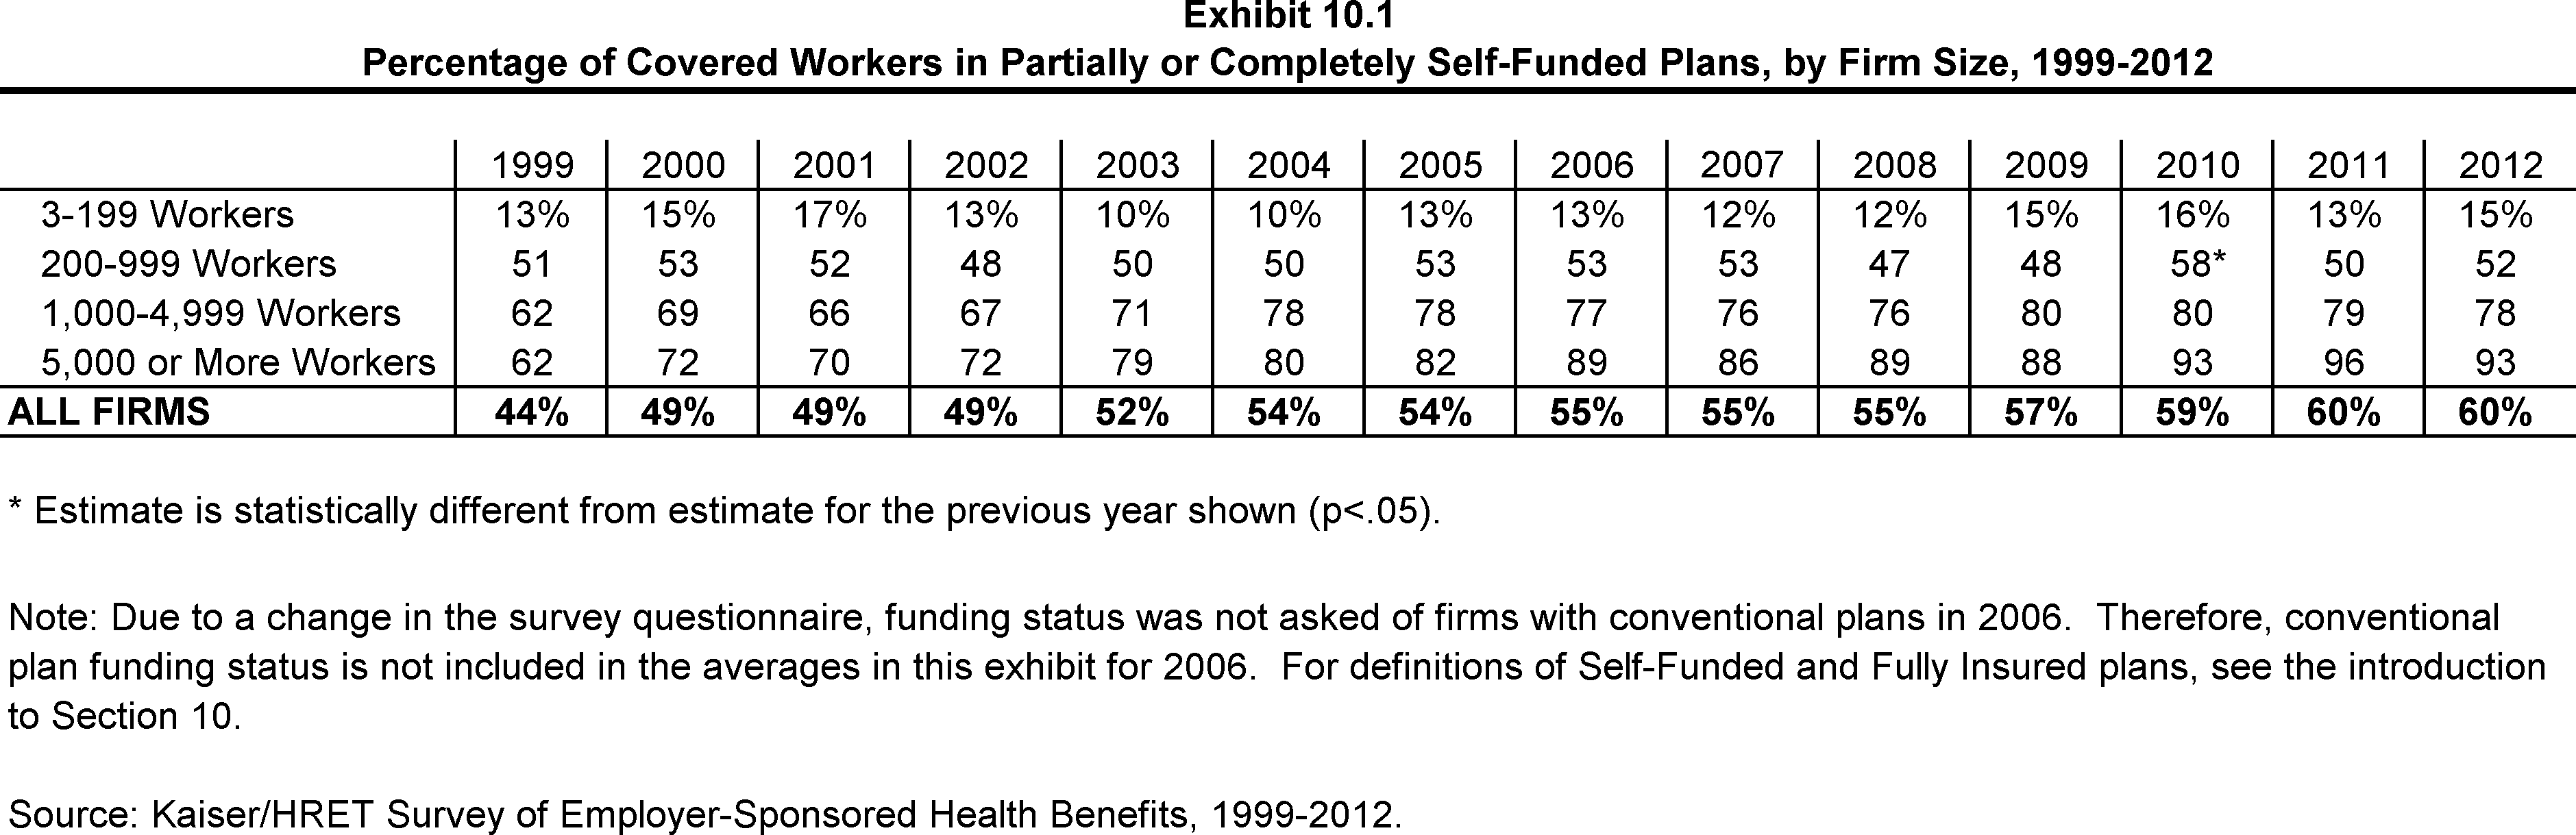
Percentage of Covered Workers in Partially or Completely Self-Funded Plans, by Firm Size, 1999-2012
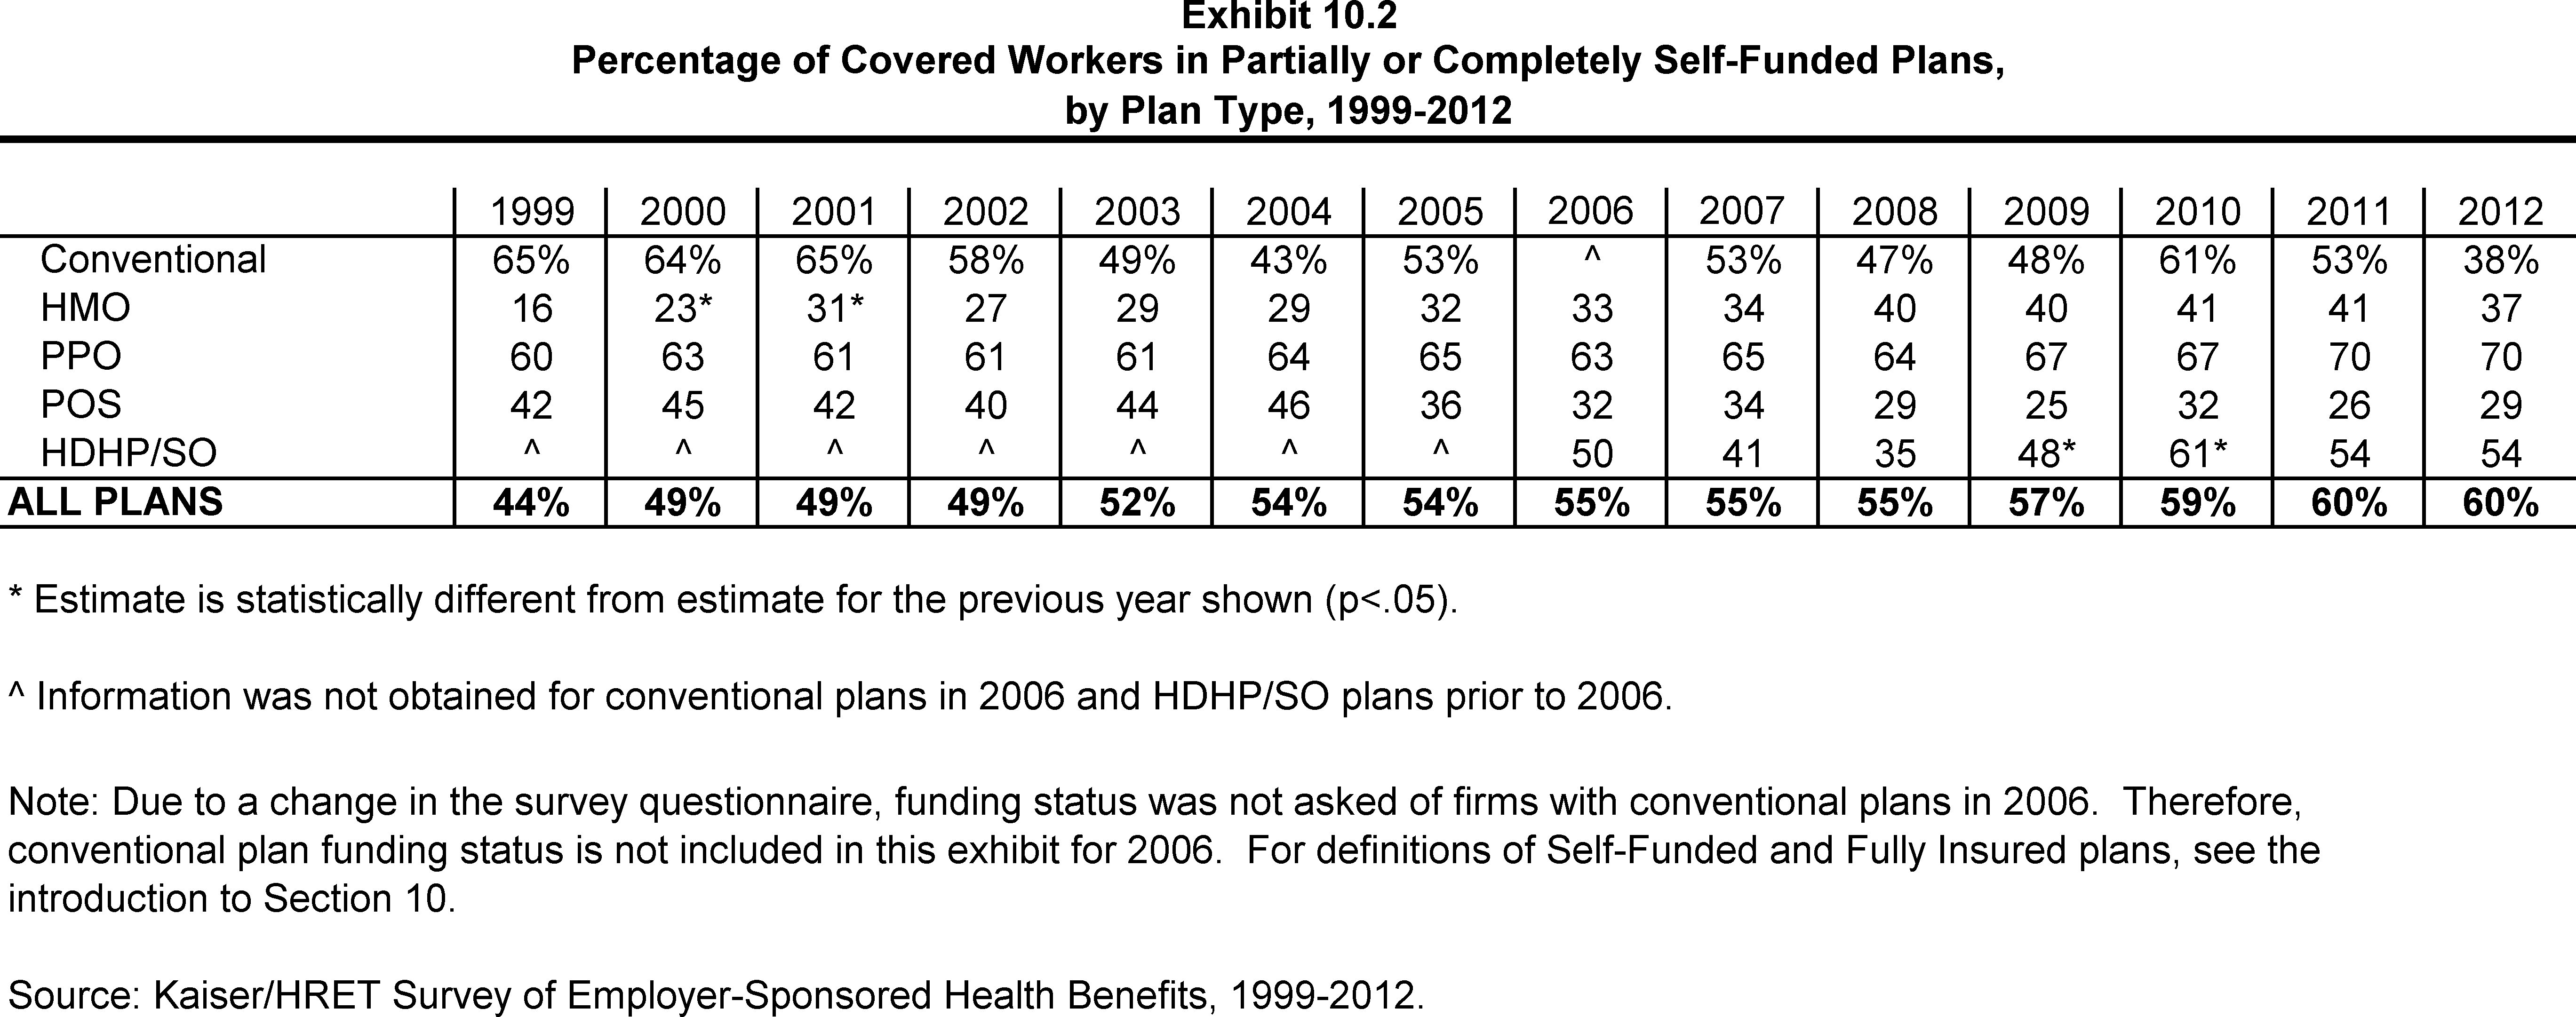
Percentage of Covered Workers in Partially or Completely Self-Funded Plans, by Plan Type, 1999-2012
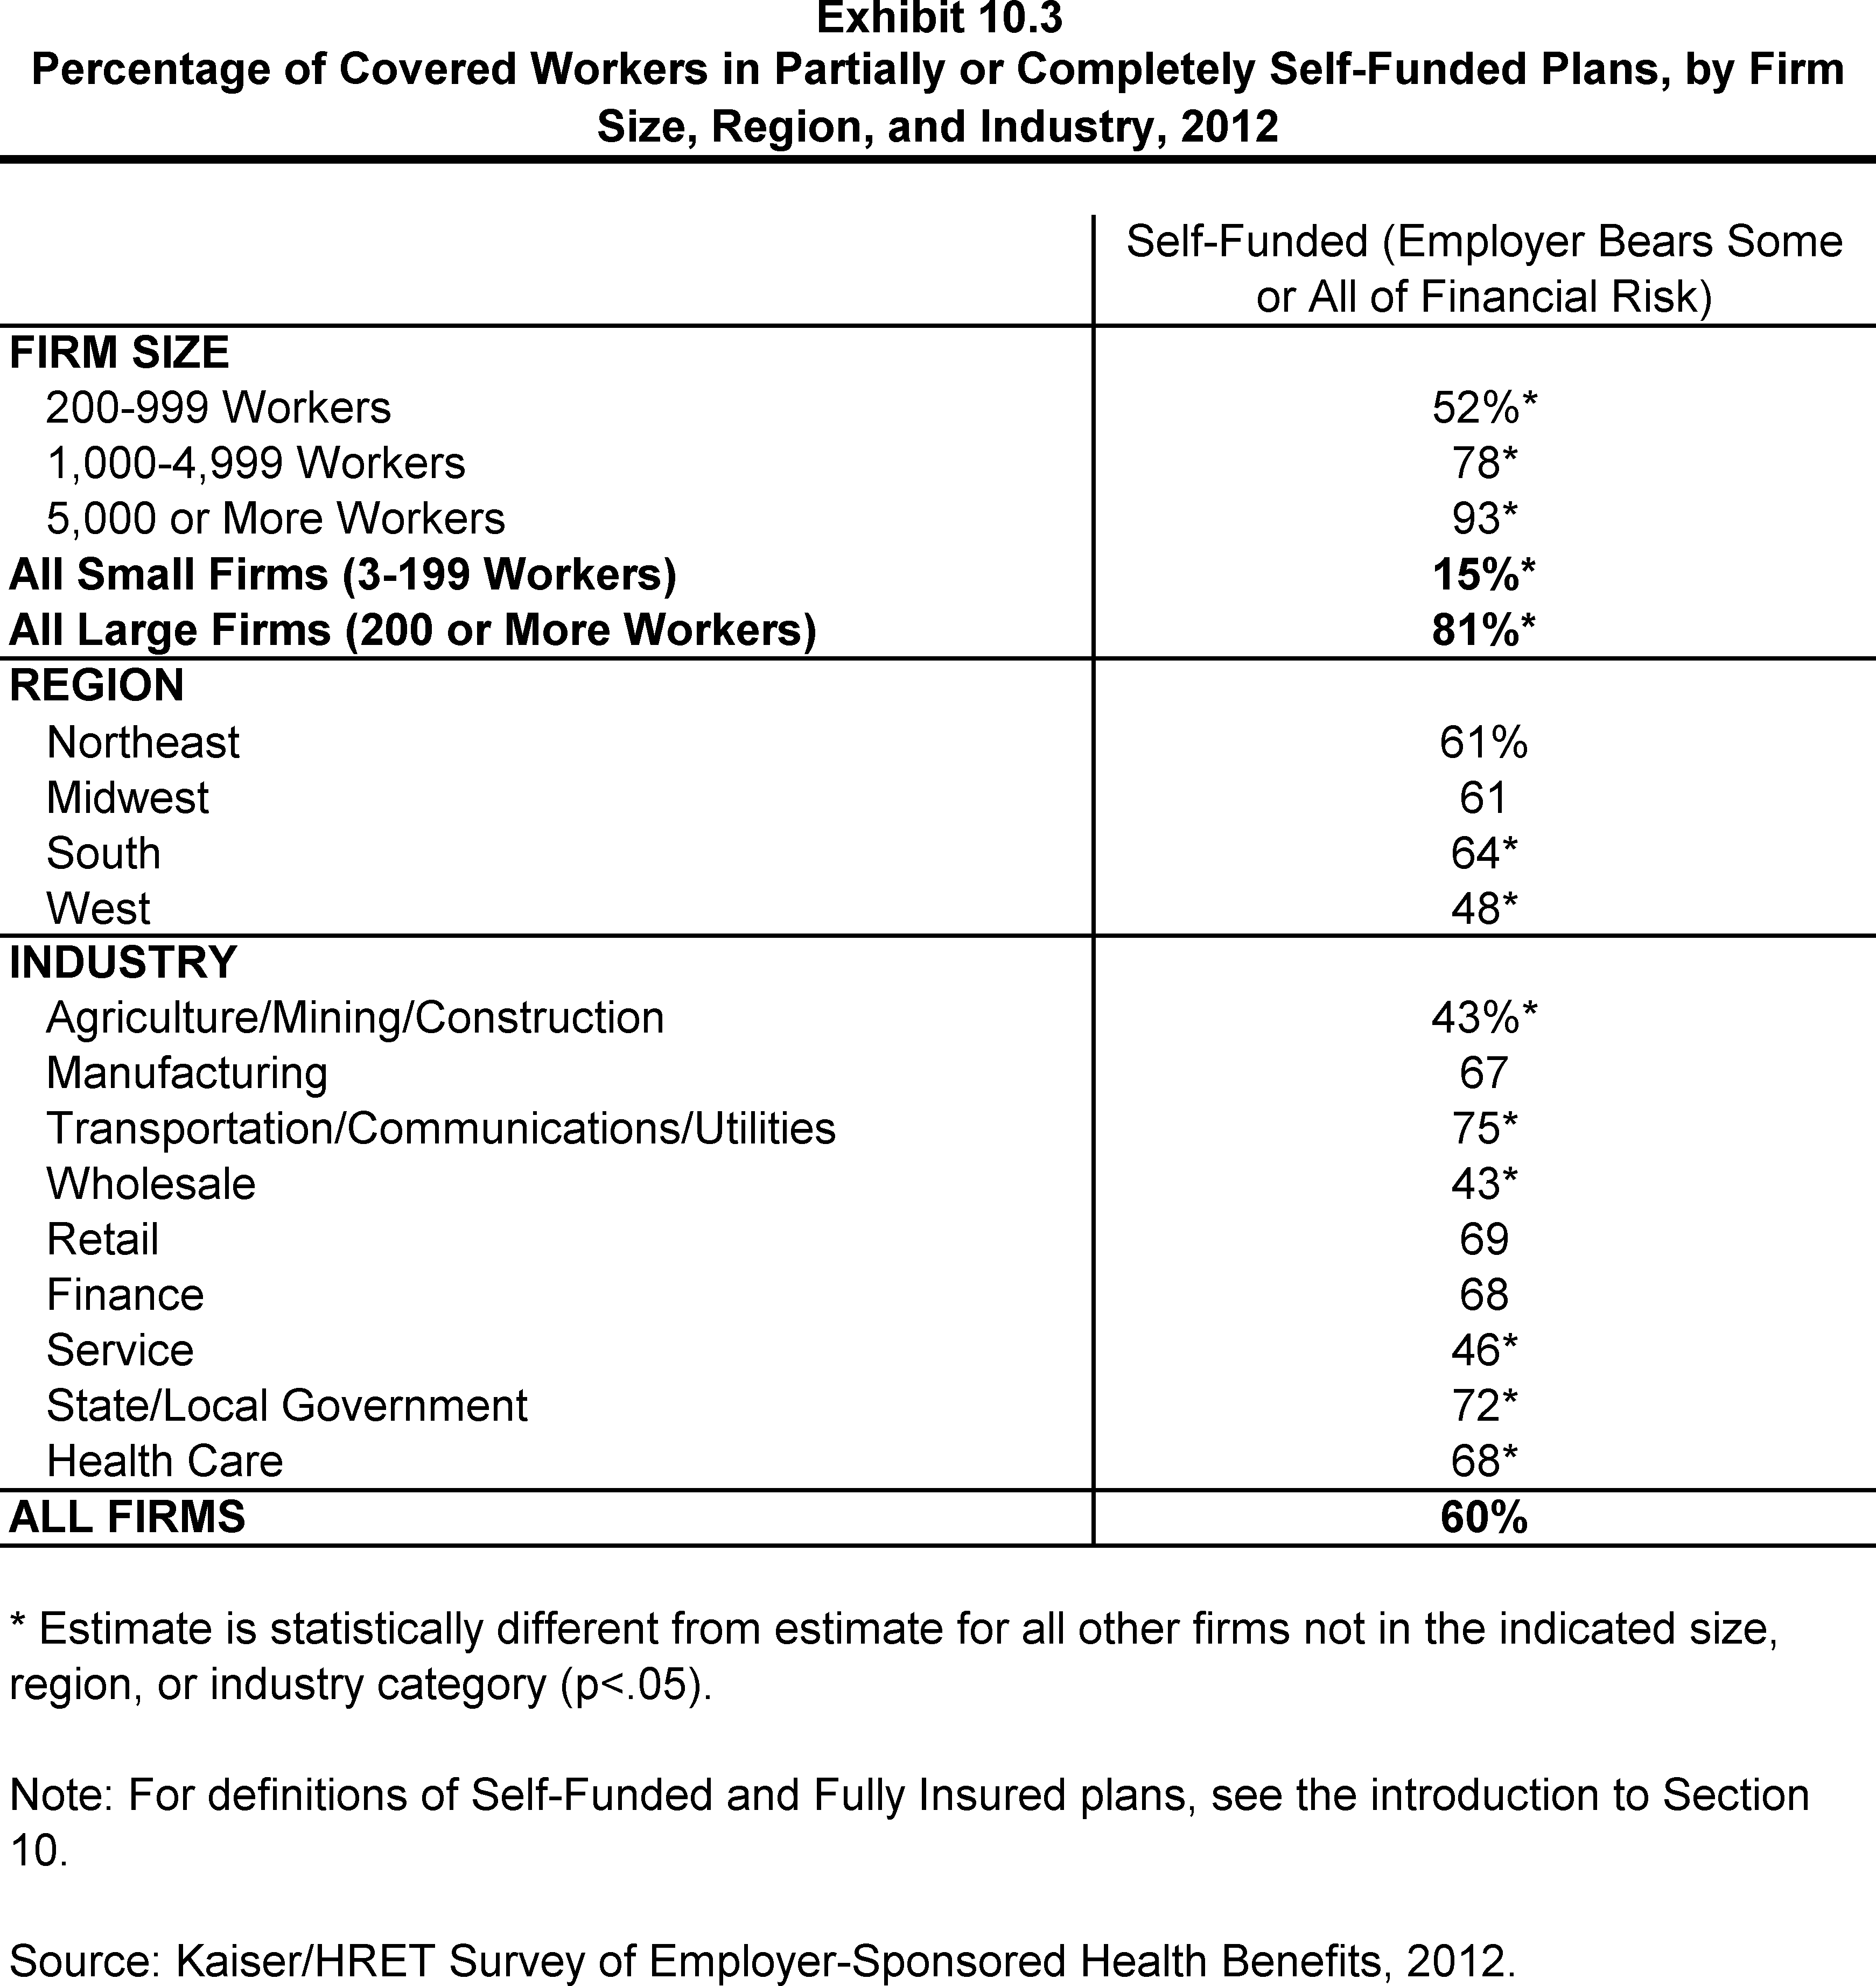
Percentage of Covered Workers in Partially or Completely Self-Funded Plans, by Firm Size, Region, and Industry, 2012
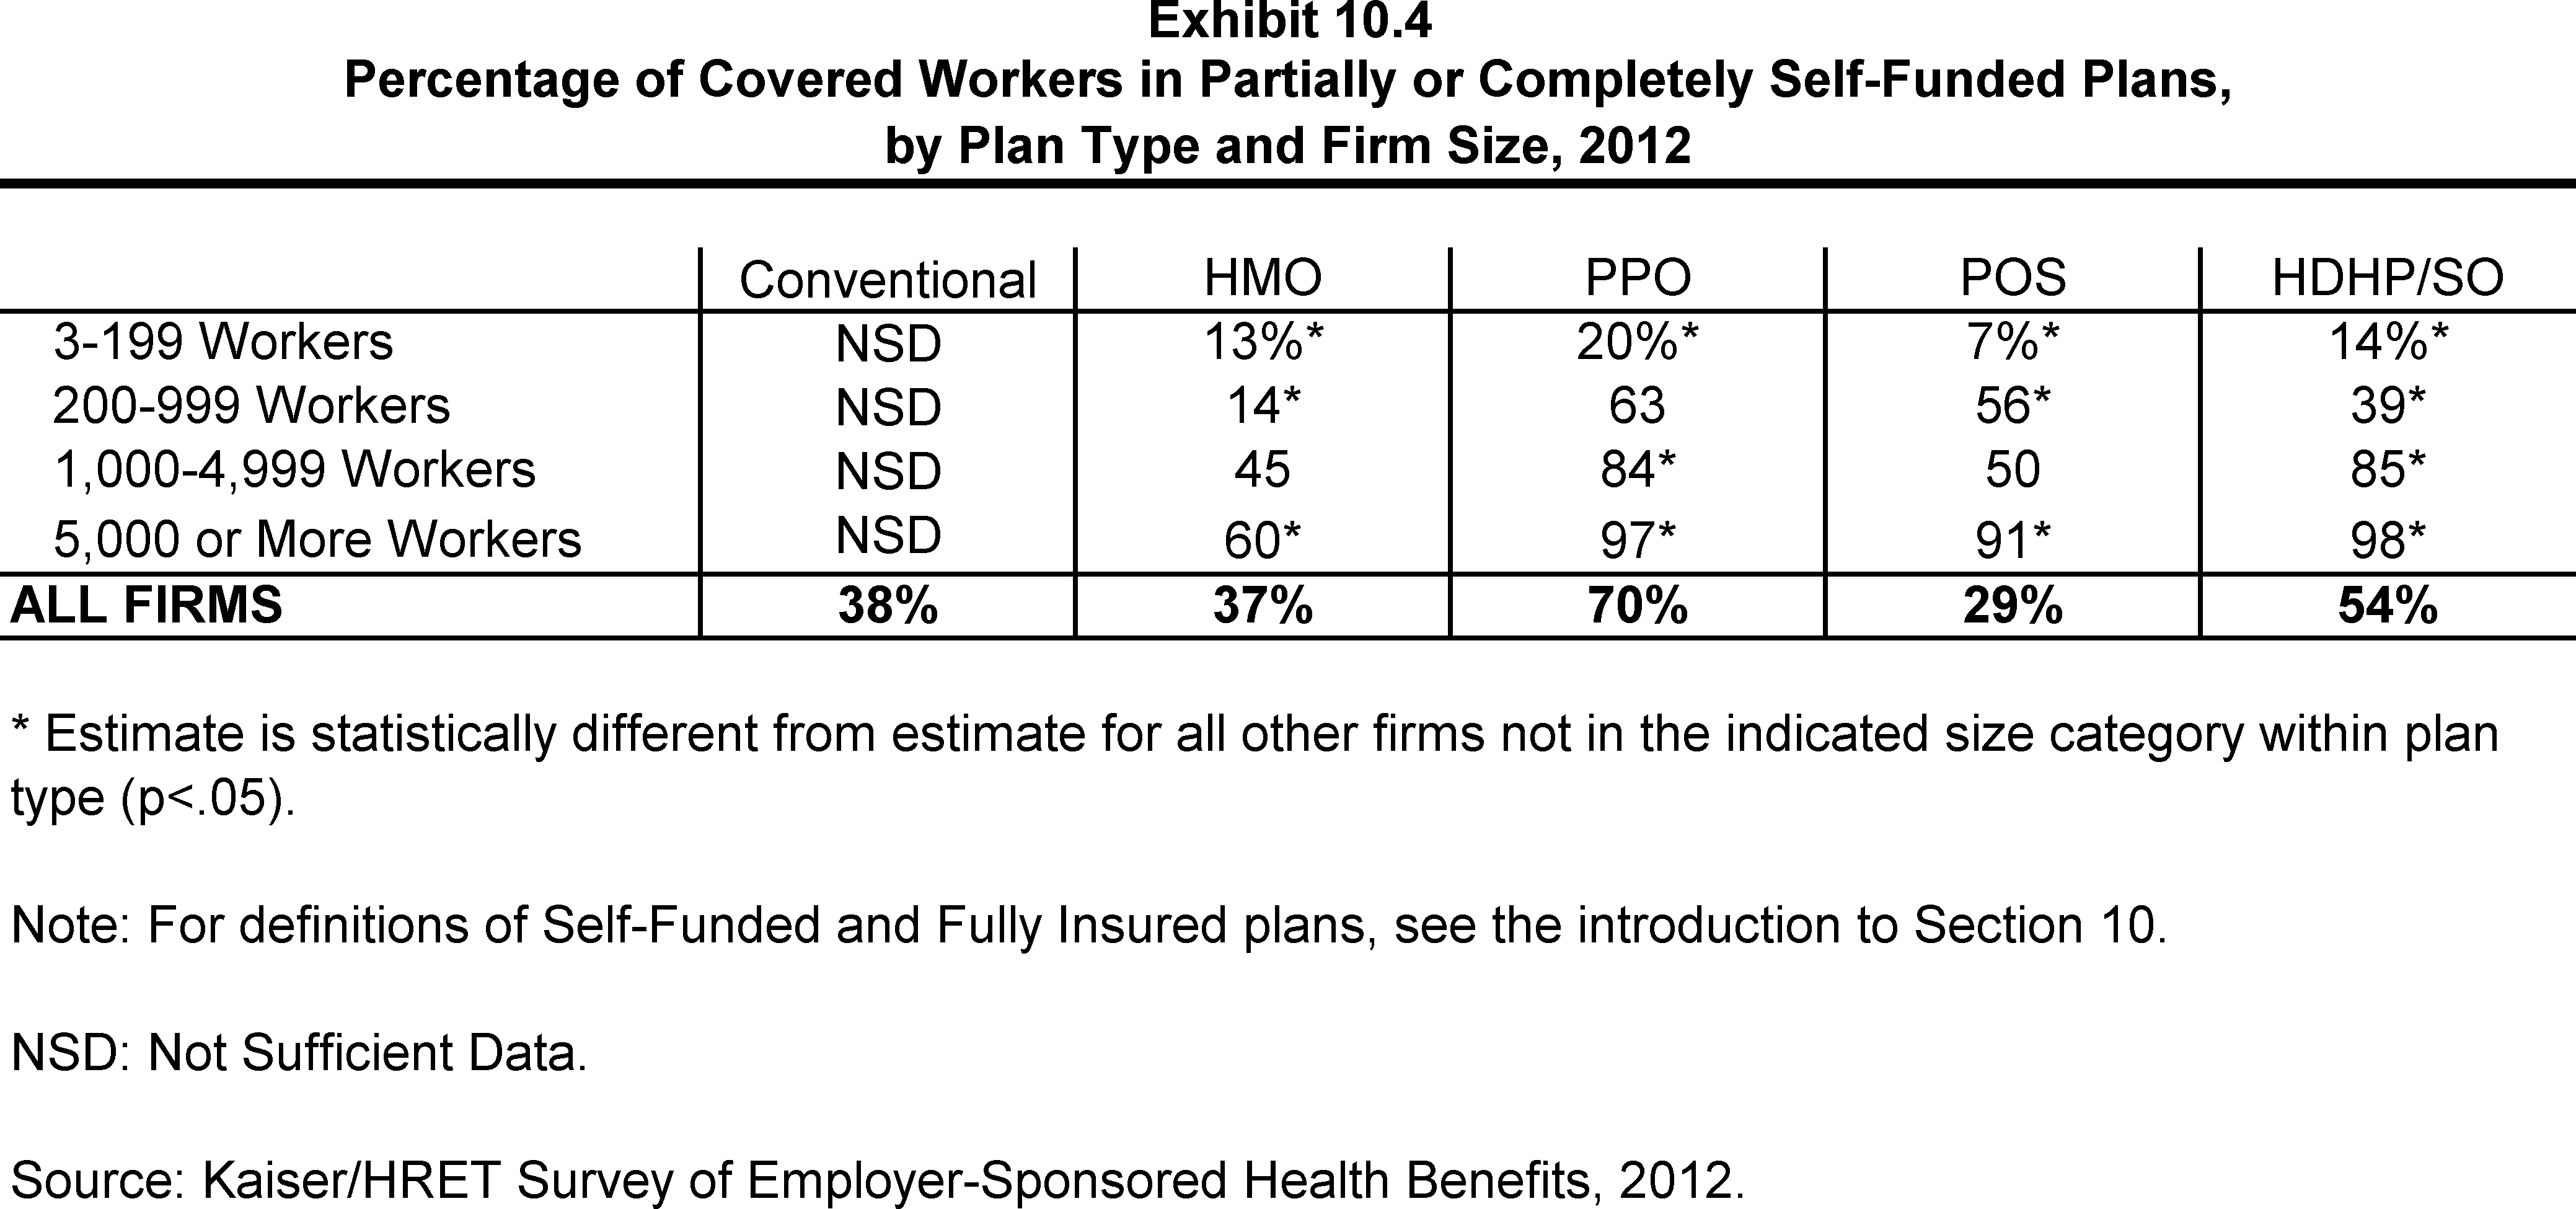
Percentage of Covered Workers in Partially or Completely Self-Funded Plans, by Plan Type and Firm Size, 2012
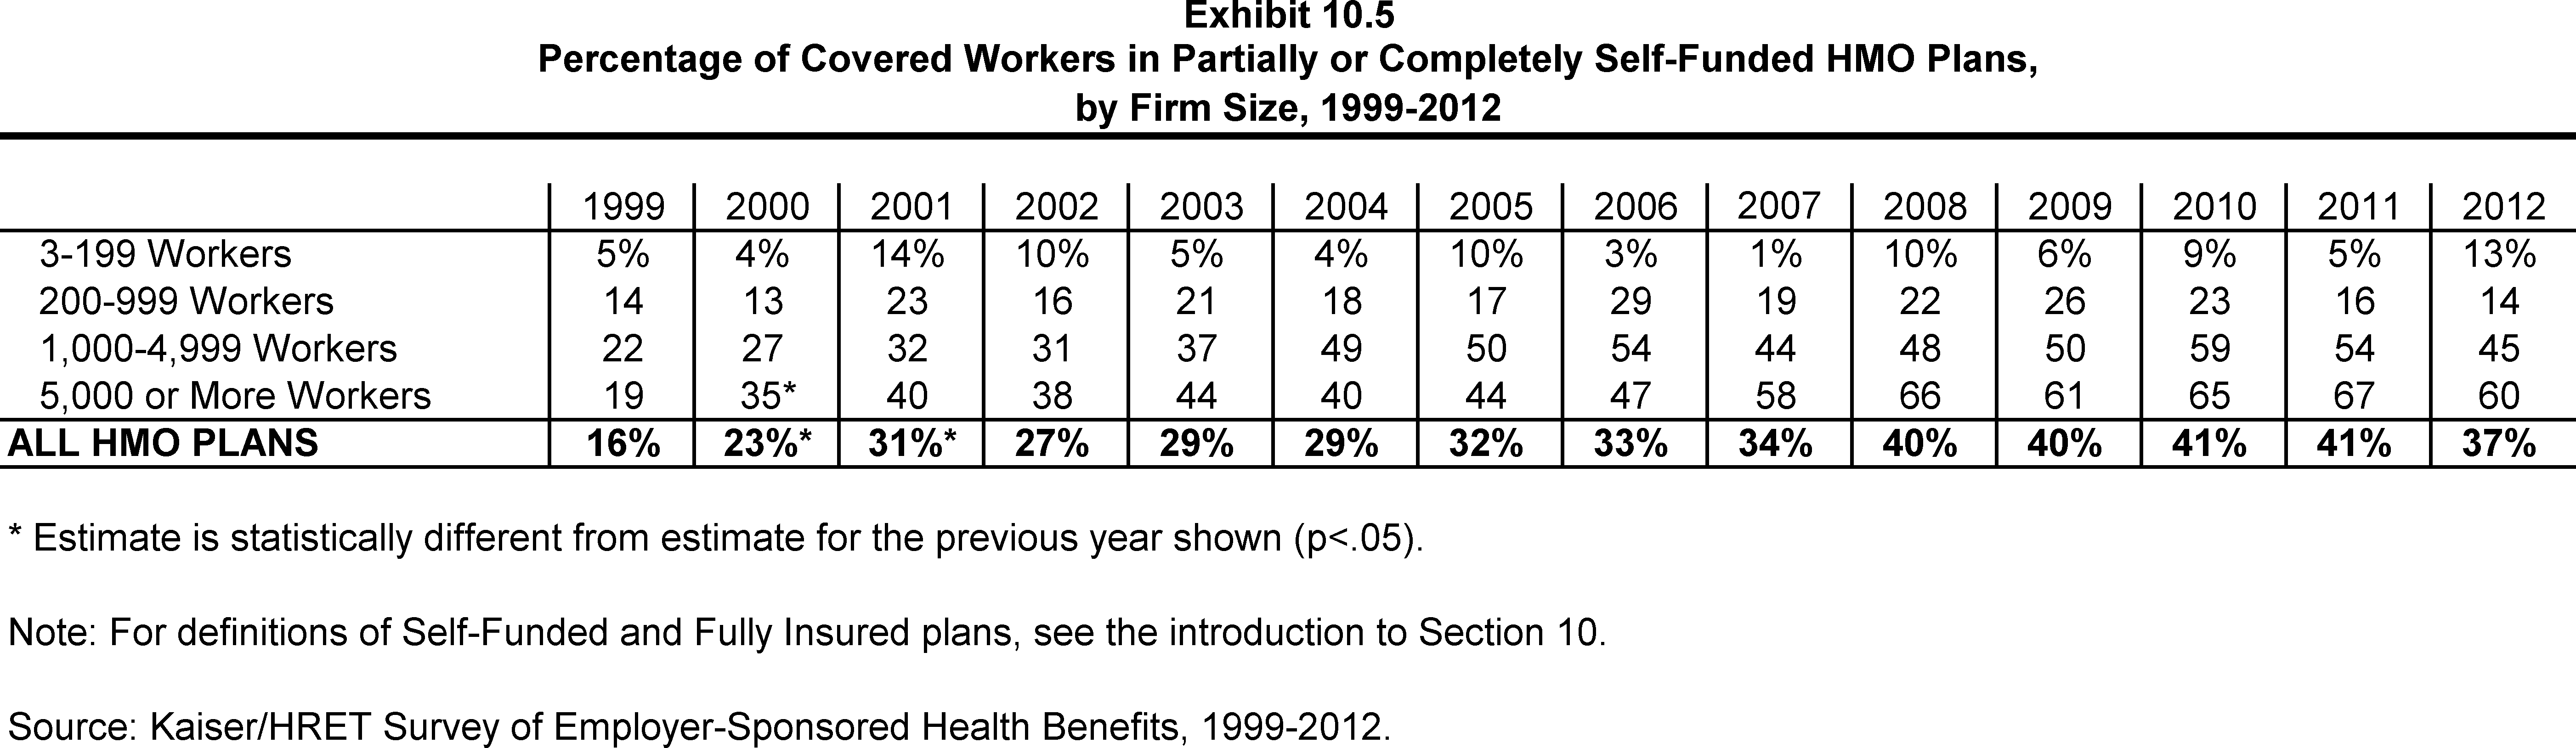
Percentage of Covered Workers in Partially or Completely Self-Funded HMO Plans, by Firm Size, 1999-2012

Percentage of Covered Workers in Partially or Completely Self-Funded PPO Plans, by Firm Size, 1999-2012
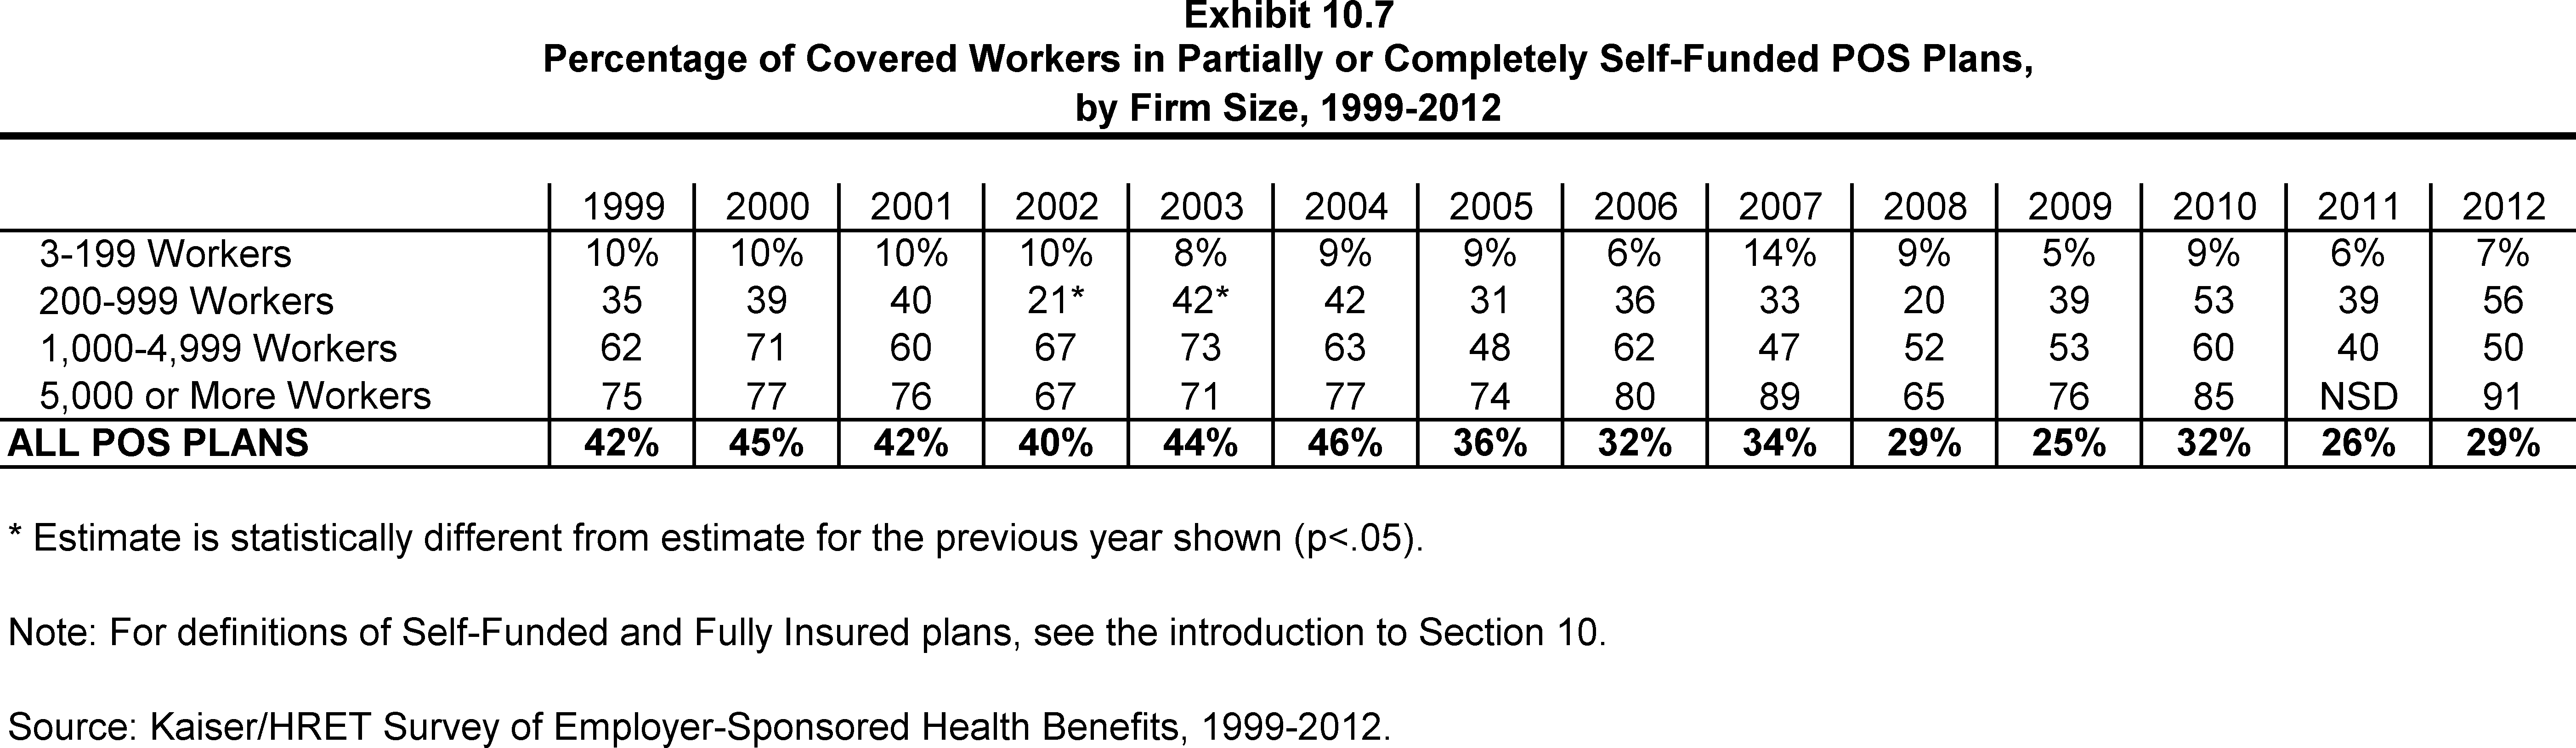
Percentage of Covered Workers in Partially or Completely Self-Funded POS Plans, by Firm Size, 1999-2012
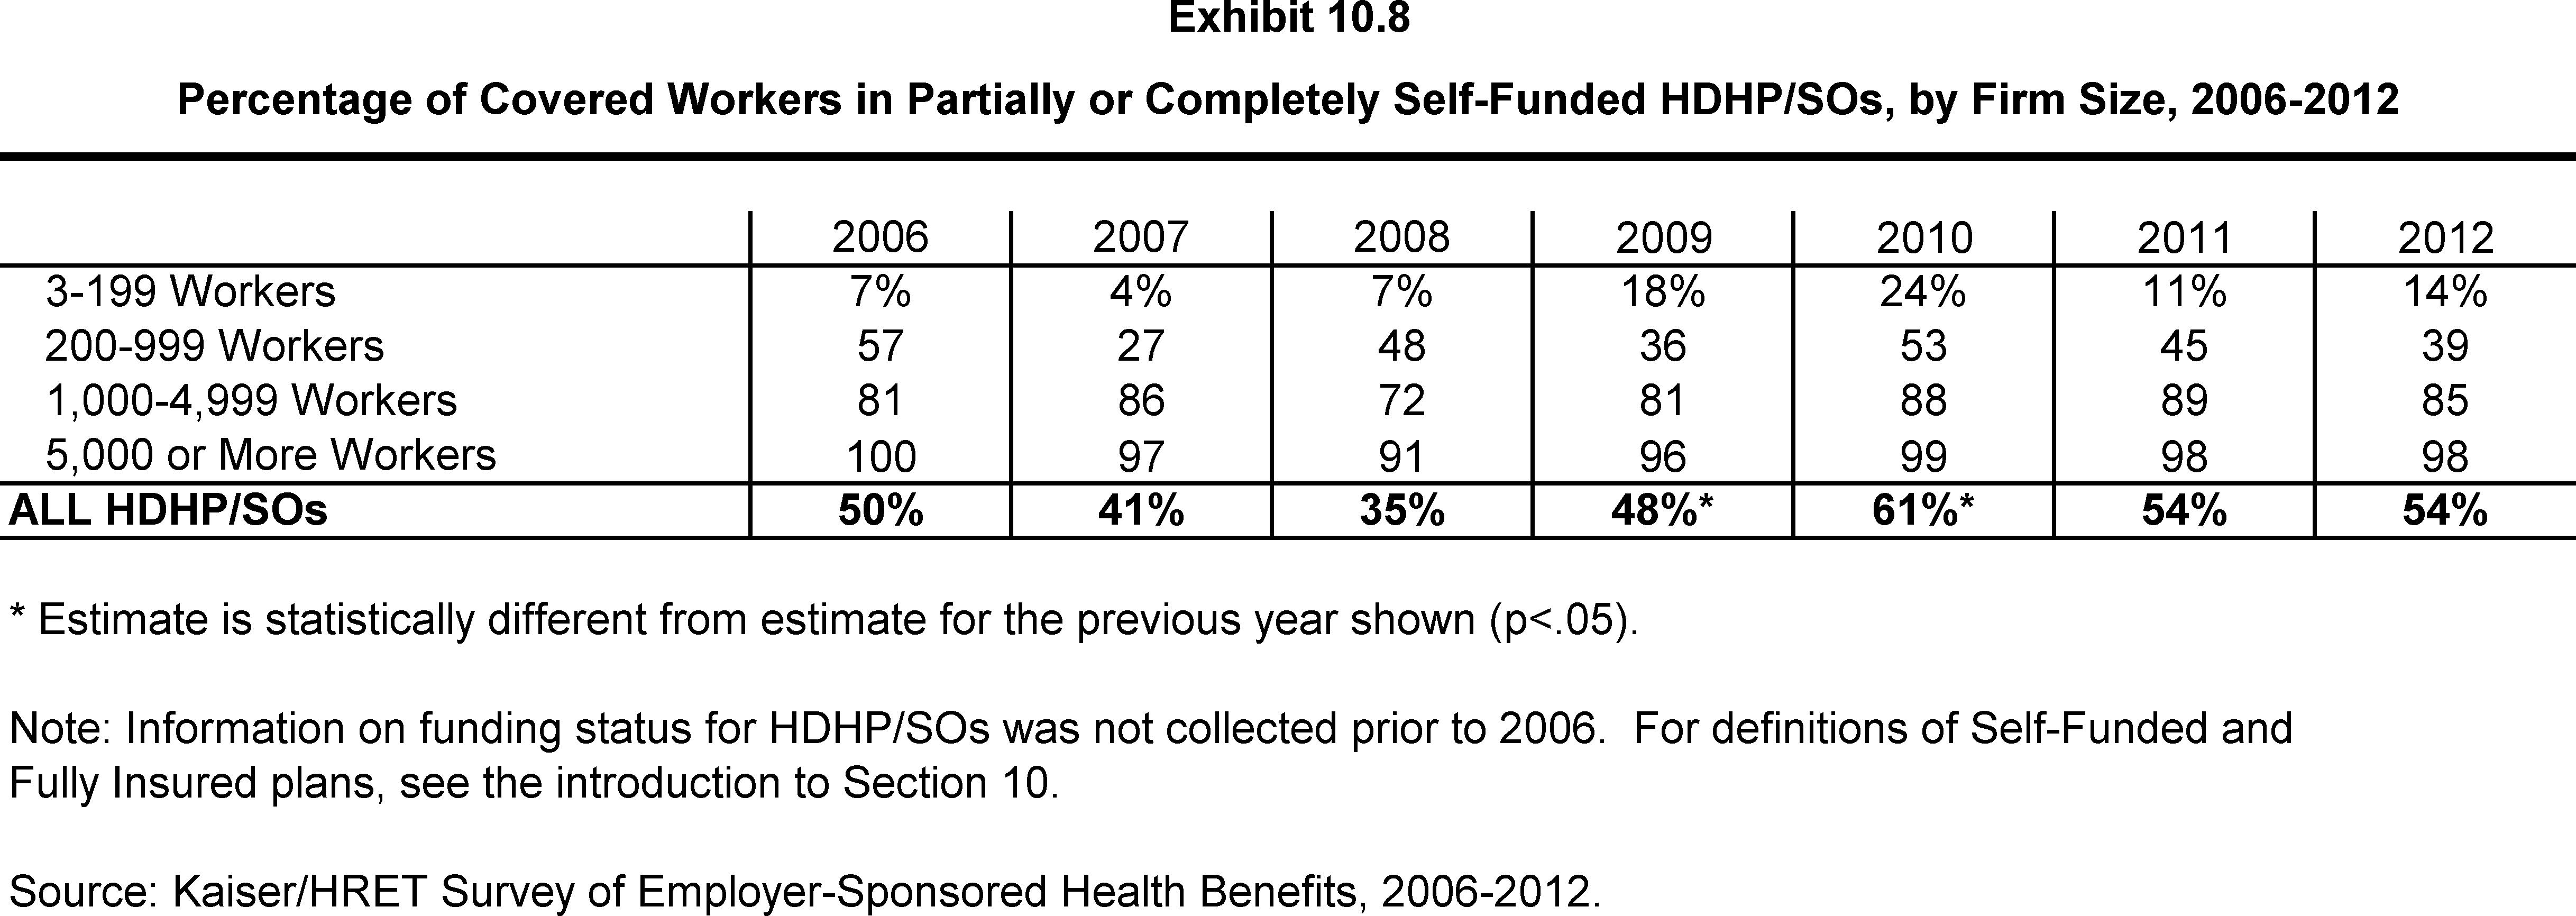
Percentage of Covered Workers in Partially or Completely Self-Funded HDHP/SOs, by Firm Size, 2006-2012
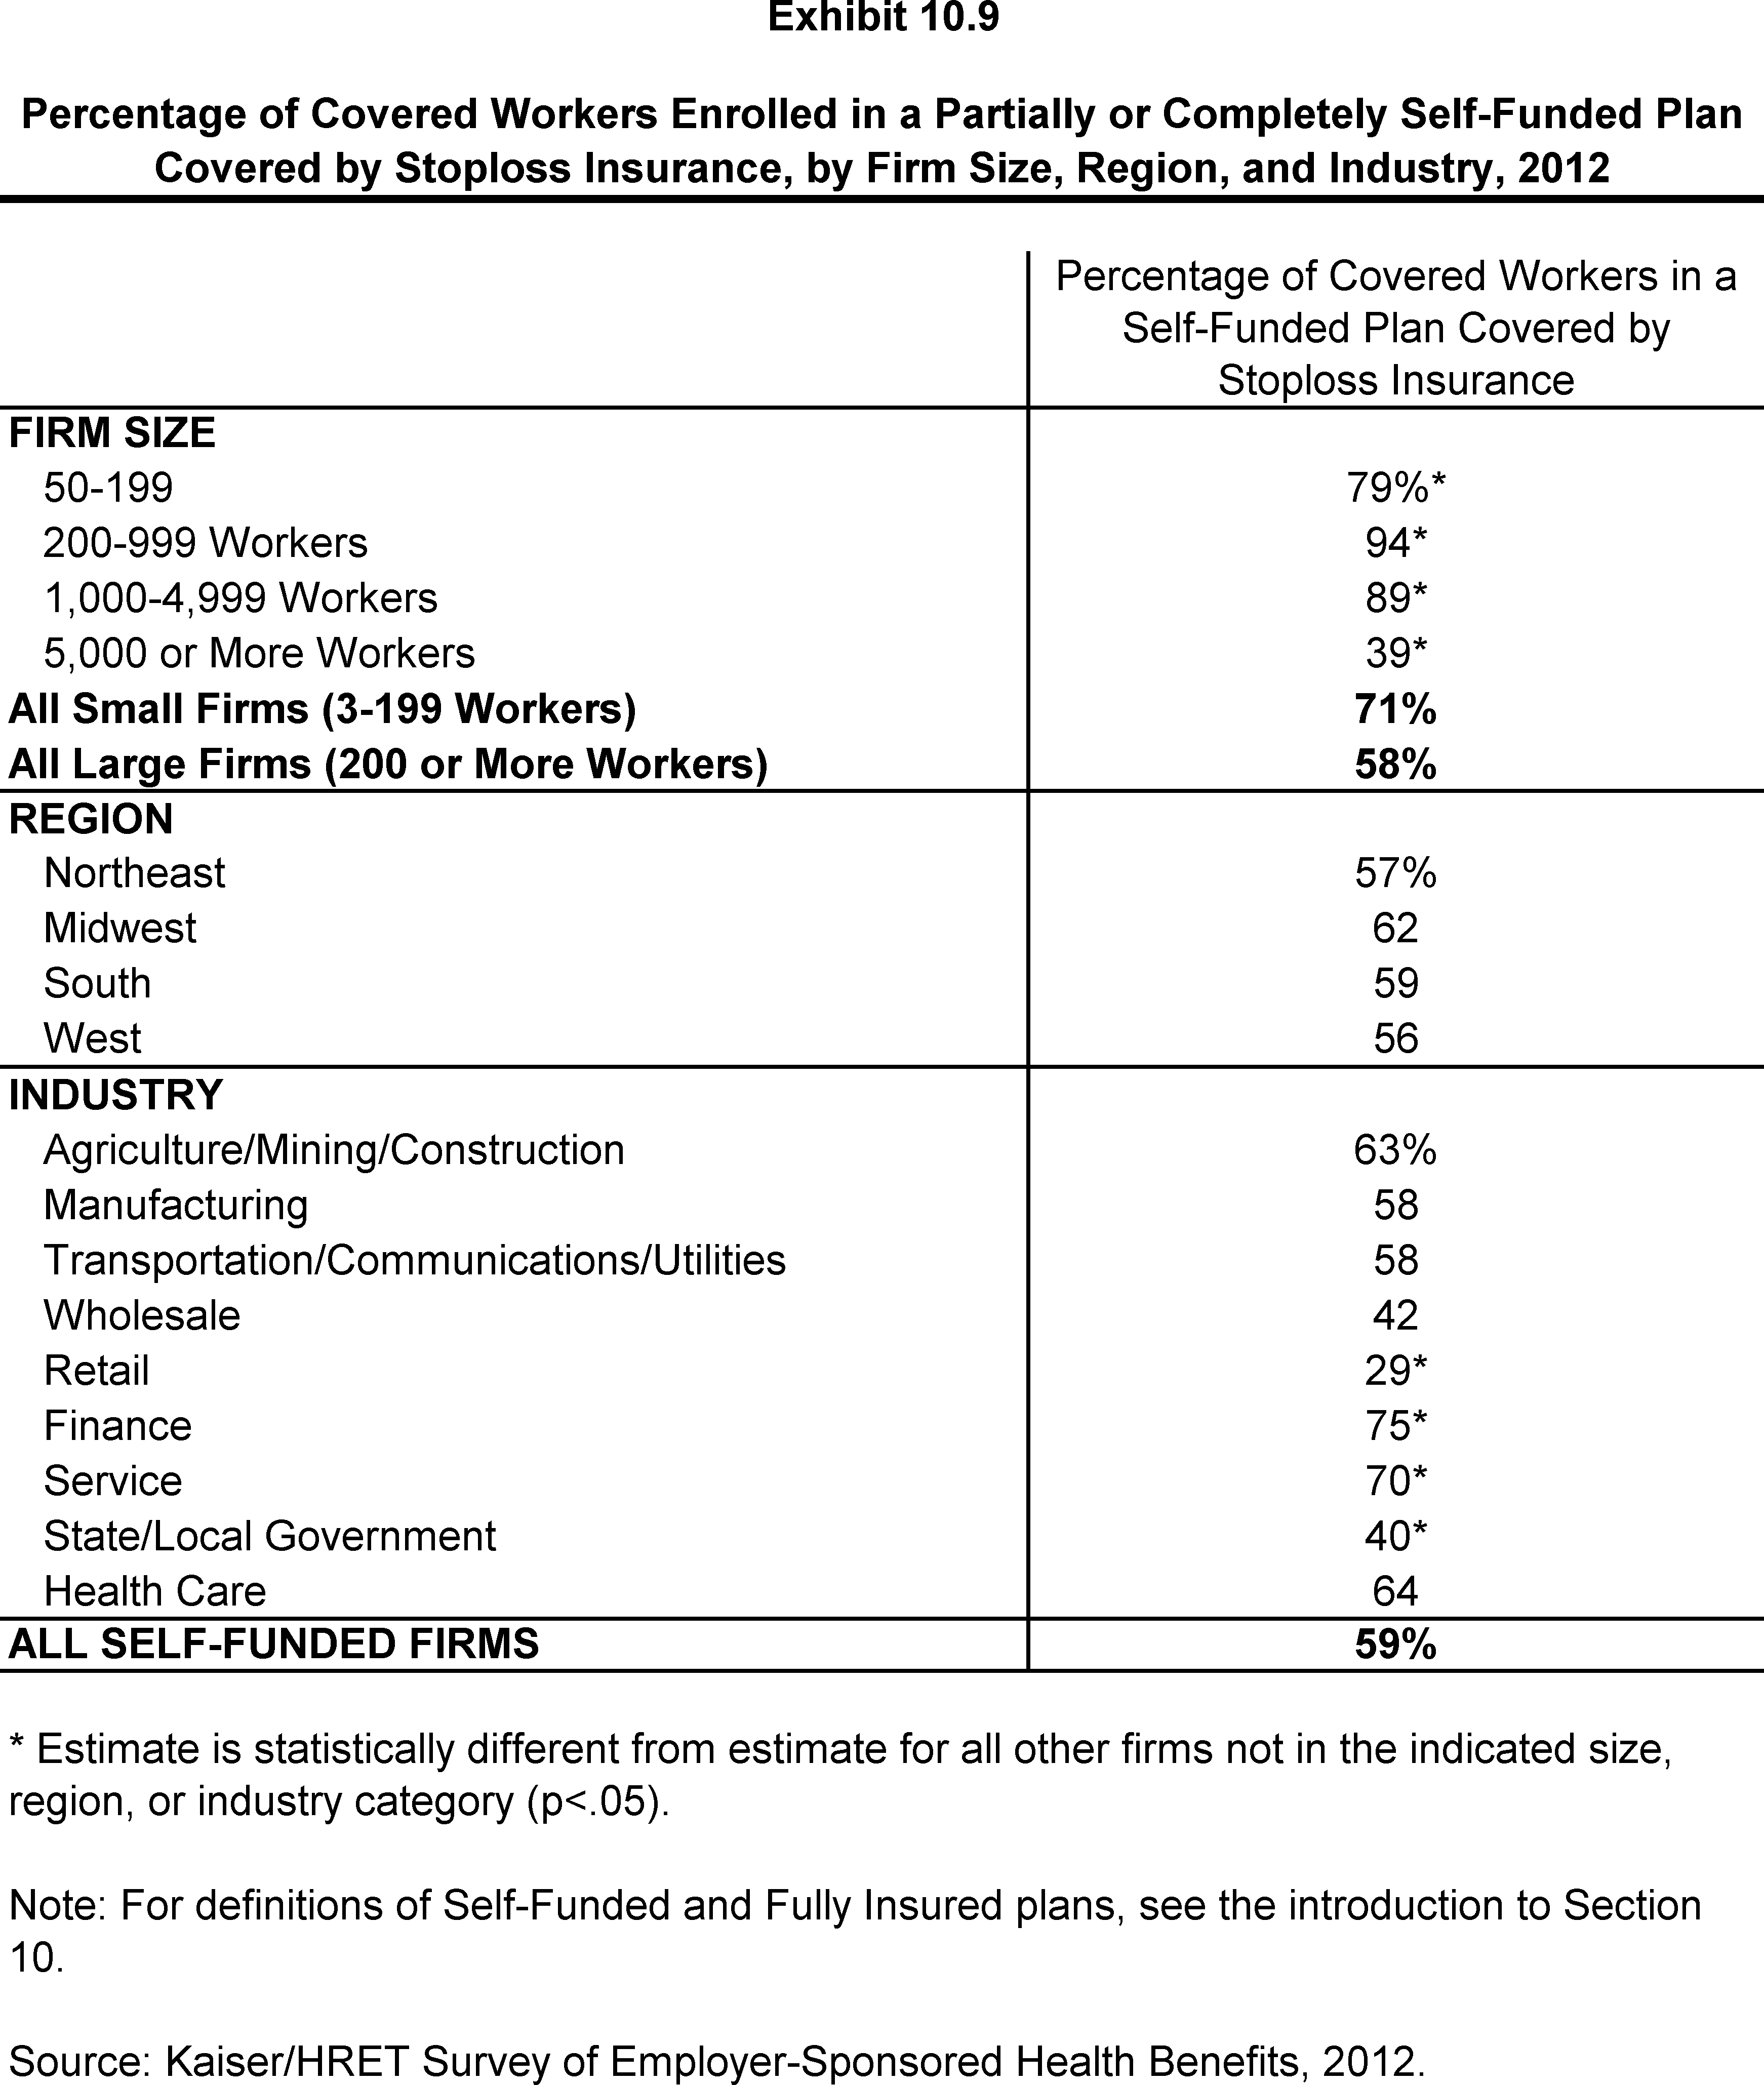
Percentage of Covered Workers Enrolled in a Partially or Completely Self-Funded Plan Covered by Stoploss Insurance, by Firm Size, Region, and Industry, 2012
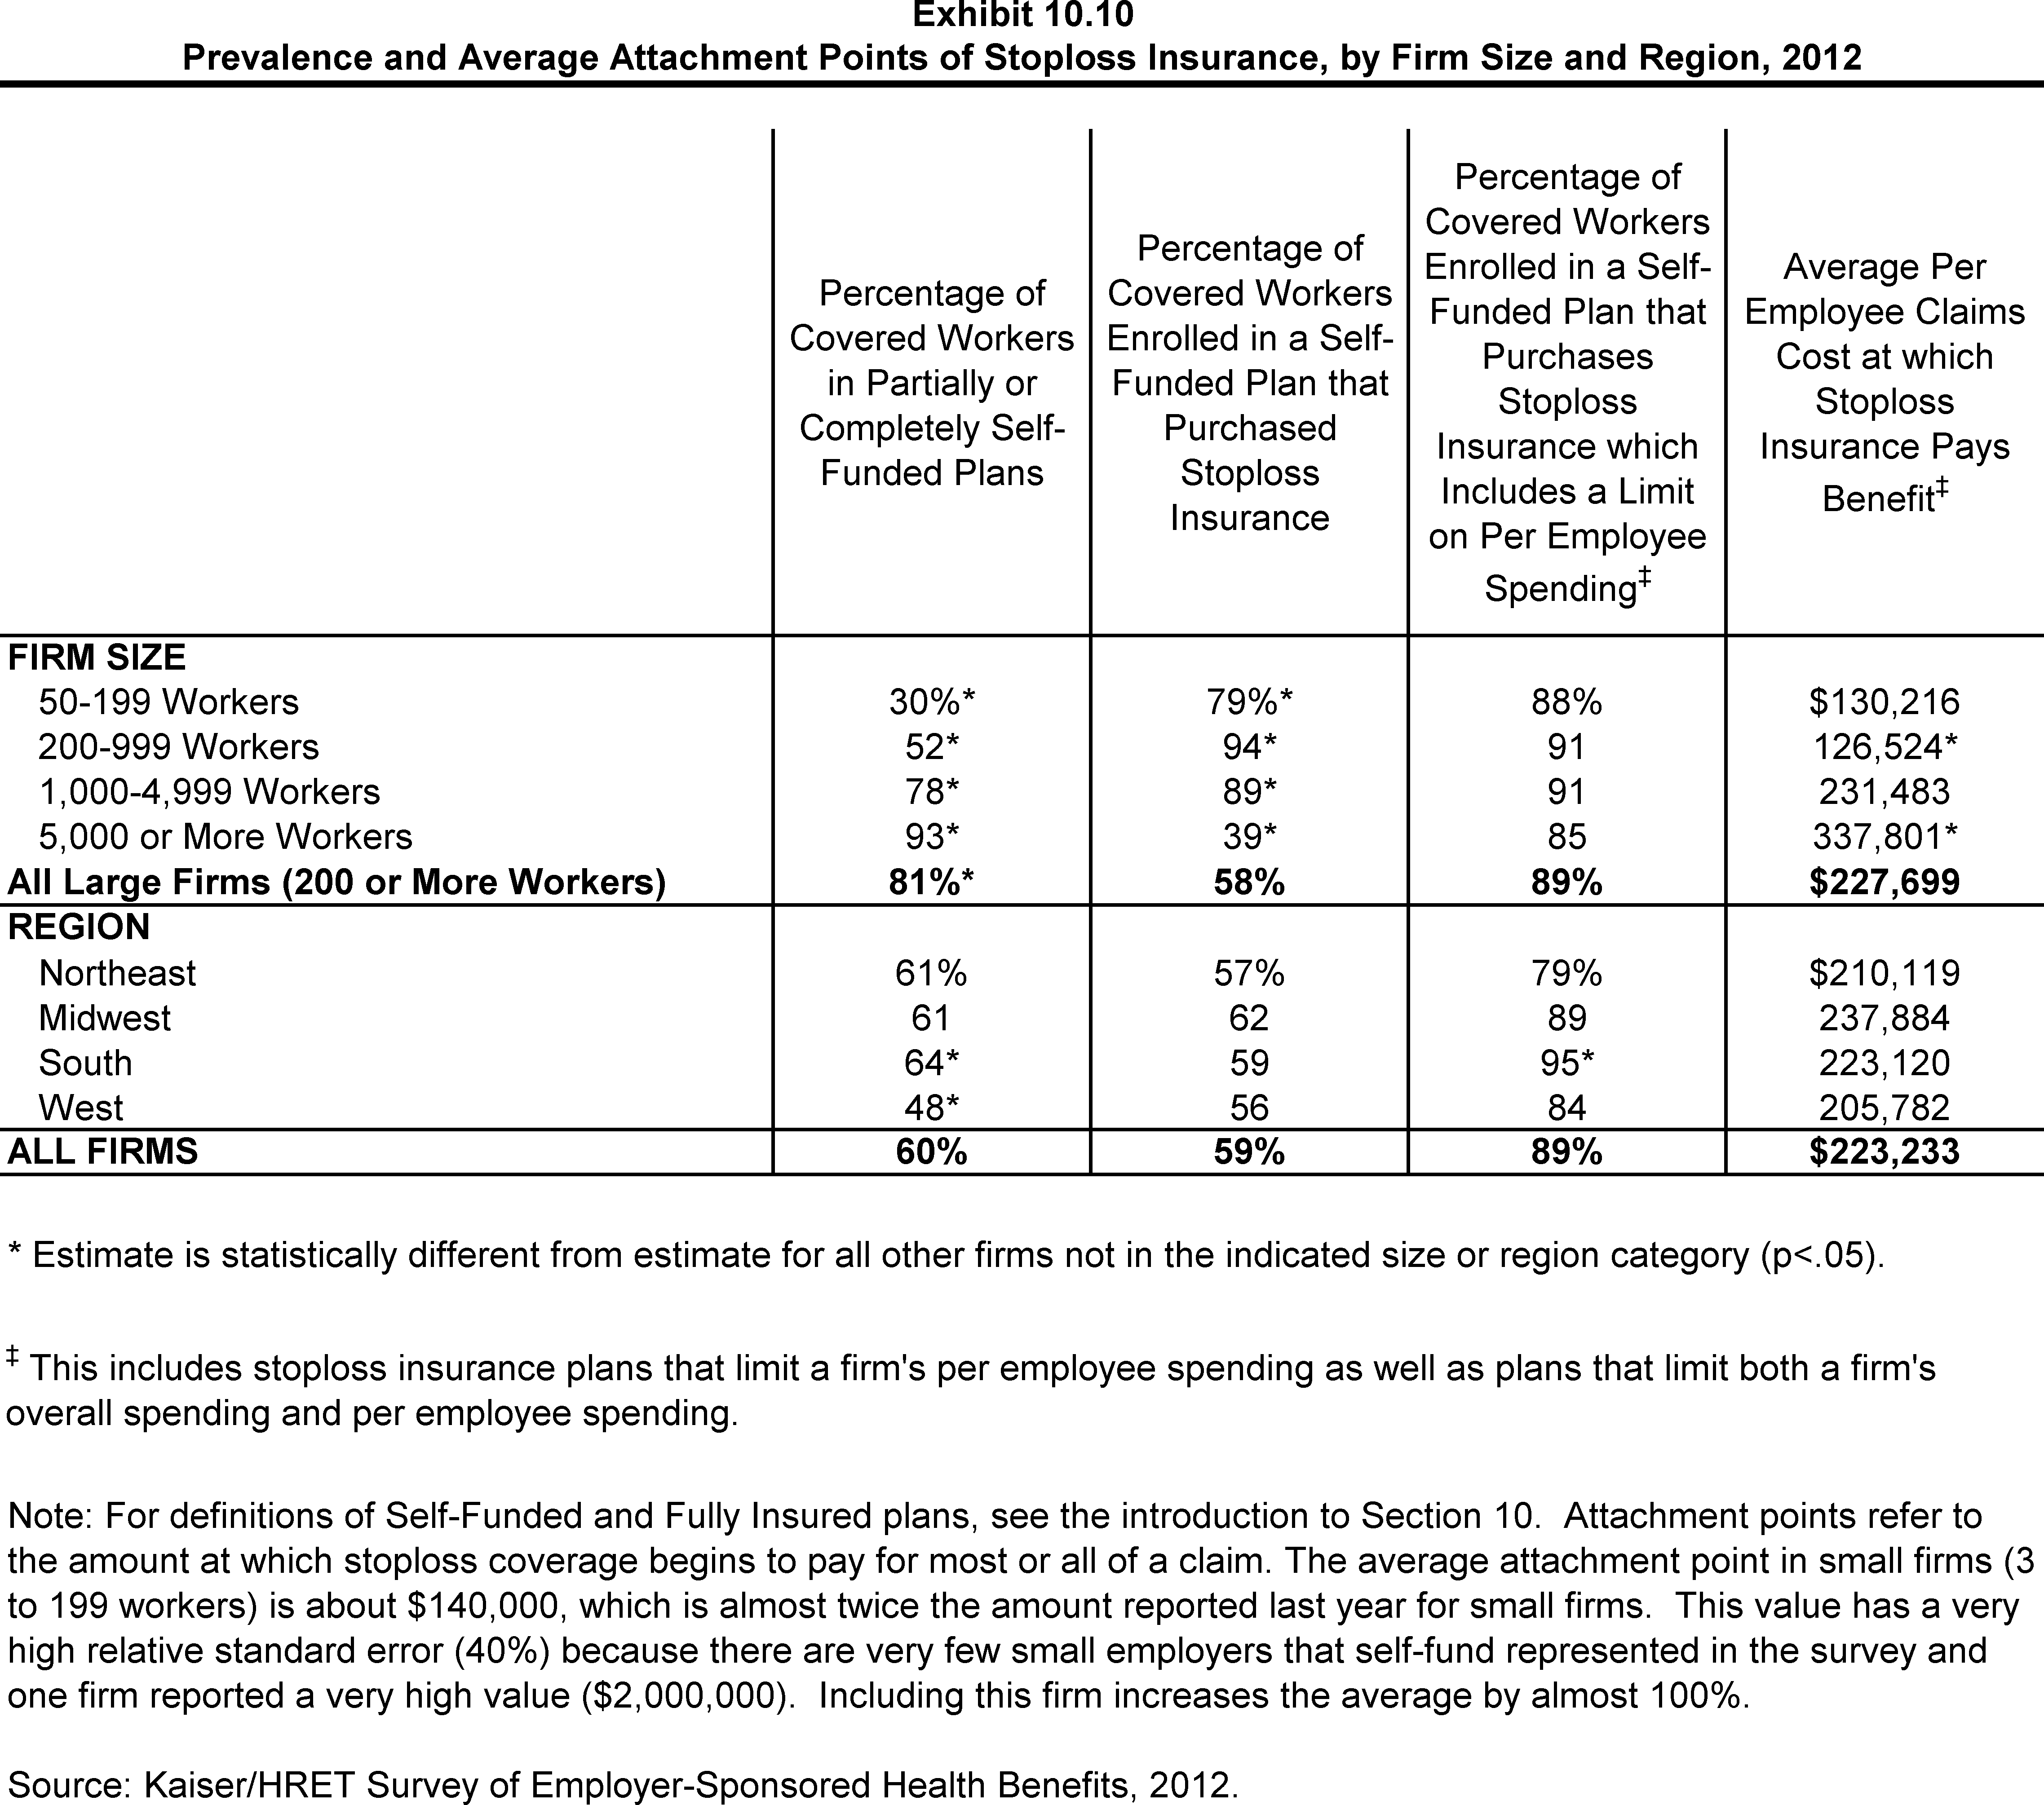
Prevalence and Average Attachment Points of Stoploss Insurance, by Firm Size and Region, 2012
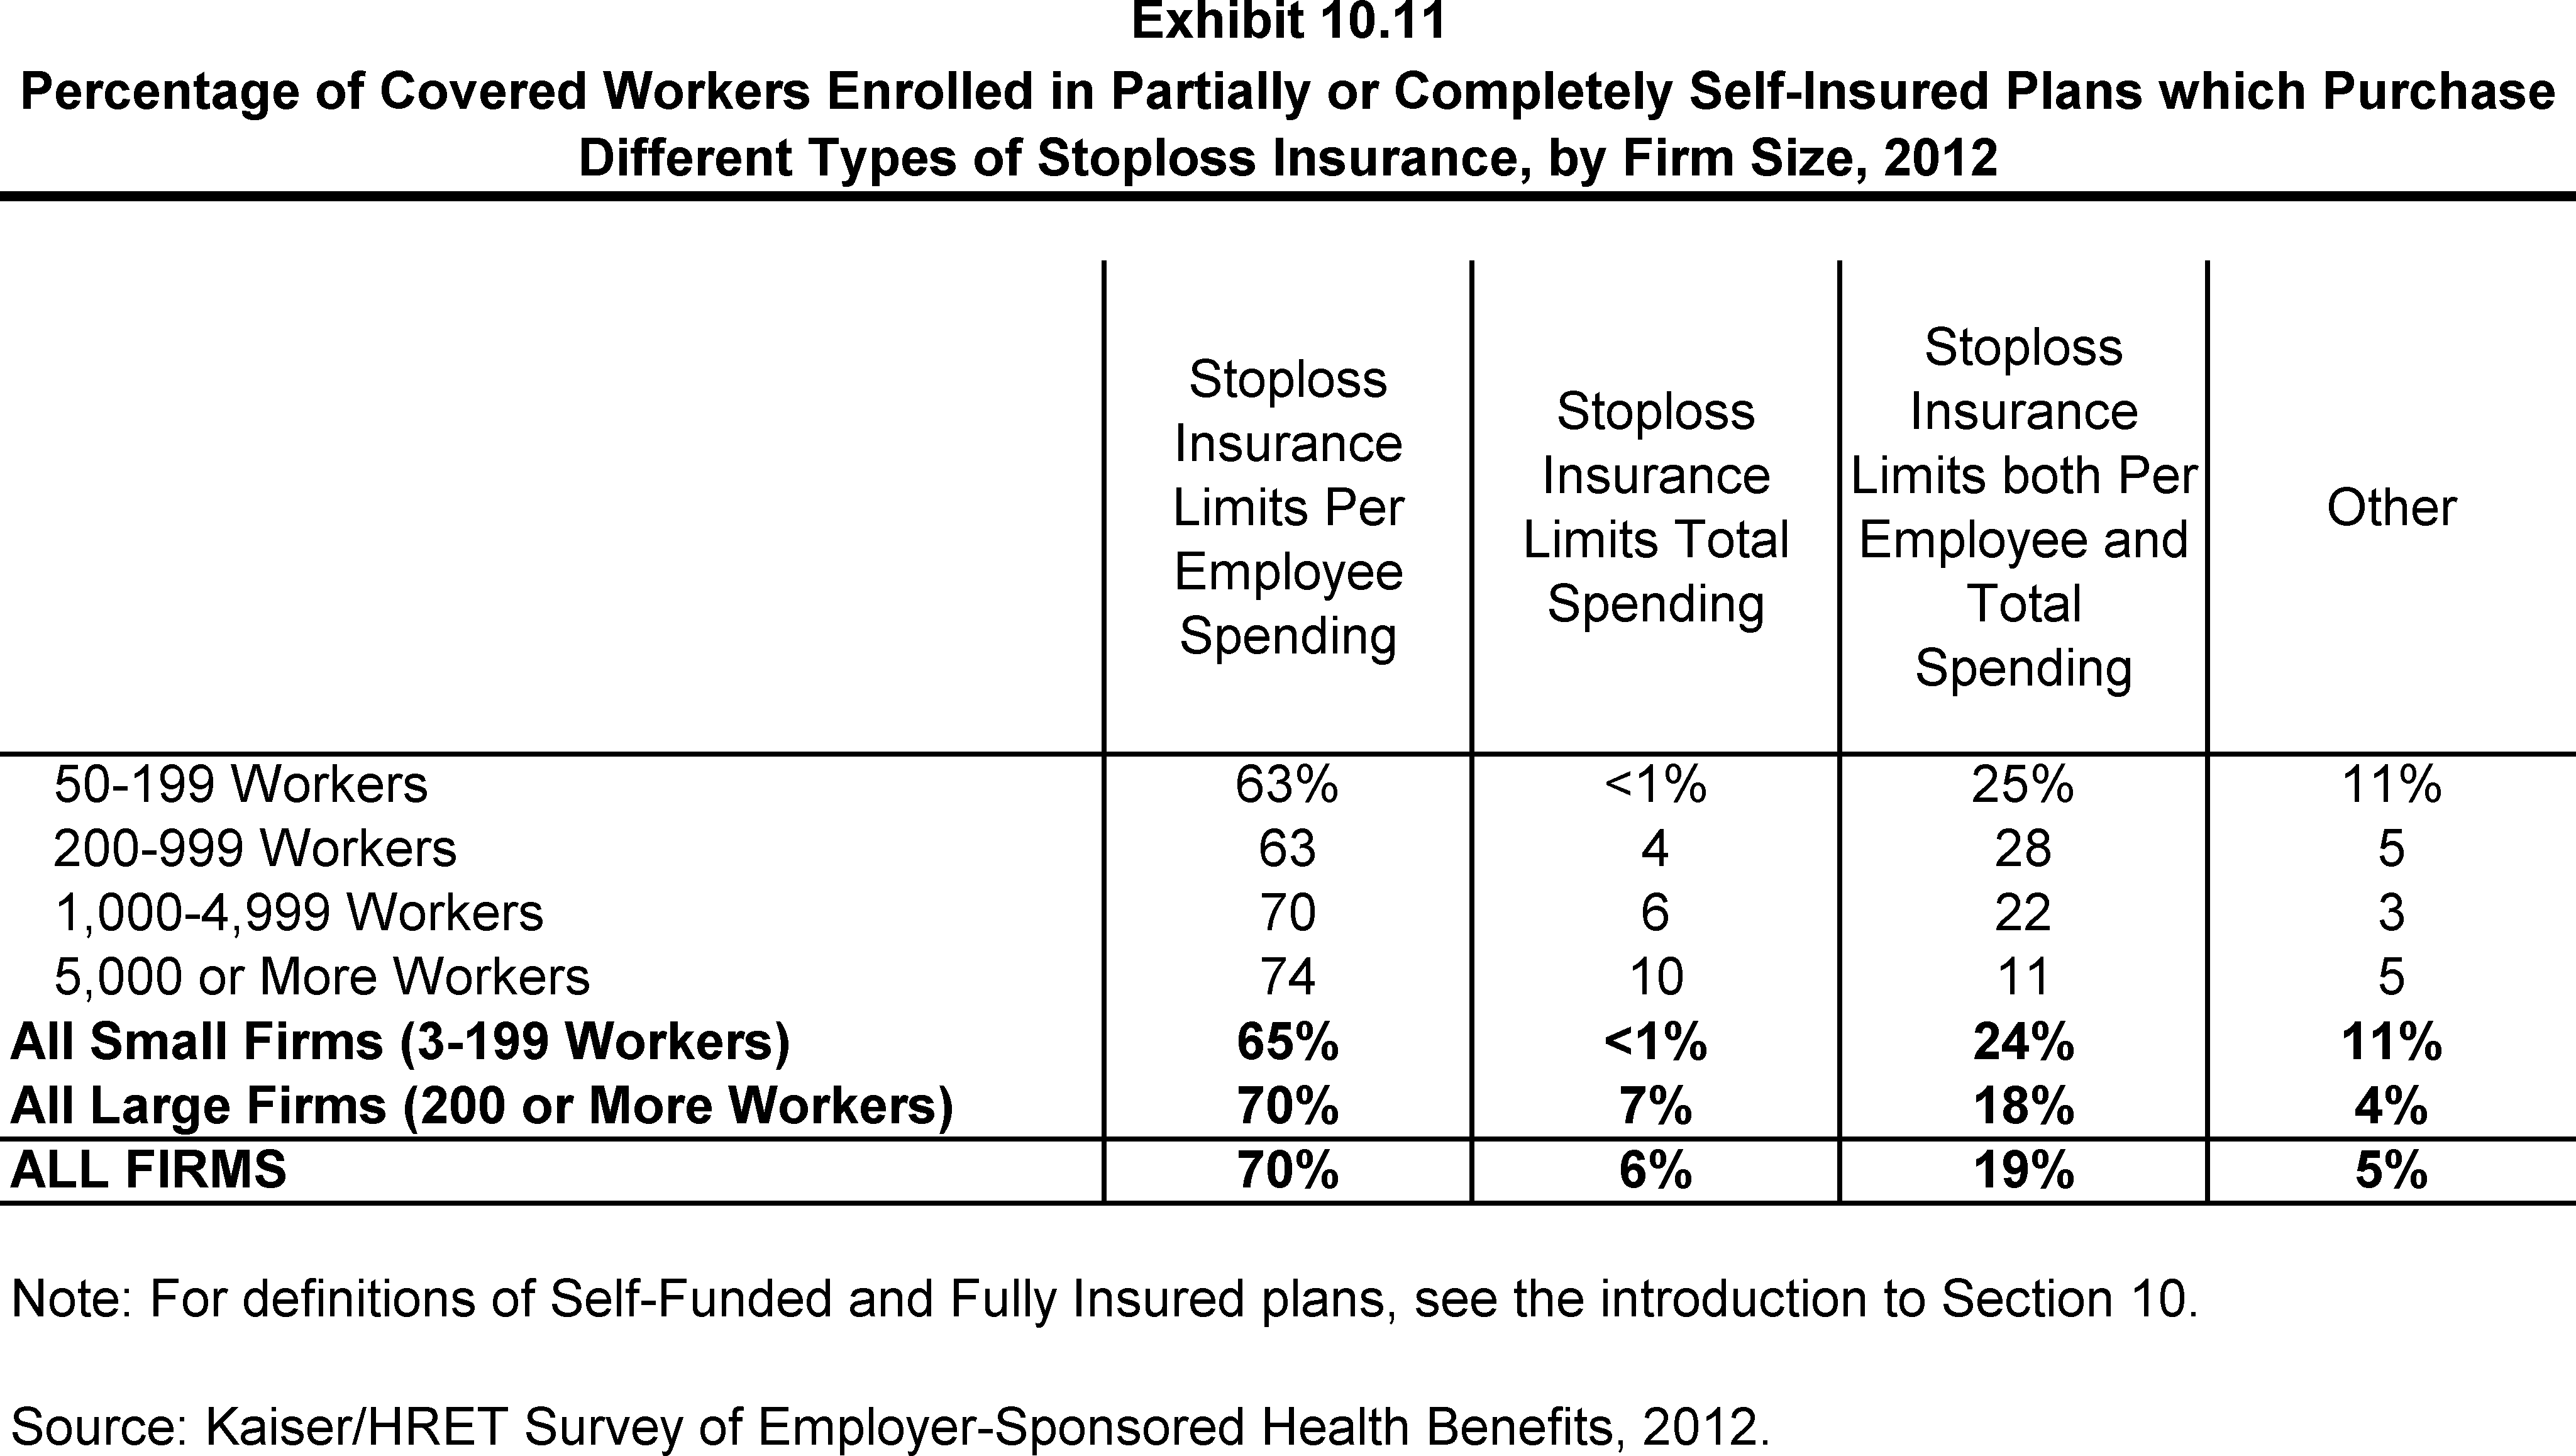
Percentage of Covered Workers Enrolled in Partially or Completely Self-Insured Plans which Purchase Different Types of Stoploss Insurance, by Firm Size, 2012
Section 11: Retiree Health Benefits
Retiree health benefits are an important consideration for older workers making decisions about their retirement. Health benefits for retirees provide an important supplement to Medicare for retirees age 65 or older. Among firms offering health benefits to their workers, large firms (200 or more workers) are much more likely than small firms (3-199 workers) to offer retiree health benefits.
- Twenty-five percent of large firms (200 or more workers) that offer health benefits to their employees offer retiree coverage in 2012, similar to 26% in 2011. There has been a downward trend in the percentage of firms offering retirees coverage, from 32% in 2005 and 66% in 1988 (Exhibit 11.1).
- The offering of retiree health benefits varies considerably by firm characteristics.
- Large firms are much more likely to offer retiree health benefits than small firms – 25% vs. 4% (Exhibit 11.2).
- Among large firms that offer health benefits, state and local governments are more likely (77%) than large firms in other industries to offer retiree health benefits. In contrast, large firms in the retail industry are less likely (9%) to offer retiree health benefits when compared to large firms in other industries (Exhibit 11.2).
- Large firms with fewer lower-wage workers (less than 35% of workers earn $24,000 or less annually) are more likely to offer retiree health benefits than large firms with many lower-wage workers (35% or more of workers earn $24,000 or less annually) (27% vs. 11%) (Exhibit 11.3). A comparable pattern exists in firms with a larger proportion of higher-wage workers (35% or more earn $55,000 or more annually).
- Large firms with union workers are more likely to offer retiree health benefits than large firms without union workers – 40% vs. 20% (Exhibit 11.3).
- Among firms offering retiree health benefits, most large firms offer them to early retirees under the age of 65 (88%). A lower percentage (74%) of large firms offering retiree health benefits offer them to Medicare-age retirees .
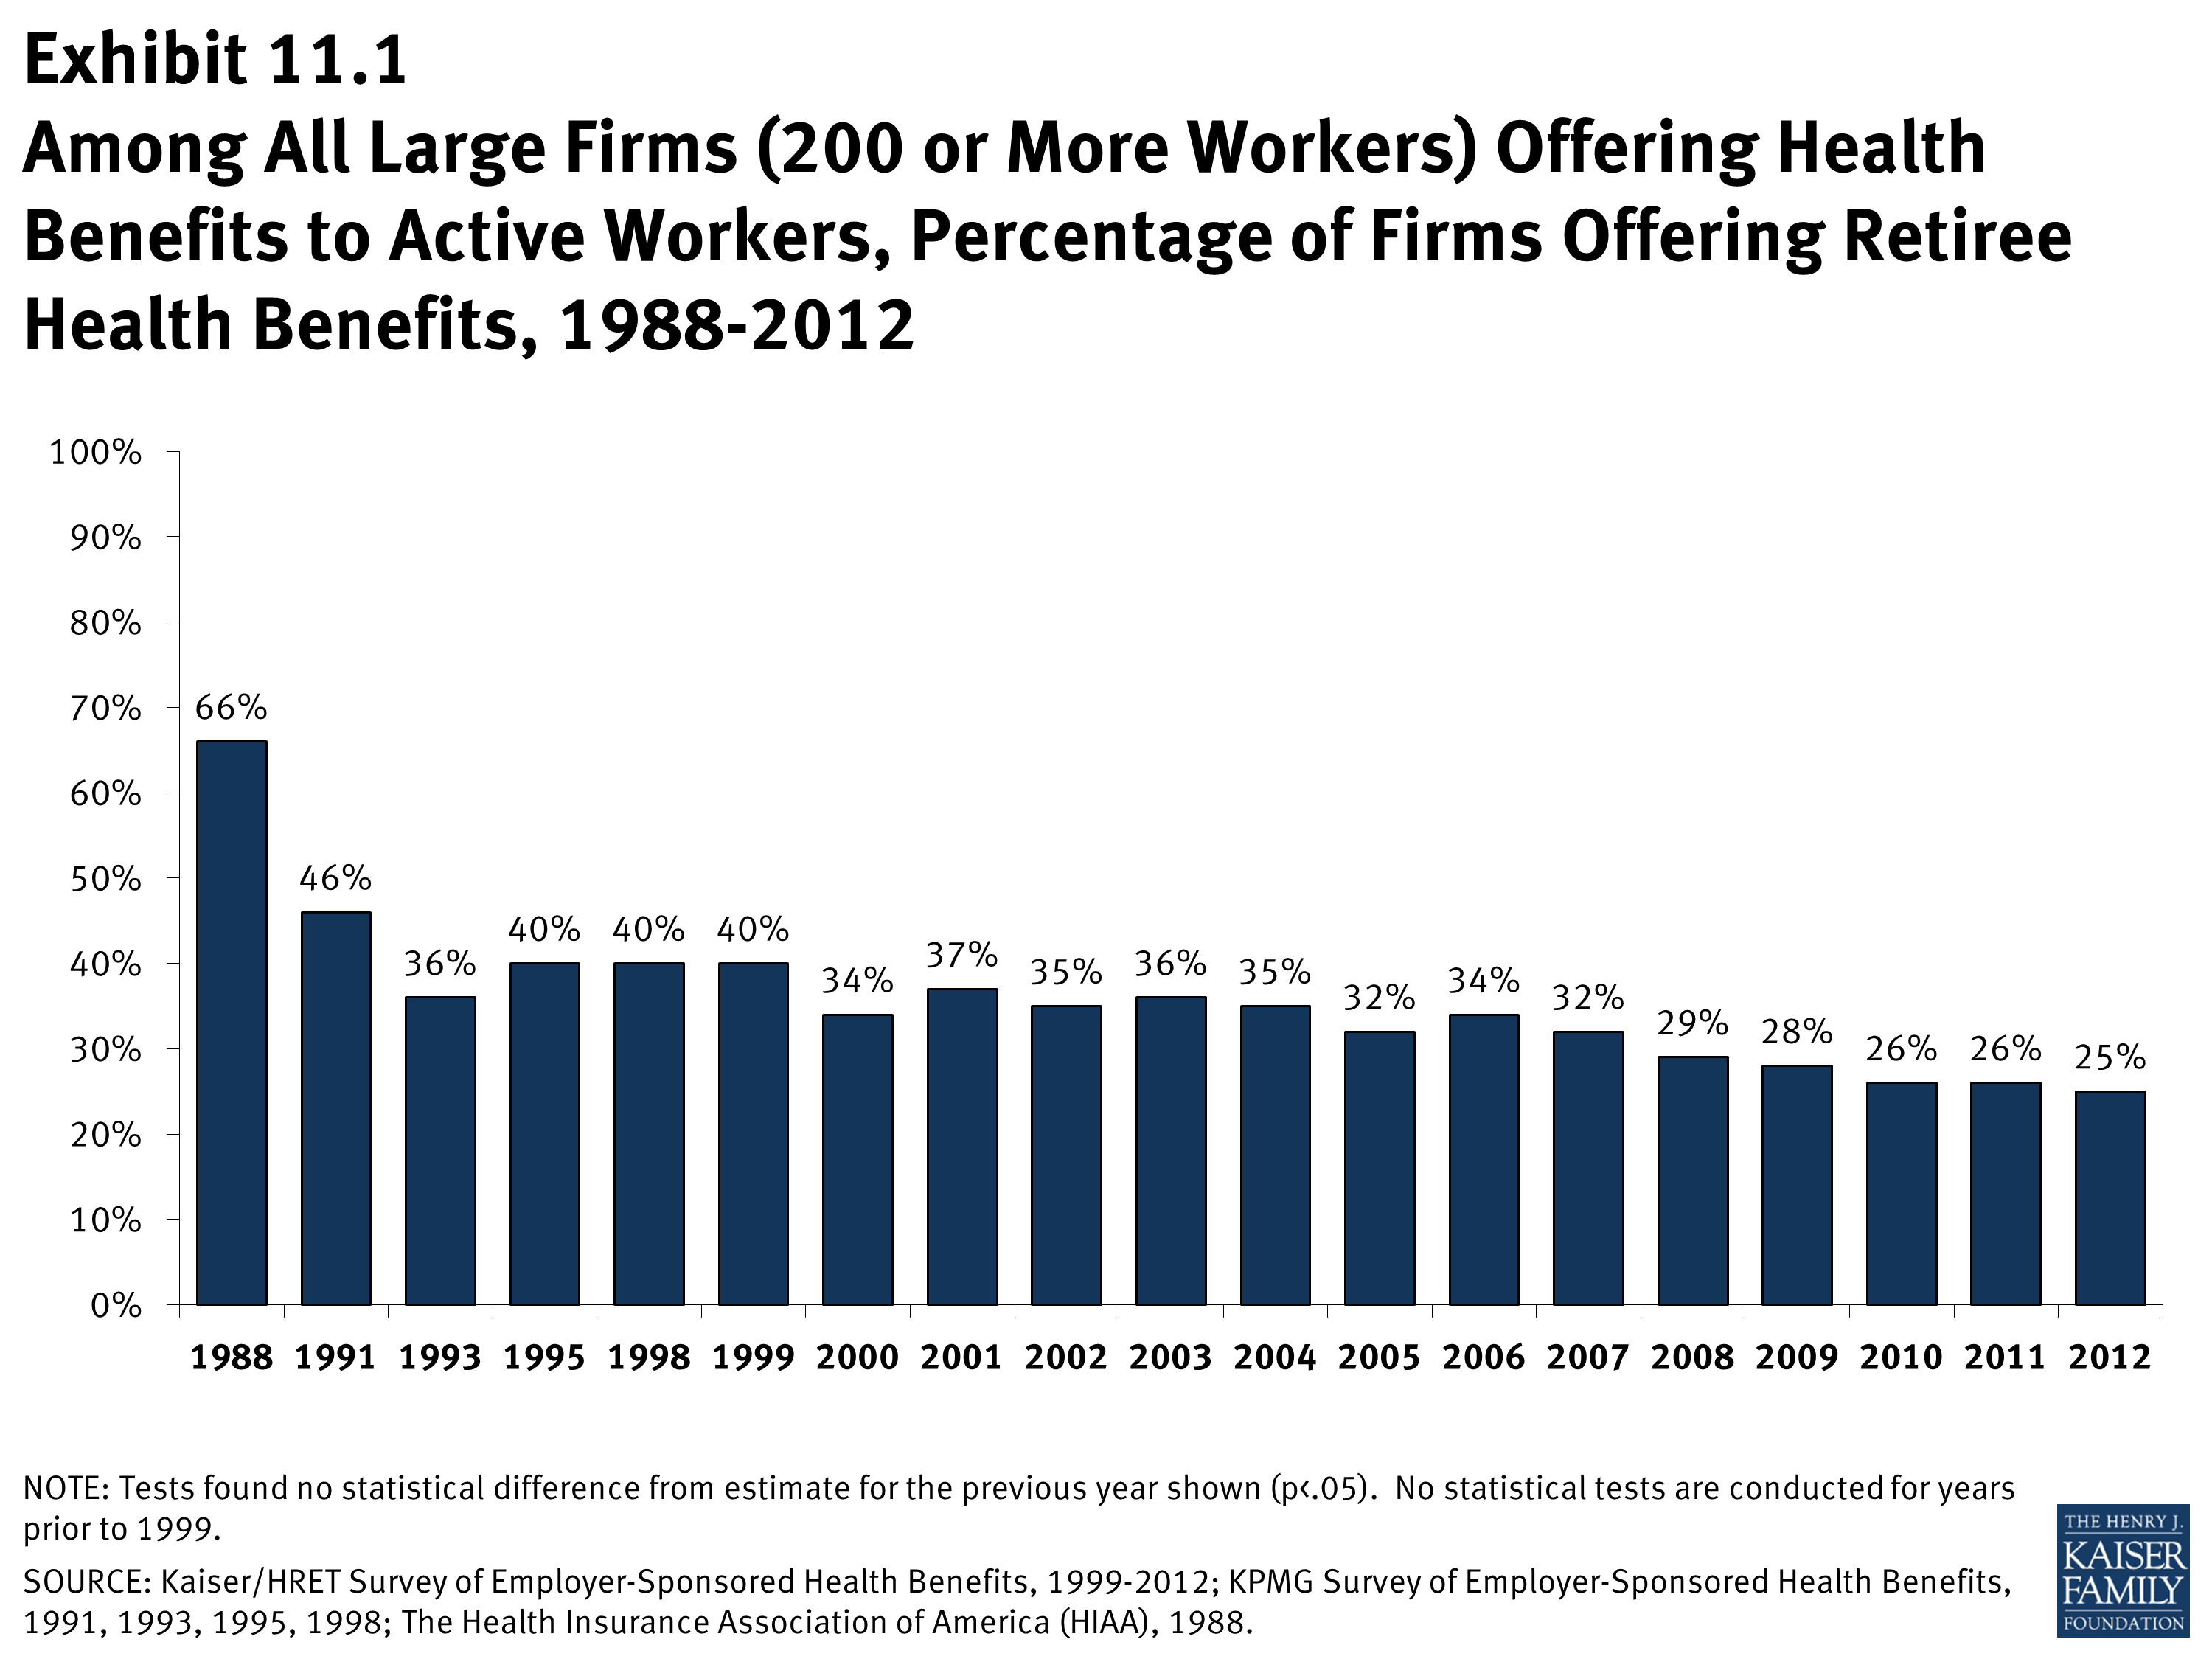
Among All Large Firms (200 or More Workers) Offering Health Benefits to Active Workers, Percentage of Firms Offering Retiree Health Benefits, 1988-2012
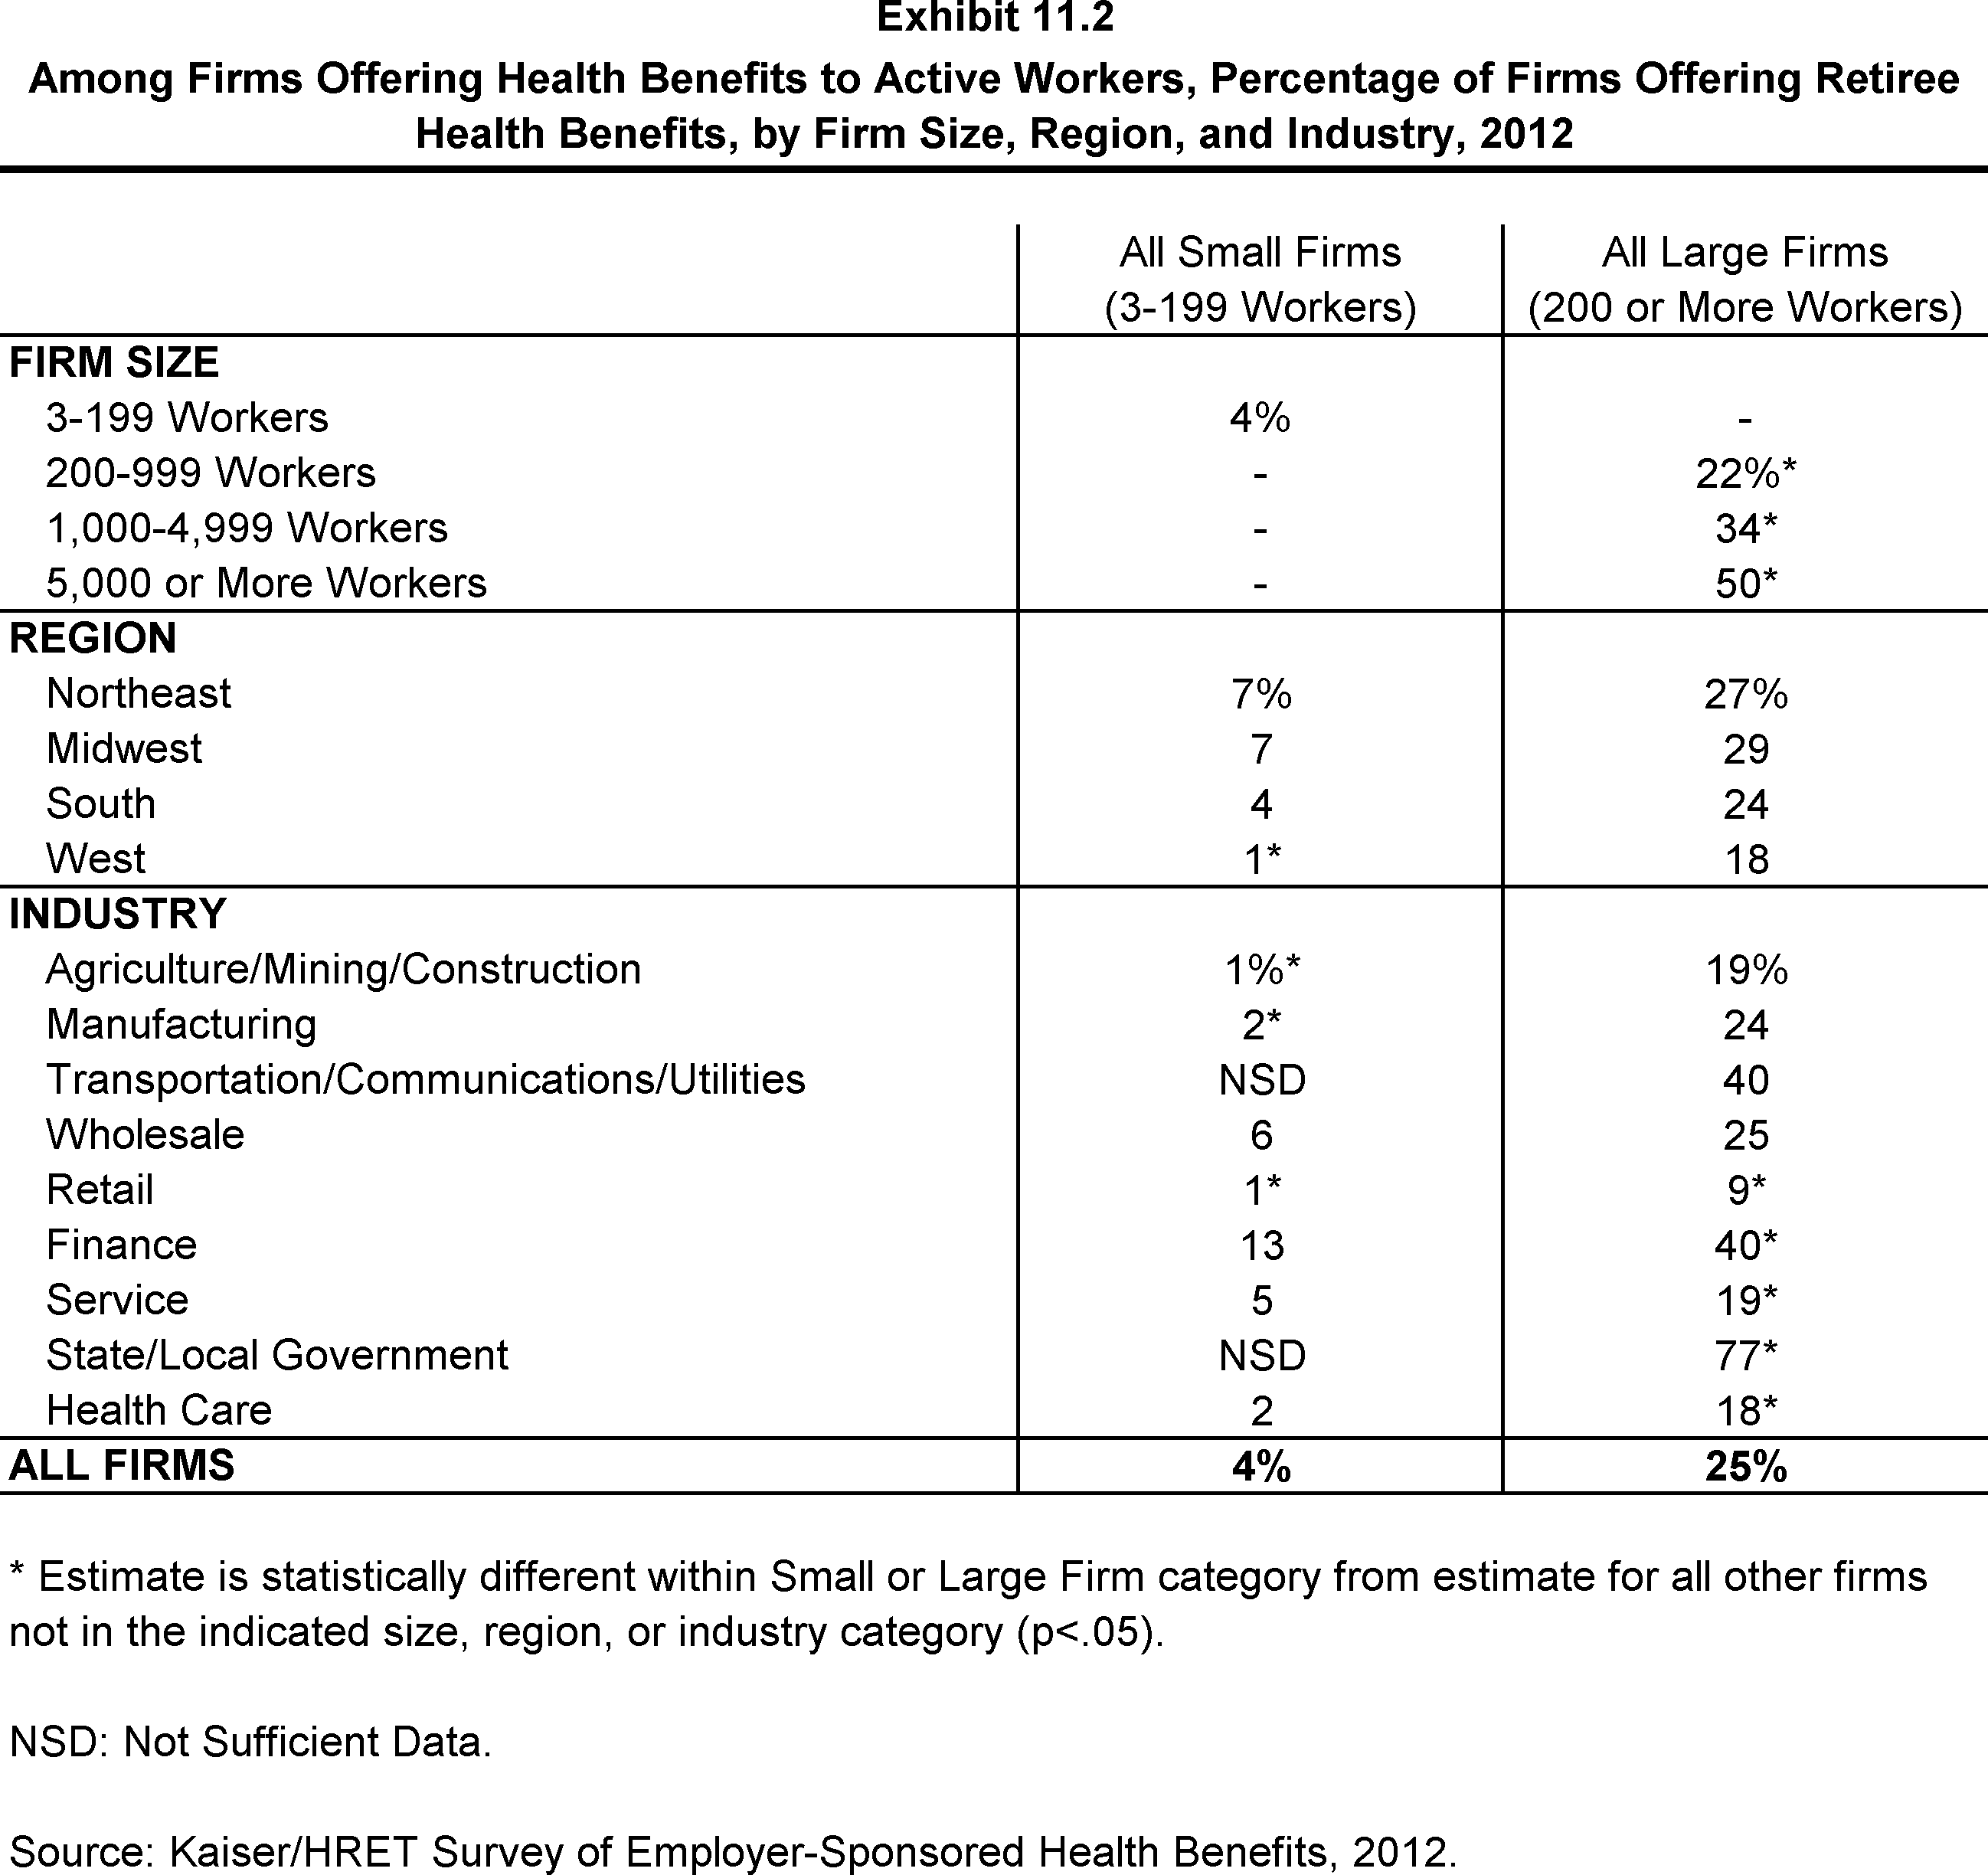
Among Firms Offering Health Benefits to Active Workers, Percentage of Firms Offering Retiree Health Benefits, by Firm Size, Region, and Industry, 2012
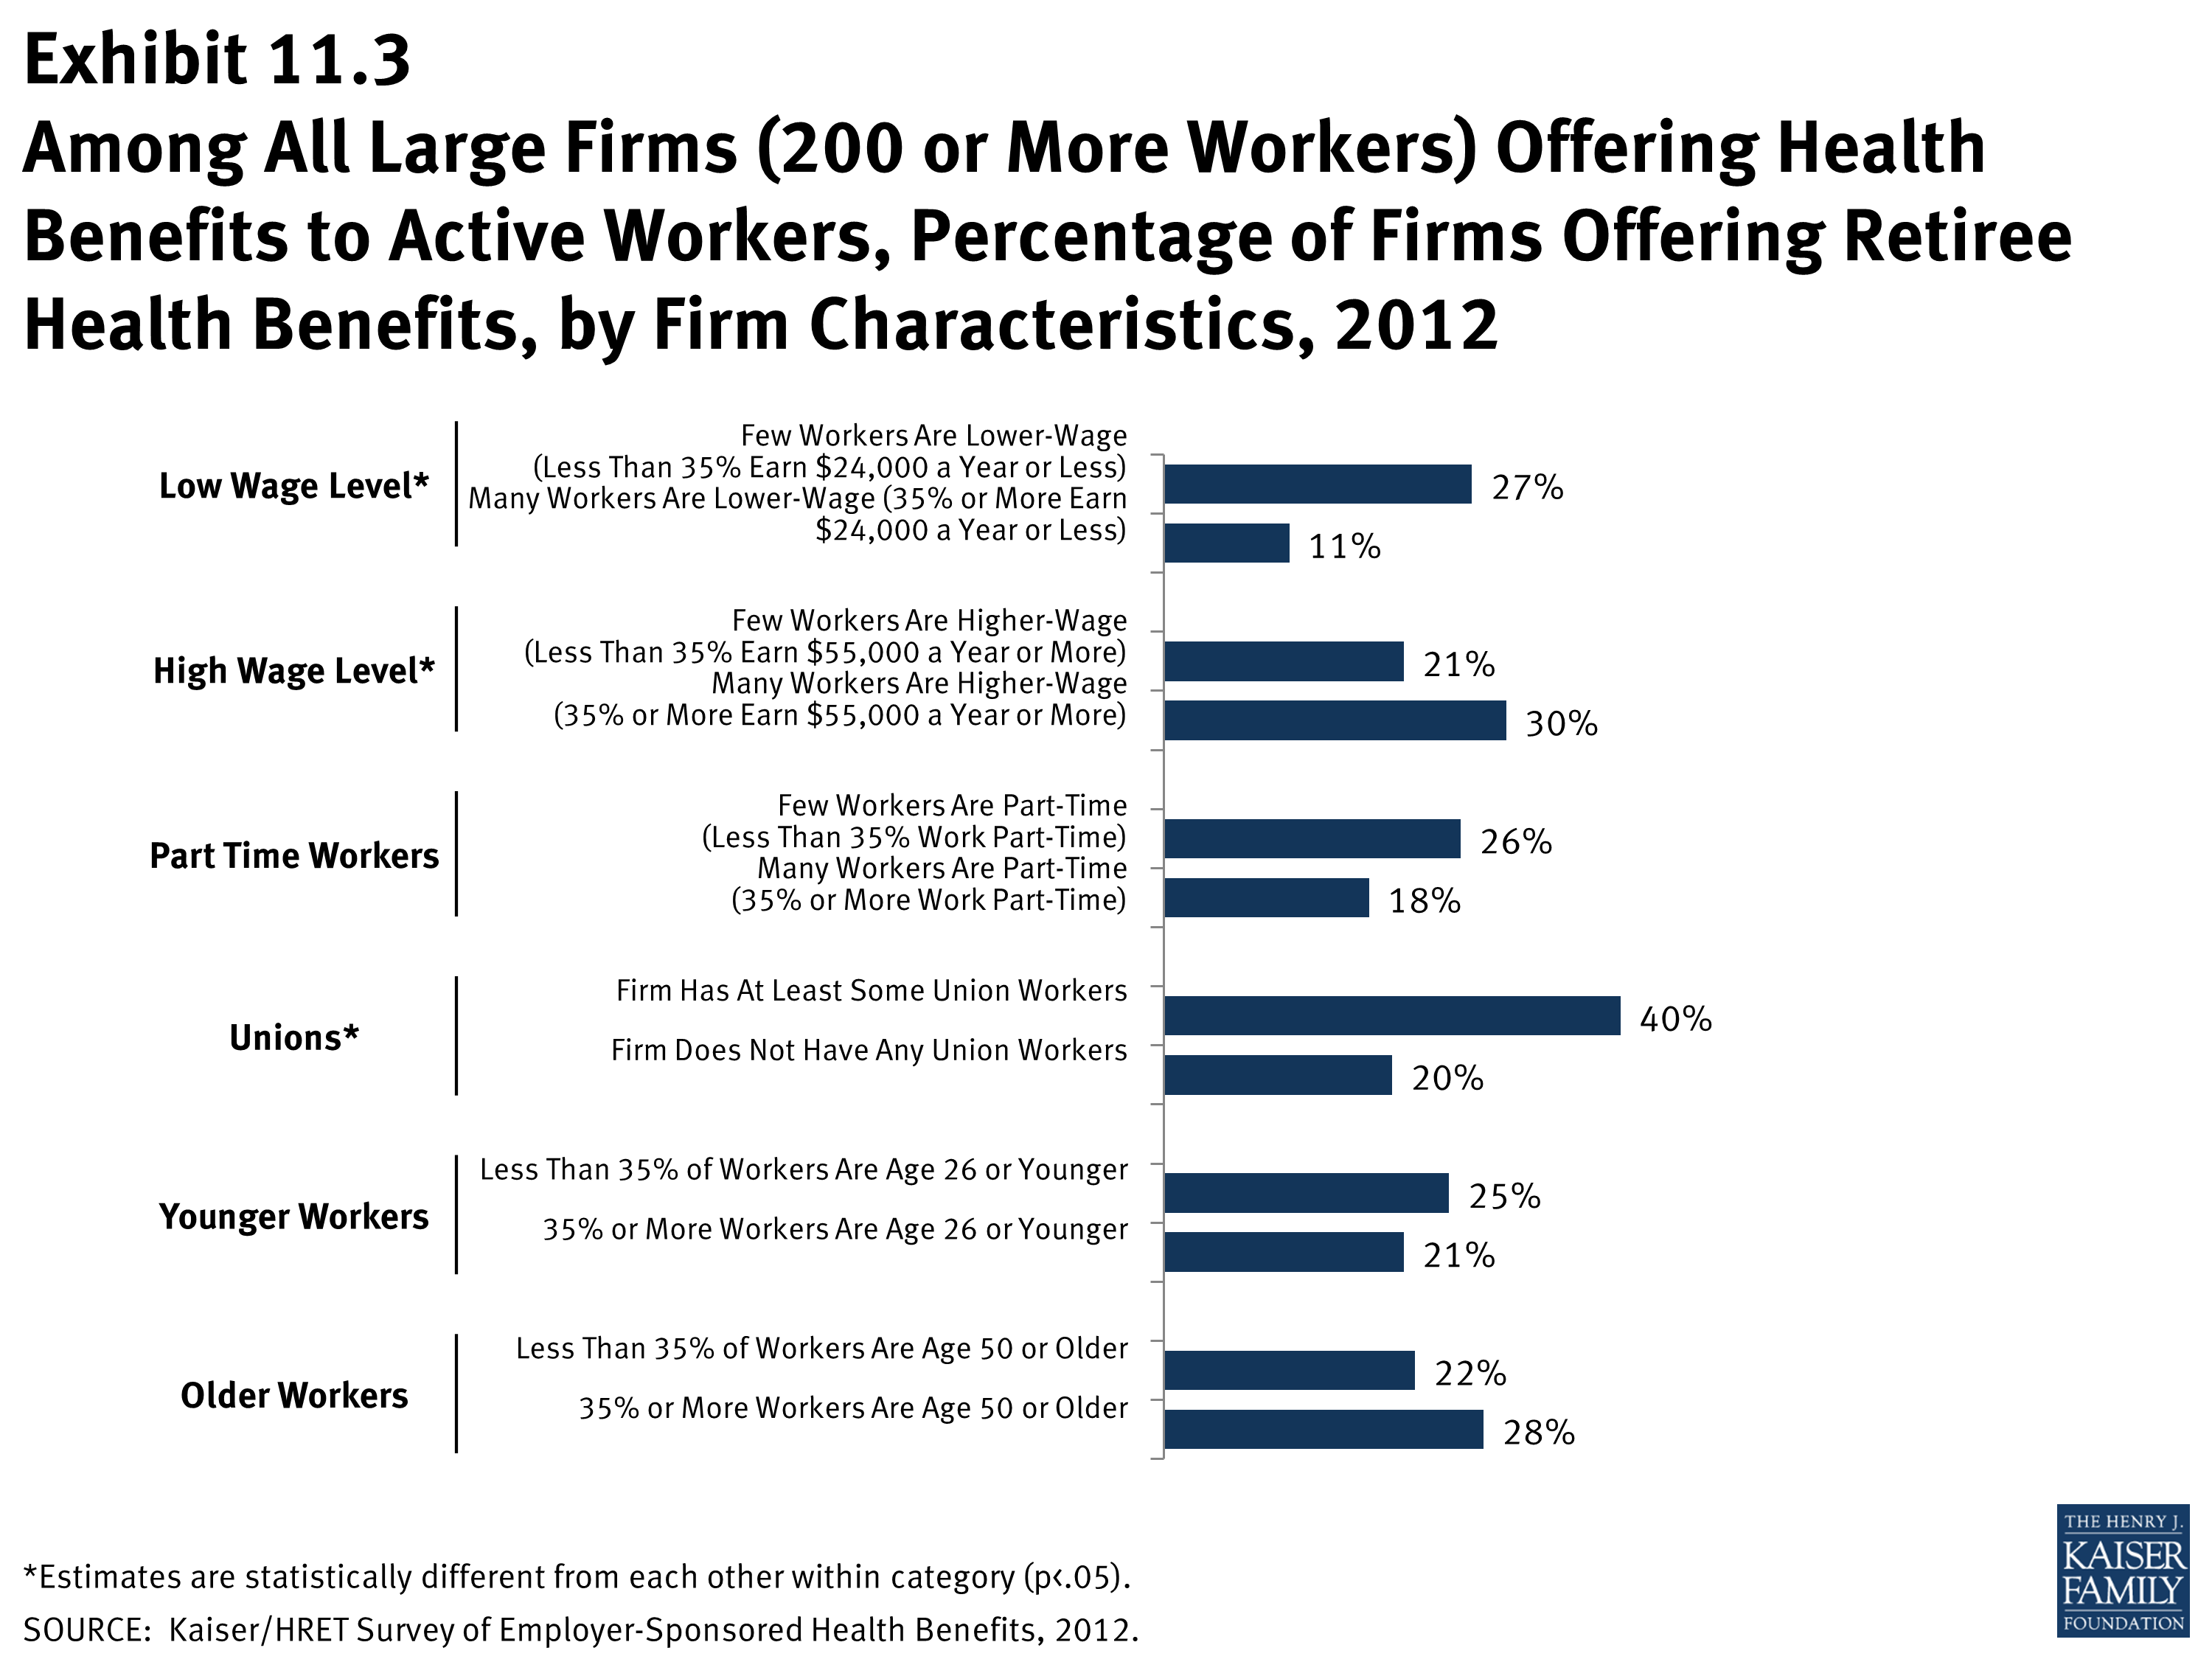
Among All Large Firms (200 or More Workers) Offering Health Benefits to Active Workers, Percentage of Firms Offering Retiree Health Benefits, by Firm Characteristics, 2012
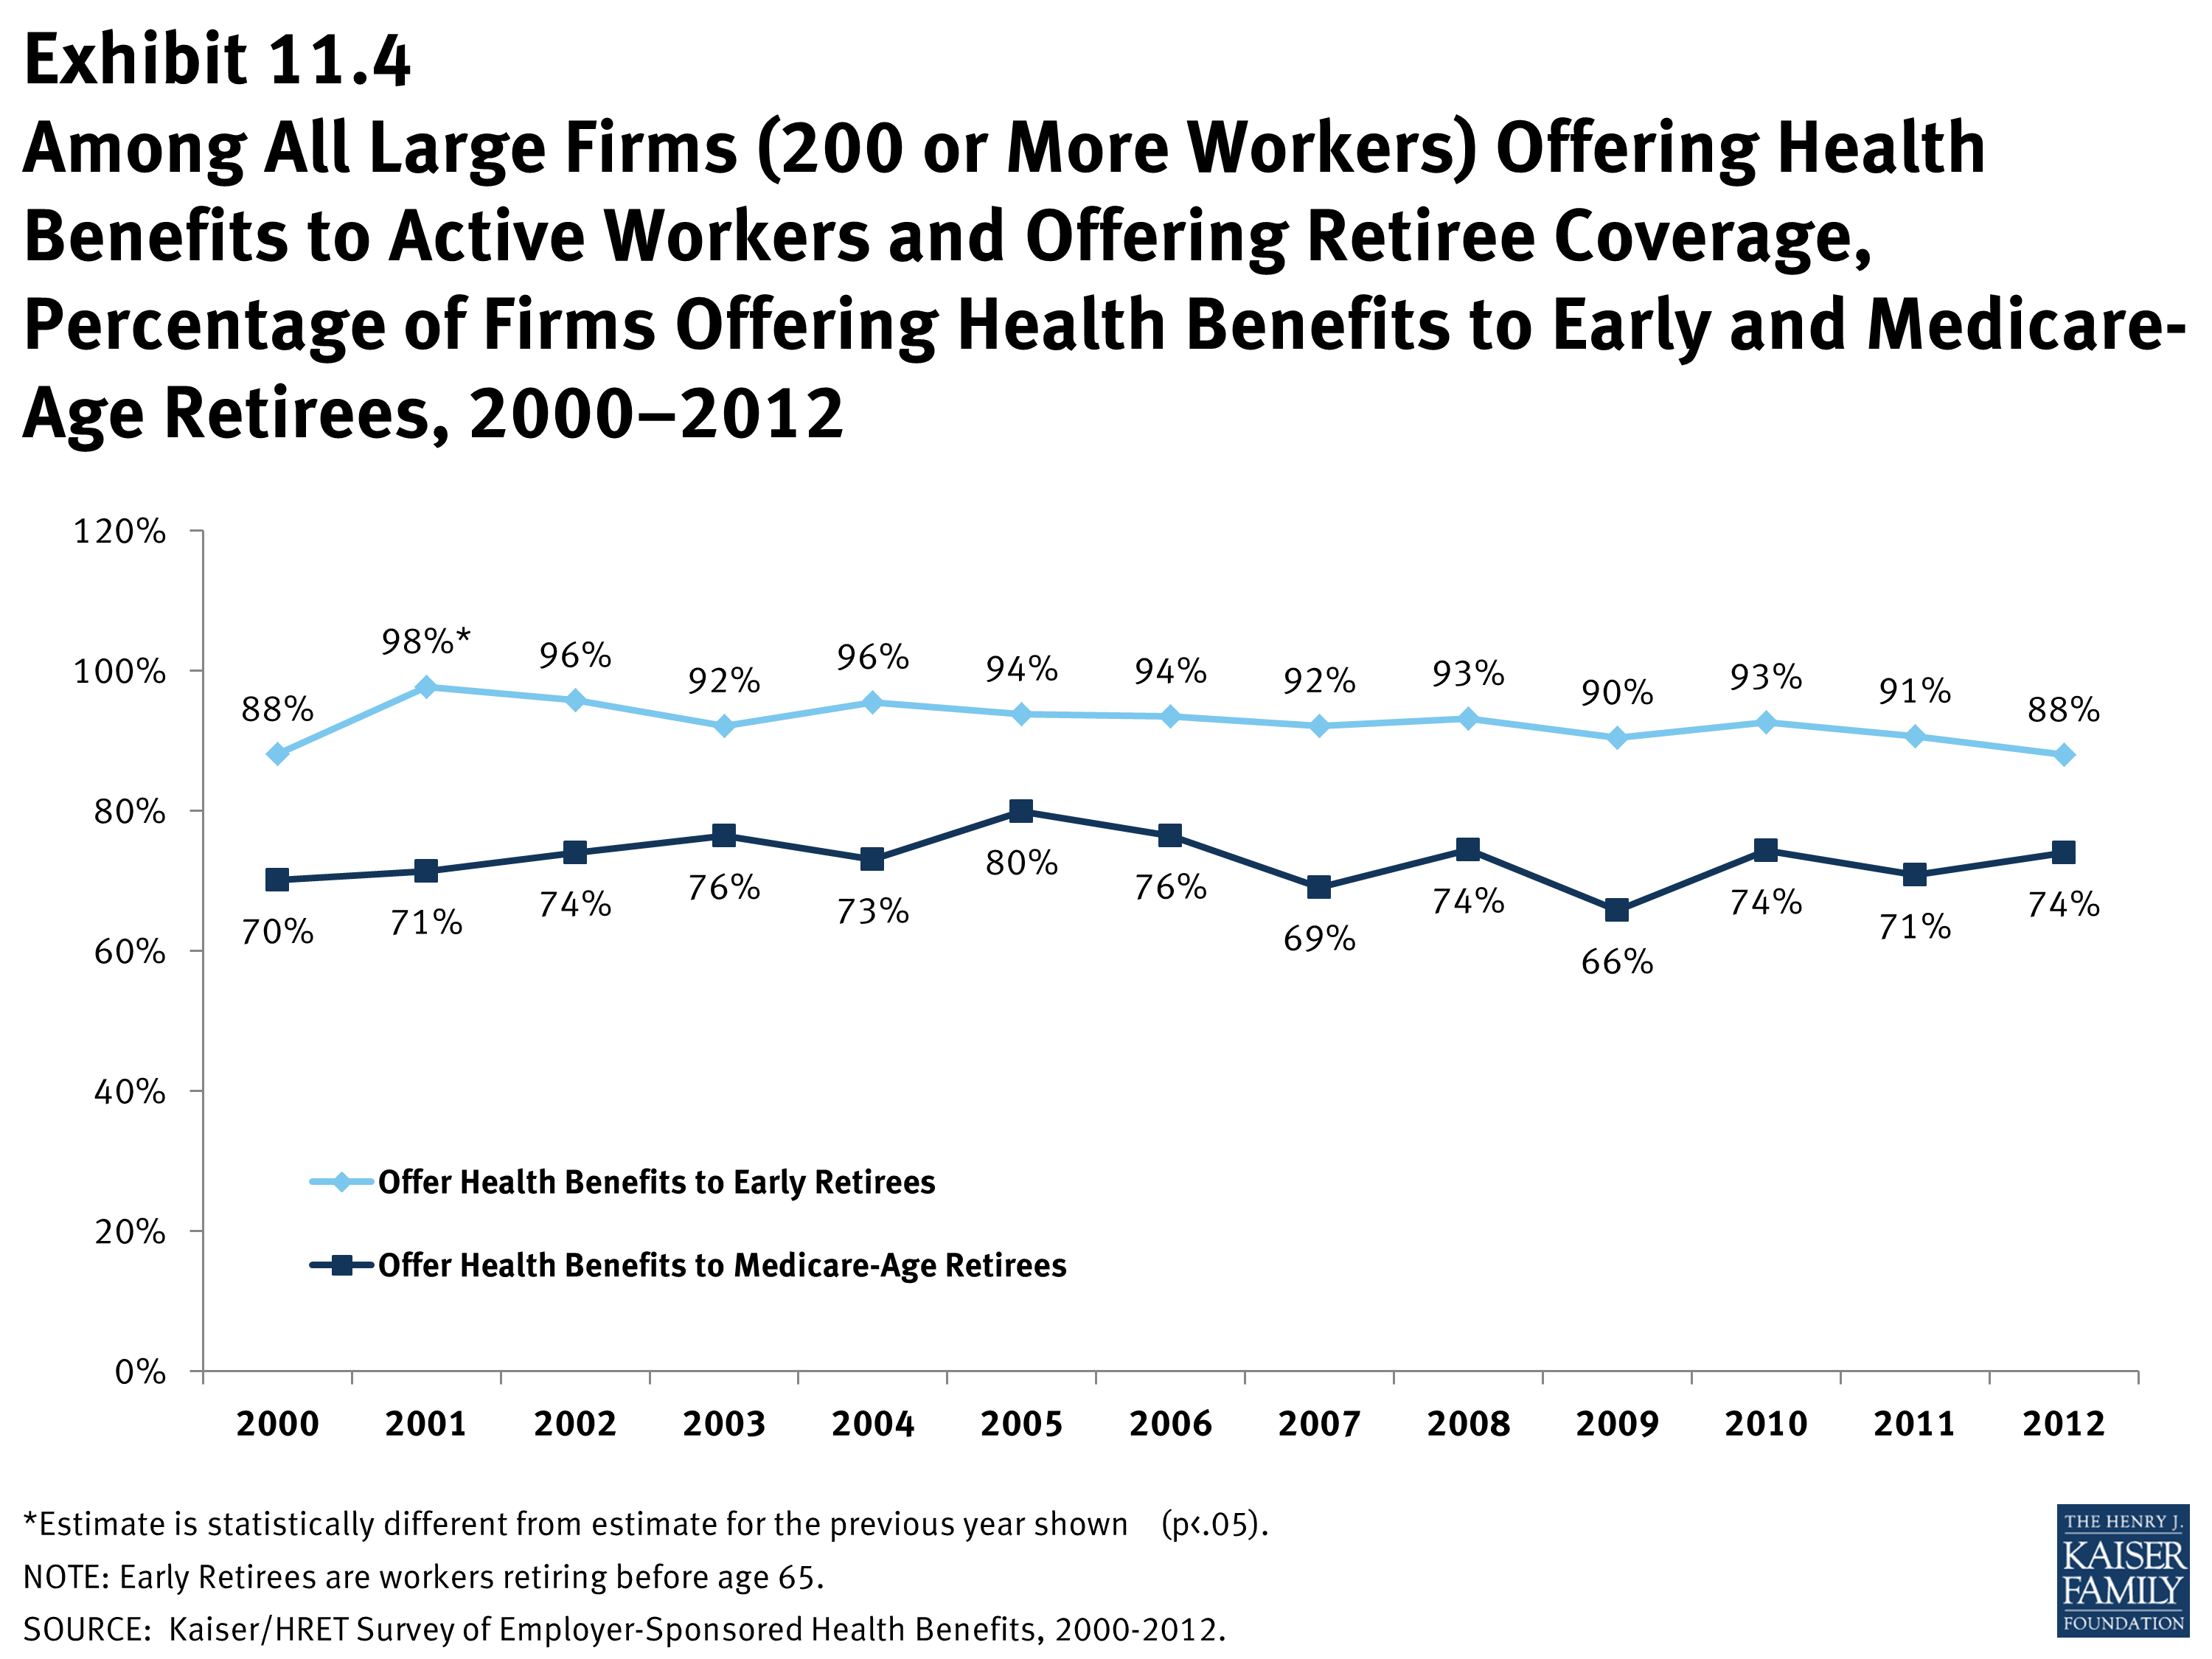
Among All Large Firms (200 or More Workers) Offering Health Benefits to Active Workers and Offering Retiree Coverage, Percentage of Firms Offering Health Benefits to Early and Medicare-Age Retirees, 2000–2012
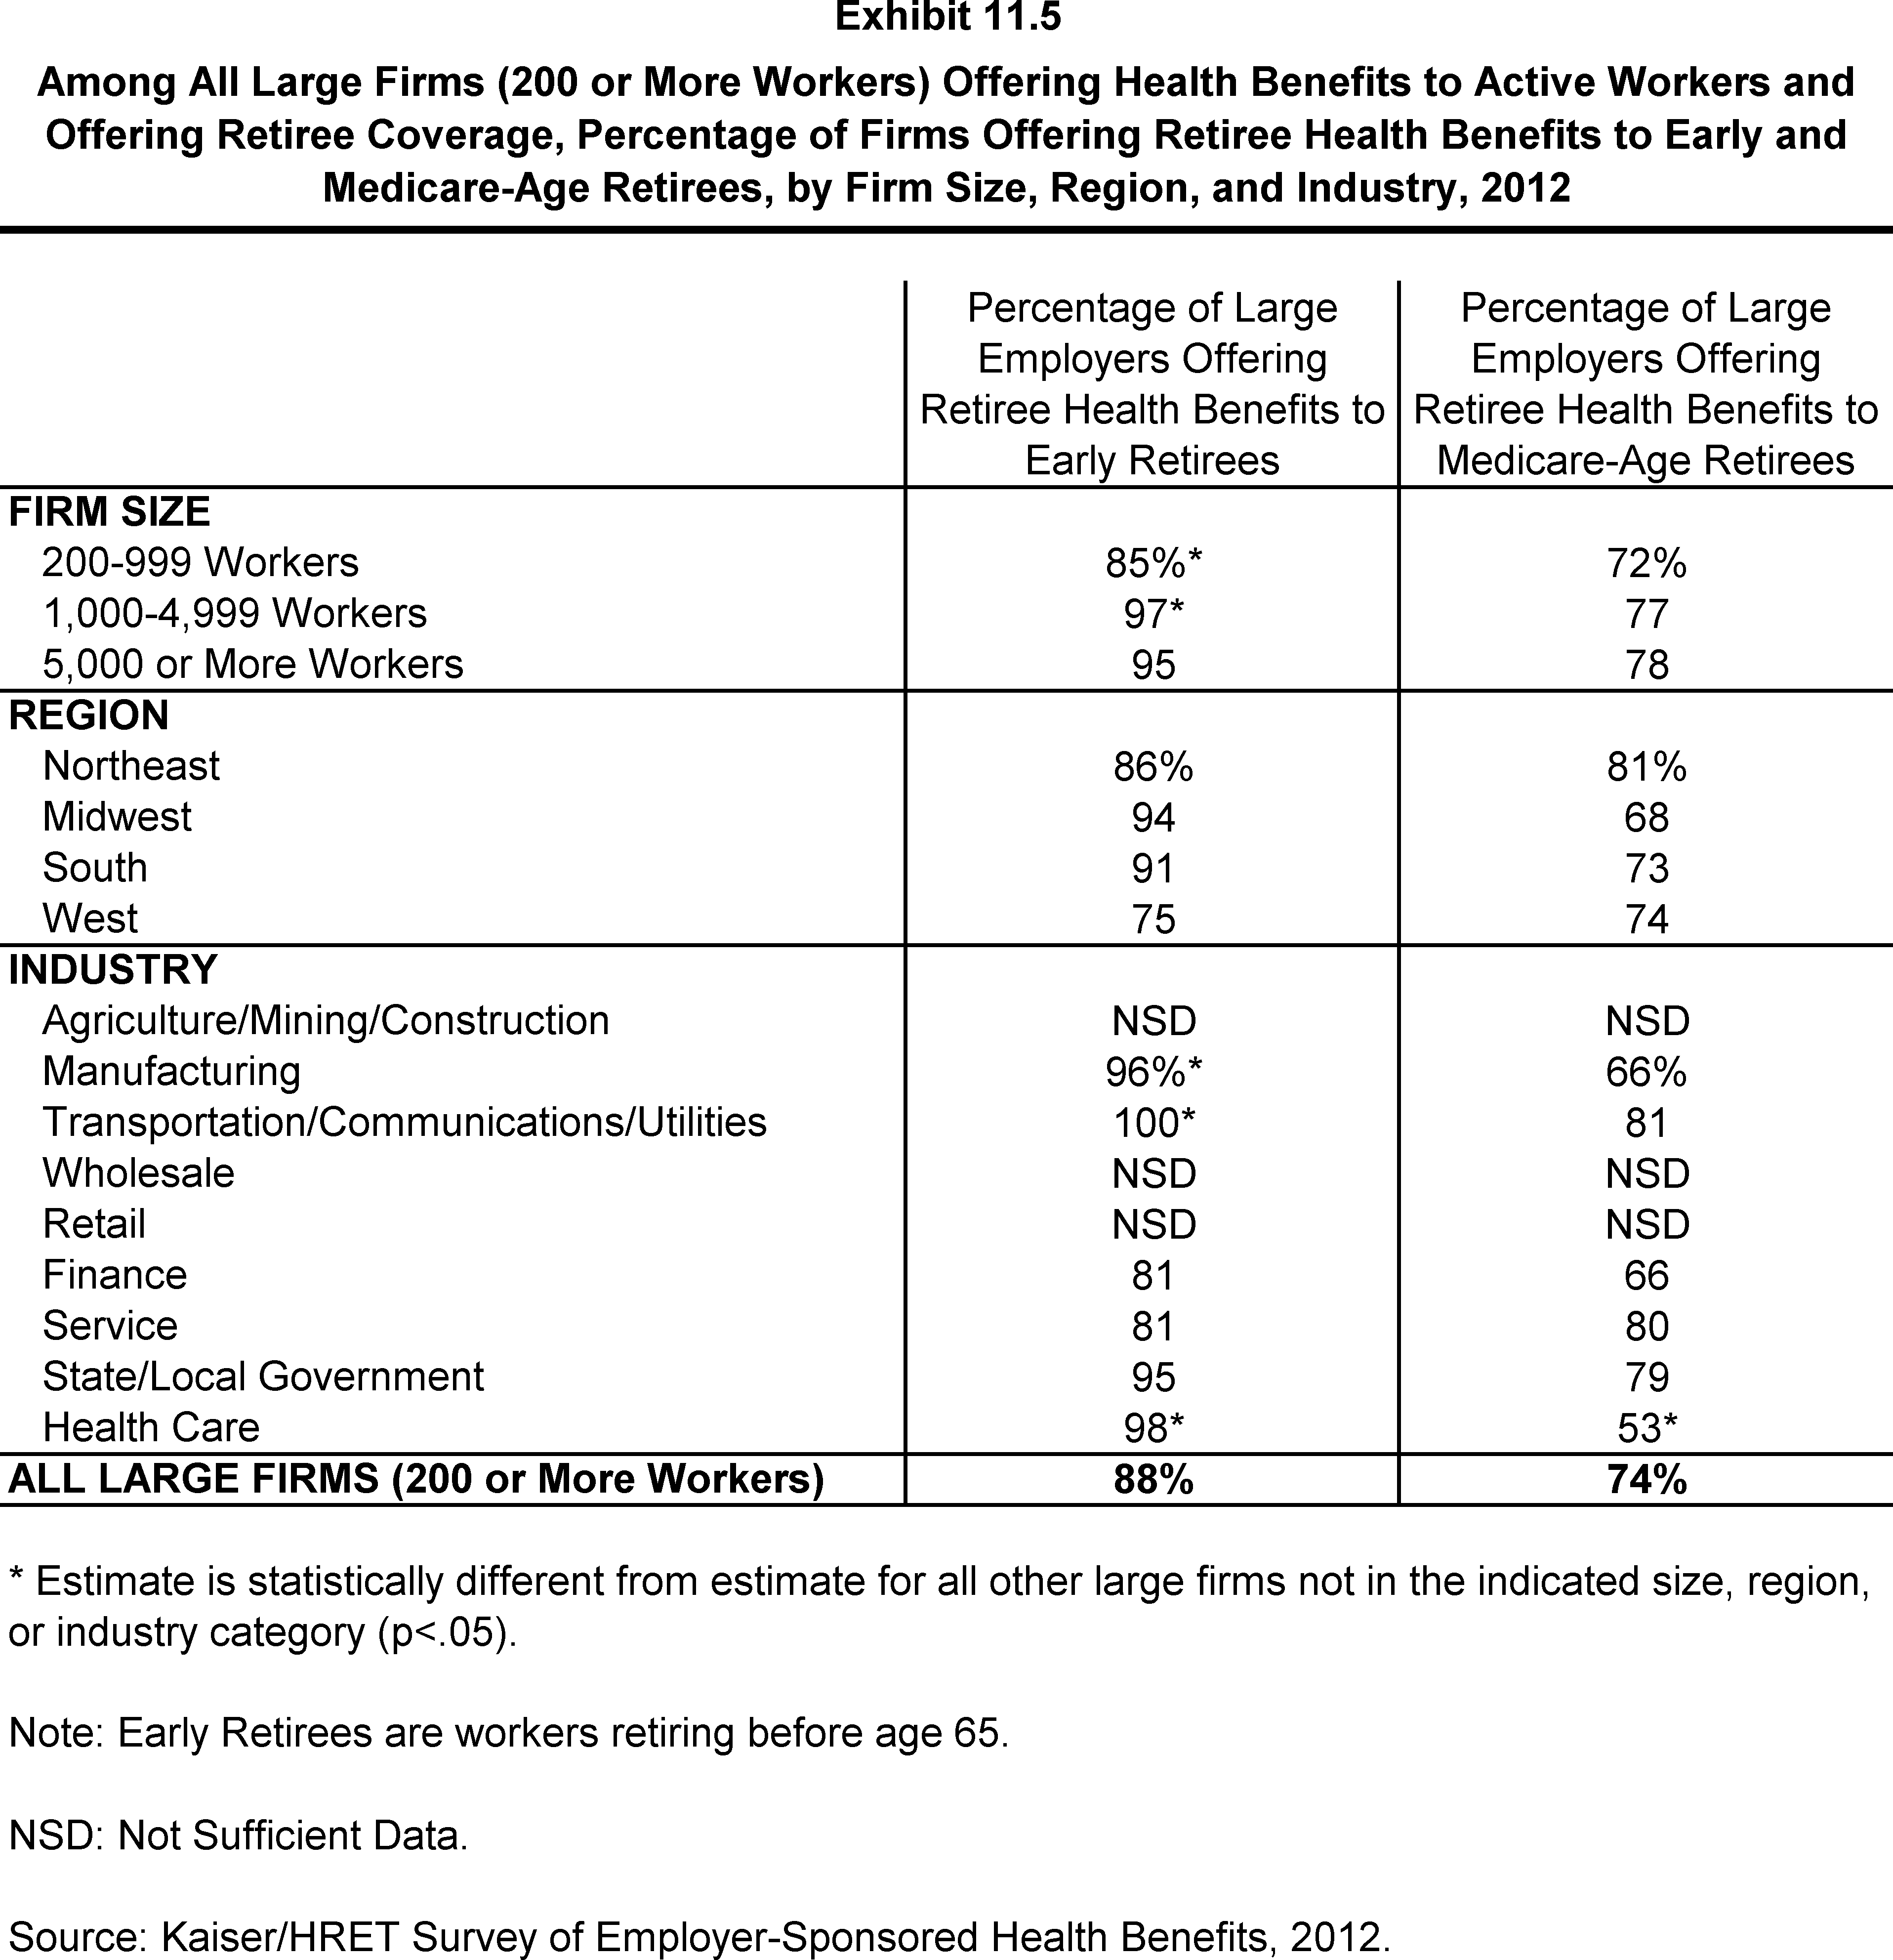
Among All Large Firms (200 or More Workers) Offering Health Benefits to Active Workers and Offering Retiree Coverage, Percentage of Firms Offering Retiree Health Benefits to Early and Medicare-Age Retirees, by Firm Size, Region, and Industry, 2012
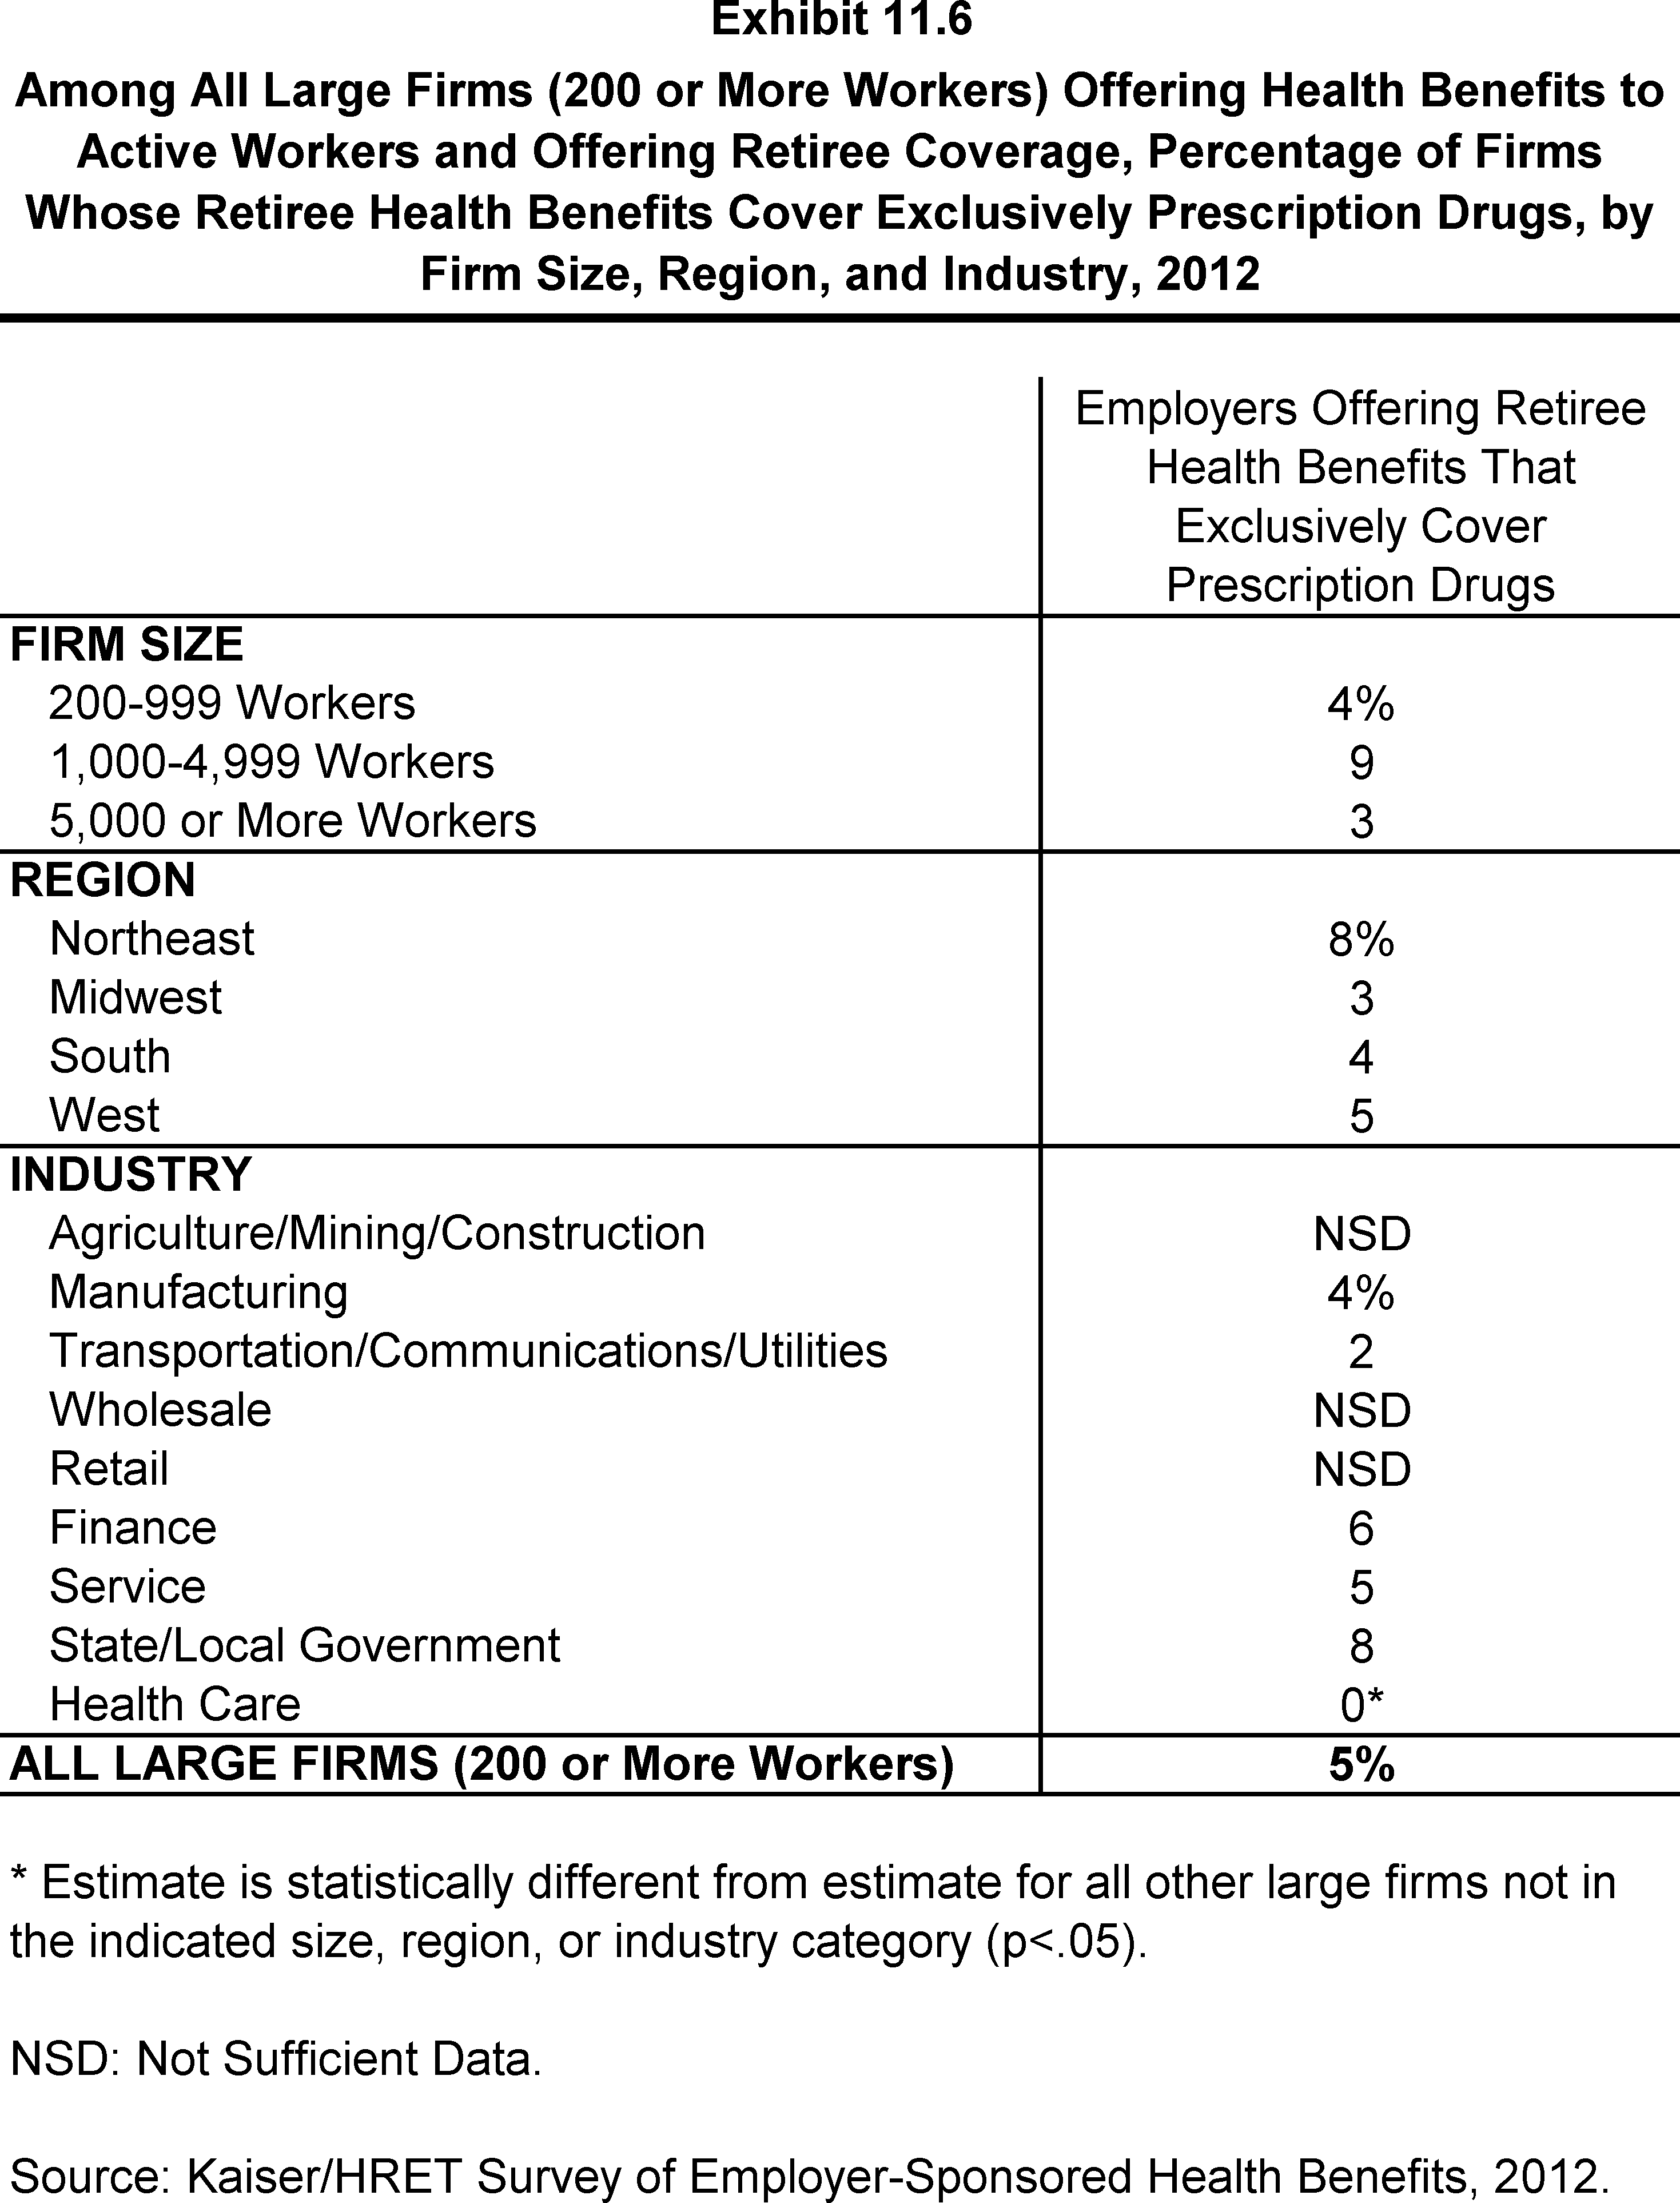
Among All Large Firms (200 or More Workers) Offering Health Benefits to Active Workers and Offering Retiree Coverage, Percentage of Firms Whose Retiree Health Benefits Cover Exclusively Prescription Drugs, by Firm Size, Region, and Industry, 2012
Section 12: Wellness Programs and Health Risk Assessments
A majority of firms offering health benefits offers some type of wellness program, with large firms (200 or more workers) being more likely than smaller firms (3-199 workers) to offer a wellness benefit. Forty-one percent of large firms and 10% of small firms offering at least one wellness benefit offer financial incentives to employees who participate in wellness programs. Eighteen percent of firms ask employees to complete health risk assessments, with some of these firms tying financial penalties or rewards to employees who complete wellness programs or meet biometric outcomes.
Wellness Benefits
- For a variety of reasons including efforts to improve health and lower costs, some employers and health plans offer wellness programs. Wellness programs may range from classes in nutrition or healthy living to a wellness newsletter.
- Sixty-three percent of firms offering health benefits offer at least one of the following wellness programs:
- weight loss programs
- biometric screening
- smoking cessation programs
- lifestyle or behavioral coaching
- gym membership discounts or on-site exercise facilities
- classes in nutrition or healthy living
- web-based resources for healthy living
- a wellness newsletter 1
- Large firms (200 or more workers) are more likely to offer at least one of the listed wellness programs than smaller firms (94% vs. 63%). The offer rate for each type of wellness benefit included in the survey is presented in (Exhibit 12.1), (Exhibit 12.2) and (Exhibit 12.3)
- Sixty percent of firms offering health benefits and wellness benefits offer the wellness benefits to spouses or dependents (Exhibit 12.4)
- Sixty-three percent of firms offering health benefits offer at least one of the following wellness programs:
- In order to encourage participation in wellness programs, firms may offer financial incentives to employees who participate.2
- Eight percent of firms offering health benefits and at least one of the listed wellness programs offer gift cards, travel, merchandise, or cash to workers who participate in wellness programs. Large firms (200 or more workers) are more likely to offer these incentives than small firms (3-199 workers) (30% vs. 7%) (Exhibit 12.5).
- Few firms offering health benefits and at least one of the listed wellness programs lower worker premium contributions (3%) or cost sharing (1%) as an incentive to encourage employees to participate. Among firms that offer a high-deductible plan paired with a HRA or HSA, 1% of firms offer workers who participate in wellness programs higher HSA or HRA contributions than employees who do not participate (Exhibit 12.5).
- Ten percent of small firms and 41% of large firms offering one or more of the listed wellness programs offer employees a specific incentive for enrolling in wellness programs3 (Exhibit 12.5).
Encouraging Participation in Wellness Programs
- Firms use methods such as health fairs or health claims that identify health risks to identify individuals and encourage participation in wellness programs.
- Twenty-four percent of firms offering health benefits and at least one of the listed wellness programs report using health fairs to identify individuals and encourage participation in wellness programs; this is a significant increase over the 9% of firms reporting using health fairs in 2011. Large firms (200 or more workers) are more likely than small firms (3-199 workers) to use health fairs to encourage wellness participation (44% vs. 23%) (Exhibit 12.6).
- Forty-six percent of firms offering health benefits and at least one of the listed wellness programs use health risk assessments to identify individuals and encourage wellness participation (Exhibit 12.6).
Reasons for Offering Wellness Programs
- Firms offering health benefits and at least one of the listed wellness programs were asked to identify their primary reason for offering a wellness program. Thirty-seven percent cite as their primary reason that the wellness program was part of their health plan, while an almost equal percentage (35%) say their primary reason is to improve the health of employees and reduce absenteeism. Fewer firms identify improving morale and productivity (9%) or reducing health costs (9%) as their primary reason (Exhibit 12.7).
- Large firms (200 or more workers) are more likely than smaller firms to report that reducing health care costs (34% vs. 8%) is a primary reason for offering wellness programs, while small firms (3 to 199) workers are more likely than larger firms to say that their primary reason for offering a wellness program was because it was part of the health plan (38% vs. 14%) (Exhibit 12.7).4
- Among firms offering an HDHP/SO and at least one of the listed wellness benefits, 17% report that their decision to offer a wellness program was related to their decision to offer a high-deductible health plan (Exhibit 12.9).5
- Among firms offering health benefits and at least one of the listed wellness programs, 73% think offering wellness programs is effective in improving the health of the firms employees. Fifty-two percent of firms offering health coverage and at least one of the listed wellness programs think offering wellness programs is effective in reducing their firms health care costs. Large firms are more likely than small firms to think offering wellness programs is effective in reducing health care costs (68% vs. 51%) (Exhibit 12.8).6
- Among firms offering health benefits and at least one wellness program, 79% report that most of the wellness benefits they offer are provided by the health plan (Exhibit 12.4).7 Small firms (3 to 199 workers) are more likely than larger firms to report that most wellness programs are provided by the health plan (80% vs. 60%) (Exhibit 12.4).
Health Risk Assessments
- Some firms give their employees the option of completing a health risk assessment to identify potential health risks. Health risk assessments generally include questions about medical history, health status, and lifestyle.
- Overall, 18% of firms offering health benefits ask their employees to complete a health risk assessment. Large firms (200 or more workers) are more likely than smaller firms to offer employees this option (38% vs. 18%) (Exhibit 12.10).
- Some firms offer financial incentives to encourage employees to complete health risk assessments.
- Of those large firms (200 or more workers) offering health benefits and health risk assessments, 63% offer a financial incentive to employees who complete a health risk assessment.8
- Of those large firms (200 or more workers) offering health benefits and health risk assessments, 63% offer a financial incentive to employees who complete a health risk assessment.8
- This year, firms who ask employees to complete a health risk assessment were also asked if their employees are rewarded or penalized financially for completing a wellness or health management program or meeting biometric outcomes.
- Eleven percent of large firms (200 or more workers) reported that there are instances where an employee with an identified health risk factor is required to complete a wellness or health management program or activity in order to avoid a financial penalty such as a higher premium contribution or higher patient cost sharing.9
- Nine percent of large firms (200 or more workers) who ask their employees to complete a health risk assessment reported that employees are rewarded or penalized financially based on whether they meet specified biometric outcomes (not including smoking cessation), such as meeting a target body mass index (or BMI) or cholesterol level.10
- Eleven percent of large firms (200 or more workers) reported that there are instances where an employee with an identified health risk factor is required to complete a wellness or health management program or activity in order to avoid a financial penalty such as a higher premium contribution or higher patient cost sharing.9
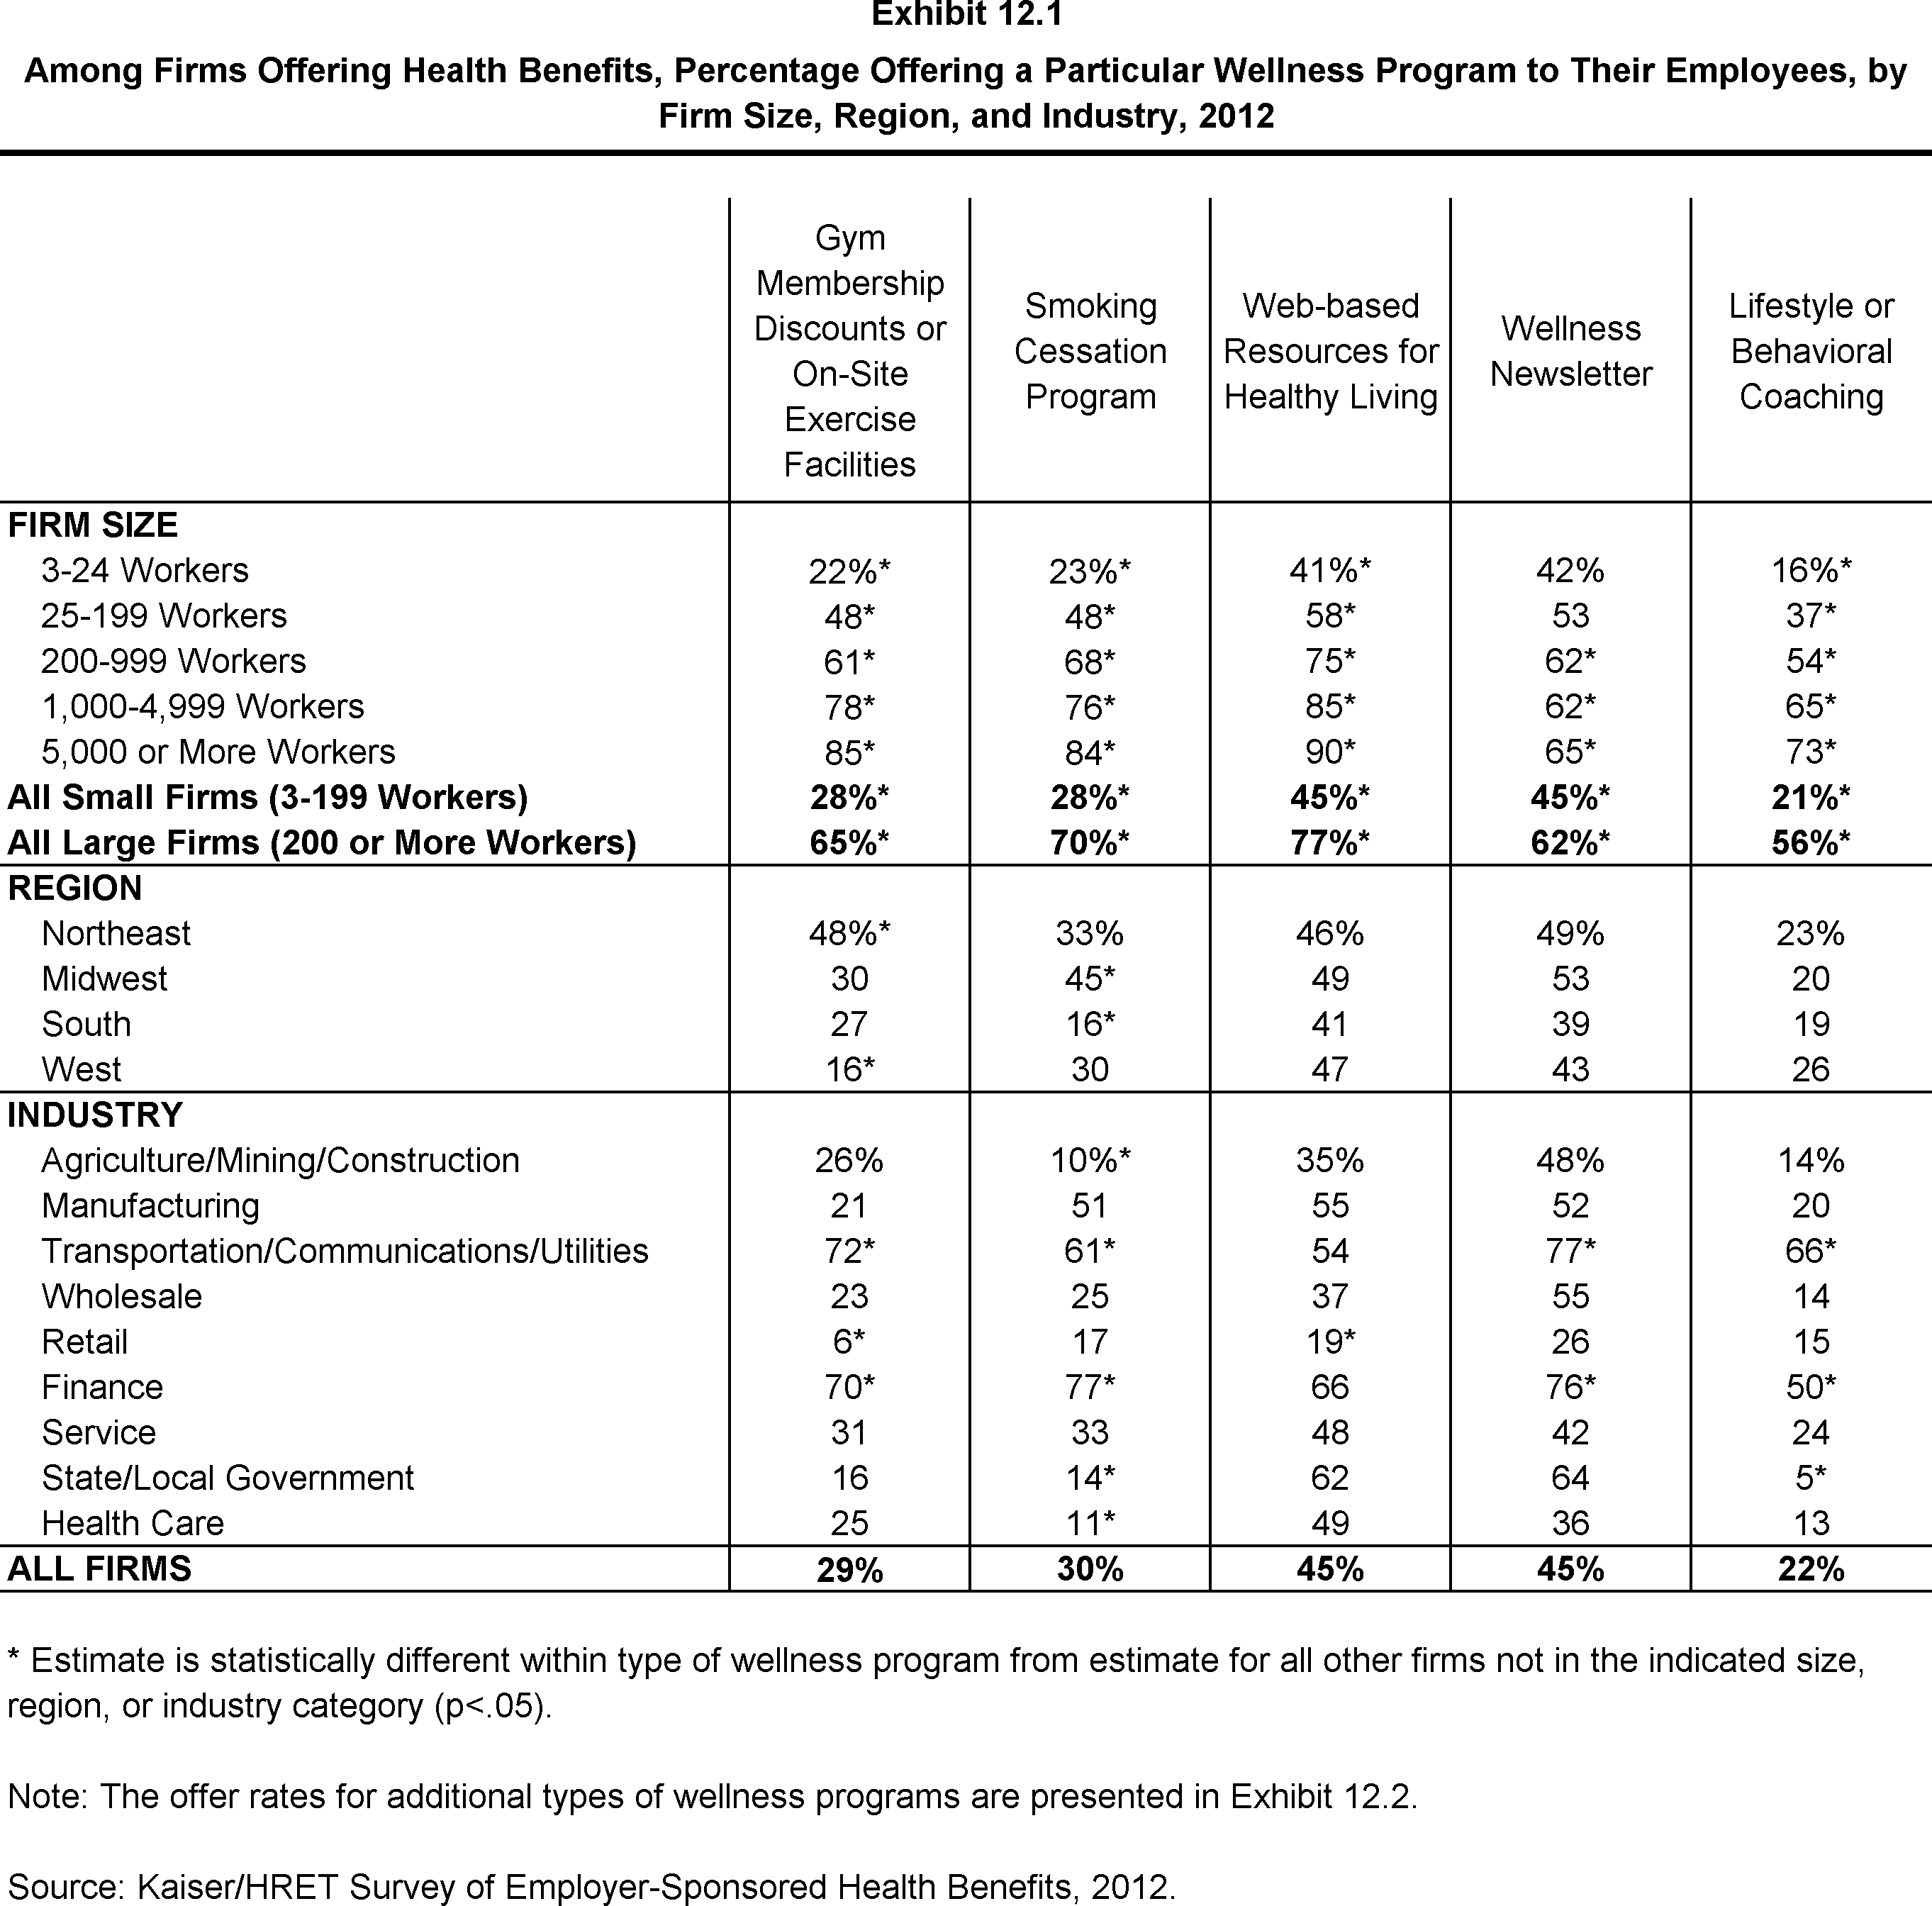
Among Firms Offering Health Benefits, Percentage Offering a Particular Wellness Program to Their Employees, by Firm Size, Region, and Industry, 2012
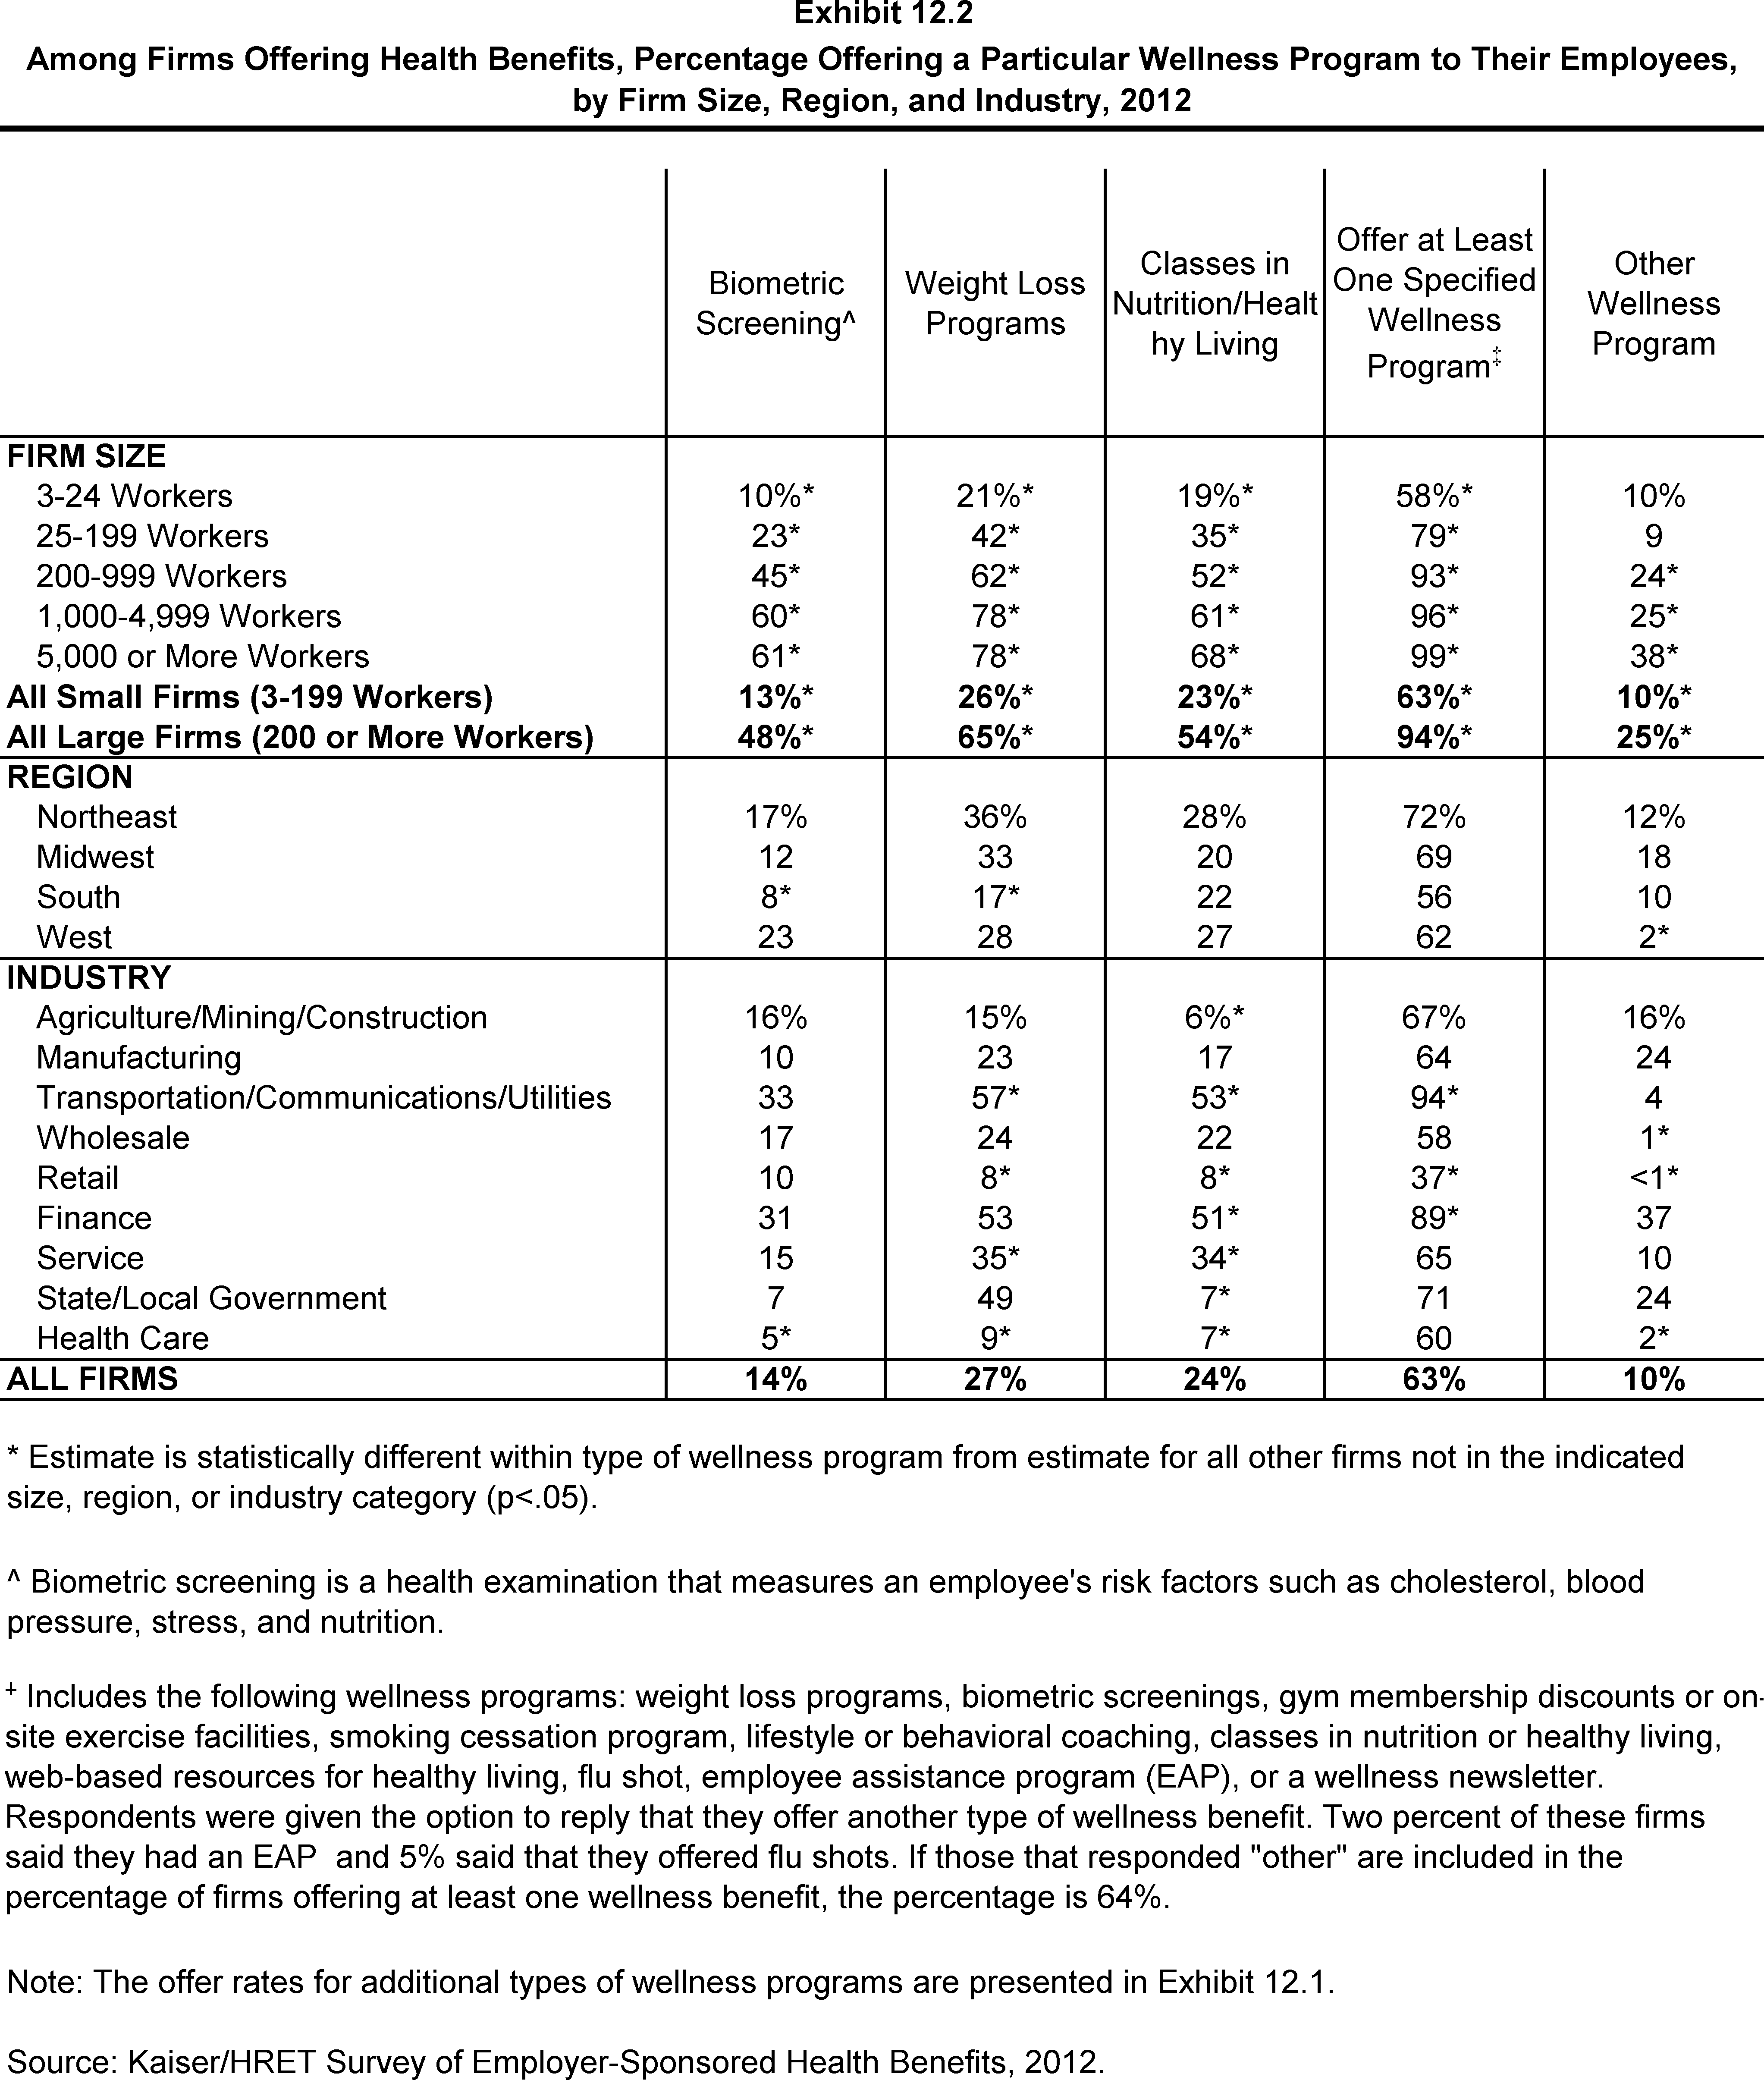
Among Firms Offering Health Benefits, Percentage Offering a Particular Wellness Program to Their Employees, by Firm Size, Region, and Industry, 2012
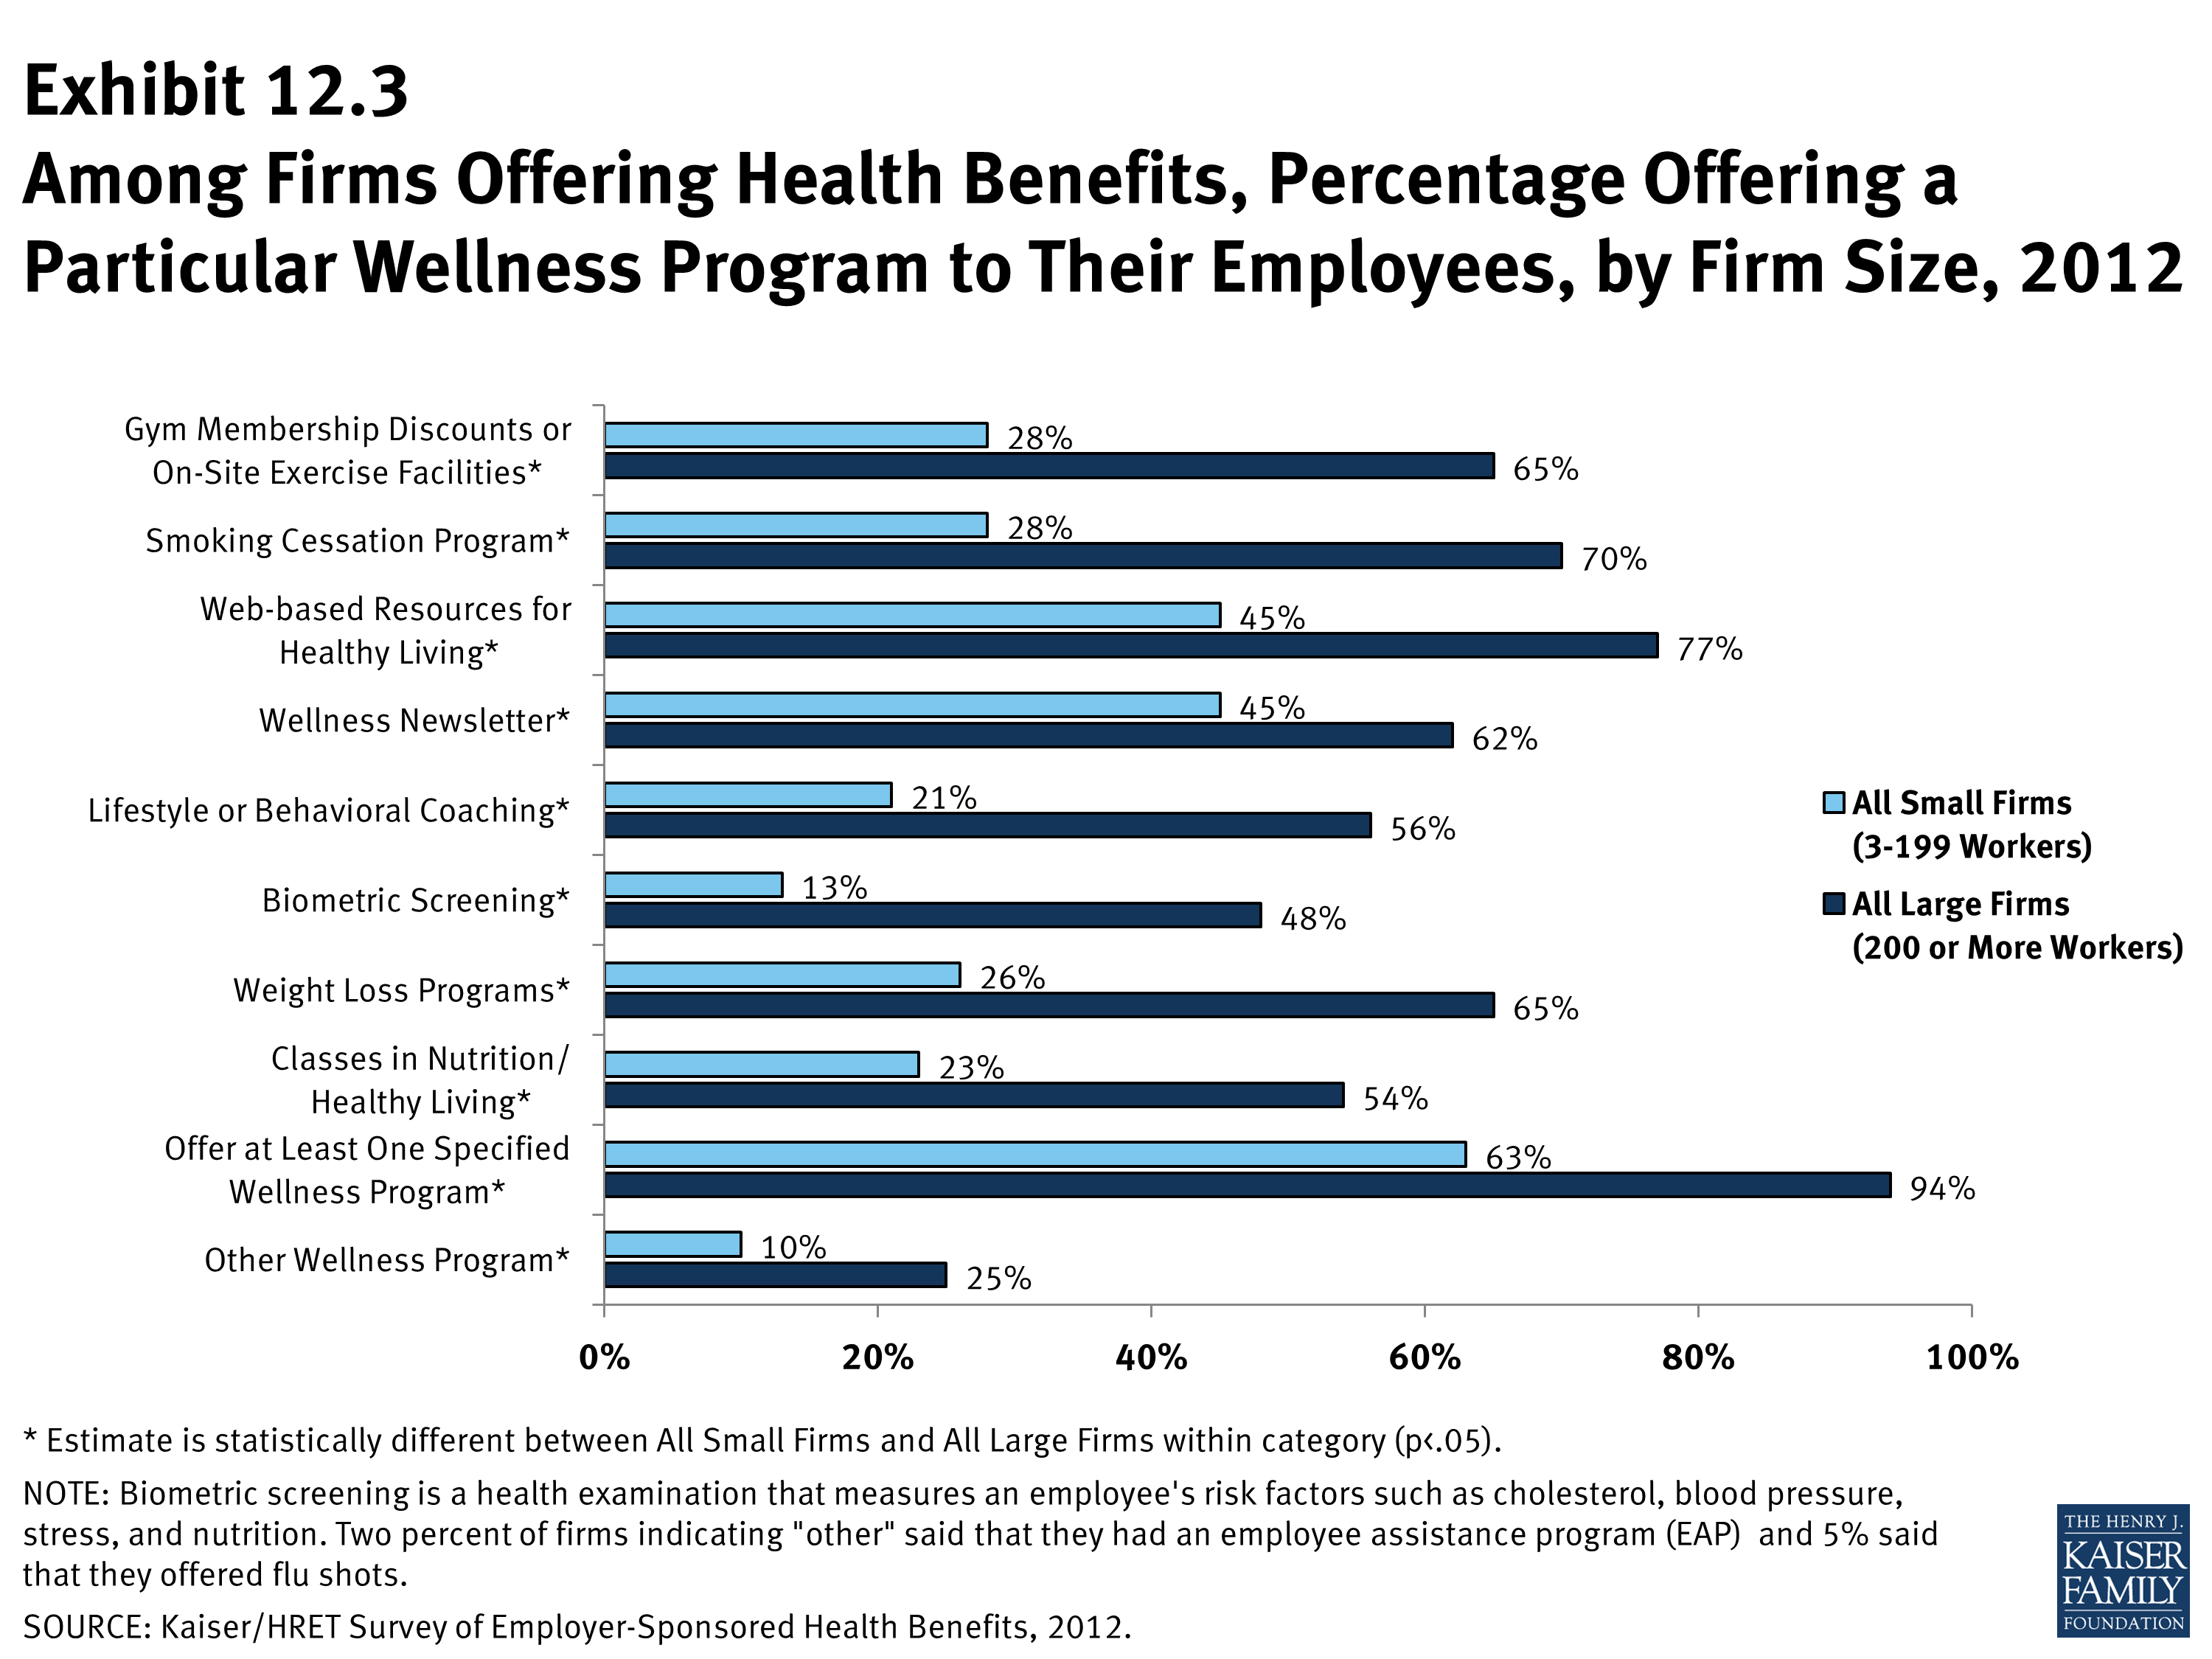
Among Firms Offering Health Benefits, Percentage Offering a Particular Wellness Program to Their Employees, by Firm Size, 2012
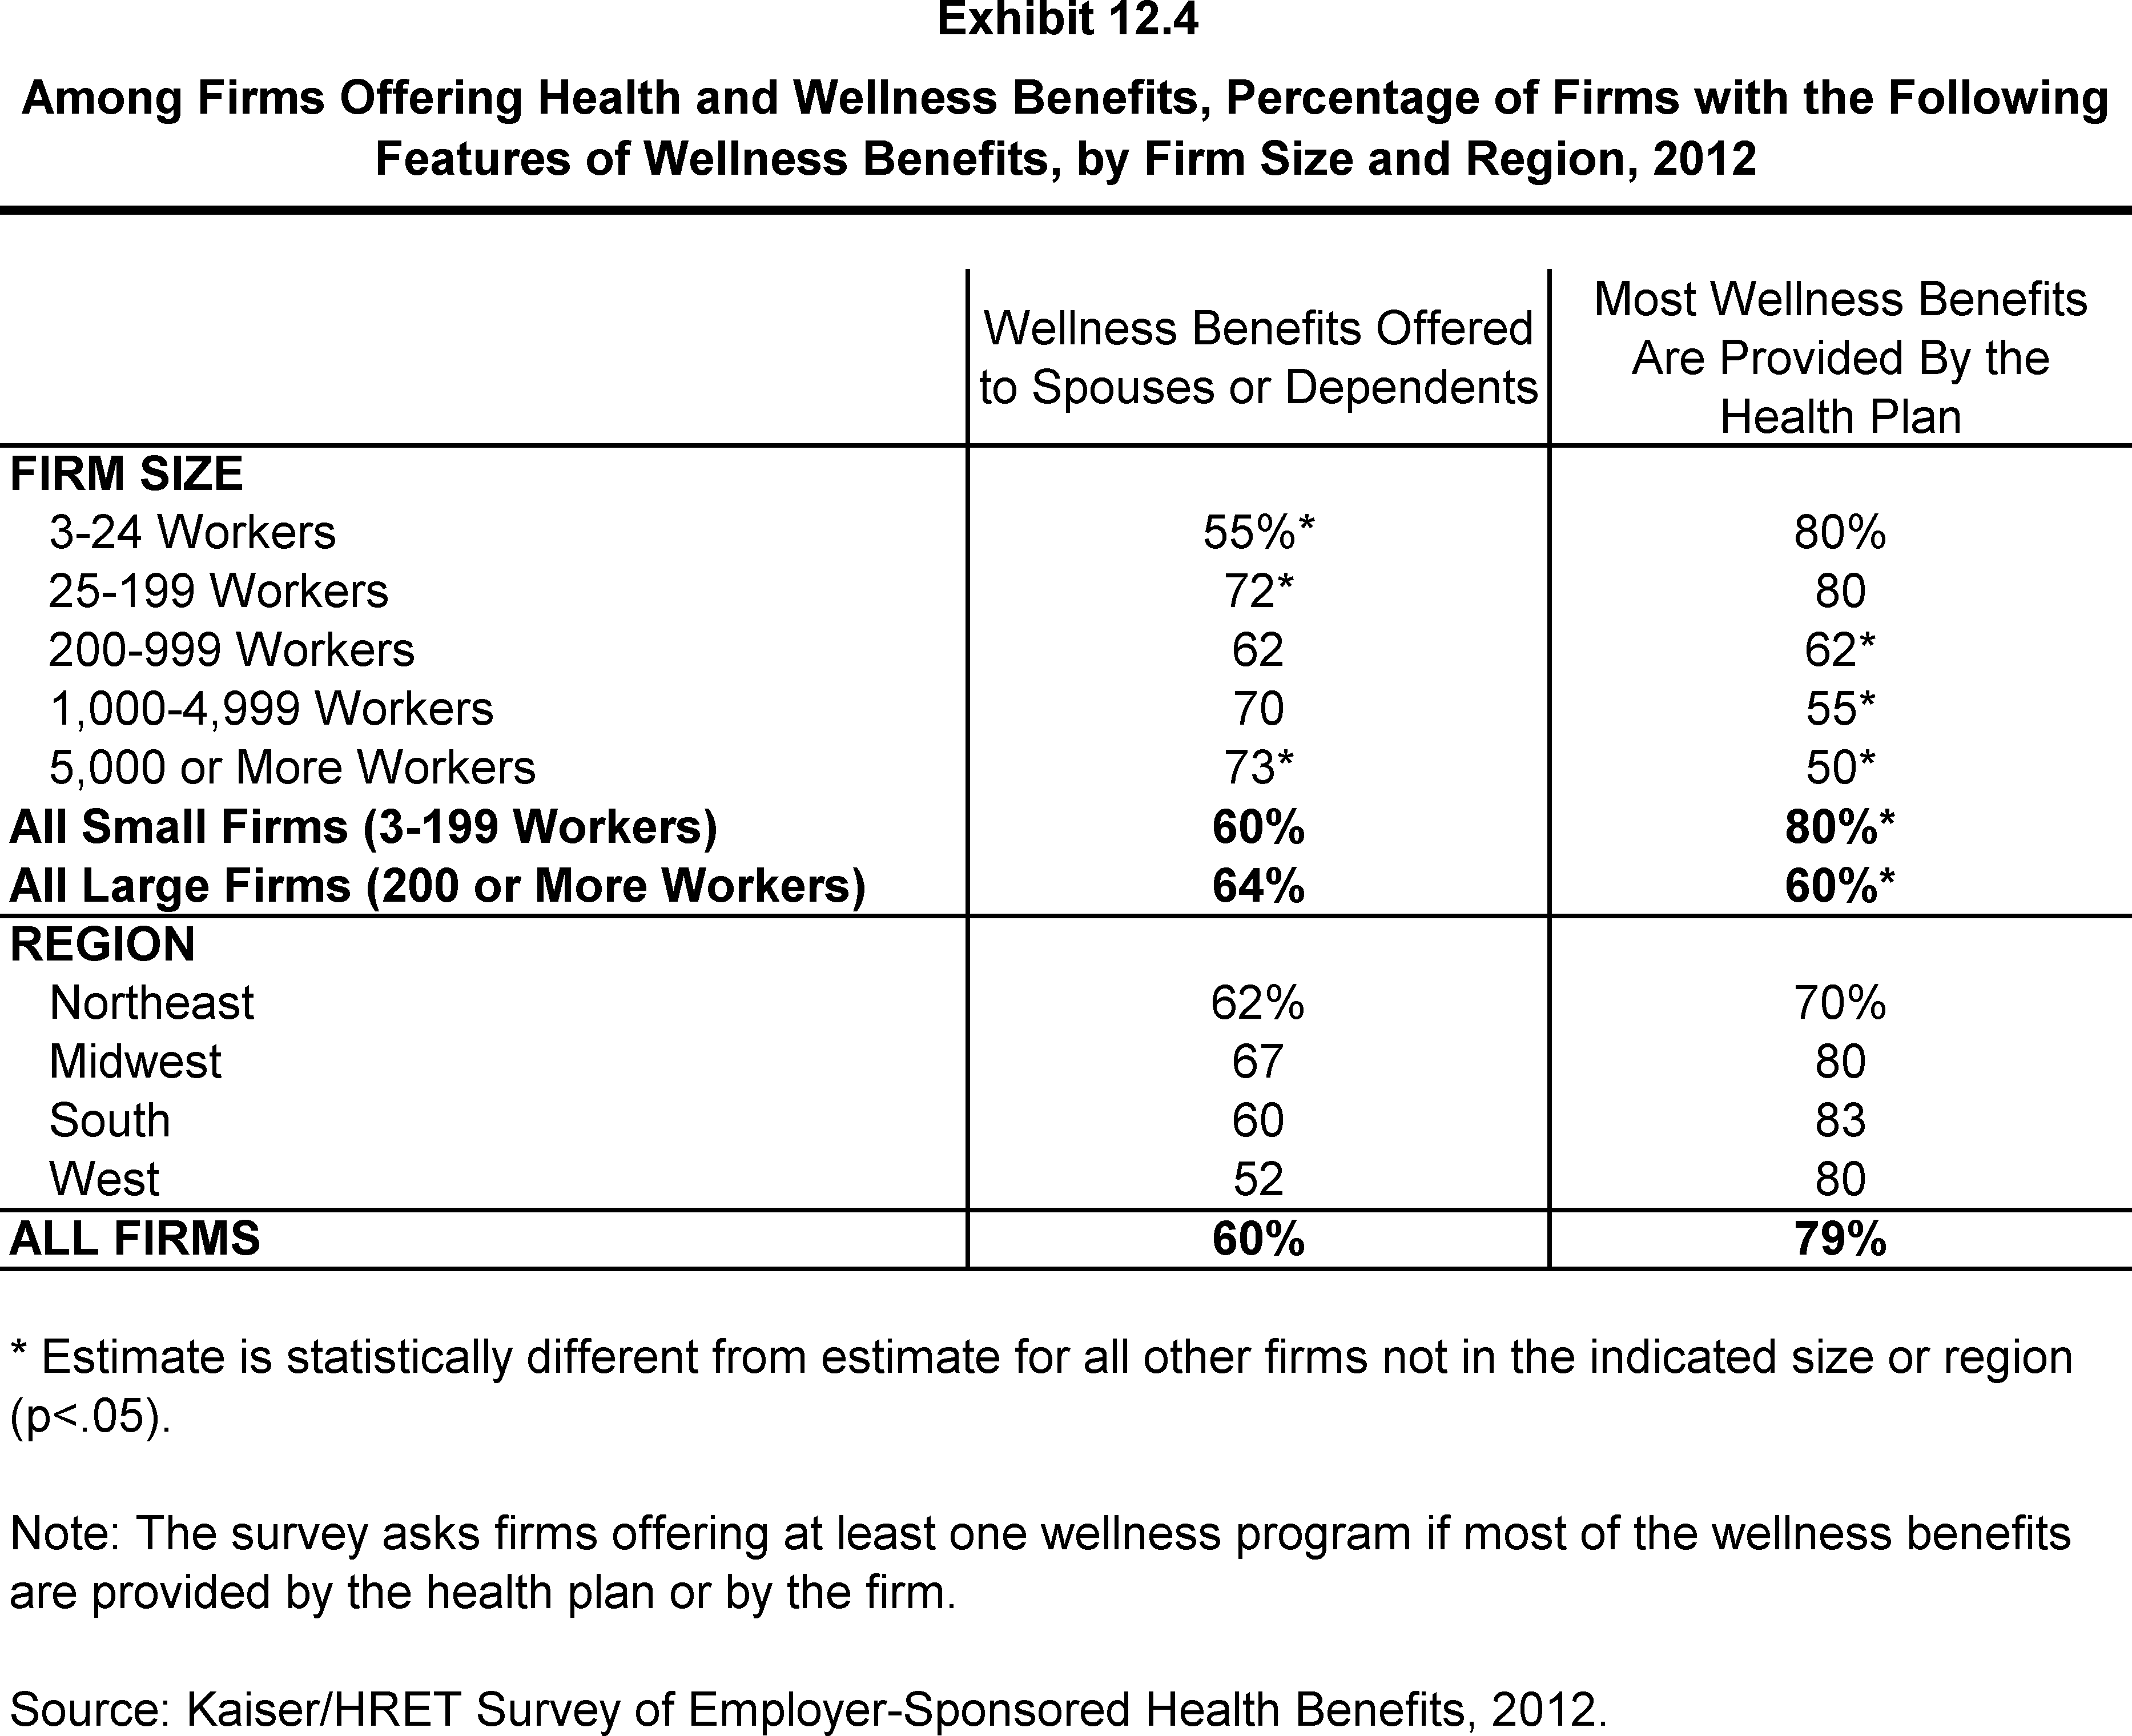
Among Firms Offering Health and Wellness Benefits, Percentage of Firms with the Following Features of Wellness Benefits, by Firm Size and Region, 2012
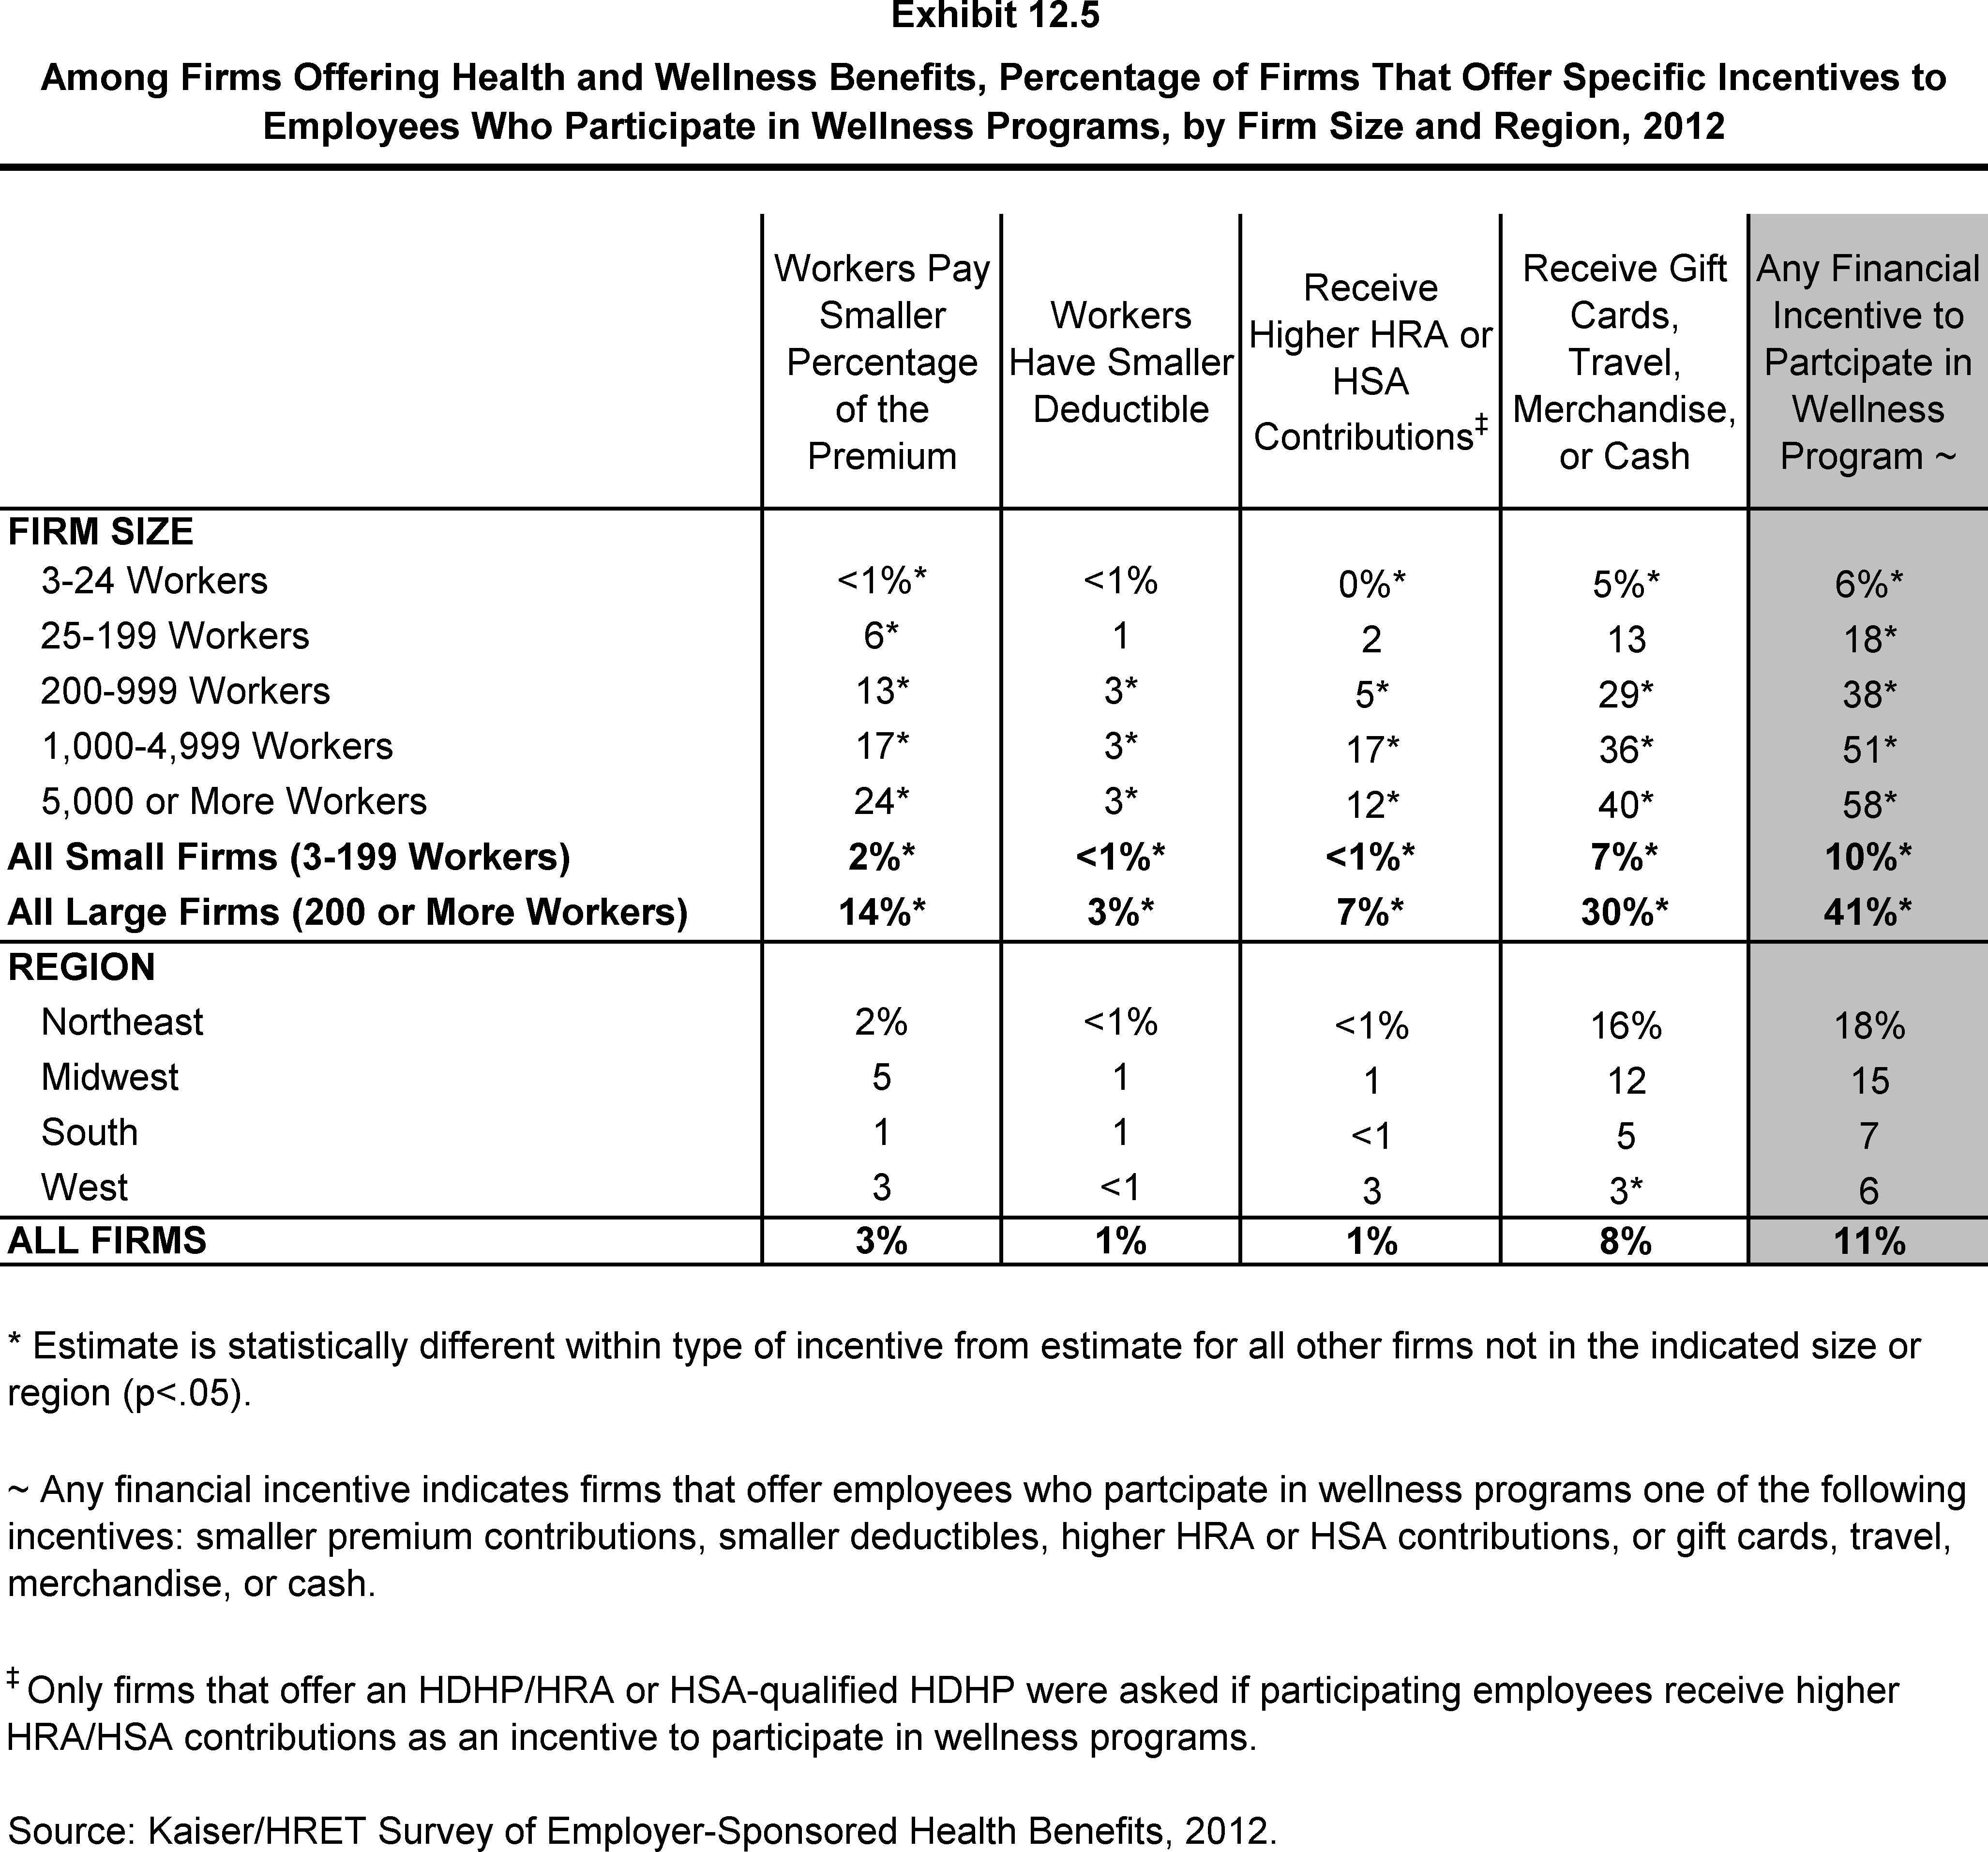
Among Firms Offering Health and Wellness Benefits, Percentage of Firms That Offer Specific Incentives to Employees Who Participate in Wellness Programs, by Firm Size and Region, 2012
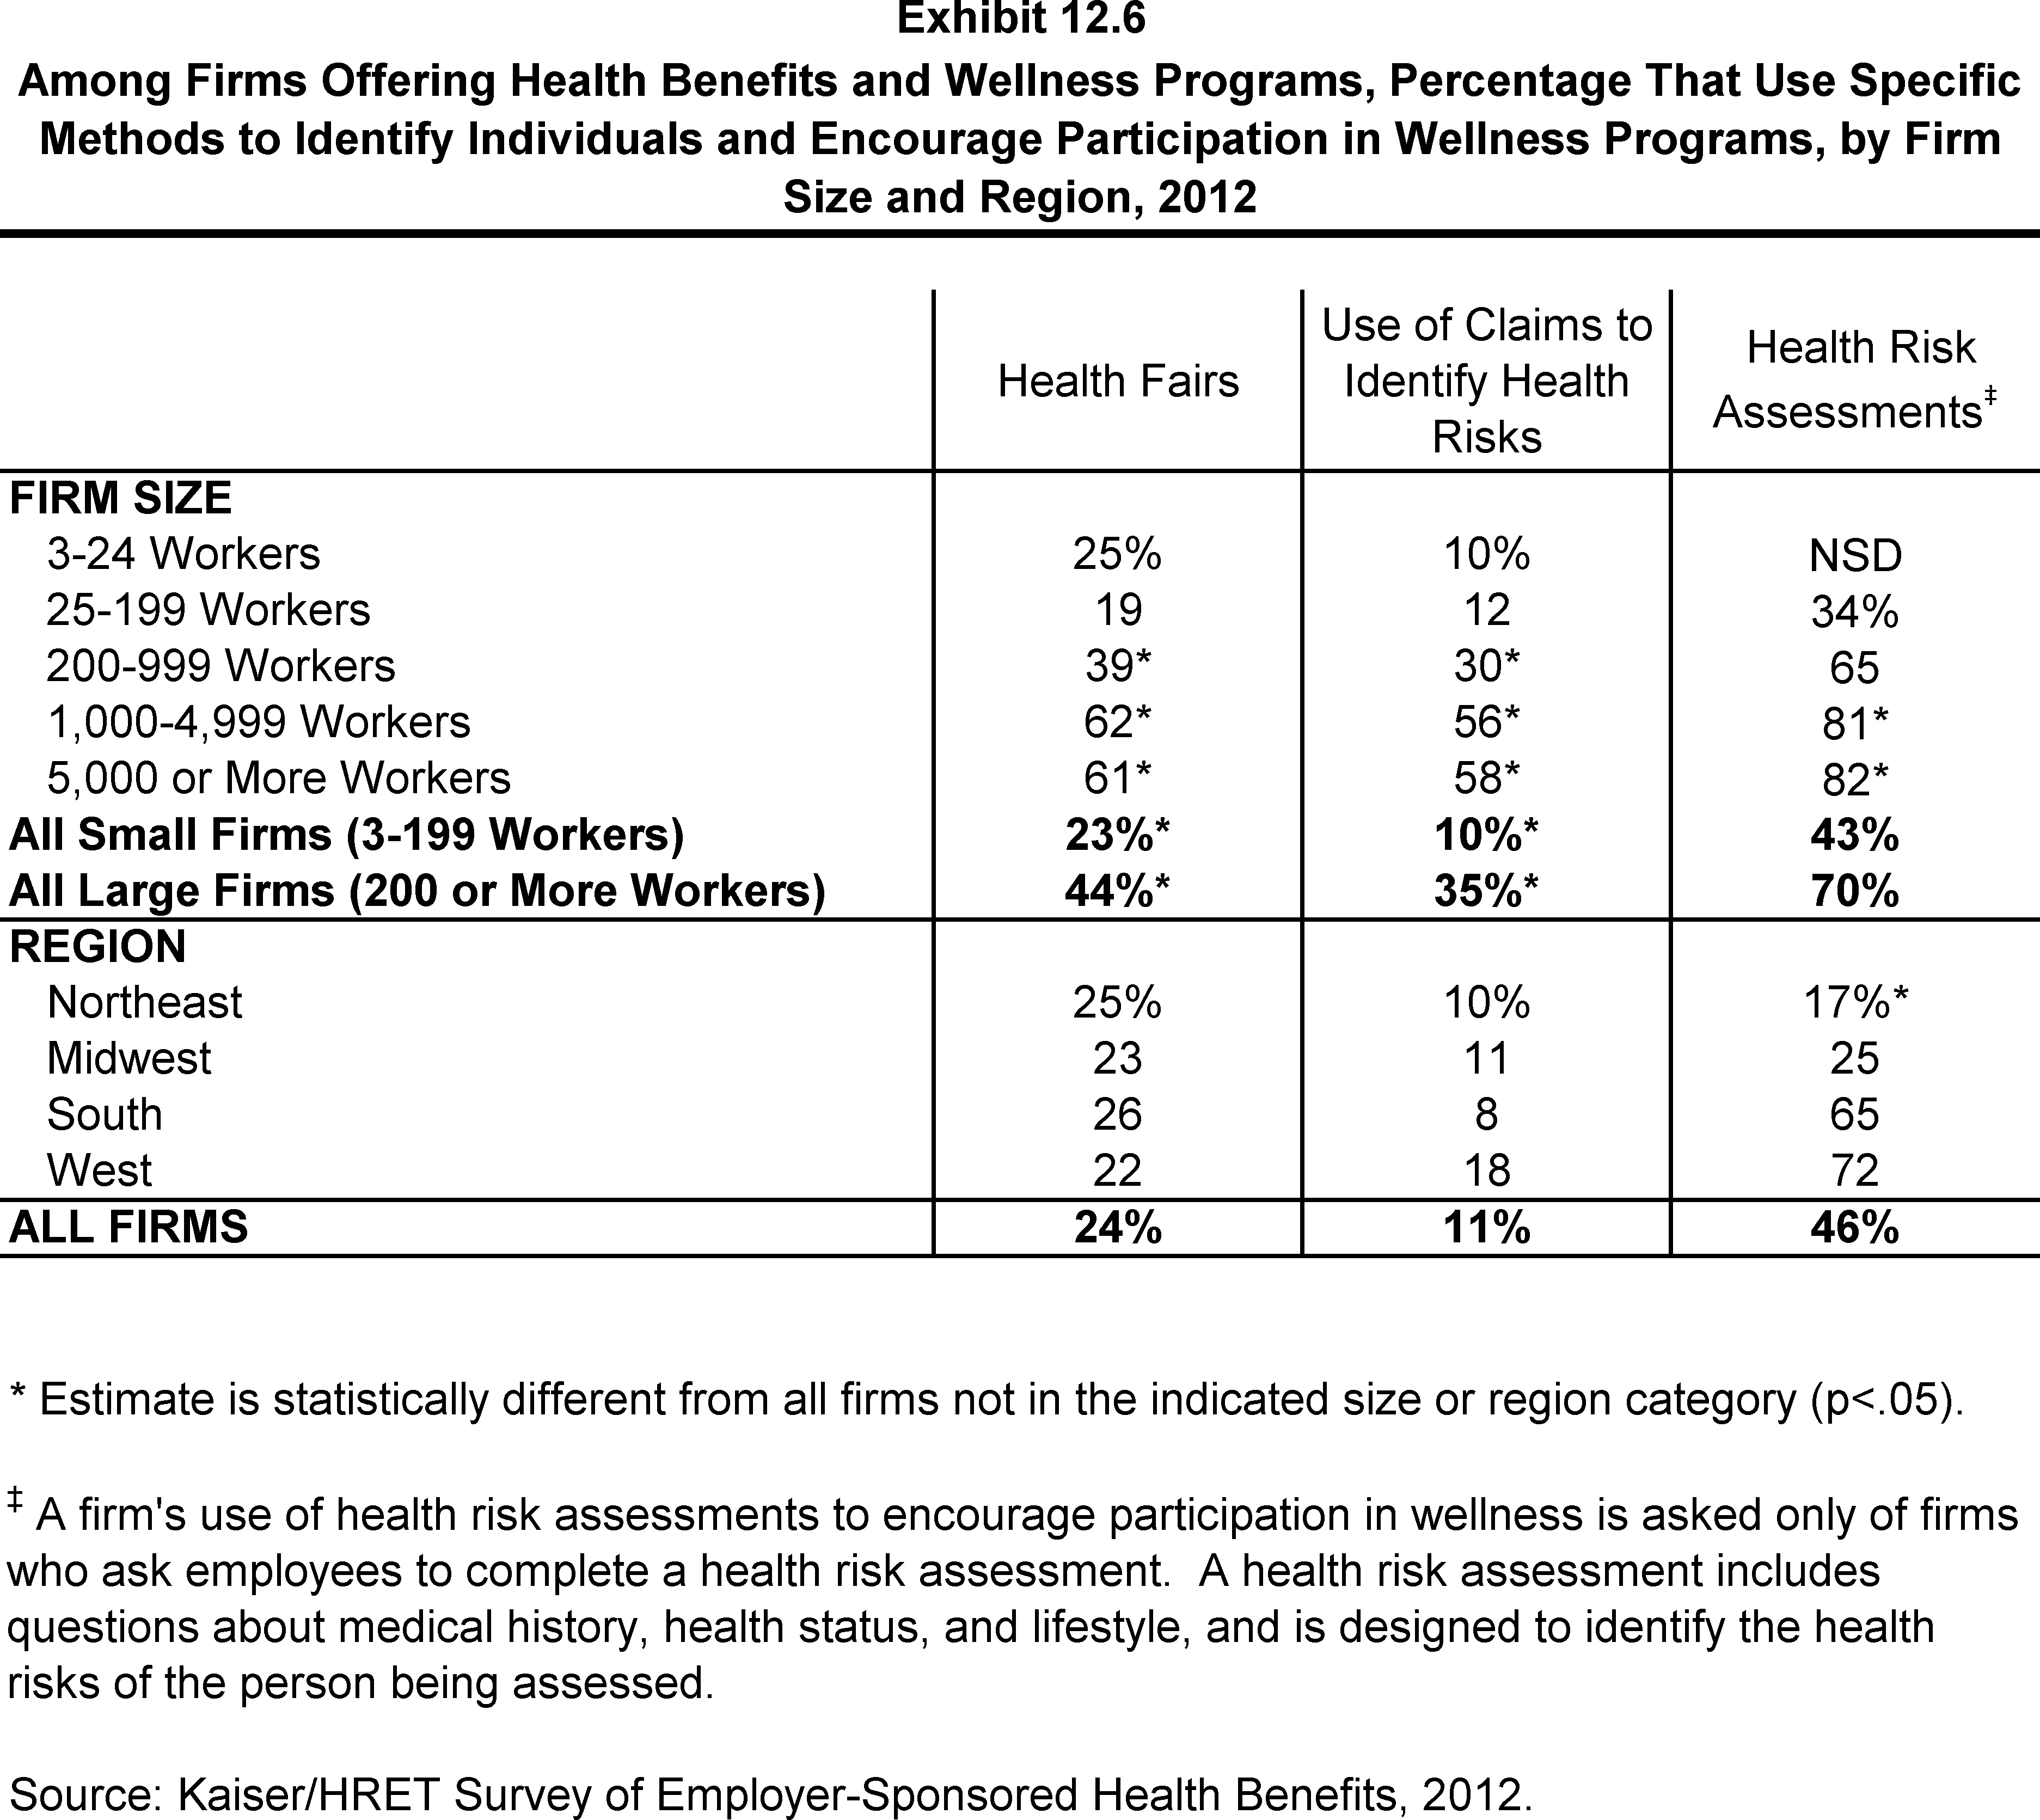
Among Firms Offering Health Benefits and Wellness Programs, Percentage That Use Specific Methods to Identify Individuals and Encourage Participation in Wellness Programs, by Firm Size and Region, 2012
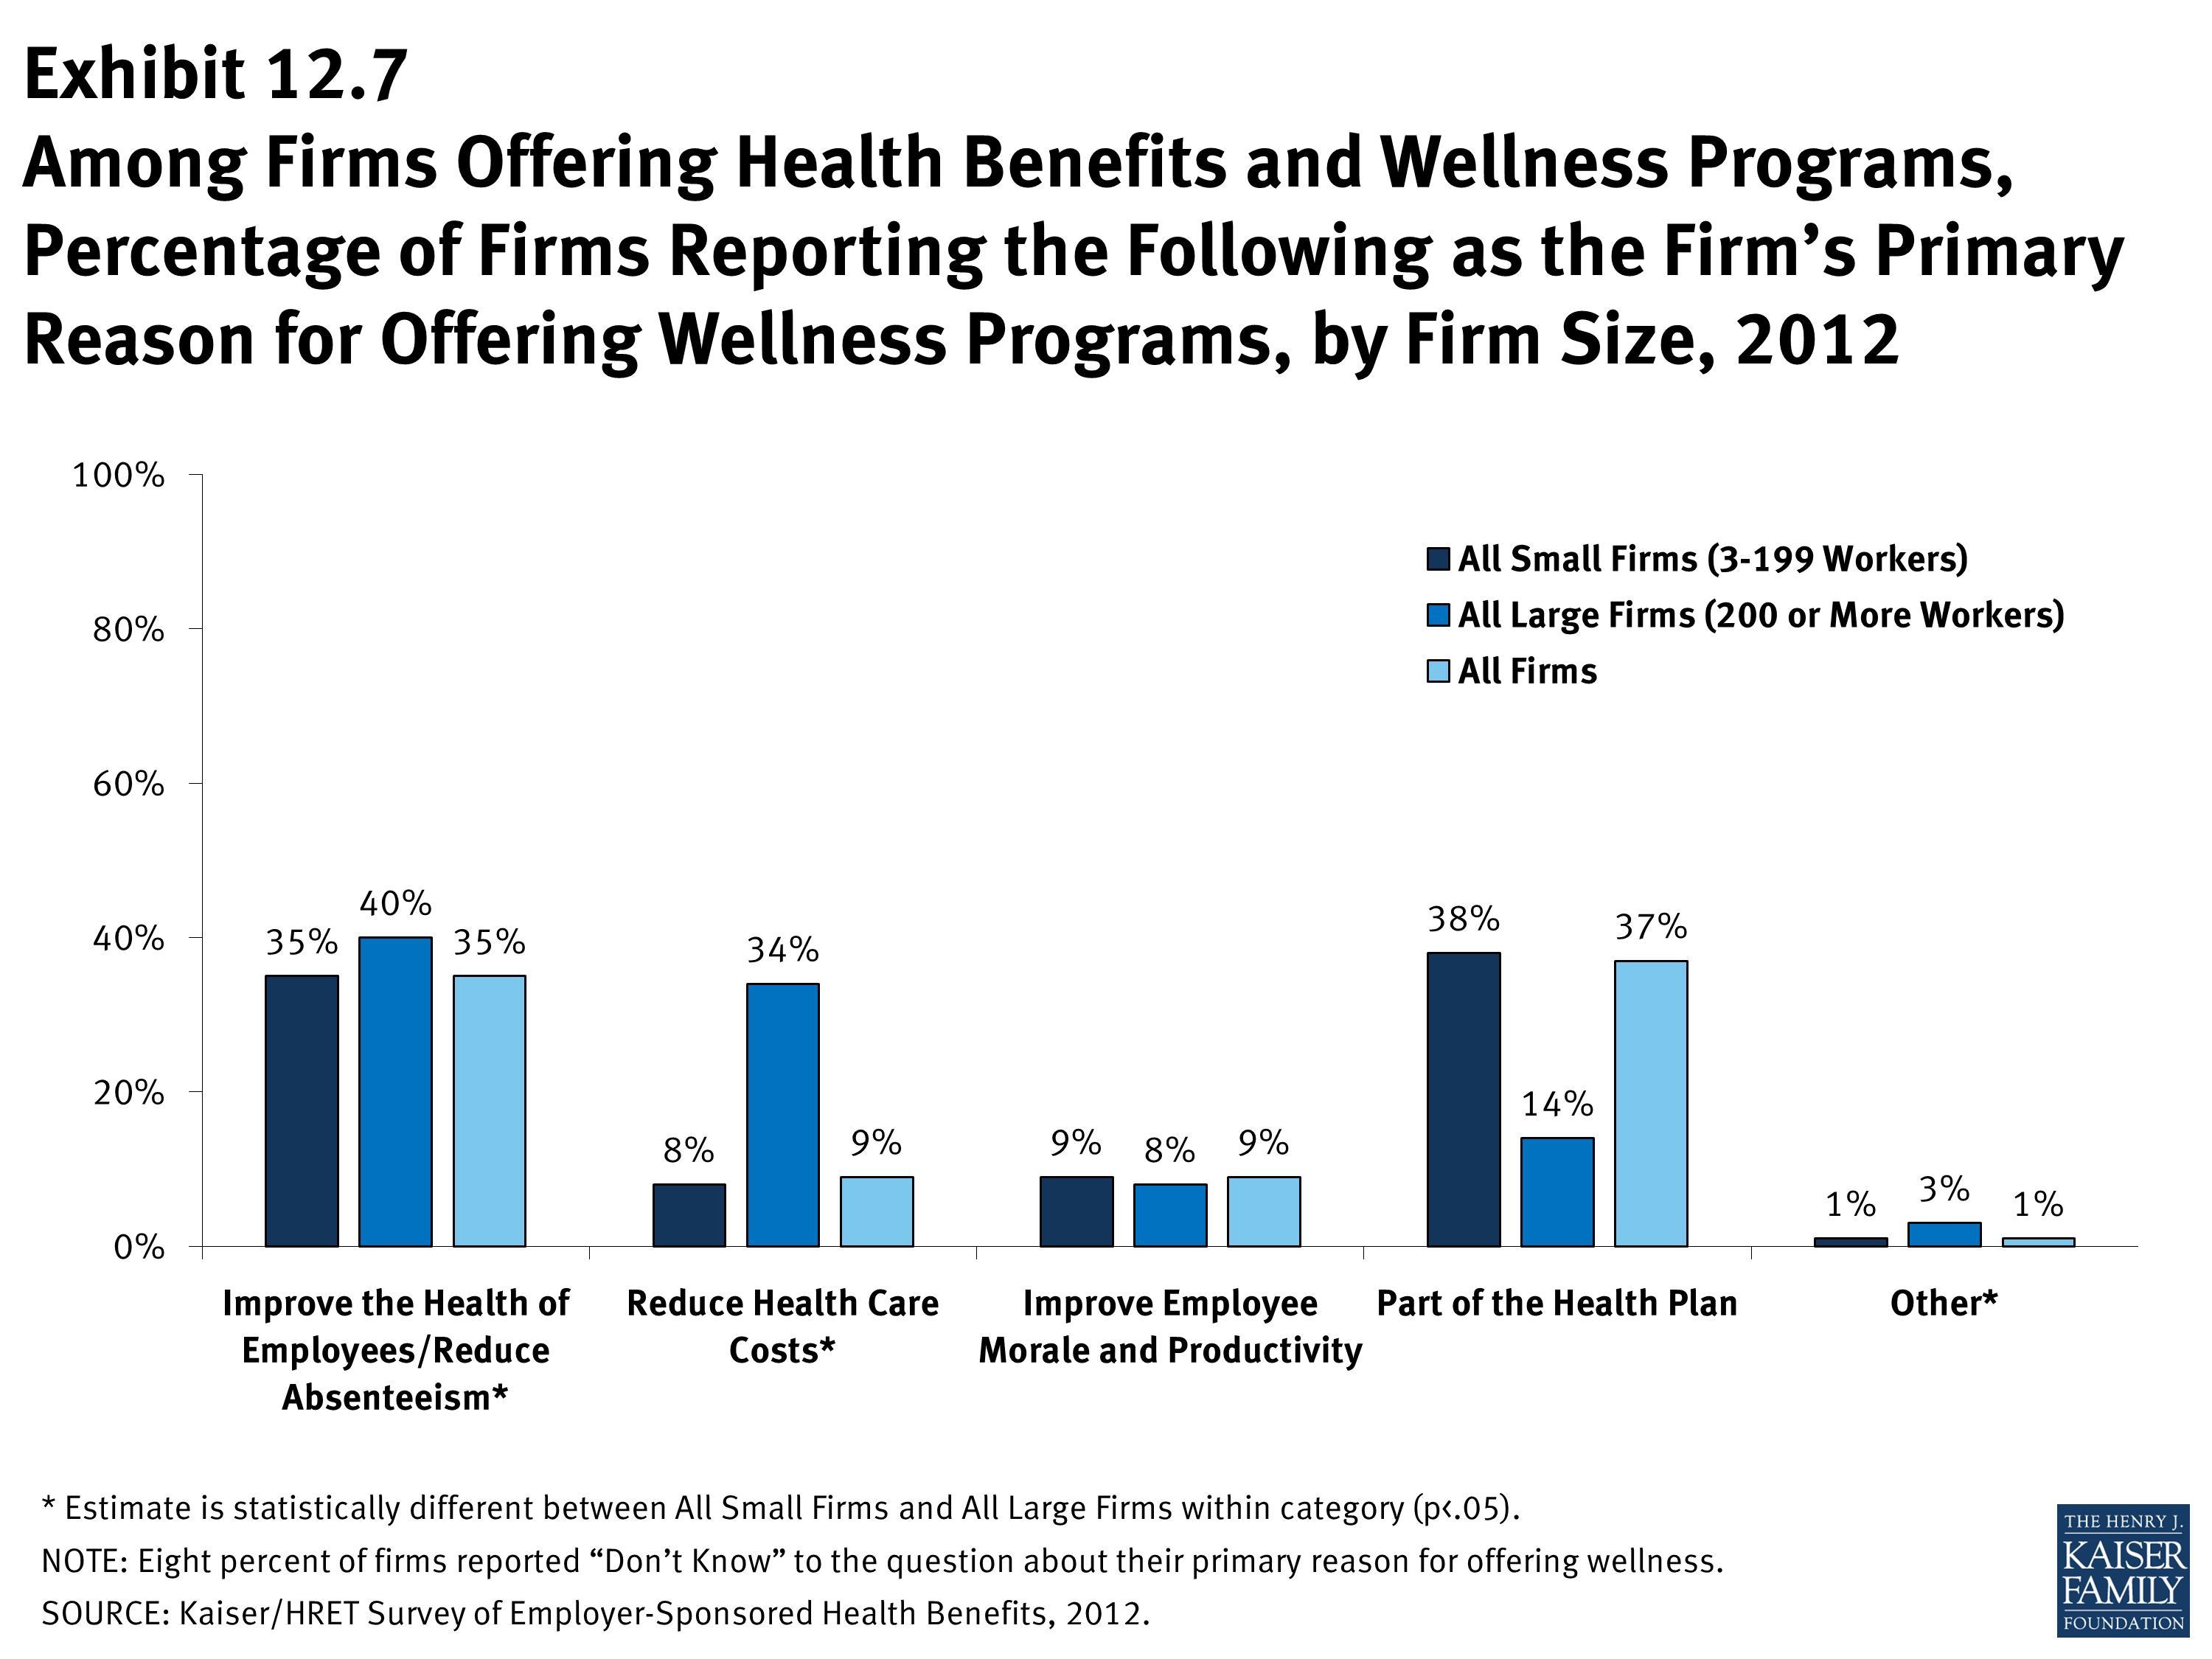
Among Firms Offering Health Benefits and Wellness Programs, Percentage of Firms Reporting the Following as the Firm’s Primary Reason for Offering Wellness Programs, by Firm Size, 2012
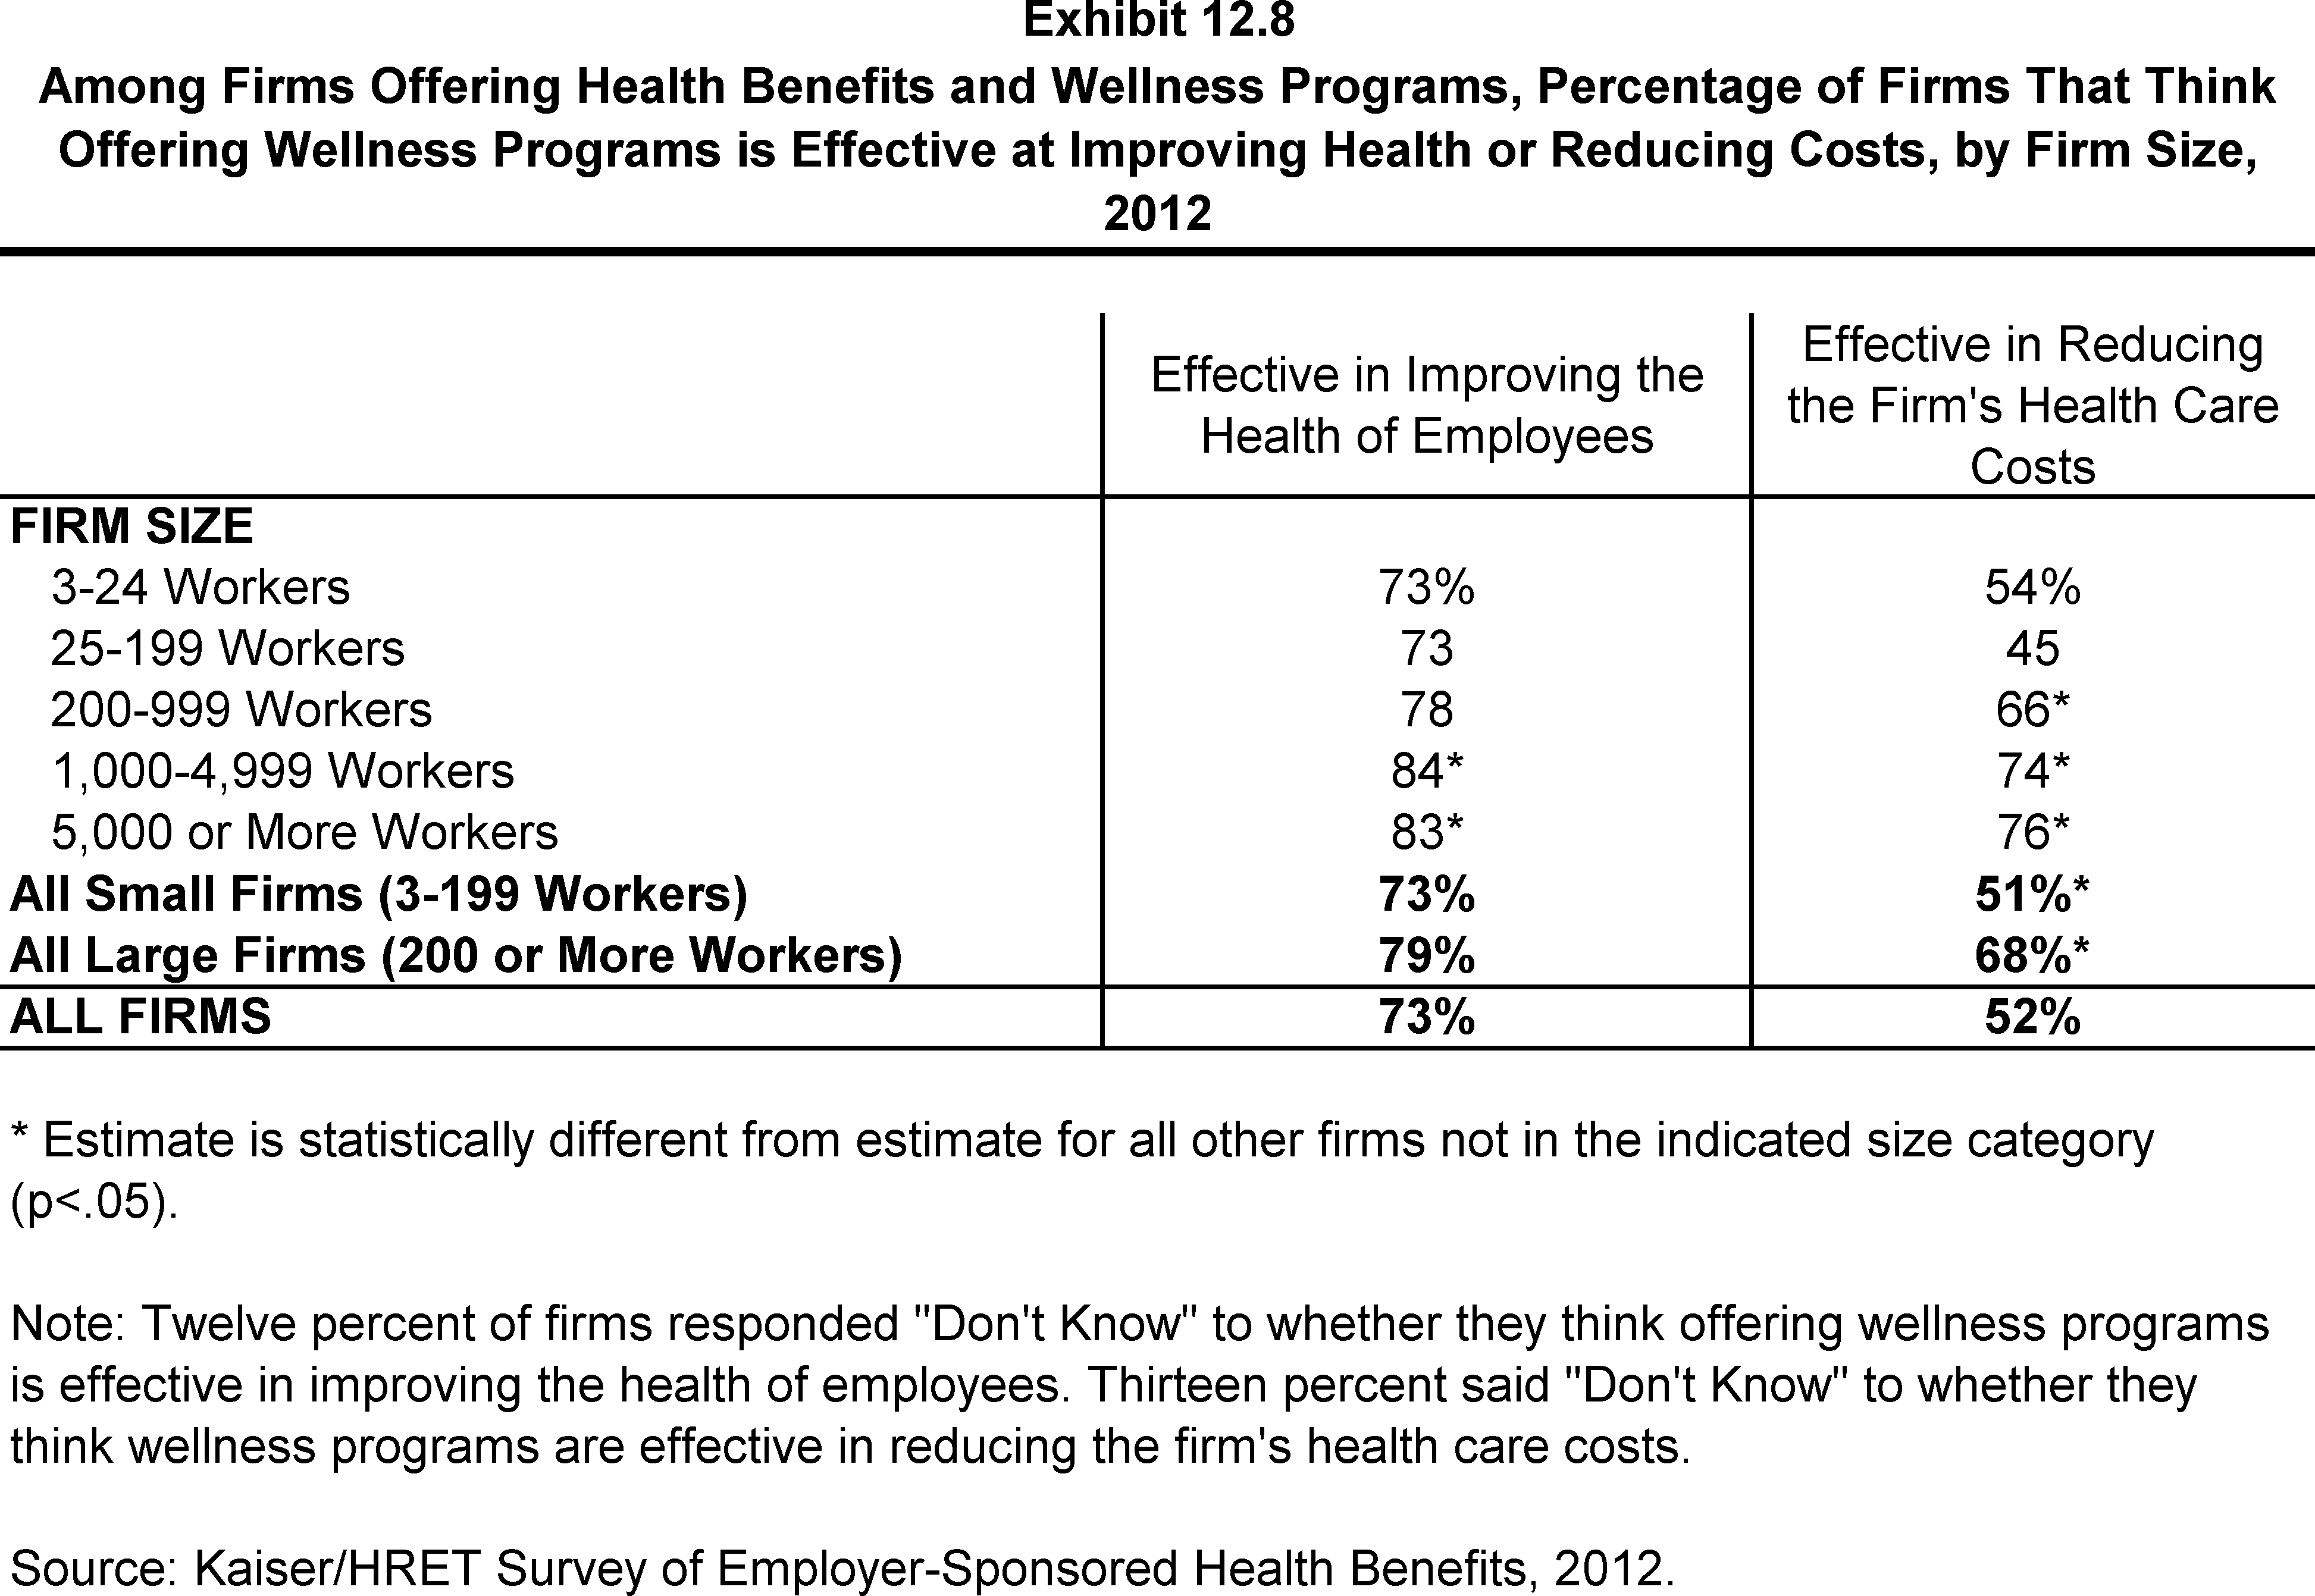
Among Firms Offering Health Benefits and Wellness Programs, Percentage of Firms That Think Offering Wellness Programs is Effective at Improving Health or Reducing Costs, by Firm Size, 2012
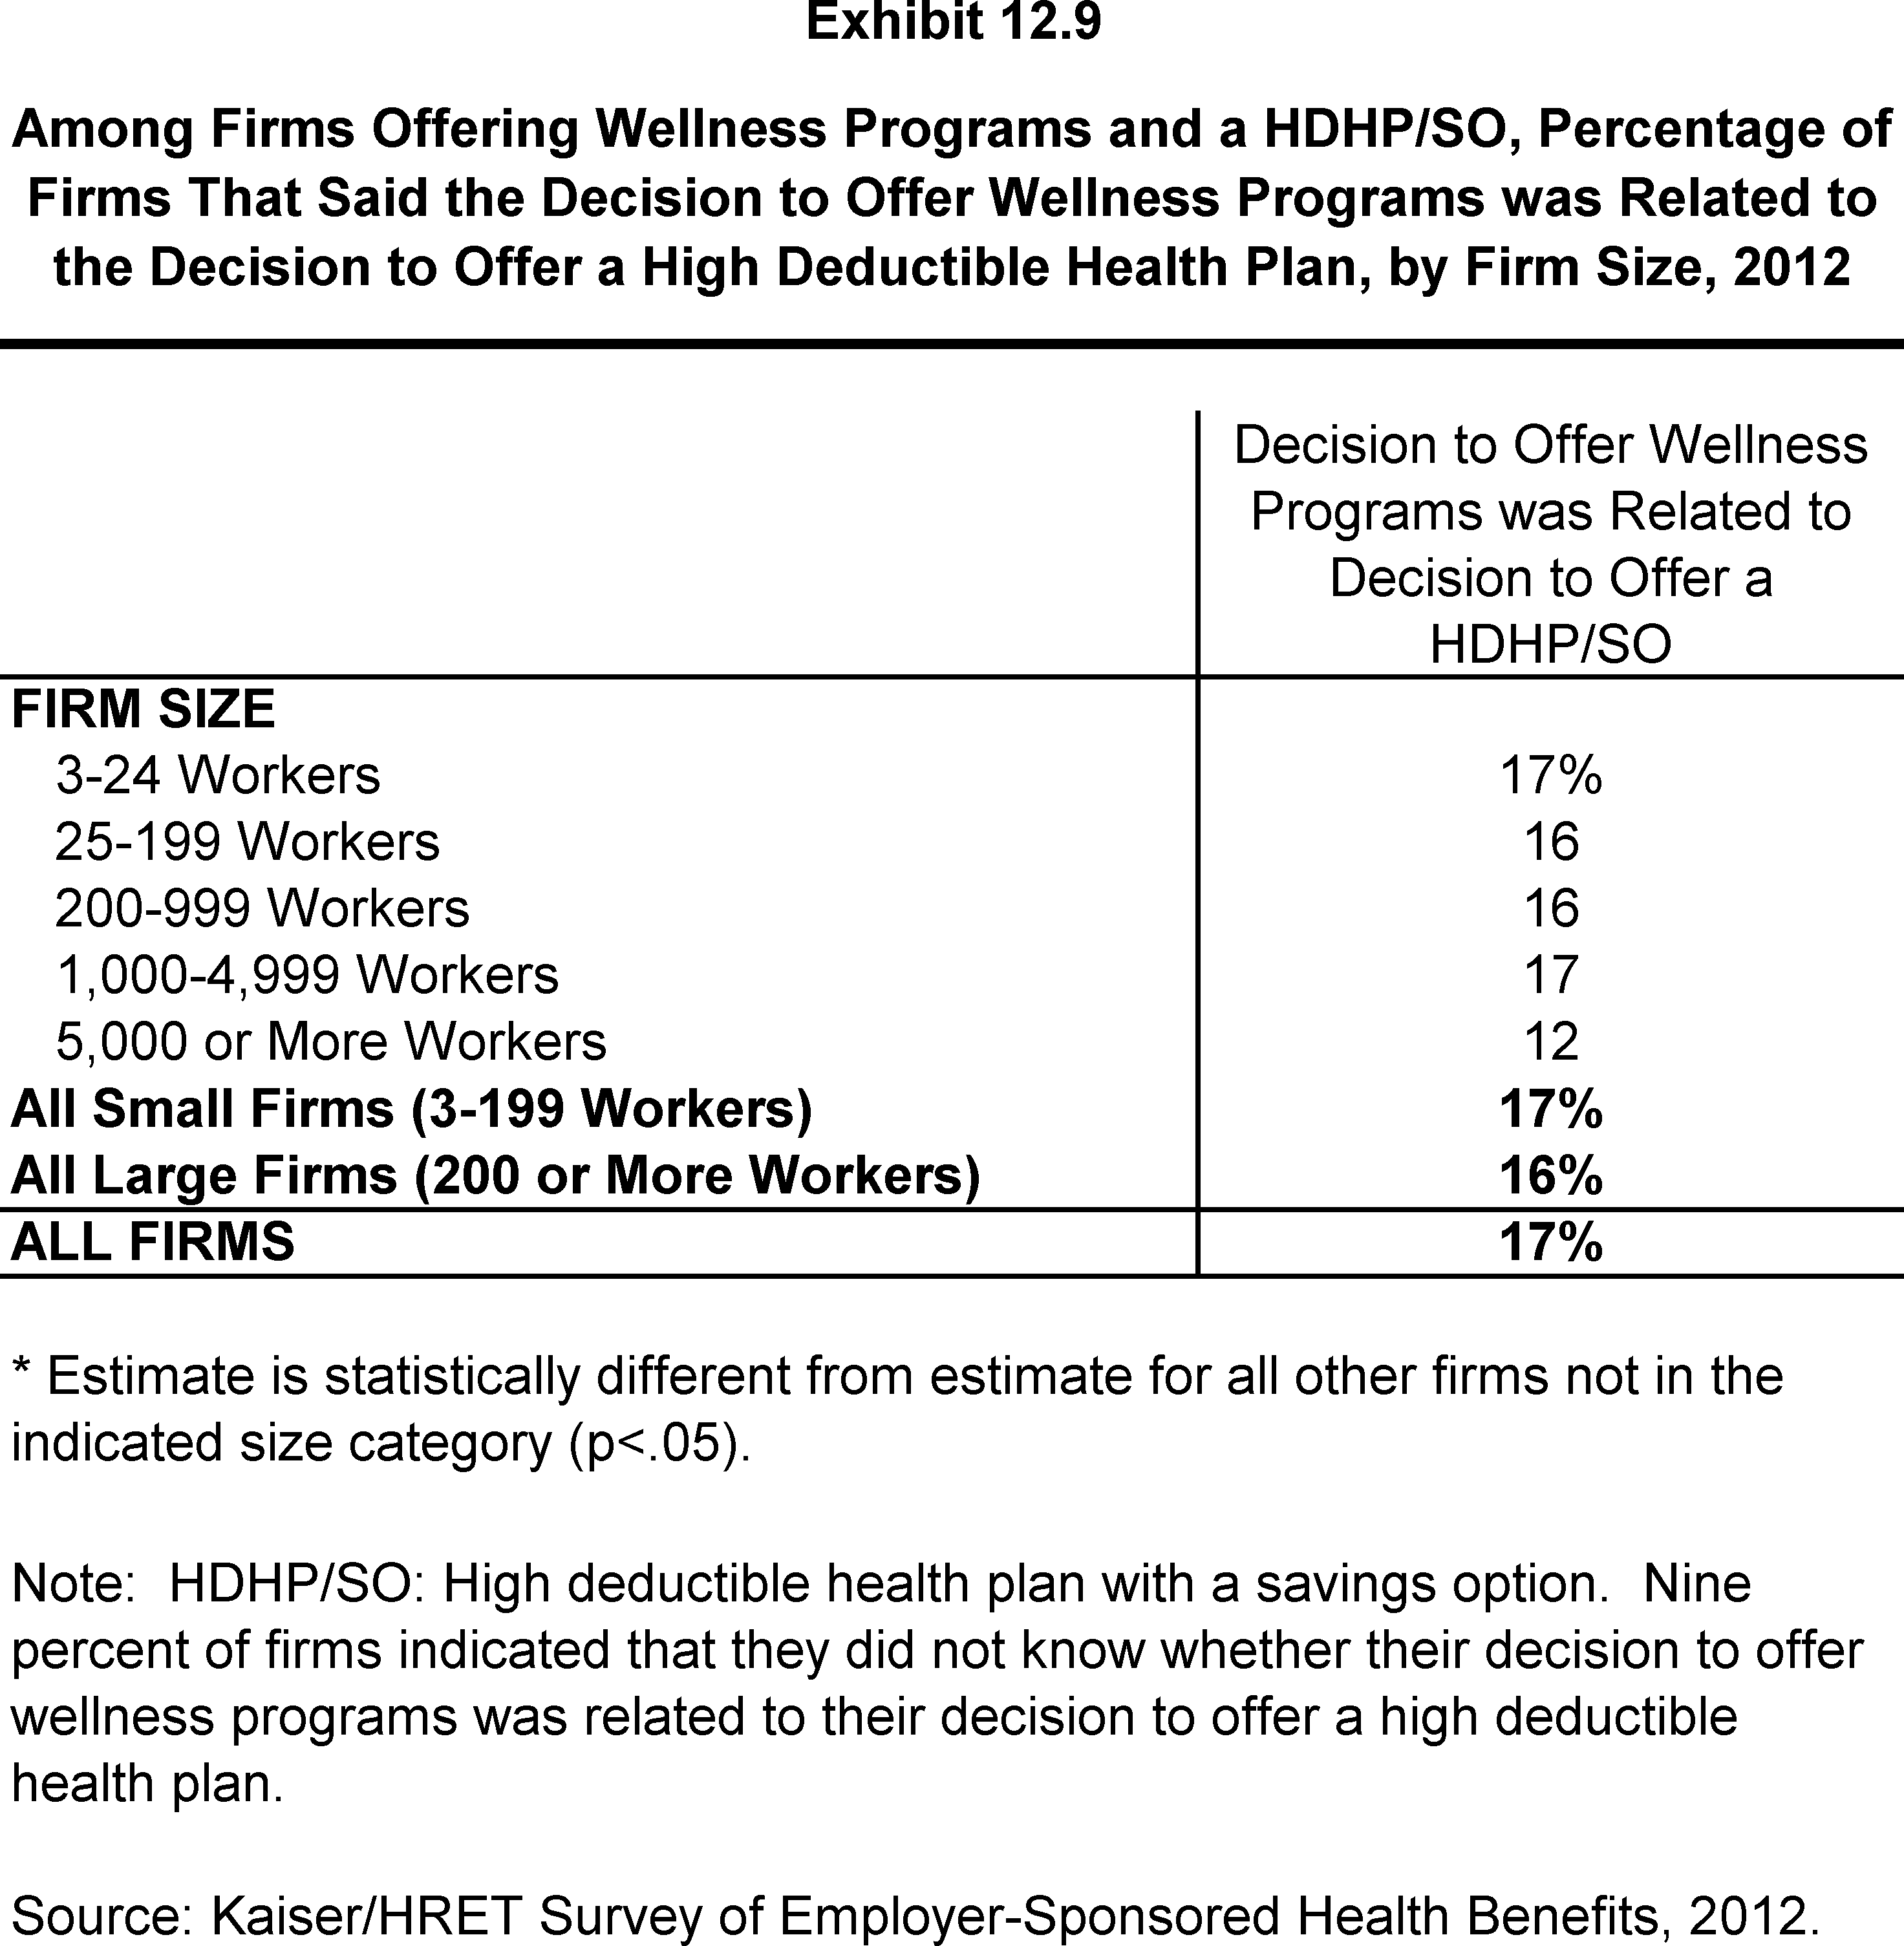
Among Firms Offering Wellness Programs and a HDHP/SO, Percentage of Firms That Said the Decision to Offer Wellness Programs was Related to the Decision to Offer a High Deductible Health Plan, by Firm Size, 2012
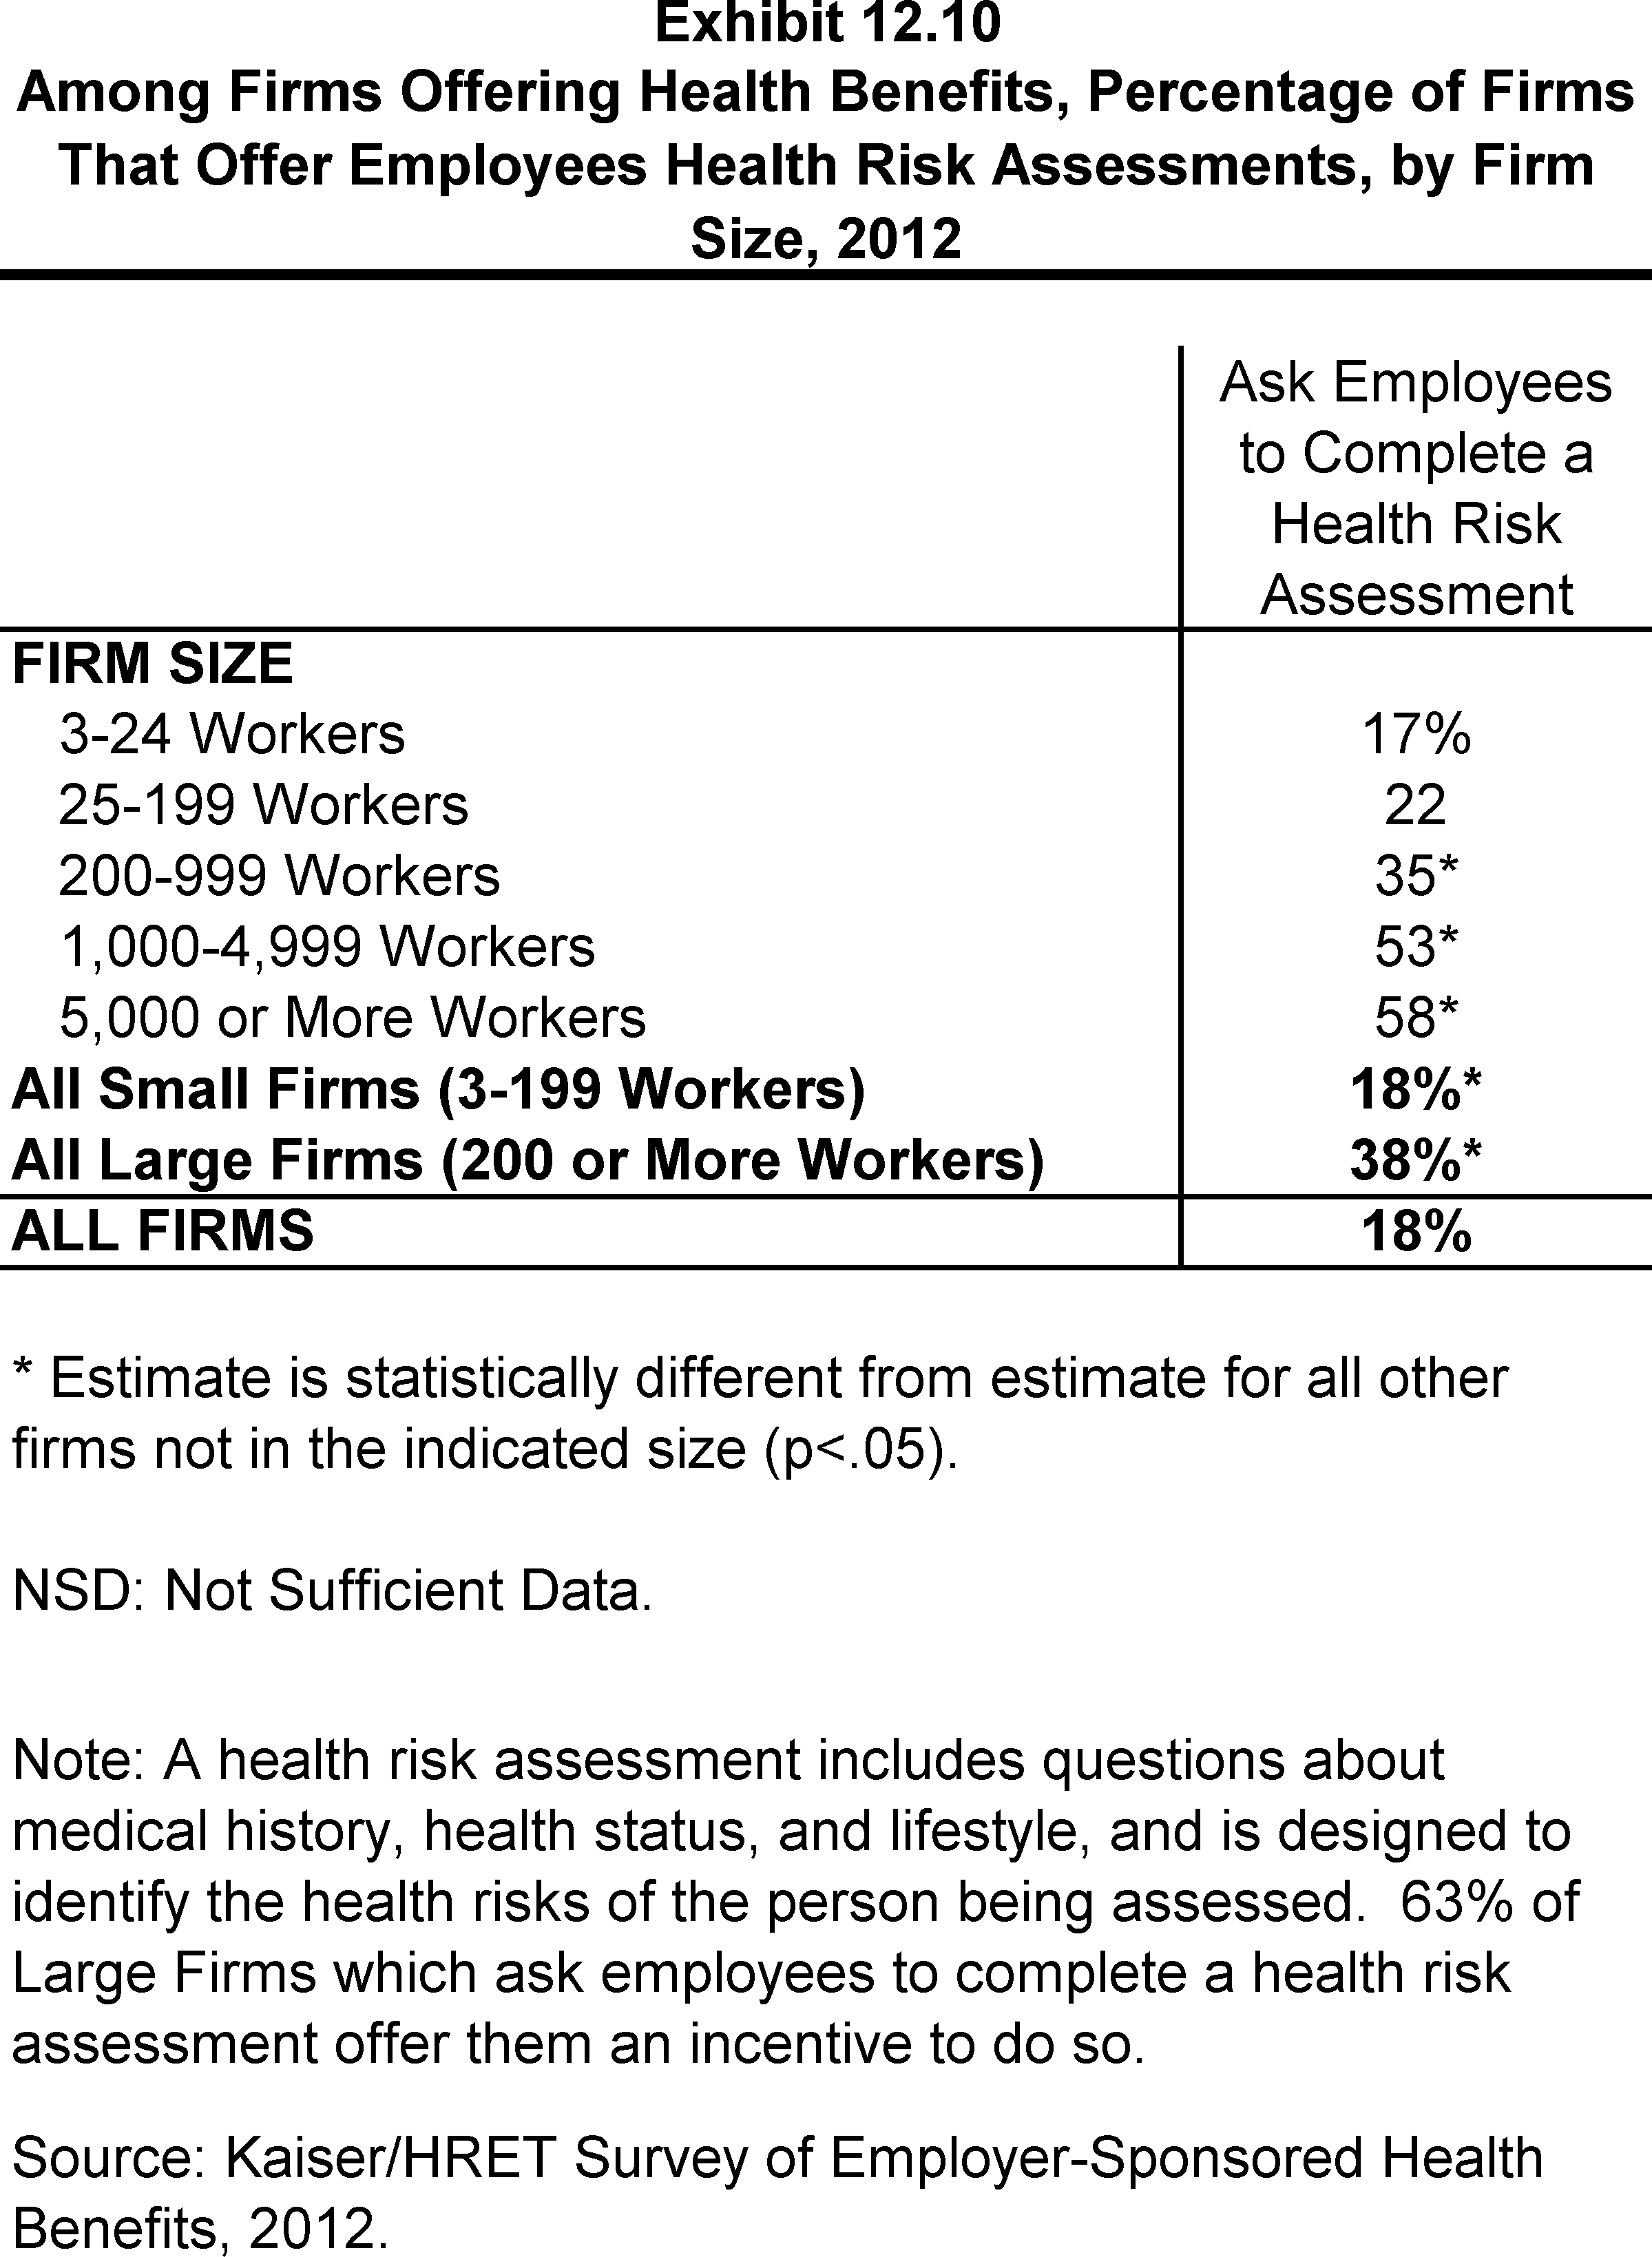
Among Firms Offering Health Benefits, Percentage of Firms That Offer Employees Health Risk Assessments, by Firm Size, 2012
Section 13: Health Reform
The Affordable Care Act (ACA), enacted in 2010, will meaningfully change the American health care system, including the employer-sponsored health insurance market. While many of the most significant provisions of the ACA take effect in 2014, important provisions became effective in 2010 and others will take effect over the next several years. The 2012 survey asked employers about several provisions that are already in effect, including questions about grandfathered health plans, extending coverage to children through the age of 25, and cost sharing for preventive care.
Grandfathering
The ACA provides new standards for employer-sponsored health plans. Many of these standards do not apply to “grandfathered” health plans, those that were created before the passage of the ACA (March 23, 2010) and which have not substantially changed since that time.
Interim final rules released by the Department of Health and Human Services on June 17, 2010, and amended on November 17, 2010, stipulate that firms cannot significantly change cost sharing, benefits, employer contributions, or access to coverage in grandfathered plans.1 New employees can enroll in a grandfathered plan as long as the firm has maintained consecutive enrollment in the plan.
While grandfathered plans are exempted from most of the ACA’s new requirements, they must comply with the following provisions as they become effective: (1) provide a uniform explanation of coverage, (2) report medical loss ratios and provide premium rebates if medical loss ratios are not met, (3) prohibit lifetime and annual limits (phased out by 2014) on essential health benefits, (4) extend dependent coverage to age 26, (5) prohibit health plan rescissions, (6) prohibit waiting periods greater than 90 days, and (7) prohibit coverage exclusions for pre-existing health conditions.2 Firms must decide whether to grandfather their insurance plans, which limits the changes they can make to their plans, or whether to comply with the full set of new health reform requirements.
- Fifty-eight percent of firms offering health benefits report that they have at least one health plan that is a grandfathered plan in 2012 (Exhibit 13.1), lower than the 72% of offering firms with a grandfathered plan in 2011.
- Looking at worker enrollment, 48% of covered workers are enrolled in a grandfathered health plan in 2012, down from 56% in 2011 (Exhibit 13.3).
- Firms with plans that are not grandfathered were asked to respond to a list of potential reasons why each plan is not a grandfathered plan. Twenty-seven percent of covered workers are in plans that were not in effect when the ACA was enacted. Roughly similar percentages of workers are in plans where the deductibles or copayments (36%) or employee premium contributions (34%) changed more than was permitted for plans to maintain grandfathered status (Exhibit 13.4).
- The reasons plans are not grandfathered varied by firm size, with workers in small firms (3 to 199 workers) much more likely than workers in large firms to be in a new plan that was not in effect when the ACA was enacted (55% vs. 19%) (Exhibit 13.4).
Extending Coverage to Adult Children to Age 26
Starting September 23, 2010, the ACA requires all health plans to extend coverage to the children of covered workers up to age 26, whether or not the child is financially dependent. Until 2014, grandfathered health plans are not required to extend coverage to a child of a covered worker if the child has access to employer-sponsored coverage either from a spouse or independently.3 The survey asked firms whether any adult children who would not have been eligible for the plan prior to the change in law had enrolled in health coverage under this provision.
- Thirty-one percent of firms that offer either family or single plus one coverage reported enrolling at least one adult child, who otherwise would not be eligible to enroll, due to the ACA (Exhibit 13.5).
- Large firms (200 or more workers) are more likely to have enrolled an adult child due to the ACA than smaller firms (90% vs. 29%) (Exhibit 13.5).
- The numbers of children who enroll under this provision are closely related to the number of workers in the firm. Smaller firms (3-49 workers) on average enroll one to two adult children due to the provision, while the largest firms (5,000 or more workers) enroll an average of 478 adult children (Exhibit 13.6).
- In total, about 2.9 million adult children were enrolled in their parent’s employer-sponsored health plan due to the Affordable Care Act. This is a significant increase from the number reported in 2011 (2.3 million).4
- Of the total 2.9 million adult children currently enrolled on their parent’s coverage because of the ACA, 1.1 million enrolled at small firms and 1.8 million at large firms.
Coverage for Preventive Care
The ACA requires non-grandfathered health plans to provide coverage for certain preventive services without deductibles or other cost sharing. Grandfathered health plans are also permitted to conform their coverage and cost sharing for preventive care without compromising their grandfathered status. Firms were asked whether they changed the list of services considered to be preventive due to the provisions in the ACA.
- Forty-one percent of covered workers are in a plan that reports it has changed the list of services considered preventive due to the ACA (Exhibit 13.7).
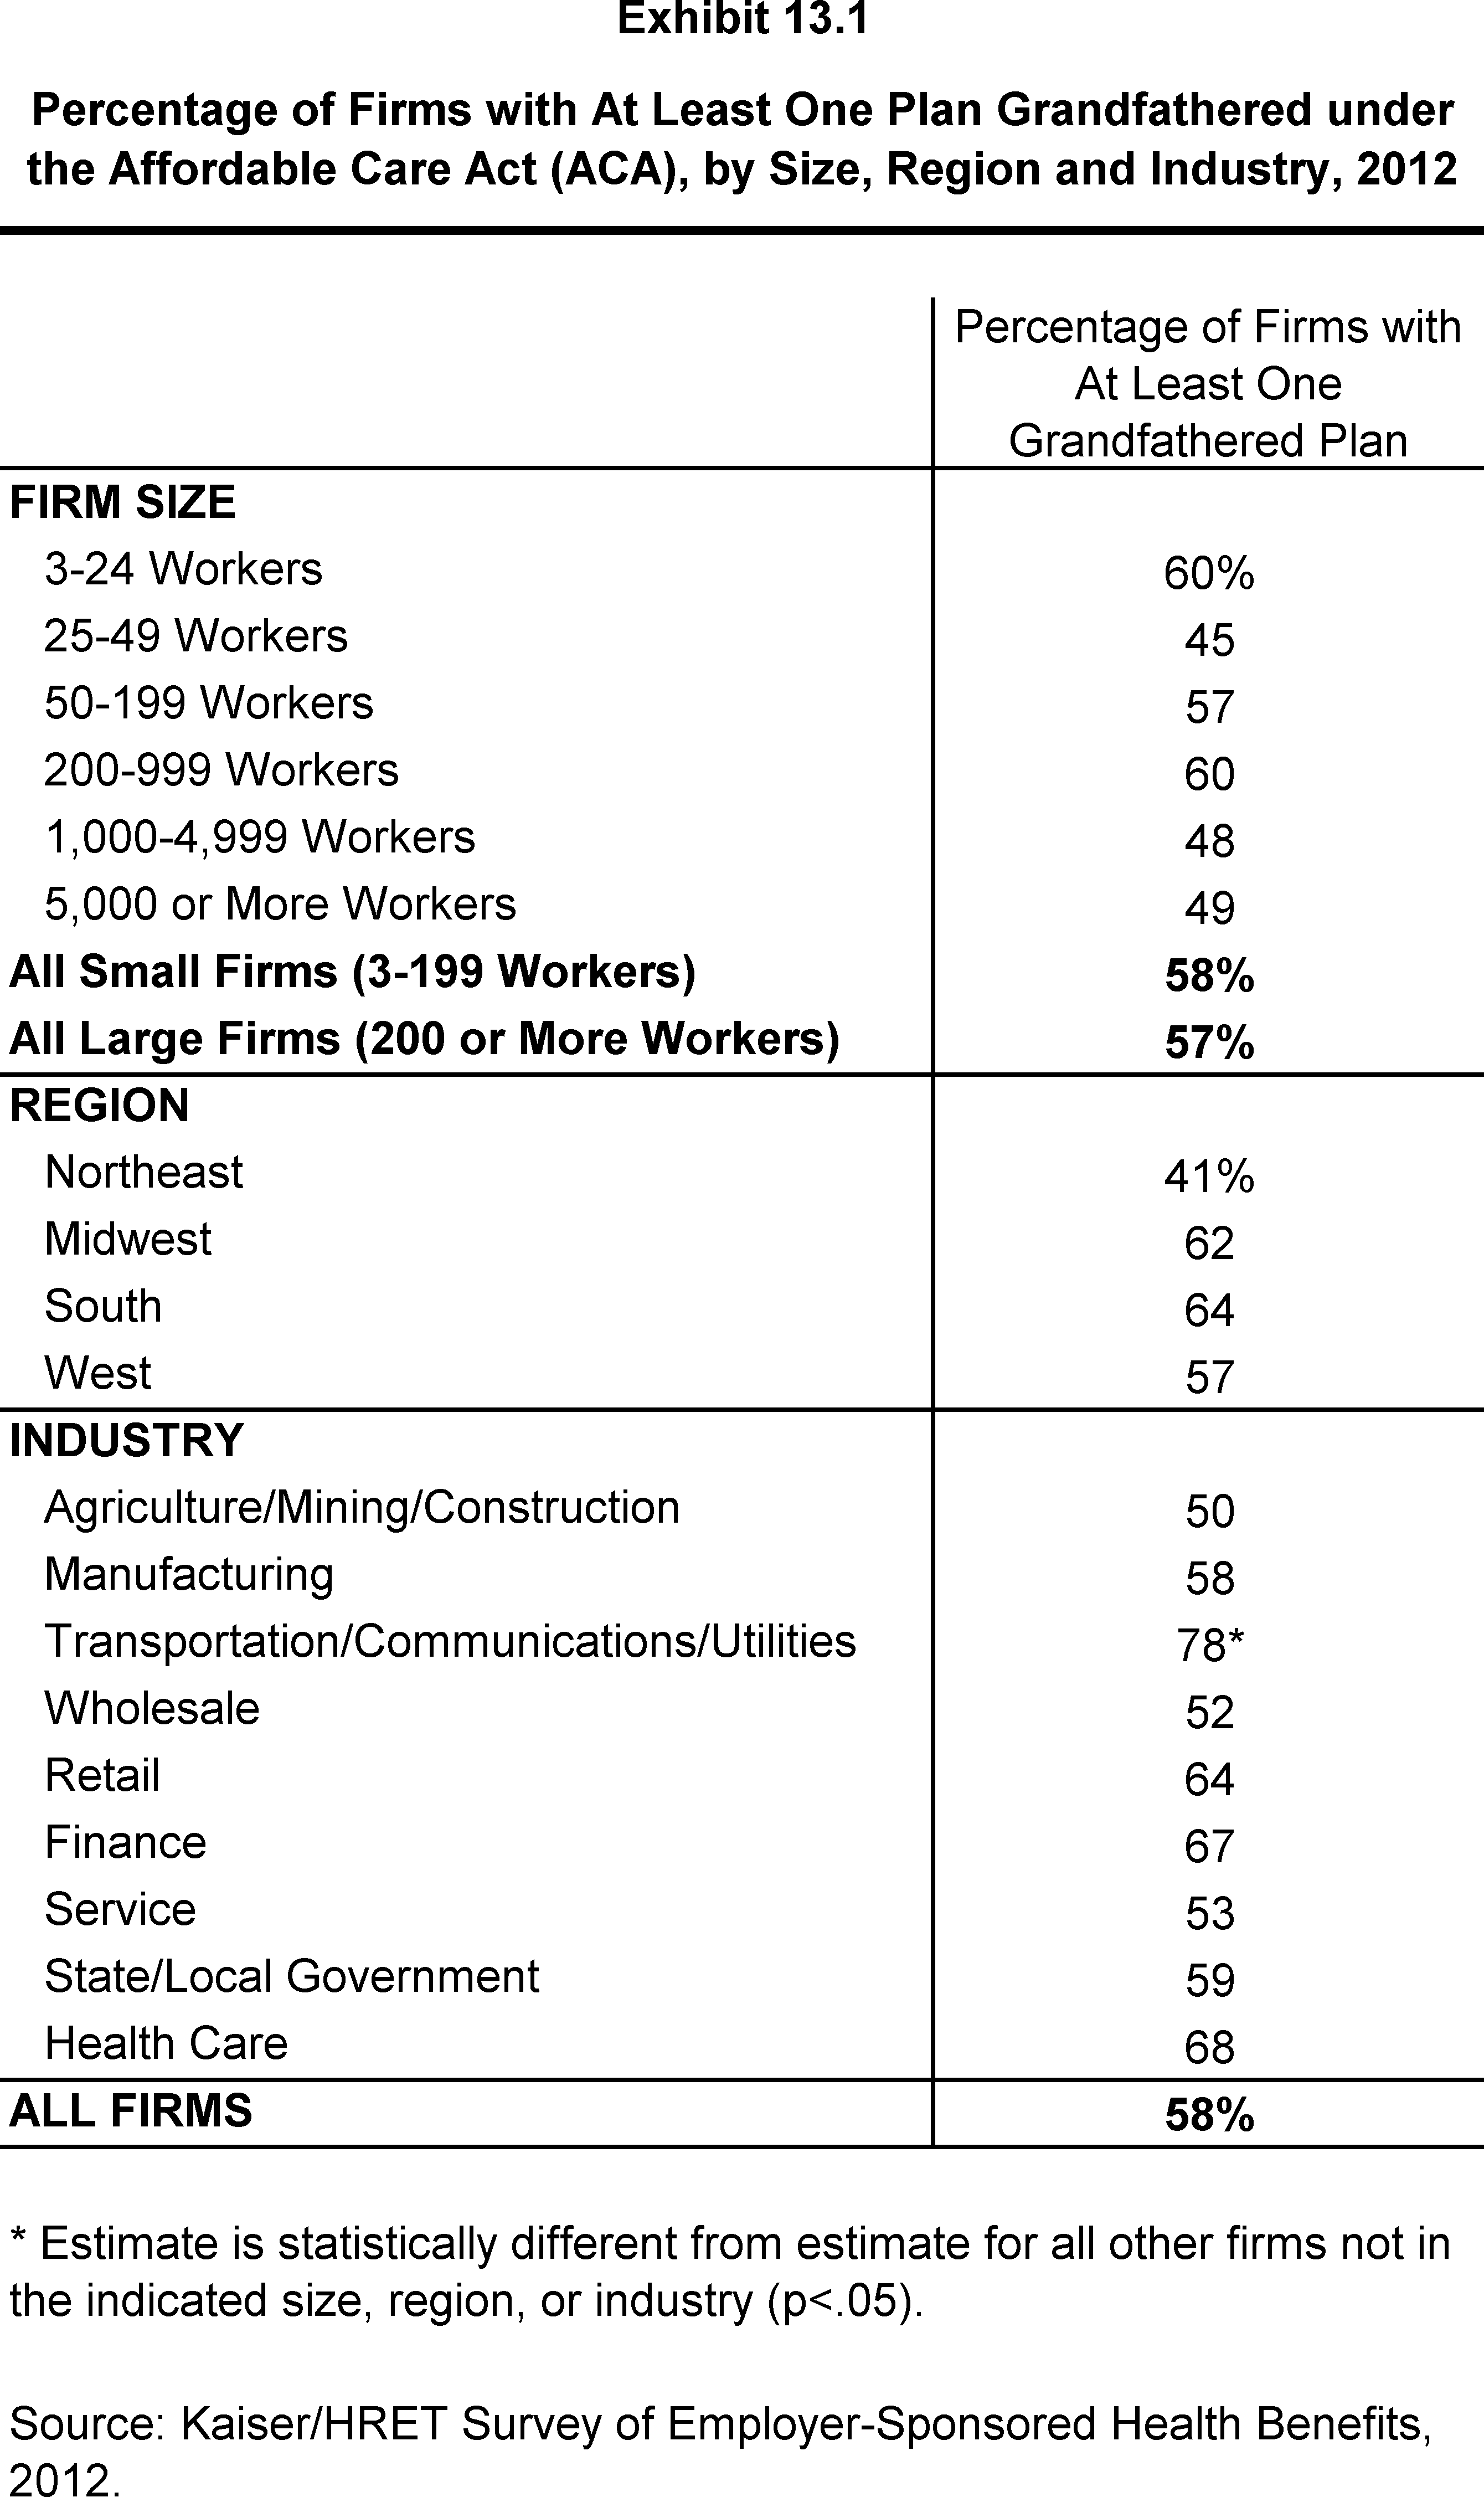
Percentage of Firms with At Least One Plan Grandfathered under the Affordable Care Act (ACA), by Size, Region and Industry, 2012
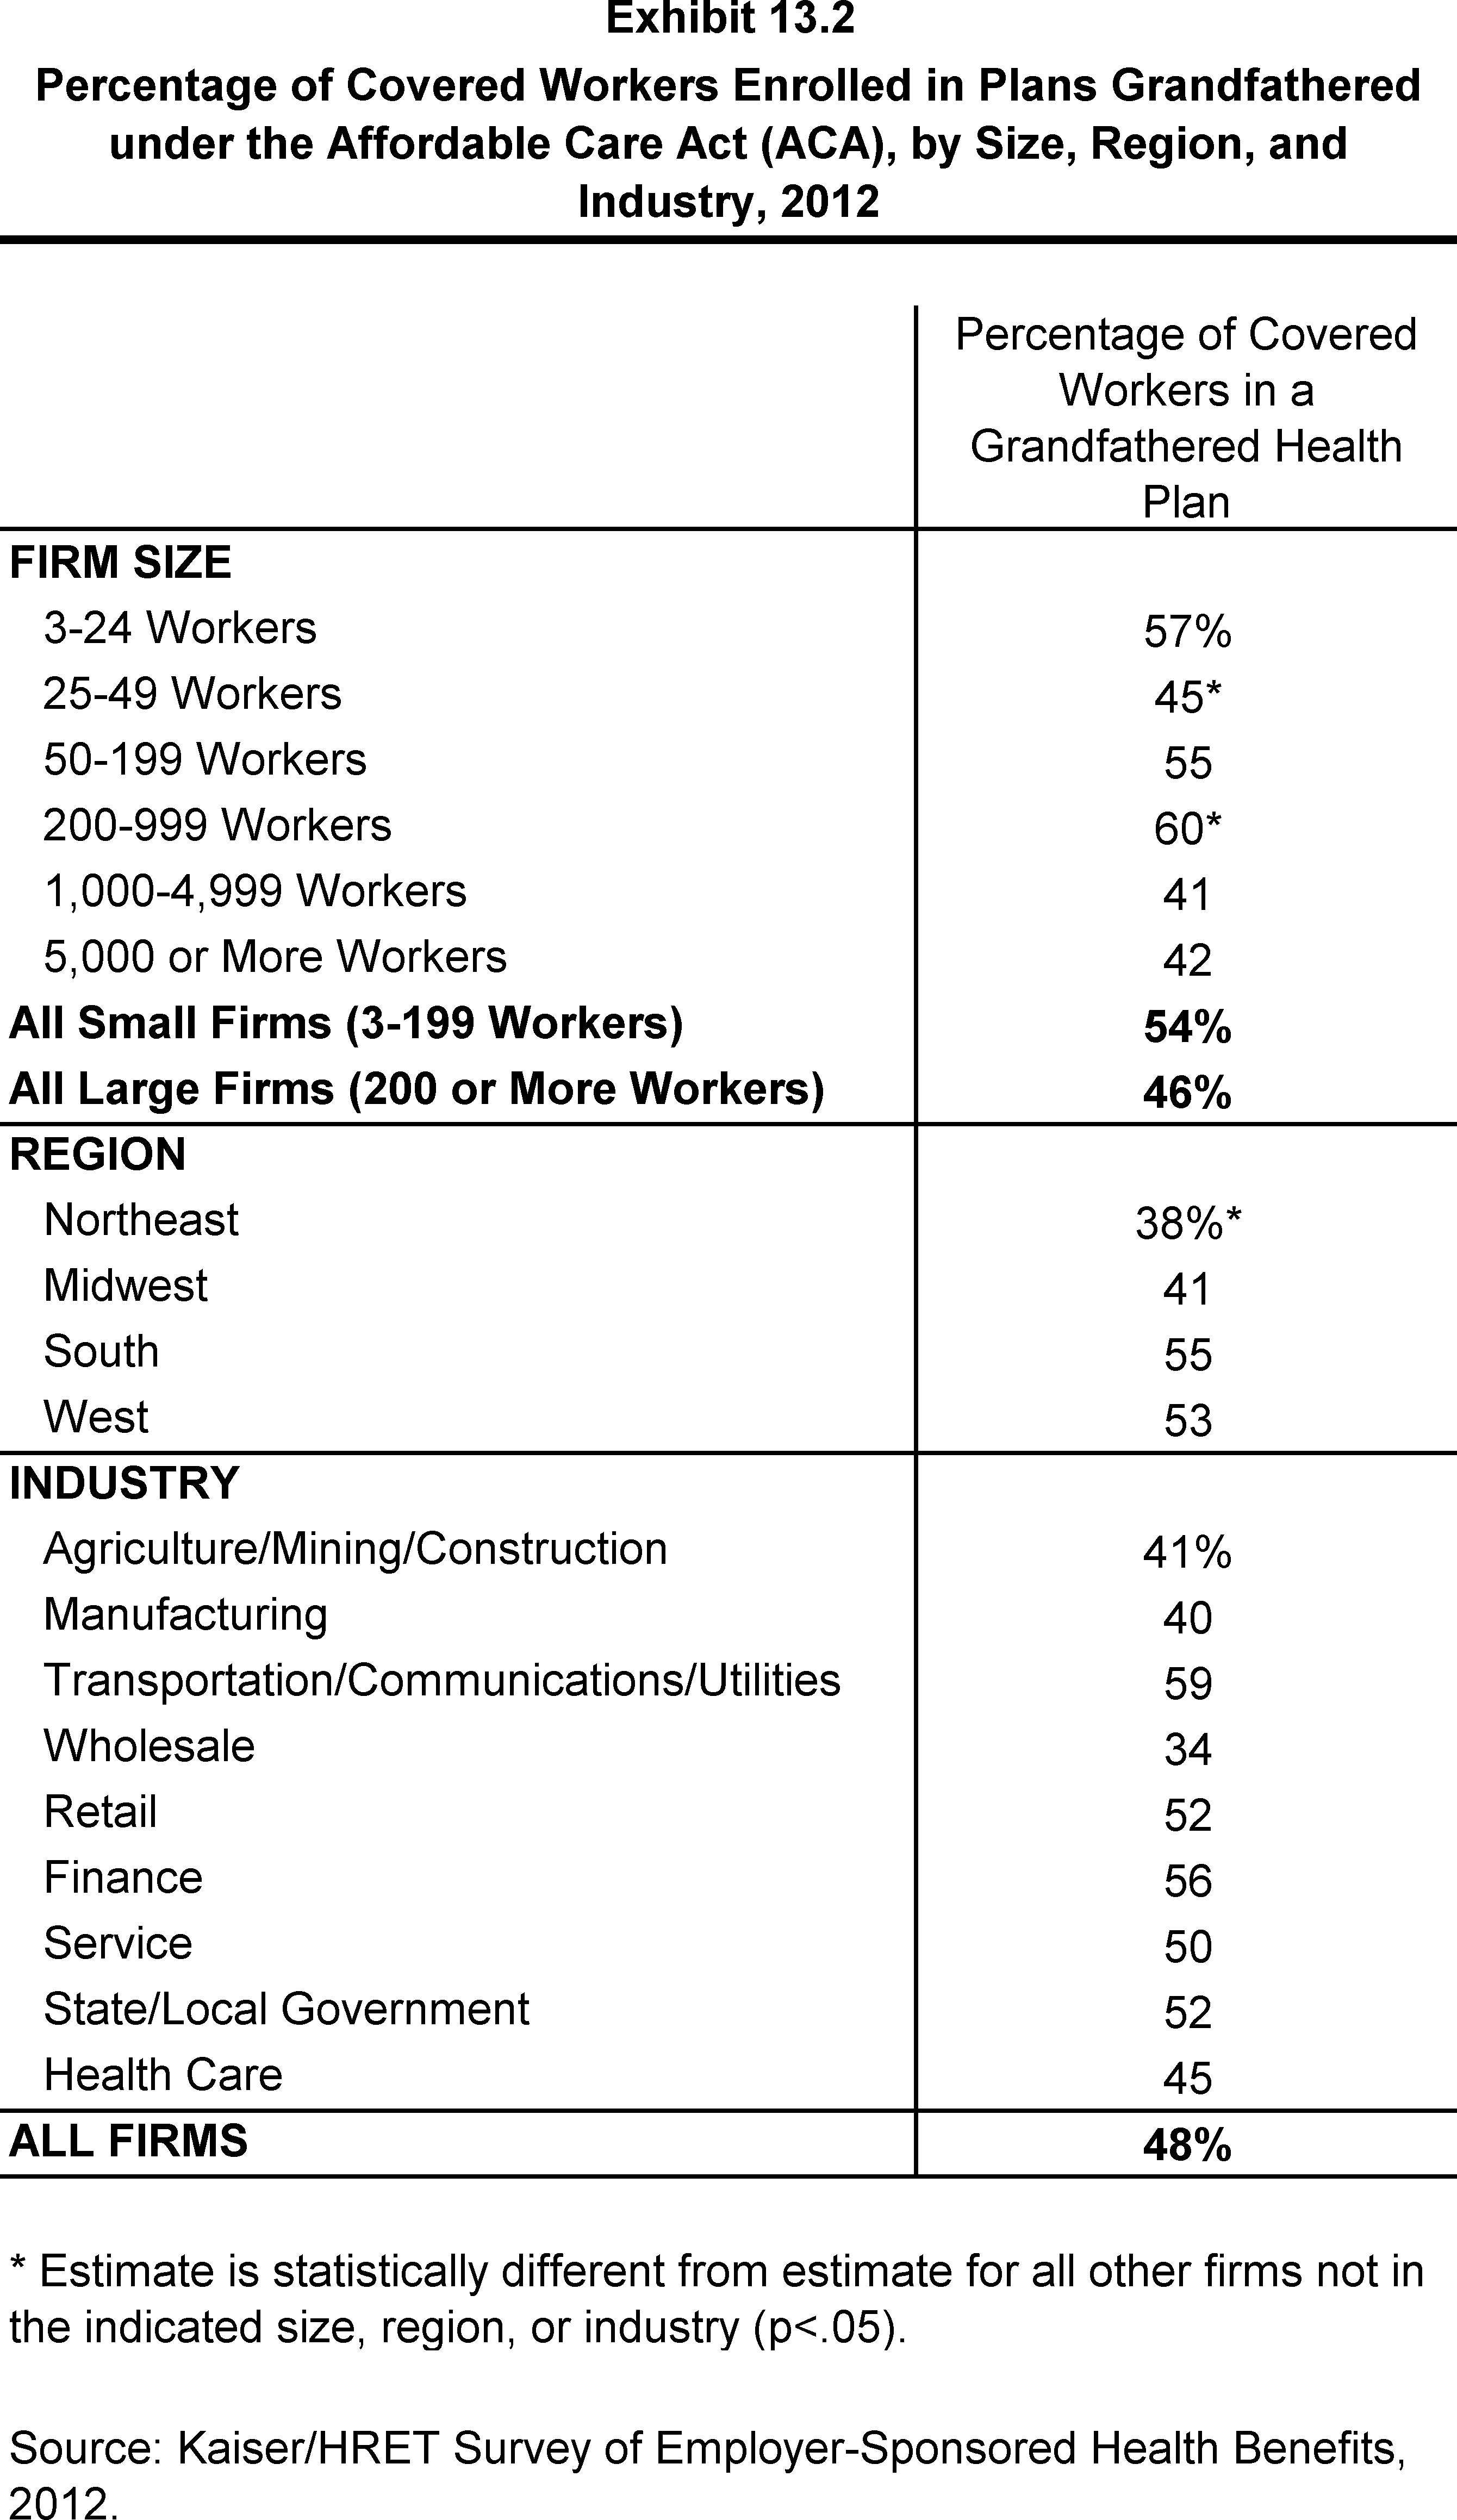
Percentage of Covered Workers Enrolled in Plans Grandfathered under the Affordable Care Act (ACA), by Size, Region, and Industry, 2012
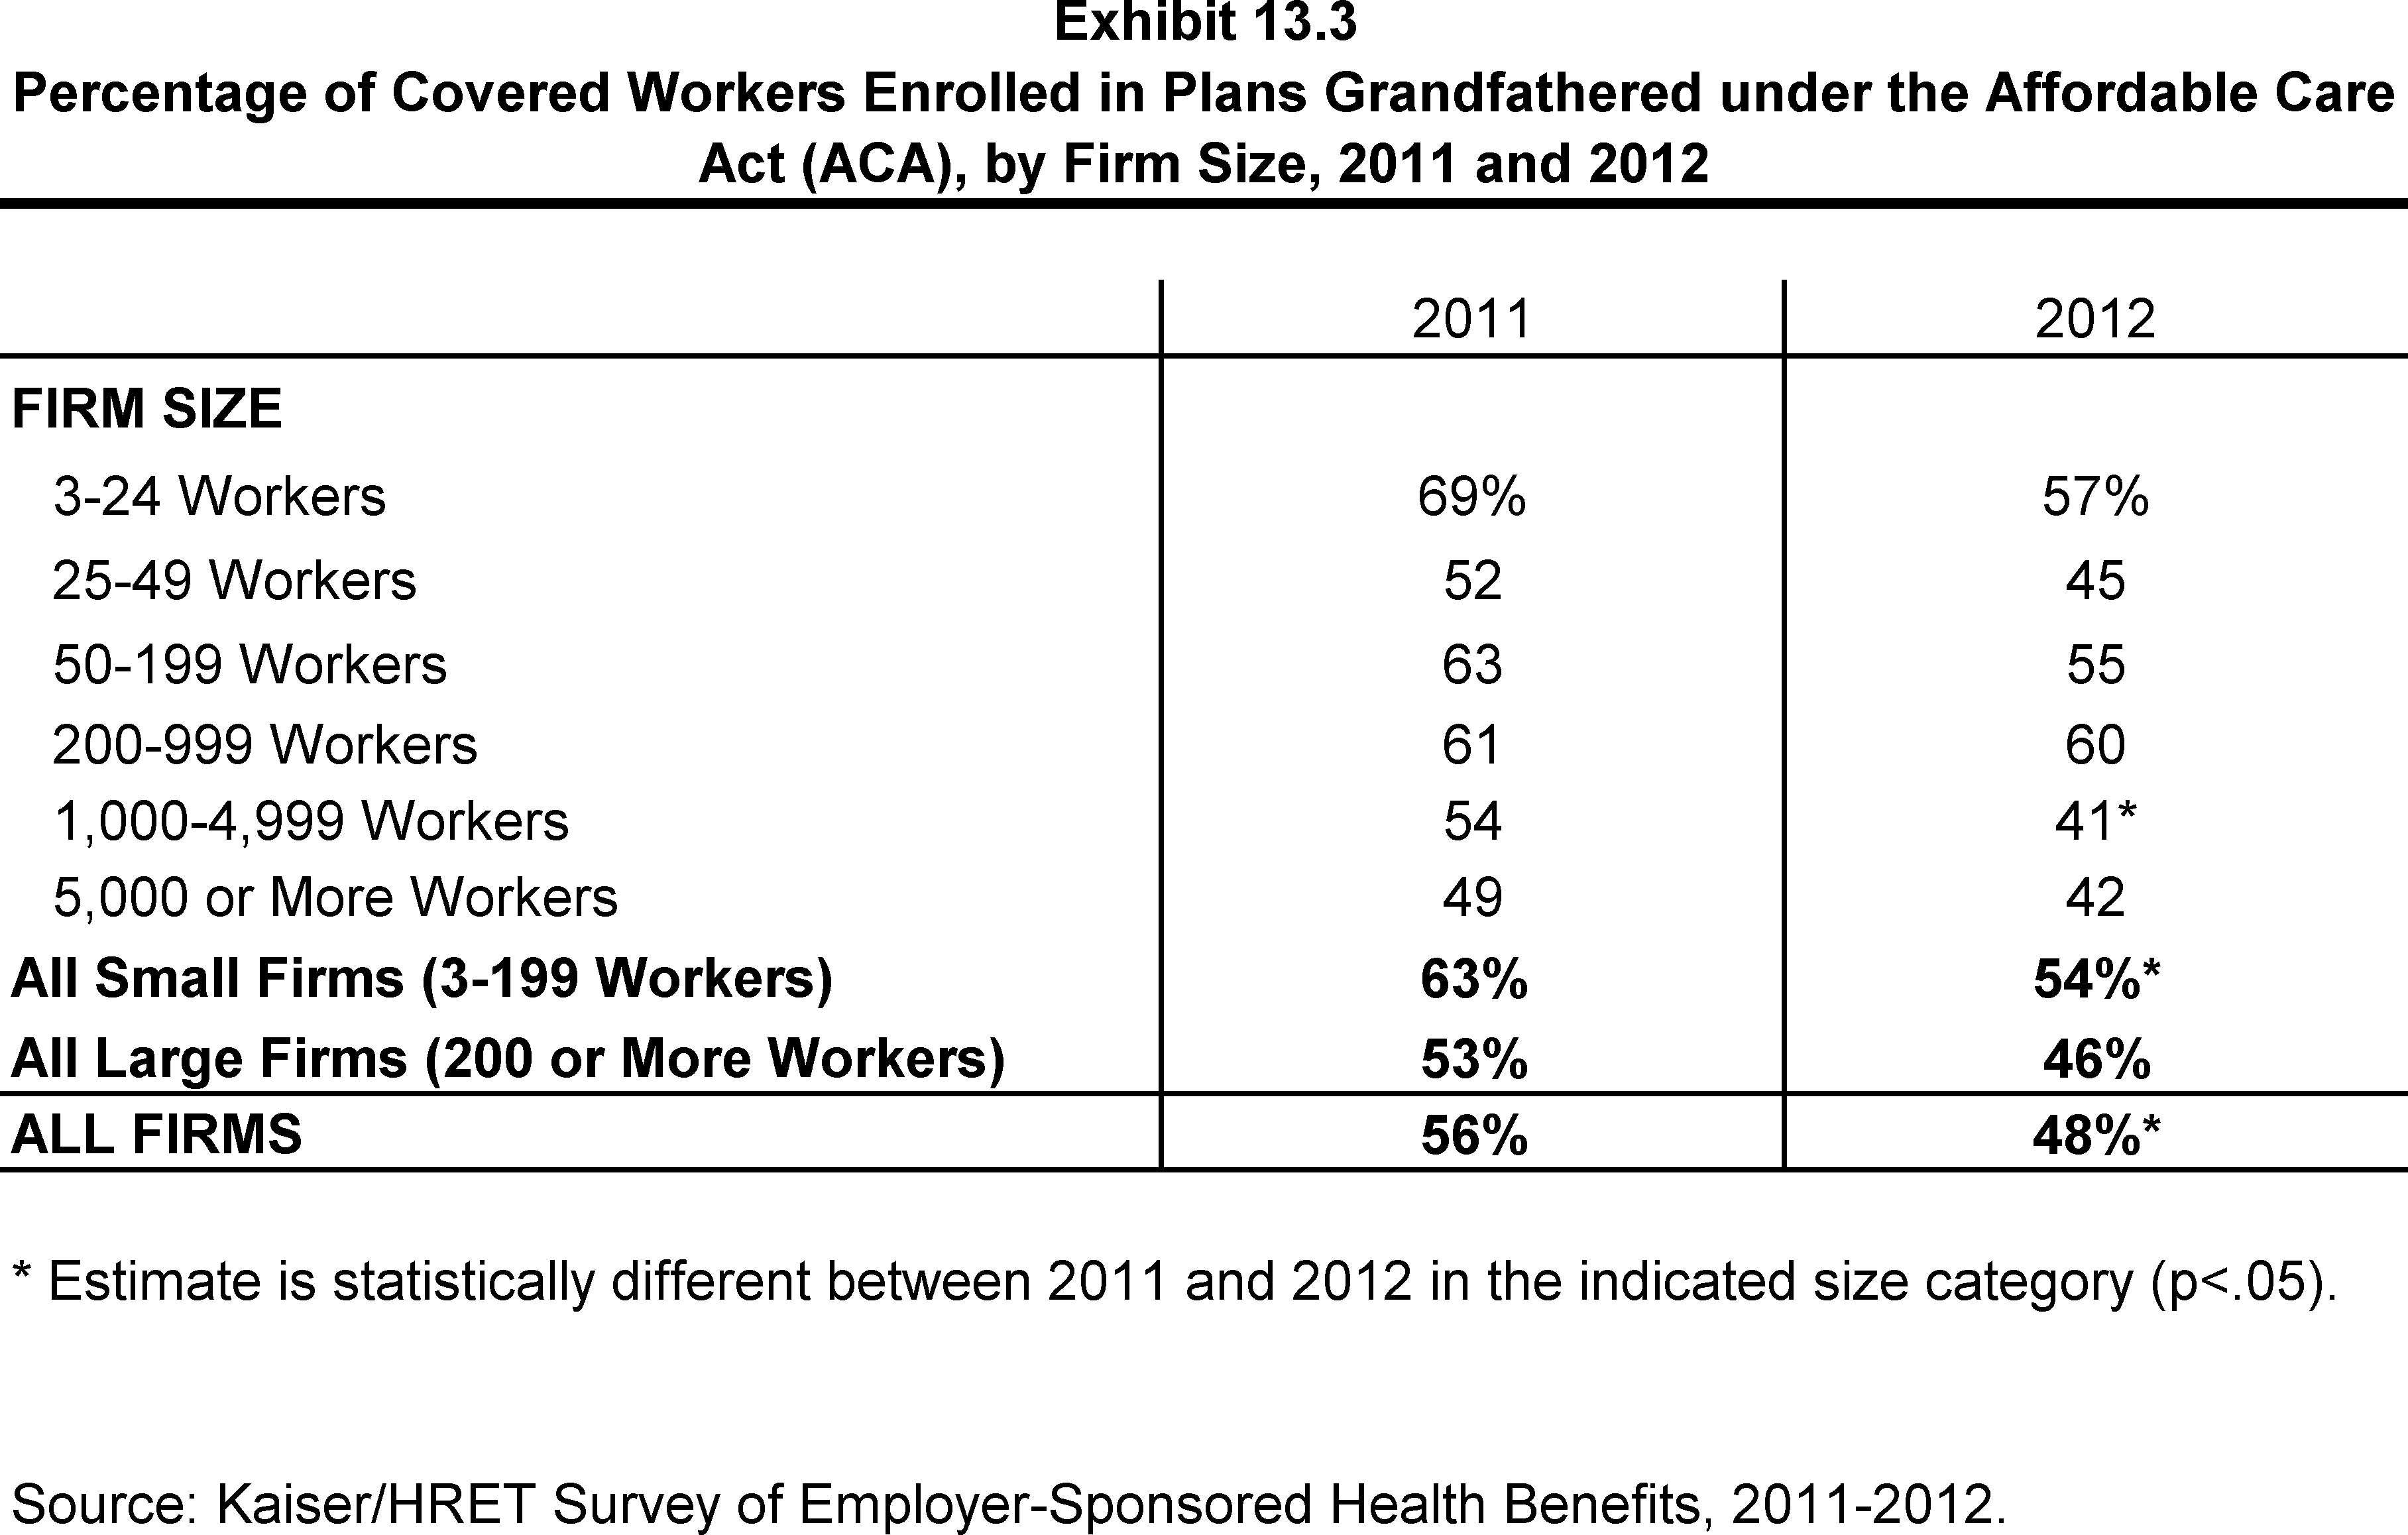
Percentage of Covered Workers Enrolled in Plans Grandfathered under the Affordable Care Act (ACA), by Firm Size, 2011 and 2012
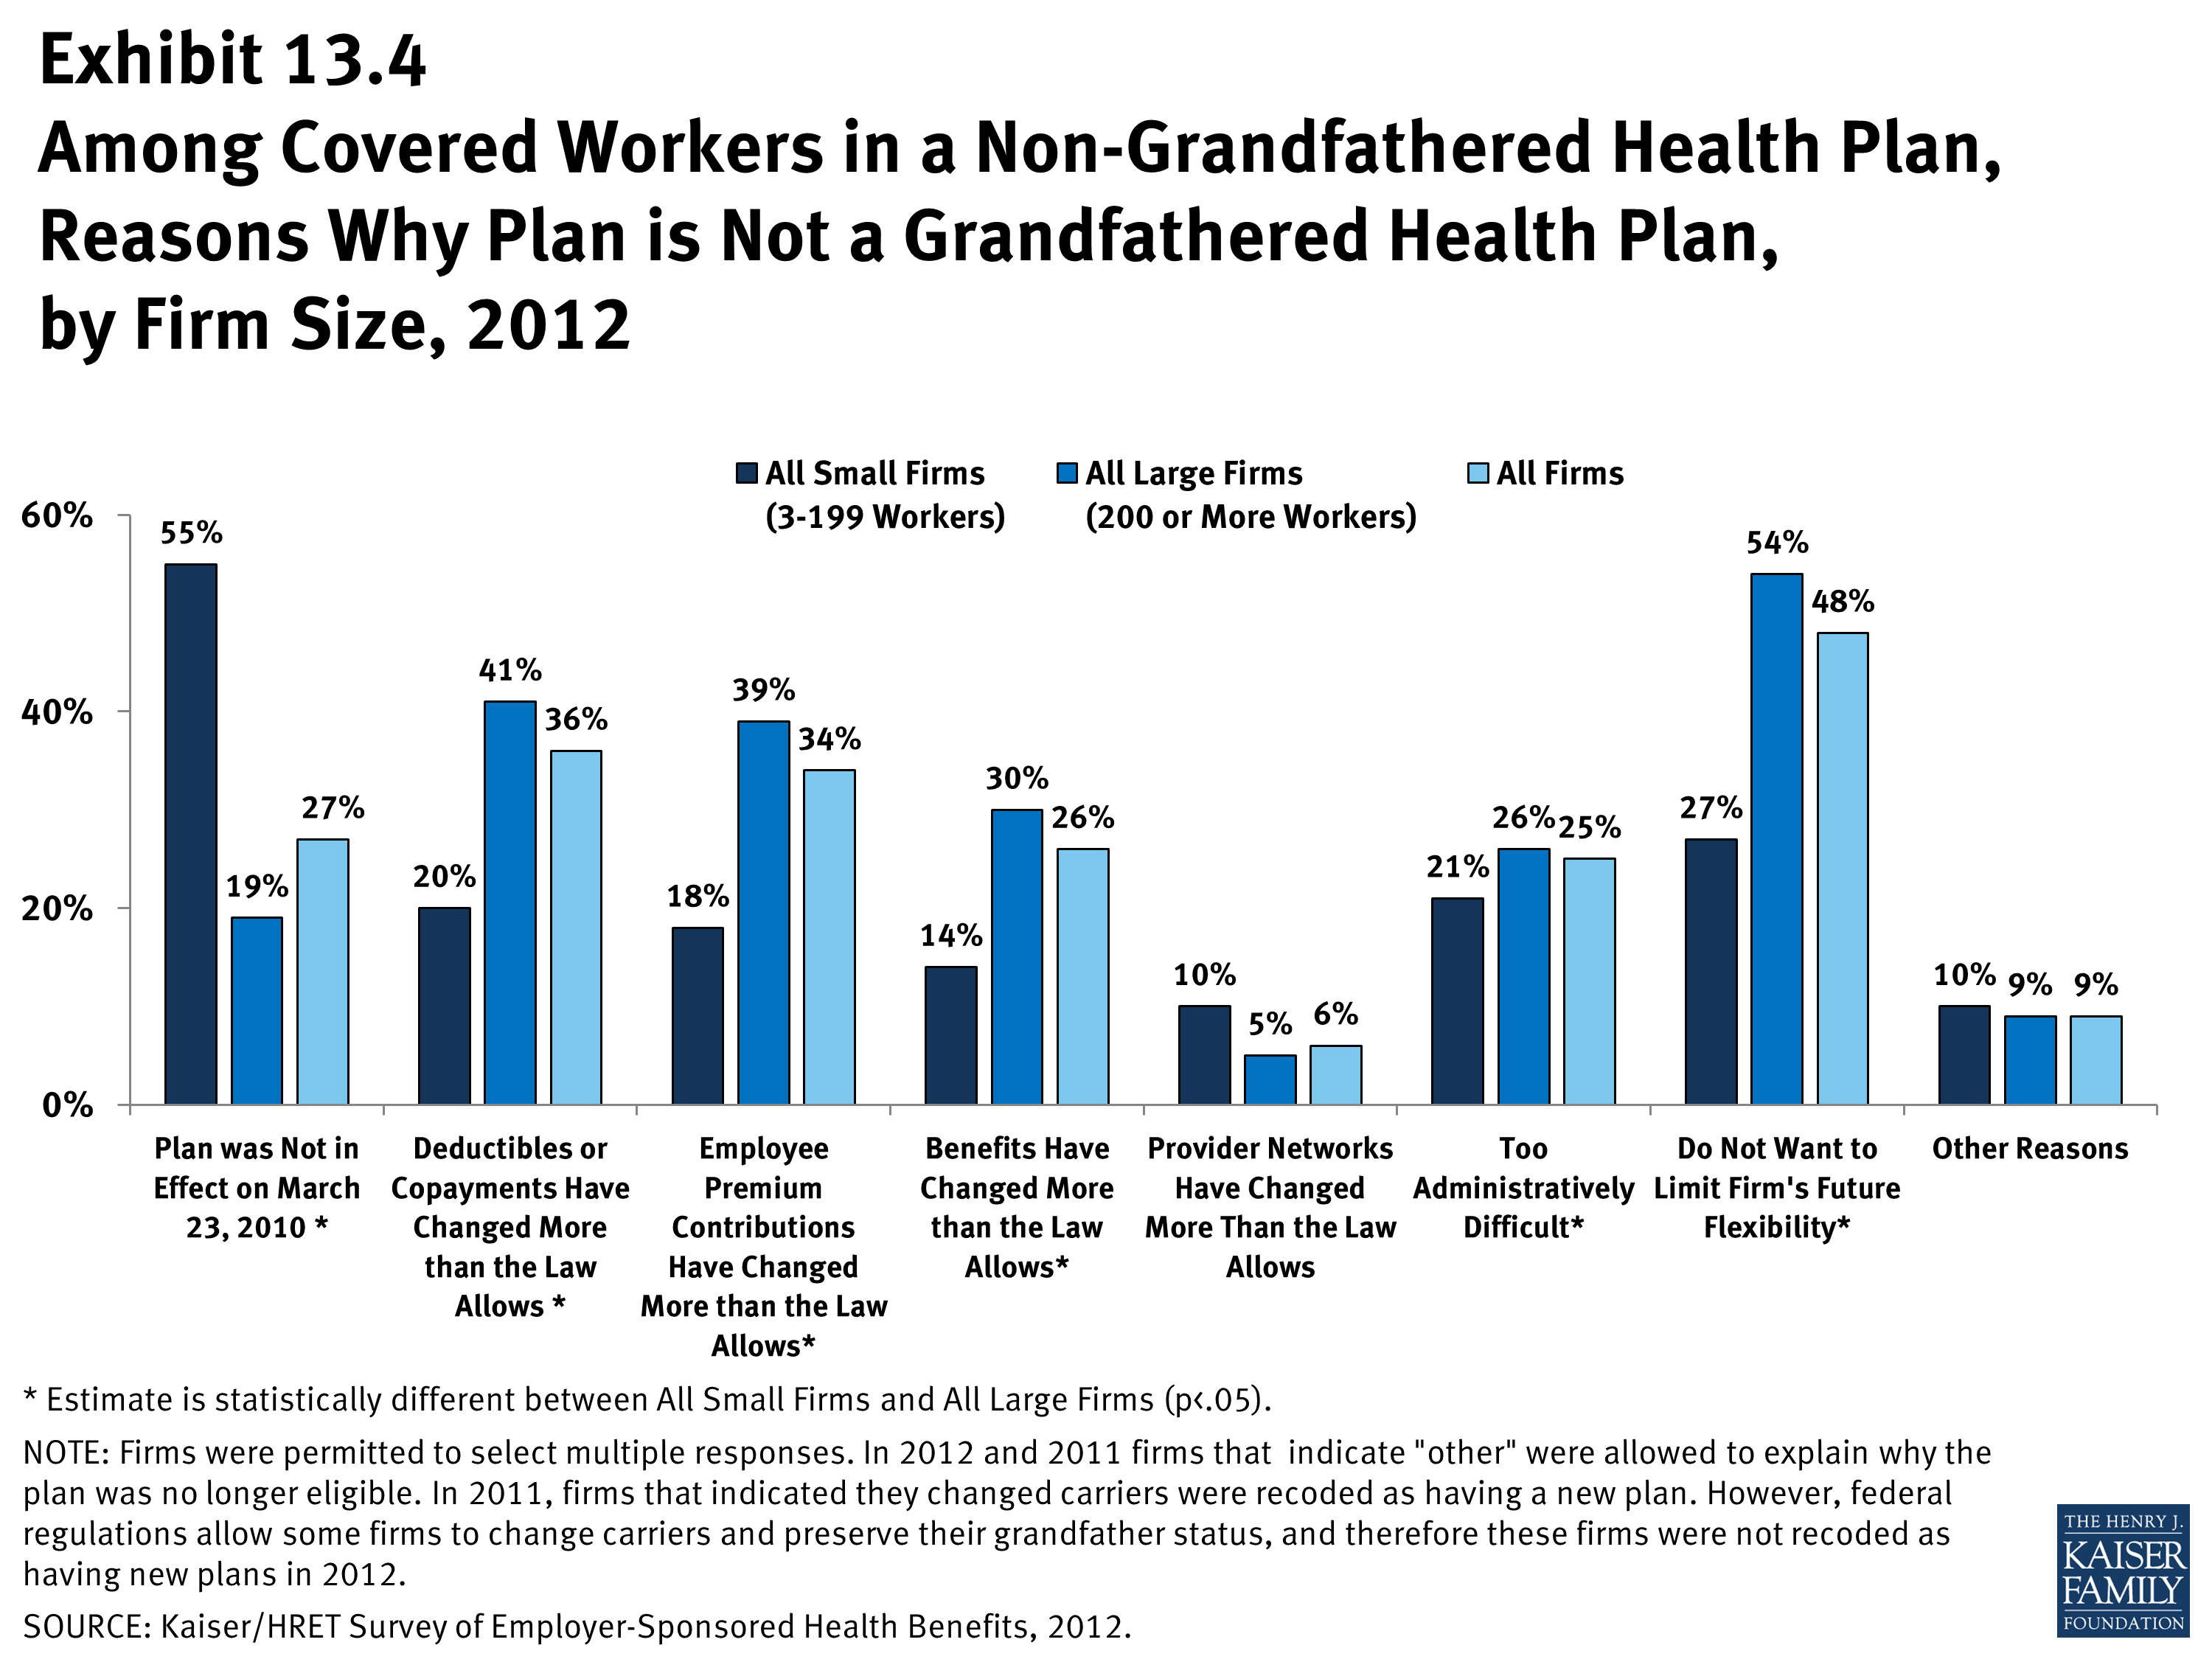
Among Covered Workers in a Non-Grandfathered Health Plan, Reasons Why Plan is Not a Grandfathered Health Plan, by Firm Size, 2012
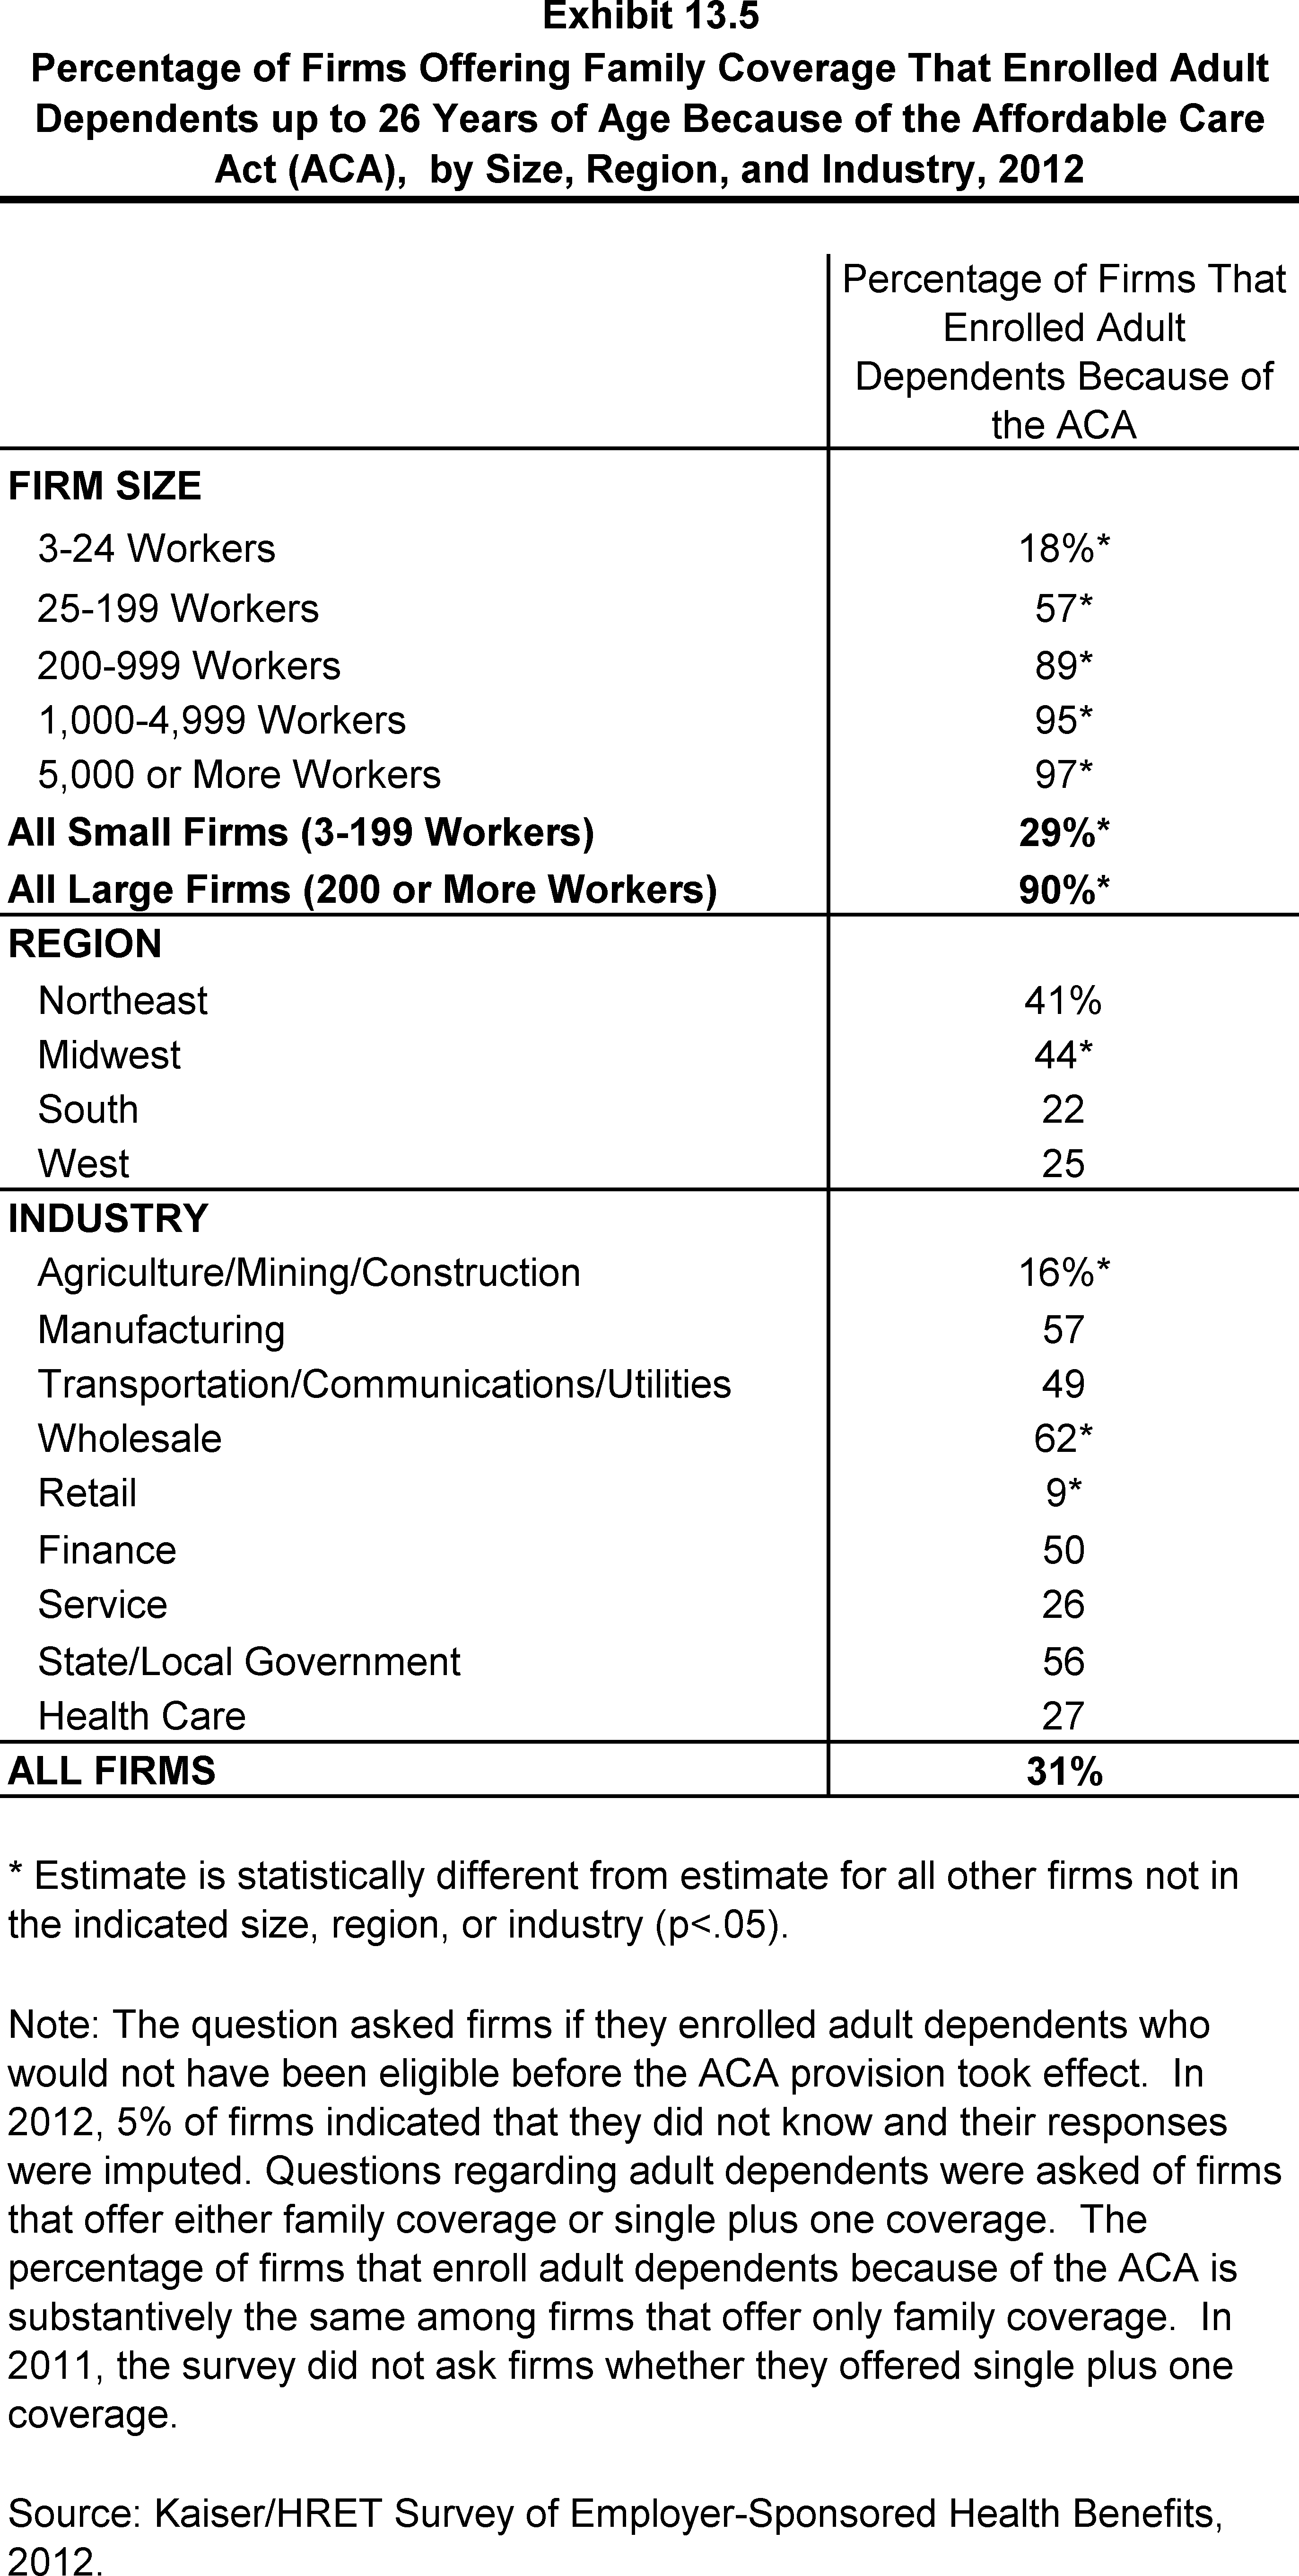
Percentage of Firms Offering Family Coverage That Enrolled Adult Dependents up to 26 Years of Age Because of the Affordable Care Act (ACA), by Size, Region, and Industry, 2012
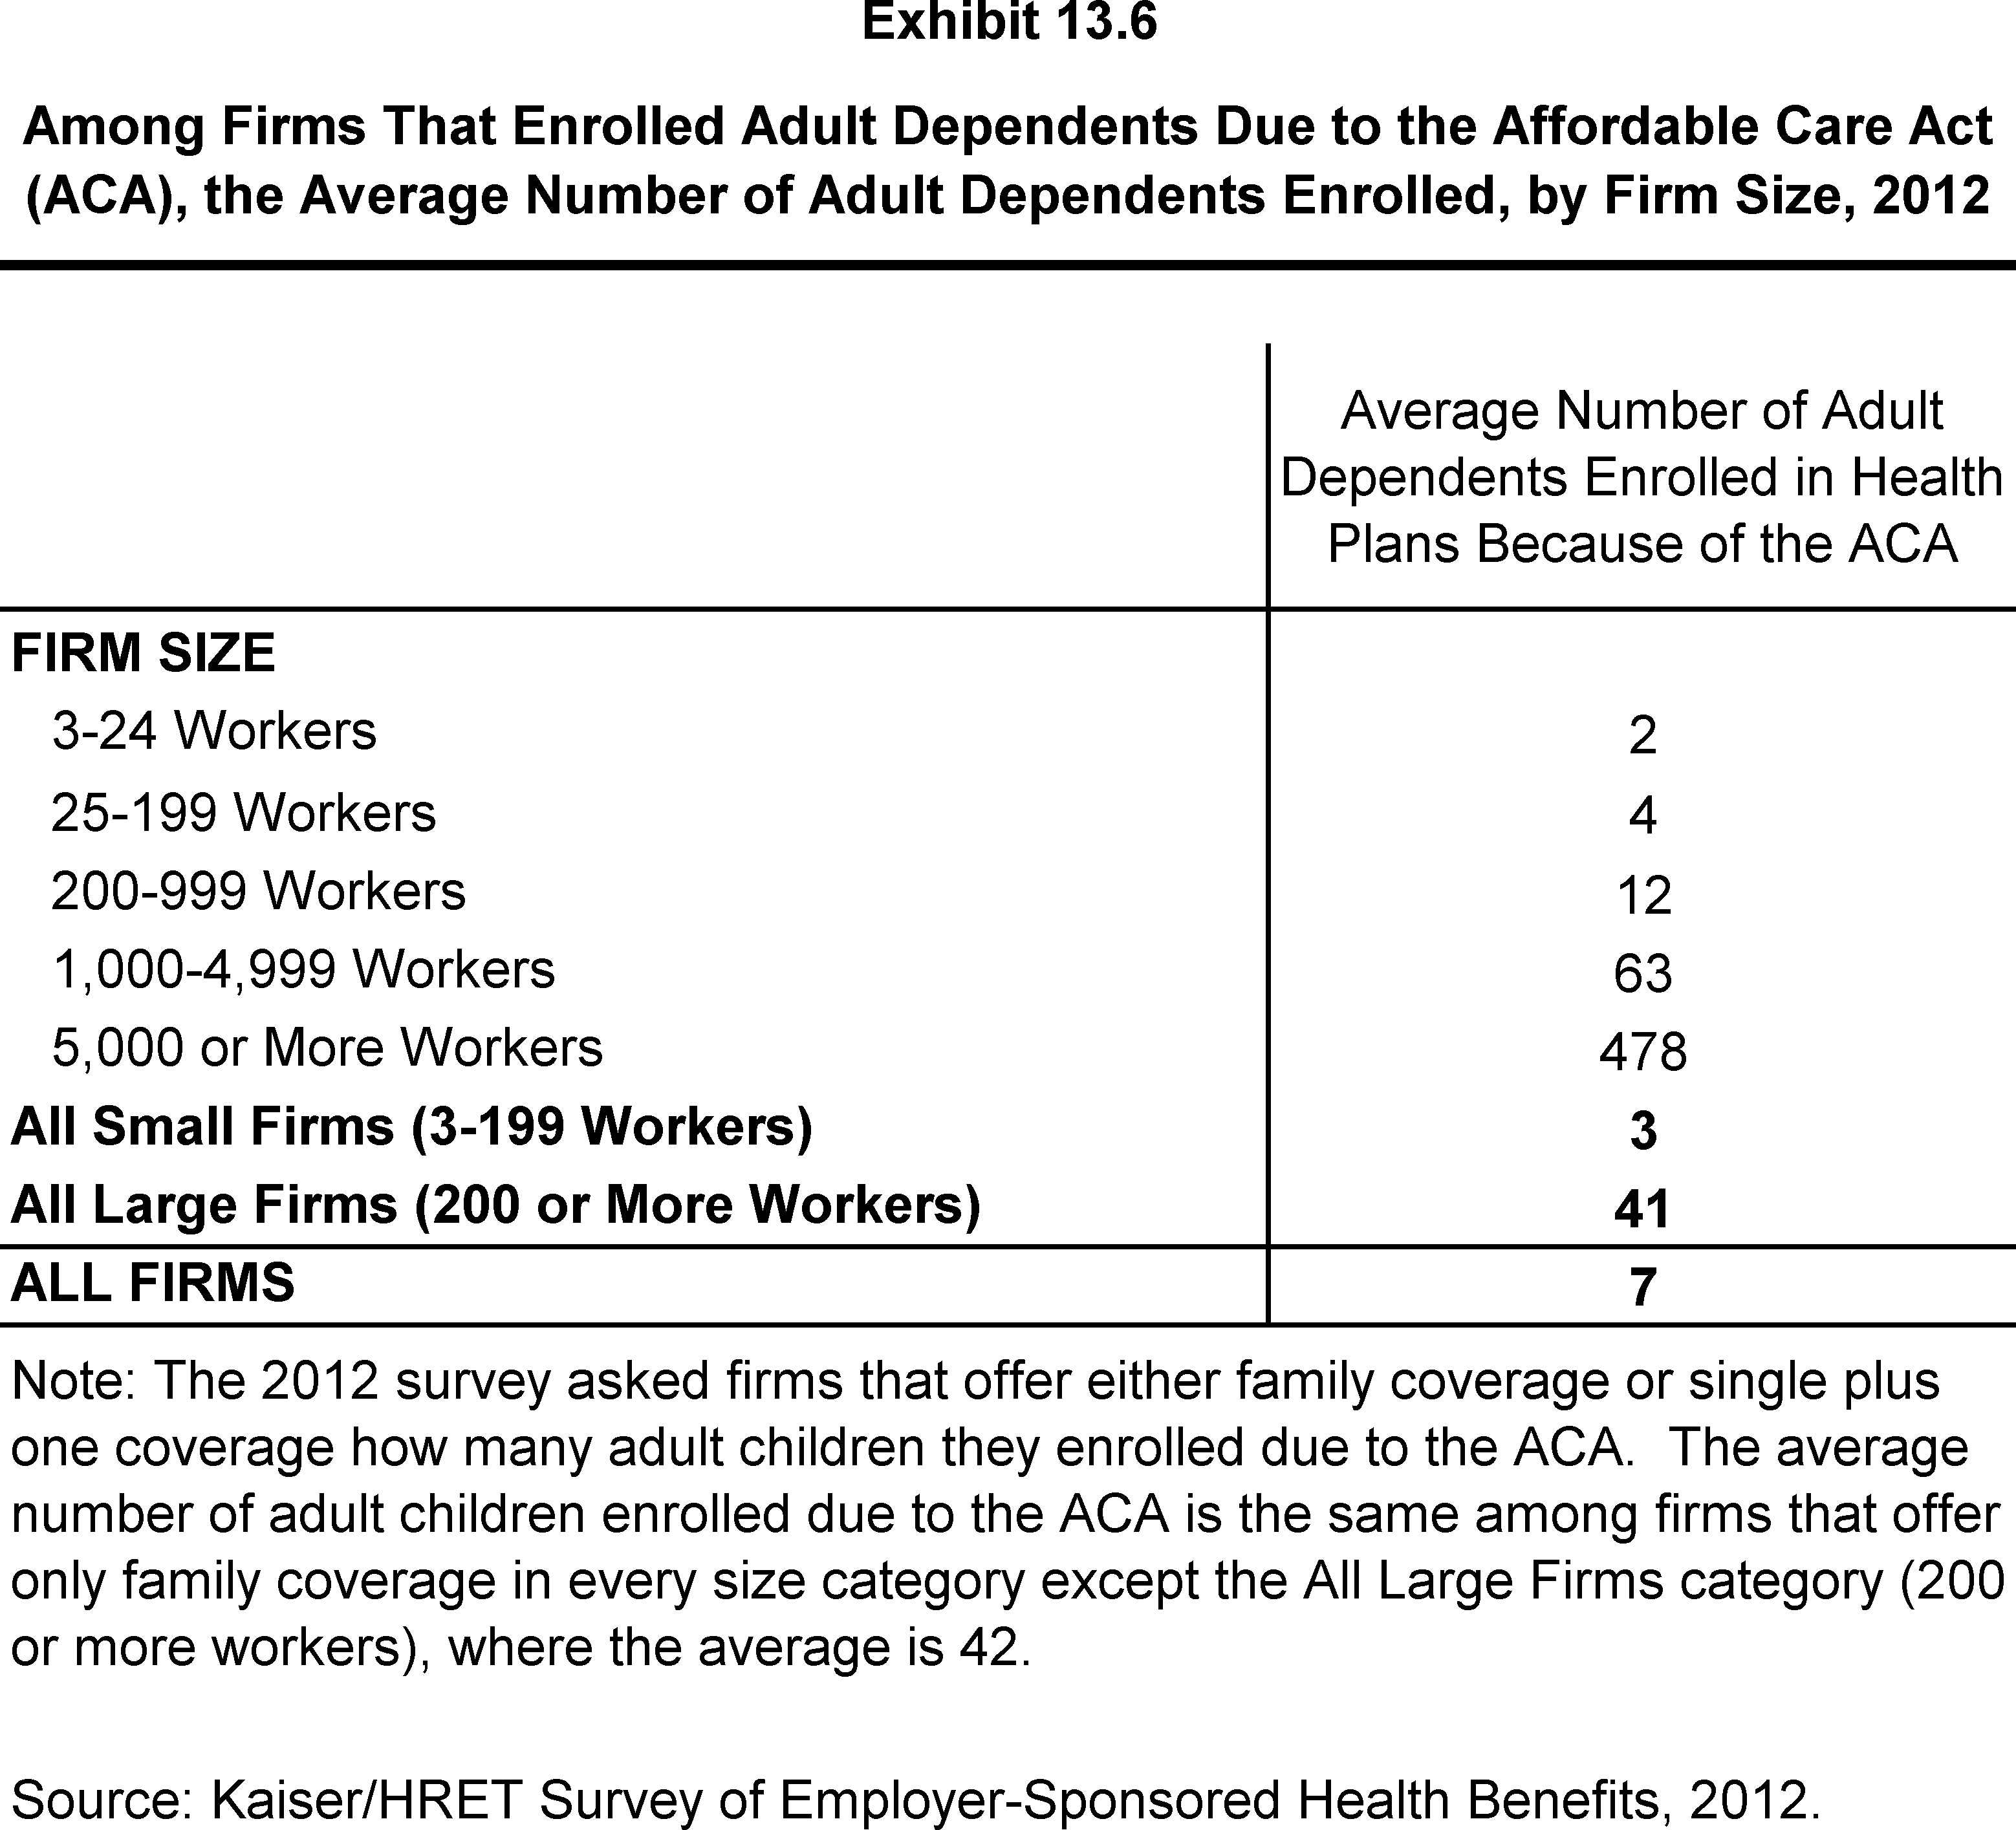
Among Firms That Enrolled Adult Dependents Due to the Affordable Care Act (ACA), the Average Number of Adult Dependents Enrolled, by Firm Size, 2012
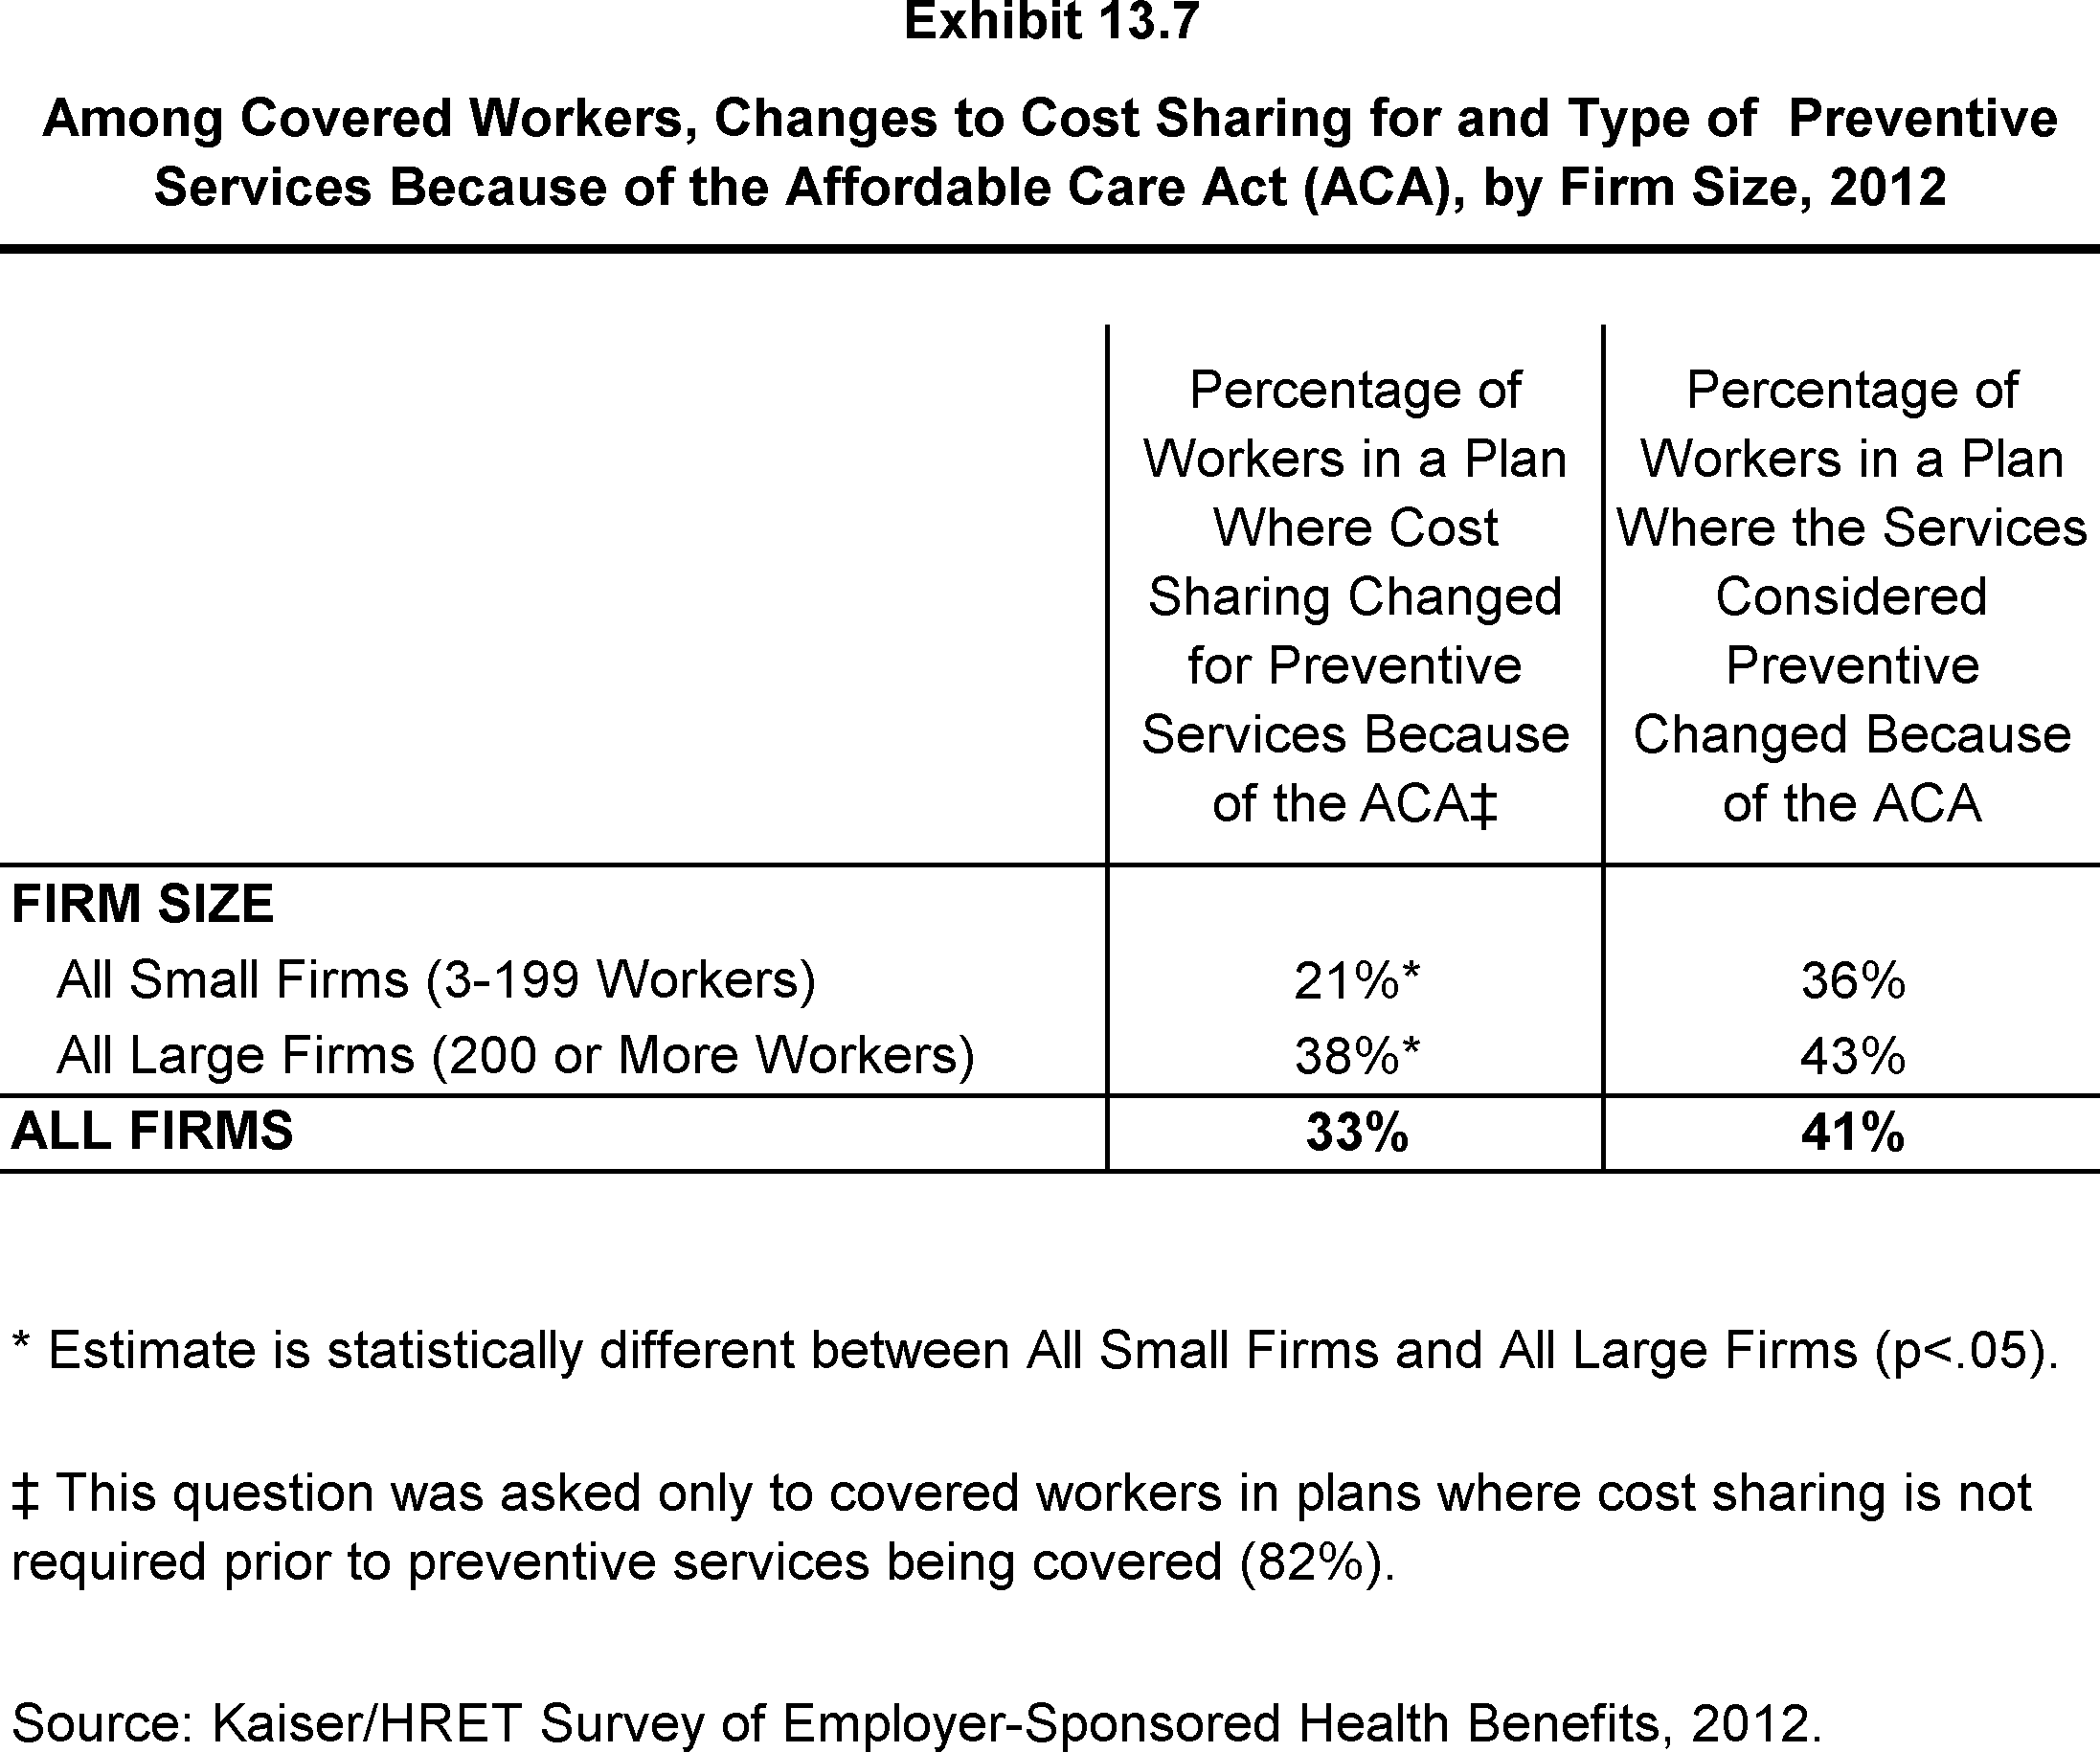
Among Covered Workers, Changes to Cost Sharing for and Type of Preventive Services Because of the Affordable Care Act (ACA), by Firm Size, 2012
Section 14: Employer Opinions and Health Plan Practices
Employers play a significant role in health insurance coverage – so their opinions and experiences are important factors in health policy discussions. Employers were asked how they view different approaches to containing cost increases, the prevalence of Flexible Spending Accounts (FSA) and Section 125 plans, and whether they shopped for a new insurance carrier recently.
Employer Opinions on Cost Containment
Firms offering health benefits were asked to rate how effective several different strategies, such as tighter managed care restrictions, higher employee cost sharing, or disease management programs, would be in reducing the growth of health insurance costs. Relatively few firms rate any of the suggested strategies as “very effective” at controlling costs (between 15% and 25%, depending on the strategy). Roughly one third of firms (between 28% and 37%) report that each of the approaches we asked about would be “somewhat effective” at controlling cost growth (Exhibit 14.1).
Shopping for Health Coverage
More than one-half (54%) of firms offering health benefits reported shopping for a new health plan or a new insurance carrier in the past year, suggesting that the market is quite dynamic (Exhibit 14.4). Among firms that shopped, 18% changed insurance carriers and 27% reported changing the type of health plan provided to employees. There were no significant differences between small firms (3 to 199 workers) and larger firms on any of these measures (Exhibit 14.5).
Pre-Tax Premium Contributions
Forty-one percent of small firms (3 to 199 workers) and 91% of larger firms have a plan under section 125 of the Internal Revenue Service Code (sometimes called a premium-only plan) to allow employees to use pre-tax dollars to pay for their share of health insurance premiums (Exhibit 14.2).
Flexible Spending Accounts
Seventeen percent of small firms (3 to 199 workers) and 76% of larger firms offer employees the option of contributing to a flexible spending account (or FSA). FSAs permit employees to make pre-tax contributions that may be used during the year to pay for eligible medical expenses (Exhibit 14.2).
Workplace Health Clinics
Twenty-two percent of firms with 1,000 or more employees have an on-site health clinic at least one of their major locations to treat employees for work-related or non-work-related conditions. Among firms with health clinics, about 3 in 4 (76%) provide treatment for non-work-related medical conditions (Exhibit 14.6).
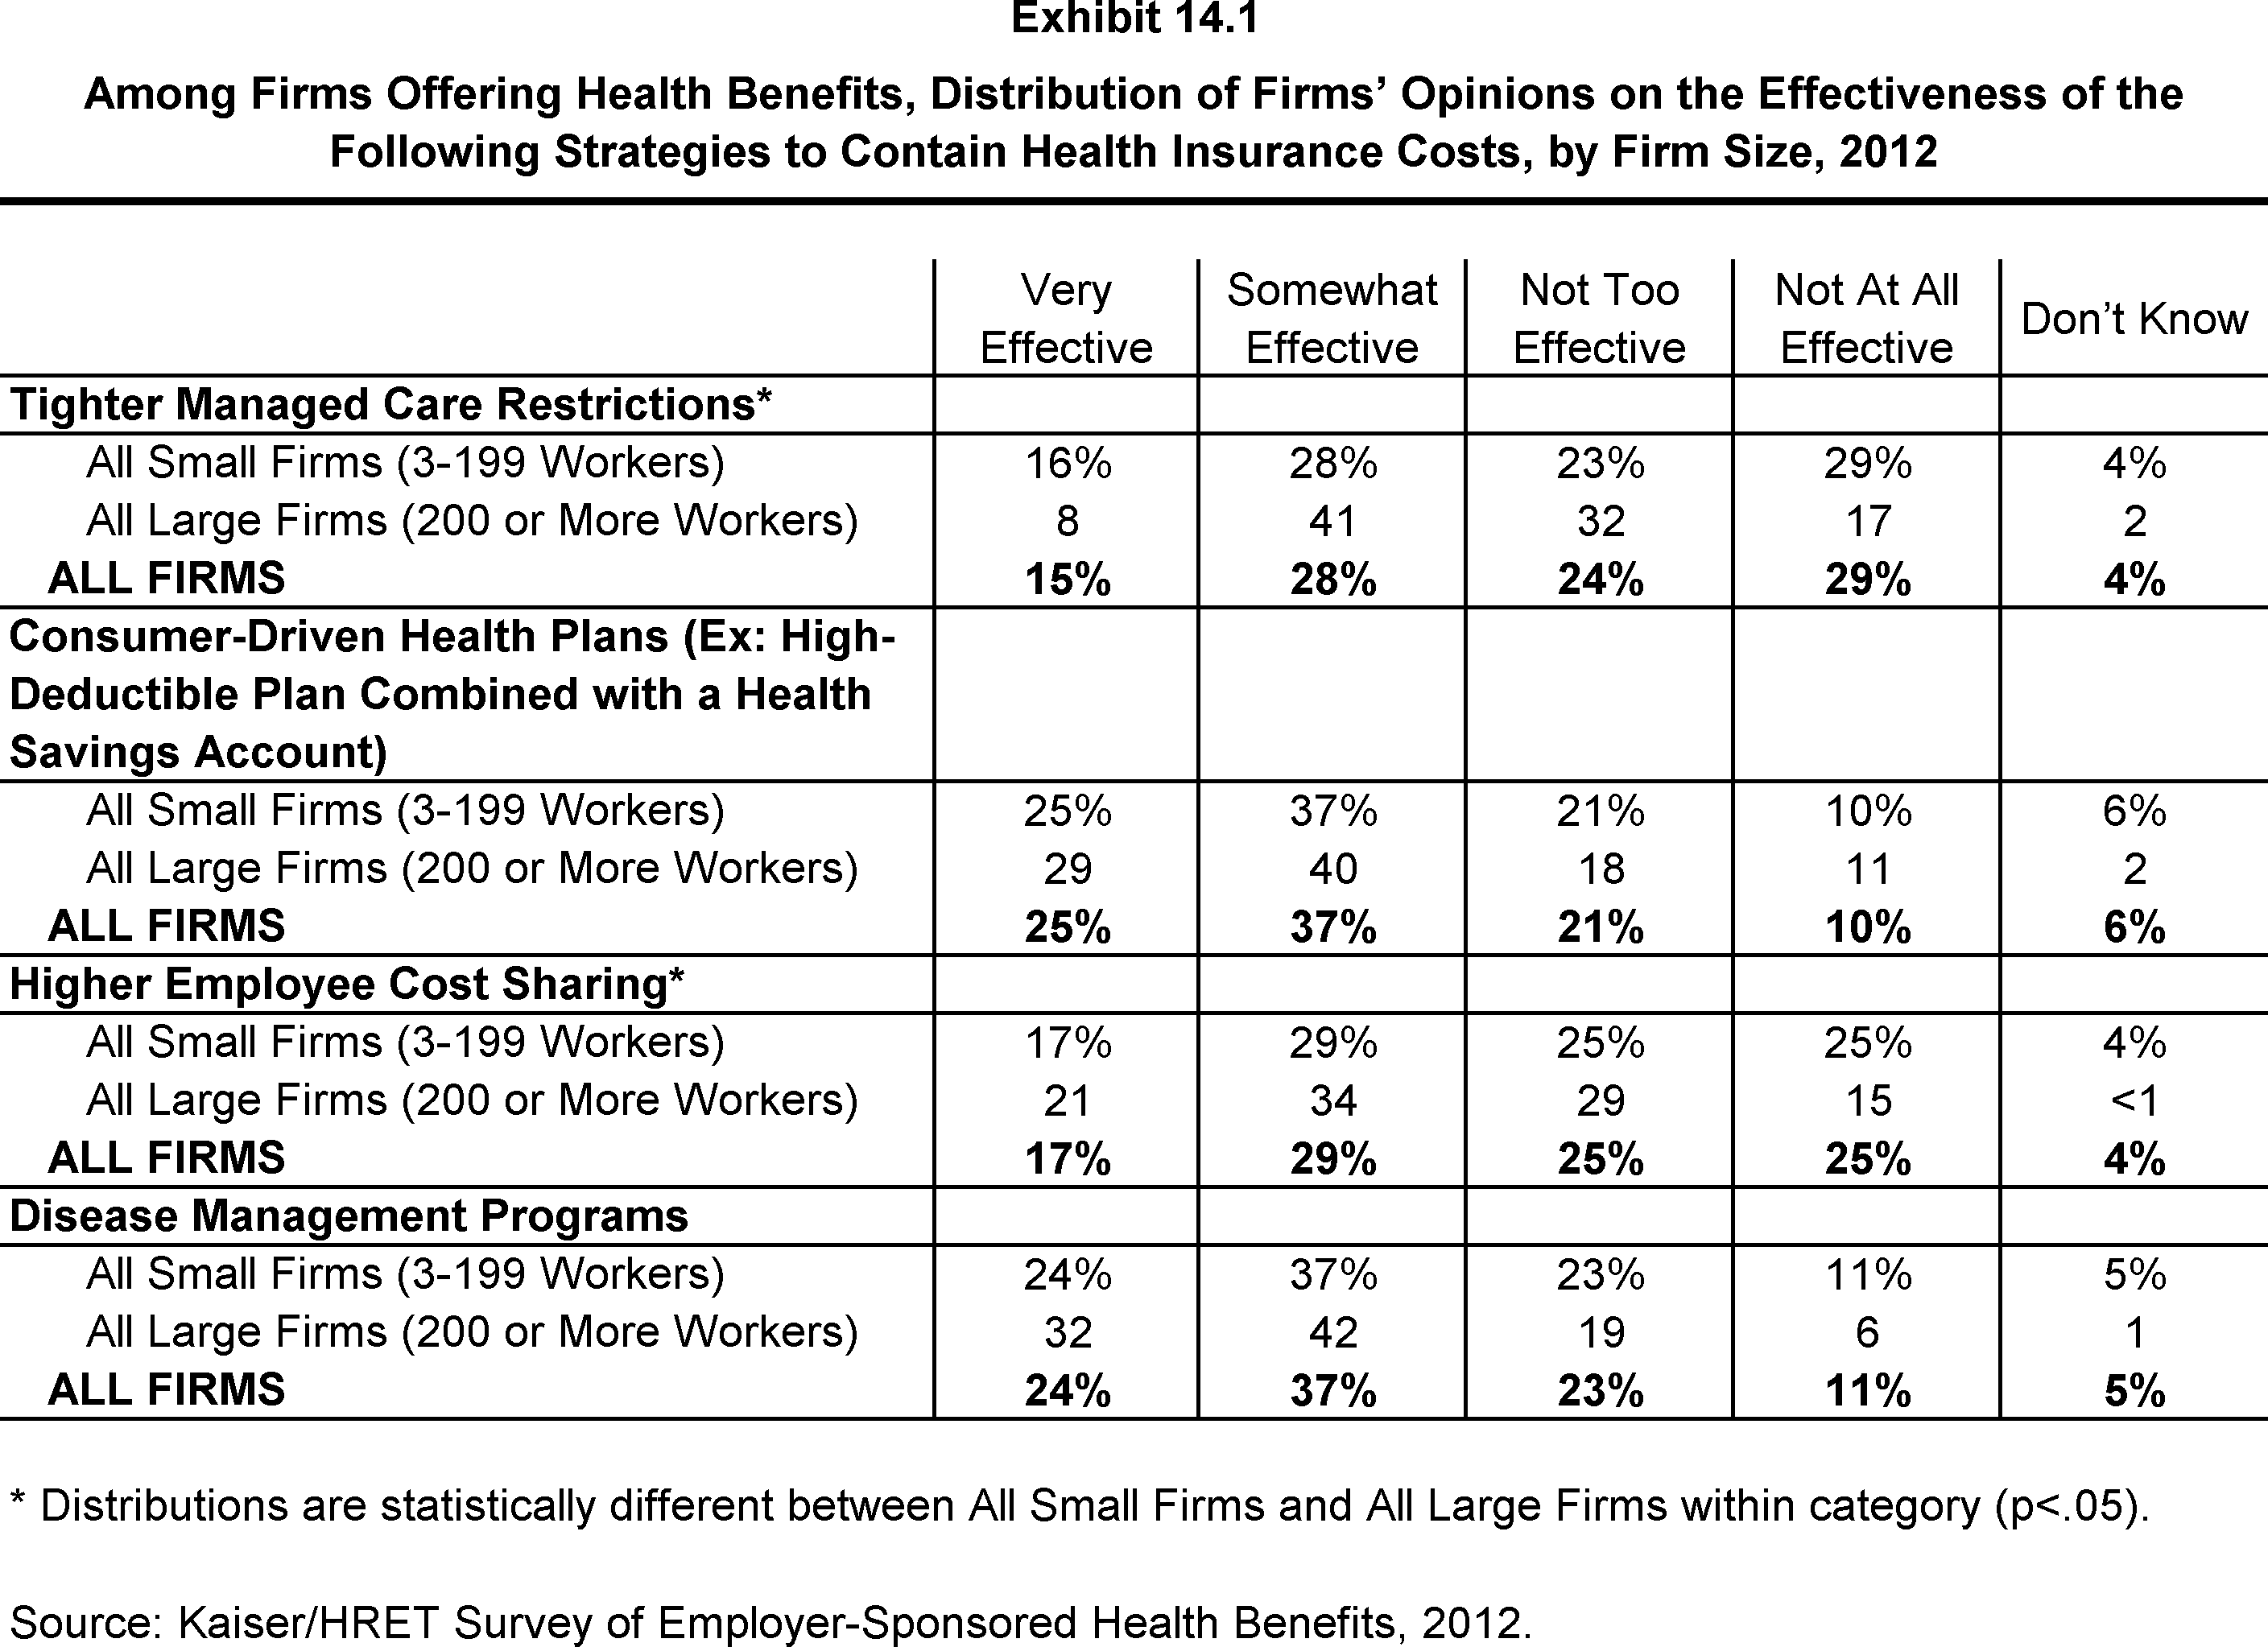
Among Firms Offering Health Benefits, Distribution of Firms’ Opinions on the Effectiveness of the Following Strategies to Contain Health Insurance Costs, by Firm Size, 2012
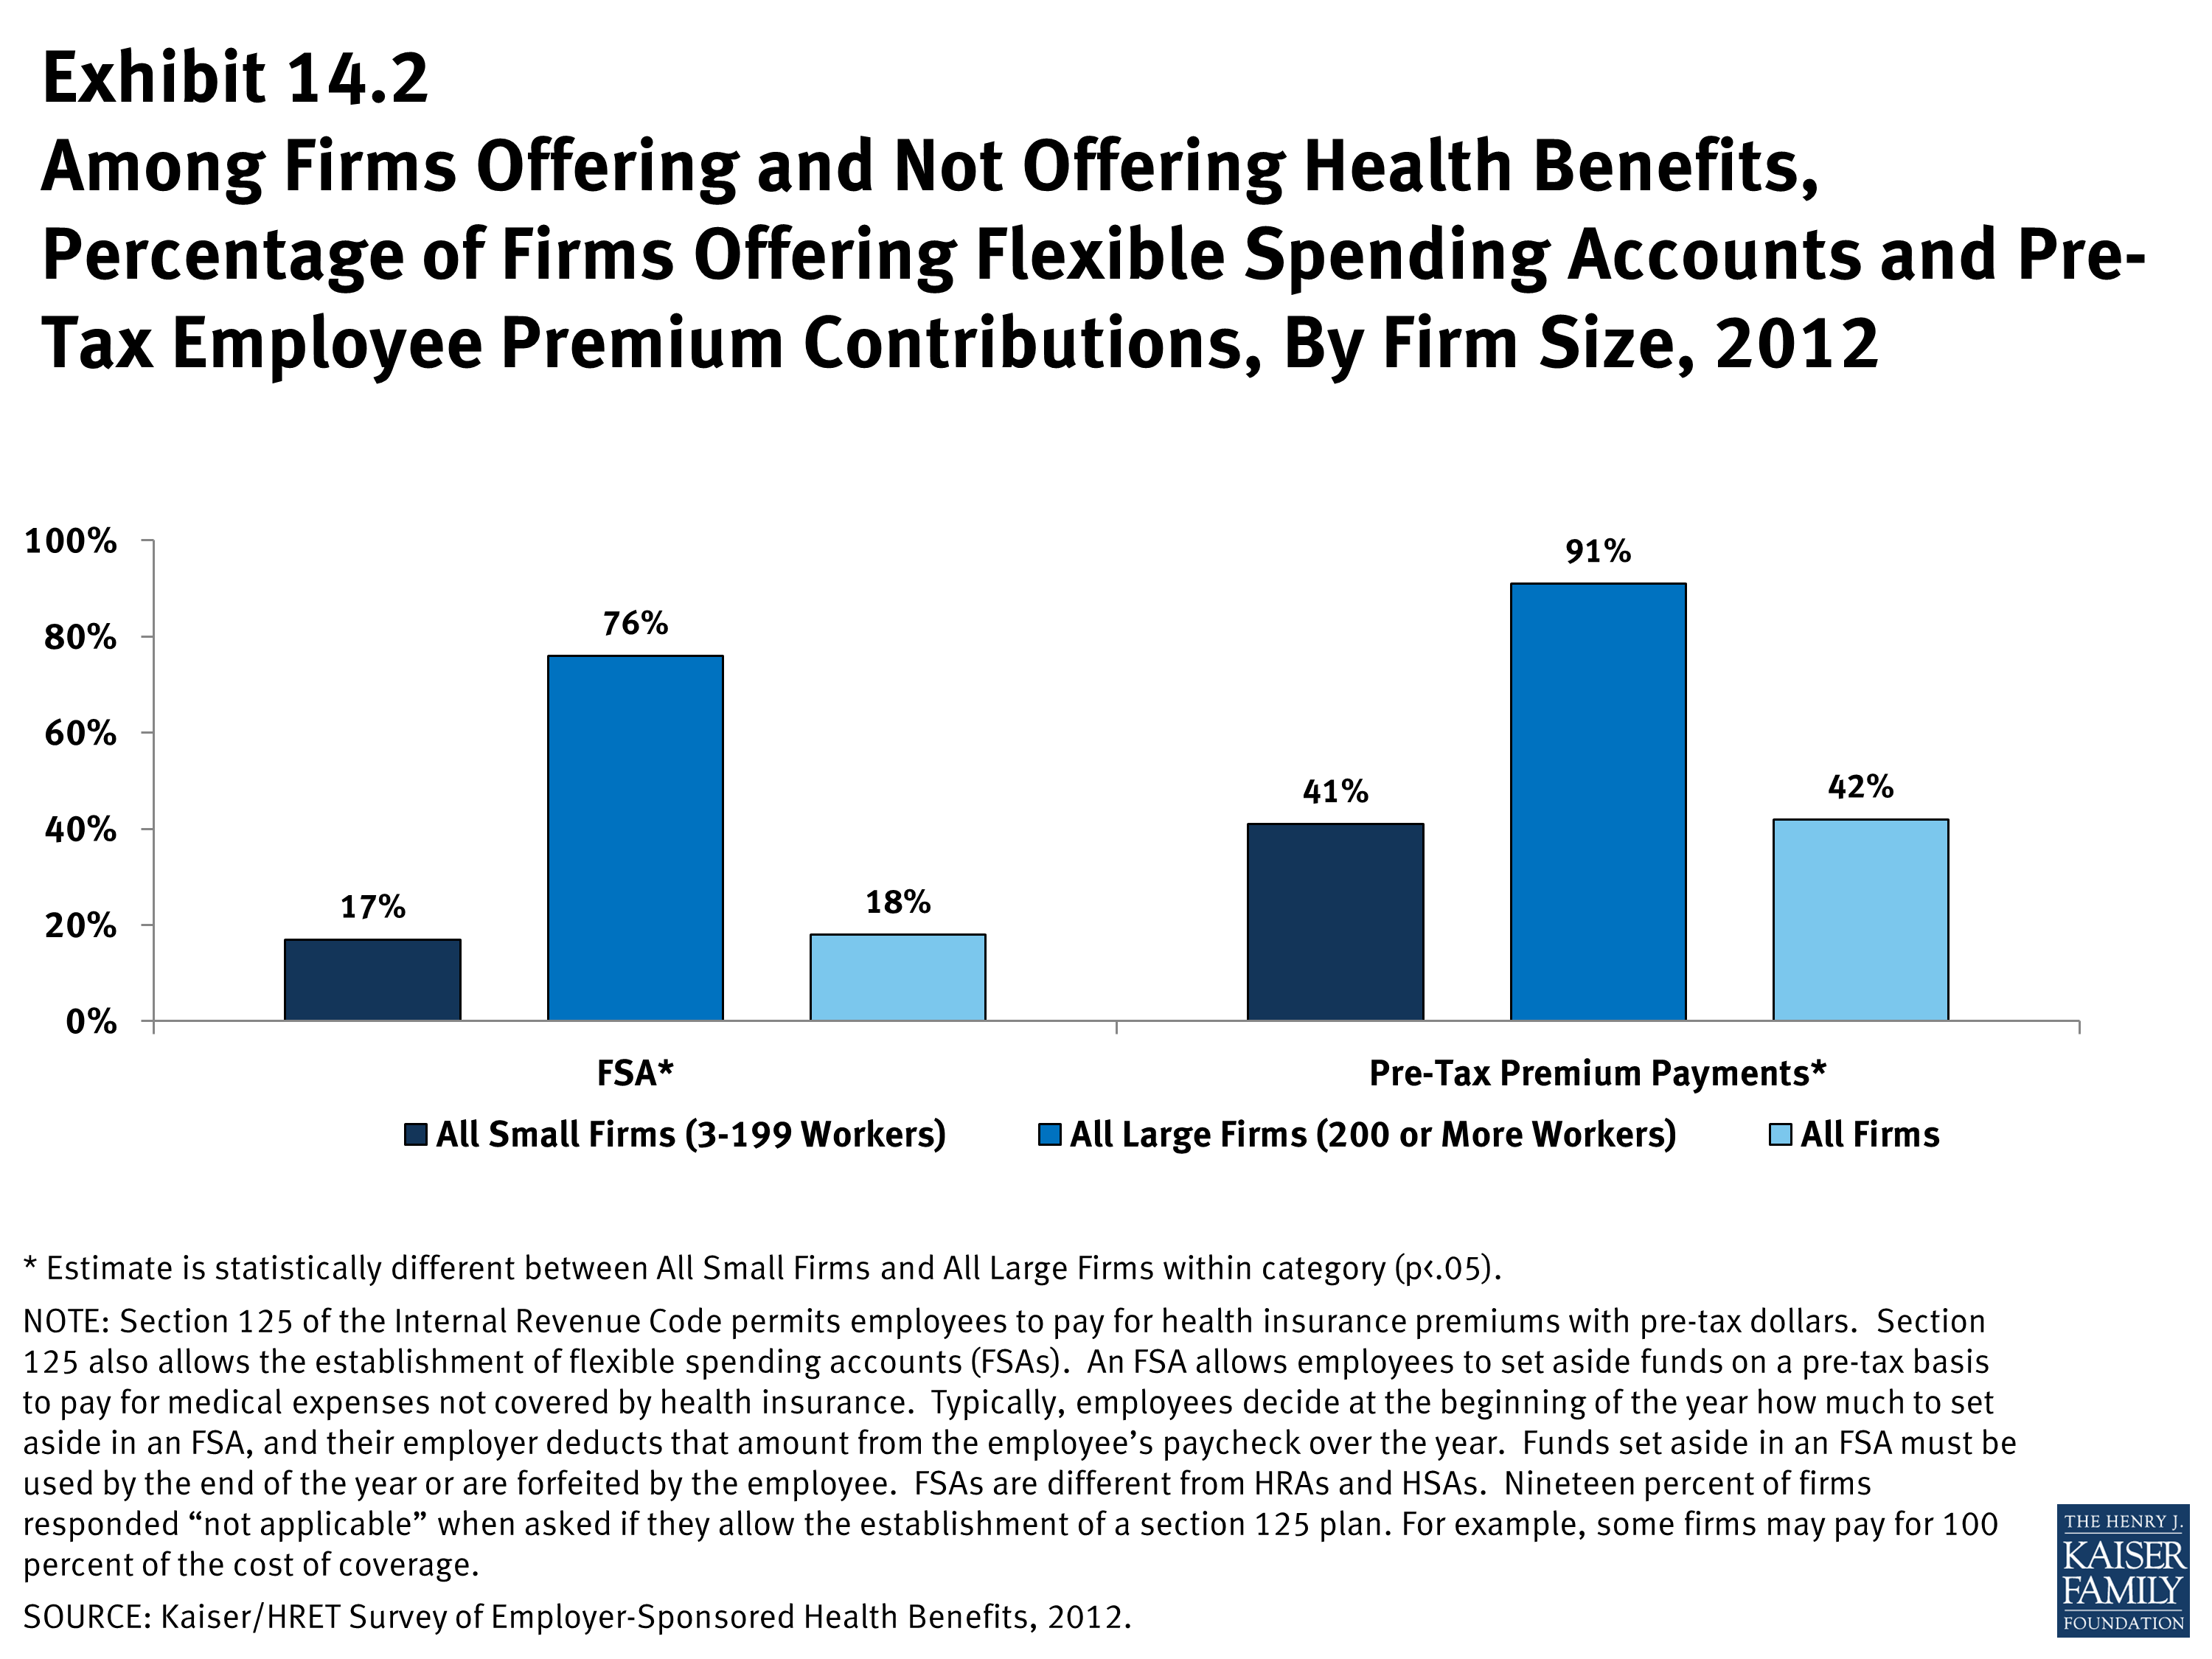
Among Firms Offering and Not Offering Health Benefits, Percentage of Firms Offering Flexible Spending Accounts and Pre-Tax Employee Premium Contributions, By Firm Size, 2012
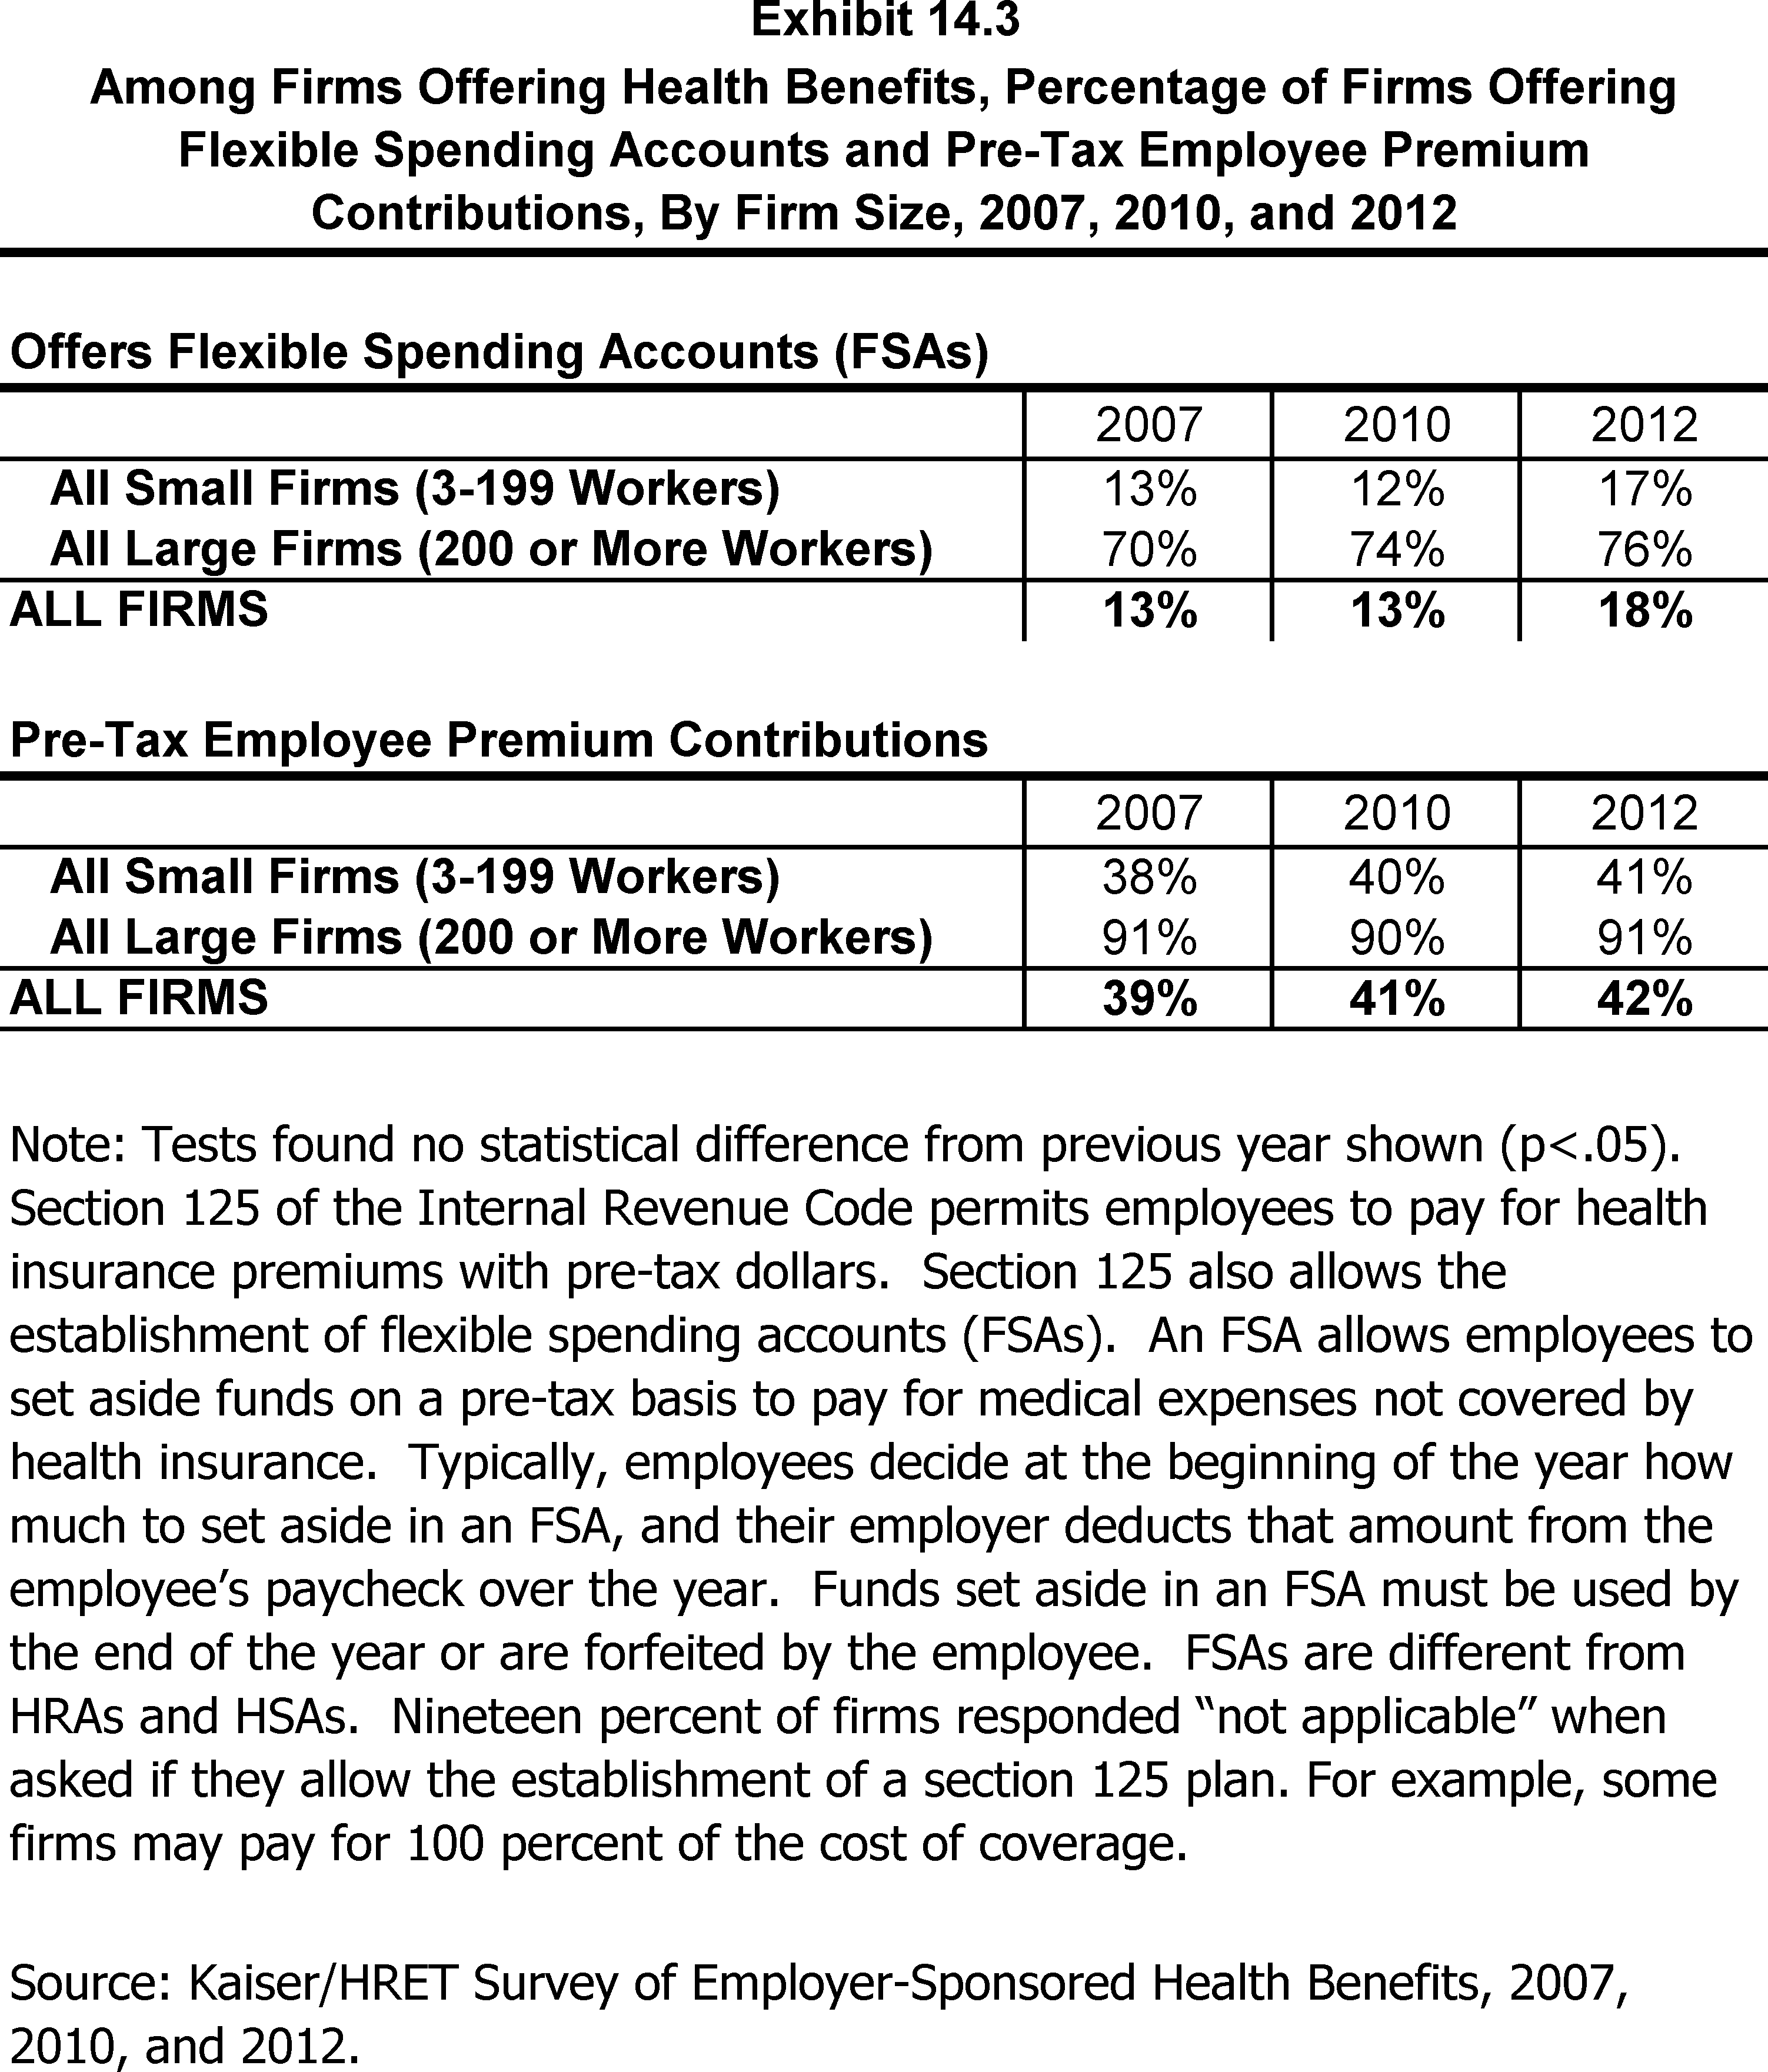
Among Firms Offering Health Benefits, Percentage of Firms Offering Flexible Spending Accounts and Pre-Tax Employee Premium Contributions, By Firm Size, 2007, 2010, and 2012
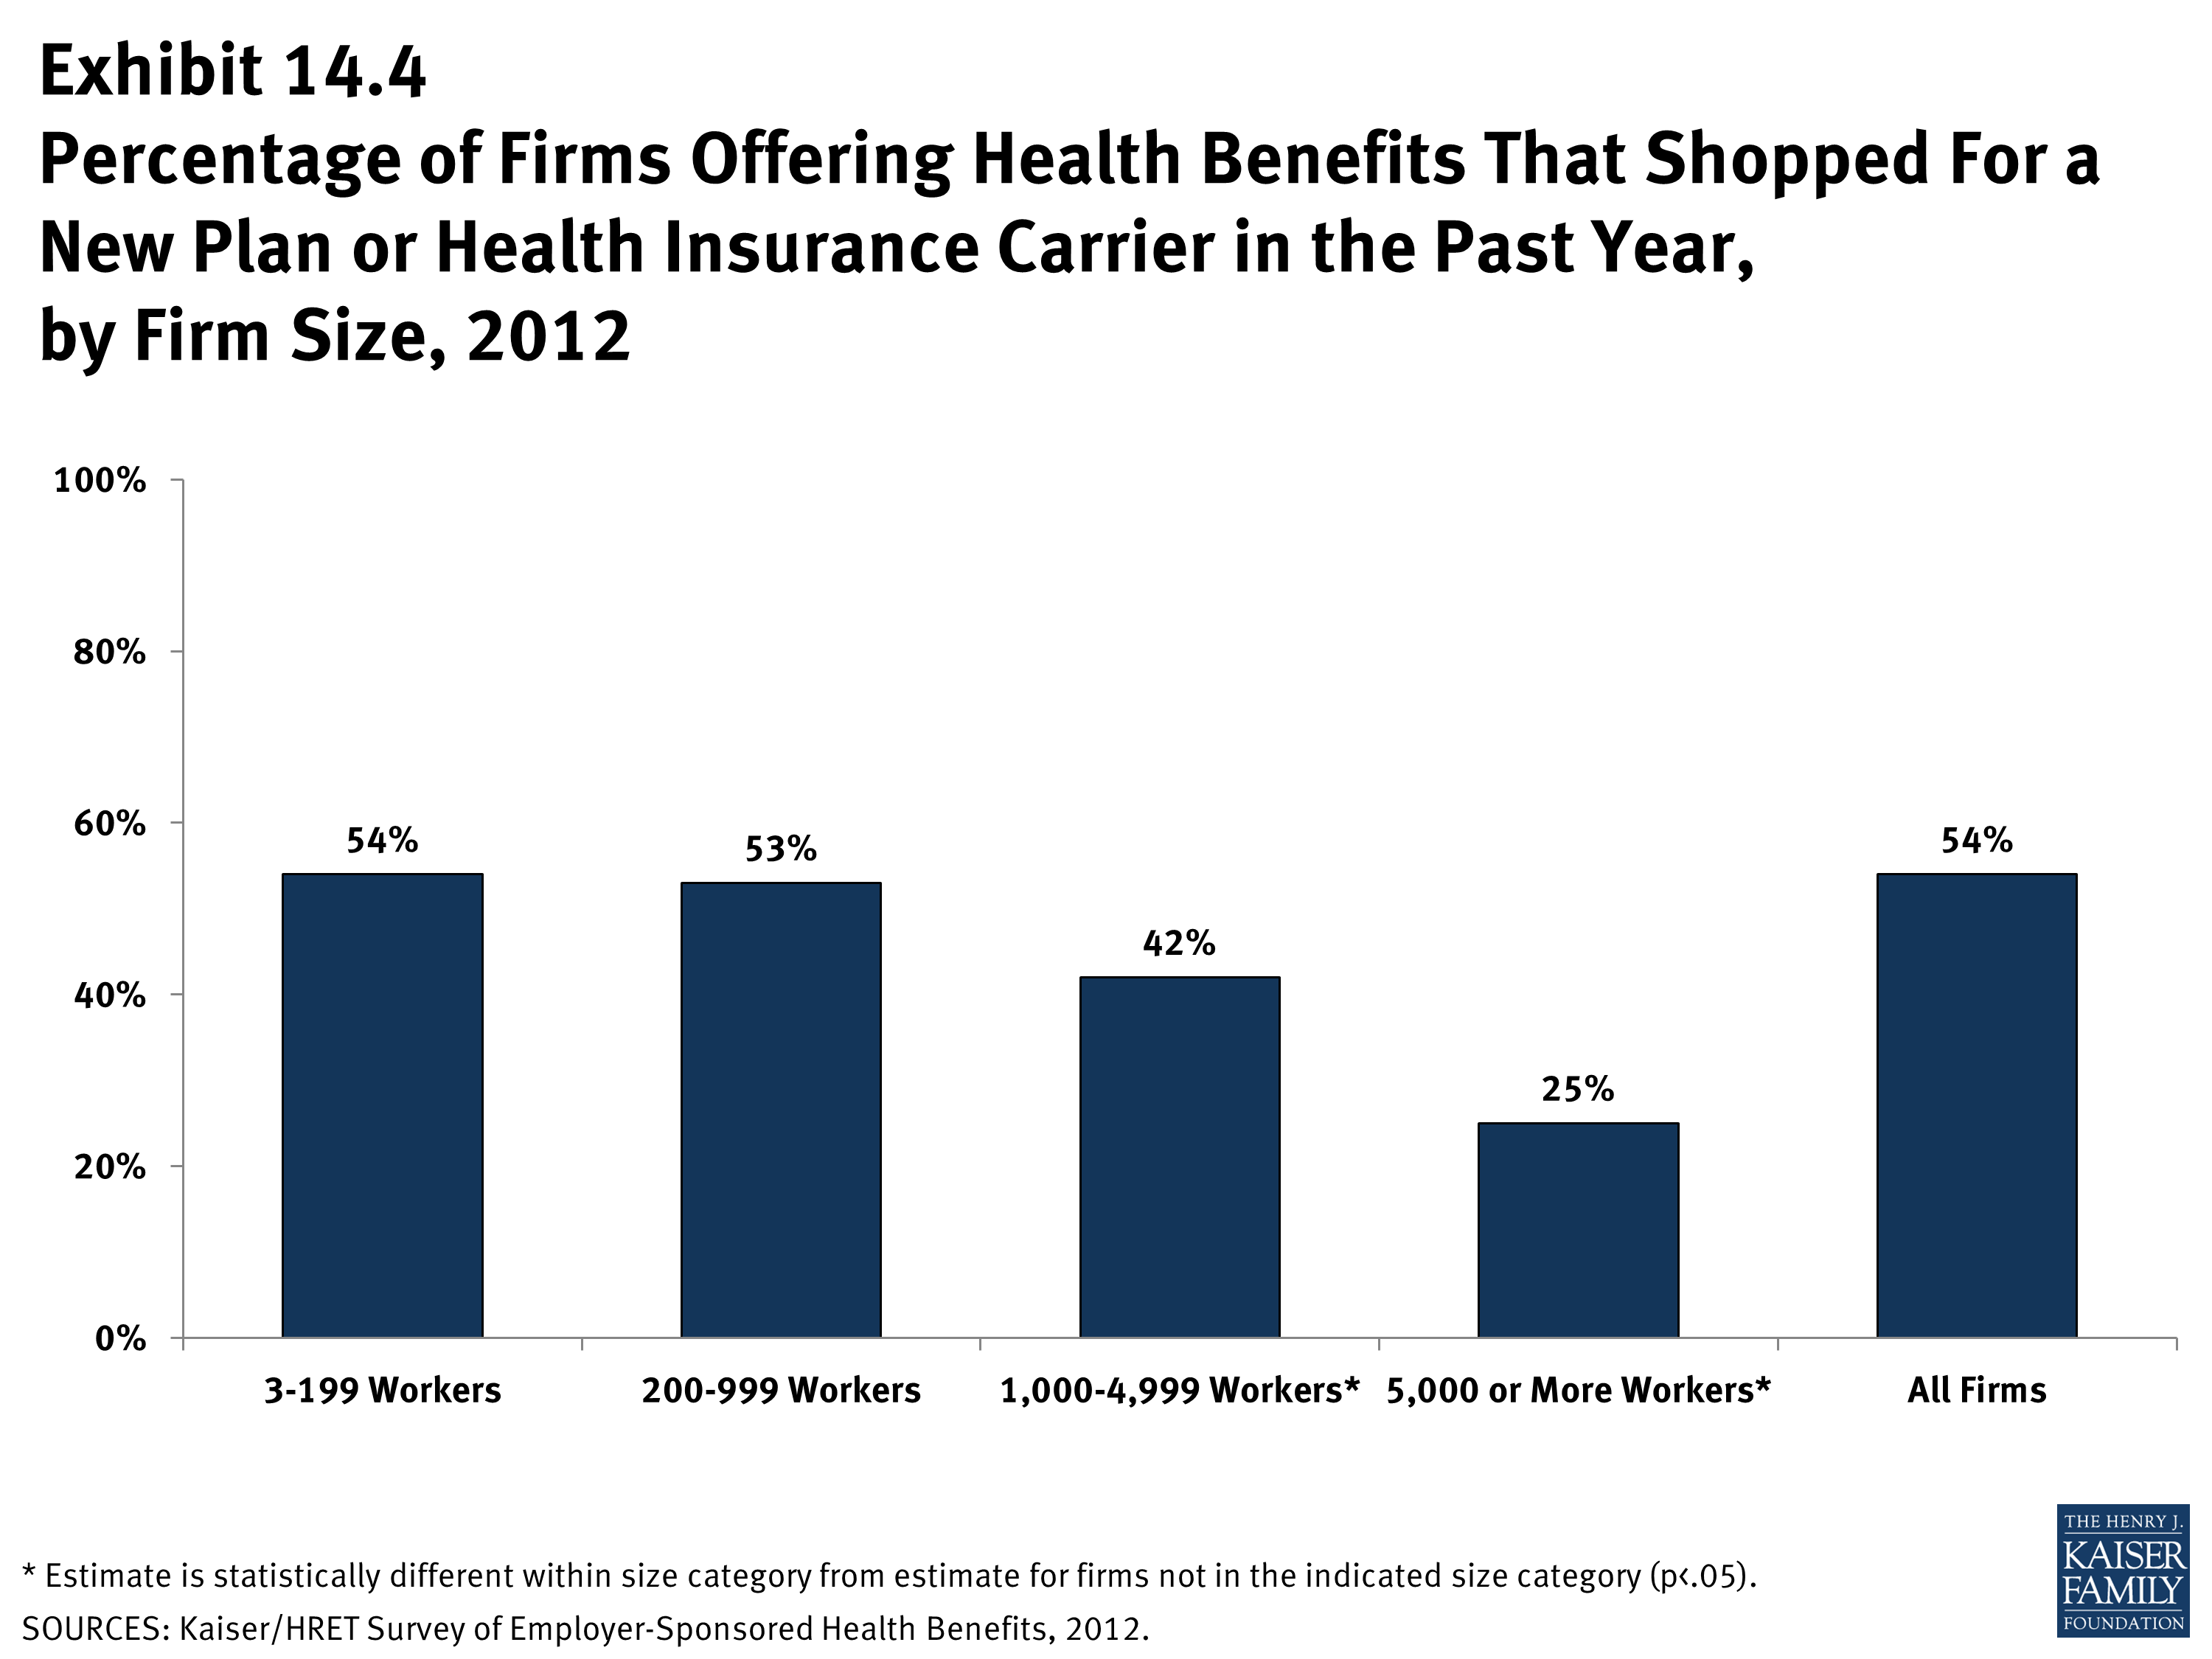
Percentage of Firms Offering Health Benefits That Shopped For a New Plan or Health Insurance Carrier in the Past Year, by Firm Size, 2012
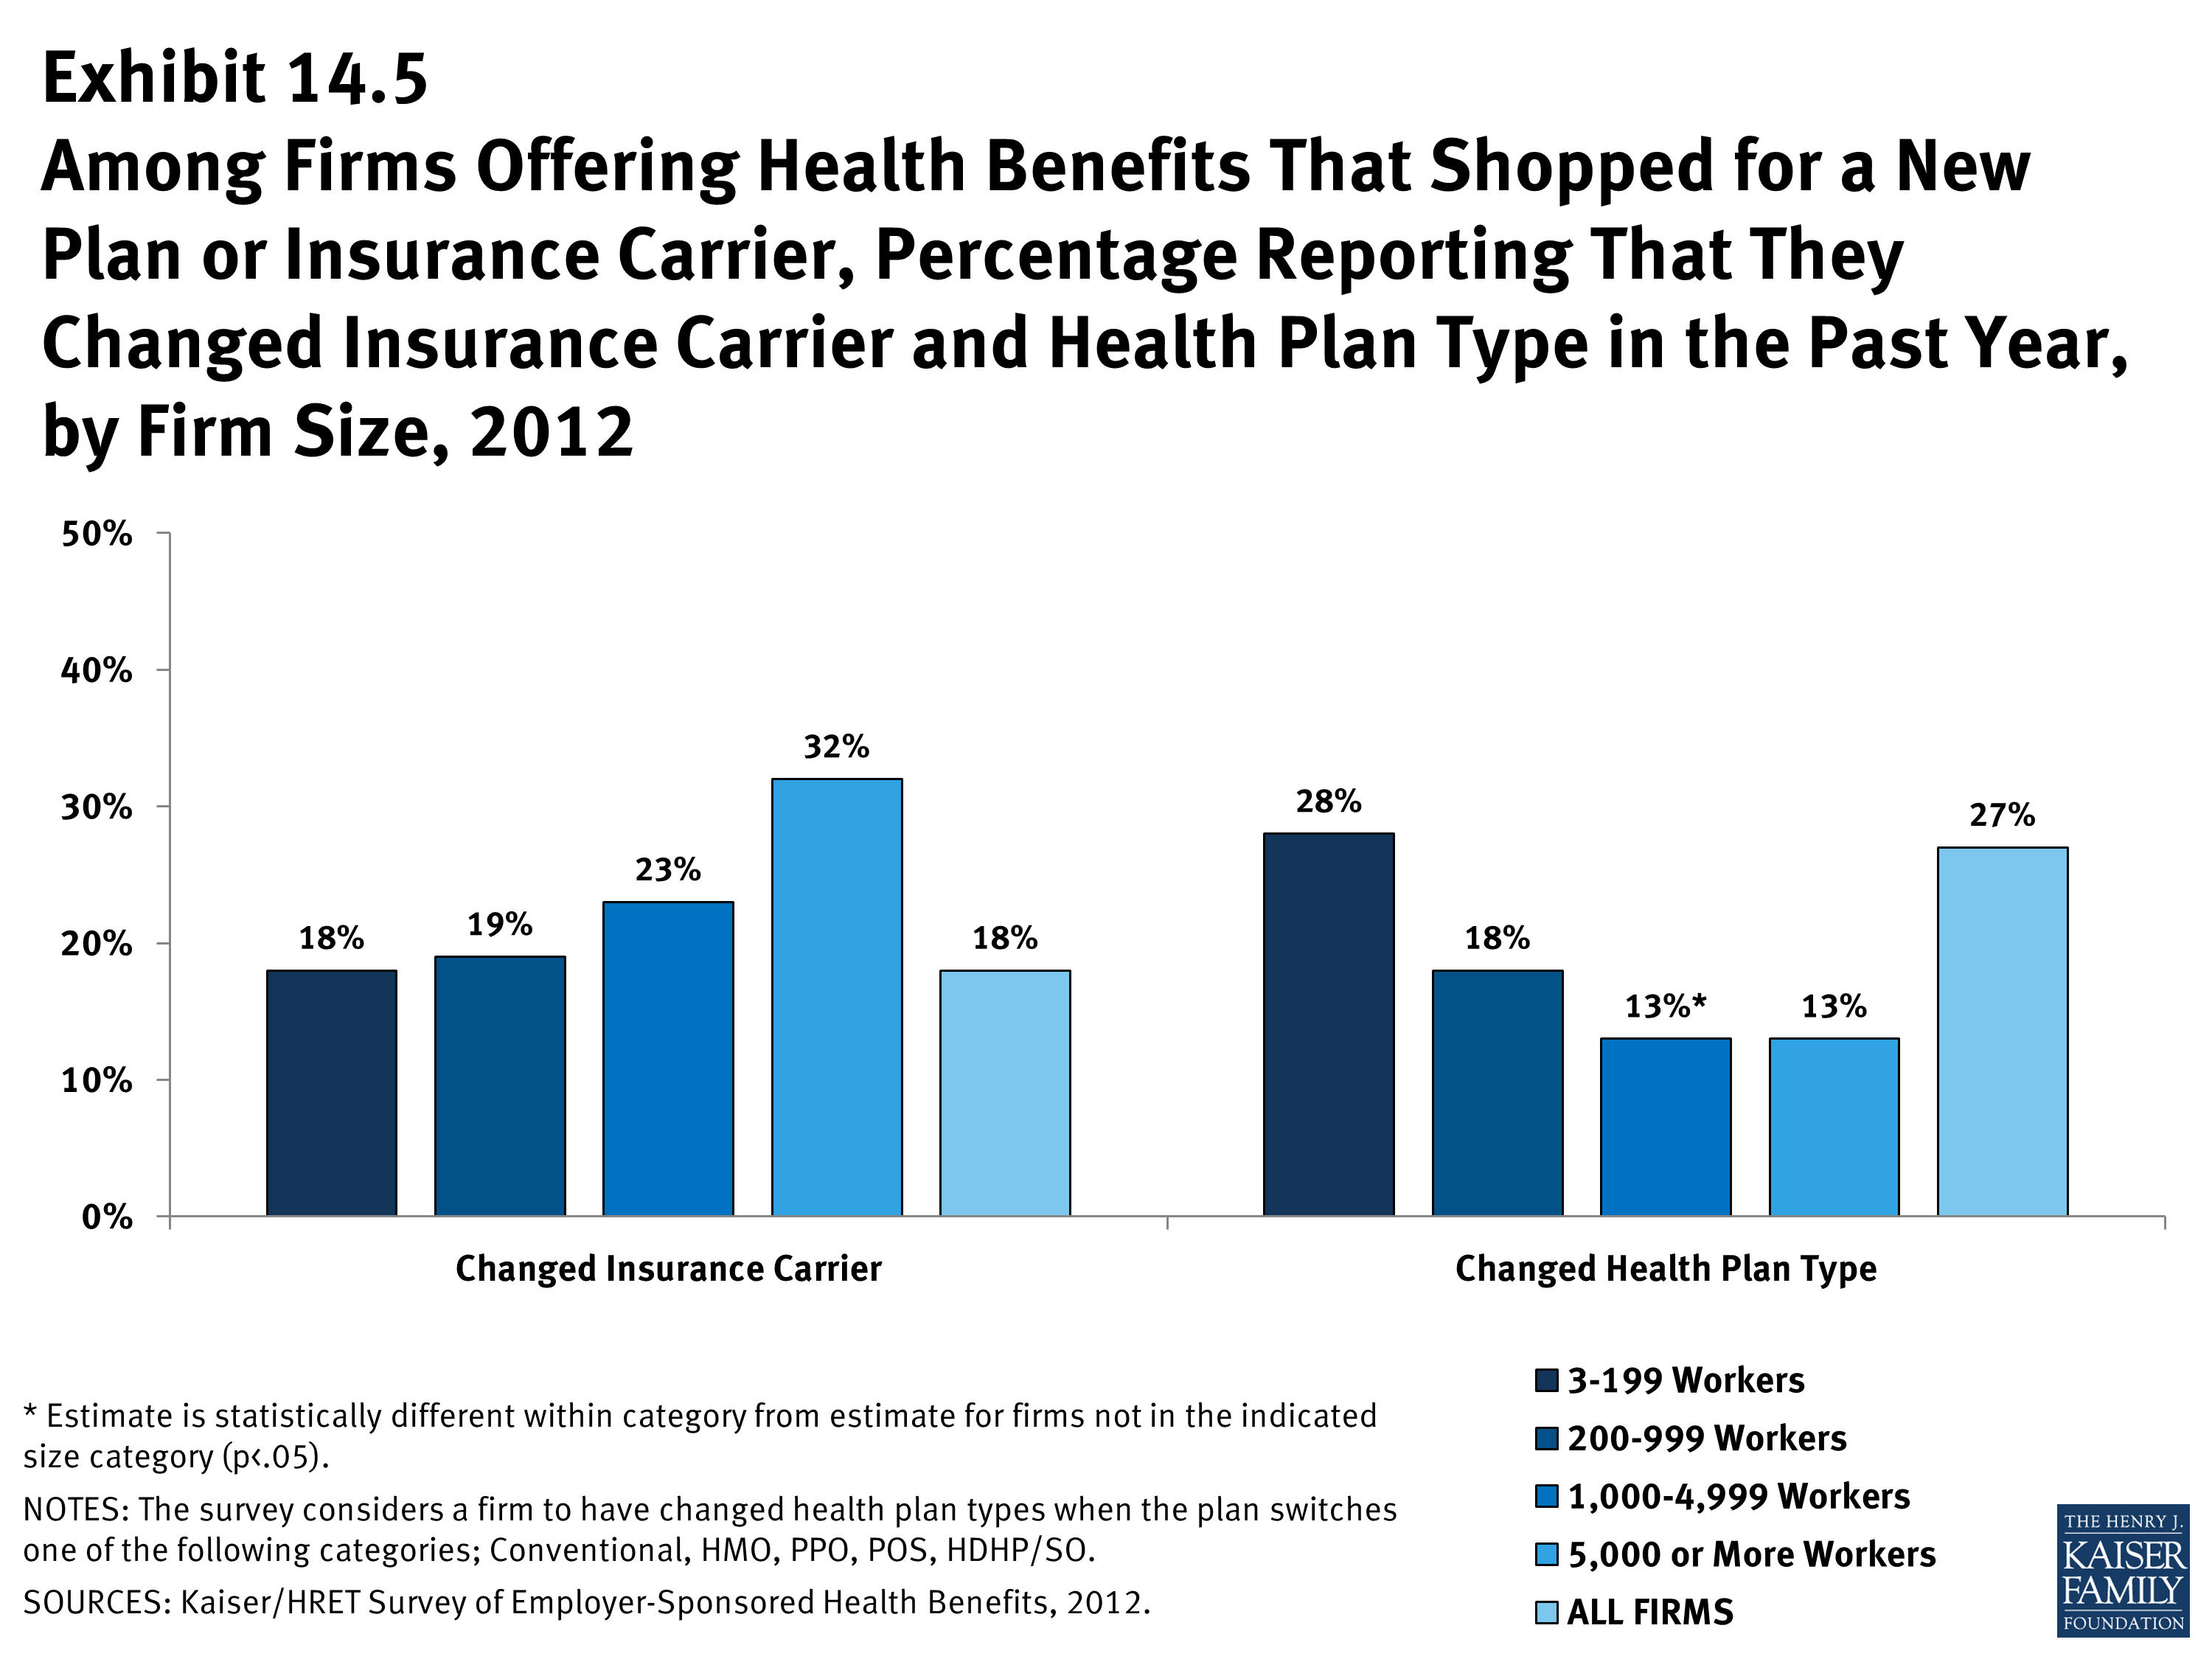
Among Firms Offering Health Benefits That Shopped for a New Plan or Insurance Carrier, Percentage Reporting That They Changed Insurance Carrier and Health Plan Type in the Past Year, by Firm Size, 2012
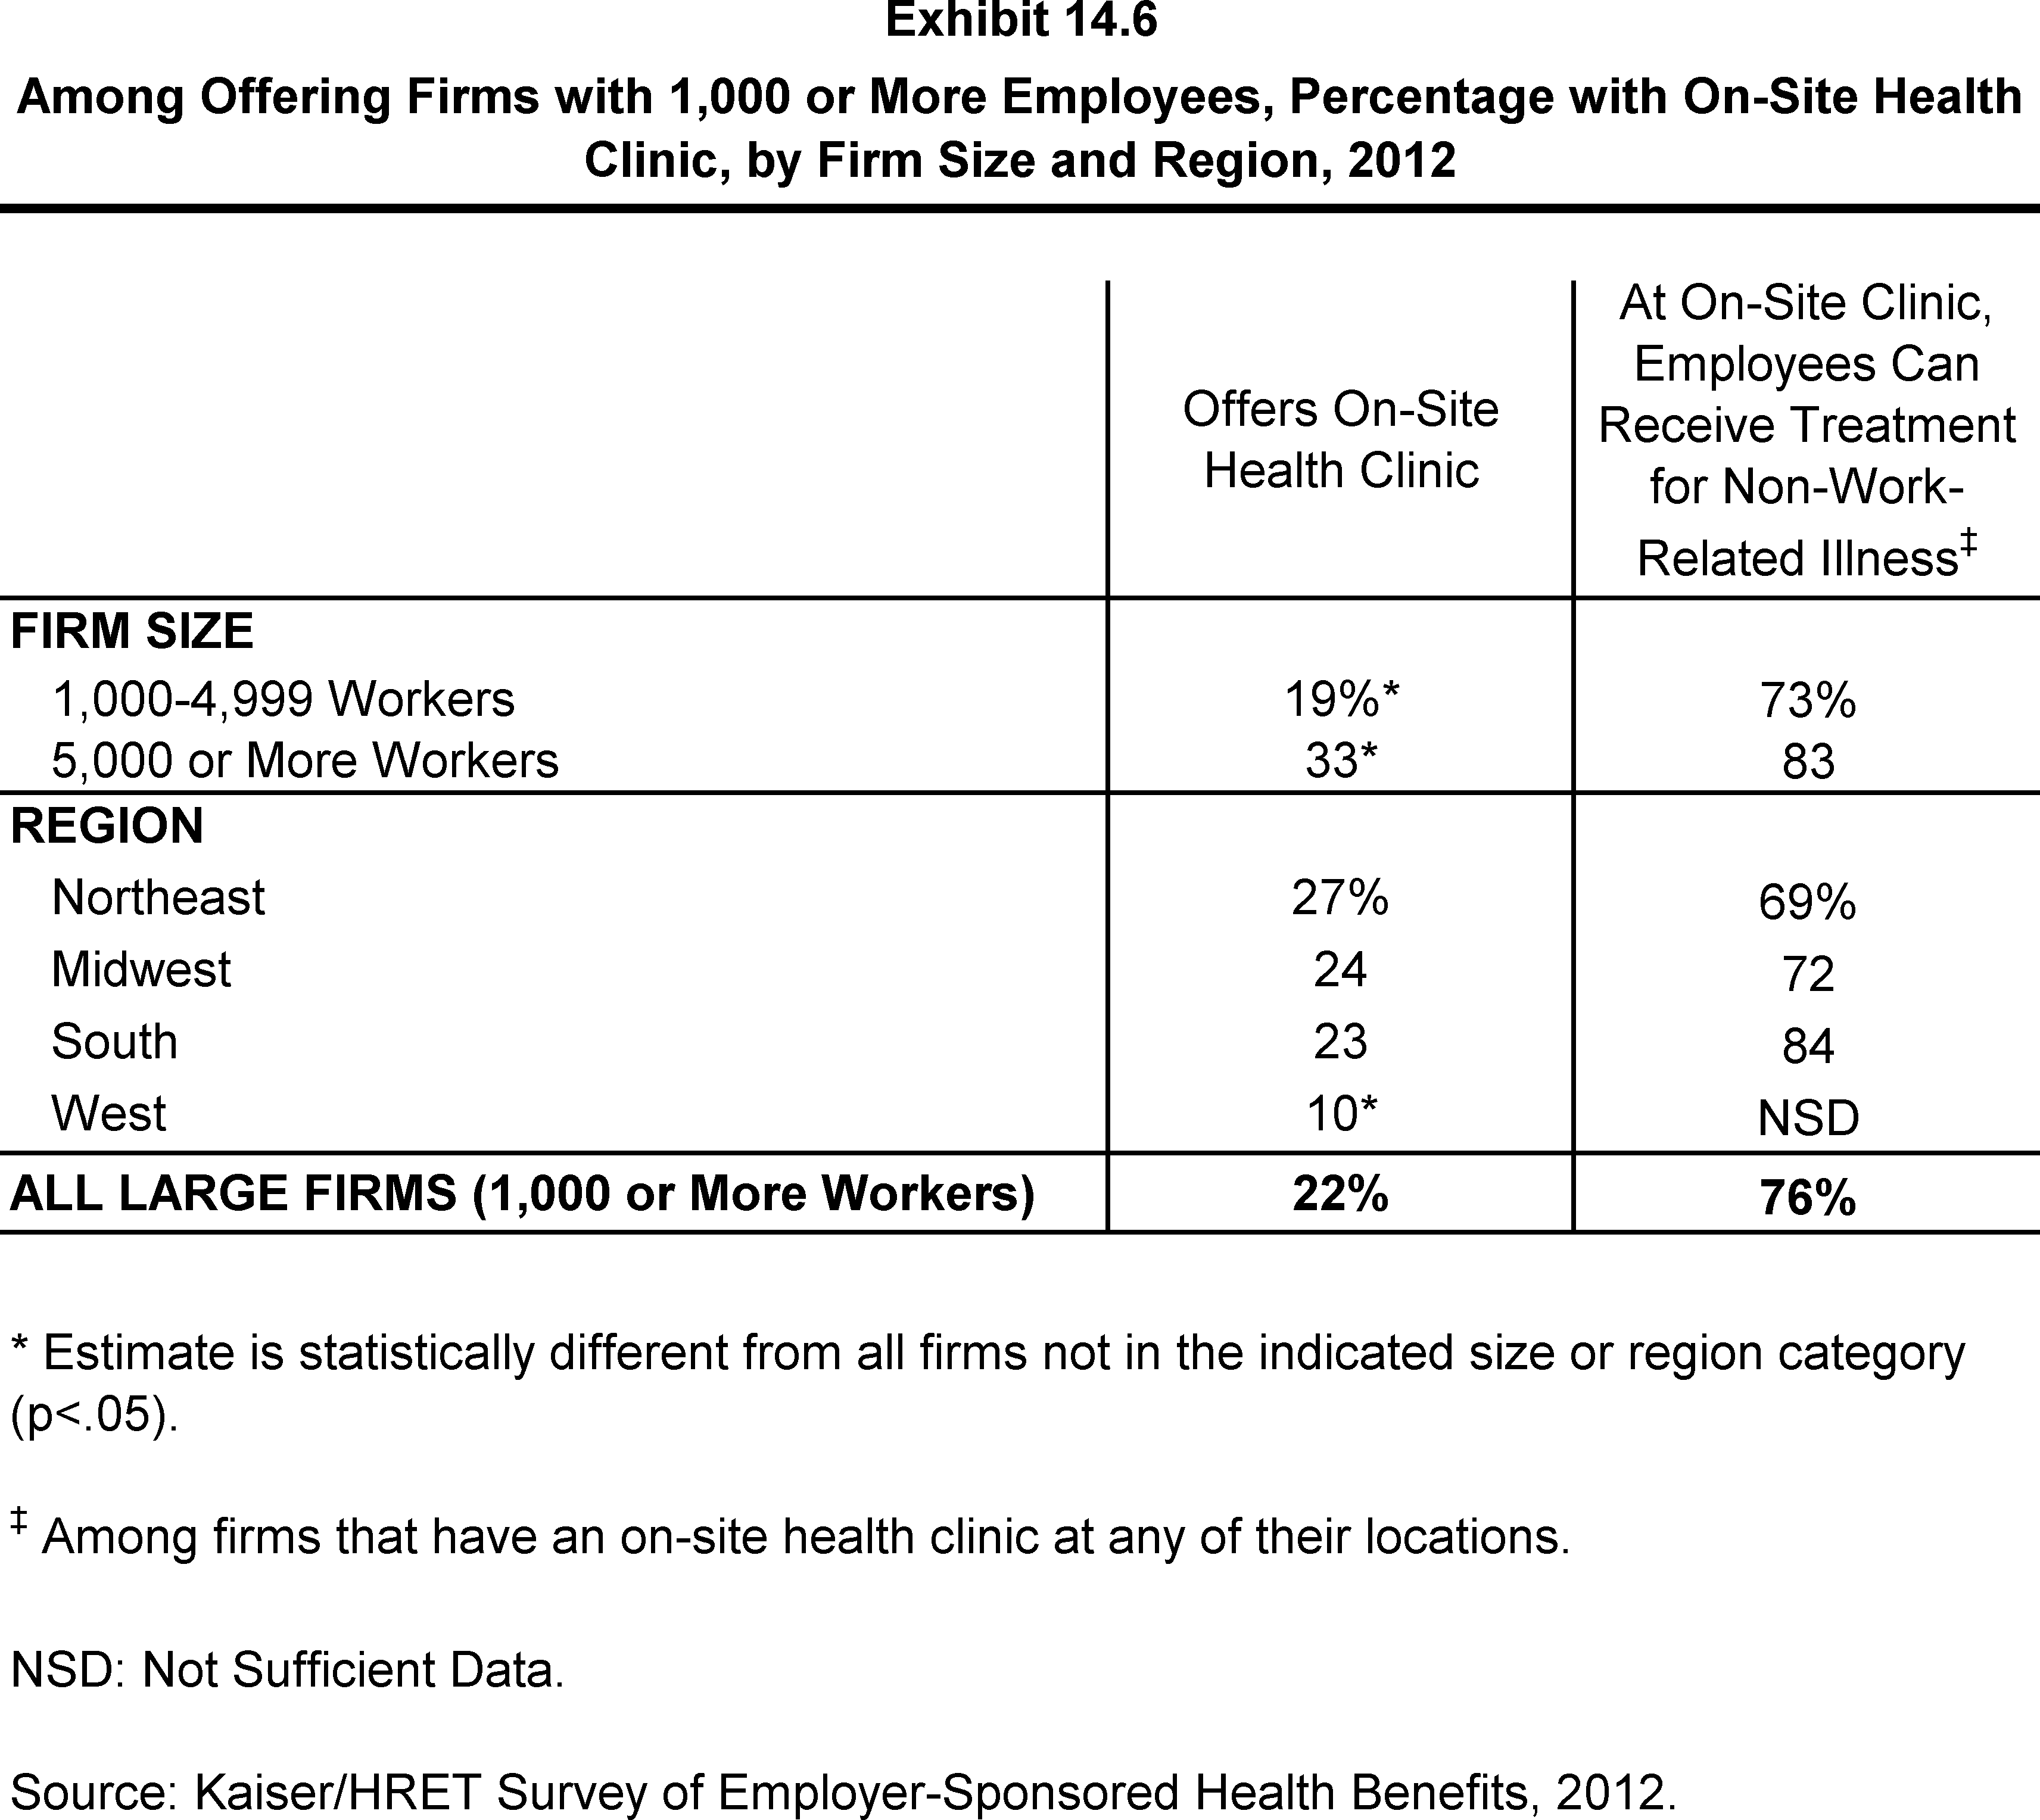
Among Offering Firms with 1,000 or More Employees, Percentage with On-Site Health Clinic, by Firm Size and Region, 2012
Methodology
Survey Design and Methods
The Kaiser Family Foundation and the Health Research & Educational Trust (Kaiser/HRET) conduct this annual survey of employer-sponsored health benefits. HRET, a nonprofit research organization, is an affiliate of the American Hospital Association. The Kaiser Family Foundation designs, analyzes, and conducts this survey in partnership with HRET, and also pays for the cost of the survey. HRET subcontracts with researchers at NORC at the University of Chicago (NORC) to work with Foundation and HRET researchers in conducting the study. Kaiser/HRET retained National Research, LLC (NR), a Washington, D.C.-based survey research firm, to conduct telephone interviews with human resource and benefits managers using the Kaiser/HRET survey instrument. From January to May 2012, NR completed full interviews with 2,121 firms.
Survey Topics
As in past years, Kaiser/HRET asked each participating firm as many as 400 questions about its largest health maintenance organization (HMO), preferred provider organization (PPO), point-of-service (POS) plan, and high-deductible health plan with a savings option (HDHP/SO).1 In 2006, Kaiser/HRET began asking employers if they had a health plan that was an exclusive provider organization (EPO). We treat EPOs and HMOs as one plan type and report the information under the banner of “HMO”; if an employer sponsors both an HMO and an EPO, they are asked about the attributes of the plan with the larger enrollment.
As in past years, the survey includes questions on the cost of health insurance, health benefit offer rates, coverage, eligibility, enrollment patterns, premiums,2 employee cost sharing, prescription drug benefits, retiree health benefits, wellness benefits, and employer opinions. New topics in the 2012 survey include the use of biometric screening, domestic partner benefits, and emergency room cost sharing. In addition, many of the questions on health reform included in the 2011 survey were retained, including stoploss coverage for self-funded plans, cost sharing for preventive care, and plan grandfathering resulting from the Affordable Care Act (ACA).
Response Rate
After determining the required sample from U.S. Census Bureau data, Kaiser/HRET drew its sample from a Survey Sampling Incorporated list (based on an original Dun and Bradstreet list) of the nation’s private employers and from the Census Bureau’s Census of Governments list of public employers with three or more workers. To increase precision, Kaiser/HRET stratified the sample by ten industry categories and six size categories. Kaiser/HRET attempted to repeat interviews with prior years’ survey respondents (with at least ten employees) who participated in either the 2010 or the 2011 survey, or both. As a result, 1,579 of the 2,121 firms that completed the survey also participated in either the 2010 or 2011 surveys, or both.3 The overall response rate is 47%.4
The vast majority of questions are asked only of firms that offer health benefits. A total of 1,930 of the 2,121 responding firms indicated that they offered health benefits. The response rate for firms that offer health benefits is 47%.
We asked one question of all firms in the study that we made phone contact with but the firm declined to participate. The question was, “Does your company offer a health insurance program as a benefit to any of your employees?” A total of 3,326 firms responded to this question (including 2,121 who responded to the full survey and 1,205 who responded to this one question). These responses are included in our estimates of the percentage of firms offering health benefits.5 The response rate for this question is 73%. In 2012 the calculation of the response rates was adjusted to be slightly more conservative than previous years.
Firm Size Categories and Key Definitions
Throughout the report, exhibits categorize data by size of firm, region, and industry. Firm size definitions are as follows: All Small Firms, 3 to 199 workers; and All Large Firms, 200 or more workers. Occasionally, firm size categories will be broken into smaller groups. The All Small Firm group may be categorized by: 3 to 24 workers, and 25 to 199 workers; or 3 to 9 workers, 10 to 24 workers, 25 to 49 workers, and 50 to 199 workers. The All Large Firm group may be categorized by: 200 to 999 workers, 1,000 to 4,999 workers, and 5,000 or more workers. Exhibit M.1 shows selected characteristics of the survey sample.
Exhibit M.2 displays the distribution of the nation’s firms, workers, and covered workers (employees receiving coverage from their employer). Among the over three million firms nationally, approximately 61.1% are firms employing 3 to 9 workers; such firms employ 8.3% of workers, and 4.4% of workers covered by health insurance. In contrast, less than one percent of firms employ 1,000 or more workers; these firms employ 48% of workers and 53% of covered workers. Therefore, the smallest firms dominate any national statistics about what employers in general are doing. For this reason, most statistics about firms are broken out by size categories. In contrast, firms with 1,000 or more workers are the most important employer group in calculating statistics regarding covered workers, since they employ the largest percentage of the nation’s workforce.
Throughout this report, we use the term “in-network” to refer to services received from a preferred provider. Family coverage is defined as health coverage for a family of four.
Each year, the survey asks firms for the percentage of their employees who earn less than a specified amount in order to identify the portion of a firm’s workforce that has relatively low wages. This year, the income threshold is $24,000 per year for low-wage workers and $55,000 for high-wage workers. These thresholds are based on the 25th and 75th percentile of workers’ earnings as reported by the Bureau of Labor Statistics using data from the National Compensation Survey (2010), the most current data available at the time of the survey design.
Rounding and Imputation
Some exhibits in the report do not sum to totals due to rounding effects. In a few cases, numbers from distribution exhibits may not add to the numbers referenced in the text due to rounding effects. Although overall totals and totals for size and industry are statistically valid, some breakdowns may not be available due to limited sample sizes. Where the unweighted sample size is fewer than 30 observations, exhibits include the notation “NSD” (Not Sufficient Data).
To control for item nonresponse bias, Kaiser/HRET imputes values that are missing for most variables in the survey. In general, 3% of observations are imputed for any given variable. All variables are imputed following a hotdeck approach. In 2012, there were nine variables where the imputation rate exceeded 20%. For these cases, the unimputed variable is compared with the imputed variable. There are a few variables that Kaiser/HRET has decided should not be imputed; these are typically variables where “don’t know” is considered a valid response option (for example, firms’ opinions about effectiveness of various strategies to control health insurance costs). In addition, there are several variables in which missing data is calculated based on respondents’ answers to other questions (for example, when missing employer contributions to premiums is calculated from the respondent’s premium and the ratio of contributions to premiums). In 2012 the method to calculate missing premiums and contributions was revised; if a firm provides a premium for single coverage or family coverage, or a worker contribution for single coverage or family coverage, that information was used in the imputation. For example, if a firm provided a worker contribution for family coverage but no premium information, a ratio between the family premium and family contribution was imputed and then the family premium was calculated. In addition, in cases where premiums or contributions for both family and single coverage were missing, the hotdeck procedure was revised to draw all four responses from a single firm. The change in the imputation method did not make a significant impact on the premium or contribution estimates.
Sample Design
We determined the sample requirements based on the universe of firms obtained from the U.S. Census. Prior to the 2009 survey, the sample requirements were based on the total counts provided by Survey Sampling Incorporated (SSI) (which obtains data from Dun and Bradstreet). Over the years, we have found the Dun and Bradstreet frequency counts to be volatile because of duplicate listings of firms, or firms that are no longer in business. These inaccuracies vary by firm size and industry. In 2003, we began using the more consistent and accurate counts provided by the Census Bureau’s Statistics of U.S. Businesses and the Census of Governments as the basis for post-stratification, although the sample was still drawn from a Dun and Bradstreet list. In order to further address this concern at the time of sampling, starting in 2009 we use Census data as the basis for the sample.
We also defined Education as a separate sampling category, rather than as a subgroup of the Service category. In the past, Education firms were a disproportionately large share of Service firms. Education is controlled for during post-stratification, and adjusting the sampling frame to also control for Education allows for a more accurate representation of both Education and Service industries.
In past years, both private and government firms were sampled from the Dun and Bradstreet database. Beginning in 2009, Government firms were sampled from the 2007 Census of Governments. This change was made to eliminate the overlap of state agencies that were frequently sampled from the Dun and Bradstreet database. The sample of private firms is screened for firms that are related to state/local governments, and if these firms are identified in the Census of Governments, they are reclassified as government firms and a private firm is randomly drawn to replace the reclassified firm. The federal government is not included in the sample frame.
Finally, the data used to determine the 2012 Employer Health Benefits sample frame include the U.S. Census’ 2008 Statistics of U.S. Businesses and the 2007 Census of Governments. At the time of the sample design (December 2011), these data represented the most current information on the number of public and private firms nationwide with three or more workers. As in the past, the post-stratification is based on the most up-to-date Census data available (the 2008 update to the Census of U.S. Businesses was purchased during the survey field period) and the 2007 Census of Governments. The Census of Governments is conducted every five years, and this is the fourth year the data from the 2007 Census of Governments has been available for use.
In 2012, the method for calculating the size of the sample was adjusted. Rather than using a combined response rate for panel and non-panel firms, separate response rates were used to calculate the number of firms to be selected in each strata. In addition, the mining stratum was collapsed into the agriculture and construction industry grouping. In sum, changes to the sampling method required more firms to be included and may have reduced the response rate in order to provide more balanced power within each strata.
Weighting and Statistical Significance
Because Kaiser/HRET selects firms randomly, it is possible through the use of statistical weights to extrapolate the results to national (as well as firm size, geography, regional, and industry) averages. These weights allow Kaiser/HRET to present findings based on the number of workers covered by health plans, the number of total workers, and the number of firms. In general, findings in dollar amounts (such as premiums, worker contributions, and cost sharing) are weighted by covered workers. Other estimates, such as the offer rate, are weighted by firms. Specific weights were created to analyze the HDHP/SO plans that are offered with an HRA or that are HSA-qualified. These weights represent the proportion of employees enrolled in each of these arrangements.
Calculation of the weights follows a common approach. First, the basic weight is determined, followed by a nonresponse adjustment. As part of this nonresponse adjustment, Kaiser/HRET conducted a small follow-up survey of those firms with 3 to 49 workers that refused to participate in the full survey. Just as in years passed, Kaiser/HRET conducted a McNemar test to verify that the results of the follow-up survey are comparable to the results from the original survey. Starting in 2012 the sample for the non-response survey was changed to exclude firms which were considered ineligible during the initial phase of the survey. Next, we trimmed the weights in order to reduce the influence of weight outliers. First, we identified common groups of observations. Within each group, we identified the median and the interquartile range of the weights and calculated the trimming cut point as the median plus six times the interquartile range (M + [6 * IQR]). Weight values larger than this cut point are trimmed to the cut point. In all instances, less than one percent of the weight values were trimmed. Finally, we calibrated the weights to U.S. Census Bureau’s 2008 Statistics of U.S. Businesses for firms in the private sector, and the 2007 Census of Governments as the basis for calibration / post-stratification for public sector firms.
In 2011, we became aware that the way we had been using the data from the Census Bureau for calibration was incorrect and resulted in an over-count of the actual number of firms in the nation. Specifically, firms operating in more than one industry were counted more than once in computing the total firm count by industry, and firms with establishments were counted more than once in computing the total firm count by state (which affects the regional count). Because smaller firms are less likely to operate in more than one industry or state, the miscounts occurred largely for larger firm sizes. The error affected only statistics that are weighted by the number of firms (such as the percent of firms offering health benefits). Statistics that are weighted by the number of workers or covered workers (such as average premiums, contributions, or deductibles) were not affected.
We addressed this issue by proportionally distributing the correct national total count of firms within each firm size as provided by the U.S. Census Bureau across industry and states based on the observed distribution of workers. This effectively weights each firm within each category (industry or state) in proportion to its share of workers in that category. The end result is a synthetic count of firms across industry and state that sums to the national totals.
Firm-weighted estimates resulting from this change show only small changes from previous estimates, because smaller firms have much more influence on national estimates. For example, the estimate of the percentage of firms offering coverage was reduced by about .05 percentage points in each year (in some years no change is evident due to rounding).6 Estimates of the percentage of large firms offering retiree benefits were reduced by a somewhat larger amount (about 2 percentage points). Historical estimates used in the 2011 survey report were updated following this same process. As noted above, worker-weighted estimates from prior years were not affected by the miscount and remained the same.
We continue to ask firms whether or not they offer a conventional health plan and, if so, how many of their covered workers are enrolled in that plan and whether it is self-funded or underwritten by an insurer. However, due to the declining market share of conventional health plans, in 2006 we stopped asking respondents additional questions about the attributes of the conventional plans they offer.7 As of 2009 our primary covered worker weight no longer includes those workers with conventional coverage. Therefore, premium and cost-sharing levels are estimated among workers covered by an HMO, PPO, POS plan, or HDHP/SO. Removing workers covered by conventional health insurance from the covered worker weight has little impact on the estimates reported for “All Plans,” such as the average single or family premium. In cases where a firm offers only conventional health plans, no information from that respondent is included in “All Plan” averages. The exception is for whether or not the plan is self-funded, for which we have information. For enrollment statistics, we weight the statistics by all covered workers, including those in conventional insurance.The survey contains a few questions on employee cost sharing that are asked only of firms that indicate in a previous question that they have a certain cost-sharing provision. For example, the copayment amount for prescription drugs is asked only of those that report they have copayments for prescription drugs. Because the composite variables (using data from across all plan types) are reflective of only those plans with the provision, separate weights for the relevant variables were created in order to account for the fact that not all covered workers have such provisions.
To account for design effects, the statistical computing package R and the library package “survey” were used to calculate standard errors.8, 9 All statistical tests are performed at the .05 level, unless otherwise noted. For figures with multiple years, statistical tests are conducted for each year against the previous year shown, unless otherwise noted. No statistical tests are conducted for years prior to 1999. In 2012 the method to test the difference between distributions across years was changed to use a Wald test which accounts for the complex survey design. In general this method was more conservative than the approach used in prior years. Exhibits such as 7.9, 7.10, 7.16 etc. are affected by the change.
Statistical tests for a given subgroup (firms with 25-49 workers, for instance) are tested against all other firm sizes not included in that subgroup (all firm sizes NOT including firms with 25-49 workers, in this example). Tests are done similarly for region and industry; for example, Northeast is compared to all firms NOT in the Northeast (an aggregate of firms in the Midwest, South, and West). However, statistical tests for estimates compared across plan types (for example, average premiums in PPOs) are tested against the “All Plans” estimate. In some cases, we also test plan-specific estimates against similar estimates for other plan types (for example, single and family premiums for HDHP/SOs against single and family premiums for HMO, PPO, and POS plans); these are noted specifically in the text. The two types of statistical tests performed are the t-test and the Wald test.
The small number of observations for some variables resulted in large variability around the point estimates. These observations sometimes carry large weights, primarily for small firms. The reader should be cautioned that these influential weights may result in large movements in point estimates from year to year; however, often these movements are not statistically significant.
Additional Notes on the 2012 Survey
In 2012, average coinsurance rates for prescription drugs, primary care office visits, specialty office visits, and emergency room visits include firms that have a minimum and/or maximum attached to the rate. In years prior to 2012 we did not ask firms the structure of their coinsurance rate. For most prescription drug tiers, and most services, the average coinsurance rate is not statically different depending on whether the plan has a minimum or maximum.
Historical Data
Data in this report focus primarily on findings from surveys jointly authored by the Kaiser Family Foundation and the Health Research & Educational Trust, which have been conducted since 1999. Prior to 1999, the survey was conducted by the Health Insurance Association of America (HIAA) and KPMG using a similar survey instrument, but data are not available for all the intervening years. Following the survey’s introduction in 1987, the HIAA conducted the survey through 1990, but some data are not available for analysis. KPMG conducted the survey from 1991-1998. However, in 1991, 1992, 1994, and 1997, only larger firms were sampled. In 1993, 1995, 1996, and 1998, KPMG interviewed both large and small firms. In 1998, KPMG divested itself of its Compensation and Benefits Practice, and part of that divestiture included donating the annual survey of health benefits to HRET.
This report uses historical data from the 1993, 1996, and 1998 KPMG Surveys of Employer-Sponsored Health Benefits and the 1999-2012 Kaiser/HRET Survey of Employer-Sponsored Health Benefits. For a longer-term perspective, we also use the 1988 survey of the nation’s employers conducted by the HIAA, on which the KPMG and Kaiser/HRET surveys are based. The survey designs for the three surveys are similar.
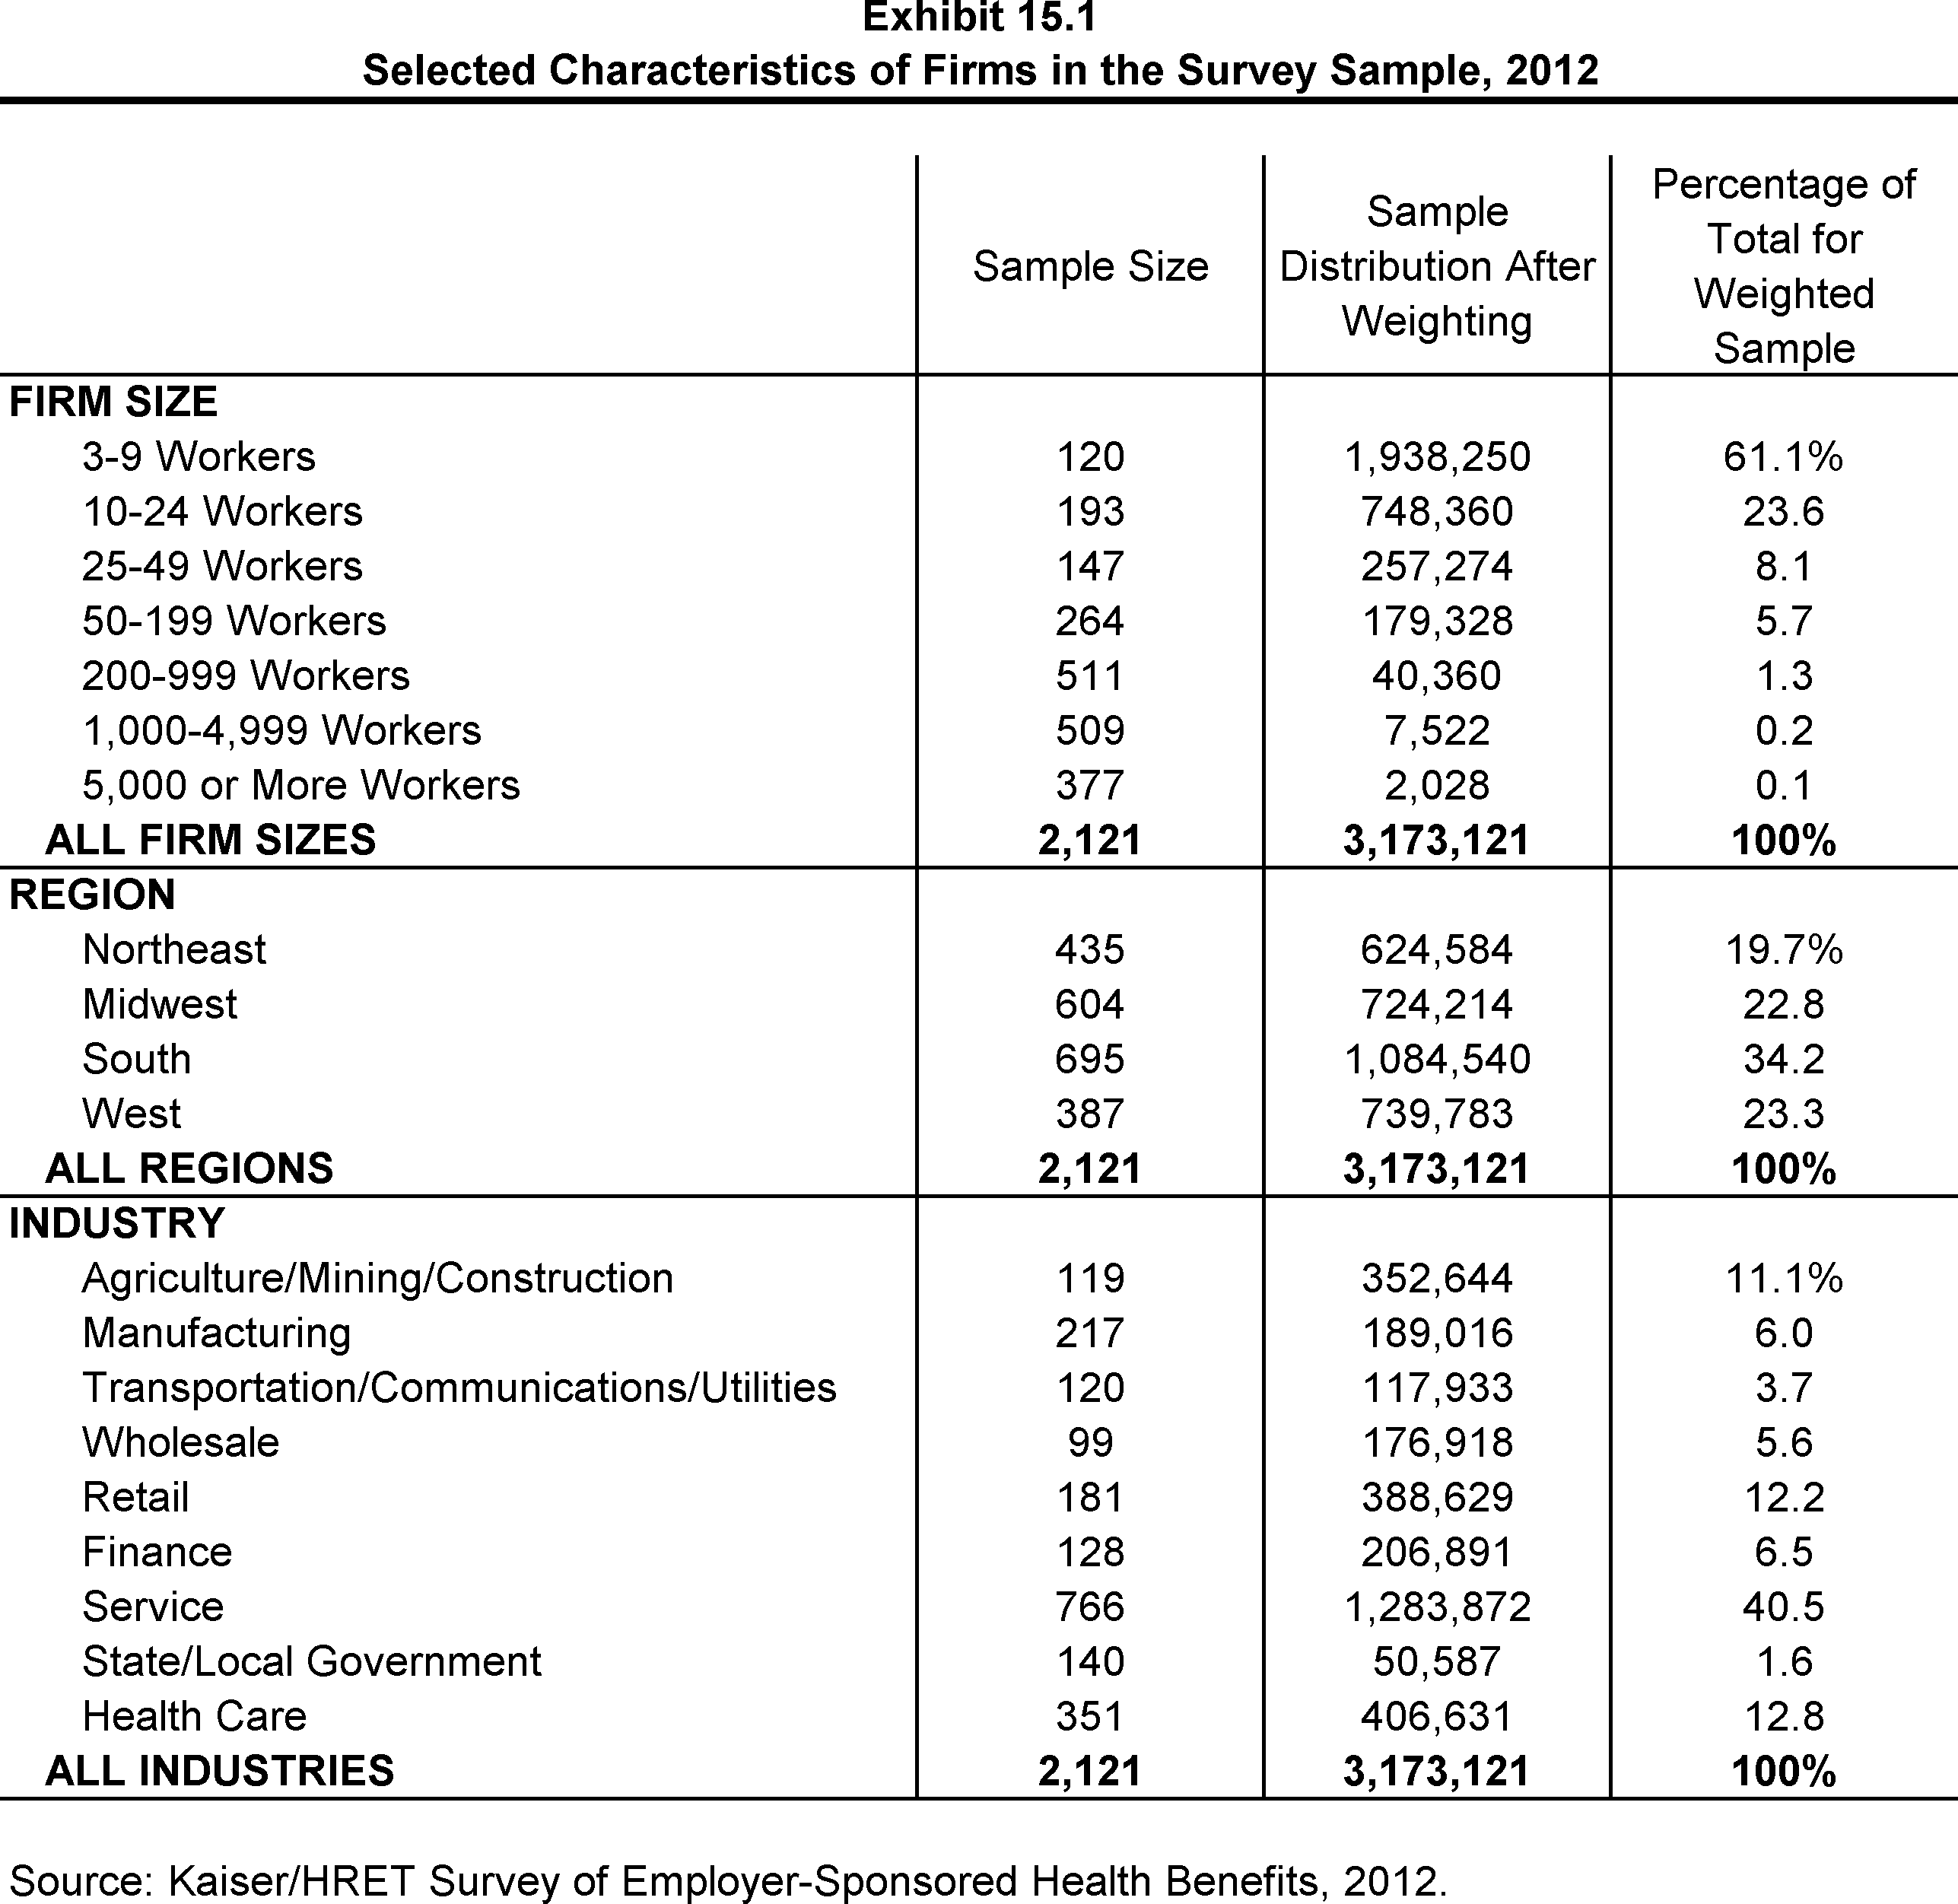
Selected Characteristics of Firms in the Survey Sample, 2012
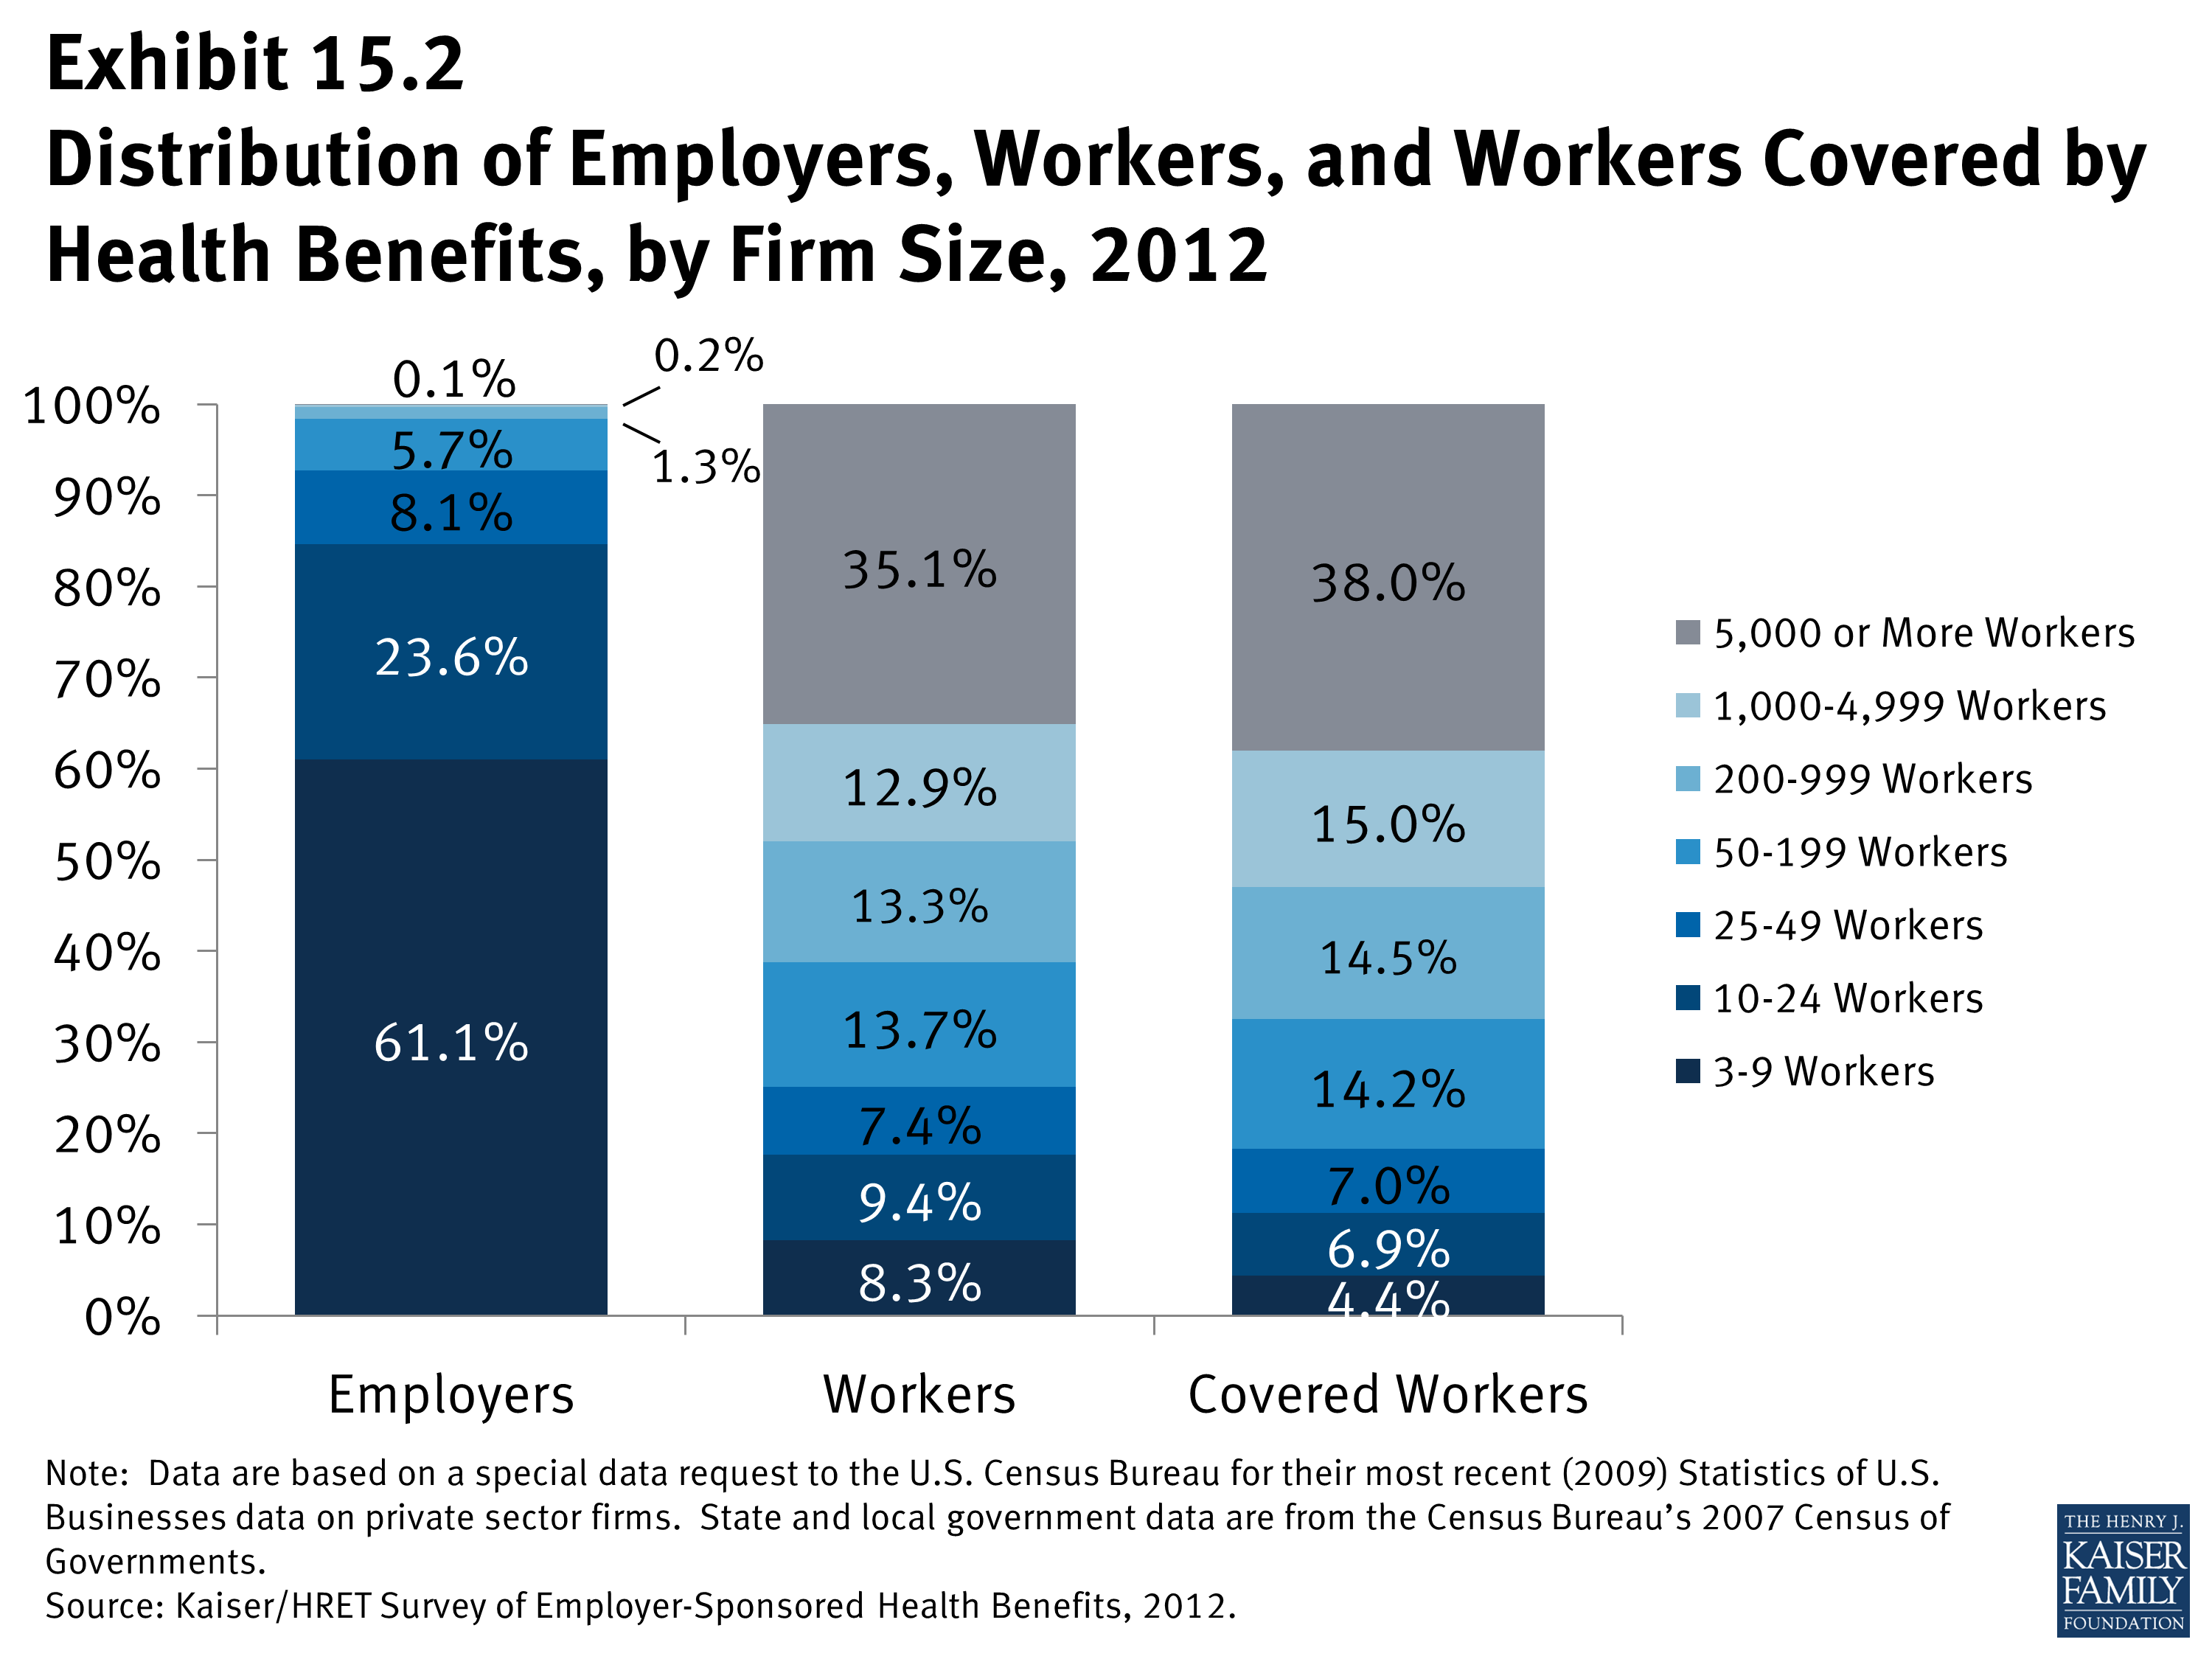
Distribution of Employers, Workers, and Workers Covered by Health Benefits, by Firm Size, 2012
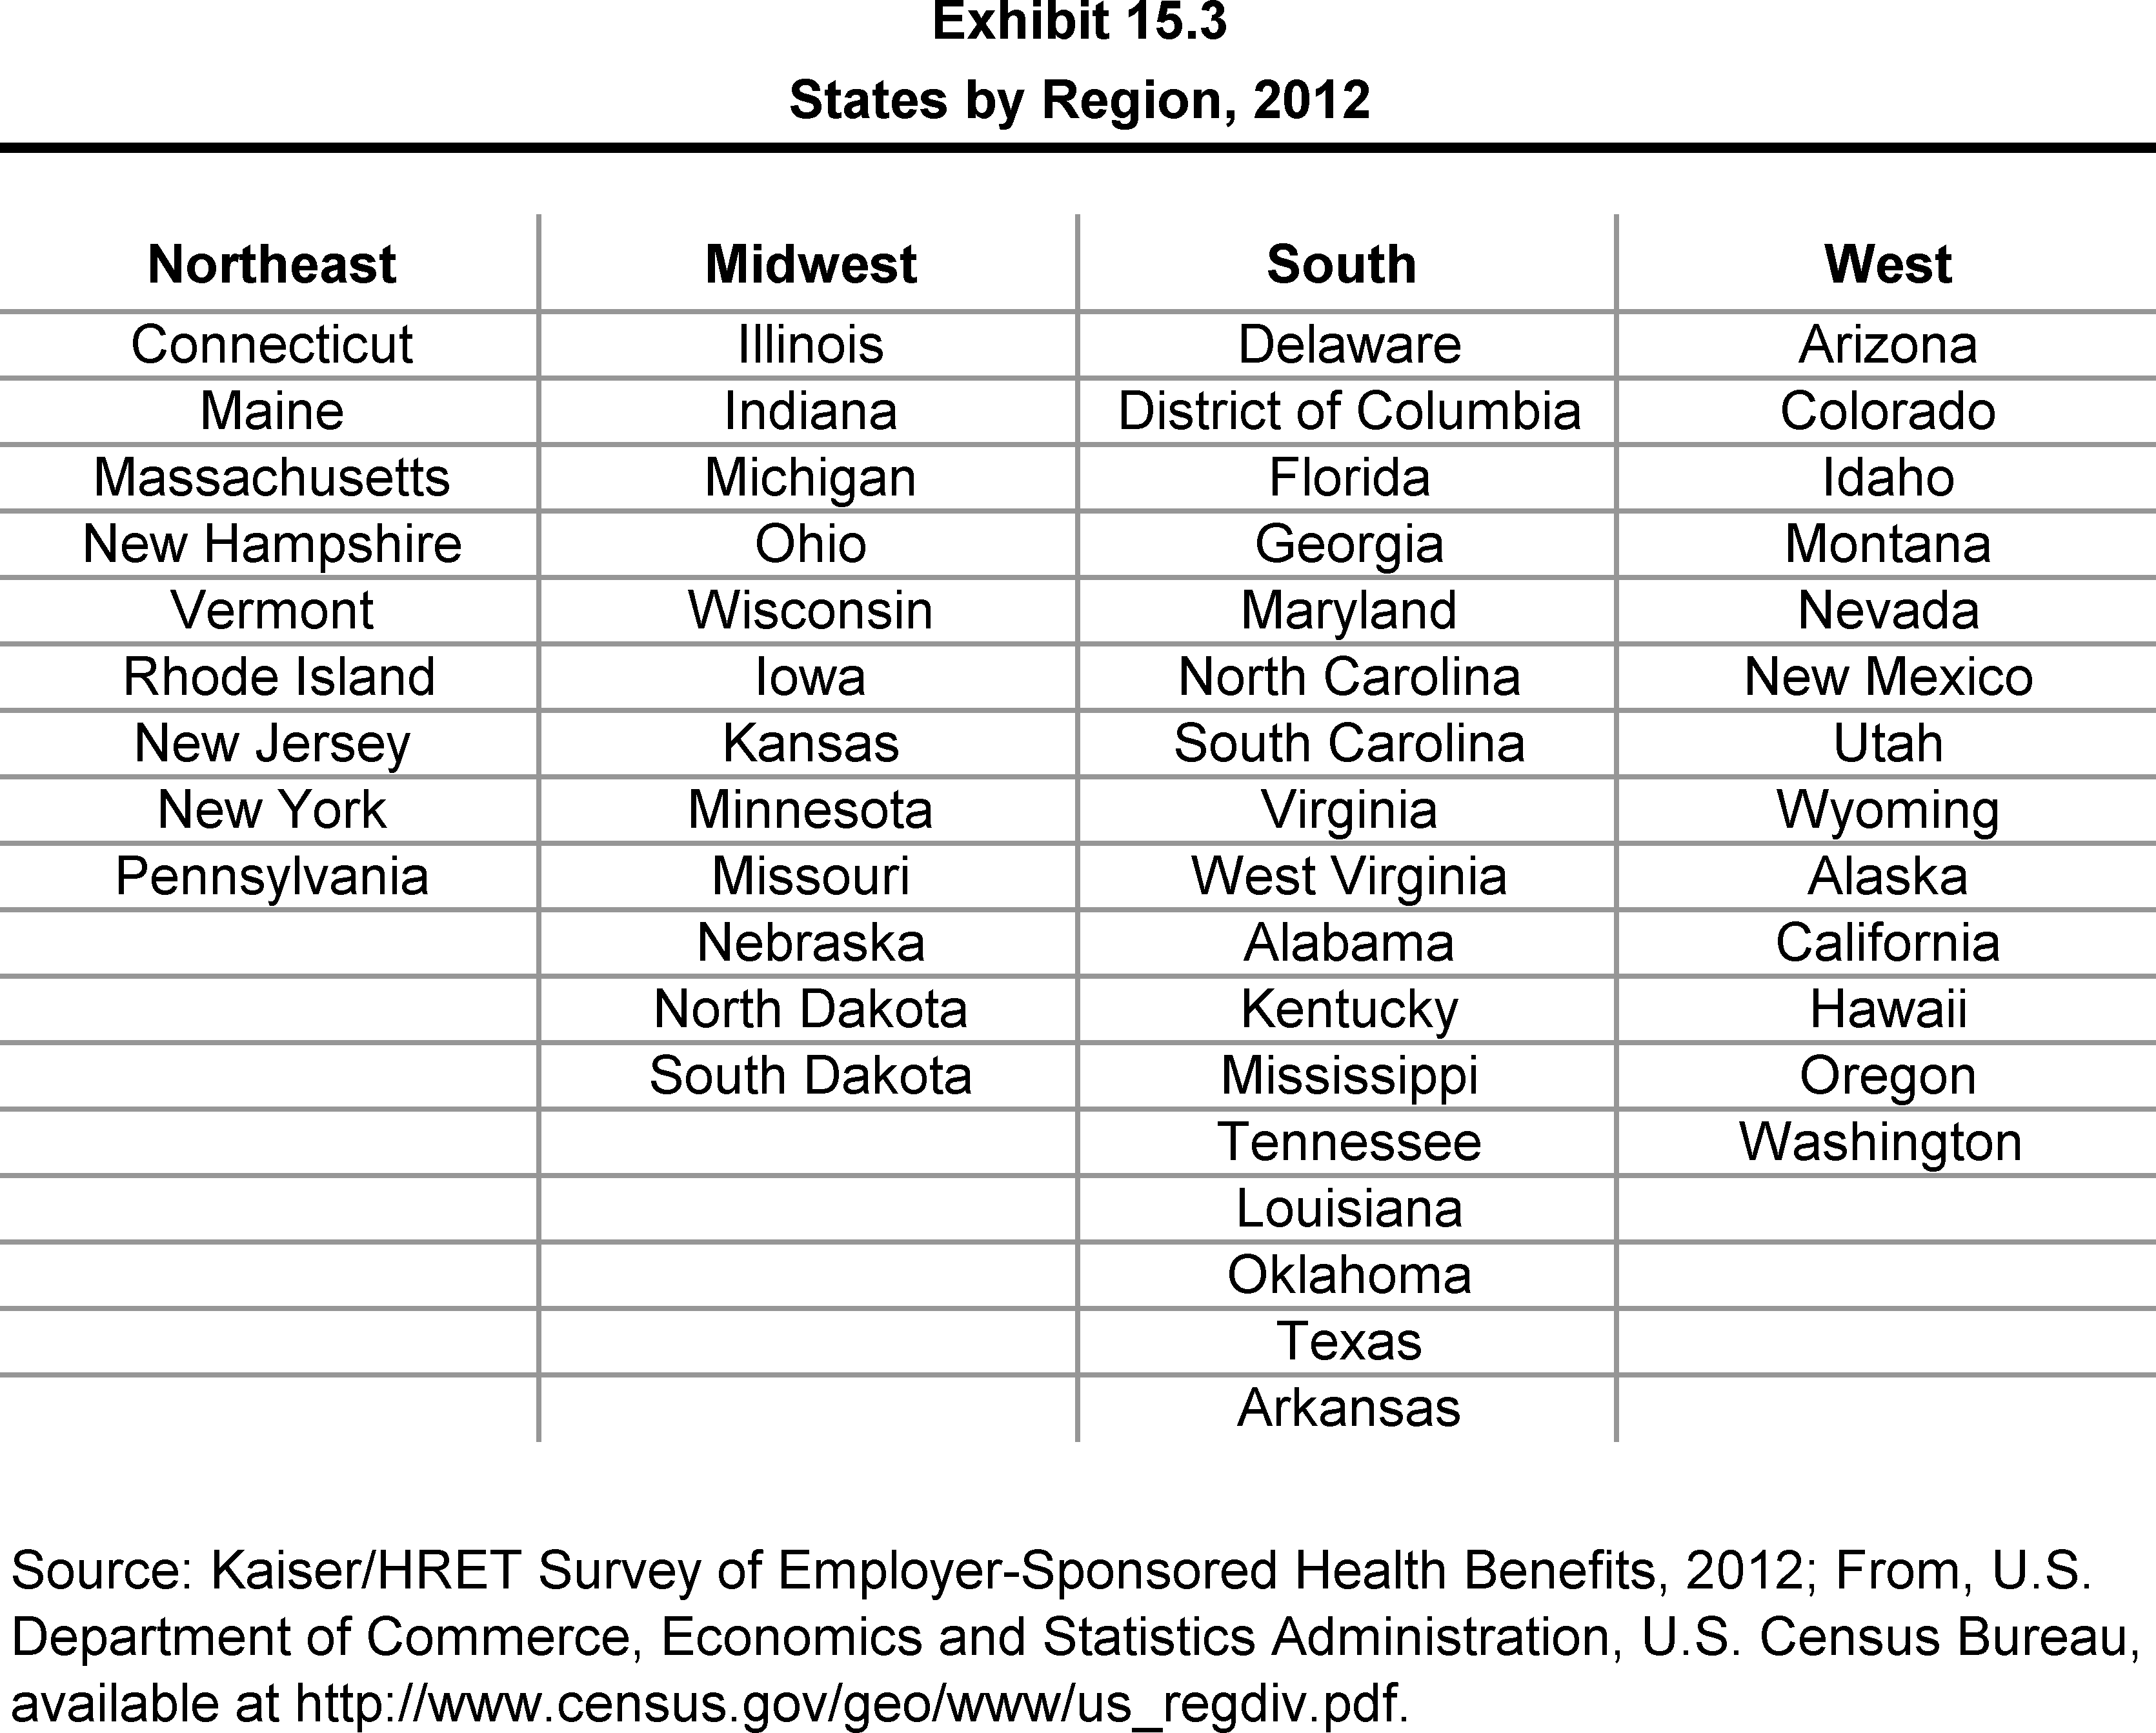
States by Region, 2012
Endnotes
Report
Section 2: Health Benefit Offer Rates
The large increase in 2010 was largely driven by a significant (12 percentage point) increase in offering among firms with 3 to 9 workers (from 47% in 2009 to 59% in 2010). This year, 50% of firms with 3 to 9 employees offer health benefits, a level that is more consistent with levels from recent years other than 2010.
Section 3: Employee Coverage, Eligibility, and Participation
Kaiser Family Foundation, Kaiser Commission on Medicaid and the Uninsured, The Uninsured: A Primer, October 2011. http://www.kff.org/uninsured/upload/7451-07.pdf. 56.2% of the non-elderly American population receives insurance coverage through an employer-sponsored plan.
In 2009, Kaiser/HRET began weighting the percentage of workers that take up coverage by the number of workers eligible for coverage. The historical take up estimates have also been updated. See the Survey Design and Methods section for more information.
Section 4: Types of Plans Offered
Starting in 2010 we included firms that said they offer a plan type even if there are no covered workers in that plan type.
Section 6: Worker and Employer Contributions for Premiums
Estimates for premiums, worker contributions to premiums, and employer contributions to premiums presented in Section 6 do not include contributions made by the employer to Health Savings Accounts or Health Reimbursement Arrangements. See Section 8 for estimates of employer contributions to HSAs and HRAs.
For definitions of Self-Funded and Fully Insured plans, see the introduction to Section 10.
Section 7: Employee Cost Sharing
Some workers with separate per-person deductibles or out-of-pocket maximums for family coverage do not have a specific number of family members that are required to meet the deductible amount and instead have another type of limit, such as a per person amount with a total dollar amount limit. These responses are included in the averages and distributions for separate family deductibles and out-of-pocket maximums.
Starting in 2010, the survey asked about the prevalence and cost of physician office visits separately for primary care and specialty care. Prior to the 2010 survey if the respondent indicated the plan had a copayment for office visits, we assumed the plan had a copayment for both primary and specialty care visits. The survey did not allow for a respondent to report that a plan had a copayment for primary care visits and coinsurance for visits with a specialist physician. The changes made in 2010 allow for variations in the type of cost sharing for primary care and specialty care. This year the survey includes cost sharing for in-network services only. See the 2007 survey for information on out-of-network office visit cost sharing.
The average copayments and the average coinsurance for emergency room visits include workers who may have a more than one type of cost sharing.
Section 8: High-Deductible Health Plans with Savings Option
There is no legal requirement for the minimum deductible in a plan offered with an HRA. The survey defines a high-deductible HRA plan as a plan with a deductible of at least $1,000 for single coverage and $2,000 for family coverage. Federal law requires a deductible of at least $1,200 for single coverage and $2,400 for family coverage for HSA-qualified HDHPs in 2012. See the Text Box for more information on HDHP/HRAs and HSA-qualified HDHPs.
The definitions of HDHP/SOs do not include other consumer-driven plan options, such as arrangements that combine an HRA with a lower-deductible health plan or arrangements in which an insurer (rather than the employer as in the case of HRAs or the enrollee as in the case of HSAs) establishes an account for each enrollee. Other arrangements may be included in future surveys as the market evolves.
See U.S. Department of the Treasury, Health Savings Accounts, available at http://www.treasury.gov/resource-center/faqs/Taxes/Pages/HSA-2012-indexed-amounts.aspx
The average out-of-pocket maximum for HDHP/HRAs is calculated for plans with an out-of-pocket maximum. About 10% of covered workers in HDHP/HRAs with single coverage or family coverage are in plans that reported having no limit on out-of-pocket expenses.
In the survey, we ask, “Up to what dollar amount does your firm promise to contribute each year to an employee’s HRA or health reimbursement arrangement for single coverage?” We refer to the amount that the employer commits to make available to an HRA as a contribution for ease of discussion. As discussed, HRAs are notional accounts, and employers are not required to actually transfer funds until an employee incurs expenses. Thus, employers may not expend the entire amount that they commit to make available to their employees through an HRA.
Section 10: Plan Funding
This includes stoploss insurance plans that limit a firm's per employee spending as well as plans that limit both a firm's overall spending and per employee spending.
The average attachment point in small firms (3 to 199 workers) is about $140,000, which is almost twice the amount reported last year for small firms. This value has a very high relative standard error (40%) because there are very few small employers that self-fund represented in the survey and one firm reported a very high value ($2,000,000). Including this firm increases the average by almost 100%.
Section 12: Wellness Programs and Health Risk Assessments
Respondents were given the option to report “other” types of wellness programs. If those firms that responded “other” are included, the percentage offering at least one wellness benefit is 64%. Two percent of firms indicating "other" said that they had an employee assistance program (EAP) and 5% said that they offered flu shots. In 2012, biometric screening was added to the list of wellness programs.
Firms that offer only web-based resources or a wellness newsletter were not asked questions about any financial incentives provided.
Financial incentives include: workers pay smaller percentage of the premium, workers have smaller deductibles, receive higher HRA or HSA contributions, or receive gift cards, travel merchandise, or cash.
Eight percent of firms reported “don’t know” when asked their primary reason for offering wellness programs.
In 2012, the percentage of firms was limited to firms who offer a high deductible plan with a savings option.
Twelve percent of firms responded "Don't Know" to whether they think offering wellness programs is effective in improving the health of employees. Thirteen percent said "Don't Know" to whether they think wellness programs are effective in reducing health care costs.se
The survey asks firms offering at least one wellness program if most of the wellness benefits are provided by the health plan or by the firm.
The estimate for small firms is not reported in the text because of the high standard error associated with this estimate. Although 19 percent of small firms that ask their employees to complete a health risk assessment reported that they offer a financial incentive, the relative standard error is 0.36, which indicates considerable uncertainty. The difference between large and small firms is statistically significant at the 0.05 confidence level.
The percentages of small and large firms offering financial rewards or penalties for completing wellness programs are not significantly different. The small firm estimates are not reported because of the high relative standard errors for the percent for firms which levy financial penalties for not completing wellness programs (0.56).
The percentages of small and large firms offering financial rewards or penalties for not meeting biometric outcomes are not significantly different. The small firm estimates are not reported because of the high relative standard errors for the percent for firms which levy financial penalties for not meeting biometric outcomes (0.68). Smoking cessation is not included as a biometric outcome within this question.
Section 13: Health Reform
Federal Register. Vol. 75, No. 116, June 17, 2010, http://www.gpo.gov/fdsys/pkg/FR-2010-06-17/pdf/2010-14614.pdf, and No. 221, Nov. 17, 2010, http://edocket.access.gpo.gov/2010/pdf/2010-28861.pdf.
United States. Congressional Research Service CRS. Open CRS. By Bernadette Fernandez. Grandfathered Health Plans Under the Patient Protection and Affordable Care Act (PPACA), Jan. 3, 2011. http://assets.opencrs.com/rpts/R41166_20110103.pdf.
Federal Register. Vol. 75, No. 92, May 13, 2010, http://www.gpo.gov/fdsys/pkg/FR-2010-05-13/pdf/2010-11391.pdf.
In 2011 firms that did not know if they enrolled adult children due to the Affordable Care Act (ACA) were not imputed. If a similar approach had been followed in 2012, an estimated 2.8 million children would have enrolled on a parent's health plan due to the Affordable Care Act. Using either approach the 2012 estimate is a significant increase over 2011. In 2012 5% of firms offering family coverage did not know whether they enrolled adult dependents due to the ACA, more than the 1% who did not know in 2011.
Methodology
Survey Design and Methods
HDHP/SO includes high-deductible health plans offered with either a Health Reimbursement Arrangement (HRA) or a Health Savings Account (HSA). Although HRAs can be offered along with a health plan that is not an HDHP, the survey collected information only on HRAs that are offered along with HDHPs. For specific definitions of HDHPs, HRAs, and HSAs, see the introduction to Section 8.
HDHP/SO premium estimates do not include contributions made by the employer to Health Savings Accounts or Health Reimbursement Arrangements.
In total, 166 firms participated in 2010 and 2012, 323 firms participated in 2011 and 2012, and 1,090 firms participated in 2010, 2011, and 2012.
Response rate estimates are calculated by dividing the number of completes over the number of refusals and the fraction of the firms with unknown eligibility to participate estimated to be eligible. Firms determined to be ineligible to complete the survey are not included in the response rate calculation.
Estimates presented in Exhibits 2.1, 2.2 and 2.3 are based on the sample of both firms that completed the entire survey and those that answered just one question about whether they offer health benefits.
Comparisons of estimates before and after this change are available at "Supplement on Updated Weighting Methodology," http://www.kff.org/insurance/8225.cfm.
In 2012, less than one percent of covered workers are enrolled in a conventional plan.
Analysis of the 2011 survey data using both R and SUDAAN (the statistical package used prior to 2012) produced the same estimates and standard errors. Research Triangle Institute (2008). SUDAAN Software for the Statistical Analysis of Correlated Data, Release 10.0, Research Triangle Park, NC: Research Triangle Institute.
A supplement with standard errors for select estimates can be found online at Technical Supplement: Standard Error Tables for Selected Estimates, http://www.kff.org/insurance/8345.cfm.