A Comparison of the Availability and Cost of Coverage for Workers in Small Firms and Large Firms: Update from the 2015 Employer Health Benefits Survey
Small and large firms vary substantially on health insurance offer rates and costs. Small firms are less likely to offer coverage, and there are important differences in the health benefits that they do offer. Workers at small firms are responsible for paying both a larger share of family premiums as well as higher cost sharing than workers in large firms. Small and large firms also face different regulatory requirements; for instance, small firms face different rules about ratings and benefits than larger firms, while firms with 50 or more full-time equivalents (FTEs) must offer affordable coverage or face a penalty. This brief expands on information presented in the 2015 Kaiser/HRET Survey of Employer-Sponsored Health Benefits to look exclusively at differences in offer rates, plan costs, and cost sharing between small firms and large firms.
We define “small firms” as employers with 3 to 199 workers and “large firms” as employers with 200 or more workers. While the vast majority of businesses in the United States are small businesses, the majority of workers are employed at large firms. Of the over three million firms with 3 or more workers, 98% have between 3 and 199 employees.1 Small firms employ 38% of all workers and 30% of workers who receive health insurance through their own job. Information on the survey’s methodology can be found in the 2015 Kaiser/HRET Employer Health Benefits Survey full report.2
Health Insurance Offer and Coverage Rates
Small firms are much less likely to offer health insurance than large firms (Figure 1). Of firms with 3 to 199 employees, 56% offer health insurance to at least some of their employees; a stark contrast to the 98% of firms with 200 or more employees who do so. Very small firms (3-9 workers) are least likely to offer health insurance to employees, with only 47% of these firms offering coverage in 2015. Since most firms in the country are small, the overall offer rate is determined primarily by the percentage of the smallest firms (3-9 workers) offering health benefits.
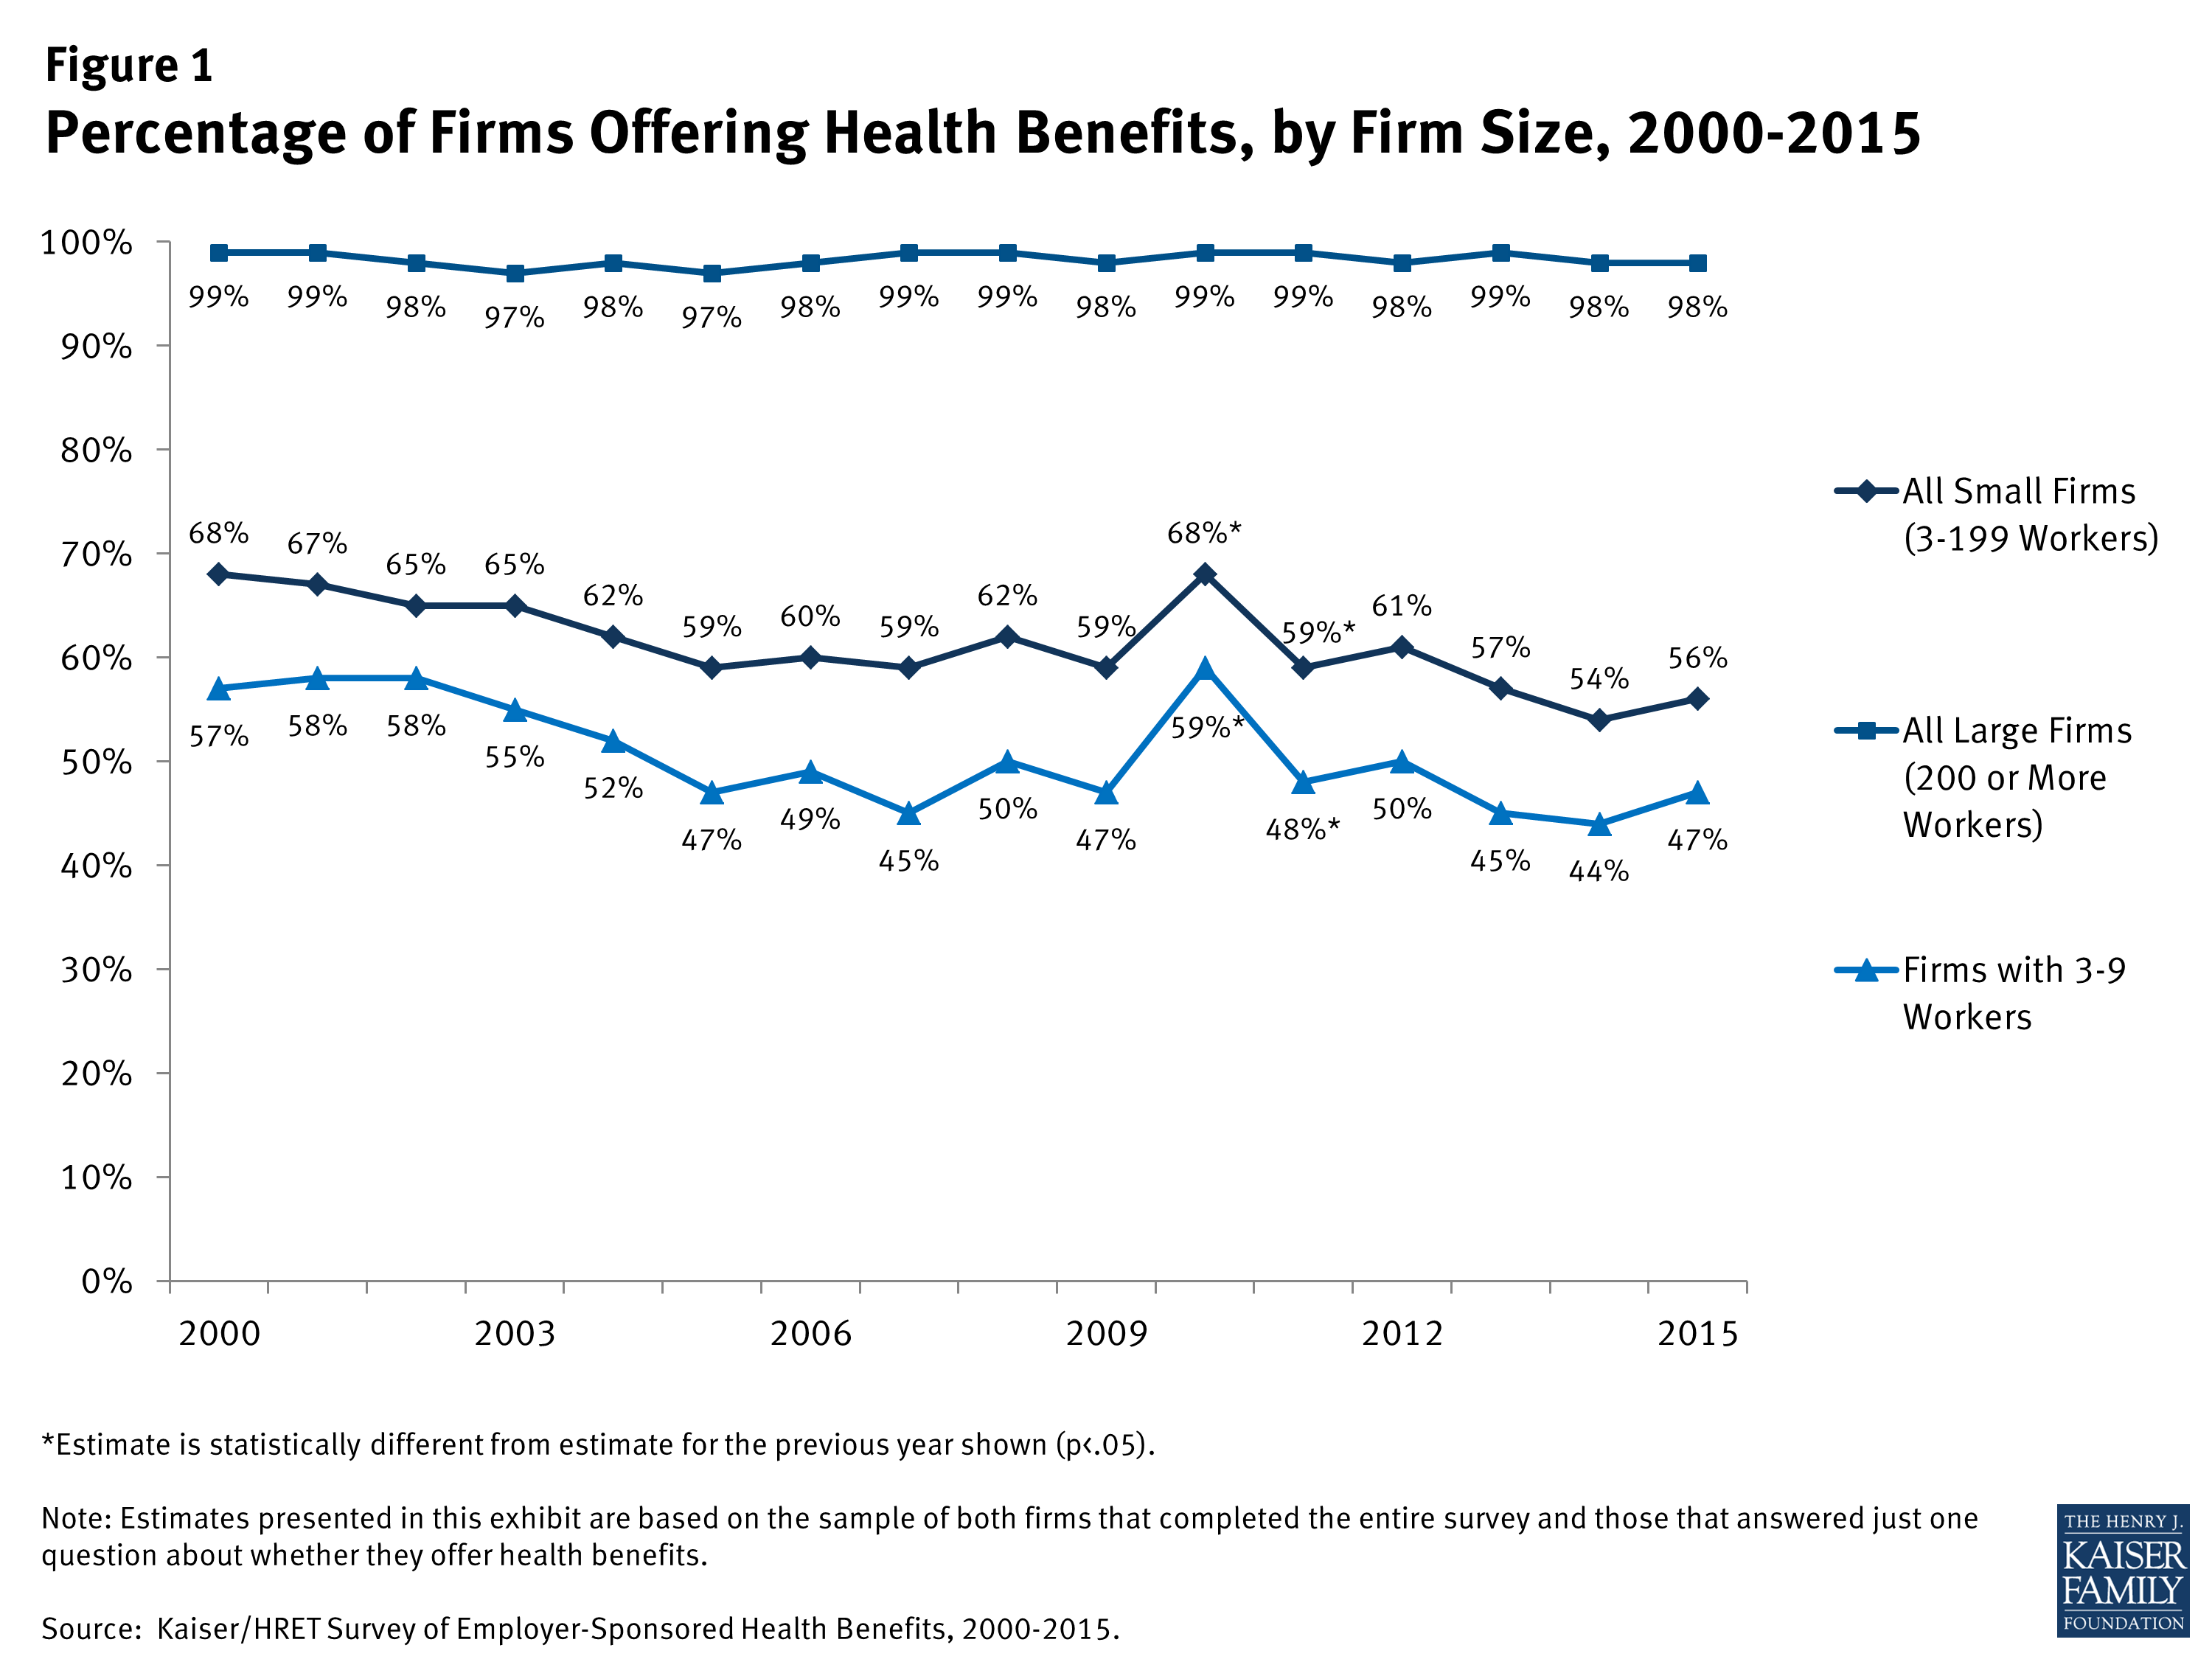
Figure 1: Percentage of Firms Offering Health Benefits, by Firm Size, 2000-2015
Small firms may not offer coverage for a variety of reasons, including the inability to afford premiums, employees obtaining coverage elsewhere, or the firm may feel that the benefit does not impact their ability to recruit and retain qualified employees.3 In 2015, 41% of small firms not offering coverage indicated that the cost of health insurance was the primary reason that they did not offer coverage.4 With new options available on the federal health insurance exchanges, some small firms may decide that their employees will get a better deal on the health insurance exchanges.
In addition to the percentage of firms that offer benefits, an important component of coverage is the percentage of workers at offering firms that are covered (Figure 2). Because some workers are not eligible or choose not to accept the coverage, a portion of workers at firms that offer health benefits are not covered by health benefits. While the percentage of covered workers at firms offering benefits is similar between small and large firms (61% and 63%, respectively), the lower offer rate at small firms means a smaller percentage of workers are covered at both offering and non-offering firms. Forty-five percent of workers at both offering and non-offering firms are covered by health benefits at small firms compared to 63% at large firms.
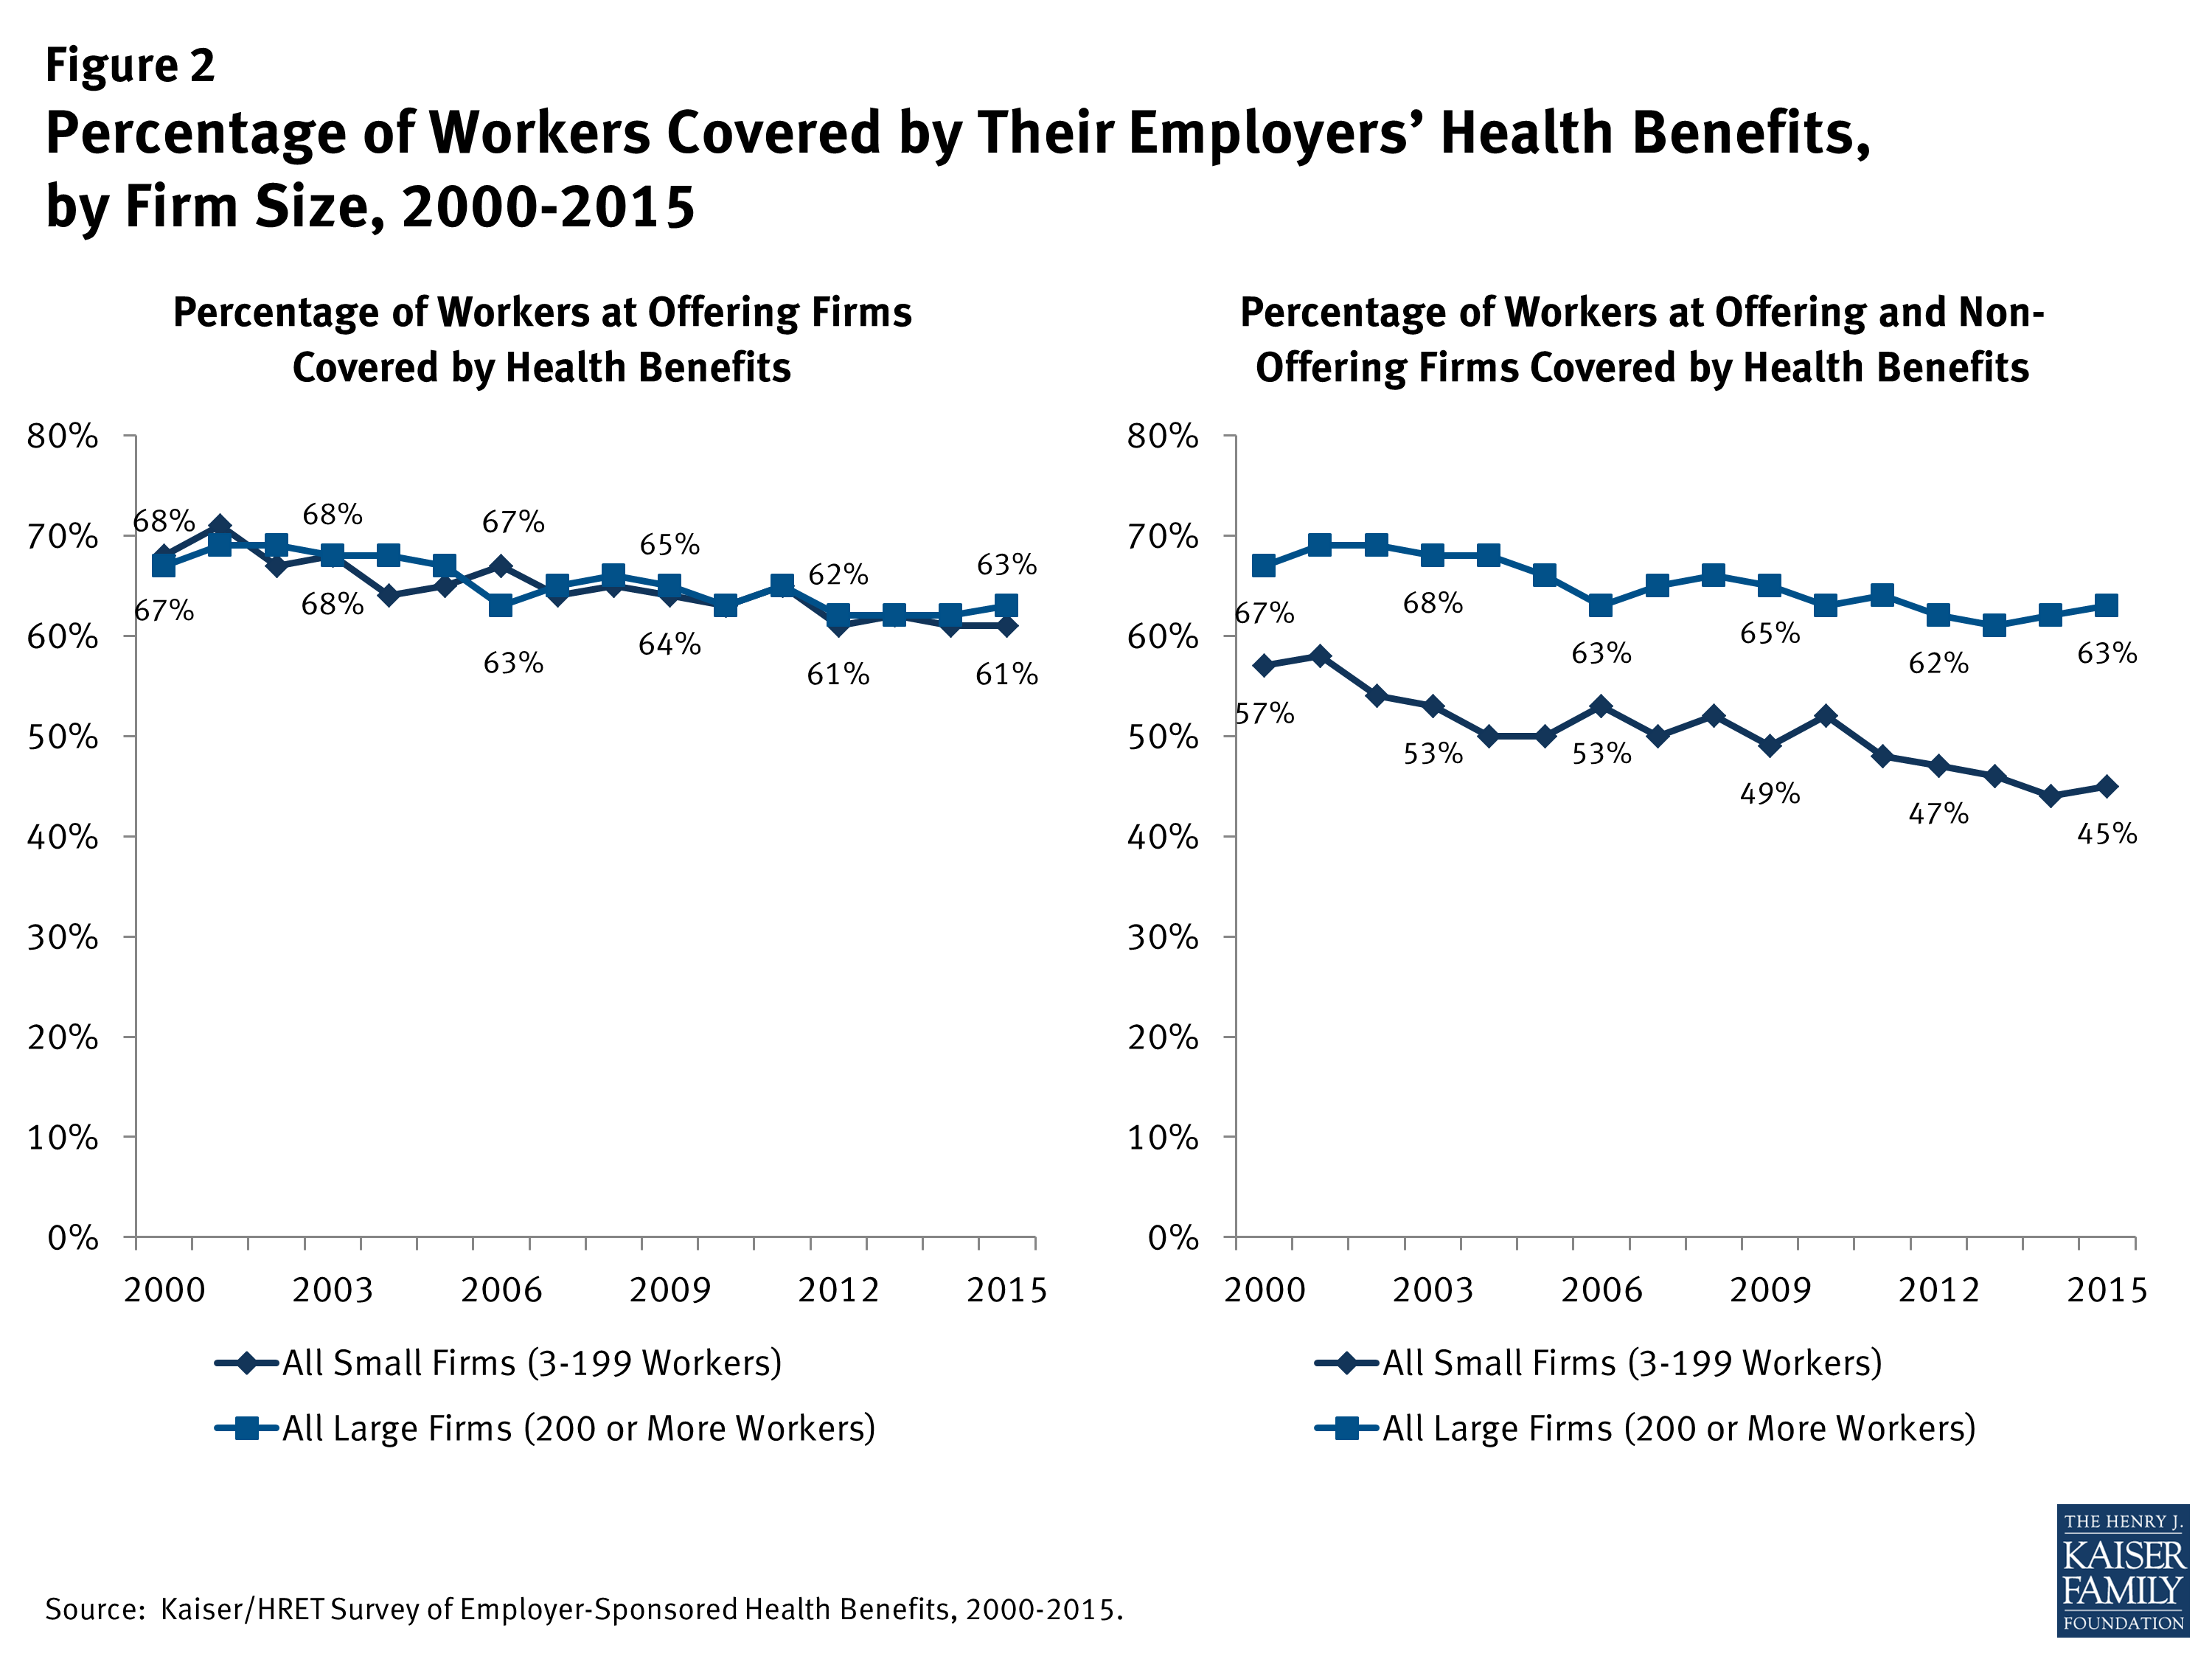
Figure 2: Percentage of Workers Covered by Their Employers’ Health Benefits, by Firm Size, 2000-2015
In addition to lower offer rates, small firms are also less likely to offer health benefits to part-time workers than are large firms (18% vs. 35%).5 A similar pattern exists for temporary workers (3% in small firms vs. 11% in large firms).6
For covered workers who are offered coverage, some employers impose a waiting period before the employee may enroll (Figure 3). Waiting periods are a specified length of time after beginning employment before employees are eligible to enroll in health benefits. With some exceptions, the Affordable Care Act (ACA) requires that waiting periods cannot exceed 90 days.7 However, there is variability in waiting periods depending on the firm size. Covered workers in small firms are more likely than those in large firms to have a waiting period (81% vs. 71%). Among those covered workers who have a waiting period, the average waiting period is longer for workers in small firms than large firms (2.2 months vs. 1.8 months).

Figure 3: Percentage of Covered Workers in Firms with a Waiting Period for Coverage and Average Waiting Period in Months, by Firm Size, 2015
Premiums
Workers in small firms have lower average premiums for family coverage than workers in large firms ($16,625 vs. $17,938 annually) (Figure 4).8 Average premiums for single coverage are not statistically different for workers in small firms compared to workers in large firms. Given that health insurance provided to small firms has higher administrative and marketing costs than health insurance provided to large firms, the lower average premium for family coverage at small firms suggests that health insurance benefits are probably less generous on average in small firms.
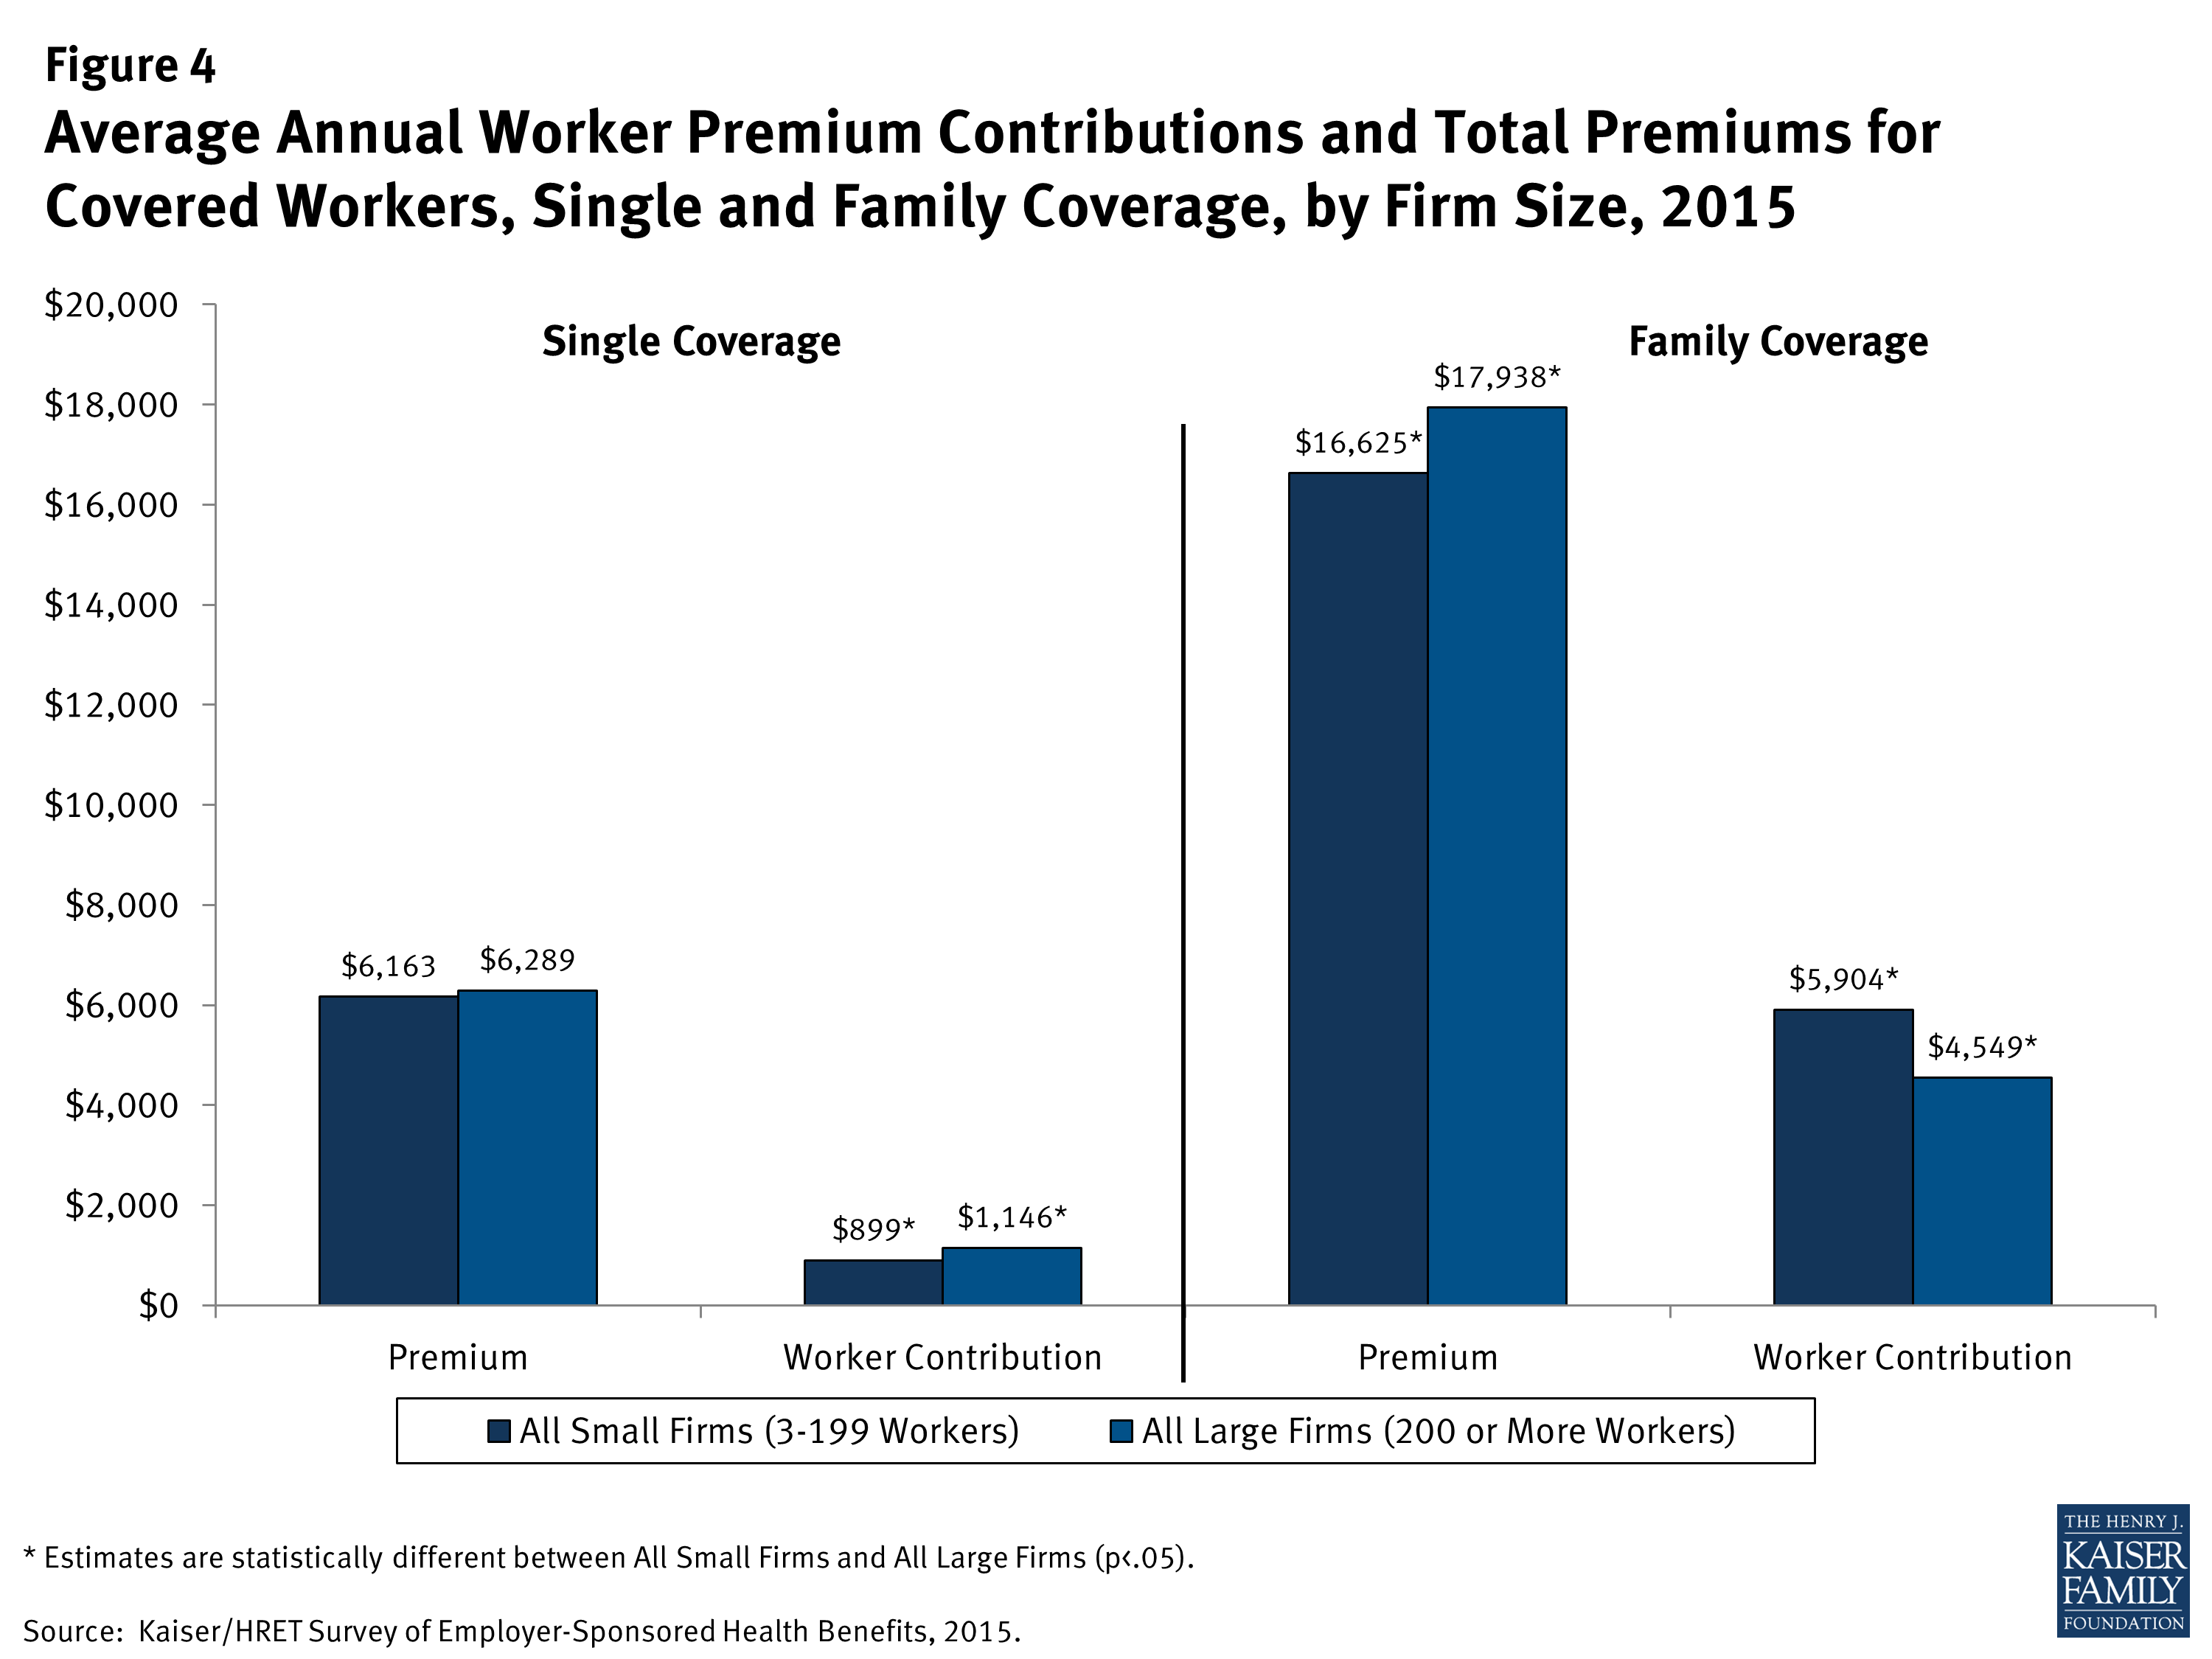
Figure 4: Average Annual Worker Premium Contributions and Total Premiums for Covered Workers, Single and Family Coverage, by Firm Size, 2015
Differences in average premiums between small and large firms vary by geographic region (Figure 5). In the West, average premiums for both single and family coverage are lower for workers in small firms than for workers in large firms. Premium differences in other regions are not statistically significant.
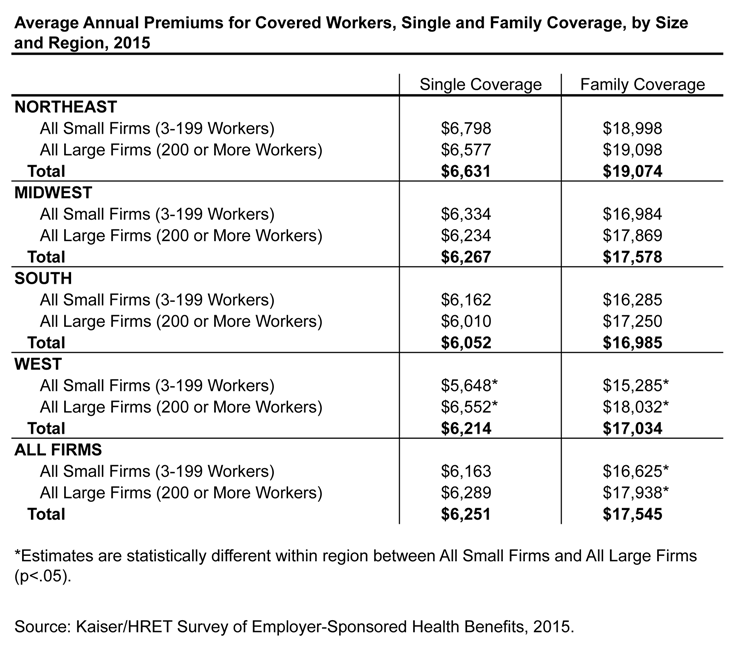
Figure 5: Average Annual Premiums for Covered Workers, Single and Family Coverage, by Size and Region, 2015
While, on average, small firms have lower family premiums than large firms, the rate of growth has been stable since 2010 (Figure 6). Since 2000, family premiums have increased 155% for small firms, less than the increase of 180% for large firms. Since 2010, average family premiums have grown 25% for small firms, similar to the 28% growth for large firms.
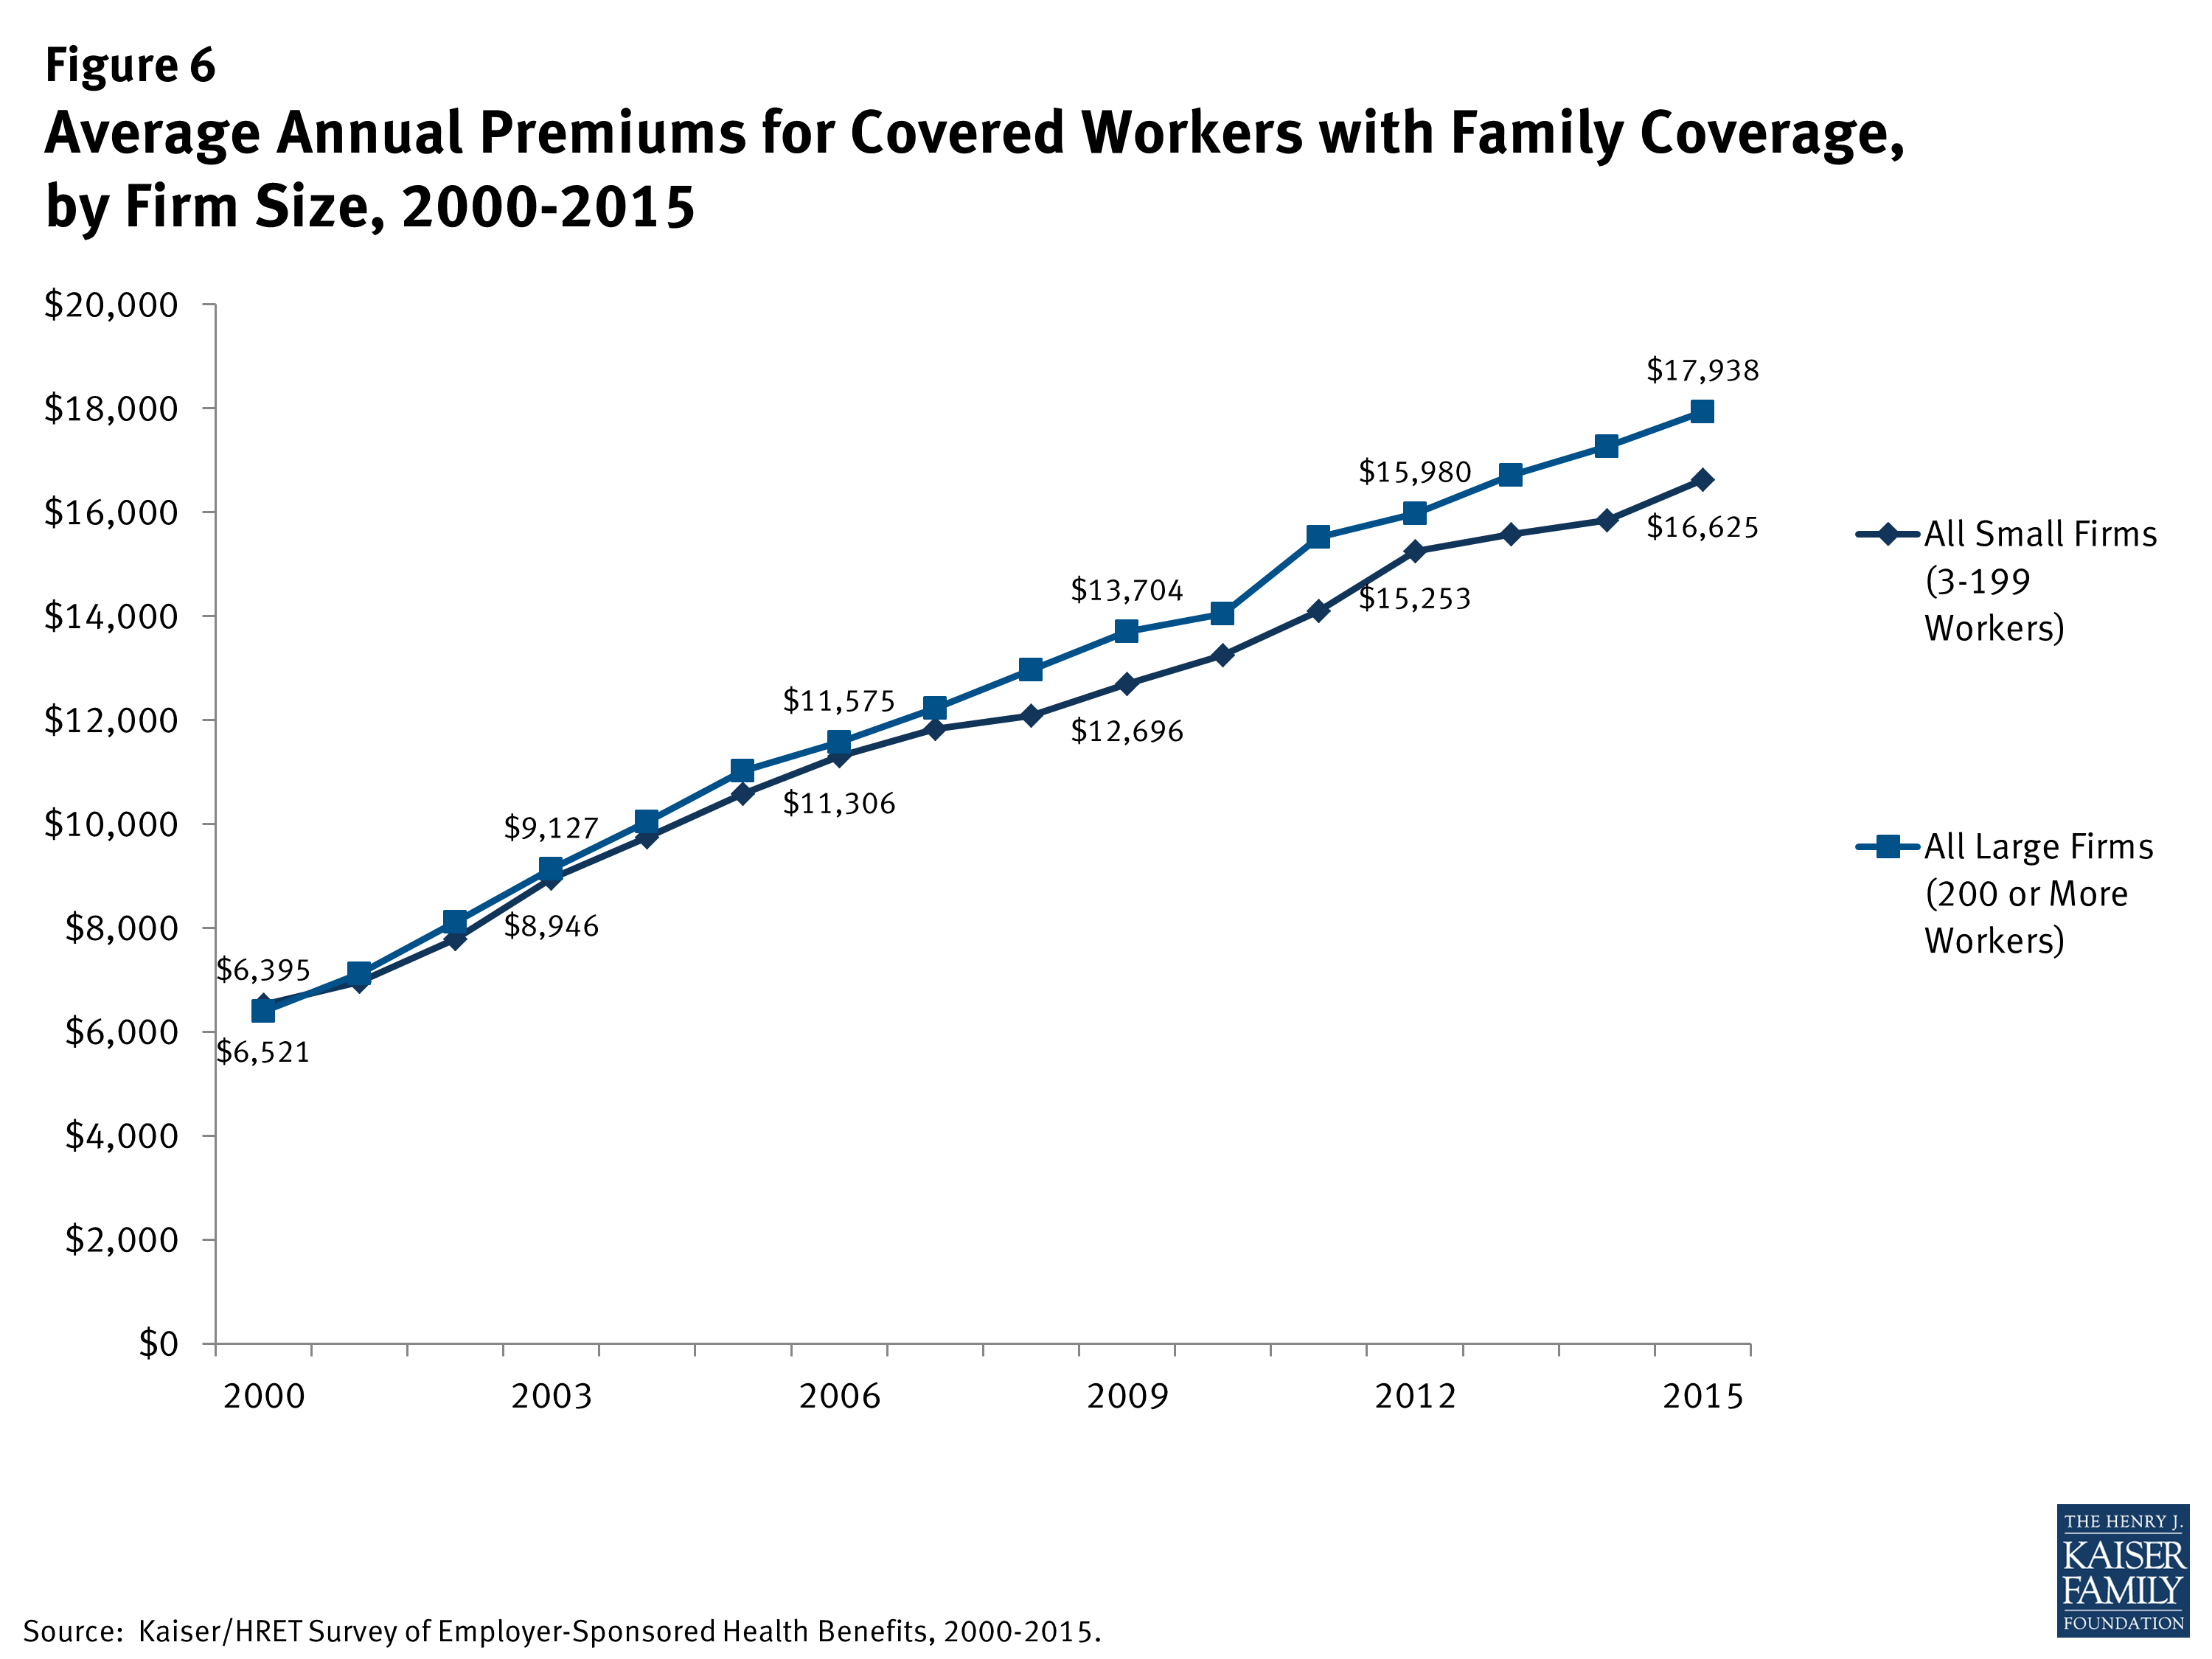
Figure 6: Average Annual Premiums for Covered Workers with Family Coverage, by Firm Size, 2000-2015
The distribution of premiums is different for small and large firms (Figure 7). Compared to covered workers in large firms, covered workers in small firms are much more likely to be employed by firms whose premium for single coverage is less than 80% of the average (33% vs. 17%).
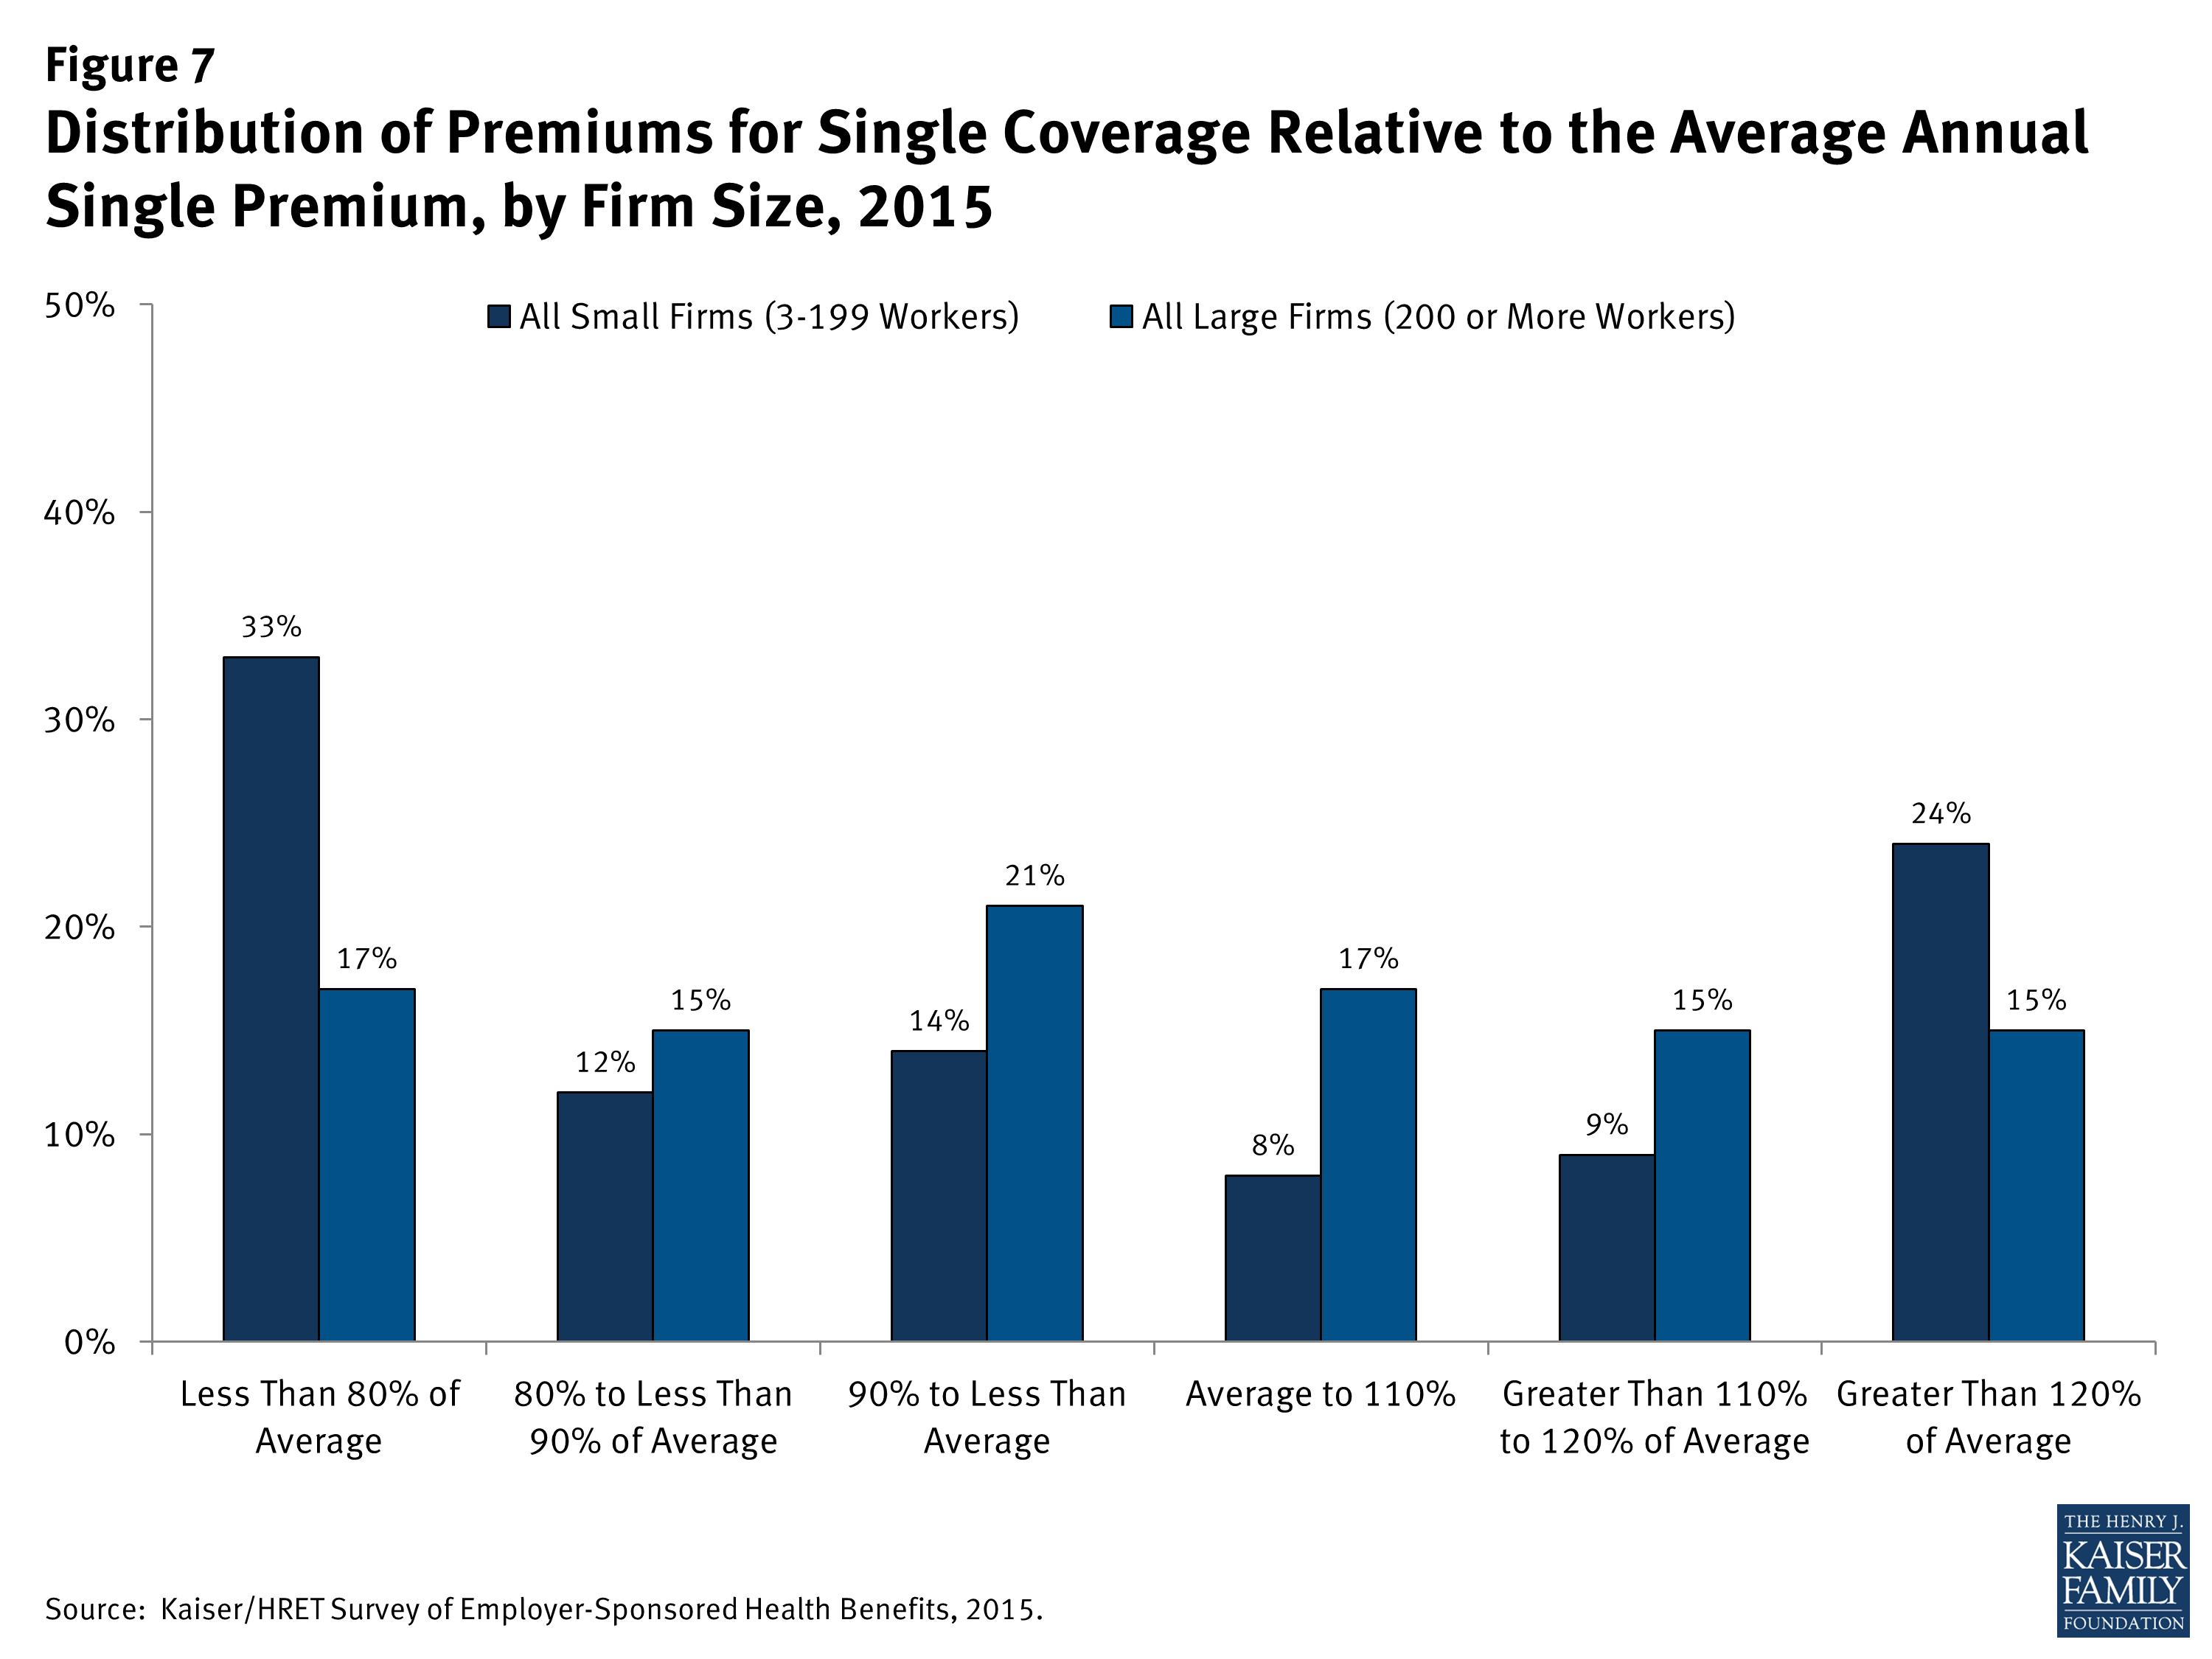
Figure 7: Distribution of Premiums for Single Coverage Relative to the Average Annual Single Premium, by Firm Size, 2015
Similar to single coverage, covered workers enrolled in family coverage at small firms are more likely to have a premium farther from the average (Figure 8). Workers in small firms with family coverage are more likely to have a total premium of less than 80% of the average family premium (30% vs. 18%).
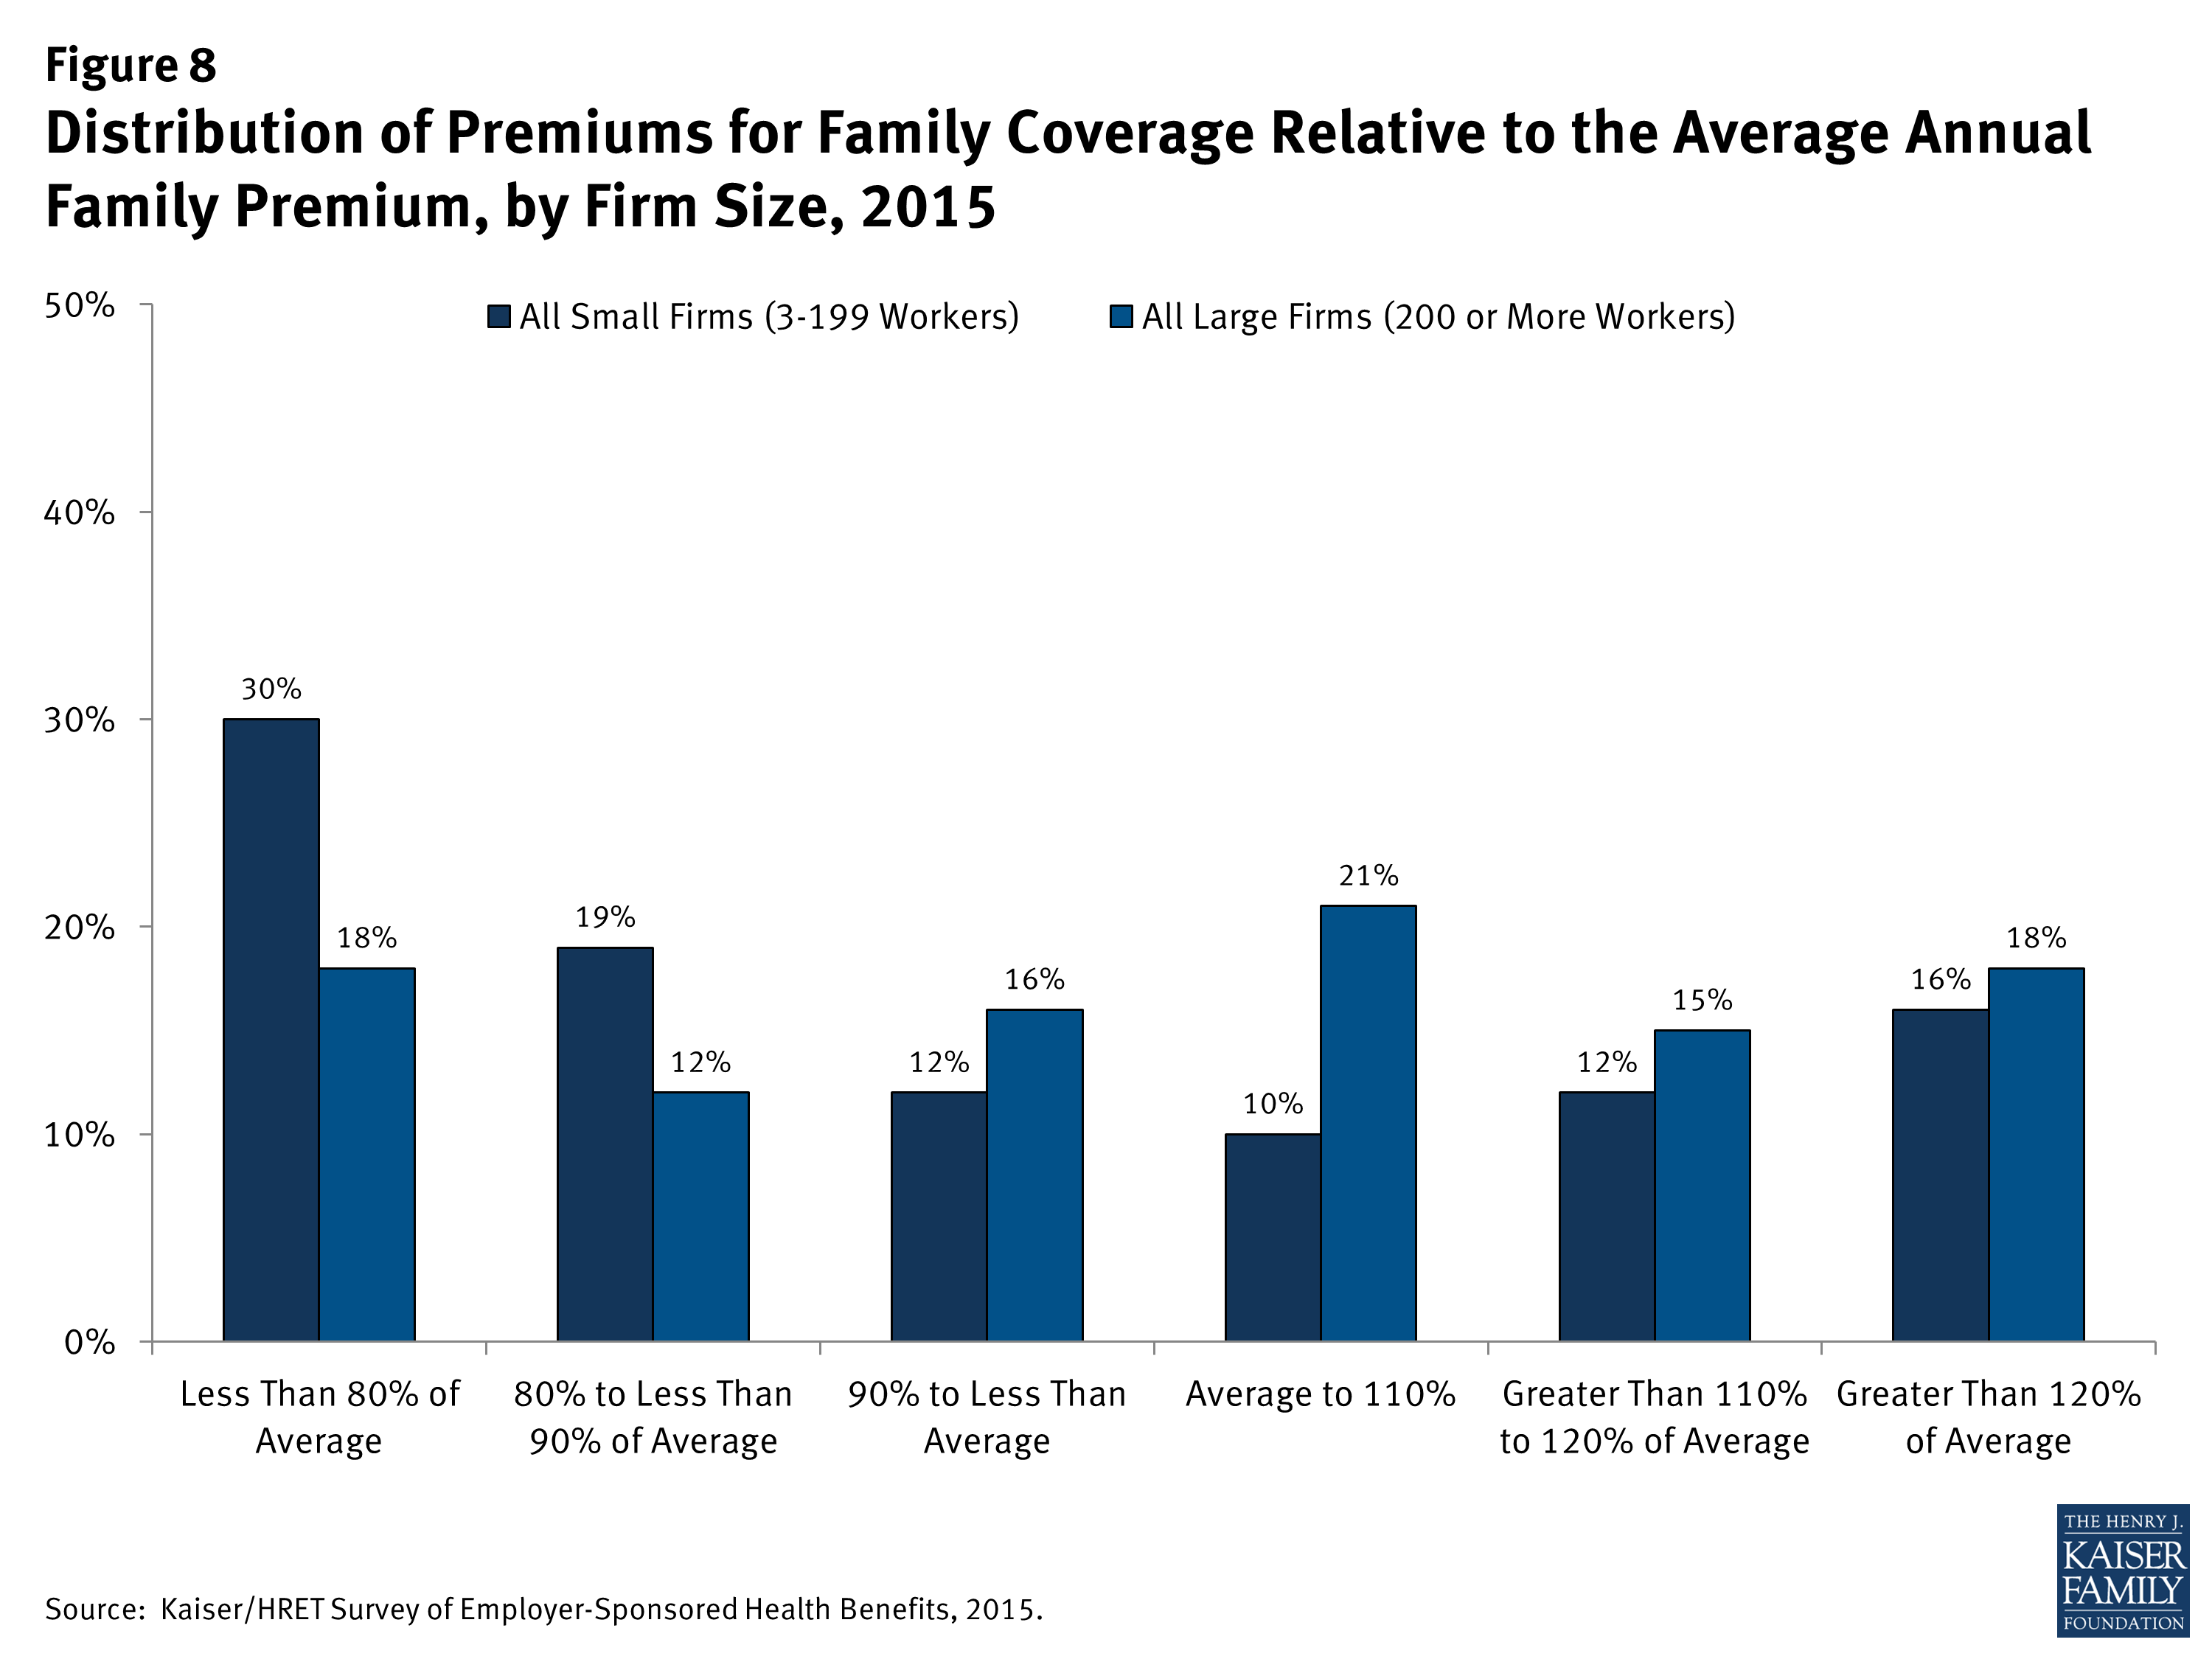
Figure 8: Distribution of Premiums for Family Coverage Relative to the Average Annual Family Premium, by Firm Size, 2015
Worker Contributions to Premiums
There are significant differences in the amount that employees contribute to premiums at small and large firms (Figure 9). Workers in small firms with single coverage contribute less to their premiums than workers in large firms ($899 vs. $1,146). However, workers in small firms contribute 30% more for family coverage than workers in large firms ($5,904 vs. $4,549). Even though workers at small firms enrolled in family coverage are covered by a plan with less expensive premiums than those at large firms ($16,625 vs. $17,983), they are responsible for a larger premium contribution than workers at large firms. On average, workers employed at small firms pay 36% of their family premium, significantly more than the 25% that workers pay at large firms.
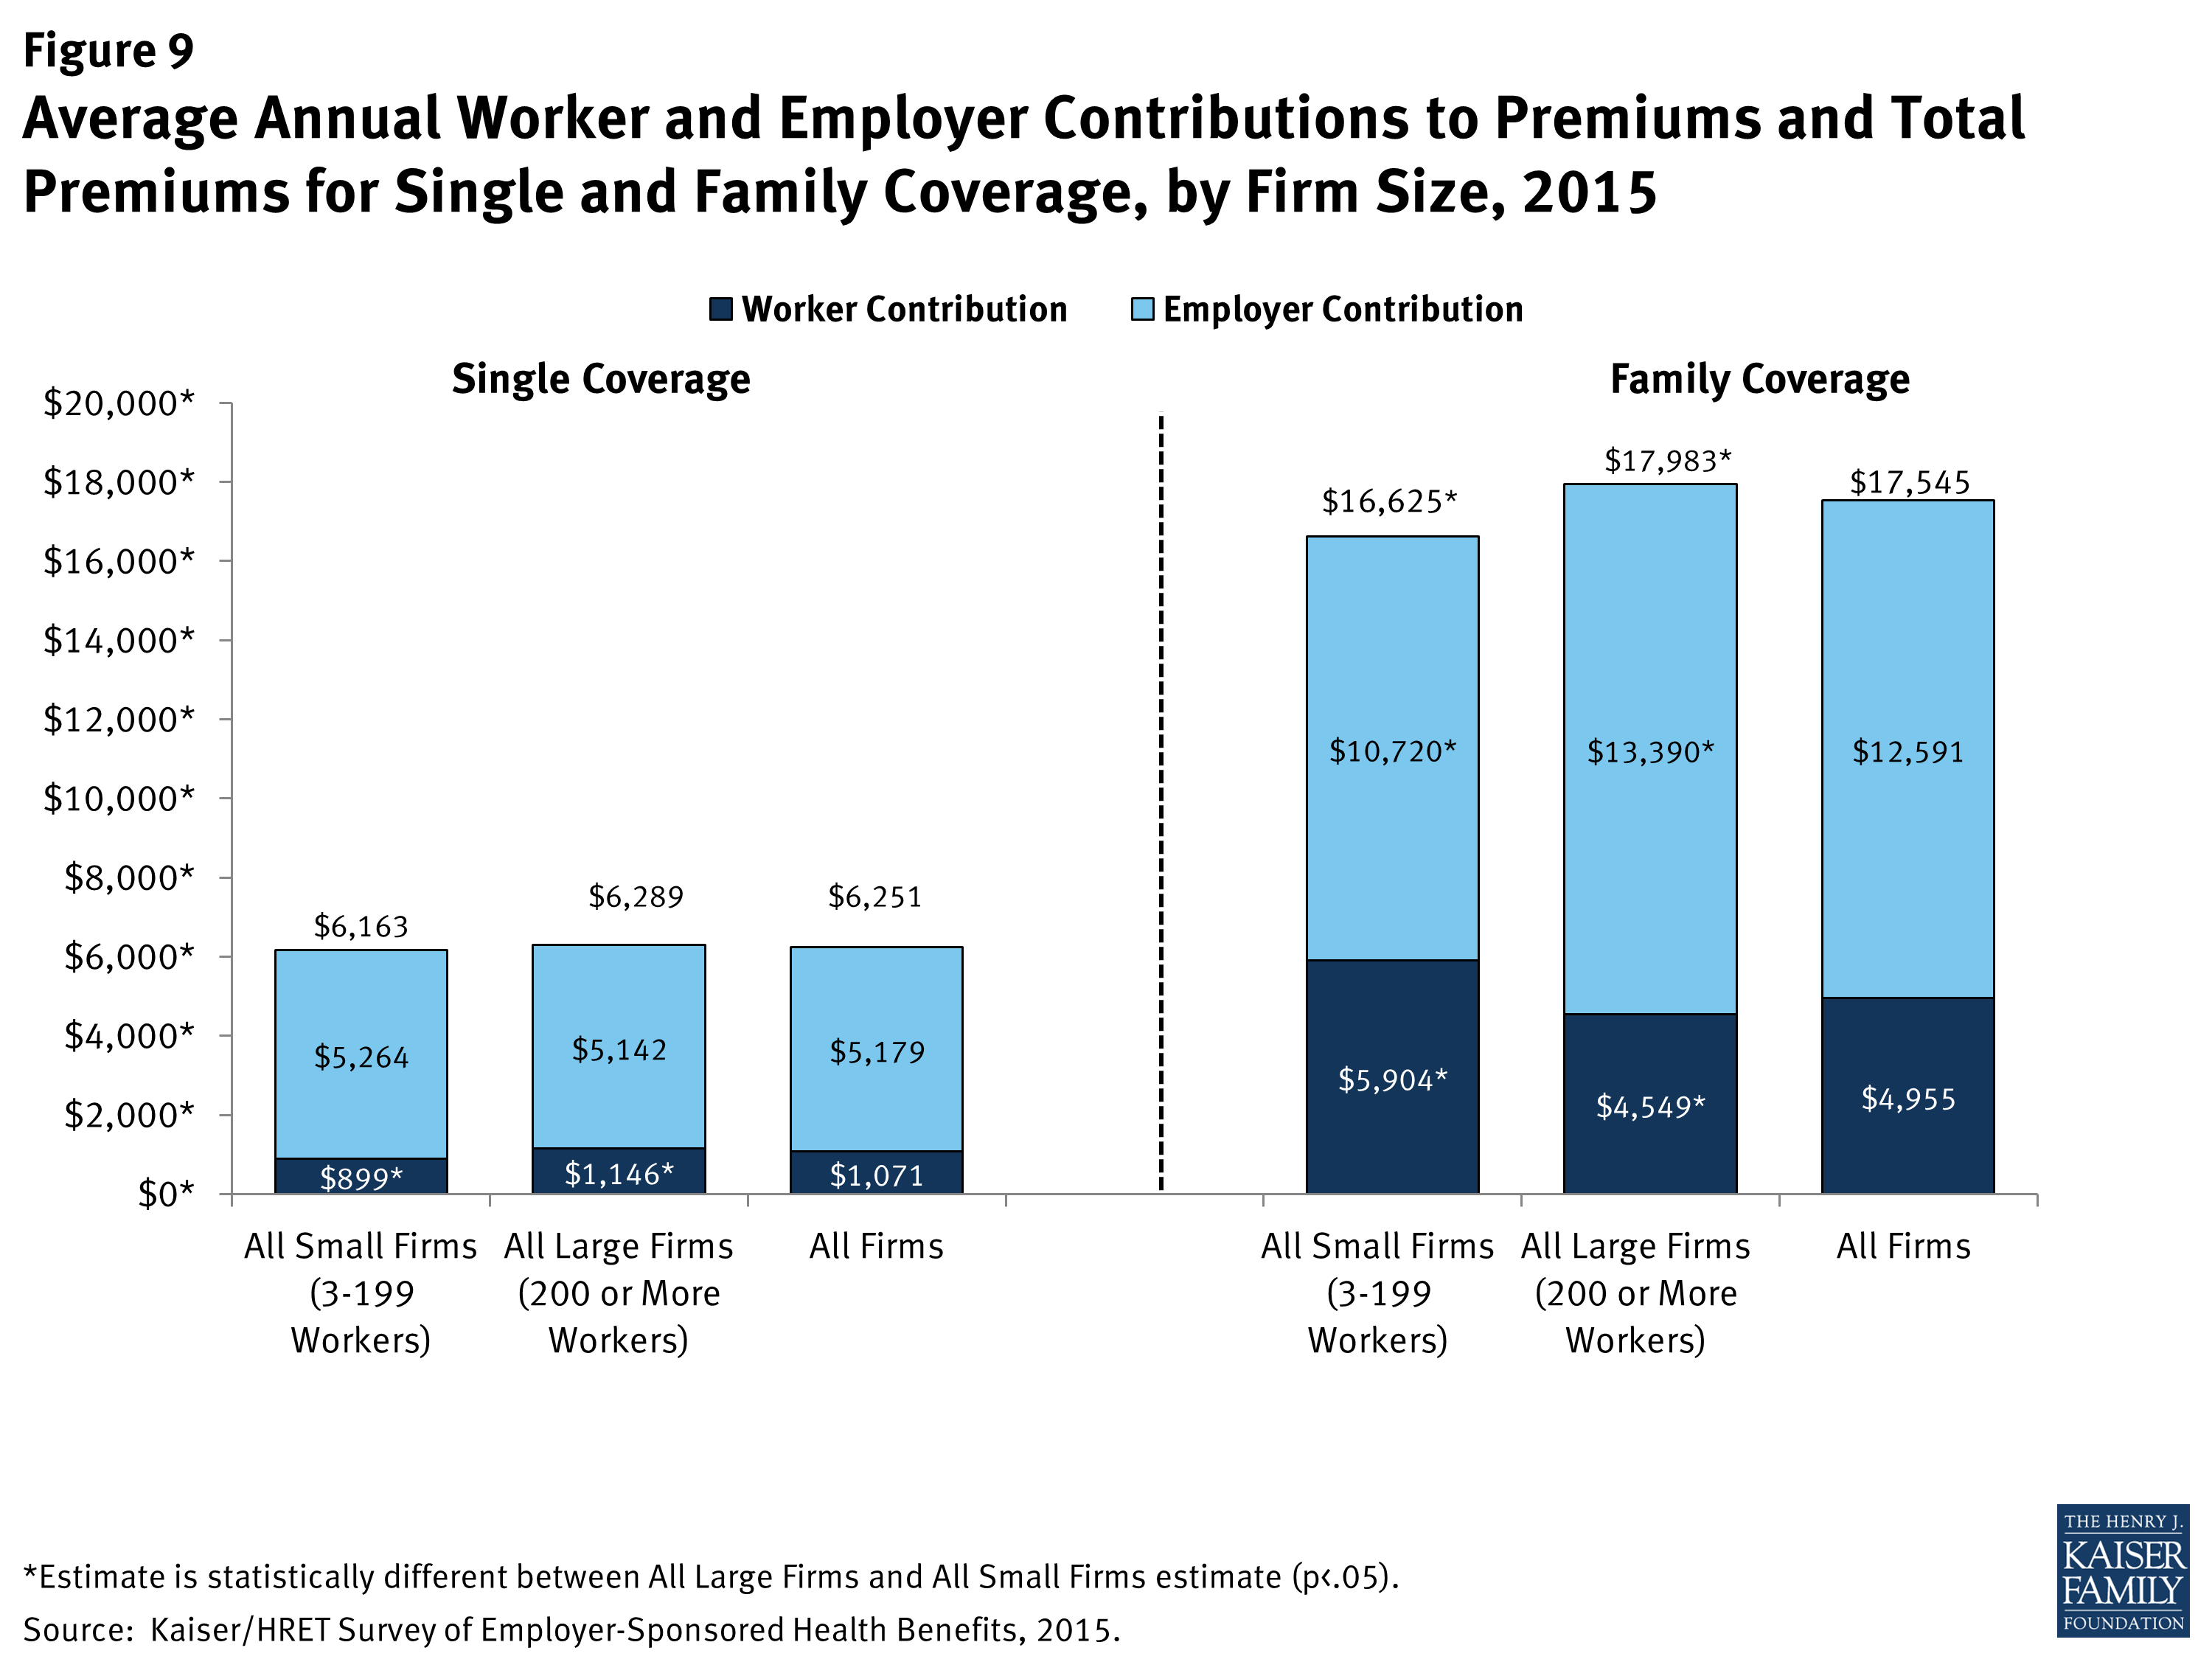
Figure 9: Average Annual Worker and Employer Contributions to Premiums and Total Premiums for Single and Family Coverage, by Firm Size, 2015
The differences between small and large firms are more pronounced when considering the distribution of the percentage of the premium paid by covered workers (Figure 10). Workers in small firms are more likely to work for a firm that pays 100% of the premium cost for both single and family coverage. However, for family coverage, workers in small firms that require a premium contribution are more likely to have higher premium contributions than workers in large firms. Thirty-two percent of workers in small firms contribute more than half of the premium for family coverage compared to just 8% of workers in large firms.
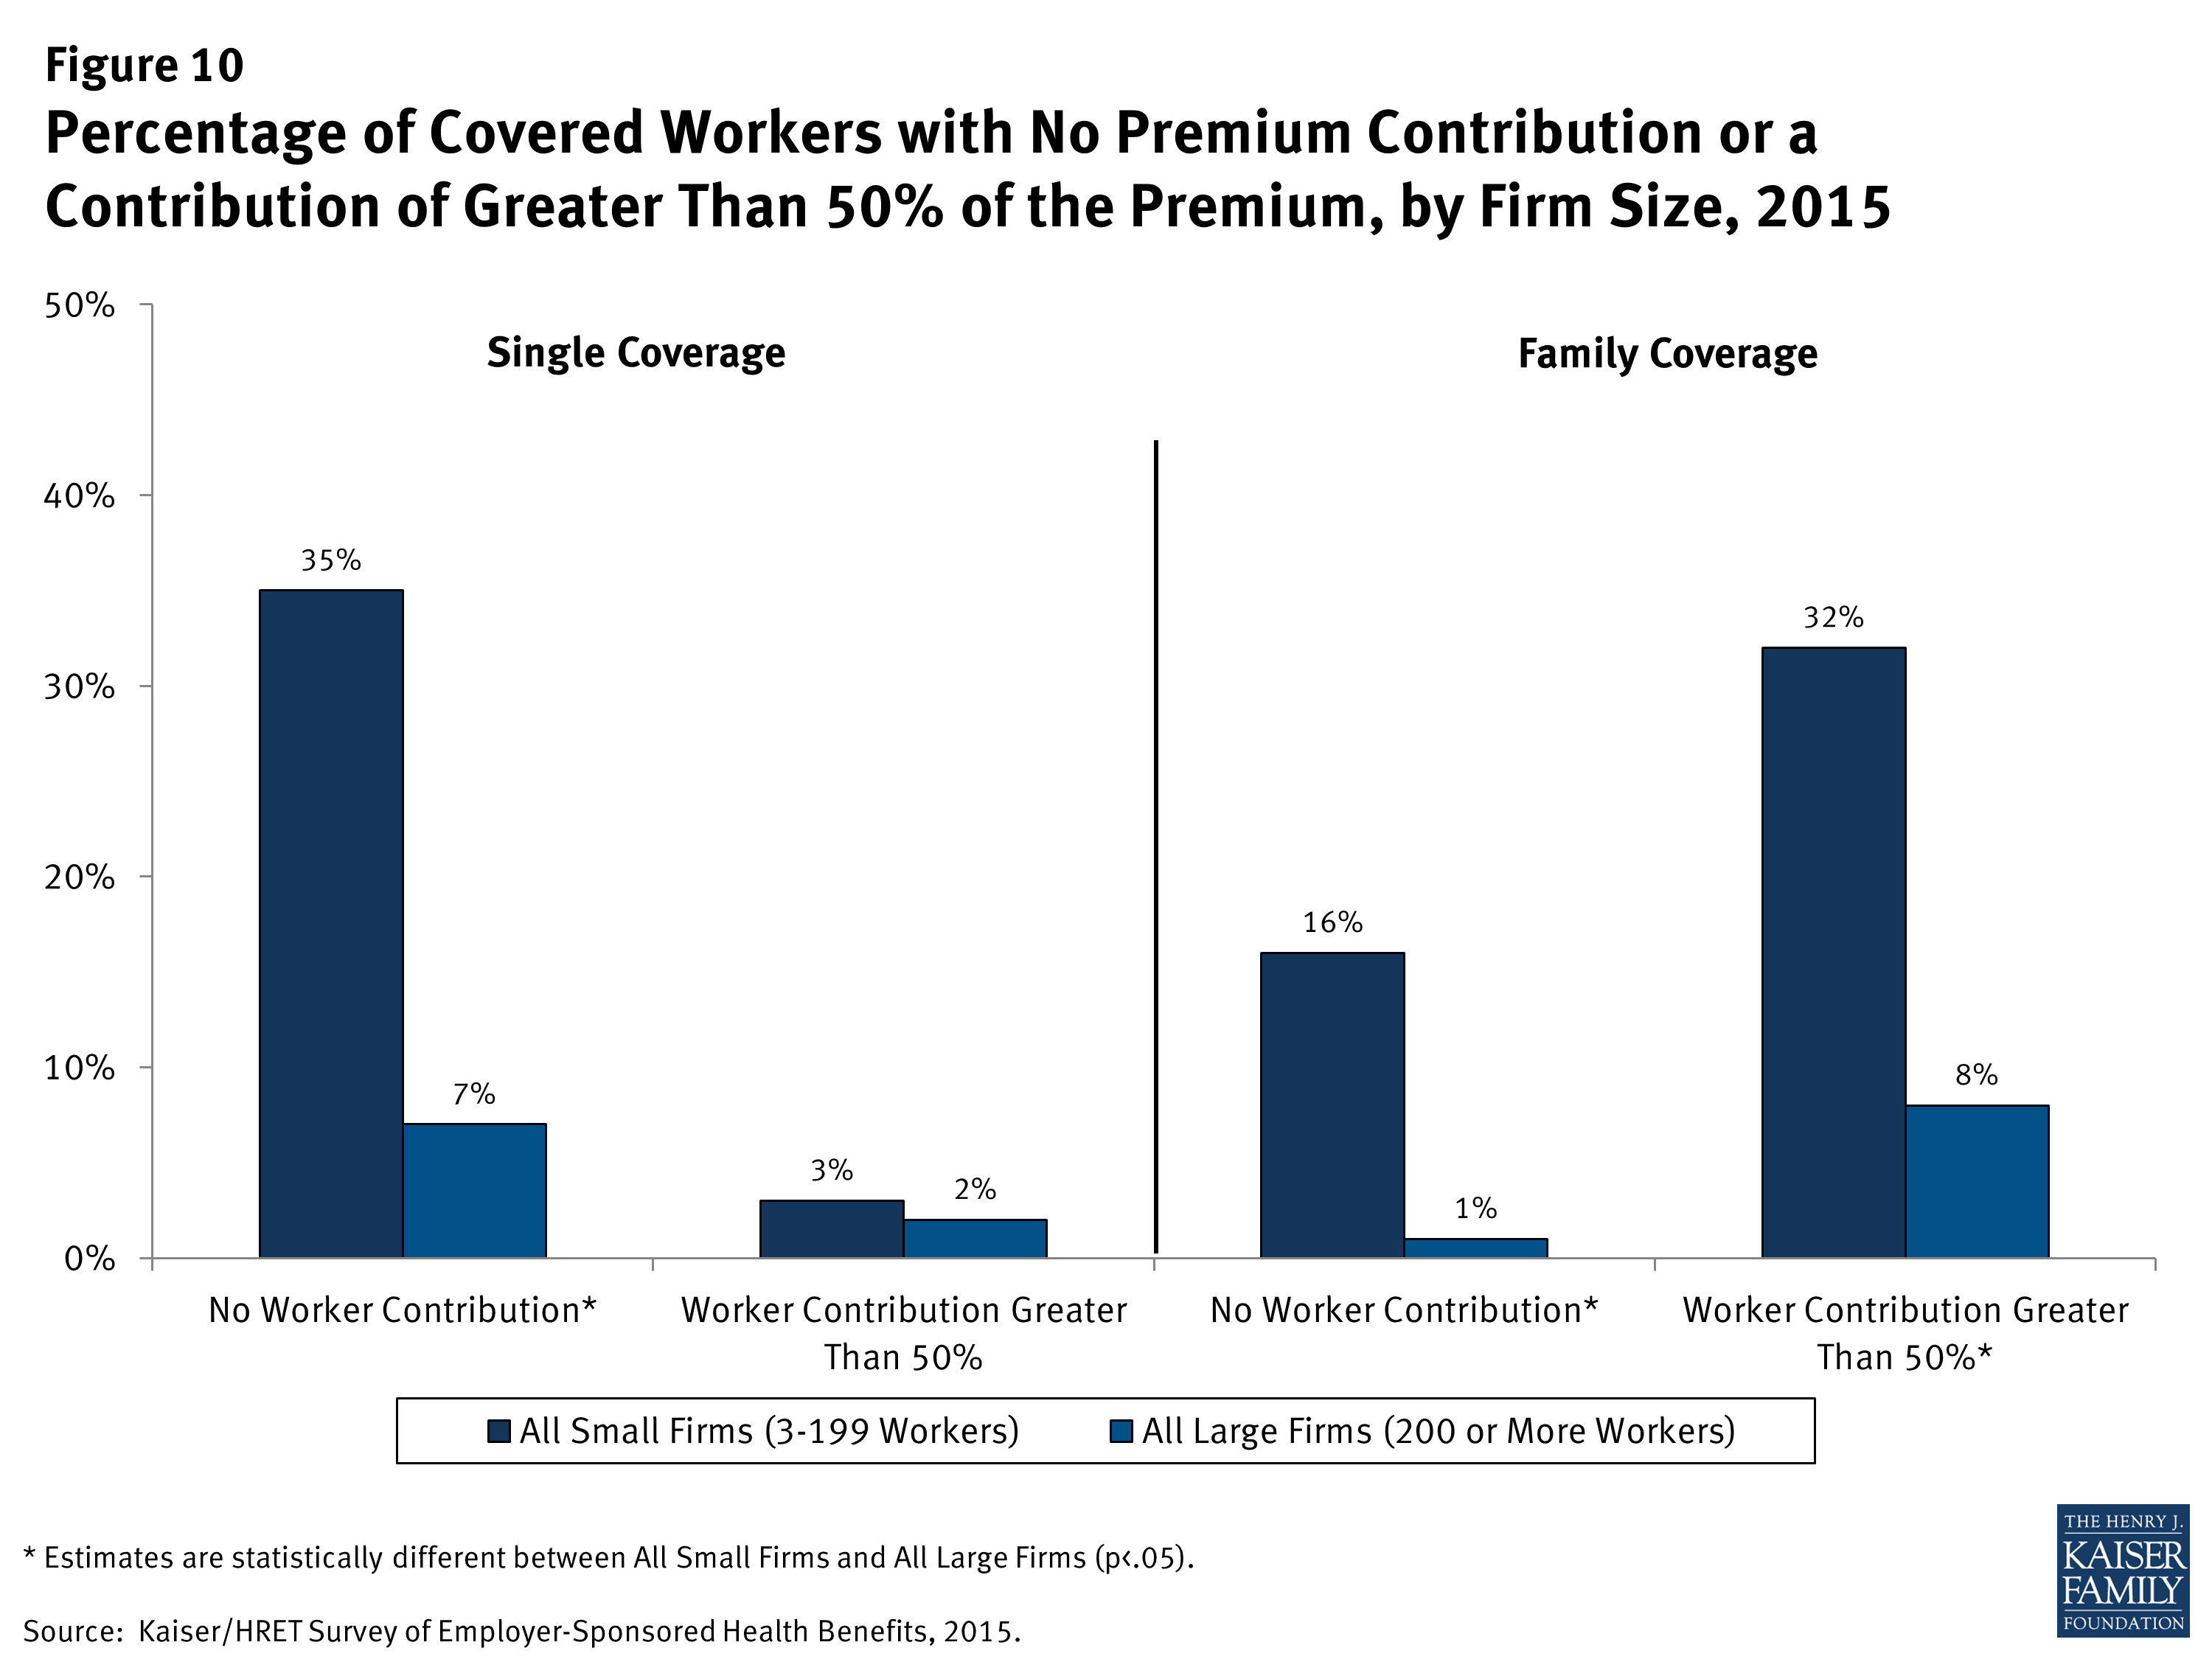
Figure 10: Percentage of Covered Workers with No Premium Contribution or a Contribution of Greater Than 50% of the Premium, by Firm Size, 2015
While, on average, workers at small firms make a larger family contribution than workers at large firms, the average rate of growth has been similar within both size categories. Workers’ contributions to family premiums at small firms have increased 27% since 2010 and 204% since 2000, similar to 25% and 213% increases at large firms.9
Firms’ approaches to family premium contributions vary depending on firm size (Figure 11). For instance, among small firms offering health benefits, 45% indicate that they contribute the same dollar amount for single coverage as family coverage, compared to only 17% of large firms who use that approach. Thirty-four percent of small firms report that they contribute a higher dollar amount for workers enrolled in family coverage than in single coverage; lower than the 67% of large firms who use that approach.
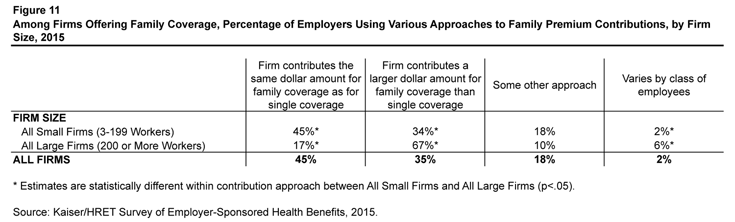
Figure 11: Among Firms Offering Family Coverage, Percentage of Employers Using Various Approaches to Family Premium Contributions, by Firm Size, 2015
Enrollment
There are differences between small and large firms in the types of plans in which workers enroll (Figure 12). Workers in small firms are more likely than workers in large firms to enroll in a Point of Service (POS) plan (19% vs. 6%). Preferred Provider Organizations (PPO) remain the dominant plan type for both small and large firms, although more workers in large firms are covered by PPOs than workers in small firms (56% vs. 41%).
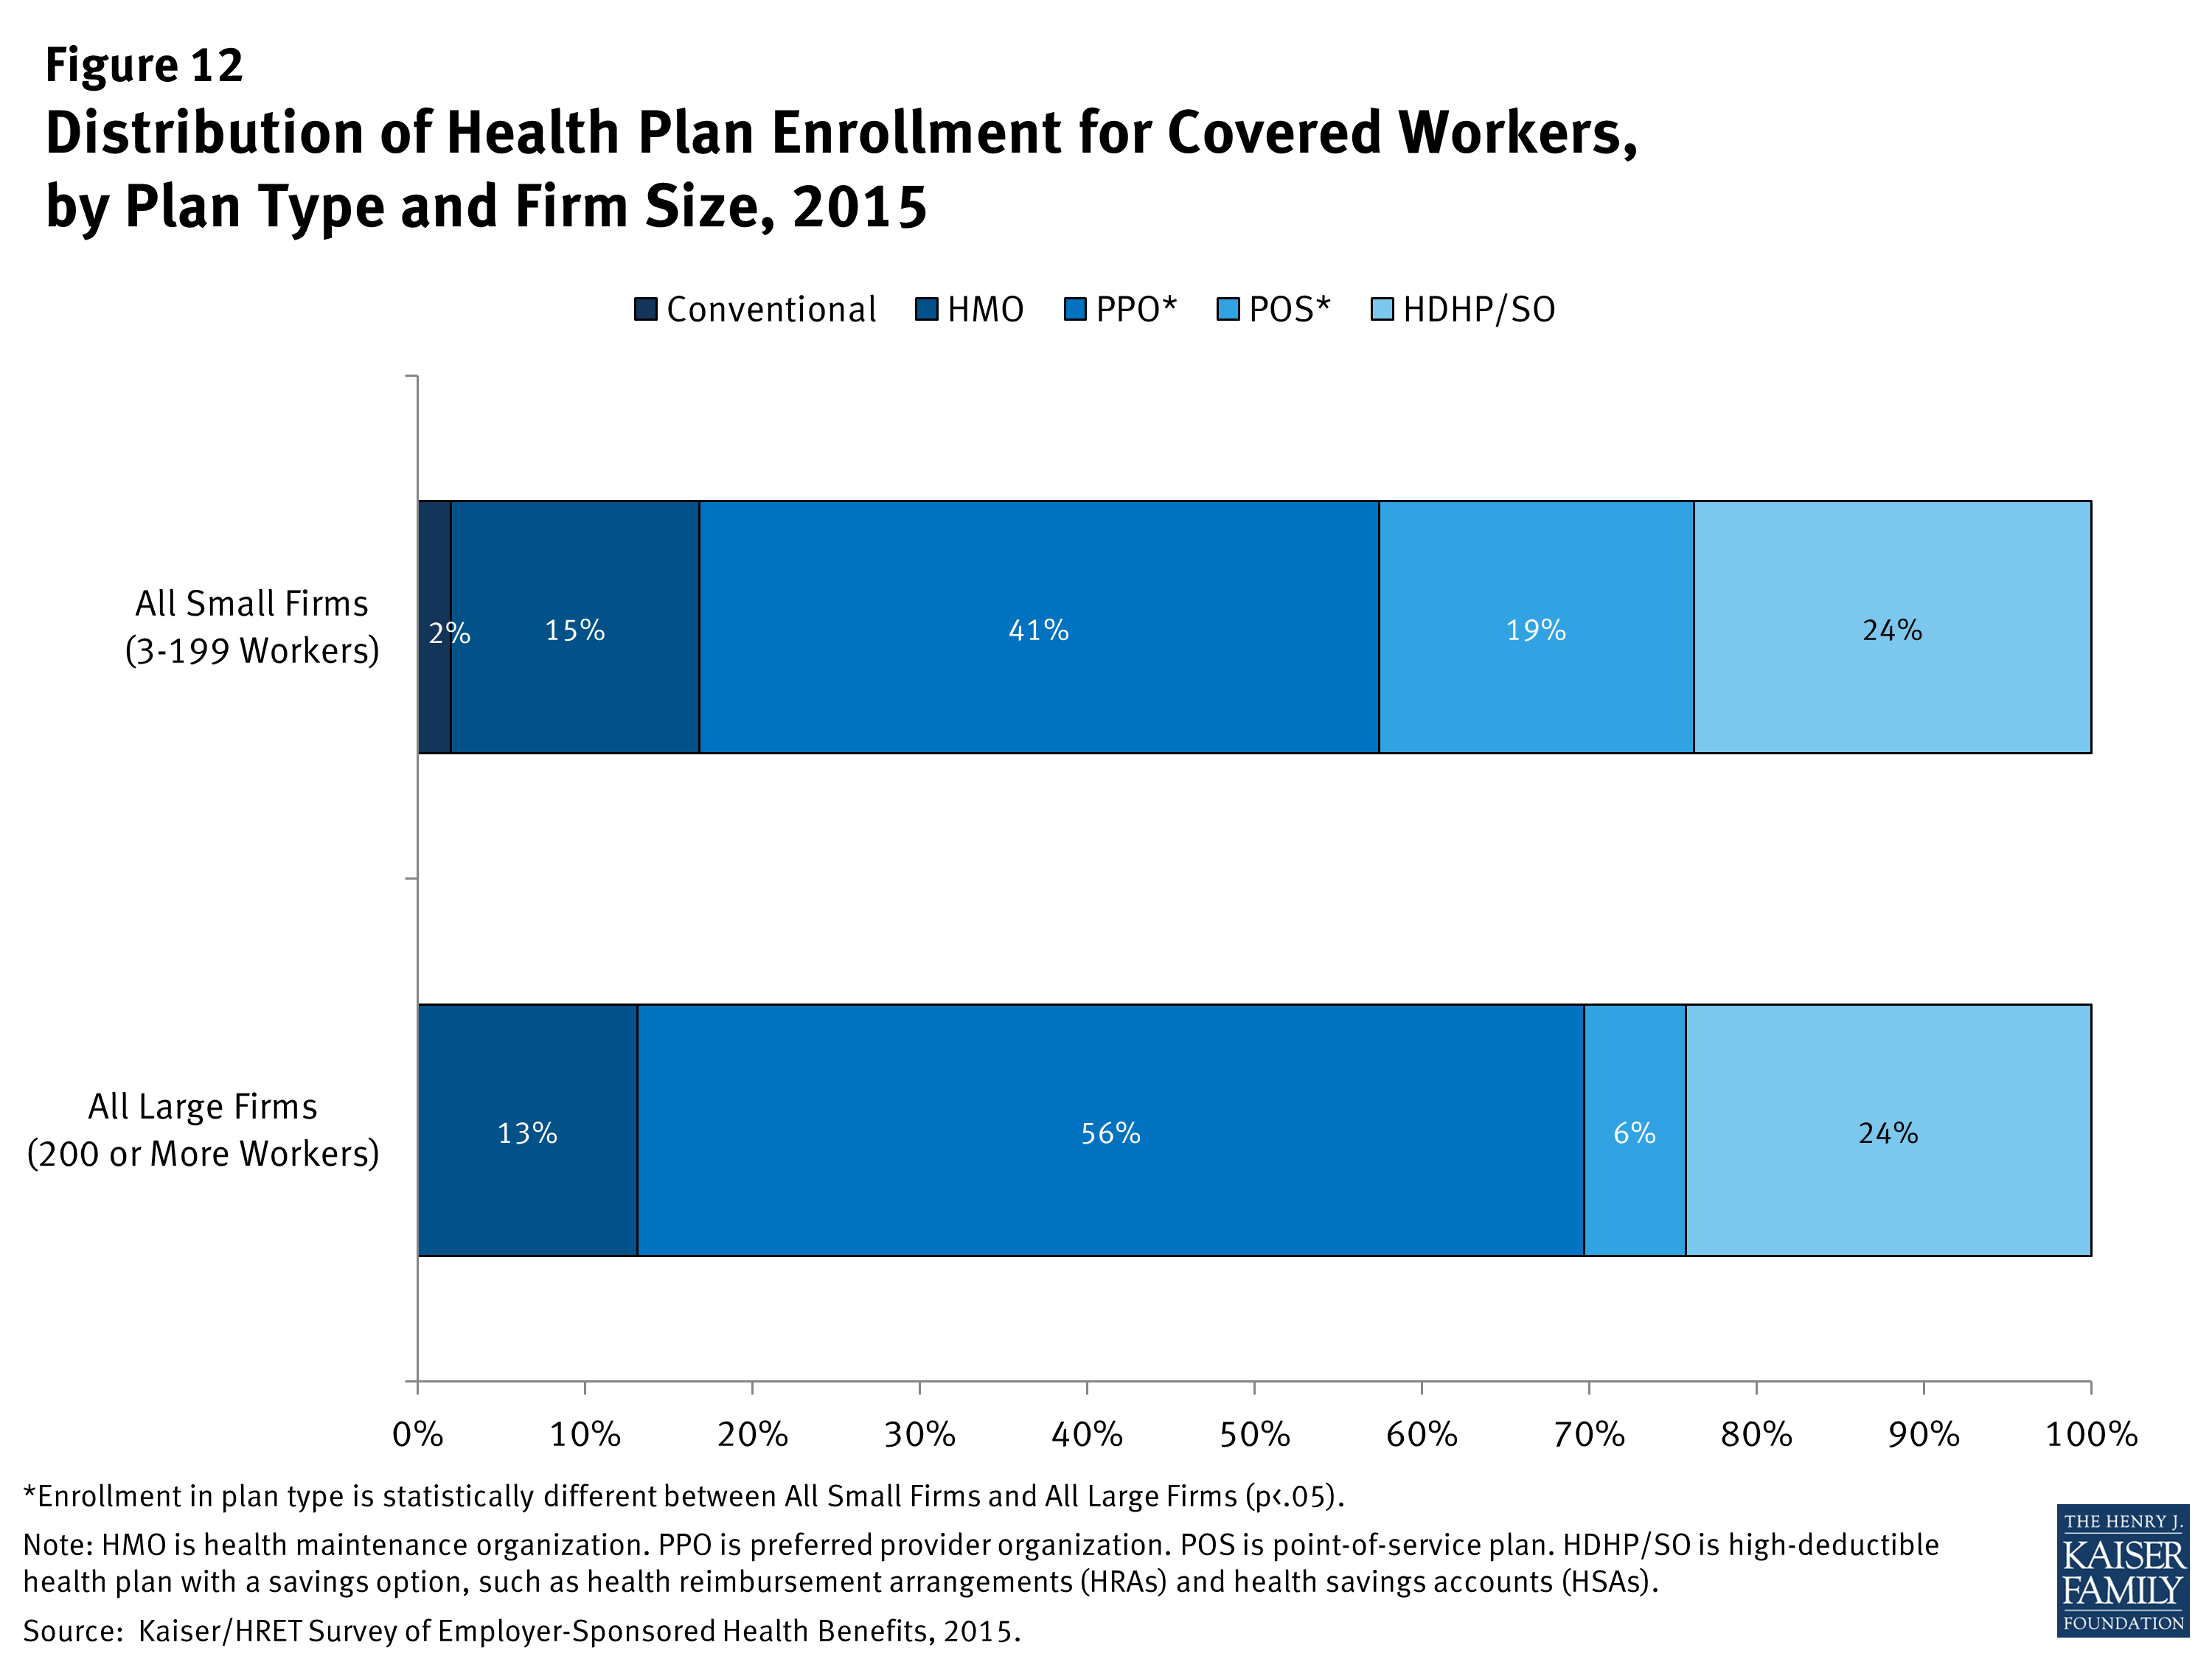
Figure 12: Distribution of Health Plan Enrollment for Covered Workers, by Plan Type and Firm Size, 2015
General Annual Deductibles
In addition to the differences in premium contributions, differences also exist between small and large firms in cost-sharing requirements (Figure 13). Among those workers with deductibles, workers in small firms generally have higher deductibles than workers in large firms. Workers in small firms with single coverage are more likely to have a deductible of at least $1,000 than covered workers in large firms (63% vs. 39%). Similarly, workers in small firms with single coverage are more likely to have a deductible of $2,000 or more than those in large firms (36% vs 12%).
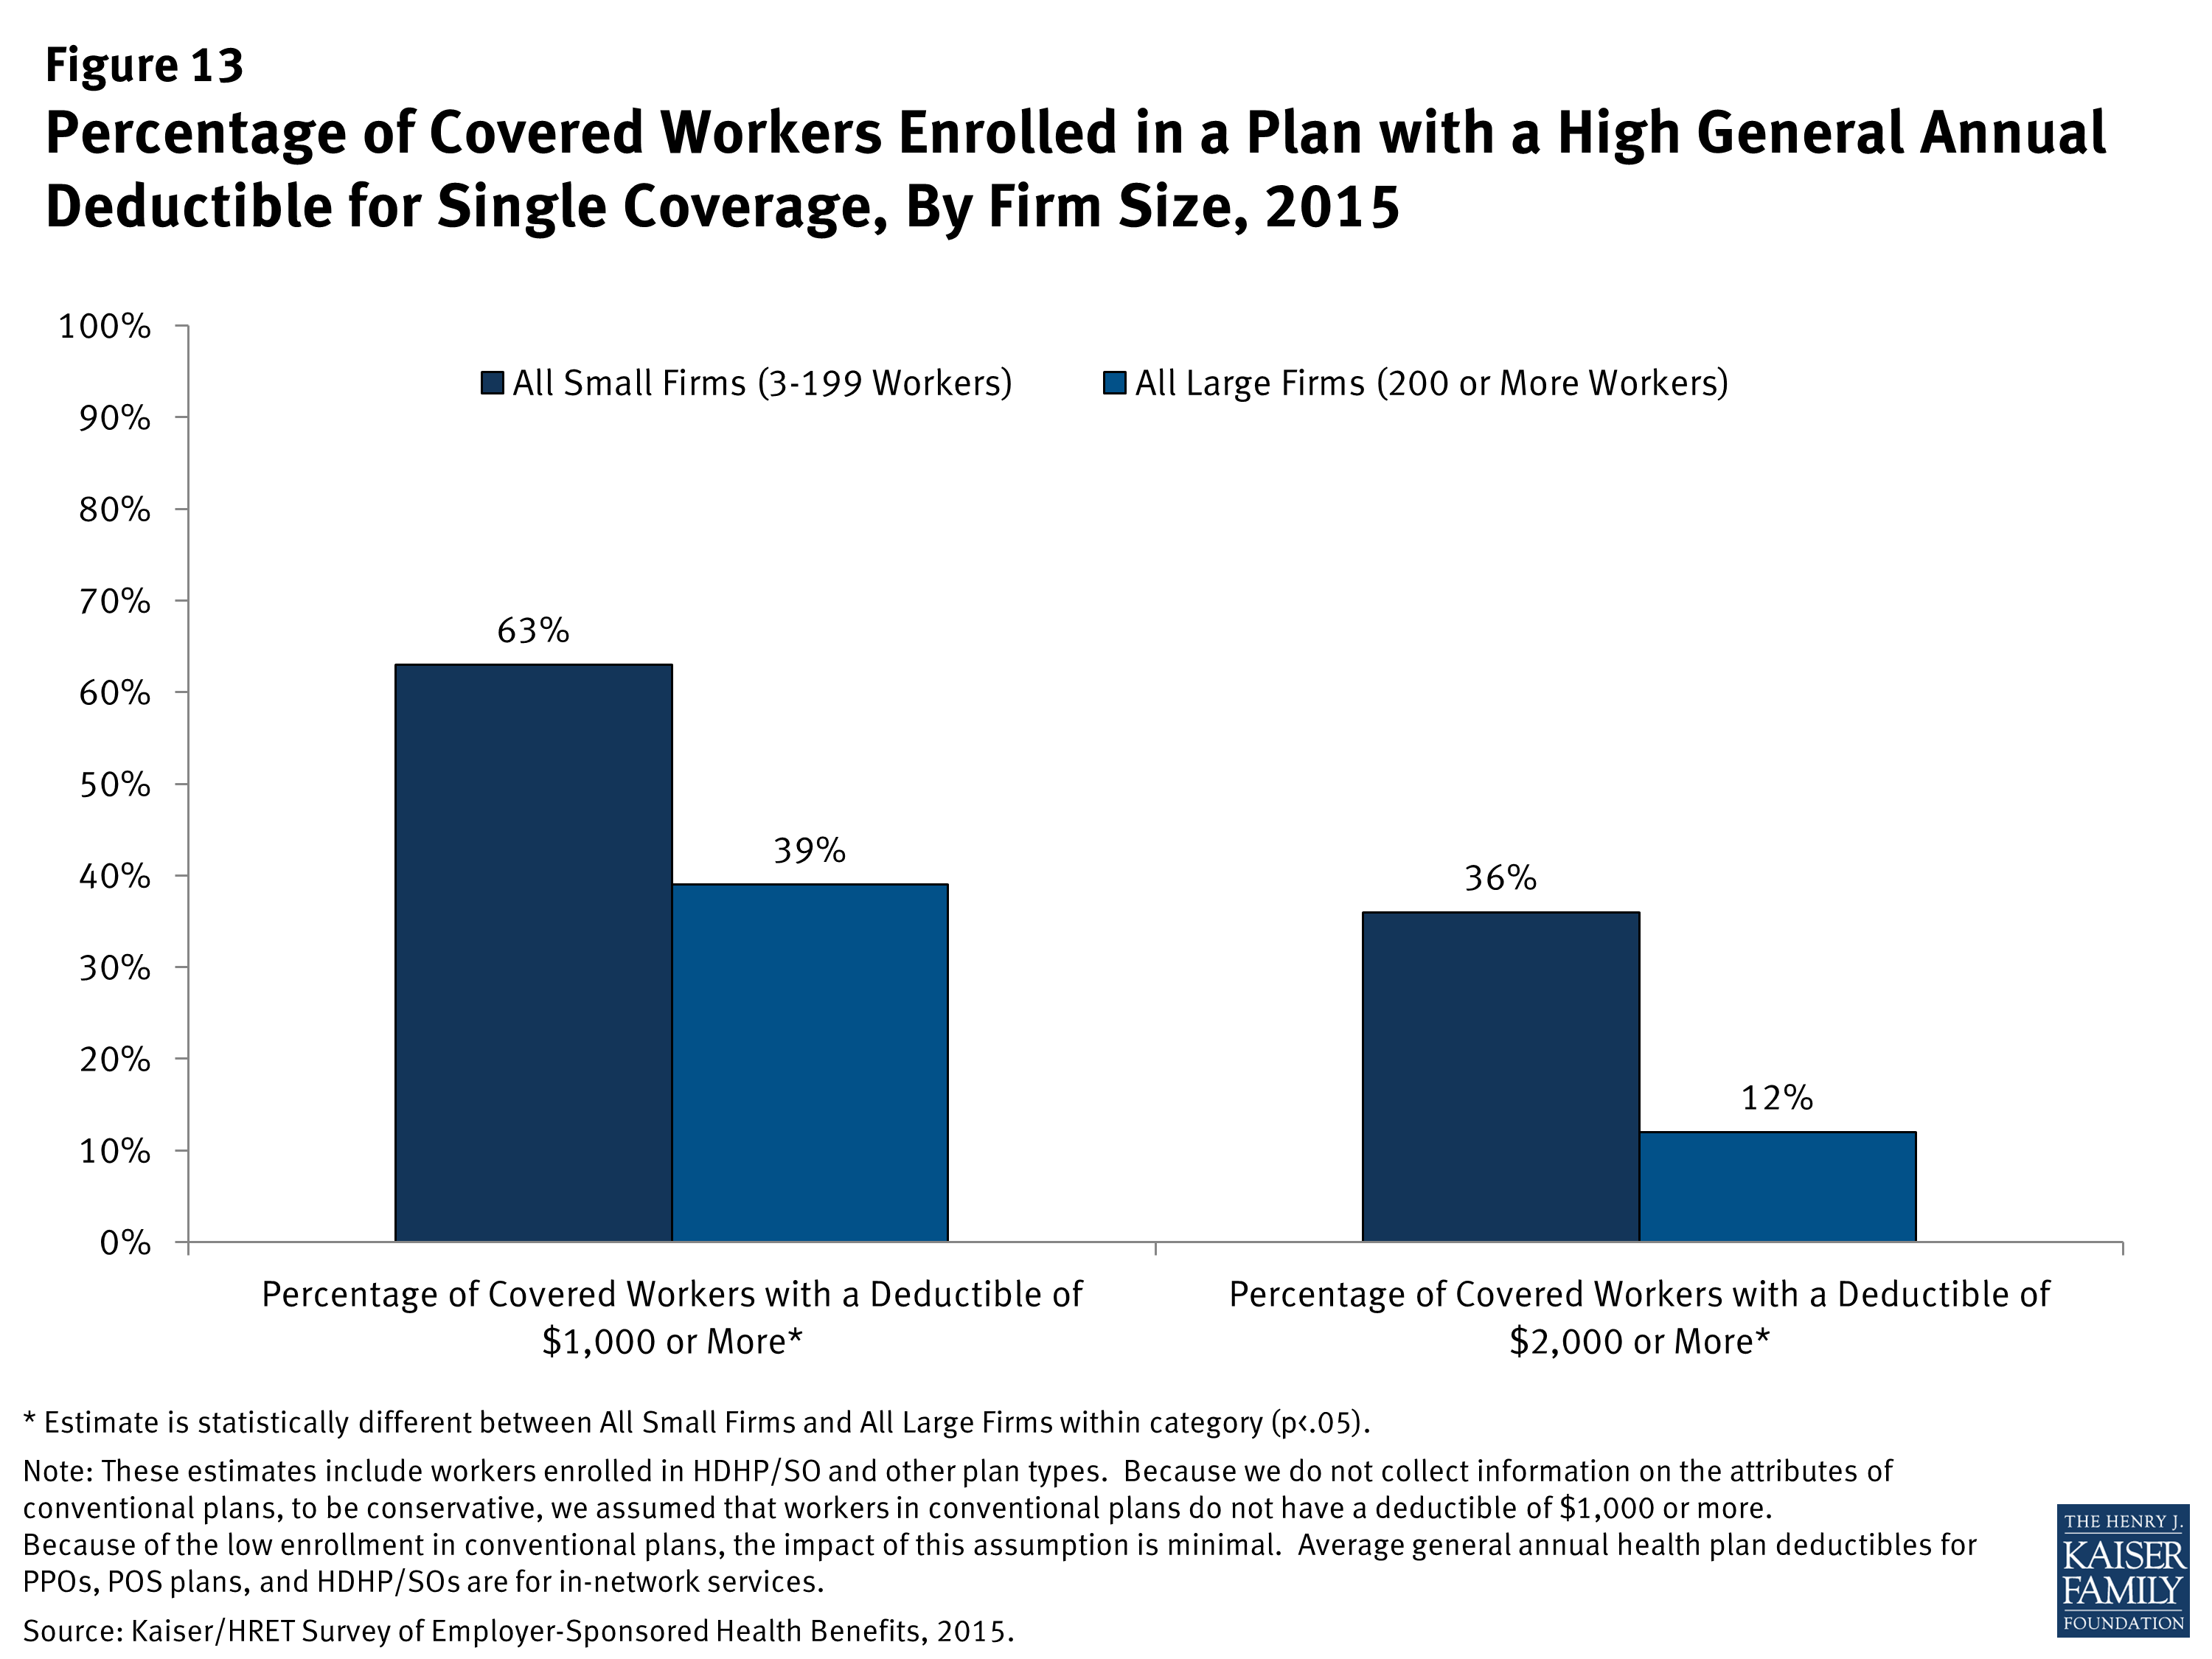
Figure 13: Percentage of Covered Workers Enrolled in a Plan with a High General Annual Deductible for Single Coverage, By Firm Size, 2015
Differences in deductible amounts vary by plan type (Figure 14). Across all plan types, workers with single coverage at small firms have annual deductibles averaging over $700 more than those in plans sponsored by large firms. For those with family coverage, the average difference between small and large firms is more than $1,400.
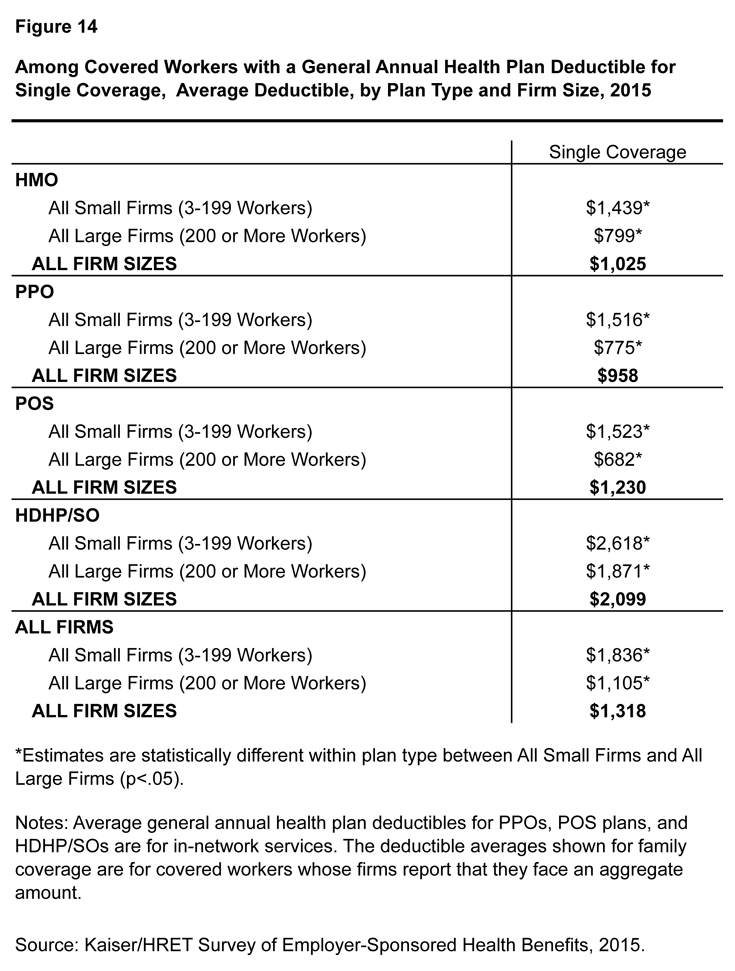
Figure 14: Among Covered Workers with a General Annual Health Plan Deductible for Single Coverage, Average Deductible, by Plan Type and Firm Size, 2015
The share of covered workers in plans with a general annual deductible has increased significantly over time, as have the average deductible amounts for covered workers in plans with deductibles (Figure 15). Neither trend by itself captures the full impact of changes in deductibles on covered workers. We can examine the average impact of both trends together on covered workers by assigning a zero deductible value to covered workers in plans with no deductible and looking at how the resulting averages change over time. These average deductible amounts are lower in any given year but the changes over time reflect both the higher deductibles in plans with deductibles and the fact that more workers face them. Using this approach, the average general annual deductible for single coverage for all covered workers in small firms is $1,507 (up 51% from 2010) and $890 for all covered workers in large firms (up 95% from 2010).
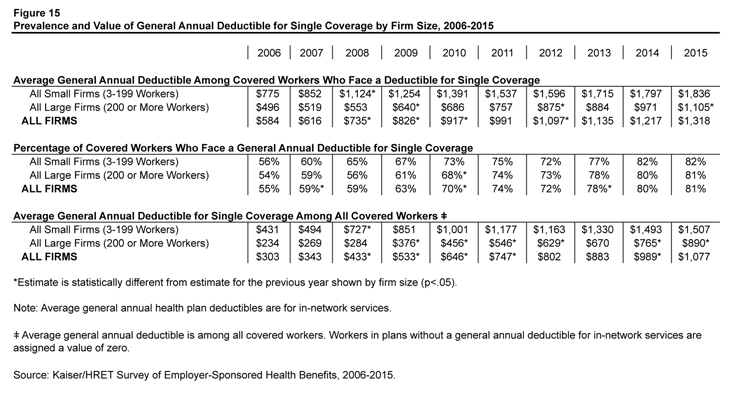
Figure 15: Prevalence and Value of General Annual Deductible for Single Coverage by Firm Size, 2006-2015
Trends in Employer Health Plan Practices
Employers of different sizes often have different resources when purchasing health coverage. Many small firms outsource more of the administrative functions of their health programs than large firms. Some firms provide health benefits by entering into a co-employment relationship with a Professional Employer Organization (PEO). Under this arrangement, the firm manages the day-to-day responsibilities of employees but the PEO hires the employees and acts as the employer for insurance, benefits, and other administrative purposes.
Five percent of firms with 3 to 499 workers offering health benefits offer coverage in conjunction with a PEO (Figure 16). Overall, six percent of covered workers enrolled in health benefits at firms with 3 to 499 workers are enrolled in a plan offered through a PEO.

Figure 16: Among Offering Firms With Fewer Than 500 Employees, Percentage of Employers who Provide Benefits Through a Co-Employment Arrangement with a Professional Employer Organization (PEO), by Firm Size, 2015
A self-funded plan is an insurance arrangement in which the employer assumes direct financial responsibility for the costs of enrollees’ medical claims. Federal law exempts self-funded plans from most state insurance laws, including reserve requirements, mandated benefits, premium taxes, and consumer protection regulations. The percentage of covered workers who are in a self-funded plan has increased over time but has remained stable over the last couple of years (Figure 17). Covered workers in large firms are more likely to be in a self-funded plan than covered workers in small firms (83% vs. 17%). The percentage of covered workers at small firms enrolled in a self-funded health plan is unchanged from 1999.
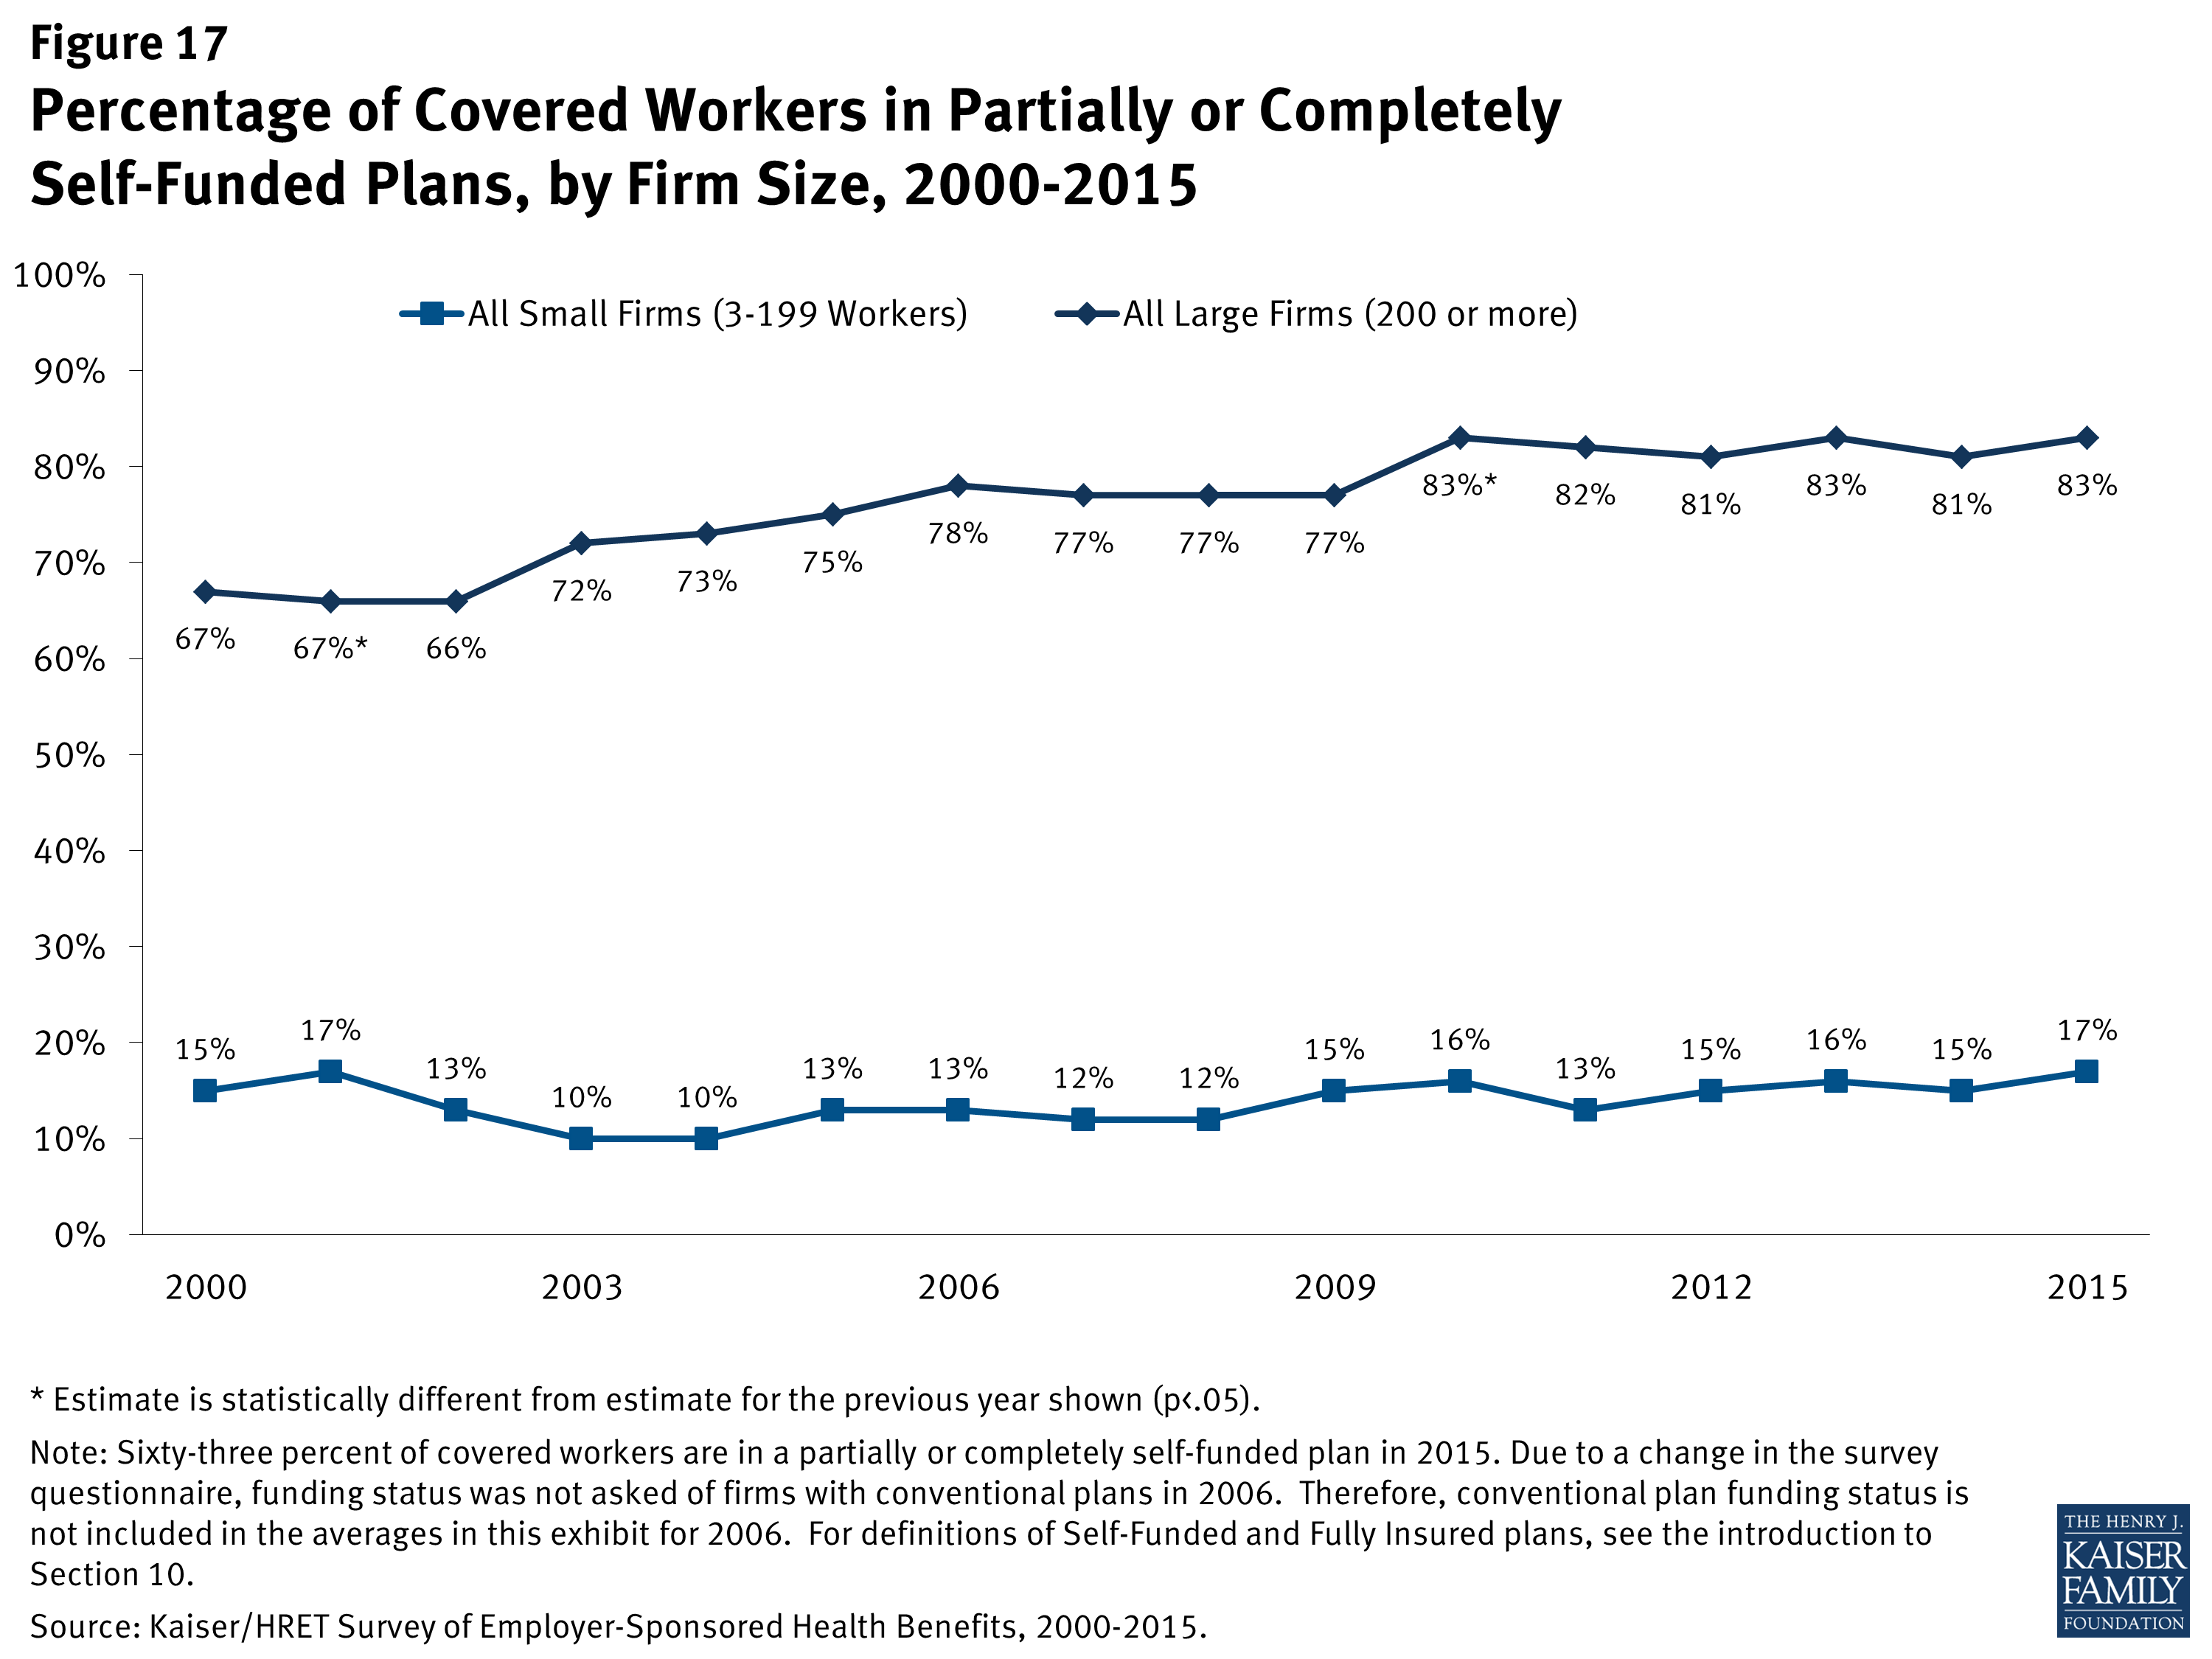
Figure 17: Percentage of Covered Workers in Partially or Completely Self-Funded Plans, by Firm Size, 2000-2015
Conclusion
Accessibility, affordability, and coverage of employer-sponsored health insurance vary greatly for small and large firms. The smallest firms are less than half as likely to offer coverage to their employees as are large firms. While family premiums are less expensive at small firms, covered workers face higher premium contributions and higher cost sharing in the form of higher deductibles. The lower offer rates combined with greater cost-sharing responsibilities for workers in small firms may limit the ability of small firms to attract and retain employees.
The continuing implementation of the ACA has brought about a number of changes for employer-based coverage, impacting both large and small employers.10 Under the ACA, employers purchasing insurance in the small group market must ensure that their plans meet essential health benefits standards established by their respective state. While there is no requirement that small businesses provide health insurance to their employees, beginning in 2016, applicable large employers (those with at least 50 FTEs) may be subject to a penalty if they do not offer affordable coverage. To help offset the cost of providing health insurance, small businesses with fewer than 25 FTE employees may be eligible to receive tax credits when purchasing insurance through the Small Business Health Options Program (SHOP). While the ACA has and will continue to meaningfully impact the availability and scope of insurance coverage, many of the contributing factors to the differences in cost sharing and premiums between small and large employer health benefits are likely to remain.