Larry Levitt
  Rakesh Singh
 Health policy and politics are inextricably linked. Policy is about what the government can do to shift the financing, delivery, and quality of health care, so who controls the government has the power to shape those policies.
Elections, therefore, always have consequences for the direction of health policy – who is the president and in control of the executive branch, which party has the majority in the House and the Senate with the ability to steer legislation, and who has control in state houses. When political power in Washington is divided, legislating on health care often comes to a standstill, though the president still has significant discretion over health policy through administrative actions. And, stalemates at the federal level often spur greater action by states.
Health care issues often, but not always, play a dominant role in political campaigns. Health care is a personal issue, so it often resonates with voters. The affordability of health care, in particular, is typically a top concern for voters, along with other pocketbook issues, and, at over 17% of the economy, health care has many industry stakeholders who seek influence through lobbying and campaign contributions. At the same time, individual policy issues are rarely decisive in elections.
 Jared Ortaliza
  Matt McGough
  Cynthia Cox
 Stephanie Oum
  Kellie Moss
  Jennifer Kates
 Kaye Pestaina
  Rayna Wallace
  Michelle Long
 Usha Ranji
  Karen Diep
  Ivette Gomez
  Laurie Sobel
  Alina Salganicoff
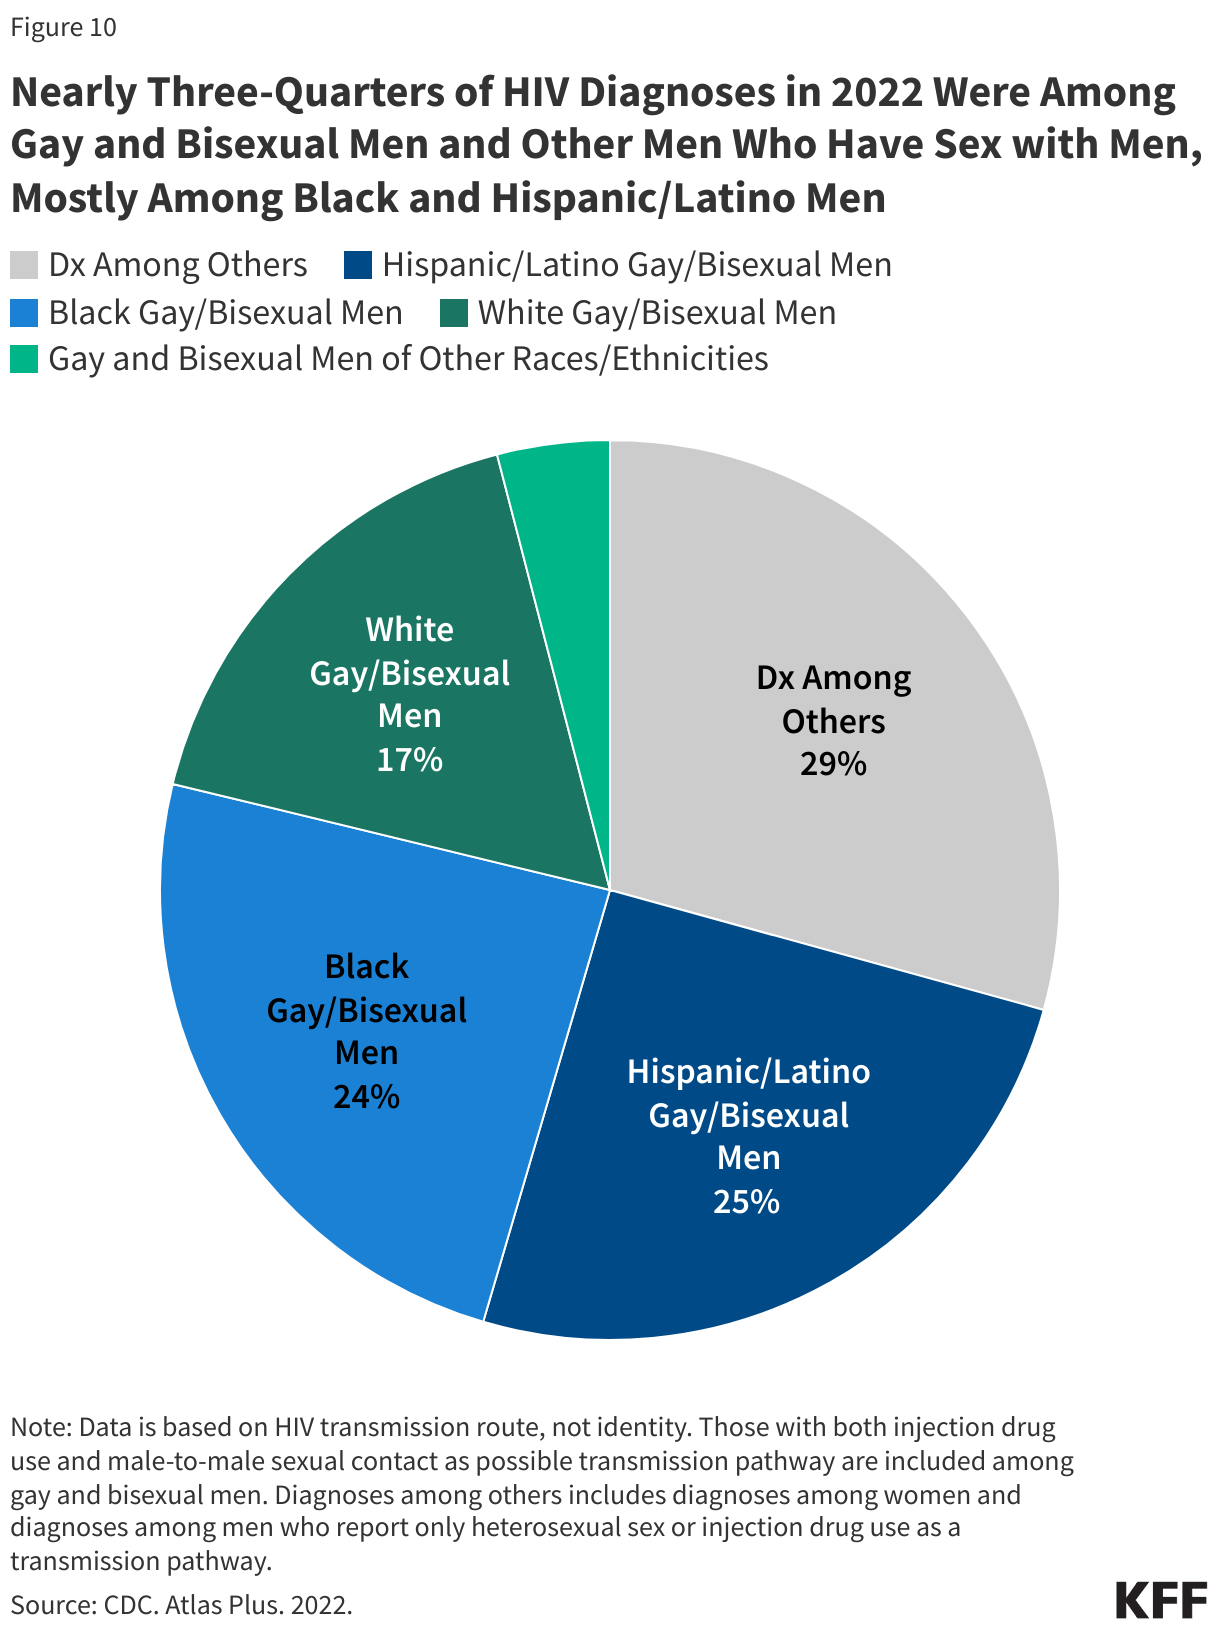
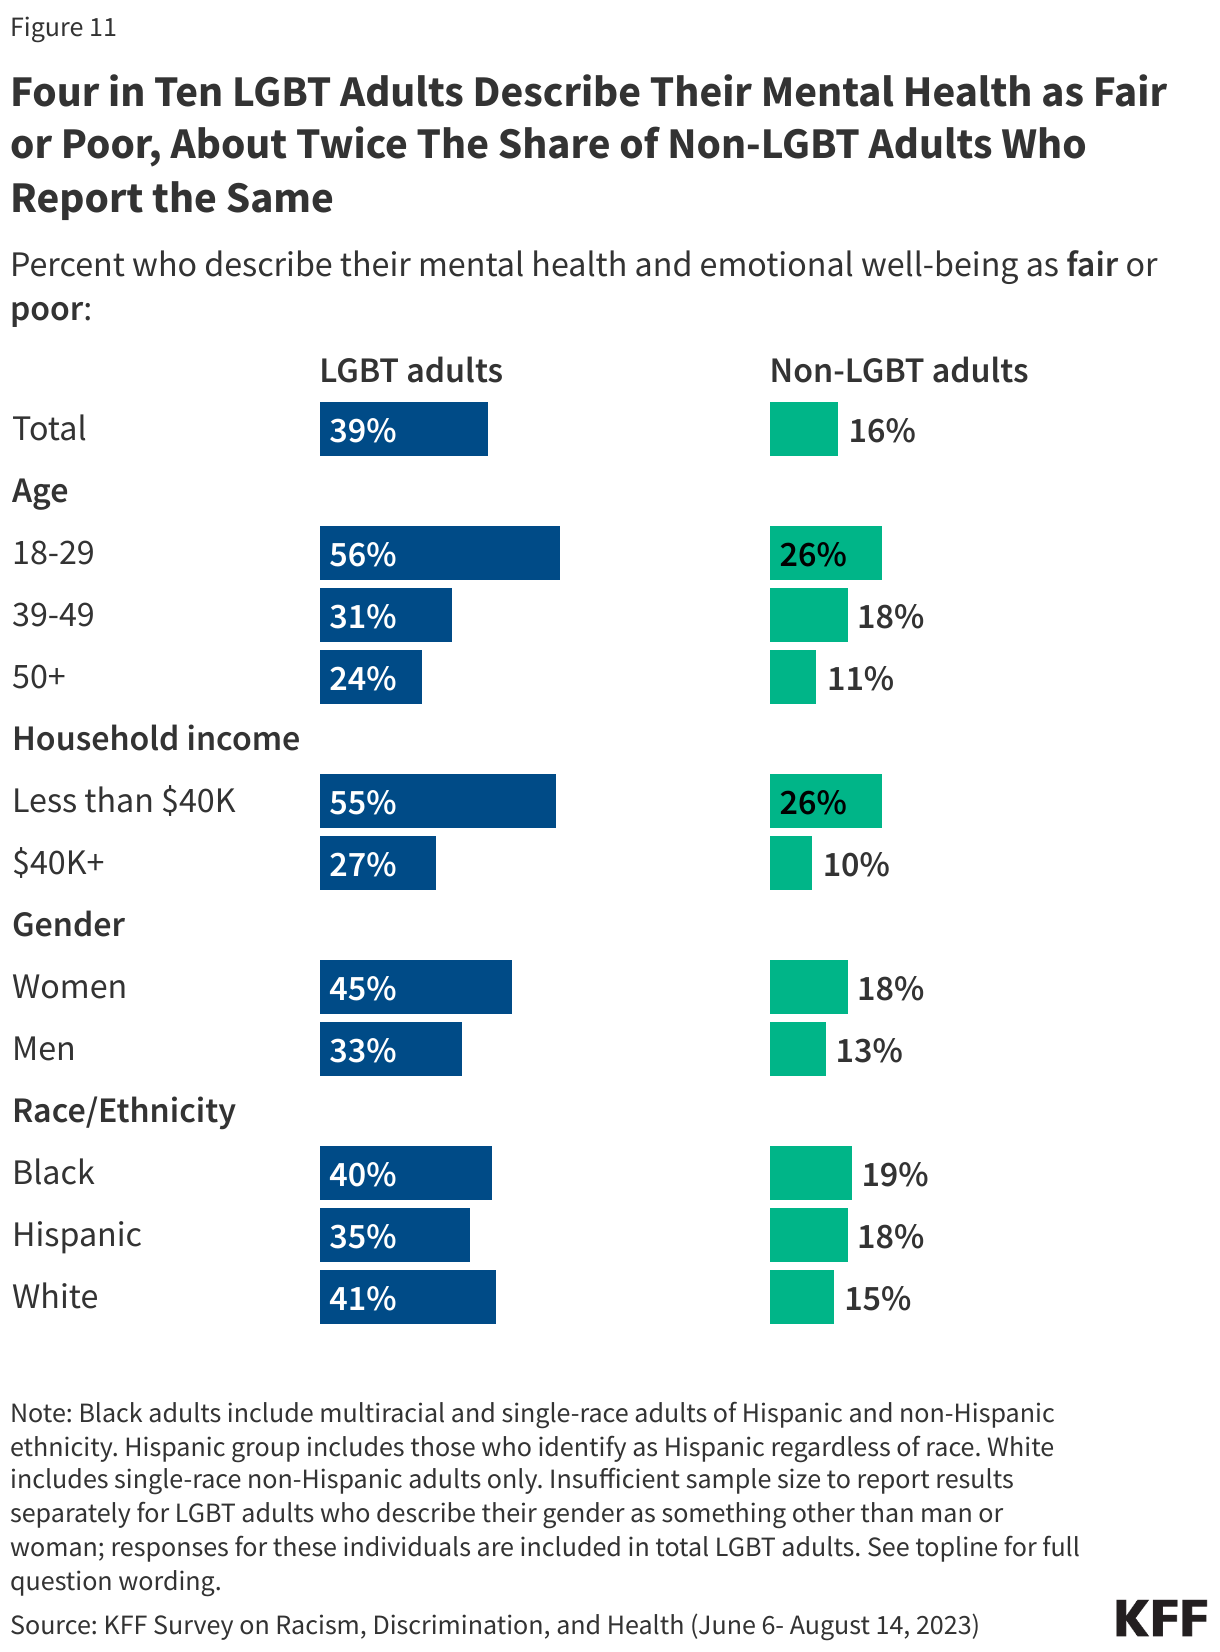
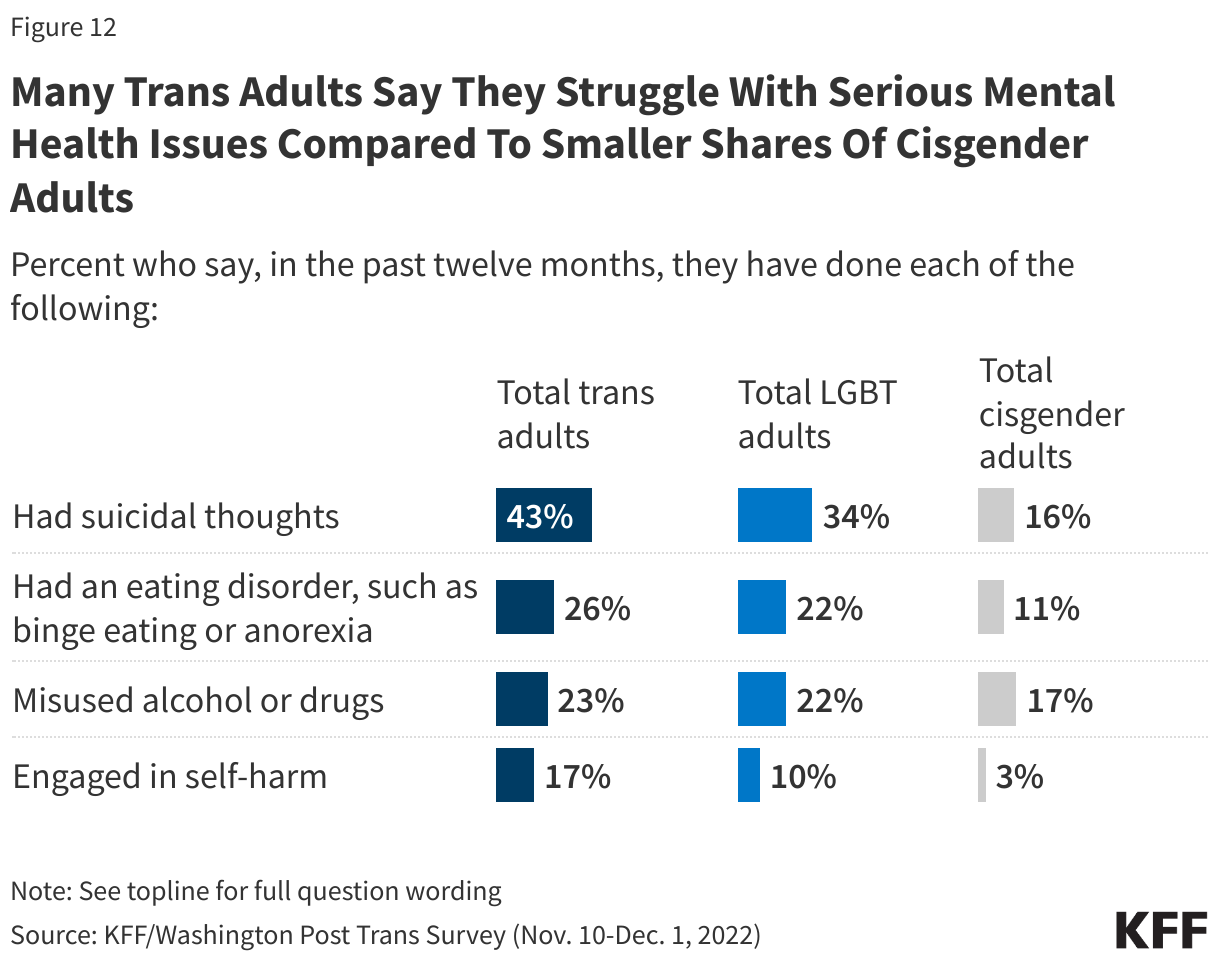
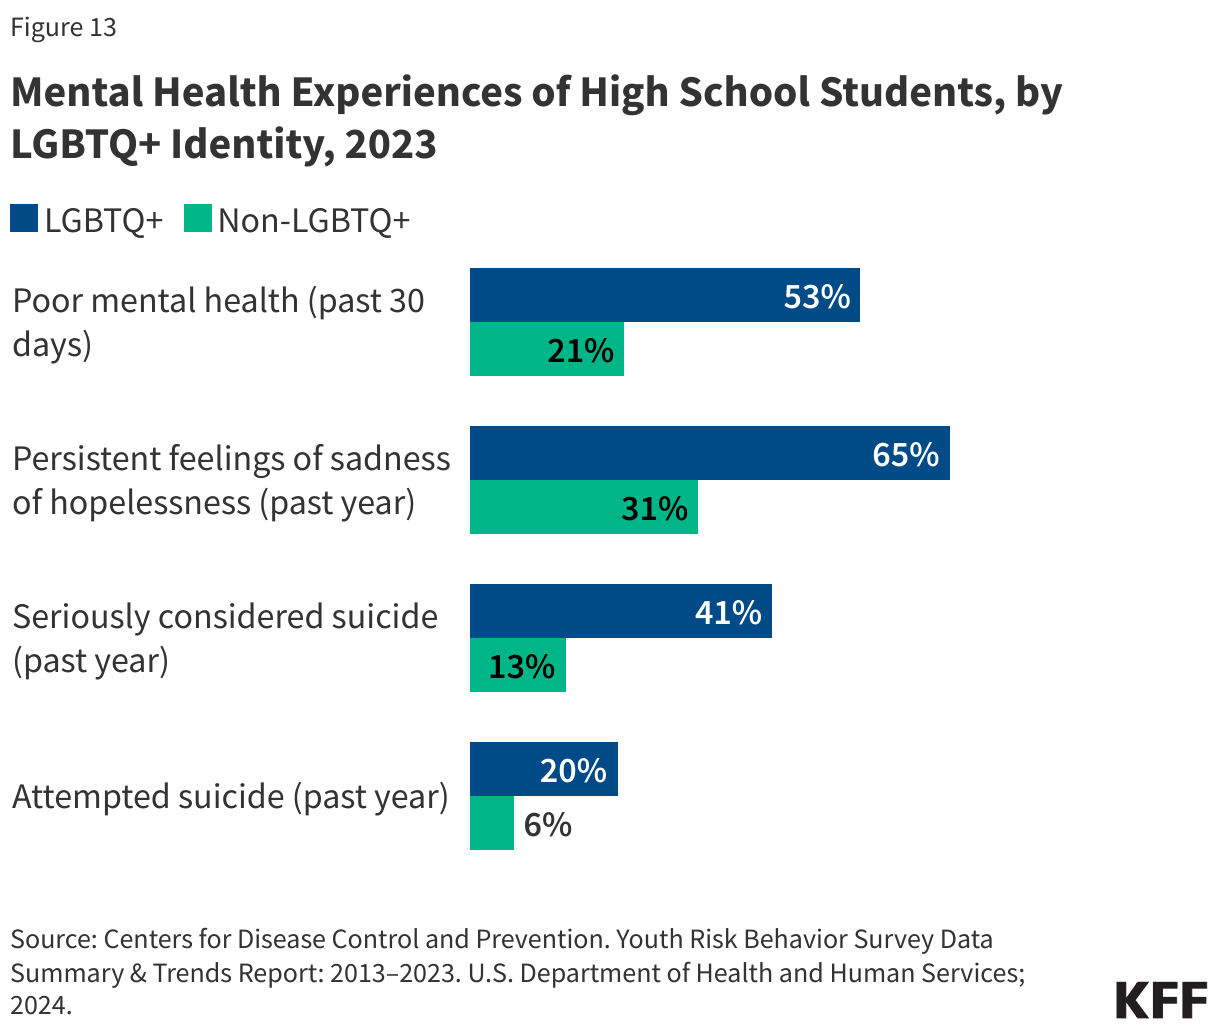
 Lindsey Dawson
  Alex Montero
  Ashley Kirzinger

 Gary Claxton
  Matthew Rae
  Aubrey Winger
 Mollyann Brodie
  Liz Hamel
  Emma Wager