Jennifer Tolbert
  Rakesh Singh
  Patrick Drake
 Health coverage in the United States is marked by a blend of private and public insurance options that leaves about 8% of the population uninsured. This coverage system has evolved over the years, most recently with the implementation of the Affordable Care Act (ACA), which aimed to reduce the uninsured rate by expanding Medicaid, creating health insurance Marketplaces for individuals, and providing subsidies to make the coverage more affordable. Many factors, including economic conditions, federal and state policy changes, and significant health crises, such as the COVID-19 pandemic, influence the uninsured rate. The ACA and recent policy changes designed to protect coverage during the pandemic have led to increased health coverage overall; however, longstanding racial and ethnic disparities in coverage persist.

The Uninsured Population and Health Coverage
Published: May 28, 2024
Health Policy 101:
KFF Authors:
Table of Contents
Introduction
What is the Landscape of Health Care Coverage in the United States?
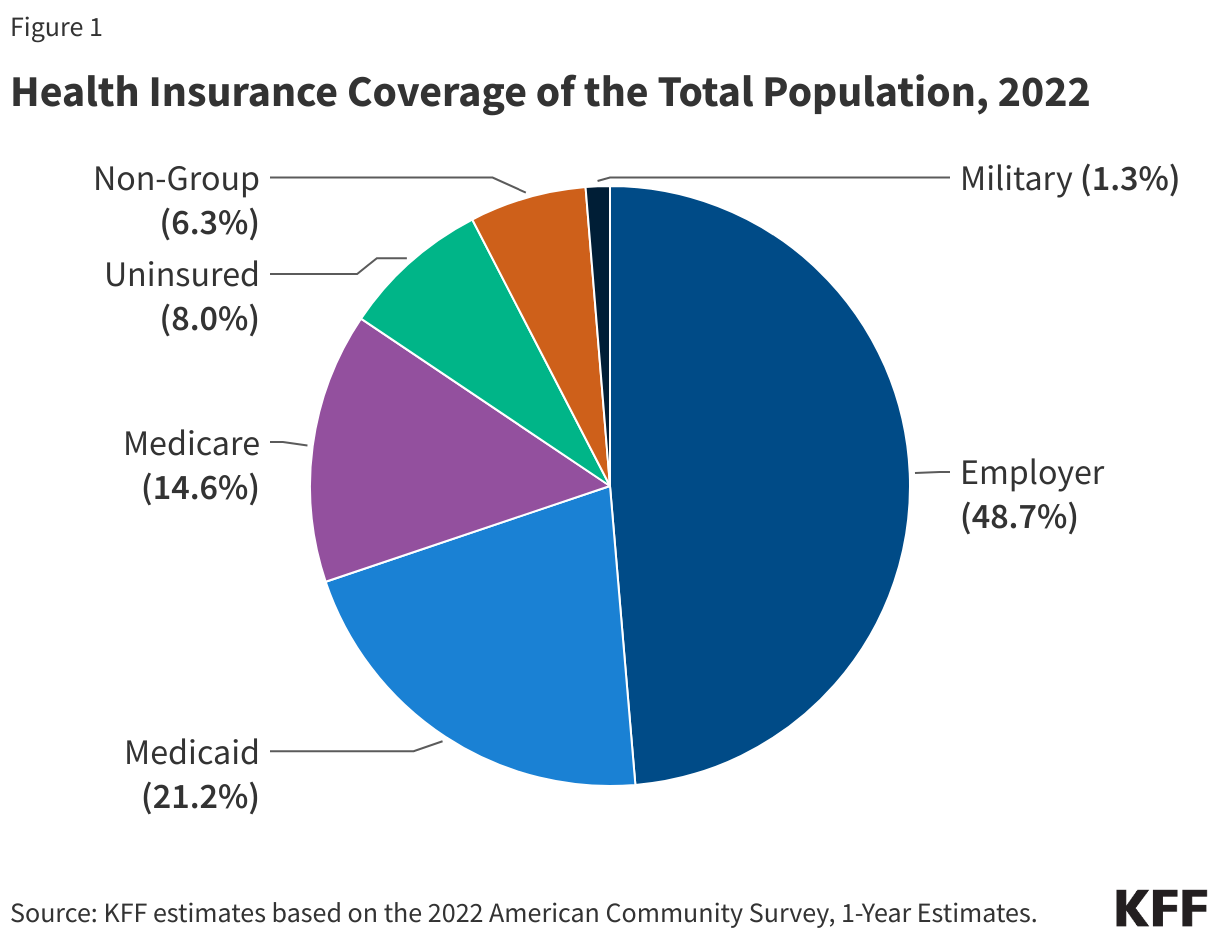
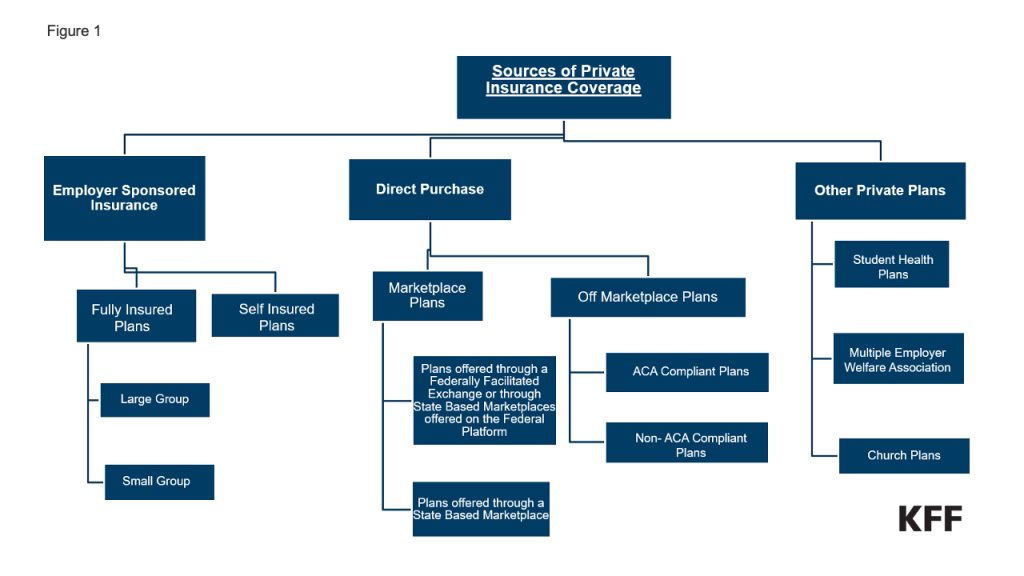
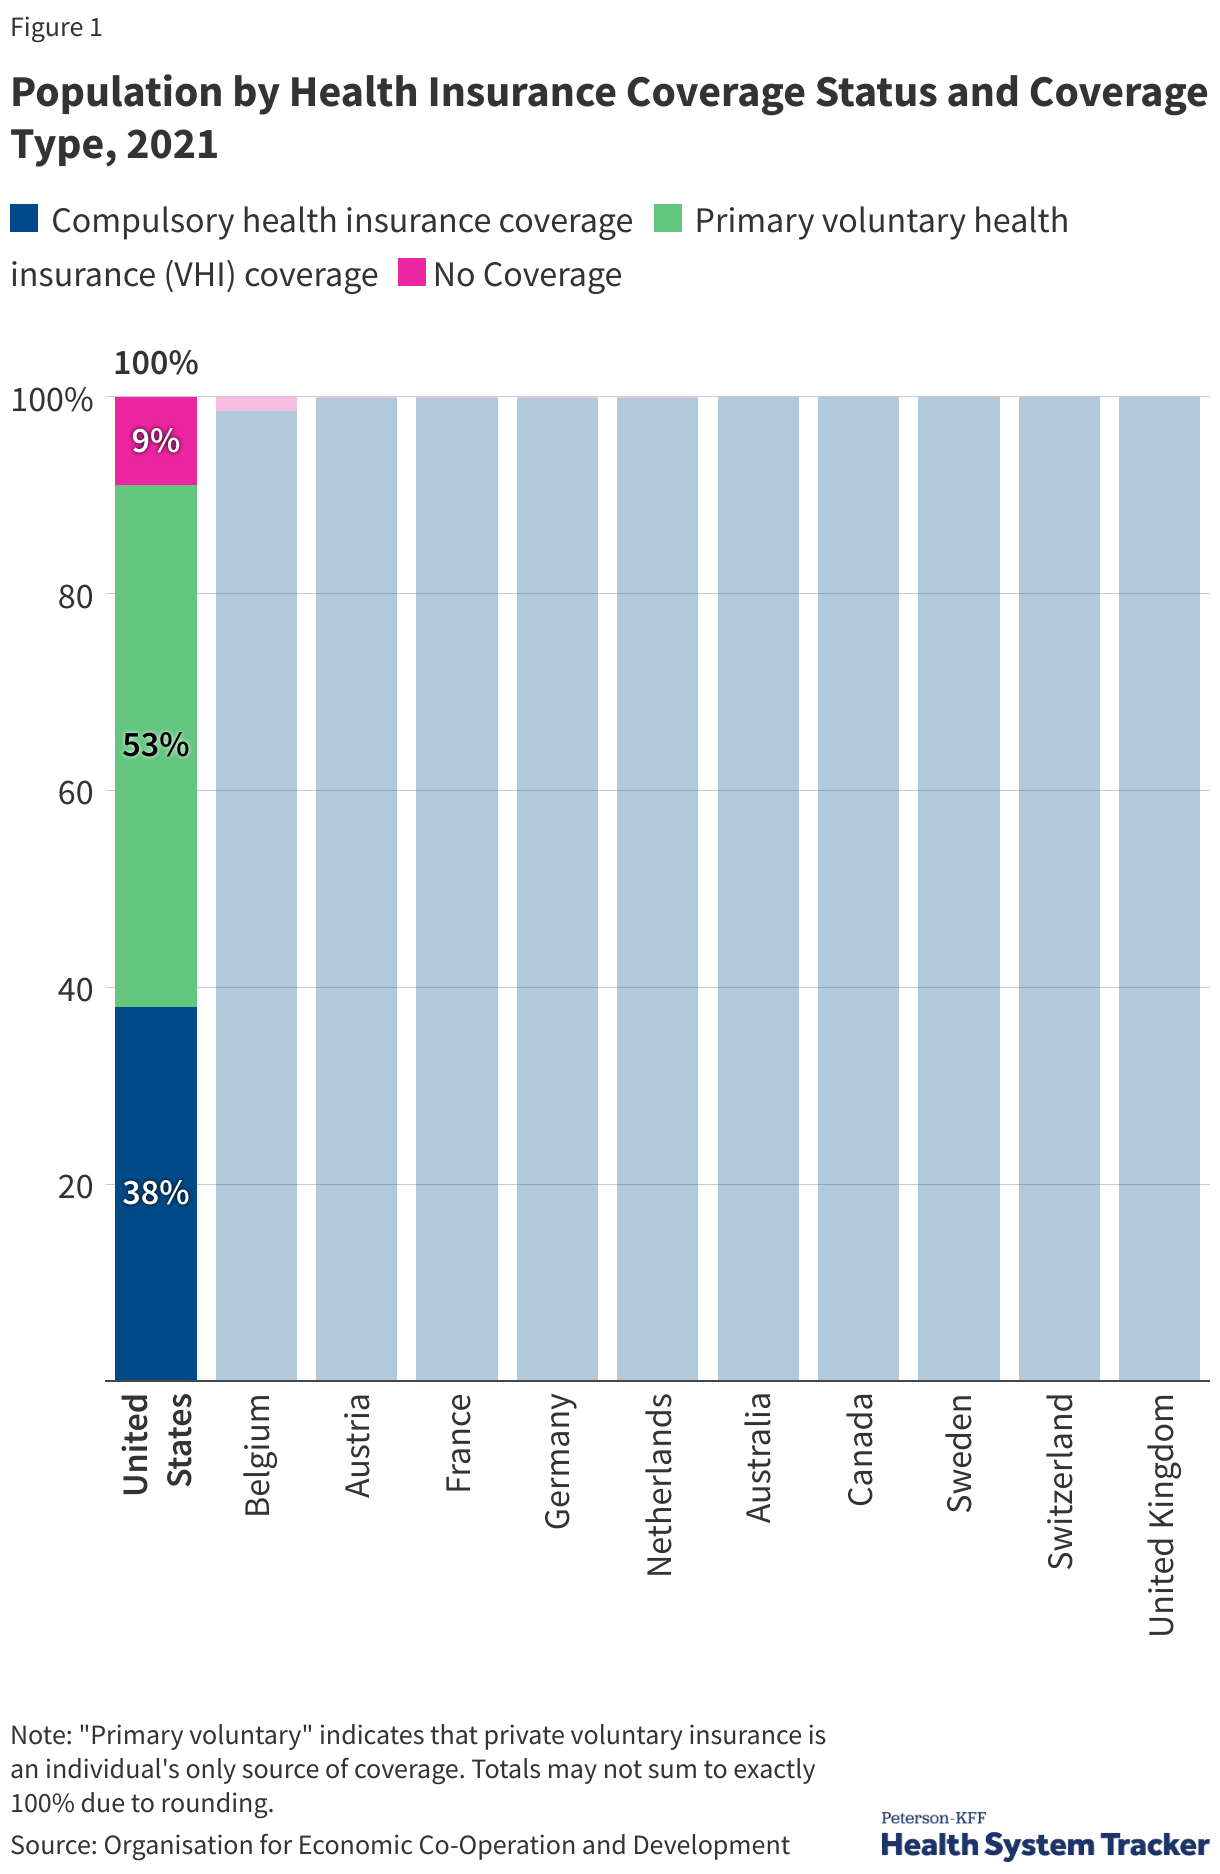
Health coverage in the U.S. is a complex patchwork of private and public insurance coverage options. In 2022, most residents had private insurance coverage, with nearly half covered by an employer-based plan . About 1 in 5 U.S. residents received coverage through the Medicaid program, the federal and state-financed comprehensive health coverage program for low-income people. Another roughly 15% of the population had health coverage from the federal Medicare program, which covers seniors and people under age 65 with long-term disabilities. About 6% of the population had private non-group insurance either purchased through the ACA Marketplace or off-market, and just over 1% of the population was covered through the military’s Tricare program. The uninsured rate for the total population was 8.0% for the year (Figure 1). (In some cases, people have multiple forms of coverage. For example, about 13 million people are enrolled in both Medicare and Medicaid and are classified in these figures as covered by Medicaid.)
Trends in the Uninsured Rate
In 2022, there were 25.6 million nonelderly uninsured residents and the uninsured rate among the nonelderly population was 9.6%, the lowest rate in U.S. history (Figure 2). The analysis of the uninsured population focuses on coverage among nonelderly people since Medicare offers near-universal coverage for seniors, with just 457,000, or less than 1%, of people over age 65 uninsured.
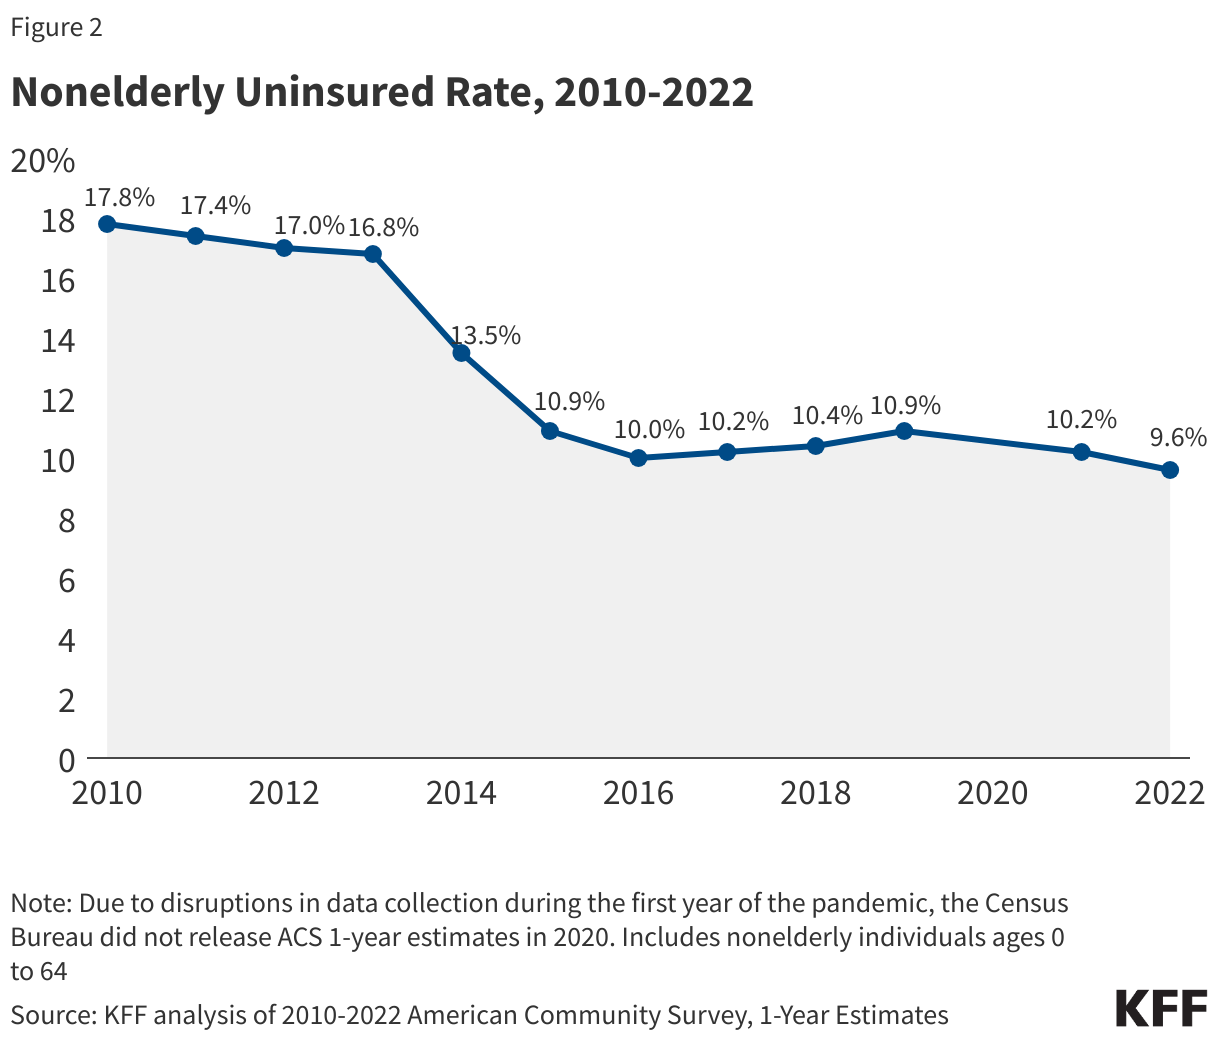
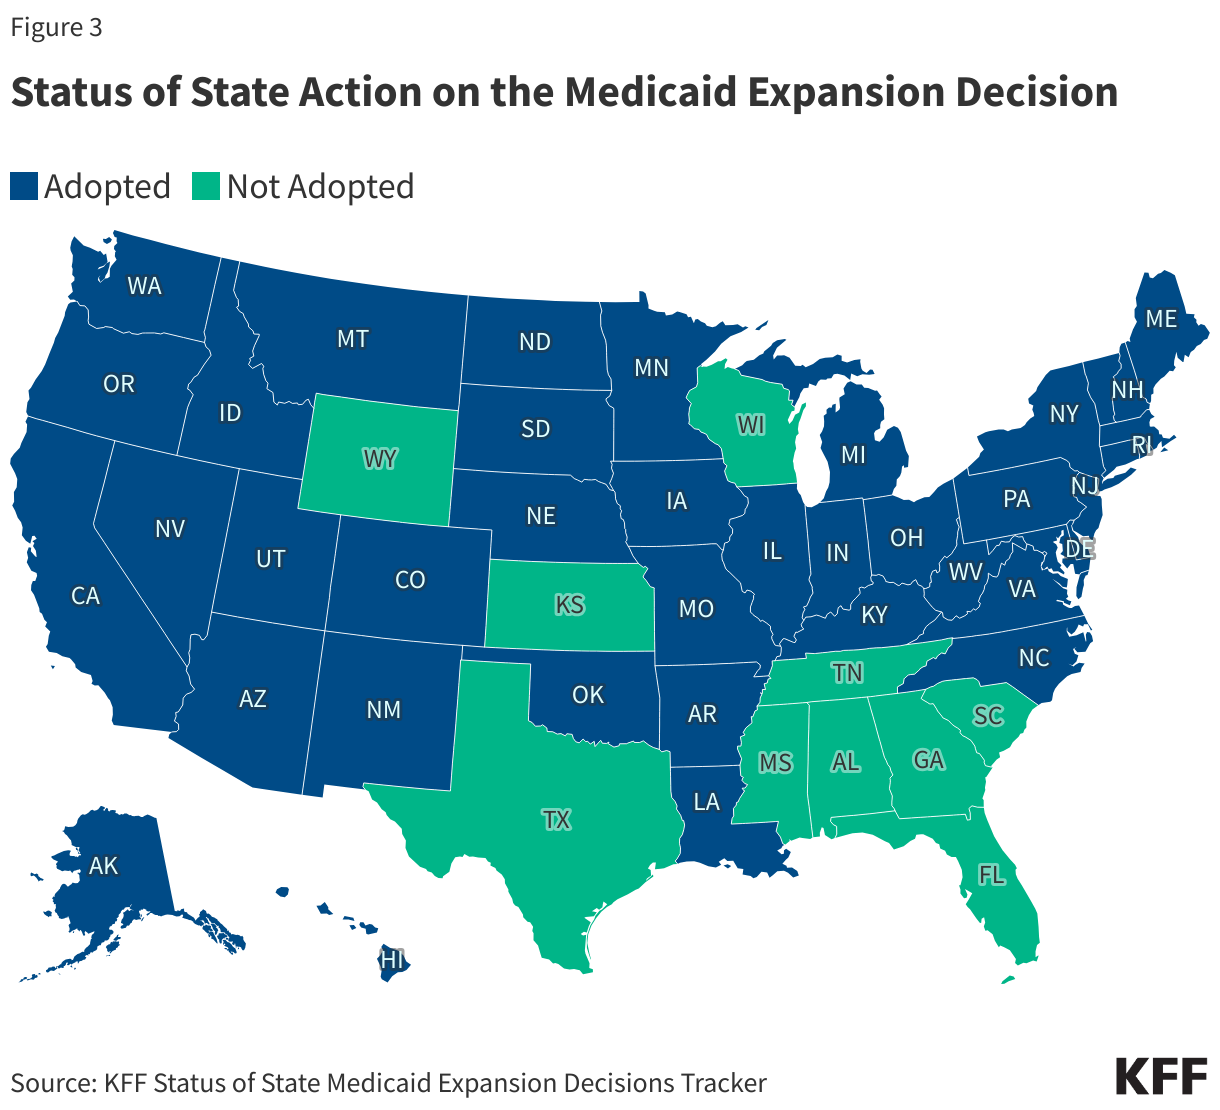
Prior to the implementation of the ACA, gaps in the public insurance system and lack of access to affordable private coverage left over 40 million people without health insurance. The ACA expanded health insurance coverage by extending Medicaid coverage to nearly all adults with incomes up to 138% of the federal poverty level (FPL) (the poverty level in the continental U.S. is $14,580 for a single individual in 2024) and creating new health insurance Marketplaces through which individuals can purchase coverage with financial help to afford premiums and cost-sharing. Following the passage of the ACA in 2010 and the rollout of the coverage provisions, the number of nonelderly uninsured people dropped to 27 million in 2016. The ACA envisioned that all states would adopt the Medicaid expansion; however, a Supreme Court ruling in 2012 made expansion optional for states. As of early 2024, 40 states and Washington, D.C. had adopted the ACA’s Medicaid expansion (Figure 3).
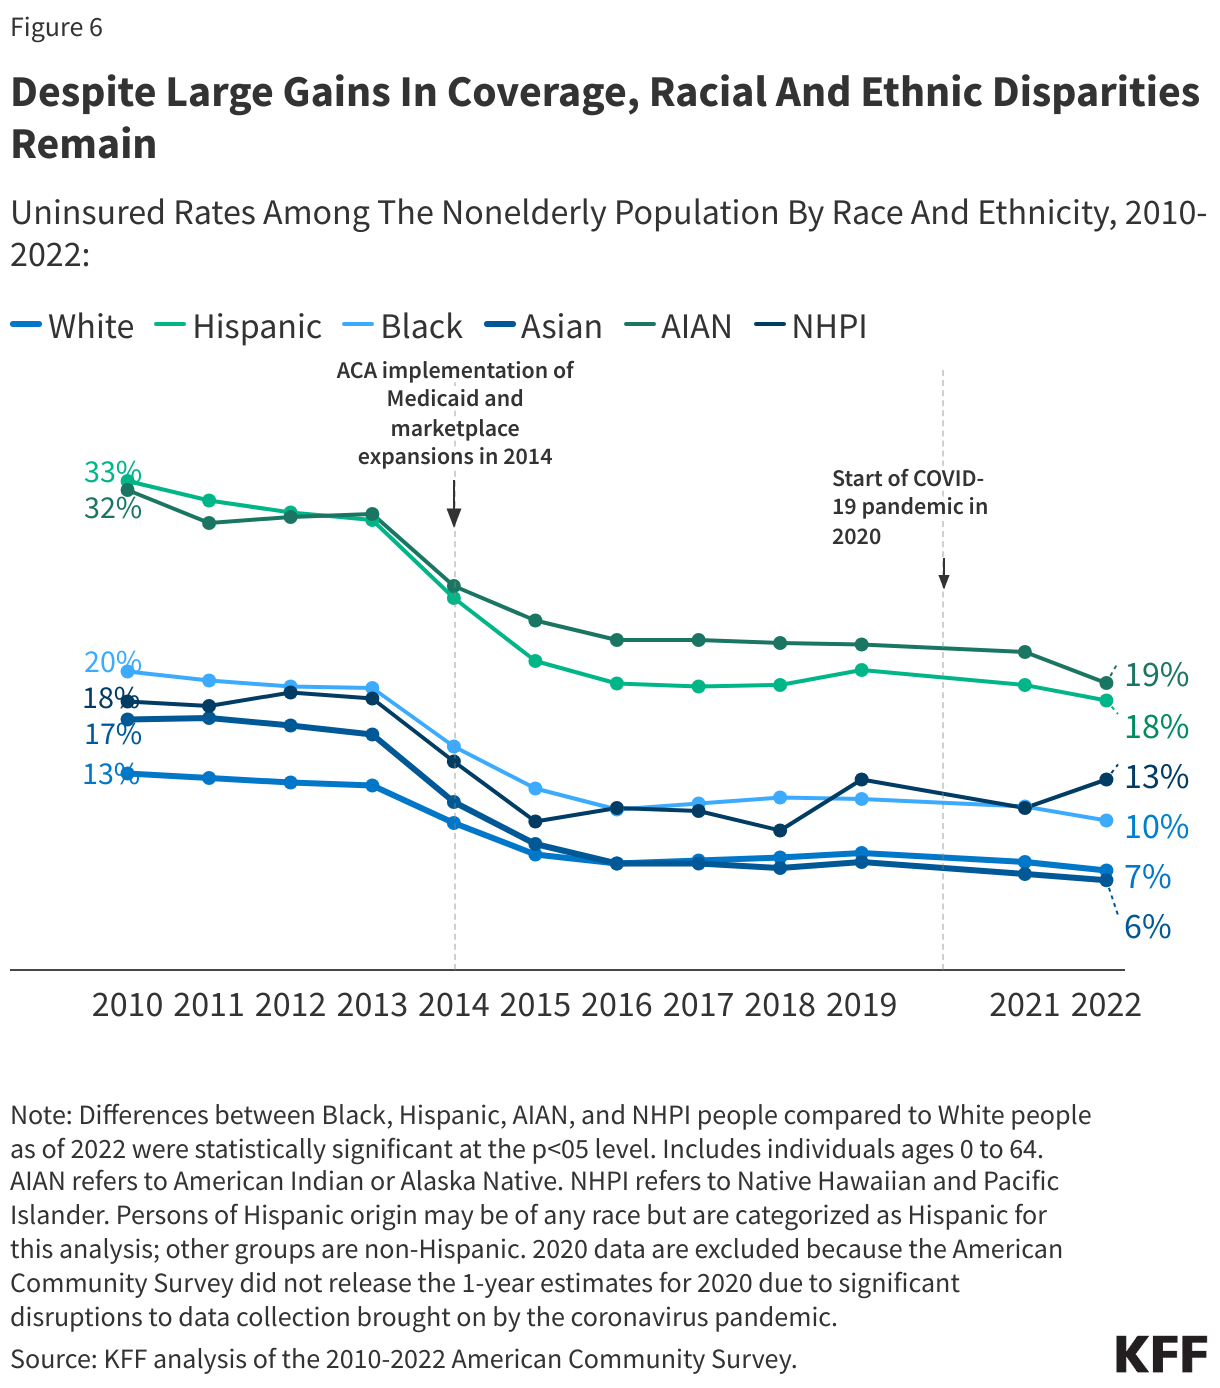
The declines in uninsured rates following implementation of the ACA coverage expansions were largest among poor and near-poor nonelderly individuals, particularly adults. People of color, who had higher uninsured rates than White people prior to 2014, had larger coverage gains from 2013 to 2016 than White people, although the coverage disparities were not eliminated.
Before implementation of the ACA, expansions of Medicaid coverage and the enactment of the Children’s Health Insurance Program (CHIP) helped to lower the uninsured rate for children. Changes in the 1980s and early 1990s expanded Medicaid eligibility levels for children and pregnant people, and the establishment of CHIP in 1997 provided coverage for children with incomes above Medicaid thresholds. When states implemented CHIP, extensive outreach efforts along with the adoption of streamlined processes facilitated enrollment of children in Medicaid and CHIP and reduced the number of uninsured children.
After declining through 2016, the number of uninsured people and the uninsured rate began increasing in 2017 and continued to grow through 2019. Generally favorable economic conditions as well as policy changes during the Trump Administration, such as reduced funding for outreach and enrollment assistance, encouraging periodic Medicaid eligibility checks, changes to immigration policy related to public charge rules, and approval of some demonstration waivers to restrict enrollment led to a decline in Medicaid enrollment, which likely contributed to the increase in uninsured people.
With the arrival of the COVID-19 pandemic, policies adopted to protect coverage drove a decline in the uninsured population from 2019 to 2022. The Families First Coronavirus Response Act required states to keep people continuously enrolled in Medicaid in exchange for enhanced federal funding. (Medicaid continuous enrollment ended in March 2023.) In addition, the American Rescue Plan Act (ARPA) provided temporary enhanced ACA Marketplace subsidies to make Marketplace coverage more affordable, and these subsidies were renewed for another three years in the Inflation Reduction Act of 2022.
Who is Uninsured in the United States?
Most people who are uninsured are nonelderly adults, in working low-income families, are people of color, and, reflecting geographic variation in income, immigration status, and the availability of public coverage, live in the South or West. In 2022, over 7 in 10 people who were uninsured were nonelderly adults and just over a quarter were children.
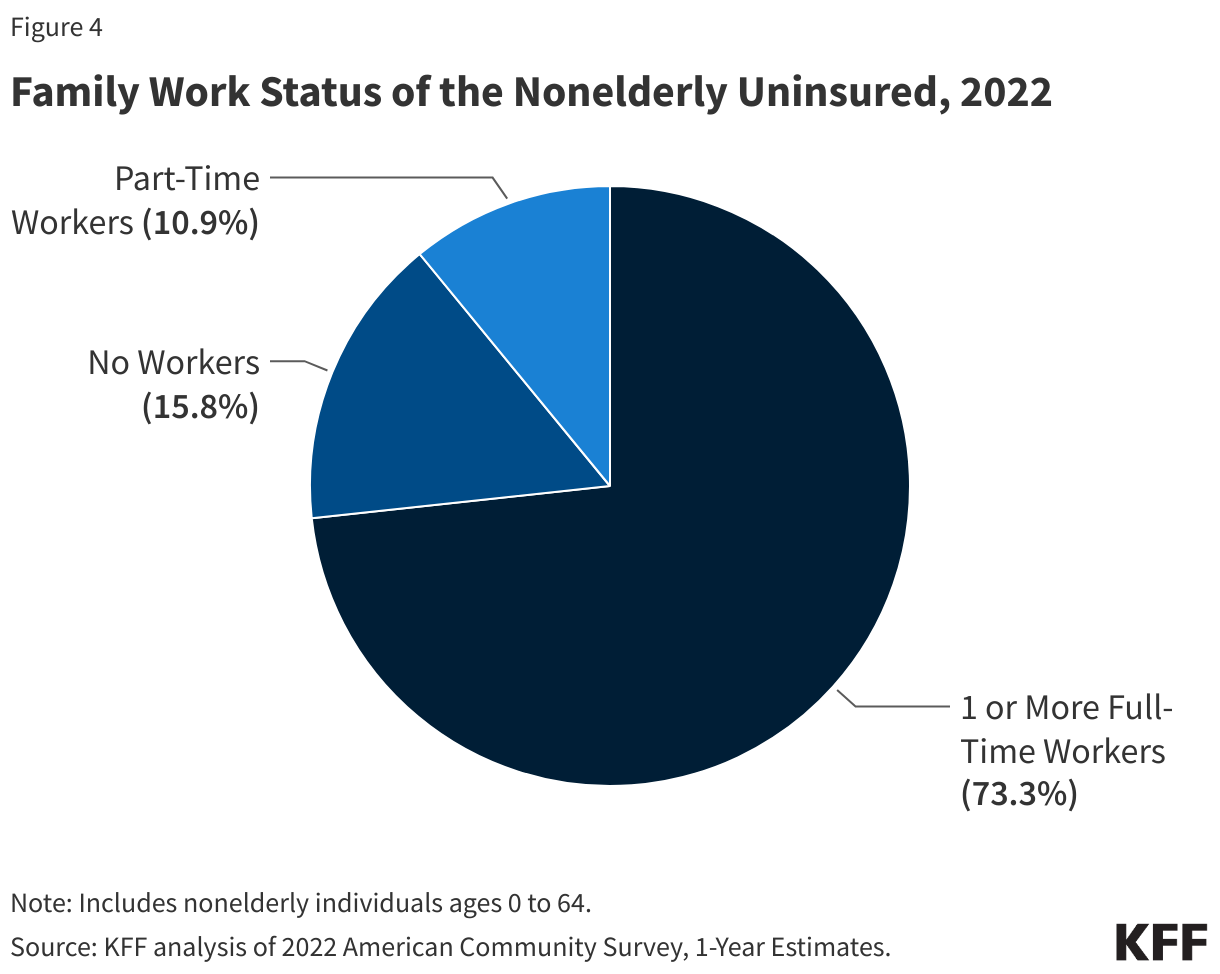
Nearly three-quarters (73.3%) of the nonelderly uninsured population had at least one full-time worker in their family and an additional 10.9% had a part-time worker in their family (Figure 4). More than 8 in 10 (80.8%) people who were uninsured were in families with incomes below 400% FPL in 2022 and nearly half (46.6%) had incomes below 200% FPL. People of color comprised over 62% of the nonelderly uninsured population in 2022 despite making up about 46% of nonelderly residents. Most uninsured individuals (75.6%) were U.S. citizens, while 24.4% were noncitizens in 2022. Nearly three-quarters lived in the South and West.
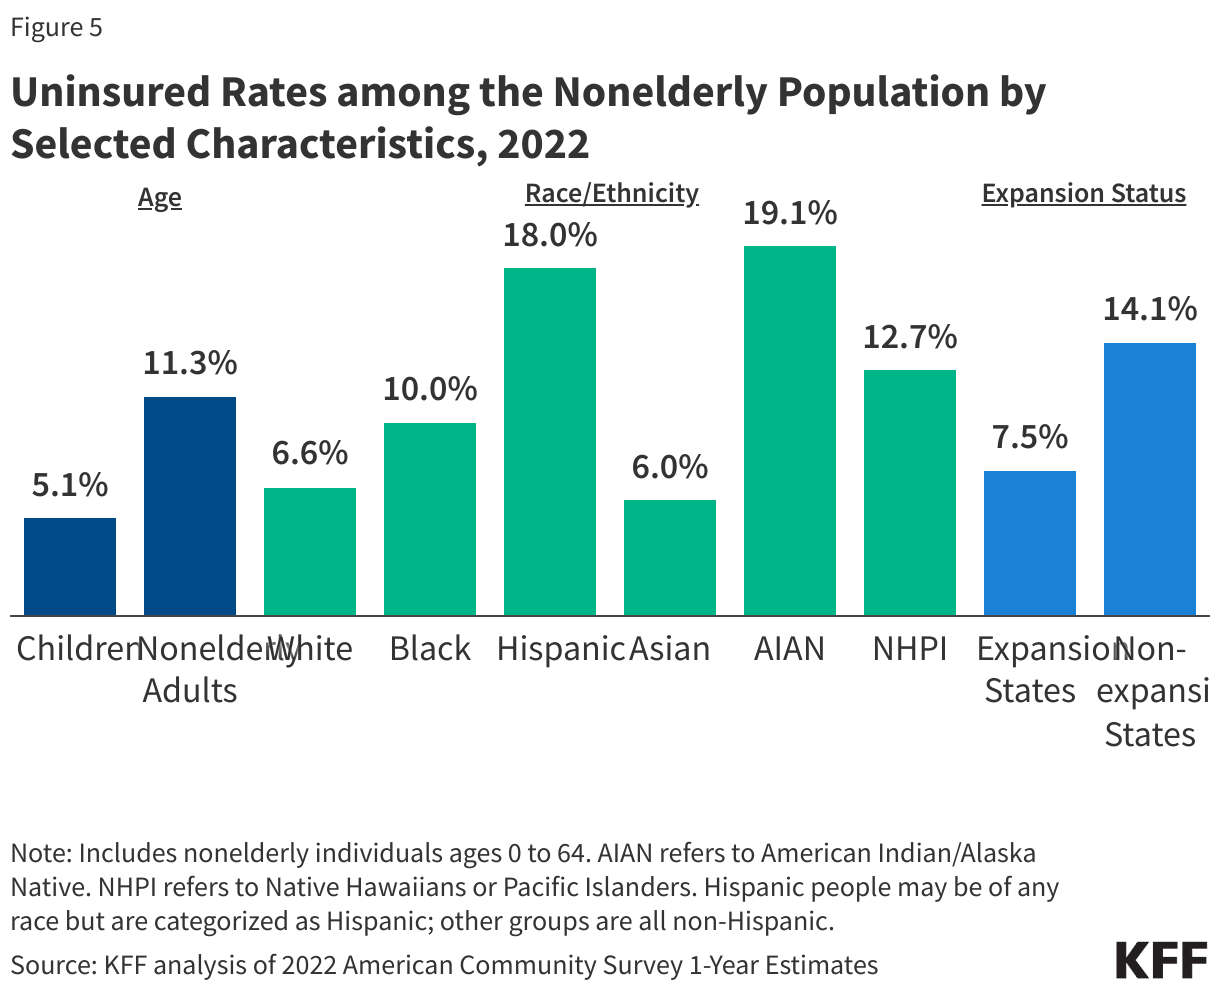
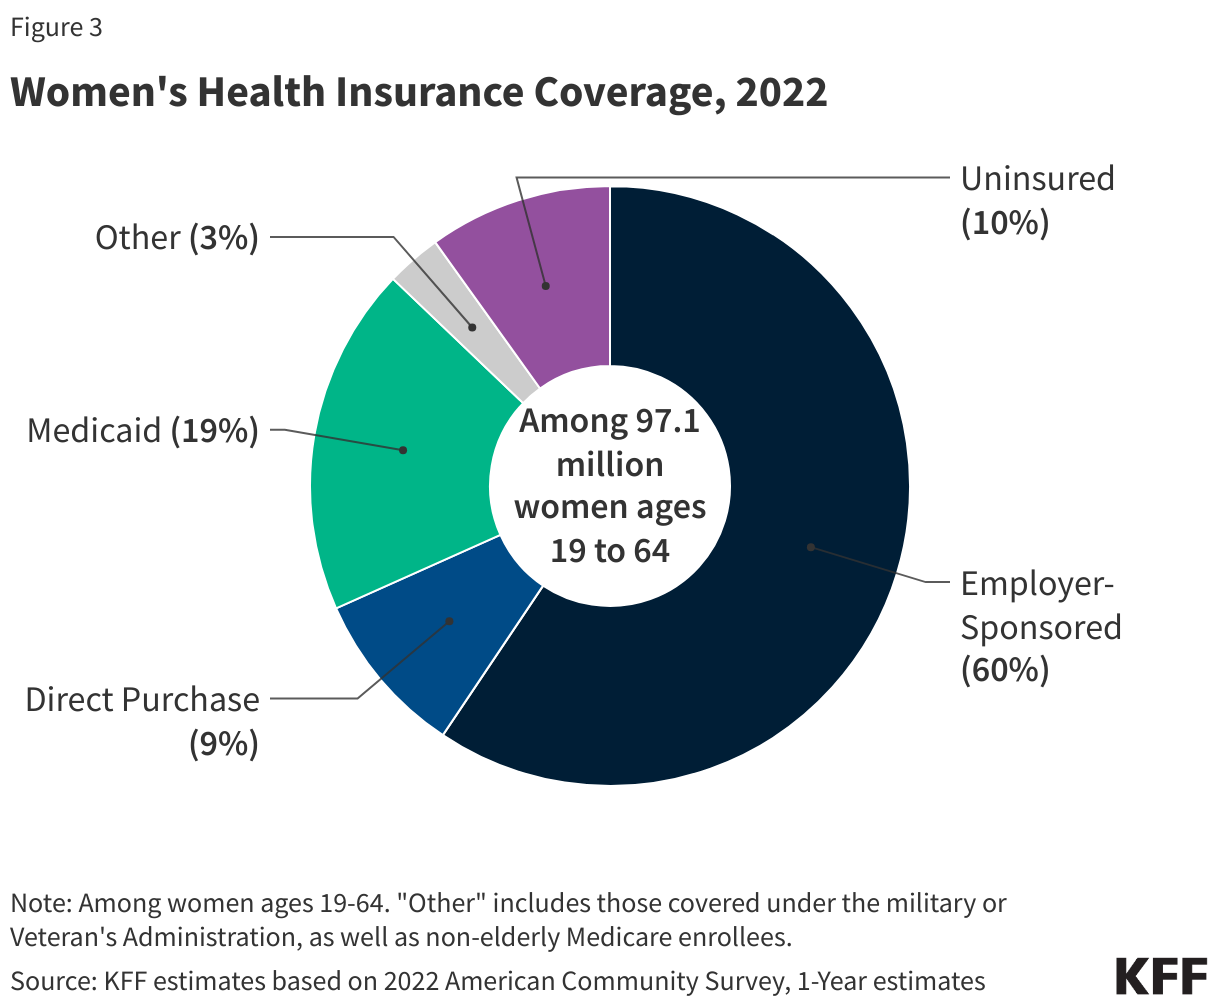
Nonelderly adults are more likely to be uninsured than children. The uninsured rate among children (5.1%) was less than half the rate among nonelderly adults (11.3%) in 2022, largely due to the broader availability of Medicaid and CHIP coverage for children than for adults. Among nonelderly adults, men had higher uninsured rates than women in 2022 (12.8% vs. 9.8%).
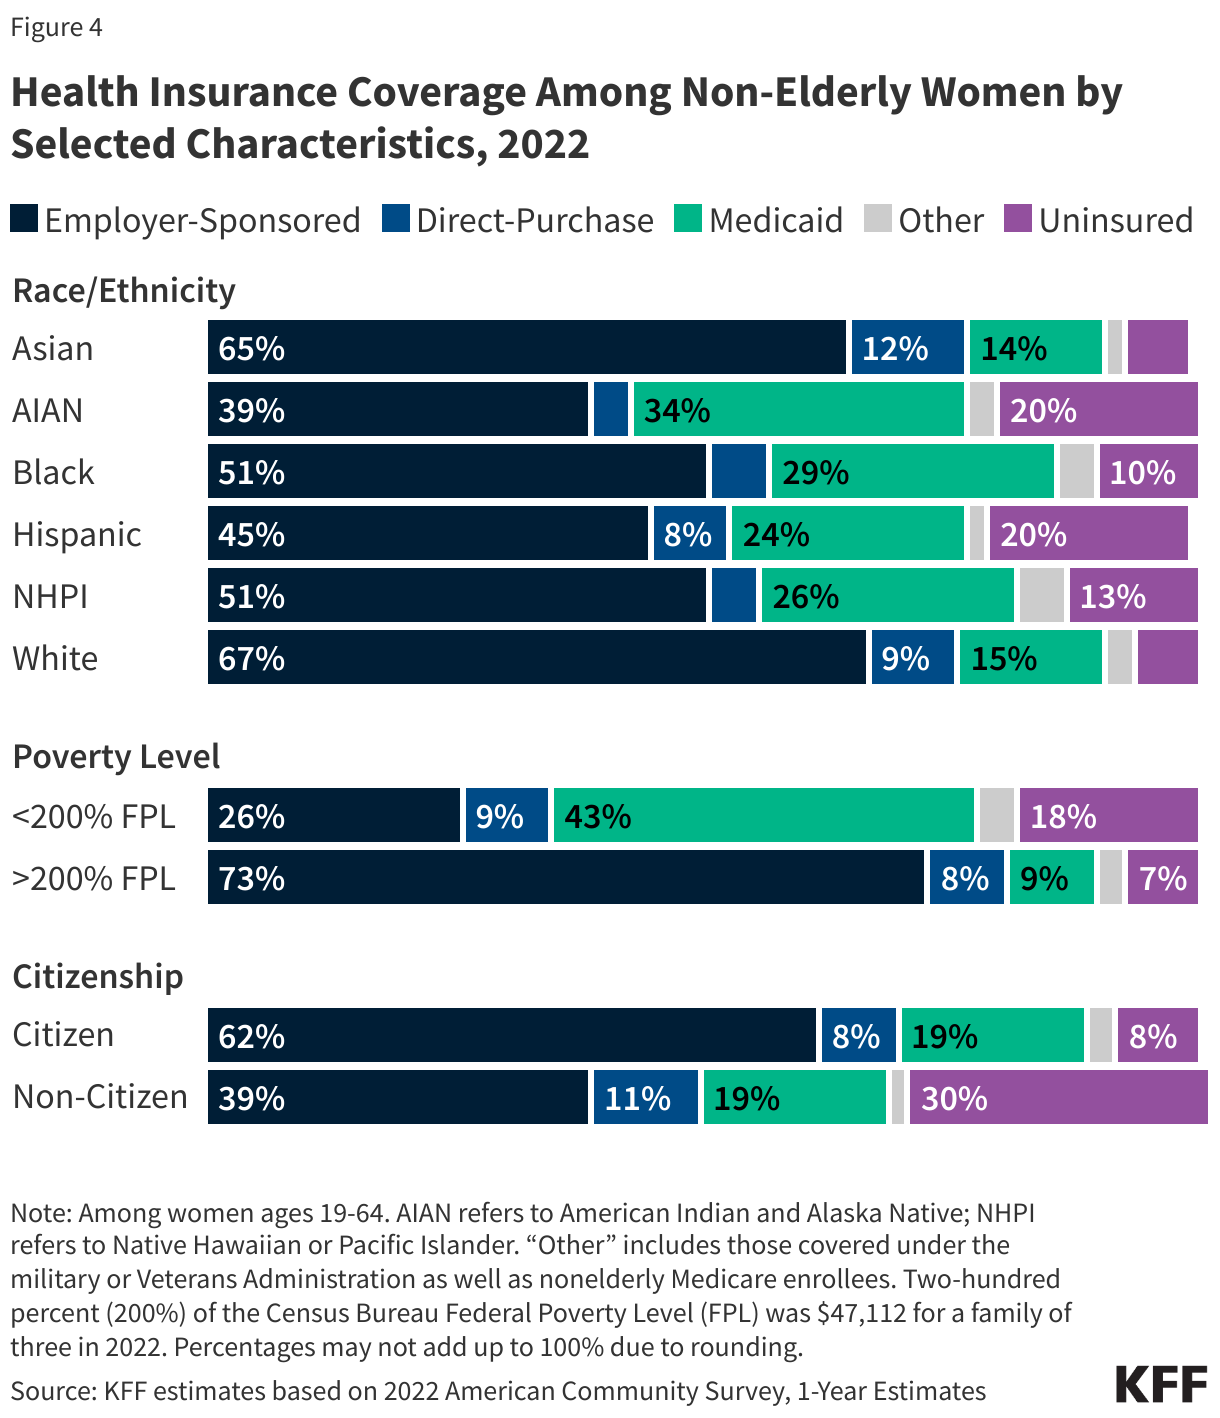
Reflecting persistent disparities in coverage, people of color are generally more likely to be uninsured than White people. In 2022, nonelderly American Indian and Alaskan Native (AIAN) and Hispanic people had the highest uninsured rates at 19.1% and 18.0%, respectively, which were nearly three times higher than the uninsured rate for White people (6.6%). Uninsured rates for nonelderly Native Hawaiian or Pacific Islander (NHPI) (12.7%) and Black people (10.0%) were also higher than the rate for their White counterparts (Figure 5). These differences in uninsured rates are driven by lower rates of private coverage among these groups. Medicaid coverage helps to narrow these differences but does not fully offset them.
Noncitizens are more likely than citizens to be uninsured. The uninsured rate for recent immigrants, those who have been in the U.S. for less than five years, was 30.3% in 2022, while the uninsured rate for immigrants who have lived in the US for more than five years was 33.1%. By comparison, the uninsured rate for U.S.-born citizens was 7.7% and 9.5% for naturalized citizens in 2022. One in 4 children has an immigrant parent, including over 1 in 10 (12%) who are citizen children with at least one noncitizen parent.
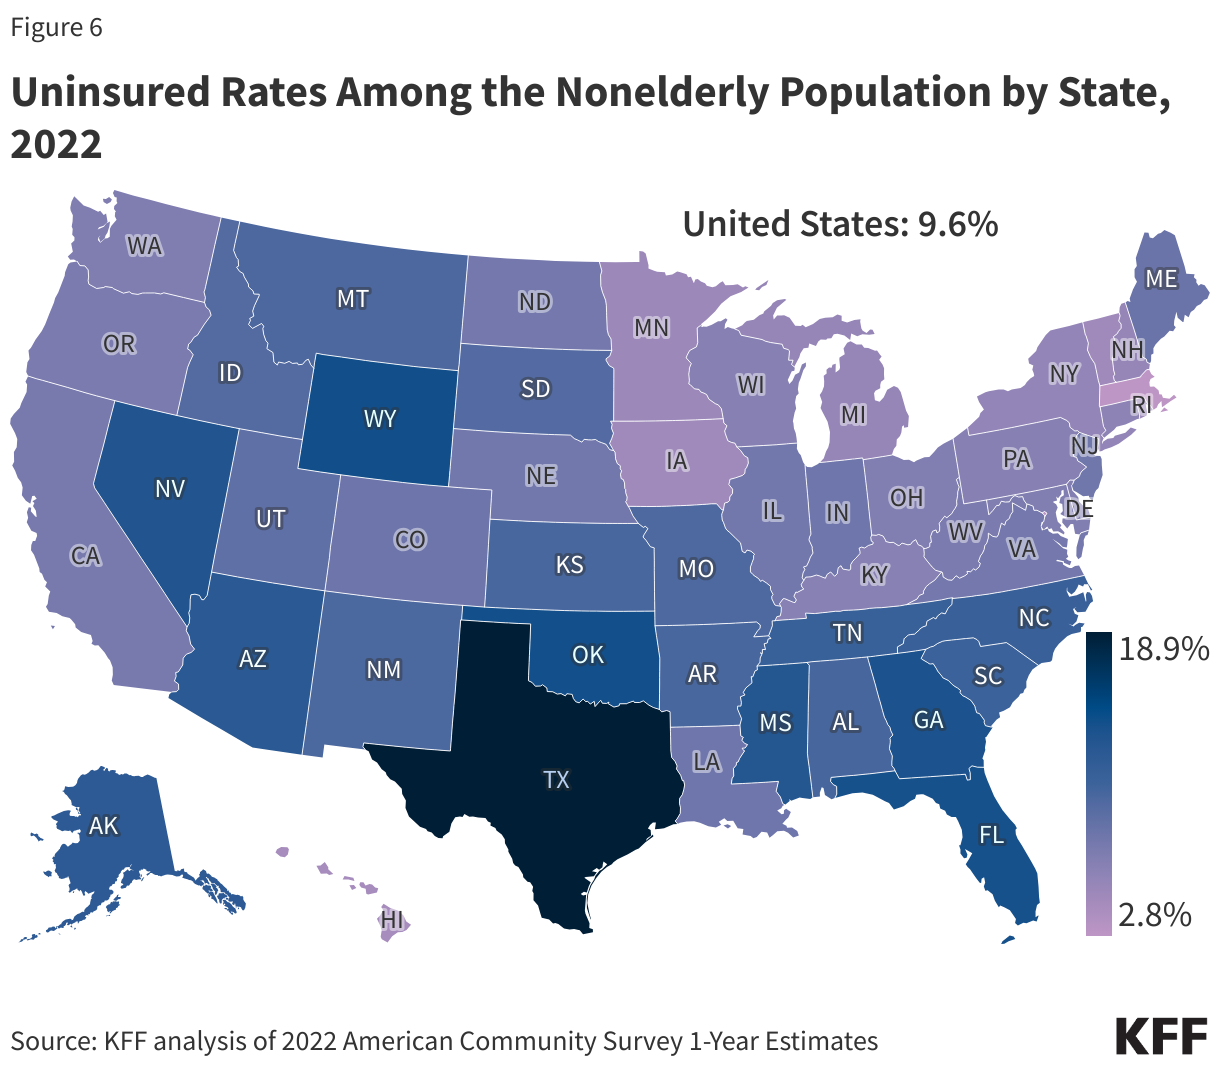
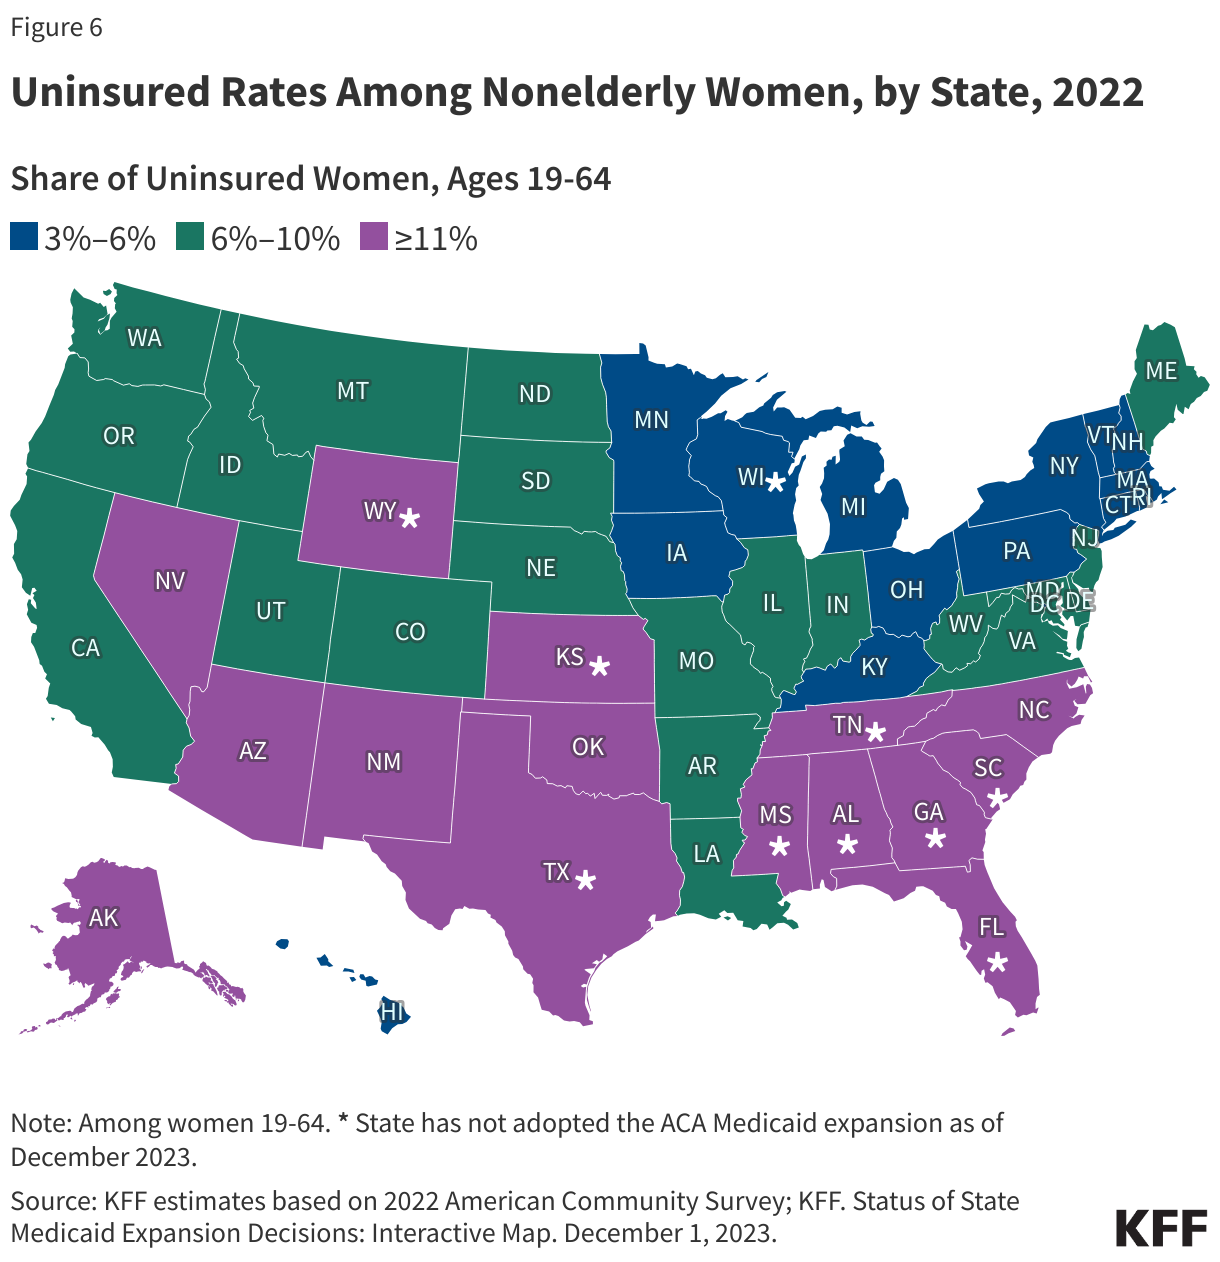
Uninsured rates vary by state and by region and were generally higher in states that had not taken up the ACA Medicaid expansion in 2022 (Figure 6). Economic conditions, availability of employer-sponsored coverage, and demographics are other factors contributing to variation in uninsured rates across states.
Why are People Uninsured?
The fragmented U.S. health coverage system leads to gaps in coverage. While employer-based insurance is the prevalent source of coverage for the nonelderly population, not all workers are offered coverage by their employer or, if offered, can afford their share of the premiums. Medicaid covers many low-income individuals, especially children, but eligibility for adults remains limited in most states that have not adopted the ACA Medicaid expansion. While subsidies for Marketplace coverage are available for many low and moderate-income people, few people can afford to purchase private coverage without financial assistance.
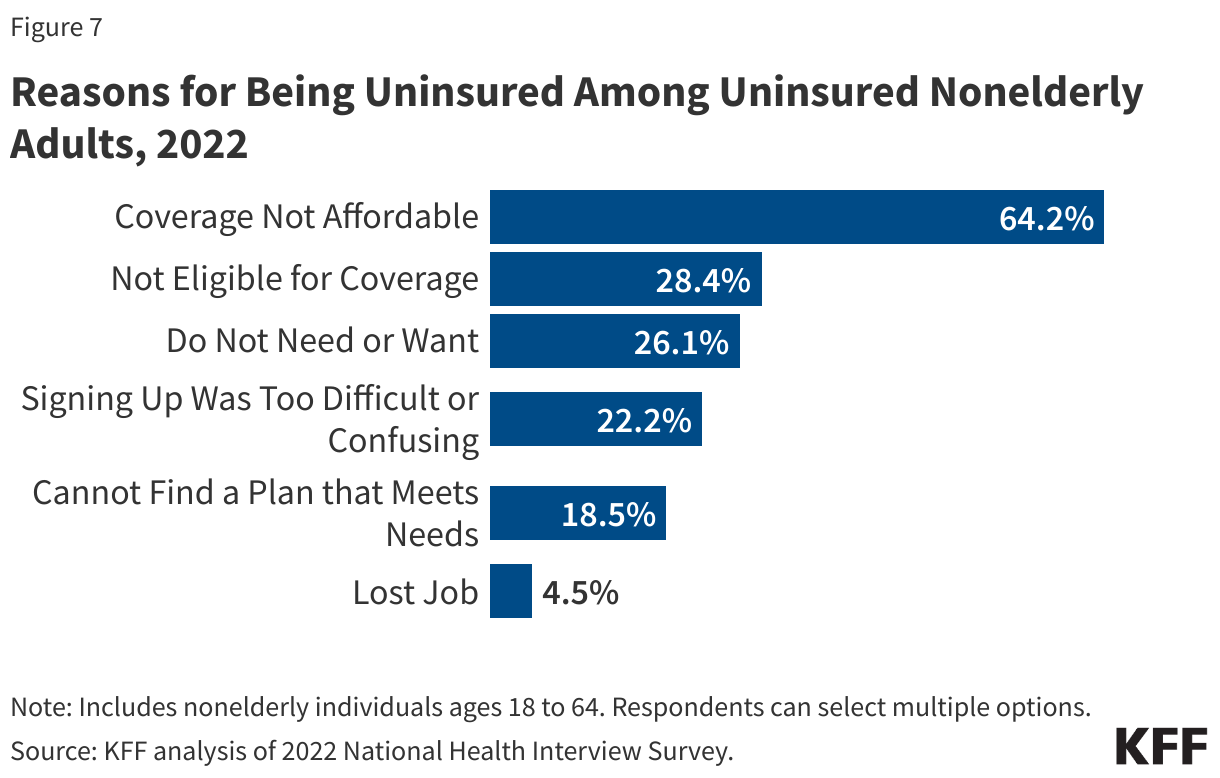
The cost of health coverage and care poses a challenge for the country broadly and is a significant barrier to coverage for people who are uninsured. In 2022, 64.2% of uninsured nonelderly adults said they were uninsured because coverage is not affordable, making it the most common reason cited for being uninsured (Figure 7). Other reasons included not being eligible for coverage (28.4%), not needing or wanting coverage (26.1%), and signing up being too difficult (22.2%).
Not all workers have access to coverage through their jobs. In 2022, 60.7% of nonelderly uninsured workers worked for an employer that did not offer them health benefits. Among uninsured workers who are offered coverage by their employers, cost is often a barrier to taking up the offer. Low-income families with employer-based coverage spend a significantly higher share of their income toward premiums and out-of-pocket medical expenses compared to those with income above 200% FPL.
A decade after the implementation of the ACA coverage options, 10 states have not adopted the Medicaid expansion, leaving 1.5 million uninsured people without an affordable coverage option. A coverage gap exists in states that have not adopted the expansion for poor adults who earn too much to qualify for Medicaid coverage but not enough to be eligible for subsidies in the Marketplace.
Lawfully present immigrants generally must meet a five-year waiting period after receiving qualified immigration status before they can qualify for Medicaid. States have the option to cover eligible children and pregnant people without a waiting period, and as of January 2023, 35 states have elected the option for children and 26 states have taken up the option for lawfully present pregnant individuals. Lawfully present immigrants are eligible for Marketplace tax credits, including those who are not eligible for Medicaid because they have not met the five-year waiting period. However, the fear of the federal rules about “public charge,” which can deny an individual entry to the U.S. or adjustment to lawful permanent status (a green card) if it is determined the individual has a likelihood of becoming primarily dependent on the government for subsistence, can deter immigrants from seeking coverage. Undocumented immigrants are ineligible for federally-funded coverage, including Medicaid and Marketplace coverage.
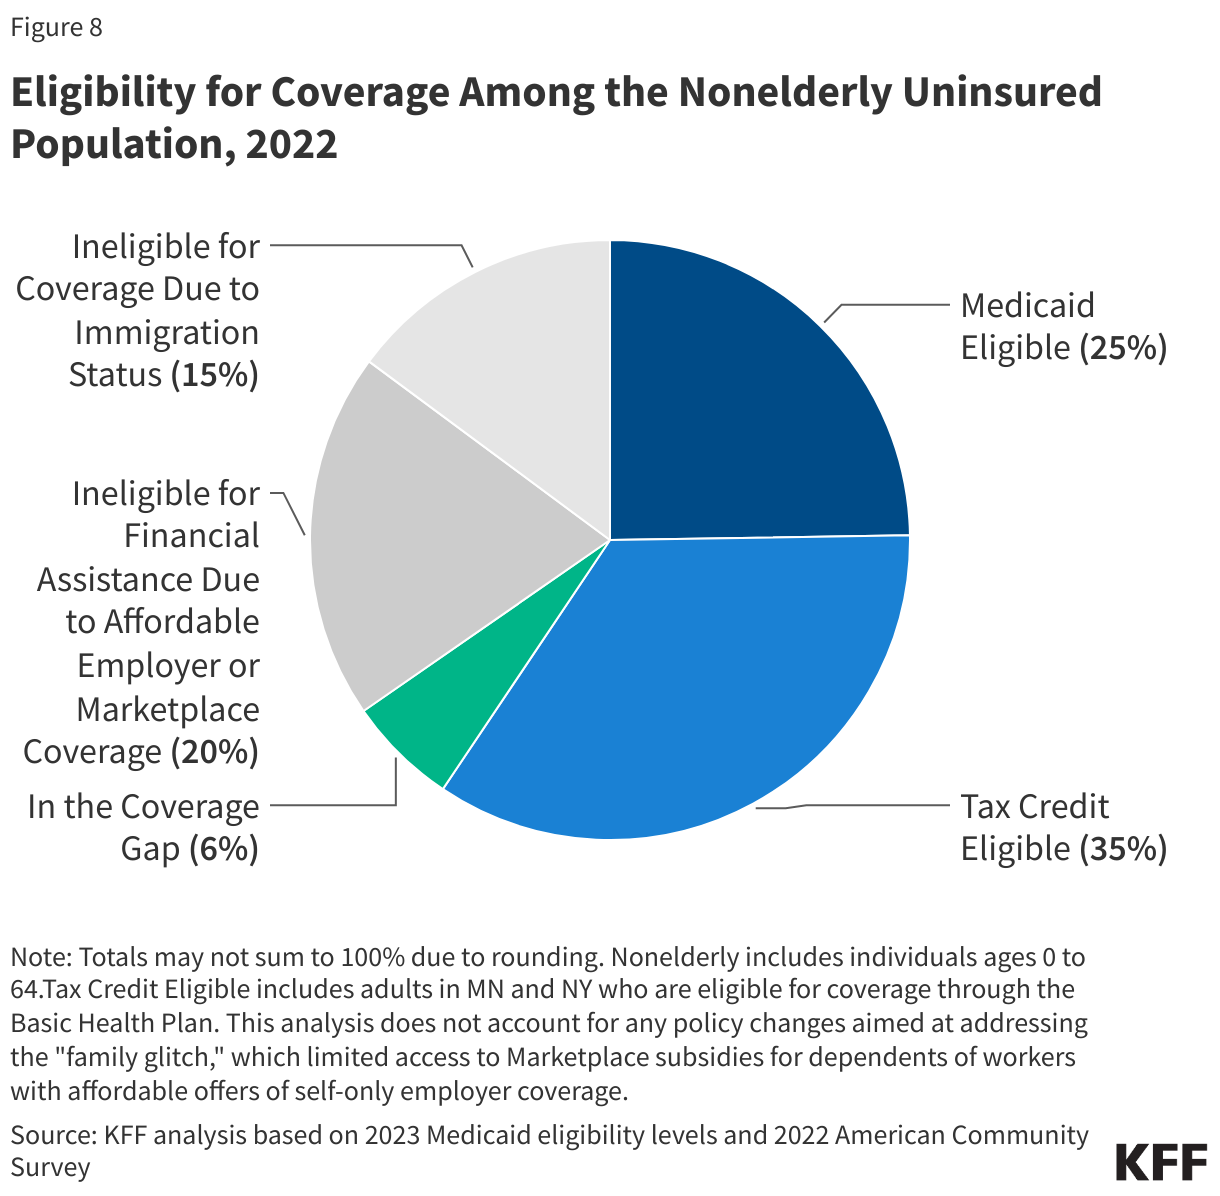
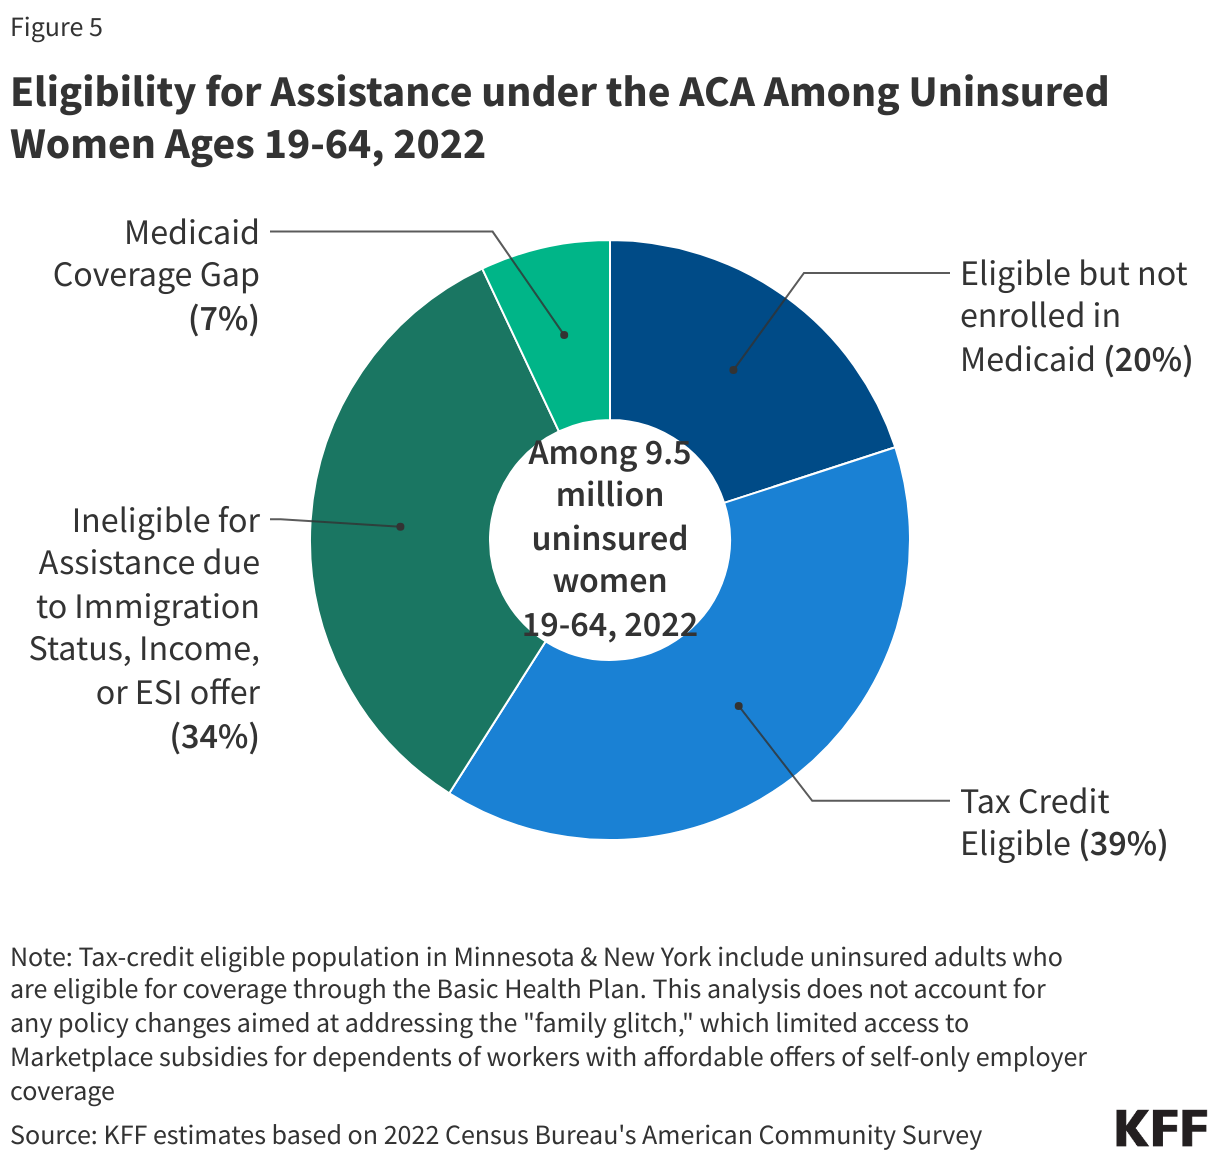
Though financial assistance is available to many of the remaining uninsured under the ACA, not everyone who is uninsured is eligible for free or subsidized coverage. Six in 10 (15.3 million) uninsured individuals in 2022 were eligible for financial assistance through Medicaid or subsidized Marketplace coverage (Figure 8). However, 4 in 10 uninsured (10.3 million) were outside the reach of the ACA because their state did not expand Medicaid, their immigration status made them ineligible, or they were deemed to have access to an affordable Marketplace plan or offer of employer coverage (Figure 8).
What are the Consequences of Being Uninsured?
Lacking health insurance in the United States can impact a person’s access to health care, their financial situation, and their health status. It can also broadly impact a community’s public health (illustrated by the COVID-19 pandemic) and the economy through lower productivity.
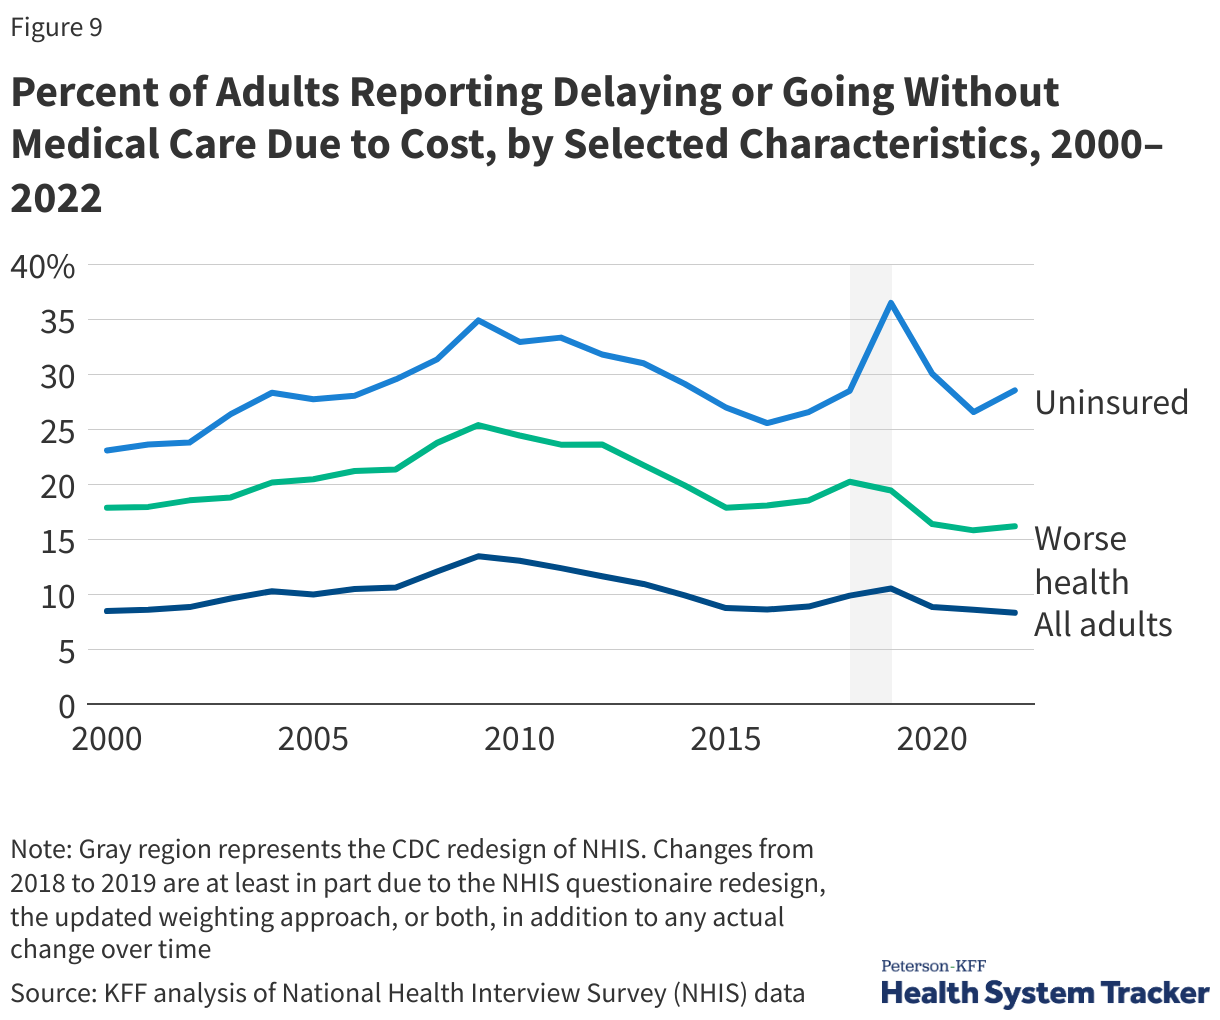
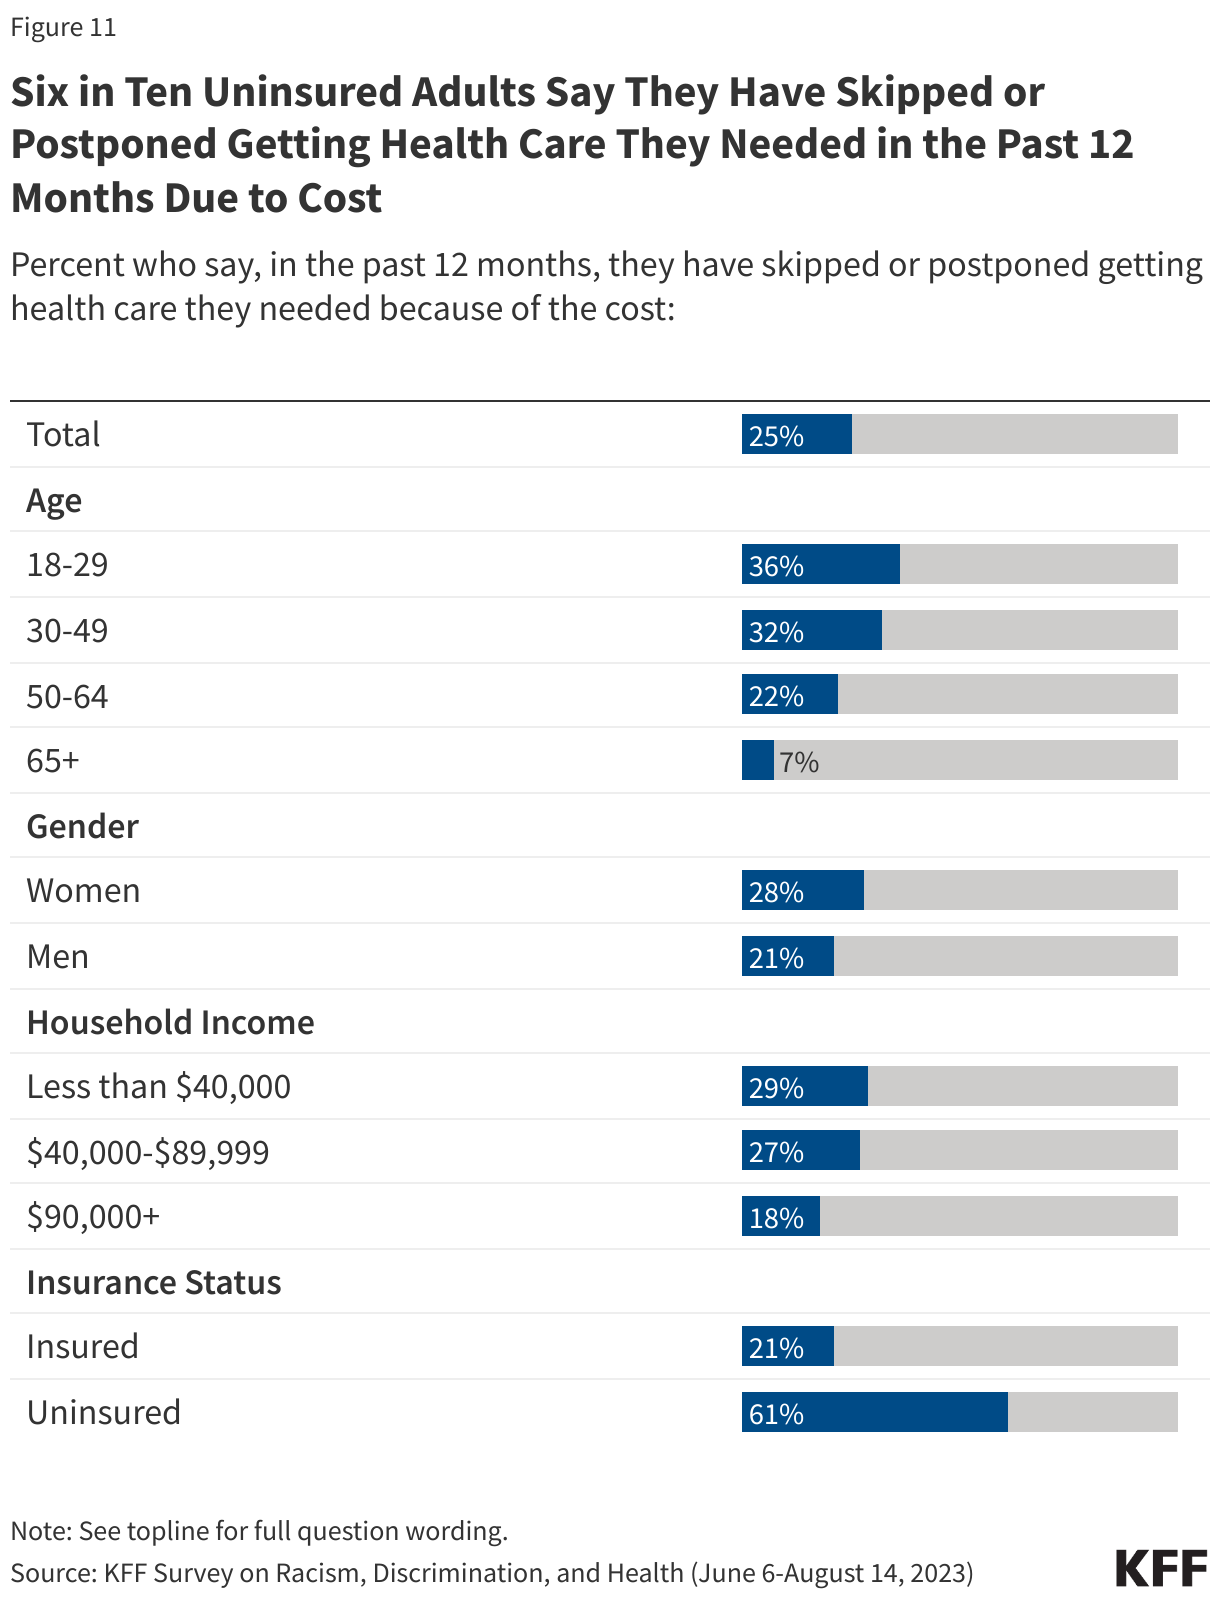
Adults who are uninsured are four times more likely than adults with insurance to report not having a usual source of care, which is often a key entry point for accessing health care whether for preventive services or for treating existing conditions. Consequently, in 2022, nearly half (47.4%) of nonelderly uninsured adults reported not seeing a doctor or health care professional in the past 12 months compared to 16.6% with private insurance and 14.0% with public coverage. Uninsured individuals are also more likely to face cost barriers to accessing needed care. In 2022, 29% of uninsured adults reported delaying or not getting care due to cost compared to 6% of insured adults (Figure 9).
The lack of access to health care and a delay in seeking care due to costs means uninsured people are more likely to be hospitalized for avoidable health problems and to experience declines in their overall health. Research also shows that when they are hospitalized, uninsured people receive fewer diagnostic and therapeutic services and have higher mortality rates than those with insurance.
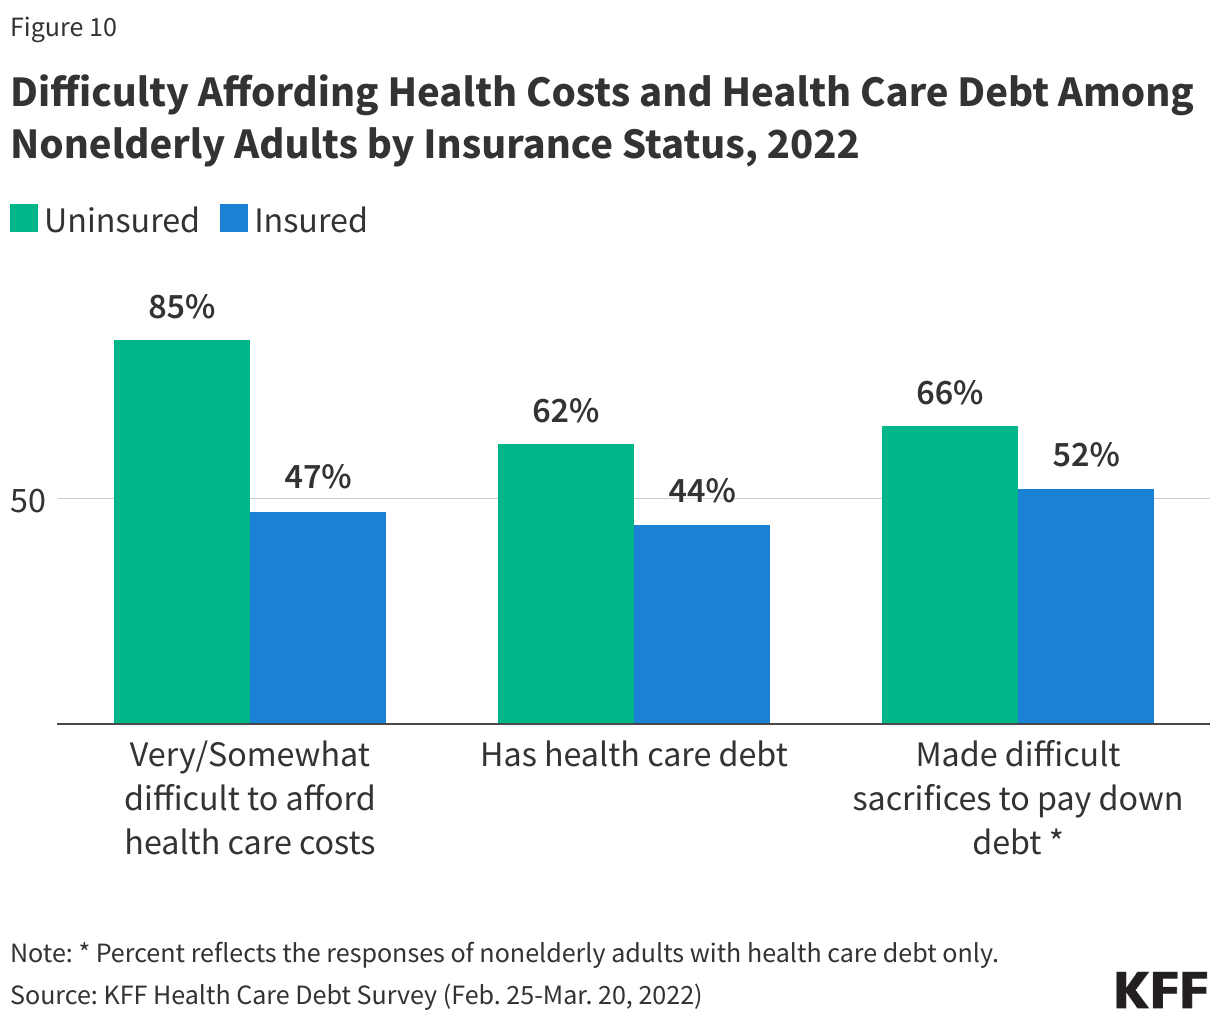
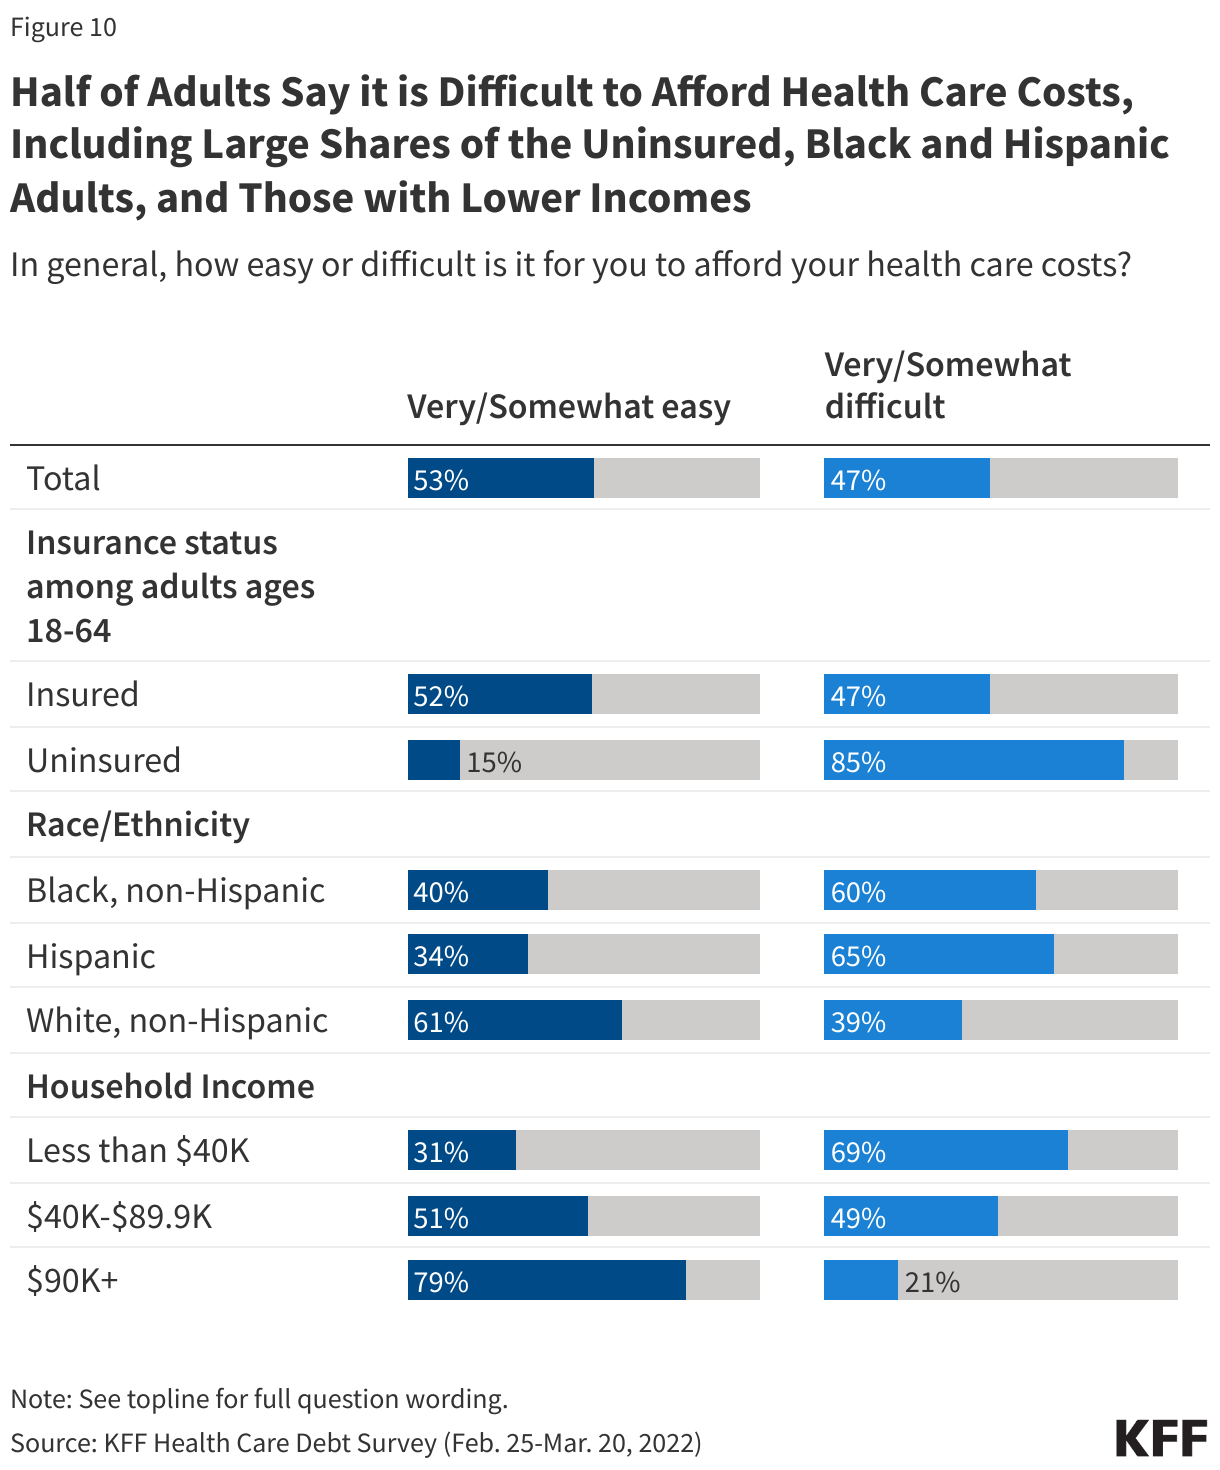
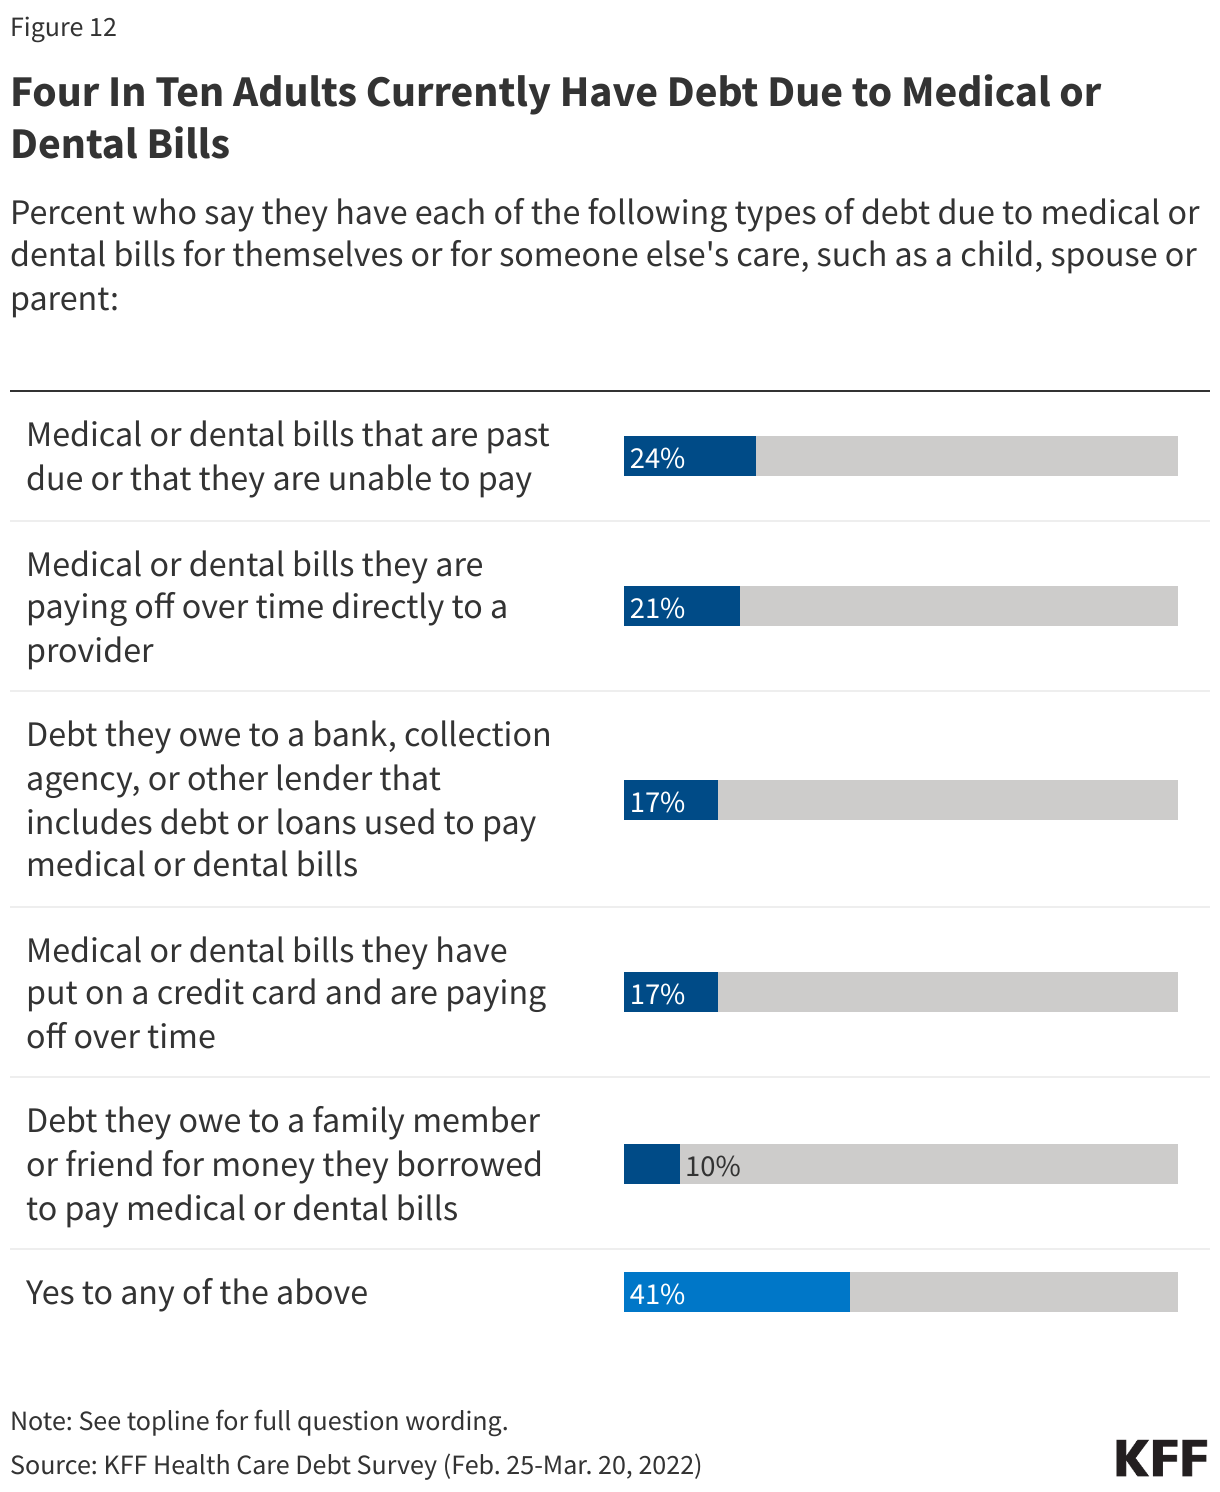
Uninsured individuals often face unaffordable medical bills when they do seek care, which can lead to medical debt and other forms of financial instability. More than 6 in 10 (62%) uninsured adults report having health care debt compared to over 4 in 10 (44%) insured adults (Figure 10). Uninsured adults are more likely to face negative consequences due to health care debt, such as using up savings, having difficulty paying other living expenses, or borrowing money.
What are the Current Efforts to Increase Coverage?
Proposals to expand health coverage have not been a focus of the current Congress. However, some states are considering legislation to expand coverage for specific populations. There has been renewed interest in the ACA Medicaid expansion among some of the 10 states that have yet to take up the option. In addition, several states have recently expanded fully state-funded coverage to certain groups of low-income people regardless of immigration status. As of early 2024, 12 states and Washington, D.C. cover income-eligible children regardless of immigration status and 5 states and Washington, D.C. cover some income-eligible adults regardless of immigration status . As part of the ARPA and then the Consolidated Appropriations Act of 2023 states were granted an option to extend Medicaid postpartum coverage to 12 months and 48 states and Washington, D.C. have taken up this option. Several states have received approval of Medicaid waivers to provide continuous eligibility for children from birth up to age six, and other states are pursuing similar waivers. A number of states are also seeking to provide 12 or 24 months of continuous eligibility for all or some adults. These waivers allow individuals to remain enrolled in Medicaid for the specified time period regardless of changes in income.
Future Outlook
The number of people without insurance and the uninsured rate dropped to record lows in 2022 because of pandemic-era coverage policies that provided continuous enrollment in Medicaid and enhanced premium subsidies in the ACA Marketplaces. However, the end of the Medicaid continuous enrollment provision in March 2023 has likely contributed to an increase in the number of people who are uninsured as millions are disenrolled from the program. The magnitude of any increase will depend on whether individuals who are no longer eligible and are disenrolled from Medicaid transition to other coverage, including employer plans and the Marketplace and whether those who are disenrolled despite remaining eligible are able to re-enroll in Medicaid. While Marketplace signups have reached 21.4 million people, exceeding the record high in 2023 by 5 million people, a relatively small share of people disenrolled from Medicaid appear to be transitioning to Marketplace or Basic Health Plan coverage so far. The enhanced premium subsidies in the ACA Marketplace will expire at the end of 2025 if not extended by Congress, that will lead to large out-of-pocket premium increases for enrollees.
Enactment of the ACA helped close some gaps in our fragmented health coverage system. Still, economic conditions play a big role when most people receive coverage through an employer. The stability of the ACA will be a factor in the continued access to affordable coverage in the short term. While its favorable ratings among the public have improved in the past decade, some policymakers and political candidates continue to express a desire to repeal the law.
Resources
- Key Facts about the Uninsured Population
- How Many Uninsured Are in the Coverage Gap and How Many Could be Eligible if All States Adopted the Medicaid Expansion?
- A Closer Look at the Remaining Uninsured Population Eligible for Medicaid and CHIP
- Health Coverage by Race and Ethnicity, 2010-2022
- How Does Cost Affect Access to Health Care?
- State-Funded Health Coverage for Immigrants
- Three Questions About Medicaid Unwinding: What We Know and What to Expect
- A Closer Look at the Remaining Uninsured Population Eligible for Medicaid and CHIP
- State-Funded Health Coverage for Immigrants
Citation
Tolbert, J., Drake, P., & Singh, R., The Uninsured Population and Health Coverage. In Altman, Drew (Editor), Health Policy 101, (KFF, May 28, 2024) https://www.kff.org/health-policy-101-the-uninsured-population-and-health-coverage/ (date accessed).
 Cynthia Cox
  Jared Ortaliza
  Emma Wager
 Kaye Pestaina
  Rayna Wallace
  Michelle Long
 Usha Ranji
  Karen Diep
  Ivette Gomez
  Laurie Sobel
  Alina Salganicoff
 Nambi Ndugga
  Latoya Hill
  Drishti Pillai
  Samantha Artiga
 Stephanie Oum
  Jennifer Kates
 Larry Levitt
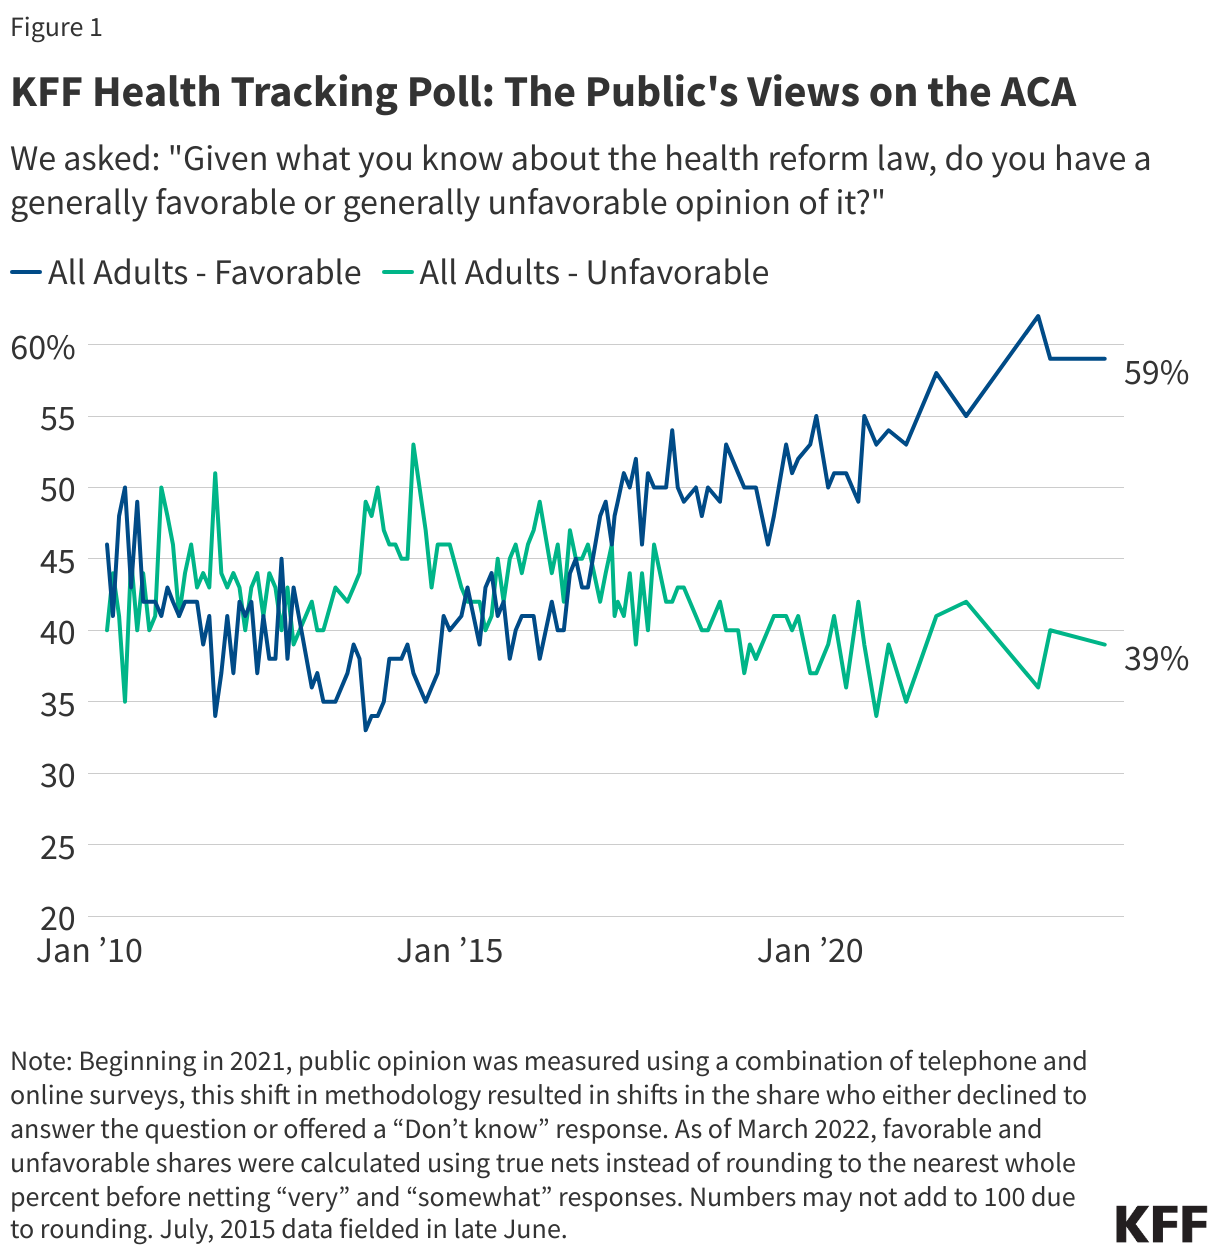
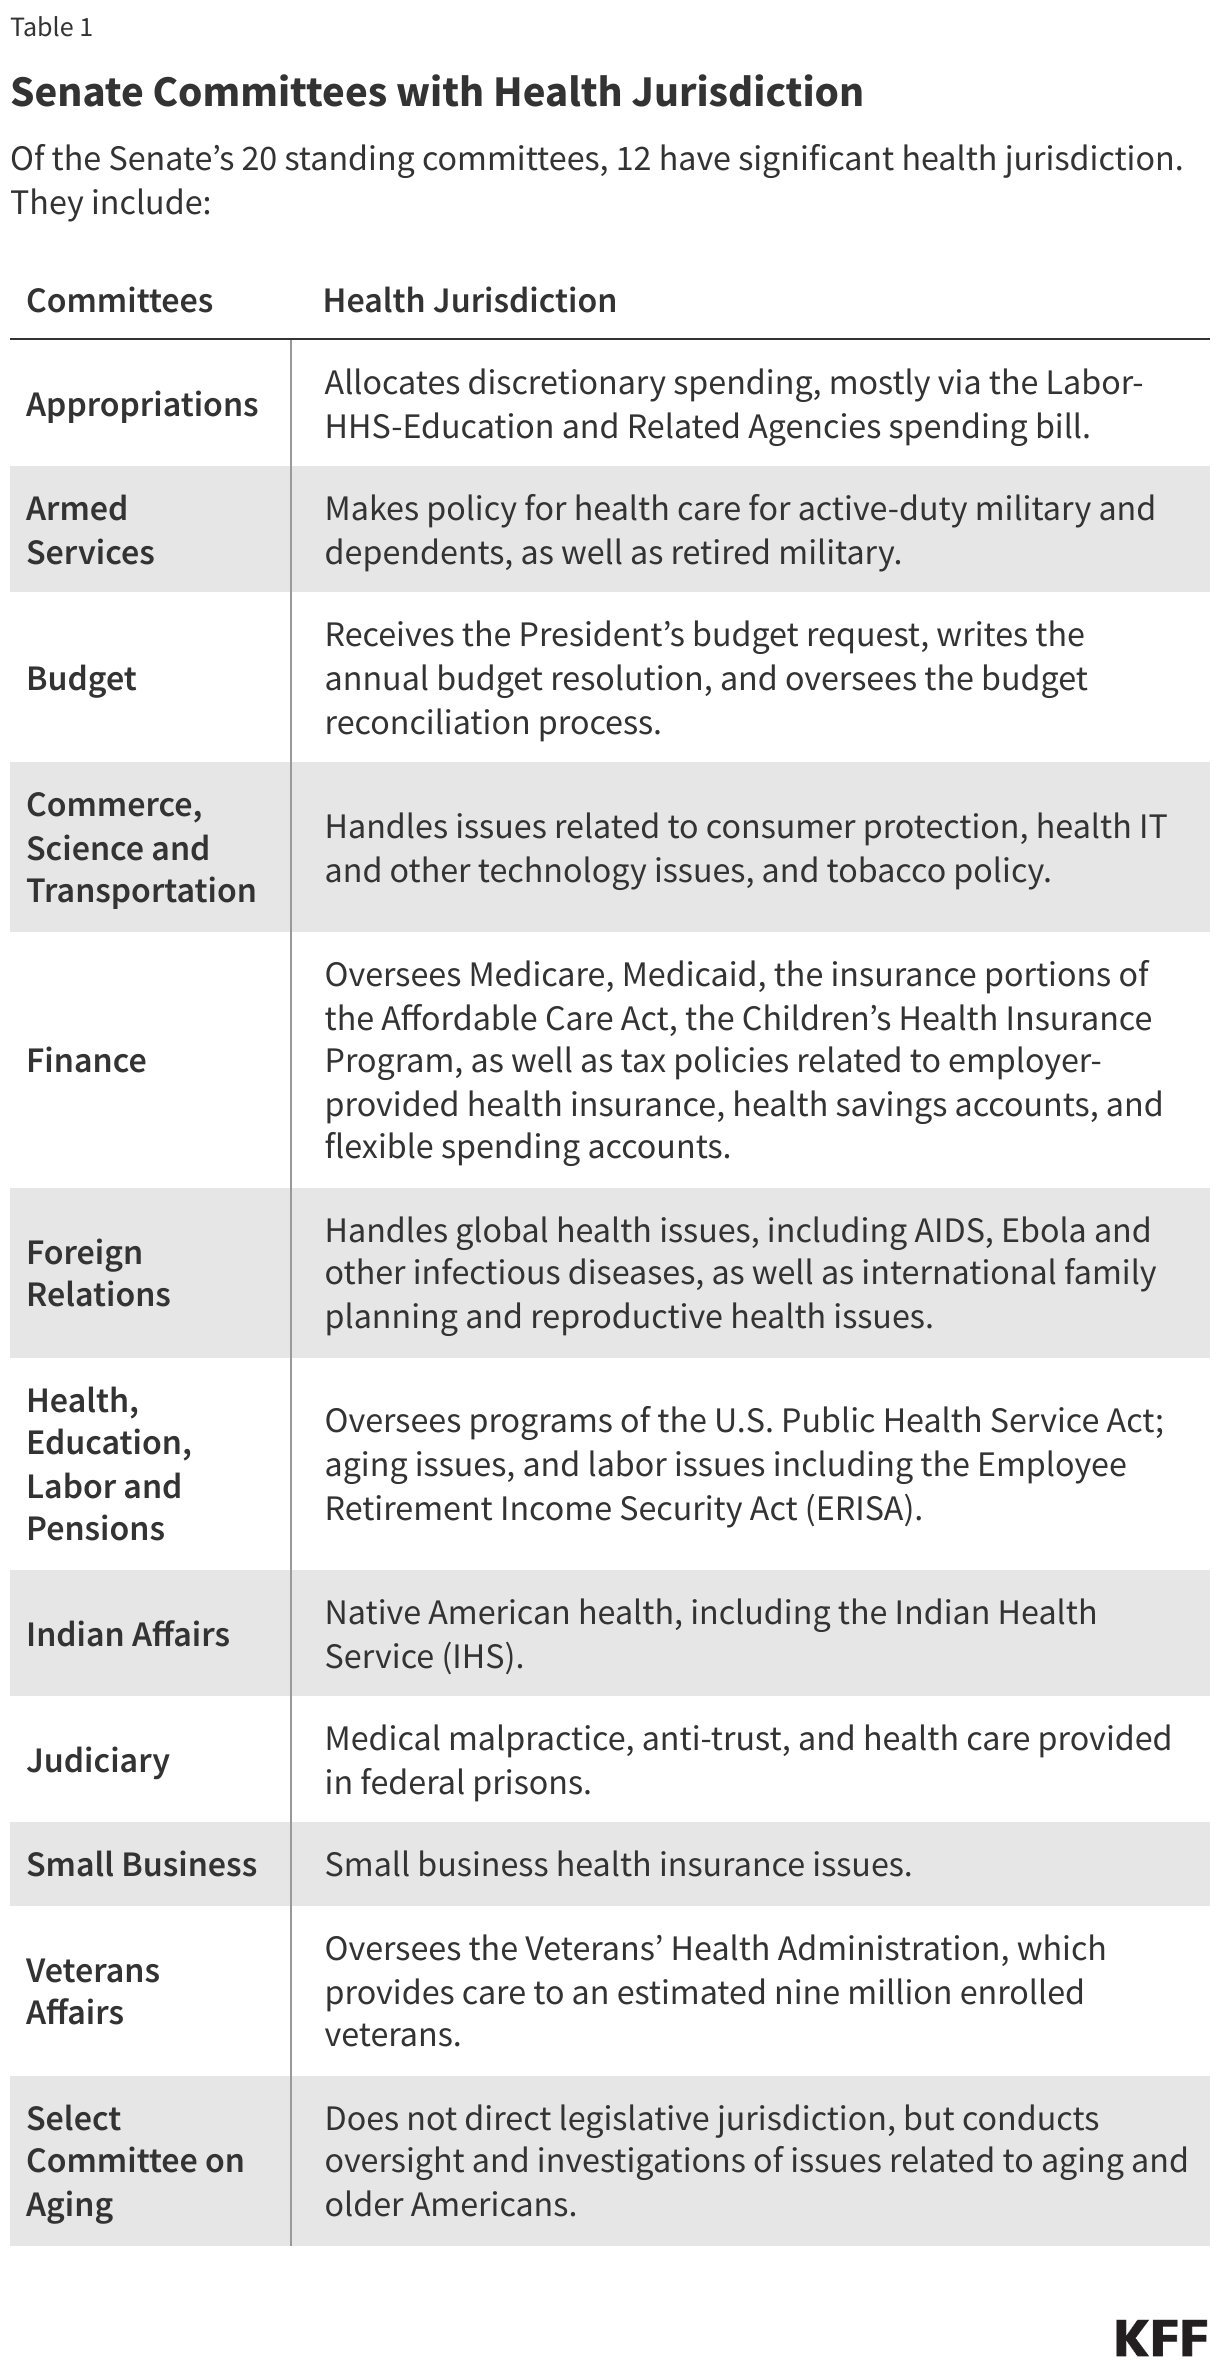
 Julie Rovner