2022 Employer Health Benefits Survey
Employer-sponsored insurance covers almost 159 million nonelderly people.1 To provide a current snapshot of employer-sponsored health benefits, KFF conducts an annual survey of private and non-federal public employers with three or more workers. This is the twenty-fourth Employer Health Benefits Survey (EHBS) and reflects employer-sponsored health benefits in 2022.
The survey was fielded from February to July of 2022. We made several revisions to the survey for 2022, including adding an online response option that 43% of respondents used to complete the survey. This change and others discussed in the methods section helped increase the number of employers completing the 2022 survey by 30% from last year.
PLAN ENROLLMENT
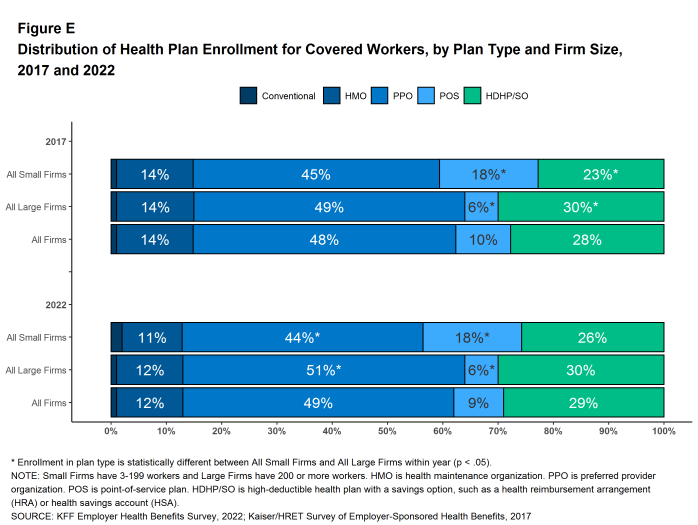
PPOs remain the most common plan type. In 2022, 49% of covered workers are enrolled in a PPO, twenty-nine percent in a high-deductible plan with a savings option (HDHP/SO), 12% in an HMO, 9% in a POS plan, and 1% in a conventional (also known as an indemnity) plan [Figure E]. This distribution of covered workers in plan types is similar to the distribution of covered workers in plan types last year.
SELF FUNDING
Many firms – particularly larger firms – self-fund, or pay for some or all health services for their workers directly from their own funds rather than through the purchase of health insurance. Sixty-five percent of covered workers, including 20% of covered workers at small firms and 82% in large firms are enrolled in plans that are self-funded. The percentage of covered workers in self-funded plans in 2022 is similar to the percentage last year.
Thirty-eight percent of small firms offering health benefits report that they have a level-funded plan, similar to the percentage in 2021 but much higher than preceding years. Level-funded arrangements combine a relatively small self-funded component with stop-loss insurance, which limits the employer’s liability and transfers a substantial share of the risk to insurers. These plans have the potential to meaningfully affect competition in the small group market because, unlike insured plans, they use health status as a factor in rating and underwriting, and are not required to provide all of the essential health benefits that are mandatory for other plans.
EMPLOYEE COST SHARING
Most covered workers must pay a share of the cost when they use health care services. Eighty-eight percent of workers with single coverage have a general annual deductible that must be met before most services are paid for by the plan.
Among workers with single coverage and a general annual deductible, the average deductible amount is $1,763, similar to last year. The average deductible for covered workers is much higher at small firms than large firms ($2,543 vs. $1,493). Among workers with single coverage and any deductible, the average deductible amount has increased 17% over the last five years and 61% over the last ten years.
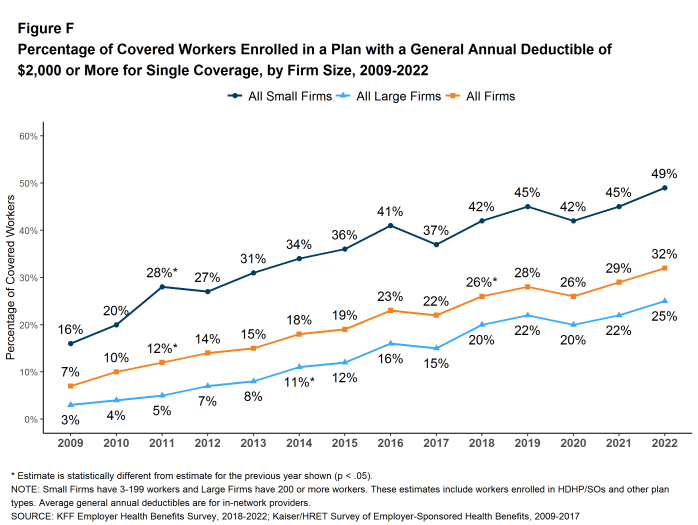
In five years, the percentage of covered workers with a general annual deductible of $2,000 or more for single coverage has grown from 22% to 32% [Figure F].
Some workers in health plans with high deductibles also receive contributions to savings accounts from their employers, which can be used to reduce cost sharing amounts. Fourteen percent of covered workers in an HDHP with a Health Reimbursement Arrangement (HRA), and 3% of covered workers in a Health Savings Account (HSA)-qualified HDHP receive an account contribution for single coverage greater than or equal to their deductible amount. Additionally, 30% of covered workers in an HDHP with an HRA and 17% of covered workers in an HSA-qualified HDHP receive account contributions that, if applied to their deductible, would reduce their personal annual liability to less than $1,000.
Regardless of their deductible, most covered workers also pay a portion of the cost when they visit an in-network physician. Many covered workers face a copayment (a fixed dollar amount) when they visit a doctor, although some workers instead have coinsurance requirements (a percentage of the covered amount). Average copayments are $27 for primary care and $44 for specialty care physician appointments, while average coinsurance rates are 19% for primary care and 20% for specialty care. These amounts are similar to those observed in 2021.
Most workers also face additional cost sharing for a hospital admission or outpatient surgery. Sixty-eight percent of covered workers have coinsurance requirements and 13% have a copayment for hospital admissions. The average coinsurance rate for a hospital admission is 20% and the average copayment amount is $344 per hospital admission. The cost sharing requirements for outpatient surgery follow a similar pattern to those for hospital admissions.
Virtually all covered workers are in plans with an annual limit on in-network cost sharing (called an out-of-pocket maximum) for single coverage, though these limits vary significantly. Among covered workers in plans with an out-of-pocket maximum for single coverage, 8% are in a plan with an out-of-pocket limit less than $2,000, while 26% are in a plan with a limit of $6,000 or more.
AVAILABILITY OF EMPLOYER-SPONSORED COVERAGE
While nearly all large firms (firms with 200 or more workers) offer health benefits to at least some workers, small firms (3-199 workers) are significantly less likely to do so. In 2022, 51% of all firms offered some health benefits. This is lower than the percentage of firms offering health benefits last year (59%) but similar to the percentage five years ago (53%).
Most firms are very small, leading to fluctuations in the overall offer rate, as the offer rates of small firms can vary widely from year to year. Most workers, however, work for larger firms, where offer rates are high and much more stable. Over ninety percent (93%) of firms with 50 or more workers offer health benefits in 2022. This percentage has remained consistent over the last 10 years. Overall, 89% of workers employed at firms with 3 or more workers are employed at a firm that offers health benefits to at least some of its workers.
Although the vast majority of workers are employed by firms that offer health benefits, many workers are not covered by their employers. Some are not eligible to enroll (e.g., waiting periods or part-time or temporary work status), while others who are eligible choose not to enroll (e.g., they may feel the coverage is too expensive or they may be covered through another source). Overall, at firms that offer coverage, 78% of workers are eligible. Among eligible workers, 77% take up the firm’s offer. The end result is 60% of workers at firms that offer health benefits enrolling in coverage. All of these percentages are similar to those in 2021. Among workers in firms offering health benefits, those in firms with a relatively large share of lower-wage workers are less likely to be covered by their own firm than workers in firms with a smaller share of lower-wage workers (49% vs. 62%).3
Among all workers, across firms that offer health benefits and firms that do not, 54% are covered by health plans offered by their employer. This is similar to the percentage last year.
HEALTH PROMOTION AND WELLNESS PROGRAMS
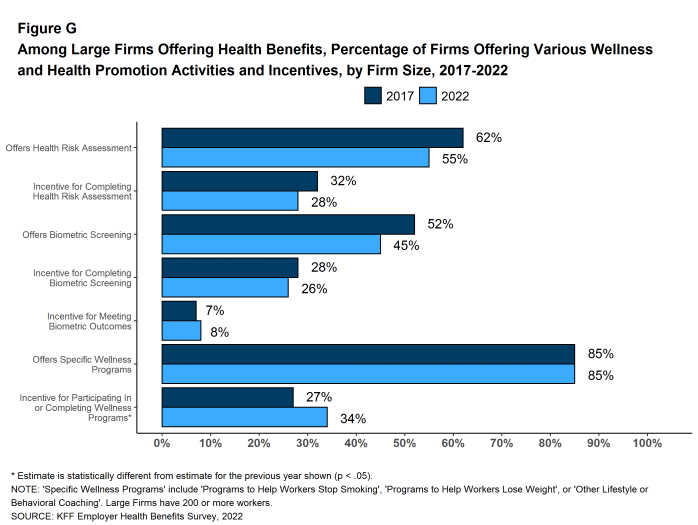
Many firms have programs that help workers identify health issues and manage chronic conditions, including health risk assessments, biometric screenings, and health promotion programs [Figure G]. However, disruptions caused by the COVID-19 pandemic, including job changes, remote work, and social distancing have challenged workers’ abilities to participate. In the 2021 EHBS, we focused on the changes employers made to these programs in response to the pandemic. For the 2022 EHBS, we look at the shares of employers offering these programs and make comparison to pre-COVID-19 levels in 2019 where appropriate.
Health Risk Assessments. Among firms offering health benefits, 40% of small firms and 55% of large firms provide workers the opportunity to complete a health risk assessment. The percentage of large firms with a health risk assessment program is lower than in 2019 (41%). Among large firms that offer a health risk assessment, 50% use incentives or penalties to encourage workers to complete the assessment, similar to the percentage (50%) in 2019.
Biometric Screenings. Among firms offering health benefits, 24% of small firms and 45% of large firms provide workers the opportunity to complete a biometric screening. The percentage of large firms with a biometric screening program is higher than the percentage in 2021 (38%). This suggests that some large employers are reinstating or revamping programs that were discontinued or suspended during the pandemic. Among large firms with a biometric screening program, 57% use incentives or penalties to encourage workers to complete the assessment, similar to the percentage (58%) in 2019.
Figure G: Among Large Firms Offering Health Benefits, Percentage of Firms Offering Various Wellness and Health Promotion Activities and Incentives, by Firm Size, 2017-2022
Health and Wellness Promotion Programs. Most firms offering health benefits offer programs to help workers identify and address health risks and unhealthy behaviors. Fifty-four percent of small firms and 85% of large firms offer a program in at least one of these areas: smoking cessation, weight management, and behavioral or lifestyle coaching. The percentage of large firms offering one of these programs is similar to the percentages last year (83%) and in 2019 (84%).
EMPLOYER SATISFACTION WITH HEALTH BENEFIT OFFERINGS
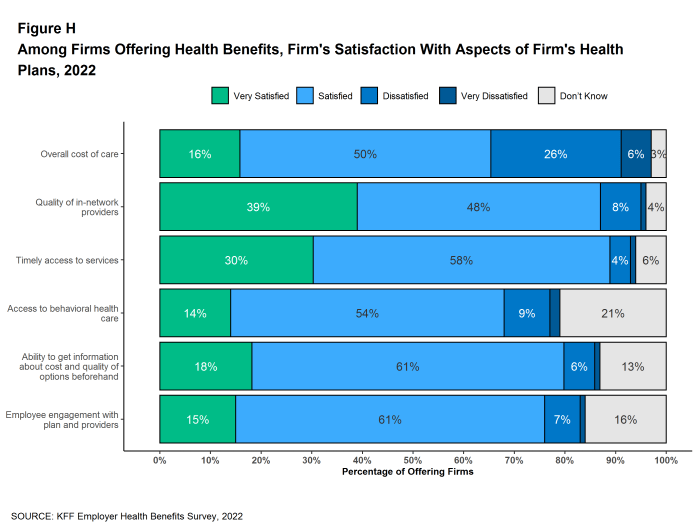
Employers offering health benefits were asked about their level of satisfaction with several aspects of their health plan offerings, including the overall costs for employees, access to care, including access to mental health services, quality of care, and adequacy of plan networks [Figure H]. Among firms offering health benefits:
- A large share (66%) is “very satisfied” or “satisfied” with the overall cost of care for their employees. Large firms are more likely to be at least “satisfied” with the overall cost of care than small firms (79% vs. 65%).
- Thirty-nine percent is “very satisfied” and another 48% is “satisfied” with the quality of the health care providers participating in their health plan networks. These percentages are similar for large and small firms.
- Thirty percent is “very satisfied” and another 58% is “satisfied” with the timely access to services for plan enrollees. These percentages are similar for large and small firms.
- Fourteen percent is “very satisfied” and another 54% is “satisfied” with access to behavioral health care in their health plans for enrollees who need it. Large firms are more likely than small firms to be “very satisfied” with access to behavioral health care in their health plans (25% vs. 13%), while small firms are more likely to say that they do not know (22% vs. 7%).
- Fifteen percent is “very satisfied” and another 61% is “satisfied” with the level of employee engagement with the plan and providers. These percentages are similar for large and small firms.
HEALTH PLAN PROVIDER NETWORKS
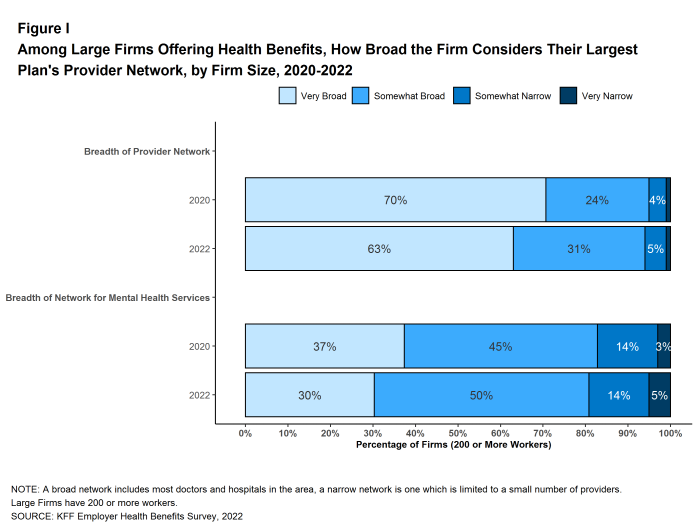
We asked employers to characterize the breadth of the provider network in their largest health plan, as well as whether the networks had a sufficient number of providers to assure timely access to certain services [Figure I]. Among employers offering health benefits:
- Fifty percent say that the network in their plan with the largest enrollment is “very broad,” 37% say it is “somewhat broad,” and 12% say it is “somewhat narrow.” Large firms are more likely than small firms to characterize the network in their largest health plan as “very broad” (63% vs. 50%).
- Twenty percent of firms say that the network for mental health and substance use in their plan with the largest enrollment is “very broad,” 51% say it is “somewhat broad,” 21% say it is “somewhat narrow,” and 8% say it is “very narrow.” Large firms are more likely than small firms to characterize the network for mental health and substance use services in their largest health plan as “very broad” (30% vs. 19%).
- Over four in five (82%) of firms believe that there is a sufficient number of primary care providers in the plan networks to provide timely access to services for workers and their family members. In contrast, only 44% believe that there is a sufficient number of behavioral health providers in the plan networks to provide timely access to services for workers and their family members. Thirty-three percent of small firms and 18% of large firms say that they do not know the answer to this question.
TELEMEDICINE
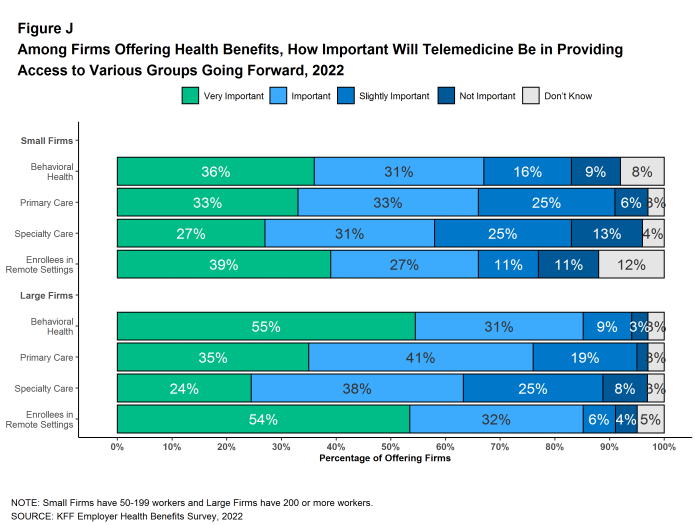
Access to telemedicine benefits, which had been growing steadily before the COVID-19 pandemic, skyrocketed during the lockdown period as people refrained from seeking non-emergency health care. We asked employers about their telemedicine benefit offerings, as well as whether they view these benefits as an important source of access to health care in the future [Figure J].
For this survey, we define telemedicine as the delivery of health care services through telecommunications to a patient from a provider who is at a remote location, including video chat and remote monitoring. We note that during the COVID-19 pandemic, some plans have eased their definitions to allow more types of digital communication to be reimbursed.
Among firms with 50 or more workers offering health benefits, 87% of small firms and 96% of large firms cover the provision of some health care services through telemedicine in their largest health plan. The percentages of small firms (50-199 workers) and large firms reporting that they cover services through telemedicine are much higher than they were three years ago (87% vs. 65% for small firms and 96% vs. 82% for large firms).
Among firms with 50 or more employees offering telemedicine services:
- Twenty-four percent offer telemedicine services through a specialized telemedicine service provider, such as Teledoc, Doctor on Demand, OR MDLIVE, while 59% offer services through their health plan, 14% offer services through both a specialized telemedicine provider and their health plan, and 3% provide services through some other arrangement. Small firms are more likely than larger firms to provide telemedicine services only through their health plan (63% vs. 46%), while large firms are more likely than smaller firms to use a specialized telemedicine provider (32% vs. 21%) or both a specialized telemedicine provider and their health plan (20% vs. 13%).
- Thirty-four percent expect the use of telemedicine to increase in 2022 when compared to last year, 14% expect it to decrease, and 42% expect it to stay about the same.
- Four percent say that their costs have increased as a result of telemedicine, 6% say that costs have decreased, 63% say that costs have stayed about the same, and 27% say that they do not know.
Firms with 50 or more employees offering telemedicine benefits were also asked how important they felt telemedicine would be in providing employees access to certain types of services in the coming years. Among these firms:
- Behavioral Health Services. Thirty-six percent say that telemedicine will be “very important” in providing access to behavioral health services in the future, and another 31% say that it will be “important” in providing access to these services. Large firms are more likely than small firms to say that telemedicine will be “very important” to providing access to behavioral health services (55% vs. 36%).
- Primary Care. Thirty-three percent say that telemedicine will be “very important” in providing access to primary care in the future, and another 33% say that it will be “important” to providing access primary care.
- Specialty Care. Twenty-seven percent say that telemedicine will be “very important” in providing access to specialty care in the future, and another 31% say that it will be “important” to providing access to specialty care.
- Enrollees in Remote Areas. Forty percent say that telemedicine will be “very important” in providing future access to care for enrollees in remote areas, and another 27% say that it will be “important” to providing future access for remote enrollees. Large firms are more likely than small firms to say that telemedicine will be “very important” to providing access for enrollees in remote areas (54% vs. 39%) while small firms are more likely than large firms to say that telemedicine will be “not important” in providing access for remote enrollees (11% vs. 4%) or to say that they do not know.
ASSISTANCE FOR LOWER-WAGE WORKERS
Some employers provide assistance to their lower-wage employees to help them with the costs of participating in their health plans. We asked large firms whether they provided assistance to help lower-wage workers with contributions or cost sharing.
- Ten percent of large firms offering health benefits have a program to lower the premium contributions of lower-wage workers, similar to the percentage in 2018 (11%). Firms with 5,000 or more workers are more likely to have a program to lower premium contributions than smaller firms.
- Only 5% of large firms offering health benefits have a program to lower cost sharing of lower-wage workers, similar to the percentage seen in 2020 (6%).
DISCUSSION
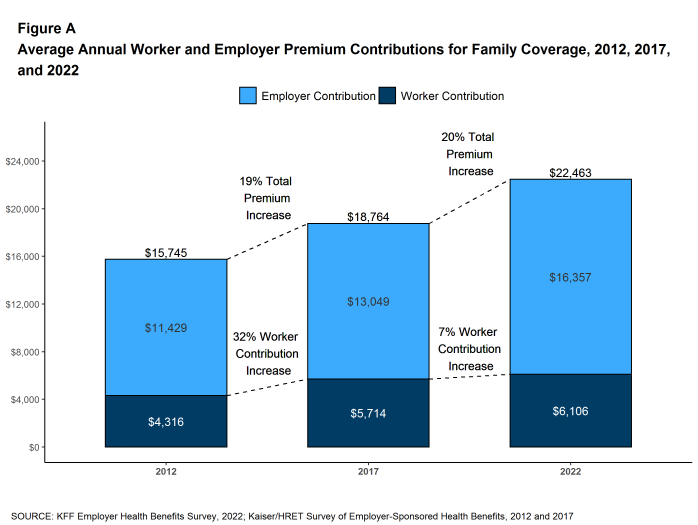
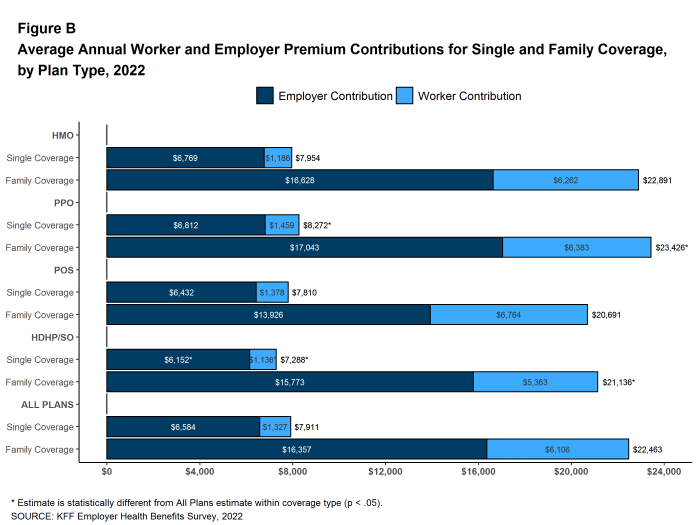
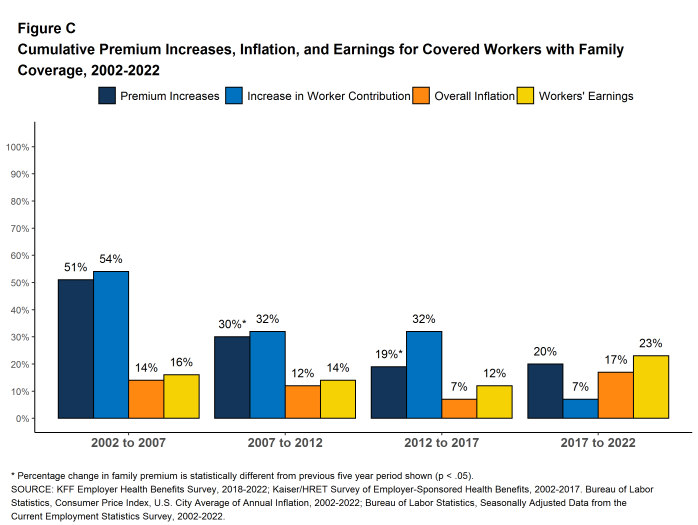
This year’s average annual premiums for single coverage ($7,911) and family coverage ($22,463) are similar to last year’s. The absence of premium increases this year may reflect the low levels of utilization during the fall of 2021, when many employers were setting their premiums.4 The inflation experienced throughout the economy in 2022 may push prices up, leading to premium increases in the upcoming year. Despite these concerns, this year continues a period of relatively low premium growth. Family premiums increased 20% over the last five years, compared to 30% between 2007 and 2012 and 51% between 2002 and 2007. Over the last five-year period, family coverage premiums grew at a rate comparable to inflation (17%) and workers earnings (23%). Additionally, the past few years have not seen significant increases in many measures of employee cost. Over the last five years, the average worker contribution to premiums for family coverage grew by 7%, slower than premiums overall, and slower than the average contribution made by employers to the premium (25%). Following a period of rapid increases, deductibles are growing at a slower pace; among all covered workers, the average deductible increased 28% over the last five years, compared to 52% between 2012 and 2017. Affordability issues linger for many with employer coverage, particularly for those at small firms who typically face high general annual deductibles, and for lower-wage workers who may find premiums unaffordable.5 However, recent years have been a reprieve from the rapid increases in premiums and deductibles throughout the 2000s and 2010s.
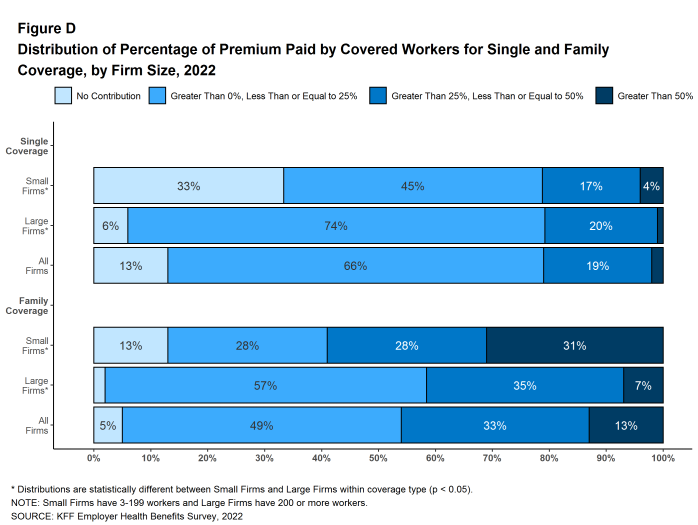
There are important differences in coverage offered by small and large firms. On average, workers at small firms contribute more to the cost of family coverage ($7,556 vs. $5,580) and face larger general annual deductibles. Among covered workers with a general annual deductible, the average deductible for single coverage is $2,543 at small firms, compared to $1,493 at large firms. Workers in small firms are considerably more likely to have a general annual deductible of $2,000 or more for single coverage than workers in large firms (49% vs. 25%).
Many employers continue to be concerned about meeting the mental health needs of their employees and their dependents. In 2022, 48% of large employers saw an increase in the share of employees seeking mental health services, and 43% were at least somewhat concerned with the growth of substance use conditions among their employees. In response to this need, many employers, particularly large employers, offer self-care apps (44%) or an employee assistance program (81%). Overall, employers expressed concern about the breadth of their provider networks for those with mental health conditions. Only 52% of large employers believe that there were a sufficient number of behavioral health providers in their networks to allow timely access to services compared to 89% for primary care providers. Additionally, only three-in-ten employers described their provider network as “very broad” for mental health services compared to 63% for their networks overall. Many employers indicated that they were trying to bolster their provider networks through alternative modes, such as adding new virtual providers.
Employers remain optimistic about the future of telemedicine, with over half of large employers indicating they believe it will be “very important” to provide access to behavioral health services, and care to enrollees in remote settings, going forward. Even as pandemic restrictions ease, over a third of large employers expected telemedicine use to increase this year.
Many employers expressed satisfaction with key elements of their plans. Over three-quarters of employers responded that they were either “very satisfied” or “satisfied” with the components of their plans we asked about, including cost of care, quality of providers, and enrollees’ timely access to services. Despite challenges, this high level of satisfaction may help explain the stability we have witnessed in employer coverage, despite the considerable turmoil over the last two years.
METHODOLOGY
The KFF 2022 Employer Health Benefits Survey reports findings from a survey of 2,188 randomly selected non-federal public and private employers with three or more workers. Davis Research, LLC conducted the field work between February and July 2022. In 2022, the overall response rate is 14%, which includes firms that offer and do not offer health benefits. Unless otherwise noted, differences referred to in the text and figures use the 0.05 confidence level as the threshold for significance. Small firms have 3-199 workers unless otherwise noted. Values below 3% are not shown on graphical figures to improve the readability of those graphs. Some distributions may not sum due to rounding. For more information on survey methodology, see the Survey Design and Methods section at www.kff.org/ehbs.
Filling the need for trusted information on national health issues, KFF is a nonprofit organization based in San Francisco, California.
- Estimate from KFF’s analysis of American Community Survey. Health insurance coverage of the nonelderly 0–64 [Internet]. San Francisco (CA): KFF; 2019 [cited 2022 Sep 12]. Available from: https://www.kff.org/other/state-indicator/nonelderly-0-64/↩︎
- Bureau of Labor Statistics, Mid-Atlantic Information Office. Consumer Price Index historical tables for, U.S. city average (1967 = 100) of annual inflation [Internet]. Washington (DC): BLS; [cited 2022 Sep 12]. Available from: https://www.bls.gov/regions/mid-atlantic/data/consumerpriceindexhistorical1967base_us_table.htm
Seasonally adjusted data from the Current Employment Statistics Survey. Bureau of Labor Statistics. Current Employment Statistics—CES (national) [Internet]. Washington (DC): BLS; [cited 2022 Sep 12]. Available from: https://www.bls.gov/ces/publications/highlights/highlights-archive.htm↩︎ - This threshold is based on the twenty-fifth percentile of workers’ earnings ($30,000 in 2022). Seasonally adjusted data from the Current Employment Statistics Survey. Bureau of Labor Statistics. Current Employment Statistics—CES (national) [Internet]. Washington (DC): BLS; [cited 2022 Sep 12]. Available from: https://www.bls.gov/ces/publications/highlights/highlights-archive.htm↩︎
- Gallagher K, Gerhart J, Amin K, Rae M, Cox C. Early 2021 data show no rebound in health care [Internet]. San Francisco (CA): Peterson-KFF Health System Tracker; 2022 Aug 17 [cited 2022 Oct 7]. Available from: https://www.healthsystemtracker.org/brief/early-2021-data-show-no-rebound-in-health-care-utilization/↩︎
- Claxton G, Rae M, Kurani N, Ortaliza J. How affordability of employer coverage varies by family income [Internet]. San Francisco (CA): Peterson-KFF Health System Tracker; 2022 Mar 10 [cited 2022 Oct 7]. Available from: https://www.healthsystemtracker.org/brief/how-affordability-of-health-care-varies-by-income-among-people-with-employer-coverage/↩︎

