Key Takeaways
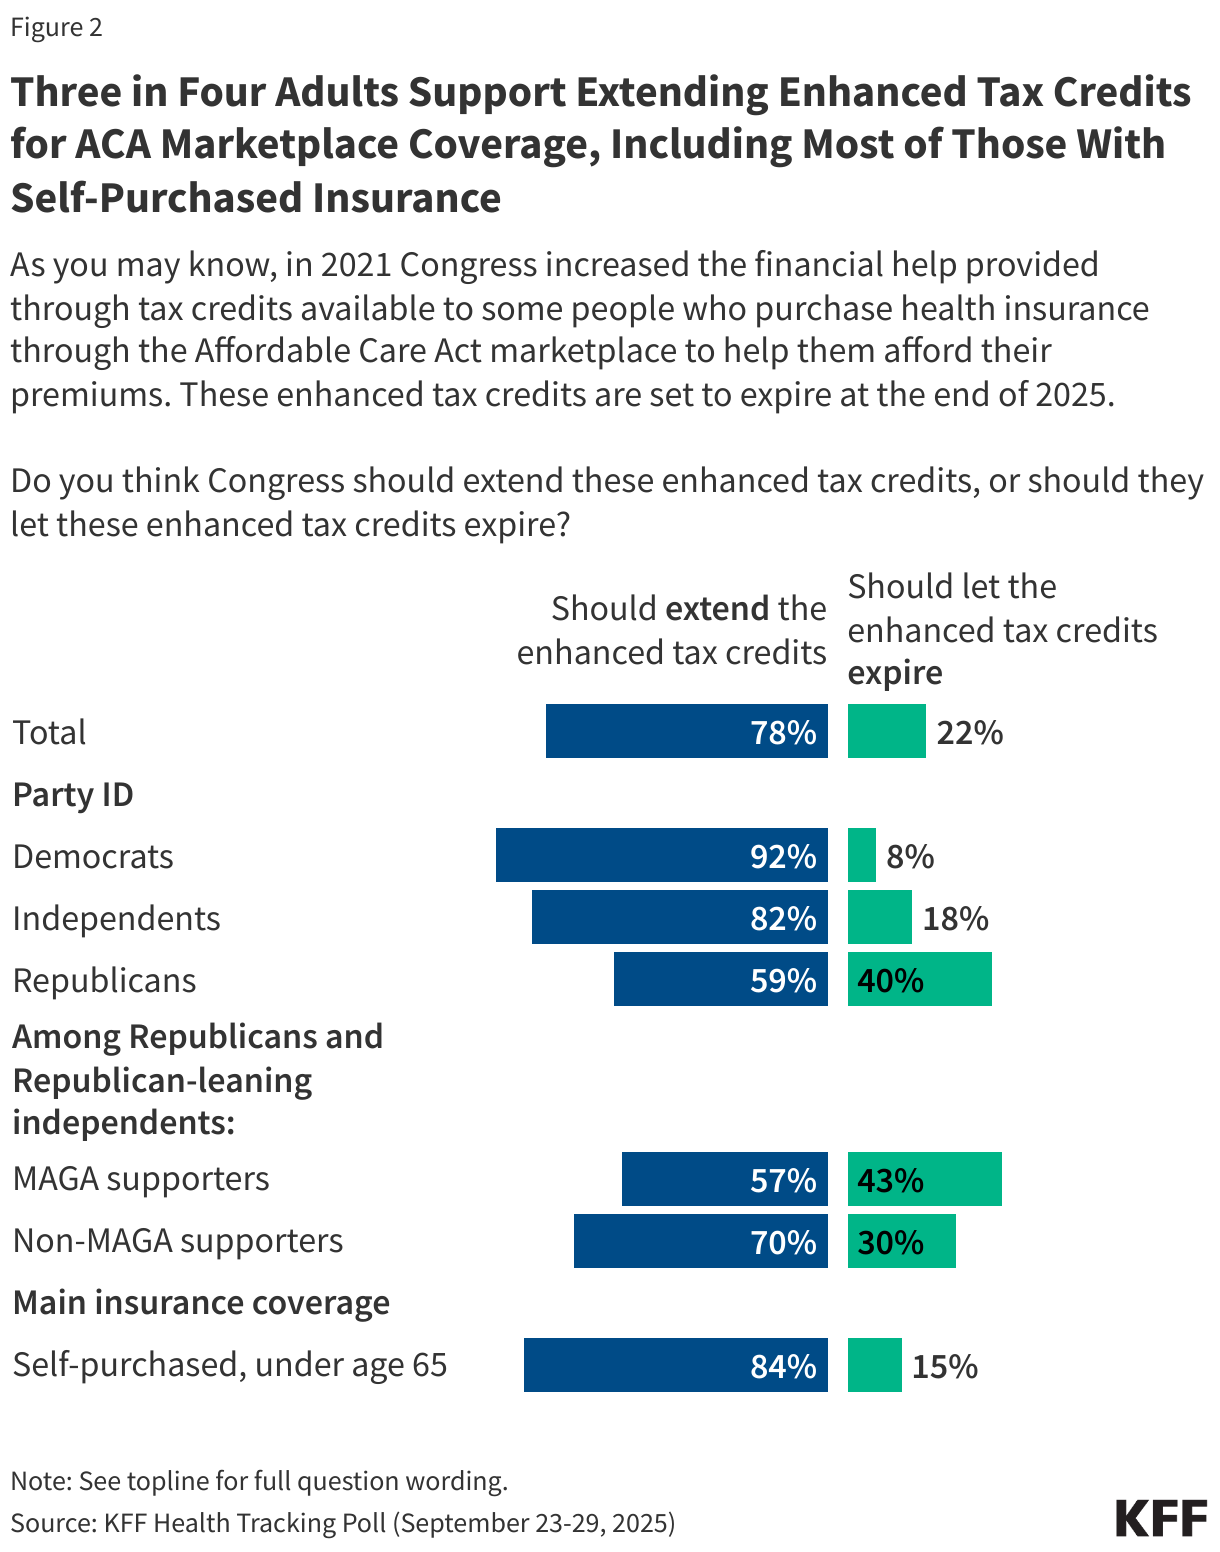
- As Congress debates federal health care spending as part of spending bill negotiations, including extending the enhanced premium tax credits, the latest KFF Health Tracking Poll finds three-quarters (78%) of adults say Congress should extend the enhanced tax credits for people who buy their own insurance through the ACA Marketplace. This is more than three times the share of the public (22%) who say Congress should let the credits expire. Notably, majorities across political party want Congress to extend the tax credits including nine in ten (92%) Democrats, eight in ten (82%) independents, and six in ten (59%) Republicans. A majority of Republicans who align with the MAGA movement (57%) also say Congress should extend these subsidies.
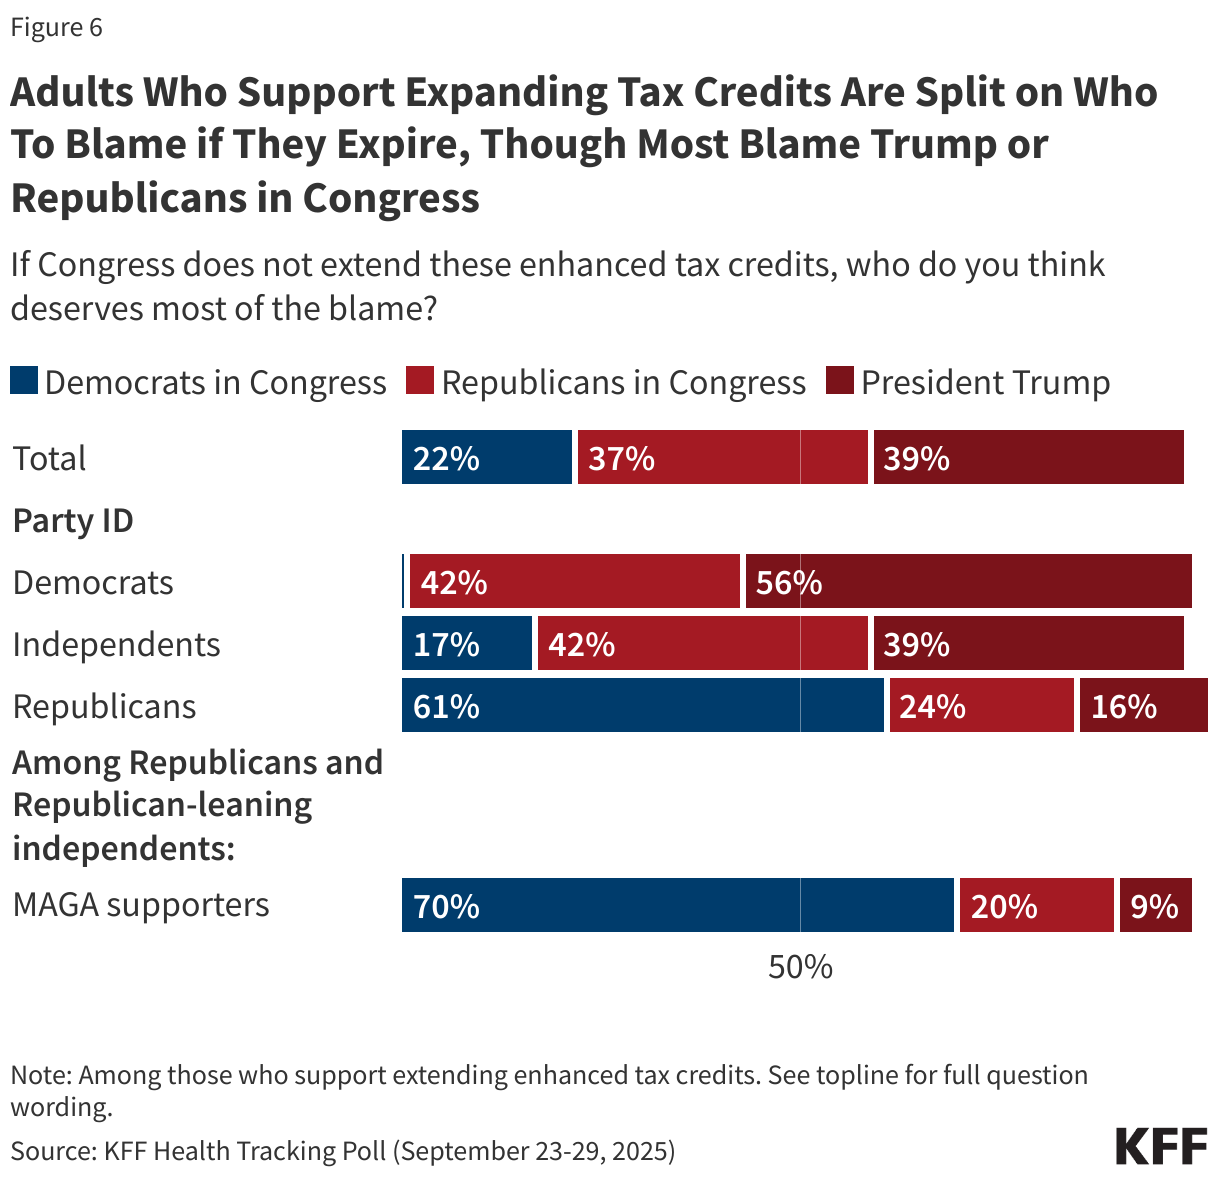
- Both parties could face political fallout if the enhanced tax credits are not extended, though the public says they will place most of the blame on those currently in charge. About four in ten (39%) adults who want to see the tax credits extended say that if Congress does not extend these enhanced tax credits, President Trump deserves most of the blame, while another four in ten (37%) say the same about Republicans in Congress. About two in ten (22%) say that Democrats in Congress deserve most of the blame. Democrats are most likely to place blame on President Trump (56%) followed by Republicans in Congress (42%), while six in ten Republicans (61%) say they would place the blame on Democrats in Congress. Among those who buy their own coverage (nearly half of whom identify as Republican or Republican-leaning), Republicans in Congress and President Trump receive the majority of the blame (42% and 37%, respectively).
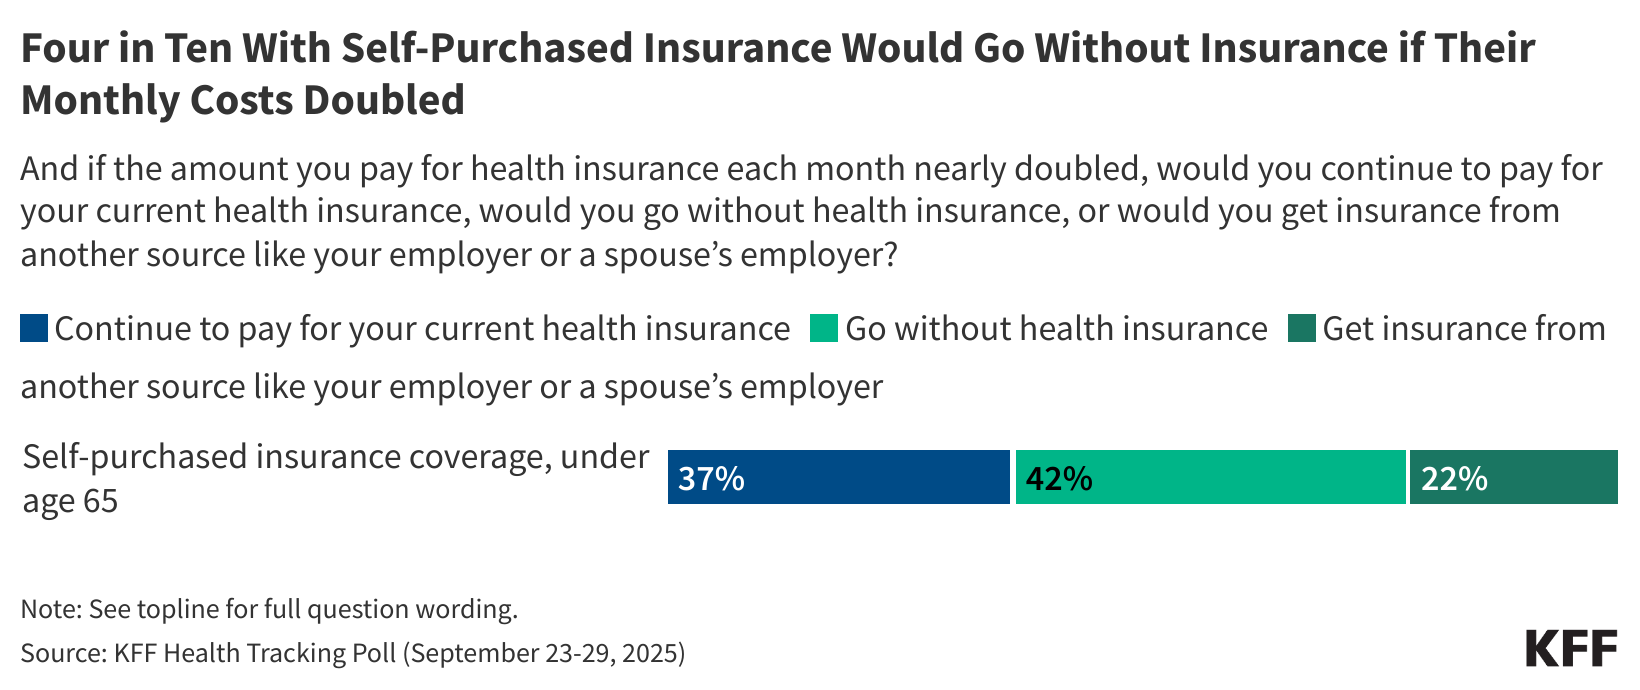
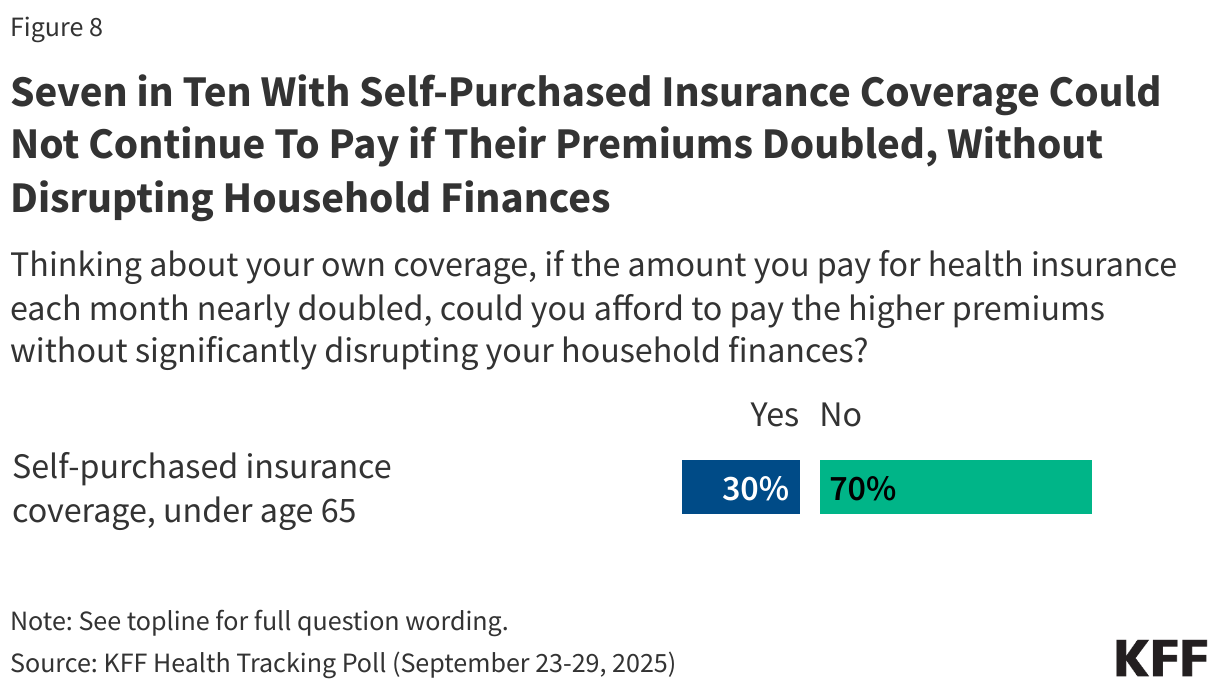
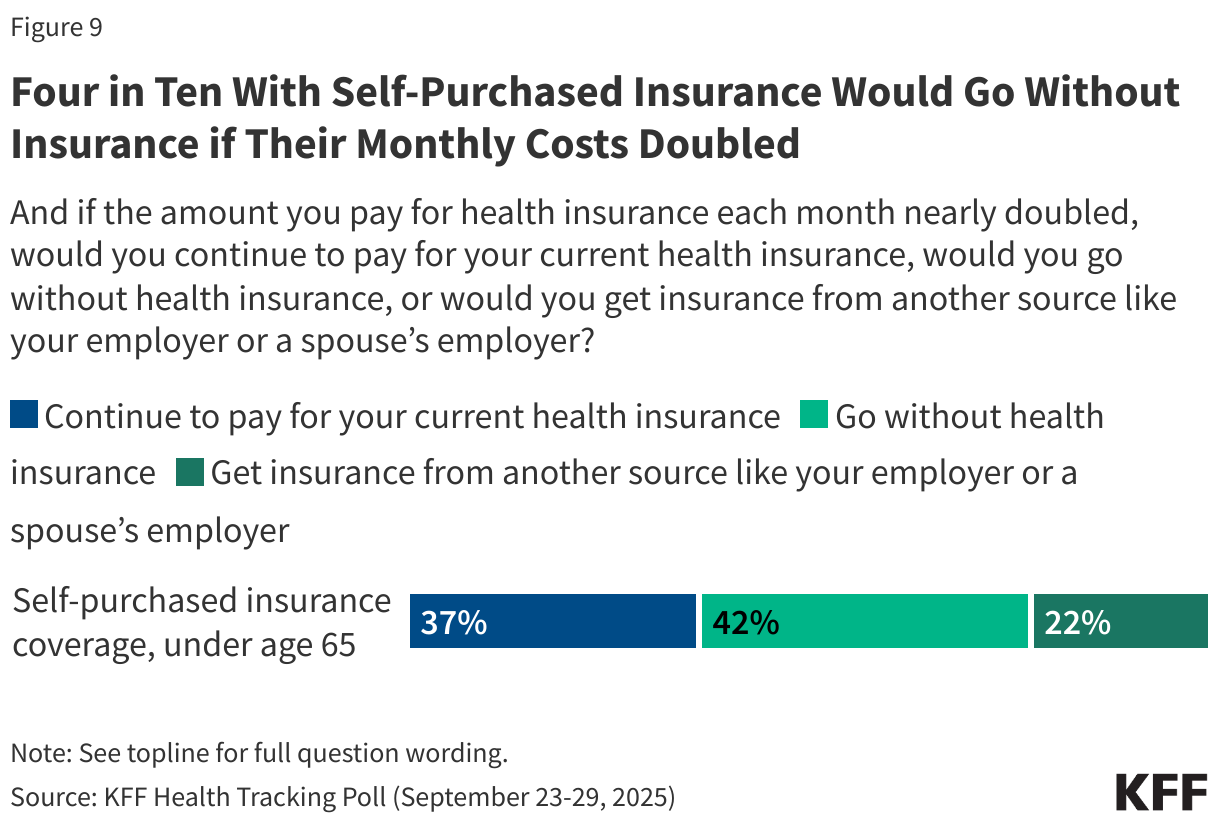
- Seven in ten adults who buy their own health insurance say that if the amount they paid for health insurance each month nearly doubled, they could not pay the higher premiums without significantly disrupting their household finances. In addition, four in ten (42%) say they would go without health insurance coverage if the amount they had to pay for health insurance each month nearly doubled. About a third (37%) say they would continue to pay for their current health insurance, while two in ten (22%) would get insurance from another source, like an employer or a spouse’s employer.
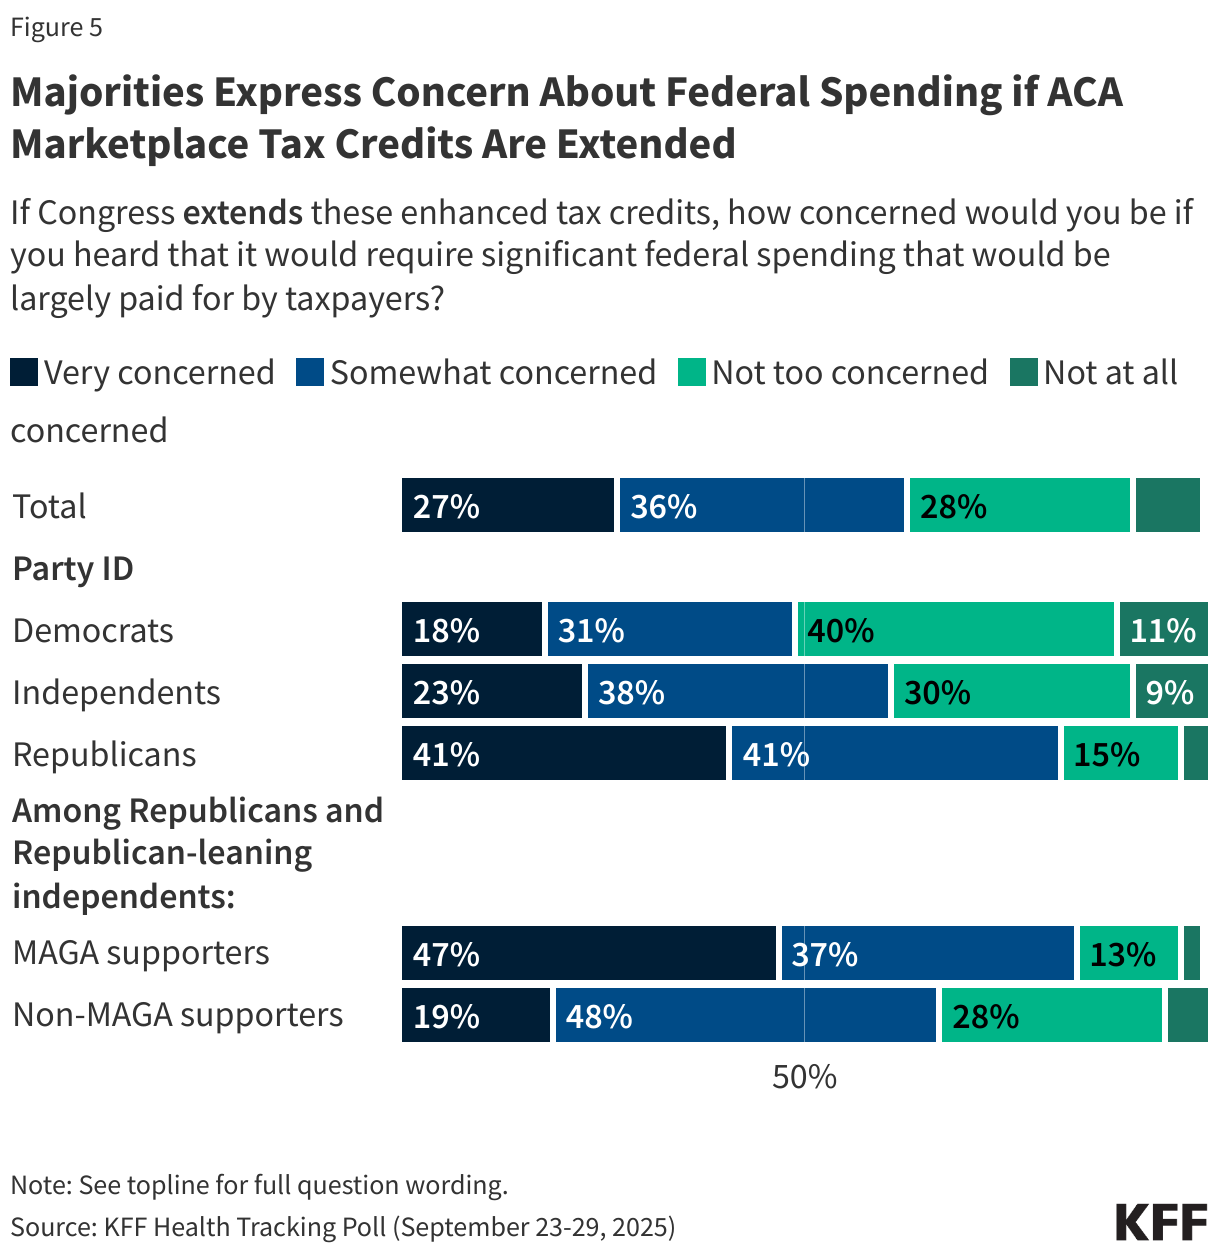
- Majorities across partisanship also report that they would be concerned if they heard about something of the outcomes for both letting the tax credits expire, as well as if Congress extended the tax cuts – granted to a lesser degree. Majorities say they would be concerned if they heard that health insurance would be unaffordable for many people who buy their own coverage (86%), that 4 million people would lose their health insurance coverage (86%), or if they heard that people who work at small businesses or are self-employed would be directly impacted (85%). On the other side, if Congress does extend these enhanced tax credits, two-thirds of the public (63%) say they would be concerned if they heard that it would require significant federal spending that would be largely paid for by taxpayers.
- Three months after the passing of the tax and budget legislation, the bill still remains largely unfavorable among the public overall – lagging far behind both the Affordable Care Act and the ACA Marketplaces in overall popularity. Many are still unsure of how the legislation will impact them personally but four in ten (43%) think it’s most likely to hurt them and their families.
Public Still Largely Unaware That ACA Enhanced Tax Credits Are Expiring, Strong Support for Congress Extending Them
On October 1st the U.S. federal government shut down as Congress was unable to pass a stopgap spending bill. As part of the discussions around the federal budget, Democrats are seeking to include the extension of the enhanced premium tax credits (ePTCs) for people who purchase their own health insurance through the ACA Marketplace that are set to expire at the end of the year.
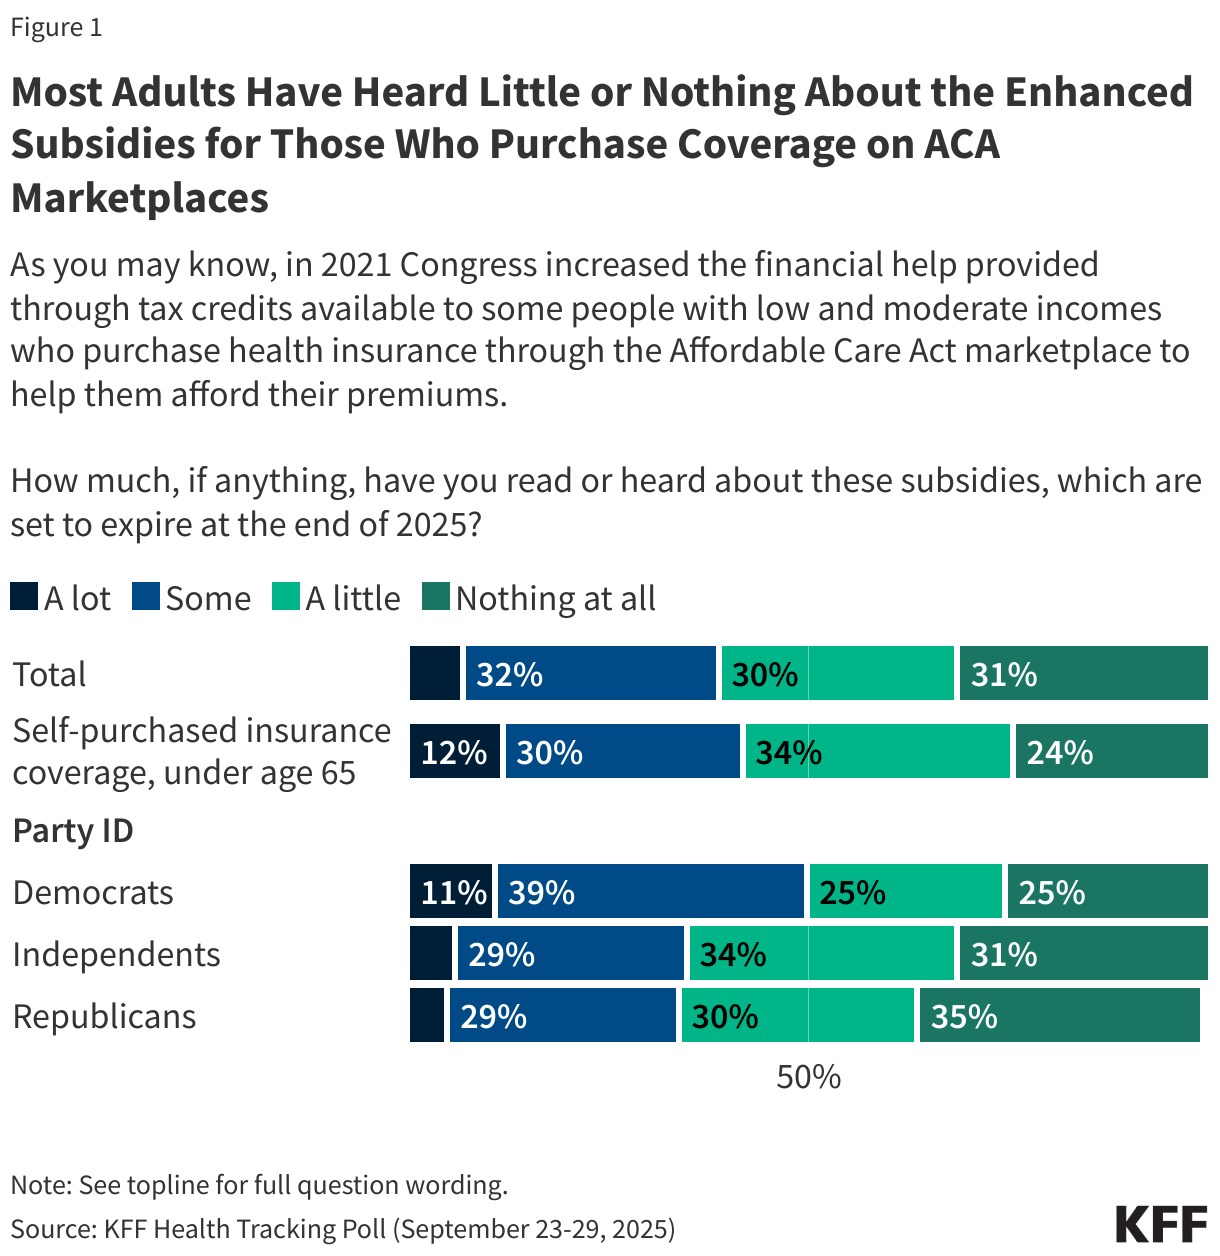
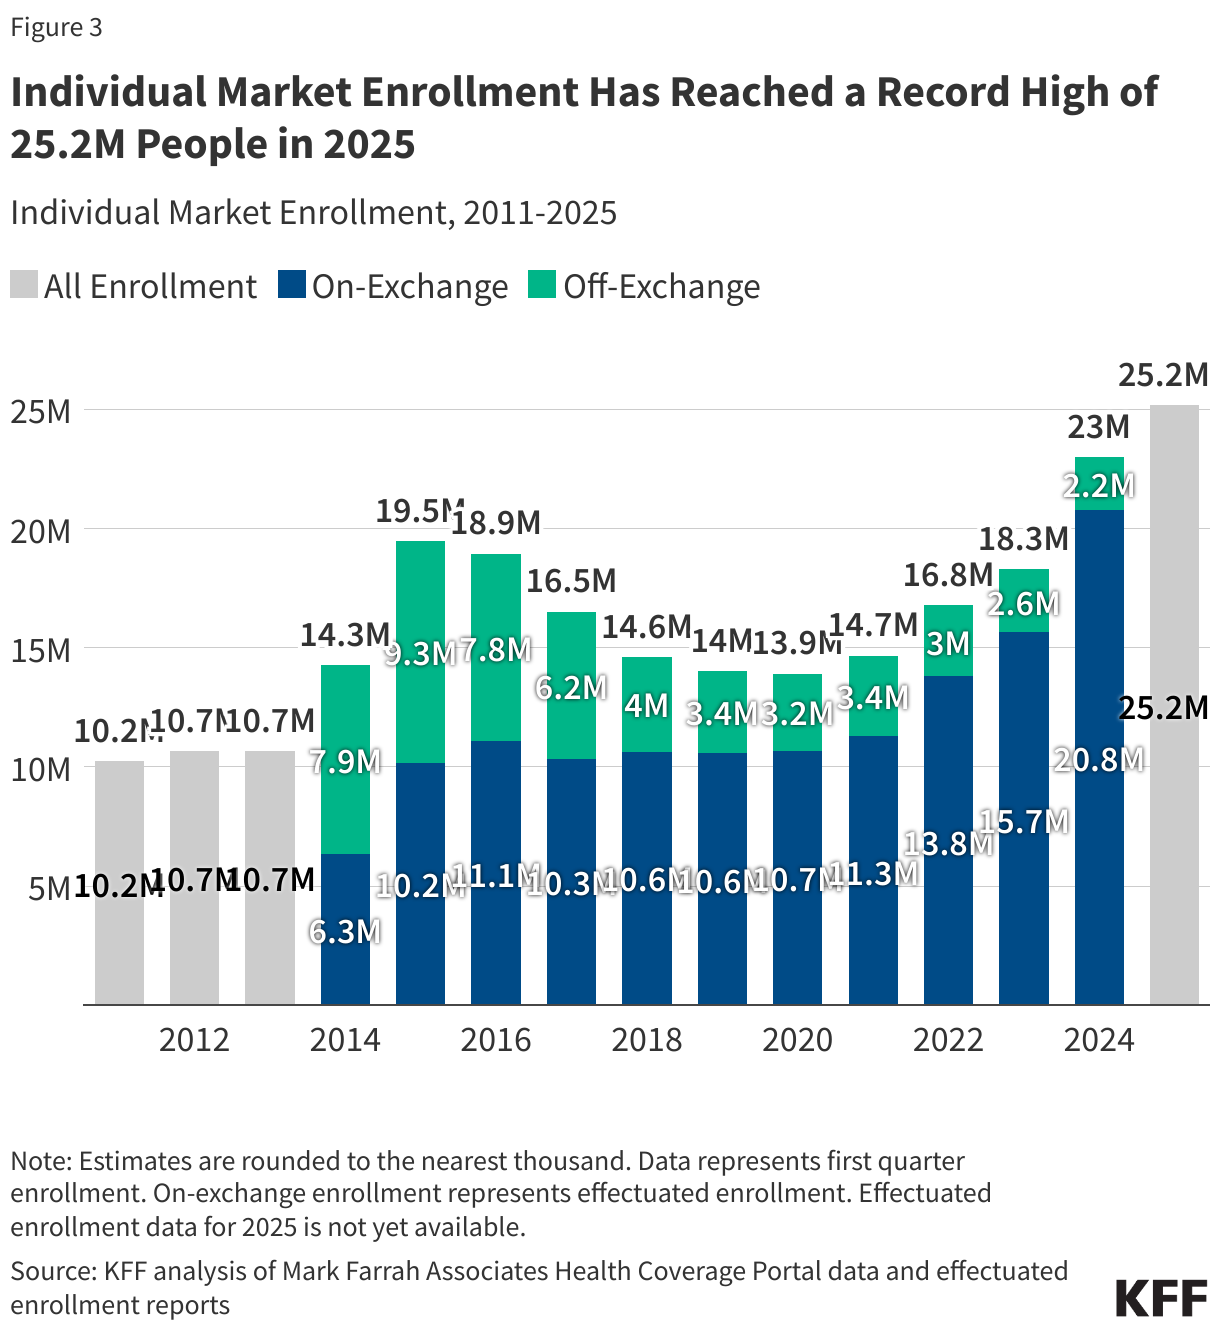
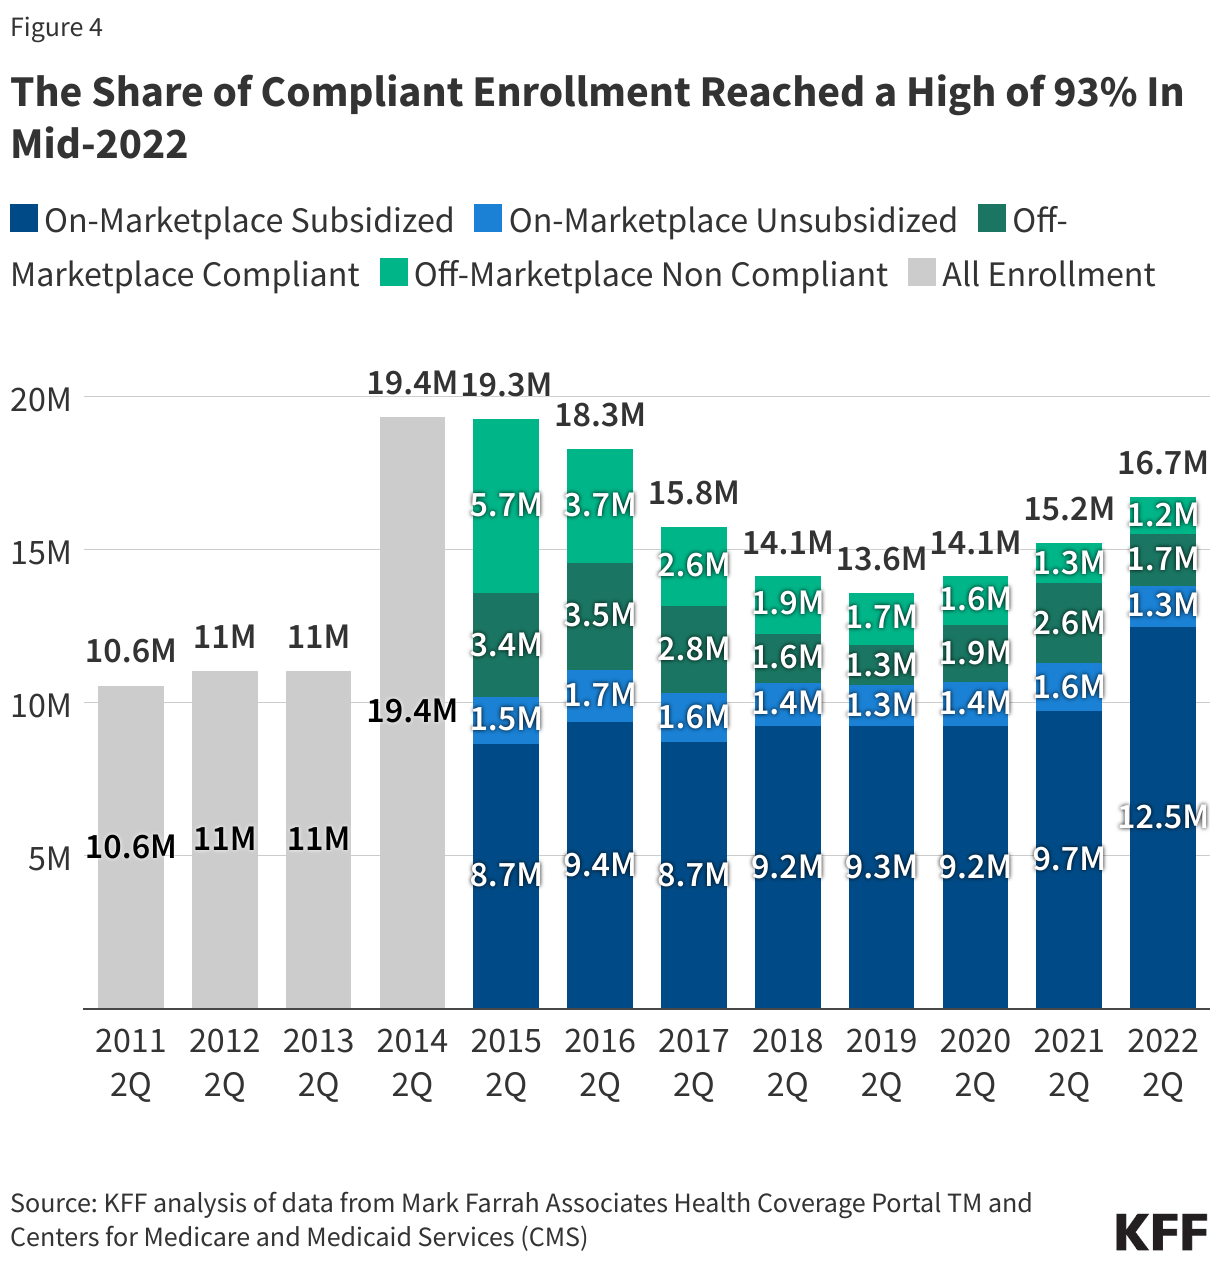
About six in ten adults say they have heard “a little” (30%) or “nothing at all” (31%) about the expiring ACA subsidies, showing widespread lack of information on the cost of coverage for over 24 million people in the U.S. Four in ten say (39%) they’ve heard “a lot” or “some” – up from 27% in June of this year. Even among the group whose cost of coverage is expected to double next year – those who purchase their own insurance plans – about six in ten (58%) say they have heard just “a little” or “nothing at all” about the expiration of tax credits for people who self-purchased insurance.
Democrats seem to be more aware of the pending expiration, with about half of Democrats (50%) saying they have heard at least “some” about this, compared to about a third of independents (35%) and Republicans (34%).
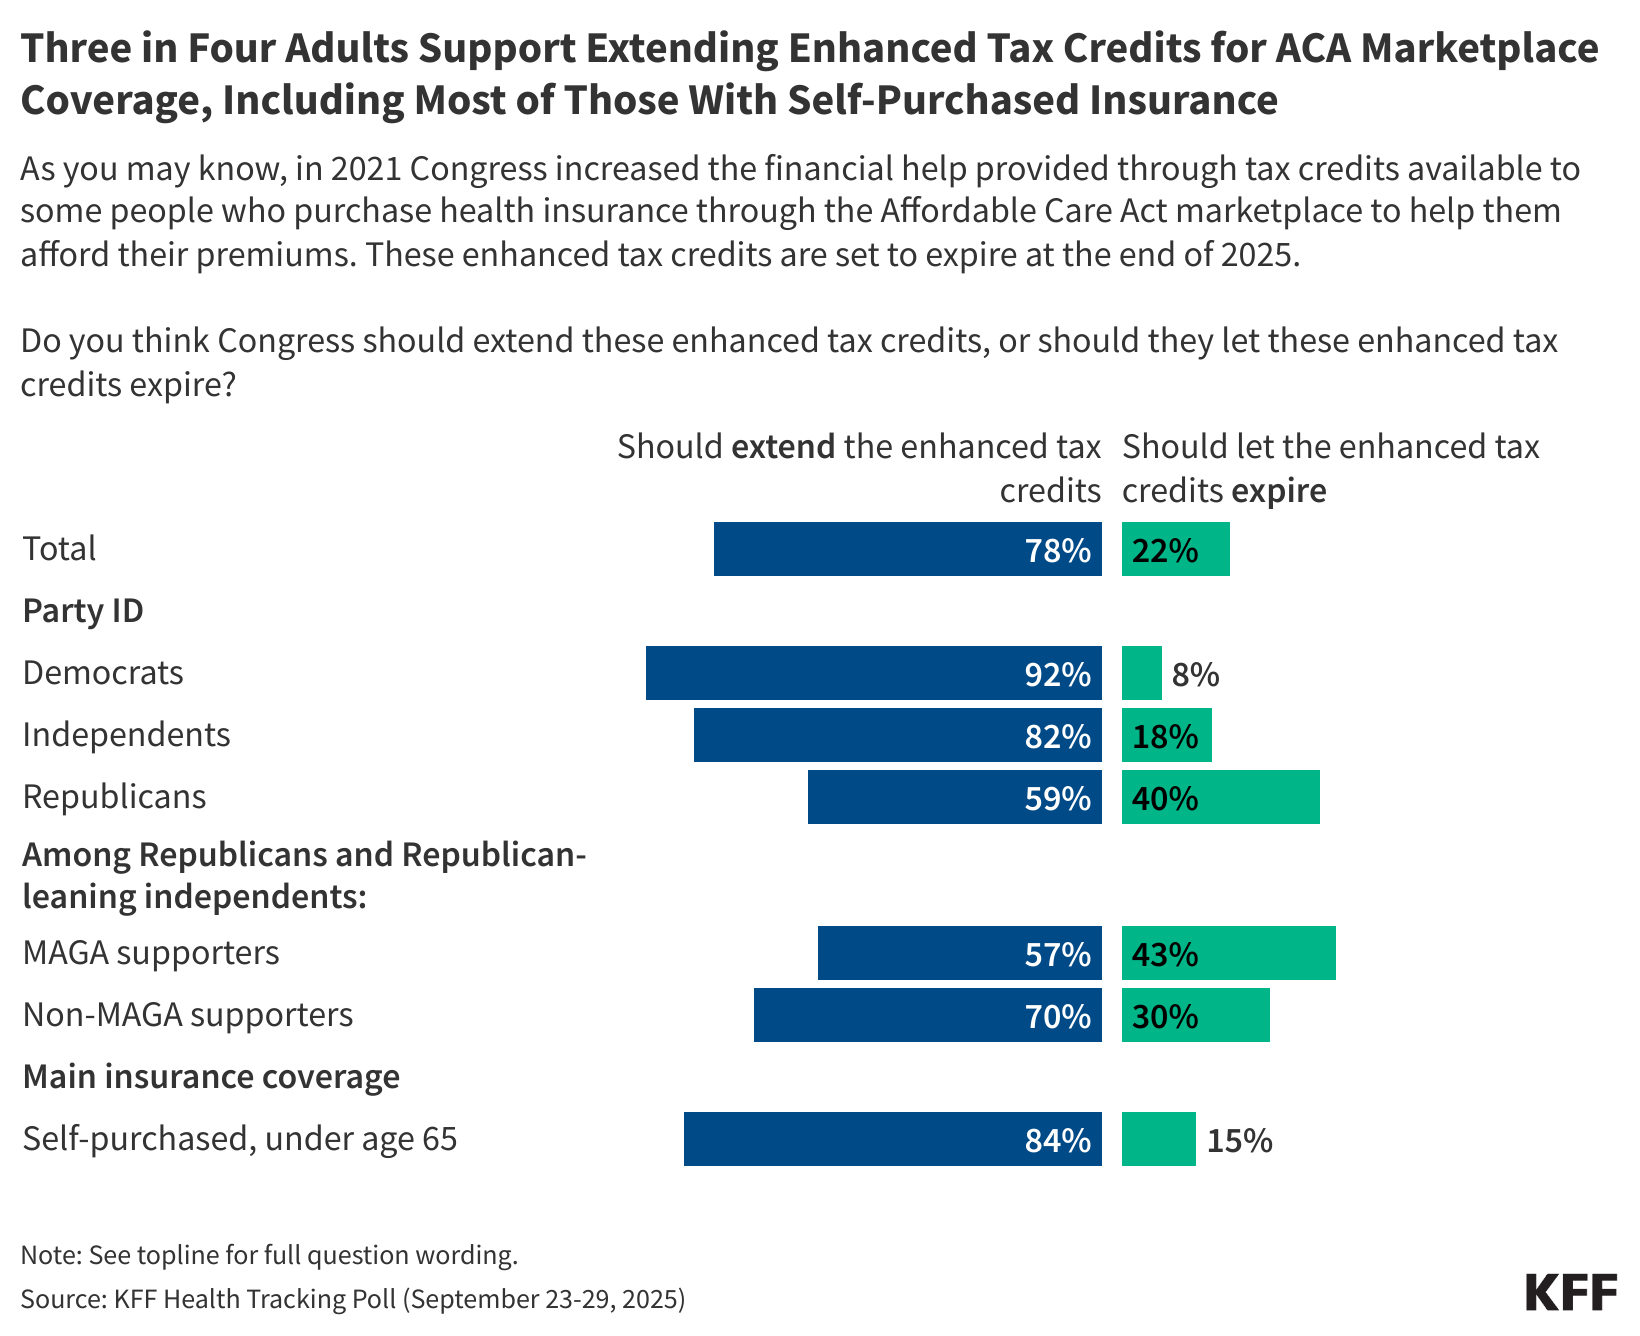
Once the public is told that the expiration date for subsidies is looming, about three-quarters (78%) of adults say Congress should extend the enhanced tax credits for people who buy their own insurance through the ACA Marketplace, more than three times the share (22%) who say Congress should let the credits expire. Over eight in ten (84%) of those who buy their own insurance say that Congress should extend the enhanced tax credits.
Although Republicans are more likely than Democrats and independents to say that Congress should let the credits expire, majorities across political party want Congress to extend the tax credits including nine in ten (92%) Democrats, eight in ten (82%) independents, and six in ten (59%) Republicans, including 57% of Republicans who align with the MAGA movement.
Previous KFF polling has shown that attitudes towards the credits shift slightly after hearing counterarguments both for and against the extension of the credits. This month’s poll shows that large majorities of the public, including majorities of Democrats, independents, Republicans, and MAGA supporters are concerned about many of the potential consequences of letting these enhanced tax credits expire. Additionally, majorities of independents and Republicans and about half of Democrats are concerned about the consequences for extending them.
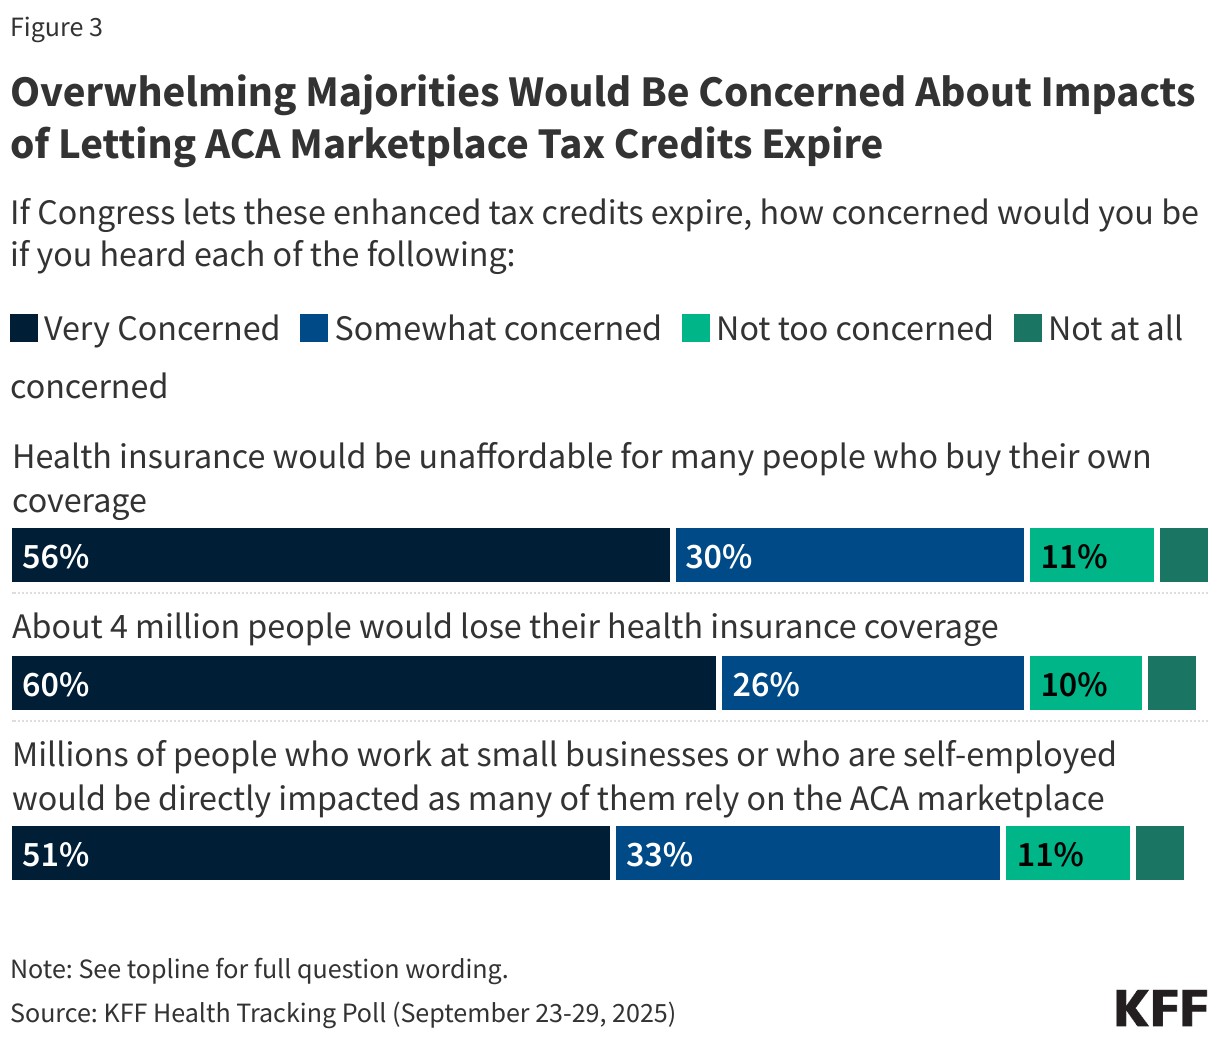
More than eight in ten adults say they would be concerned, including at least half who say they would be “very concerned,” if they heard that health insurance would be unaffordable for many people who buy their own coverage (86%), that 4 million people would lose their health insurance coverage (86%), or if they heard that people who work at small businesses or are self-employed would be directly impacted (85%).
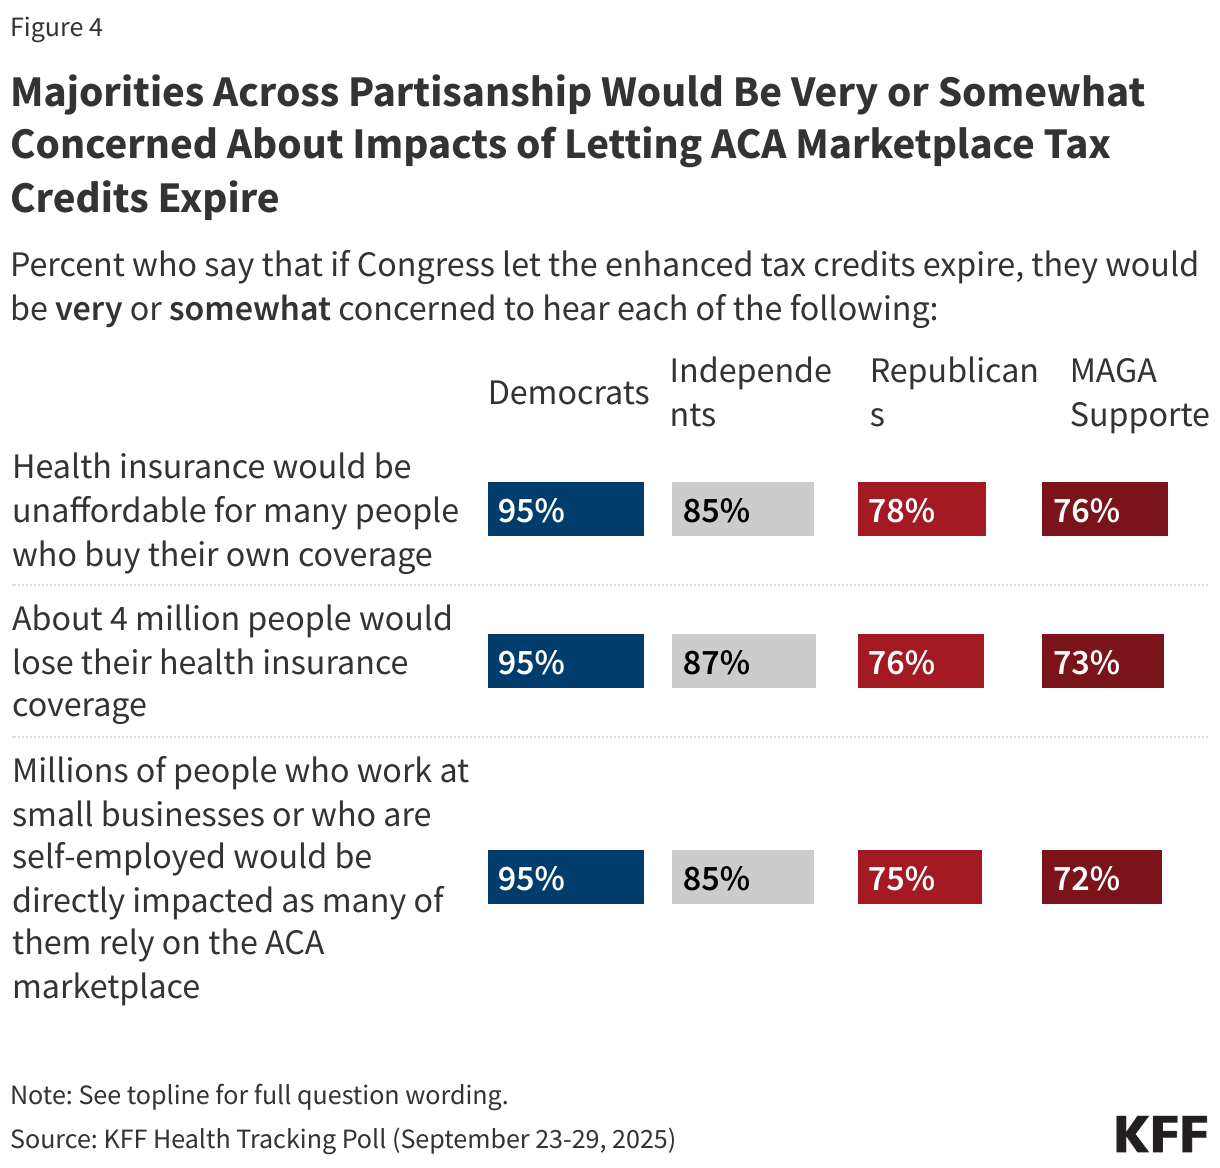
Concern over the possible consequences is high across party lines with large majorities of Democrats and independents saying they would be concerned about each of these potential outcomes, as well as three-quarters of Republicans and MAGA supporters.
On the other side, if Congress does extend these enhanced tax credits, two-thirds (63%) of the public say they would be concerned if they heard that it would require significant federal spending that would be largely paid for by taxpayers, including a quarter (27%) who would be “very concerned.” This is predictably divided along partisan lines. More than eight in ten (83%) Republicans say they would be concerned about federal spending, but notably so do more than six in ten independents (61%) and nearly half of Democrats (49%). Republicans who support the MAGA movement are among the most worried about this issue, with almost half (47%) saying they would be “very concerned.”
The poll finds more people say they would blame President Trump or Republicans in Congress than Democrats if tax credits are not extended. About four in ten (39%) adults who want to see the tax credits extended say that if Congress does not extend these enhanced tax credits, President Trump deserves most of the blame, while another four in ten (37%) say the same about Republicans in Congress. About two in ten (22%) say that Democrats in Congress deserve most of the blame, driven heavily by Republicans. Six in ten (61%) Republicans who want to see the tax credits extended say they would blame Democrats in Congress, including seven in ten MAGA Republicans, compared to one in six (17%) independents.
Over half of Democrats (56%) who want to see the tax credits extended say that if they are not extended, President Trump deserves most of the blame, though four in ten (42%) blame Republicans in Congress. Independents are largely split, with about four in ten saying they will blame Republicans in Congress (42%) or President Trump (39%).
Adults who purchased their own insurance, most of whom do so through the ACA Marketplace, are similarly split, with four in ten (42%) placing the blame if Congress does not extend the enhanced tax credits on Republicans in Congress and four in ten (37%) on President Trump. Two in ten (21%) of this group would blame Democrats in Congress if the subsidies expire. Notably, a previous KFF poll found that nearly half of adults enrolled in ACA Marketplace plans identify as Republican or lean Republican.
Marketplace Enrollees Unsure How to Afford Coverage if Enhanced Tax Credits Expire
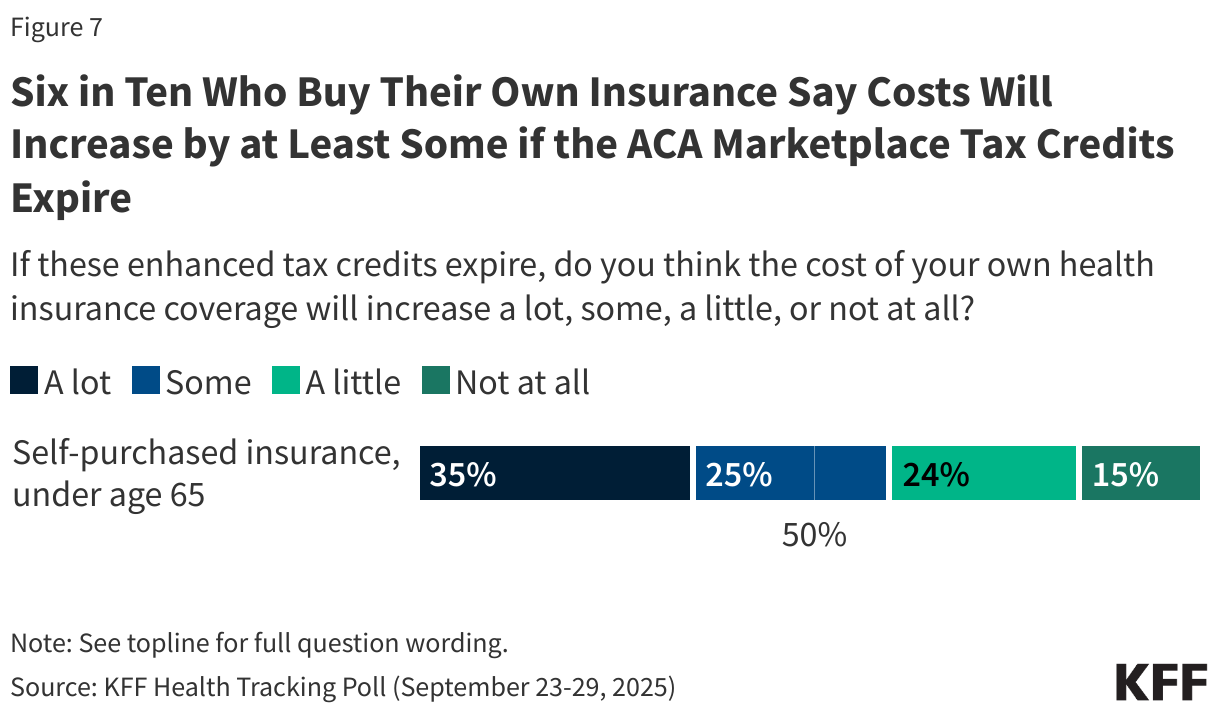
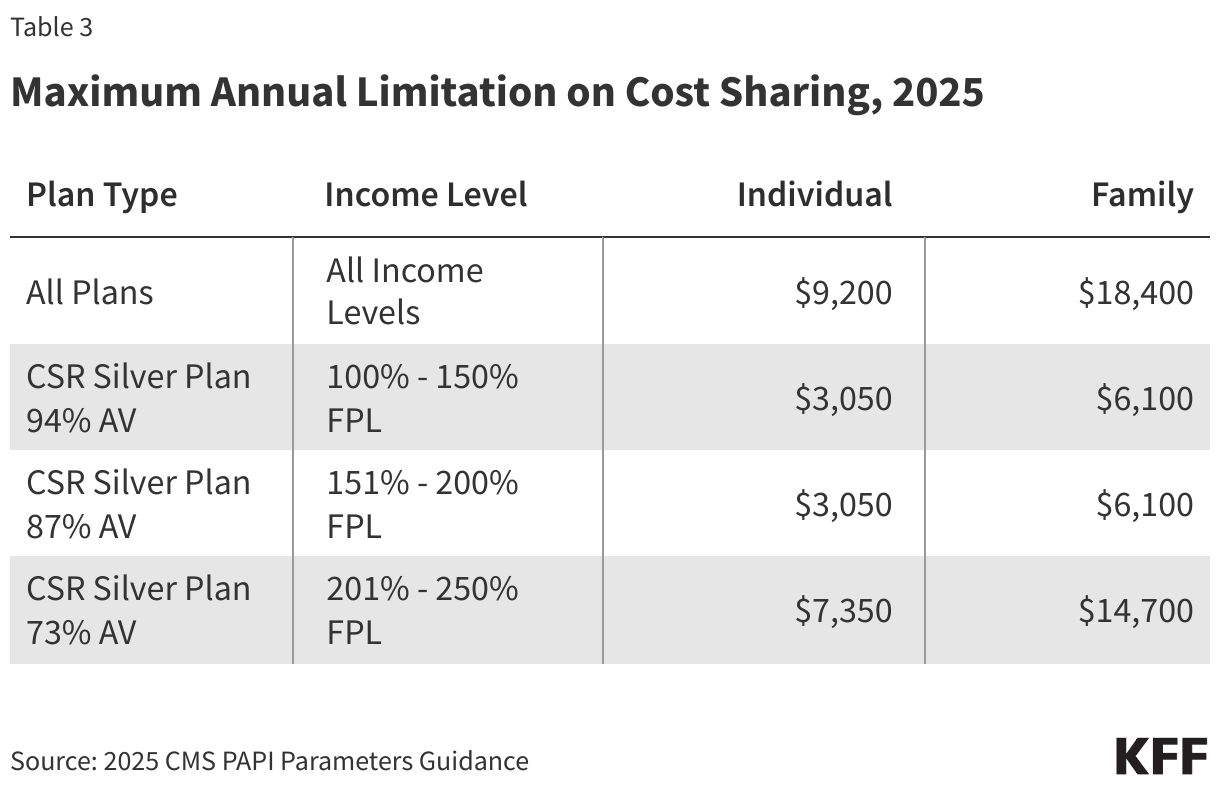
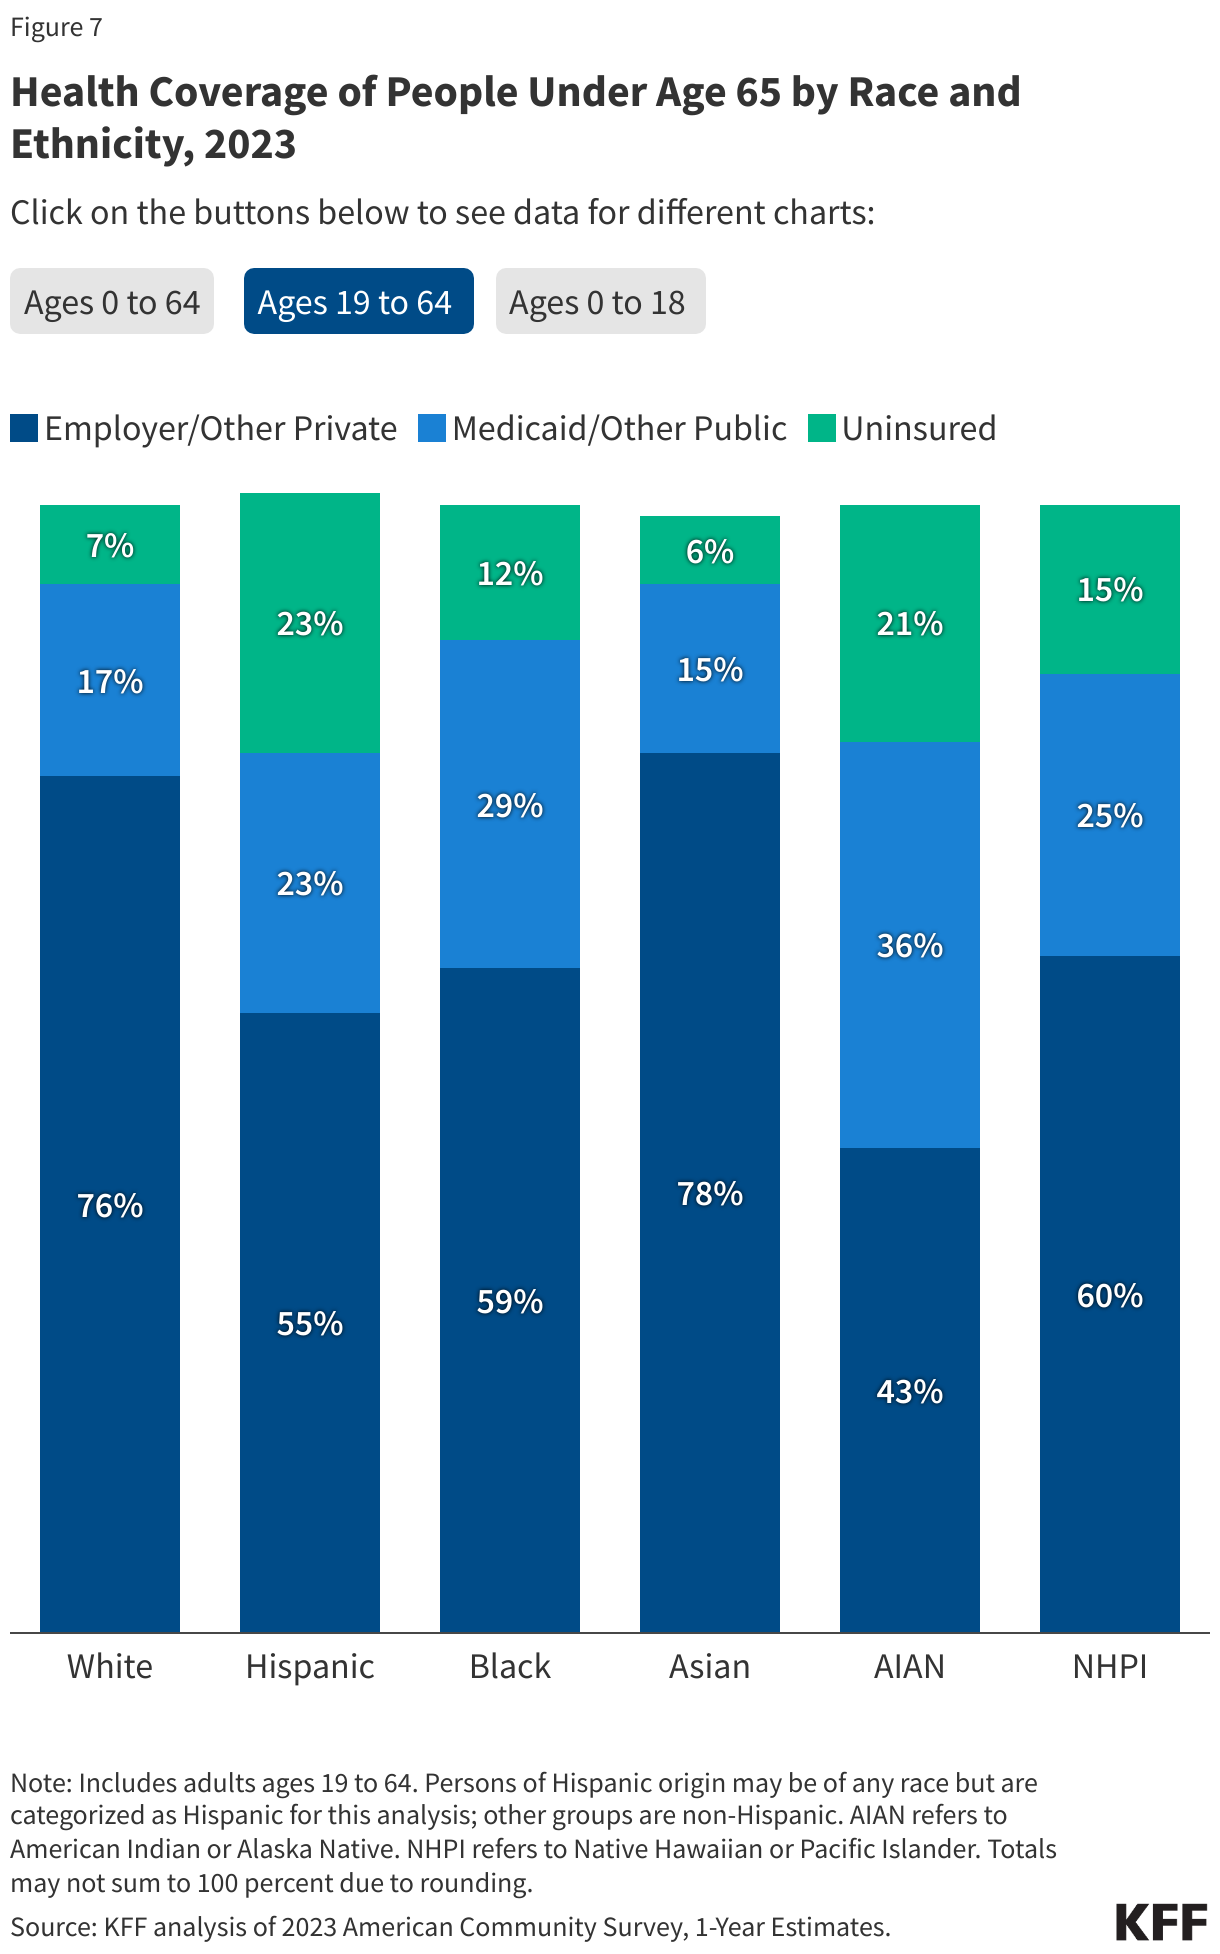
Six in ten adults who buy their own health insurance coverage think the cost of their personal health insurance would increase at least “some” if the tax credits are not extended, while about a quarter say they think it will increase “a little” (24%), or that their costs won’t increase at all (15%). Estimates are that the amount enrollees pay for premiums for ACA Marketplace plans will more than double on average and nearly 4 million people could eventually be uninsured. Notably, more than half of adults with Medicaid (54%) also say they think that if the enhanced tax credits expire the cost of their own coverage will also increase at least “some,” as do about four in ten people with Medicare age 65 and older and about half of people with employer-sponsored insurance. It is important to note that the expiration of enhanced tax credits only directly impact people who buy their own coverage on the ACA Marketplace.
Among those who have insurance through the ACA Marketplace, seven in ten say that if the amount they paid for health insurance each month nearly doubled, they could not pay the higher premiums without significantly disrupting their household finances. Just three in ten estimate that they could pay the higher premiums.
About four in ten (42%) Marketplace enrollees say they would go without health insurance coverage if the amount they had to pay for health insurance each month nearly doubled. Just over a third (37%) say they would continue to pay for their current health insurance, while about a quarter (22%) would get insurance from another source, like an employer or a spouse’s employer.
Public Views of Major Health Care Legislation
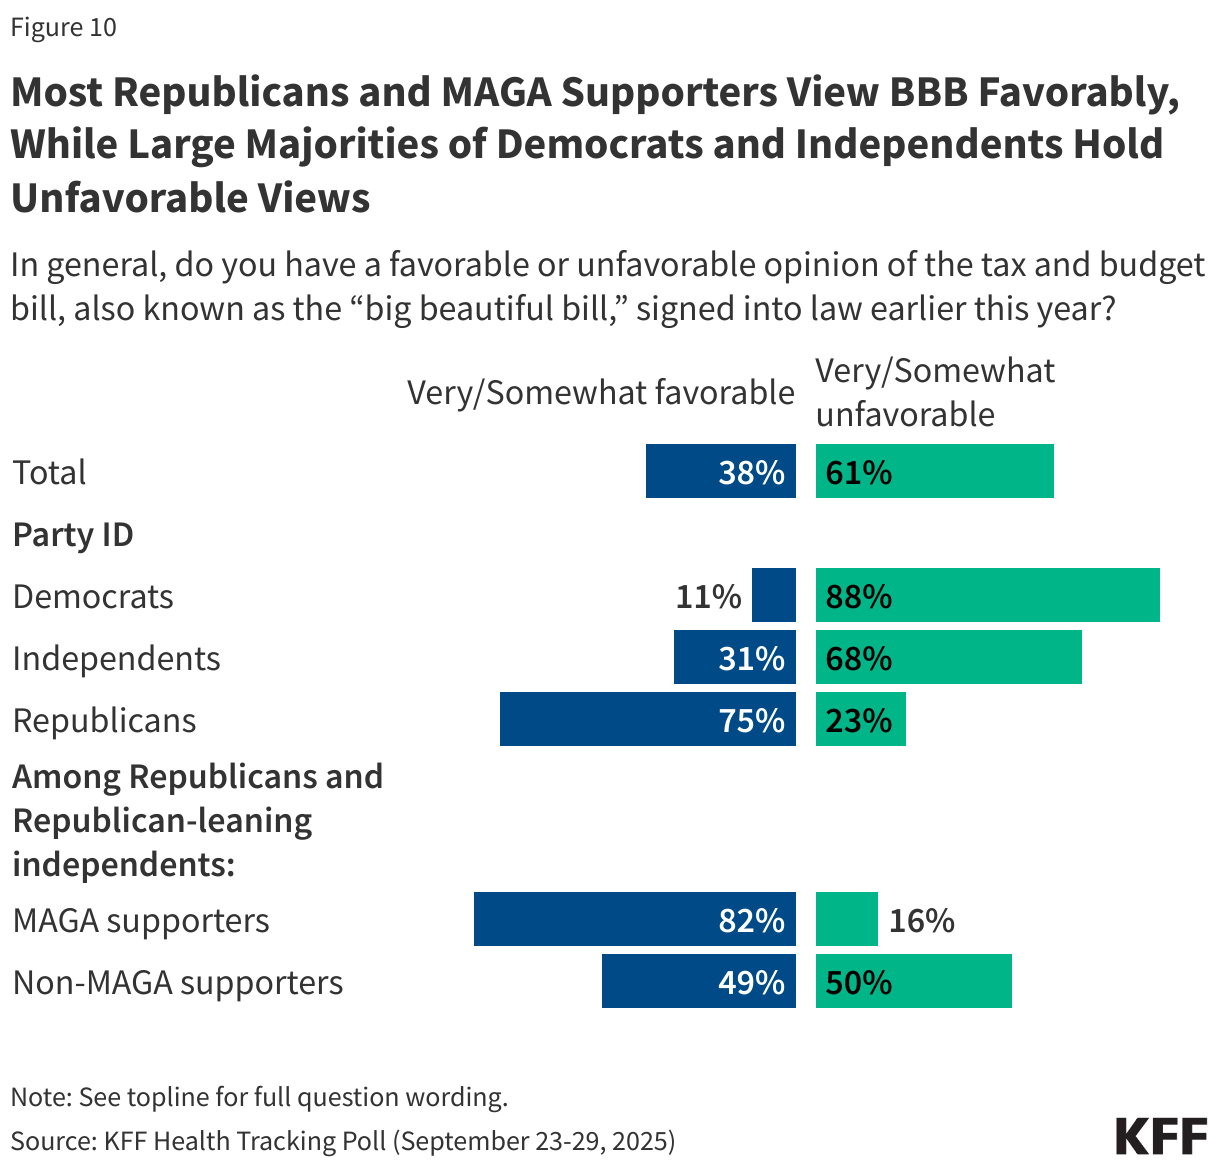
On July 4, 2025, President Trump signed a sweeping legislative package known as the “Big Beautiful Bill,” that included significant changes to the country’s Medicaid program and the Affordable Care Act (ACA) Marketplaces. The package, which passed on a party-line vote, with no Democrats in favor, has been described as the biggest rollback of the country’s health care programs in modern history. Now, as part of federal budget negotiations, Democrats in Congress, are seeking to minimize some of these health insurance rollbacks. The latest KFF Health Tracking Poll shows both parties are playing to their bases, with Republicans strongly supporting the “Big Beautiful Bill” (BBB) legislation and Democrats largely opposed.
Overall, about four in ten (38%) adults hold favorable views of the tax and budget legislation passed earlier this year, including three-quarters of Republicans (75%) and eight in ten (82%) Republicans or Republican-leaning independents who support the MAGA movement. Democrats and independents, on the other hand, largely hold unfavorable views of the legislation, including nearly nine in ten (88%) Democrats and two-thirds (68%) of independents who say they view the law unfavorably.
The share of the public who say they have a favorable opinion of the tax and budget legislation has stayed relatively stable, at close to four in ten (38%), similar to 36% in July and 35% in June.
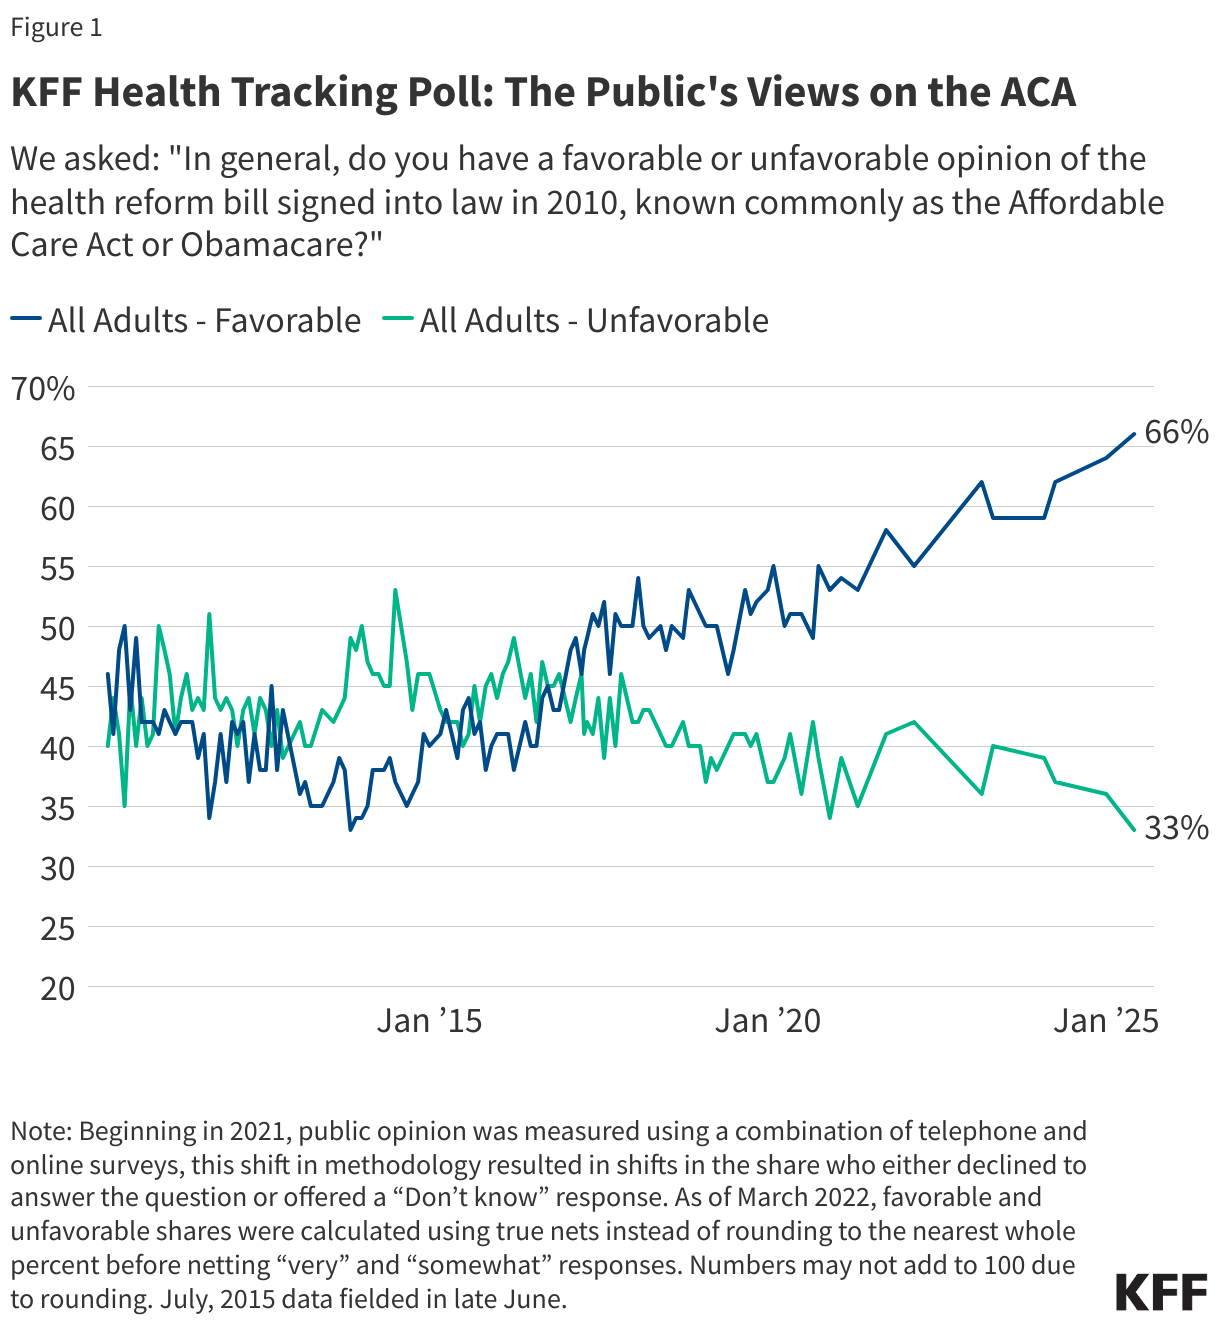
Overall favorability of the 2010 health care law known as the Affordable Care Act (ACA) continues to be at historically high levels, with about two-thirds (64%) of the public viewing the law positively. This is largely driven by Democrats and independents, with over nine in ten (94%) Democrats and two-thirds (64%) of independents viewing the law favorably, while two-thirds (64%) of Republicans have an unfavorable view. Click here to explore more than ten years of polling on the ACA.
Majorities Across Partisans View ACA Marketplaces Favorably
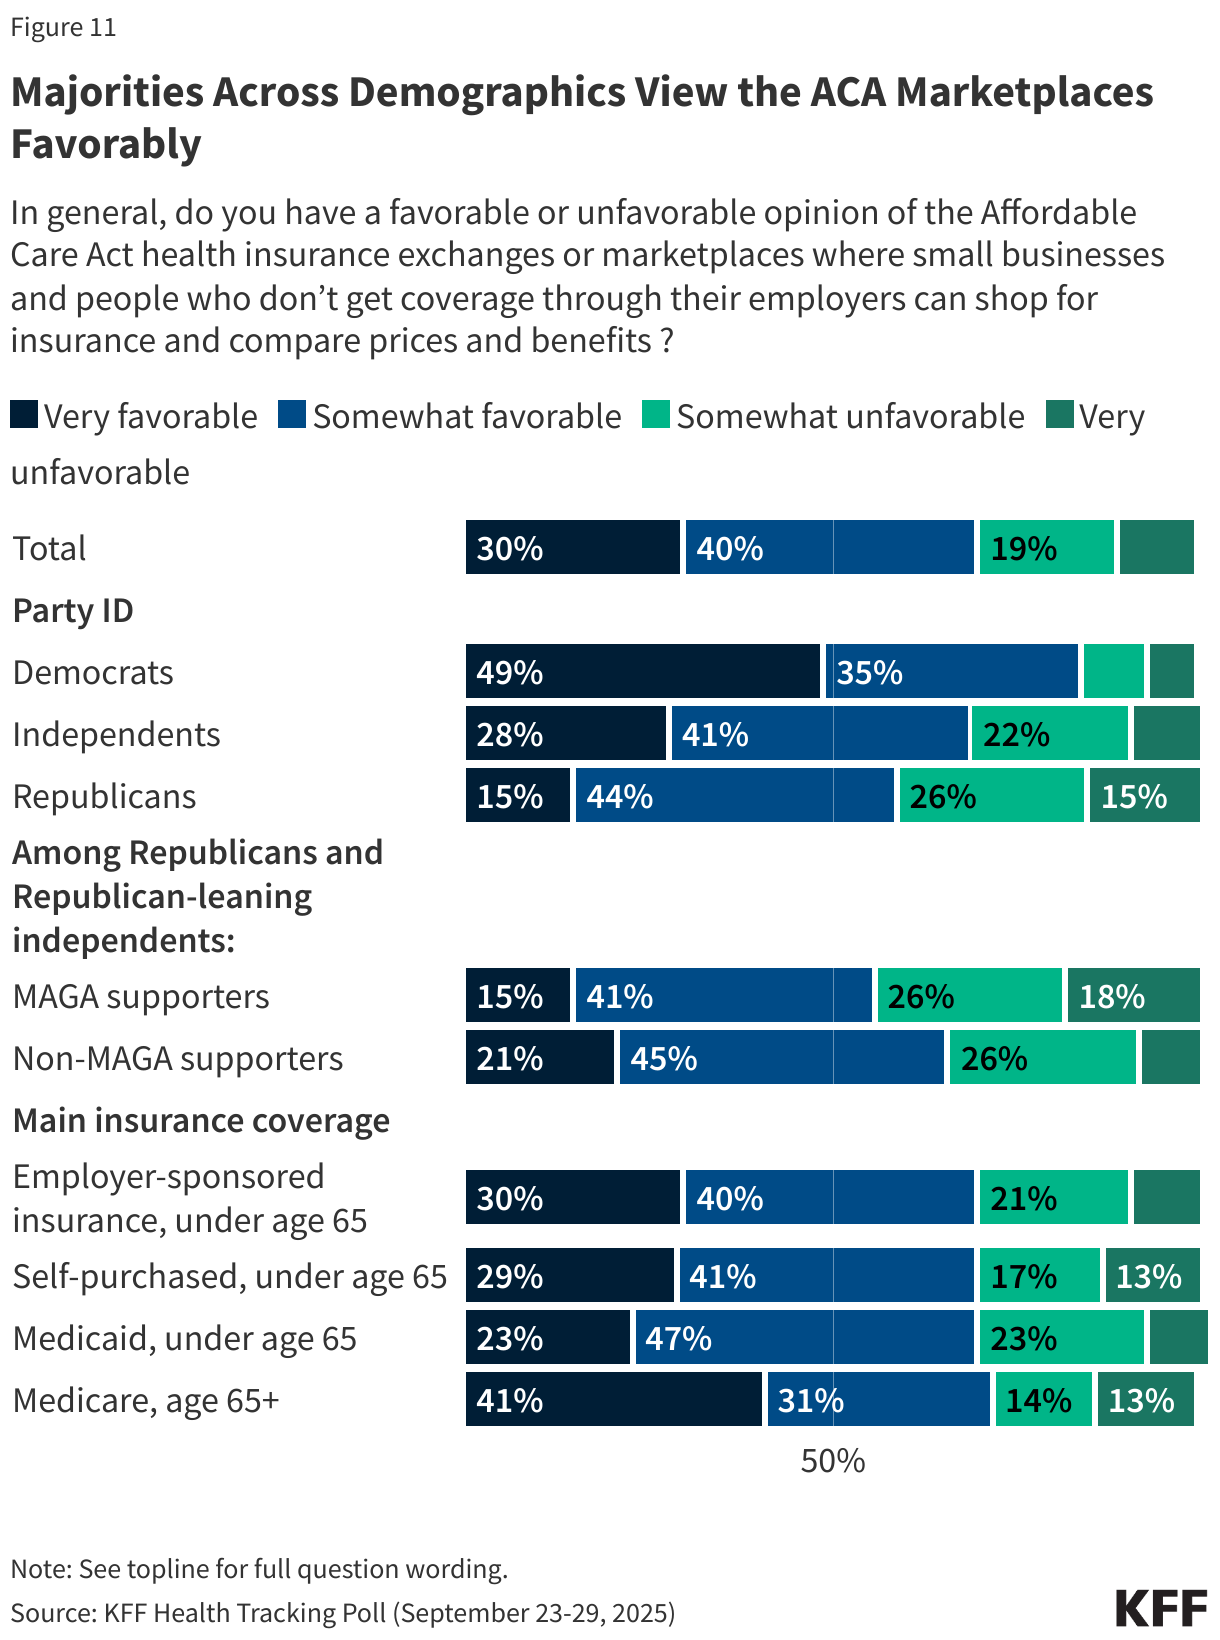
The ACA Marketplaces where people and small businesses can shop for health insurance are even more popular than the ACA itself, with seven in ten (70%) adults having a favorable view. The ACA Marketplaces have consistently been a more popular provision of the ACA, even before Congress passed the American Rescue Plan Act (ARPA) in 2021, which provided temporarily enhanced tax credits to adults who purchased their own health insurance through the Marketplaces. Though views of the ACA Marketplace are divided by partisanship, majorities across party lines view the ACA Marketplace positively, with eight in ten (84%) Democrats, seven in ten (69%) independents, and six in ten (59%) Republicans holding a favorable view. This also includes MAGA Republicans and Republican-leaning independents, among whom over half (56%) hold a favorable opinion of the Marketplace.
Among those who purchase their health care plan themselves, many of whom bought through the ACA Marketplace, seven in ten have a favorable opinion of the ACA health insurance exchanges or Marketplaces.
Many Still Unsure How the “Big Beautiful Bill” Will Impact Them
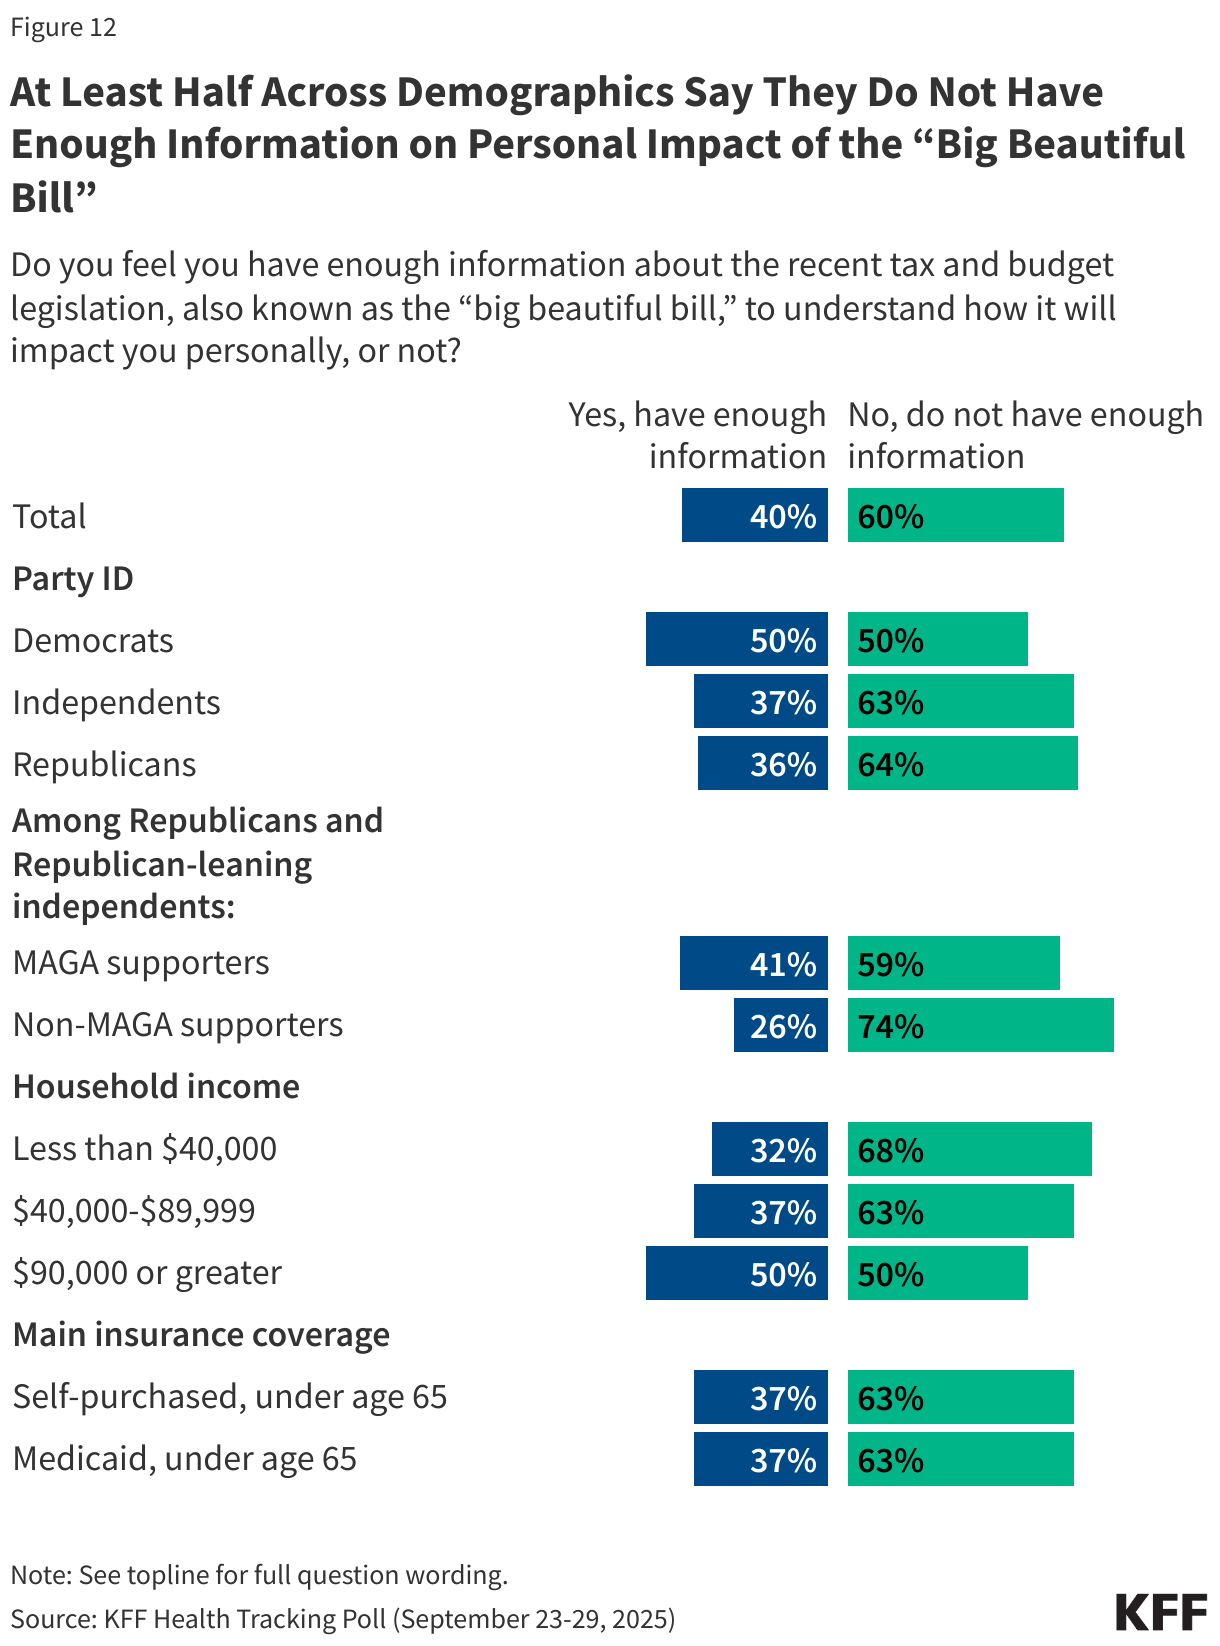
Three months after the passing of President Trump’s major legislative achievement, the “Big Beautiful Bill,” most people remain unaware of how the effects of the tax and budget legislation will impact them. Six in ten adults say they do not have enough information as to how the legislation will impact them personally, while four in ten report that they do have enough information.
Democrats (50%) are more likely than Republicans (36%) and independents (37%) to say they have enough information about how the BBB will impact them personally. About four in ten (41%) Republicans and Republican-leaning independents who identify with the MAGA movement say they have enough information about the impact of the legislation, though majorities (59%) still do not.
The BBB legislation has made changes to the ACA Marketplaces including limiting some eligibility and shortening the open enrollment period. Among those who purchase their own health insurance, two-thirds (63%) say they do not have enough information about how the legislation will impact them.
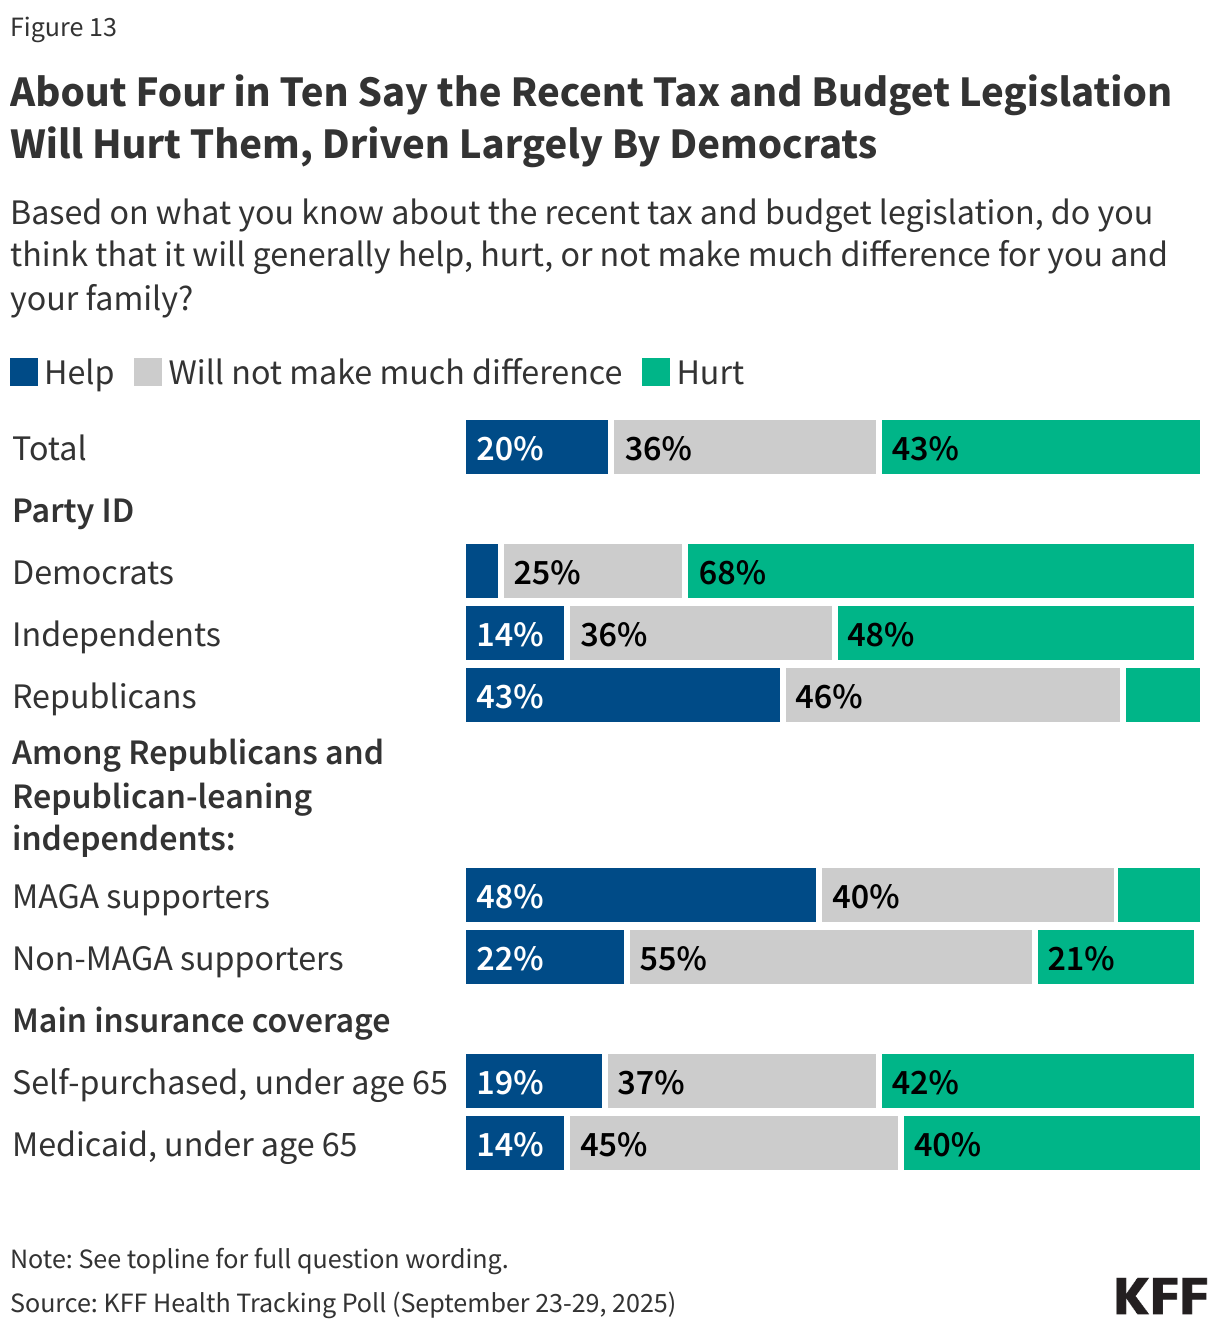
While many say they don’t have enough information about how the tax and budget legislation will affect them, partisanship once again plays a major role in public perception of the law’s impact. About four in ten (43%) say the recent legislation will generally hurt them and their families, which is twice the share who say the legislation will generally help them. More than a third of the public (36%) say the law won’t make a difference to them and their families.
Two-thirds (68%) of Democrats say the tax and budget legislation will generally hurt them and their families, as do about half (48%) of independents. Republicans are split between thinking the law will help them and thinking it won’t make a difference, with similar shares saying the law will help them and their families (43%) and saying they don’t think the law will make a difference for them (46%). Nearly half of Republicans and leaners who support the MAGA movement say the law will help them (48%) while four in ten say it won’t make a difference for them. Very few MAGA supporters (11%) say the law will hurt them.
Among those who purchase their own insurance, many through the ACA Marketplace, four in ten (42%) expect the legislation will generally hurt them and their family, while similar share (37%) expects it to not make much of a difference and just one in five (19%) say it will help.

 Jared Ortaliza
  Matt McGough
  Cynthia Cox
 Julie Rovner
 Kaye Pestaina
  Rayna Wallace
  Michelle Long
 Usha Ranji
  Karen Diep
  Ivette Gomez
  Laurie Sobel
  Alina Salganicoff
 Lindsey Dawson
  Jennifer Kates
  Alex Montero
  Ashley Kirzinger

 Nambi Ndugga
  Latoya Hill
  Drishti Pillai
  Samantha Artiga
 Robin Rudowitz
  Jennifer Tolbert
  Alice Burns
  Elizabeth Hinton
  Anna Mudumala
  Priya Chidambaram
  Maiss Mohamed
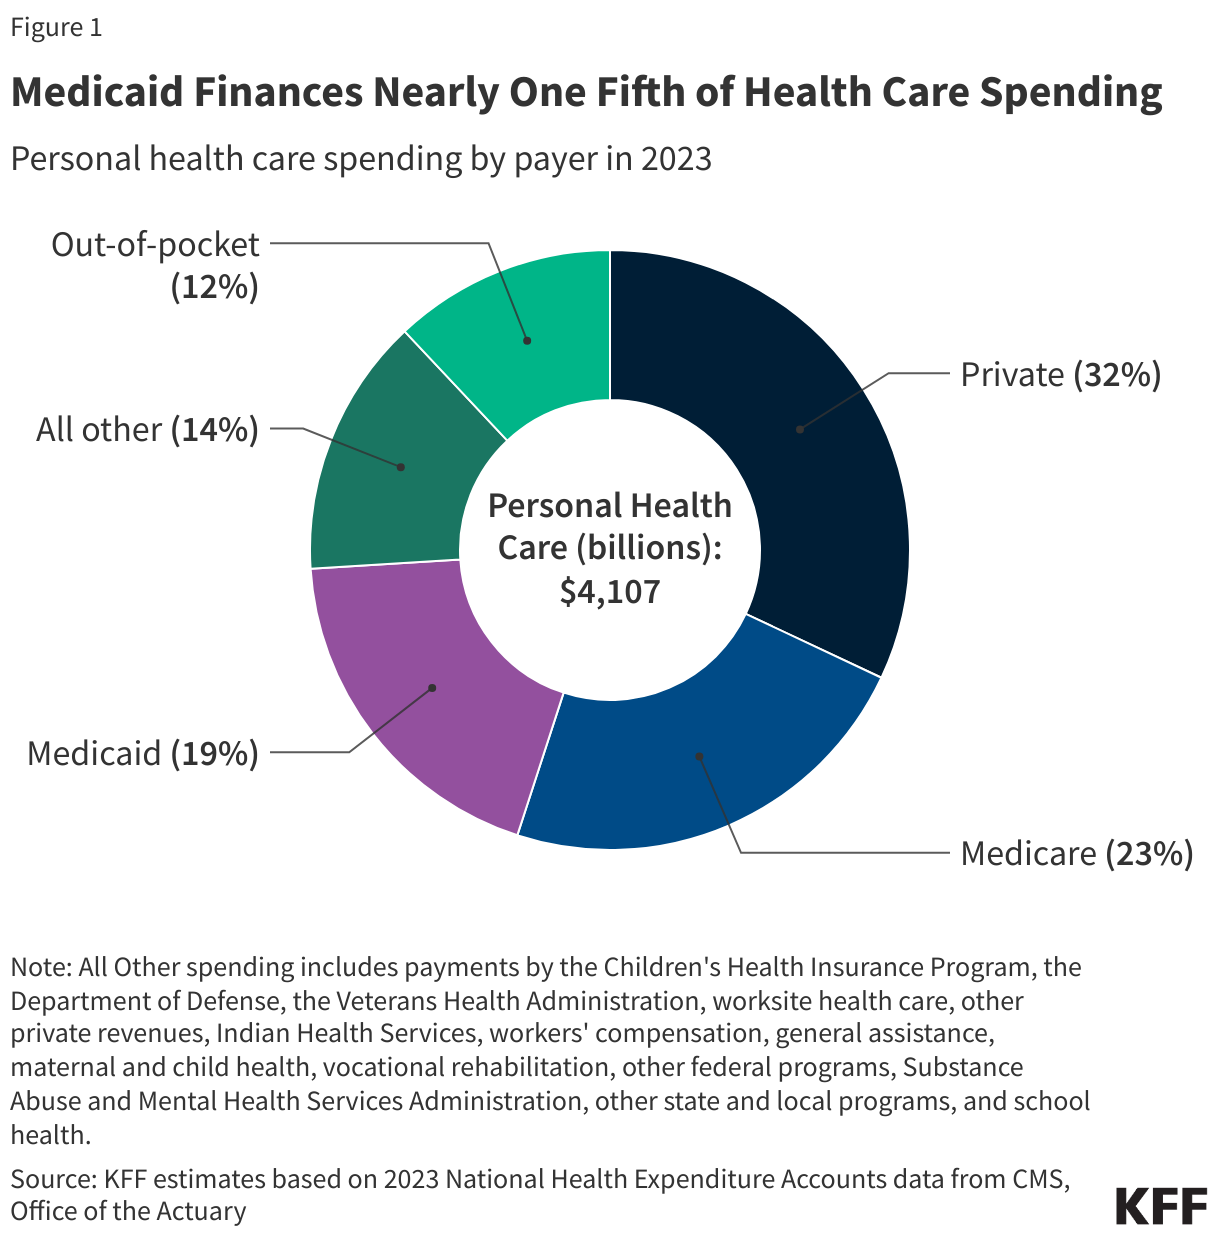
 Emma Wager
  Krutika Amin