The Politics of Health Care and Elections

Table of Contents

Introduction

Copy link to Introduction

Health policy and politics are inextricably linked. Policy is about what the government can do to shift the financing, delivery, and quality of health care, so who controls the government has the power to shape those policies.

Elections, therefore, always have consequences for the direction of health policy – who is the president and in control of the executive branch, which party has the majority in the House and the Senate with the ability to steer legislation, and who has control in state houses. When political power in Washington is divided, legislating on health care often comes to a standstill, though the president still has significant discretion over health policy through administrative actions. And, stalemates at the federal level often spur greater action by states.

Health care issues often, but not always, play a dominant role in political campaigns. Health care is a personal issue, so it often resonates with voters. The affordability of health care, in particular, is typically a top concern for voters, along with other pocketbook issues, and, at over 17% of the economy, health care has many industry stakeholders who seek influence through lobbying and campaign contributions. At the same time, individual policy issues are rarely decisive in elections.

Health Reform in Elections

Copy link to Health Reform in Elections

Health “reform” – a somewhat squishy term generally understood to mean proposals that significantly transform the financing, coverage, and delivery of health care – has a long history of playing a major role in elections.

Harry Truman campaigned on universal health insurance in 1948, but his plan went nowhere in the face of opposition from the American Medical Association and other groups. While falling short of universal coverage, the creation of Medicare and Medicaid in 1965 under Lyndon Johnson dramatically reduced the number of uninsured people. President Johnson signed the Medicare and Medicaid legislation at the Truman Library in Missouri, with Truman himself looking on.

Later, Bill Clinton campaigned on health reform in 1992, and proposed the sweeping Health Security Act in the first year of his presidency. That plan went down to defeat in Congress amidst opposition from nearly all segments of the health care industry, and the controversy over it has been cited by many as a factor in Democrats losing control of both the House and the Senate in the 1994 midterm elections.

For many years after the defeat of the Clinton health plan, Democrats were hesitant to push major health reforms. Then, in the 2008 campaign, Barack Obama campaigned once again on health reform, and proposed a plan that eventually became the Affordable Care Act (ACA). The ACA ultimately passed Congress in 2010 with only Democratic votes, after many twists and turns in the legislative process. The major provisions of the ACA were not slated to take effect until 2014, and opposition quickly galvanized against the requirement to have insurance or pay a tax penalty (the “individual mandate”) and in response to criticism that the legislation contained so-called “death panels” (which it did not). Republicans took control of the House and gained a substantial number of seats in the Senate during the 2010 midterm elections, fueled partly by opposition to the ACA.

The Affordable Care Act (Obamacare)

Copy link to The Affordable Care Act (Obamacare)

The ACA took full effect in 2014, with millions gaining coverage, but more people viewed the law unfavorably than favorably, and repeal became a Republican rallying cry in the 2016 campaign. After the election of Donald Trump, a high-profile effort to repeal the law was ultimately defeated following a public backlash. The ACA repeal debate was a good example of the trade-offs inherent in all health policies. Republicans sought to reduce federal spending and regulation, but the result would have been fewer people covered and weakened protections for people with pre-existing conditions. KFF polling showed that the ACA repeal effort led to increased public support for the law, which persists today.

KFF Health Tracking Poll: The Public's Views on the ACA

While President Trump failed in his first term to repeal the ACA, his administration repealed the individual mandate penalty, reduced federal funding for consumer assistance (navigators) by 84% and outreach by 90%, and expanded short-term insurance plans that can exclude coverage of preexisting conditions.

In a strange policy twist, the Trump administration ended payments to ACA insurers to compensate them for a requirement to provide reduced cost sharing for low-income patients. But, insurers responded by increasing premiums, which in turn increased federal premium subsidies and federal spending, likely strengthening the ACA.

Between President Trump’s presidential terms, the Biden administration restored outreach funding and signed legislation increasing the premium tax credits that help ACA Marketplace enrollees pay their premiums, leading to record enrollment and historically low uninsured rates.

The increased premium tax credits are set to expire at the end of 2025 unless Congress and President Trump take action. If these tax credits do expire, people purchasing subsidized coverage will face significant increases in their monthly premium payments and some may become priced out of the market.

President Trump’s second term has already brought federal policy changes that will significantly alter ACA Marketplace operations, consumer protections, and premium tax credit eligibility. Key changes in the 2025 budget reconciliation law, such as ending auto-renewals, removing repayment limits for tax credits when income rises, and tightening eligibility verification, are projected by the Congressional Budget Office (CBO) to result in 2 million people becoming uninsured.

Medicaid

Copy link to Medicaid

Since its establishment in 1965, Medicaid has evolved as states took up the optional joint federal-state program to the point that in the 1980s all 50 states were participating. Due to the nature of its federal and state management, there has been a give-and-take over the flexibility of and spending for the program, but it has generally expanded in its coverage of key population groups.

With the passage of the ACA, Medicaid experienced its largest federal policy coverage expansion with the addition of what was ultimately a state option to cover adults with incomes up to 138% of the federal poverty level in exchange for enhanced federal funding for the coverage. Much like the take-up of the original Medicaid program, states have gradually adopted the expansion so that only 10 states, mainly concentrated in the South, remain holdouts. However, recent federal actions may alter the expansion landscape.

Until 2025, the most serious attempt by federal policymakers to make cuts to the Medicaid program was during the 2017 failed attempt to repeal the ACA. Medicaid changes in the legislation included a rollback of enhanced federal matching funds for the Medicaid expansion and a per-enrollee cap of federal funds for most Medicaid enrollees. The 2025 budget reconciliation law includes the largest enacted cuts in Medicaid’s history, instituting Medicaid work requirements, tightening eligibility checks and reducing or capping types of provider funding. The CBO estimates that 7.5 million people will become uninsured due to the Medicaid provisions of the law. However, several of the Medicaid provisions will not be implemented until after the 2026 midterm elections.

Affordability of Health Care

Copy link to Affordability of Health Care

One persistent feature of health care as an election issue is that it is fundamentally an economic issue for the country and for individuals. If you are uninsured, you not only experience access issues, but also the high cost of health care treatment. If you have health insurance, you worry about annual premium changes, deductibles, and cost-sharing related to health care services and prescription drugs whose prices continue to rise.

President Trump has often spotlighted the high price of prescription drugs, criticizing both the pharmaceutical industry and pharmacy benefit managers. Although he kept the issue of drug prices on the political agenda as president, in the end, his first administration accomplished little to restrain them. 

President Biden signed the Inflation Reduction Act, which requires the federal government to negotiate the prices of certain drugs in Medicare, which was previously banned. How aggressively the prescription drug negotiation program proceeds during the second Trump administration is an open question. While President Trump has issued an executive order calling for a “most favored nation” policy for drug pricing, with prices in the U.S. matching the currently lower prices in other countries, it remains unclear how drug companies will respond to the call and whether there will be any enforcement mechanism.

Health Care Infrastructure of the Federal Government

Copy link to Health Care Infrastructure of the Federal Government

A feature of the second Trump administration has been the push to remake the executive branch of the federal government to reflect his priorities at a scale that hasn’t occurred in the recent past. Secretary of Health and Human Services (HHS), Robert F. Kennedy, Jr., announced a plan to restructure the department in March 2025 that would reduce the workforce substantially, create the new agency Administration for a Healthy America, reorganize and consolidate divisions and relocate offices.

HHS Secretary Kennedy is also leading the Make America Healthy Again (MAHA) Commission and making substantial changes to the vaccine approval process by remaking the roster for the Centers for Disease Control and Prevention’s Advisory Committee on Immunization Practices and having CDC change recommendations for who should receive the COVID-19 vaccine.

These changes to the federal health care infrastructure could impact the accessibility of vaccines and other preventive services, as well as undermine the confidence the public has in the government, particularly its scientific agencies.

Future Outlook

Copy link to Future Outlook

Ultimately, irrespective of the issues that get debated during the campaign, the outcome of federal elections – who controls the White House and Congress – has significant implications for the future direction of health care.

However, even with changes in party control of the federal government, generally incremental movement to the left or the right is the norm. Sweeping changes in health policy, such as the creation of Medicare and Medicaid or passage of the ACA, are rare in the U.S. political system and are usually preceded by one-party control of Congress and the presidency. More fundamental changes in health care financing and coverage, such as Medicare for All, face long odds. This is the case even though most of the public favors Medicare for All, though attitudes shift significantly after hearing messages about its potential impacts.

It has historically been politically difficult to take benefits away from people once they have them. That, and the fact that seniors are a strong voting bloc, has been why Social Security and Medicare have been considered political “third rails.” While Medicare and Social Security were largely untouched in the Republican tax and spending law passed in 2025, the law made substantial cuts to the ACA and Medicaid, and millions more people are projected to become uninsured in what will be the biggest rollback in federal support for health coverage ever. Looking toward the 2026 midterm election and beyond, changes to both the ACA and Medicaid, as well as fundamental changes to the health care infrastructure and public health policies of the federal government, may emerge as major campaign issues.

Resources

Copy link to Resources

Citation

Copy link to Citation

Levitt, L. & Singh, R., The Politics of Health Care and the 2024 Election. In Altman, Drew (Editor), Health Policy 101, (KFF, October 2025) https://www.kff.org/elections/health-policy-101-the-politics-of-health-care-and-elections/ (date accessed).

Medicare 101

Table of Contents

What Is Medicare?

Copy link to What Is Medicare?

Medicare is the federal health insurance program established in 1965 under Title XVIII of the Social Security Act for people age 65 or older, regardless of income or medical history, and later expanded to cover people under age 65 with long-term disabilities. Today, Medicare provides health insurance coverage to 68 million people, including 61 million people age 65 or older and 7 million people under age 65. Medicare covers a comprehensive set of health care services, including hospitalizations, physician visits, and prescription drugs, along with post-acute care, skilled nursing facility care, home health care, hospice, and preventive services. People with Medicare can choose to get coverage under traditional Medicare or Medicare Advantage private plans.

Medicare spending comprised 13.5% of the federal budget in 2024 and 21.2% of national health care spending in 2023. Funding for Medicare comes primarily from government contributions, payroll tax revenues, and premiums paid by beneficiaries. Over the longer term, the Medicare program faces financial pressures associated with higher health care costs, growing enrollment, and an aging population.

Who Is Covered by Medicare?

Copy link to Who Is Covered by Medicare?

Most people become eligible for Medicare when they reach age 65, regardless of income, health status, or medical conditions. Residents of the U.S., including citizens and permanent residents, are eligible for premium-free Medicare Part A if they have worked at least 40 quarters (10 years) in jobs where they or their spouses paid Medicare payroll taxes and are at least 65 years old. People under age 65 who receive Social Security Disability Insurance (SSDI) payments generally become eligible for Medicare after a two-year waiting period. People diagnosed with end-stage renal disease (ESRD) and amyotrophic lateral sclerosis (ALS) become eligible for Medicare with no waiting period.

Medicare covers a diverse population in terms of demographics and health status, and this population is expected to grow larger and more diverse in the future as the U.S. population ages. Currently, most people with Medicare are White, female, and between the ages of 65 and 84 (Figure 1). The share of U.S. adults who are age 65 or older is projected to grow from 17% in 2022 to nearly a quarter of the nation’s total population (24%) in 2060. Among people ages 65 and older, the share of people ages 80 and older will increase from 23% in 2022 to 34% in 2060. As the U.S. population ages, the number of Medicare beneficiaries is projected to grow by more than one-third from 68 million people in 2024 to more than 93 million people in 2060. The Medicare population will also grow more racially and ethnically diverse. By 2060, people of color will comprise 44% of the U.S. population ages 65 and older, up from a quarter in 2022.

Selected Demographic Characteristics of Medicare Beneficiaries, 2022

While many Medicare beneficiaries enjoy good health, others live with health problems that affect their quality of life, including multiple chronic conditions, limitations in their activities of daily living, and cognitive impairments. In 2022, nearly half (45%) of Medicare beneficiaries had four or more chronic conditions, more than a quarter (28%) had a functional impairment, and 17% had a cognitive impairment (Figure 2).

Selected Measures of Health Status of the Medicare Population, 2022

Most Medicare beneficiaries have limited financial resources, including income and assets. In 2024, one in four Medicare beneficiaries – 16.5 million people with Medicare – lived on incomes below $24,600 per person, and half (32.9 million) of all Medicare beneficiaries lived on incomes below $43,200 per person; one in four Medicare beneficiaries had savings below $18,950 per person in 2024, while half had savings below $110,100 per person. Income among Medicare beneficiaries is generally lower for women than men, for people of color than White beneficiaries, and for beneficiaries under age 65 with disabilities than older beneficiaries (Figure 3).

Among Medicare Beneficiaries, Per Capita Income Declines with Age among Older Adults and Is Lower for Women, Black and Hispanic Beneficiaries, and Beneficiaries Under 65

What Does Medicare Cover and How Much Do People Pay for Medicare Benefits?

Copy link to What Does Medicare Cover and How Much Do People Pay for Medicare Benefits?

Benefits. Medicare covers a comprehensive set of medical care services, including hospital stays, physician visits, and prescription drugs. Medicare benefits are divided into four parts: 

  • Part A, also known as the Hospital Insurance (HI) program, covers inpatient care provided in hospitals and short-term stays in skilled nursing facilities, hospice care, post-acute home health care, and pints of blood received at a hospital or skilled nursing facility. An estimated 67.5 million people were enrolled in Part A in 2024. In 2023, 13% of beneficiaries in traditional Medicare had an inpatient hospital stay, while 7% used home health care services (which are also covered under Part B), and 3% had a skilled nursing facility stay (Figure 4). (Comparable utilization data for beneficiaries in Medicare Advantage is not available.)
  • Part B,the Supplementary Medical Insurance (SMI) program, covers outpatient services such as physician visits, outpatient hospital care, and preventive services (e.g., mammography and colorectal cancer screening), among other medical benefits. An estimated 62 million people were enrolled in Part B in 2024. A larger share of beneficiaries use Part B services compared to Part A services. For example, in 2023, more than 9 in 10 (92%) traditional Medicare beneficiaries used physician and other services covered under Part B and 59% used outpatient hospital services.
  • Part C, more commonly referred to as the Medicare Advantage program, allows beneficiaries to enroll in a private plan, such as a health maintenance organization (HMO) or preferred provider organization (PPO), as an alternative to traditional Medicare. Medicare Advantage plans cover all benefits under Medicare Part A, Part B, and, in most cases, Part D (Medicare’s outpatient prescription drug benefit), and typically offer extra benefits, such as dental services, eyeglasses, and hearing exams. In 2025, 34.1 million beneficiaries are enrolled in Medicare Advantage, which is 54% of Medicare beneficiaries who are eligible to enroll in Medicare Advantage plans. (See “What Is Medicare Advantage and How Is It Different From Traditional Medicare?” for additional information.) 
  • Part D is a voluntary outpatient prescription drug benefit delivered through private plans that contract with Medicare, either stand-alone prescription drug plans (PDPs) or Medicare Advantage prescription drug (MA-PD) plans. In 2025, 54.8 million beneficiaries are enrolled in Part D, with 58% enrolled in MA-PDs and 42% enrolled in PDPs. In 2023, over 9 in 10 Medicare beneficiaries enrolled in Part D (93%) used prescription drugs. (See “What Is the Medicare Part D Prescription Drug Benefit?” for additional information.)
Use of Selected Medicare-Covered Services by People with Medicare in 2023

Although Medicare covers a comprehensive set of medical benefits, Medicare does not cover long-term care services. Additionally, coverage of vision services, dental care, and hearing aids is not part of the standard benefit, though most Medicare Advantage plans offer some coverage of these services.

Premiums and cost sharing. Medicare has varying premiums, deductibles, and coinsurance amounts that typically change each year to reflect program cost changes.

  • Part A: Most beneficiaries do not pay a monthly premium for Part A services, but are required to pay a deductible for inpatient hospitalizations ($1,676 in 2025). (People who are working contribute payroll taxes to Medicare and qualify for premium-free Part A at age 65 based on having paid 1.45% of their earnings over at least 40 quarters.) Beneficiaries are generally subject to cost sharing for Part A benefits, including extended inpatient stays in a hospital ($419 per day for days 61-90 and $838 per day for days 91-150 in 2025) or skilled nursing facility ($209.50 per day for days 21-100 in 2025). There is no cost sharing for home health visits.
  • Part B: Beneficiaries enrolled in Part B, including those in traditional Medicare and Medicare Advantage plans, are generally required to pay a monthly premium ($185 in 2025). Beneficiaries with annual incomes greater than $106,000 for a single person or $212,000 for a married couple in 2025 pay a higher, income-related monthly Part B premium, ranging from $259 to $628.90. Approximately 8% of Medicare beneficiaries with Part B coverage are expected to pay income-related Part B premiums in 2025. Part B benefits are subject to an annual deductible ($257 in 2025), and most Part B services are subject to coinsurance of 20 percent.
  • Part C: In addition to paying the Part B premium, Medicare Advantage enrollees may be charged a separate monthly premium for their Medicare Advantage plan, although three-quarters (76%) of enrollees are in plans that charge no additional premium in 2025. Medicare Advantage plans are generally prohibited from charging more than traditional Medicare, but vary in the deductibles and cost-sharing amounts they charge. Medicare Advantage plans typically establish provider networks and may require higher cost sharing for services received from non-network providers.
  • Part D: Part D plans vary in terms of premiums, deductibles, and cost sharing. People in traditional Medicare who are enrolled in a separate stand-alone Part D plan generally pay a monthly Part D premium unless they qualify for full benefits through the Part D Low-Income Subsidy (LIS) program and are enrolled in a premium-free (benchmark) plan. In 2025, the average enrollment-weighted premium for stand-alone Part D plans is $39 per month, substantially higher than the enrollment-weighted average monthly portion of the premium for drug coverage in MA-PDs ($7 in 2025).

Sources of coverage. Most people with Medicare have some type of coverage that may protect them from unlimited out-of-pocket costs and may offer additional benefits, whether it’s coverage in addition to traditional Medicare or coverage from Medicare Advantage plans, which are required to have an out-of-pocket cap and typically offer supplemental benefits (Figure 5). However, based on KFF analysis of data from the 2022 Medicare Current Beneficiary Survey, 3.2 million people with Medicare have no additional coverage, which places them at risk of facing high out-of-pocket spending or going without needed medical care due to costs. 

  • Medicare Advantage plans now cover more than half (54%) of all Medicare beneficiaries enrolled in both Part A and Part B, or 34 million people (in 2022, Medicare Advantage enrollment was just under half of beneficiaries, or 29.9 million people). (See “What Is Medicare Advantage and How Is It Different From Traditional Medicare?” for additional information.)
  • Employer and union-sponsored plans provided some form of coverage to 14.5 million Medicare beneficiaries – nearly a quarter (24%) of Medicare beneficiaries overall in 2022. Of the total number of beneficiaries with employer coverage, 9.1 million beneficiaries had this coverage in addition to traditional Medicare (31% of beneficiaries in traditional Medicare), while 5.4 million beneficiaries were enrolled in Medicare Advantage employer group plans. (These estimates exclude 5.6 million Medicare beneficiaries with Part A only in 2022, primarily because they or their spouse were active workers and had primary coverage from an employer plan and Medicare as a secondary payer.) 
  • Medicare supplement insurance, also known as Medigap, covered 2 in 10 (21%) Medicare beneficiaries overall, or 42% of those in traditional Medicare (12.5 million beneficiaries) in 2022. Medigap policies, sold by private insurance companies, fully or partially cover Medicare Part A and Part B cost-sharing requirements, including deductibles, copayments, and coinsurance. 
  • Medicaid, the federal-state program that provides health and long-term services and supports coverage to low-income people, was a source of coverage for 11.6 million Medicare beneficiaries with low incomes and modest assets in 2022 (19% of all Medicare beneficiaries), including 7.0 million enrolled in Medicare Advantage and 4.6 million in traditional Medicare. (This estimate is somewhat lower than KFF estimates published elsewhere due to different data sources and methods used.) For these beneficiaries, referred to as dual-eligible individuals, Medicaid typically pays the Medicare Part B premium and may also pay a portion of Medicare deductibles and other cost-sharing requirements. Most dual-eligible individuals are eligible for full Medicaid benefits, including long-term services and supports.
Nearly all People with Medicare Had Coverage Either Through Medicare Advantage Plans or Traditional Medicare Coupled with Some Other Type of Coverage in 2022

What Is Medicare Advantage and How Is It Different From Traditional Medicare?

Copy link to What Is Medicare Advantage and How Is It Different From Traditional Medicare?

Medicare Advantage, also known as Medicare Part C, allows beneficiaries to receive their Medicare benefits from a private health plan, such as a health maintenance organization (HMO) or preferred provider organization (PPO). Medicare pays private insurers to provide Medicare-covered benefits (Part A and B, and often Part D) to enrollees. Virtually all Medicare Advantage plans include an out-of-pocket limit for benefits covered under Parts A and B, and most offer additional benefits not covered by traditional Medicare, such as vision, hearing, and dental. The average Medicare beneficiary can choose from 34 Medicare Advantage plans with prescription drug coverage offered by eight insurance companies in 2025. These plans vary across many dimensions, including premiums, cost-sharing requirements, out-of-pocket limits, extra benefits, provider networks, prior authorization and referral requirements, denial rates, and prescription drug coverage.

More than half of all eligible Medicare beneficiaries (54%) are currently enrolled in a Medicare Advantage plan, up from 25% in 2010 (Figure 6). The share of eligible Medicare beneficiaries in Medicare Advantage plans varies across states, ranging from 2% in Alaska to 63% in Alabama and Michigan.  Growth in Medicare Advantage enrollment is due to a number of factors. Medicare beneficiaries are attracted to Medicare Advantage due to the multitude of extra benefits, the simplicity of one-stop shopping (in contrast to traditional Medicare where beneficiaries might also purchase a Part D plan and a Medigap plan), and the availability of plans with no premiums beyond the Part B premium, driven in part by the current payment system that generates high gross margins in this market (see “How Does Medicare Pay Private Plans in Medicare  Advantage and Medicare Part D?” for additional information). Insurers market these plans aggressively, airing thousands of TV ads for Medicare Advantage during the Medicare open enrollment period. In some cases, Medicare beneficiaries have no choice but to be enrolled in a Medicare Advantage plan for their retiree health benefits as some employers are shifting their retirees into these plans; if they are dissatisfied with this option, they may have to give up retiree benefits altogether, although they would retain Medicare and have the option to choose traditional Medicare (potentially with a Medigap supplement).

More Than Half (54%) of Eligible Medicare Beneficiaries Are Enrolled in a Medicare Advantage Plan in 2025

There are several differences between Medicare Advantage and traditional Medicare. Medicare Advantage plans can establish provider networks, the size of which can vary considerably for both physicians and hospitals, depending on the plan and the county where it is offered. These provider networks may also change over the course of the year. Medicare Advantage enrollees who seek care from an out-of-network provider might be required to pay higher cost sharing or pay in full out of pocket for their care. In contrast, traditional Medicare beneficiaries can see any provider that accepts Medicare and is accepting new patients. In 2019, 89% of non-pediatric office-based physicians accepted new Medicare patients, with little change over time. Only 1% of all non-pediatric physicians formally opted out of the Medicare program in 2024.

Medicare Advantage plans also often use tools to manage utilization and costs, such as requiring enrollees to receive prior authorization before a service will be covered and requiring enrollees to obtain a referral for specialists or mental health providers. In 2024, virtually all Medicare Advantage enrollees were in plans that required prior authorization for some services, most often higher-cost services. Medicare Advantage insurers made nearly 50 million prior authorization determinations in 2023 (Figure 7). Prior authorization and referrals to specialists are used less frequently in traditional Medicare, with prior authorization generally applying to a limited set of services.

Medicare Advantage Insurers Made Nearly 50 Million Prior Authorization Determinations in 2023

Medicare Advantage plans are required to use payments from the federal government that exceed their costs of covering Part A and B services (known as rebates) to provide supplemental benefits to enrollees, such as lower cost sharing, extra benefits not covered by traditional Medicare, or reducing the amount of Part B and/or Part D premiums. Examples of extra benefits include eyeglasses, hearing exams, preventive dental care, and gym memberships (Figure 8). (See “How Does Medicare Pay Private Plans in Medicare Advantage and Medicare Part D?” for a discussion of how Medicare pays Medicare Advantage plans.) Medicare Advantage plans must also include a cap on out-of-pocket spending, which provides protection from catastrophic medical expenses. Traditional Medicare does not have an out-of-pocket limit, though purchasing a Medigap policy effectively provides protection from catastrophic costs for beneficiaries in traditional Medicare. (See “What Does Medicare Cover and How Much Do People Pay for Medicare Benefits?” for a brief discussion of Medigap.)

Most Medicare Advantage Enrollees in Plans Available for General Enrollment Have Access to Some Benefits Not Covered by Traditional Medicare in 2025

What Is the Medicare Part D Prescription Drug Benefit?

Copy link to What Is the Medicare Part D Prescription Drug Benefit?

Medicare Part D, Medicare’s voluntary outpatient prescription drug benefit, was established by the Medicare Modernization Act of 2003 (MMA) and launched in 2006. Before the addition of the Part D benefit, Medicare did not cover the cost of outpatient prescription drugs. Under Part D, Medicare helps cover prescription drug costs through private plans that contract with Medicare to offer the Part D benefit to enrollees, which is unlike coverage of Part A and Part B benefits under traditional Medicare, and beneficiaries must enroll in a Part D plan if they want this benefit.

A total of 54.8 million people with Medicare are currently enrolled in plans that provide the Medicare Part D drug benefit, including plans open to everyone with Medicare (stand-alone prescription drug plans, or PDPs, and Medicare Advantage drug plans, or MA-PDs) and plans for specific populations (including retirees of a former employer or union and Medicare Advantage Special Needs Plans, or SNPs). Nearly 6 in 10 Part D enrollees are in MA-PDs, as overall enrollment in Medicare Advantage plans has grown in recent years. Just over 13 million low-income beneficiaries receive extra help with their Part D plan premiums and cost sharing through the Part D Low-Income Subsidy Program (LIS).

For 2025, the average Medicare beneficiary has a choice of 14 stand-alone Part D plans and 34 Medicare Advantage drug plans. These plans vary in terms of premiums, deductibles and cost sharing, the drugs that are covered, any utilization management restrictions that apply, and pharmacy networks. People in traditional Medicare who are enrolled in a separate stand-alone Part D plan generally pay a monthly Part D premium unless they qualify for full benefits through the Part D LIS program and are enrolled in a premium-free (benchmark) plan. In 2025, the average enrollment-weighted premium for stand-alone Part D plans is $39 per month. In 2025, most stand-alone Part D plans include a deductible, averaging $491. Plans generally impose a tiered structure to define cost-sharing requirements and cost-sharing amounts charged for covered drugs, typically charging lower cost-sharing amounts for generic drugs and preferred brands and higher amounts for non-preferred and specialty drugs, and a mix of flat dollar copayments and coinsurance (based on a percentage of a drug’s list price) for covered drugs.

The standard design of the Medicare Part D benefit currently has three distinct phases, where the share of drug costs paid by Part D enrollees, Part D plans, drug manufacturers, and Medicare varies. Based on changes in the Inflation Reduction Act, these shares changed in 2024 and 2025 (Figure 9). Most notably, the Part D benefit now includes a $2,000 out-of-pocket spending cap, meaning Part D enrollees face no additional costs once their out-of-pocket costs exceed $2,000 in 2025. Previously, enrollees with high drug costs who did not receive low-income subsidies were responsible for paying 5% of their total drug costs when they reached the catastrophic coverage phase. This new out-of-pocket spending cap is projected to help an estimated 11 million Part D enrollees in 2025, including 6.1 million enrollees not receiving low-income subsidies.

The Share of Medicare Part D Drug Costs Paid by Enrollees, Plans, Drug Manufacturers, and Medicare Changed in 2024 and 2025

The Inflation Reduction Act of 2022, signed into law by President Biden on August 16, 2022, includes several provisions to lower prescription drug costs for people with Medicare and reduce drug spending by the federal government, including several changes related to the Part D benefit. These provisions include (but are not limited to) (Figure 10):

  • Requiring the Secretary of the Department of Health and Human Services to negotiate the price of some Part D and Part B drugs covered under Medicare. The law that established the Part D benefit included a provision known as the “noninterference” clause, which prevented the HHS Secretary from being involved in price negotiations between drug manufacturers and pharmacies and Part D plan sponsors. In addition, the Secretary of HHS does not currently negotiate prices for drugs covered under Medicare Part B (administered by physicians). To date, Medicare has completed one round of price negotiation on 10 Part D drugs, with negotiated prices available in 2026, and selected 15 more Part D drugs for price negotiation in the second round, with negotiated prices available in 2027.
  • Adding a hard cap on out-of-pocket drug spending under Part D, which phased in beginning in 2024, and was limited to $2,000 in 2025 (increasing to $2,100 in 2026). As noted above, under the original design of the Part D benefit, enrollees had catastrophic coverage for high out-of-pocket drug costs, but there was no limit on the total amount that beneficiaries paid out of pocket each year.  
  • Limiting the out-of-pocket cost of insulin products to no more than $35 per month in all Part D plans and in Part B and making adult vaccines covered under Part D available for free as of 2023. Until these provisions took effect, beneficiary costs for insulin and adult vaccines were subject to varying cost-sharing amounts.
  • Expanding eligibility for full benefits under the Part D Low-Income Subsidy program in 2024, eliminating the partial LIS benefit for individuals with incomes between 135% and 150% of poverty. Beneficiaries who receive full LIS benefits pay no Part D premium or deductible and only modest copayments for prescription drugs until they reach the catastrophic threshold, at which point they face no additional cost sharing.
  • Requiring drug manufacturers to pay a rebate to the federal government if prices for drugs covered under Part D and Part B increase faster than the inflation rate, with the initial period for measuring Part D drug price increases running from October 2022-September 2023. Previously, Medicare had no authority to limit annual price increases for drugs covered under Part B or Part D. Year-to-year drug price increases exceeding inflation are not uncommon and affect people with both Medicare and private insurance.
Implementation Timeline of the Prescription Drug Provisions in the Inflation Reduction Act

How Does Medicare Pay Hospitals, Physicians, and Other Providers in Traditional Medicare?

Copy link to How Does Medicare Pay Hospitals, Physicians, and Other Providers in Traditional Medicare?

In 2024, Medicare was estimated to spend $464 billion on benefits covered under Part A and Part B for beneficiaries in traditional Medicare. Medicare pays providers in traditional Medicare using various payment systems depending on the setting of care (Figure 11).

Spending on Part A and Part B Benefits in Traditional Medicare is Estimated to be $464 Billion in 2024

Medicare relies on a number of different approaches when determining payments to providers for Part A and Part B services delivered to beneficiaries in traditional Medicare. These providers include hospitals (for both inpatient and outpatient services), physicians, skilled nursing facilities, home health agencies, and several other types of providers. Of the $464 billion in estimated spending on Medicare benefits covered under Part A and Part B in traditional Medicare in 2024, $149 billion (32%) was for hospital inpatient services and $68 billion (15%) was for hospital outpatient services, $71 billion (15%) was for services covered under the physician fee schedule, and $176 billion (38%) was for all other Part A or Part B services for beneficiaries in traditional Medicare.

Medicare uses prospective payment systems for most providers in traditional Medicare. These systems generally require that Medicare pre-determine a base payment rate for a given unit of service (e.g., a hospital stay, an episode of care, a particular service). Then, based on certain variables, such as the provider’s geographic location and the complexity of the patient receiving the service, Medicare adjusts its payment for each unit of service provided. Medicare updates payment rates annually for most payment systems to account for inflation adjustments. 

The main features of hospital, physician, outpatient, and skilled nursing facility payment systems (altogether accounting for 69% of spending on Part A and Part B benefits in traditional Medicare) are described below:

  • Inpatient hospitals (acute care): Medicare pays hospitals per beneficiary discharge using the Inpatient Prospective Payment System. The rate for each discharge corresponds to one of over 770 different categories of diagnoses – called Medicare Severity Diagnosis Related Groups (MS-DRGs), which reflect the principal diagnosis, secondary diagnoses, procedures performed, and other patient characteristics. DRGs that are likely to incur more intense levels of care and/or longer lengths of stay are assigned higher payments. Medicare’s payments to hospitals also account for a portion of hospitals’ capital and operating expenses.
  • Medicare also makes additional payments to hospitals in particular situations. These include additional payments for rural or isolated hospitals that meet certain criteria. Further, Medicare makes additional payments to help offset costs incurred by hospitals that are not otherwise accounted for in the inpatient prospective payment system. These include add-on payments for treating a disproportionate share (DSH) of low-income patients, as well as for covering costs associated with care provided by medical residents, known as indirect medical education (IME). While not part of the Inpatient Prospective Payment System, Medicare also pays hospitals directly for the costs of operating residency programs, known as Graduate Medical Education (GME) payments.
  • Physicians and other health professionals: Medicare reimburses physicians and other health professionals (e.g., nurse practitioners) based on the Physician Fee Schedule for over 10,000 services. Payment rates for these services are based on three components: (1) clinician work, (2) practice expenses, and (3) professional liability insurance (also known as medical malpractice insurance), which are measured in terms of “relative value units” (RVUs). Each component is adjusted to account for differences across geography and then multiplied by a conversion factor. Payment rates for individual services may be updated each year based in part on the recommendations of the AMA/Specialty Society RVS Update Committee (RUC), a volunteer committee of physicians and other professionals overseen by the American Medical Association (AMA). CMS also makes annual updates to the conversion factor based on statutory factors, as well as adjustments to preserve budget neutrality, which may result in payment cuts for physicians and other clinicians whenever the projected cost of all Physician Fee Schedule spending is expected to increase by more than $20 million for the year.
  • Payment rates specified under the Physician Fee Schedule are subject to further adjustments under the Quality Payment Program, established by the Medicare Access and CHIP Reauthorization Act of 2015 (MACRA). Clinicians can receive payment increases if they participate in qualified advanced alternative payment models (A-APMs), which bear some financial risk for the costs of patient care, while those who participate in the Merit-based Incentive Payment System (MIPS) may receive payment increases or decreases (or no change) depending on their performance on specific quality measures. (See “What Is Medicare Doing to Promote Alternative Payment Models?” for more information about alternative payment models in Medicare.)
  • While not part of the Physician Fee Schedule, Medicare also pays for a limited number of drugs that physicians and other health care providers administer. For drugs administered by physicians, which are covered under Part B, Medicare reimburses providers based on a formula set at 106% of the Average Sales Price (ASP), which is the average price to all non-federal purchasers in the U.S, inclusive of rebates (other than rebates paid under the Medicaid program).
  • Hospital outpatient departments: Medicare pays hospitals for ambulatory services provided in outpatient departments, using the Hospital Outpatient Prospective Payment System, based on the classification of individual services into Ambulatory Payment Classifications (APC) with similar characteristics and expected costs. Final determination of Medicare payments for outpatient department services is complex. It incorporates both individual service payments and payments “packaged” with other services, partial hospitalization payments, as well as numerous exceptions, such as payments for new technologies. Medicare payment rates for services provided in hospital outpatient departments are typically higher than for similar services provided in physicians’ offices, and evidence indicates that providers have shifted the billing of services to higher-cost settings. There is bipartisan interest in proposals to expand so-called “site-neutral” payments, meaning that Medicare would align payment rates for the same service across settings.
  • Skilled Nursing Facilities (SNFs): SNFs are freestanding or hospital-based facilities that provide post-acute inpatient nursing or rehabilitation services. Medicare pays SNFs based on the Skilled Nursing Facility Prospective Payment System, and payments to SNFs are determined using a base payment rate, adjusted for geographic differences in labor costs, case mix, and, in some cases, length of stay. Daily rates consider six care components – nursing, physical therapy, occupational therapy, speech–language pathology services, nontherapy ancillary services and supplies, and non–case mix (room and board services).

How Does Medicare Pay Private Plans in Medicare Advantage and Medicare Part D?

Copy link to How Does Medicare Pay Private Plans in Medicare Advantage and Medicare Part D?

Medicare Advantage. Medicare pays firms offering Medicare Advantage plans a set monthly amount per enrollee. The payment is determined through an annual process in which plans submit “bids” for how much they estimate it will cost to provide benefits covered under Medicare Parts A and B for an average beneficiary. The bid is compared to a county “benchmark”, which is the maximum amount the federal government will pay for a Medicare Advantage enrollee and is a percentage of estimated spending in traditional Medicare in the same county, ranging from 95 percent in high-cost counties to 115 percent in low-cost counties. When the bid is below the benchmark in a given county, plans receive a portion of the difference (the “rebate”), which they must use to lower cost sharing, pay for extra benefits, or reduce enrollees’ Part B or Part D premiums. Payments to plans are risk adjusted, based on the health status and other characteristics of enrollees, including age, sex, and Medicaid enrollment. In addition, Medicare adopted a quality bonus program that increases the benchmark for plans that receive at least four out of five stars under the quality rating system, which increases plan payments.

Generally, Medicare pays more to private Medicare Advantage plans for enrollees than their costs would be in traditional Medicare. The Medicare Payment Advisory Commission (MedPAC) reports that while it costs Medicare Advantage plans 83% of what it costs traditional Medicare to pay for Medicare-covered services, plans receive payments from CMS that are 120% of spending for similar beneficiaries in traditional Medicare, on average. The higher spending stems from features of the formula used to determine payments to Medicare Advantage plans, including setting benchmarks above traditional Medicare spending in half of counties and higher benchmarks due to the quality bonus program, resulting in bonus payments of at least $12.7 billion in 2025. This amount is four times greater than spending on bonus payments in 2015 (Figure 12).

Total Spending on Medicare Advantage Plan Bonuses Quadrupled Between 2015 and 2025 From At Least $3 Billion to $12.7 Billion

The higher spending in Medicare Advantage is also related to the impact of coding intensity, where Medicare Advantage enrollees look sicker than they would if they were in traditional Medicare, resulting in plans receiving higher risk adjustments to their monthly per person payments, translating to an estimated $84 billion in excess payments to plans in 2025.

Higher payments to Medicare Advantage plans allow them to offer extra benefits attractive to enrollees. However, these benefits come at a cost to all beneficiaries through higher Part B premiums – amounting to $13 billion in 2025 alone – and contribute to the strain on the Medicare Part A Hospital Insurance Trust Fund. (See “How Much Does Medicare Spend and How Is the Program Financed?” for additional information .)

Medicare Part D. Medicare pays Part D plans, both stand-alone prescription drug plans and Medicare Advantage plans that offer drug coverage, based on an annual competitive bidding process. Plans submit bids yearly to Medicare for their expected costs of providing the drug benefit plus administrative expenses. Plans receive a direct subsidy per enrollee, which is risk-adjusted based on the health status of their enrollees, plus reinsurance payments from Medicare for the highest-cost enrollees and adjustments for the low-income subsidy (LIS) status of their enrollees. (Unlike Medicare Advantage, there is no quality bonus program that provides higher payments to Part D plans with higher Part D quality ratings.) Risk-sharing arrangements with the federal government (“risk corridors”) limit plans’ potential total losses or gains.

Under reinsurance, Medicare subsidizes 20% of total drug spending incurred by Part D enrollees with relatively high drug spending above the catastrophic coverage threshold, as of 2025, down from 80% in prior years, based on a provision of the Inflation Reduction Act. This provision was designed to shift more of the responsibility for catastrophic drug costs to Part D plans and drug manufacturers. Plans now pay 60% of total drug costs above the catastrophic threshold, up from 15% to 20% in prior years. (See “What Is the Medicare Part D Prescription Drug Benefit?” for more detail on plan liability under various phases of the Part D benefit and more information on changes to Part D included in the Inflation Reduction Act.) In the aggregate, Medicare’s reinsurance payments to Part D plans in 2025 are estimated to account for 18% of total Part D spending, down from close to half of total Part D spending (46%) in 2024 (Figure 13).

Spending for Catastrophic Coverage (“Reinsurance”) Accounted for Close to Half (46%) of Total Medicare Part D Spending in 2024, But Is Estimated to Decrease to 18% in 2025 as Inflation Reduction Act Changes to the Part D Benefit Take Effect

For 2025, Medicare’s actuaries estimate that Part D plans will receive direct subsidy payments averaging $1,855 per enrollee overall, $1,313 for enrollees receiving the LIS, and $517 in reinsurance payments for very high-cost enrollees.

What Is Medicare Doing to Promote Alternative Payment Models?

Copy link to What Is Medicare Doing to Promote Alternative Payment Models?

While Medicare has traditionally paid providers on a fee-for-service basis, the program is implementing various alternative payment models designed to tie payments under traditional Medicare to provider performance on quality and spending. Although the overarching goals of these various models are similar—improving the quality and affordability of patient care, increasing coordination between care teams, and reducing health care costs—the specific aims vary by model.

A notable example of an alternative payment model within Medicare is the Medicare Shared Savings Program (MSSP), a permanent accountable care organization (ACO) program in traditional Medicare established by the Affordable Care Act (ACA) that offers financial incentives to providers for meeting or exceeding savings targets and quality goals. ACOs are groups of doctors, hospitals, and other health care providers who voluntarily form partnerships to collaborate and share accountability for the quality and cost of care delivered to their patients. The MSSP currently offers different participation options to ACOs, allowing these organizations to share in savings only or both savings and losses, depending on their level of experience and other factors.

ACOs have a defined patient population for the purpose of calculating annual savings or losses. Beneficiaries in traditional Medicare may choose to align themselves to an ACO (voluntary alignment) or may be assigned to a particular ACO based on where they received a plurality of their primary care services. In either case, beneficiaries are free to seek treatment from any provider who accepts Medicare and are not limited to ACO-affiliated providers. This contrasts with enrollment in Medicare Advantage, where beneficiaries are generally limited to seeing providers in their plan’s network or face higher out-of-pocket costs for seeing out-of-network providers.

In 2023, the Medicare Shared Savings Program saved Medicare an estimated $2.1 billion relative to annual spending targets. As of 2025, there are 476 MSSP ACOs nationwide, with over 643,000 participating clinicians and 10.8 million beneficiaries aligned to MSSP ACOs (Figure 14).

Medicare Shared Savings Program ACOs Are Operating in Every State and the District of Columbia

The ACA also established the Center for Medicare and Medicaid Innovation (CMMI, also known as the Innovation Center), an operating center within the Centers for Medicare & Medicaid Services tasked with designing and testing alternative payment models to address concerns about rising health care costs, quality of care, and inefficient spending within the Medicare, Medicaid, and CHIP programs. Since its start in 2010, CMMI has launched more than 80 models across six different categories, including accountable care models, disease-specific models, health plan models, and others (Figure 15). CMMI models are designed to be tested over a limited number of years, but Congress gave CMMI the authority to expand models nationwide permanently if they meet certain quality and savings criteria. As of the most recent estimate, six models have shown statistically significant savings, and four have met the requirements for permanent expansion into the wider Medicare program, including the Medicare Diabetes Prevention Program and the Home Health Value-Based Purchasing Model.

While the overall aims of CMMI are set in law, changes of administration have brought about changes in the strategic direction of the Innovation Center and the types of models that have been pursued, along with the reframing or termination of certain models from the previous administration. For example, the Biden administration placed a greater emphasis on health equity in CMMI models, while the second Trump administration is prioritizing evidence-based preventive care, empowering consumers with data and information to make health decisions, and promoting choice and competition in health care markets.

The Center for Medicare and Medicaid Innovation (CMMI) has Implemented Numerous Programs and Pilot Projects to Test New Payment Models

According to the Congressional Budget Office (CBO), the activities of CMMI increased federal spending by $5.4 billion from 2011 to 2020, which CBO attributes in part to the mixed success of many models at generating sufficient savings to offset their high upfront costs. (CBO had initially projected that CMMI would reduce federal spending by $2.8 billion in its first decade of operation.) However, evidence suggests that savings vary by model type, with the greatest savings found among state and community-based models. Further, a review of select CMMI models provides evidence of improvements in care coordination, team-based care, and other care delivery changes, even in the absence of savings. CBO projects that CMMI’s activities will come closer to the breakeven point regarding federal spending over the course of the current decade (2024-2033).

How Much Does Medicare Spend and How Is the Program Financed?

Copy link to How Much Does Medicare Spend and How Is the Program Financed?

Spending. Medicare plays a significant role in the health care system, accounting for 21% of total national health spending in 2023, a quarter of spending on both hospital care and physician and clinical services, and 32% of spending on retail prescription drug sales (Figure 16).

In 20222023, Medicare Accounted for 21% of Total National Health Spending

In 2024, Medicare spending, net of income from premiums and other offsetting receipts, totaled $910 billion and accounted for 13% of the federal budget — a similar share as spending on Medicaid, the ACA, and the Children’s Health Insurance Program combined, and defense spending (Figure 17).

In 2024, Medicare Spending Accounted for 13% of the Federal Budget

In 2025, Medicare benefit payments are estimated to total $1.1 trillion, up from $632 billion in 2015 (including spending for Part A, Part B, and Part D benefits in both traditional Medicare and Medicare Advantage). Medicare spending per person has also grown, increasing from $5,800 to $16,700 between 2000 and 2023 – or 4.7% average annual growth over the 23-year period. In recent years, however, growth in spending per person has been lower in Medicare than in private health insurance .

Spending on Medicare Part A benefits (mainly hospital inpatient services) has decreased as a share of total Medicare spending over time as care has shifted from inpatient to outpatient settings, leading to an increase in spending on Part B benefits (including physician services, outpatient services, and physician-administered drugs). Spending on Part B services now accounts for the largest share of Medicare benefit spending (50% in 2024) (Figure 18). Moving forward, Medicare spending on physician services and other services covered under Part B is expected to grow to more than half of total Medicare spending by 2034, while spending on hospital care and other services covered under Part A is projected to decrease further as a share of the total.

Spending on Physician Services and Other Medicare Part B Services Now Accounts for the Largest Share of Total Medicare Benefits Spending

Payments to Medicare Advantage plans for Part A and Part B benefits tripled as a share of total Medicare spending between 2014 and 2024, from $156 billion to $462 billion, partly due to steady enrollment growth in Medicare Advantage plans. Growth in spending on Medicare Advantage also reflects that Medicare pays more to private Medicare Advantage plans for enrollees than their costs in traditional Medicare, on average. (See “How Does Medicare Pay Private Plans in Medicare Advantage and Medicare Part D?” for additional information.) These higher payments have contributed to growth in spending on Medicare Advantage and overall Medicare spending. In 2024, half of all Medicare program spending for Part A and Part B benefits was for Medicare Advantage plans, up from just under 30% in 2014. Between 2024 and 2034, Medicare Advantage payments are projected to total close to $9 trillion, $2.5 trillion more than spending under traditional Medicare (Figure 19).

Medicare Advantage Payments are Projected to Total Close to $9 Trillion Between 2024 and 2034, $2.5 Trillion More than Spending Under Traditional Medicare

Financing. Medicare funding, which totaled $1.1 trillion in 2024, comes primarily from governmnet contributions (44%), payroll tax revenues (35%), and premiums paid by beneficiaries (15%). Other sources include taxes on Social Security benefits, payments from states, and interest.

The different parts of Medicare are funded in varying ways, and revenue sources dedicated to one part of the program cannot be used to pay for another part (Figure 20).

Medicare Revenues Come from Different Sources, Primarily Government Contributions, Payroll Taxes, and Premiums Paid by Beneficiaries
  • Part A, which covers inpatient hospital stays, skilled nursing facility (SNF) stays, some home health visits, and hospice care, is financed primarily through a 2.9% tax on earnings paid by employers and employees (1.45% each). Higher-income taxpayers (more than $200,000 per individual and $250,000 per couple) pay a higher payroll tax on earnings (2.35%). Payroll taxes accounted for 88% of Part A revenue in 2024.
  • Part B, which covers physician visits, outpatient services, preventive services, and some home health visits, is financed primarily through a combination of government contributions (72% in 2024) and beneficiary premiums (26%) (and 2% from interest and other sources). The standard Part B premium that most Medicare beneficiaries pay is calculated as 25% of annual Part B spending, while beneficiaries with annual incomes over $106,000 per individual or $212,000 per couple pay a higher, income-related Part B premium reflecting a larger share of total Part B spending, ranging from 35% to 85%.
  • Part D, which covers outpatient prescription drugs, is financed primarily by government contributions (75%) and beneficiary premiums (13%), with an additional 12% of revenues coming from state payments for beneficiaries enrolled in both Medicare and Medicaid. Higher-income enrollees pay a larger share of the cost of Part D coverage, as they do for Part B.
  • The Medicare Advantage program (sometimes referred to as Part C) does not have its own separate revenue sources. Funds for Part A benefits provided by Medicare Advantage plans are drawn from the Medicare HI trust fund. Funds for Part B and Part D benefits are drawn from the Supplementary Medical Insurance (SMI) trust fund. Beneficiaries enrolled in Medicare Advantage plans pay the Part B premium and may pay an additional premium if required by their plan. In 2025, 76% of Medicare Advantage enrollees pay no additional premium.

Measuring the level of reserves in the Medicare Hospital Insurance trust fund, out of which Part A benefits are paid, is a common way of measuring Medicare’s financial status. Each year, Medicare’s actuaries provide an estimate of the year when the reserves are projected to be fully depleted. In 2025, the Medicare Trustees projected sufficient funds would be available to pay for Part A benefits in full until 2033, 8 years from now – three years earlier than the 2024 projection. At that point, in the absence of Congressional action, Medicare will be able to pay 89% of costs covered under Part A using payroll tax revenues. At the same time, the Congressional Budget Office has recently updated its projection of the Part A trust fund, extending the year of trust fund depletion to 2052, based on changes in its projections of Part A spending and revenues and a change in CBO’s modeling related to graduate medical education payments. OACT projects both lower income and higher spending under Part A than CBO, as well as faster Part A spending growth, which helps to account for the difference in the projected HI trust fund depletion dates.

Since 2010, the projected year of trust fund reserve depletion, based on projections by Medicare’s actuaries, has ranged from 5 years out (in 2021) to 19 years out (in 2010) (Figure 21).

The Medicare Hospital Insurance Trust Fund Reserves Are Projected to Be Depleted in 2033, Based on a Projection by Medicare's Actuaries

The level of reserves in the Part A Trust Fund is affected by growth in the economy, which affects revenue from payroll tax contributions, health care spending and utilization trends, and demographic trends: an increasing number of beneficiaries as the population ages, especially between 2010 and 2030 when the baby boom generation reaches Medicare eligibility age, and a declining ratio of workers per beneficiary making payroll tax contributions. 

Part B and Part D do not have financing challenges similar to Part A, because both are funded by beneficiary premiums and government contributions that are set annually to match expected outlays. However, future increases in spending under Part B and Part D will require increases in government (and taxpayer) funding and higher premiums paid by beneficiaries.

Future Outlook

Copy link to Future Outlook

Looking to the future, Medicare faces a number of challenges from the perspective of beneficiaries, health care providers and private plans, and the federal budget. These include:

  • How best to address the fiscal challenges arising from an aging population and increasing health care costs through spending reductions and/or revenue increases.
  • Whether and how to improve coverage for Medicare beneficiaries, including an out-of-pocket limit in traditional Medicare, enhanced financial support for lower-income beneficiaries, and additional benefits, such as dental and vision.
  • How to control spending while ensuring fair and adequate payments to hospitals, physicians and other providers, and Medicare Advantage plans, including whether and how to reduce overpayments to Medicare Advantage plans.
  • How to address the implications for traditional Medicare of the predominant role that Medicare Advantage now plays in covering Medicare beneficiaries.

Any potential changes to Medicare to address these challenges could have implications for federal spending and taxpayers, the solvency of the Medicare Hospital Insurance trust fund, total health care spending, the affordability of health care for Medicare’s growing number of beneficiaries, many of whom have limited incomes, and access to high-quality medical care.

Resources

Copy link to Resources

Citation

Copy link to Citation

Cubanski, J., Freed, M., Ochieng, N., Cottrill, A., Fuglesten Biniek, J., & Neuman, T., Medicare 101. In Altman, Drew (Editor), Health Policy 101, (KFF, October 2025) https://www.kff.org/health-policy-101-medicare/ (date accessed).

The U.S. Government and Global Health

Table of Contents

Introduction

Copy link to Introduction

While there is currently no standard, agreed-upon definition of global health, the National Academy of Medicine (formerly Institute of Medicine) defines global health as having “the goal of improving health for all people in all nations by promoting wellness and eliminating avoidable diseases, disabilities, and deaths.” A key dimension of global health is an emphasis on addressing inequities in health status between rich and poor countries and also for those who are most marginalized within countries, as well as a recognition that the health of people around the world is highly interconnected, with domestic and foreign health inextricably linked. 

The U.S. government has long been the largest donor to and implementer of global health programs in the world. These efforts have aimed to help improve the health of people in low- and middle-income countries while also contributing to broader U.S. global development goals, foreign policy priorities, and national security concerns, including helping safeguard the health of Americans. These efforts began decades ago and saw major expansion in the early part of the current century with the creation of the President’s Emergency Plan for AIDS Relief (PEPFAR) and other programs. Since the beginning of the second Trump administration, however, the U.S. global health response has undergone significant change, disruption, and retraction, and the global health landscape has been altered in fundamental ways. This has included, as part of a major review of U.S. foreign aid, the dissolution of the U.S. Agency for International Development (USAID), the main implementing agency for U.S. global health programs, the elimination of numerous programs and projects, and the transition of remaining programs to the State Department.  As part of its review, the administration is seeking to assess whether U.S. foreign aid programs are aligned with U.S. national interests.

What Is the U.S. Role in Global Health?

Copy link to What Is the U.S. Role in Global Health?

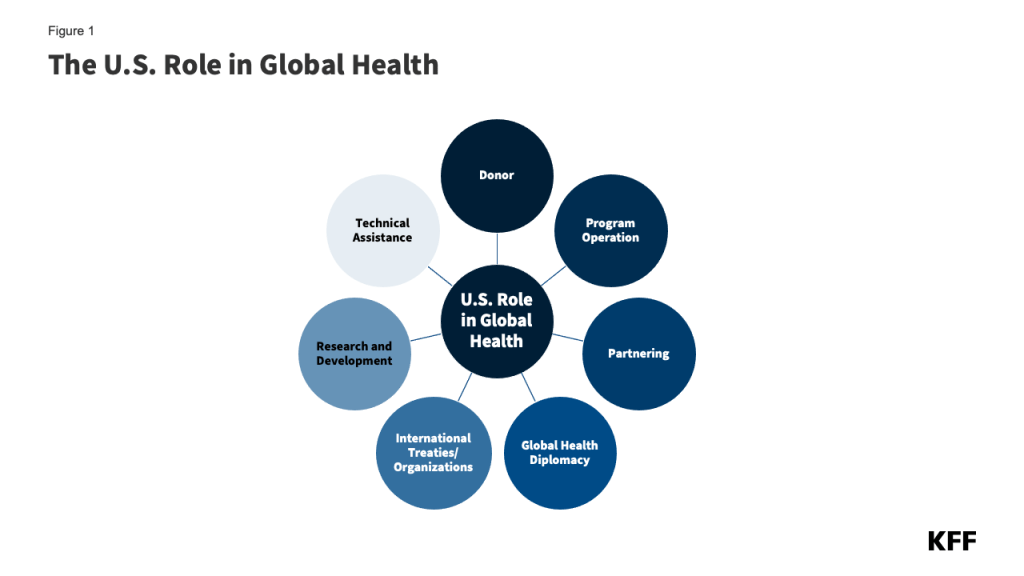
Historically, the U.S. role in global health is multifaceted and includes a broad range of activities. Its primary roles are as a supporter of bilateral (i.e., country-to-country) efforts, directly funding implementation of global health efforts in partner countries, and as a donor to multilateral health institutions (i.e., international organizations that pool support from multiple countries for one or more areas of global health). The U.S. also engages in global health diplomacy through its relationships with other governments, multilateral institutions, non-governmental organizations, and the private sector. Specifically, the U.S. government:

  • acts as a donor by providing financial and other health-related development assistance (e.g., commodities, like contraceptives or bed nets for protection from disease-carrying mosquitoes) to low- and middle-income countries;
  • operates programs and delivers health services;
  • provides technical assistance and other capacity-building support;
  • participates in major international health organizations and coordinates health efforts with other stakeholders through global health diplomacy;
  • conducts research;
  • supports international responses to disasters and other emergencies; and
  • partners with governments, non-governmental groups, and the private sector (Figure 1).

U.S. global health activities have targeted a variety of issues and used different intervention approaches such as:

  • Health services and systems strengthening: improving basic and essential health services, systems, and infrastructure;
  • Disease detection and response: supporting surveillance, prevention, and treatment of diseases, including both infectious (e.g., HIV, TB, malaria) and non-communicable diseases (e.g., cardiovascular disease, cancer);
  • Population and maternal/child health: promoting maternal health; reproductive health and family planning; child nutrition, immunization, and other child survival interventions;
  • Nutrition, water, and environmental health: providing non-emergency food aid and supporting dietary supplementation and food security; clean/safe water and sanitation; mitigation of environmental hazards; and
  • Research and development: investigating and developing new technologies, interventions, and strategies, including vaccines, medicines, and diagnostics.

What Are the Major Global Health Program Areas the U.S. Supports?

Copy link to What Are the Major Global Health Program Areas the U.S. Supports?

While the U.S. government’s involvement in global health currently faces an uncertain future – with a more limited scope, the dissolution of USAID, and cancelation of numerous U.S.-supported global health projects, as the Trump administration seeks to reorganize foreign aid more broadly –  the U.S. has historically supported global health through a wide array of bilateral and multilateral global health programs in countries around the world including:

HIV/PEPFAR

While the U.S. first provided funding to address the emerging global HIV epidemic in 1986, U.S. funding and attention for these efforts has grown significantly in the last two decades, particularly following President George W. Bush’s 2003 announcement of the President’s Emergency Plan for AIDS Relief (PEPFAR), the coordinated U.S. government response to global HIV. Now the largest commitment by any nation devoted to a single disease, the launch of PEPFAR led to substantially increased U.S. support for HIV prevention, treatment, and care efforts, as well as U.S. contributions to multilateral entities, including the Global Fund to Fight AIDS, Tuberculosis and Malaria (Global Fund), the Joint United Nations Programme on HIV/AIDS (UNAIDS), and the International AIDS Vaccine Initiative (IAVI).  PEPFAR, which is housed in the Department of State, has been credited with saving 26 million lives and contributing to broader health, educational, and economic gains.  Currently, PEPFAR faces significant change. While U.S. policymakers had been increasingly looking at when and how to transition PEPFAR services and financing to country governments, the current Trump administration has sought to narrow PEPFAR’s scope and significantly accelerate this timeline. See the “Status of PEPFAR” fact sheet for more information.

Tuberculosis (TB)

Since the 1998 launch of USAID’s global TB control program, the U.S. response to global TB has expanded, particularly after 2003 when PEPFAR highlighted the U.S. government’s commitment to addressing TB. Prior to the current Trump administration, these efforts focused on diagnosis, treatment, and control of TB (including multi-drug-resistant and extensively drug-resistant TB, or MDR/XDR TB) as well as on research. The U.S. was also a donor to the Global Drug Facility of the Stop TB Partnership.  With the dissolution of USAID, remaining TB programming has been moved to the State Department and its scope has been reduced. See the “Status of U.S. Global Tuberculosis Efforts” fact sheet for more information.

Malaria/PMI

Engaged in malaria work since the 1950s, the U.S. supported expanded malaria efforts in low- and middle-income countries through the President’s Malaria Initiative (PMI), launched in 2005 and housed at and managed by USAID, as well as through research and other activities. PMI programs centered on expanding coverage of six key high-impact interventions to control or eliminate malaria, which included: diagnosis of malaria and treatment with artemisinin-based combination therapies (ACTs), entomological monitoring, intermittent preventive treatment in pregnancy (IPTp), indoor residual spraying (IRS) with insecticides, insecticide-treated mosquito nets (ITNs), and seasonal malaria chemoprevention (SMC). The U.S. has also supported the RBM Partnership to End Malaria.  Under the current administration, remaining PMI programming has been moved into the State Department. See the “Status of the President’s Malaria Initiative (PMI)” fact sheet for more information.

Maternal and Child Health (MCH)

Involved in efforts to improve MCH since the 1960s,  U.S. global MCH activities, which had been housed at and managed by USAID, aimed to bring to scale a range of high-impact interventions that mitigate maternal, newborn, and under-five deaths; prevent and address the indirect causes of such deaths (such as HIV, TB, and malaria); strengthen integration of maternal health services with family planning; improve equity of access to and use of services by vulnerable populations; and strengthen health systems. The U.S. has also been a donor to global organizations and initiatives addressing MCH, such as Gavi, the Vaccine Alliance, the United Nations Children’s Fund (UNICEF), and the Global Polio Eradication Initiative (GPEI).Under the current administration, remaining MCH programming has been moved into the State Department. See the “Status of U.S. Global Maternal and Child Health Efforts” fact sheet for more information.

Nutrition

For more than 40 years, the U.S. had been involved in nutrition efforts in low- and middle-income countries that aimed to prevent undernutrition through support for effective interventions, such as nutrition education, nutrition during pregnancy, exclusive breastfeeding, and micronutrient supplementation. Housed at and managed by USAID, U.S. global nutrition efforts were coordinated with the U.S. Feed the Future Initiative (FtF, launched in 2009), which aimed to address global hunger and food security. Currently, remaining nutrition programming has been moved to the State Department. See the “Status of U.S. Global Maternal and Child Health Efforts” fact sheet for more information.

Family Planning and Reproductive Health (FP/RH)

Engaged since the 1960s in international research on family planning and population issues as well as other FP/RH efforts (including the purchase and distribution of contraceptives in developing countries),  U.S. global FP/RH activities were designed to decrease the risk of unintended pregnancies and maternal and child mortality through effective interventions, including contraception, counseling, and post-abortion care. The U.S. also provided funding to global organizations addressing FP/RH, such as the United Nations Population Fund (UNFPA), though in some years, funding for UNFPA was withheld. The current administration has moved to end U.S. bilateral and multilateral support for family planning efforts. See the “Status of U.S. Family Planning and Reproductive Health Efforts” fact sheet for more information

Neglected Tropical Diseases (NTDs)

Having historically worked on addressing NTDs through research and surveillance, attention to and funding for U.S. global NTD efforts increased markedly in 2006 with the launch of the USAID NTD Program and the subsequent announcement of expanded efforts across the U.S. government in 2008. These efforts had focused on five NTDs (soil-transmitted helminths,  lymphatic filariasis or elephantiasis, onchocerciasis or river blindness, schistosomiasis or snail fever, and trachoma) that are responsible for the overwhelming majority of the NTD burden but can be controlled and even eliminated with low-cost and effective interventions, such as an integrated control approach targeting multiple NTDs simultaneously through mass drug administration (MDA). The future of NTD efforts is uncertain amid the current Trump administration’s foreign aid freeze and dissolution of USAID.

Global Health Security (GHS)

While the U.S. has supported global health security work for more than two decades, its involvement has expanded over time, with attention to these efforts growing significantly due to the COVID-19 pandemic. These efforts aimed to reduce the threat of emerging and re-emerging diseases by supporting preparedness, detection, and response capabilities worldwide. The U.S. had also played a key role in the development and 2014 launch of the “Global Health Security Agenda (GHSA).” Through this international partnership that now involves more than 70 countries and international organizations, the U.S. worked to help countries make measurable improvements in their GHS capabilities. The U.S. had also been a donor to the new Pandemic Fund, which seeks to provide sustained financing to help countries build their capacity to prevent, prepare for, and respond to epidemics and pandemics.  While the first U.S. global health security strategy had been developed by the first Trump administration, the current Trump administration has withdrawn this strategy, eliminated several global health security positions and some offices, and withdrawn from U.S. engagement in key international efforts. See the “Status of Global Health Security/Pandemic Preparedness” fact sheet for more information.

How Much Funding Does the U.S. Provide for Global Health?

Copy link to How Much Funding Does the U.S. Provide for Global Health?

In FY 2025, U.S. funding appropriated by Congress for global health totaled $12.4 billion. While this funding has been appropriated to federal agencies, the current administration has withheld much of it from programming and sought to formally rescind (cancel) more than $1 billion in funding for global health, including some PEPFAR funding (Congress voted to amend the rescission package, reducing that amount to $500 million, and exempting PEPFAR and some other global health programs from cuts).  As such, funding amounts presented here for the current fiscal year may not reflect actual obligations or outlays of U.S. support. There is ongoing litigation federal court regarding these actions.

As Figure 2shows, U.S. appropriations for global health have grown significantly since the early 2000s, in large part due to funding for initiatives such as PEPFAR and PMI, but with spikes in some years due to emergency or supplemental funding for disease outbreaks such as Ebola, Zika, and COVID-19. Funding reached its highest level to date in FY 2021, largely due to the U.S. global response to the COVID-19 pandemic.

Although a large majority of the American public overestimates the share of the federal budget that is spent on foreign aid (with nearly half believing that the share is greater than 20%), U.S. foreign aid actually accounts for 1% or less of the federal budget, with U.S. funding for global health—which is part of the foreign affairs budget—accounting for an even smaller share.

U.S. Global Health Funding (in billions), FY 2006 - FY 2025

U.S. Global Health Funding by Program Area

Looking across funding for the major global health program areas since FY 2006, most U.S. global health funding over time has been directed to HIV programs, accounting for approximately 50% of U.S. global health funding in most years (Figure 3). The Global Fund accounted for the next largest share over the period, followed by MCH and malaria. More recently, the U.S. has emphasized global health security more, with funding for these efforts increasing considerably during the COVID-19 pandemic and afterward. Consistent with this trend, most funding was provided to HIV efforts ($5.4 billion or 44%), followed by the Global Fund ($1.7 billion or 13%) and maternal and child health and global health security (both $1.3 billion or 10%) in FY 2025 (Figure 4).

Distribution of U.S. Global Health Funding, by Program Area, FY 2006 - FY 2025
U.S. Global Health Funding (in millions), by Program Area , FY 2025

Bilateral vs. Multilateral Aid

Most U.S. global health funding is provided bilaterally – that is, funding provided by the U.S. directly to or on behalf of a recipient country or region. In FY 2025, about 80% of the U.S. global health budget was provided through bilateral programs. The remainder (about 20%) is provided multilaterally through U.S. contributions to international institutions and organizations (see “What Multilateral Health Organizations Are Supported by the U.S.?”).

Which U.S. Agencies Are Involved in Carrying Out Efforts in These Program Areas?

Copy link to Which U.S. Agencies Are Involved in Carrying Out Efforts in These Program Areas?

Historically, the U.S. government’s engagement in global health has been carried out and overseen by multiple executive branch departments and agencies and the legislative branch, including several congressional committees (Figure 5). The current administration has made significant changes to this infrastructure. See the “Proposed Reorganization of U.S. Global Health Programs” fact sheet for more information.

Executive Branch

In general, U.S. global health engagement has developed within two main structures of the Executive Branch of government: the foreign assistance structure, which is predominantly global development-oriented and has close links to foreign policy; and the public health structure, which has its roots in disease prevention, control, and surveillance efforts.

Most funding for and oversight of U.S. global health resides within the foreign assistance structure, including:

  • Department of State (State): Established in 1789, the Department of State is the Cabinet-level foreign affairs agency of the United States. It advances U.S. objectives and interests worldwide through its primary role in developing and implementing the President’s foreign policy. Prior to the current Trump administration, it also provided policy direction to USAID, the lead federal agency for development assistance. The Trump administration has dissolved USAID and moved remaining global health activities into the Department of State. The Department of State’s Bureau for Global Health Security and Diplomacy (GHSD) coordinates the Department’s work on global health security, including HIV, and houses PEPFAR.
  • U.S. Agency for International Development (USAID): Established in 1961, USAID was an independent U.S. federal government agency that received overall foreign policy guidance from the Secretary of State. Its role was to support long-term and broad-based economic growth in countries and advance U.S. foreign policy objectives by supporting activities through each of its programmatic functional bureaus (e.g., Bureau for Global Health) and regional bureaus. Most USAID global health programs had been coordinated through the Bureau for Global Health, including HIV and other infectious diseases, MCH, nutrition, FP/RH, NTDs, and global health security. USAID has now been dissolved by the current administration.  
  • Millennium Challenge Corporation (MCC): Established in 2004, MCC administers the Millennium Challenge Account (MCA), a U.S. government initiative providing development assistance to eligible countries to promote economic growth and reduce poverty in low- and middle-income countries. Although MCC supports several health-related programs, health is not the main focus or purpose of its work; its design is intended to link MCC contributions for development assistance (to reduce poverty through support for economic growth) to greater responsibility by low- and middle-income countries for successfully attaining certain governance and development benchmarks. The current Trump administration had sought to close down the agency but ultimately did not do so.

Agencies within the public health structure operate global health programs directly or in conjunction with foreign assistance agencies. They are represented most prominently by several agencies within the Department of Health and Human Services (HHS), including:

  • Office of Global Affairs (OGA): OGA’s primary function is global health diplomacy – particularly coordinating and maintaining engagement across HHS and the U.S. government with foreign governments and ministries of health, multilateral organizations, civil society groups, and the private sector – exchanging best practices and sharing technical knowledge to advance U.S. global health priorities and research.
  • Centers for Disease Control and Prevention (CDC): With a long history of working on international health issues, prior to the current Trump administration, CDC focused on disease control and prevention and health promotion through operations, development assistance, basic and field research, technical assistance, training/exchanges, and capacity building. The current administration has eliminated many of the staff working on these issues and sought to eliminate the CDC’s global health center.
  • National Institutes of Health (NIH): One of the world’s leading research entities on global health, NIH conducts biomedical and behavioral science research on diseases and disorders to enhance diagnosis, prevention, and treatment and provides technical assistance and training. Prior to the current Trump administration, all 27 of the agency’s institutes and centers engaged in global health activities, but these activities are already being curtailed or eliminated.
  • Food & Drug Administration (FDA): The FDA screens pharmaceutical and biological products for safety and efficacy and helps oversee the safety of the U.S. food supply.
  • Health Resources and Services Administration (HRSA): HRSA builds human and organizational capacity and promotes health systems strengthening to deliver care in PEPFAR countries.

In addition to the foreign assistance and public health service agencies, other departments and agencies involved in global health have included the Department of Defense (DoD), the Department of Agriculture (USDA), the Peace Corps, the Environmental Protection Agency (EPA), the Department of Homeland Security (DHS), the Department of Labor (DoL), the Department of Commerce (Commerce), the Office of the U.S. Trade Representative (USTR), and the National Security Council (NSC). The NSC, which sits within the White House, plays a significant role across the U.S. government, as it is responsible for coordinating and reviewing the U.S. strategy and activities related to global health security, including its international response. However, the administration has eliminated many of the staff working on these issues, and is no longer operating the White House Office of Pandemic Preparedness and Response (OPPR), which had been responsible for domestic policy coordination related to health security.

Legislative Branch

The U.S. Congress introduces, considers, and passes global health-related legislation; oversees global health efforts, specifying how funds for these programs are to be (and not to be) spent; authorizes and appropriates funding; and confirms presidential appointees to key U.S. global health positions. Major committees of the House of Representatives (House) and Senate with jurisdiction over global health efforts include: the House Committee on Foreign Affairs, Senate Committee on Foreign Relations, House Committee on Energy and Commerce, Senate Committee on Health, Education, Labor, and Pensions, and the Senate and House Appropriations Committees.

The U.S. global health response has been defined by numerous governing statutes, authorities, and policy decisions. For instance, the legislation that created PEPFAR in 2003 and its subsequent reauthorizations in 2008, 2013, 2018, and 2024 are key statutes of U.S. global health policy, as they govern its bilateral HIV response, bilateral assistance for TB and malaria, and participation in the Global Fund. Other statutory requirements that shape the implementation and scope of U.S. global health activities are those governing U.S. global FP/RH efforts, such as those directing how U.S. funds may not be spent. For instance, the Helms Amendment (1973) prohibits the use of foreign assistance to pay for the performance of abortion as a method of family planning or to motivate or coerce any person to practice abortion. The Kemp-Kasten Amendment (1985) prohibits funding any organization or program, as determined by the President, that supports or participates in the management of a program of coercive abortion or involuntary sterilization (it has been invoked at times to restrict funding to UNFPA).

While Congress has authority over many aspects of global health, the current administration has taken several actions without its direct consent (such as eliminating USAID and withholding Congressionally-directed appropriations), and has questioned the extent of Congressional authority in these areas. It is unclear if Congress will act on these issues and some of these questions are being litigated in federal court.

Where Do U.S. Bilateral Global Health Programs Operate?

Copy link to Where Do U.S. Bilateral Global Health Programs Operate?

Prior to the current Trump administration, the U.S. provided bilateral support for U.S. global health programs in almost 80 countries, with additional countries reached through U.S. regional global health programs and U.S. contributions to multilateral organizations. Multiple factors determined where the U.S. channeled its global health support. While more U.S. support was generally directed to countries facing a higher burden of disease, it was also influenced by factors such as the presence of willing and able partner governments, a history of positive relations and goodwill with host countries, strategic and national security priorities, and funding and personnel availability. The majority of countries receiving U.S. bilateral support for global health (“partner countries”) were located in sub-Saharan Africa (35 countries), followed by the Western Hemisphere (14 countries), East Asia and Oceania (11 countries), South and Central Asia (9 countries), Europe and Eurasia (4 countries), and Middle East and North Africa (4 countries) (Figure 5). Most U.S. bilateral support for global health programs was provided in sub-Saharan Africa (84%) (Figure 6). Furthermore, the top 10 country recipients of U.S. global health funding, representing 59% of U.S. bilateral support for global health, were all in this region (Figure 7).

Countries Where the U.S. Operates Global Health Programs, by Region, FY 2023
U.S. Global Health Funding, by Region, FY 2023
Top 10 Recipient Countries of U.S. Global Health Funding, FY 2023

The U.S. typically operated more than one health program (HIV, TB, malaria, etc.) in each partner country. While in most countries, the U.S. operated programs in four or fewer global health areas, this number was generally higher in countries in sub-Saharan Africa (five or more).

What Multilateral Health Organizations Are Supported by the U.S.?

Copy link to What Multilateral Health Organizations Are Supported by the U.S.?

In addition to its bilateral programs, the U.S. has a long history of engagement with multilateral health organizations and international institutions, beginning with its role in the development of the first such organizations, including the Pan-American Health Organization (PAHO) in the early 1900s and the World Health Organization (WHO) a few decades later. This involvement continued with, for example, the Global Fund (which the U.S. helped to launch in 2001), Gavi (launched in 2000), the GHSA (which the U.S. played a key role in developing and launching in 2014), and the Pandemic Fund (launched in 2022). Prior to the current Trump administration – which is carrying out a review of its engagement in international organization to determine the future of U.S. multilateral participation and support – U.S. support for multilateral global health efforts has taken various forms, including:

  • Funding. The U.S. has often been the largest or one of the largest donors to multilateral health efforts, funding core (generally used to support essential functions and operations) and voluntary (used for specific projects or initiatives the U.S. seeks to support) contributions. About a fifth (19%) of U.S. global health funding supported U.S. contributions to multilateral health organizations (Figure 8). However, some global health support to multilateral organizations has already been reduced or eliminated by the current Trump administration, such as funding and engagement in the World Health Organization, UNFPA, and the Pandemic Fund.
  • Governance. The U.S. has been active in the governance structures that oversee multilateral global health organizations and initiatives, including holding permanent or rotating seats on many of their boards.
  • Technical assistance. The U.S. has offered technical assistance in support of grants to partner countries, providing additional staff capacity to international organizations (by detailing U.S. government employees to these organizations for periods of time).
  • Standard setting. The U.S. has engaged in standard-setting, weighing in on global plans, treaties, and agreements to respond to a range of health issues as they are developed and considered for approval by the larger body.
U.S. Multilateral Global Health Funding (in millions), FY 2025

The U.S. has engaged with a number of multilateral global health organizations, including health-focused specialty agencies of the United Nations (U.N.) and international financing mechanisms for global health. Key among these are eight to which Congress specifically directs funding (though the U.S. also reaches other multilateral health institutions without direct Congressional appropriations but rather through general support), of which the U.S. has been the top contributor to five (the Global Fund, PAHO, UNAIDS, UNICEF, and WHO):

U.N. Agencies

  • World Health Organization (WHO): WHO, created in 1948, is the directing and coordinating authority for health within the U.N. system. WHO provides international leadership on global health matters, shaping the health research agenda, setting norms and standards, providing technical support to countries, and monitoring and assessing health trends. The U.S. has been involved in WHO since its creation, providing financial and technical support as well as participating in its governance structure. However, President Trump announced on the first day of his second term that the U.S. would withdraw as a member of WHO and halt funding to the organization.
  • Pan American Health Organization (PAHO): PAHO is the oldest international health agency, founded originally as the International Sanitary Bureau in 1902. The U.S. joined PAHO as a member state in 1925. PAHO, the specialized international health agency for the Americas, “works with countries throughout the region to improve and protect people’s health” and serves as the WHO Regional Office for the Americas and as the health organization of the inter-American System.
  • Joint United Nations Programme on HIV/AIDS (UNAIDS): UNAIDS, created in 1996 as the successor organization to the WHO Global Programme on AIDS (GPA), is the leading global organization for addressing HIV/AIDS. Coordinating efforts across the U.N. system, it is made up of 11 U.N. co-sponsors and guided by a Programme Coordinating Board (PCB), which is a subset of its co-sponsors and government representatives. The U.S. currently serves on the PCB.
  • United Nations Children’s Fund (UNICEF): UNICEF, created in 1946, aims to improve the lives of children, particularly the most disadvantaged children and adolescents, and is one of the largest purchasers of vaccines worldwide. The U.S. was a founding member that same year.
  • United Nations Population Fund (UNFPA): UNFPA, created in 1969, is the largest purchaser and distributor of contraceptives worldwide. While the U.S. helped to found UNFPA and was a leading supporter for many years, its support has fluctuated significantly and sometimes been withheld entirely over the years, due to ongoing U.S. political debates about abortion. The Trump administration has announced that it is withholding funding from UNFPA.

Non-U.N. Financing Mechanisms

  • Gavi, the Vaccine Alliance (Gavi): Gavi, created in 2000, is a public-private partnership that aims to increase access to immunization in poor countries. The U.S. has been involved in Gavi since its creation through contributions, participation in Gavi’s governance, and technical assistance. The U.S. is the second largest donor to Gavi’s core programs and the top donor to Gavi’s COVAX Advance Market Commitment (COVAX AMC), a financial mechanism within COVAX that supports low- and middle-income countries through procurement and distribution of COVID-19 vaccines.
  • Global Fund to Fight AIDS, Tuberculosis and Malaria (Global Fund): The Global Fund, created in 2001, is an independent multilateral financing entity that supports HIV, TB, and malaria programs in low- and middle-income countries. The U.S. was involved in creating the Global Fund and maintains a permanent seat on its Board. U.S. contributions and those of other donors are pooled and then provided by the Global Fund to country-driven projects based on technical merit and need.
  • TB Global Drug Facility: The Global Drug Facility, created in 2001, is a financing mechanism of the Stop TB Partnership; it provides grants to countries for TB drugs.

U.S. support for multilateral institutions overall has fluctuated over time, reflecting, in part, changing U.S. leadership views on the relative value of bilateralism versus multilateralism. As a result, U.S. engagement in and contributions to specific multilateral health organizations and institutions may change over time. For example, the U.S. under the first Trump administration did not participate in the partnership to create  COVAX (an international partnership led by the Coalition for Epidemic Preparedness Innovations [CEPI], Gavi, and WHO) to facilitate greater global access to the COVID-19 vaccine, although Congress did provide $4 billion in emergency funding to Gavi in support of COVID-19 vaccine access. Under the Biden administration, the U.S. joined the COVAX partnership.

Multilateral initiatives complement U.S. bilateral global health efforts, helping make progress toward U.S. goals in various program areas. In some cases, U.S. multilateral global health support allows the U.S. to reach a larger number of countries; it also may help to leverage additional funding and provide opportunities for improved coordination and technical consultations. Additionally, U.S. policies related to funding can greatly influence other financial support for multilaterals. For instance, since U.S. law has required that the U.S. contribution to the Global Fund cannot exceed 33% of total contributions from all donors, the U.S. contribution has leveraged other donor contributions; in effect, this requirement encouraged increased support from other donors and prevented the U.S. from becoming the predominant donor to the Global Fund.

How Does the U.S. Compare to Other Donors of International Health Assistance?

Copy link to How Does the U.S. Compare to Other Donors of International Health Assistance?

The U.S. has been the largest donor to global health, providing over 40% of all international health assistance among major donor governments (Figure 9).

U.S. was the Largest Donor Government of International Health Assistance in 2023

In addition, the U.S. has historically devoted more of its foreign assistance to health than any other donor government, contributing over a quarter of its foreign assistance to global health in 2023 (Figure 10). The U.S. has also been the largest government donor to several specific global health areas, including HIV and family planning. Currently, however, the Trump administration is withholding global health funds in several areas and actual spending levels are still unknown.

Donor Governments with the Largest Share of Development Assistance Directed to International Health in 2023

Future Outlook

Copy link to Future Outlook

While the U.S. has been engaged in international health activities for over a century and has historically been the largest funder and implementer of global health programs worldwide, it is currently undergoing a fundamental shift, with a significantly reduced footprint and role.  Given the prominence of the U.S. in global health, these actions have and will influence the larger global health ecosystem and the health of those in low and middle income countries. Among the key issues to watch are:

  • The future direction of U.S. leadership in and degree of commitment to global health as the Trump administration reorganizes foreign assistance more broadly and seeks to permanently alter the U.S. role.
  • The status of U.S. funding for global health, particularly given the interplay between Congress and the administration on whether and how that funding gets spent and ongoing litigation in this area.
  • The ability of global health implementers to continue to deliver services to those who need them, given their loss of funding and future uncertainty.
  • The future role of multilateral institutions in global health, as the U.S. bilateral role is reduced, but also its support for multilateral health efforts remains unclear.
  • Whether other donors (governments, foundations, the private sector) will help to fill some of the gaps left by the U.S.
  • Whether the nations that have been recipients of U.S. global health support will increase their own financing and delivery of health services to their populations.

Resources

Copy link to Resources

Citation

Copy link to Citation

Oum, S., Moss, K., & Kates, J., The U.S. Government and Global Health. In Altman, Drew (Editor), Health Policy 101, (KFF, October 2025) https://www.kff.org/health-policy-101-the-u-s-government-and-global-health/ (date accessed).

The Role of Public Opinion Polls in Health Policy

Table of Contents

Introduction

Copy link to Introduction

Polls and surveys are useful tools for understanding health policy issues. However, it takes time and training to understand how to interpret survey results and to decide which polls are useful and which might be misleading. The aim of this chapter is to help you learn how to be a good consumer of polls so they can be a valuable part of your toolkit for understanding the health policy environment. It begins by discussing why polls are an important tool in policy analysis and the caveats to keep in mind when interpreting them. It then discusses polling methodology and the questions you should ask to assess the quality and usefulness of a poll. The chapter ends with some real-world examples in which polling helped inform policy debates.

People sometimes ask if there is a difference between a “poll” and a “survey.” The quick answer is that every poll is a survey, but not every survey is a poll (for example, large federal surveys like the Census or surveys of hospitals or other institutions would not be called polls). For purposes of this chapter, we use the terms interchangeably.

Why Should You Pay Attention to Polls at all?

Copy link to Why Should You Pay Attention to Polls at all?

Polls have gotten a bad rap over the past few years, particularly around election times when they don’t do a perfect job predicting who the winner of a given election will be. Given this, you may wonder why you should pay attention to polls when trying to understand health policy. There are six basic reasons why it’s important for health policy scholars to understand public opinion:

1. People vote, and elections can have important consequences for health policy at the local, state, and national levels. While polls may not always be perfect predictors of election outcomes, they are one of the best ways to understand the dynamics of how voters are thinking and feeling when weighing their vote choices, not only for high-profile offices like President and Congress, but for state and local races and ballot initiatives as well.

2. Public opinion can influence policy choices, particularly for highly salient issues, like health care, that touch pretty much everyone’s lives in some way. While the average member of the public may not be equipped to understand the details of most health policy legislation, their preferences and views can put constraints on lawmakers by identifying actions that would be deemed unacceptable by large majorities of the public or their constituents.

3. Polls can also provide information about the broader environment in which health policy issues or changes are being debated. They can help you understand the salience of a given issue (i.e., how much do people care about prescription drug prices and how closely are they paying attention to debates over how to lower them?) and identify other factors that might affect the likely success of a given policy (i.e., if the country’s attention is focused on a foreign policy crisis, how will that affect the public’s reaction to a major new proposal to overhaul Medicaid?).

4. Beyond measuring opinion, surveys can also be useful for understanding how health policy is affecting people. Survey questions about people’s experiences can offer context by providing information like the share of people who are struggling to afford their health insurance. Looking at questions like these at multiple points in time can also help you understand how experiences change in the months and years following enactment of major health legislation.

5. Surveys can help amplify the voices of real people in policy debates, particularly those that are often ignored or drowned out by special interests. Polling that includes adequate sample sizes to represent the voices of marginalized and underrepresented populations, such as members of racial and ethnic minority groups, immigrants, LGBTQ individuals, people living in rural areas, and those with lower incomes, may be especially useful for understanding the impact of health policy on people.

6. In this way, methodologically sound, non-partisan, transparent surveys can serve as a counterweight to polls sponsored by special interests that are conducted in private and used to craft public messages, design campaigns, or sell products.

Caveats to Polling

Copy link to Caveats to Polling

Polls do not tell the whole story. Public opinion is just one part of the political and policymaking process. Public support for a given policy may seem clear based on a single survey question, but it can be quite malleable in the course of a public debate, and not all surveys measure this malleability. Small changes in survey question wording can sometimes lead to big changes in public support, so it’s important never to rely on a single question from a single poll to make a conclusion about what the public thinks or knows. When possible, look for multiple questions on the same topics from multiple polls conducted at various times. If the answers are consistent, you can be more confident that the conclusion is correct. Sometimes a poll finding conflicts with your best sense of political reality when all available information is considered. In those instances, there’s a good chance your “gut” is a better guide than what a given poll tells you.

There are limits to polling on complex topics like health care. When the public says they support a specific proposal for lowering health care costs, it doesn’t mean they have fully thought through the details of that proposal and its implications. Rather, it may signal how important they think it is for policymakers to address the high cost of health care. And while some polls test this by asking follow-up questions that probe the public about trade-offs to any given policy approach, some health policy topics are just too complicated to reasonably ask the average American to weigh in on in a short survey.

Public opinion can’t give you the “right” answer. While public opinion can tell you where the public stands on an issue, it cannot tell you what the right policy solution is in any given situation. For example, pollsters often ask people to rank the priority they give to different health issues before Congress. They may ask the public to rank the issues of prescription drug costs, the future of the Affordable Care Act, Medicaid expansion, the financial sustainability of Medicare, and so forth. But it turns out that real people aren’t organized like congressional committees and don’t put the issues neatly into policy buckets like pollsters do. What they are concerned about is the cost and affordability of health care, a concern that cuts across these issues. These ranking questions provide some information about what resonates most with the public, but that doesn’t mean they should be treated as a rank-ordered list for policymakers to address starting from the top down. In addition, beyond telling you what the public thinks, polls can be just as useful for pointing out what the public doesn’t understand about a given policy issue, allowing you to direct outreach and education efforts or figure out messaging that will resonate with the public if you are advocating for a policy change.

Understanding the Methods: Questions to Ask about Polls

Copy link to Understanding the Methods: Questions to Ask about Polls

The science of survey research is complicated, but there are a few simple terms you can learn and questions you can ask when you encounter polls in your schooling and daily life. These include:

Population. Who is the population that the survey is claiming to represent? Polls can be conducted with many different populations, so it is important to know how researchers define the population under study. For example, a survey of voters may be useful for your understanding of a particular health care issue’s importance in the election, but it might not be as useful for estimating how many people have had problems paying medical bills, since lower-income people (who may be the most likely to experience bill problems) are less likely to be voters and may be left out of the study entirely.

Sampling. How did researchers reach the participants for their poll, and was it a probability or non-probability sample? In a probability-based sample, all individuals in the population under study have a known chance of being included in the survey. Such samples allow researchers to provide population estimates (within a margin of sampling error) based on a small sample of responses from that population. Examples of probability-based sampling techniques include random digit dialing (RDD), address-based sampling (ABS), registration-based sampling (RBS), and probability-based online panels. Non-probability sampling, sometimes called convenience or opt-in sampling, has become increasingly common in recent years. While non-probability surveys have some advantages for some types of studies (particularly their much lower cost), research has shown that results obtained from non-probability samples generally have greater error than those obtained from probability-based methods, particularly for certain populations.

Data collection (survey mode). While there are many ways to design a survey sample, there are also many ways to collect the data, known as the survey mode. For many years, telephone surveys were considered the gold standard because they combined a probability-based sampling design with a live interviewer. Survey methodology is more complicated now, but it is still important to know whether the data was collected via telephone, online, on paper, or some other way. If phones were used, were responses collected by human interviewers or by an automatic system, sometimes known as interactive voice response (IVR) or a “robocall”? Or were responses collected via text message? Depending on the population represented, different approaches might make the most sense. For example, about 5% of adults in the U.S. are not online, and many others are less comfortable responding to survey questions on a computer or internet-connected device. While young adults may be comfortable responding to a survey via text message, many older adults still prefer to take surveys over the phone with a live interviewer. Some populations feel a greater sense of privacy when taking surveys on paper, while literacy challenges may make a phone survey more appropriate for other populations. Many researchers now combine multiple data collection modes in a single survey to make sure these different segments of the population can be represented.

Language. Was the survey conducted only in English, or were other languages offered? If the survey is attempting to represent a population with lower levels of English language proficiency, this may affect your confidence in the results.

Survey sponsor. Who conducted the survey and who paid for it? Understanding whether there is a political agenda, special interest, or business behind the poll could help you better determine the poll’s purpose as well as its credibility.

Timing. When was the survey conducted? If key events related to the survey topic occurred while the survey was in the field (e.g., an election or a major Supreme Court decision), that might have implications for your interpretation of the results.

Data quality checks. During and after data collection, what data quality checks were implemented to ensure the quality of the results? Most online surveys include special “attention check” questions designed to identify respondents who may have fabricated responses or rushed through the survey without paying attention to the questions being asked. Inclusion of these questions is a good sign that the researchers were following best practices for data collection.

Weighting. Were the results weighted to known population parameters such as age, race and ethnicity, education, and gender? Despite best efforts to draw a representative sample, all surveys are subject to what is known as “non-response bias” which results from the fact that some types of people are more likely to respond to surveys than others. Even the best sampling approaches usually fall short of reaching a representative sample, so researchers apply weighting adjustments to correct for these types of biases in the sample. When reading a survey methodology statement, it should be clear whether the data was weighted, and what source was used for the weighting targets (usually a survey from the Census or another high-quality, representative survey).

Sample size and margin of sampling error. The sample size of a survey (sometimes referred to as the N) is the number of respondents who were interviewed, and the margin of sampling error (MOSE) is a measure of uncertainty around the survey’s results, usually expressed in terms of percentage points. For example, if the survey finds 25% of respondents give a certain answer and the MOSE is plus or minus 3 percentage points, this means that if the survey was repeated 100 times with different samples, the result could be expected to be between 22%-28% in 95 of those samples. In general, a sample size of 1,000 respondents yields a MOSE of about 3 percentage points, while smaller sample sizes result in larger MOSEs and vice versa. Weighting can also affect the MOSE. When reading poll results, it is helpful to look at the N and MOSE not only for the total population surveyed, but for any key subgroups reported. This can help you better understand the level of uncertainty around a given survey estimate. The non-random nature of non-probability surveys makes it inappropriate to calculate a MOSE for these types of polls. Some researchers publish confidence estimates, sometimes called “credibility intervals,” to mimic MOSE as a measure of uncertainty, but they are not the same as a margin of sampling error. It’s also important to note that sampling error is only one source of error in any poll.

Questionnaire. Responses to survey questions can differ greatly based on how the question was phrased and what answer choices were offered, so paying attention to these details is important when evaluating a survey result. Read the question wording and ask yourself – do the answer options seem balanced? Does the question seem to be leading respondents toward a particular answer choice? If the question is on a topic that is less familiar to people, did the question explicitly offer respondents the chance to say they don’t know or are unsure how to answer? If the full questionnaire is available, it can be helpful to look at the questions that came before the question of interest, as information provided in these questions might “prime” respondents to answer in a certain way.

Transparency. There is no “gold seal” of approval for high-quality survey methods. However, in recent years, there has been an increasing focus on how transparent survey organizations are about their methods. The most transparent researchers will release a detailed methodology statement with each poll that answers the questions above, as well as the full questionnaire showing each question in the survey in the order they were asked. If you see a poll released with a one or two-sentence methodology statement and can’t find any additional information, that may indicate that the survey organization is not being transparent with its methods. The American Association for Public Opinion Research has a Transparency Initiative whose members agree to release a standard set of information about all of their surveys. Some news organizations also “vet” polls for transparency before reporting results, but many do not. This means that just because a poll or survey is reported in the news doesn’t necessarily mean it’s reliable. It’s always a good idea to hunt down the original survey report and see if you can find answers to at least some of the questions above before making judgments about the credibility of a poll.

Election polling vs. issue polling. Election polls – those designed at least in part to help predict the outcome of an election – are covered frequently in the media, and election outcomes are often used by journalists and pundits to comment on the accuracy of polling. Issue polls – those designed to understand the public’s views, experiences, and knowledge on different issues – differ from election polls in several important ways. Perhaps the most important difference is that, in addition to the methodological challenges noted above, election polls face the added challenge of predicting who will turn out to vote on election day. Most election polls include questions designed to help with this prediction, and several questions may be combined to create a “likely voter” model, but events or other factors may affect individual voter turnout in ways pollsters can’t anticipate. Election polls conducted months, weeks, or even days before the election also face the risk that voters will change their mind about how to vote between the time they answer the survey and when they fill out their actual ballot. Issue polls do not generally face these challenges, so it’s important to keep in mind that criticisms about the accuracy of election polls may not always apply to other types of polls.

Examples of the Usefulness of Polls in Understanding Health Policy

Copy link to Examples of the Usefulness of Polls in Understanding Health Policy

Example #1: Tracking the evolution of public opinion and experience through debate, passage, and implementation of the Affordable Care Act

The Affordable Care Act (ACA) is the largest health legislation enacted in the 21st century. From the time the legislation was being debated in Congress through its passage, implementation, and efforts to repeal it, the ACA has been the subject of media coverage, political debate, campaign rhetoric, and advertising. In each of those stages, polls and surveys have provided important information for understanding what was happening with the law.

Prior to passage, polls showed the public’s desire for change in health care, particularly when it came to decreasing the uninsured rate and making health care and insurance more affordable. Despite this apparent consensus on the need for change, polls also helped shed light on some of the barriers to passing legislation. For example, survey trends demonstrated how the share of the public who expected health reform legislation to leave their families worse off increased over the course of an increasingly public debate in which opponents tapped into fears about how the proposed law might change the status quo.

After the law was passed, public opinion on the ACA was sharply divided along partisan lines, with majorities of Democrats viewing the law favorably and majorities of Republicans having an unfavorable view. However, surveys also painted a more nuanced picture beyond the overall partisanship, showing that majorities of U.S. adults across partisan lines favored many of the things the ACA did, including allowing young adults to stay on their parents’ insurance until age 26, preventing health plans from charging sick people more than healthy people, and providing financial subsidies to help lower- and moderate-income adults purchase coverage. At the same time, polls showed that many adults were not aware that these provisions were part of the ACA, and that many others incorrectly believed the law did things it did not, such as creating a government-run insurance plan and allowing undocumented immigrants to receive government financial help to purchase coverage.

This combination of “the parts more popular than the whole” and incomplete public knowledge of the law provided some insight into why efforts to repeal the law were ultimately unsuccessful despite the relative unpopularity and deep partisan divisions on the law overall. When faced with the very real prospect of the popular parts of the law going away – particularly the protections for people with pre-existing health conditions – the public (and particularly Democrats and independents who had previously expressed lukewarm support) rallied to protect it. In fact, following concerted Republican efforts to repeal the law in 2017, the ACA has remained more popular than ever, with more adults expressing a favorable than an unfavorable opinion.

In addition to providing information about the public’s evolving opinion and awareness of the law, surveys also helped provide information about people’s experiences under the law. For example, a 2014 survey of people who purchase their own insurance found that 6 in 10 people enrolled in insurance through the new marketplaces were previously uninsured, and that most of this group said they decided to purchase insurance because of the ACA. Subsequent surveys showed that most marketplace enrollees were satisfied with their plans, but many reported challenges related to the affordability of coverage and care.

These are just a few examples of the ways surveys helped provide insights into the dynamics of a complex health policy at different points in time.

Example #2: Understand the limits of public support of Medicare-for-All proposals

Another health policy issue where polls have provided useful information is the debate over a national, single-payer health plan. While the idea has been discussed for decades, public discussion was prominent most recently during the 2016 and 2020 Democratic presidential primaries, when Senator Bernie Sanders made “Medicare-for-all” a centerpiece of his campaign. Since 2017, a majority of U.S. adults have supported the idea of a national Medicare-for-all plan, but once again, polls also indicated why such a proposal had never become a political reality. For example, the public’s reaction to the idea varies considerably based on the language used to describe it; while majorities view the terms “universal coverage” and “Medicare-for-all” positively, most have a negative reaction to “socialized medicine,” and many are unsure how they feel about the term “single-payer health insurance.” Surveys also demonstrate that while support starts out high, many people say they would oppose a Medicare-for-all plan if they heard common arguments made by opponents, such as that it would lead to delays in treatments, threaten the current Medicare program, or increase taxes. Polls like these and others that test different messages can help shed light on the public’s likely reaction to real-world debates over policies, helping us understand some of the reasons why certain policies that seem to attract majority support in the abstract face an uphill battle once public debate and discussion about them begin.

Example #3: Understanding the impact of the Supreme Court’s overturning of Roe v. Wade

Polls can also help shed light when sudden events create policy changes that immediately affect individuals’ access to health care in different scenarios. A recent example is the Supreme Court 2022 decision in Dobbs v. Jackson that overturned Roe v. Wade and eliminated the nationwide right to abortion that had been in place since 1973. The Dobbs decision opened the door for states to pass their own abortion regulations, and many states had previously established “trigger laws” that made abortion illegal as soon as Roe was overturned.

Polls before and after the 2022 midterm election indicated how the overturn of Roe affected voter motivation, turnout, and vote choice. For example, polling in October 2022 showed abortion increasing as a motivating issue for voters, particularly among Democrats and those living in states where abortion was newly illegal. And election polling of voters showed how the Supreme Court decision played a key role in motivating turnout among key voting blocs that likely contributed to the Democratic party’s stronger-than-expected performance in the midterms. Two years later, amid growing economic concerns, polls leading up to the 2024 election showed that while the economy and inflation were far and away the top issues for voters, some key groups of women voters as well as voters in states with abortion-related ballot initiatives continued to be motivated by the issue of abortion more than two years after the Dobbs decision.

Understanding the impact of Dobbs is an area where polling of specific populations (including grouping individuals by the abortion laws in their state) is more useful than looking at the U.S. population as a whole. For example, in addition to shedding light on the dynamics of abortion as an election issue, polling in 2023 indicated widespread confusion about the legality of medication abortion, particularly among people living in states that had banned or severely limited the procedure. Surveys also shed light on the experiences of people living in different states; for example, a 2024 survey found that 1 in 5 women of reproductive age (18-49) living in states with abortion bans said either they or someone they know had difficulty accessing an abortion since the Supreme Court overturned Roe v. Wade due to restrictions in their state.

Example #4: Amplifying the voices and experiences of marginalized populations

Well-designed surveys of under-represented groups can provide important information about health policy by amplifying the opinions and experiences of those whose voices are often left out of policy debates. Examples include:

  • A survey of 2023 Medicaid enrollees documented the coverage status of people who were disenrolled during the Medicaid “unwinding” process. Beginning in March 2020, states kept people enrolled in Medicaid without the need to renew or re-determine eligibility under a law passed in response to the COVID-19 pandemic. When the law expired in March 2023, it was uncertain how individuals and families would be affected. Surveys like this helped document the impact of the policy change on people’s coverage status and access to care.
  • A survey of U.S. immigrants shed light on the health and health care experiences of a group that makes up one-sixth of the adult population. Among other findings, this survey showed that half of all likely undocumented immigrants in the U.S. lacked health insurance coverage, information not previously available from other data sources. It also illustrated the importance of state policies in determining coverage rates for immigrant adults, documenting the much higher uninsured rate among immigrants living in states with less expansive coverage policies (like Texas) compared to those in states with more expansive policies (like California).
  • A survey of trans adults documented this population’s struggles accessing appropriate health care. Among other findings, this survey found that almost 4 in 10 trans adults said it was difficult to find a health care provider who treats them with dignity and respect, 3 in 10 said they had to teach a provider about trans people in order to get appropriate care, and 1 in 5 had health insurance that would not cover gender-affirming treatment. Importantly, these survey findings help increase understanding of the health care experiences of a group that is often marginalized in U.S. society, and one that also faces other barriers, including economic challenges, higher rates of mental health challenges and unmet needs for mental health care.
  • A survey focused on racism, discrimination, and health showed the extent of discrimination and unfair treatment in health care settings. This survey found that large shares of Black, Hispanic, Asian, and American Indian and Alaska Native adults reported preparing for possible insults or being very careful about their appearance in order to be treated fairly during health care encounters. It also showed how individuals who have more visits with providers who share their racial and ethnic background report more positive health care experiences. These findings provide insights into possible policy solutions to improve care, highlighting the importance of a diverse health care workforce that is trained in culturally appropriate care.
  • Surveys of areas impacted by natural disasters also help provide information to guide recovery efforts in these areas. For example, a survey of Hurricane Katrina evacuees living in Houston-area shelters documented the physical and emotional toll of the storm and the disproportionate impact on lower-income, African American, and uninsured residents. A series of surveys of New Orleans residents in the years following Katrina showed steady progress in many areas of recovery, but highlighted how the gap between the experiences of the city’s Black and White residents grew over time in many ways. Surveys of Puerto Rico residents following Hurricane Maria and Texas Gulf Coast residents following Hurricane Harvey provided similar insights to shine a lens on disparities and highlight the needs of the local populations in those areas.

Resources

Copy link to Resources

Citation

Copy link to Citation

Brodie, M., Hamel, L., & Kirzinger, A., The Role of Public Opinion Polls in Health Policy. In Altman, Drew (Editor), Health Policy 101, (KFF, October 2025) https://www.kff.org/health-policy-101-the-role-of-public-opinion-polls-in-health-policy (date accessed).

International Comparison of Health Systems

KFF Authors:

Table of Contents

Introduction

Copy link to Introduction

Health systems aim to provide accessible, high-quality care that improves health outcomes at an affordable cost. One way to assess the performance of the United States’ health system is to benchmark it against those in similar countries.

Comparing health system performance internationally is complicated, though, as each country has unique political, economic, and social conditions. Because health spending and health outcomes are often correlated with a country’s wealth, this chapter focuses on comparisons between the U.S. and other large and wealthy OECD nations: Australia, Austria, Belgium, Canada, France, Germany, Japan, the Netherlands, Sweden, Switzerland, and the United Kingdom.

Despite spending far more money than any peer nation, Americans live shorter lives and often face more barriers to care. Some of this disparity can be attributed to aspects of the U.S. health system, but socioeconomic, health and other factors also play a role.

Health Insurance Systems and Coverage

Copy link to Health Insurance Systems and Coverage

From the late nineteenth to mid-twentieth centuries, many nations created health insurance systems that aimed to make health care accessible and affordable to their population. Some countries, like the United Kingdom, have health systems that are largely publicly funded and operated, while other countries, like Switzerland, have a compulsory private insurance system. Many countries’ health systems include a mix of private and public insurance. Regardless of financing mechanism, the health systems in many countries that are similarly large and wealthy as the U.S. are largely compulsory, resulting in universal or near-universal health coverage.

During this same period, the United States took a different approach, relying on a largely voluntary private insurance system that resulted in a substantial share of the population being uninsured. Despite decades of calls for a national public health insurance program, it was not until 1965 that two major public insurance programs were created – Medicare for people age 65 or older and Medicaid for low-income people – and it was not until the Affordable Care Act passed in 2010 that the U.S. health system was expanded to create near-universal eligibility for health insurance coverage for lawfully present residents. Even so, the U.S. health system is still largely voluntary and millions of people in the U.S. continue to go without insurance, often citing cost as a barrier.

Health Spending

Copy link to Health Spending

Wealthy countries, including the U.S., tend to spend more per person on health care and related expenses than lower-income countries. However, even among higher-income countries, the U.S. spends far more per person on health.

Spending Growth

Over the past five decades, the health spending gap between the U.S. and peer nations has widened. In 1970, the U.S. spent about 7% of its GDP on health, which was similar to spending in several comparable countries (the average of comparably wealthy countries was about 5% of GDP in 1970). The U.S. was relatively on pace with other countries until the 1980s, when health spending in the U.S. grew at a significantly faster rate relative to its GDP. 

The United States spends more per capita on total health expenditures, including government spending and household payments. In 2020, the U.S. spent 19.5% of its GDP on health consumption (up from 17.5% in 2019), largely due to the increased spending during the COVID-19 pandemic, along with the economic downturn. By 2023, health spending as a share of GDP had declined to 17.6% in the U.S.—but remains substantially higher than in peer countries.

Drivers of Health Spending

The largest category of health spending in both the U.S. and comparable countries is spending on inpatient and outpatient care, which includes payments to hospitals, clinics, and physicians for services and fees such as primary care or specialist visits, surgical care, provider-administered medications, and facility fees. Americans spent $8,353 per person on inpatient and outpatient care, compared to $3,636 in peer countries, on average. The U.S.’s higher spending on providers is driven more by higher prices than higher utilization of care. Patients in the U.S. have shorter average hospital stays and fewer physician visits per capita, while many hospital procedures have been shown to have higher prices in the U.S. Higher spending on inpatient and outpatient care drives most of the difference in health spending between the U.S. and its peers. In fact, the U.S. spends more on inpatient and outpatient care than most peer nations spend on their entire health systems (including long-term care, prescription drugs, administration, prevention, and other services).

The cost of prescription drugs is another factor that partially explains the U.S.’s higher health spending. Many of the same medications cost more in the U.S. than they do in other comparable nations. In 2022, the U.S. spent $1,765 per capita on prescription drugs and other medical goods (including over-the-counter and clinically delivered pharmaceuticals as well as durable and non-durable medical equipment). However, because prescription drugs represent a relatively small share of total health spending, even if per capita prescription drug spending in the U.S. were closer to that of comparable countries, that would make only a small dent in closing the gap on health spending.

Spending on health administration is similarly much higher in the U.S. than in comparable countries: $1,078.44 per capita. Administrative costs include spending on running governmental health programs and overhead from insurers, but exclude administrative expenditures from health care providers. This includes administrative spending for private health insurance, governmental health programs (such as Medicaid and Medicare), as well as other third-party payers and programs.

The U.S. also spends more per capita on preventive care than peer nations. Activities captured in this spending category vary among countries, but in the U.S., it generally consists of public health activities, including preventive health programs and education for immunizations, disease detection, emergency preparedness, and more. In the U.S., preventive care spending more than doubled between 2019 and 2020, from $343 to $741 per capita, but subsequently declined to $649 by 2022.

Meanwhile, the only category of spending in which the U.S. spends less than most comparable countries on a per-person basis is long-term care. Long-term care spending includes health and social services provided in long-term care institutions such as nursing homes as well as home- and community-based settings. After an increase from 2019 to 2020 at the onset of the COVID-19 pandemic, U.S. spending on long-term care declined by 4.9% between 2020 and 2021 but increased again by 5.4% between 2021 and 2022. Long-term care spending was already lower in the U.S. than in peer countries before the pandemic.

Health Outcomes

Copy link to Health Outcomes

Life Expectancy

Life expectancy is one of the most common measures of health outcomes. In 1980, the average American could expect to live 73.7 years – a similar life expectancy to residents of most wealthy countries. However, in subsequent years, life expectancy continued growing in most other nations at a pace far beyond that of the U.S.

In 1996, Japan became the first nation to report an average life expectancy of 80 years among its population. By 2012, all peer countries had also achieved this milestone. That same year, life expectancy in the U.S. was 78.5 years and began a decade-long plateau. By 2019, the life of the average U.S. resident would be almost four years shorter than the life of the average resident of these comparable nations (78.8 vs. 82.7 years).

This plateau and four-year gap were already highly concerning, but the health crisis brought on by the COVID-19 pandemic made the situation in the U.S. much worse. For the first time ever recorded, life expectancy dropped by almost two years, from 78.8 in 2019 to 77.0 in 2020. The pandemic was not unique to the United States, but this stunning life expectancy drop was – the average comparable nation saw a decline of less than half a year (82.7 to 82.3). By 2023, life expectancy rebounded to 78.4 years, still a full 1.3 years below pre-pandemic levels and over four years below the average among peer nations.

The life expectancy data presented here are period life expectancy estimates based on excess mortality observed in each year. Period life expectancy at birth represents the mortality experience of a hypothetical cohort if current conditions persisted into the future, and not the mortality experience of a birth cohort.

Years of Life Lost

The causes of this decrease in life expectancy are multifaceted. When people die before a certain age, the difference between their age at death and the specified age is recorded as life years lost. For example, when looking at years of life lost before age 75, a person who dies at age 60 would be considered to have lost 15 years of life. Examining the causes of these years of life lost can point to the factors which are decreasing life expectancy.

The United States had the highest rate of years of life lost per 100,000 population aged 75 years old in 2021, by a large margin. However, by examining the cause of these years of life lost, it is possible to notice where the U.S. underperforms. For example, the U.S. has a significantly higher rate of years of life lost due to heart disease, transport accidents, and accidental poisoning (a category that includes drug overdose).

While cancer is a common cause of premature years of life lost in the United States, most other countries have a similar rate of years of life lost due to cancer. This indicates that cancer is not a main cause of the discrepancy between the U.S. and peer nations.

Overall, the United States’ higher rates of premature death and disease burden do not necessarily reflect entirely on the quality of care that patients receive in doctors’ offices or hospitals. Life expectancy, mortality rates, and disease burden can also be influenced by factors outside of the health system, like socioeconomic conditions (e.g., income inequality, structural racism) and differences in health-related behaviors (e.g., diet, exercise, drug use). Children and teens in the U.S. are less likely to make it to adulthood than in peer countries, with the U.S having higher rates of motor vehicle accidents, firearm deaths, and suicide deaths among children and teens.

Quality of Care

Copy link to Quality of Care

Another, more direct way to measure the performance of the health system is to examine the quality of care provided in a hospital or clinical setting. However, inconsistent and imperfect quality metrics make it difficult to compare quality of care in the U.S. and its peers.

In comparison to peer nations, across the limited measures available internationally, the U.S. performs better on some and worse on other indicators of quality of care. For example, the U.S. performs worse on certain measures of treatment outcomes (such as maternal mortality) and some patient safety measures (such as obstetric trauma with instrument and medication or treatment errors). The U.S. performs similarly to or better than peer nations in other measures of treatment outcomes (such as mortality rates within 30 days of acute hospital treatment) and patient safety (such as rates of post–operative sepsis).

Hospital Mortality Rates

Mortality within 30 days of being admitted to a hospital is not entirely preventable, but high quality of care can reduce the mortality rate for certain diagnoses. The 30-day mortality rates after hospital admissions for heart attacks (acute myocardial infarction) are similar in the U.S. and the average of comparable countries. However, the 30-day mortality rates for ischemic strokes (caused by blood clots) were 4.5 deaths per 100 patients in the U.S. in 2022, compared to an average of 6.9 deaths per 100 patients in similar countries. Rates of mortality after hemorrhagic stroke (caused by bleeding) are also lower in the U.S. While the U.S. has lower rates of mortality due to these conditions than the average across peer nations, it is important to note that several peer nations have lower rates than the U.S.

Maternal Health

While wealth and economic prosperity are highly correlated with lower maternal mortality rates, the U.S. is an outlier with the highest rate of pregnancy-related deaths (18.6 deaths per 100,000 live births in 2023) when compared to similar countries (5.1 deaths per 100,000 live births). 

Within the U.S., there are significant racial disparities in maternal mortality rates. The maternal mortality rate for Black mothers is about 3 times the rate for White mothers — a disparity that persists across age and socioeconomic groups. Every race and ethnicity, socioeconomic, and age group in the United States sees higher maternal mortality rates than the average in comparable countries. Maternal mortality in the U.S. has risen in recent years, sparking concern from the medical community and policymakers. 

Obstetric trauma is more likely to occur in deliveries where instruments are utilized (i.e., forceps). The rate of obstetric trauma during deliveries with an instrument in the U.S. was 11.7 per 100 vaginal deliveries in 2022, higher than most comparable countries with available data. The rate of obstetric trauma during deliveries without an instrument in the U.S. was 1.7 per 100 vaginal deliveries in 2022, on the lower end among comparable countries with available data.

Hospital Admissions

Hospital admissions for certain chronic diseases, such as cardiac conditions, chronic obstructive pulmonary diseases (COPD), asthma, and diabetes, can arise for a variety of reasons, but preventive services — or lack thereof — play a large role. Hospital admission rates in the U.S. are higher than in comparable countries for congestive heart failure and complications due to diabetes, and some admissions for these chronic conditions could be avoided through primary care.

Post-Operative Complications

Rates of post-operative complications are an important measure of hospital safety. Pulmonary embolisms and deep vein thromboses are common complications after major surgeries, such as hip or knee replacement. The prevalence of post-operative clots for these procedures is higher in the U.S. than in the U.K., Sweden, Belgium, and the Netherlands, but lower than in Australia.

Sepsis is a life-threatening complication of infection that can lead to organ failure, shock, or death. Rates of post-operative infections and sepsis are an important marker of care quality for patients undergoing surgery, because this is a major source of morbidity and mortality that can sometimes be prevented. Prevention is multifactorial and can involve proper operative techniques and training, hygiene and safety protocols, and antibiotic utilization, among other things. The rate of post-operative sepsis following abdominal surgery is just under 2% in the U.S., lower than in most peer countries that report data.

Access to Care

Copy link to Access to Care

Out-of-Pocket Costs

Universal coverage means all residents have health insurance, but it does not mean health care is free. In many countries people contribute to health care costs through both out-of-pocket expenses—such as copays, coinsurance, and deductibles—as well as insurance premiums. Even in countries with universal coverage, residents often have at least nominal out-of-pocket costs. In fact, people in Switzerland pay more out-of-pocket on health care ($1,988), on average, than Americans do ($1,425) per capita.

Costs are a common barrier to accessing health care in the U.S. More than 1 in 4 Americans report skipping consultations, tests, treatment, or follow-up, and 21% report skipping medication. Only 9.2% of the United States population is uninsured, so these numbers include individuals who have health insurance, but still find medical care unaffordable. While cost-related access barriers are particularly prevalent in the U.S., residents of other countries with universal coverage also report skipping care due to costs.

Appointment Availability

Cost is not the only reason why a person may miss or delay needed medical care. The availability of physicians can also impact access to care. Among people who needed same or next-day medical care, about half (51%) of Americans were able to make a timely appointment, which is somewhat below the average of peer nations (57%).

Physicians

The U.S. has just 2.7 practicing physicians per 1,000 residents, compared to an average of 3.8 among peer nations. Also of concern in the U.S. is the ratio of primary to specialty care providers. Most other nations have somewhere between one-quarter and one-half physicians employed in primary care. Primary care is an integral part of the health system in many nations – a patient sees a primary care physician for most illnesses or injuries and only goes to a specialist or hospital if their primary care doctor decides it is necessary. In the United States, however, only 12% of doctors are general physicians, including primary care physicians.

The U.S. faces this physician shortage and high rates of specialization in part due to how medical education is structured. The U.S. has kept a tight lid on the number of medical schools, as well as the number of training spots available to new doctors. Furthermore, the higher education system in the U.S. places the burden of financing an education on the student, and university tuition is more expensive than in many peer countries. As a result, students borrow money, and most graduate from medical school with a significant amount of debt. Because primary care generally comes with a lower salary, some new physicians may pursue a higher-paid specialty, even if they would rather work in primary care.

Additionally, the U.S. has only 0.15 psychiatrists per 1,000 residents, the lowest of all peer nations. Although the U.S. has a high number of specialist providers, only 6% are psychiatrists, compared to an average of 10% of specialists in other countries examined. Despite clear and increasing demand for mental health treatment, psychiatry remains one of the lowest-paid physician specialties in the United States.

Future Outlook

Copy link to Future Outlook

The outlook of health systems will be shaped by various factors, including political and policy changes, technological advancements, economic and demographic shifts, social factors, and unforeseen events–as the COVID-19 pandemic demonstrated. Here are some issues to watch:

Health Outcomes: The United States was already performing worse than its peers across a wide range of health outcomes, but the COVID pandemic widened the gap, and it is not yet clear whether life expectancy and other measures will recover as quickly in the U.S. as in peer nations. In addition to the pandemic recovery, both the U.S. and peer countries face the challenge of aging populations and increases in chronic conditions, leading to increased demand for health care services and long-term care.

Access to Care: Unlike the U.S., other large and wealthy nations have long achieved universal or near-universal health coverage and offer more robust access to care. While the U.S. recently reached a record-high insurance coverage rate, the tax and spending legislation signed by President Trump includes the biggest reduction ever in federal spending on Medicaid and the Affordable Care Act Marketplaces—changes that are projected to increase the number of people uninsured by millions in the coming years. Moreover, even those with insurance in the U.S. often face high out-of-pocket costs, leading many to forgo needed care or incur medical debt.

Quality of Care: The adoption of new technologies will shape care delivery in both the United States and in other countries. Electronic health records, telemedicine, artificial intelligence, and other digital health tools are becoming more prevalent globally. However, many digital health tools are new, untested, and have unknown implications for quality of care.

Health Spending: Most peer nations place a strong emphasis on cost containment and efficiency and achieve this through regulation of and negotiation with health providers. In the U.S., by contrast, the federal and state governments less directly control commercial health insurance prices. However, with the passage of the Inflation Reduction Act, Medicare has negotiated drug prices for a selection of high cost drugs. There will likely be ongoing debate about further actions the federal government can take to lower drug prices, as well as taking other steps to restrain prices of health care generally.

Resources

Copy link to Resources

Health Costs:

Health Outcomes:

Access and Quality of Care

Citation

Copy link to Citation

Wager, E. & Cox, C., International Comparison of Health Systems. In Altman, Drew (Editor), Health Policy 101, (KFF, October 2025) https://www.kff.org/health-policy-101-international-comparison-of-health-systems/ (date accessed). 

The Uninsured Population and Health Coverage

Table of Contents

Introduction

Copy link to Introduction

Health coverage in the United States is marked by a blend of private and public insurance options that leaves about 8% of the population uninsured. This coverage system has evolved over the years, most recently with the implementation of the Affordable Care Act (ACA), which aimed to reduce the uninsured rate by expanding Medicaid, creating health insurance Marketplaces for individuals, and providing subsidies to make the coverage more affordable. Many factors, including economic conditions, federal and state policy changes, and significant health crises, such as the COVID-19 pandemic, influence the uninsured rate. The ACA and policy changes designed to protect coverage during the pandemic led to increased health coverage overall; however, passage of the 2025 Federal Budget Reconciliation Bill (referred to as the One Big Beautiful Bill Act) along with other policy changes are expected to increase significantly the number of people who are uninsured over the next ten years.

What is the Landscape of Health Care Coverage in the United States?

Copy link to What is the Landscape of Health Care Coverage in the United States?

Health coverage in the U.S. is a complex patchwork of private and public insurance coverage options. In 2023, most residents had private insurance coverage, with nearly half covered by an employer-based plan. About 1 in 5 U.S. residents received coverage through the Medicaid program, the federal and state-financed comprehensive health coverage program for low-income people. Another roughly 15% of the population had health coverage from the federal Medicare program, which covers seniors and people under age 65 with long-term disabilities. About 6% of the population had private non-group insurance either purchased through the ACA Marketplace or off-market, and just over 1% of the population was covered through the military’s TRICARE or VA health care programs. The uninsured rate for the total population was 7.9% for the year (Figure 1). (In some cases, people have multiple forms of coverage. For example, about 12 million people are enrolled in both Medicare and Medicaid and are classified in these figures as covered by Medicaid.)

Health Insurance Coverage of the Total Population, 2023

Trends in the Uninsured Rate

Copy link to Trends in the Uninsured Rate

In 2023, there were 25.3 million uninsured residents ages 0-64, and the uninsured rate among the population ages 0-64 was 9.5%, the lowest rate in U.S. history (Figure 2). The analysis of the uninsured population focuses on coverage among people ages 0-64 since Medicare offers near-universal coverage for seniors—just 457,000, or less than 1%, of people over age 65 were uninsured.

 Uninsured Rate of People Ages 0-64, 2010-2023

Prior to the implementation of the ACA, gaps in the public insurance system and lack of access to affordable private coverage left over 40 million people without health insurance. The ACA expanded Medicaid coverage to nearly all adults with incomes up to 138% of the federal poverty level (FPL) (the poverty level in the continental U.S. is $15,650 for a single individual in 2025) and created new health insurance Marketplaces through which individuals can purchase coverage with financial help to afford premiums and cost-sharing. Following the passage of the ACA in 2010 and the rollout of the coverage provisions, the number of uninsured people ages 0-64 dropped to 27 million in 2016. The ACA envisioned that all states would adopt the Medicaid expansion; however, a Supreme Court ruling in 2012 made expansion optional for states. As of early 2025, 40 states and Washington, D.C. had adopted the ACA’s Medicaid expansion (Figure 3).

Status of State Action on the Medicaid Expansion Decision

The declines in uninsured rates following implementation of the ACA coverage expansions were largest among poor and near-poor individuals, particularly adults. People of color, who had higher uninsured rates than White people prior to 2014, had larger coverage gains from 2013 to 2016 than White people, although the coverage disparities were not eliminated.

Before implementation of the ACA, expansions of Medicaid coverage and the enactment of the Children’s Health Insurance Program (CHIP) helped to lower the uninsured rate for children. Changes in the 1980s and early 1990s expanded Medicaid eligibility levels for children and pregnant people, and the establishment of CHIP in 1997 provided coverage for children with incomes above Medicaid thresholds. When states implemented CHIP, extensive outreach efforts along with the adoption of streamlined processes facilitated enrollment of children in Medicaid and CHIP and reduced the number of uninsured children.

After declining through 2016, the number of uninsured people and the uninsured rate began increasing in 2017 and continued to grow through 2019. Generally favorable economic conditions as well as policy changes during the Trump Administration, such as reduced funding for outreach and enrollment assistance, encouraging periodic Medicaid eligibility checks, changes to immigration policy related to public charge rules, and approval of some demonstration waivers to restrict enrollment led to a decline in Medicaid enrollment, which likely contributed to the increase in uninsured people.  

With the arrival of the COVID-19 pandemic, policies adopted to protect coverage drove a decline in the uninsured population from 2019 to 2023. The Families First Coronavirus Response Act required states to keep people continuously enrolled in Medicaid in exchange for enhanced federal funding. Medicaid continuous enrollment ended in March 2023, and most states completed renewals for individuals who enrolled during continuous enrollment by December 2024. In addition, the American Rescue Plan Act (ARPA) provided temporary enhanced ACA Marketplace subsidies to make Marketplace coverage more affordable, and these subsidies were renewed for another three years in the Inflation Reduction Act of 2022. These enhanced subsidies will expire at the end of December 2025 unless Congress acts to extend them.

Who is Uninsured in the United States?

Copy link to Who is Uninsured in the United States?

Most people who are uninsured are adults under age 65, are in working low-income families, are people of color, and, reflecting geographic variation in income, immigration status, and the availability of public coverage, live in the South or West. In 2023, over 8 in 10 people ages 0-64 who were uninsured were adults and 16% were children.

Nearly three-quarters (73.7%) of the uninsured population ages 0-64 had at least one full-time worker in their family and an additional 11.2% had a part-time worker in their family (Figure 4). More than 8 in 10 (80.9%) people ages 0-64 who were uninsured were in families with incomes below 400% FPL in 2023 and nearly half (46.7%) had incomes below 200% FPL. People of color comprised 62.9% of the uninsured population ages 0-64 in 2023 despite making up about 46% of residents ages 0-64. Most uninsured individuals (74.2%) were U.S. citizens, while 25.8% were noncitizens in 2023. Nearly three-quarters lived in the South and West.

Family Work Status of Uninsured People Ages 0-64, 2023

Adults ages 19 to 64 are more likely to be uninsured than children. The uninsured rate among children (5.3%) was less than half the rate among adults ages 19-64 (11.1%) in 2023, largely due to the broader availability of Medicaid and CHIP coverage for children than for adults. Among adults ages 19-64, men had higher uninsured rates than women in 2023 (12.6% vs. 9.5%).

Reflecting persistent disparities in coverage, people of color are generally more likely to be uninsured than White people. In 2023, American Indian and Alaskan Native (AIAN) and Hispanic people ages 0-64 had the highest uninsured rates at 18.7% and 17.9%, respectively, which were nearly three times higher than the uninsured rate for White people (6.5%). Uninsured rates for Native Hawaiian or Pacific Islander (NHPI) (12.8%) and Black people (9.7%) ages 0-64 were also higher than the rate for their White counterparts (Figure 5). These differences in uninsured rates are driven by lower rates of private coverage among these groups. Medicaid coverage helps to narrow these differences but does not fully offset them.

Uninsured Rates among the Population Ages 0-64 by Selected Characteristics, 2023

Noncitizens are more likely than citizens to be uninsured. Nearly one-third of noncitizen immigrants were uninsured in 2023 while the uninsured rate for U.S.-born citizens was 7.5% and 8.9% for naturalized citizens. One in 4 children has an immigrant parent, including over 1 in 10 (12%) who are citizen children with at least one noncitizen parent.

Uninsured rates vary by state and by region and were generally higher in states that had not taken up the ACA Medicaid expansion in 2023 (Figure 6). Economic conditions, availability of employer-sponsored coverage, and demographics are other factors contributing to variation in uninsured rates across states.

Uninsured Rates Among Population Ages 0-64 by State, 2023

Why are People Uninsured?

Copy link to Why are People Uninsured?

The fragmented U.S. health coverage system leads to gaps in coverage. While employer-based insurance is the prevalent source of coverage for the population ages 0-64, not all workers are offered coverage by their employer or, if offered, can afford their share of the premiums. Medicaid covers many low-income individuals, especially children, but eligibility for adults remains limited in most states that have not adopted the ACA Medicaid expansion. While subsidies for Marketplace coverage are available for many low and moderate-income people, few people can afford to purchase private coverage without financial assistance.

The cost of health coverage and care poses a challenge for the country broadly and is a significant barrier to coverage for people who are uninsured. In 2023, 63.2% of uninsured adults ages 18-64 said they were uninsured because coverage is not affordable, making it the most common reason cited for being uninsured (Figure 7). Other reasons included not being eligible for coverage (27.0%), not needing or wanting coverage (26.6%), and signing up being too difficult (23.9%).

Reasons for Being Uninsured Among Uninsured Adults Ages 18-64, 2023

Not all workers have access to coverage through their jobs. In 2023, 64.7% of uninsured workers worked for an employer that did not offer them health benefits. Among uninsured workers who are offered coverage by their employers, cost is often a barrier to taking up the offer. Low-income families with employer-based coverage spend a significantly higher share of their income toward premiums and out-of-pocket medical expenses compared to those with income above 200% FPL.

A decade after the implementation of the ACA coverage options, 10 states have not adopted the Medicaid expansion, leaving 1.4 million uninsured people without an affordable coverage option. A coverage gap exists in states that have not adopted the expansion for poor adults who earn too much to qualify for Medicaid coverage but not enough to be eligible for subsidies in the Marketplace.

Lawfully-present immigrants generally must meet a five-year waiting period after receiving qualified immigration status before they can qualify for Medicaid. States have the option to cover eligible children and pregnant people without a waiting period, and as of January 2025, 38 states have elected the option for children, and 32 states have taken up the option for lawfully-present pregnant individuals. Under current law, lawfully-present immigrants are eligible for Marketplace tax credits, including those who are not eligible for Medicaid because they have not met the five-year waiting period. Undocumented immigrants are ineligible for federally-funded coverage, including Medicaid and Marketplace coverage, although some states provide fully state-funded health coverage to these individuals.

Health care provisions in the 2025 reconciliation package narrow eligibility for federally-subsidized health coverage, including Medicaid and CHIP, Medicare, and Marketplace subsidies, to a limited group of lawfully-present immigrants. These changes take effect on January 1, 2027 and are expected to increase the number of lawfully residing immigrants without health coverage.

Though financial assistance is available to many of the remaining uninsured under the ACA, not everyone who is uninsured is eligible for free or subsidized coverage. Nearly 6 in 10 (14.5 million) uninsured individuals in 2023 were eligible for financial assistance through Medicaid or subsidized Marketplace coverage (Figure 8). However, over 4 in 10 uninsured (10.9 million) were outside the reach of the ACA because their state did not expand Medicaid, their immigration status made them ineligible, or they were deemed to have access to an affordable Marketplace plan or offer of employer coverage (Figure 8).

Eligibility for Coverage Among Uninsured Population Ages 0-64, 2023

What are the Consequences of Being Uninsured?

Copy link to What are the Consequences of Being Uninsured?

Lacking health insurance in the United States can impact a person’s access to health care, their financial situation, and their health status. It can also broadly impact a community’s public health (illustrated by the COVID-19 pandemic) and the economy through lower productivity.

Adults who are uninsured are almost five times more likely than adults with insurance to report not having a usual source of care, which is often a key entry point for accessing health care whether for preventive services or for treating existing conditions. Consequently, in 2023, nearly half (46.6%) of uninsured adults ages 18-64 reported not seeing a doctor or health care professional in the past 12 months compared to 15.6% with private insurance and 14.2% with public coverage (Figure 9). Uninsured individuals are also more likely to face cost barriers to accessing needed care. In 2023, uninsured adults were nearly three times more likely to report not getting medical care due to cost compared to publicly insured adults and four times more likely than privately insured adults (22.6% vs 7.7% and 5.1%, respectively).

Barriers to Health Care Among Adults Ages 18-64 by Insurance Status, 2023 

The lack of access to health care and a delay in seeking care due to costs mean uninsured people are more likely to be hospitalized for avoidable health problems and to experience declines in their overall health. Research also shows that when they are hospitalized, uninsured people receive fewer diagnostic and therapeutic services and have higher mortality rates than those with insurance.

Uninsured individuals often face unaffordable medical bills when they do seek care, which can lead to medical debt and other forms of financial instability. Nearly half of uninsured adults reported difficulty paying for health care, compared to 21% of insured adults and over 8 in 10 (84%) uninsured adults said they worried that health care costs would put them in debt or increase their existing debt, compared to 71% of adults with insurance (Figure 10). Uninsured adults are also more likely to face negative consequences due to health care debt, such as using up savings, having difficulty paying other living expenses, or borrowing money.

Problems Paying for Health Care  and Worries About Health Care Debt by Insurance Status

Future Outlook

Copy link to Future Outlook

Driven by pandemic-era policies to promote health coverage, the number of people without insurance and the uninsured rate dropped to historic lows in recent years. Although millions of people lost Medicaid coverage during the unwinding of continuous enrollment, Medicaid enrollment remains higher than in February 2020, before the start of the pandemic. Enhanced Marketplace subsidies adopted during the pandemic led to record Marketplace signups, with enrollment topping 25 million in 2025. States have also taken action to reduce the number of people who are uninsured. In 2023, two states, North Carolina and South Dakota, newly adopted the Medicaid expansion, and several states have expanded state-funded coverage for certain individuals regardless of immigration status.

However, actions by Congress and the Trump Administration threaten to reverse these recent coverage gains. Congress passed the 2025 Federal Budget Reconciliation package on July 3, 2025, which makes significant changes to Medicaid and ACA Marketplaces, and President Trump signed the reconciliation package into law on July 4, 2025.  The Congressional Budget Office (CBO) estimates that the law will increase the number of people without health insurance by 10 million. The expiration of the enhanced premium tax credits for Marketplace enrollees, which will happen at the end of 2025 unless Congress takes action to extend them, will further increase the number of people without health insurance. CBO projects that over 14 million more people will be uninsured in 2034 due to the combined effects of the reconciliation package and the expiration of the enhanced Marketplace subsidies. In addition to these potential coverage losses, the Trump administration’s increased immigration enforcement activities are likely to have a broad chilling effect that could cause immigrants to decide to disenroll or not enroll themselves or their children, most of whom are U.S. citizens, in health coverage programs even if they are eligible due to immigration-related fears.

Enactment of the ACA helped close some gaps in our fragmented health coverage system and led to a significant decline in the number of people who were uninsured. Recent efforts built on that success to further shrink the share of people without insurance. Yet, despite this success and the ACA’s continued favorability—the public has a favorable view of the ACA by a 2 to 1 margin—policymakers enacted cuts to federal support for Medicaid and ACA coverage to fund other budget priorities. The impact on health coverage and people’s ability to access needed health care services will be significant.

Resources

Copy link to Resources

Citation

Copy link to Citation

Tolbert, Jennifer, Bell, Clea, Cervantes, Sammy & Singh, Rakesh, The Uninsured Population and Health Coverage. In Altman, Drew (Editor), Health Policy 101, (KFF, October 2025) https://www.kff.org/health-policy-101-the-uninsured-population-and-health-coverage/ (date accessed).

Employer-Sponsored Health Insurance 101

Table of Contents

Introduction

Copy link to Introduction

Employer-sponsored health insurance (ESI) is the largest source of health coverage for non-elderly U.S. residents. Unlike many other nations, the U.S. relies on voluntary, private health insurance as the primary source of coverage for residents who are not elderly, poor or disabled. Providing health insurance through workplaces is an efficient way of offering coverage options to working families, and the tax benefits of employer-based coverage further enhance its attractiveness. Yet, ESI often results in uneven coverage, especially for those with low wages or those working at smaller firms. Overall, 60% of people under age 65, or about 164.7 million people, had employment-sponsored health insurance in 2023. The level of coverage varies significantly with income and other factors, even among working families.

Editorial Note: The estimate for the number of people with employer-sponsored health insurance includes all people under age 65, regardless of whether they report multiple types of coverage. A KFF analysis of the American Community Survey (ACS) found that 154 million people under age 65 are covered by employer-sponsored health insurance in the United States. To produce this estimate, coverage is assigned using a hierarchy, so each person reporting more than one type of insurance is counted under a single category.

What Is Employer-Sponsored Health Insurance?

Copy link to What Is Employer-Sponsored Health Insurance?

There are several ways people get private health insurance. One is by purchasing coverage directly from an insurer, often with the help of an insurance agent or through an online platform such as Healthcare.gov. Income-based premium assistance is available under the Affordable Care Act (ACA). This is called individual or non-group health insurance. The second is coverage under a policy or plan offered by a sponsoring group, such as an employer, union or trade association. This is called group health insurance. When an individual is sponsored specifically by an employer (or sometimes jointly by one or more employers and a union or by a group of employers), it is often referred to as employer-sponsored health insurance, or ESI.

The word “insurance” is something of a misnomer here. An employer providing health benefits for workers and their families (“plan enrollees”) can fund them in one of two ways. Employers may purchase a health insurance policy from a state-licensed health insurer, which is referred to as an insured plan. Alternatively, the employer can pay for health care for the plan enrollees directly with its own assets, referred to as a self-funded plan. Employers with self-funded plans often protect themselves from unexpected high claim amounts or volume by purchasing a type of insurance referred to as stop-loss coverage. As discussed below, most ESI plan enrollees are covered by large employers, and most large employers self-fund their health benefit plans.

Another confusing set of phrases used in conjunction with health insurance, including ESI, is “health plan” or just “plan”. The terms can refer to an entity offering coverage (e.g., Aetna) or a particular coverage option offered by an insurer or employer (e.g., the PPO plan option). However, the terms “employee benefit plan” and “plan” have specific meanings in federal law, and invoke several legal obligations for employers when they offer certain benefits to their workers and their family members. Under the Employee Retirement Income Security Act, or ERISA, an employee benefit plan, or plan, is created when a private employer creates a plan, fund or program to provide certain benefits, including health benefits, to employees. ERISA creates a structure of disclosure, enforcement and fair dealing regarding the promises made by employers to enrollees in employee benefit plans. However, ERISA does not apply to the health benefit plans created by public plans or churches, although the word plan is often still used to describe benefits offered in these settings.

ESI plans can be differentiated across several dimensions.

Comprehensive or limited benefits

Employers offer different types of health benefit options to employees. These include comprehensive benefit plans, which cover a large share of the cost of hospital, physician and prescription costs that a family might incur during a year; service-specific benefits, such as dental or vision care plans; and supplemental benefit plans, which may provide a limited additional benefit to enrollees if certain circumstances occur (e.g. $100 per day if hospitalized). The discussion here will be limited to comprehensive benefit plans.

Open or closed provider networks

Health plans contract with hospitals, physicians, pharmacies and other types of health providers to provide plan enrollees with access to medical care at a predetermined cost. Plan enrollees receiving services from one of these providers know that their financial liability is limited by their deductible and other cost sharing amounts specified in their benefit plan. A closed-network plan is one where, absent special circumstances, an enrollee is only covered if they receive care from a provider in their plan’s network of contracted providers. In an open-network plan, an enrollee still has some coverage if they receive care from a provider not in the plan network, although they will likely face higher cost sharing under their benefit plan, and the provider may ask them to pay an additional amount (known as balance billing). Health maintenance organization (HMO) and exclusive provider organization (EPO) plans are two types of closed network plans. Preferred provider organization (PPO) and point of service (POS) plans are two types of open network plans.

Small and large group markets

Federal and state laws divide ESI into the small group and the large group market, based on the number of full-time equivalent employees (FTEs) working for the employer sponsoring the plan. Federal regulation states that employers with fewer than 50 FTEs are often in the small group market and employers with at least 50 FTEs are in the large group market. However, states have the option to raise the small group market limit to fewer than 100 FTEs. The regulatory requirements for the small and large group markets differ somewhat. Generally, the small group insured market is subject to more extensive rules about benefits and ratings. Large employers are potentially subject to financial penalty under the ACA if they do not offer health insurance coverage meeting certain requirements to their full-time employees.

Are Employers Required to Offer Health Benefits?

Copy link to Are Employers Required to Offer Health Benefits?

The drafters of the ACA intended to provide coverage options to those without access to employer-sponsored coverage without encouraging employers to drop coverage. To achieve this balance, the ACA requires that employers with at least 50 FTEs offer health benefits which meet minimum standards for value and affordability or pay a penalty. The so-called ‘employer mandate’ constitutes two separate penalties.

First, employers are taxed if they do not offer minimum essential coverage to 95% of their full-time employees and their dependent children. This generally requires that employers offer major-medical coverage and not a limited benefit plan. Employers face this penalty when at least one of their employees receives an advance premium tax credit (APTC) to purchase coverage on the health insurance exchange markets or Marketplaces. In 2024, this penalty stipulates that employers will be assessed a tax of $2,900 for each full-time employee after their first 30 employees.

Secondly, employers are penalized if the coverage they offer is not affordable or does not provide minimum value. Plans are considered to meet the minimum value standard if they cover 60% of the health spending of a typical population. In 2025, coverage was deemed to be affordable if the employee premium contribution is less than or equal to 9.02% of their household income. Employers may be charged $4,350 for each employee enrolling in subsidized Marketplace coverage.

Defining what constitutes ‘affordable’ has been the focus of considerable attention in recent years. The Obama Administration initially issued rules that workers and their dependents would be considered to have an affordable offer if self-only coverage met the affordability test. With many employers requiring much larger premium contributions to enroll dependents, this meant that as many as 5.1 million people were in households where they had to pay a larger share of their income to enroll in the plan offered by their employers without being eligible for premium tax credits. Recent rules have addressed the so-called “family glitch”, by considering the cost of family coverage when assessing affordability. While most large employers offer health benefits, many may encourage spouses and other dependents to enroll in other plans if possible. For more information on eligibility for premium credits see the Affordable Care Act chapter.

Why Is Employer-Sponsored Health Insurance So Dominant?

Copy link to Why Is Employer-Sponsored Health Insurance So Dominant?

ESI is by far the most common source of private health insurance. There are two primary reasons for this. The first is that providing health insurance through the workplace is efficient, with advantages relating both to risk management and to the costs of administration. The second is that contributions towards premiums by employers and (in most cases) by employees are not subject to income or payroll taxes, providing a substantial federal and state subsidy towards the costs of ESI.

ESI Efficiencies

When people have choices about whether to buy insurance and the amount of coverage to buy, it is natural that people with the highest need for coverage (e.g., people in poorer health) will be more likely to purchase and be more willing to pay higher prices. This is called adverse selection. If insurers do not address these tendencies, their risk pools will become dominated by a relatively small share of people with the highest needs, and premiums will increase to levels that only make sense for those with very high expected costs.

There are several ways insurers seek to manage the risk profile of potential enrollees to avoid adverse selection. One is by examining the health profile of each applicant, which typically includes the applicant’s health history and pre-existing conditions. This strategy is reasonably effective, but an expensive and time-consuming process. A much lower-cost approach is to provide coverage to groups of people who are grouped together for reasons other than their health or their need for health insurance. Providing coverage through the workplace is a common way of doing this. Mostly, people choose a job because of the work, not because they need health insurance. Therefore, providing coverage through workplaces provides insurers with a fairly normal mix of healthy and less healthy enrollees if certain conditions are met. These conditions include enrolling a large share of the eligible workers in coverage (typically achieved by the employer paying a large share of the cost) and limiting the range of coverage options (to avoid adverse selection among plan types). Further, as the number of employees grows, the ability to predict future costs based on prior experience also increases, reducing the uncertainty in setting premiums for the group. As uncertainty decreases, insurers can reduce what they charge for insuring the group. Overall, the same scenario generally applies to situations where employers choose to offer a self-funded plan. Therefore, these advantages occur regardless of whether an insurer or an employer is taking on the risk.

In addition to the risk management advantages, ESI has many administrative advantages. Providing coverage through a workplace adds many employees to a risk pool through a single transaction, with no need to examine their health in most cases. Employers also provide and collect enrollment information to workers and collect the employee share of premiums, dramatically reducing the number of transactions and reducing the amount of unpaid premiums that typically occur when individuals purchase insurance directly from insurers.

Tax Advantages

Federal and state tax systems provide significant tax preferences for ESI. Generally, wages and other things of value employers provide as compensation to their workers are subject to federal and state taxes. The federal government taxes wages and other forms of income through a series of marginal rates that vary with income and the marital and filing status of the taxpayer. For example, the lowest marginal rate in 2024 for a single taxpayer was 10% for income below $11,601 and the highest rate was 37% for income above $609,350. Additionally, wages are subject to federal payroll taxes to support the Social Security and Medicare programs; employers and employees are each assessed 6.2% of wages up to a maximum wage for Social Security and 1.45% of wages with no wage limit for Medicare. Wages are also subject to state income and payroll taxes for unemployment which vary considerably.

Unlike wages, ESI provided by employers as part of their compensation to employees is not considered income under the federal income tax code, nor are they considered wages subject to federal payroll taxes (See 26 USC sections 105 and 106). Federal law also permits employers to establish programs that exclude employee contributions towards ESI from these taxes. These exclusions lower the cost of health insurance for employees. For example, just considering the federal tax advantages, if an employee earns annual wages of $100,000, an employer can provide the employee with a $20,000 family policy for an additional $20,000 in compensation. However, if ESI were subject to federal taxes, that same employee would need to earn an additional $27,460 in wages to be able to buy a $20,000 family policy with after-tax dollars, assuming a 22% marginal federal income tax rate and a combined 15.3% payroll tax for Social Security and Medicare. Looked at another way, for this employee, for every dollar that the employer raises the employee’s compensation, the employee can get a dollar of health benefits or just under 63 cents in wages after taxes. State tax laws, which follow federal definitions of income and wages in this situation, further lower the cost of ESI for workers, although the impacts are much smaller.

The exclusion of ESI from federal income tax is a long-standing and somewhat controversial part of federal tax policy, first appearing due to a decision by the War Labor Board in 1942, which in turn allowed employers to use fringe benefits to attract workers during the war. In 1954, ESI exclusion was enacted in the tax code. This tax policy, combined with the risk management and administrative advantages of group coverage, contributed to the rapid growth and continued market dominance of commercial hospital and medical insurance during this period. Detractors of the tax exclusion have argued that it encourages workers to over-consume health insurance by demanding health benefits that are richer than what they would want under a tax-neutral approach (e.g., if health benefits were taxed in the same way as wages). Richer benefits, it is argued, contribute to higher health care costs because people with better insurance use more health care than they otherwise would, since they are not facing the actual costs of care (sometimes called moral hazard). Another criticism is that the income tax exclusion favors higher-paid employees because they have higher marginal tax rates: the effective income tax benefit for a dollar of ESI is only 10 cents for a worker with very low wages, but can be up to 37 cents for those with the highest wages.

In contrast, the exclusion of health benefits from payroll taxes has the same dollar benefit for workers at all wage levels (up to the Social Security earning limit), which results in a higher percentage exclusion (share of wages) for those with lower wages. The tax exclusion was estimated to cost the federal government $312 billion (about $940 per person in the US) in income and payroll taxes in 2022.

Who Is Covered by Employer-Sponsored Health Insurance?

Copy link to Who Is Covered by Employer-Sponsored Health Insurance?
Share of non-elderly people with employer-sponsored health insurance (ESI), overall and by poverty level, March 2023

As of March 2023, 60.4% of the non-elderly, or about 164.7 million people, had ESI. Of these, 84.2 million had ESI from their own job, 73.8 million were covered as a dependent by someone within their household, and 6.7 million were covered as a dependent by someone outside of their household.

A relatively small share of these people also held other coverage at that time: 3.2% were also covered by Medicaid or other public coverage and 0.6% were also covered by non-group coverage.

ESI coverage varies dramatically with income. In March 2023, more than 4 in 5 (84.2%) non-elderly adults with incomes at least 400% of the federal poverty level (FPL) had ESI, compared to 59.0% with incomes between 200% and 399% of the FPL and 23.9% with incomes below 200% of the FPL.

ESI also varies with age, as well as other worker characteristics. Among non-elderly people in March of 2023, people in younger age groups were less likely than those in older age groups to have ESI, and U.S. citizens were much more likely than non-citizens to have ESI. ESI coverage also varied across race and ethnic categories: compared to non-Hispanic White people, Hispanic people and non-Hispanic people who are Black, American Indian or Alaskan Native, or of mixed race were less likely to have ESI.

Share of non-elderly people with employer-sponsored health insurance (ESI), By select characteristics, March 2023

How Many Workers Have Access to Employer-Sponsored Health Insurance at Their Job?

Copy link to How Many Workers Have Access to Employer-Sponsored Health Insurance at Their Job?

For people in working families to have ESI, one or more workers must work for an employer that makes coverage available to them. For workers to access ESI, they need to work for an employer that offers ESI and be eligible to enroll in coverage offered at their job. About four in five (80.8%) adult non-elderly workers worked for an employer that offered ESI to at least some employees as of March 2023. Most (93.1%) of these workers were eligible for the ESI offered at their job. Overall, in 2023, about 3 in 4 of all workers were eligible to enroll in the ESI offered at their job.

Among workers ages 18-64 years, share working for an  offering employer and share eligible for employer-sponsored health insurance (ESI) at job, overall and by poverty level, March 2023

Both the share of workers working for employers offering coverage and the share of workers eligible for coverage at their jobs vary significantly by income. Among adult non-elderly workers, the share working for an employer offering ESI ranged from 60.6% for workers with incomes under 200% of the FPL to 88.2% for workers with incomes at least 400% of the FPL. Similarly, the share eligible for coverage ranged from 49.5% for workers with incomes under 200% of the FPL to 84.6% for workers with incomes of at least 400% of the FPL.

Working for an offering employer and being eligible for the offered coverage are dependent on a combination of characteristics. As of March 2023, non-elderly workers working in construction, service, sales, and farm, fishing and forestry-related occupations were less likely to be working for an employer offering ESI and to be eligible for ESI at their jobs. Full-time workers were much more likely to be working for an employer offering ESI and to qualify for coverage at their job. There also was significant variation in offer rates and eligibility within sex, age group, race and ethnicity, and citizenship.

Among workers ages 18-64 years, share working for an offering employer and share eligible for employer-sponsored health insurance (ESI) at job, By occupation and full-time/part-time status, March 2023

How Many Workers Take Employer-Sponsored Health Insurance Available at Their Job?

Copy link to How Many Workers Take Employer-Sponsored Health Insurance Available at Their Job?
Among workers ages 18-64 years eligible for employer-sponsored health insurance (ESI) at work, share covered from own job or other sources, March 2023

Among non-elderly adult workers eligible for ESI at their jobs in March 2023, 74.4% were ESI policyholders. Of those who did not have ESI from their own job, 14.6% were covered by ESI as a dependent, 4.6% had Medicaid or other public coverage, 2.0% had non-group coverage, 1.1% had some other coverage, and 3.7% were uninsured. A small share of workers with ESI from their job also had other coverage at the same time: 2.4% also had Medicaid or other public coverage and 0.6% also had non-group coverage.

What Share of Employers Offer Health Benefits to Their Workers?

Copy link to What Share of Employers Offer Health Benefits to Their Workers?
Percentage of Firms Offering Health Benefits, by Firm Size, 1999-2024

Among firms with three or more workers, just over half (54%) offered health benefits to at least some of their workers in 2024. Firm offer rates differed significantly with firm size. Only 46% of firms with three to nine workers offered health benefits while virtually all (98%) firms with at least 200 employees did so. While a large majority of firms are small, 84% of firms with three or more employees have fewer than 25 employees, and these firms employ just 16% of workers. Sixty-four percent of workers work for firms with 200 or more employees, where the employer offer rate is almost 100%.

Among firms offering health benefits, 25% of firms with fewer than 200 workers and 26% of larger firms offered health benefits to part-time workers in 2024.

Eighty-nine percent of firms offering health benefits offered them to dependents (e.g., spouses and children) of their workers in 2024.

What Are the Premiums for Employer-Sponsored Health Insurance?

Copy link to What Are the Premiums for Employer-Sponsored Health Insurance?
Average Annual Worker and Employer Premium Contributions for Family Coverage, 2014, 2019 and 2024

Employer health insurance premiums are the total of what employers and employees pay to providers for health coverage through employment. Generally, premiums are the estimated cost of health spending for the covered population, as well as the administrative costs and fees associated with the plan. Therefore premiums usually increase when a covered population either uses more health services or the prices for health care increase. In 2024, the average total premiums for covered workers were $8,951 for single coverage and $25,572 for family coverage (for a family of four). Employer contributions to an employee’s health insurance premium are a sizeable share of an employee’s overall compensation (6.9% for private industry as of June 2023).

Premiums varied around these averages due to factors such as the age and the health of the workforce, the cost of the providers included in the network, and the generosity of the coverage. In 2024, 16% of covered workers worked at a firm with an average annual premium of at least $31,500 for family coverage. The robustness of plan offerings varies across firms, with some employers offering generous benefits to attract new employees, while others prioritize more affordable plan options. Some employers sponsor limited-benefit plans, which may cover a limited number of services but have lower costs. The average family premium for covered workers at firms with a relatively large share of lower-wage workers (firms where at least 35% of the workers earn $31,000 annually or less) is lower than at firms with fewer lower-wage workers. On the other hand, the average premiums for single and family coverage are relatively higher in the Northeast and in private not-for-profit firms. There is additional discussion of how premiums vary with firm characteristics here.

During the late 1990s and early 2000s, health insurance premiums grew at a rate considerably faster than inflation and workers’ wages. Recently, the rate of growth has moderated. For example, over the last five years, family premiums have grown 24%, roughly comparable to the rate of inflation (23%) and the change in wages (28%). When faced with higher premium costs employers can adjust their plan offerings, increase cost sharing, drop high-cost providers, or change how benefits are covered in other ways.

How Much Do Workers Contribute Towards the Premiums for Employer-Sponsored Health Insurance?

Copy link to How Much Do Workers Contribute Towards the Premiums for Employer-Sponsored Health Insurance?

Workers contribute to health insurance in two ways. First, through a premium contribution, which is typically deducted from an employee’s paycheck. Then, secondly, through cost-sharing such as copays, coinsurance, and/or deductibles, which are paid when the employee utilizes services covered by their plan. While all workers enrolled in the plan must pay their premium (or have it paid by the employer), overall cost sharing is higher for workers who use more services.

Workers with health coverage in 2024, on average, were responsible for 16% of the premium for single coverage and 25% of the premium for family coverage. In dollar terms, the average annual contribution for covered workers was $1,368 for single coverage and $6,296 for family coverage.

Over time, the average premium contribution for covered workers has increased. For example, over the last 10 years, the single coverage average contribution has increased 27% and the family coverage average contribution increased 31%. At the same time, the share of the premium paid by workers has remained relatively consistent. In 2024, covered workers contributed, on average, 16% of the premium for single coverage and 25% of the premium for family coverage, which was similar to these averages a decade ago. This is because as premiums have increased over time, both employers and employees have faced similar increases on average.

There remains a lot of variation in how much workers are required to contribute to their health plan across firms, particularly within firm size. In 2024, 37% of covered workers at small firms were enrolled in a plan where the employer paid the entire premium for single coverage. This was only the case for 5% of covered workers at large firms. However, 26% of covered workers at small firms were in a plan where they must contribute more than half of the premium for family coverage, compared to 6% of covered workers at large firms. The family average contribution rate for covered workers in firms with fewer than 200 employees was 33%, which is higher than the average contribution rate of 23% for covered workers in larger firms. Small firms often approach the cost of health insurance differently than large firms, sometimes making the same employer contribution regardless of whether the employee enrolls any dependents. Similarly, some large employers encourage spouses and dependents to enroll in other plans, if they have access, through spousal surcharges.

Distribution of Percentage of Premium Paid by Covered Workers for Single and Family Coverage, by Firm Size, 2024

In addition to any required premium contributions, most covered workers must pay a share of the cost of the medical services they use. The most common forms of cost-sharing are deductibles (an amount that must be paid before most services are covered by the plan), copayments (fixed dollar amounts), and coinsurance (a percentage of the charge for services). Some plans combine cost sharing forms, such as requiring coinsurance for a service up to a maximum amount or requiring either coinsurance or a copayment for a service, whichever is higher. The type and level of cost sharing may vary with the kind of plan in which the worker is enrolled. Cost sharing may also vary by the type of service, with separate classifications for office visits, hospitalizations, and prescription drugs. Plans often structure their cost sharing to encourage enrollees to reflect on their use, reducing overall utilization.

Among Covered Workers Who Face a Deductible for Single Coverage, Average General Annual Deductible for Single Coverage, by Firm Size, 2006-2024

In recent years, general annual deductibles have grown in prominence in plan design. In 2024, 87% percent of covered workers were enrolled in a health plan that required an enrollee meet a deductible before the plan covered most services. The average deductible amount as of 2024 for workers with single coverage and a general annual deductible was $1,787. On average, covered workers at smaller firms face higher deductibles than those at large firms ($2,434 vs. $1,478). Generally, a substantial share of workers faced relatively high deductibles. Fifty percent of workers at small firms and 26% of workers at large firms had a general annual deductible of $2,000 or more. Over the last five years, the percentage of covered workers with a general annual deductible of $2,000 or more for single coverage has grown from 28% to 32%.

While average deductibles have not grown over the last few years, the growth over the last ten years outpaces the increases in premiums, wages and inflation. The rise in deductible costs has focused attention on consumerism in health care. Some believe that increasing deductibles will place a greater incentive on enrollees to shop for services, therefore reducing total plan spending. Alternatively, deductibles are less common in Health Maintenance Organization (HMO) plans, which use forms of gatekeeping to dissuade utilization. The growth of deductibles has had important consequences for the financial protection that health insurance provides. A multitude of plans require deductibles well in excess of the financial assets of many of their enrollees. As opposed to coinsurances and copays that accumulate throughout the year, deductible spending may require enrollees to finance relatively high expenses all at once.

Cumulative Increases in Family Coverage Premiums, General Annual Deductibles, Inflation, and Workers' Earnings, 2014-2024

In addition to looking at the average obligations enrollees face under their health plan, we can look at the actual spending incurred by enrollees in large group plans. In 2021, deductibles accounted for more than 58% of an enrollee’s cost-sharing liability, which is significantly greater than 35% of enrollee liability ten years ago.

The amount of cost sharing large group enrollees face varies, particularly around how many health services a person uses. Individuals who have a hospitalization, or a chronic condition which requires ongoing management, often incur higher cost-sharing over the year. For example, large group enrollees faced an average of $779 in cost sharing, but individuals with a diabetes diagnosis (even without complications) incurred costs of $1,585 in 2017.

Distribution of out-of-pocket spending for people with large employer coverage, 2003-2021

While some employer health plans have relatively generous benefits, there remains a concern about affordability, particularly for lower-wage workers who do not have the assets to meet the cost-sharing required under their plan, as well as for individuals enrolling in family coverage at smaller firms. Overall, individuals in families with employer coverage spend 2.4% of their income on the worker contribution required to enroll in an employer-sponsored health plan, and another 1.4% of their income on typical out-of-pocket spending on cost-sharing. Individuals covered by employer-sponsored plans in households at or below 199% of the FPL contribute nearly 10% of their income on average towards their premiums and cost-sharing.

A key component of plan design is the out-of-pocket maximum, which caps the amount of money an enrollee spends on in-network covered benefits within a year.

The ACA requires that almost all plans have an out-of-pocket (OOP) maximum below a federally determined limit. In 2024, 14% of covered workers in plans with an OOP maximum had an OOP maximum of less than $2,000 for single coverage, while 24% of these workers had an OOP maximum above $6,000.

What Types of Employer-Sponsored Health Insurance Plans Do Workers Have?

Copy link to What Types of Employer-Sponsored Health Insurance Plans Do Workers Have?

Today virtually all plans have preferential cost sharing for enrollees to visit providers participating in a preferred provider network. Some plans require enrollees to visit a primary care physician or other gatekeeper before they are referred to a specialist. Plans are often categorized based on these characteristics. 

Preferred Provider Organization (PPO)

PPO plans are the most common plan type. These plans typically have broader provider networks and do not require gatekeeping for specialist services. However, insurers may still use utilization management tools, such as prior authorization, to determine appropriate use and which services will be paid for under the plan. Point-of-service (POS) plans have a provider network like a PPO plan but require gatekeeping for referrals. POS plans are more common in the Northeast and among smaller firms. 

Health Maintenance Organization (HMO)

HMO plans represented 13% of covered workers in 2024. HMO enrollment has decreased over the past few decades, compared to nearly 3 in 10 workers who were enrolled in HMOs in the late 1990s. HMOs do not cover non-emergency out-of-network services, and some integrate health care financing and service delivery. Since providers in these plans are not paid on a fee-for-service basis, they are designed to encourage lower utilization to reduce costs.

High Deductible Health Plan with a Savings Option (HDHP-SO)

HDHP-SO is a relatively new plan type. This plan pairs a high deductible with either a Health Reimbursement Arrangement (HRA) or Health Savings Account (HSA). HSA-qualified plans were first authorized in the Medicare Modernization Act of 2003 and grew precipitously until 2015. HDHP-SO plans now represent almost 3 in 10 covered workers, including almost a quarter enrolled in an HSA-qualified plan. These plans may be an HMO, PPO, or POS, meeting specified federal guidelines. HSA-qualified plans allow both employers and enrollees to contribute to a tax-preferred savings account, which enrollees can use to meet their cost-sharing requirements or save for future health spending. On average, HSA-qualified health plans have higher deductibles than other plan types and lower premiums. The growing enrollment in HSA-qualified plans has led to a growth in general annual deductibles overall. While having a higher deductible in other plan types generally increases enrollee out-of-pocket liability, this is not necessarily true for HDHP-SO plans. Many HDHP-SO enrollees receive an account contribution from their employers, reducing the higher cost-sharing in these plans. In 2024, 68% of employers offering single coverage and 77% of employers offering family coverage, as well as an HSA-qualified health plan, contributed to the enrollee’s account. On average, employers contributed $705 to single coverage HSA-qualified HDHPs and $1,297 to family coverage HSA-qualified HDHPs. Some employers may make their account contribution contingent on other factors, such as completing wellness programs

Distribution of Health Plan Enrollment for Covered Workers, by Plan Type, 1988-2024
Average Annual Premiums and Contributions for Covered Workers in HDHP/SOs and Non-HDHP/SOs, for Family Coverage, 2024

What Types of Network Strategies Do Employer-Sponsored Health Insurance Plans Use?

Copy link to What Types of Network Strategies Do Employer-Sponsored Health Insurance Plans Use?

Employer plans typically include provider networks, in which enrollees face lower out-of-pocket expenses if they receive care from a designated provider. Firms and health plans structure their networks of providers to ensure access to care to encourage enrollees to use providers who are lower cost or who provide better care. Employees generally prefer broad network plans, and job-based plans are typically broader than those offered on the Marketplaces. Even so, some employers offer a health plan with a relatively small network of providers. These narrow network plans limit the number of providers that can participate to reduce costs and are more restrictive than standard HMO networks. In 2024, 6% percent of firms offering health benefits reported that they offer at least one narrow network plan to their employees.

More frequently, firms use tiered or high-performance networks in which providers are selected and then grouped within the network based on the quality, cost, and/or efficiency of care they deliver. Enrollees then receive lower cost sharing by choosing a provider in a lower tier.

Another way plans designate preferred providers is through “Centers of Excellence”, which are facilities or providers that health plans and employers single out as suppliers of exceptionally high-value specialty care for specific conditions. Plans and employers may encourage or require enrollees to use these designated providers to receive coverage for certain types of care.

As major purchasers of health care, many view employers as having considerable leverage in health care markets based on their network design. This leverage is dampened by a combination of factors, including the prevalence of highly concentrated provider markets, employees’ preferences for broad network plans, and the challenges of building networks capable of delivering timely access.

One specific concern is the availability of mental health providers. In 2023, most firms (91%) reported that they believed their largest plan offered timely access to primary care providers. However, only 67% of firms believed there were enough mental health providers in their largest plan’s network to provide timely access to services. As plan costs continue to rise for employers, these networks may be further limited as high-cost providers are removed to mitigate costs.

Additional Strategies to Improve Health and Control Cost

Copy link to Additional Strategies to Improve Health and Control Cost

In addition to cost-sharing requirements and network design, many employers use other strategies to influence both the health of their workforce and the cost of their health plans.

One such strategy is utilization management, where insurers evaluate enrollees’ health care use. A common tool is prior authorization, where an insurer reviews the appropriateness of certain services or prescriptions before covering them. Plans may use prior authorization to limit the use of services they believe are often used inappropriately or to encourage lower-cost alternatives. In recent years, prior authorization has come under public scrutiny for delaying care and adding complexity for patients. Among large employers (those with 200 or more workers), 12% believe their employees have a high level of concern about the complexity of prior authorization requirements, and another 35% believe employees’ concern is moderate. In early 2025, many insurers pledged to voluntarily expedite their prior authorization processes and improve enrollee communication. How these changes will affect enrollees’ access to timely care remains to be seen, or if ultimately prior authorization becomes the target of new legislation.  While loosening restrictions could improve access, it may also lead to higher plan costs and premiums if more services are used.

Another approach is to promote population health, in order to improve the health and productivity of workers and their family members while also potentially reducing health care spending. Many employers try to achieve this through wellness programs, which may include initiatives such as exercise programs, health education classes, health coaching, and stress management counseling. Among large firms offering health benefits, 69% offer programs to help employees stop smoking or using tobacco, 62% offer programs to support weight loss, and 70% offer other forms of lifestyle or behavioral coaching. Overall, 79% of large firms offer at least one of these programs. Some wellness programs are tied to financial incentives or penalties, which can increase costs for enrollees who choose not to participate in wellness activities, decline health screenings, or, in some cases, fail to meet biometric targets.

Future Outlook

Copy link to Future Outlook

While ESI seems likely to remain the dominant source of health insurance for working families, employers and working families each face challenges relating to affordability and access to care. These include: 

Ultimately, health care is expensive, and the cost of good ESI coverage can place a strain on employers and employees, particularly for workers with lower wages. Additionally, only about half of workers with incomes below 200% of the FPL are even eligible for ESI at their workplace. Can ESI be a source of affordable coverage for all working families, or are novel approaches to providing affordable coverage options needed for these families? 

Many ESI policies have significant deductibles and other out-of-pocket costs to keep the premium costs down, while increasing the cost of obtaining care for enrollees. Can and will employers continue to increase out-of-pocket costs, and, if not, how will they control the costs of ESI going forward? 

What avenues are available to employers to increase access to care for people with mental health and substance use care needs? Is telehealth a sufficient response? 

Can employers and health plans develop provider networks that provide quality health care at lower costs? 

Resources

Copy link to Resources

Citation

Copy link to Citation

Claxton, G., Rae, M., & Winger, A., Employer-Sponsored Health Insurance 101. In Altman, Drew (Editor), Health Policy 101, (KFF, October, 2025) https://www.kff.org/health-policy-101-employer-sponsored-health-insurance/ (date accessed).

State and Federal Reproductive Rights and Abortion Litigation Tracker

Last updated on

The Supreme Court’s Dobbs ruling, overturning Roe v. Wade, returned the decision to restrict or protect abortion to states. In many states, abortion providers and advocates are challenging state abortion bans contending that the bans violate the state constitution or another state law. The state litigation tracker presents up-to-date information on the ongoing litigation challenging state abortion policy.

In addition, since the Dobbs decision, new questions have arisen regarding the intersection of federal and state authority when it impacts access to abortion and contraception. Litigation has been brought in federal court to resolve some of these questions. The federal litigation tracker presents up-to-date information on the litigation in federal courts that involves access to contraception and abortion.

Status of Abortion Litigation in State Courts, as of 2/14/2023
Status of Abortion Litigation in State Courts, as of February 15, 2023

Medicaid Enrollment and Unwinding Tracker

Published: Sep 30, 2025

Enrollment Data

Note: The data presented below are updated monthly as new Medicaid/CHIP enrollment data become available.

The Medicaid Enrollment and Unwinding Tracker presents the most recent data on monthly Medicaid/CHIP enrollment reported by the Centers for Medicare & Medicaid Services (CMS) as part of the Performance Indicator Project as well as archived data on renewal outcomes reported by states during the unwinding of the Medicaid continuous enrollment provision. The unwinding data were pulled from state websites, where available, and from CMS.

Medicaid/CHIP enrollment trends generally use February 2020 as the baseline month because it was the month prior to the start of the COVID-19 pandemic and implementation of the continuous enrollment provision. During continuous enrollment, which was in place during the three years of the pandemic, states paused Medicaid disenrollments. As a result, when the continuous enrollment provision ended in March 2023, national Medicaid/CHIP enrollment had increased to a record high of 94 million enrollees. Beginning April 1, 2023, states could resume disenrolling people after conducting renewals to verify eligibility for the program, though some states delayed the start of their unwinding periods until May, June, or July 2023. Most states took 12 months to complete unwinding renewals and nearly all states completed renewals by August 2024.

The figures below show Medicaid and CHIP enrollment from February 2020 through the most current month of available data. Some figures also include enrollment for adults and children in Medicaid/CHIP. Key enrollment trends as of June 2025 include:

  • There are 77.7 million people enrolled in Medicaid/CHIP nationally (Figure 1). This represents a 18% decline from total Medicaid/CHIP enrollment in March 2023, but is still 9% higher than Medicaid/CHIP enrollment in February 2020, prior to the pandemic (Figure 2 and Table 1).
  • Several factors likely explain why national Medicaid/CHIP enrollment is higher than pre-pandemic enrollment. The pandemic may have encouraged some people who were previously eligible for Medicaid but not enrolled to newly enroll in the program. During the unwinding, many states took steps to improve their renewal processes, which reduced the number of people who were disenrolled despite remaining eligible. In addition, some states expanded eligibility for certain groups since the start of the pandemic, such as the Affordable Care Act’s (ACA) Medicaid expansion.
  • Medicaid/CHIP enrollment is higher than pre-pandemic levels in all but twelve states (AR, AK, CO, ID, IA, LA, MT, NM, SC, TN, TX, and WV). Enrollment changes from pre-pandemic baseline vary from a 15% decrease in Montana to a 54% increase in North Carolina (Figure 2). Many of the states with the largest increases in enrollment expanded eligibility since the start of the pandemic. For example, five states (NE, OK, MO, SD, and NC) implemented the Medicaid expansion between October 2020 and December 2023 and Maine increased the income limit for children to qualify for Medicaid.
  • In the 49 states and DC with complete enrollment data by age, there are 36.2 million children (48%) and 39.7 million adults (52%) enrolled, a change from pre-pandemic (February 2020) enrollment patterns when children made up a slight majority (51%) of Medicaid/CHIP enrollees (Figure 1).
  • Child enrollment in Medicaid/CHIP is below pre-pandemic enrollment in 16 states, while adult enrollment is below pre-pandemic levels in 12 states (Figure 2).
  • There are 70.5 million people enrolled in Medicaid and 7.2 million people enrolled in CHIP (Figure 1). More states report Medicaid enrollment above their pre-pandemic baselines compared to the number reporting CHIP enrollment above the baseline (Figure 2).
National Enrollment in Medicaid/CHIP, February 2020 to April 2025
Cumulative Percent Changes in Enrollment from February 2020 to April 2025
Total Medicaid/CHIP Enrollment, Selected Time Periods

Unwinding Data – Archived

Note: The data on unwinding renewal outcomes presented below were last updated on September 12, 2024; since most states have now completed the Medicaid unwinding, the information will not be updated again.

As of September 12, 2024 and with nearly complete unwinding data for most states: 

  • Over 25 million people were disenrolled (31% of completed renewals) and over 56 million people had their coverage renewed (69% of completed renewals).  
  • Disenrollment rates varied across states from 57% in Montana to 12% in North Carolina, driven by a variety of factors including differences in renewal policies and procedures as well as eligibility expansions in some states.  
  • Among those who were disenrolled, nearly seven in ten (69%) were disenrolled for paperwork or procedural reasons while three in ten (31%) were determined ineligible.  
  • Among those whose coverage was renewed during the unwinding, 61% were renewed on an ex parte, or automated, basis, meaning the individual did not have to take any action to maintain coverage. 

State Data on Renewal Outcomes

The data on unwinding-related renewal outcomes presented in this section rely primarily on monthly reports that states were required to submit to the Centers for Medicare & Medicaid Services (CMS) during the unwinding period. The data also reflect updates to the monthly reports that states submit three months after the original report submission to account for the resolution of pending cases and any other changes in renewal metrics. For 13 states, data were pulled from dashboards or reports published on state websites that provide more complete information, and for a few additional states, updated monthly reports were pulled from state websites because they were more timely than what is reported on the CMS website. 

To view archived data for specific states, click on the State Data – Archived tab.


As of August 1, 2024, States Have Reported Renewal Outcomes for Over Eight in Ten People who were Enrolled in Medicaid/CHIP Prior to the Start of the Unwinding


Medicaid Disenrollments

  • As of September 12, 2024, at least 25,198,000 Medicaid enrollees had been disenrolled during the unwinding of the continuous enrollment provision. Overall, 31% of people with a completed renewal were disenrolled in reporting states while 69%, or 56.4 million enrollees, had their coverage renewed.
  • There is wide variation in disenrollment rates across reporting states, ranging from 57% in Montana to 12% in North Carolina. A variety of factors contribute to these differences, including differences in renewal policies and system capacity. Some states adopted policies that promote continued coverage among those who remain eligible and/or have automated eligibility systems that can more easily and accurately process renewals while other states have adopted fewer of these policies and have more manually-driven systems. In addition, North Carolina and South Dakota adopted Medicaid expansion and other states increased eligibility levels for certain populations (e.g., children, parents, etc.) during the unwinding, which may have lowered disenrollment rates in these states.

At least <b>24,838,000</b> Medicaid enrollees have been disenrolled with publicly available unwinding data, as of August 1, 2024


  • Across all states with available data, 69% of all people disenrolled had their coverage terminated for procedural reasons. However, these rates vary based on how they are calculated (see note below). Procedural disenrollments are cases where people are disenrolled because they did not complete the renewal process and can occur when the state has outdated contact information or because the enrollee does not understand or otherwise does not complete renewal packets within a specific timeframe. High procedural disenrollment rates are concerning because many people who are disenrolled for these paperwork reasons may still be eligible for Medicaid coverage. 

(Note: The first tab in the figure below calculates procedural disenrollment rates using total disenrollments as the denominator. The second tab shows these rates using total completed renewals, which include people whose coverage was terminated as well as those whose coverage was renewed, as the denominator. And finally, the third tab calculates the rates as a share of all renewals due, which include completed renewals and pending cases.)

Of all people who were disenrolled, 69% were terminated for procedural reasons, as of August 1, 2024

Medicaid Renewals

  • Of the people whose coverage has been renewed as of September 12, 2024, 61% were renewed on an ex parte basis while 39% were renewed through a renewal form, though rates vary across states. Under federal rules, states are required to first try to complete administrative (or “ex parte”) renewals by verifying ongoing eligibility through available data sources, such as state wage databases, before sending a renewal form or requesting documentation from an enrollee. Ex parte renewal rates varied across states from 90% or more in Arizona, North Carolina, and Rhode Island to less than 20% in Pennsylvania and Texas. 

Overall, 61% of people who retained Medicaid coverage were renewed through ex parte processes, as of August 1, 2024

Federal Data on Renewal Outcomes

The data presented here are cumulative unwinding metrics published by CMS. These counts and percentages may differ from the above data, which present renewal metrics reported on state websites when state-reported data are more complete.  

Figure 1 below shows cumulative renewal data reported by CMS during states’ unwinding periods. Renewal data for the months after the end of states’ unwinding period are excluded. The data reflect updated unwinding data reported by states three months after the original monthly reports as they become available.   

Cumulative Medicaid Renewal Outcomes for Reporting States through April 2023

For questions about this tracker, please contact KFFTracker@kff.org

State Data – Archived

Note: The state data presented below were last updated on September 12, 2024; since most states have now completed the Medicaid unwinding, the information will not be updated again. 

The data presented here provide state-level data on enrollment trends and renewal outcomes during the unwinding period. Figure 1 shows total Medicaid enrollment by month starting in January 2023 and, once disenrollments resumed in a state, the cumulative percent change in Medicaid enrollment relative to the month before Medicaid disenrollments started (this baseline month will differ across states). Figure 2 shows renewal metrics for each month of a state’s unwinding period (or cumulative data for the unwinding period for some states). 

For total national Medicaid enrollment, click on the Enrollment Data tab.

Related Resources

Resources on unwinding data

Resources on state policies and preparations for the unwinding

Resources on pre-pandemic enrollment patterns and coverage transitions

KFF’s unwinding explainer

Overview of President Trump’s Executive Actions on Global Health

Published: Sep 30, 2025

Note: Originally published on Jan. 28, 2025, this resource is updated as needed, most recently on September 30, 2025, to reflect additional developments. 

Starting on the first day of his second term, President Trump began to issue numerous executive actions, several of which directly address or affect U.S. global health efforts.* This guide provides an overview of these actions, in the order in which they were issued. The “date issued” is date the action was first taken; subsequent actions are listed under “What Happens/Implications.” See an accompanying timeline of events specific to the foreign aid review and USAID dissolution.

President Trump’s Executive Actions on Global Health

Initial Rescissions Of Harmful Executive Orders And Actions, January 20, 2025
PURPOSE: Initial rescissions of Executive Orders and Actions issued by President Biden.

Among these orders are several that addressed the COVID-19 pandemic and global health security, such as Executive Order 13987 (Organizing and Mobilizing the United States Government To Provide a Unified and Effective Response To Combat COVID-19 and To Provide United States Leadership on Global Health and Security),  which among other things established the National Security Council Directorate on Global Health Security and Biodefense and a Senior Director position to oversee it.

What Happens Next/Implications: Given that most of the provisions in the COVID-19 and Global Health Security actions issued by President Biden are no longer current or relevant, the rescissions of these actions are likely to have minimal effect on government policies. One exception may be the elimination of the Directorate of Global Health Security and Biodefense and its Senior Director at the National Security Council, which were responsible for interagency coordination on global health security matters during the Biden Administration. The elimination of this office echoes a similar move made during the first Trump Administration to eliminate an NSC Directorate for Global Health Security, and raises questions about who and which offices at NSC (and across the government) will fill this coordination role in the new Administration. More rescissions of other Biden administration Executive Actions may be issued at a later date.
Withdrawing The United States From The World Health Organization, January 20, 2025
PURPOSE: To withdraw from the World Health Organization (WHO).

“The United States noticed its withdrawal from the World Health Organization (WHO) in 2020 due to the organization’s mishandling of the COVID-19 pandemic that arose out of Wuhan, China, and other global health crises, its failure to adopt urgently needed reforms, and its inability to demonstrate independence from the inappropriate political influence of WHO member states.  In addition, the WHO continues to demand unfairly onerous payments from the United States, far out of proportion with other countries’ assessed payments.  China, with a population of 1.4 billion, has 300 percent of the population of the United States, yet contributes nearly 90 percent less to the WHO.”

ACTIONS: The United States intends to withdraw from the WHO. 
The Presidential Letter to the Secretary-General of the United Nations signed on January 20, 2021, that retracted the United States’ July 6, 2020, notification of withdrawal is revoked.
Executive Order 13987 (Organizing and Mobilizing the United States Government to Provide a Unified and Effective Response to Combat COVID–19 and To Provide United States Leadership on Global Health and Security), which, among other things, called for “engaging with and strengthening the World Health Organization” is revoked.
Assistant to the President for National Security Affairs shall establish directorates and coordinating mechanisms within the National Security Council apparatus as necessary and appropriate to safeguard public health and fortify biosecurity.
The Secretary of State and Director of the Office of Management and Budget shall take actions to pause future transfer of any U.S. funds, support, or resources to WHO; recall and reassign U.S. government personnel or contractors working in any capacity with WHO; and identify credible and transparent U.S. and international partners to assume necessary activities previously undertaken by WHO.
The Director of the White House Office of Pandemic Preparedness and Response Policy shall review, rescind, and replace the 2024 U.S. Global Health Security Strategy.
The Secretary of State shall immediately inform the Secretary-General of the United Nations, any other applicable depositary, and the leadership of the WHO of the withdrawal.
While the withdrawal is in progress, Secretary of State will cease negotiations on the WHO Pandemic Agreement and the amendments to the International Health Regulations, and states that “actions taken to effectuate such agreement and amendments will have no binding force on the United States.”
What Happens Next/Implications: President Trump initiated a process to withdraw from the WHO during his first term in office, a process that takes a year to finalize, and halted funding. This time period was not met when President Biden took office and he reversed this decision and restored funding. Now, after issuance of a formal letter of withdrawal United Nations and WHO, the process will be initiated once again. Such a letter has been issued, indicating that membership will end as of January 22, 2026.

Per the Executive Order, U.S. government representatives may not work with WHO. While U.S. representatives attended the Executive Board meeting in February (the U.S. previously held a seat on the Executive Board), no representatives attended the World Health Assembly in May, where world leaders adopted the Pandemic Agreement. On May 30, the White House released details on the President’s Budget Request for FY 2026, requesting eliminated funding for WHO. Further, on June 3, the administration asked Congress to rescind funds previously appropriated for fiscal years 2024 and 2025, including contributions to WHO. However, for both the FY 2026 appropriations and FY2024-25 rescissions, Congress will determine the final funding levels.

As the largest donor to WHO providing approximately 16%-18% of the organization’s revenue, the absence of U.S. funding will have an impact WHO’s operations, as will the loss of U.S. technical expertise. See: KFF Fact Sheet and Quick Take
Reevaluating And Realigning United States Foreign Aid, January 20, 2025
PURPOSE: To pause funding and review all U.S. foreign assistance to assess alignment with American values.

The U.S. “foreign aid industry and bureaucracy are not aligned with American interests and in many cases antithetical to American values. They serve to destabilize world peace by promoting ideas in foreign countries that are directly inverse to harmonious and stable relations internal to and among countries.”

“It is the policy of United States that no further United States foreign assistance shall be disbursed in a manner that is not fully aligned with the foreign policy of the President of the United States.”

Calls for:

90-day pause in U.S. foreign development assistance (new obligations or disbursements) to assess programmatic efficiencies and consistency with U.S. foreign policy.
Review of U.S. foreign assistance programs by the responsible department and agency heads under guidelines provided by the Secretary of State, in consultation with the Director of OMB.
Responsible department and agency heads, in consultation with the Director of OMB, will make determinations within 90 days of this order on whether to continue, modify, or cease each foreign assistance program based upon the review recommendations, with the concurrence of the Secretary of State.
New obligations and disbursements may resume for a program prior to the end of the 90-day period if a review is conducted, and the Secretary of State or his designeein consultation with the Director of OMB, decide to continue the program in the same or modified form.  Additionally, any other new foreign assistance programs and obligations must be approved by the Secretary of State or his designee, in consultation with the Director of OMB.
The Secretary of State may waive the pause for specific programs.
What Happens Next/Implications: Almost all global health programs are funded through foreign aid appropriations and are therefore subject to this order. The order temporarily freezes any new U.S. government spending (obligations or disbursements) through these programs, which could interrupt implementation of programs for which funds have not yet been obligated. It also calls for a 90-day review of all foreign aid programs. Key developments are as follows:
On January 24, 2025, A Notice on Implementation of the Executive Order was issued by USAID which, among other things, calls for stop-work orders to be issued for all existing foreign assistance awards (not just new obligations and disbursements). It notes that waivers have been granted for: foreign military financing for Israel and Egypt and emergency food assistance (and related expenses) and, on a temporary basis, salaries and related administrative expenses, including travel, for U.S. direct hire employees, personal services contractors, and locally employed staff. The stop-work order on existing awards halted U.S. global health (and other foreign assistance) programs that were already underway, placing key programs at risk of not being able to provide critical services, and affecting access for individuals on the ground, unless a waiver was received.
On January 28, the Secretary of State  issued a blanket waiver for life-saving humanitarian assistance programs, which also lays out a process for requesting additional waivers (more information is here). This guidance also states that the waiver does not apply to “activities that involve abortions, family planning, conferences, administrative costs [unless associated with waived activities], gender or DEI ideology programs, transgender surgeries, or other non-life saving assistance.”
On February 1, PEPFAR, the global HIV/AIDS program, was granted a limited waiver enabling it to resume or continue “urgent life-saving HIV treatment  services”, defined as a set of care and treatment services and prevention of mother-to-child transmission services.
On February 4, some additional services for other global health programs  – tuberculosis; malaria; acute risks of maternal and child mortality, including severe acute malnutrition; and other life-threatening diseases and health conditions – deemed to be “lifesaving” were also granted a limited waiver to allow them to resume or continue.
On February 6, a lawsuit was filed by Democracy Forward and Public Citizen Litigation Group, on behalf of the American Foreign Service Association and American Federation of Government Employees, challenging the foreign aid funding freeze, the plan to put most staff on leave, and the fact that staff had already been placed on leave; on February 7, they filed a temporary restraining order (TRO). That same day, a temporary restraining order was issued by the U.S. District Court in the District of Columbia preventing the government from placing additional staff on leave or evacuating staff back to the U.S., and requiring reinstatement of all staff already placed on leave, until February 14. The court did not grant a TRO on the funding freeze, on the grounds that the plaintiffs in this case did not demonstrate that the freeze caused them irreparable harm. On February 13, the court extended the TRO through February 21 (further actions are described below, as this case was combined with another for purposes of the court’s consideration).
On February 10, a lawsuit was filed in the U.S. District Court for the District of Columbia on behalf of two U.S. organizations seeking emergency relief from the freeze on funding for foreign assistance (AVAC v. United States Department of State).
On February 11, a lawsuit was filed in the U.S. District Court for the District of Columbia on behalf of several U.S. organizations challenging the executive order and subsequent actions freezing foreign aid and dissolving USAID, and asking the court to temporarily restrain and preliminarily and permanently enjoin Defendants from implementing these actions (Global Health Council v. Trump).
On February 13, the court, in a ruling pertaining to the February 10 and February 11 lawsuits brought by numerous U.S. organizations, issued a TRO preventing the Trump administration from “suspending, pausing, or otherwise preventing the obligation or disbursement of appropriated foreign-assistance funds in connection with any contracts, grants, cooperative agreements, loans, or other federal foreign assistance award that was in existence as of January 19, 2025; or issuing, implementing, enforcing”, or “otherwise giving effect to terminations, suspensions, or stop-work orders in connection with any contracts, grants, cooperative agreements, loans, or other federal foreign assistance award that was in existence as of January 19, 2025.”
On February 14, the parties filed a joint status report proposing an expedited preliminary injunction briefing schedule.
On February 18, the government filed a required status report stating that, despite the TRO, it had the authority to cancel contracts and suspend grant awards.
This was followed by a February 19 request by the February 10 plaintiffs (AVAC v. Department of State) for an emergency motion to enforce the TRO and to hold the defendants in civil contempt.
The defendants filed a required response on February 20, stating that they have not violated the TRO and should not be held in contempt, which was again opposed by the plaintiffs. Also on February 20, the February 11 plaintiffs (Global Health Council v. Trump) filed a response to the defendant’s status report with a motion to enforce the TRO.  The court reaffirmed the TRO on February 20 (but did not hold the defendants in contempt), stating it was prepared to hold a hearing on the preliminary injunction motions in both cases by March 4, 2025 and that the TRO would be in place through March 10, 2025, or the date the Court resolves the preliminary injunction motions, whichever is sooner.
The plaintiffs filed an emergency order to enforce the TRO on February 24, due to continued lack of payment, and the court issued a motion to enforce on February 25. The government appealed, (asking for a stay pending appeal) but this was denied by the court. The government then appealed to the Supreme Court and was granted a stay until February 28 while the case was considered.
On March 5, the Supreme Court denied the government’s request to vacate the federal district court’s TRO, sending the order back to the district court to clarify the government’s obligations for ensuring compliance with the TRO.
On March 6, the federal district court judge ordered the government to release all payments that were due to plaintiffs as of February 13, by Monday, March 10 at 6pm, and on March 10, the federal district court judge preliminarily enjoined the government from taking certain actions related to the foreign aid freeze.
On March 10, Secretary Rubio announced that a six-week review had been completed and that 83% of programs at USAID (5,200 contracts) had been cancelled. That same day, the court  preliminarily enjoined the government from enforcing actions taken to implement the foreign aid freeze (requiring it to reverse any terminations, suspensions, and stop-work orders and to pay for any work completed by February 13). The court stated that the government was “enjoined from unlawfully impounding congressionally appropriated foreign aid funds and shall make available for obligation the full amount of funds that Congress appropriated for foreign assistance programs in the Further Consolidated Appropriations Act of 2024.”
On April 1, the government filed an appeal with the U.S. Court of Appeals for the District of Columbia challenging the preliminary injunction issued on March 10.
On April 17, the administration extended the foreign aid review for another 30 days from the original deadline of April 20, 2025.
On May 2 and May 30, the White House released information on its budget request for FY 2026, proposing significant decreases, and in some cases eliminations, of funding for global health activities. However, Congress will determine the final funding levels.
On June 3, the administration asked Congress to rescind previously appropriated funds for fiscal years 2024 and 2025, including $8.3 billion in foreign assistance, of which at least $1.2 billion was designated for global health. However, Congress will need to approve any potential rescissions.
• On August 13, the U.S. District Court of Appeals for the District of Columbia Circuit partially vacated the March 10 preliminary injunction in the cases GHC v. Trump and AVAC v. State Department which required the government to make congressionally appropriated foreign assistance funds available for obligation. The appeals court ruled that the plaintiffs did not have the authority to challenge the President’s impoundment of funds. Instead, the court ruled that challenges of impoundment should be brought forward by the Comptroller General.
• On August 28, the U.S. District Court of Appeals for the District of Columbia Circuit amended its opinion, clarifying that while plaintiffs did not have the authority to challenge impoundment of foreign assistance funds through the Impoundment Control Act, they could seek relief through the Administrative Procedures Act. Following this amended opinion, plaintiffs in GHC v. Trump and AVAC v. State Department cases motioned for a preliminary injunction in the U.S. district court on September 1. On September 3, the U.S. district court granted the preliminary injunction, ordering defendants to obligate expiring foreign assistance funds before the end of the fiscal year on September 30. On September 4, defendants appealed this preliminary injunction and requested a stay on the preliminary injunction pending the resolution of the appeals case, from both the district court and appeals court. These requests were both denied on September 5. On September 8, defendants requested a stay of the preliminary injunction as it pertained to funds included in the President’s proposed rescissions package from the U.S Supreme Court. On September 9, the Chief Justice of the Supreme Court granted a partial administrative stay of the preliminary injunction, and on September 26, the court granted the partial stay.

The 90-day review of foreign assistance was initially supposed to go through April 19, 2025, however, has been granted a 30-day extension.
America First Policy Directive To The Secretary Of State, January 20, 2025
PURPOSE: To put core American interests first in foreign policy.

The foreign policy of the United States “shall champion core American interests and always put America and American citizens first.”

“As soon as practicable, the Secretary of State shall issue guidance bringing the Department of State’s policies, programs, personnel, and operations in line with an America First foreign policy, which puts America and its interests first.”
What Happens Next/Implications: The State Department is responsible for the supervision and overall strategic direction of foreign assistance programs administered by the State Department and USAID, which includes the vast majority of global health assistance. It also directly oversees PEPFAR, the global HIV/AIDS program, and many aspects of global health diplomacy for the U.S. Priorities and approaches for these and other global health programs are likely to be shaped by how the White House and State Department leadership define “America First” foreign policy and American interests, and how that definition is implemented in practice.

In the President’s Budget Request for FY 2026, the request proposes eliminated funding for several global health activities, including family planning and reproductive health (FPRH), neglected tropical diseases (NTDs), and nutrition, stating these are “programs that do not make Americans safer”. However, Congress will determine final funding levels and whether to include these eliminations in its appropriations bills.

Defending Women From Gender Ideology Extremism And Restoring Biological Truth To The Federal Government, January 20, 2025
PURPOSE: To define sex as an immutable binary biological classification and remove recognition of the concept of gender identity.

The order states that “It is the policy of the United States to recognize two sexes, male and female” and directs the Executive Branch to “enforce all sex-protective laws to promote this reality”. Elements of the order that may affect global health programs are as follows:

Defines sex as “an individual’s immutable biological classification as either male or female”.  States that “sex” is not a synonym for and does not include the concept of “gender identity” and that gender identity “does not provide a meaningful basis for identification and cannot be recognized as a replacement for sex.”
Directs the Secretary of Health and Human Services to provide the U.S. Government, external partners, and the public clear guidance expanding on the sex-based definitions set forth in the order within 30 days.
Directs each agency and all Federal employees to “enforce laws governing sex-based rights, protections, opportunities, and accommodations to protect men and women as biologically distinct sexes, including when interpreting or applying statutes, regulations, or guidance and in all other official agency business, documents, and communications.
Directs each agency and all Federal employees, when administering or enforcing sex-based distinctions, to use the term “sex” and not “gender” in all applicable Federal policies and documents.
Directs agencies to remove all statements, policies, regulations, forms, communications, or other internal and external messages “that promote or otherwise inculcate gender ideology”, and shall cease issuing such statements, policies, regulations, forms, communications or other messages. Directs agencies to take all necessary steps, as permitted by law, to end the Federal funding of gender ideology.
Requires that Federal funds shall not be used to promote gender ideology and directs agencies to ensure grant funds do not promote gender ideology.
Rescinds multiple executive orders issued by President Biden, including: “Preventing and Combating Discrimination on the Basis of Gender Identity or Sexual Orientation” (13988) and “Advancing Equality for Lesbian, Gay, Bisexual, Transgender, Queer, and Intersex Individuals” (14075).
What Happens Next/Implications: This order is broad, directed to all federal agencies and programs. Because PEPFAR, and some other U.S. global health programs, serve people who are members of the LGBTQ community, guidance and implementation could affect the ability of these programs to reach individuals and organizations and provide them with services. In addition, the order will likely result in the removal of existing protections based on sexual orientation and gender identity, which had been provided in agency guidance for global health and development programs. Implementation guidance has been issued and all federal agencies must comply.
Memorandum For The Secretary Of State, The Secretary Of Defense, The Secretary Of Health And Human Services, The Administrator Of The United States Agency For International Development, January 24, 2025
PURPOSE: To reinstate Mexico City Policy and direct review of programs per the Kemp-Kasten Amendment.
• Revokes President Biden’s Presidential Memorandum of January 28, 2021 for the Secretary of State, the Secretary of Defense, the Secretary of Health and Human Services, and the Administrator of the United States Agency for International Development (Protecting Women’s Health at Home and Abroad)
Reinstates President Trump’s Presidential Memorandum of January 23, 2017 for the Secretary of State, the Secretary of Health and Human Services, and the Administrator of the United States Agency for International Development (The Mexico City Policy).
Directs the Secretary of State, in coordination with the Secretary of Health and Human Services, to the extent allowable by law, to implement a plan to extend the requirements of the reinstated Memorandum to global health assistance furnished by all departments or agencies.
Directs the Secretary of State to take all necessary actions, to the extent permitted by law, to ensure that U.S. taxpayer dollars do not fund organizations or programs that support or participate in the management of a program of coercive abortion or involuntary sterilization.
What Happens Next/Implications: The Mexico City Policy is a U.S. government policy that – when in effect – has required foreign NGOs to certify that they will not “perform or actively promote abortion as a method of family planning” using funds from any source (including non-U.S. funds) as a condition of receiving U.S. global family planning assistance and, when in place under the Trump administration, most other U.S. global health assistance. First announced in 1984 by the Reagan administration, the policy has been rescinded and reinstated by subsequent administrations along party lines since; it was widely expected that the President Trump would reinstate it in his second term. The new memorandum calls for the implementation of a plan to extend the requirements to global health assistance furnished by all departments or agencies; until the plan is ready, the scope of the new memorandum is unknown.

The new memorandum also directs the Secretary of State to review programs under the Kemp-Kasten amendment, a provision of U.S. law that states that no U.S. funds may be made available to “any organization or program which, as determined by the [p]resident of the United States, supports or participates in the management of a program of coercive abortion or involuntary sterilization.” It has been used in the past to prevent funding from going to UNFPA.

See: KFF Mexico City Policy explainer and related resources and Kemp-Kasten explainer.
Renewed Membership in the Geneva Consensus Declaration on Promoting Women’s Health and Strengthening the Family, January 24, 2025
PURPOSE: To rejoin the Geneva Consensus Declaration.

The United States informed signatories of the Geneva Consensus Declaration of its intent to rejoin immediately. Established in 2020, the declaration, led by the United States, has the following objectives: “to secure meaningful health and development gains for women; to protect life at all stages; to defend the family as the fundamental unit of society; and to work together across the UN system to realize these values.”

What Happens Next/Implications: The Geneva Consensus Declaration, initially crafted and signed by the U.S. – along with 31 other countries at the time – was meant to enshrine certain values and principles related to women’s health and family, including a rejection of the “international right to abortion.”  The Biden administration withdrew from the Consensus in 2021.
Review of and Changes to USAID, January 27, 2025
Reorganization of the Department of State, April 22, 2025
PURPOSE: To review and potentially reorganize USAID “to maximize efficiency and align operations with the national interest,” which may include the suspension or elimination of programs, projects, or activities; closing or suspending missions or posts; closing, reorganizing, downsizing, or renaming establishments, organizations, bureaus, centers, or offices; reducing the size of the workforce at such entities; and contracting out or privatizing functions or activities performed by federal employees.What Happens Next/Implications: Related to but separate from the Executive Order on reevaluating and realigning foreign aid and on the America first policy directive to the Secretary of State, the administration has made changes to and begun a review of USAID, the U.S. government’s international development agency which oversees and/or implements most U.S. global health programs (see, The U.S. Government and Global Health). Key developments are as follows:
On January 27, senior USAID career staff were placed on leave and hundreds of other staff were let go.
On February 2, the USAID website was taken down.
On February 3, the USAID building in DC was closed, which has prevented other staff from accessing it.
The President appointed Secretary of State Rubio as Acting USAID Administrator on February 3. Secretary Rubio has said that the agency has “conflicting, overlapping, and duplicative functions that it shares with the Department of State” and that its systems and processes are not “well synthesized, integrated, or coordinated, and often result in discord in the foreign policy and foreign relations of the United States.” President Trump and other administration officials have called for dissolving the agency altogether. Formal notification of the intent to review the agency was sent by Secretary Rubio to Congress on February 3.
On February 4, a notice was posted on the USAID website stating that on February 7, all USAID direct hire personnel would be placed on administrative leave globally, with the exception of “designated personnel responsible for mission­ critical functions, core leadership and specially designated programs.” The notice also said that staff posted outside the United States would need to return to the U.S. within 30 days.
On February 6, a lawsuit was filed by Democracy Forward and Public Citizen Litigation Group, on behalf of the American Foreign Service Association and American Federation of Government Employees, challenging the foreign aid funding freeze, the plan to put most staff on leave, and the fact that staff had already been placed on leave; on February 7, they filed for a temporary restraining order (TRO). That same day, a temporary restraining order was issued by the U.S. District Court in the District of Columbia preventing the government from placing additional staff on leave or evacuating staff back to the U.S., and requiring reinstatement of all staff already placed on leave, until February 14. The court did not grant a TRO on the funding freeze, on the grounds that the plaintiffs in this case did not demonstrate that the freeze caused them irreparable harm. On February 13, the court extended the TRO through February 21, at which time, the court determined that further preliminary injunctive relief was not warranted and the TRO was ended, allowing the government to dismiss USAID staff.
On February 11, a lawsuit was filed in the U.S. District Court for the District of Columbia on behalf of several U.S. organizations challenging the executive order pausing foreign aid, and subsequent actions freezing foreign aid and dissolving USAID, and asking the court to temporarily restrain and preliminarily and permanently enjoin Defendants from implementing these actions. In a February 13 ruling, a federal court issued a TRO preventing the Trump administration from freezing foreign aid assistance but stated that the proposed injunctions related to USAID were overbroad (in a separate case, the district court ended the TRO on dismissing USAID staff – see above).
On February 13, a lawsuit was filed in the U.S. District Court for the District of Maryland by 26 former and current employees of USAID, suing Elon Musk and DOGE for taking actions to control and dissolve the agency. On February 18, the plaintiffs filed a motion for preliminary injunction. The defendants responded on February 24 and the plaintiffs replied on February 26. On March 18, the court granted a preliminary injunction, requiring the defendants to reverse many of the actions taken to dissolve USAID, and on March 21, the defendants filed an appeal on the preliminary injunction. On March 25, the U.S. 4th Circuit Court of Appeals granted the defendants’ motion for a temporary stay on the preliminary injunction, allowing DOGE to resume its efforts to dissolve USAID, until March 27. The following day on March 28, the court granted defendants’ motion for a stay, clearing the path for DOGE to continue its work dissolving USAID.
On February 18, a lawsuit was filed in the U.S. District Court for the District of Columbia on behalf of the Personal Services Contractor Association (representing USAID personal service contractors) challenging the suspension of foreign assistance and the actions related to USAID, including “steps to dismantle USAID, cripple its operations, or transfer its functions to the State Department without Congressional authorization”. On February 19, the plaintiffs filed a motion for a temporary restraining order. On March 6, the court denied the TRO request.
On March 28, Secretary Rubio announced that the Department of State and USAID have notified Congress on their intent to “undertake a reorganization that would involve realigning certain USAID functions to the Department by July 1, 2025, and discontinuing the remaining USAID functions that do not align with Administration priorities.” Additionally, nearly all the remaining USAID staff received notice that they would be subject to a final reduction-in-force.
On April 22, Secretary Rubio announced the Department of State’s reorganization plan and new organization chart. The plan states that it would consolidate functions and remove non-statutory programs that are “misaligned with America’s core national interests.”
On April 28, a lawsuit was filed by a group of labor unions, non-profits, and local governments challenging the administration’s moves to drastically reshape several federal agencies without congressional approval (American Federation of Government Employees v. Trump). The district court issued a TRO on May 9 and preliminary injunction on May 22 ordering the administration to pause large-scale reductions in force, program eliminations, and other actions related to federal agency restructuring. An emergency motion by the government for a stay pending appeal of the district court’s preliminary injunction was denied on May 30.
On May 2 and May 30, the White House released information on its budget request for FY 2026, noting the reorganization of USAID into the Department of State.
On May 29, the Department of State notified Congress of its reorganization plans, including absorbing USAID’s continued functions.
On June 13, the district court in American Federation of Government Employees v. Trump ruled that the actions of the Department of State, including the reorganization announcement and notification to Congress, were in violation of the preliminary injunction.
On July 8, the U.S. Supreme Court granted the government’s request for a stay of the preliminary injunction pending resolution of the appeals case in American Federation of Government Employees v. Trump, allowing the government to move forward with large-scale reductions to federal agency operations and workforces, including at the State Department.

While initially created through Executive Order in 1961 as part of the State Department, the Foreign Affairs Reform and Restructuring Act of 1998 established it as an independent agency within the executive branch. As such, the Executive branch does not have authority to dissolve it without Congress, and Congress also requires notification first as well as consultation on any proposed changes.
Withdrawing the United States From and Ending Funding to Certain United Nations Organizations and Reviewing United States Support to All International Organizations, February 4, 2025
PURPOSE: To review United States participation in all international intergovernmental organizations, conventions, and treaties and to withdraw from and end funding to certain United Nations (U.N.) organizations.

The U.S. “helped found” the U.N. “after World War II to prevent future global conflicts and promote international peace and security.  But some of [its] agencies and bodies have drifted from this mission and instead act contrary to the interests of the United States while attacking our allies and propagating anti-Semitism.”
States that the U.S. “will reevaluate our commitment to these institutions,” including three organizations that “deserve renewed scrutiny”:
the U.N. Human Rights Council (UNHRC; the U.S. will not participate in and withhold its contribution to the budget of the body),
the U.N. Educational, Scientific, and Cultural Organization (UNESCO; the U.S. will conduct a review of its membership in the body within 90 days), and
the U.N. Relief and Works Agency for Palestine Refugees in the Near East (UNRWA; reiterates that the U.S. will not contribute to the body).

    Requires that within 180 days:
  • • the Secretary of State, with the U.S. Ambassador to the U.N., conduct a review of all international intergovernmental organizations of which the U.S. is a member and provides any type of funding or other support, and all conventions and treaties to which the United States is a party, to determine which organizations, conventions, and treaties are contrary to the interests of the United States and whether such organizations, conventions, or treaties can be reformed; and
the Secretary of State to report the findings of the review to the President, through the National Security Advisor, and provide recommendations as to whether the U.S. should withdraw from any such organizations, conventions, or treaties.
What Happens Next/Implications: With a long history of multilateral global health engagement, the U.S. is often the largest or one of the largest donors to multilateral health efforts (i.e., multi-country, pooled support often directed through an international organization). It provided $2.4 billion in assessed or core contributions in FY 2024 – 19% of overall U.S. global health funding – as well as more funding in voluntary or non-core contributions.

The U.S. is also a signatory or party to numerous global health-related international conventions, treaties, and agreements; these include those that played a role in the global COVID-19 response (such as the International Health Regulations). It often has participated in negotiations for new international instruments, although the Trump administration indicated in a Jan. 20, 2025, Executive Order, listed above, that the U.S. would no longer engage in the Pandemic Agreement (sometimes called the “Pandemic Treaty”) negotiations.

This Executive Order will have immediate impacts via the ordered actions related to the three U.N. organizations specified, much as the impacts of the Jan. 20, 2025, Executive Order on the World Health Organization (WHO, which initiated U.S. withdrawal from membership and halted U.S. funding) are already being seen. Beyond these, additional impacts of this Executive Order will be determined by the findings and recommendations of the international organizations and conventions review, particularly if U.S. support for or membership in some international organizations is recommended to be reduced or eliminated and if it recommends the U.S. withdraw from any international agreements.

Congressional notification and oversight of any proposed changes will also be important to watch, including debates about whether advice or consent or congressional notification periods are or may be required prior to withdrawing the U.S. from international instruments such as treaties.

The administration has already signaled plans to discontinue support for several international organizations in its budget request for FY 2026 by proposing eliminated funding for Gavi, the Pan American Health Organization (PAHO), the United Nations Children’s Fund (UNICEF), the United Nations Population Fund (UNFPA), and the World Health Organization (WHO). However, Congress will determine final funding levels and whether to include these eliminations in its appropriations bills.

The 180 day review of all international intergovernmental organizations goes through August 3, 2025.
Memorandum For The Heads Of Executive Departments And Agencies, February 6, 2025
PURPOSE: The memorandum seeks to “stop funding Nongovernmental Organizations that undermine the national interest and administration priorities”.

The memorandum:

States: it is Administration policy “to stop funding NGOs [Nongovernmental Organizations] that undermine the national interest.”
Directs heads of executive departments and agencies to review all funding that agencies provide to NGOs and “to align future funding decisions with the interests of the United States and with the goals and priorities of my Administration, as expressed in executive action; as otherwise determined in the judgment of the heads of agencies; and on the basis of applicable authorizing statues, regulations, and terms.”
What Happens Next/Implications: This memo aligns with other Executive actions that target federal funding for global health and foreign assistance programs. Implementation of this memo could result in the Administration halting funding to global health NGOs they determine “do not align with administration priorities.” No criteria for how this determination will be made has been provided.

The majority of U.S. global health assistance is channeled through NGOs. In FY22, for example, 62% of U.S. global health funding was provided to NGOs as prime partners (45% to U.S.-based NGOs and 17% to foreign-based NGOs) and others are likely sub-recipients of U.S. assistance.* As such, this Order could have a significant impact on NGOs if it is determined that they do not align with administration policies.

*Source: KFF analysis of data from www.foreignassistance.gov.
Addressing Egregious Actions of The Republic of South Africa, February 7, 2025
PURPOSE: To stop U.S. support for South Africa due to its “commission of rights violations in its country or its ‘undermining United States foreign policy, which poses national security threats to our Nation, our allies, our African partners, and our interests.”

“It is the policy of the United States that, as long as South Africa continues these unjust and immoral practices that harm our Nation:
(a)  the United States shall not provide aid or assistance to South Africa; and
(b)  the United States shall promote the resettlement of Afrikaner refugees escaping government-sponsored race-based discrimination, including racially discriminatory property confiscation.”

ACTIONS:

All executive departments and agencies, including USAID, shall, to the maximum extent allowed by law, halt foreign aid or assistance delivered or provided to South Africa, and shall promptly exercise all available authorities and discretion to halt such aid or assistance.
The head of each agency may permit the provision of any such foreign aid or assistance that, in the discretion of the relevant agency head, is necessary or appropriate.
The Secretary of State and the Secretary of Homeland Security shall take appropriate steps, consistent with law, to prioritize humanitarian relief, including admission and resettlement through the United States Refugee Admissions Program, for Afrikaners in South Africa. A plan shall be submitted to the President through the Assistant to the President and Homeland Security Advisor.
What Happens Next/Implications: South Africa receives a significant amount of global health assistance, particularly for HIV/AIDS, from the United States government. The executive order allows the heads of U.S. agencies to permit the provision of foreign aid or assistance under this order at their discretion. On February 10, the U.S. Embassy and Consulates in South Africa announced that PEPFAR would not be impacted by this Executive Order and could continue under the limited waiver already granted to the foreign aid funding freeze. No other exceptions have yet been announced.

The Government of South Africa has issued a statement in response to the Executive Order that, among other things, expresses concern “by what seems to be a campaign of misinformation and propaganda aimed at misrepresenting our great nation.”

Notes and Sources:

*There are several other Executive Actions issued by the President that instruct all government agencies on a variety of topics and as such broadly affect global health program operations but are not specific to global health. These include, for example, Executive Actions withdrawing from the Paris Agreement under the United Nations Framework Convention on Climate Change and ending DEI programs. These are not included in this resource.

Sources: White House, https://www.whitehouse.gov/presidential-actions/; State Department, www.state.gov.