What Do Medicaid Unwinding Data by Race and Ethnicity Show?
During the unwinding of the pandemic continuous enrollment provision in Medicaid, states are required to report monthly data on renewal outcomes. While these required data are valuable for tracking how many people are renewed and disenrolled, they lack the detail required to assess renewal outcomes for different populations. Additional demographic data can shed light on who is losing coverage, which can help to identify areas for potential outreach, assistance, or systems solutions to address issues that may be disproportionately affecting certain groups. Because people of color are more likely to be covered by Medicaid, there has been particular interest in the effects of unwinding by race and ethnicity. While data on renewals by race and ethnicity are limited, this policy watch examines which states are posting data and presents findings on disenrollment patterns by race and ethnicity based on available data.
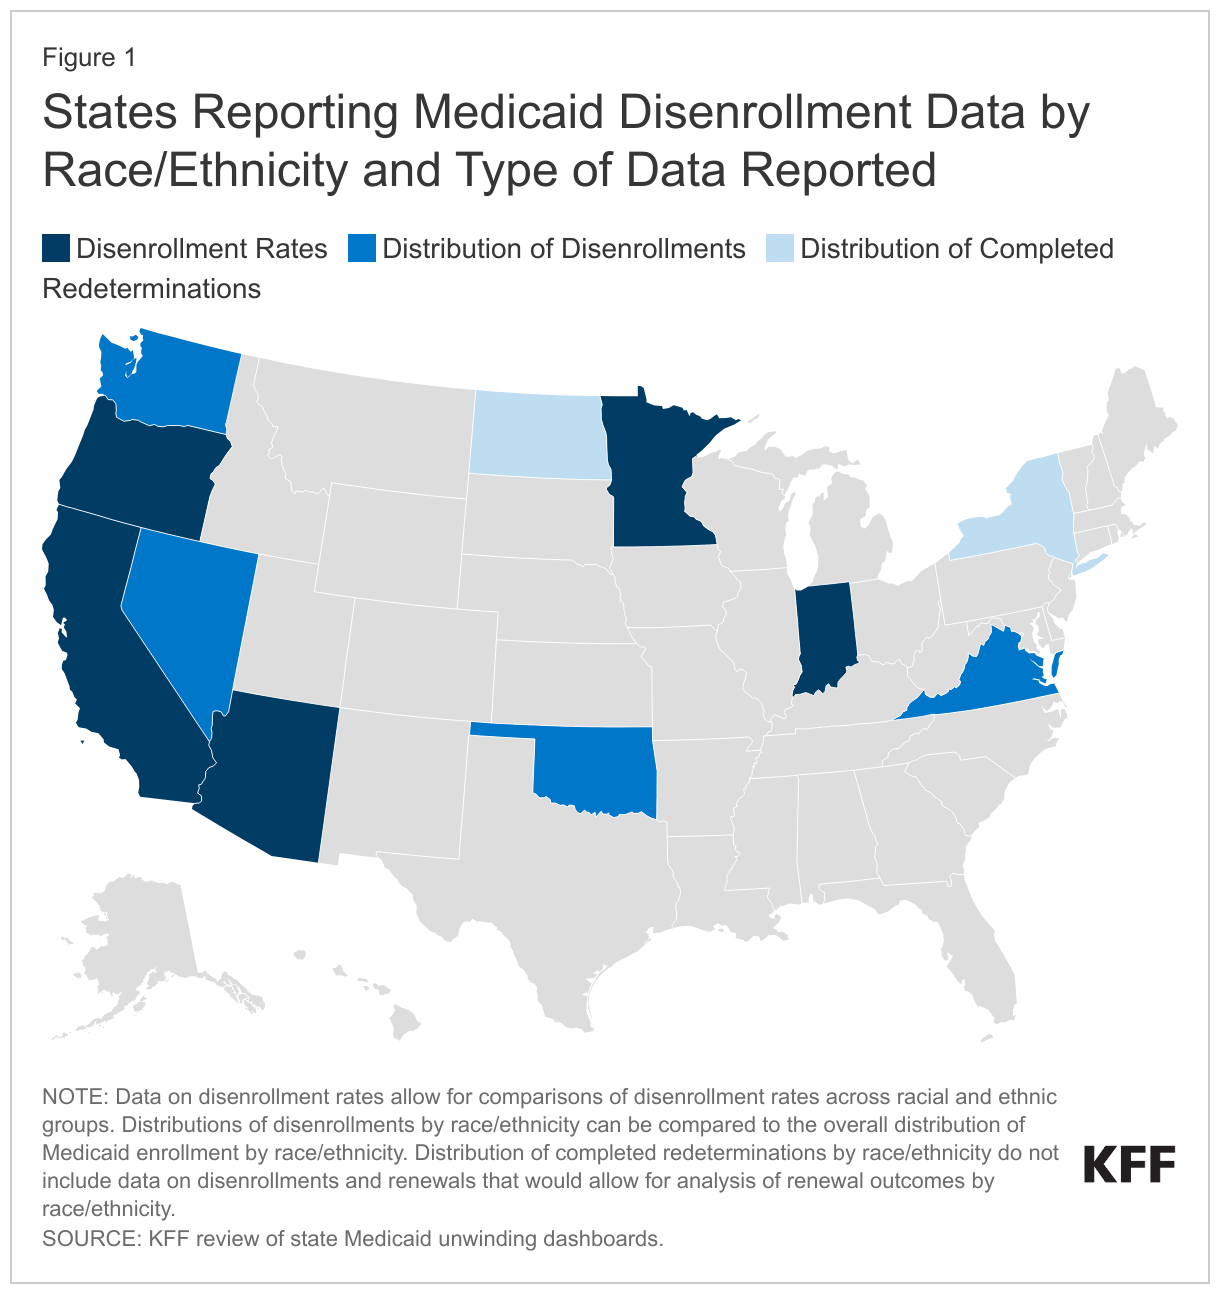
As of September 2023, nine states are reporting data that allow for analysis of disenrollment patterns by race and ethnicity. Five states (Arizona, California, Indiana, Minnesota, and Oregon) provide data on disenrollment rates by race and ethnicity. Four states (Nevada, Oklahoma, Virginia, and Washington) report the distribution of disenrollments by race and ethnicity that can be compared to the distribution of overall Medicaid enrollment in each state by race and ethnicity. An additional two states (New York and North Dakota) provide data on redeterminations that have been completed by race and ethnicity but do not break out the share of people who were disenrolled or had their coverage renewed, preventing analysis of disenrollment patterns by race and ethnicity. In addition to differences in the metrics states are reporting, the number of months of reported data differ across states, as does data quality, with the share of data with unknown or not reported race and ethnicity ranging from 7% in Oklahoma and Washington to 37% in Oregon. Higher shares of data with unknown race and ethnicity can affect the validity of the findings. States also vary in their racial and ethnic classifications, and while all states report data for Hispanic people, some states report Hispanic and non-Hispanic ethnicity separately from race.
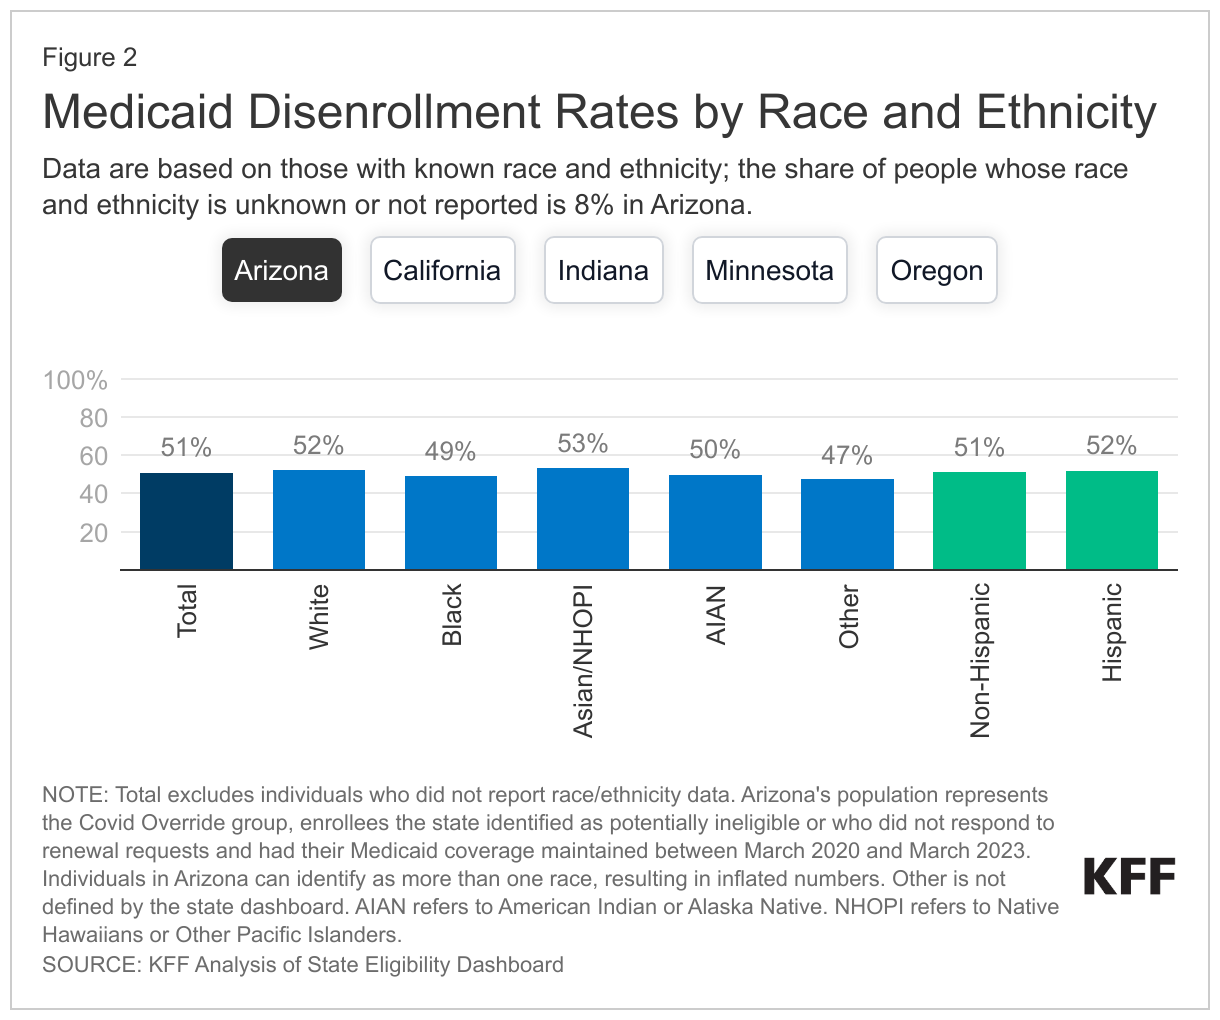
Across the five states reporting disenrollment rates by race and ethnicity, there are not large differences in disenrollment rates by race and ethnicity. Although the overall disenrollment rates vary from 12% in Oregon to 51% in Arizona, within states, the disenrollment rates for people of color are similar to those of White people (Figure 2). (Note: Arizona reports data for its COVID override population—enrollees who were flagged as potentially no longer eligible.) Overall, there are no consistent trends across states that point to disparities for certain groups of color. However, in some states, some groups have higher rates of disenrollment compared to their White counterparts. For example, in Minnesota, disenrollment rates for AIAN, Black, and Hispanic enrollees are higher than those for White and non-Hispanic enrollees.
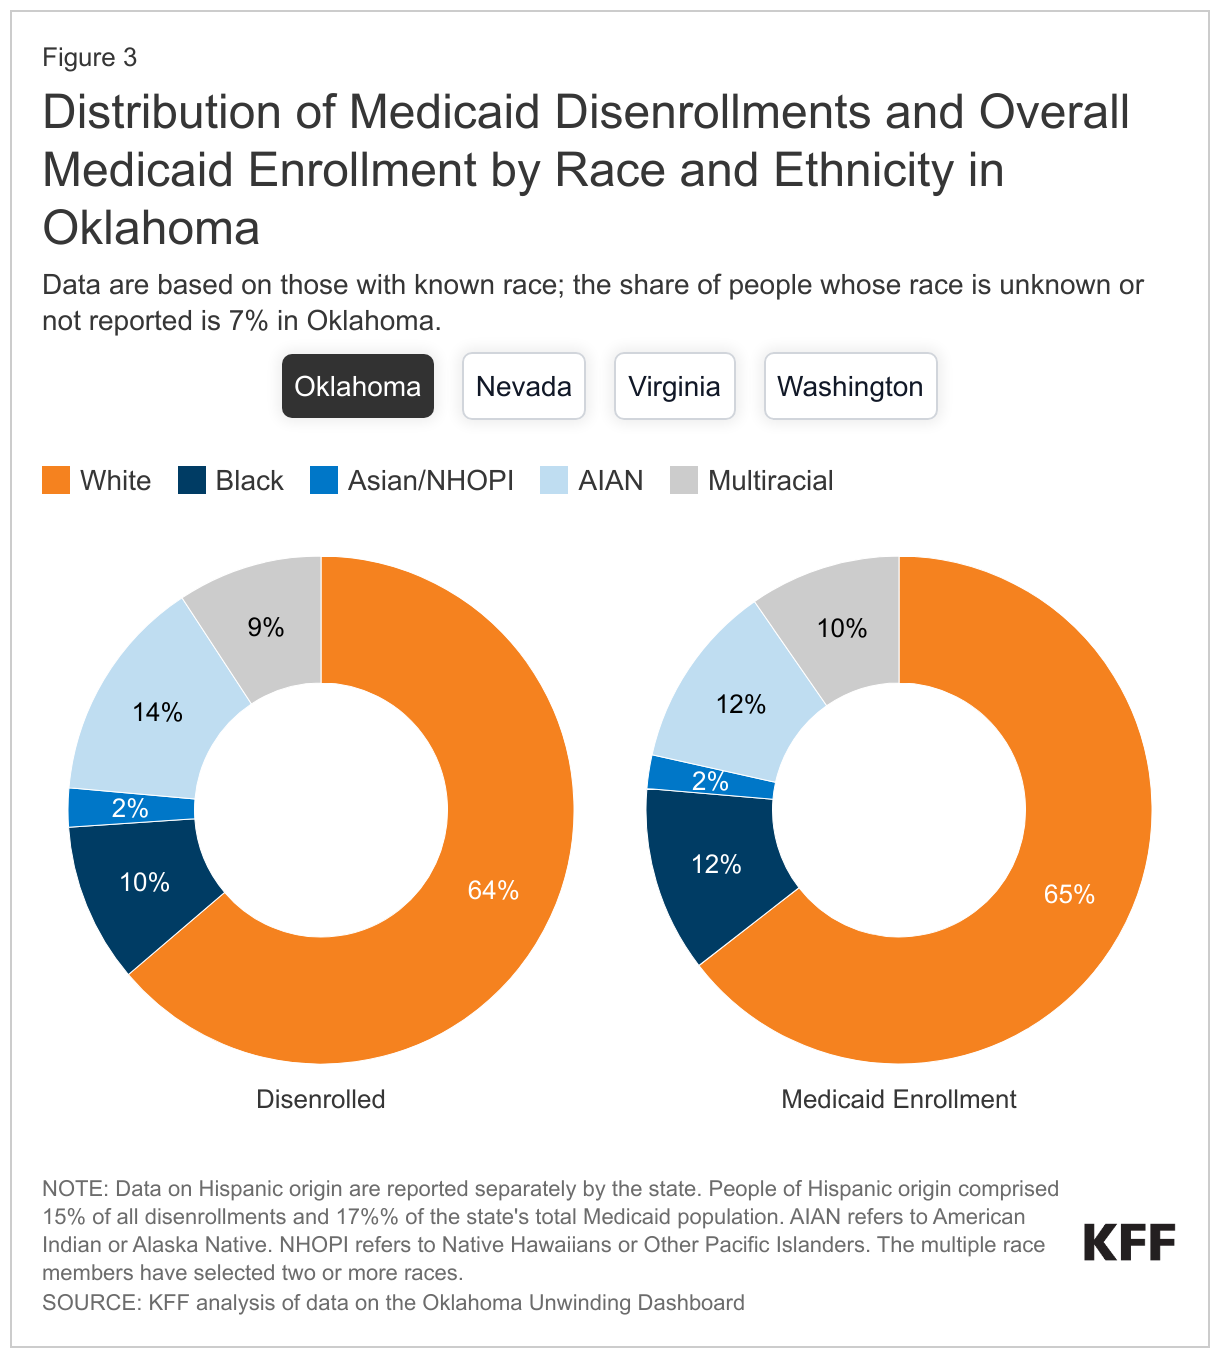
In the four states that are reporting the distribution of disenrollments, the racial and ethnic composition of people losing coverage generally mirrors that of the overall Medicaid population. The share of disenrollments people of color make up varies across states from 36% in Oklahoma to 64% in Nevada, reflecting state differences in the overall share of Medicaid enrollees who are people of color. In general, the share of disenrollments for people of color is within one or two percentage points of their share of total Medicaid enrollment, suggesting that they are not being disproportionately disenrolled (Figure 3). For example, in Oklahoma, people of color account for 36% of disenrollments and represent 35% of total Medicaid enrollment. However, in Virginia, people of color are less likely to be disenrolled than White people; people of color comprise 46% of total Medicaid enrollment but account for only 41% of total disenrollments.
While available data on Medicaid disenrollments by race/ethnicity suggest people of color are not at greater risk of being disenrolled, the data reported to date are limited, and the experiences of people of color in the reporting states may not be similar to those of people in non-reporting states. Compared to the national average, these states have a higher share of Medicaid enrollees who are people of color, including a higher share of Hispanic people but a lower share of Black people. Data from a larger number of states, including more states in the South and Midwest, would provide a more complete picture of disenrollment patterns by race and ethnicity and would show whether some groups are being disenrolled at disproportionate rates. In addition, more standardization of reporting of race and ethnicity data would allow for better comparisons of disenrollment patterns across states.
Continued monitoring of disenrollment data, including by race and ethnicity, will be important to identify shifts in current trends and other potential issues. While states are not required to report demographic data on Medicaid renewal outcomes during the unwinding period, these data provide valuable insights into who is losing coverage and whether certain groups are at greater risk of being disenrolled, both within and across states. This information can help focus outreach efforts where needed or suggest strategies to address disparate impacts. In the absence of state reporting during the unwinding period, Medicaid claims data and survey data that could provide similar information will not be available for years. Overall, 60% of Medicaid enrollees are people of color, and the large number of disenrollments to date, particularly procedural disenrollments, has led to millions of people of color losing Medicaid coverage. Consequently, the unwinding of the Medicaid continuous enrollment provision is likely to have a greater impact on changes in health coverage for people of color, which, in turn, has important implications for their ability to access care and their health outcomes.