Over the last decade, Medicare Advantage, the private plan alternative to traditional Medicare, has taken on a prominent role in the Medicare program. In 2025, more than 34 million Medicare beneficiaries are enrolled in a Medicare Advantage plan – more than half, or 54%, of the eligible Medicare population.
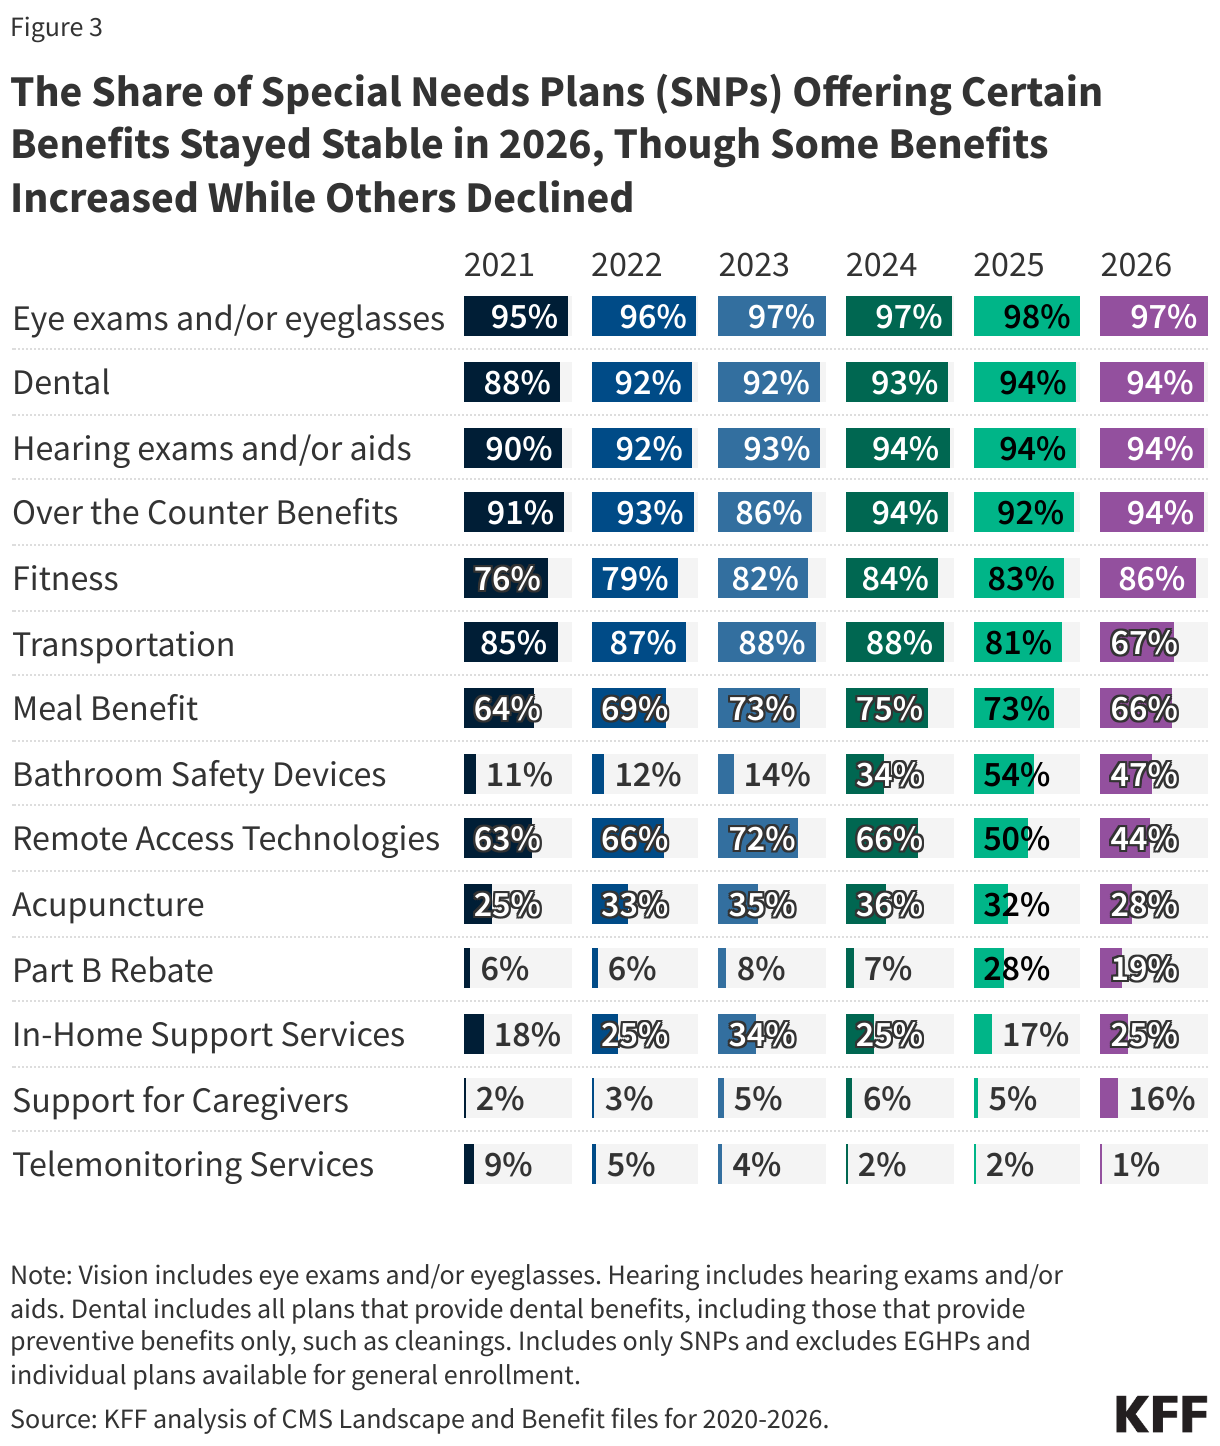
In 2026, the average Medicare beneficiary has a choice of 32 Medicare Advantage prescription drug (MA-PD) plans, two fewer than the 34 in 2025. Virtually all Medicare Advantage plans for 2026 provide multiple extra benefits like vision, hearing, and dental benefits, similar to last year. While Medicare Advantage plan choices are relatively stable for a large share of beneficiaries, the number of enrollees facing plan terminations is increasing in 2026, which could lead to some beneficiaries experiencing disruptions in their coverage.
This brief provides an overview of the Medicare Advantage plans that are available for 2026 and key trends over time. This analysis uses data from the CMS Landscape files. In general, this brief refers to individual Medicare plans available for general enrollment, excludes Special Needs Plans (SNPs), except where noted, and excludes employer plans. (See methods for more details.) A second, companion analysis, describes premiums and benefits that are available for 2026 Medicare Advantage plans and over time.
Medicare Advantage Highlights for 2026
- The average Medicare beneficiary has the option of 32 Medicare Advantage prescription drug (MA-PD) plans in 2026, two fewer than the 34 options available in 2025. Across all plans for individual enrollment, including those with and without prescription drug coverage, the average beneficiary has 39 options in 2026, compared to 42 options in 2025.
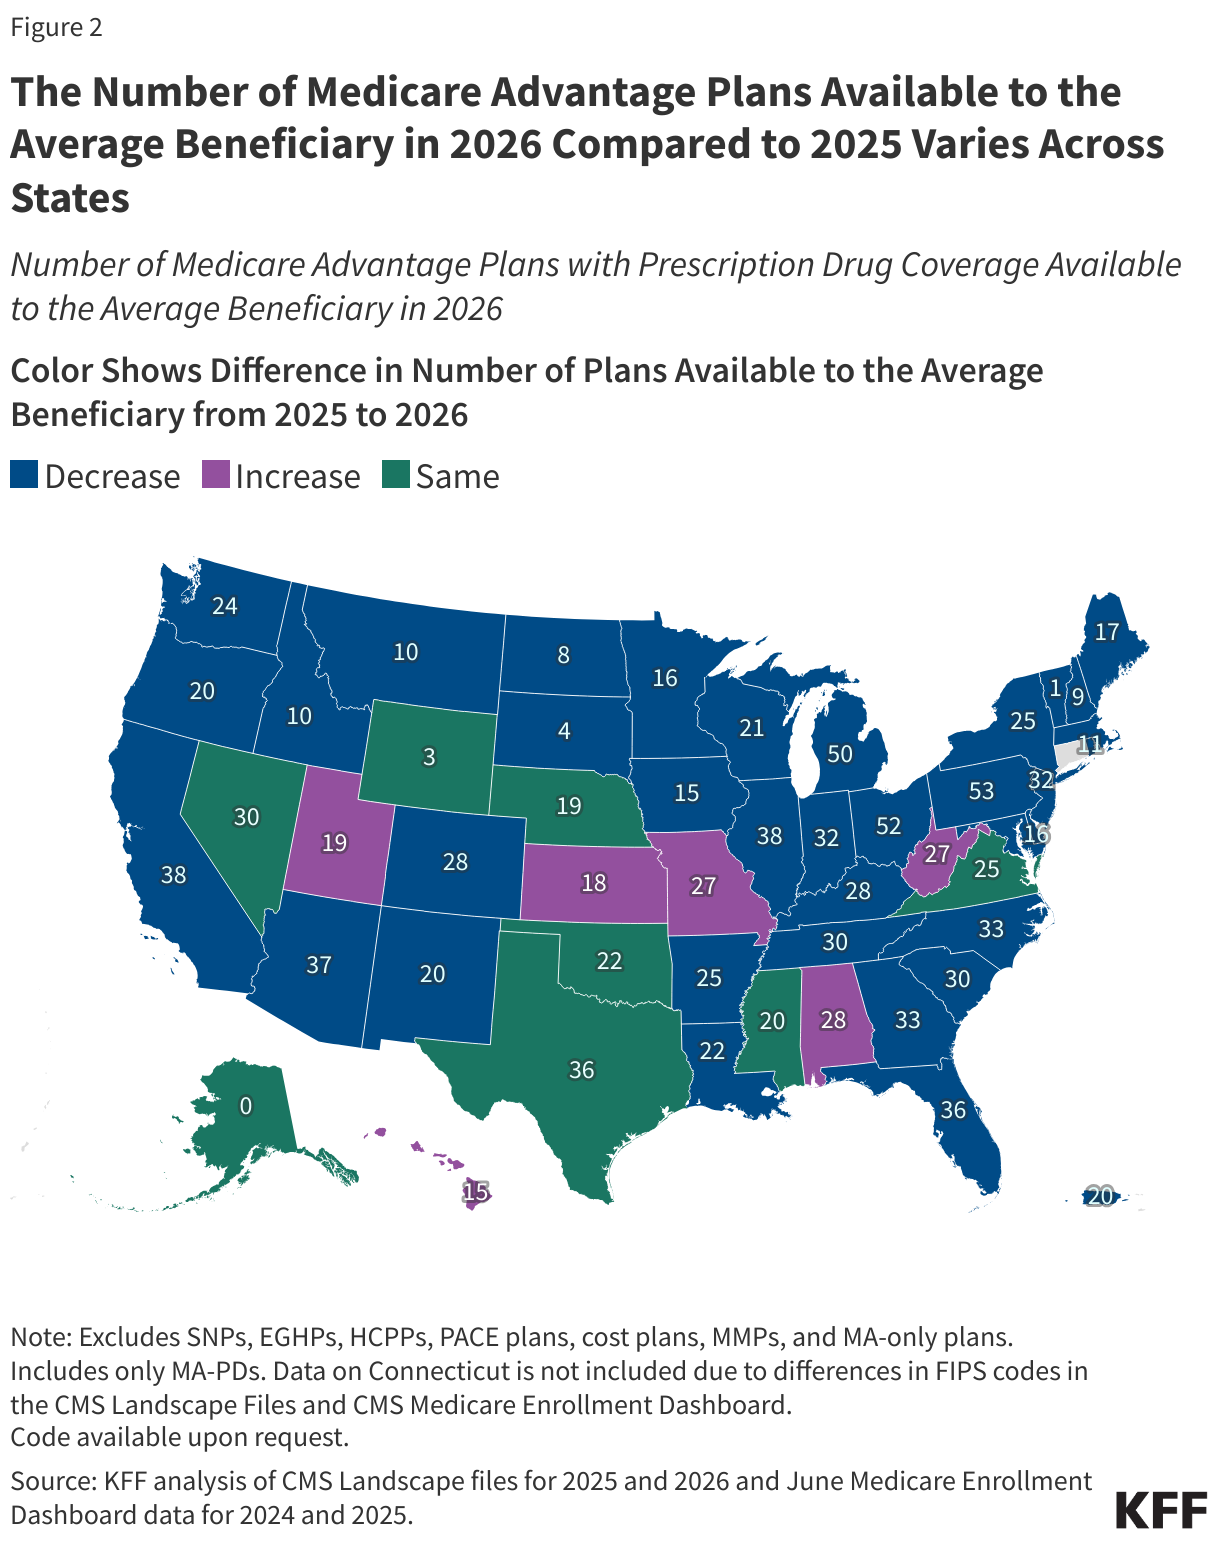
- The number of plans with prescription drug coverage available to the average beneficiary varies across states in 2026, as does the change in the number of plans compared to 2025. In 35 states, DC and Puerto Rico, the average beneficiary has a choice of fewer plans on average in 2026 than in 2025, while in six states, the average beneficiary has a choice of more plans, and in eight states the number of plans available, on average, stayed the same.
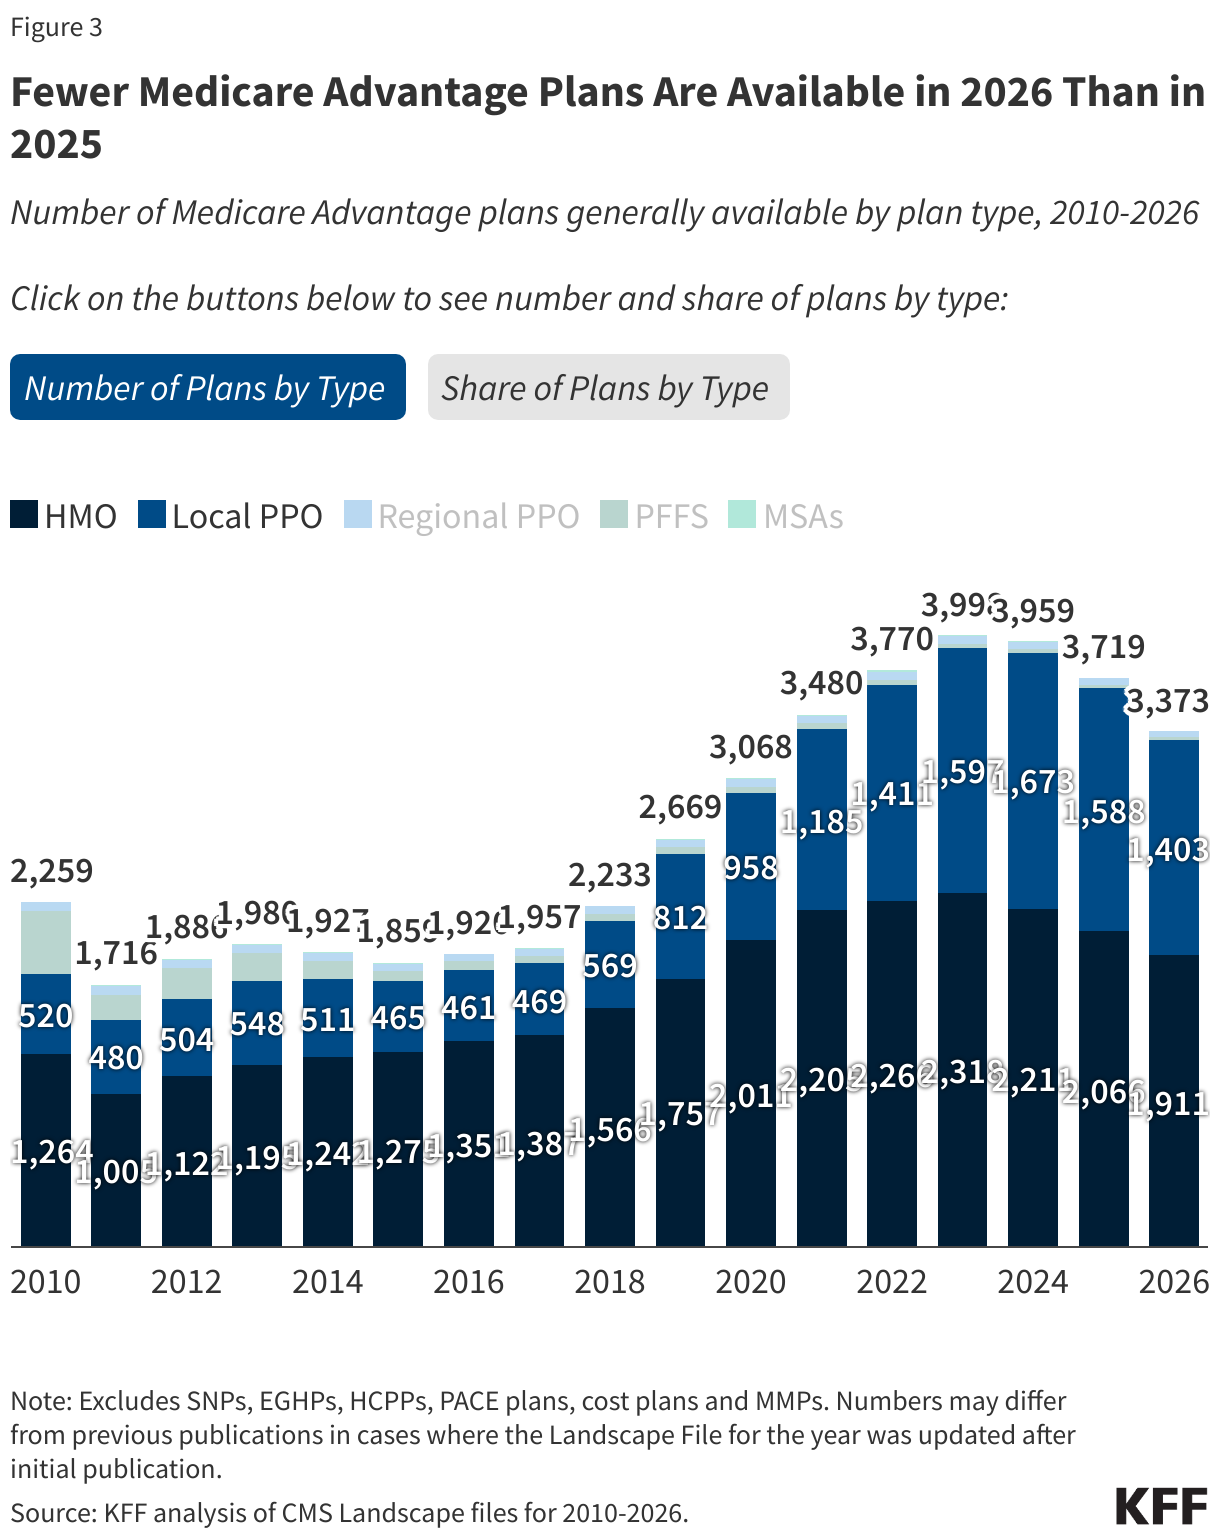
- In total, 3,373 Medicare Advantage plans, including those without prescription drug coverage, are available nationwide for individual enrollment in 2026 – a 9% decrease from 2025. HMOs account for more than half (57%) of all Medicare Advantage plans offered in 2026 but have declined as a share of all Medicare Advantage plans since 2017 (71% of plans). During this period local PPOs have risen as a share of all plans, increasing from 24% to 42%.
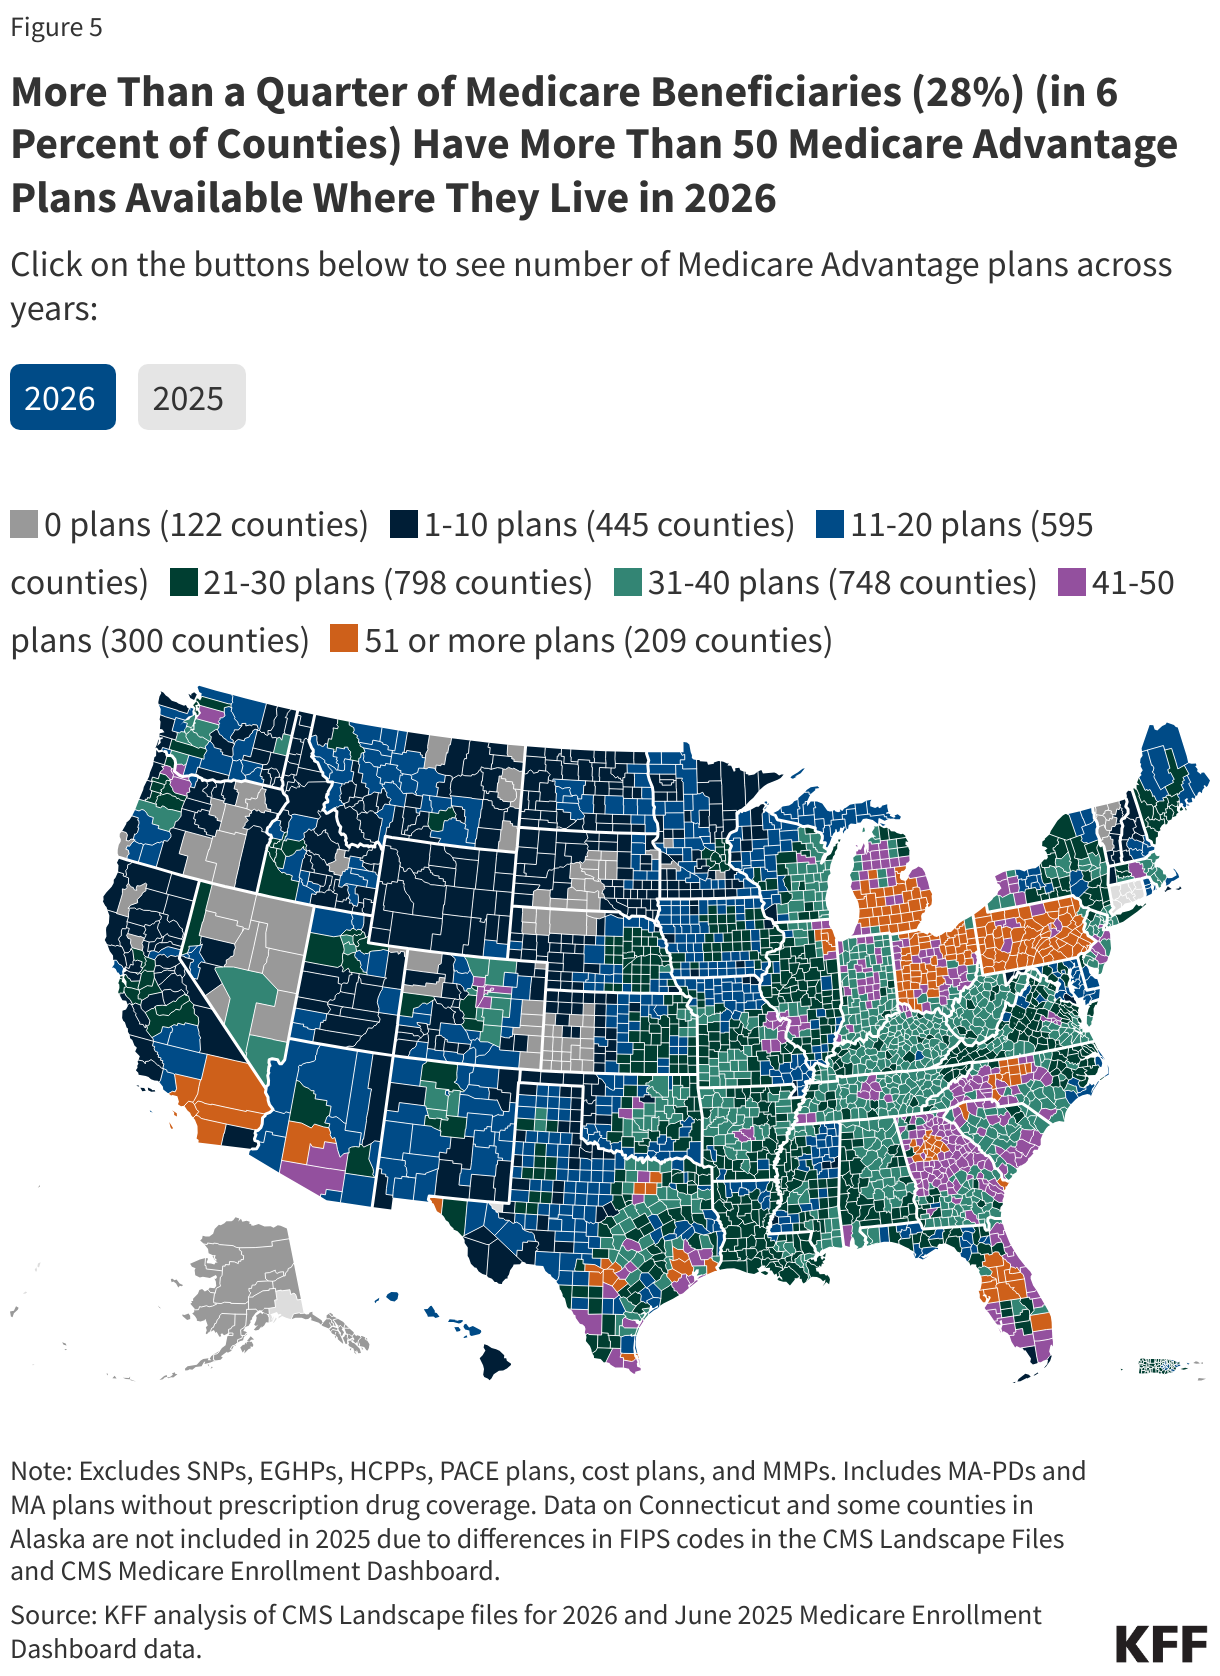
- More than a quarter of all Medicare beneficiaries (28%) live in a county with more than 50 Medicare Advantage plans available in 2026, up from seven percent in 2020, but down from 32% in 2025.
- Less than 1% of Medicare beneficiaries live in a county with no plans available. These beneficiaries live in 122 counties across 13 states (Alaska, California, Colorado, Idaho, Kansas, Minnesota, Montana, Nebraska, Nevada, Oregon, South Dakota, Utah, and Vermont) and territories other than Puerto Rico.
- The average Medicare beneficiary can choose from among plans offered by eight firms in 2026, the same as in 2025 and 2024.
- The two largest Medicare Advantage insurers – UnitedHealthcare and Humana – are exiting more counties – meaning they are no longer offering any plans in those counties – than they are entering in 2026. For example, UnitedHealthcare is exiting 225 counties, while entering 14 new counties and Humana is exiting 198 counties, while entering five new counties. Each insurer is offering plans in roughly 80% of all U.S. counties, a decline from 2025, when each insurer was offering plans in nearly 90% of counties.
- Across all Medicare Advantage insurers that are exiting any markets, the set of counties that each Medicare Advantage insurer is exiting do not completely, or in many cases, largely overlap. The different decisions of insurers to exit some counties suggest a combination of factors are at play, including local market characteristics, cost pressures, shifts in firm-level strategies, and ultimately the insurers’ assessment of potential profits.
- About 13% of beneficiaries enrolled in individual MA-PDs this year (or about 2.6 million people) are in a plan that has been terminated for 2026, an increase from 2025 when nearly 1.3 million Medicare Advantage enrollees faced a termination. Additionally, up to 6% of enrollees in MA-PDs (or as many as 1.3 million people) are in a plan affected by a consolidation, meaning some portion of this 1.3 million people will be moved into another plan under the same insurer automatically.
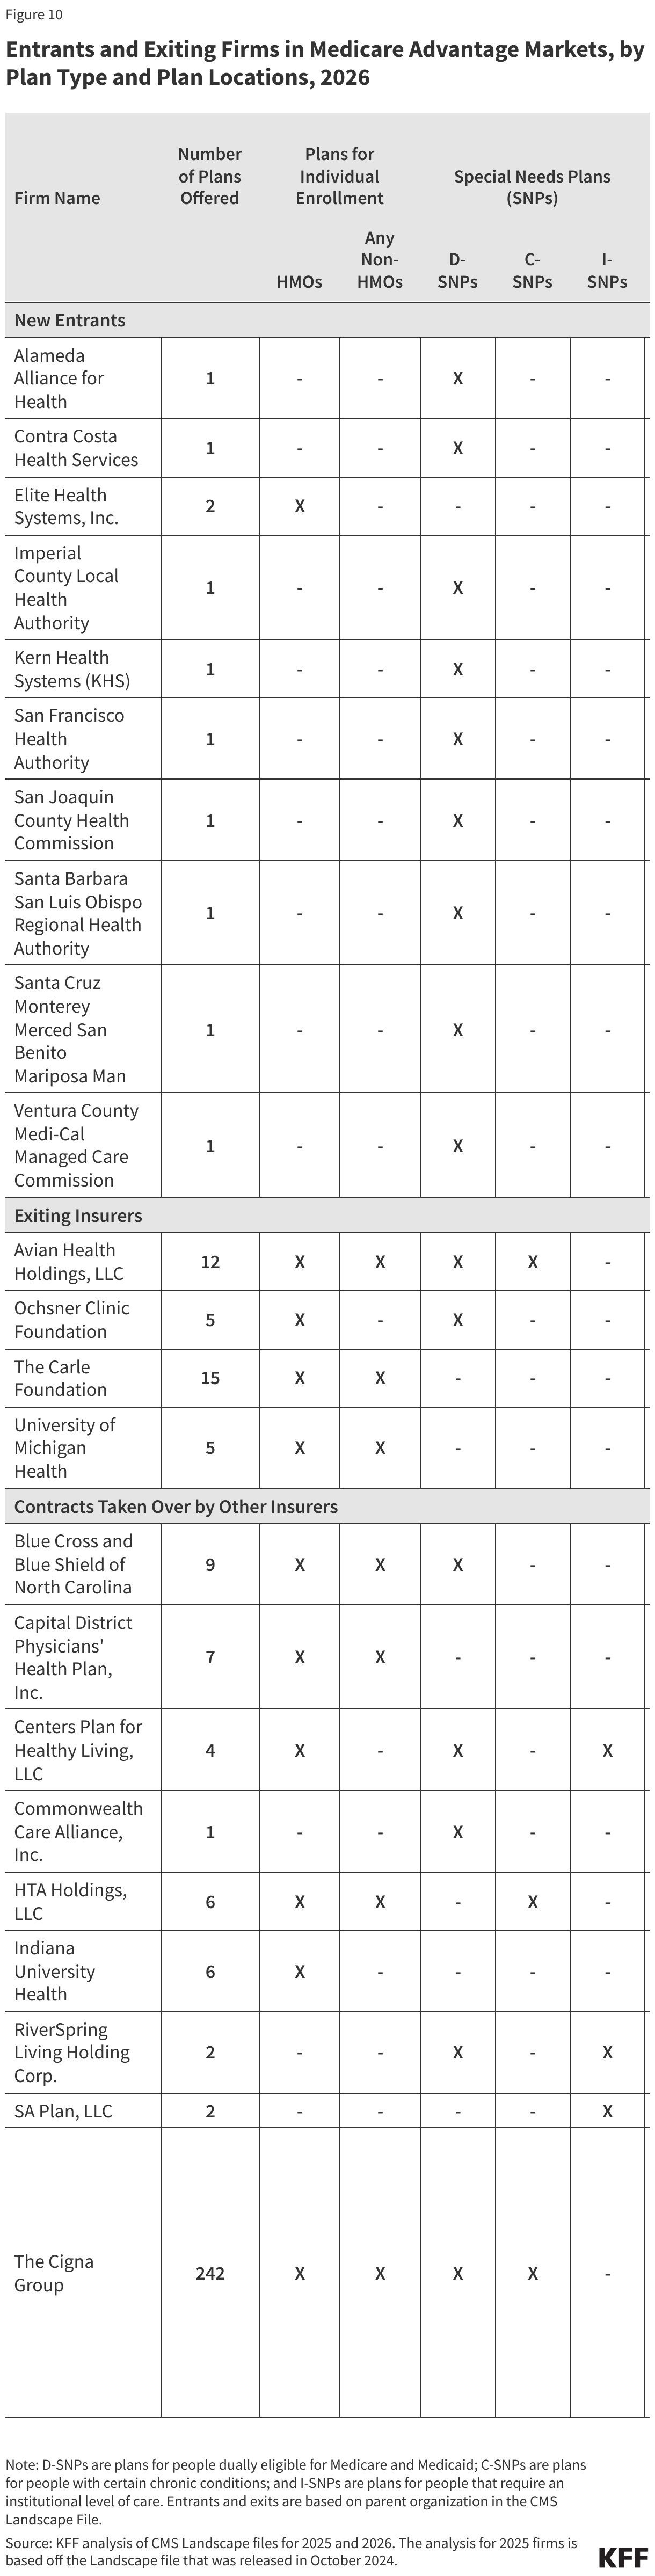
- In 2026, ten firms entered the market for the first time (nearly all offering D-SNPs), four firms exited the market, and nine had contracts taken over by other insurers.
Plan Offerings in 2026
Number of Plans Available to Beneficiaries
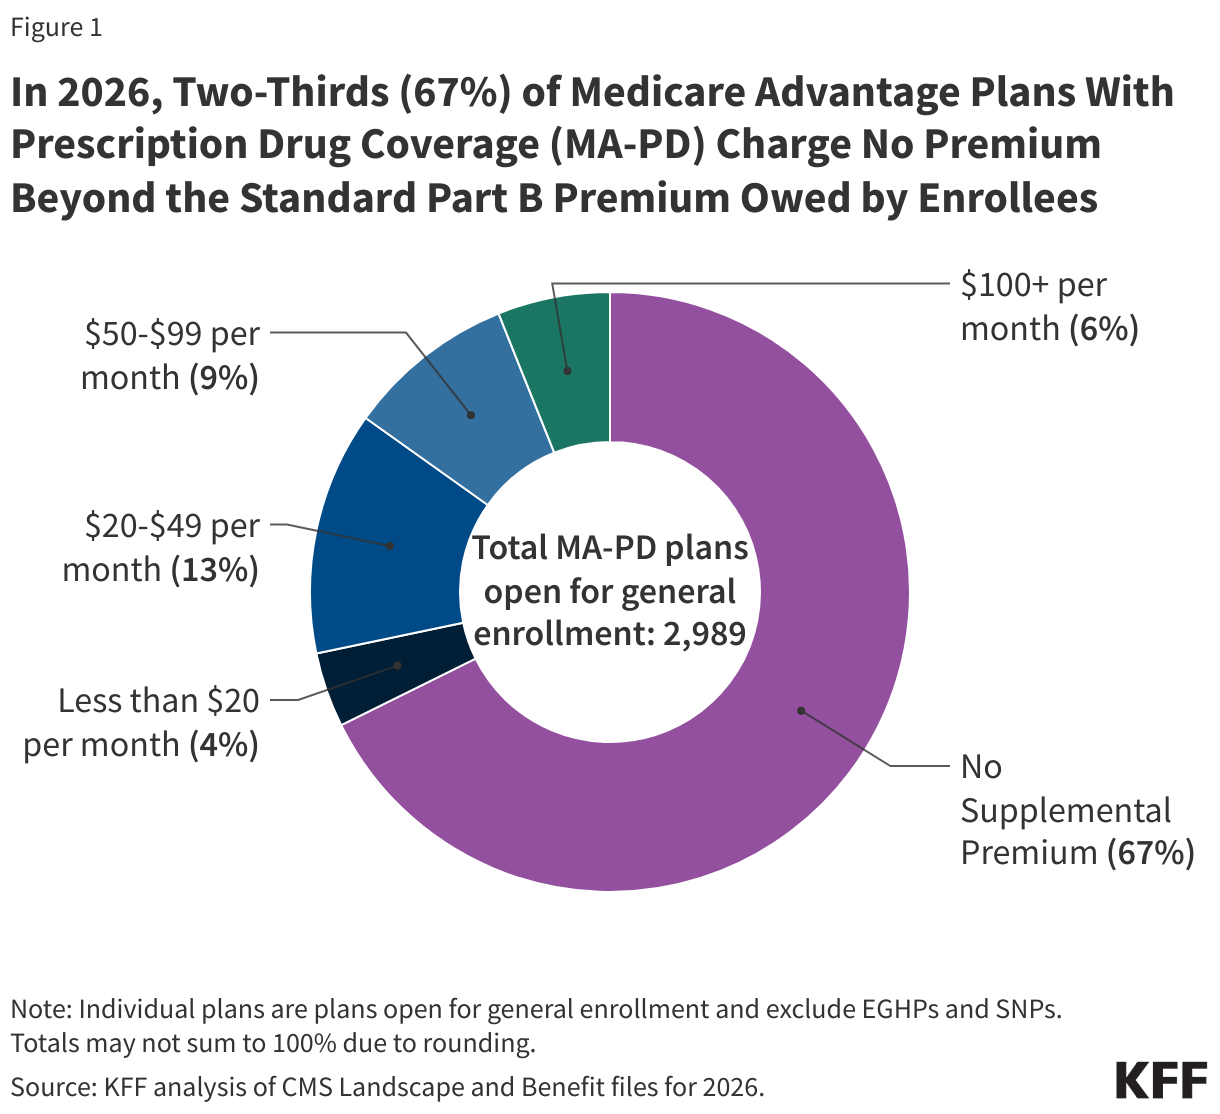
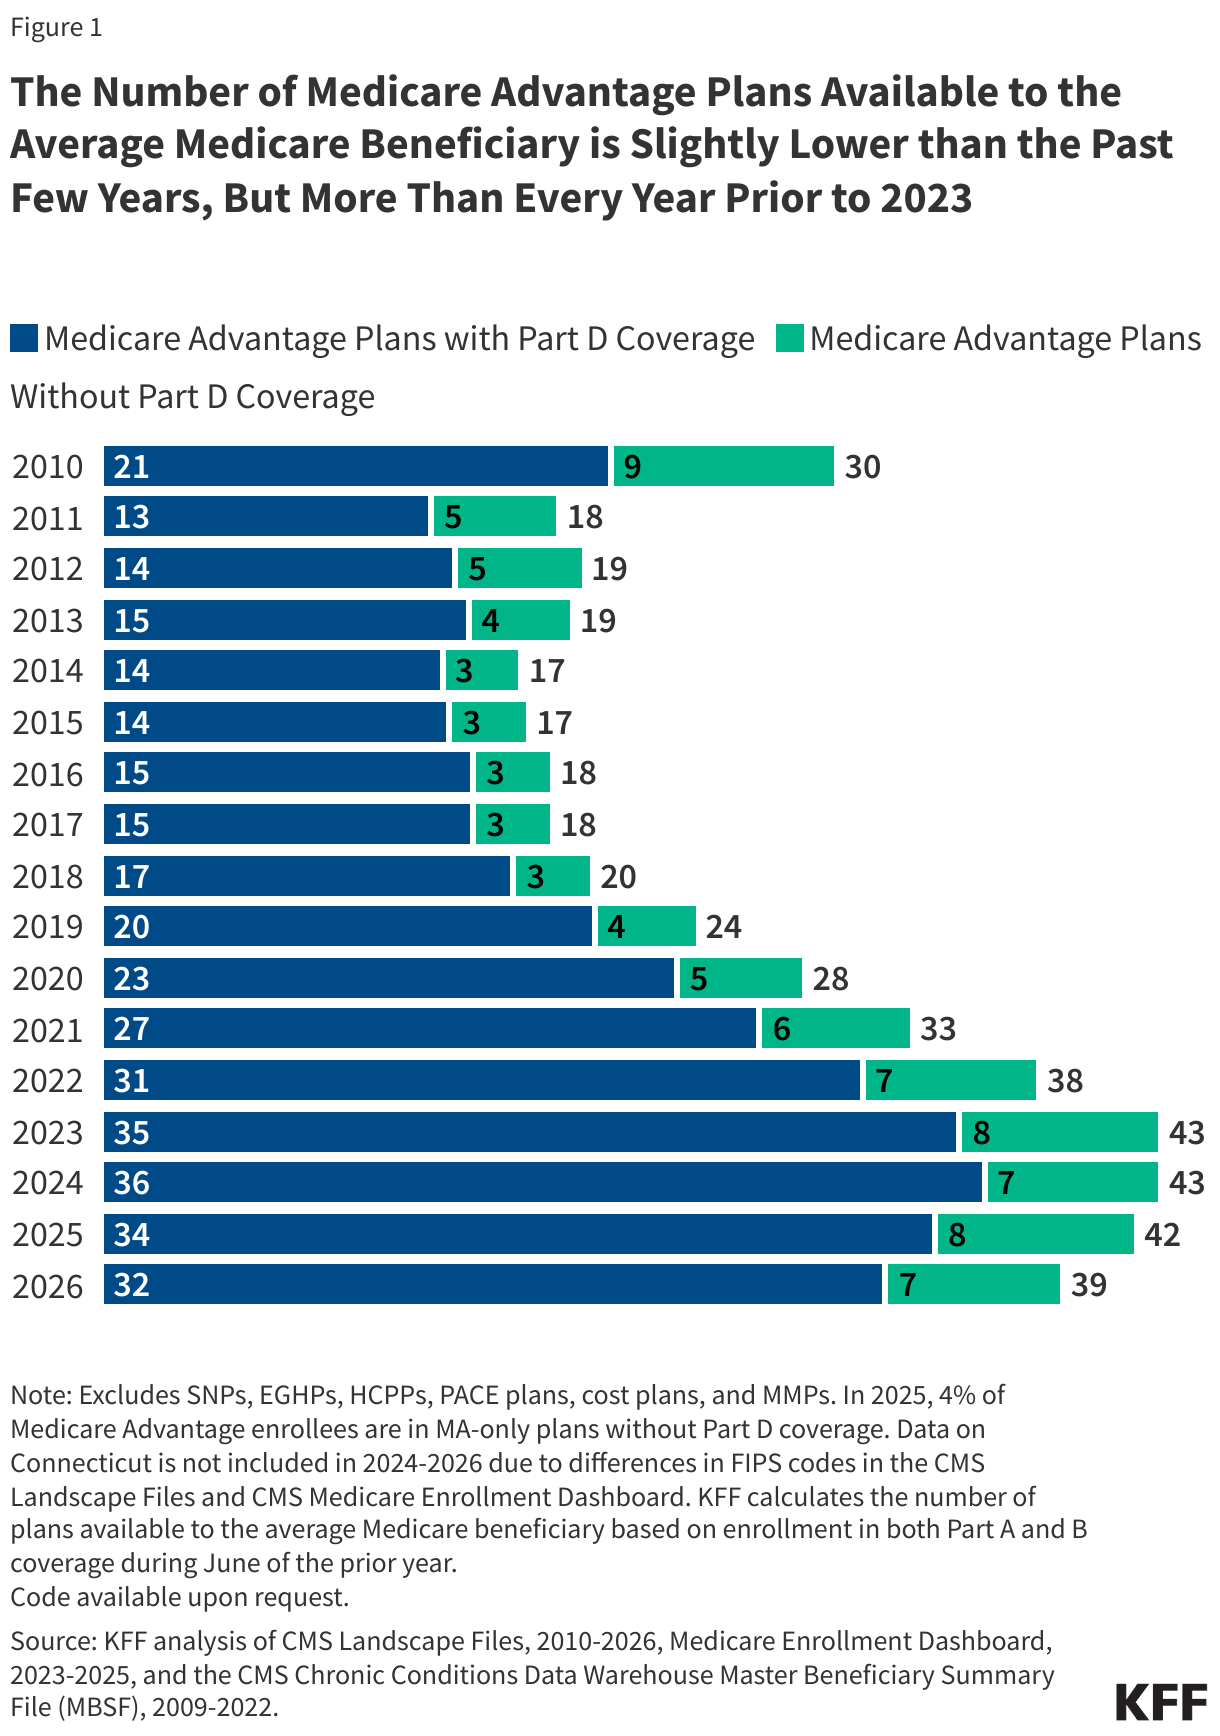
For 2026, the average Medicare beneficiary has access to 32 Medicare Advantage prescription drug (MA-PD) plans, two fewer than the 34 in 2025 (Figure 1). The number of MA-PD options has grown steadily since 2010, peaking in 2024 when the average Medicare beneficiary had 36 options. Despite the decline in offerings over the last two years, the number of options available for 2026 is higher than the number available in 2022 (31) and every year before.
Across all plans for individual enrollment, including those with and without prescription drug coverage, the average beneficiary has 39 options in 2026, compared to 42 options in 2025. These numbers exclude employer- or union-sponsored group plans, Special Needs Plans (SNPs), PACE plans, cost plans, and Medicare-Medicaid plans (MMPs) that are only available to select populations.
Number of Plans Available to Beneficiaries, by State
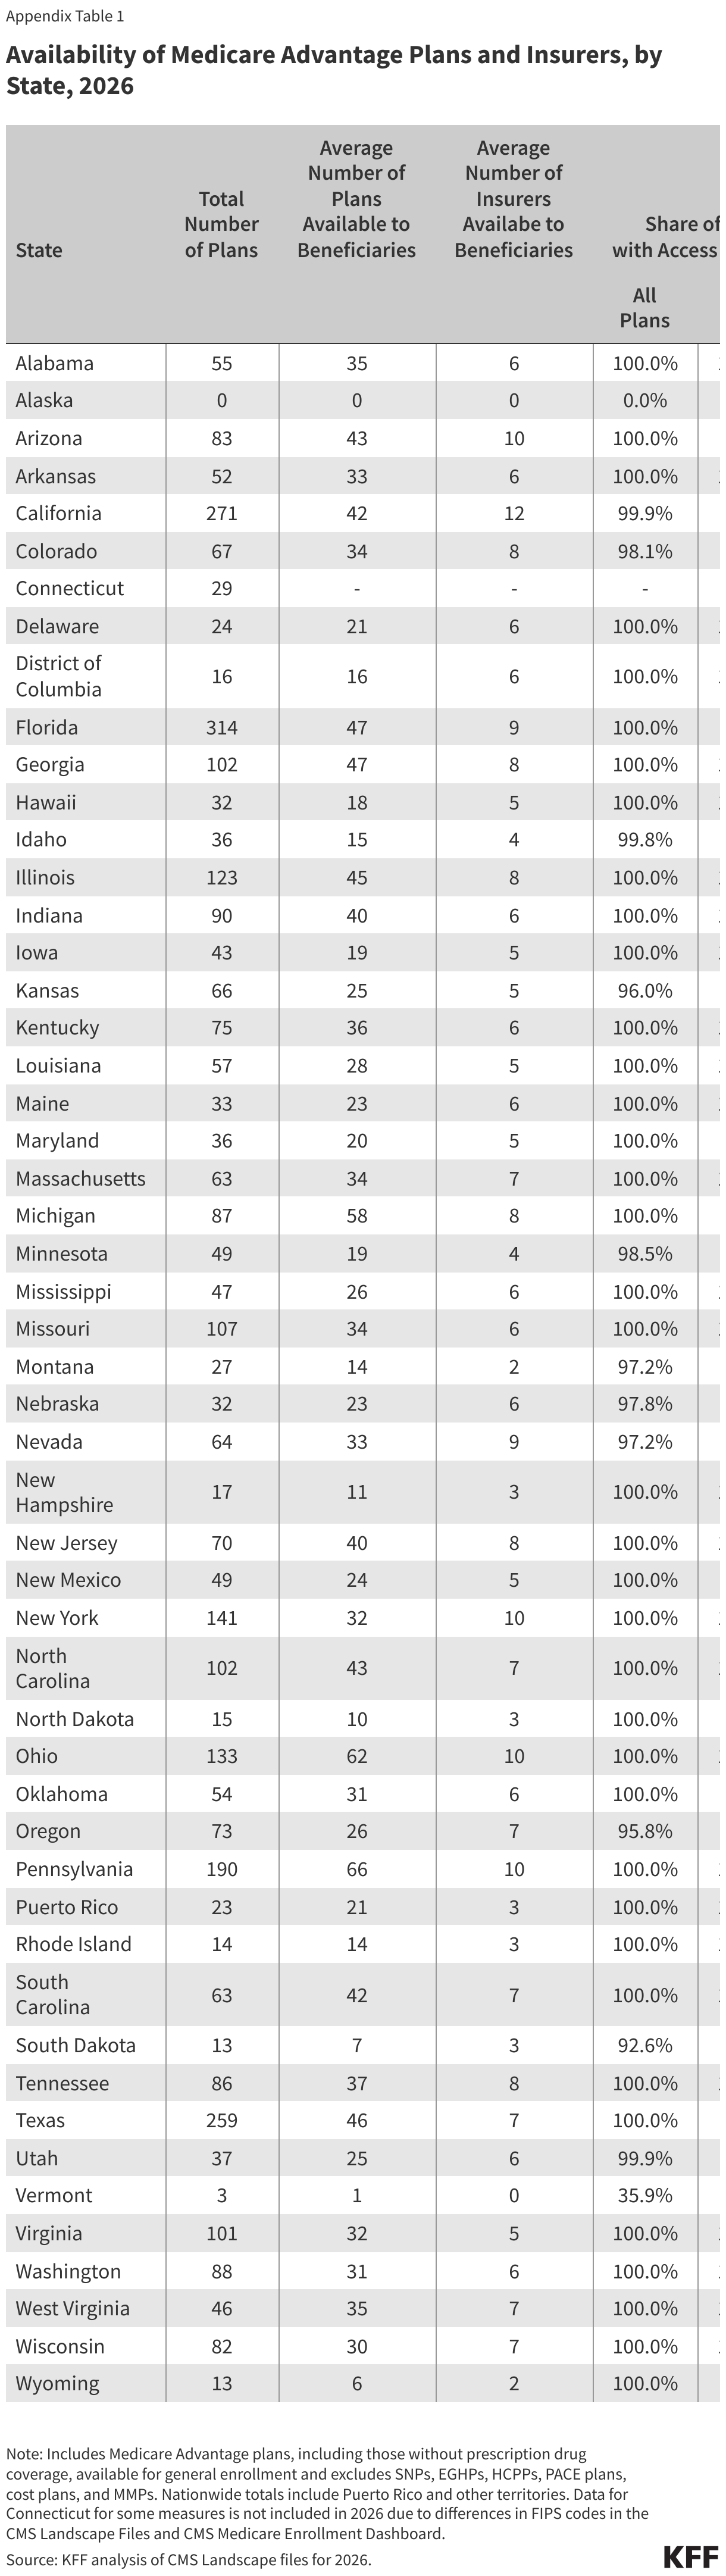
The number of Medicare Advantage plans with prescription drug coverage available to the average beneficiary varies across states, as does the change in the number of plans compared to 2026 (Figure 3). In 35 states, DC and Puerto Rico, the average beneficiary has a choice of fewer plans on average in 2026 than in 2025.
The states with the largest drop in the number of plans available were New Hampshire (13 fewer plans) and Minnesota (11 fewer plans). In Minnesota, UCare, the second largest Medicare Advantage insurer in the state, exited the market altogether (excluding one D-SNP plan), while UnitedHealthcare and Humana decreased their offerings, especially in more rural counties with lower Medicare Advantage enrollment. Additionally, several more rural states have four or fewer options on average, including South Dakota (4 MA-PDs), Wyoming (3 MA-PDs), Vermont (1 MA-PD) and Alaska (0). Alaska had no plans available in 2026, as in 2025 (Alaska has historically had few or no Medicare Advantage plans available for general enrollment).
In six states (AL, HI, KS, MO, UT, and WV), the average beneficiary has access to more plans in 2026 than in 2025, on average. In the remaining eight states, the number of plans available to the average beneficiary stayed the same (including Alaska, with no MA-PDs in either year). Connecticut is not included in this calculation because of differences in how counties are reported across CMS enrollment and plan files.
Total Number of Plans
Individual plans. In total, 3,373 Medicare Advantage plans, including those without prescription drug coverage, are available nationwide for individual enrollment in 2026 – a 9% decrease from the number of plans (346 fewer plans) offered in 2025 (Figure 3).
HMOs account for more than half (57%) of all Medicare Advantage plans offered in 2026 but have declined as a share of all Medicare Advantage plans since 2017 (71% of plans) (Figure 3). During this period local PPOs have risen as a share of all plans, increasing from 24% to 42%. The share of plans that are regional PPOs has declined from around 3% of plans offered in 2017 to 1% in 2026 (Appendix Figure 1).
The number of plans offered by plan type mostly mirrors Medicare Advantage enrollment in HMOs (59%) and PPOs (40%) in 2025. The increasing availability of PPOs may reflect interest in plans with some out-of-network coverage, as physician availability is an important component when Medicare Advantage enrollees select their plan.
While many employers and unions also offer Medicare Advantage plans to their retirees, no information about these 2026 plan offerings is made available by CMS to the public during the Medicare open enrollment period. Employer and union plans are administered separately and may have enrollment periods that do not align with the Medicare open enrollment period.
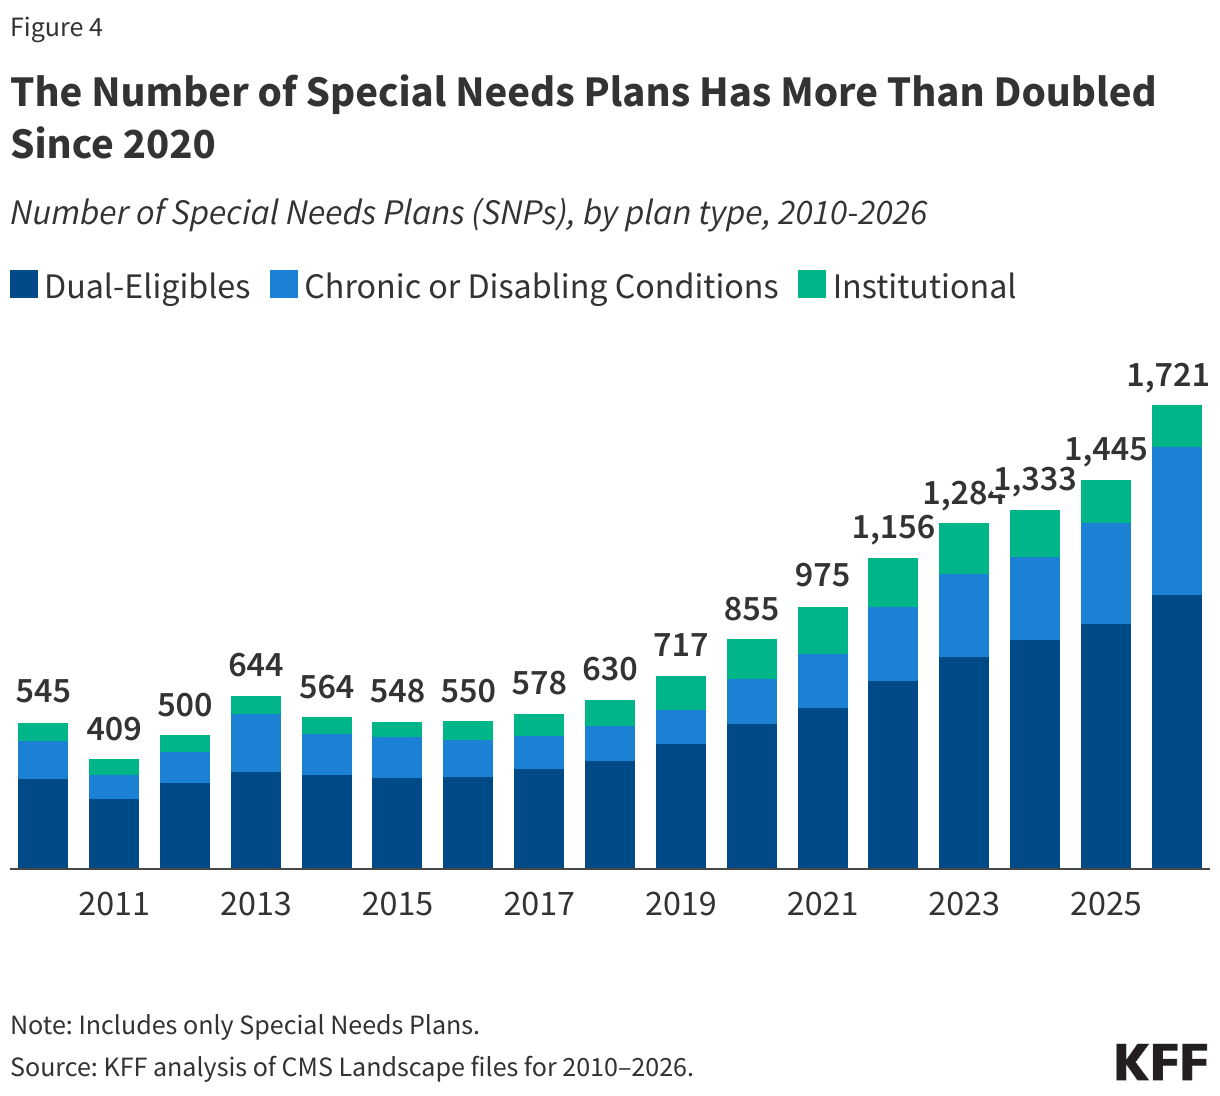
Special Needs Plans (SNPs). In 2026, 1,721 SNPs will be offered nationwide, a 19 percent increase between 2025 and 2026 (Figure 4).
D-SNPs. Nearly six in ten SNPs (59%) are designed for people dually eligible for Medicare and Medicaid (D-SNPs). The number of D-SNPs has nearly doubled since 2020, increasing from 540 D-SNPs in 2020 to 1,019 D-SNPs in 2026 (up from 909 D-SNPs in 2025), suggesting insurers continue to be drawn to this high-need population. In 2025, 6 million Medicare beneficiaries are enrolled in D-SNPs.
C-SNPs. The number of SNPs offered for people with chronic conditions (C-SNPs) has substantially increased, more than tripling since 2020, from 165 plans that year to 548 plans in 2026 (up from 376 plans in 2025). Enrollment in C-SNPs has also increased sharply, rising to 1.2 million Medicare beneficiaries in 2025, comprising 75% of total SNP enrollment growth between 2024 and 2025. The acceleration of C-SNP enrollment and C-SNP offerings coincided with implementation of new rules for D-SNPs requiring greater integration between Medicare and Medicaid, and stricter rules about enrolling a large number of dually-eligible individuals in plans generally available for enrollment, which are not required of C-SNPs.
I-SNPs. The number of SNPs for people who require an institutional-level of care (I-SNPs) increased from 150 plans in 2020 to 189 plans in 2023, before dropping back down to 154 in 2026 (down from 160 plans in 2025). In 2025, about 115,000 Medicare beneficiaries are enrolled in I-SNPs.
Medicare Advantage Plans by County
In 2026, more than a quarter of Medicare beneficiaries (28%) (in 6 percent of counties) can choose from more than 50 Medicare Advantage plans (including plans without prescription drug coverage; Figure 5).
The 28% of Medicare beneficiaries who have more than 50 plan options is a decrease from 2025 when 32% of beneficiaries in 9 percent of counties had a choice of more than 50 plans. Similar to the last three years, the counties with the most plan options are predominantly in Pennsylvania and Ohio. Beneficiaries in Lancaster, Pennsylvania can choose from 82 Medicare Advantage plans – the most offerings of any county in the U.S.
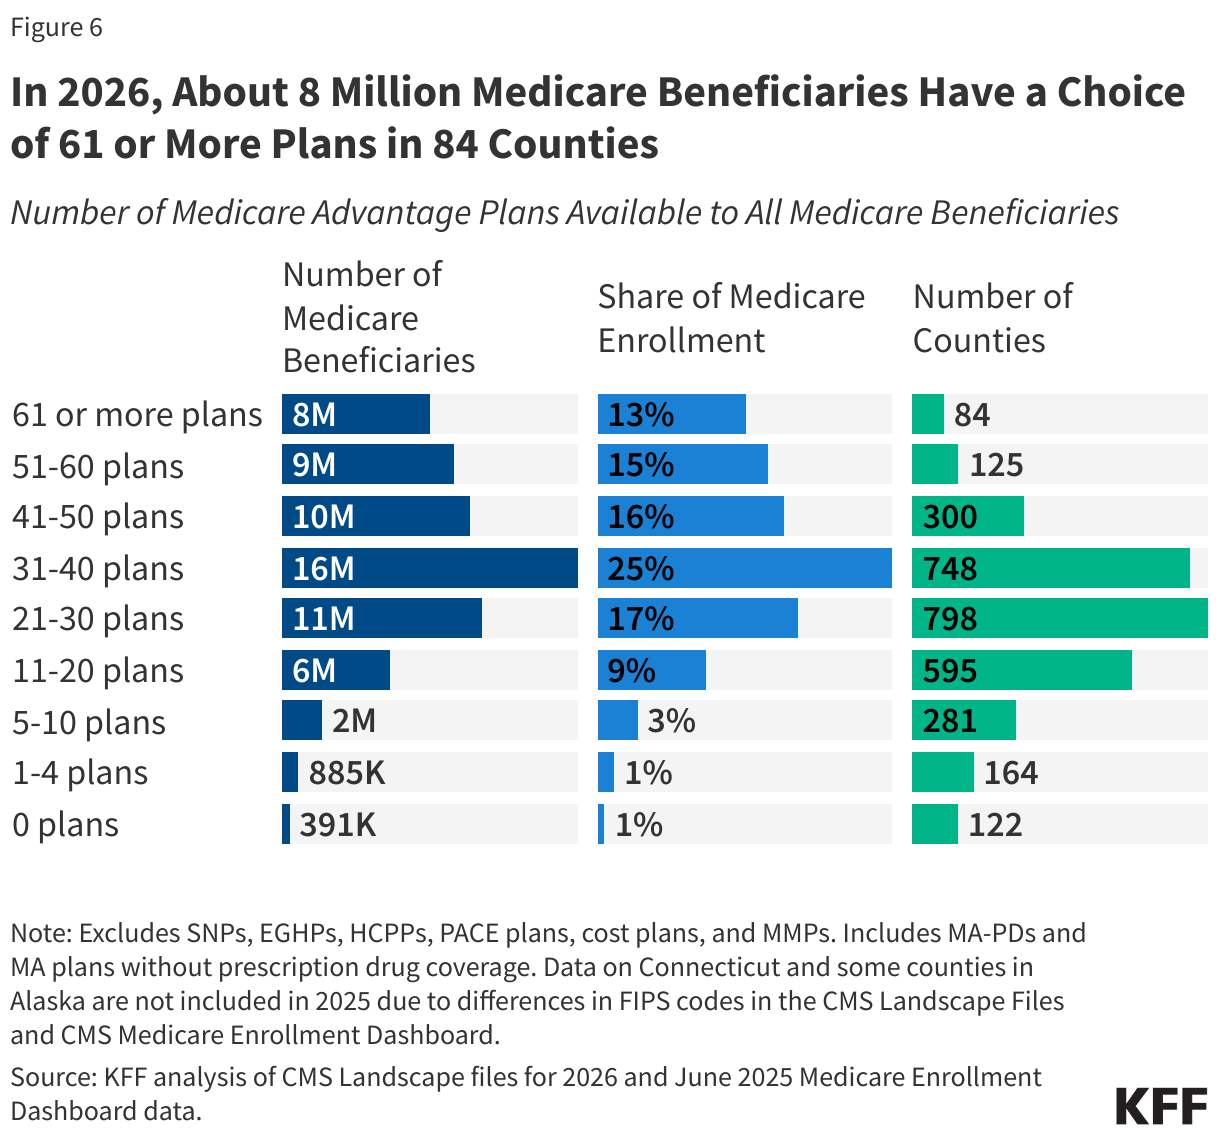
In 2026, about 8 million people have a choice of 61 or more plans (including plans without prescription drug coverage) in 84 counties (Figure 6).
An additional 9 million beneficiaries have a choice of 51 to 60 plans in 125 counties. In contrast, in 2026, 1.4% of beneficiaries live in a county with one to four Medicare Advantage plans available, while less than 1% of beneficiaries live in a county without any plans available. In 122 counties across 13 states (Alaska, California, Colorado, Idaho, Kansas, Minnesota, Montana, Nebraska, Nevada, Oregon, South Dakota, Utah, and Vermont) and territories other than Puerto Rico, about 391,000 Medicare beneficiaries will not have access to a Medicare Advantage plan (an increase from 81 counties and about 250,000 Medicare beneficiaries in 2025). Similar to 2025, there are no Medicare Advantage plans for individual enrollment being offered in any county in Alaska in 2026, which includes about 106,000 beneficiaries.
Medicare Advantage Plans by Geographic Status. As in recent years, virtually all Medicare beneficiaries (99.4%) have access to a Medicare Advantage plan as an alternative to traditional Medicare, but the number of options varies by rurality.
Medicare beneficiaries living in urban areas can choose from 42 Medicare Advantage plans in 2026 on average, including 34 with Part D coverage, substantially more than beneficiaries living in rural areas – both areas adjacent and non-adjacent to urban areas. Beneficiaries in rural counties adjacent to urban areas can choose from an average of 29 plans, including 22 with Part D coverage.
Beneficiaries in the most rural areas – counties not adjacent to rural areas - can choose from an average of 20 plans, including 15 with Part D coverage.
Medicare Advantage Plan Offerings by Firm
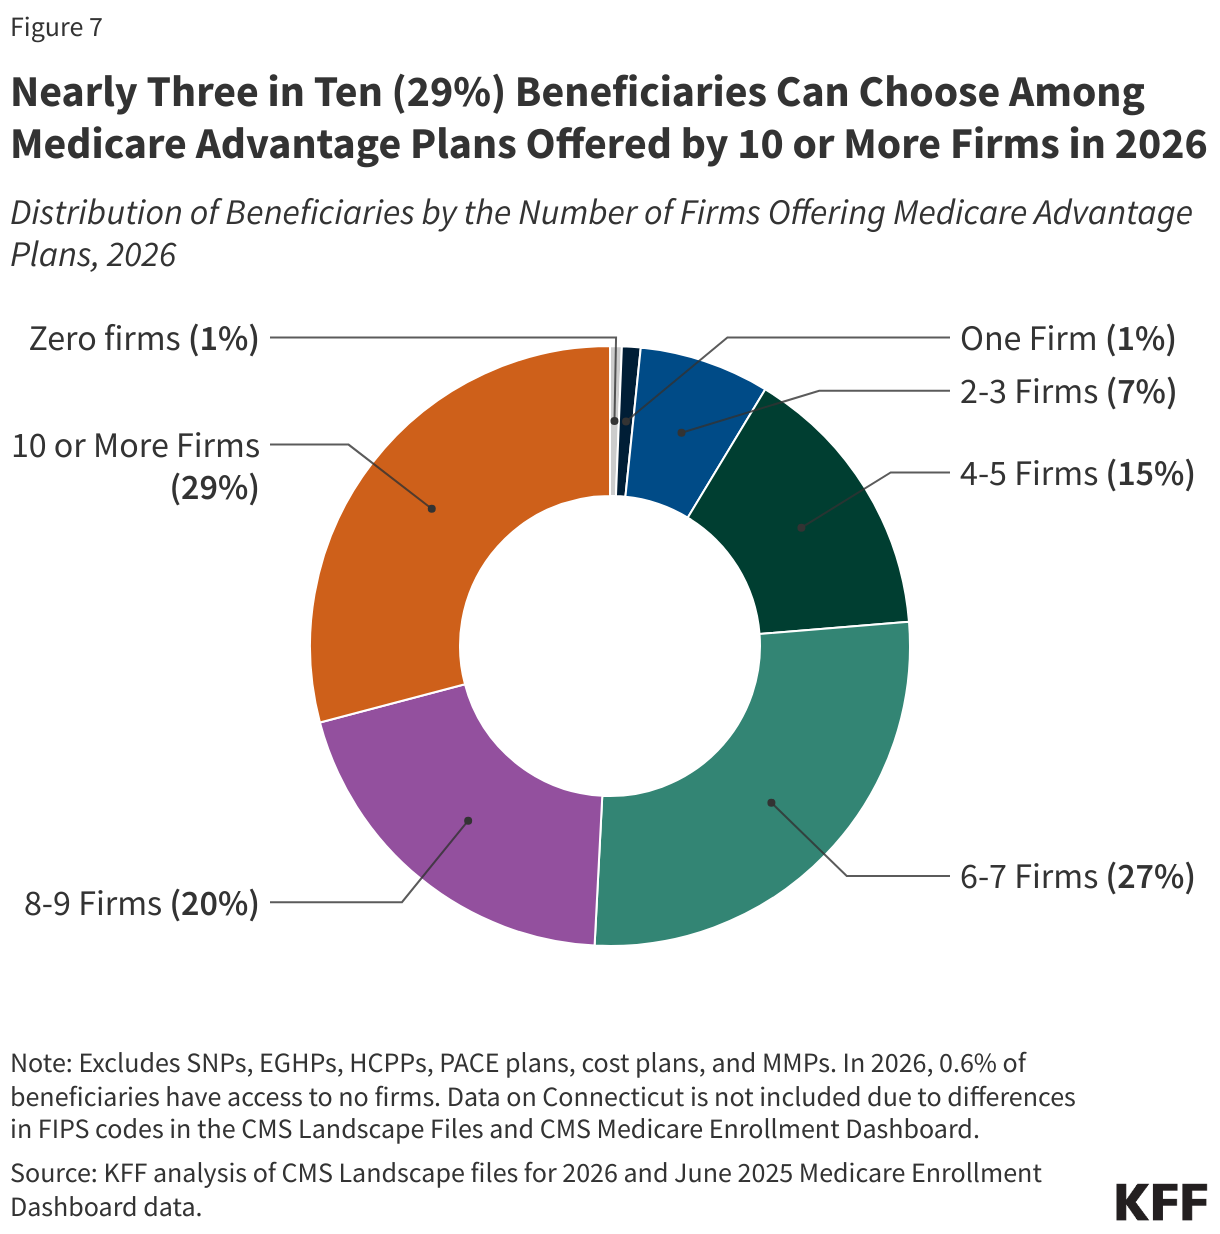
The average Medicare beneficiary is able to choose from plans offered by eight firms in 2026 (Figure 7), the same as in 2024 and 2025. Despite most beneficiaries having access to plans operated by several different firms, enrollment is concentrated in plans operated by UnitedHealthcare and Humana, and together UnitedHealthcare and Humana account for nearly half (46%) of Medicare Advantage enrollment in 2025.
In 2026, nearly three in ten beneficiaries (29%), in 132 counties, are able to choose from plans offered by 10 or more firms or other sponsors (a decline from 31% in 2025). In contrast, 8% of beneficiaries live in a county where one to three firms offer Medicare Advantage plans (714 counties, an increase from 501 counties in 2025).
Further, in 171 counties, only one firm will offer Medicare Advantage plans in 2026. These are mostly rural counties with relatively few Medicare beneficiaries (less than 1.5% of the Medicare population). In some of these counties, there were no firms offering Medicare Advantage in 2025, e.g., two counties in Idaho (Clatsop and Tillamook). In contrast, Medicare beneficiaries in some counties had access to three firms in 2026 but only one firm in 2025, such as people living in five counties in Vermont (Caledonia, Essex, Orange, Windham, and Windsor). In Vermont, Vermont Blue Advantage (Blue Cross Blue Shield of Vermont), the largest Medicare Advantage insurer in the state in 2025, ended its Medicare Advantage coverage, as did UnitedHealthcare. Humana is offering plans in five of Vermont’s 14 counties. The remaining counties in Vermont have no Medicare Advantage options for 2026.
Availability of Plans by Firm and County
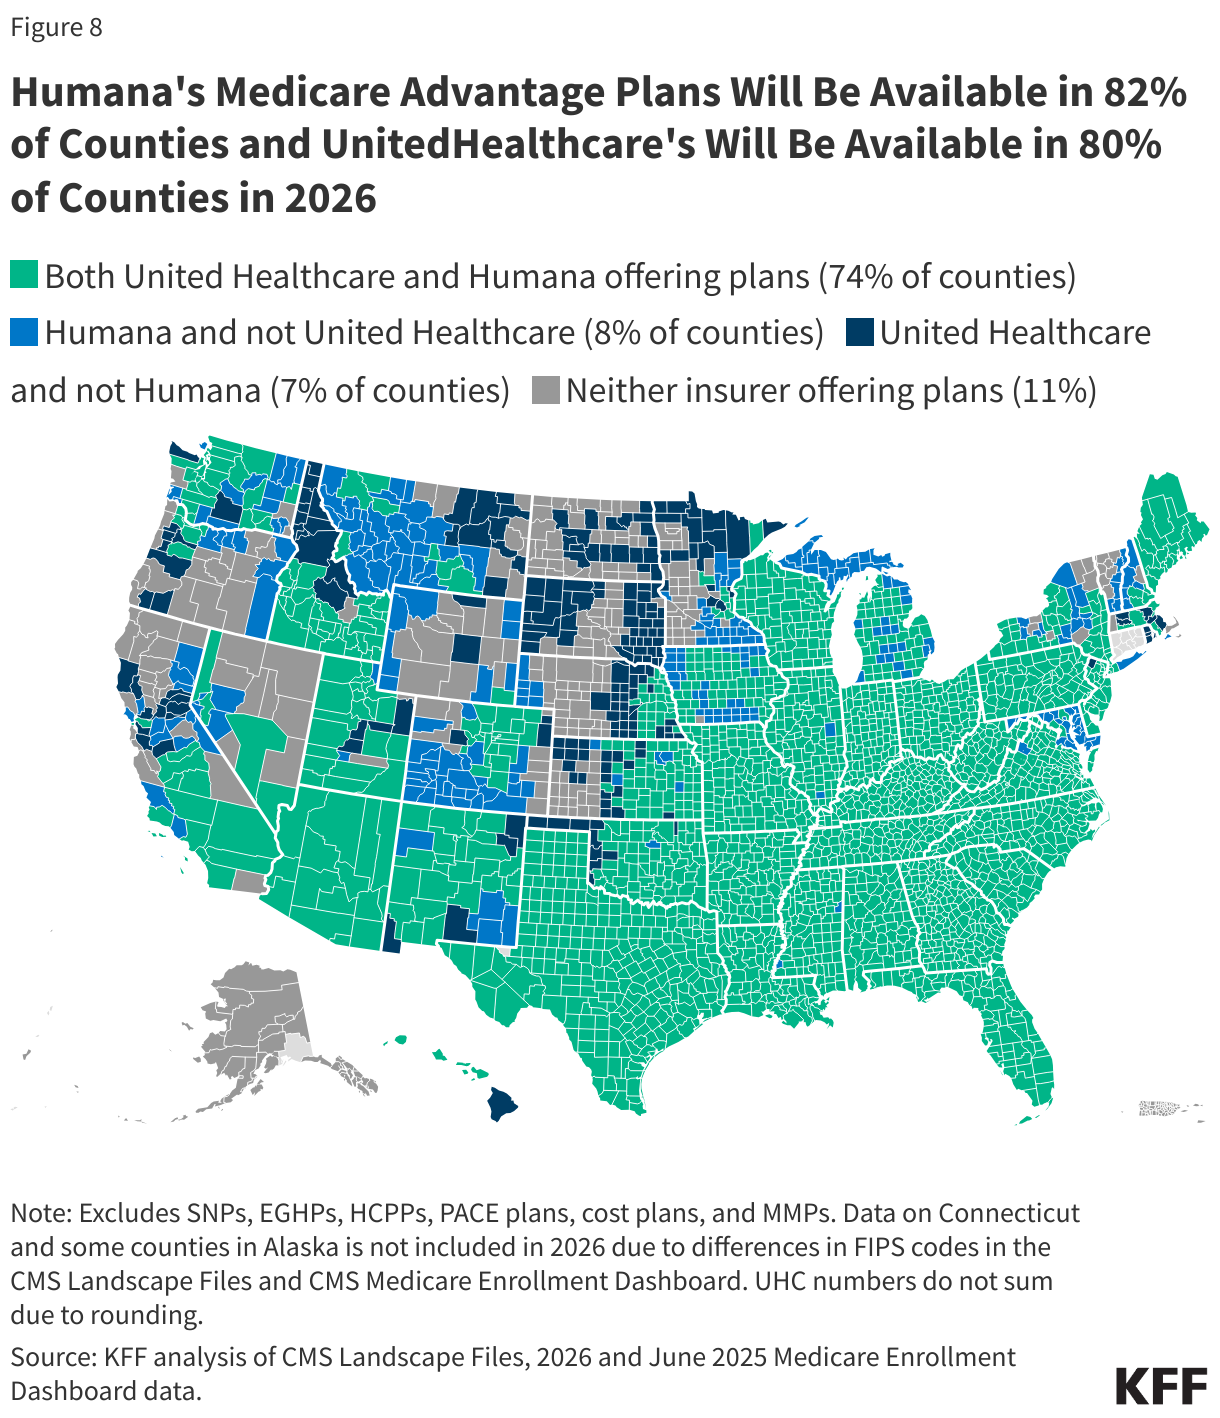
UnitedHealthcare and Humana, the two firms with the most Medicare Advantage enrollees in 2025, have large footprints across the country, offering plans in the majority of counties, though their footprints have slightly shrunk compared to 2025 (Figure 8).
For example, in 2026, Humana will be in 82% of counties, down from 89% of counties in 2025, and United Healthcare will be in 80% of counties in 2026, down from 87% of counties in 2025. Neither insurer will offer plans in 11% of counties, up from 5% of counties in 2025.
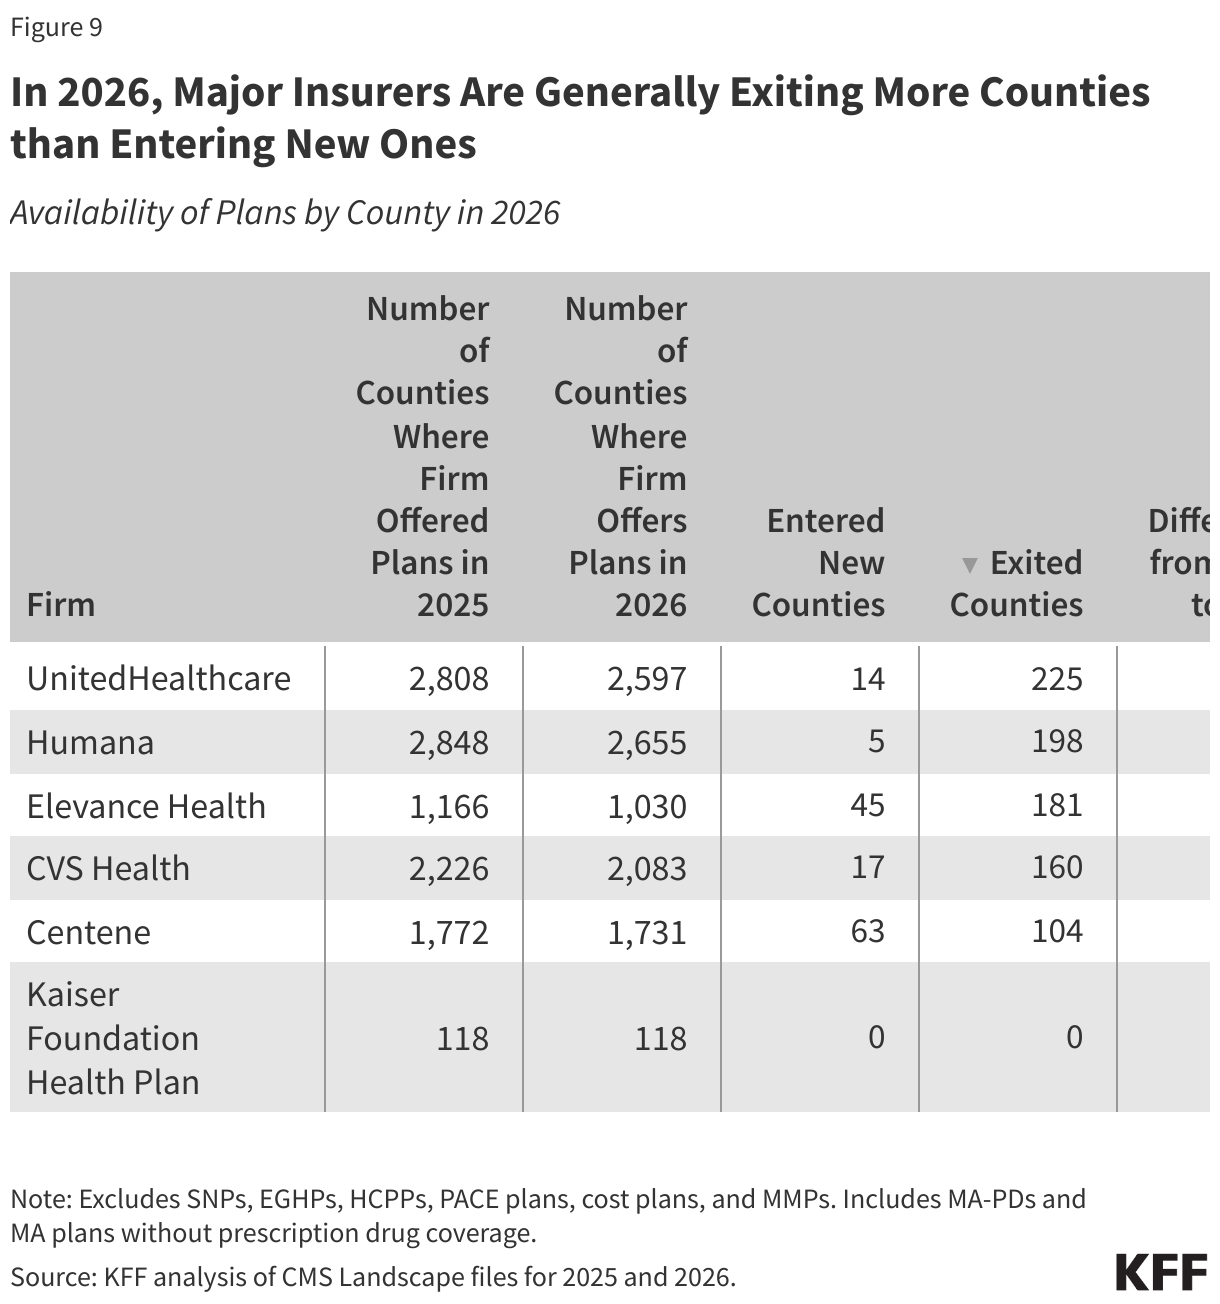
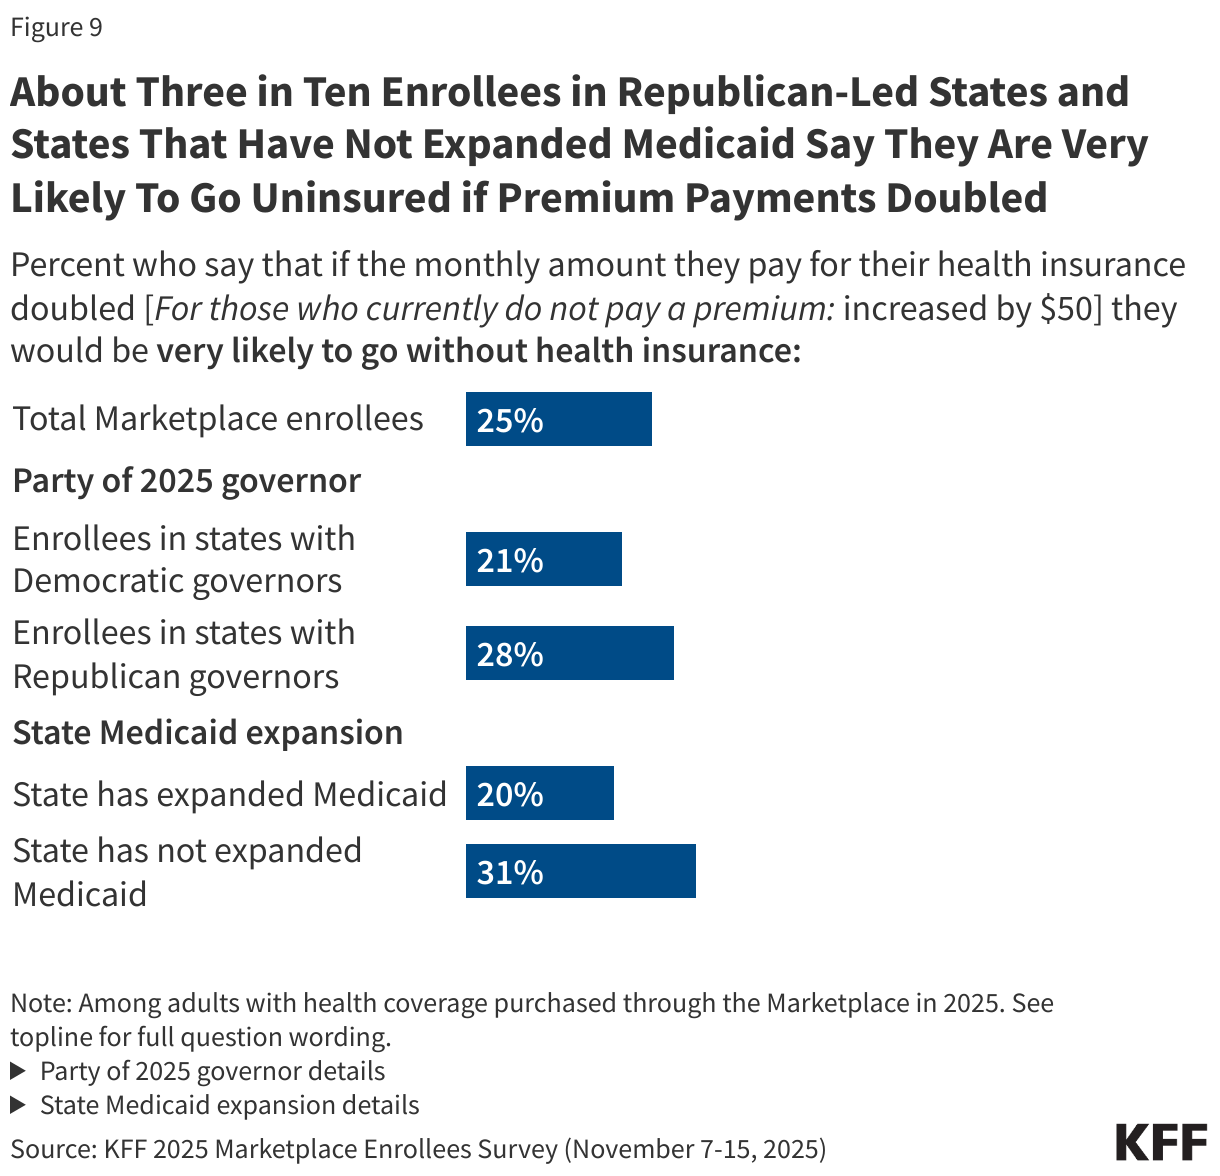
Some major insurers are expanding into new counties, while leaving others – meaning they are no longer offering any plans in those counties – though on the whole, the largest insurers are exiting more counties than they are entering in 2026 (Figure 9).
UnitedHealthcare is exiting the greatest number of counties – 225 counties in 2026 – while entering 14 new counties. In total, UnitedHealthcare is offering plans in 2,597 counties in 2026, a decrease of 211 counties from 2025. Humana is exiting the second greatest number of counties – 198 counties in 2026 – while entering 5 new counties. Humana is offering plans in more counties than any other large Medicare Advantage insurer – 2,655 counties in 2026 – though that represents a decrease of 193 counties from 2025.
Elevance is exiting 181 counties and entering 45 new counties in 2026, a decrease of 136 counties from 2025. CVS is exiting 160 counties, while entering 17 new counties in 2026, a decrease of 143 counties from 2025. Centene is exiting 104 counties, but is entering 63 new counties, the most new counties of any of the largest insurers. Kaiser Foundation Health Plans is neither exiting nor entering new counties in 2026.
The set of counties that each Medicare Advantage insurer is exiting do not completely, or in many cases, largely overlap. In some cases, such as many counties in Vermont and New Hampshire, multiple insurers are leaving rural areas with relatively low Medicare Advantage penetration. In other cases, such as in Monroe, NY (Rochester) and in Hennepin, MN (Minneapolis), insurers are leaving counties with higher Medicare Advantage penetration in an urban area. The different decisions of insurers to exit some counties suggest a combination of factors are at play, including local market characteristics, cost pressures, shifts in firm-level strategies, and ultimately the insurers’ assessment of potential profits.
Plan Renewals and Terminations
In 2026, 13% of Medicare Advantage enrollees in MA-PDs or about 2.6 million people, are in a plan that has been terminated for the coming year and will not be automatically assigned to another plan. (This number excludes people enrolled in SNPs, plans without prescription drug coverage, and people with employer coverage). This is an increase compared to 2025, when 6% of Medicare Advantage enrollees in MA-PDs or nearly 1.3 million people, were in a plan that was terminated.
People who have had their plan terminated will be able to enroll in another Medicare Advantage plan if one is available in their area or choose traditional Medicare. If they choose traditional Medicare, they will qualify for a special enrollment period for Medigap with guaranteed issue rights, meaning they can switch to traditional Medicare and will not be denied a Medigap policy due to a pre-existing condition. It is beyond the scope of this analysis how many beneficiaries in terminated plans have the option to enroll in another plan from the same insurer or the number of plans from which they can choose.
Another 6% of Medicare Advantage enrollees in MA-PDs, or about 1.3 million people, are in plans that have been affected by a consolidation. This is similar to 2025 when about 1.3 million people were also impacted by a consolidation. In this situation, some portion of this 1.3 million people will be moved into another plan under the same insurer automatically if the contract includes another plan of the same type (i.e., HMO or PPO) in the same county. (Some enrollees in consolidated renewal plans will not see changes in their plan because they were already in the plan that other enrollees are now being assigned to.) They may still enroll in another Medicare Advantage plan if one is available or choose traditional Medicare. However, they do not qualify for a special enrollment period for Medigap.
One of the features of the Medicare Advantage market is that plans can change from year to year, including in which counties insurers choose to offer plans for Medicare beneficiaries. When deciding on their health coverage, Medicare beneficiaries weigh factors such as out-of-pocket costs, provider networks, access to extra benefits offered by Medicare Advantage plans, drug formularies, among other plan benefits. Plan terminations and consolidations in the Medicare Advantage market add to the complexity that beneficiaries face when selecting their Medicare coverage.
New Market Entrants and Exits
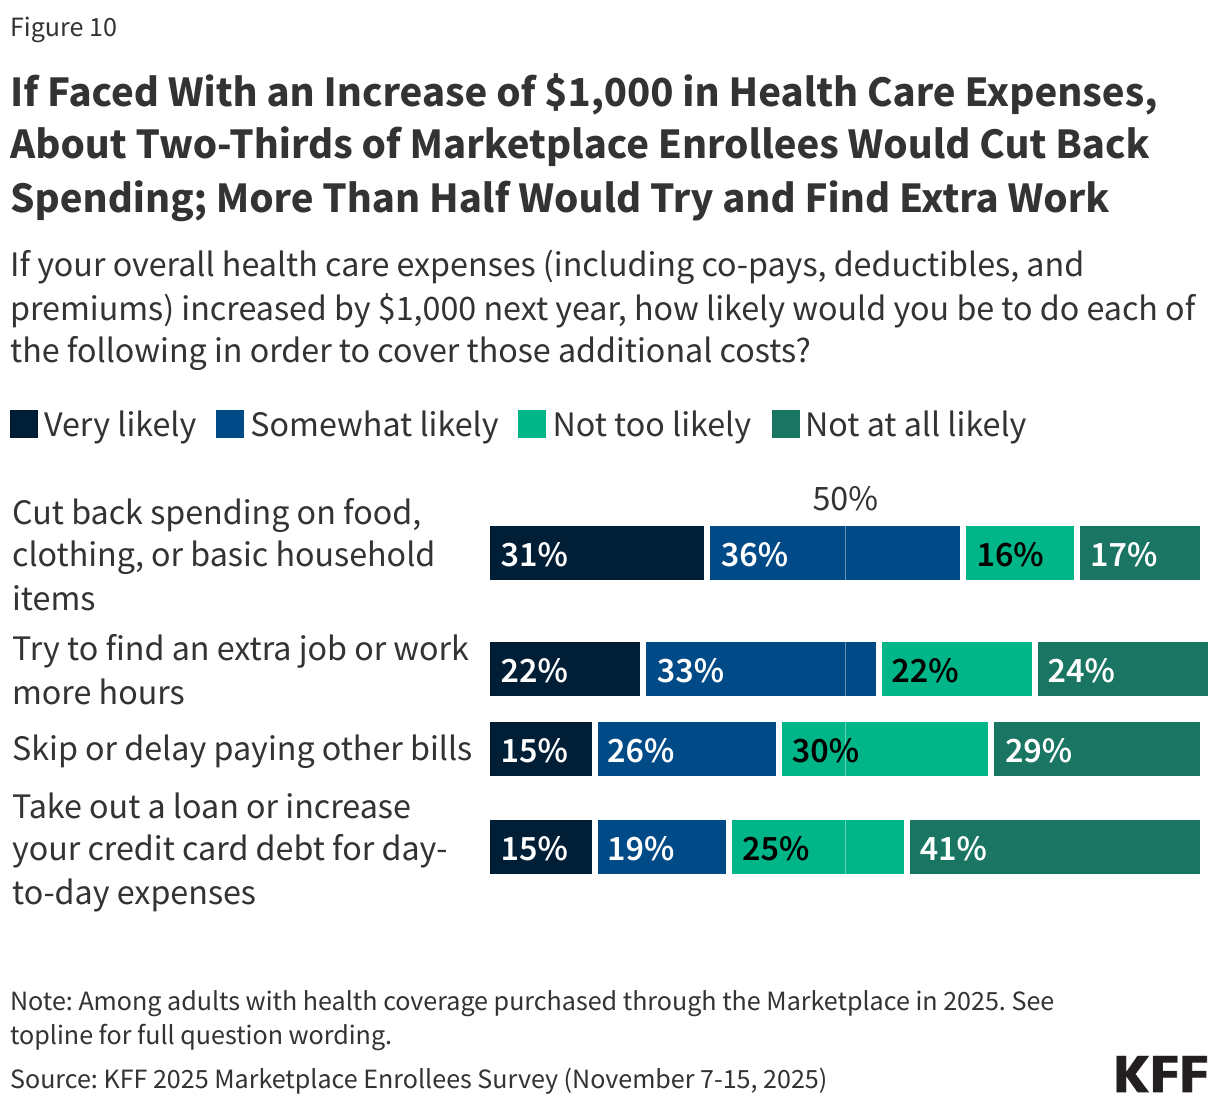
In 2026, ten firms are entering the market for the first time, four firms are exiting the market, and nine have had contracts taken over by other insurers (Figure 10). All of the new market entrants are only offering plans in California, including nine that are only offering a D-SNP plan, and a tenth firm that is offering two HMO plans.
In the last few years, some firms have introduced plans that are either co-branded or are in partnership with another company. For example, Alignment Health is offering plans co-branded with Instacart in California and Nevada in 2026, as they did in 2025. These plans will offer groceries to qualifying beneficiaries with chronic conditions. Alignment Health also continues to partner with Walgreens. As they did in 2025, other companies with a partnership that are offering plans in 2026 include Select Health and Kroger and Humana and USAA, though this is not an exhaustive list.
Four firms that participated in the Medicare Advantage market in 2025 are not offering plans in 2026. Two of the firms cited financial challenges, while another (Ochsner) did not specify why it was leaving the market. Avian Health Holdings, marketed as Sonder Health Plans, was placed in receivership and ceased operations.
Another nine firms left the market but had most of their contracts taken over by other insurers. Seven firms that are no longer in the Medicare Advantage market had contracts taken over by other parent organizations that were already offering plans in the Medicare Advantage market (Capital District Physicians' Health Plan, Centers Plan for Healthy Living, Commonwealth Care Alliance, HTA Holdings, Indiana University Health, RiverSpring Living Holding Corp, and the Cigna Group). Cigna, the largest of these insurers, had its Medicare line of business acquired by Health Care Service Corporation. Additionally, Blue Cross Blue Shield of North Carolina plans are now part of the newly formed CuraCor Solutions holding company and SA Plan LLC is now part of BrightSpring Health Services, which is new to the Medicare Advantage market.
Meredith Freed, Jeannie Fuglesten Biniek, Nancy Ochieng, and Tricia Neuman are with KFF. Anthony Damico is an independent consultant.
Methods
This analysis focuses on the Medicare Advantage marketplace in 2026 and trends over time. The analysis of plan offerings, availability of plans by state, county, firm, and insurer are based on individual Medicare Advantage plans for general enrollment. In addition to the analysis of SNP availability, SNPs are also included in counts of plan terminations and renewals as well as entries and exits. Employer plans are excluded from this analysis.
Data on Medicare Advantage plan availability, enrollment, and premiums were collected from a set of data files released by the Centers for Medicare & Medicaid Services (CMS):
- Medicare Advantage plan landscape files, released each fall prior to the annual enrollment period
- Medicare Advantage contract/plan/state/county level enrollment files, released on a monthly basis
- Medicare Advantage plan benefit package files, released quarterly
- Medicare Enrollment Dashboard files, released on a monthly basis
Connecticut is excluded from the analysis of Medicare Advantage at the county level due to a change in FIPS codes that are in the Medicare Enrollment Dashboard data but are not yet reflected in the Medicare Advantage enrollment data. Some Alaskan counties are also excluded due to differences in FIPS codes.
In previous years, KFF had calculated the share of Medicare beneficiaries enrolled in Medicare Advantage by including Medicare beneficiaries with either Part A and/or B coverage. We modified our approach in 2022 to estimate the share enrolled among beneficiaries eligible for Medicare Advantage who have both Medicare Part A and Medicare B. These changes are reflected in all data displayed trending back to 2010.
Additionally, in previous years, KFF had used the term Medicare Advantage to refer to Medicare Advantage plans as well as other types of private plans, including cost plans, PACE plans, and HCPPs. However, cost plans, PACE plans, HCPPs are excluded from this analysis in addition to MMPs. These exclusions are reflected in all data displayed trending back to 2010.
KFF’s plan counts may be lower than those reported by CMS and others because KFF uses overall plan counts and not plan segments. Segments generally permit a Medicare Advantage organization to offer the “same” local plan, but may vary supplemental benefits, premium and cost sharing in different service areas (generally non-overlapping counties).
Code available at https://github.com/KFFData/kff-medicare-plan-analysis.
Appendix