Medicare Advantage, the private plan alternative to traditional Medicare, covers over half of eligible Medicare beneficiaries. Initially, one of the goals of having Medicare contract with private plans was to generate savings for the Medicare program by introducing competition between private plans. However, private plans have never generated savings for Medicare, in part because the way Medicare pays private insurers has never sufficiently accounted for the differences in health status between beneficiaries in traditional Medicare and those enrolled in Medicare Advantage plans. In addition, the payment system was designed to attract insurers to the Medicare Advantage market, providing payments sufficient to maintain profitability as well as to fund supplemental benefits, which are valued by enrollees. This has limited the amount of savings realized by the federal government when private plans achieve efficiencies and have lower costs than traditional Medicare.
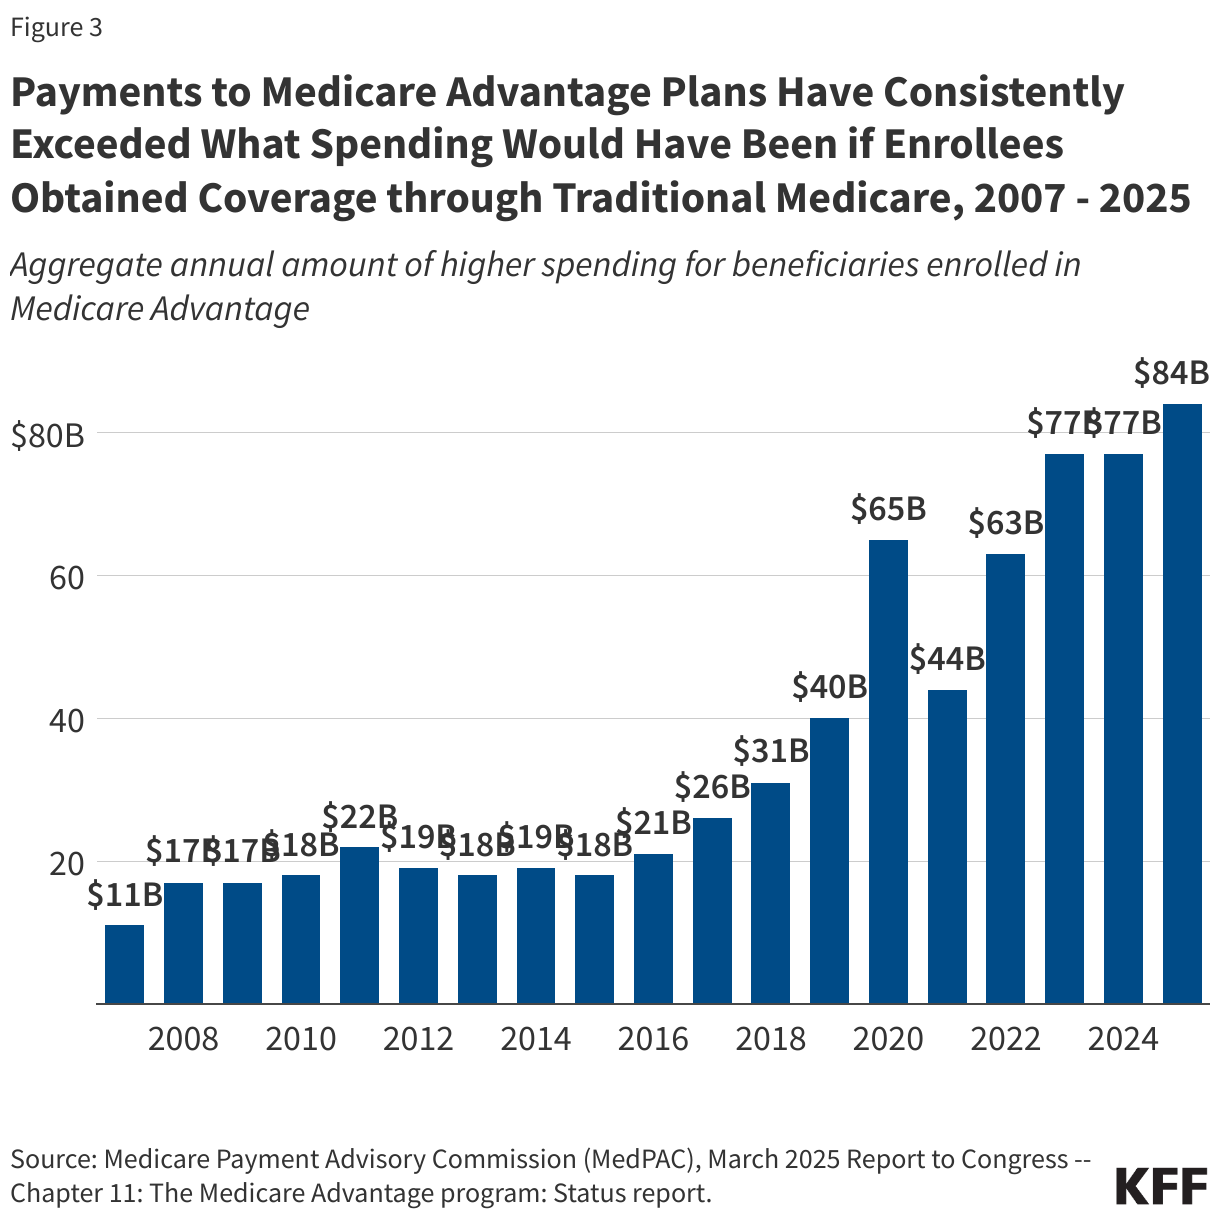
The Medicare Payment Advisory Commission (MedPAC) estimates that, in 2025, payments from the federal government to Medicare Advantage plans exceed what spending would have been in traditional Medicare by 20%, which translates into $84 billion in additional spending. Higher payments to Medicare Advantage plans increase total Medicare spending, strain the Part A Hospital Insurance trust fund and drive-up Part B premiums for all Medicare beneficiaries. This raises questions about whether the current payment system provides strong financial returns to insurers at the expense of the federal budget, Medicare beneficiaries themselves, and U.S. taxpayers, while also providing popular supplemental benefits such as dental and vision for Medicare Advantage enrollees. It also raises questions about whether the current payment system results in an inequitable distribution of supplemental benefits, in that it finances these additional benefits for Medicare Advantage enrollees but not traditional Medicare beneficiaries.
According to press reports, some Senators briefly considered including changes to how the federal government adjusts payments to Medicare Advantage plans based on the health status of their enrollees as part of the reconciliation legislation enacted into law on July 4, 2025. Some reportedly raised the possibility of including the No UPCODE Act, a bipartisan bill that includes a subset of payment reforms recommended by MedPAC. While these changes were ultimately not included in the reconciliation bill, there appears to be ongoing interest in refining the current methodology for setting payments to plans, given the impact of the current payment system on Medicare spending and the federal budget.
This brief explains how Medicare Advantage payments are determined, including a description of the parameters that are set in law and those that can be modified by the executive branch through its regulatory authority. It also provides an overview of policy options to change the Medicare Advantage payment system and includes a glossary of terms (italicized and bolded in text) related to Medicare Advantage payment policy.
Medicare Advantage payments are determined through an annual process.
Private plans have a long history in the Medicare program, and the details of how they are paid have changed over time to address evolving policy goals, largely as part of major pieces of legislation, including the Tax Equity and Fiscal Responsibility Act of 1982 (TEFRA), the Balanced Budget Act of 1997, the Medicare Modernization Act of 2003, and the Affordable Care Act of 2010 (ACA).
Medicare Advantage plans receive a monthly payment per enrollee from the federal government to provide Medicare-covered services. In most cases, the funds received from the federal government are sufficient for plans to also cover supplemental benefits, such as vision, hearing, and dental services, to reduce cost sharing compared to what is required under traditional Medicare without a supplement, and to buy-down the Part D premium for plans that offer prescription drug coverage. Congress established the framework for the Medicare Advantage payment system giving the Secretary of the Department of Health and Human Services (HHS) authority in how it is implemented. In each step of the annual payment process described below, some components are set in statute (many of which were substantially revised by the ACA), while the Secretary of HHS is directed to define others, which is implemented by the Centers for Medicare & Medicaid Services (CMS), the federal agency that oversees and administers the Medicare program.
Benchmarks are the maximum amount the federal government will pay Medicare Advantage plans.
The maximum amount the federal government will pay private insurers in a county for an average beneficiary who enrolls in a plan is called the benchmark. This amount is a percentage of what the federal government spends on beneficiaries in traditional Medicare in the county. The law stipulates that all counties nationwide are to be divided into quartiles based on traditional Medicare spending and sets the benchmark as a specific percentage. The maximum amount the federal government will pay private plans is less than traditional Medicare in one-quarter of counties and is equal to or more than traditional Medicare in the other three-quarters of counties.
Specifically, counties in the first quartile with the highest spending (such as Miami-Dade County, Florida) have a benchmark set at 95% of traditional Medicare spending. Counties in the second and third quartiles have benchmarks set at 100% and 107.5% of traditional Medicare spending, respectively. And counties in the fourth quartile with the lowest spending (such as Hennepin County (Minneapolis), Minnesota) have a benchmark of 115% of traditional Medicare spending.
The law also states that benchmarks are to be increased by a specific amount for plans that receive at least a 4-star rating under the quality bonus program. In most counties, benchmarks are increased by 5 percentage points for qualifying plans. The increase is 10 percentage points for qualifying plans in urban counties with historically high Medicare Advantage penetration and with lower-than-average traditional Medicare spending (double bonus counties). Benchmarks are capped and cannot be higher than they would have been prior to the ACA.
In each U.S. county, the calculation of traditional Medicare spending for setting the benchmark includes spending for beneficiaries with Parts A and B, and beneficiaries with Part A only or Part B only, even though enrollment in both Part A and Part B is required for Medicare Advantage. Including Part A only and Part B only beneficiaries in the calculation of traditional Medicare spending for the purpose of calculating benchmarks has the effect of reducing average traditional Medicare spending compared to what it would be if spending was based only on beneficiaries enrolled in both Part A and Part B.
While the law broadly defines how to consider historical traditional Medicare spending for purposes of setting Medicare Advantage benchmarks, it directs the Secretary of HHS, through CMS, to compute the per capita rate for payments and publish this amount. CMS, therefore, decides how to incorporate available data, as well as the economic and other assumptions to use when forecasting how health care spending will grow (since CMS is setting the payment for the upcoming year). CMS also develops, revises, administers and evaluates the methods used to calculate and assign star ratings, which are used to determine the annual increases in the benchmarks, as well as rebates received by plans (described below), and are available for beneficiaries to use to compare plans. To derive star ratings, CMS determines the specific quality measures to use, the source and year of data, how to weight measures, and the cut points for specific star values. In October of each year, CMS publishes updates to quality star ratings, which appear on the Medicare Plan Finder and are used for the subsequent payment year (after the one beginning in the coming January). That is, the quality star ratings published in the fall of 2025 will be used to determine payments for plans available to beneficiaries in 2027.
CMS publishes an Advance Notice of proposed methodological changes and payment policies early in the calendar year and a final Rate Announcement, including the county-level benchmarks, by the first Monday in April. Along with the rate announcement, CMS makes the rate book, as well as the bid pricing tool available at this time. This gives plans the information and time needed to prepare their bids (described in the next section).
Insurers submit bids to cover Medicare A and B services.
After CMS publishes the final rate announcement, insurers estimate how much it will cost to cover Medicare Part A and Part B services (excluding hospice) for the average Medicare beneficiary under each Medicare Advantage plan they propose to offer, plus administrative expenses and profit. Insurers submit their bids to CMS by the first Monday in June. (There is an exception to this process for employer- and union- sponsored plans, which do not submit bids, and instead are assigned a bid amount based on the enrollment-weighted average of bids for plans available in the same counties.) CMS is responsible for reviewing, negotiating, and ultimately determining whether to accept a bid. CMS publishes the approved Medicare Advantage plans ahead of the October 1st launch of the marketing period for the coming year and Medicare’s annual open enrollment period that runs from October 15 through December 7.
The law requires insurers to submit certain information as part of their bid, including: a description of the proposed costs of providing all items and services covered under the plan, the proportion attributable to Medicare-covered Part A and Part B benefits, basic Part D prescription drug coverage, and supplemental benefits. Plans are also required to submit the actuarial basis used in their calculations, including a description and the actuarial value of deductibles, coinsurance, and copayments. Plans are required to spend at least 85% of their revenue on plan-covered services (including extra benefits), leaving 15% for administrative expenses and profit. This is also called the medical loss ratio (MLR). Additional instructions to insurers, including information that CMS requires as part of the bid are addressed in the Annual Rate Announcement and included in the instructions for the bid pricing tool.
Payments to Medicare Advantage plans are comprised of two components, the base payment and the rebate.
For all approved bids, CMS calculates how much the federal government will pay the Medicare Advantage plan per enrollee, by comparing the insurer’s bid (to cover the cost of providing Medicare Part A and Part B services) to the benchmark. The precise benchmark against which a bid is compared depends on whether the plan is a local or regional plan, and the specific counties in which the plan operates. Bids for plans that operate across multiple counties are compared against a weighted average benchmark constructed using projections for plan enrollment across the different counties.
The payments to Medicare Advantage plans include the following two components:
- Base payment. For plans that bid at or below the benchmark, the base payment is 100% of the plan’s bid. If the bid is above the benchmark, the plan’s base payment is equal to the benchmark amount, and enrollees in that plan pay a supplemental premium equal to the difference between the bid and the benchmark.
- Rebate. In addition to the base payment, plans that bid below the benchmark receive a portion of the difference between the benchmark and bid, which is called a rebate. (Plans that bid at or above the benchmark receive no rebate.) The percentage of the difference a plan gets depends on the quality star rating of the contract of which it is a part (most Medicare Advantage contracts include multiple plans) and is specified in law. The rebate percentage is 70% of the difference for plans that are part of contracts with at least 4.5 stars, 65% for plans that are part of contracts with 3.5 to 4.5 stars, and 50% for plans that are part of contracts with less than 3.5 stars.
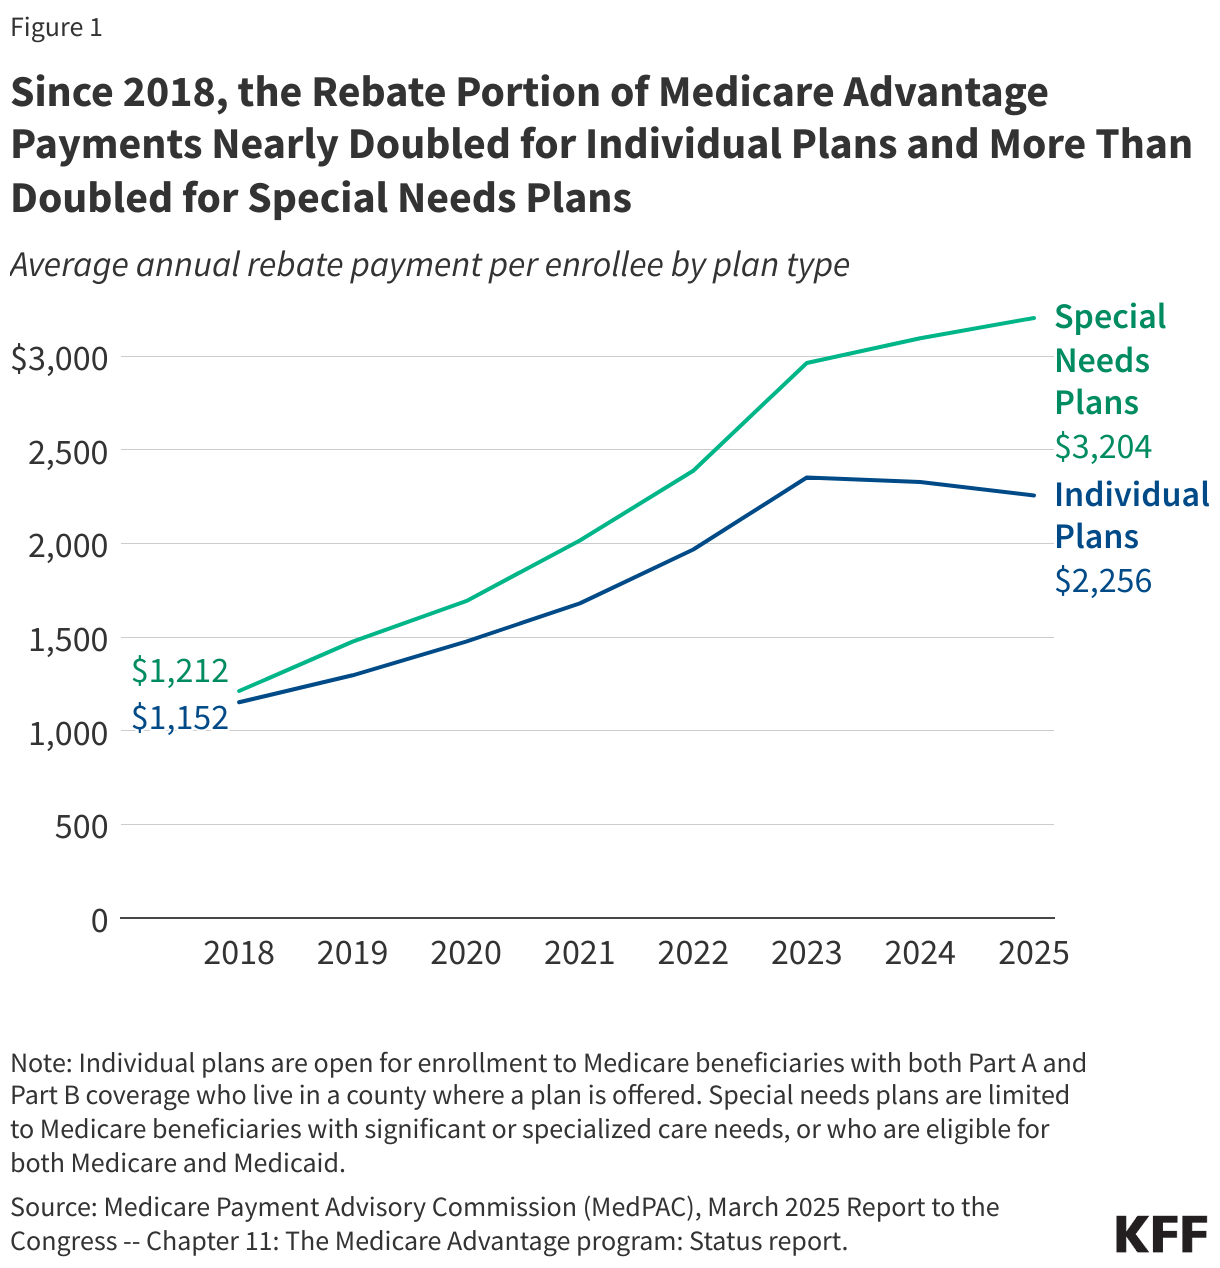
- Plans are required by law to use the rebate dollars to reduce cost sharing, pay for non-Medicare covered benefits (for example, dental, vision, and hearing services), or reduce the Part B and/or Part D premium (as well as to cover associated administrative costs and profit). Since 2018, the rebate portion of the payment has nearly doubled for individual plans, which are broadly available for general enrollment, and more than doubled for special needs plans, which are plans that restrict enrollment to beneficiaries with specific care needs or who are dually eligible for Medicare and Medicaid (Figure 1). Virtually all Medicare Advantage plans now provide supplemental benefits, usually for no additional premium.
Payments to Medicare Advantage plans are adjusted for the health status of enrollees.
The law requires CMS to adjust payments to Medicare Advantage plans for certain demographic characteristics and the health status of enrollees. This is called risk adjustment, and under this process enrollees are assigned a risk score that is intended to serve as a predictor of their expected health care spending. CMS is responsible for developing the risk adjustment model, including deciding which data to use, the number of years of diagnosis data to incorporate, and the set of diagnoses that will factor into the risk score.
CMS periodically revises and updates the risk adjustment model, including how it is referenced (i.e., moving from V24 to V28, the current version in use) and provides notification in the Advance Notice when it proposes to make changes. For example, this occurred in 2023 when CMS proposed an update to the data used to calibrate the risk adjustment model and the year used to estimate the effect of the different factors in the model, as well as changes to how certain conditions that were coded more frequently in Medicare Advantage than in traditional Medicare were incorporated (or not) into the risk adjustment model. After considering comments on their proposed changes, including from industry representatives that were concerned about the impact on benefits and costs, changes were incorporated into V28 and adopted through a phased in process during plan years 2024 and 2025. CMS also makes decisions about other model specifications, such as how to scale risk scores so that the average score for traditional Medicare beneficiaries in the payment year is equal to 1 (this is called the normalization factor).
The law requires the Secretary to reduce Medicare Advantage risk scores by not less than 5.9 percent to account for the difference in coding patterns between Medicare Advantage and traditional Medicare if the risk model is developed using traditional Medicare data (which it currently is). The requirement for an automatic reduction in risk scores is because Medicare Advantage enrollees tend to have more documented diagnoses than they would if covered under traditional Medicare. (See next section for a fuller discussion of coding intensity.)
Medicare Advantage payments exceed expected spending in traditional Medicare.
Medicare payments to Medicare Advantage insurers consistently exceed the amount Medicare would have been expected to spend on enrollees if they were covered under traditional Medicare, according to MedPAC (Figure 3). In 2025, MedPAC estimates that payments per enrollee are 20% higher than expected spending would be in traditional Medicare. That translates into $84 billion of additional spending for 2025 alone. The higher payments to plans and the associated higher spending under Medicare can be attributed almost entirely to coding intensity ($40 billion) and favorable selection ($44 billion), described in more detail below.
Coding intensity contributes to higher spending for Medicare Advantage enrollees.
The current risk adjustment system relies on diagnoses from health care encounters in the prior year and generally provides higher payments to Medicare Advantage plans for enrollees with more reported diagnoses. This system creates incentives for Medicare Advantage plans to document more health conditions for their enrollees than would have been recorded in traditional Medicare. In traditional Medicare, health care providers only have to record enough information about a person’s diagnosed health care conditions to support the service for which payment is being submitted. This results in Medicare Advantage enrollees looking sicker than they would if they had been covered under traditional Medicare. Since the risk adjustment model is calibrated on traditional Medicare beneficiaries, the difference in coding practices means that the model overpredicts spending for Medicare Advantage enrollees and thus pays more for Medicare Advantage enrollees than if they had been covered under traditional Medicare. MedPAC estimates that higher coding intensity in Medicare Advantage contributes $40 billion of the $84 billion in additional Medicare spending in 2025.
Medicare Advantage insurers utilize tools that are never or rarely used in traditional Medicare to capture more diagnoses than are included on health care claims, such as chart reviews and health risk assessments (HRAs), some of which occur in a person’s home rather than in a clinical setting. On the one hand, capturing additional diagnoses could help Medicare Advantage organizations better manage care for enrollees by providing a more complete picture of someone’s health. But on the other hand, such coding practices increase payments to Medicare Advantage insurers often without improving care. Analyses by the Health and Human Services Office of the Inspector General (HHS OIG) and Wall Street Journal found, for example, that enrollees in Medicare Advantage plans frequently had no health care services associated with many of the diagnoses that appear in submissions used to calculate risk scores. MedPAC estimates that in 2023, diagnoses documented from chart reviews and HRAs contributed $24 billion and $15 billion, respectively, to total Medicare Advantage spending, a finding consistent with estimates by other researchers.
The extent to which the embedded incentives and use of additional tools impacts risk scores varies substantially across Medicare Advantage insurers. MedPAC found that in 2023, 85% of Medicare Advantage enrollees were in a plan sponsored by an insurer estimated to have coding practices that increased their enrollees’ risk scores by more than CMS’ 5.9% reduction in risk scores. In other words, even with the across-the-board 5.9% reduction to risk scores applied by CMS, payments for the vast majority Medicare Advantage enrollees remain higher than expected spending in traditional Medicare due to coding intensity.
The reporting of diagnoses for risk adjustment that are not supported by a person’s medical record could be due to insufficient documentation or potentially constitute fraud. Risk Adjustment Data Validation (RADV) audits are the primary tool the government uses to identify and recover payments to plans that were made based on such diagnoses. However, due to limited resources and staff at CMS allocated for RADV audits, the federal government has audited only a small share of Medicare Advantage contracts and has not recouped a substantial amount of Medicare payments made to plans based on coding practices that could not be justified.
In May 2025, CMS under the Trump administration announced it would audit every Medicare Advantage contract every payment year, substantially increase the staff dedicated to carrying out these audits, and expedite the completion of audits launched between 2018 and 2024. However, it is not clear whether CMS has taken any steps to hire the new staff. Additionally, a federal judge recently struck down a rule finalized under the Biden administration related to RADV audits, which may further complicate CMS’ ability to implement its announced audit strategy. Nevertheless, Dr. Mehmet Oz, the current Administrator for CMS, continues to express concern about coding practices that document more conditions without accompanying treatment, suggesting this will remain a priority for the agency. The Department of Justice also has several ongoing cases alleging that certain insurers submitted diagnoses to CMS for risk adjustment purposes that are not valid, meaning the enrollee does not have the condition at all, and thus are illegal under the False Claims Act.
Favorable selection into Medicare Advantage plans also leads to higher Medicare spending.
Among people with the exact same risk score (based on reported diagnoses and other characteristics) that is used to estimate expected health care spending, actual spending will vary. In other words, some people use more services and incur substantially higher costs than others who have the same reported medical conditions. If people whose actual spending is lower than average among all people with the same risk score are more likely to enroll in Medicare Advantage, then there is favorable selection into Medicare Advantage because the actual cost of providing coverage for enrollees (before any effects from care management) is lower than the payments made to plans. Analysis comparing traditional Medicare spending among people who subsequently enroll in Medicare Advantage and those who remain in traditional Medicare implies favorable selection because traditional Medicare spending among beneficiaries with similar risk scores was lower for those who subsequently enrolled in Medicare Advantage than beneficiaries who stayed in traditional Medicare. MedPAC estimates that favorable selection contributes $44 billion of the $84 billion in additional Medicare spending in 2025.
One reason spending varies across people with the same risk score is that people who are the same age and sex with the same health conditions (the primary inputs into the risk score model) vary in how much health care they actually use, even if their predicted spending would be the same based on having the same risk score. Many things that affect a person’s use of health care services are not captured in the risk score model, including personal preferences or circumstances, tolerance for risk, or clinical nuances that require more or less management of a particular condition.
In the presence of utilization management tools that are common features of Medicare Advantage plans, such as prior authorization, referral requirements, and the use of networks, people who expect to use more health care services may prefer to receive their coverage from traditional Medicare, where these tools are generally not used. While these utilization management tools may deter use of unnecessary or clinically inappropriate services and reduce what the plan spends on Medicare-covered services, these effects are separate from the impact of favorable selection.
Efficiencies achieved by Medicare Advantage insurers do not guarantee savings for the federal government.
Even without the differences in spending due to coding intensity and favorable selection, when plans operate efficiently and have lower costs than traditional Medicare, Medicare payments could still be higher for beneficiaries enrolled in Medicare Advantage plans than expected costs for these beneficiaries under traditional Medicare. This is because the payment system is not designed for the federal government to retain the majority of savings achieved by Medicare Advantage insurers.
First, benchmarks are set at or above traditional Medicare spending in three-quarters of counties (representing nearly 60% of all Medicare beneficiaries), meaning savings are not guaranteed in these counties because the maximum amount the federal government is willing to pay is at least as much as what spending would be in traditional Medicare. Second, benchmarks are further increased under the quality bonus program. For example, in 2025, 75% of Medicare Advantage enrollees are in a plan that receives bonus payments, at an estimated cost of at least $12.7 billion according to a prior KFF analysis. Third, insurers’ rebate payments are set so that they are paid between 50% and 70% of the difference between the benchmark and their bid (the estimated cost of providing Medicare-covered services), which limits the share of any savings attributable to efficiencies that are retained by the federal government.
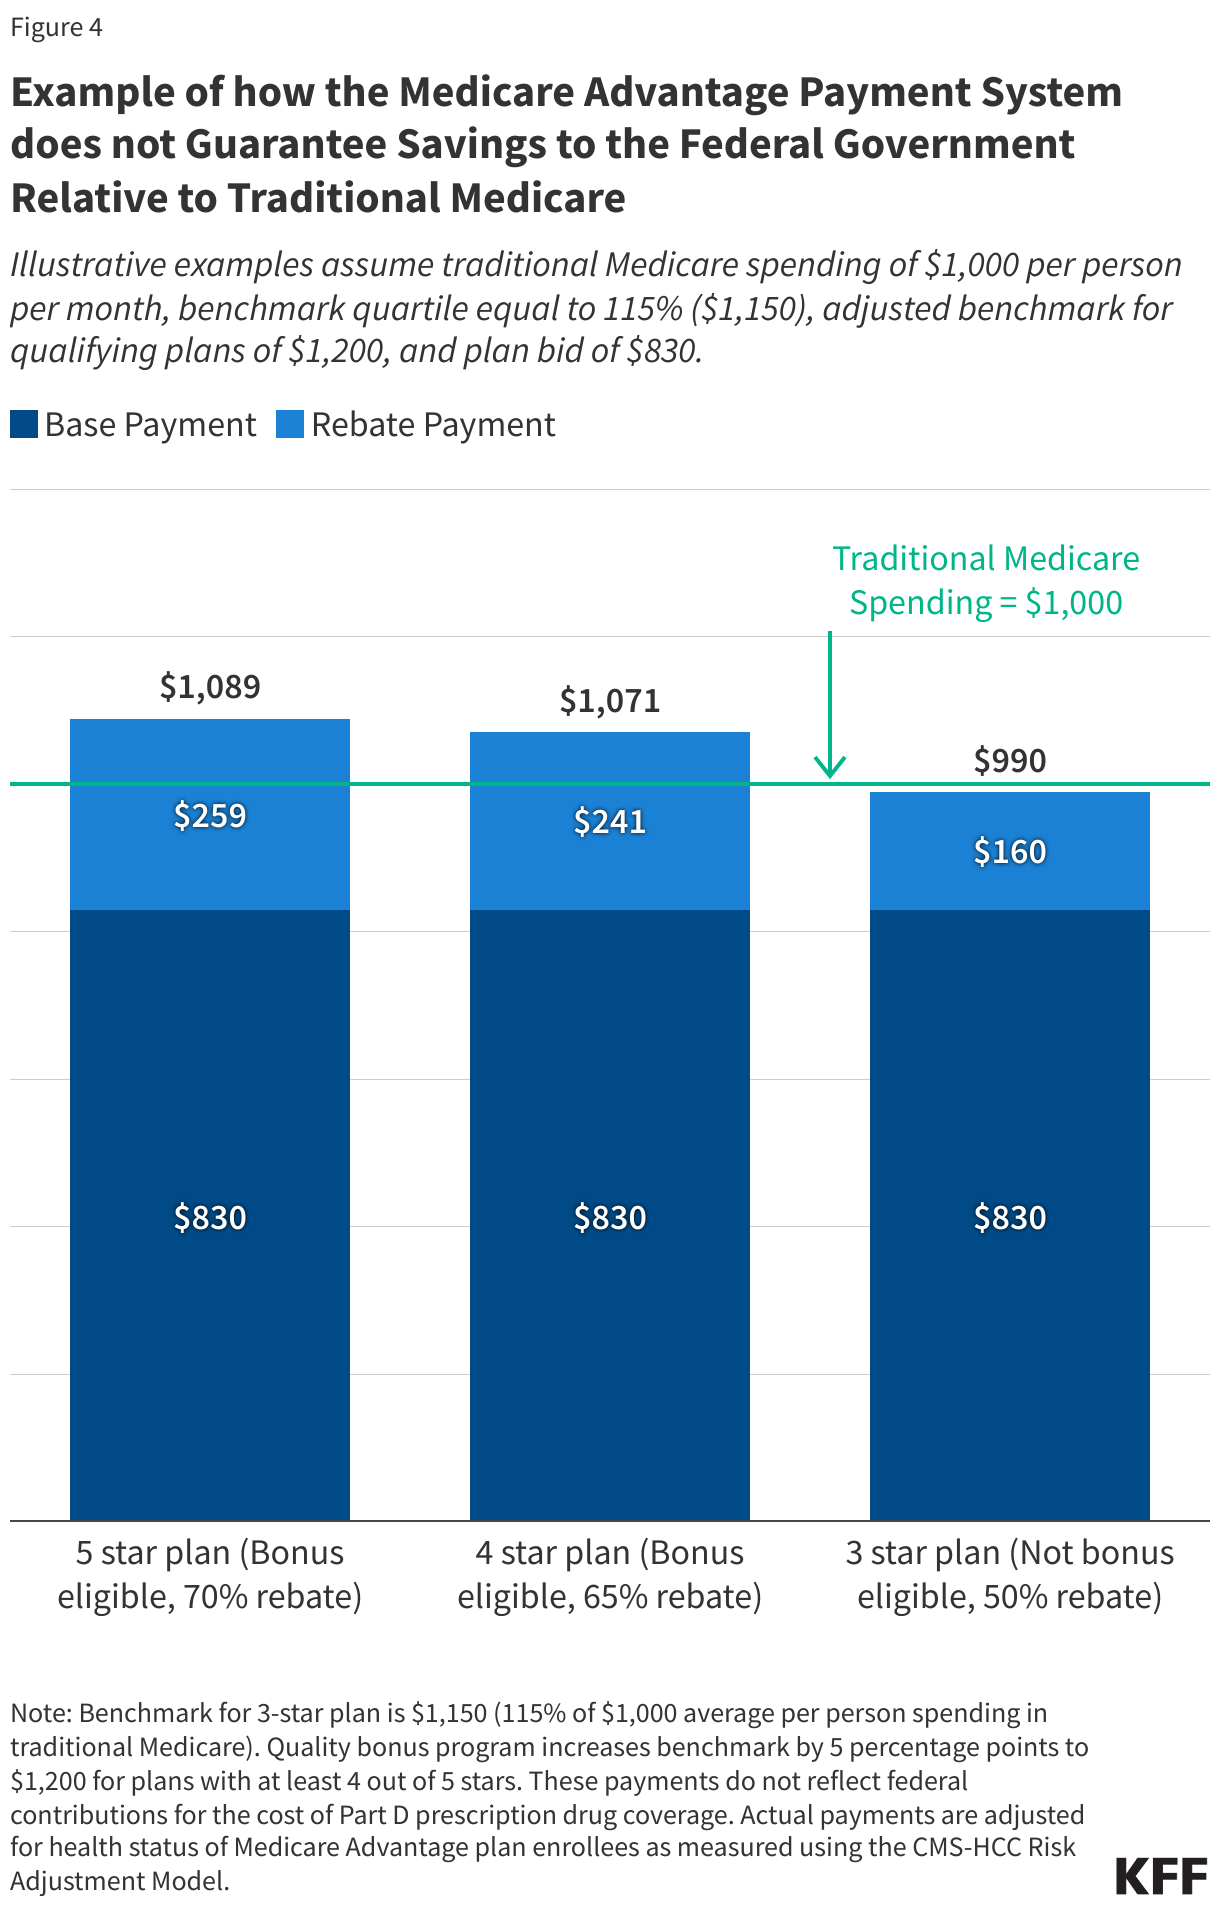
While most Medicare Advantage plans estimate that their costs for covering Part A and Part B services are well below traditional Medicare spending, with the average bid equal to about 83% of traditional Medicare spending, payments from CMS can still exceed spending in traditional Medicare, particularly in counties with benchmarks set above traditional Medicare costs. That lower spending could stem from a number of factors, such as lower use of health care services, including fewer hospital admissions and less use of post-acute care.
Consider an illustrative county with a benchmark that is 115% of traditional Medicare spending and average traditional Medicare spending of $1,000 per month. Plans with an average bid and at least a 4-star quality rating would potentially receive payments in excess of traditional Medicare spending. As shown in Figure 4, a 4-star plan with estimated costs that are 17% below traditional Medicare spending, that is a bid of $830, would receive $1,071 a month for an average enrollee, compared to traditional Medicare spending of $1,000 per month. In this example, only the 3-star plan would achieve modest ($10 per month) savings for traditional Medicare.
Virtually all Medicare Advantage enrollees are in a plan that offers reduced cost sharing and coverage of non-Medicare covered services, such as dental, vision and hearing, usually for no additional premium. Plans pay for these benefits using their rebate dollars. Additionally, most people in a plan that includes Part D prescription drug coverage do not have to pay the Part D premium, because the plan uses its rebate dollars to cover this cost. Thus, the higher payments to Medicare Advantage plans compared to spending in traditional Medicare allow private plans to provide additional benefits that enrollees potentially value. It is difficult to estimate how much value enrollees get, however, because detailed data on out-of-pocket spending, the use of extra benefits by enrollees, and plan spending by type of extra benefit are not readily available.
The higher spending in Medicare Advantage relative to traditional Medicare has prompted numerous proposals to reform the Medicare Advantage payment system. Some proposals aim to address concerns related to coding intensity, either directly or through refinements to the methodology for adjusting payments to plans for the health status of enrollees (risk adjustment). Additional proposals would modify specific levers in the current payment system, such as the methodology for determining benchmarks, the quality bonus program and star ratings, or introducing a new reinsurance program. And others would adopt more fundamental changes to the payment approach, like implementing competitive bidding for Medicare Advantage plans. Often, proposals incorporate multiple reforms (Table 1). In many cases, the proposals described in this section would require Congressional action, while others could be implemented by CMS as part of rulemaking or the annual rate announcement.
Changes to the Medicare Advantage payment system that result in lower payments to plans raise concerns about the impact on plan availability, benefits, and costs. Specifically, since plans use payments from the federal government to reduce cost sharing, pay for non-Medicare covered services, and buy down the Part B and/or Part D premiums, some in the industry have argued that lower payments will translate into fewer extra benefits and higher premiums and other costs for enrollees. Analysis of how Medicare Advantage insurers respond to payment changes thus far suggests that the effects have been modest and that insurers have prioritized reducing their profits or lowering administrative costs over major changes to popular benefits. Following changes to the risk adjustment model that were phased in beginning in 2024, some insurers reduced the number of plans they offered, though overall the market was relatively stable. Ultimately, the response of insurers to changes in payment, and the impact on beneficiaries, will depend on the magnitude of the payment reductions and how gradually the changes are phased in overtime.
Several options to reduce the impact of coding intensity differences between Medicare Advantage and traditional Medicare have been proposed. For example, MedPAC recommends several policy changes, including developing a risk adjustment model that uses two years of traditional Medicare and Medicare Advantage diagnostic data to reduce year-to-year variation in the documentation of diagnoses, excluding diagnoses from HRAs (in either traditional Medicare or Medicare Advantage), and applying a coding adjustment that fully accounts for any remaining differences between traditional Medicare and Medicare Advantage. The Congressional Budget Office (CBO) has estimated that a subset of these policies (using two years of data and excluding diagnoses from HRAs) would save $124 billion over 10 years (2025 – 2034).
In recent years, policies to address coding intensity have also gotten increased attention from Congress. For example, the No UPCODE Act, sponsored by Senator Bill Cassidy (R-LA) and Senator Jeff Merkley (D-OR), largely modeled after the recommendations from MedPAC, would require CMS to exclude diagnoses from chart reviews and HRAs, use two years of diagnostic data, and take into account differences in Medicare Advantage and traditional Medicare coding patterns when determining adjustments to Medicare Advantage payment. The legislation has been introduced in two successive sessions of Congress.
Some proposals would increase the coding intensity adjustment applied to all Medicare Advantage plans above the 5.9% minimum. CBO included two variations of an increase in the across-the-board adjustment in its most recent set of Options for Reducing the Deficit, estimating that over 10 years, increasing the across-the-board risk score reduction from 5.9% to 8% would save $159 billion, while an increase from 5.9% to 20% would save more than $1 trillion (both over the 2025 – 2034 time period). A modification of this option would apply a tiered adjustment based on plans’ historical coding behaviors, so plans with higher coding intensity would have a higher adjustment. (CBO has not released an estimate of savings from this option.)
Options to revise how the federal government determines benchmarks for Medicare Advantage payments include both changes to the quartile system and changes to the calculation of spending in traditional Medicare that serves as the basis for benchmarks. For example, MedPAC recommends replacing the current approach to benchmarks (based on traditional Medicare spending in counties, stratified by quartiles) with a policy that blends local area traditional Medicare spending with standardized national traditional Medicare spending. This approach would keep benchmarks above traditional Medicare spending in low-spending areas, maintaining incentives for insurers to participate in these markets, and below traditional Medicare spending in high-spending areas, allowing the Medicare program to reduce overall spending. The approach also aims to address concerns about basing benchmarks on traditional Medicare spending in counties with very high Medicare Advantage penetration and smooths the differences across counties with similar traditional Medicare spending. The proposal would also apply a 2% discount rate to the benchmark to ensure the federal government retains a minimum level of savings. Some of the savings achieved by the MedPAC proposal would be offset by its recommendation to calculate traditional Medicare spending based on beneficiaries enrolled in both Medicare Part A and Part B (rather than include beneficiaries with Part A only or Part B only), which has a substantial cost, and by eliminating the policy that caps benchmarks at their pre-ACA level. Under this recommendation, the rebate percentage would be set at 75% for all plans (rather than tied to star ratings). In June 2021, MedPAC estimated that taken altogether, these changes would result in $10 billion in savings over 5 years.
Other variations of options to revise the benchmark system include capping benchmarks at a percent of traditional Medicare costs or imposing requirements that adjustments to the benchmark reduce aggregate payments so that they do not exceed spending for similar beneficiaries in traditional Medicare. Paragon Health Institute estimates that capping benchmarks at 100% of traditional Medicare spending in all counties except those with the lowest Medicare Advantage penetration would save $385 billion over 10 years.
Proposals to reform the Medicare Advantage program often include replacing, modifying, or ending the quality bonus program, and revising the quality star ratings system on which bonuses are based. For example, one Congressional proposal would end the benchmark increases for plans that obtain certain quality scores. In addition, MedPAC has proposed a comprehensive reform to the quality rating system that would replace the quality bonus program with a Medicare Advantage Value Incentive Program (MA-VIP). The MA-VIP would score a small set of measures, evaluate quality at the local level, account for social risk factors, distribute rewards based on a continuous scale so that there is not a sharp “cliff” where only plans above a certain threshold get a bonus, and incorporate both rewards for higher-performing plans and penalties for lower-performing plans. In June 2020, MedPAC estimated that these changes would save more than $10 billion over five years.
Another option includes making the quality bonus program budget neutral by offsetting spending on bonuses for high-quality plans with penalties paid by low-quality plans. The Committee for a Responsible Federal Budget (CRFB) estimates that making the quality bonus program budget neutral would save between $115 billion and $170 billion over 10 years (2024 – 2033).
Additionally, a narrower approach that largely retains the quality bonus program but eliminates double bonus counties would produce some savings. CBO estimates that eliminating double bonuses would save $18 billion over 10 years (2019 – 2028), but that savings estimate could be larger now given the growth in Medicare Advantage enrollment since the estimate was developed.
Another approach would establish a reinsurance mechanism to protect Medicare Advantage insurers from extremely high and unexpected costs that are not otherwise addressed by the risk adjustment model. For example, insurers could be paid more for enrollees that had spending that was substantially higher than predicted, while insurers with enrollees with substantially lower than predicted spending would make payments into the program, designed so the whole system was budget neutral (known as a two-sided approach). One Congressional proposal includes stop-loss payments for plans that experience significantly higher expenditures than expected and authorizes the Secretary to implement such payments in a budget-neutral manner.
Competitive bidding proposals.
Another option would shift away from traditional Medicare spending as the basis for benchmarks and instead use bids submitted by insurers that estimate the cost of providing Part A and Part B services to determine the benchmark. This approach is referred to as competitive bidding. For example, under this approach, the maximum Medicare payment to plans (benchmarks) could be set at the enrollment-weighted average of bids submitted to provide a standard benefit package, similar to the process used in the Part D payment system. CBO has not scored a competitive bidding approach in recent years. The Bipartisan Policy Center estimates that this change could save between $400 billion and $500 billion over 10 years (2024 – 2033).
|
|---|
| Table 1 |
| Proposals to Reform the Medicare Advantage Payment System |
| Category Summary | Examples | Savings Estimates |
| Coding Intensity and Risk Adjustment: Reduce the impact of coding intensity differences between Medicare Advantage and traditional Medicare. | Exclude diagnoses from HRAs from risk adjustment model (MedPAC, No UPCODE Act, H.R. 3467)
Exclude diagnoses from chart reviews from risk adjustment model (No UPCODE Act, H.R. 3467)
Use two years of data (MedPAC, No UPCODE Act, H.R. 3467)
Increase across-the-board adjustment to risk scores
Apply a tiered adjustment to risk scores based on historical coding intensity | Use two years of data in risk model and make diagnoses from HRAs ineligible for risk adjustment: $124B (CBO, 2025-2034) |
| Benchmarks: Move away from the quartile system and revise calculation of traditional Medicare spending. | Use a blend of national and local traditional Medicare spending (MedPAC)
Use spending for traditional Medicare beneficiaries enrolled in both Part A and Part B (MedPAC, Paragon Health Institute)
Eliminate benchmark cap based on pre-ACA spending (MedPAC, Paragon Health Institute)
Discount benchmark by 2% (MedPAC)
Cap benchmarks at 100% of traditional Medicare spending, except in counties with low Medicare Advantage penetration (Paragon Health Institute) | Blending national and local traditional Medicare spending: $10B over 5 years (MedPAC, est. in 2021) Capping benchmarks at 100% of traditional Medicare spending: $385B (Paragon Health Institute, est. in 2024) |
| Quality Bonus Program and Star Ratings: Replace, modify, or end quality bonus program and/or revise star rating system. | Make quality bonus program budget neutral (CFRB)
End benchmark increases for plans that obtain certain quality scores (H.R. 3467)
Eliminate double bonus counties | Eliminating double bonuses: $18.2B (CBO, 2019-2028)
Making QBP budget neutral: $115-170B (CFRB, 2024-2033) |
| Reinsurance or Stop Loss: Establish mechanism to protect insurers from extremely high and unexpected costs. | Stop-loss payments to plans that experience significantly higher spending than expected (H.R.3467) | Budget neutral |
| Competitive Bidding: Use plan estimates of costs to cover standard set of benefits to set benchmark. | Set benchmark at the enrollment-weighted average of Medicare Advantage insurer bids to provide a standardized benefit package (Schaeffer Initiative for Health Policy, Bipartisan Policy Center) | Benchmark set to enrollment-weighted average of bids: $400B to $500B (BPC, 2024-2033). |
This work was supported in part by Arnold Ventures. KFF maintains full editorial control over all of its policy analysis, polling, and journalism activities.