A Closer Look at California’s Plans to Implement Work Requirements While Facing Major Budget Shortfalls Amid Cuts in Federal Medicaid Funding
The 2025 reconciliation law requires states to condition Medicaid eligibility for adults in the Affordable Care Act (ACA) Medicaid expansion group and enrollees in partial expansion waiver programs (Georgia and Wisconsin) on meeting work requirements starting January 1, 2027. Implementing work requirements will require complex changes to eligibility and enrollment systems, as well as enrollee outreach and education, staff training, and coordination with managed care plans, providers, and other stakeholders. As states are preparing to implement work requirements and other changes in the reconciliation law, many states are facing more tenuous budget situations with slowing revenue growth and broader reductions in federal funding.
The governor projects a $3 billion budget deficit for fiscal year (FY) 2027 and is proposing changes to slow Medicaid spending and close budget gaps while anticipating reductions in federal funding primarily due to changes included in the 2025 reconciliation law. Overall, state data show that California Medicaid (Medi-Cal) provides coverage to 14.8 million enrollees as of June 2025. Under the Governor’s proposed budget, Medicaid accounts for about 40% of the state budget and 20% of General Fund spending in FY 2027 or $49 billion (an increase from $45 billion in FY 2026). This issue brief examines the current budget context in California, the governor’s recently proposed budget, the state’s Medicaid Advisory Committee (MAC) meeting, state implementation plan documents and guidance, and data from KFF’s Medicaid work requirements tracker to provide initial insight into how California — the state with by far the largest number of Medicaid enrollees — is preparing to implement Medicaid work requirements during ongoing state budget debates.
What is the budgetary context as California prepares to implement work requirements?
California is facing a more tenuous fiscal climate like in other states, which led the state to implement spending cuts in FY 2026. In the past year, revenue volatility and rising costs have led to slowing state revenue growth following a period of record-breaking revenue and expenditure growth for states after the initial pandemic-induced economic downturn. Facing budget pressures in FY 2026 due to increasing spending demands from Medicaid, employee health care, education, housing, and disaster response, California implemented measures to slow cost growth in Medicaid, most of which may be attributed to higher utilization of services per-enrollee, higher service costs, and recent state benefit expansions. The changes in FY 2026 included partially restoring the asset test for seniors and persons with disabilities, ending Medicaid coverage of GLP-1s for obesity treatment, and ending supplemental payments for dental services.
In addition to Medicaid cuts, the state also implemented restrictions to their state-funded health program for immigrant adults who would qualify for Medicaid if not for their immigration status, including pausing enrollment and benefits, implementing cost-sharing, and reducing payments to health centers for services provided to undocumented immigrants. The state increased spending in other areas to fill in losses in federal funding, such as allocating funds to replace ACA Marketplace subsidies for some enrollees after the expiration of ACA enhanced premium tax credits at the end of 2025. California received $233 million this year from the federal Rural Health Transformation Program to help offset the 2025 reconciliation law impact on rural areas, though the program is unlikely to fully cover losses over time due to cuts in the law and from other federal policy changes.
The California governor’s proposed budget projects a $3 billion structural deficit for FY 2027 that is expected to grow to $22 billion in FY 2028 due to costs outpacing revenues and changes included in the 2025 reconciliation law. The governor’s proposed budget estimates that the 2025 reconciliation law would result in costs of $1.4 billion General Fund in FY 2027, with $1.1 billion in Medicaid alone. The proposed budget anticipates cost increases despite estimated reductions in spending due to eligibility changes that are expected to reduce the number of enrollees once they go into effect in 2027 (including work requirements, more frequent redeterminations, immigrant eligibility changes, and retroactive coverage). The budget also assumes cost increases (or revenue decreases) due to financing changes related to the state’s managed care tax and the hospital quality assurance fee, which are offset by modest revenue increases in the state’s managed care behavioral health tax. Other financing changes (including changes to state directed payments) will likely have larger impacts beyond the 2027 budget window.
In addition to the required federal Medicaid changes, the governor’s proposed budget voluntarily imposes Medicaid work requirements and six-month redeterminations on certain enrollees in California’s state-funded health program for immigrants. At the local level, voters in one California county approved a ballot measure in December 2025 to raise taxes to backfill Medicaid funding gaps caused by the 2025 reconciliation law, and voters in other counties may also consider similar ballot measures later in 2026.
What do we know about how California will implement work requirements?
Most Medicaid adults in California under age 65 who will be subject to the new work requirements are already working or attending school. As of June 2025, there were about five million expansion enrollees in California who could be affected by the new requirements. KFF analysis indicates that roughly 63% of Medicaid adults without dependent children in California who could be subject to work requirements work 80 or more hours per month or are attending school. In addition, many enrollees who are not working the required hours will likely qualify for exemptions from the new work requirements. California currently estimates that the introduction of work requirements will result in up to 1.4 million individuals being disenrolled over the reconciliation law implementation period.
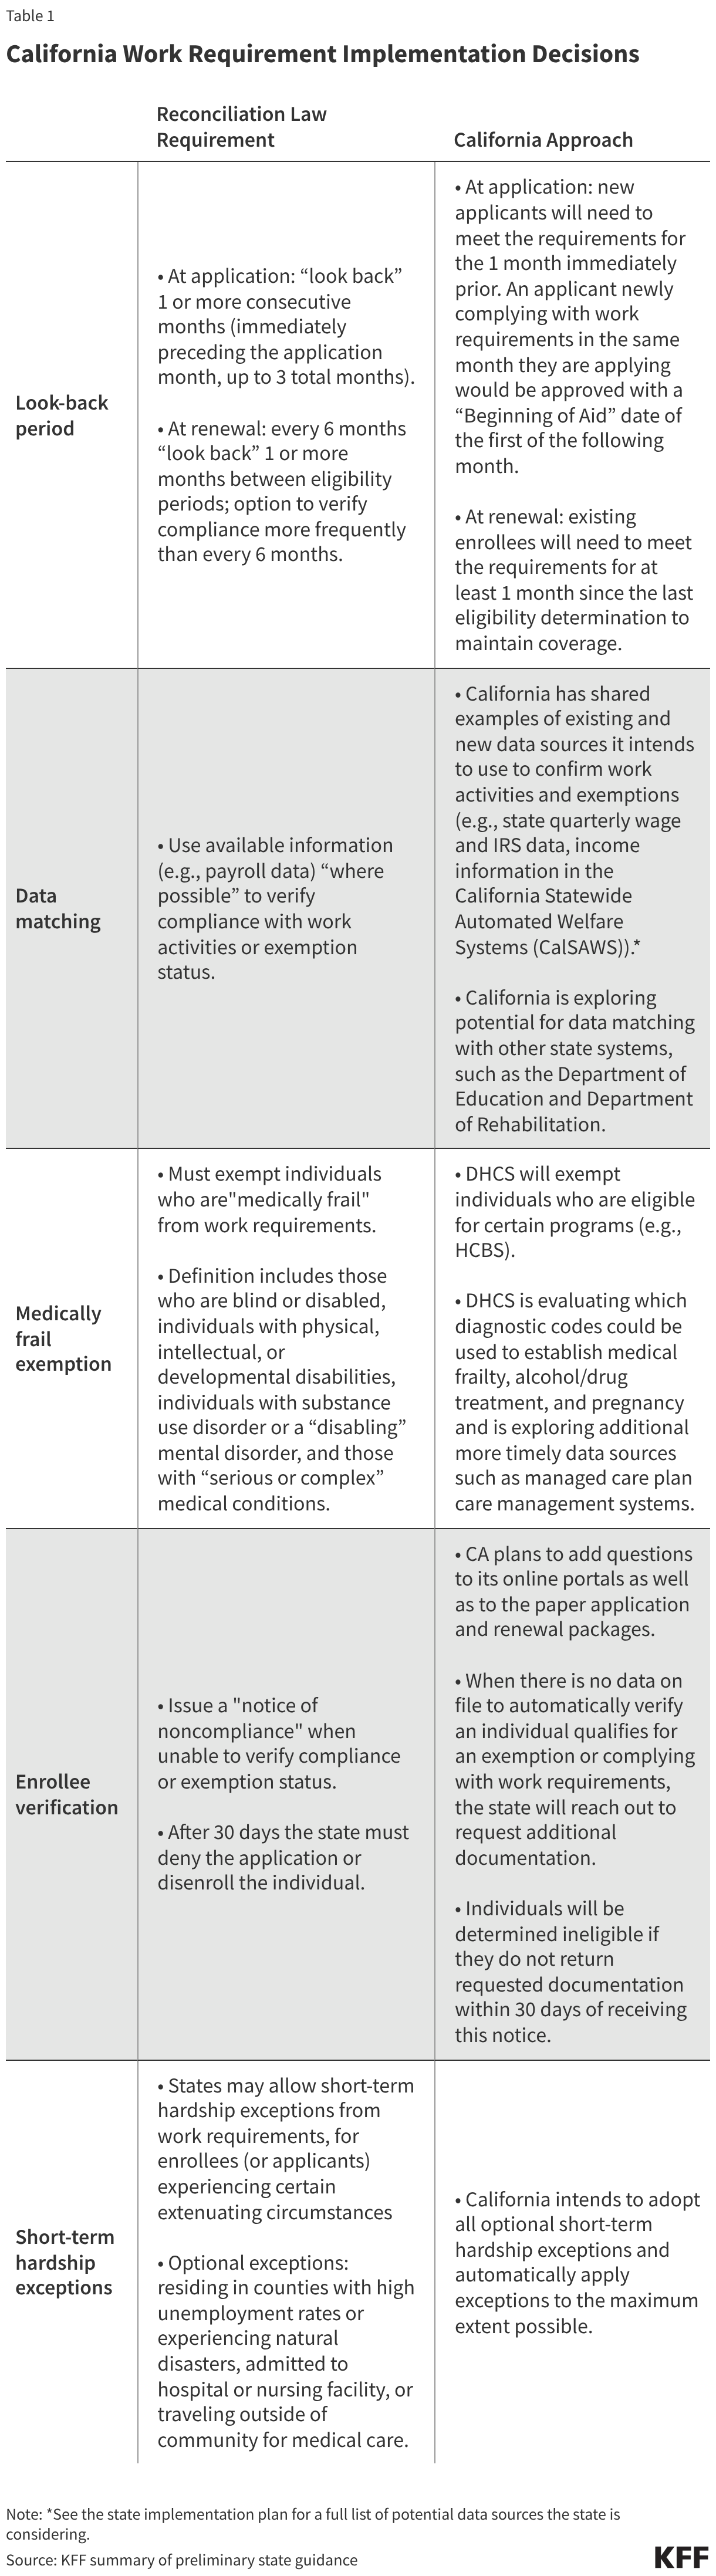
In initial state guidance, California provided a first look into how the state is planning to implement work requirements. Current state guidance discusses policies such as look-back periods, data matching, enrollee verification, and short-term hardship exceptions (Table 1). The guidance also provides early plans for individuals experiencing changes in circumstances and transitioning into the ACA Medicaid expansion group from groups not subject to work requirements, saying they will be subject to work requirement verification at their next renewal rather than immediately at the time of transition. There remain several areas where the state is waiting on federal guidance before clarifying policies (e.g., definitions for the “medically frail” exemption, standards for self-attestation, acceptable forms of verification, and criteria for exemptions and work activities).
In a recent Medicaid Advisory Committee (MAC) meeting, California state officials also provided early insight into the state’s outreach and communication plan. All states are required to have a Medicaid Advisory Committee to advise the State Medicaid agency about health and medical care services. These groups include Medicaid enrollees, advocates, and providers. The new law requires states to begin outreach to notify individuals (by mail and at least one additional method) of the new requirements at least three months before the start of the first compliance “look-back” period and notify individuals “periodically thereafter.” The proposed Governor’s Budget includes $4 million for navigators to assist with eligibility, enrollment, and retention. In its March MAC meeting, the state outlined some key tenets of its outreach plan:
- Early outreach. California has already started outreach to members (e.g., text messages) and plans to continue to spread awareness by sharing flyers, social media posts, text messages, and relying on word of mouth through local partners.
- Training and toolkits. The state plans to share toolkits and train county eligibility workers, Department of Health Care Services (DHCS) Coverage Ambassadors, navigators, health plans, doctors’ offices, clinics, community health workers, and community-based partners.
- Maximizing reach. California will translate materials into 19 languages and work with “trusted messengers” (e.g., local groups) to help people get and retain coverage.
- Automation and simplification. The state will aim to use existing data, when possible, to minimize extra steps for individuals and to simplify forms and renewal instructions as much as possible.
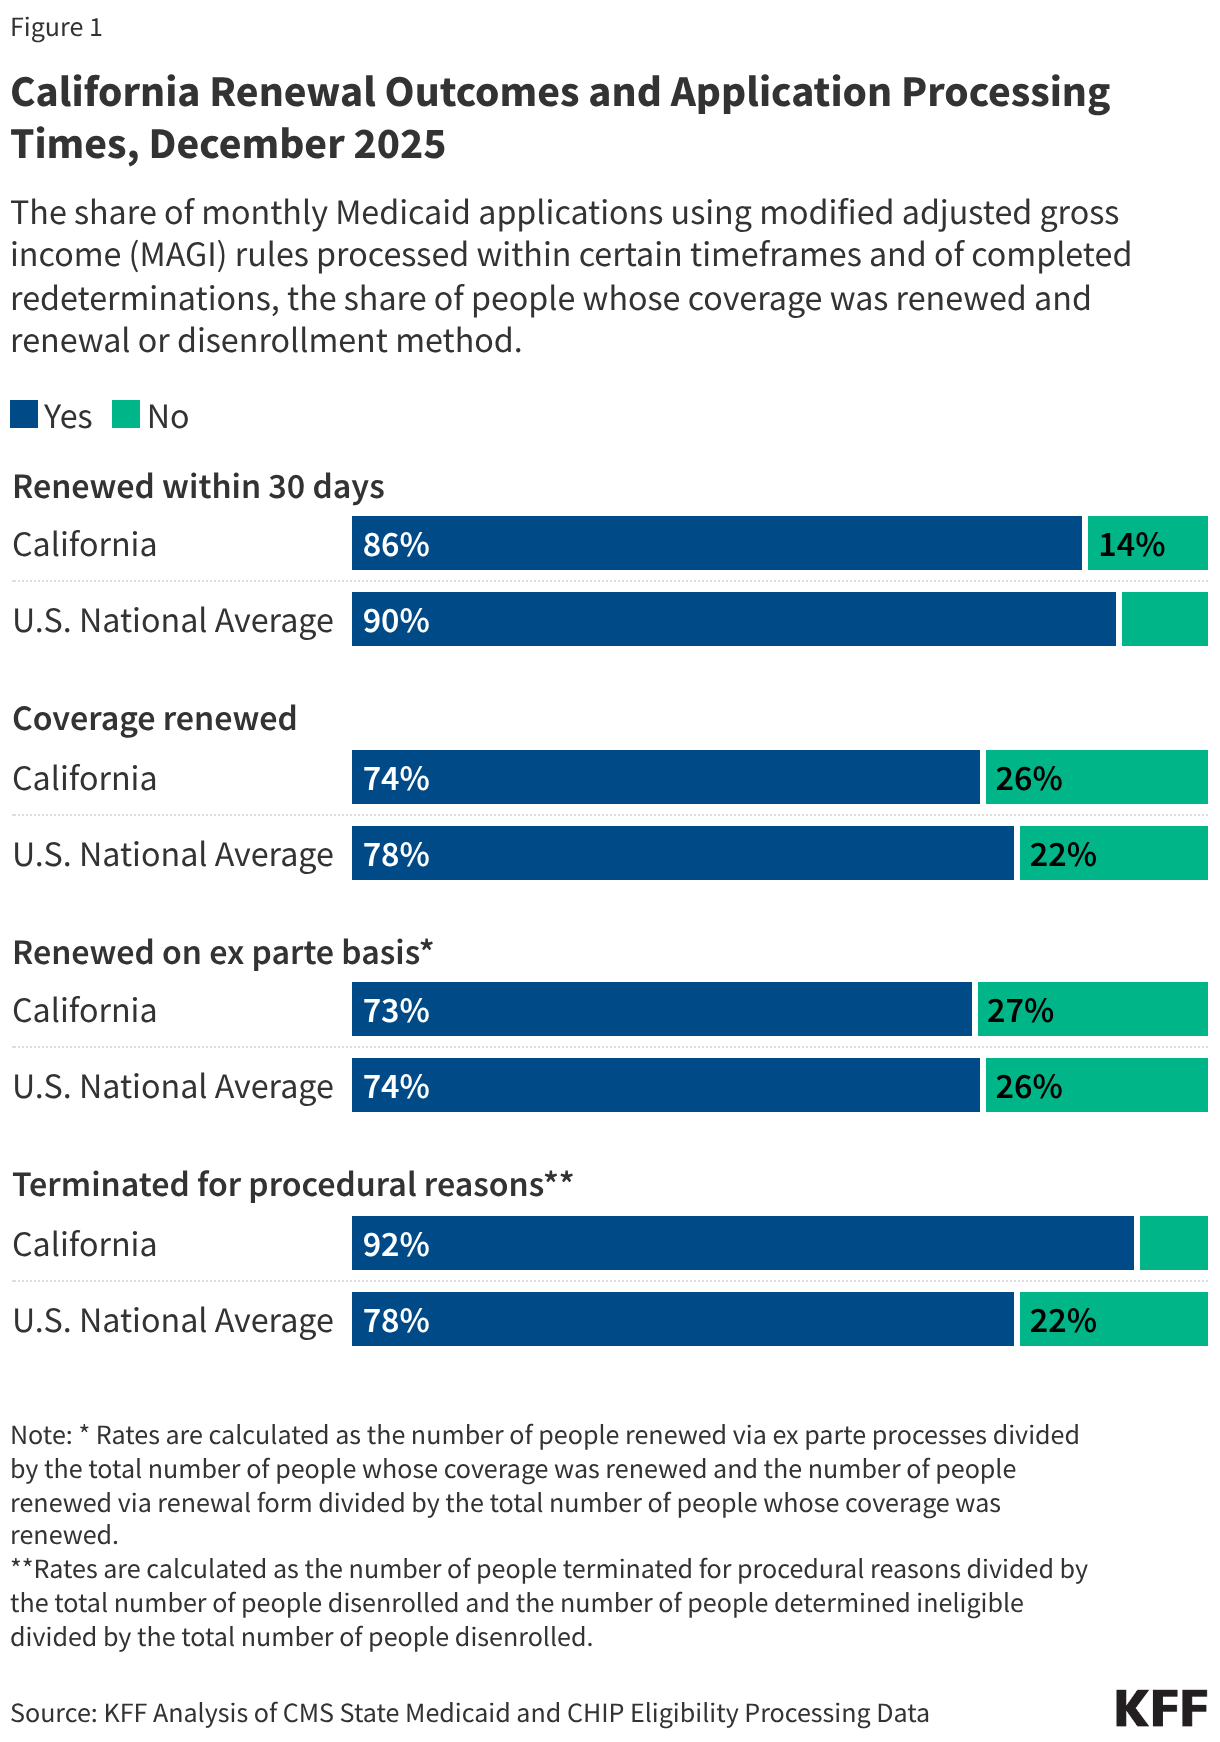
KFF is tracking metrics related to Medicaid enrollment, renewal outcomes, and application processing times that can provide insight into California’s potential readiness to implement data matching and other necessary system changes. As of December 2025, nearly nine in 10 applications in California were processed within 30 days and nearly three in four individuals going through a Medicaid redetermination had their coverage renewed. Of people who retained coverage, 73% were renewed through ex parte processes (meaning the state verifies ongoing eligibility through available data sources before sending a renewal form or requesting documentation from an enrollee). Early data match estimates shared during the recent MAC meeting list around 1.8 million individuals able to be determined exempt or compliant via an automated source based on August 2025 enrollment data, although these estimates are likely to change as the state integrates additional data sources and implements cross-system information data sharing. In its implementation plan, California acknowledges that ex parte rates have dropped back to levels from before the unwinding of COVID-era guarantees of continuous Medicaid enrollment and anticipates the work requirements to increase the manual administrative workload to support members in retaining coverage. Among those who were disenrolled, 92% were terminated for procedural reasons (a higher rate than the national average of 78%). While these metrics provide insight into California’s Medicaid eligibility systems, they are not the only indicators or predictors of successful implementation of work requirements, which will also require enrollee outreach and education, staff training, and coordination with managed care plans, providers, and other stakeholders.
As states implement work requirements, ongoing monitoring can help assess how processes are working and identify areas of concern. Central to that oversight is timely data on renewal outcomes, including data on disenrollments related to work requirements. While available data (highlighted above) from CMS can be helpful, these data are not timely enough for real-time monitoring and they do not isolate outcomes for the expansion population. States can fill that gap by reporting more timely data on application and renewal outcomes that include breakouts for individuals subject to work requirements. In the MAC presentation slides, California state officials communicated their intention to monitor key metrics related to the impact of work requirement implementation, including the number of individuals subject to work requirements, the number of individuals in compliance with reporting requirements, and the number of individuals who lose coverage due to procedural disenrollments.