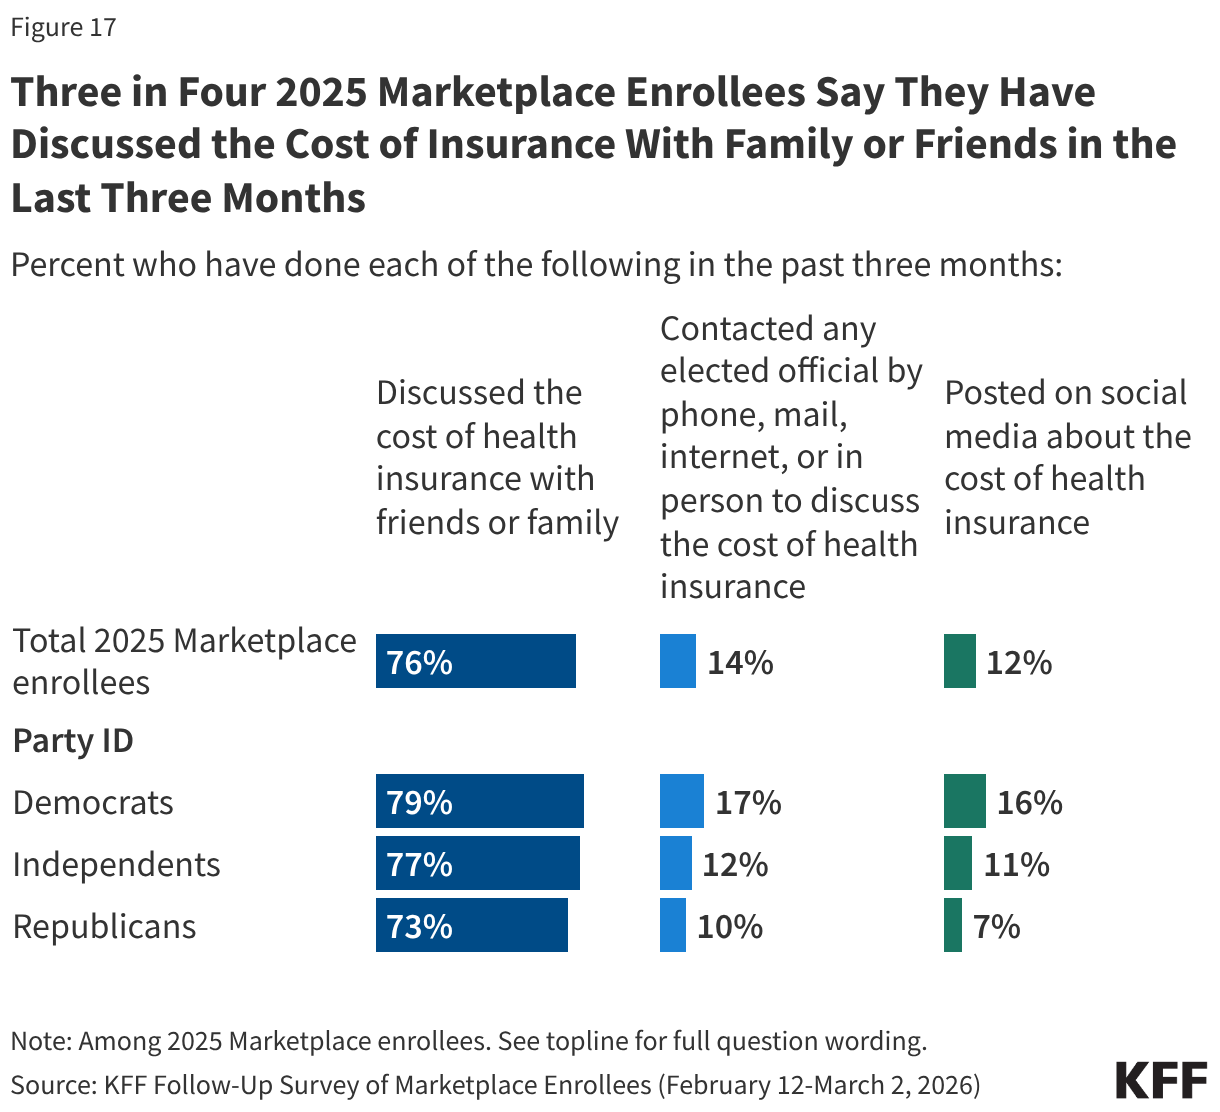
The impact of claims denials is widely recognized by lawmakers and the public. According to a January 2026 KFF poll, two-thirds (66%) of insured adults believe delays and denials of health care services by health insurance companies are a “major problem.” One-third (33%) of insured adults say they have had a health insurance company deny coverage for a certain health care service or medication prescribed by their doctor in the past two years. The Affordable Care Act (ACA) requires insurers to report transparency data for all non-grandfathered health plans sold on and off the Marketplace, including fully-insured and self-funded employer health plans. Partial implementation of this federal requirement began with the 2015 plan year; however, it has so far been limited to qualified health plans (QHPs) offered on the federally facilitated Marketplace, HealthCare.gov (including state-based Marketplaces that rely on HealthCare.gov for eligibility and enrollment functions). It does not yet include QHPs offered on state-based Marketplaces or group health plans.
This brief analyzes federal transparency data published by the Centers for Medicare and Medicaid Services (CMS) on claims denials and appeals for non-group qualified health plans (QHPs) offered on HealthCare.gov in 2024. Similar to KFF’s previous analyses of these data, a downloadable working file based on CMS’s public use file is available on the right-hand side of this brief.
Key Takeaways
- Insurers of qualified health plans (QHPs) sold on HealthCare.gov denied 19% of in-network claims in 2024 and 37% of out-of-network claims for a combined average of 20% of all claims, all similar to 2023.
- The in-network denial rate ranged from 3% to 36%, with significant variation by insurer and by state. Three percent of reporting insurers had in-network denial rates of 30% or higher in 2024, a decrease from 17% in 2023.
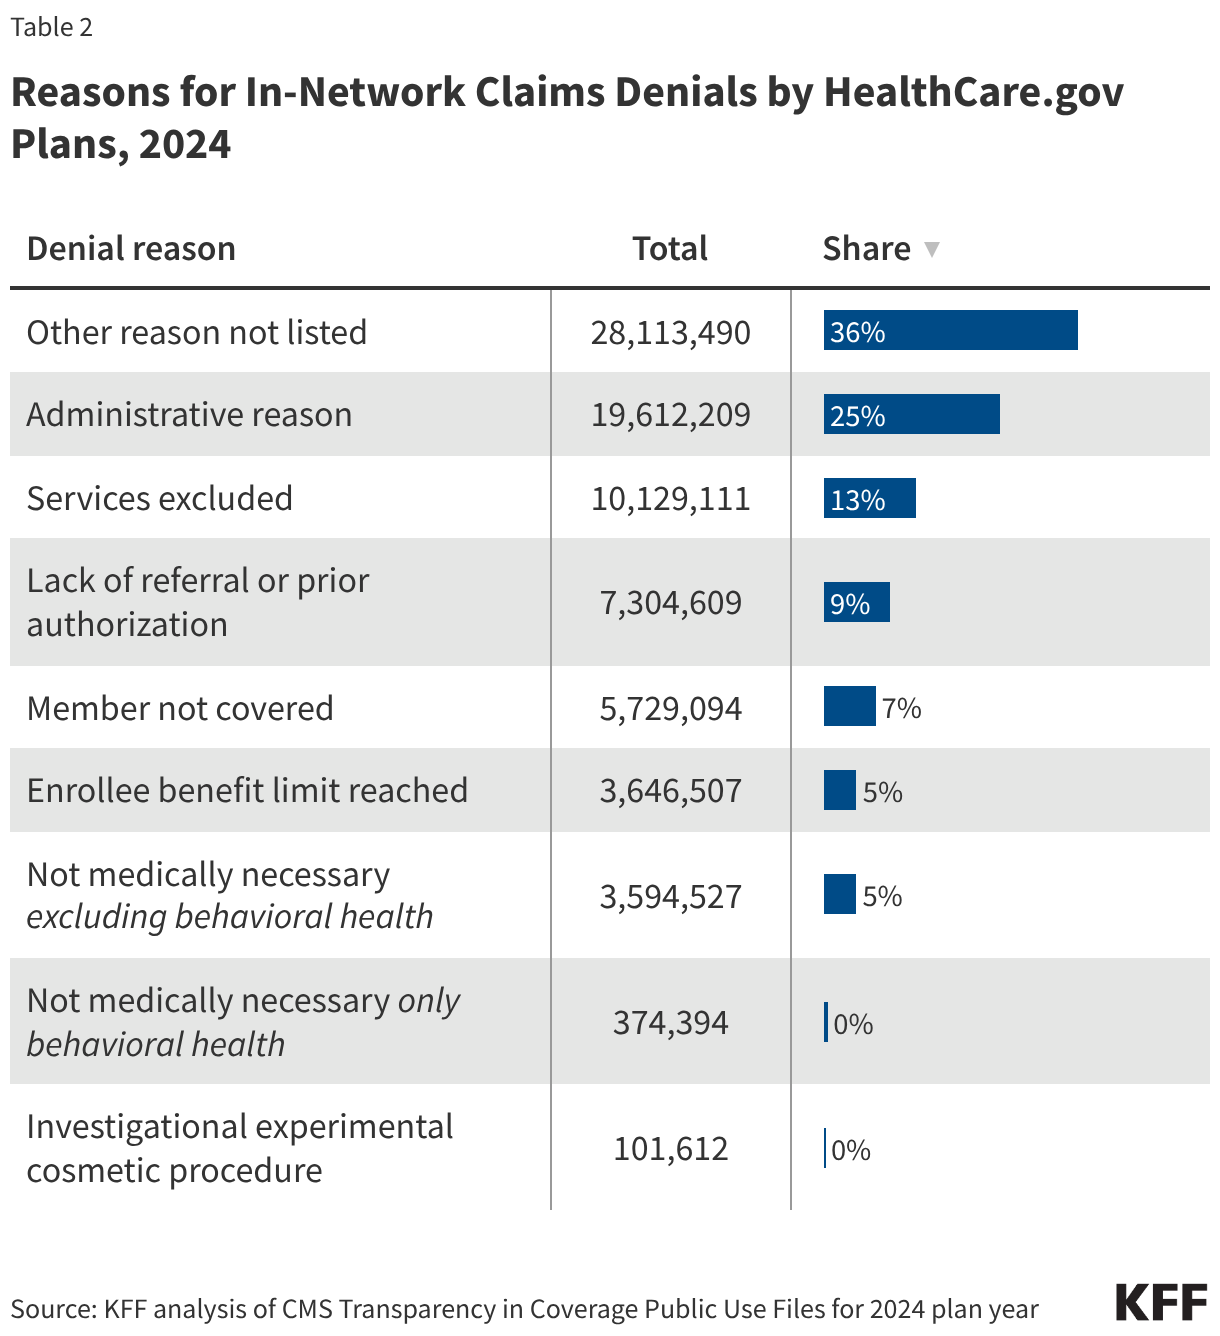
- Of the limited information available on in-network claims denial reasons, the most common reasons cited by insurers in 2024 included “Other” [reason not listed] at 36%, followed by administrative reasons (25%). Nine percent of denials were for lack of prior authorization or referral, and only 5% of denials were for lack of medical necessity. Insurers do not report what types of services were denied.
- Consumers rarely appeal denied claims (fewer than 1% of denied claims were appealed), and when they do, insurers usually uphold their original decision (66% of appeals were upheld).
- Marketplace enrollees filed at least 5,881 external appeals in 2024, or 4% of all upheld internal appeals. Due to the suppression of small values, the rate at which external appeals were upheld could not be calculated.
- Rapidly developing artificial intelligence (AI) tools may reduce administrative errors that can lead to improper denials, predict whether a claim will be paid, and assist providers and patients in appealing a denial, but federal oversight and guardrails to protect consumers may be a challenge.
Introduction
As part of the annual QHP certification process, issuers (referred to as insurers in this brief) must report certain denied claims information to CMS for plans that were offered in the previous year that they want to offer in the upcoming year. The ACA requires the data to be made available to federal and state insurance regulators and to the public. The current dataset only includes information about claims for benefits (medical and prescription drugs combined) made after a service was provided (post-service claims); it does not include information about denied requests for prior authorization (a claim decision made before a service is provided, also called a “pre-service” claim).
Insurers participating in the Marketplace in 2026 reported aggregated data on all HealthCare.gov QHPs they offered in 2024. Additionally, plan-level data from 2024 are reported for plans returning in 2026, including the number of in- and out-of-network claims submitted and denied, and reasons for claims denials. Among insurers participating in HealthCare.gov states in 2024, 52 are either not participating in 2026 or offered plans in states that have since switched to operating their own marketplaces, and therefore, did not provide claims denial information. (See the Methods section for details.) Among returning insurers, such denial information was only reported for 75% of their claims (the share of claims attributable to returning plans), because not all plans offered in 2026 were also offered in 2024 and vice versa. Additionally, only 62% of plans in the CMS dataset were also offered in 2024 and are included in the plan-level reporting for denial reasons. See the Methodology section for more details.
Claims Denials and Appeals in 2024
Insurer-level Claims Denials Data
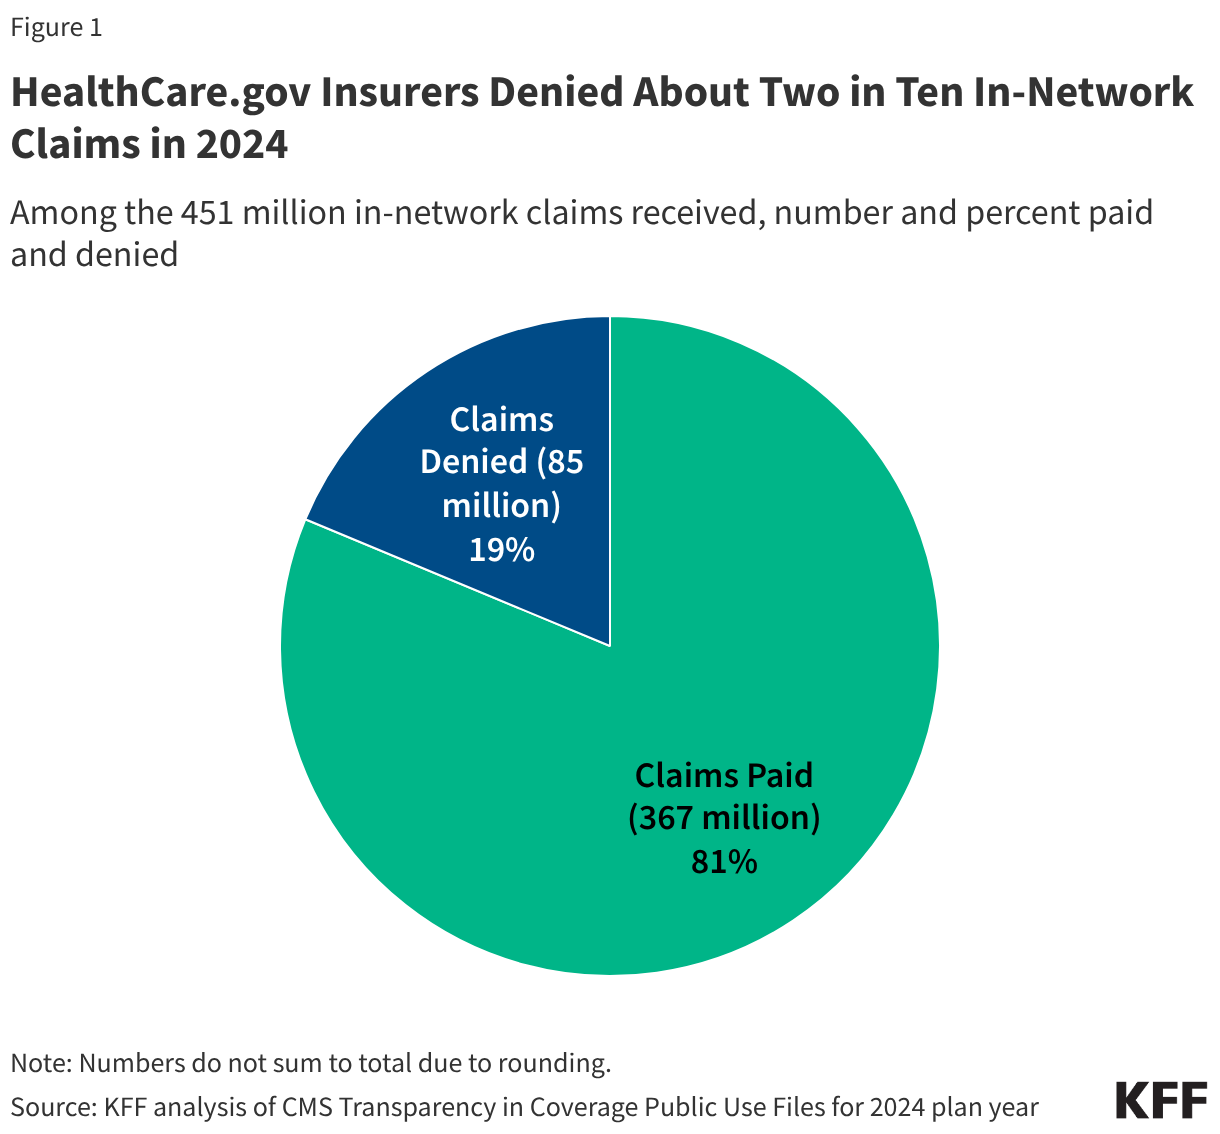
Insurers reported receiving about 496 million claims in 2024, with 91% (451 million claims) filed for in-network services. Of these in-network claims, approximately 85 million were ultimately denied, resulting in an average in-network denial rate of 19% (Figure 1). Out-of-network claims totaled 44 million, with an overall higher denial rate of 37%. Claims that were initially denied, then subsequently resubmitted and paid, are not included as denied claims in the denial rate.
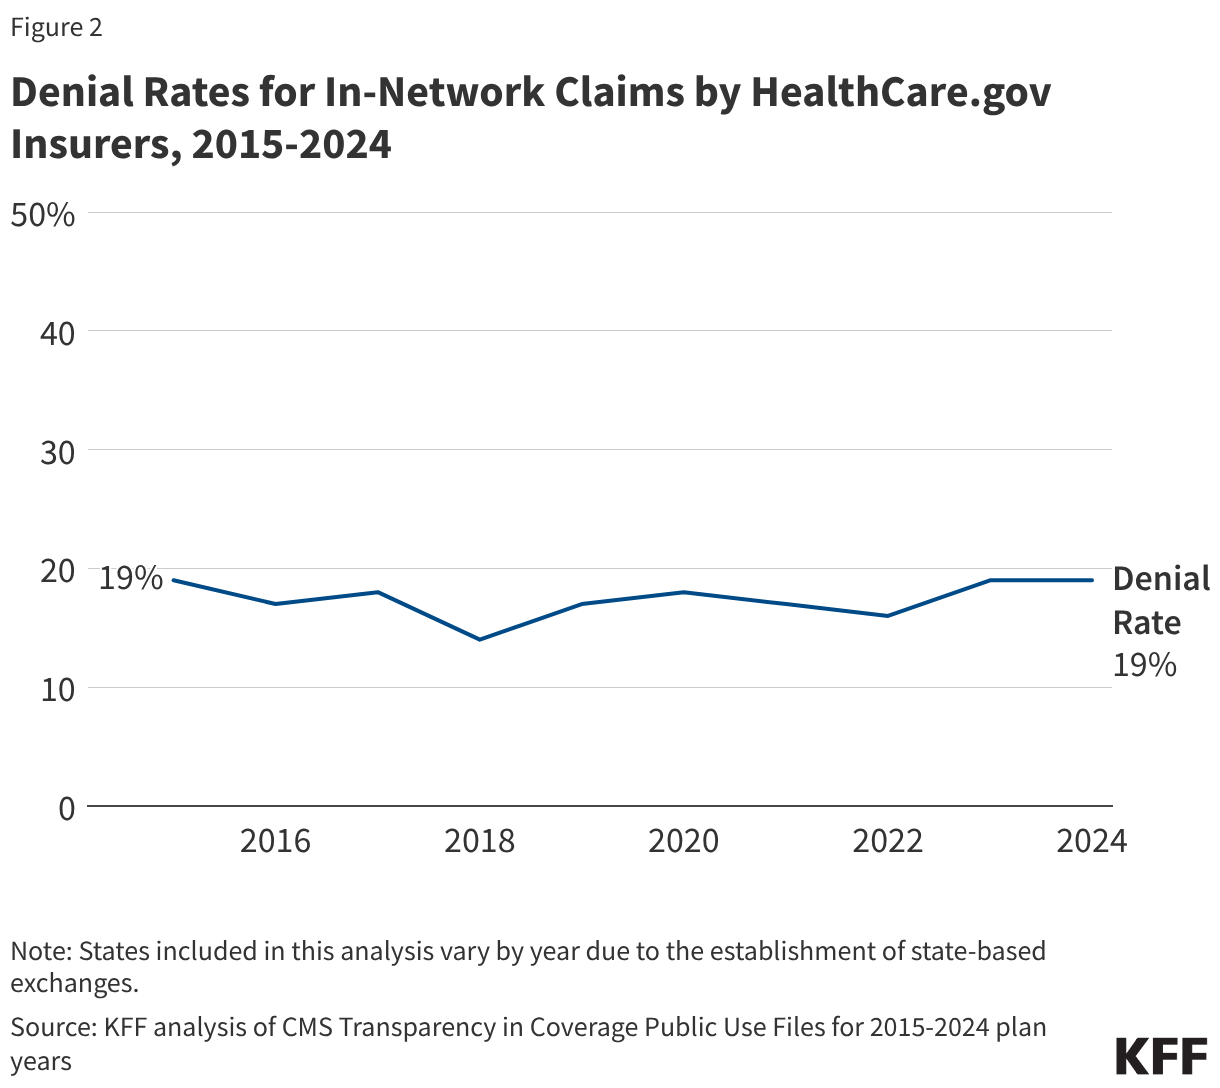
Although the composition of HealthCare.gov states has continued to change since the inception of transparency reporting, the overall in-network denial rate in 2024 is similar to previous years (Figure 2).
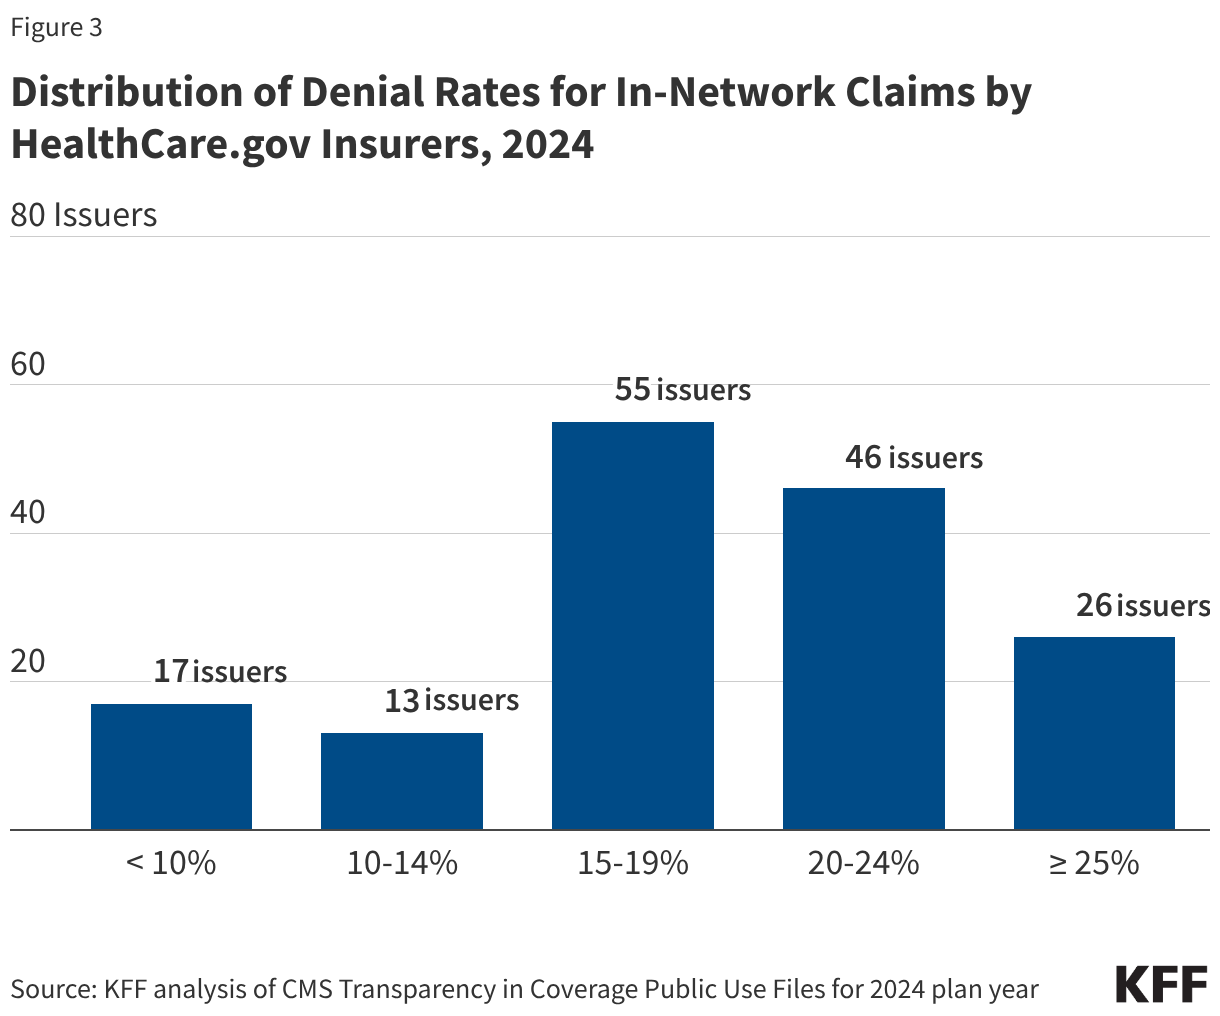
Insurer denial rates for in-network claims received in 2024 varied widely, ranging from 3% to 36%. Seventeen of the 157 reporting insurers had an in-network denial rate of less than 10%, while 26 insurers had a denial rate of 25% or more (Figure 3). About 3% of reporting insurers had in-network denial rates of 30% or higher in 2024, a decrease from 14% in 2023.
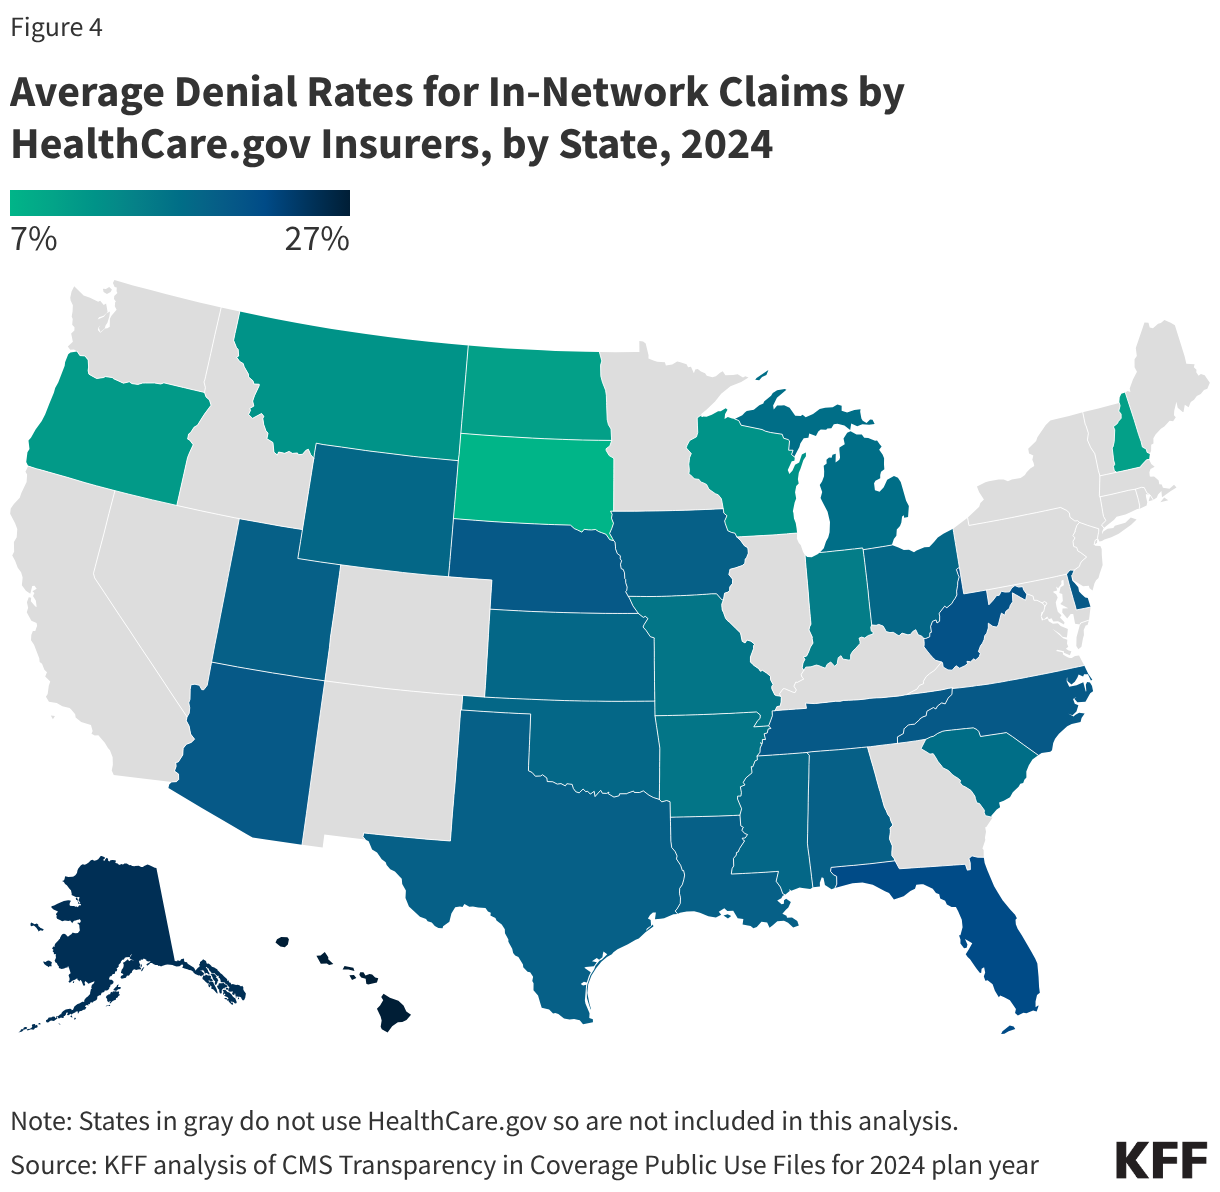
Denial rates also varied geographically (Figure 4). The state with the highest average in-network denial rate for HealthCare.gov insurers was Hawaii (27%), and the lowest average was in South Dakota (7%). South Dakota also had the lowest average denial rate in 2023 (6%). Average denial rates have the potential to obscure variation. For example, while the average denial rate for insurers in Texas was about the same as the national average, denial rates for insurers in Texas had greater variability than any other state included in this analysis, ranging from 12% to 36% (the highest single insurer-level denial rate in the country).
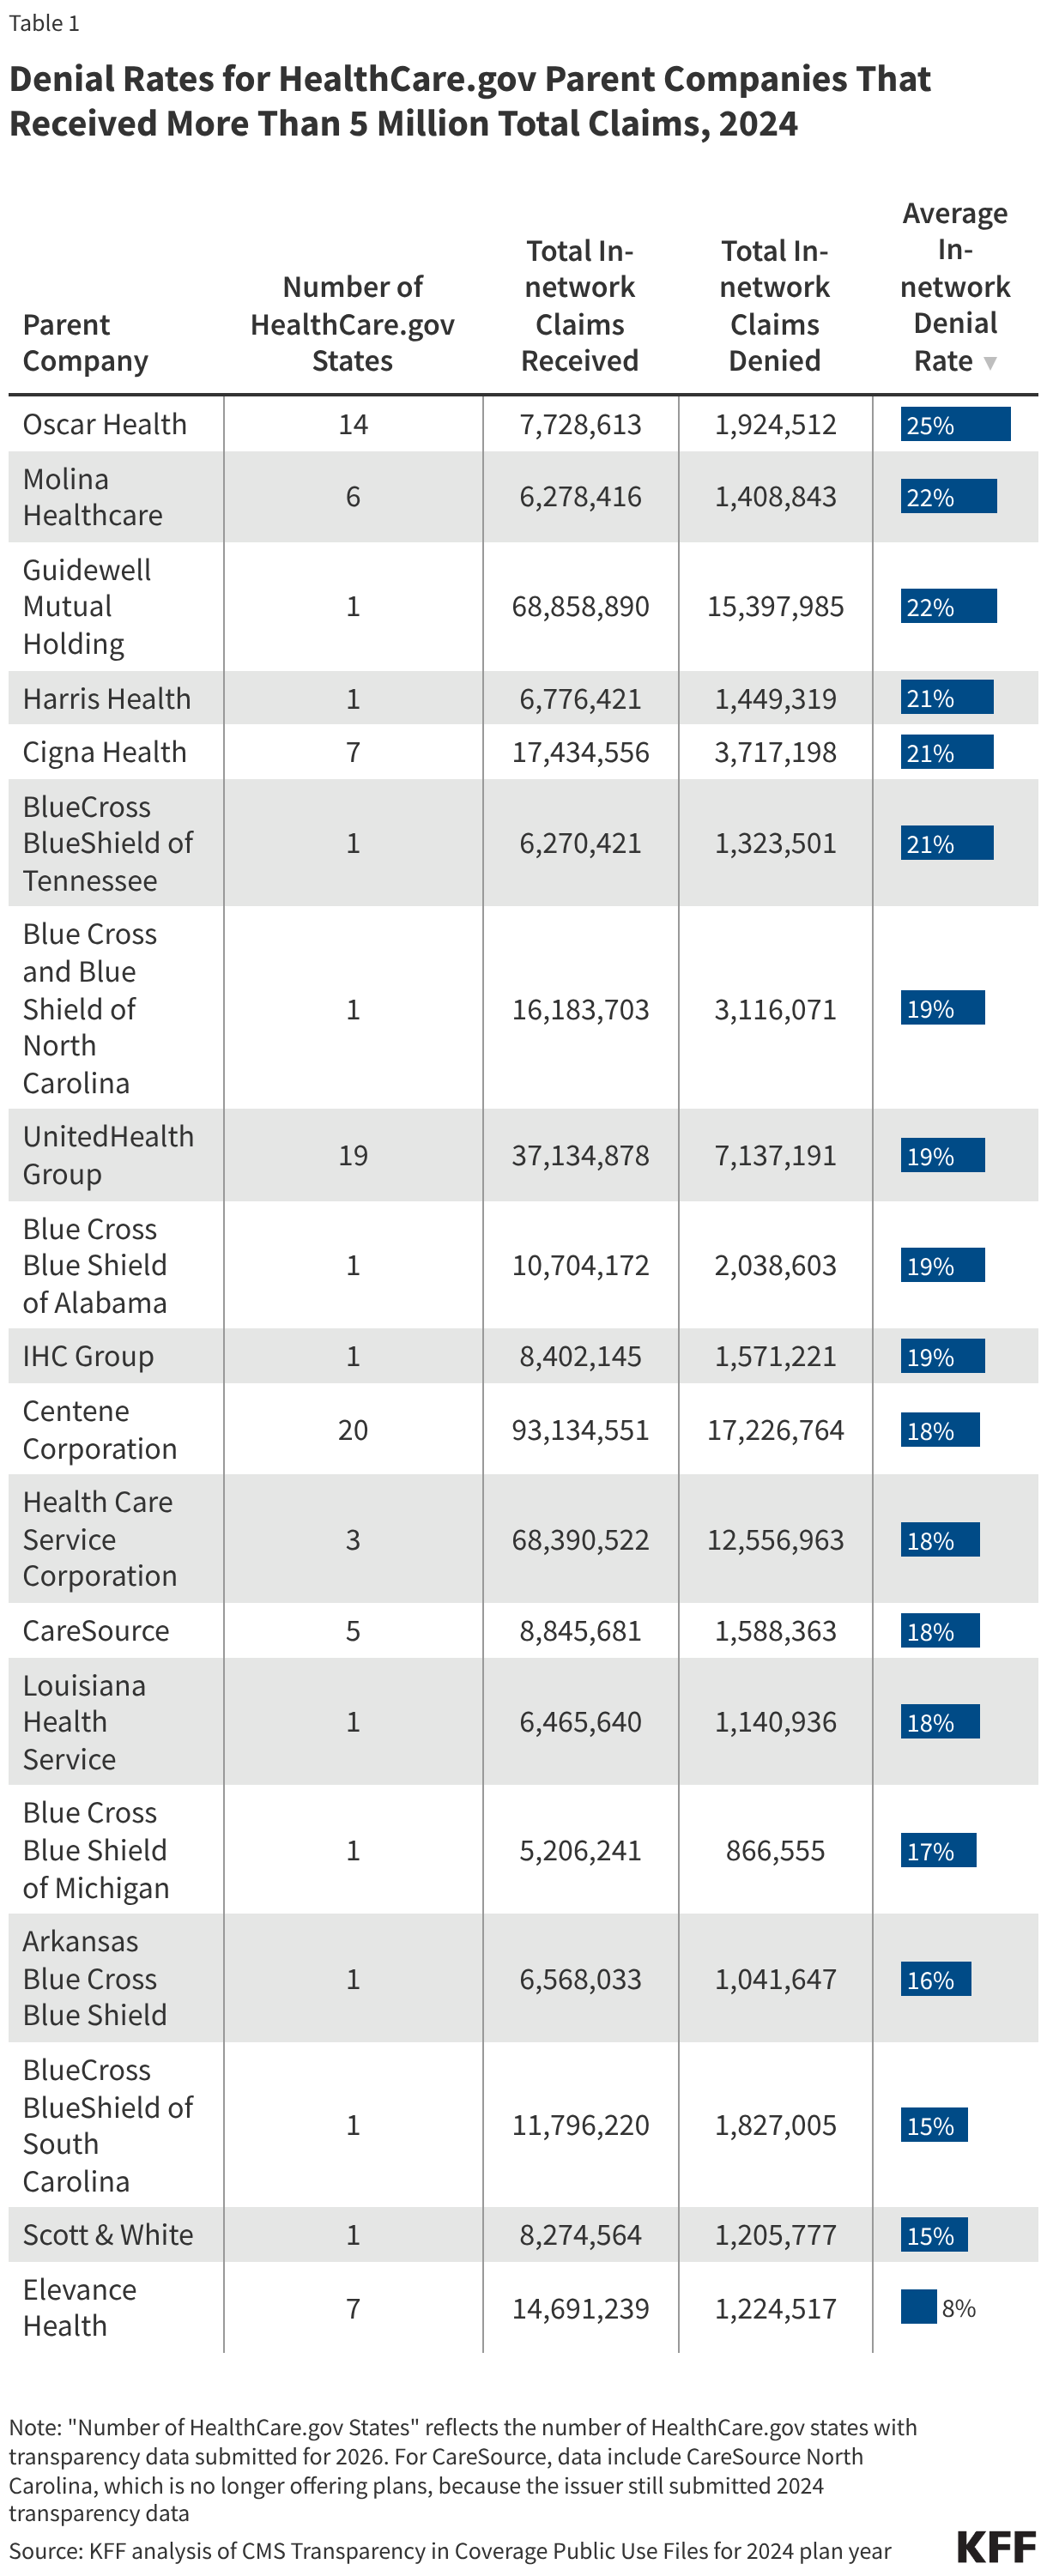
Denial rates vary substantially by insurer. Table 1 shows denial rates for claims filed in HealthCare.gov states by parent companies that received more than 5 million claims in 2024. (State-specific Blue Cross and Blue Shield parent companies are listed separately in the table below because they operate independently of one another.) For in-network claims processed by these parent companies, the average in-network denial rate was 19%, ranging from 8% (Elevance Health) to 25% (Oscar Health). There was less variability in 2024 than in 2023, when the lowest average denial rate by large parent companies was 14% (Centene), and the highest was 35% (Blue Cross Blue Shield of Alabama).
Plan-level Claims Denial Data
In addition to insurer-level data, insurers also report certain claims data at the plan level. Insurers reported about 79 million denial reasons, excluding denials for claims being out-of-network, for claims that were denied at some point in the adjudication process during the 2024 coverage year. In all, insurers reported on about 66 million in-network claims at the plan level that were ultimately denied that year.
Denial rates varied only slightly between most plan metal levels. On average, in 2024, HealthCare.gov insurers denied 19% of in-network claims in their bronze plans, 20% in silver plans, 17% in gold plans, 18% in platinum plans, and 22% in catastrophic plans. These are similar to 2023 except for catastrophic and platinum plans, which denied an average of 26% of in-network claims that year.
Denial Reasons
CMS requires HealthCare.gov insurers to report the reasons for claims denials at the plan level. Specified denial reason categories include:
- Denials due to lack of prior authorization or referral
- Denials due to an out-of-network provider
- Denials due to an exclusion of a service
- Denials based on medical necessity (reported separately for behavioral health and other services)
- Denials due to enrollee benefit reached
- Denials due to a member not being covered
- Denials due to investigational, experimental, or cosmetic procedure
- Denials for administrative reasons (which include claims that were duplicated, missing information, untimely, for an unapproved provider, or that met other criteria)
- Denials for all other reasons not specified above
A claim might be denied for more than one reason and on more than one submission, and each denial reason is tallied separately (see the Data Limitations section for more information). The distribution of denial reasons, shown in Table 2, likely includes multiple reasons per claim as the data set does not indicate the total number of claims denied at some point in the adjudication process, nor the number of times a given claim was denied. Of in-network claims, 13% of denials were because the claim was for an excluded service, 9% of denials were due to lack of prior authorization or referral, and only 5% were based on medical necessity. The share of denial reasons related to administrative reasons was 25%, the most common reason aside from “other" (36%).
Insurers also had wide variability in their use of denial reasons. While 5% of all in-network claim denials by HealthCare.gov plans were based on medical necessity, several plans reported much higher shares for medical necessity reasons. For example, 38% of denial reasons for Molina Healthcare of Mississippi were due to medical necessity. Similarly, while 9% of all in-network denials by HealthCare.gov plans were based on lack of prior authorization or referral, some plans reported a much larger share. For example, 97% of denial reasons for Blue Cross Blue Shield of Arizona were for lack of prior authorization or referral.
Plans may apply utilization review techniques differently. For example, individual insurer policies and practices may affect the balance between denials for failure to obtain referral/prior authorization and medical necessity denials, as greater use of prior authorization would shift utilization review to before a service is provided and possibly decrease the number of denials due to medical necessity. However, without more detail on the types of claims subject to these denials, it is not possible to discern the possible implications for patients. Additionally, denials captured in the CMS data do not reflect the share or types of services covered by insurers.
Appeals Data
CMS requires insurers to report the total number of denied and internally appealed claims at the insurer level. Internal appeal is a process that allows consumers to challenge a denied claim made by their health insurer. As in KFF’s previous analyses of federal claims denial data, we find that consumers rarely appeal denied claims, and when they do, insurers usually uphold their original decision.
Appeal to Insurer (Internal Appeal). Of the approximately 85 million in-network denied claims in 2024, HealthCare.gov consumers appealed at least 262,982 – an appeal rate of less than 1%. (CMS suppresses reporting of observations lower than 10, so the number of internally appealed claims could be higher). Insurers upheld 165,863 (66%) denials on appeal. Relatedly, the 2023 KFF Survey of Consumer Experiences with Health Insurance found that only one in ten insured adults who reported experiencing a problem with their insurance in the past year had filed a formal appeal.
Appeal to Third Party (External Appeal). Consumers whose denial is upheld at internal appeal may have the right to an independent external appeal (also called external review) for certain types of claims. Among insurers that reported at least 10 external appeals in 2024, Marketplace enrollees externally appealed at least 5,881 claims in 2024 (again, the number of externally appealed claims could be higher due to CMS suppression of values under 10). Among insurers that reported at least 10 external appeals in 2024, 4% of upheld appeals were externally appealed. Due to the suppression of small values, the rate at which external appeals were upheld could not be calculated.
It is not well known that consumers can appeal claims denials through an external appeal process. KFF’s 2023 consumer survey found that just 40% of consumers believed they have a legal right to appeal to a government agency or independent medical expert, while 51% said they were unsure if they had appeal rights, and 9% did not believe they had this right. Furthermore, Marketplace enrollees (34%) were less likely to know they had external appeal rights compared to those with Medicare (58%) and Medicaid (45%).
Data Limitations
While the CMS data allows users to glean insights into HealthCare.gov insurers’ claims denials to a degree not broadly available for other market segments, it currently has several gaps and limitations. Because the current data do not link denial reasons to the services that were denied, neither the share of total claims denied for a given reason nor the type of service most often denied can be calculated. Claims initially denied but then paid cannot be identified from the data set, nor can the set of denial reasons associated with a given claim. For example, if the initial submission of a claim misspelled a patient’s name and was denied because the patient could not be identified, the claim may be denied again after being corrected and resubmitted if the claim were for a service that was not covered. Each of these reasons is reported individually, irrespective of whether a claim is resubmitted to correct the deficit, denied, or ultimately paid with or without appeal. In addition, the adjudication process employed by the insurer may affect how denial reasons are reported. Although publicly reported data allow for multiple reasons throughout the life of a claim, in practice, insurers may file denial reasons sequentially and not capture all applicable reasons for denying claims, such as denying claims from an unidentifiable enrollee before determining whether the claim was for a medically necessary procedure. Lastly, claims that are denied do not necessarily indicate that services are not ultimately paid by the insurer, such as when a new claim is filed instead of resubmitting the original. In these cases, the original claim would be counted as denied, even if the new claim was ultimately paid.
Federal reporting on denials could be more useful when presented as claims ever denied for a given reason, instead of tallying the total reasons. Also, reporting that includes denial information about all claims from all insurers in the previous year, and not just those attributable to plans that are returning to the Marketplace next year, would provide a more complete understanding of claims denials. Additionally, information about the types of services approved and denied (e.g., specialty of service and type of prescription drug) would give a more comprehensive picture of insurer practices and what type of care insurers actually cover. Information about appeals, especially external appeals, could provide insight into how this consumer protection mechanism works for patients. Information about what services required prior authorization and how often the prior authorization itself was approved and denied is another data element not included in the CMS data. Many insurers in the individual and group market report this information to the National Association of Insurance Commissioners (NAIC), but these specific data points are not available to the public.
Other Claims Data
With few exceptions, complete, uniform claims denial data are currently only available for plans sold on HealthCare.gov, making it difficult to directly compare these data to other segments of the private insurance market. However, related claims data from other sources are available and can provide some insights. Recent data for government health insurance programs, such as Medicare and Medicaid, largely focus on denials of prior authorization requests. (Prior authorization is a process used by health insurers that requires providers to obtain approval before a service or other benefit is covered, whereas the claims denial data in this analysis is based on claims the insurer receives after the service has been rendered.)
Other Private Insurance Claims Data
State Reporting Requirements
Some states require insurers to report certain claims denial data to the state, which are then made publicly available. For example, California requires all insurers on its state-based Marketplace, Covered California, to annually report claims data similar to what is available for HealthCare.gov insurers. In plan year 2023, insurers with complete claims data denied an average of 21% of in-network claims, similar to HealthCare.gov insurers. (Insurer-level claims data is not currently available for the 2024 plan year.)
Health insurers in Connecticut with at least 1,000 enrollees must report annual data on claims payment practices, prior authorization requests and denials, claims denial reasons, and several other metrics for all private market segments. In 2024, the largest insurers in Connecticut had an overall denial rate of 14%.
Vermont requires insurers of state-regulated health plans (individual and group) with at least 2,000 enrollees or that offer insurance through the Vermont Health Benefit Exchange to report certain pre- and post-service claims denial data to the state, including breakdowns by mental health, substance use disorder services, and prescription drugs. In 2024, these insurers denied an average of 8.5% of total claims received.
Connecticut’s and Vermont’s claims denial data are not directly comparable to those reported by Covered CA or HealthCare.gov insurers for several reasons, including that those states’ data include group health plans, and claims data are not separated by network status. As interest in insurer claims practices and transparency continues, more states may implement claims data reporting. These state laws, however, do not apply to self-funded health plans sponsored by private employers, which, nationally, cover most insured people under age 65, resulting in a patchwork of different requirements across the country.
National Association of Insurance Commissioners
The National Association of Insurance Commissioners (NAIC), via the Market Conduct Annual Statement (MCAS), collects uniform data annually on claims denials, prior authorization requests, appeals, and more from many insurers in the individual and group markets in nearly every U.S. state. MCAS data are intended to help state insurance regulators monitor the market conduct of insurance companies, and insurers can use this information to identify areas to improve performance. However, full MCAS health insurance data are shared with state regulators only, not the general public or CMS. A limited national summary published by the NAIC shows that the average claims denial rate for both in- and out-of-network claims (excluding pharmacy) in 2024 was 16%.
Prior Authorization Data for Government Health Insurance Programs
Medicare
Medicare Advantage, which covers more than half of all Medicare beneficiaries, has come under scrutiny in recent years over concerns about policies and processes related to prior authorization denials. According to a KFF analysis of federal data, Medicare Advantage plans fully or partially denied 4.1 million prior authorization requests in 2024, for an overall denial rate of nearly 8%. The use of prior authorization in traditional Medicare is relatively new and is only used for a limited set of services. According to KFF analysis, in 2024, CMS denied about 143,000 prior authorization requests for traditional Medicare beneficiaries, for a denial rate of about 23%.
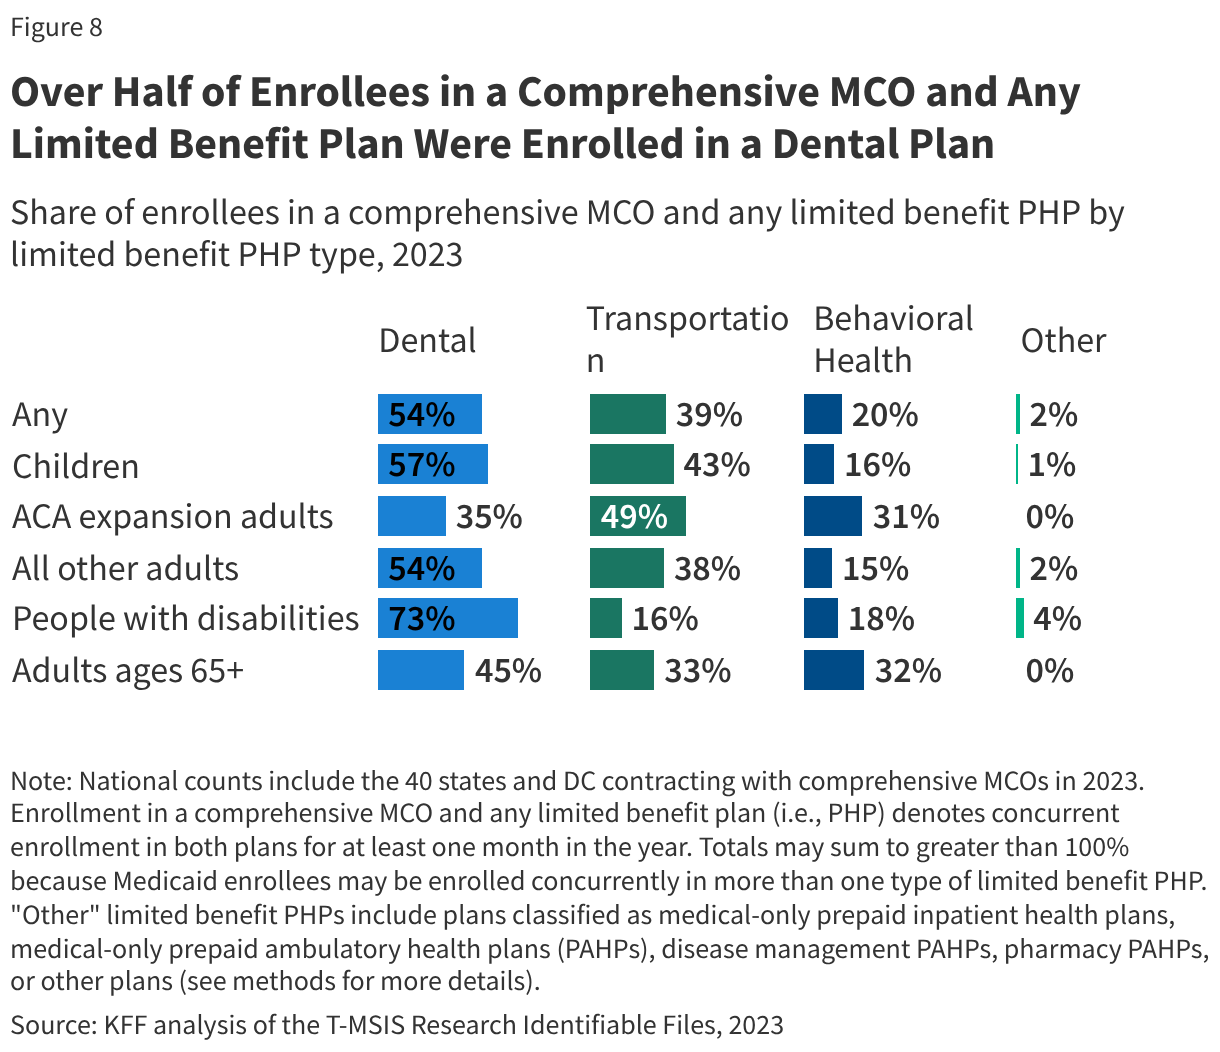
Medicaid Managed Care
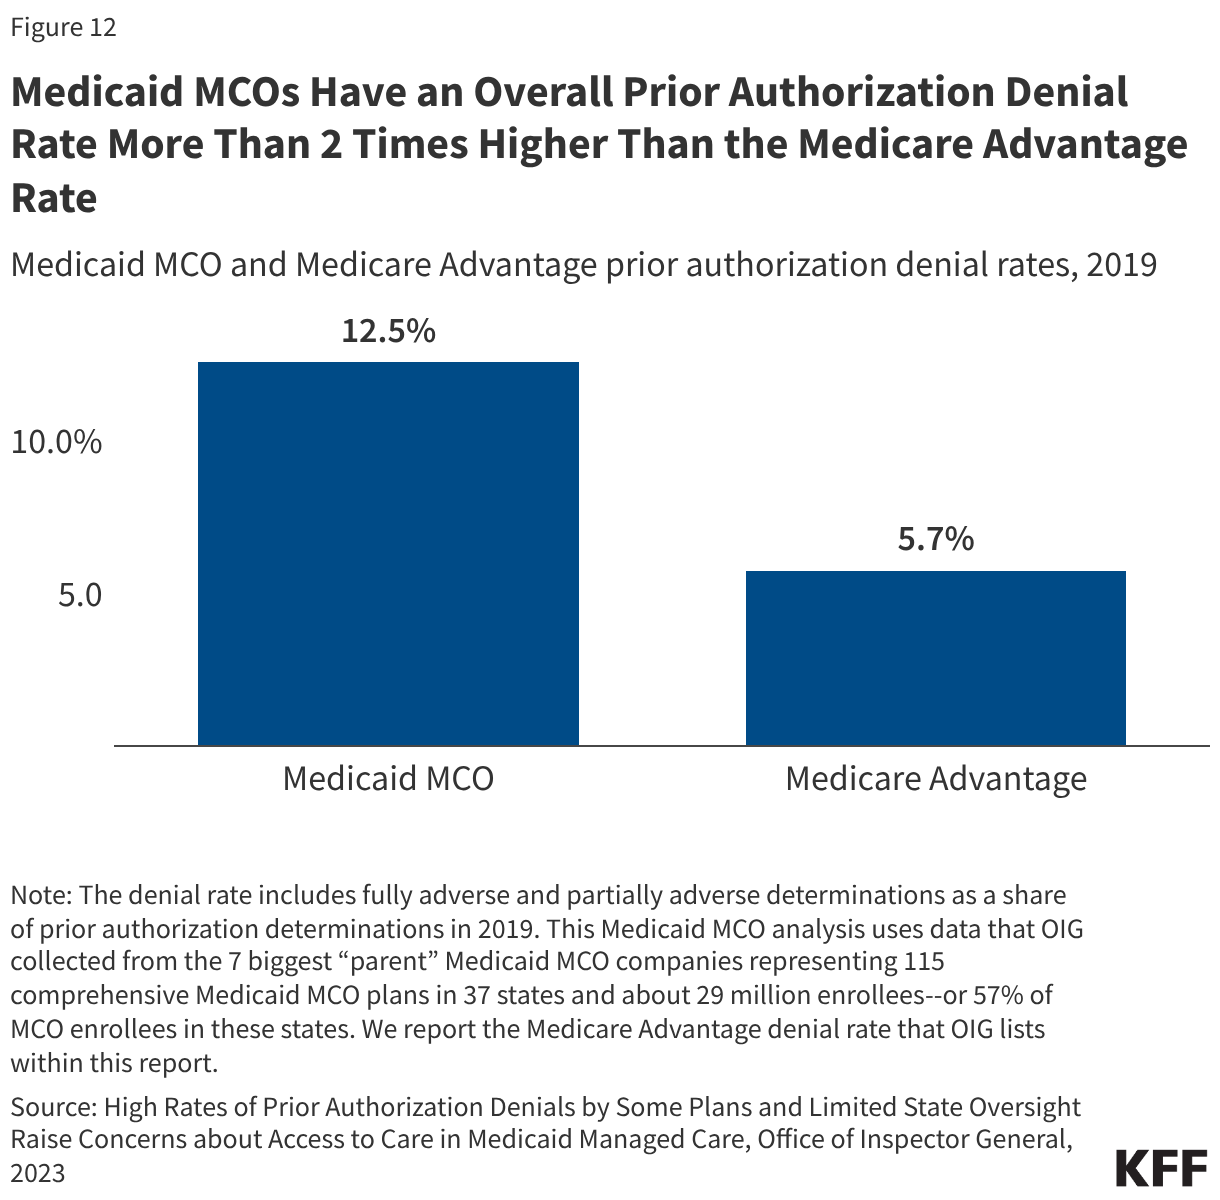
Medicaid managed care organizations (MCOs), which deliver care to the majority of Medicaid enrollees, often require prior authorization to determine if the requested service or medication is appropriate and medically necessary. A 2023 federal report found that Medicaid MCOs denied more than 2 million prior authorization requests in 2019, for an overall prior authorization denial rate of nearly 13%.
Looking Forward
A January 2025 KFF poll about the public’s priorities for the incoming Congress and President Trump’s second term found that more than half (55%) of U.S. adults thought closer regulation of insurers’ decisions to approve or deny claims for health services or prescription drugs should be a “top priority.” Although CMS has expressed an interest in possibly using the claims denial data to conduct compliance in an effort to improve the accuracy of the data issuers submit, so far, the federal government has not used the available claims denial data to conduct oversight of insurers, nor to develop tools or indicators to help consumers see and compare differences across plans. Providing the public with accessible information and more transparency about how claims review and appeals operate for each insurer, in all market segments, could better enable consumers and employers to make more informed choices when purchasing private coverage. This includes:
Broadening the Data Collected and Disclosed
Planned additions for the coming year. Starting in the next few months, as part of the federal QHP certification process for plan year 2027, insurers will report to CMS additional data elements: whether claims received and denied were for behavioral health or non-behavioral health services; data on pre-service claims; and denial reasons for out-of-network claims that mirror the current denial reasons for in-network claims. In addition, a 2024 CMS interoperability regulation requires QHP issuers to publicly report specific prior authorization metrics on their websites by March 31, 2026, according to a recently released 2027 Draft Letter to Issuers in the Federally-facilitated Exchanges. While a specific format for the public display of this information is not required, CMS has issued templates.
More useful data on reasons for denial. More than half of the reasons for a denial are either due to administrative reasons or an “other” category. Exploring ways to get more specific information about what is happening in the plan’s claims review process, especially when a claim is initially reviewed, could help policymakers address delays in patients receiving needed care and improper denials without a long and protracted second internal review and appeal. For instance, specific information about how many initial denials relate to administrative or coding errors or requests for information already provided could be useful in evaluating plan and provider performance and addressing improper denials.
Collecting employer data. Transparency of pricing data is a stated priority for the Trump administration, and the ACA requires group health plans to disclose claims denial and other data; however, these requirements still have not been implemented at the federal level. Since most people under age 65 have employer-sponsored coverage, efforts to provide more information about this market could begin to address concerns about insurer denials. Federal mental health parity regulations updated in 2024 require employer plans (and non-group plans) to collect and evaluate certain data, including the number and percentage of certain claim denials. However, the Trump administration has indicated that the requirements will not be enforced by the federal government.
Assessing the Impact of Artificial Intelligence in Claims Review
The use of artificial intelligence (AI) by both health plans and providers in the review and appeal of health claims could have both positive and negative implications for consumers. Health plans already use proprietary automated systems for claims processing, largely unknown to the public, but AI presents new challenges for oversight as well as opportunities to help patients navigate the complexities in health care. New tools being rapidly developed and promoted might reduce administrative errors that lead to improper denials, predict in advance whether a claim will be paid, and assist providers and patients in appealing a denial. However, concerns about accuracy, privacy, and bias in AI models have resulted in calls from consumer advocates, insurers, and providers for new consumer protections and/or oversight. States have begun to pass legislation, some focused on making sure a human is involved where claims are denied, regulators can audit the data used to train AI systems, and technology companies are required to test and disclose outcome metrics.
Congress has not enacted new laws to regulate AI specifically, and the Trump administration has stated its position that state laws to regulate AI should not apply. The CMS WISeR model is now testing the use of AI to make prior authorization decisions for specific services in traditional Medicare. Public information about the specific technology being used in the model is limited.
Key issues moving forward include how and whether the federal government will provide guardrails for how this technology is used, not just for claims review, but for an increasingly wide variety of administrative and clinical tasks that have a direct and indirect impact on patients.
Closer Examination of Independent External Review
The information available on independent review for the federal Marketplace continues to show a small number of external appeals. No information is provided about the types of services that are being evaluated under external review, and publicly-available data on the number of upheld internal appeals that are overturned in an external appeal are limited. Other researchers have started to look deeper at external review outcomes using other data sources. One recent study examined external review decisions (not limited to Marketplace plans) involving coverage of specific cancer genetic tests in four states where data are publicly available. It found that almost half of all external review decisions overturned the initial denial, and 30% of denials specifically for cancer genetic tests were overturned, with wide variation across states and types of genetic tests.
In June 2025, the Trump administration announced a pledge by many of the largest health insurers to act to “fix [the] broken prior authorization system.” Insurers voluntarily committed to make several changes, including reducing the scope of prior authorization requirements by January 1, 2026, and providing better transparency about authorization decisions and appeals. While some insurers have made general announcements about changes, information about specific process improvements and reductions in prior authorization requirements is limited, and a recent report and KFF polling indicate that prior authorization is still a problem for many consumers.
Methodology
Our analysis of the CMS Transparency in Coverage 2026 Public Use File (published September 26, 2025) includes insurers with more than 1,000 claims submitted and excludes stand-alone dental plans and small group (SHOP) plans. Of the 183 major medical insurers offering plans in 2026 in HealthCare.gov states, 156 reported receiving more than 1,000 claims and showed data on claims received and denied in 2024. Comparison with the QHP Landscape PY2026 Individual Medical file showed that, among insurers participating in HealthCare.gov states in 2024, 52 are not participating in 2026. (This number does not include the two insurers in the transparency public use file that are not actually offering plans in 2026. Since one of those insurers submitted claims information for its 2024 plans, that issuer is still included in our analysis.) Twenty-two HealthCare.gov insurers participated in Illinois and Georgia in 2024. Since then, these two states have switched to operating their own marketplaces. Excluding insurers operating in these two states, 30 participated in 2024 but did not participate in 2026.
Calculation of claims denial rates includes information provided by insurers on plans offered in 2024 but not in 2026. The number of denied claims reflects only the final adjudication status. A claim may be initially denied, then resubmitted and approved; claims that are paid even after initial denial do not count as denied in the claims denial rate calculation.
Twenty-five insurers offering plans in 2026 did not offer plans in 2024. Among states that offered plans on HealthCare.gov in both 2024 and 2026, 38% of plans available in 2026 were not available in 2024; of the 4,415 plans offered in 2024, only 2,514 (57%) were offered in 2026 and are included in the plan-level reporting of information on denial reasons. Half (the median) of the returning insurers did not provide statistics on denial reasons for more than 20% of claims filed in 2024, as they were associated with plans not being offered in 2026. Calculation of denial reasons excluded claims that were denied as out-of-network in all totals. Since out-of-network denials may depend more on plan type than insurer processes, the analysis focused on in-network claims.
To obtain the parent company name, the QHP Landscape PY2026 Individual Medical file was merged with the Medical Loss Ratio Submission Template header using HIOS plan identification numbers to find NAIC company codes. The NAIC identifier was then mapped to a parent company name using the Enrollment by Segment Exhibit data from Mark Farrah Associates. A small number of insurers could not be mapped by this method, so parent company names were entered manually. Statistics calculated at the parent company level do not include plans offered in market segments other than on-exchange ACA plans offered in HealthCare.gov states.
The external appeal rate assumes that all external appeals went through an internal appeal first and was calculated as the number of external appeals filed over the number of internal appeals upheld. CMS does not report values under 10. When calculating statistics with suppressed values, they were assumed to be zero. Additional considerations for using CMS transparency public files can be found here.