
 Josh Michaud
  Jennifer Kates
  Stephanie Oum
  Anna Rouw
 While there is no singular definition of public health, it has broadly been defined as “the science and art of preventing disease, prolonging life, and promoting health,” and “what we do together as a society to ensure the conditions in which everyone can be healthy”. Definitions and objectives for public health have evolved over time, as it is not a static concept (see Box 1). Public health encompasses a wide variety of programs and activities, including controlling the spread of communicable disease, preventing chronic diseases, improving nutrition, improving air and water quality, promoting safer workplaces, reducing automobile accidents, and more.
The overarching focus for a public health system is to help with disease prevention, health promotion, and to close gaps in health disparities in groups of people. These groups can range from small communities to populations at the national and even global levels. Public health’s focus on health equity in groups of people can be contrasted with clinical medicine, which is mostly focused on preventing and treating illness in individuals.
Box 1: Selected Definitions of “Public Health”
- “the science and art of preventing disease, prolonging life, and promoting health through the organized efforts and informed choices of society, organizations, public and private communities, and individuals.” – C-E A. Winslow (1920)
- “the fulfillment of society’s interest in assuring conditions in which people can be healthy” – Institute of Medicine (1988)
- “collective effort to identify and address the unacceptable realities that result in preventable and avoidable health outcomes, and it is the composite of efforts and activities carried out by people committed to these ends” – Turnock (2001)
- “what we do together as a society to ensure the conditions in which everyone can be healthy.” – DeSalvo, et.al (2017)
A Brief History of Public Health in the U.S.
In the United States, public health evolved as a practice and a discipline over time with roots that extend back to the early history of the nation (the first governmental public health agency, the Marine Hospital Service, was formed in 1798). As scientific understanding about causes and effective interventions for diseases improved over time, public health practices evolved and expanded across the country. The 19th century saw a “great sanitary awakening” in the U.S., as illness came to be understood as an indicator of poor social and environmental conditions, and investments in hygiene and sanitation grew to combat disease in communities around the country, especially in large cities. After the U.S. Civil War, states began to set up boards of health to oversee growing investments and attention to public health activities in communities. The first state-level agency for public health was created in New York in 1866; Massachusetts established its first state board of health in 1869 and other states and jurisdictions followed. As the understanding of the germ theory of disease grew, state and local health departments created infectious disease laboratories in the 1890s. In the early to mid-20th century, state and local health departments grew in size and responsibilities and many of the public health interventions and focus areas that we see today were established and expanded.
In addition, a number of milestones occurred in the 20th century to grow the federal government’s role in public health, including new legislation such as the Food and Drug Act of 1906 (allowed federal oversight of manufacture, labeling and sale of foods) and the Sheppard-Towner Act of 1922 (authorized federal government funding of state-level public health efforts for the first time, in this case for maternal and child health programs). As part of the social welfare reforms undertaken via the “New Deal” in the 1930s and the “Great Society” in the 1960s, federal responsibilities, oversight, and funding for public health grew significantly. Many core federal departments and agencies we still have today were established during this period. From the late 1960s through today, U.S. public health efforts have experienced periods of decline and periods of growth often linked with broader social trends, changing perceptions about health threats, and economic and fiscal conditions in the country. During the first Trump administration and continuing through the Biden administration, the COVID-19 pandemic represented one of the greatest public health challenges of the last 100 years and led to an expansion of the government’s public health response. However, the expansion has proven temporary and during the second Trump administration, public health efforts face resource cuts and an uncertain future.
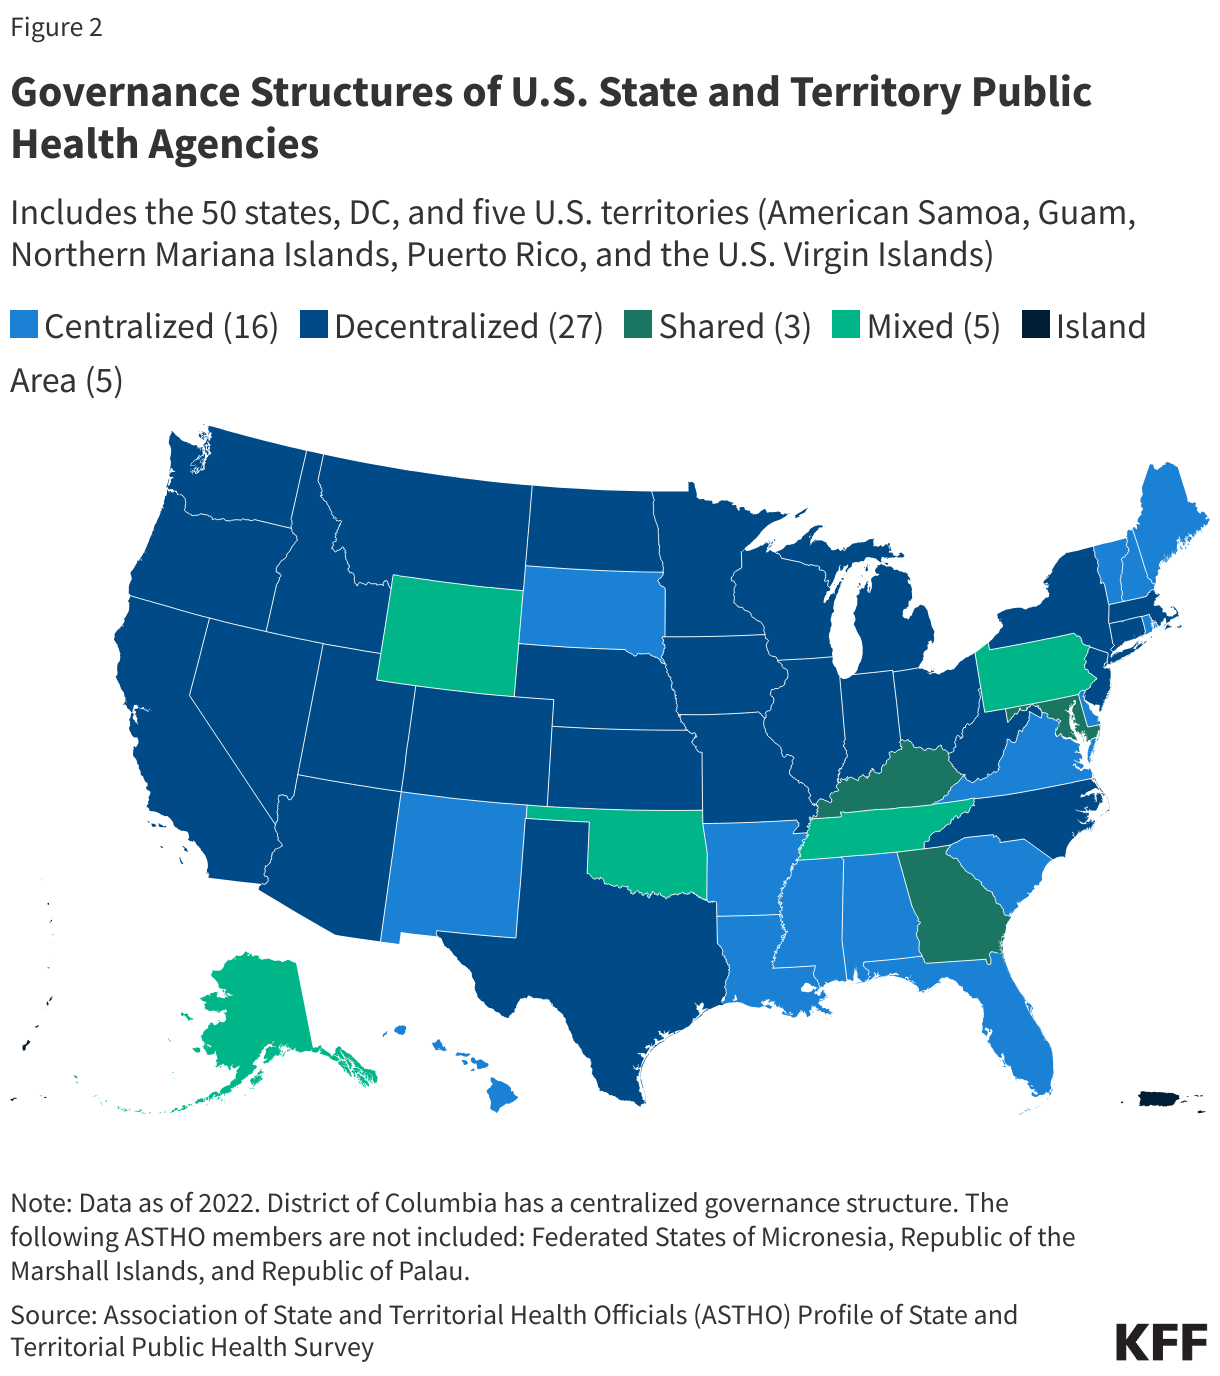
Public health powers and responsibilities derive from the U.S. Constitution and are shared across federal, state, and local levels of government – each of which has unique roles in such efforts that can vary state by state and even community by community. While many of public health efforts are funded and implemented through public (i.e. governmental) programs, private actors are also involved in funding and delivering public health services in the U.S. Given the many actors involved and the variations across federal, state and local roles and approaches, public health in the U.S. has often been referred to as a “patchwork” system.
Key Public Health Frameworks, Services, Capabilities and Characteristics
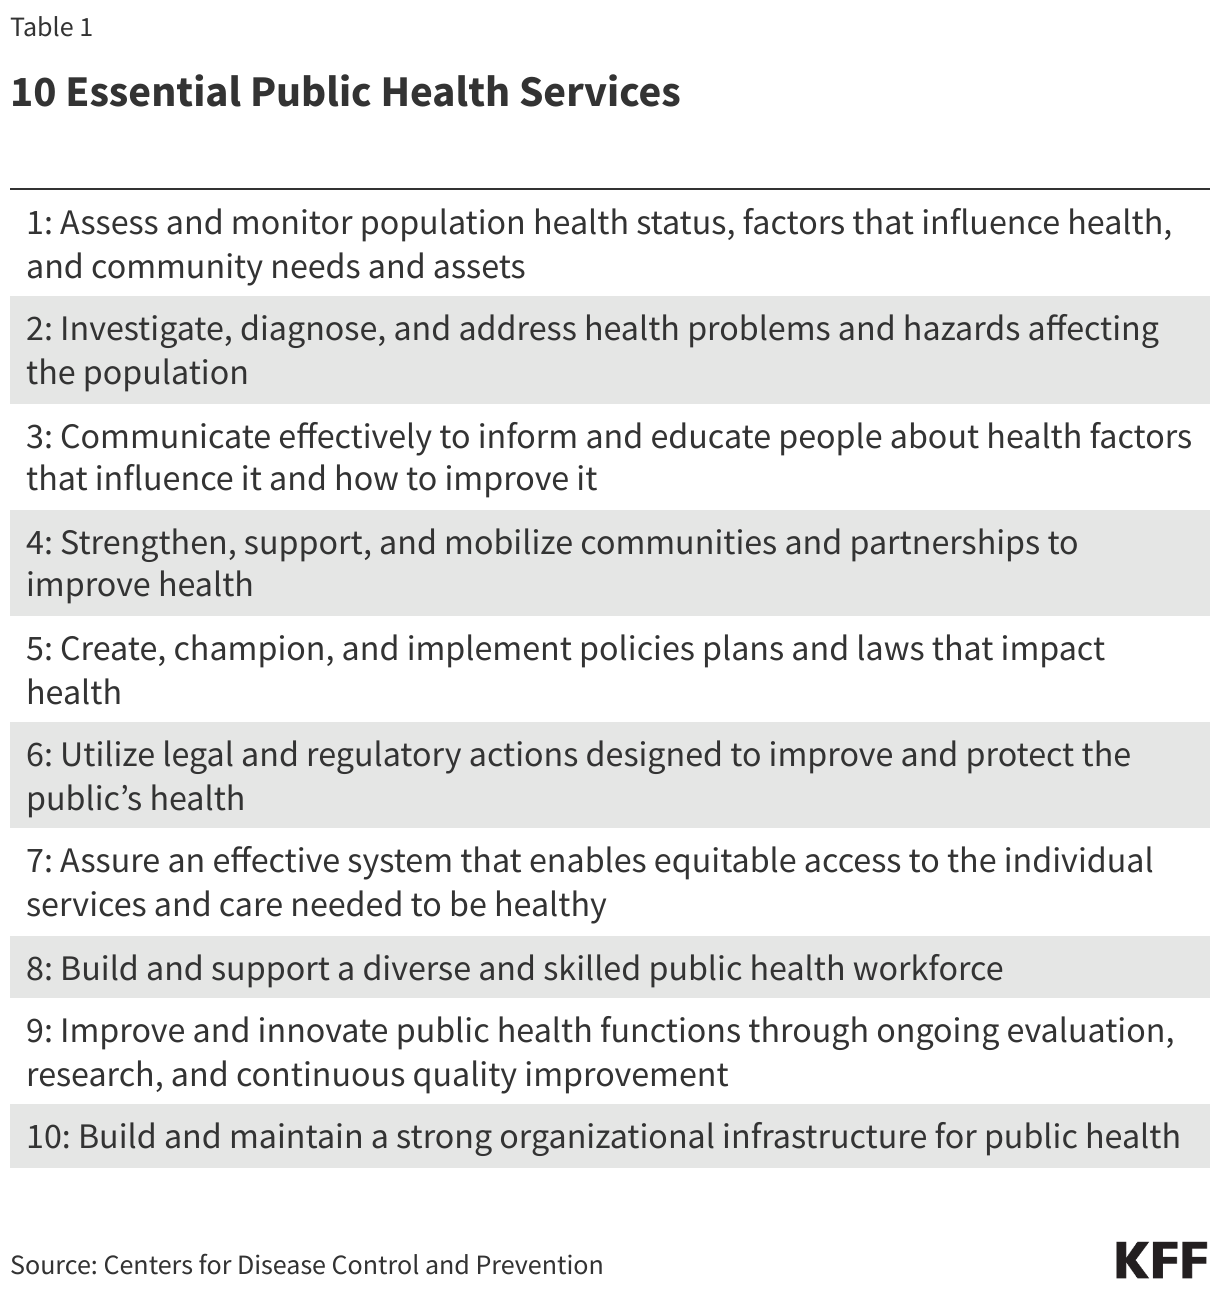
Public health efforts are typically guided at the broadest level by strategies or frameworks outlining the services, capabilities and activities that help deliver on the mission to protect and promote communities’ health. A key framework for U.S. public health over the last few decades has been the 10 Essential Public Health Services (EPHS) framework, originally developed in 1994 by a federal workgroup (with input from outside experts), and updated in 2020. The EPHS highlights ten key public health service areas that include: monitoring population health status and community needs, investigating and addressing hazards and health problems, and using legal and regulatory actions to improve and protect the public’s health (see Table 1). An underlying principle of promoting equity underlies all service areas in this framework.
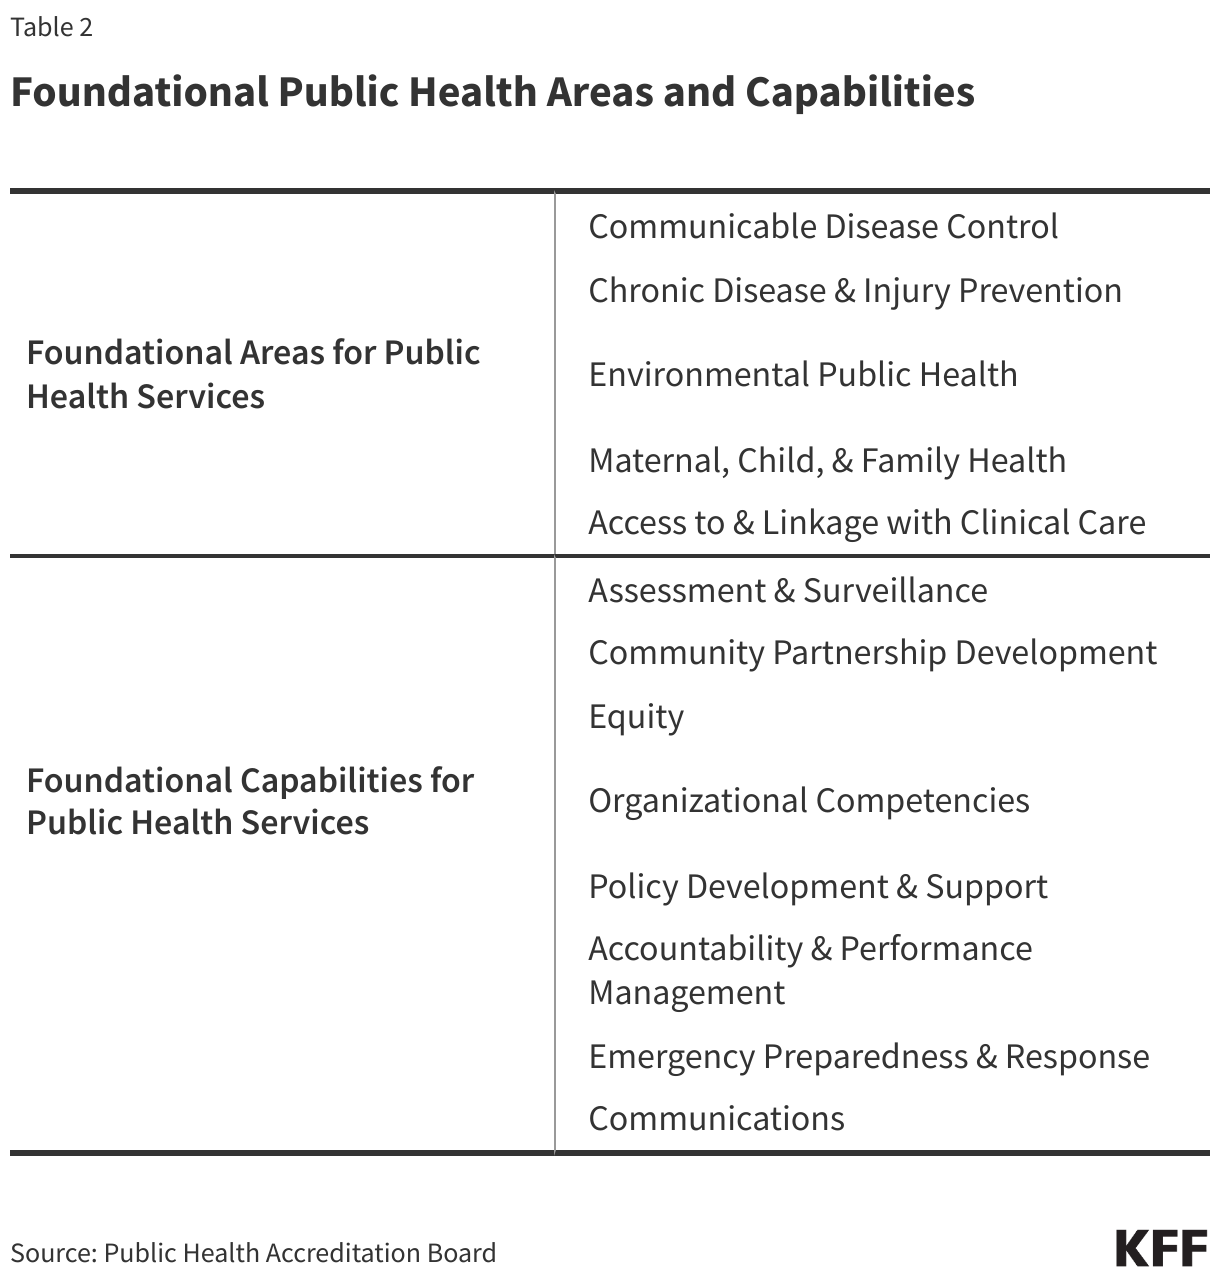
The “Foundational Public Health Services (FPHS)” framework is another key resource. This framework emerged from a 2013 convening of stakeholders who, in response to a recommendation from the Institute of Medicine, set out to define “a minimum package of public health capabilities and programs that no jurisdiction can be without.” The FPHS, which is now overseen by the Public Health Accreditation Board (PHAB), outlines eight “foundational capabilities” and five “foundational areas” that are central for delivering public health services to communities (see Table 2). These foundational areas include: communicable disease control, environmental public health, and maternal, child & family health, while foundational capabilities include assessment & surveillance, emergency preparedness & response, and communications.
The EPHS and FPHS frameworks overlap but are also seen as complementary, with the EPHS describing activities the public health system overall should undertake in communities, and the FPHS representing a minimum package of governmental public health activities that should be present everywhere.
Other strategies and frameworks have been formed and shaped through numerous governmental and non-governmental expert bodies and reports. Particularly influential have been recommendations and guidance from the National Academy of Medicine (previously the Institute of Medicine), which published a milestone report on the U.S. public health system in 1998 and key follow-up reports in 2002 and 2017.
In addition to these frameworks and capabilities, public health can be identified through certain defining characteristics, which include:
- Being science-based. Effective public health policies and activities draw from the best available science and evidence and are adapted and updated as new information and scientific understanding improves.
- Focusing on prevention. Ultimately, the goal of public health interventions is to prevent disease or otherwise improve health outcomes in groups of people. When public health works, the result is often the absence of disease and/or longer, healthier lives in a community. This means the benefits derived from public health interventions – disease prevented – are often unseen and hard to quantify.
- Addressing health inequities. Underlying the public health approach is a recognition that all people have an equal right to better health. However, in reality there are significant health disparities across different demographic groups and geographic areas. Therefore, public health interventions often emphasize addressing health needs in underserved, marginalized, disadvantaged, and otherwise vulnerable populations in support of health equity.
Social Determinants of Health
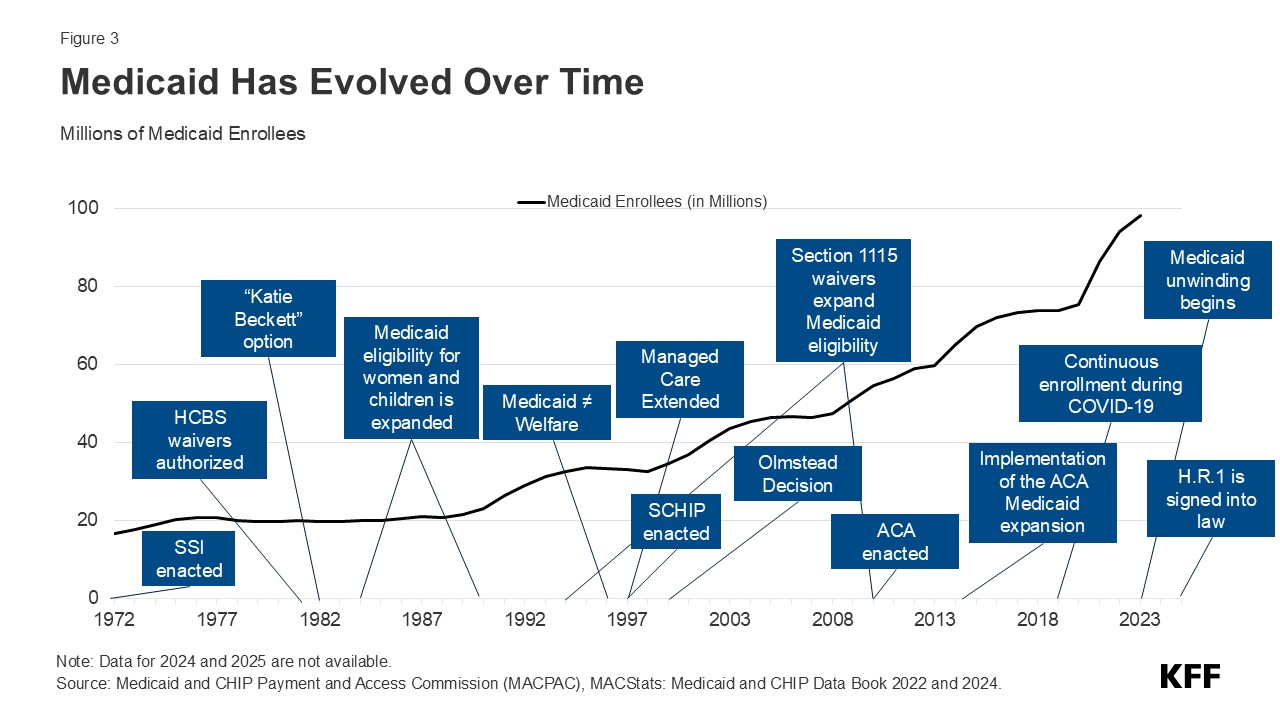
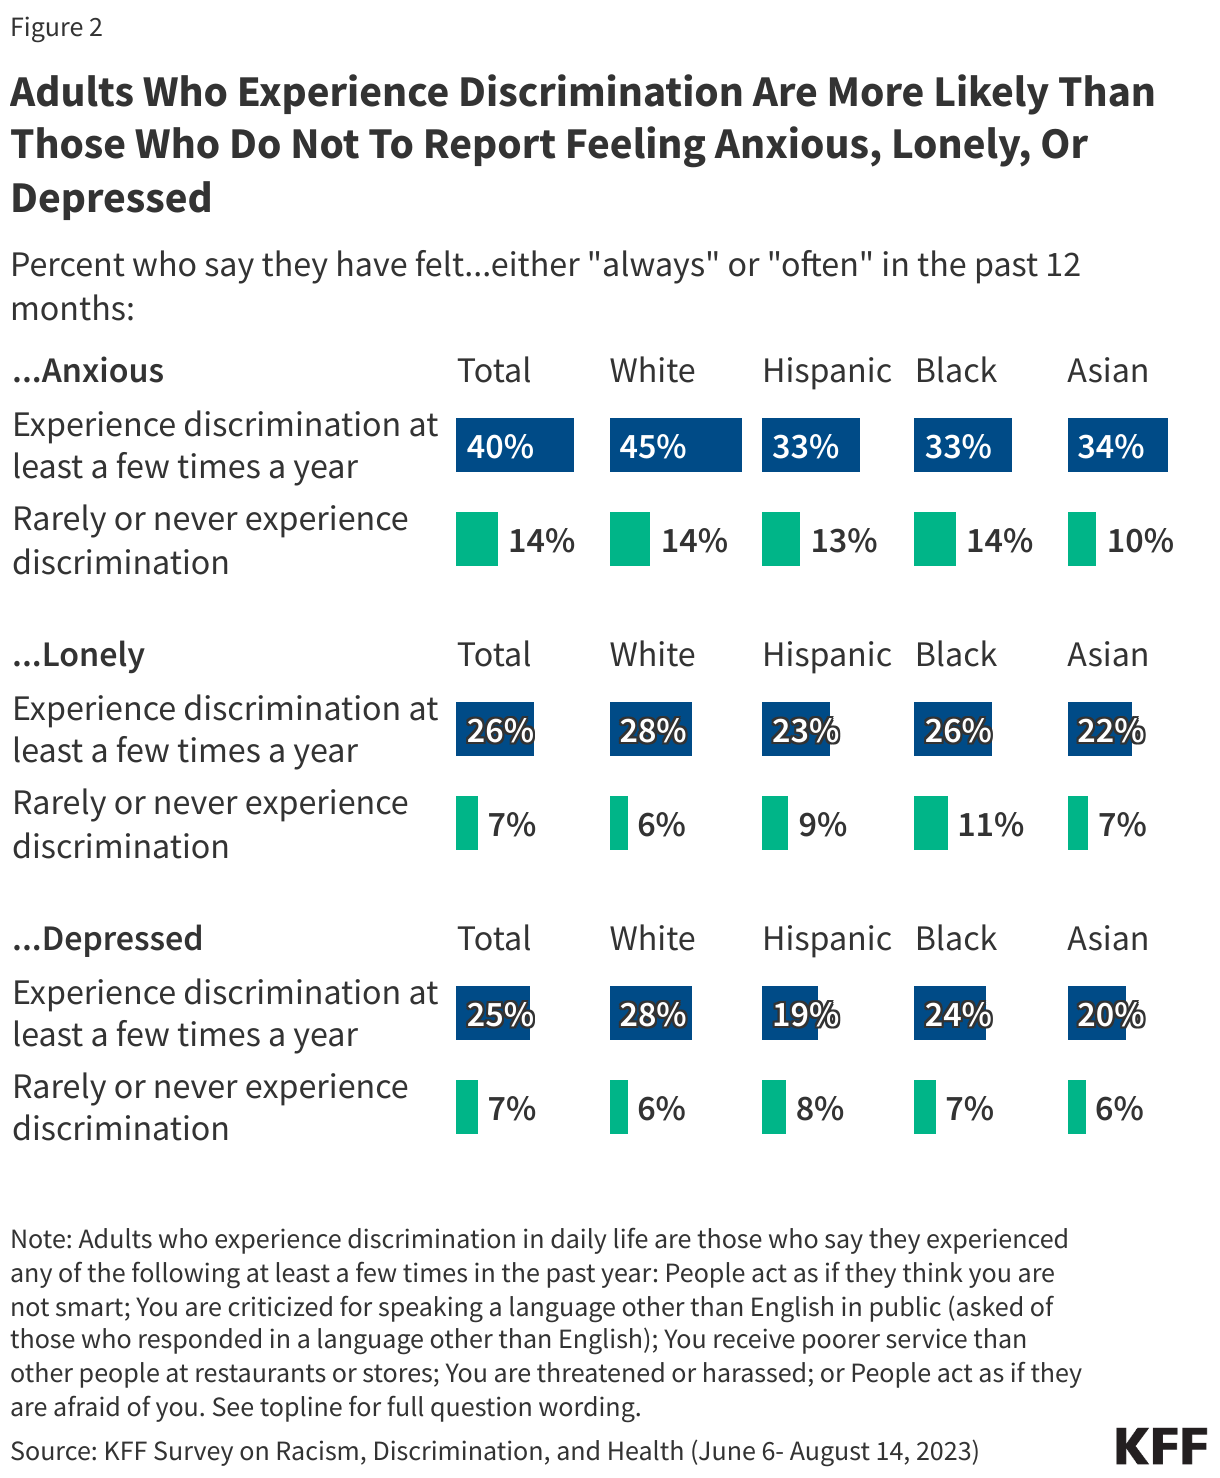
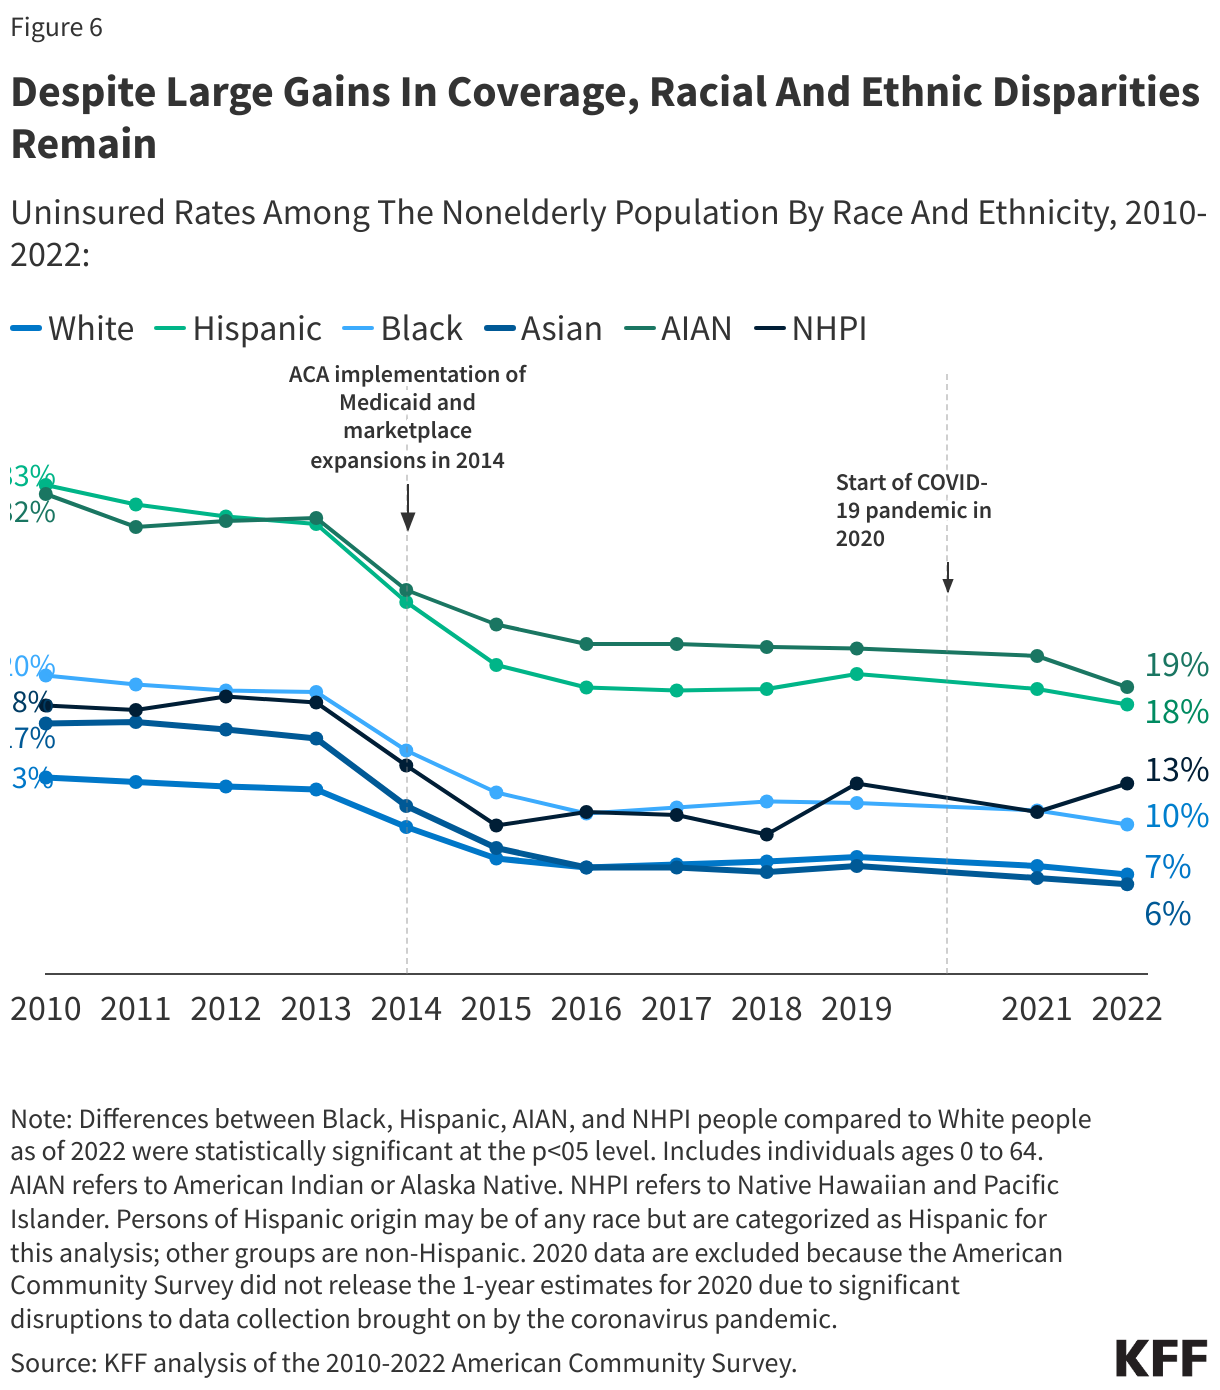
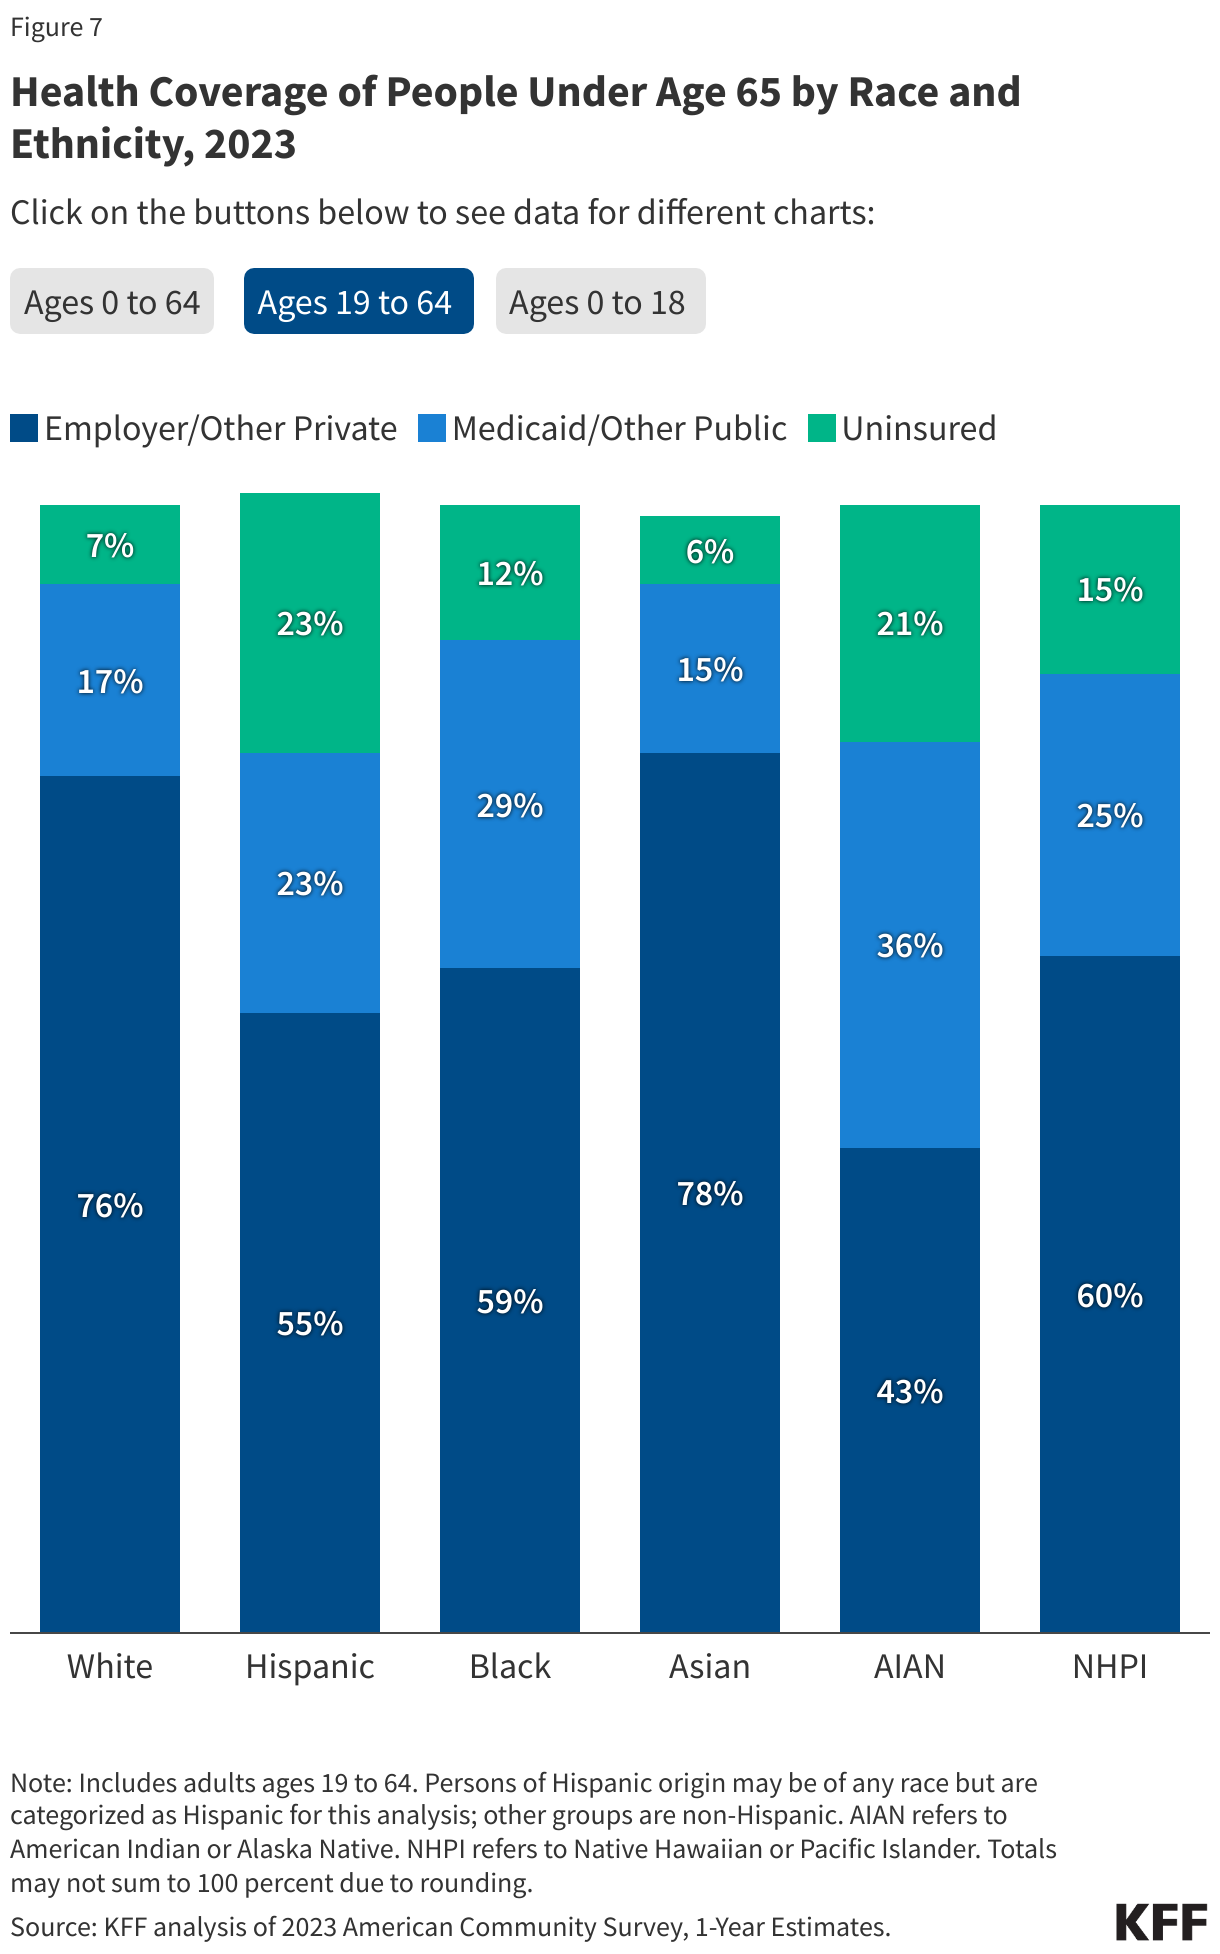
The health of a population can be greatly affected by non-medical factors, which would include things like educational access and quality, health care access and quality, neighborhood characteristics, social and community practices, and economic health and stability. These other, broader societal and community-wide factors are known as the “social determinants of health” (SDOH, see Figure 1). Unequal access to SDOH can feed health disparities. For example, communities that have less access to grocery stores with healthy foods face greater challenges with nutrition, which raises the risks of heart disease, diabetes, obesity and other conditions in these communities compared to others with health food options. During an epidemic or pandemic, the lack of sick leave policies and precarious economic circumstances can leave workers – especially low-wage workers – with little flexibility to take time off from work, raising their risk of infection and continuing community transmission. In general, racial and ethnic health and health care disparities can result in higher rates of illness and death for minority populations across a wide range of health conditions.
Many public health programs recognize the importance of social determinants of health, and sometimes work in partnership with other public and private efforts to help develop and implement complementary approaches aimed at improving health equity. The CDC recommends that public health departments consider how social determinants affect health in their communities, highlighting how a focus on implementing the 10 Essential Public Health Services can help address inequities that arise from these social conditions. Still, there are limits to how directly public health programs can address these issues given that they often involve broad social conditions such as employment, discrimination, housing, and education.

Source: KFF. Race, Inequality, and Health. https://www.kff.org/health-policy-101-race-inequality-and-health/?entry=table-of-contents-what-factors-drive-racial-and-ethnic-health-disparities
 Juliette Cubanski
  Meredith Freed
  Nancy Ochieng
  Alex Cottrill
  Jeannie Fuglesten Biniek
  Tricia Neuman

 Robin Rudowitz
  Jennifer Tolbert
  Alice Burns
  Elizabeth Hinton
  Anna Mudumala
  Priya Chidambaram
  Maiss Mohamed
 Nambi Ndugga
  Latoya Hill
  Drishti Pillai
  Samantha Artiga
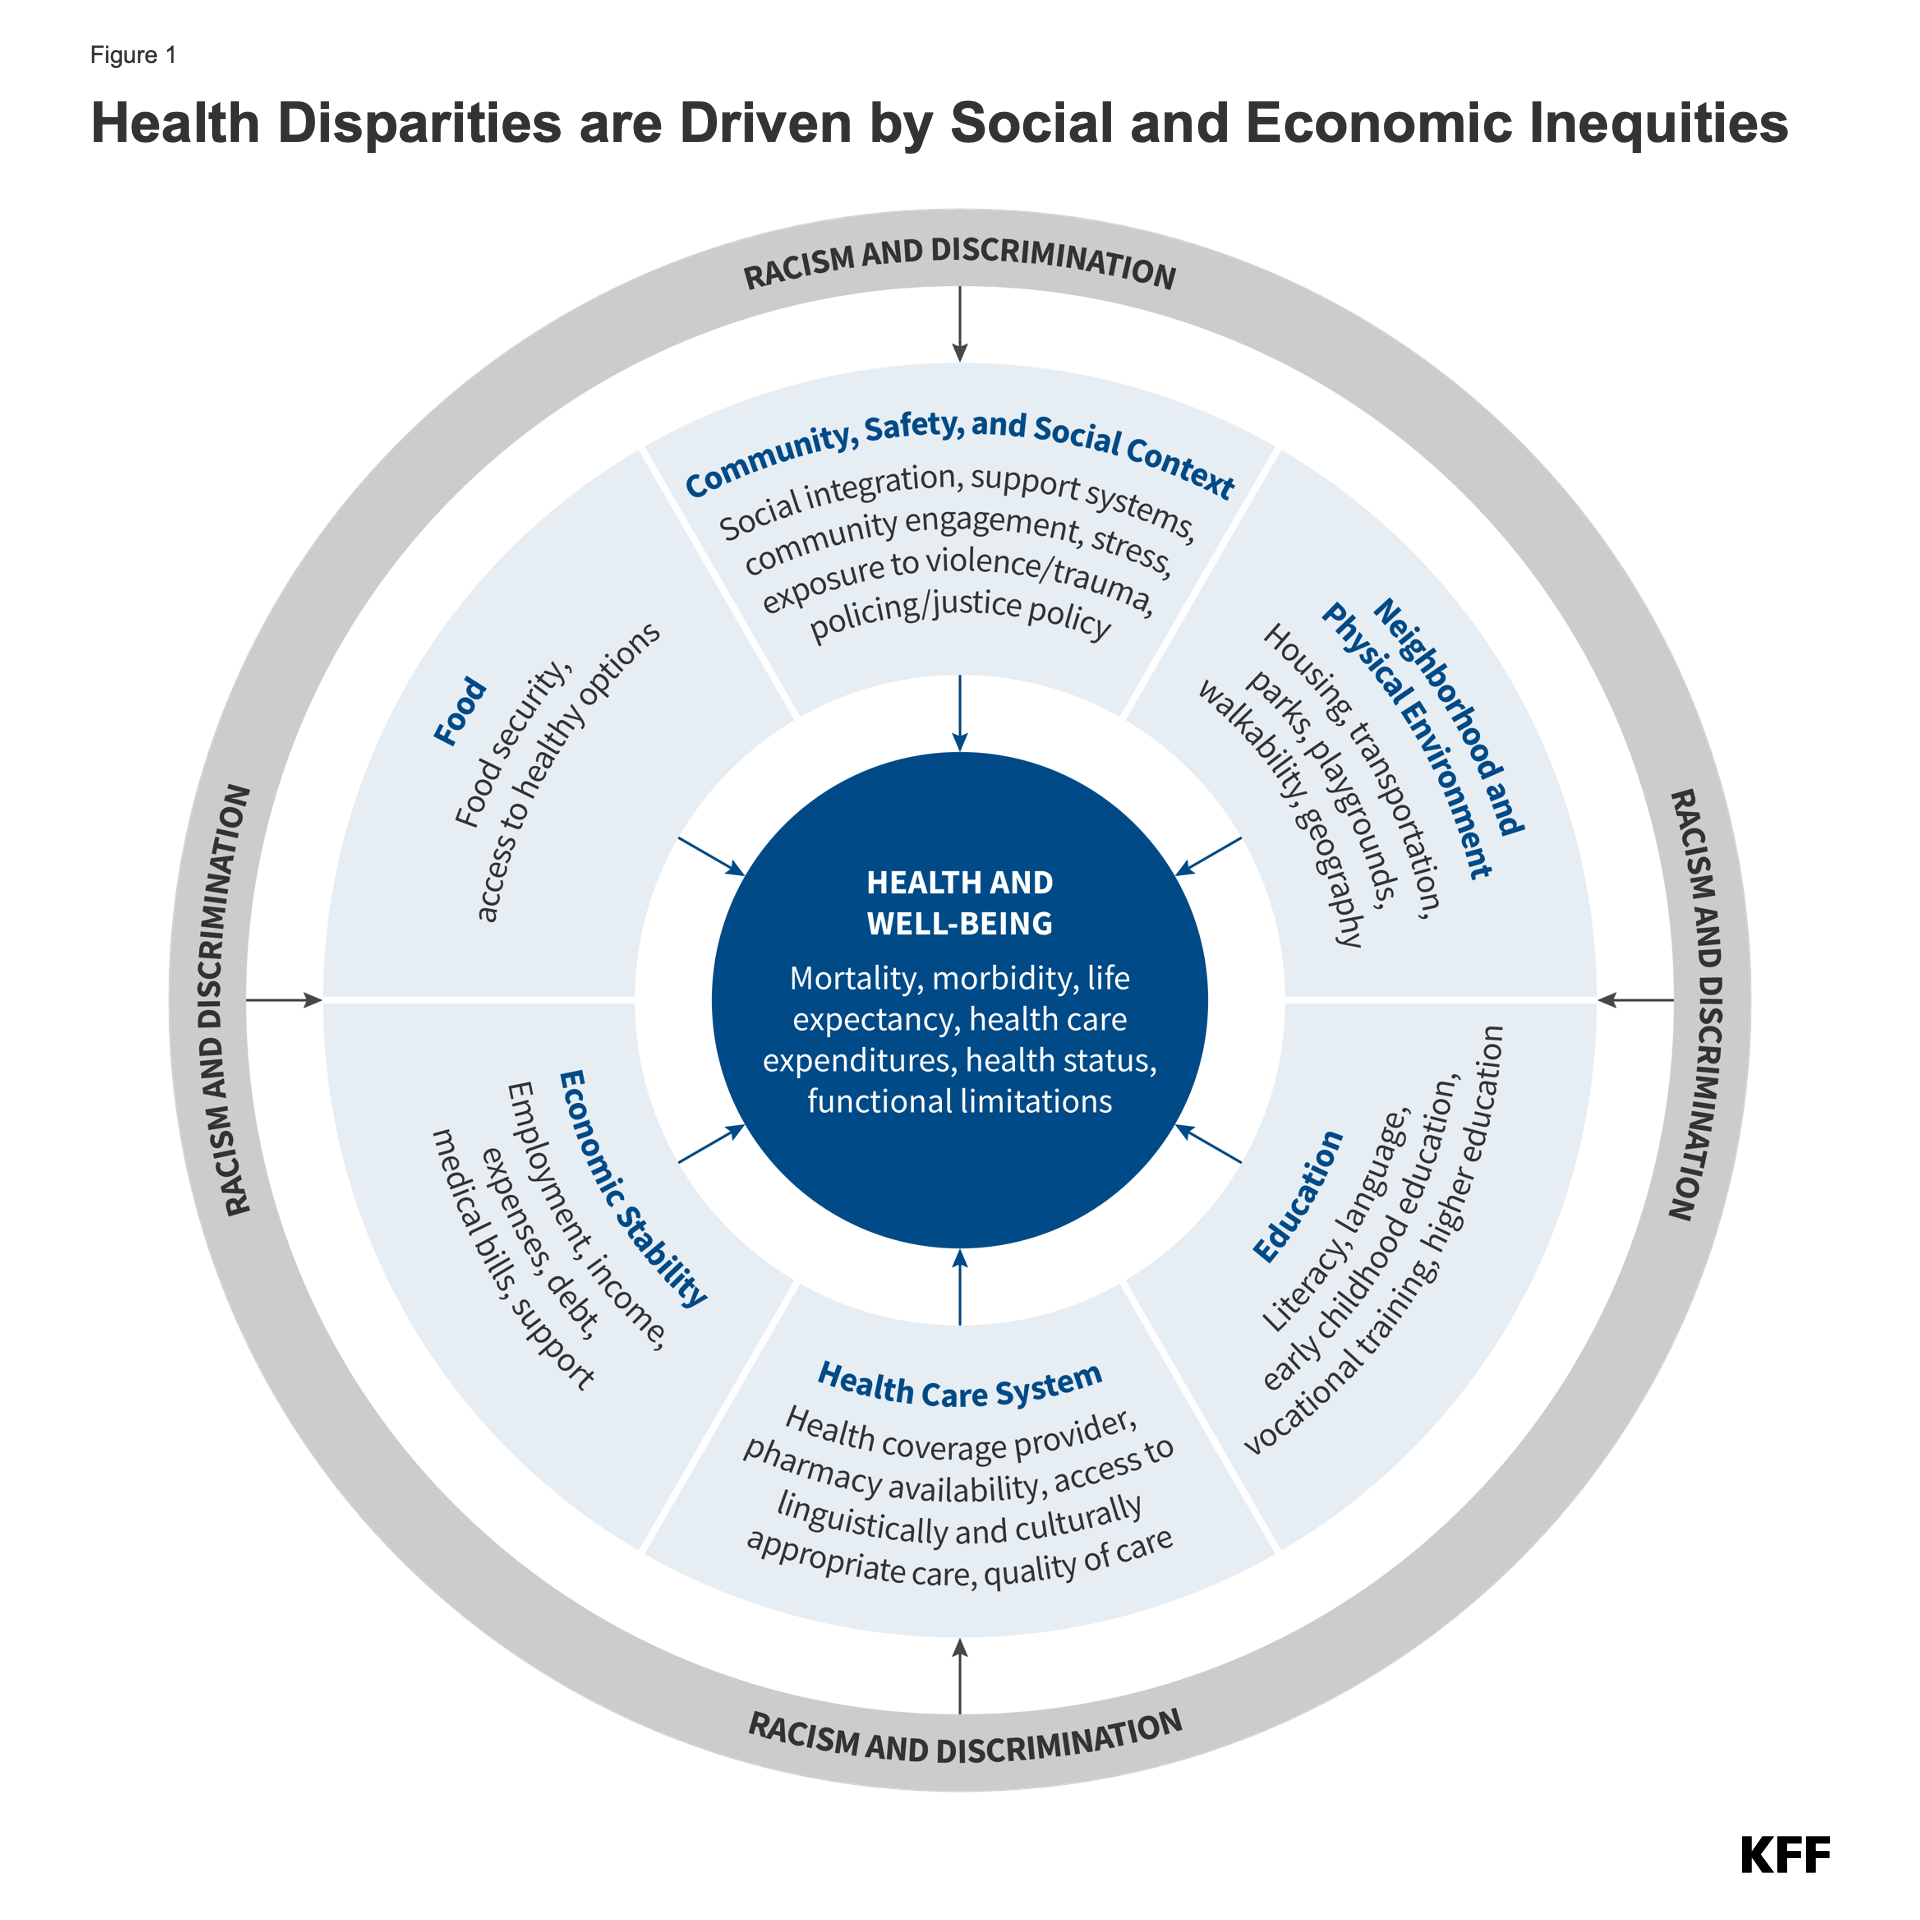
 Cynthia Cox
  Jared Ortaliza
  Emma Wager
  Krutika Amin

 Julie Rovner
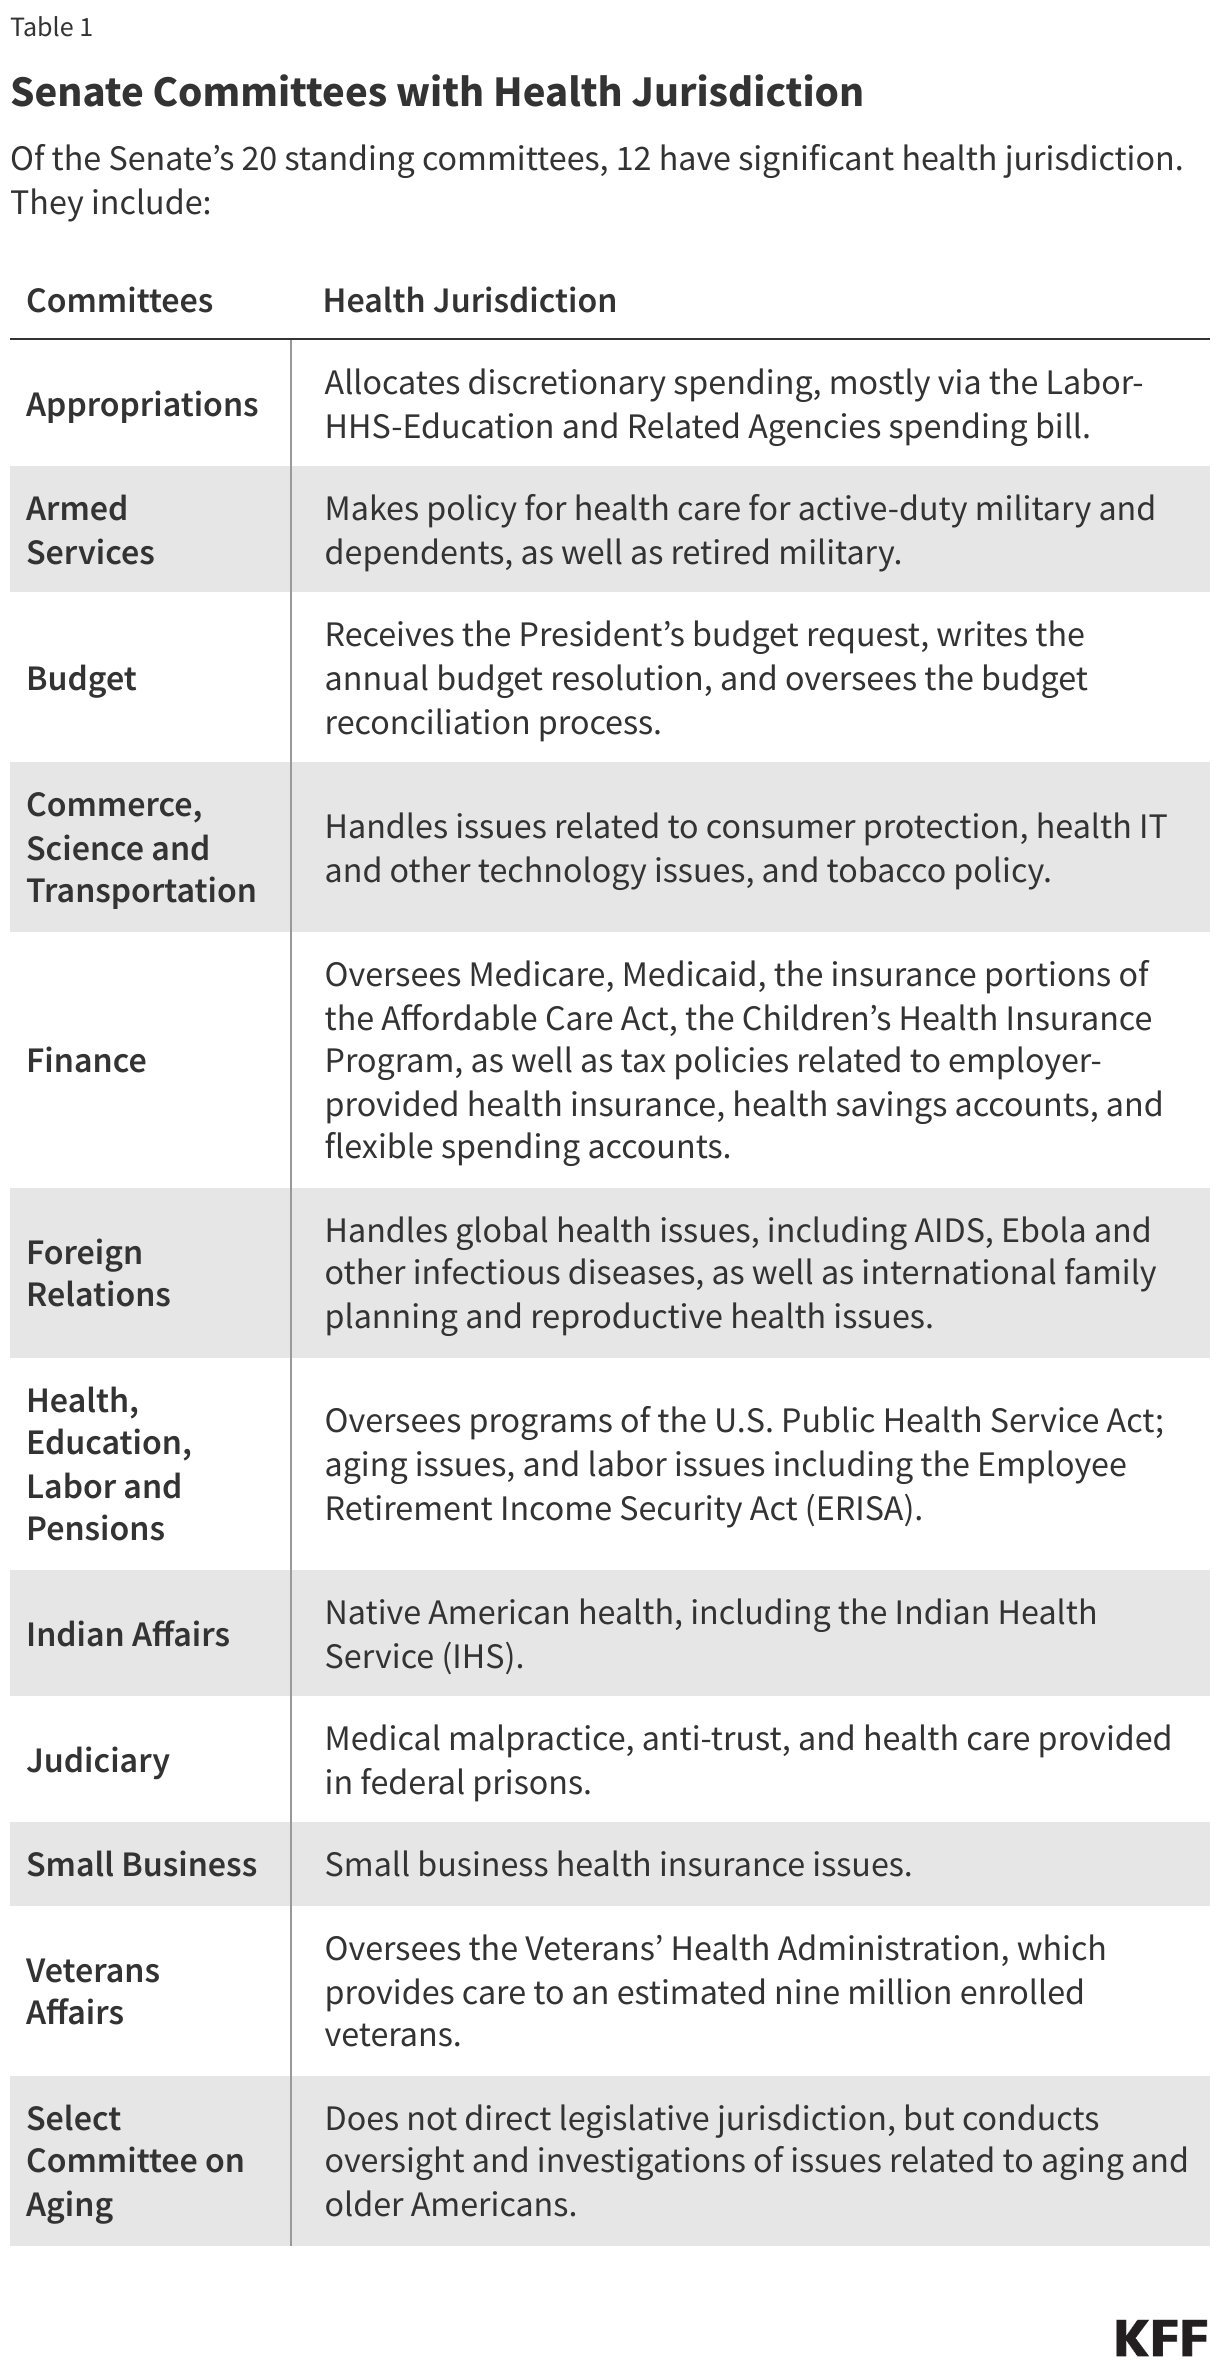
 Rakesh Singh