As Pandemic-Era Policies End, Medicaid Programs Focus on Enrollee Access and Reducing Health Disparities Amid Future Uncertainties

Results from an Annual Medicaid Budget Survey for State Fiscal Years 2024 and 2025

Authors: Elizabeth Hinton, Elizabeth Williams, Jada Raphael, Anna Mudumala, Robin Rudowitz, Kathleen Gifford, Aimee Lashbrook, and Caprice Knapp
Published: Oct 23, 2024

Overview

This annual Medicaid budget survey report highlights certain policies in place in state Medicaid programs in state fiscal year (FY) 2024 and policy changes implemented or planned for FY 2025. The findings are drawn from the 24th annual budget survey of Medicaid officials conducted by KFF and Health Management Associates (HMA), in collaboration with the National Association of Medicaid Directors (NAMD).

Medicaid budget survey reports from prior years are available in our archives.

NEWS RELEASE

  • A news release announcing the publication of the 2024 Medicaid Budget Survey is available.

EXECUTIVE SUMMARY

  • The Executive Summary provides an overview of the 2024 survey results and is available under the Executive Summary.

FULL REPORT

  • The complete 2024 Medicaid Budget Survey Report is available under the Report. The Report contains 6 separate sections. Users can view each section separately or download a full Report PDF that is available on the right side of the page.

ENROLLMENT & SPENDING BRIEF

  • This companion issue brief provides an overview of Medicaid enrollment and spending growth with a focus on FY 2024 and FY 2025.

ADDITIONAL BRIEFS

Executive Summary

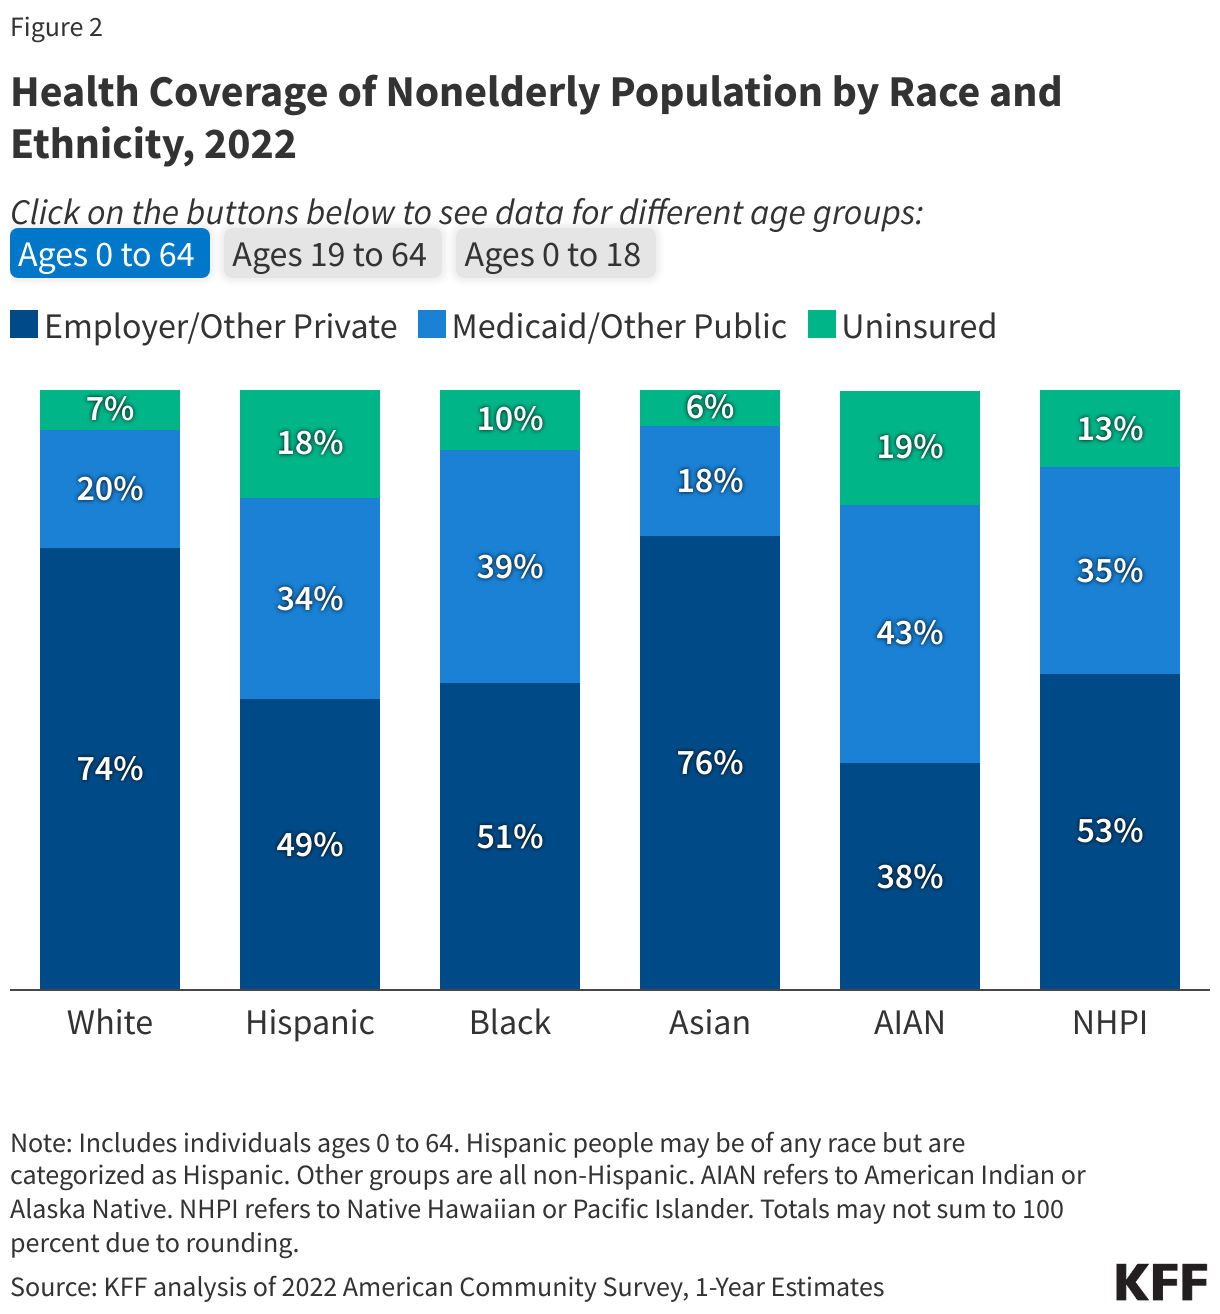
At the end of state fiscal year (FY) 2024 and heading into FY 2025, states were wrapping up the unwinding of the pandemic-related continuous enrollment provision, focusing on an array of other priorities, and facing uncertainty about the stability of state revenues. States were also looking ahead to federal and state elections in November and the potential implications of those elections for Medicaid enrollees, states, and providers. As states have emerged from the now-expired COVID-19 Public Health Emergency, which profoundly affected Medicaid enrollment and spending, many are focused on using Medicaid to address long-standing health disparities (often exacerbated by the pandemic), improve access to behavioral health services and long-term services and supports (LTSS), address enrollee social determinants of health, and implement broader delivery system and value-based initiatives. Serving over one in five people living in the United States and accounting for nearly one-fifth of health care spending (and half of long-term care spending), Medicaid represents a large share of state budgets and is a key part of the overall health care system.

This report highlights certain policies in place in state Medicaid programs in FY 2024 and policy changes implemented or planned for FY 2025, which began on July 1, 2024 for most states.1  The findings are drawn from the 24th annual budget survey of Medicaid officials in all 50 states and the District of Columbia conducted by KFF and Health Management Associates (HMA), in collaboration with the National Association of Medicaid Directors (NAMD). States completed this survey in mid-summer of 2024, and 50 states responded to this year’s survey, although response rates for specific questions varied.2  The District of Columbia is counted as a state for the purposes of this report. Given differences in the financing structure of their programs, the U.S. territories were not included in this analysis.

Key Take-Aways

Provider Rates and Managed Care
  • States had implemented (in FY 2024) and were planning (in FY 2025) a wide range of fee-for-service (FFS) rate increases across provider types and very few states were implementing rate restrictions. In FY 2024 and FY 2025, states reported inflation and workforce shortages were driving higher labor costs, resulting in pressure to increase provider rates across provider types. In FY 2024 and FY 2025, states continue to report rate increases for nursing facilities and home and community-based services (HCBS) providers more often than for other provider categories, reflecting ongoing staffing challenges for LTSS services. More than half of states reported rate increases for outpatient behavioral health providers (34 states), primary care providers (33 states), and dentists (28 states) in FY 2024, signaling a continued focus on leveraging rates to preserve or increase access in these areas. Beginning in 2026, the recently finalized Access rule requires states to conduct comparative rate analyses for certain services, publish fee schedules for all FFS rates, disclose payment rates for HCBS, and ensure HCBS payment adequacy (payment adequacy provision effective in 2030). A separate Managed Care rule also requires states to submit an annual managed care payment analysis for certain services (also effective in 2026).
  • Many states reported increases in hospital FFS base rates and hospital supplemental payments in FY 2024 and FY 2025. State FFS payments to hospitals fall into two broad categories: (1) FFS base rates and (2) supplemental payments (typically made in a lump sum for a fixed period). Supplemental payments are often used to cover hospital costs that exceed the amounts covered by their FFS base rates. While managed care organizations (MCOs) have flexibility to determine provider payment methods and amounts, they often pay rates similar to FFS rates. Many states that contract with MCOs use “state directed payments” (SDPs) to make uniform rate increases that are like FFS supplemental payments. This year states were asked about changes to hospital FFS base rates, total (non-DSH) FFS hospital supplemental payments, and managed care state directed payments for hospital services.
  • More than half of states (26 states) reported increasing both inpatient and outpatient hospital FFS base rates in FY 2024, and many states reported increases in both hospital FFS base rates and total non-DSH supplemental payments. States reported few decreases to hospital FFS payments (base rates or total supplemental payments).
  • Thirty-seven of 41 responding states that contract with MCOs reported SDP(s) for hospital services in place as of July 1, 2024. Most of these states (26 of 37 states) reported that hospital SDPs, as a percentage of total Medicaid hospital reimbursement, were projected to increase in FY 2025 (compared to FY 2024). A few states commented on plans to significantly increase hospital SDPs in FY 2025, including increases up to the average commercial rate (the new payment rate ceiling established by federal rules that is substantially higher than the Medicare payment ceiling used for other Medicaid FFS supplemental payments).
  • About two-thirds of responding MCO states (25 of 41) reported seeking CMS approval for a capitation rate amendment to address shifts in the average risk profile (or “acuity”) of MCO members in FY 2024 and/or FY 2025. States and plans faced another period of heightened rate setting uncertainty when the public health emergency (PHE) continuous enrollment period expired on March 31, 2023. States may use a variety of mechanisms (e.g., medical loss ratios (MLRs) with remittance requirements and/or risk corridors) to adjust plan risk to ensure payments are not too high or too low. However, even with these strategies in place, states may determine rate amendments are necessary, for example, if their actual experience differs significantly from the assumptions used for the initial certified rates. While many states and plans anticipated that enrollees likely to retain coverage during “unwinding” would have higher health care needs and utilization patterns (on average) than those disenrolled, states can seek rate amendments if projections do not match experience.
Benefits and Prescription Drugs
  • Most states continue to implement benefit enhancements, particularly for mental health and/or substance use disorder (SUD) services. Consistent with trends in recent years, states reported expanding services across the behavioral health care continuum. In conjunction with the ongoing implementation of the 988 Suicide and Crisis Lifeline, there was a particular focus on enhancing crisis services in FY 2024 and FY 2025, including mobile crisis services and crisis services for youth. States also continue to invest in more coordinated and integrated physical and behavioral health care. In addition to behavioral health expansions, states reported enhanced pregnancy and postpartum services. Frequently reported benefit actions include coverage of doula services and other benefit additions or expansions aimed at reducing maternal morbidity and mortality and addressing racial/ethnic health disparities.
  • Twelve state Medicaid programs reported covering GLP-1s (glucagon-like peptide-1s) when prescribed for the treatment of obesity, under FFS as of July 1, 2024. GLP-1 agonists have been used as a treatment for type 2 diabetes for over a decade and are covered by state Medicaid programs for that purpose. However, newer forms of these drugs, such as Wegovy and Zepbound, have gained widespread attention for their effectiveness as a treatment for obesity. While states must cover nearly all FDA-approved drugs for medically accepted indications, a long-standing statutory exception allows states to choose whether to cover weight-loss drugs under Medicaid, leading to variation in coverage policies across states. Recent KFF analysis found most large employer firms do not cover GLP-1 drugs for weight loss, coverage in ACA Marketplace plans remains limited, and coverage in Medicare is prohibited. A majority of state Medicaid programs reported that cost was a key factor contributing to their obesity drug coverage decisions, though half of states that currently do not cover the drugs noted they were considering or evaluating adding coverage. Rising prescription drug costs are an ongoing concern for states and nearly three-quarters of states reported at least one new or expanded initiative to contain prescription drug costs in FY 2024 or FY 2025. Efforts to implement or expand value-based arrangements (VBAs) with pharmaceutical manufacturers were the most frequently mentioned cost containment initiative across states.
Social Determinants of Health and Reducing Health Disparities
  • A number of states are expanding or enhancing Medicaid coverage to help address enrollee social determinants of health (SDOH) or associated health-related social needs (HRSN). In 2022, CMS released a new framework for covering HRSN services under Section 1115 waivers, expanding flexibility for states to add certain short-term housing and nutrition supports as Medicaid benefits. Additional guidance and resources that identify allowable HRSN services and supports were released by CMS in late 2023. HRSN approvals to date include coverage of rent/temporary housing and utilities and meal support (up to three meals per day), departing from long-standing prohibitions on payment of “room and board” in Medicaid.
  • States are implementing strategies to reduce racial and ethnic health disparities, including through changes in managed care contracts. Some state MCO contracts incorporate requirements to reduce health disparities. For example, states can require MCOs to have a health equity plan in place, conduct staff training on health equity and/or implicit bias, report racial disparities data, or incorporate enrollee feedback (among other requirements). The number of states with at least one specified MCO requirement related to reducing disparities grew to 37 states in FY 2025 (from 16 in FY 2022). States may also tie MCO financial quality incentives to reducing health disparities. About one-third of states reported at least one MCO financial incentive tied to reducing racial/ethnic disparities in place in FY 2024, most commonly linking capitation withholds or pay for performance incentives to improving health disparities.

Heading into FY 2025, state Medicaid officials were focused on continued efforts to address key priorities but noted state budget and administrative issues as challenges. In terms of policy priorities, states highlighted continued efforts to expand access to behavioral health services and LTSS (including addressing workforce shortages), implement payment and delivery system reforms, and advance key initiatives related to SDOH and transitions from incarceration (two policy areas also linked to reducing health disparities). Tackling these issues is often complex and involves sustained effort over multiple years. States also noted a number of ongoing and emerging challenges including rising health care costs (particularly for LTSS and prescription drugs); uncertain trajectory for state budgets and limited administrative capacity (due to outdated systems and state workforce shortages) at the same time administrative demands are increasing, especially tied to the implementation of new federal rules. The implementation of new federal rules could be further complicated by a Supreme Court ruling that could increase legal challenges to federal regulations. State officials also commented on challenges dealing with a lot of program uncertainty, adjusting to a new “normal” following the unwinding and expiration of pandemic-era policies, and the upcoming election that could have major implications for the program.

Acknowledgements

Pulling together this report is a substantial effort, and the final product represents contributions from many people. The combined analytic team from KFF and Health Management Associates (HMA) would like to thank the state Medicaid directors and staff who participated in this effort. In a time of limited resources and challenging workloads, we truly appreciate the time and effort provided by these dedicated public servants to complete the survey and respond to our follow-up questions. Their work made this report possible. We also thank the leadership and staff at the National Association of Medicaid Directors (NAMD) for their collaboration on this survey. 

Introduction

Medicaid provides health insurance coverage to more than one in five Americans and accounts for nearly one-fifth of all U.S. health care expenditures. At the end of FY 2024 and heading into FY 2025, states were wrapping up the unwinding of the pandemic-related continuous enrollment provision and focused on addressing other key priorities including reducing long-standing health disparities (often exacerbated by the pandemic), improving access to behavioral health and long-term services and supports (LTSS), addressing enrollee social determinants of health, and implementing broader delivery system and value-based initiatives.

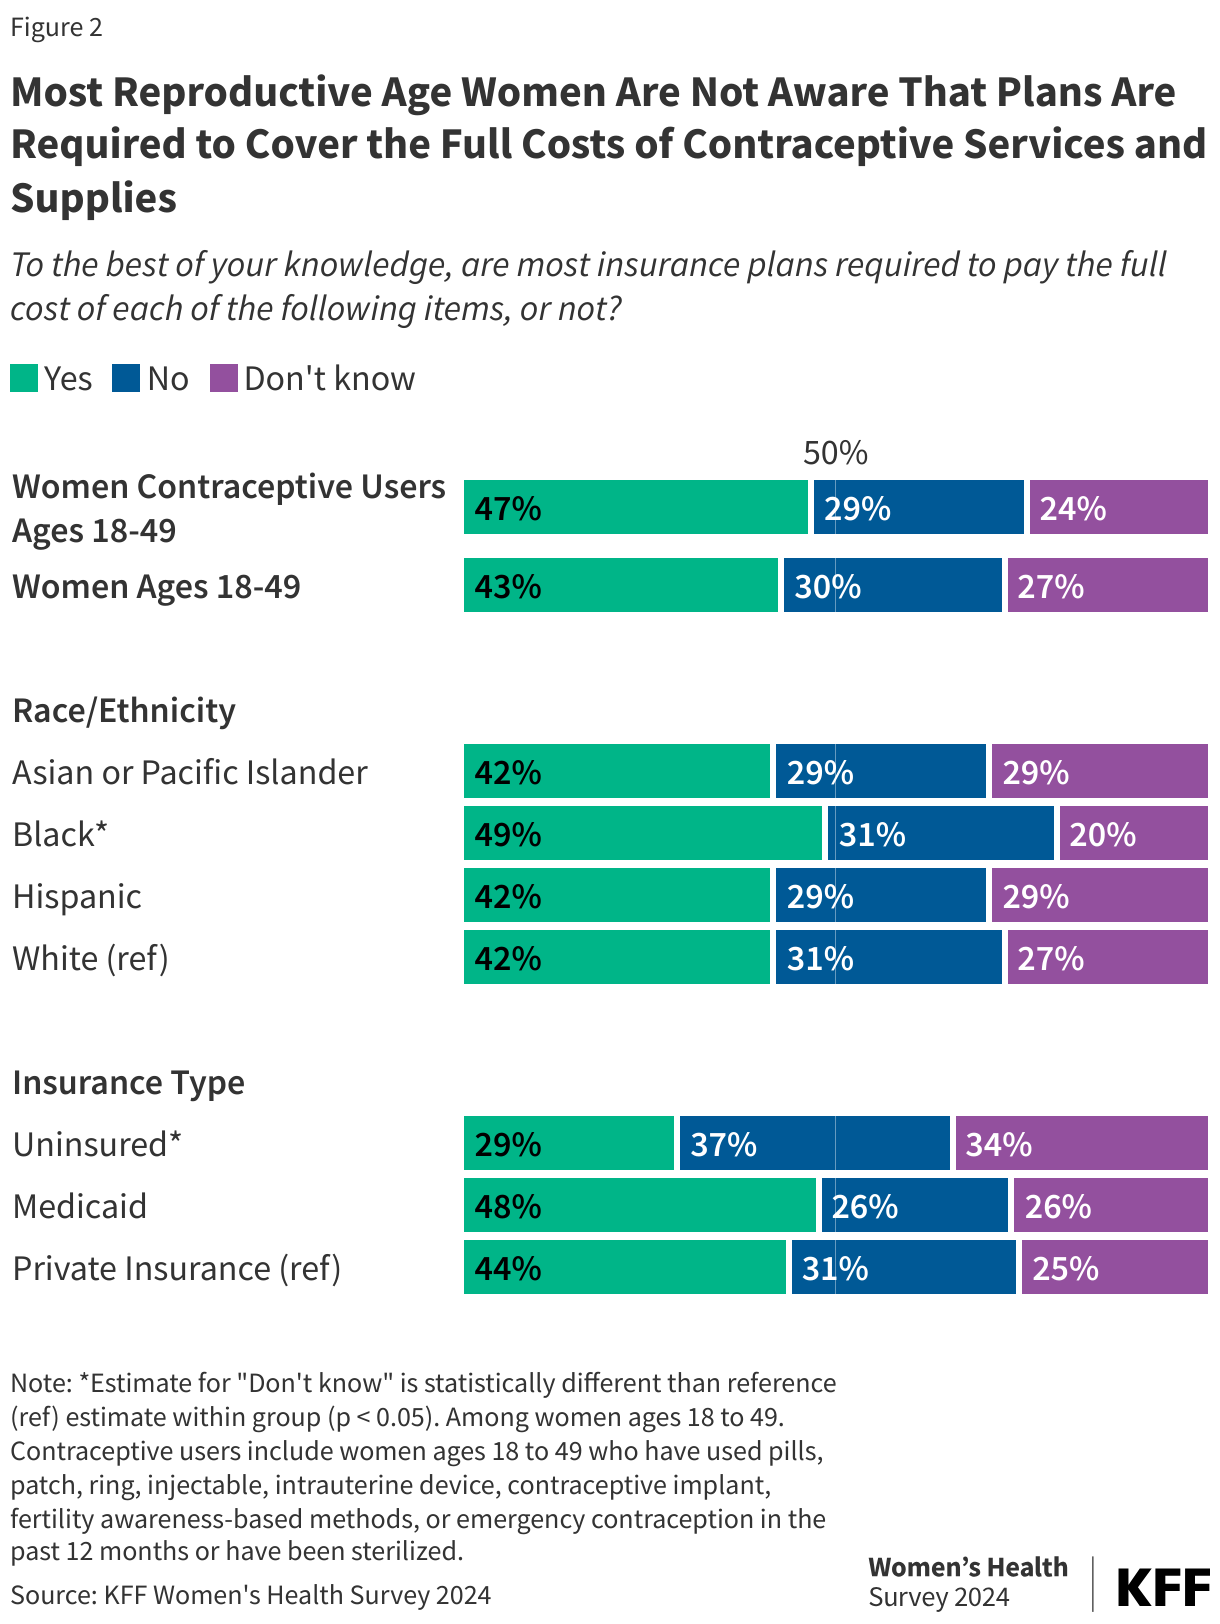
At the start of the pandemic, Congress enacted the Families First Coronavirus Response Act, which included a requirement that Medicaid programs keep people continuously enrolled in Medicaid in exchange for enhanced federal funding. As a result, enrollment in Medicaid and Children’s Health Insurance Program (CHIP) reached record highs, growing to 94 million enrollees, an increase of 23 million or 32% between February 2020 and April 2023. Medicaid enrollment growth along with enhanced subsidies in the Affordable Care Act (ACA) Marketplaces contributed to the lowest ever uninsured rate in 2022 and a stable uninsured rate in 2023.

The 2023 Consolidated Appropriations Act (CAA) ended the continuous enrollment provision on March, 31, 2023 and required states to begin the process of “unwinding” (i.e., resume historically typical eligibility redeterminations and disenroll individuals found to be no longer eligible for Medicaid). The CAA also phased down the enhanced federal matching funds through the end of 2023. Since the unwinding period began, millions of individuals have been disenrolled from Medicaid, but total net Medicaid and CHIP enrollment as of June 2024 remained over 8 million more than enrollment in February 2020, before the pandemic began. Though state unwinding timelines varied, all states except four completed unwinding renewals by August 2024.3  However, net enrollment trends remain uncertain and continue to evolve as states wrap up unwinding, re-enroll eligible individuals who may have lost coverage, process new applications, and, in some cases, expand eligibility.

This report draws upon findings from the 24th annual budget survey of Medicaid officials in all 50 states and the District of Columbia conducted by KFF and Health Management Associates (HMA), in collaboration with the National Association of Medicaid Directors (NAMD). (Previous reports are archived here.) This year’s KFF/HMA Medicaid budget survey was conducted from June through September 2024 via a survey sent to each state Medicaid director in June 2024 followed by a set of focus groups with Medicaid officials in different roles (directors, deputy directors, chief financial officers, and medical directors) from various states. Overall, 50 states responded by October 2024,4  although response rates for specific questions varied. The District of Columbia is counted as a state for the purposes of this report. Given differences in the financing structure of their programs, the U.S. territories were not included in this analysis. The survey instrument is included as an appendix to this report.

This report examines Medicaid policies in place or implemented in FY 2024, policy changes implemented at the beginning of FY 2025, and policy changes for which a definite decision has been made to implement in FY 2025 (which began for most states on July 1, 20245 ). Policies adopted for the upcoming year are occasionally delayed or not implemented for reasons related to legal, fiscal, administrative, systems, or political considerations, or due to CMS approval delays. Key findings, along with state-by-state tables, are included in the following sections:

Delivery Systems

Context

Managed Care Models. For more than three decades, states have increased their reliance on managed care delivery systems with the aim of improving access to certain services, enhancing care coordination and management, and making future costs more predictable. Across the states, there is wide variation in the populations required to enroll in managed care, the services covered (or “carved in”), and the quality and performance incentives and penalties employed. Most states contract with risk-based managed care organizations (MCOs) that cover a comprehensive set of benefits (acute care services and sometimes long-term services and supports), but many also contract with limited benefit prepaid health plans (PHPs) that offer a narrow set of services such as dental care, non-emergency medical transportation (NEMT), or behavioral health services. A minority of states operate primary care case management (PCCM) programs which retain fee-for-service (FFS) reimbursements to providers but link beneficiaries with a primary care provider who is paid a small monthly fee to provide case management services in addition to primary care. While the shift to MCOs has increased budget predictability for states, the evidence about the impact of managed care on access to care and costs is both limited and mixed.6 ,7 ,8  Recently finalized regulations, addressing Medicaid managed care access, finance, and quality, are primarily aimed at strengthening standards for timely access to care and states’ monitoring and enforcement efforts.

Capitation Rates and Risk Mitigation. MCOs are at financial risk for services covered under their contracts, receiving a per member per month “capitation” payment for these services. Capitation rates must be actuarially sound9  and are applied prospectively, typically for a 12-month rating period, regardless of changes in health care costs or utilization.10  States may use a variety of risk mitigation tools to ensure payments are not too high or too low, including risk sharing arrangements, risk and acuity adjustments, medical loss ratios (MLR), or incentive and withhold arrangements. When, however, significant enrollment, utilization, cost, and acuity changes began to emerge early in the COVID-19 public health emergency (PHE), CMS allowed states to modify managed care contracts, and many states implemented COVID-19 related “risk corridors” (where states and health plans agree to share profit or losses), allowing for the recoupment of funds. In last year’s survey, nearly two-thirds of responding MCO states reported implementing a pandemic-related MCO risk corridor (in 2020, 2021, and/or 2022), leading to the recoupment of payments for many states. States and plans faced another period of heightened rate setting uncertainty when the PHE continuous enrollment period expired on March 31, 2023.

Addressing Health Disparities. In the United States, racial and ethnic health disparities persist, driven by inequitable health care access and utilization and by social and economic factors, often referred to as social determinants of health (SDOH), that are rooted in historic and ongoing racism and discrimination. Like the federal government, many states have identified addressing health disparities as a key Medicaid priority and are leveraging their MCO contracts to reduce health disparities, for example, by addressing SDOH and tying MCO financial quality incentives (e.g., performance bonuses or withholds) to health disparity reductions.

This section provides information about:

  • Managed care models
  • MCO medical loss ratio (MLR) and remittance requirements
  • MCO capitation rate amendments
  • SDOH MCO contract requirements
  • Strategies to reduce health disparities

Findings

Managed Care models

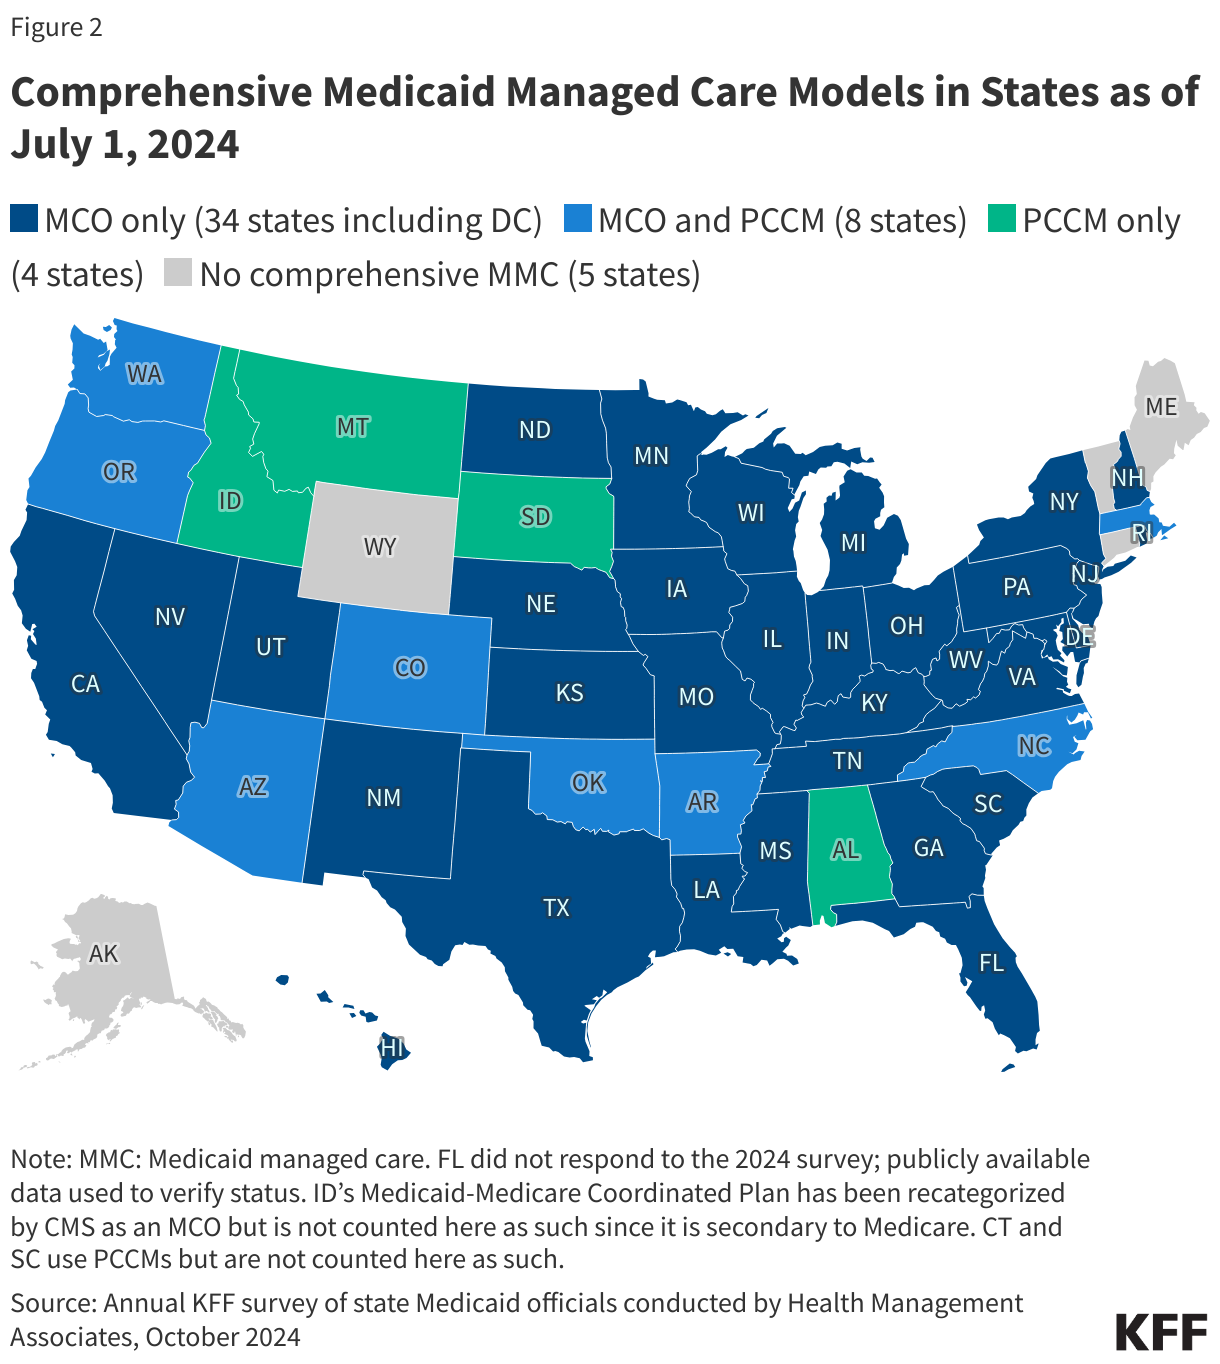
Capitated managed care remains the predominant delivery system for Medicaid in most states. As of July 1, 2024, all states except five – Alaska, Connecticut,11  Maine, Vermont,12  and Wyoming – had some form of managed care (MCOs and/or PCCM) in place (Figure 2). As of July 1, 2024, 42 states13  were contracting with MCOs, up from 41 states in 2023 (with the addition of Oklahoma); only two of these states (Colorado and Nevada) did not offer MCOs statewide (although Nevada plans to expand MCOs statewide in 2026). Twelve states reported operating a PCCM program, one fewer than reported in 2023 (as North Dakota ended its PCCM program in December 2023).14 

Of the 46 states that operate some form of comprehensive managed care (MCOs and/or PCCM), 34 states operate MCOs only, four states operate PCCM programs only, and eight states operate both MCOs and a PCCM program. In total, 30 states15  were contracting with one or more limited benefit prepaid health plans (PHPs) to provide Medicaid benefits including behavioral health care, dental care, vision care, non-emergency medical transportation (NEMT), or long-term services and supports (LTSS).

Comprehensive Medicaid Managed Care Models in States as of July 1, 2024

Capitation Rates and Risk Mitigation

Minimum Medical Loss Ratios (MLRs) and Remittance Requirements

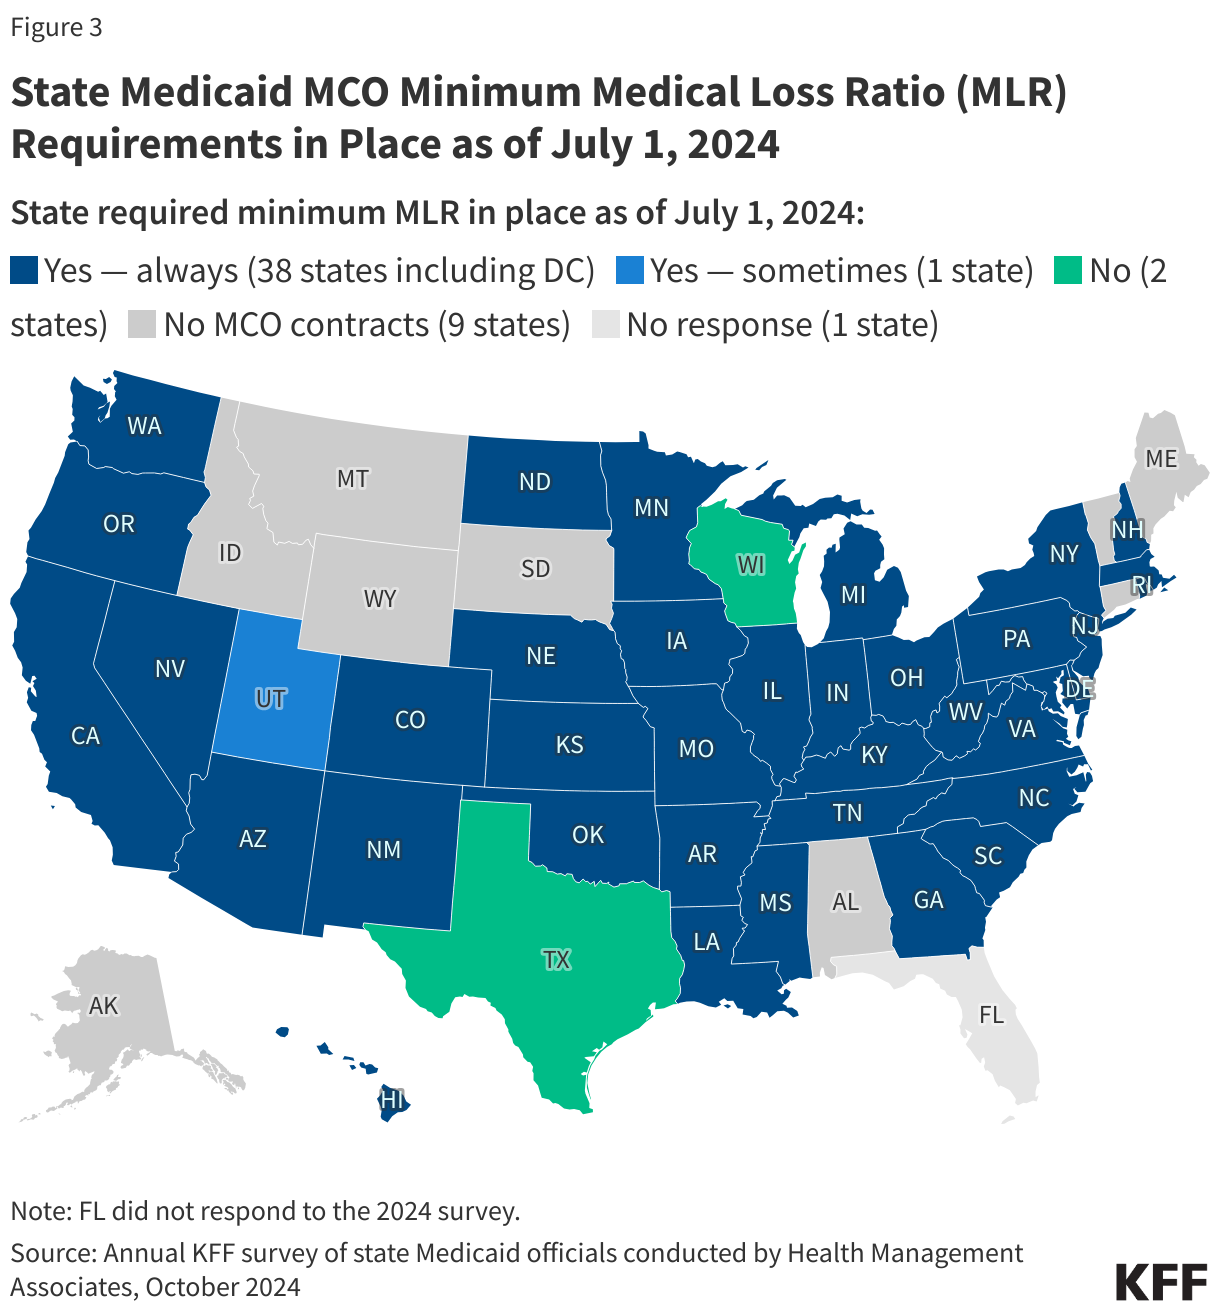
The medical loss ratio (MLR) reflects the proportion of total capitation payments received by an MCO spent on clinical services and quality improvement, where the remainder goes to administrative costs and profits. To limit the amount that plans can spend on administration and keep as profit, CMS published a final rule in 2016 that requires states to develop capitation rates for Medicaid to achieve an MLR of at least 85% in the rate year.16  There is no federal requirement for Medicaid plans to pay remittances to the state if they fail to meet the MLR standard, but states have discretion to require remittances. The 2024 Consolidated Appropriations Act included a financial incentive to encourage certain states to collect remittances from Medicaid MCOs that do not meet minimum MLR requirements. The Biden-Harris Administration’s FY 2024 and 2025 budgets went further proposing to require Medicaid managed care plans to meet an 85% minimum MLR and to require states to collect remittances if plans fail to meet the minimum MLR. An analysis of National Association of Insurance Commissioners (NAIC) data for the Medicaid managed care market shows the average loss ratios (in aggregate across plans) increased slightly in 2023 compared to 2022 (from 86% to 87%), implying a potential decrease in profitability, but remained lower than in 2018 and 2019. This year’s survey asked states whether they have a state required minimum MLR and whether they require MCOs that do not meet the minimum MLR requirement to pay remittances.

Nearly all MCO responding states (38 of 41) reported a minimum MLR requirement is always in place for MCOs as of July 1, 2024 (Figure 3). While states must use plan-reported MLR data to set future payment rates so that plans will “reasonably achieve” an MLR of at least 85%, states are not required to set a minimum MLR for their managed care plans. If states set a minimum MLR requirement, it must be at least 85%.17  While most states that described their requirements reported a minimum MLR requirement of 85%, several states reported higher requirements that ranged from 86% to 91%. A few states noted that minimum MLRs may vary by program. For example, in Pennsylvania, the minimum MLR requirement is set at 85% for MCOs covering acute care only (hospital and physician services) and at 90% for MCOs that cover acute care and LTSS.

State Medicaid MCO Minimum Medical Loss Ratio (MLR) Requirements in Place as of July 1, 2024

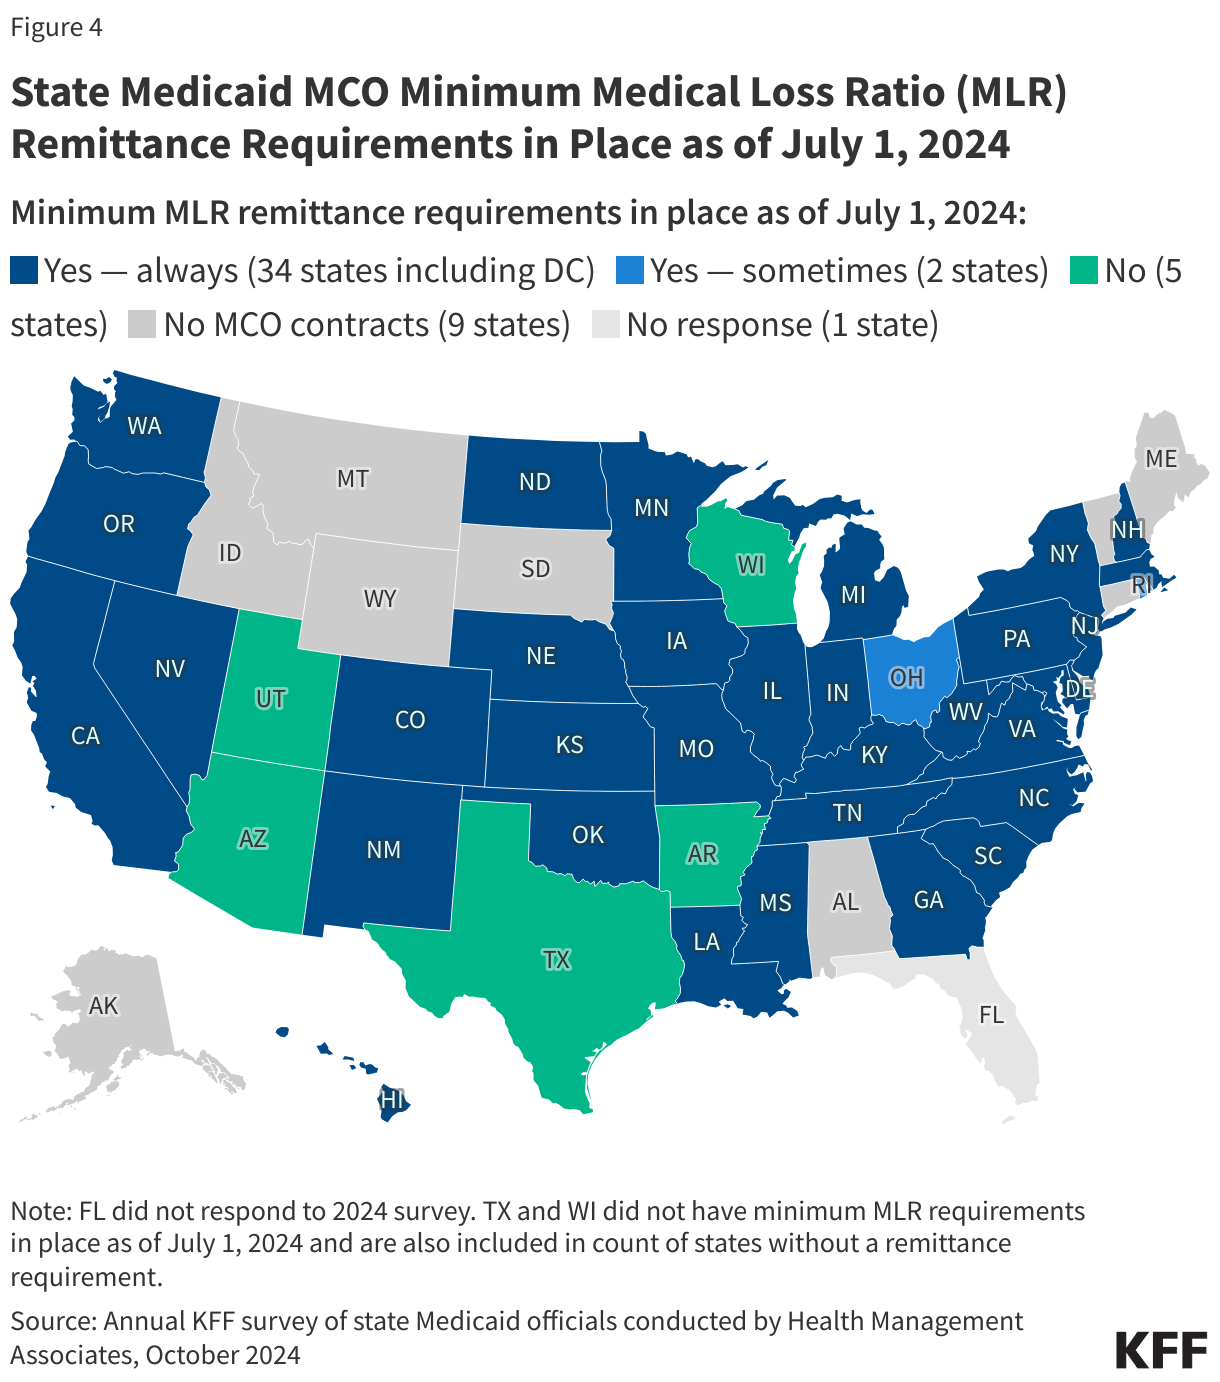
More than three-quarters of responding MCO states report they always require remittance payments when an MCO does not meet minimum MLR requirements (Figure 4). Thirty-four states reported that they always require MCOs to pay remittances, while two states indicated they sometimes require MCOs to pay remittances. States reporting that they sometimes require remittances may limit this requirement to certain MCO contracts. For example, Rhode Island reported that the remittance requirement did not apply to all populations. Additionally, some states (North Carolina, Oregon, and Tennessee) give MCOs that fail to meet the state required minimum MLR the option to either remit funds to the state and/or use funds towards community reinvestments (see MCO Contract Requirements Related to Social Determinants of Health below for more information). Five states do not require remittances (including two states that do not set a minimum MLR requirement). States that do not have minimum MLR and remittance requirements in place may have other risk mitigation strategies such as profit caps or experience rebates and/or risk corridors.

State Medicaid MCO Minimum Medical Loss Ratio (MLR) Remittance Requirements in Place as of July 1, 2024
Rate Amendments

State Medicaid programs use the most recent and accurate enrollment, cost, and utilization data available to ensure that MCO capitation rates are actuarially sound and that MCOs are not over-paid or under-paid for the services they deliver. Even if risk mitigation strategies are in place (e.g., MLR with remittance and/or risk corridors), states may determine rate amendments are necessary, for example, if their actual unwinding experience differs significantly from the assumptions used for the initial certified rates. Prior to the start of unwinding, plans expected the overall risk profile of their members to increase, with “stayers” likely to be sicker than “leavers.”

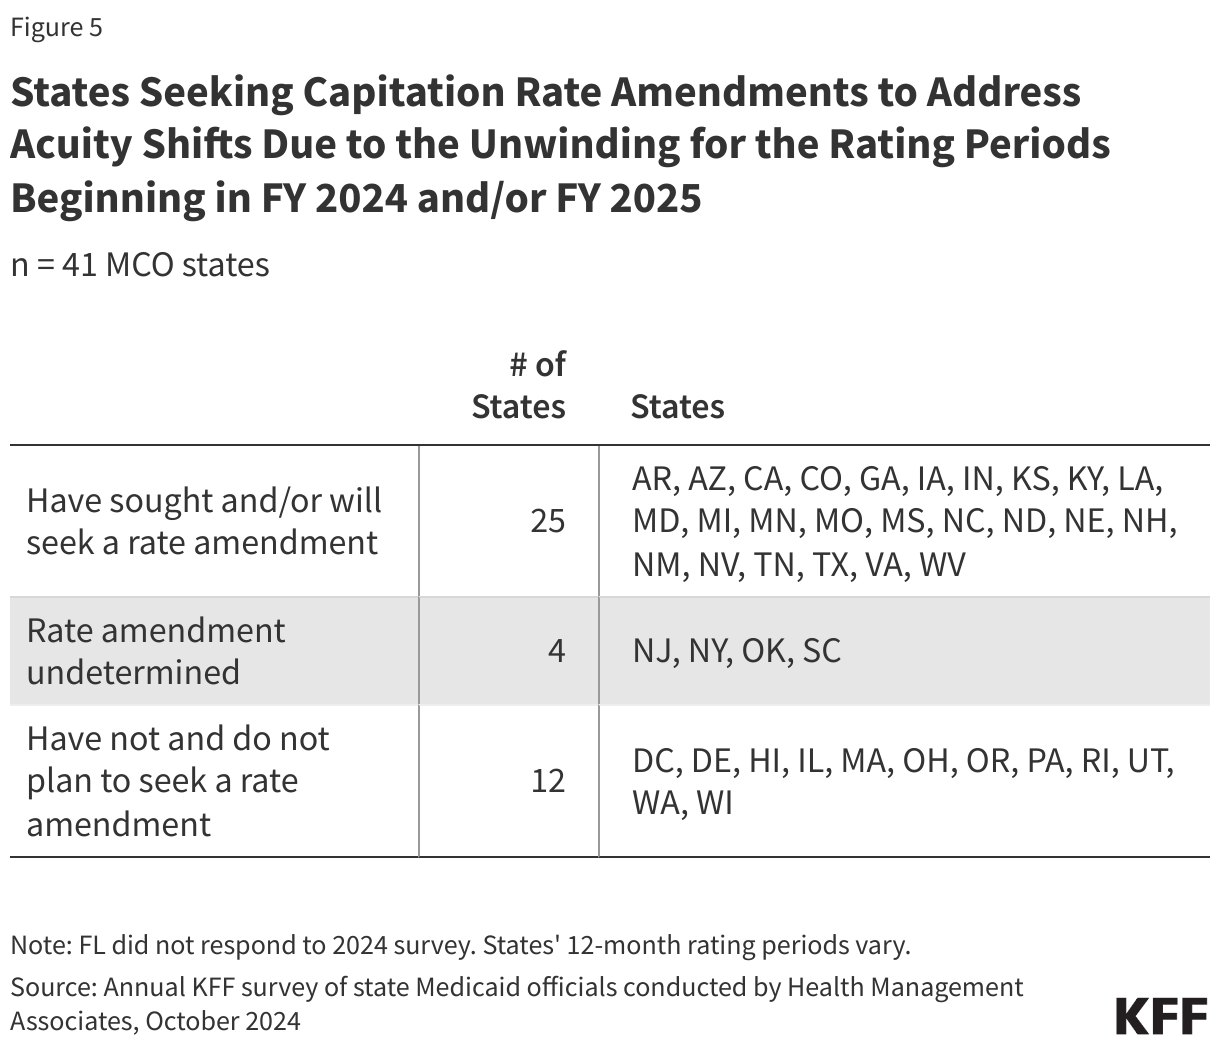
During a contract rating period, states may increase or decrease rates by 1.5% per rate cell (which apply to population subgroups with one or more common characteristics such as age, gender, eligibility category, and geographic region) without seeking CMS approval for the change (different rules apply for states with approved rate ranges per cell).18  To make a larger change, states must submit a rate amendment for federal approval that addresses and accounts for all differences from the most recently certified rates. This year’s survey asked states whether they have or will seek CMS approval for a capitation rate amendment to address “acuity shifts” (i.e., shifts in the average risk profile and utilization patterns) among MCO enrollment due to the unwinding in the rating period that began in FY 2024 and the rating period that begins in FY 2025.

About two-thirds of responding MCO states (25 of 41) reported seeking CMS approval for a capitation rate amendment to address acuity shifts among MCO enrollment due to the unwinding for a rating period beginning in FY 2024 and/or FY 2025 (Figure 5). An additional four states reported that while they did not seek a rate amendment to address acuity shifts for the rating period that began in FY 2024, whether they seek a rate amendment for the rating period that begins in FY 2025 is undetermined. Twelve states have not and do not plan to seek a rate amendment to address acuity shifts due to the unwinding in either rating period.

States Seeking Capitation Rate Amendments to Address Acuity Shifts Due to the Unwinding for the Rating Periods Beginning in FY 2024 and/or FY 2025

Social determinants of health (SDOH) are the conditions in which people are born, grow, live, work and age. Addressing social determinants of health is important for improving health outcomes and reducing health disparities. While there are limits, states can use Medicaid – which, by design, serves a primarily low-income population with greater social needs – to address social determinants of health. This year’s survey asked states about MCO contract requirements related to social determinants of health in place in FY 2024 or planned for implementation in FY 2025.

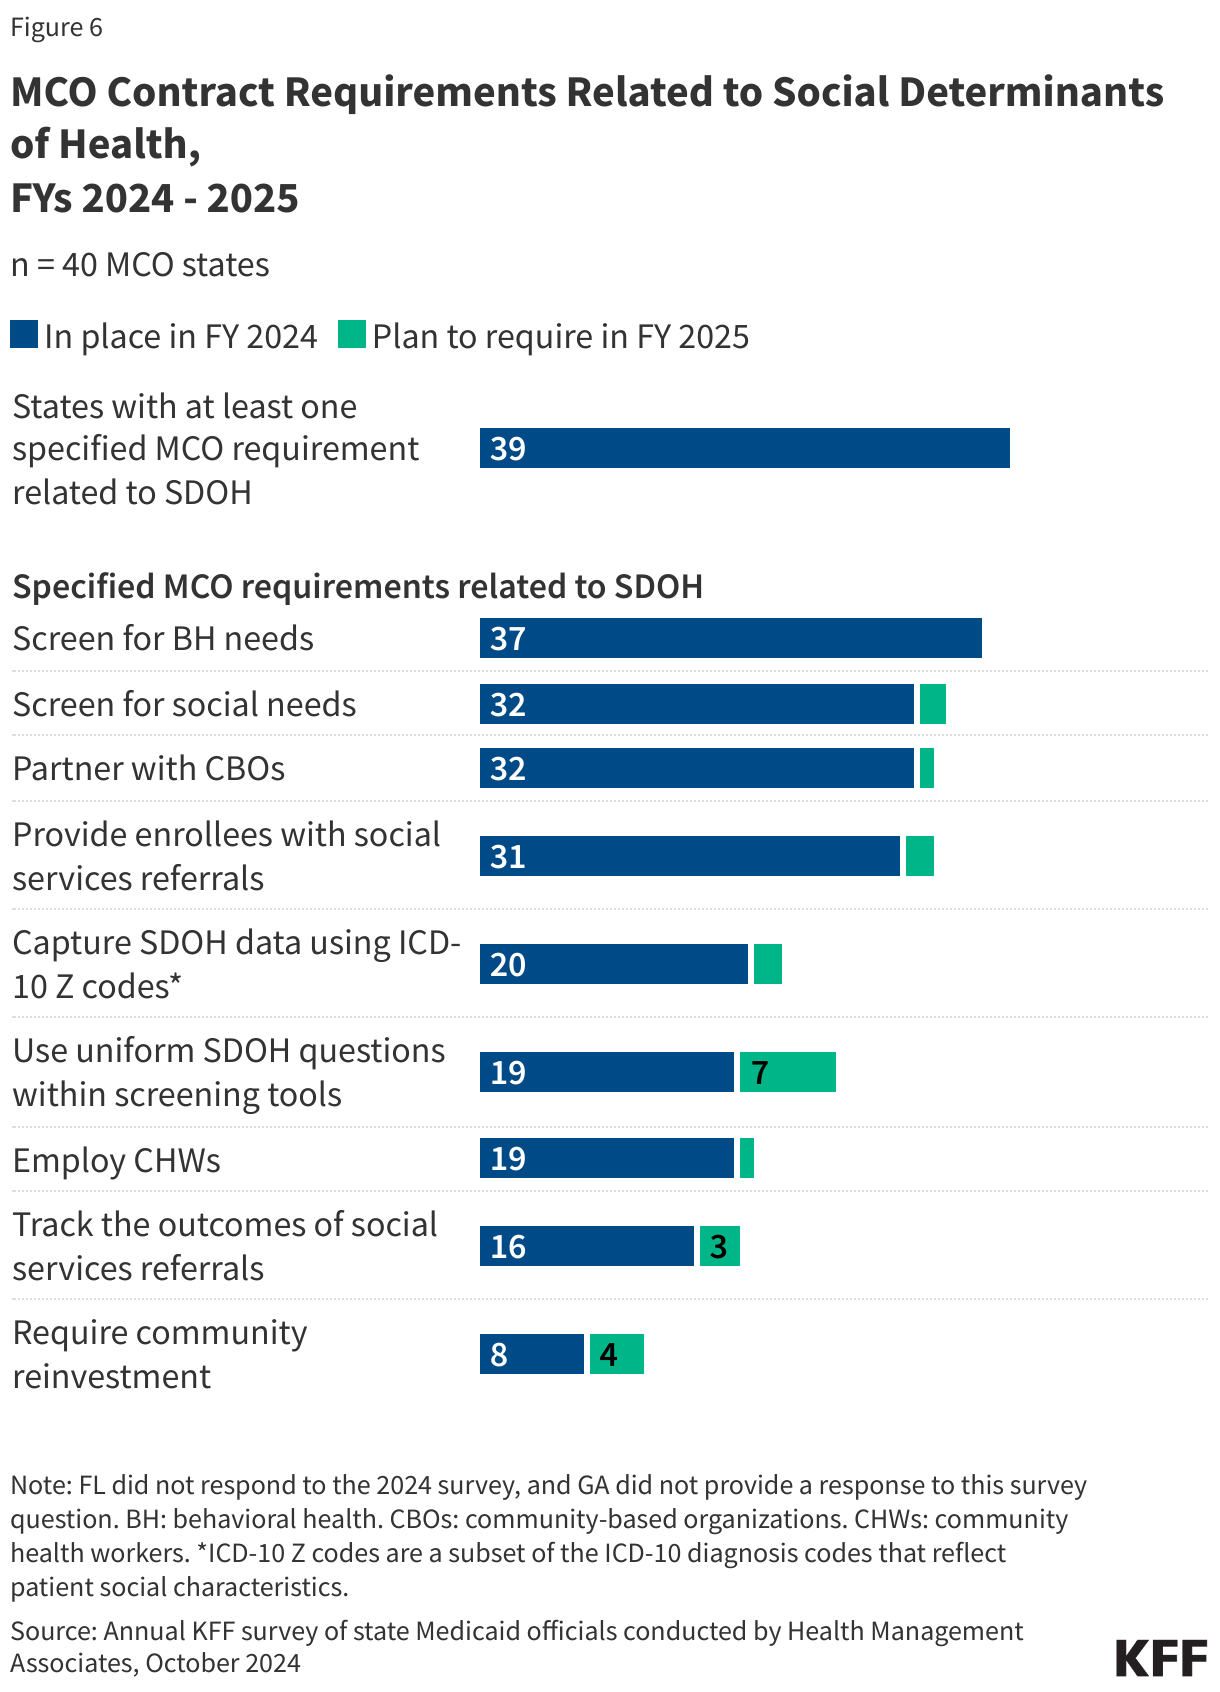
Nearly all responding MCO states (39 of 40) reported leveraging Medicaid MCO contracts to promote at least one strategy to address social determinants of health in FY 2024 (Figure 6). In FY 2024, more than three-quarters of responding MCO states reported requiring MCOs to screen enrollees for behavioral health needs, screen enrollees for social needs, provide referrals to social services, and partner with community-based organizations (CBOs). Similar numbers of states (about half) reported requiring MCOs to encourage/or require providers to capture SDOH data using ICD-10 Z codes, incorporate uniform SDOH questions within screening tools, employ community health workers (CHWs),19  and track the outcomes of referrals to social services. Fewer states reported requiring MCO community reinvestment (i.e., directing plans to reinvest a portion of revenue or profits into the communities they serve) compared to other strategies; however, a few states reported plans to require these activities in FY 2025.

While most states with community reinvestment requirements reported requiring MCOs to reinvest a percentage of their revenue or profits, a few states tie reinvestment requirements to state minimum MLRs and allow or encourage MCOs that do not meet the required MLR to reinvest all or a portion of the remittance payment.

State examples of community reinvestment requirements include:

  • In Arizona, MCOs are required to reinvest 6% of their profits into the community for each Medicaid line of business. Community reinvestment activities must support health-related social needs (HRSN) and demonstrate evidence-based measurable impacts to health outcomes. MCOs must submit an annual community reinvestment plan, which outlines their plans for the use of reinvestment funds for the year, as well as a community reinvestment report, which provides an overview of the measurable impacts of each activity (quantitative or qualitative) and the HRSN domain impacted (e.g., food insecurity, housing, transportation, etc.).
  • New Mexico requires each MCO to contribute a portion of their after-tax underwriting gain to community reinvestments and to submit an annual community reinvestment plan to the state for review and approval that details the MCO’s community reinvestment strategies, activities, and the anticipated time frame for demonstrable impact. The MCO’s strategies must include efforts to collaborate with other MCOs to attain collective impact on the areas of focus identified by the state including efforts to develop, expand, and retain in-state behavioral health residential providers to reduce the unnecessary utilization of inpatient, emergency room, and out-of-state services.
  • In North Carolina, MCOs may voluntarily contribute to health-related resources that help address members’ and communities’ unmet health-related needs. MCOs that do not meet the state required MLR have the option to make contributions to health-related resources in lieu of all or a portion of the remittance owed to the state. MCOs must submit proposals that align with the state’s quality strategy for review and approval by the state.
  • In Tennessee, if an MCO achieves a medical loss ratio of less than 85%, the MCO must either remit funds to the state and/or propose a reinvestment plan. An MCO that doesn’t meet the minimum MLR requirement and opts for reinvestment must submit a community reinvestment plan to the state for approval.
MCO Contract Requirements Related to Social Determinants of Health,  FYs 2024 - 2025

Financial Incentives Tied to Reducing Health Disparities

States use an array of financial incentives to improve quality, including linking performance bonuses or penalties, capitation withholds, or value-based state-directed payments to quality measures. States implement financial incentives across delivery systems (fee-for-service and managed care). This year’s survey asked states if they had an MCO financial quality incentive (e.g., a performance bonus or penalty, capitation withhold) that rewards quantitative improvement in racial/ethnic disparities for one on more populations in place in FY 2024 or planned for FY 2025 or beyond.

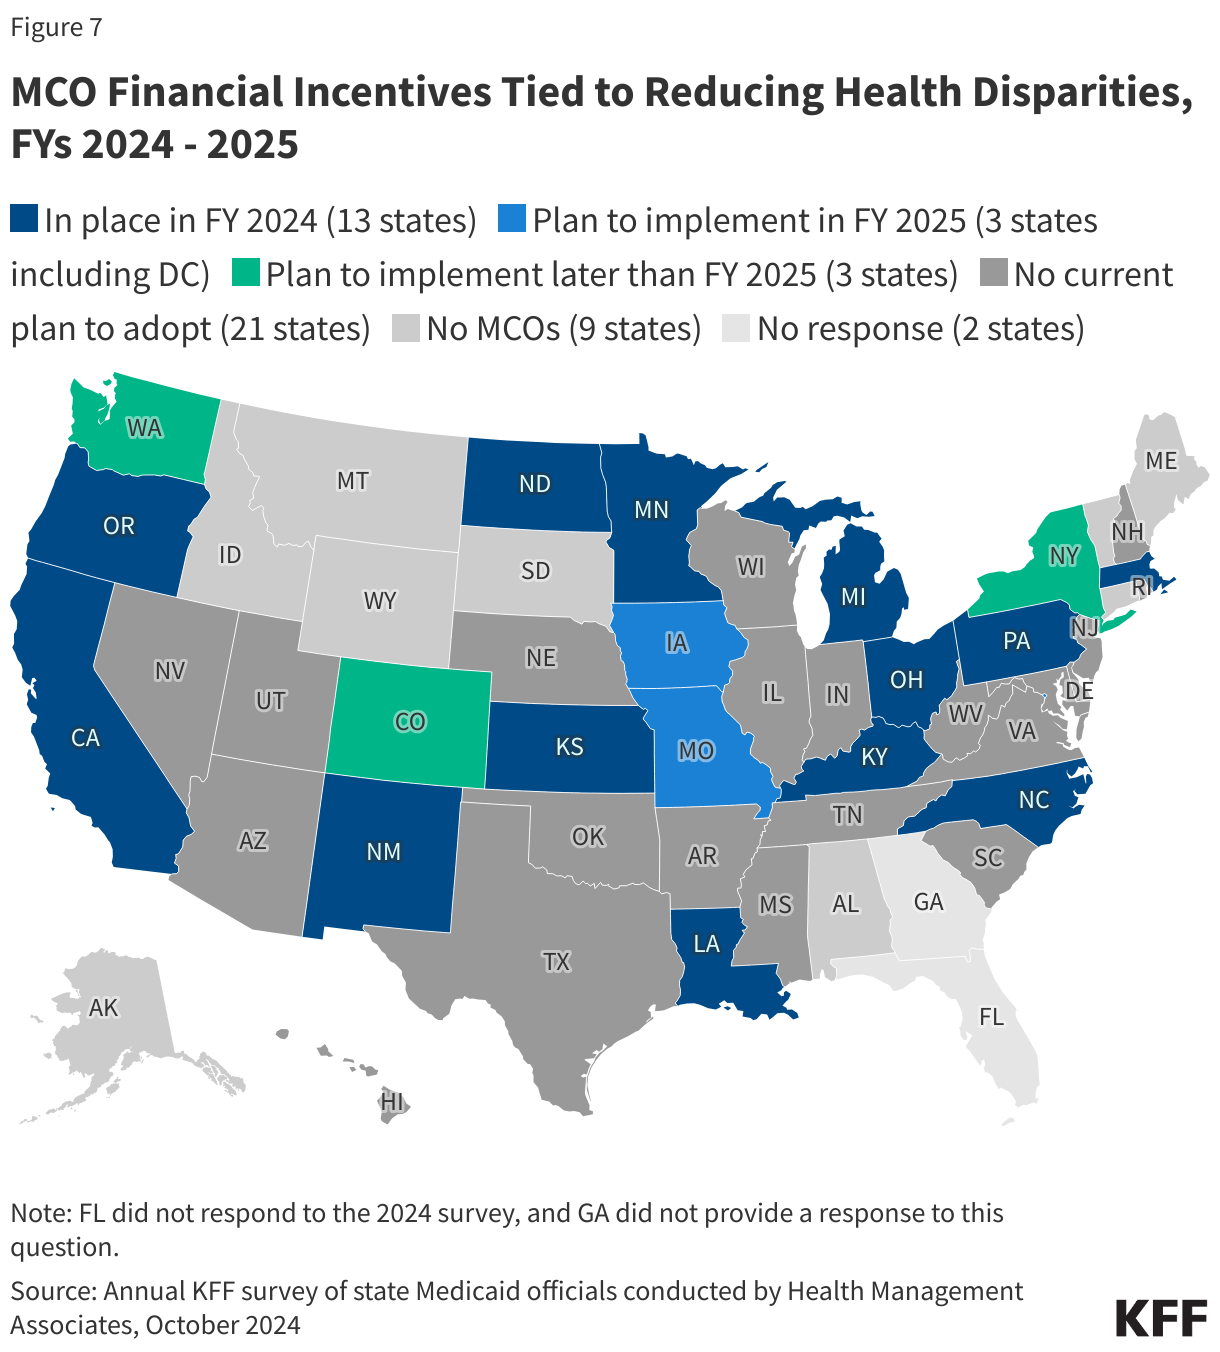
About one-third of responding MCO states (13 of 40) reported at least one MCO financial incentive tied to reducing racial/ethnic disparities in place in FY 2024 (Figure 7). Six additional states reported plans to implement MCO financial incentives in FY 2025 or later. States most commonly reported linking (or planning to link) capitation withholds or pay for performance incentives to improving health disparities. At least five states (Colorado, Louisiana, Missouri, North Carolina, and Pennsylvania) specifically mentioned current or planned MCO financial incentives focused on reducing disparities in maternal and child health. Other notable state examples include:

  • Kentucky’s MCO capitation withhold is tied to performance improvement on six core measures, including a social need screening and intervention measure (HEDIS SNS-E). MCOs are incentivized to address disparities by screening enrollees for unmet food, housing, and transportation needs and closing identified gaps.
  • In Louisiana, one-quarter of the capitation withhold is attributed to health equity performance improvement efforts, including development and maintenance of a Health Equity Plan and reporting and reduction of disparities in select maternal health, child health, preventive, and behavioral health measures.
  • In Massachusetts, the Quality and Equity Incentive Programs incentivize accountable care organizations (ACOs), MCOs, and the MA Behavioral Health Vendor to pursue performance improvements in three domains: demographic and health-related social needs data, equitable quality and access, and capacity and collaboration.
MCO Financial Incentives Tied to Reducing Health Disparities, FYs 2024 - 2025

In addition to implementing financial incentives tied to improvements in health disparities, states can leverage managed care contracts in other ways to promote reducing health disparities. For example, states can require MCOs to achieve national standards for advancing health equity, conduct staff training on health equity and/or implicit bias, develop new positions related to health equity, report racial disparities data, incorporate enrollee feedback, among other requirements. In this year’s survey, states that contract with MCOs were asked about whether certain MCO contract requirements related to reducing disparities were in place in FY 2024 or planned for implementation in FY 2025.

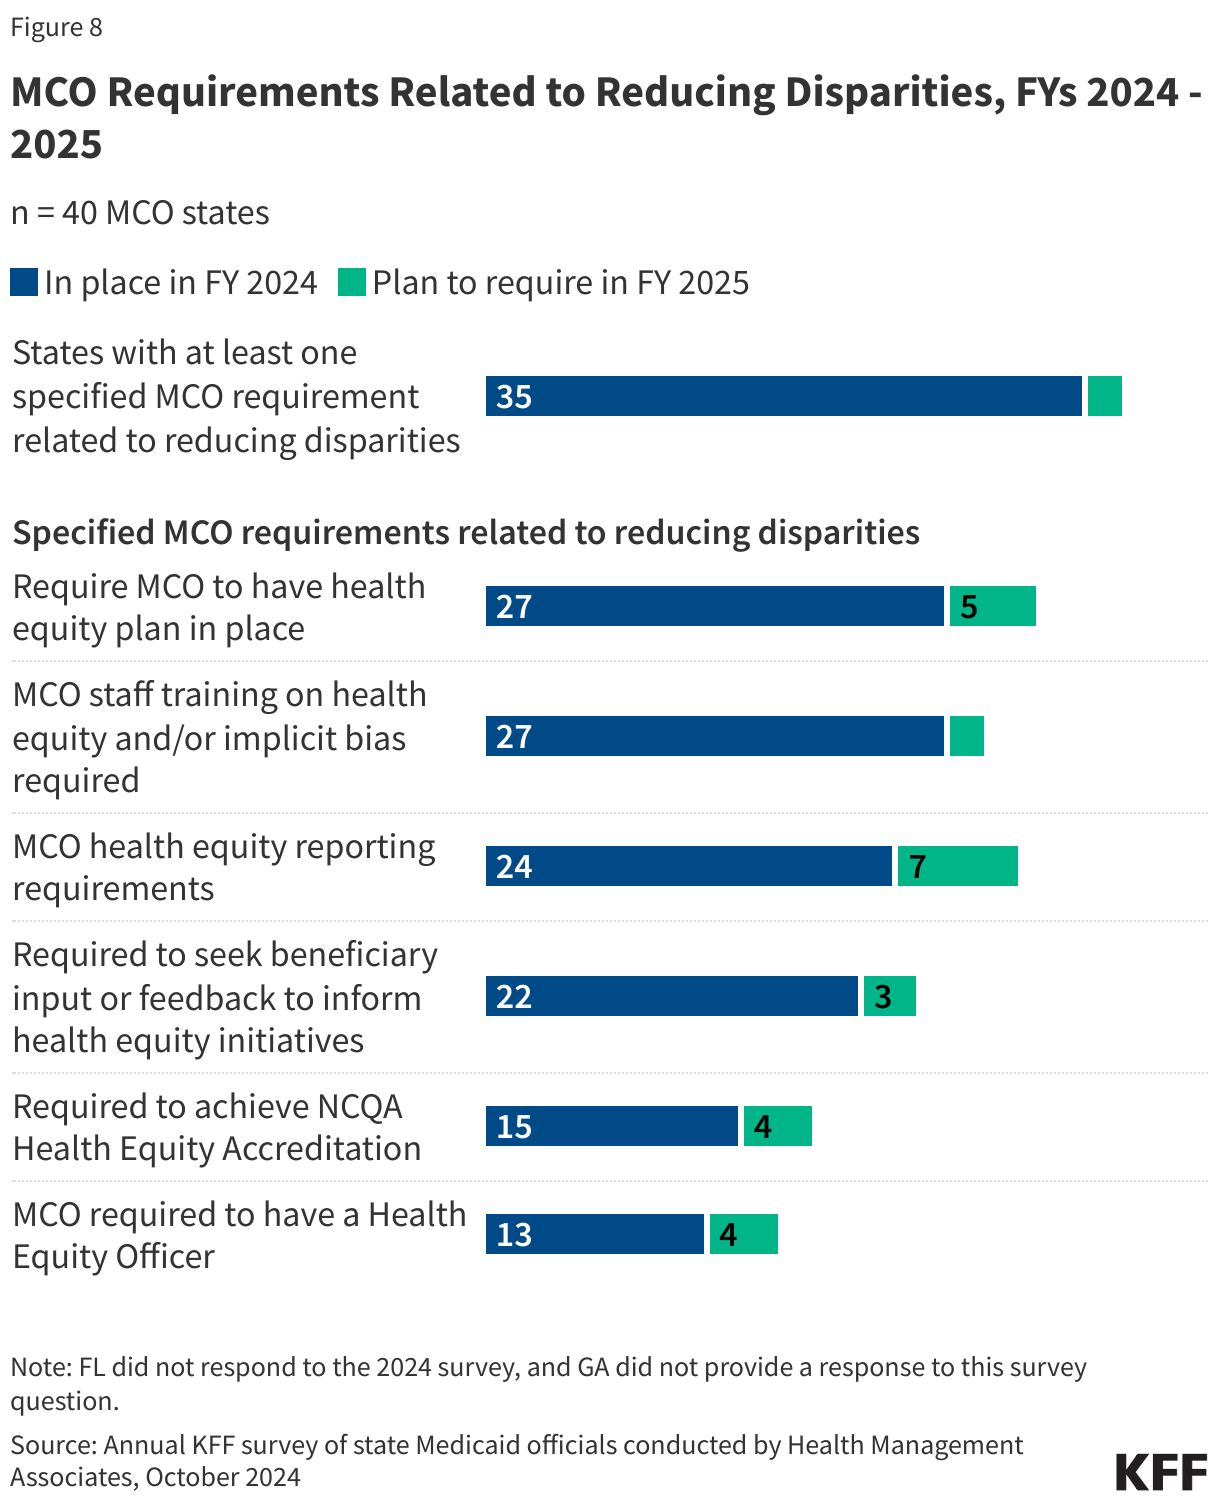
Nearly all responding MCO states (35 of 40) reported at least one specified MCO requirement related to reducing disparities in place in FY 2024 (Figure 8). In FY 2024, about two-thirds of states reported requiring MCOs to have a health equity plan in place (27 states) and train staff on health equity and/or implicit bias (27 states). Over half of states reported requiring MCOs to meet health equity reporting requirements (24 states) and seek enrollee input or feedback to inform health equity initiatives (22 states). Fewer states reported requiring MCOs to achieve NCQA’s Health Equity Accreditation (previously the Multicultural Health Care Distinction) (15 states) or have a health equity officer (13 states). Among states with at least one requirement in place in FY 2024, three-quarters (27 of 35) reported three or more specified requirements in place (data not shown). The number of MCO states with at least one specified MCO requirement related to reducing disparities grew significantly from 16 states in FY 2022 and is expected to grow to 37 states in FY 2025.

MCO Requirements Related to Reducing Disparities, FYs 2024 - 2025

Provider Rates And Taxes

Context

States have substantial flexibility to establish Medicaid provider reimbursement methodologies and amounts, especially within a fee-for-service (FFS) delivery system where a state Medicaid agency pays providers or groups of providers directly. While states with capitated managed care arrangements are generally not permitted to direct how their contracted managed care organizations (MCOs) pay providers, state determined FFS rates remain important benchmarks for MCO payments in most states. To improve access to Medicaid services across both FFS and managed care delivery systems, recently finalized rules include provisions that require states to improve payment rate transparency and promote payment adequacy for some direct care workers (see Box 1).

Fee-for-Service Rates. While federal law and regulations grant states broad latitude to determine FFS provider payments, they also require that payments be sufficient to ensure that Medicaid enrollees have access to care that is equal to the level of access enjoyed by the general population in the same geographic area.20  CMS reviews and approves state changes to FFS payment methodologies through the Medicaid State Plan Amendment process.21  In addition to FFS provider payments, states are permitted to make multiple types of “supplemental” payments. States make these payments for a variety of purposes including to supplement Medicaid “base” FFS payment rates that often do not fully cover provider costs as well as to help support the costs of care for uninsured patients.

Managed Care Provider Rates. States pay Medicaid MCOs a set per member per month (“capitation”) payment for the Medicaid services specified in their contracts. Under federal law, payments to Medicaid MCOs must be actuarially sound. Actuarial soundness means that “the capitation rates are projected to provide for all reasonable, appropriate, and attainable costs that are required under the terms of the contract and for the operation of the managed care plan for the time period and the population covered under the terms of the contract.” Plan rates are usually set for a 12-month rating period and must be reviewed and approved by CMS each year. States are generally prohibited from contractually directing how a managed care plan pays its providers.22  Subject to CMS approval, however, states may implement certain “state directed payments” (SDPs)23  that require managed care plans to adopt minimum or maximum provider payment fee schedules, provide uniform dollar or percentage increases to network providers (above base payment rates), or implement value-based provider payment arrangements.

Box 1: Federal Rules Finalized in 2024

FFS / Access Rule. The recently finalized Ensuring Access to Medicaid Services final rule (Access rule)24  is designed to promote quality of care and improved health outcomes by advancing access to care for Medicaid enrollees. The rule addresses several dimensions of access: increasing provider rate transparency and accountability, standardizing data and monitoring, and creating opportunities for states to promote active enrollee engagement in their Medicaid programs. The rule requires states, in part, to:

  • Conduct comparative rate analyses. States must compare their FFS payment rates for primary care, obstetrical and gynecological care, and outpatient mental health and substance use disorder services to Medicare rates, and publish the analysis every two years, with the first analysis published by July 1, 2026.
  • Publish fee schedules. By July 1, 2026, states must publish all FFS rates on a publicly available and accessible website and make updates within one month of a payment rate change.
  • Disclose payment rates for HCBS. By July 1, 2026, states must publish the average hourly rate paid for personal care, home health aide, homemaker, and habilitation services, and publish the disclosure every two years.
  • Establish a direct care worker payment advisory group. Within two years (of effective date of the final rule), states must establish an advisory group that includes direct care workers, beneficiaries, beneficiaries’ authorized representatives, and other interested parties to advise and consult on the sufficiency of payment rates (at least every two years) for personal care, homemaker, home health aide, and habilitation services.
  • Ensure HCBS payment adequacy. Beginning in July 2030, states must ensure a minimum of 80% of Medicaid payments for homemaker, home health aide, and personal care services are spent on compensation for direct cares workers, as opposed to administrative overhead or profit (known as the “80/20 rule.”)

LTC Facility Staffing Rule. One provision of the recently finalized Minimum Staffing Standards for Long-Term Care Facilities and Medicaid Institutional Payment Transparency Reporting final rule (LTC Facility Staffing rule) requires states, beginning in June 2028, to collect and report on the percent of Medicaid payments that are spent on compensation for direct care workers and support staff delivering care in nursing facilities and intermediate care facilities, for individuals with intellectual disabilities.25 

Managed Care Rule. The recently finalized Medicaid and CHIP Managed Care Access, Finance, and Quality final rule (Managed Care rule) introduced a managed care payment analysis requirement and made several changes to state directed payment requirements including:

  • Requiring states to submit annual payment analysis. States must submit an annual analysis comparing managed care plans’ payment rates for certain services to Medicare rates and compare certain HCBS rates to state FFS payment rates (beginning the first rating period that begins on or after July 9, 2026.)26 
  • Eliminating the requirement to obtain prior approval for certain SDPs. States will no longer be required to seek prior CMS approval for SDPs that impose minimum fee schedules set at the Medicare payment rate.27 
  • Establishing SDP payment rate ceiling for certain providers. The rule allows SDPs for inpatient and outpatient hospital services, nursing facility services, and the professional services at an academic medical center to reach “average commercial rates”28  (which is substantially higher than the Medicare payment ceiling used for many FFS supplemental payments).29 

Provider Rate Implications of Economic and Fiscal Conditions. Historically, FFS provider rate changes generally reflect broader economic conditions. During economic downturns when states may face revenue shortfalls, states have typically turned to provider rate restrictions to contain costs. Conversely, states are more likely to increase provider rates during periods of recovery and revenue growth. During the COVID-19 public health emergency, however, states were able to generally avoid rate cuts due to temporary federal support from the pandemic-related enhanced Medicaid matching funds as well as enhanced funding for home and community-based services (HCBS). In FY 2024 and FY 2025, states reported inflation and workforce shortages were driving higher labor costs, resulting in pressure to increase provider rates.

Provider Taxes. States have considerable flexibility in determining how to finance the non-federal share of state Medicaid payments, within certain limits. In addition to state general funds appropriated directly to the Medicaid program, most states also rely on funding from health care providers and local governments generated through provider taxes, user fees, intergovernmental transfers (IGTs), and certified public expenditures (CPEs). Over time, states have increased their reliance on provider taxes, with expansions often driven by economic downturns. Federal regulations30  require provider taxes to be broad-based (imposed on all non-governmental entities, items, and services within a class), and uniform (consistent in amount and scope across the entities, items, or services to which it applies), and must not hold taxpayers harmless (i.e., directly or indirectly guarantee that the provider will be repaid for all or a portion of the tax). Also, a provider tax will meet the hold harmless “safe harbor threshold” if it generates revenue that does not exceed 6% of net patient revenue.

This section provides information about:

  • Hospital reimbursement
  • Nursing facility reimbursement
  • FFS reimbursement rates for other provider types
  • Payment rate transparency
  • Provider taxes

Findings

Hospital Reimbursement – FFS Base Rates, Supplemental Payments, and State Directed Payments (SDPs)

States make different types of Medicaid payments to hospitals. The two broad categories of FFS payment are (1) FFS base rates and (2) supplemental payments, typically made in a lump sum for a fixed period of time. States use supplemental payments, including upper payment limit (UPL), disproportionate share hospital (DSH), or uncompensated care pool payments, to cover hospital costs that exceed the amounts covered by their FFS base rates. DSH payments can also be used to pay for unpaid costs of care for the uninsured. The Medicaid statute31  requires states to make Medicaid DSH payments to hospitals, and most states also make other types of FFS supplemental payments, although payment amounts and how they are distributed to hospitals vary considerably across states. Because many types of supplemental payments are interchangeable, an increase in one type can lead to a decrease in another. Increases or decreases in base FFS payments may also result in supplemental payment changes.

Hospital FFS base rates (and payment methods) also vary considerably across states and, on average, are below hospitals’ costs of providing services to Medicaid enrollees and below Medicare payment rates for comparable services,32  causing some states to rely more heavily on supplemental payments than others to help cover hospitals’ costs. Within a state, reimbursement methodologies and levels may also vary by hospital type (e.g., community, critical access, and academic medical center hospitals). While managed care organizations have flexibility to determine provider payment methodologies and amounts, they often pay rates that are similar to FFS rates. As a result, many states that contract with MCOs use state directed payments (SDPs) to make uniform rate increases that are like FFS supplemental payments.33 

According to the Medicaid and CHIP Payment and Access Commission (MACPAC), in FY 2022, 61% of Medicaid payments to hospitals were made through managed care delivery systems and 39% were made on a FFS basis. Further, about half of FFS payments to hospitals were made through supplemental payments, while one-third of managed care payments to hospitals are made through SDPs.

In this year’s survey, states were asked to report on changes made to their FFS base rates, non-DSH supplemental payments, and hospital SDPs in FY 2024 and changes planned for FY 2025. DSH was excluded as individual state DSH allotments are federally determined and MACPAC is statutorily required to annually report on Medicaid DSH allotments.

Hospital FFS Base Rates & Non-DSH FFS Supplemental Payments

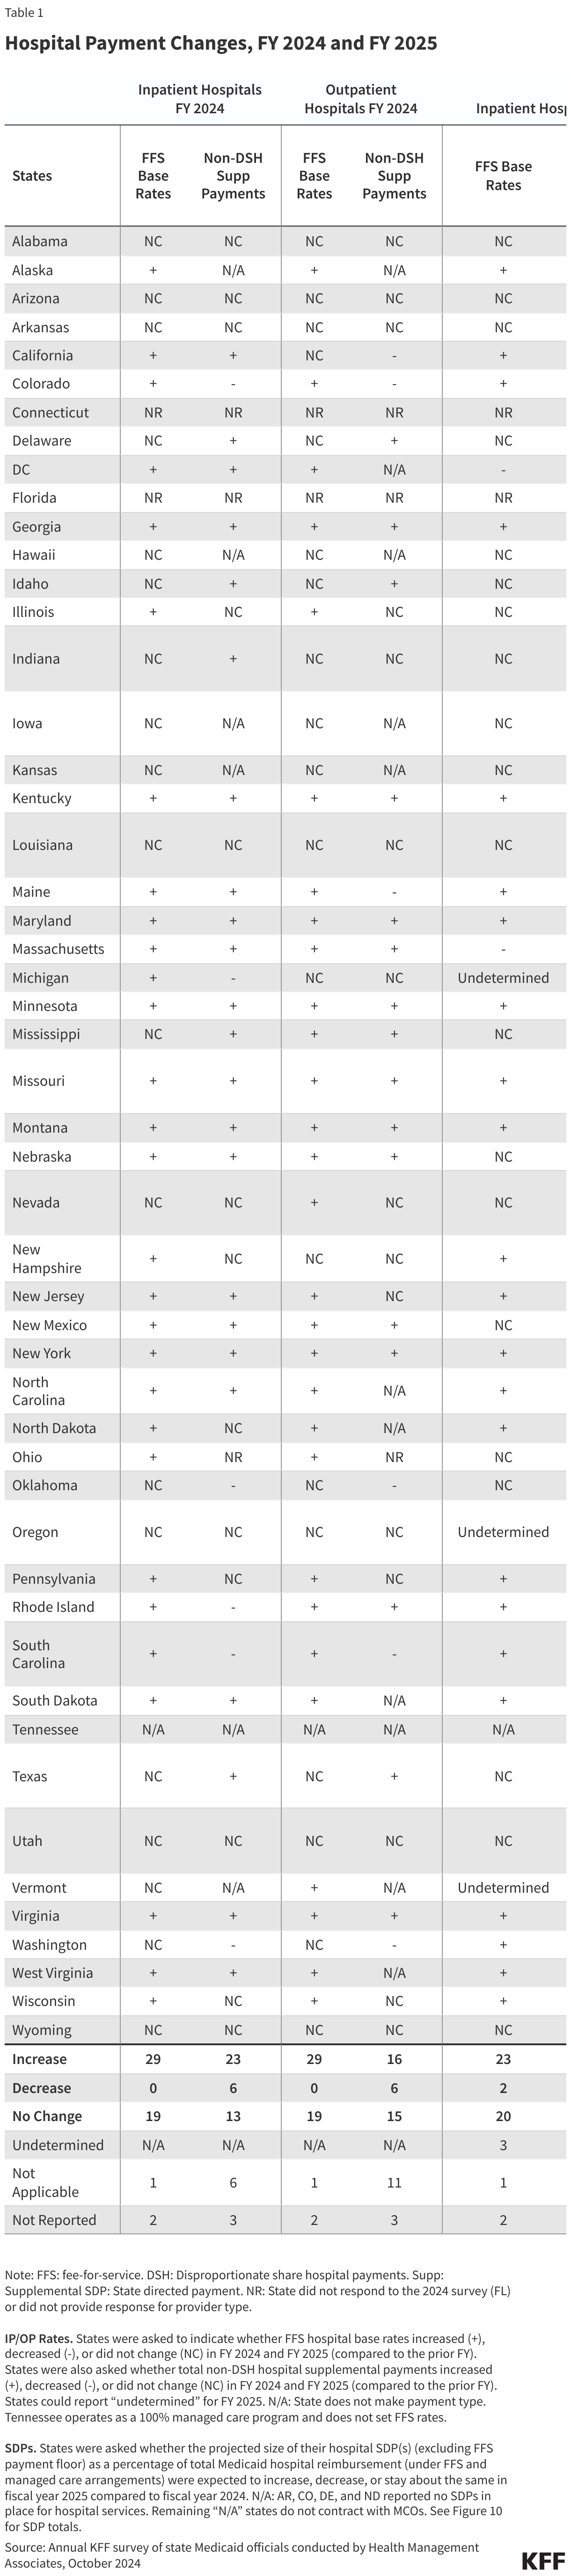
Overall, few responding states reported hospital rate decreases (FFS base rates or supplemental payments) in FY 2024 or FY 2025 (Table 1). Among the states that reported decreases, several reported that the decreases (to FFS base rates or non-DSH supplemental payments) offset increases in other areas. For example, two states (California and Oklahoma) reported transitions in utilization from FFS to managed care caused non-DSH supplemental payments to decrease while managed care state directed payments increased (in FY 2024 and/or FY 2025.) Michigan reported its reduction in total non-DSH supplemental payments (in FY 2024) offset an increase in FFS base rates for hospitals designated as Level I or Level II Trauma Centers. Massachusetts reported while hospital base rates were set to decrease in FY 2025, overall payments to hospitals would increase when add-on and incentive payments are included. In contrast, Utah reported plans to reduce a small graduate medical education (GME) supplemental payment in FY 2025 without noting any offsetting FFS base rate increases.

More than half of responding states (26 states) reported increasing both inpatient and outpatient hospital FFS base rates in FY 2024 (Table 1). Nearly half (20 states) reported plans to increase inpatient and outpatient FFS base rates in FY 2025. A few states commented on more significant FFS hospital base rate increases:

  • Illinois reported a 10% across the board increase for both inpatient and outpatient base rates in FY 2024.
  • Maine reported substantial increases to inpatient DRG (diagnosis-related group) rates in FY 2025 to align more closely with Medicare rates and increased outpatient rates in both FY 2024 and FY 2025, benchmarking them to Medicare outpatient rates.
  • Missouri reported an average 9% increase in FFS hospital per diems in FY 2025 due to increased cost trends.

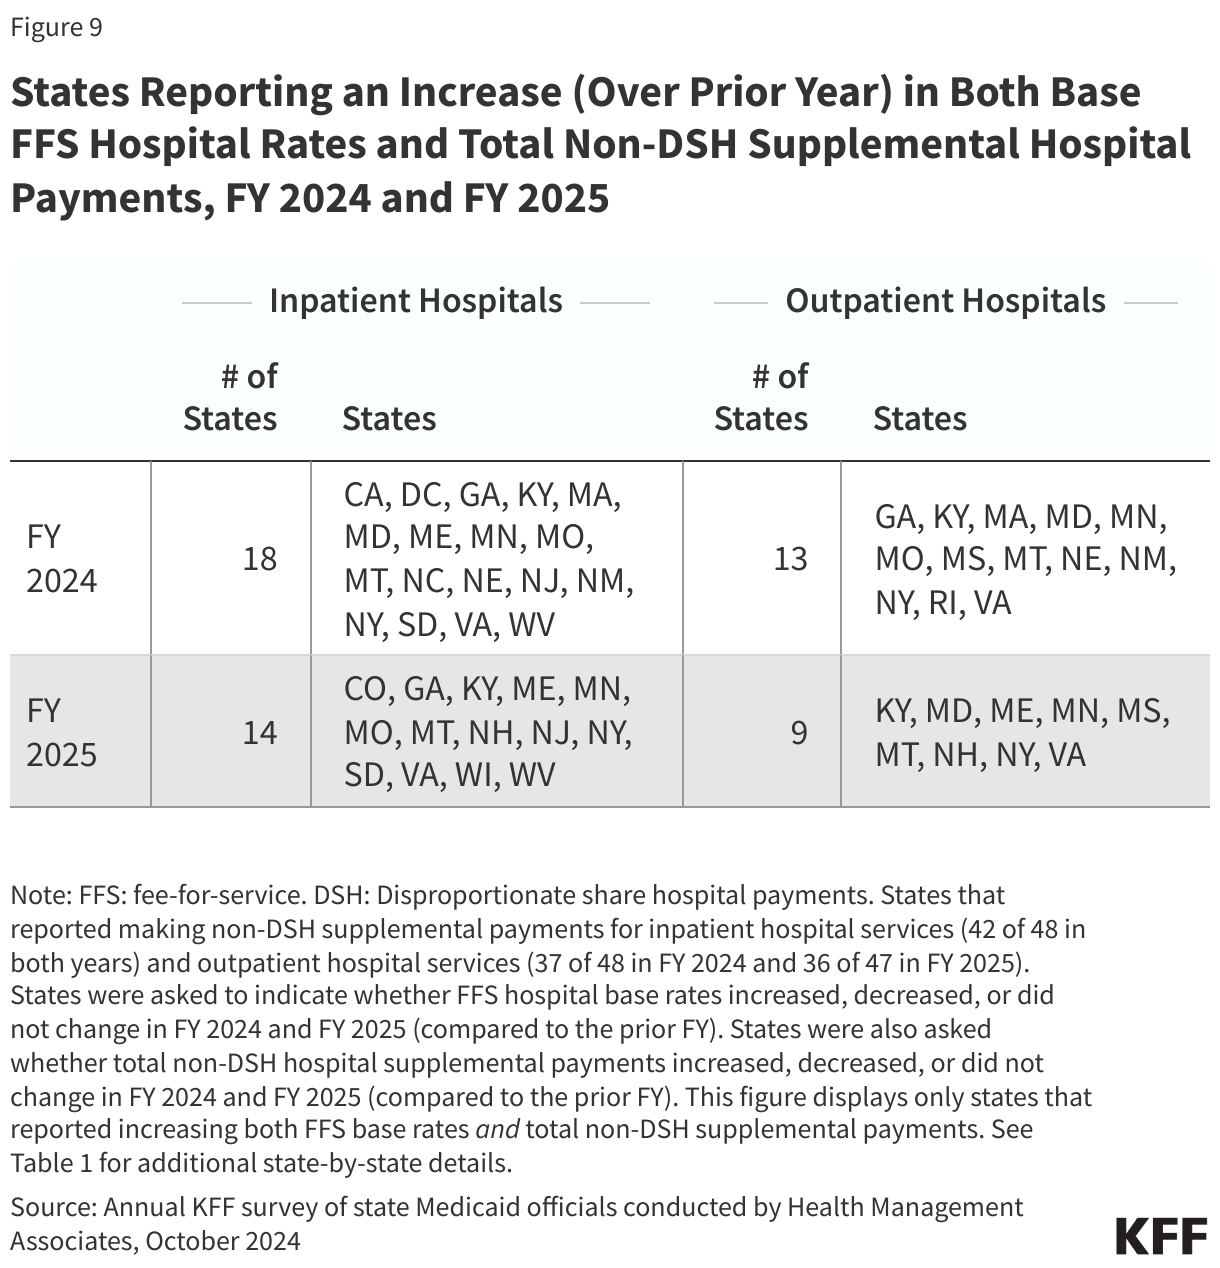
Many states reported increases in both hospital base rates and non-DSH supplemental payments in both FY 2024 and FY 2025 (Figure 9). Most responding states reported making non-DSH supplemental payments for both inpatient (42 of 48 in both years) and outpatient (37 of 48 in FY 2024 and 36 of 47 in FY 2025) hospital services (Table 1). Of the 42 states with inpatient supplemental payments, nearly half in FY 2024 (18 states) and one-third in FY 2025 (14 states) planned to increase both FFS base rates and supplemental payments (Figure 9). Of the states reporting outpatient supplemental payments (37 in FY 2024 and 36 in FY 2025), over one-third in FY 2024 (13 states) and about one-quarter in FY 2025 (9 states) planned to increase both FFS base rates and supplemental payments.

States Reporting an Increase (Over Prior Year) in Both Base FFS Hospital Rates and Total Non-DSH Supplemental Hospital Payments, FY 2024 and FY 2025

Hospital State Directed Payments

Recent reports indicate state directed payments have been a major driver of Medicaid expenditure growth in recent years. New Medicaid managed care rules finalized in 2024 permit states to pay hospitals and nursing facilities at the average commercial payment rate (ACR) when using directed payments, which is substantially higher than the Medicare payment ceiling used for other Medicaid FFS supplemental payments. Recently revised CBO Medicaid spending projections for 2025-2034 reflect a 4% (or $267 billion) increase with half of the increase attributed to expected growth in directed payments in Medicaid managed care (driven in part by the rule change allowing states to pay at the ACR).

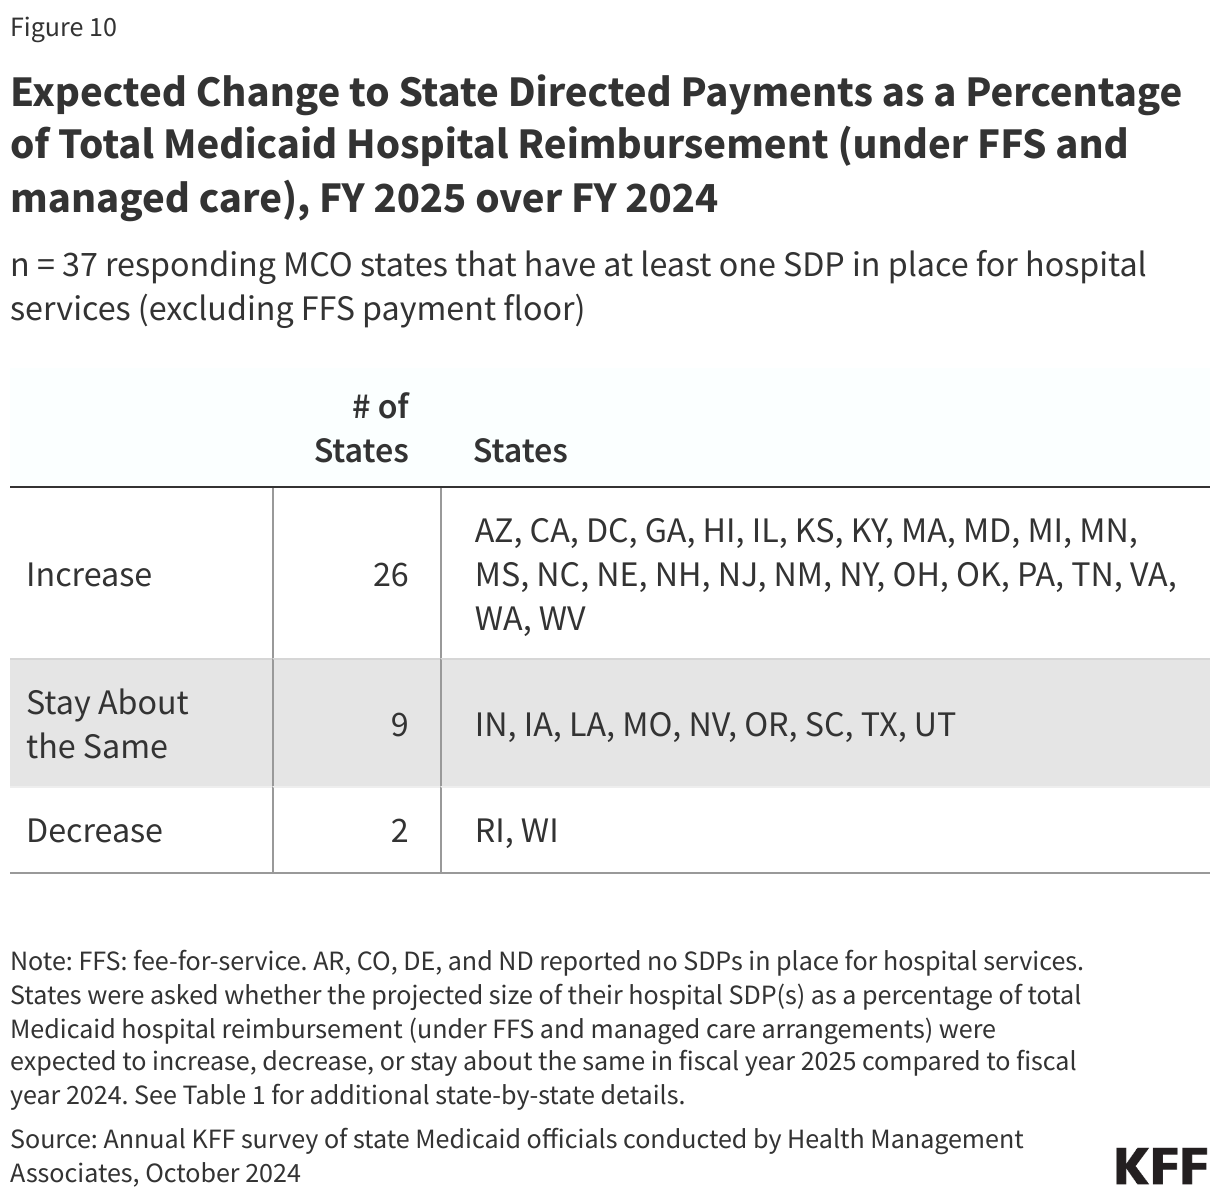
Thirty-seven34  of 41 responding states that contract with MCOs reported an SDP for hospital services (excluding SDPs requiring a FFS payment floor) in place as of July 1, 2024. Only four states that contract with MCOs reported no SDPs in place (Arkansas, Colorado, Delaware, and North Dakota). States reporting a hospital SDP in place were also asked about whether the projected size of their hospital SDP(s) as a percentage of total Medicaid hospital reimbursement (under FFS and managed care arrangements) was expected to increase, decrease, or stay about the same in FY 2025 compared to FY 2024. The vast majority of MCO states (26 of 37) reported that the hospital SDP payments, as a percentage of total Medicaid hospital reimbursement, were projected to increase in FY 2025 (Figure 10 and Table 1). A few states commented on significantly increasing, or plans to significantly increase, hospital SDPs in FY 2024 or 2025, including increases up to the ACR ceiling:

  • The District of Columbia reported seeking CMS approval to increase hospital inpatient and outpatient SDPs up to the ACR ceiling effective in FY 2025.
  • Michigan increased its inpatient hospital SDP by $2.5 billion in FY 2024 (113.64%), with $1.8 billion coming from federal funds.
  • Nebraska is implementing a new hospital SDP in FY 2025 expected to generate approximately $1 billion in federal funds per year.35 
  • Utah reported having SDPs in place targeting 95% of ACR for private hospitals and 100% of ACR for state-owned hospitals in FY 2025.
Expected Change to State Directed Payments as a Percentage of Total Medicaid Hospital Reimbursement (under FFS and managed care), FY 2025 over FY 2024

Nursing Facility Reimbursement – FFS Base Rates and Supplemental Payments

State Medicaid programs typically pay nursing facilities a daily “per diem” rate that is determined by state-specific methodologies that are often cost-based and commonly account for several specified cost categories such as direct care costs (including nursing and other direct care worker wages and benefits), indirect care costs (ancillary costs such as social services, patient activities, medical directorship, and clinical consultants), administration (such as administrative services, food service, housekeeping, maintenance, laundry, and utilities), and capital costs for the physical building.36  Most states also adjust base rates by patient acuity and may also choose to make quality incentive payments and supplemental payments intended to make up the difference between base FFS payments and the amount that Medicare would have paid for the same service. To address workforce shortages in nursing facilities, the recently finalized LTC Facility Staffing rule creates new minimum staffing requirements for nursing facilities with implications for Medicaid nursing facility reimbursement policies and budgets.

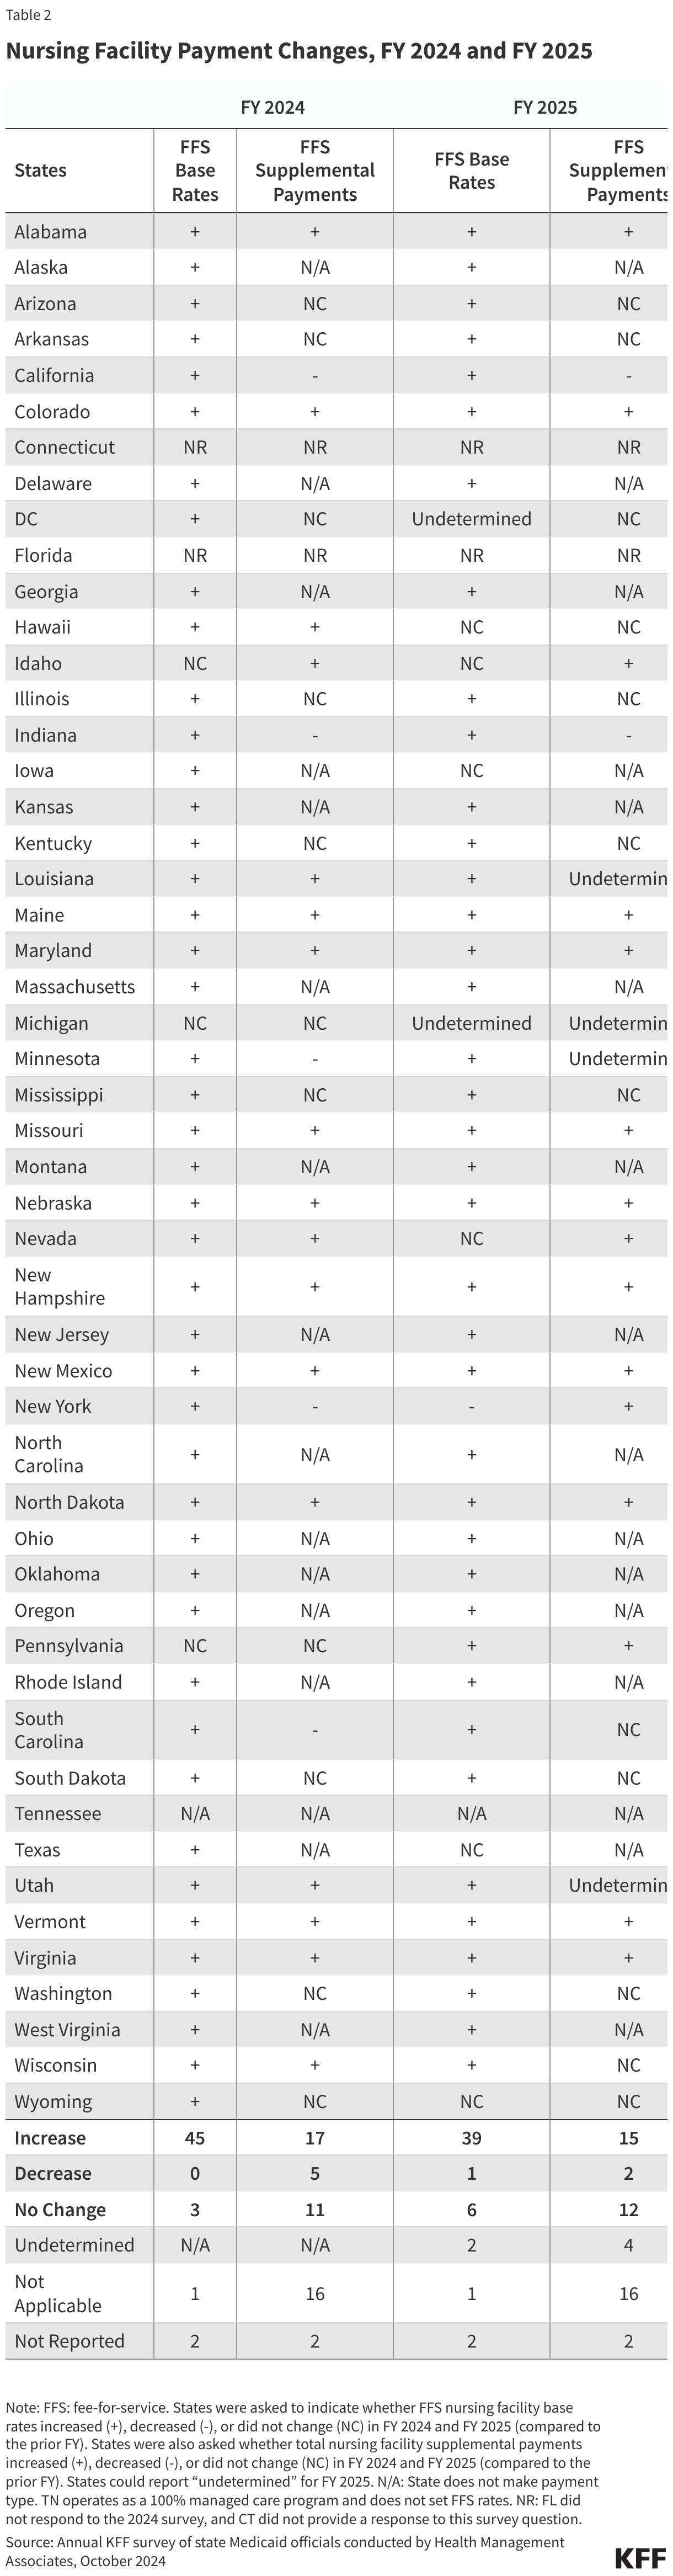
Overall, few responding states (5) reported nursing facility rate decreases (FFS base rates or supplemental payments) in FY 2024 or FY 2025 (Table 2). One of these states (California) attributed its decrease in total nursing facility supplemental payments to utilization shifts from FFS to managed care. Another state (Indiana) reporting a decrease in total nursing facility supplemental payments is implementing an LTSS managed care program in FY 2025.

Most responding states reported increasing nursing facility FFS base rates in both FY 2024 (45 of 49) and FY 2025 (39 of 49) (Table 2). Reflecting the ongoing staffing challenges impacting nursing facility services, several states reported more significant nursing facility base rate increases. Examples include:

  • Iowa reported a 25.49% base rate increase in FY 2024.
  • Montana increased base rates by 8.24% effective July 1, 2024.
  • Nevada reported increased base, pediatric, and ventilator rates by 24.5% in FY 2024.
  • Ohio reported a 17% increase in FY 2024.
  • Rhode Island reported completing a rate review which will result in a 14.5% increase to the direct care, indirect care, and other direct care components of the nursing facility base rates as of October 1, 2024.
  • Texas reported increasing rates by 8-14% across the various Resource Utilization Groups effective September 1, 2023.

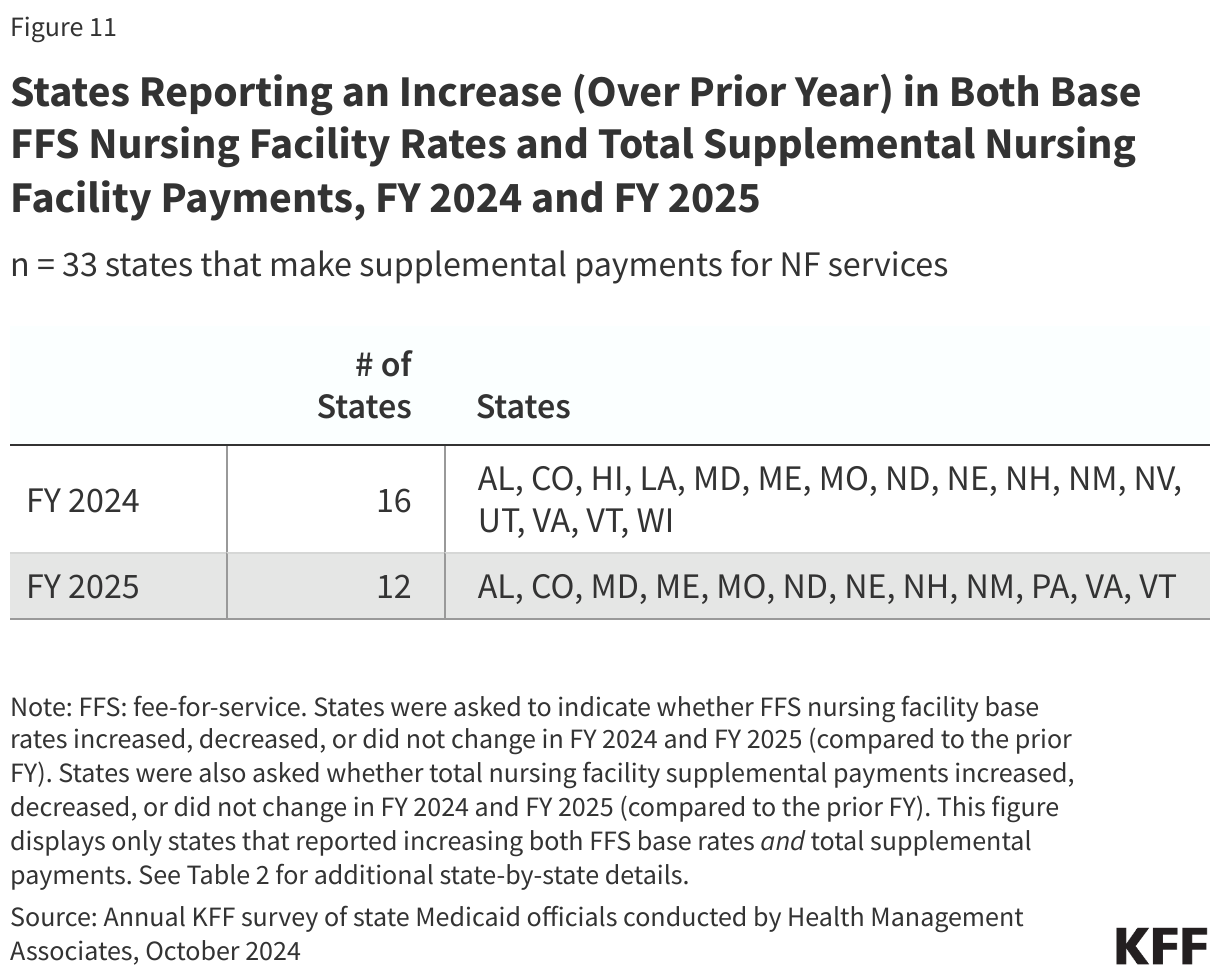
Many states reported increasing both nursing facility FFS base rates and total nursing facility supplemental payments in both FY 2024 and FY 2025 (Figure 11). About two-thirds of responding states (33 of 49) made supplemental payments for nursing facility services for both FY 2024 and FY 2025 (Table 2). Of these 33 states, nearly half (16 states) in FY 2024 and over one-third (12 states) in FY 2025 planned to increase both FFS base rates and supplemental payments.

States Reporting an Increase (Over Prior Year) in Both Base FFS Nursing Facility Rates and Total Supplemental Nursing Facility Payments, FY 2024 and FY 2025

FFS Reimbursement Rates for Other Provider Types

In addition to nursing facility and hospital rates, this year’s survey asked states to report FFS rate changes in FY 2024 and FY 2025 for the following provider types: primary care providers, OB/GYNs, outpatient behavioral health (BH) clinicians, home health, dentists, lay professionals, home and community-based services (HCBS) providers, and providers of non-emergency medical transportation (NEMT).

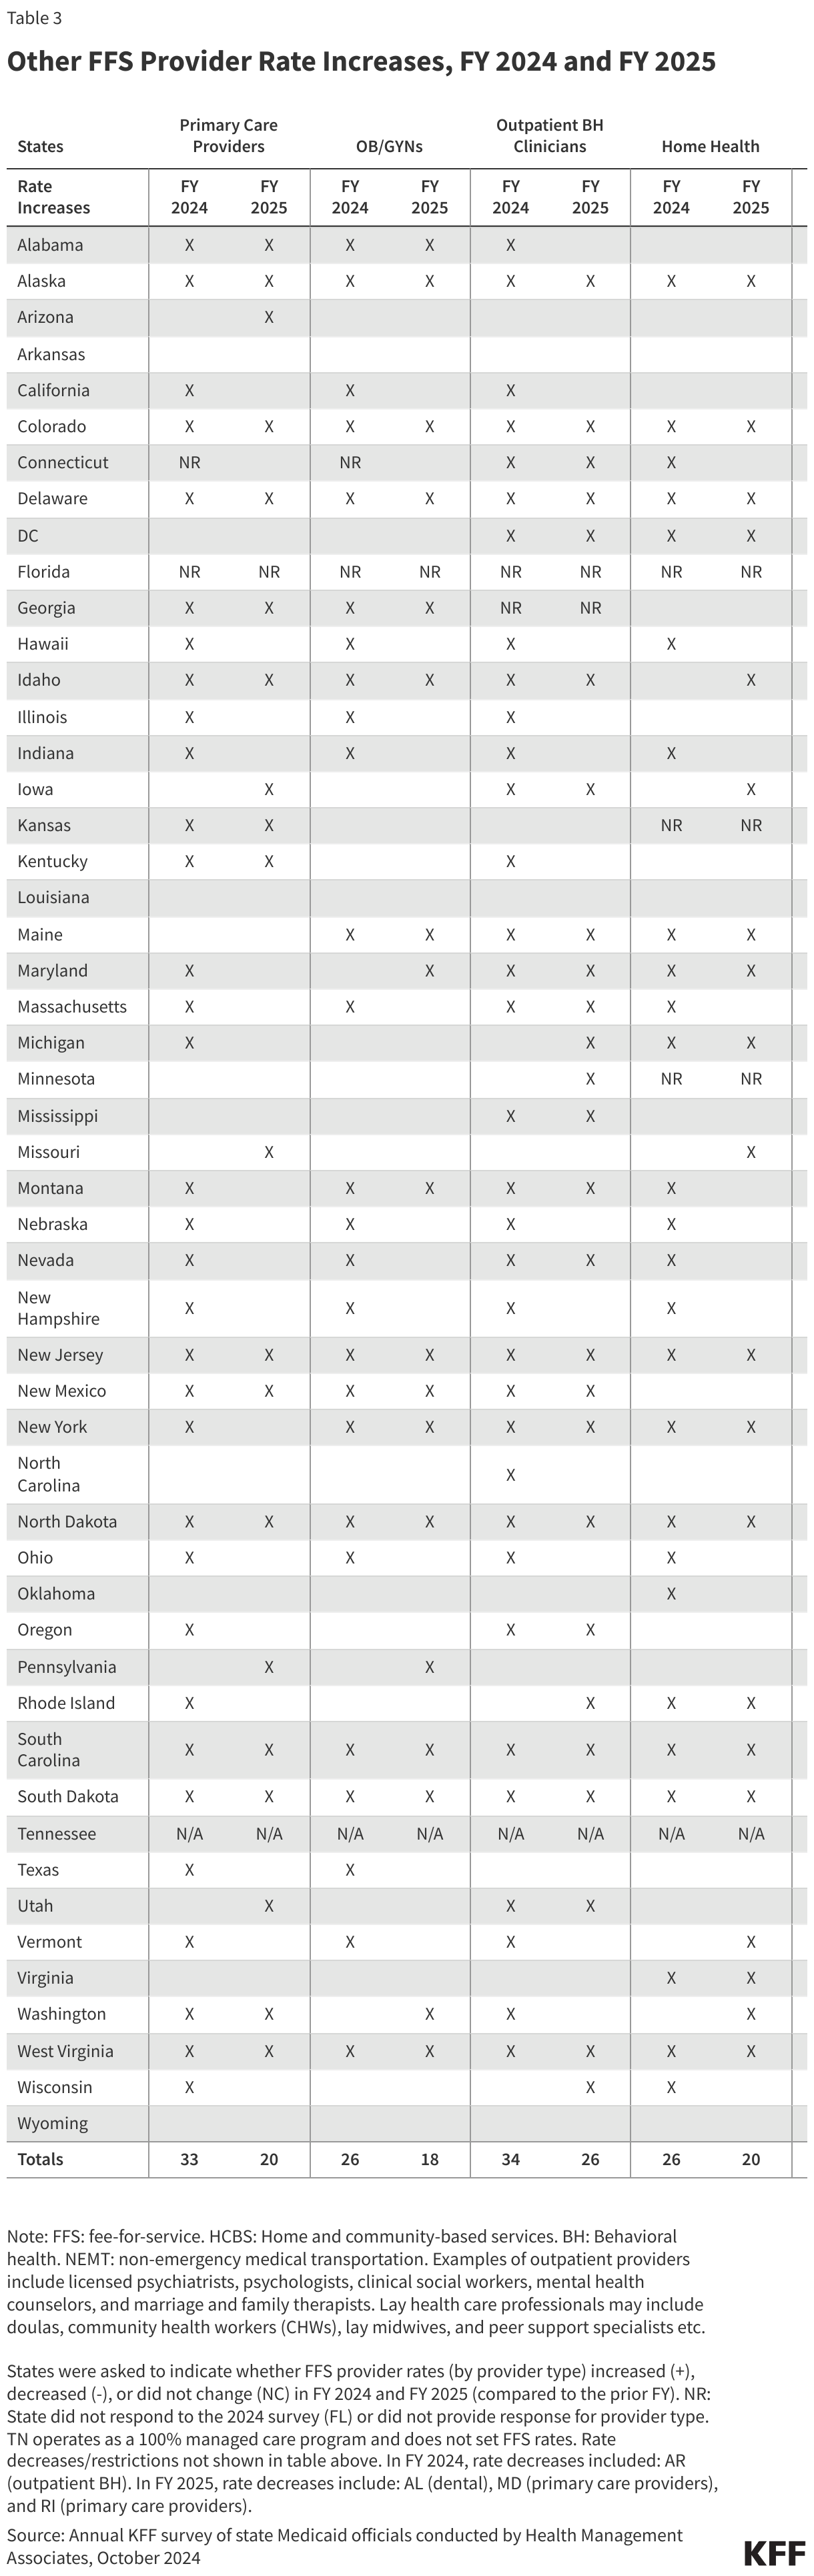
At the time of the survey, responding states had implemented or were planning more FFS rate increases than rate restrictions in both FY 2024 and FY 2025 (Figure 12 and Table 3).37 ,38  Forty-eight states in FY 2024 and 44 states in FY 2025 reported implementing FFS rate increases for at least one (non-hospital, non-nursing facility) provider category. Only one state in FY 2024 and three in FY 2025 implemented or were planning to implement at least one rate restriction.

FFS Provider Rate Increases in FY 2024 and Adopted for FY 2025

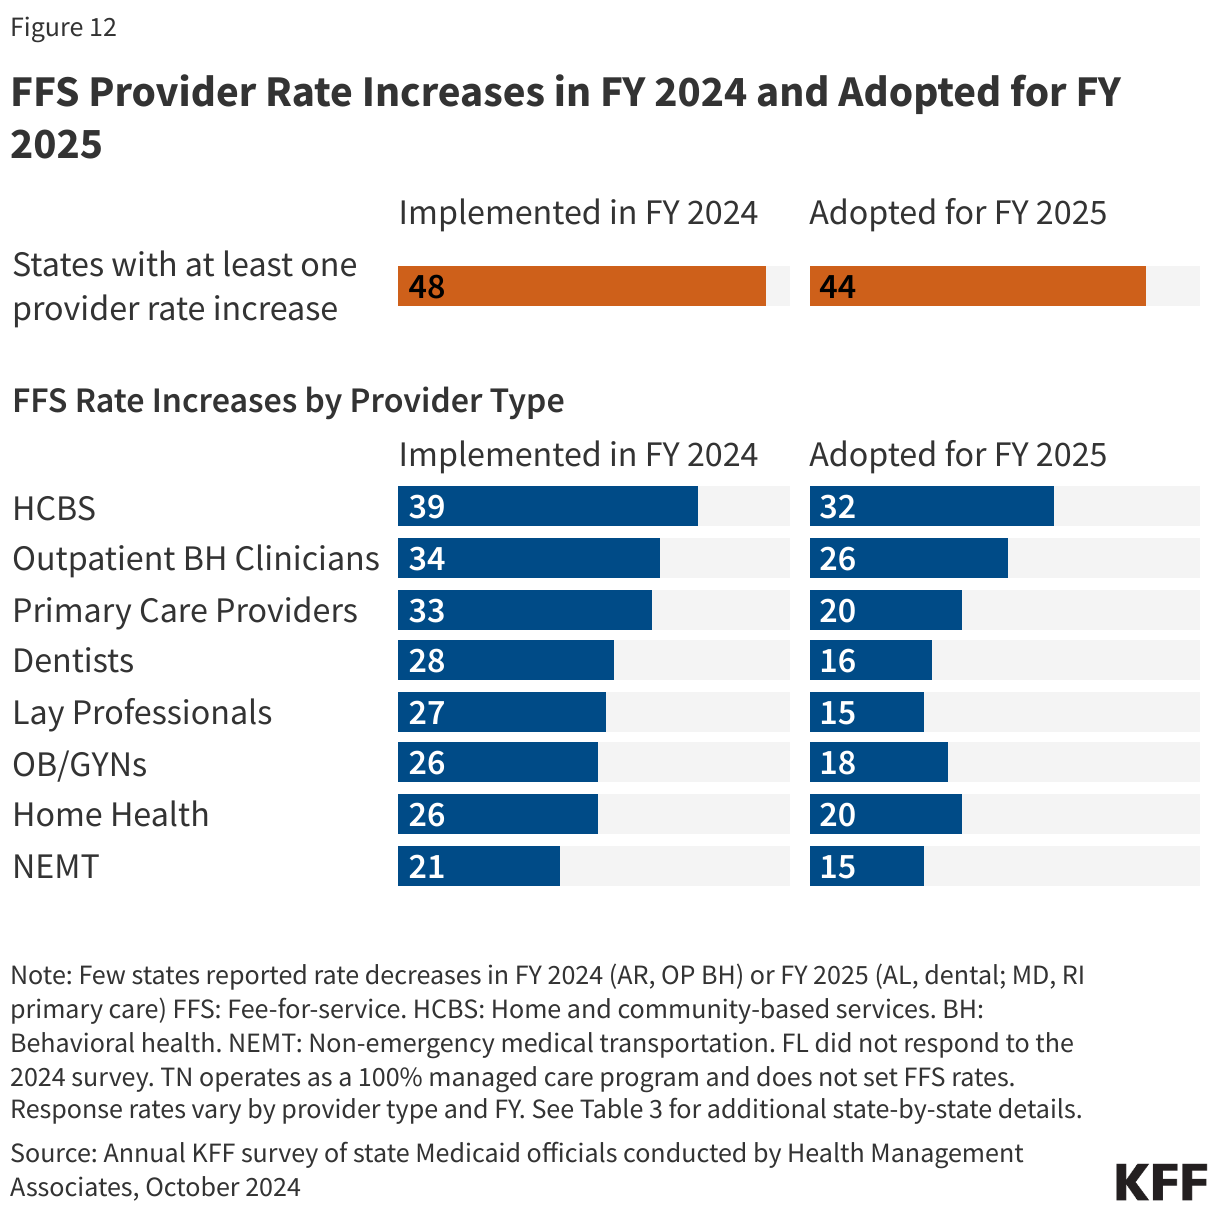
States reported rate increases for HCBS providers more often than for other provider categories (Figure 12). Between April 1, 2021 and March 31, 2022, states received an additional 10 percent in federal matching funds for HCBS spending, funded through the American Rescue Plan Act (ARPA). States were required to reinvest the additional federal funding in Medicaid HCBS, resulting in an estimated $37 billion of new HCBS funding. As of the end of 2023, the largest use of funds was for workforce recruitment and retention, often through payment rate increases or retention bonuses for HCBS workers. The ARPA funding will end in most states by March 2025 (though some states have received extensions into 2026). In this year’s survey, most states reported increasing HCBS rates in both FY 2024 (39 states) and FY 2025 (32 states). One state (Wyoming) commented that it planned to continue enhanced ARPA-funded rates in both FY 2024 and FY 2025 and was also planning to seek permanent funding from its legislature to continue the enhanced rates beyond the expiration of ARPA HCBS funding. Examples of other HCBS rate increases reported include the following:

  • California and the District of Columbia reported HCBS rate increases in both FY 2024 and FY 2025 to account for increases in California’s statewide minimum wage and the District of Columbia’s living wage. Over 6,000 California HCBS providers also received retention payments in FY 2024.
  • Connecticut enacted several HCBS rate increases including a 12.5% increase to home-delivered meals and 8.6% increase to adult day services for individuals enrolled in the State’s 1915(i) waiver.
  • Kentucky implemented a legislatively mandated 10% rate increase for HCBS providers in FY 2024 and will study HCBS rates in FY 2025.
  • Mississippi increased all HCBS rates by 4% in FY 2024.
  • Texas enacted legislation in 2023 to increase personal care attendant rates in FY 2024 from $8.11 to $10.60, a 30% increase.

Thirty-three states reported increasing primary care provider rates in FY 2024 and 20 states reported plans to do so in FY 2025. States reporting notable primary care rate increases for FY 2024 or FY 2025 include Kansas (9% in FY 2025), Michigan (7.5% in FY 2024), Ohio (6% in FY 2024), and South Dakota (5% in FY 2024). Other states reported benchmarking to Medicare rates, for example, 87.5% of Medicare in California and 70% of Medicare (if rates were lower) in Illinois.

This year’s survey found a continued focus on improving dental rates with 28 states implementing a dental rate increase in FY 2024. Sixteen states also reported planned increases to dental rates in FY 2025. States reporting notable dental rate increases for FY 2024 or FY 2025 include Ohio (93% increase on average per procedure in FY 2024), Wyoming (25% increase in FY 2025), Nebraska (12.5% increase in FY 2025), Vermont (raising rates to 75% of regional commercial rates in FY 2024), and Missouri (increases in FY 2025 to cover a larger percentage of usual and customary rates).

Thirty-four states implemented FFS rate increases for one or more outpatient behavioral health providers in FY 2024 and 26 states plan to do so in FY 2025. Examples of outpatient providers include licensed psychiatrists, psychologists, clinical social workers, mental health counselors, and marriage and family therapists. Examples of rate increases reported for FY 2024 or FY 2025 include:

  • Mississippi will increase behavioral health codes by 15% over the course of FY 2024 and FY 2025 for those services billed using the Healthcare Common Procedure Coding System (HCPCS) codes.
  • Montana conducted a BH provider reimbursement rate study, resulting in rate increases (which vary by service) in FY 2024 and FY 2025, bringing rates closer to identified benchmarks.
  • New Mexico increased behavioral health service rates to a minimum of 120% of the 2023 Medicare fee schedule in FY 2024.
  • South Dakota increased rates for Community Mental Health Centers (CMHCs) and substance use disorder (SUD) services by 16% in FY 2024.
  • Washington increased developmental screening codes by 100% and implemented varied rate increases for mental and behavioral health services ranging from 7% to 22% in FY 2024. 

In FY 2024, 27 states that reimburse services provided by lay professionals on a FFS basis implemented rate increases for one or more lay professionals and 15 states plan to do so in FY 2025. Lay health care professionals, such as doulas, community health workers (CHWs), lay midwives, and peer support specialists, are frontline health workers with a deep understanding of the communities they serve. Typically, they have received some training and may be certified in some cases but are not licensed clinicians. Many state Medicaid programs have chosen to reimburse services provided by one or more types of lay professionals to help reduce health disparities, support other health care providers, and improve health outcomes. Many states reporting rate increases for lay professionals did not specify the type of lay professional impacted by the increase(s), but those that did frequently identified doulas and CHWs. A number of states noted the recent addition of doula coverage including the District of Columbia, Massachusetts, Michigan, New Hampshire, Oklahoma, Pennsylvania, and Washington.

In FY 2024, 21 states that set FFS NEMT rates implemented FFS rate increases and 15 states plan to do so in FY 2025. State Medicaid programs are required to provide non-emergency medical transportation (NEMT) for enrollees who have no other means of transportation to access medically necessary health care services. NEMT is provided in several ways. States may reimburse transportation providers directly on a FFS basis, outsource the service on a FFS or capitated basis to a “transportation broker” (which could be a private vendor or a local or county governmental entity); or carve the benefit into an MCO contract.39  Two states reported particularly notable FFS rate increases: Illinois reported an average statewide increase of 40% for NEMT rates in FY 2024 and Ohio implemented a 79% increase for certain NEMT services that are not county-administered.

Payment Rate Transparency

The recently finalized Access rule rescinds regulations that previously required states to produce and submit to CMS at least once every three years Access Monitoring Review Plans (AMRPs) that analyzed the sufficiency of access to care. Instead, the Access Rule has replaced the AMRP requirement with a more streamlined and standardized process that in part requires states to compare FFS payment rates for rates for primary care, OB/GYN, and outpatient mental health and substance use disorder (SUD) services to Medicare rates at least every two years, with the first analysis published by July 1, 2026. The recently finalized Managed Care rule requires a similar payment analysis annually. This year’s survey asked states whether they have conducted comparative rate analyses of FFS Medicaid payment rates within the last two years.

FFS Analysis

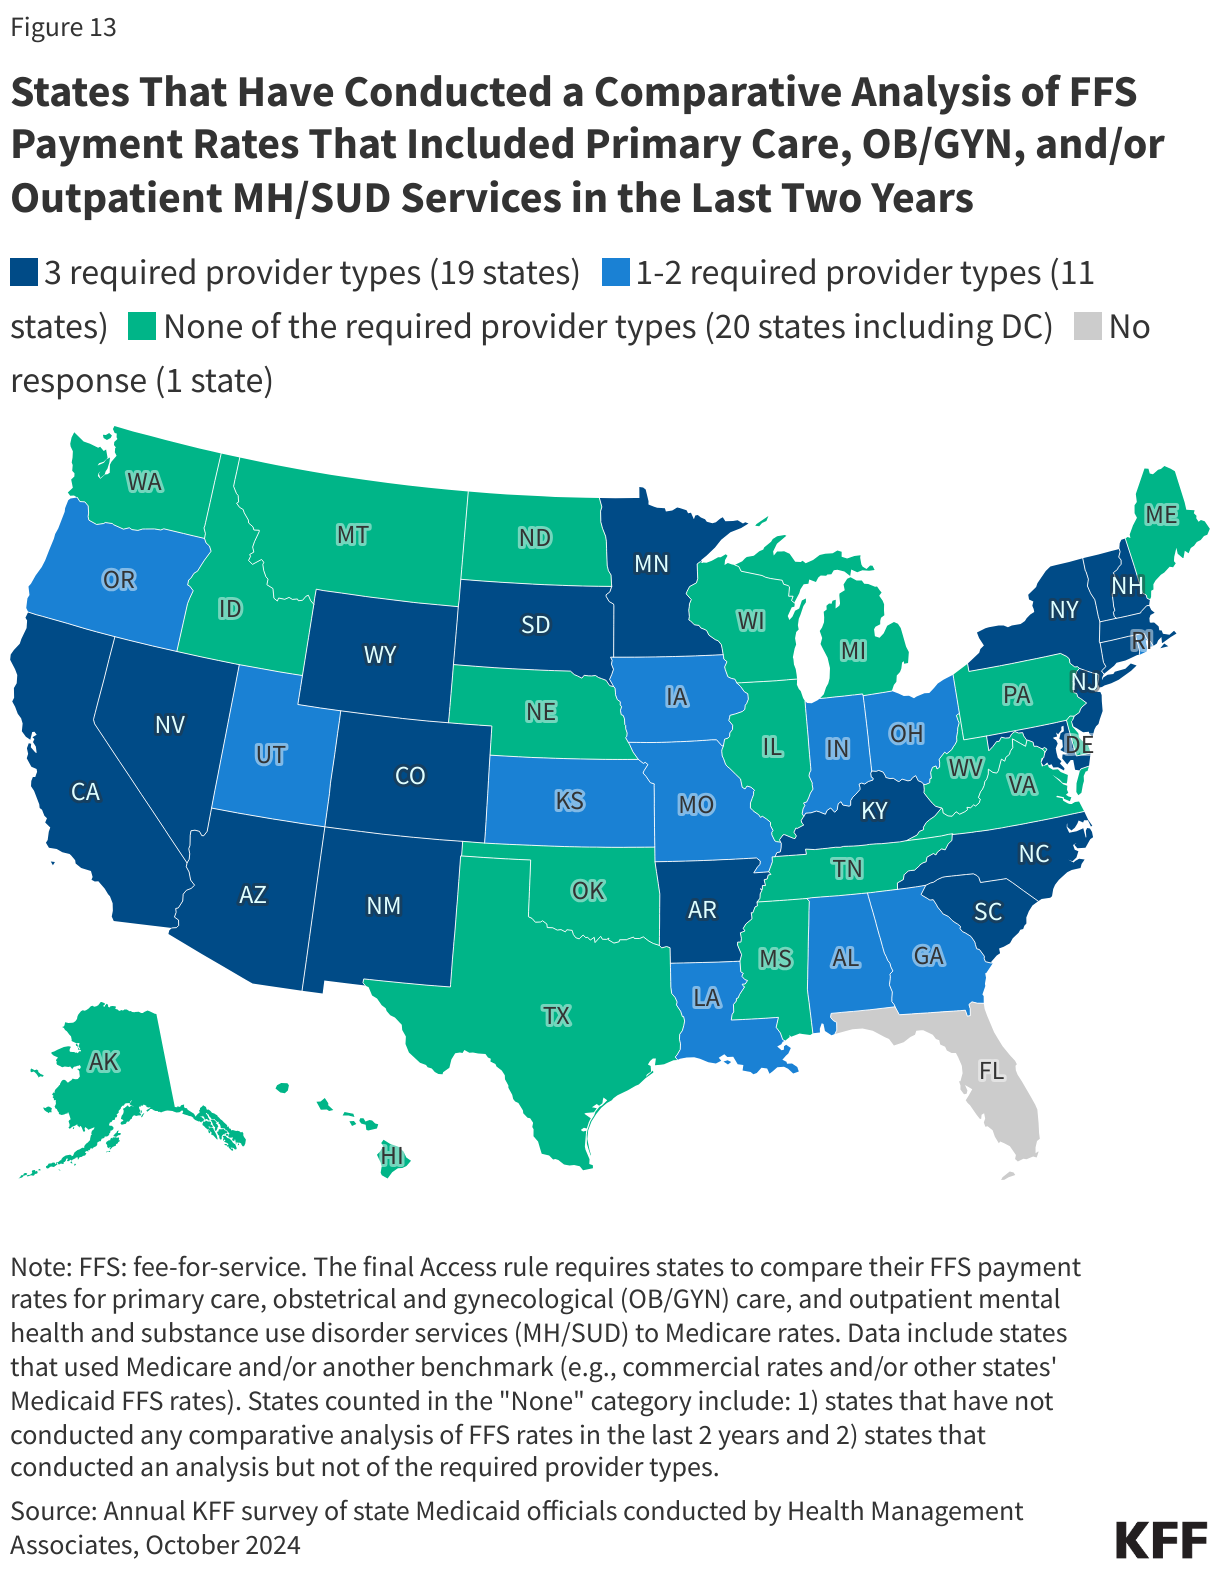
More than one-third of responding states (19 of 50) reported conducting a comparative rate analysis of FFS Medicaid payment rates that included primary care, OB/GYN, and outpatient MH/SUD services within the last two years (Figure 13). An additional eleven states reported conducting an analysis including one or two of the required provider types, while 20 states reported that they had not conducted an analysis of any of the three required provider types. Of the 30 states that had conducted a FFS comparative rate analysis (for at least one “required” provider type), over half benchmarked their FFS rates to Medicare rates. Several states reported benchmarking to a combination of Medicare and another benchmark (e.g., commercial rates and/or other states’ FFS rates). Many states also reported including other physician specialists and dental providers in their analyses. In addition to the various benchmarks used, there may be other methods states used for their comparative rate analyses that differ from those required in the final Access rule.

States That Have Conducted a Comparative Analysis of FFS Payment Rates That Included Primary Care, OB/GYN, and/or Outpatient MH/SUD Services in the Last Two Years

Provider Taxes

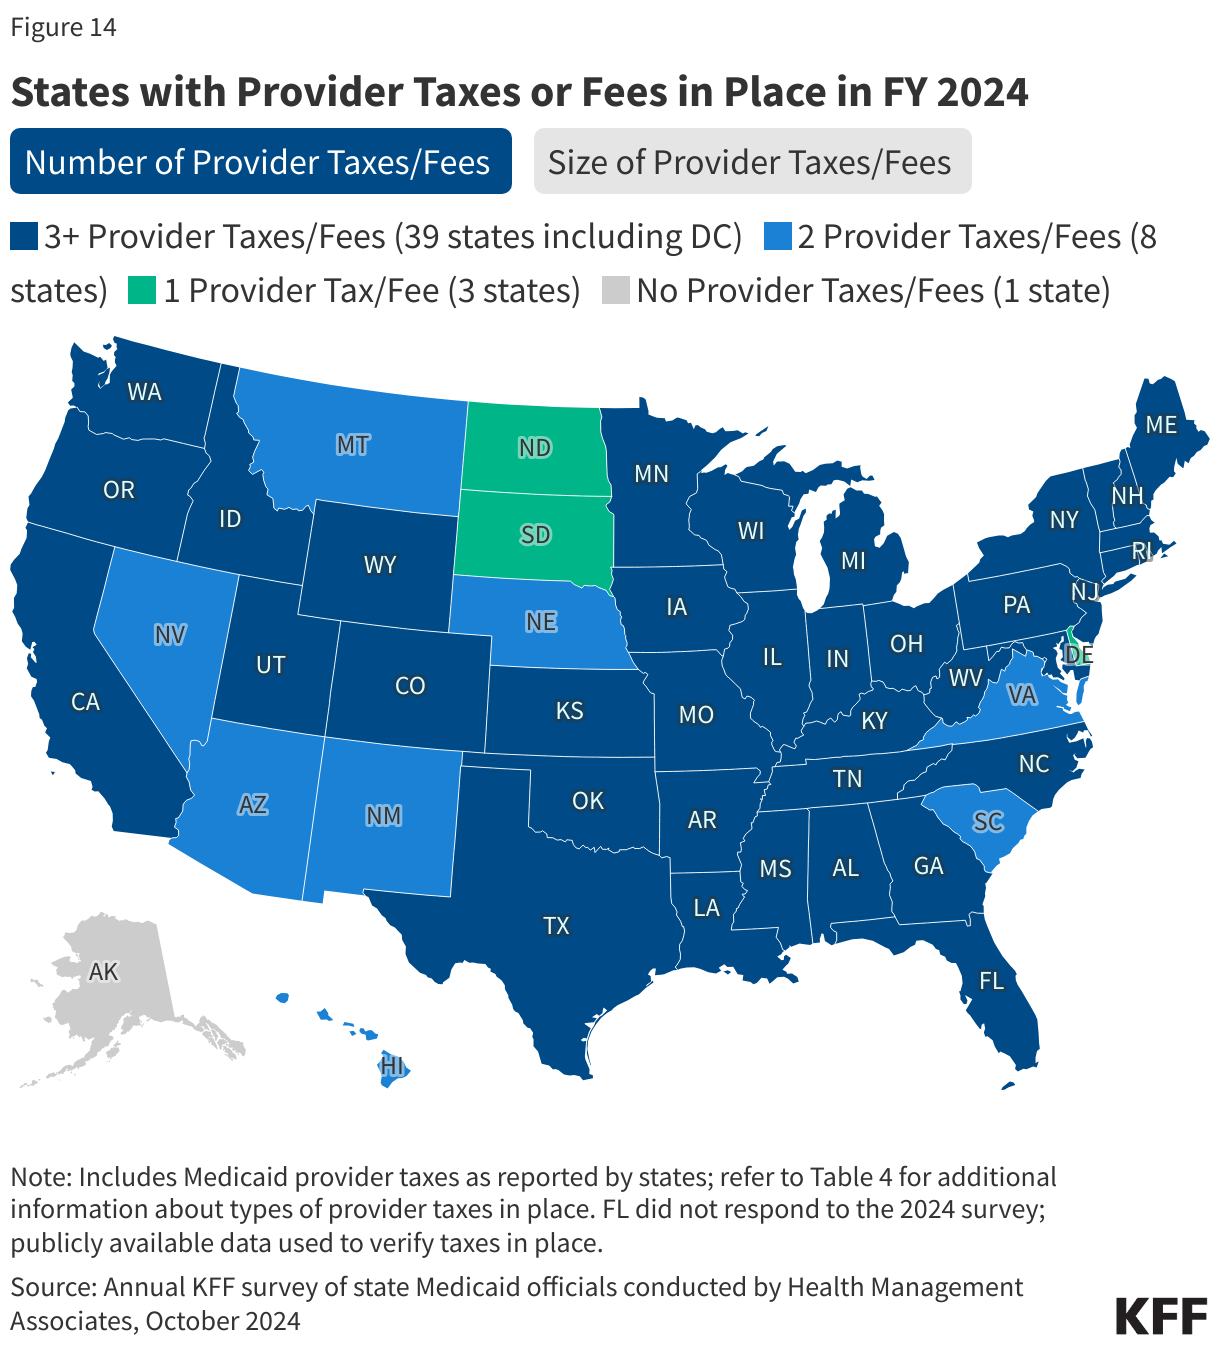
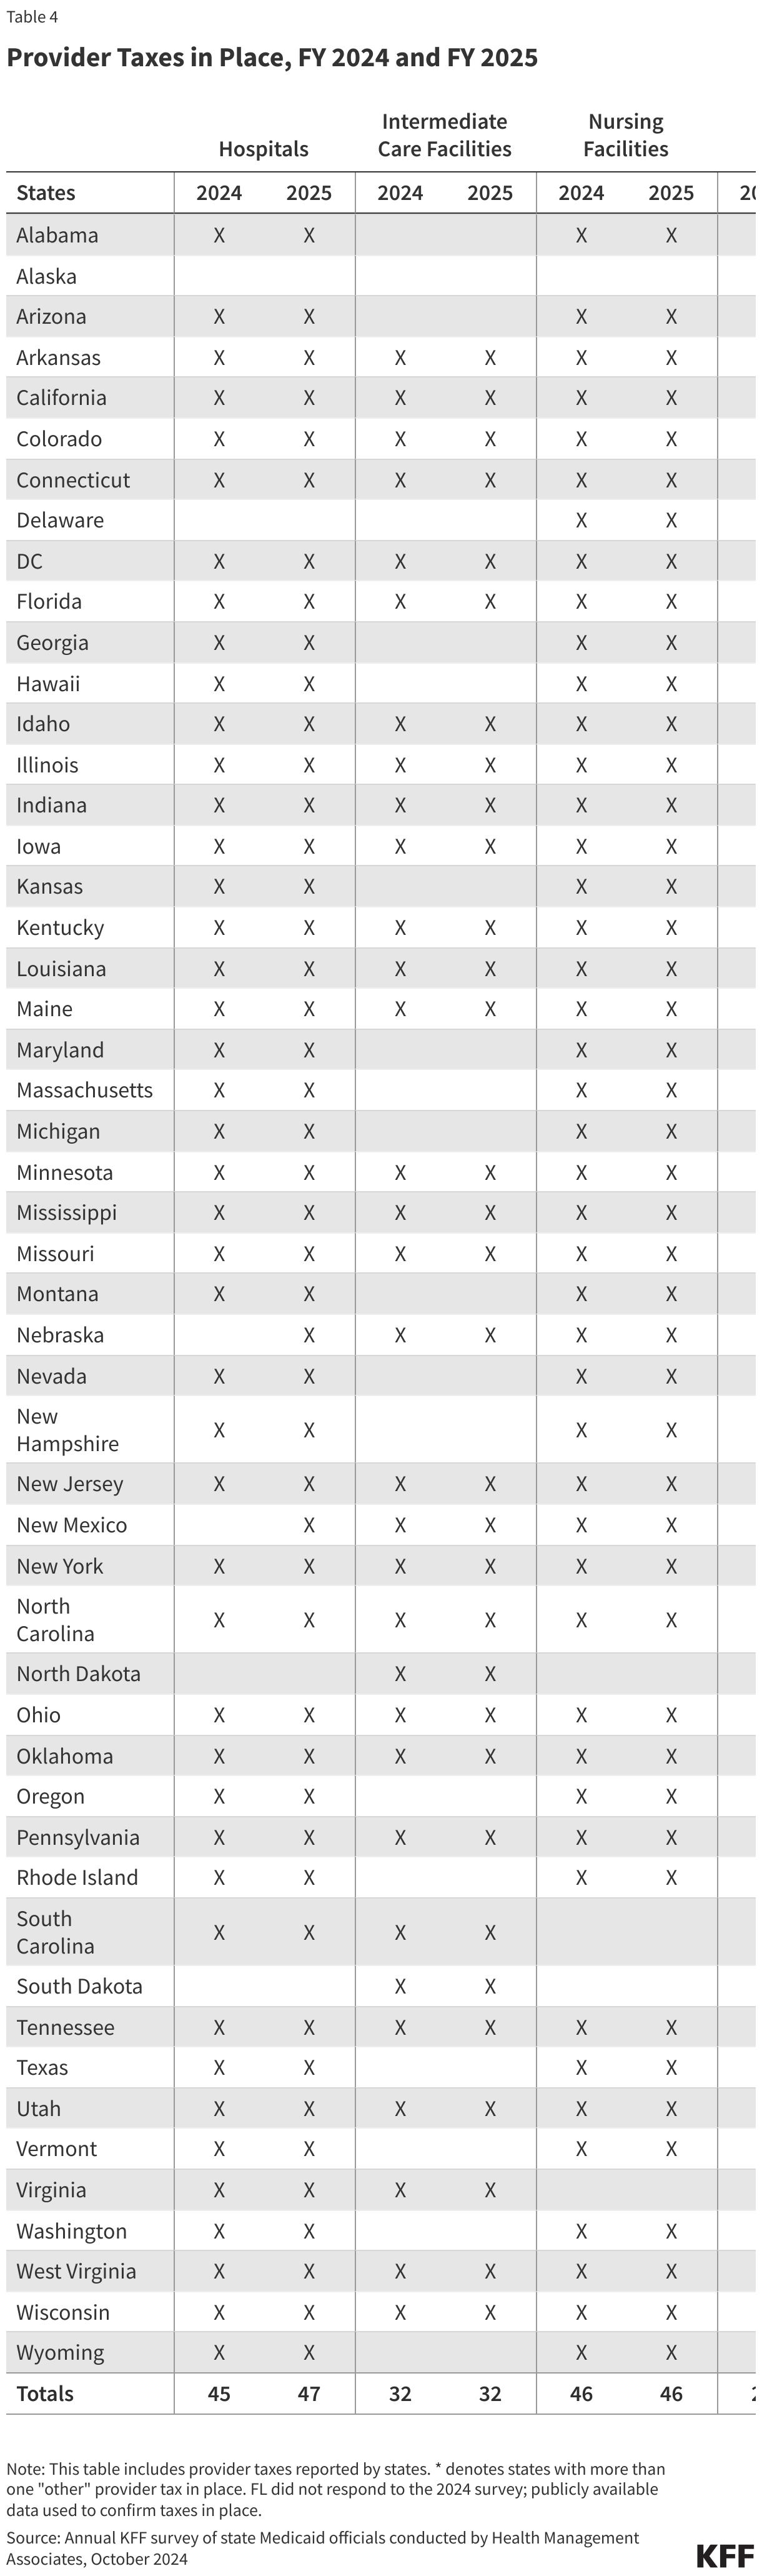
States continue to rely on provider taxes and fees to fund a portion of the non-federal share of Medicaid costs. Provider taxes are an integral source of Medicaid financing, comprising approximately 17% of the non-federal share of total Medicaid payments in FY 2018 according to the U.S. Government Accountability Office (GAO).40  At the beginning of FY 2003, 21 states had at least one provider tax in place. By FY 2013, all but one state (Alaska) had at least one provider tax or fee in place. In this year’s survey, states reported a continued reliance on provider taxes and fees to fund a portion of the non-federal share of Medicaid costs. In FY 2024, 39 states had three or more provider taxes in place, eight states had two provider taxes in place, and three states had one provider tax in place (Figure 14).41  As of July 1, 2024, 38 responding states reported at least one provider tax that is above 5.5% of net patient revenues, which is close to the maximum federal safe harbor or allowable threshold of 6%. Federal action to lower that threshold or eliminate provider taxes, as has been proposed in the past, would therefore have financial implications for many states.

States with Provider Taxes or Fees in Place in FY 2024

Few states made or are making significant changes to their provider tax structure in FY 2024 or FY 2025 (Table 4). The most common Medicaid provider taxes in place in FY 2024 were taxes on nursing facilities (46 states) and hospitals (45 states), intermediate care facilities for individuals with intellectual disabilities (32 states), MCOs42  (20 states), and ambulance providers (17 states). Seven states reported plans to add new taxes in FY 2025 (Nebraska and New Mexico adding a hospital tax, Massachusetts and New York adding a managed care tax, and Oregon, South Carolina, and Wyoming adding an ambulance tax). Maine will eliminate both a critical access hospital tax and a service provider tax (on certain community support services providers) in FY 2025. Twenty-three states reported planned increases to one or more provider taxes in FY 2025. Missouri was the only state planning tax decreases in FY 2025, reporting planned decreases in two of its taxes.43 

Hospital Payment Changes, FY 2024 and FY 2025
Nursing Facility Payment Changes, FY 2024 and FY 2025
Other FFS Provider Rate Increases, FY 2024 and FY 2025
Provider Taxes in Place, FY 2024 and FY 2025

Benefits

Context

Scope of Medicaid Benefits. State Medicaid programs must cover a comprehensive set of “mandatory” benefits, including items and services typically excluded from traditional insurance such as non-emergency medical transportation and long-term care. States may additionally cover a broad range of optional benefits defined in statute or permissible under other authorities such as Section 1115 waivers. In recent years, many state Medicaid programs have expanded their coverage of behavioral health, maternity, and dental services. States are also using Medicaid benefits to address social determinants of health (SDOH) and associated health-related social needs (HRSN) (e.g., housing, nutrition).

States may apply reasonable service limits based on medical necessity or to control utilization, but once covered, services must be “sufficient in amount, duration and scope to reasonably achieve their purpose.”44 ,45  There are additional benefit protections under federal statute for children and youth up to age 21.46  The Early and Periodic Screening, Diagnostic, and Treatment (EPSDT) benefit ensures access to any medically necessary service identified in federal Medicaid statute without limitation, including optional services the state otherwise does not cover. CMS recently released updated guidance for states reinforcing EPSDT requirements and outlining strategies and best practices to strengthen children’s access and the delivery of health care services under the EPSDT benefit.

The ability to cover optional benefits and place limits on items and services results in variation across states. State Medicaid benefit design is also impacted by prevailing economic conditions: states are more likely to adopt restrictions or limit benefits during downturns and expand or restore benefits as conditions improve. States used additional federal funds and Medicaid emergency authorities made available during the COVID-19 public health emergency (PHE) to maintain or even enhance access to needed services. This year, benefit expansions far outweigh benefit restrictions and limitations, consistent with prior years. New and enhanced benefits continue to advance state priorities by expanding access to a continuum of behavioral health services, supporting improved maternal and infant health, and addressing SDOH. In some states, new benefits may be targeted to specific populations or eligibility groups, such as justice-involved individuals, at risk youth, and individuals experiencing homelessness.

This section provides information about:

  • Benefit changes
  • Medicaid financing of the 988 Suicide & Crisis Lifeline
  • Coverage of community violence intervention or prevention services

Findings

Benefit Changes

States were asked about benefit changes implemented during FY 2024 or planned for FY 2025, excluding eligibility expansions, telehealth policy changes, and changes made to comply with federal requirements. Benefit changes may be planned at the direction of state legislatures and may require CMS approval.

Benefit Changes Reported by States, FYs 2011 - 2025

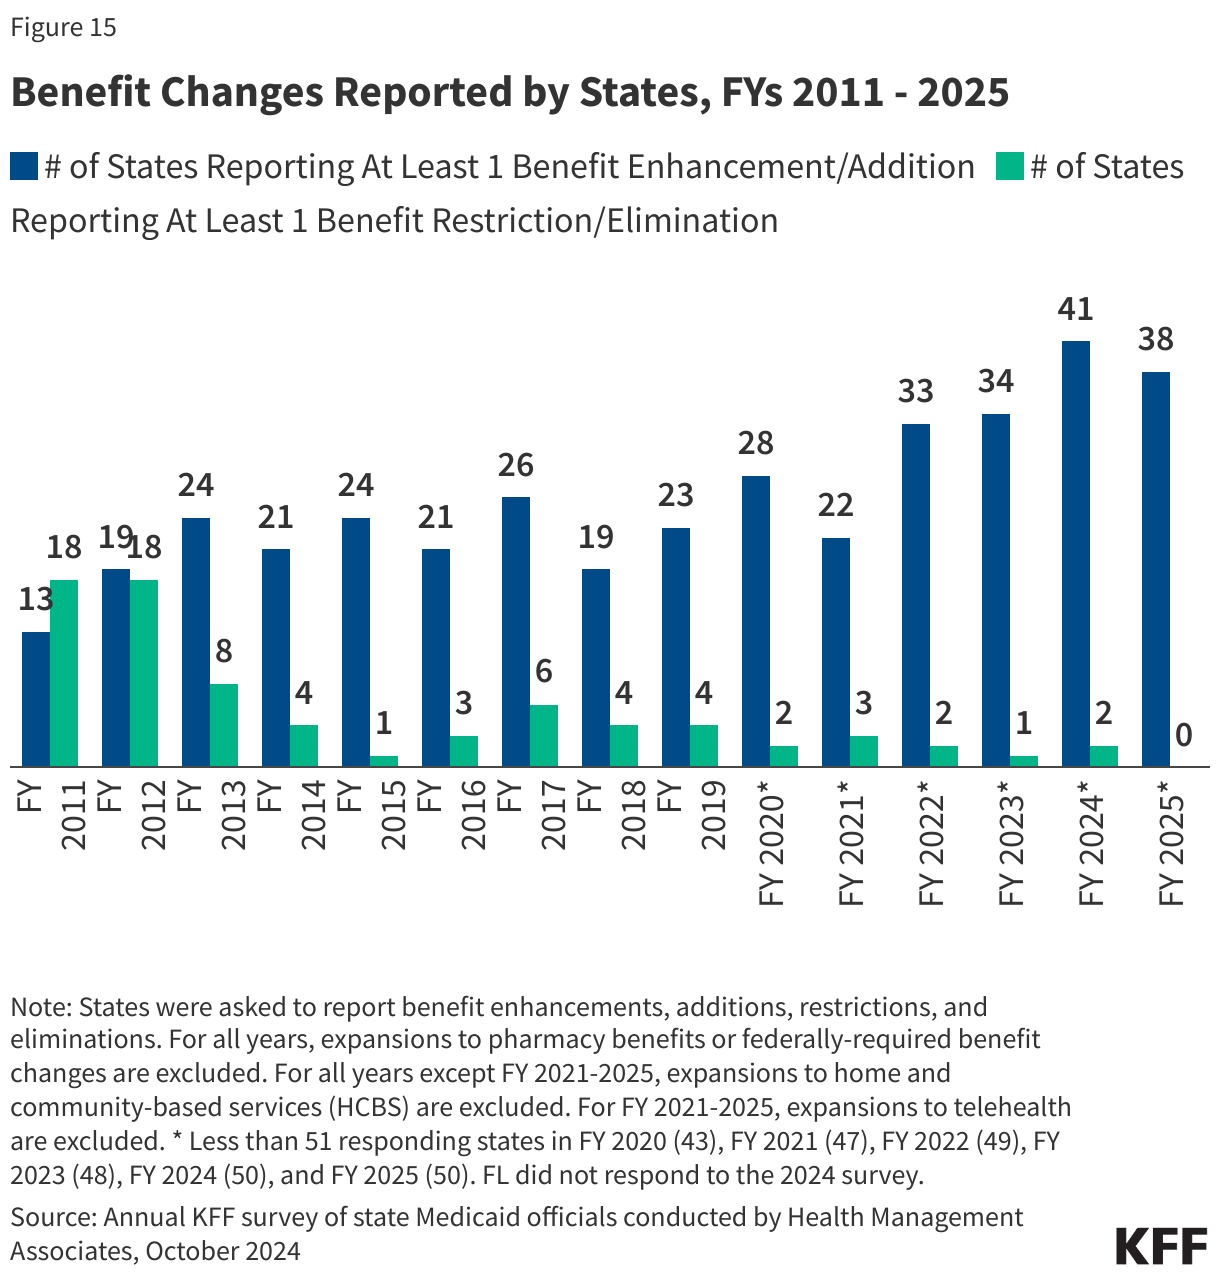
The number of states reporting new benefits and benefit enhancements continues to greatly outpace the number of states reporting benefit cuts and limitations (Figure 15 and Table 5). Forty-one states reported new or enhanced benefits in FY 2024, and 38 states reported plans to add or enhance benefits in FY 2025.47  Only two states (Nevada and Texas) reported eliminating or restricting benefits, both states taking action in FY 2024. There are additional details about benefit enhancements or additions in select benefit categories below (Figure 16).

Select Categories of Benefit Enhancements or Additions,  FYs 2024 - 2025

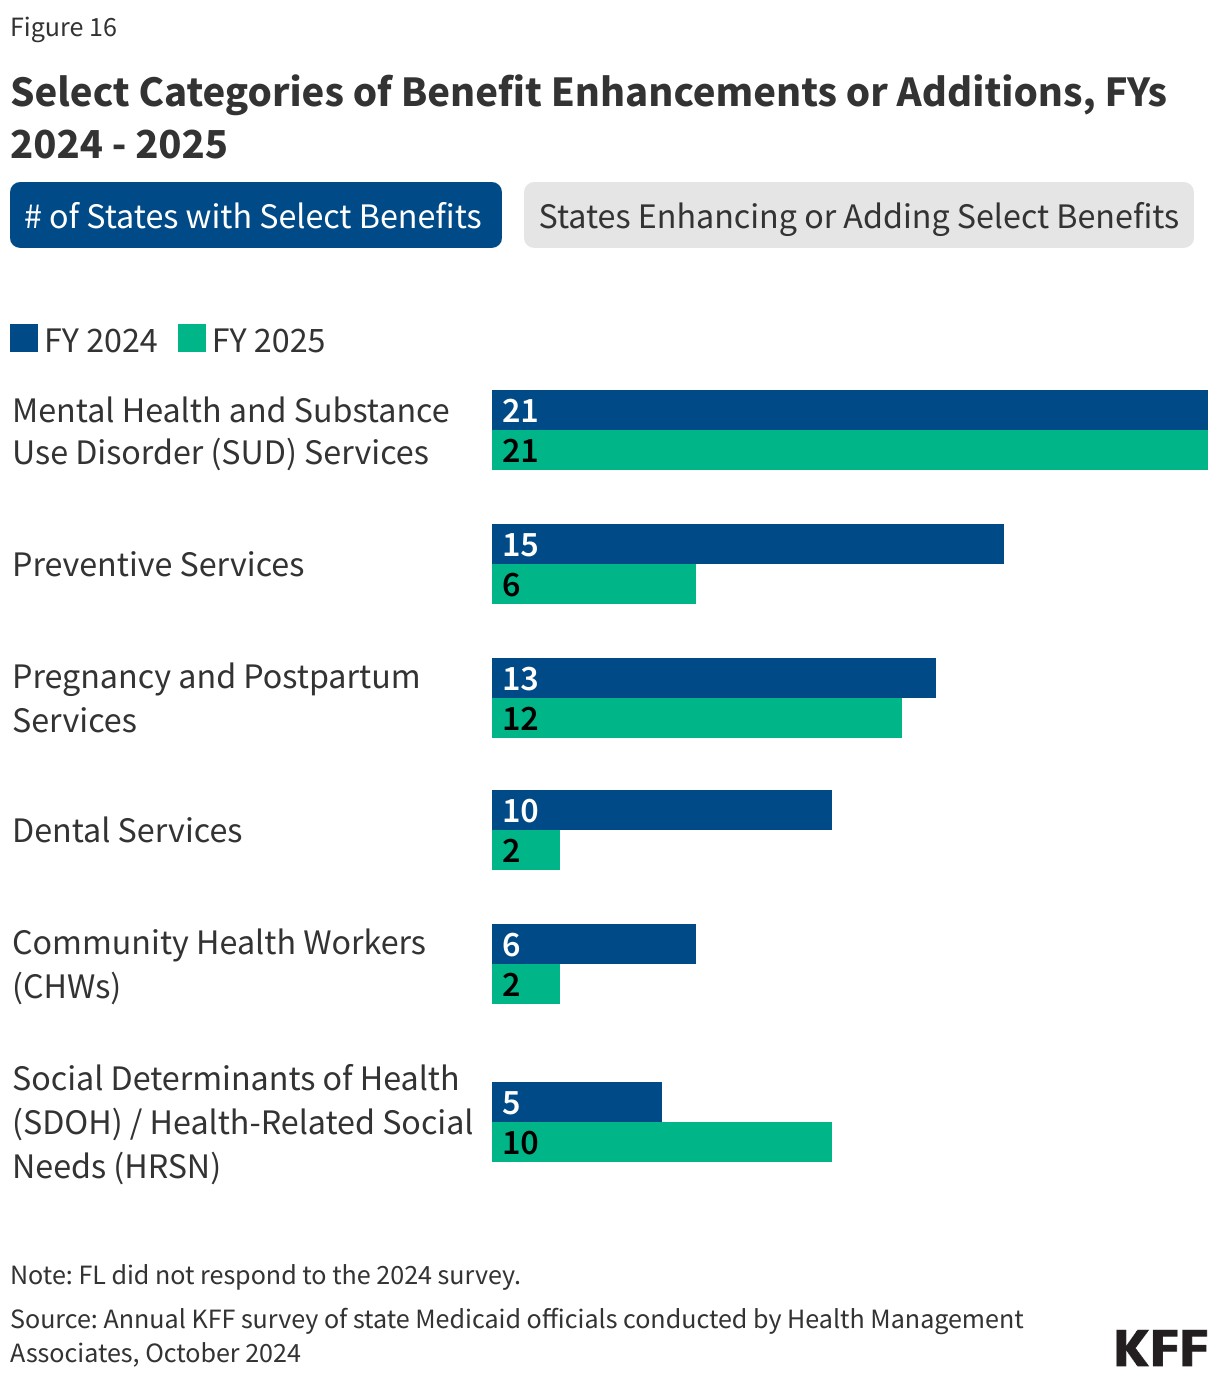
Behavioral Health Services. Behavioral health services are not a specifically defined category of Medicaid benefits. Some fall under mandatory Medicaid benefit categories (e.g., physician services). States may also cover behavioral health services through optional benefit categories (e.g., rehabilitative services). Behavioral health services for children are particularly comprehensive due to Medicaid’s EPSDT benefit for children. Mental health and substance use disorder (SUD) services continue to be one of the most frequently reported categories of benefit expansions. Consistent with trends in recent years, states reported expanding services across the behavioral health care continuum. For FY 2024 and 2025, in conjunction with the ongoing implementation of the 988 Suicide and Crisis Lifeline, there was a particular focus on enhancing crisis services and expanding the availability of other services at home and in the community. States also continue to invest in more coordinated and integrated physical and behavioral health care, including reimbursement for interprofessional consultation, adding coverage for services provided under the Collaborative Care Model (CoCM), and implementing or expanding Certified Community Behavioral Health Clinics (CCBHCs).48 

  • Crisis Services. At least eleven states49  reported benefit actions related to the addition or expansion of crisis services, including seven states (Louisiana, Maine, Maryland, Montana, Nebraska, New Mexico, and West Virgina) enhancing their mobile crisis response and three states (Connecticut, Louisiana, and Nebraska) adding or expanding crisis services for youth. For example, Connecticut opened and added coverage of services in Children’s Urgent Crisis Centers for children and youth experiencing a behavioral health crisis in FY 2024.
  • Contingency Management. Contingency management is an evidence-based psychosocial therapy that uses incentives to motivate and reinforce behavior changes that promote recovery from stimulant use disorder and other SUDs.50  Delaware reported recent approval under a Section 1115 waiver of a 24-week contingency management program for individuals with stimulant use disorder and a 64-week program for pregnant and postpartum individuals with opioid use disorder.51  Three additional states (California, Montana, and Washington)52  have already implemented and/or received CMS approval to implement a contingency management program and at least four states (Hawaii, Michigan, Rhode Island, and West Virginia)53  have requests pending. For example, West Virginia reported a pending Section 1115 waiver request enhancing covered SUD services, including expanded peer supports, expanded secure withdrawal management and stabilization services, the addition of recovery housing and contingency management services, and implementation of quick response teams for SUD emergencies.54 
  • Physical and Behavioral Health Integration. Four states (District of Columbia, Maryland, Nevada and South Carolina) reported benefit actions related to Medicaid coverage of the Collaborative Care Model (CoCM), an evidence-based model integrating behavioral health into primary care through collaborative care teams that include a case manager and a psychiatric consultant. Five states (Colorado, District of Columbia, New York, Pennsylvania, and South Carolina) added reimbursement of interprofessional consultation codes, following 2023 guidance from CMS reducing barriers to payment for the consulting provider and acknowledging the important role interprofessional consultation plays in improving access to behavioral health services.

Pregnancy and Postpartum Services. Medicaid covers more than 4 in 10 births nationally and the majority of births in many states. To help reduce maternal morbidity and mortality, as well as address disparities in maternal and infant health outcomes, states continue to expand and enhance covered prenatal, delivery, and postpartum services. As reported last year, these benefit enhancements are happening alongside the extension of Medicaid postpartum coverage in many states. Fourteen states reported adding coverage of doula services in FY 2024 or FY 2025.55  Eight states reported new benefits to help parents initiate or maintain breastfeeding, including breast pumps, human donor milk, and lactation consultation.56 

  • South Dakota reported a new enhanced care coordination program for pregnant individuals designed to increase utilization of timely prenatal and postpartum services.57  In FY 2025, Nebraska is launching its Prenatal Plus Program for at risk pregnant individuals pursuant to LB 857, which includes nutrition counseling, psychosocial counseling and support, education and health promotion, breastfeeding support, and targeted case management.
  • New Jersey is the second state in the nation implementing a statewide universal home visiting program to help improve maternal and infant health. The state’s Medicaid program is also piloting programs to provide evidence-based home visiting services for up to 500 families each year58  and medically indicated home-delivered meals for pregnant individuals with diabetes.
  • Tennessee is the first state to receive CMS approval to cover diapers for the first two years of a child’s life under its TennCare 1115 waiver. Delaware also received approval under its Section 1115 waiver to expand its Postpartum Nutrition Supports Initiative pilot and cover home-delivered meals or medically appropriate food boxes, as well as a weekly supply of diapers and wipes, for 12 weeks following delivery.
  • Massachusetts reported providing temporary housing assistance (up to six months) for pregnant individuals and families who are experiencing homelessness and participating in the state’s Emergency Assistance Family Shelter program.59 

Preventive Services. States are required to provide comprehensive preventive care to children through the EPSDT benefit, and states must cover certain preventive services for adults eligible under the ACA’s Medicaid expansion; however, this coverage is not required for “traditional” Medicaid adults. In this year’s survey, states reported benefit actions related to testing, screenings, vaccinations,60  and contraceptives. Some states also report expanding access to preventive services by newly adding coverage of pharmacist services allowable under their scope of practice (Illinois, Pennsylvania, Wisconsin, and Wyoming) and adding local health departments to providers that may be reimbursed for screenings and other services (Texas).

  • Two states reported covering at home testing and screening services. Pennsylvania added coverage of at home sexually transmitted infection (STI) test kits. Wyoming added coverage of Cologuard® at home colorectal screening tests to help increase colorectal cancer screening rates.
  • Three states (Louisiana, Mississippi, and New Hampshire) reported addition or expansion of smoking cessation counseling services beyond required benefits and covered populations.

Services Targeting Social Determinants of Health (SDOH). Outside of Medicaid home and community-based services programs, state Medicaid programs have more limited flexibility to address enrollee social needs (e.g., housing, food, transportation, etc.). Certain options exist under Medicaid State Plan authority as well as Section 1115 waiver authority to add non-clinical benefits. In 2022, CMS released a new framework for covering health-related social needs (HRSN) services under Section 1115 waivers, expanding flexibility for states to add certain short-term housing and nutrition supports as Medicaid benefits (building on CMS guidance from 2021). Additional guidance and resources that identify allowable HRSN services and supports were released by CMS in late 2023. In this year’s survey, states continued to report services targeting SDOH, including housing services and supports, nutrition services, and medical respite.

  • CMS has approved ten states (Arizona, Arkansas, California, Illinois, Massachusetts, New Jersey, New Mexico, New York, Oregon, and Washington) under the new HRSN Section 1115 framework. States continue to seek approval for SDOH-related services in and outside of this framework. Of note in this year’s survey, at least three states (California, District of Columbia, and Hawaii) reported pending Section 1115 waiver requests to provide short-term rental assistance, utilities assistance, and/or temporary housing in addition to other housing services and supports.
  • Eight states (District of Columbia, Hawaii, Kentucky, Massachusetts, Michigan,61  Minnesota, Nebraska, and Utah) reported plans to add coverage of medical respite services (also known as recuperative care or pre-procedure/post-hospitalization housing) in FY 2024 or later. This intervention includes room and board and clinically oriented services and supports62  to provide a safe and stable environment before a procedure or following an inpatient discharge for individuals experiencing homelessness. State activity to cover this benefit continues.63 

Community Health Workers. Eight states (Kansas, Michigan, Nevada, New Jersey, New Mexico, New York, Oklahoma, and Pennsylvania) added or expanded coverage of services provided by Community Health Workers (CHWs) in FY 2024 or FY 2025, continuing a trend observed in Medicaid programs in recent years. Services provided by CHWs may include culturally appropriate health promotion and education, care coordination, and help accessing medical and non-medical services.

  • New York reported adding coverage of CHW services for children, pregnant and postpartum individuals, and other high-risk enrollees in FY 2024.64  New Mexico’s CHW benefit includes services provided by CHWs or Community Health Representatives (CHR) trained under the Indian Health Service (IHS).65 

Dental Services. While EPSDT requires states to provide comprehensive dental services for children, states are not required to provide dental benefits to adults. States may choose to provide dental coverage for adults, and with increasing frequency, are expanding coverage from limited (e.g., extractions or emergency services) to more comprehensive (e.g., diagnostic, preventive, and restorative services). Following adult dental benefit expansions in several states reported in recent surveys, benefit actions related to dental services in FY 2024 and FY 2025 are more nuanced. Examples include but are not limited to adding select periodontal services (Connecticut), dentures and partial dentures (Kansas), adult oral examinations (Missouri), and Silver Diamine Fluoride (SDF)/interim caries arresting medicament application for children and targeted adult populations (Missouri and Texas). Texas reported narrow restrictions on dental benefits in FY 2024, impacting coverage of topical fluoride treatment and space maintainers.

  • Georgia is expanding its adult dental benefit in FY 2025 to include diagnostic, preventive, restorative, periodontal, prosthodontic, orthodontic, endodontic, emergency dental services, and oral surgery.66  Nebraska reported removing the annual adult benefit cap ($750) in FY 202467  and Vermont eliminated the annual dental benefit cap for certain adult populations in FY 2024.68 

Other State Benefit Actions. In this year’s survey, several states reported expanding other optional benefits covered by their Medicaid programs. Three states (New Mexico, Rhode Island, and Washington) reported adding chiropractic services, one state (Wyoming) reported adding podiatry services, and one state (Washington) reported adding acupuncture services.

  • Palliative Care. Hawaii and New Jersey reported adding a community palliative care benefit in FY 2024 or FY 2025 to prevent and provide relief from symptoms and stress of serious illness and improve enrollees’ quality of life. Illinois reported introducing a pediatric palliative care benefit in FY 2024.
  • School-based services. Schools can be a key setting for providing services to Medicaid-covered children. Seven states (Alaska, Maine, Maryland, New York, Ohio, Oklahoma, and Rhode Island) report expanding their school-based services programs. Examples include adding services (e.g., outpatient therapy, psychological testing, early intervention), provider types (e.g., school psychologists), or populations served. For example, a few states are extending services to children who do not have an Individualized Education Program (IEP) or Individualized Family Service Plan (IFSP).

Box 2: Section 1115 Medicaid Reentry Waivers

In April 2023, CMS released guidance encouraging states to apply for a new Section 1115 demonstration opportunity to test transition-related strategies to support community reentry and care transitions for individuals who are incarcerated. This opportunity allows states to partially waive the statutory Medicaid inmate exclusion policy, which prohibits Medicaid from paying for services provided during incarceration (except for inpatient services). As of October 2024, eleven states have approval to provide pre-release services and 15 additional states (including DC) have pending pre-release waivers under review at CMS. In July 2024, CMS announced it had developed a standard demonstration application and special terms and conditions to expedite the review and approval of reentry waiver requests (approving 7 reentry waivers in July). States with governors across political parties have pursued these waivers. California will be the first state to implement its reentry demonstration in October 2024 (after gaining approval in January 2023).

Starting January 1, 2025, the 2023 Consolidated Appropriations Act (CAA) requires Medicaid and CHIP to cover screenings (medical, dental, and behavioral health), diagnostic services, and case management for all eligible youth (under age 21 and former foster care youth under age 26) in public institutions (including state prisons, local jails, tribal jails and prisons, and all juvenile detention and youth correctional facilities) 30 days prior to release. States must continue to provide case management services for at least 30 days post-release. The 2023 CAA also gives states an option to provide full Medicaid or CHIP services to all youth (under age 21 and former foster care youth under age 26) in public institutions pending disposition of charges (i.e., awaiting the outcome of charges).

988 Suicide & Crisis Lifeline

On July 16, 2022, the federally mandated crisis number, 988, became available to all landline and cell phone users at no charge. This three-digit number provides 24/7 access to crisis counselors for everyone, regardless of financial ability. Insurer payments can help financially sustain 988 and other crisis services, and some states bill Medicaid. Recent CMS guidance confirms Medicaid administrative match, including enhanced federal matching rates for health IT costs, is available to support 988 operations such as establishing or improving local call centers, system integration, and information exchange. This year’s survey asked states whether Medicaid supported administration of the 988 hotline or paid for 988 services delivered to Medicaid beneficiaries.

A handful of states reported using Medicaid funding to support and sustain the 988 Suicide & Crisis Lifeline as of July 1, 2024. Four states (Georgia, Indiana, Michigan, and Utah) reported using Medicaid administrative funds to support hotline operations, and an additional three states (Idaho, West Virginia, and Wyoming) plan to do so in FY 2025. Seven states (Arizona, Colorado, Georgia, Indiana, Michigan, New Mexico, and West Virginia) reported using Medicaid funds to pay for hotline services provided to individual Medicaid enrollees and two (Idaho and Wyoming) additional states plan to do so in FY 2025. Some states explained that 988 hotline administration was fully covered by SAMHSA grants and other funding, and a few states noted that insurance or other identifying information is not collected, making it challenging to bill Medicaid.

Medicaid Coverage of Community Violence Intervention Services

Community violence intervention services are multi-disciplinary, community-based strategies for individuals and groups at risk of participating in or being a victim of gun violence. They may provide safety planning, conflict intervention, trauma-informed care, a connection to social services, and other interventions to reduce the likelihood of future violence. In 2021, the Biden-Harris Administration announced an investment in community violence intervention programs, including Medicaid funding. More recently, the administration announced additional clarifying guidance on Medicaid reimbursement for violence intervention programs, as well as counseling on firearm safety, is forthcoming. This year’s survey asked states if they have in place a Medicaid-funded State Plan community violence intervention or community violence prevention benefit.

Six responding states reported covering community violence intervention or community violence prevention services in Medicaid as of July 1, 2024. These states are California, Connecticut, Illinois, Maryland, New York, and Oregon. Service definitions, delivery model, and provider qualifications vary across the states, but commonly include evidence-based, trauma-informed education and services to promote recovery, support behavior change, and prevent future injury or violence. States generally cover these services when provided by certified violence prevention professionals following an individual assessment, but two states (California and New York) cover violence prevention services as a CHW service. Illinois’ Reimagine Public Safety Act created Violence Prevention Community Support Teams to provide peer supports, therapy and counseling, and community support, including at an enrollees’ home or school. At least one state (Connecticut) noted low utilization despite covering the benefit since 2022. 
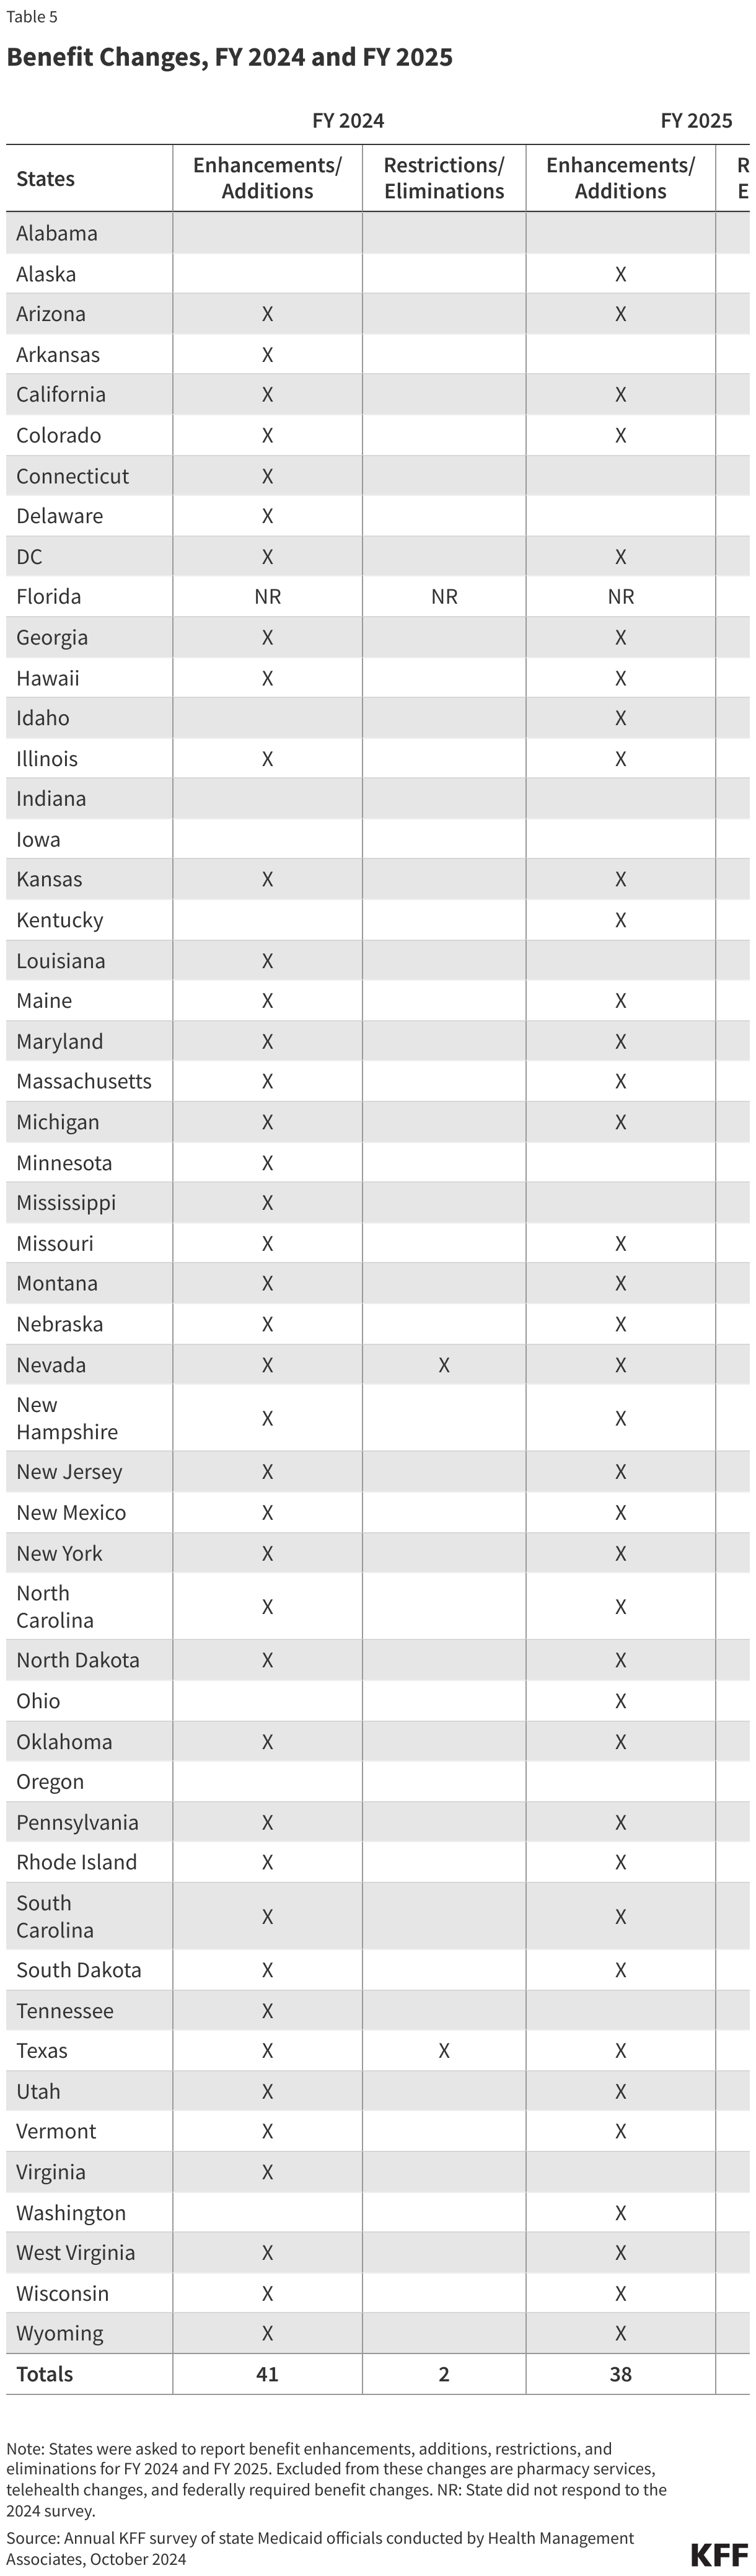
Benefit Changes, FY 2024 and FY 2025

Pharmacy

Context

Drug Expenditures. Management of rising pharmacy costs continues to be a focus area at both the state and federal levels. Between FY 2017 and FY 2023, net Medicaid spending on prescription drugs (after rebates) grew by 72% and in FY 2023, prescription drugs accounted for approximately 6% of total Medicaid spending. Much of the spending growth in recent years has been attributed to new high-cost specialty drugs, including obesity drugs and emerging cell and gene therapies that treat, and sometimes cure, rare diseases but at a high cost to Medicaid and other payers.

State Level Controls. The federal Medicaid Drug Rebate Program (MDRP) requires states to cover nearly all FDA-approved drugs from rebating manufacturers, limiting states’ ability to control drug costs through restrictive formularies. Instead, states use an array of payment strategies and utilization controls to manage pharmacy expenditures, including preferred drug lists (PDLs), prior authorization, managed care pharmacy carve-outs, and value-based arrangements (VBAs) negotiated with individual pharmaceutical manufacturers that increase supplemental rebates or refund payments to the state if the drug does not perform as expected. States and MCOs may contract with external vendors like pharmacy benefit managers (PBMs) to manage or administer the pharmacy benefit. PBMs may perform a variety of administrative and clinical services for Medicaid programs (e.g., developing a provider network, negotiating rebates with drug manufacturers, adjudicating claims, monitoring utilization, overseeing PDLs, etc.) and are used in both fee-for-service (FFS) and managed care settings. PBMs, however, have faced increased scrutiny in recent years as more states adopt reforms to increase transparency and improve oversight.

Federal Initiatives. As of January 1, 2024, the American Rescue Plan Act (ARPA) lifted the cap on the total amount of statutory rebates that Medicaid could collect from manufacturers that raise drug prices substantially over time. Some manufacturers have responded by cutting prices or discontinuing drug products to avoid paying increased rebates which have implications for state rebate collections and PDLs. Further, the Inflation Reduction Act included a number of prescription drug reforms that primarily apply to Medicare. The Congressional Budget Office has predicted, however, that one of those provisions (the Medicare inflation rebate requirement) will interact with Medicaid, resulting in a net increase in Medicaid drug costs. A federal rule was also recently finalized aimed at increasing price transparency and established a voluntary model for states and manufacturers to increase access to cell and gene therapies for people with Medicaid. There have also been recent bills under consideration with Medicaid drug pricing provisions and potential implications for Medicaid drug spending.

Obesity Drugs. GLP-1 (glucagon-like peptide-1) agonists have been used as a treatment for type 2 diabetes for over a decade and are covered by state Medicaid programs for that purpose. However, newer forms of these drugs, such as Wegovy and Zepbound, have gained widespread attention for their effectiveness as a treatment for obesity and are causing state Medicaid programs and other payers to re-evaluate their coverage policies for obesity drugs. Recent KFF analysis has found most large employer firms do not cover GLP-1 drugs for weight loss, coverage in ACA Marketplace plans remains limited, and coverage in Medicare is prohibited. In Medicaid, states must cover nearly all FDA-approved drugs for medically accepted indications; however, a long-standing statutory exception allows states to choose whether to cover weight-loss drugs under Medicaid for adults, leading to variation in coverage policies across states. All obesity drugs are covered for children under Medicaid’s Early and Periodic Screening, Diagnostic and Treatment (EPSDT) benefit, though it is less clear how states are implementing and covering these services in practice. Almost 40% of adults and 26% of children with Medicaid have obesity, and expanding Medicaid coverage of these drugs could address some disparities in access to these medications. However, expanded coverage could also increase Medicaid drug spending and put pressure on overall state budgets. KFF analysis found that utilization and gross spending on GLP-1s nearly doubled each year from 2019 to 2022. In the longer term, however, reduced obesity rates among Medicaid enrollees could also result in reduced Medicaid spending on chronic diseases associated with obesity, such as heart disease, type 2 diabetes, and types of cancer.

This section provides information about:

  • Managed care’s role in administering pharmacy benefits
  • Pharmacy cost containment
  • Coverage of obesity drugs

Findings

Managed Care’s Role in Administering Pharmacy Benefits

Most states that contract with MCOs include Medicaid pharmacy benefits in their MCO contracts, but eight states “carve out” prescription drug coverage from managed care. While the majority of states that contract with MCOs report that the outpatient prescription drug benefit is carved in to managed care (31 of 42 states that contract with MCOs), eight states (California, Missouri, New York, North Dakota, Ohio, Tennessee, Wisconsin, and West Virginia) report that pharmacy benefits are carved out of MCO contracts as of July 1, 2024 (Figure 17). This count is unchanged from last year’s survey, though Utah noted considering future pharmacy delivery model changes such as carving out the pharmacy benefit from MCO contracts following a legislature-initiated study. There has been an increase from one state (Kentucky) to three states (Kentucky, Louisiana, and Mississippi) that now contract with a single PBM for the managed care population instead of implementing a traditional carve-out of pharmacy from managed care. Under this “hybrid” model, MCOs remain at risk for the pharmacy benefit but must contract with the state’s PBM to process pharmacy claims and pharmacy prior authorizations according to a single formulary and PDL.

State Coverage of Pharmacy Benefits in MCO Contracts as of July 1, 2024

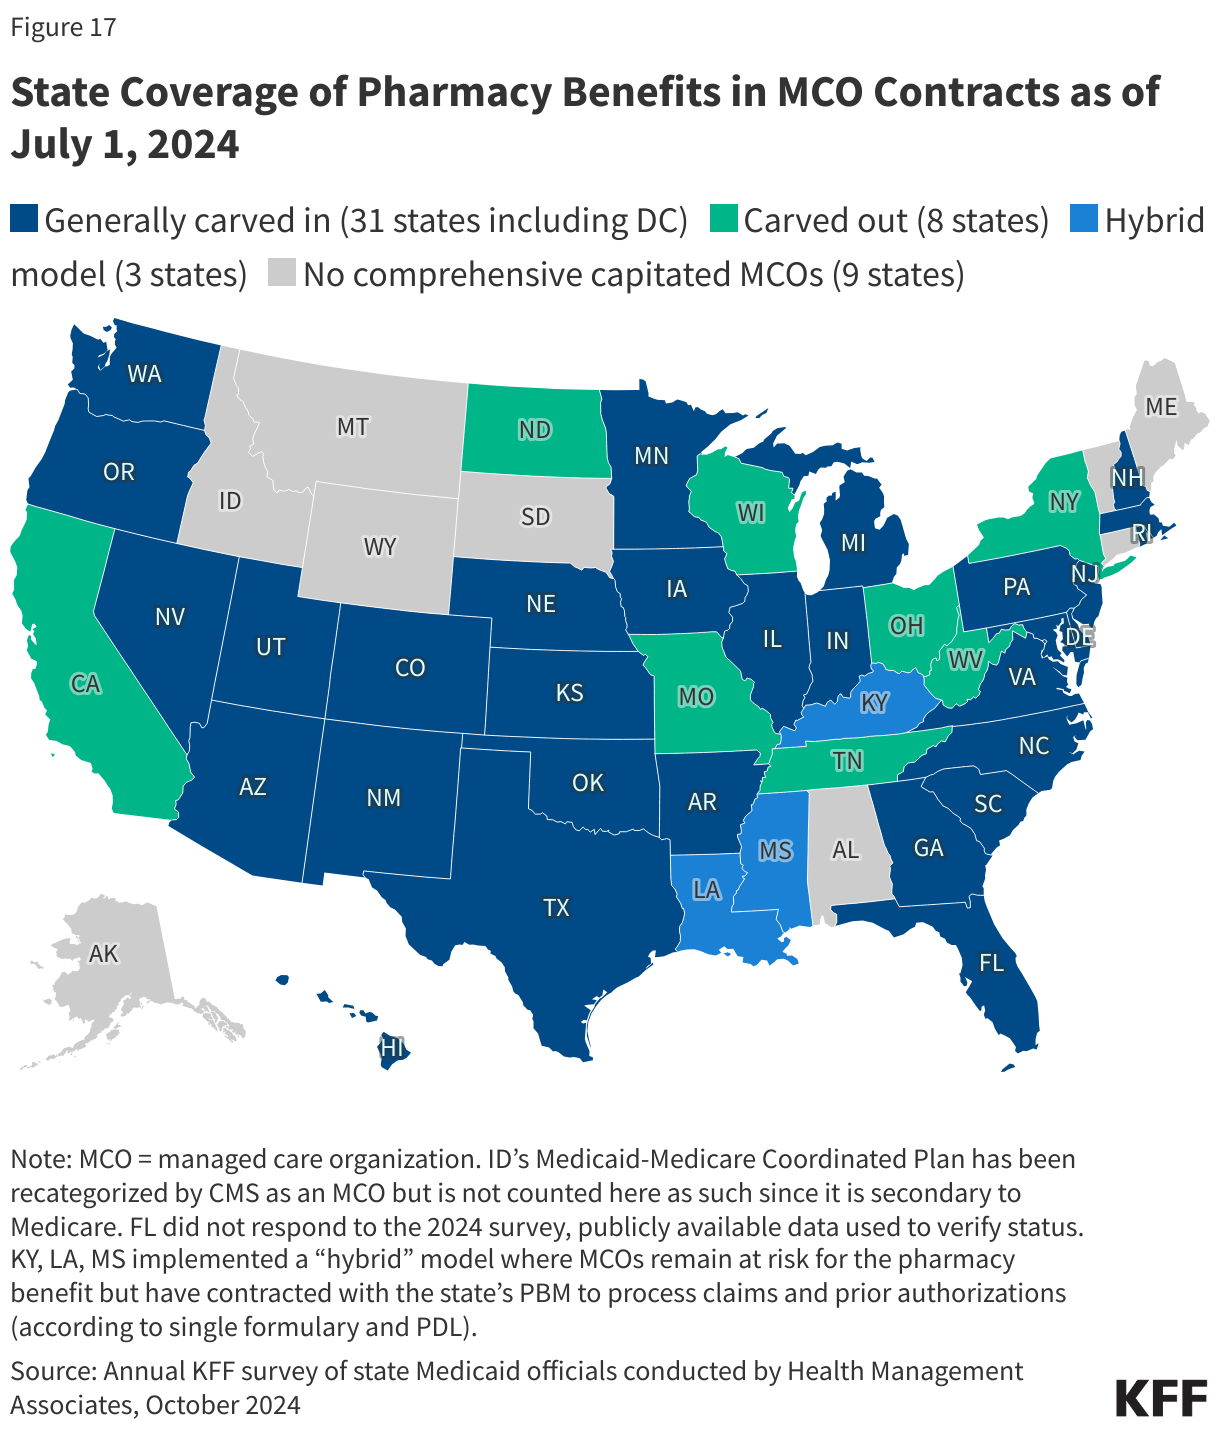
Half of states that contract with MCOs report targeted carve-outs of one or more drugs or drug classes. As of July 1, 2024, 21 of 42 states that contract with MCOs reported carving out one or more drug classes from MCO capitation payments (Figure 18). These targeted drug carve-outs can include drugs covered under the pharmacy benefit or the medical benefit and may be used as a MCO risk mitigation strategy or for other reasons, including enrollee protection. Some of the most commonly reported drug carve outs include hemophilia products, spinal muscular atrophy agents, other cell and gene therapies and/or high-cost specialty drugs. Notably, three states noted carving out the recently approved gene therapies for sickle cell disease. Over half of people with sickle cell disease are covered by Medicaid and CHIP, and enrollees with the disease typically incur high medical and pharmacy costs. The new therapies could potentially cure individuals of the disease but come at a steep cost, making them particularly promising as well as challenging for state Medicaid programs. When asked to describe any significant changes to how drugs are administered for FY 2025 and beyond, three states (New Hampshire, Texas, and Washington) did note they will be reversing (or carving back in) a specific drug class carve out.

Drug Classes Carved Out of MCO Contracts as of July 1, 2024

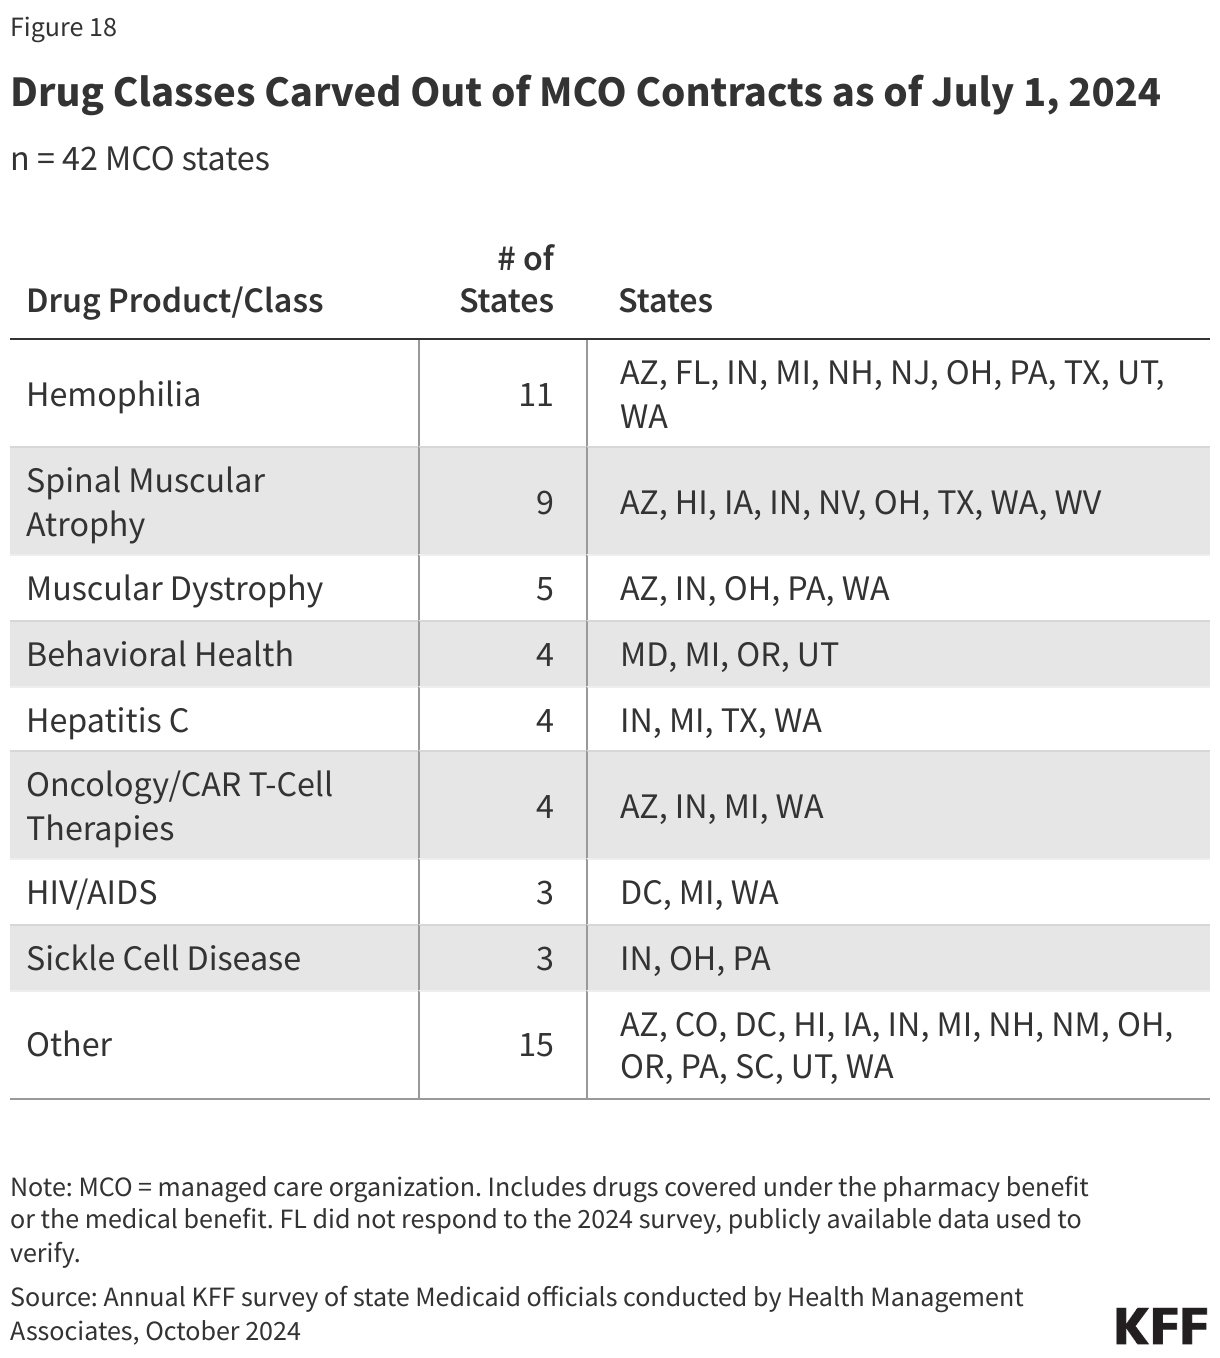
Cost Containment Initiatives

Nearly three-quarters of responding states reported at least one new or expanded initiative to contain prescription drug costs in FY 2024 or FY 2025. In this year’s survey, states were asked to describe any new or expanded pharmacy program cost containment strategies implemented in FY 2024 or planned for FY 2025, including initiatives to address PBM spread pricing and value-based arrangements. States were asked to exclude routine updates, such as to PDLs or state maximum allowable cost programs, as these utilization management strategies are employed by states regularly and are not typically considered major new or expanded policy initiatives.

The largest share of states noting new or expanded cost containment policies reported initiatives related to value-based arrangements (VBAs) with pharmaceutical manufacturers as a way to control pharmacy costs. Half of responding states reported working toward, implementing, or expanding VBA efforts in FY 2024 or FY 2025, up from one-third in FY 2023 or FY 2024. This includes states that are just beginning to lay the groundwork for VBAs in their state, which can include submitting a State Plan Amendment (SPA) and negotiations with manufacturers. A recent HMA survey of state Medicaid programs found that nine states had VBAs in place as of July 1, 2023 (up from seven as of July 1, 2022), with the most frequently targeted drugs for VBAs including hepatitis C treatment and drugs used to treat spinal muscular atrophy. In this year’s survey, five of the nine states with VBAs in place reported efforts to further expand VBAs. State interest in VBAs appears to be accelerating, though states can face a number of barriers to implementing VBAs including manufacturer willingness as well as the administrative burden and complexity of the agreements. Though not specifically asked about in this year’s survey, eight states noted interest or intent to join CMS’s Cell and Gene Therapy Access Model, where CMS will negotiate an outcome-based agreement for cell and gene therapies (starting with the gene therapy for sickle cell disease) on behalf of states and provide technical assistance.

While VBAs were the most commonly reported initiative, states also reported a variety of other cost containment policy changes related to rebate maximization, high-cost drugs, and PBM reform. Specific cost containment policy changes reported in FY 2024 and FY 2025 include:

  • Significant PDL or rebate changes. At least nine states reported new or expanded PDL or rebate changes, including changes in states with uniform PDLs that apply to both FFS and managed care. Seven of those states (Alaska, Arkansas, Delaware, Kentucky, Massachusetts, South Dakota, and Washington) reported initiatives in FY 2024 to significantly update or expand their PDLs, including adding new drug classes. Two states, Delaware (in FY 2024) and Connecticut (in FY 2025), reported limiting coverage of over the counter (OTC) products; Delaware specially noted they will now only cover OTC products that are rebate eligible. Washington and Delaware reported implementing additional clinical criteria for both FFS and MCOs in FY 2024, and Connecticut noted requiring detailed clinical review for non-preferred medications in FY 2025. Lastly, South Carolina will transition to a uniform PDL for FFS and MCO drug coverage beginning in FY 2024.
  • Pharmacy reimbursement changes. At least three states (Arkansas, Massachusetts, and Mississippi) mentioned incorporating products like diabetic supplies traditionally covered as a durable medical equipment (DME) benefit into their pharmacy billing policies. These changes can facilitate enrollee access, reduce administrative burdens and improve data tracking, and/or enable states to collect rebates on products.
  • Additional changes that specifically target high-cost specialty drugs. At least six states reported new or expanded initiatives in FY 2024 to mitigate the cost impact of high-cost specialty drugs, including some biologic and/or physician administered drugs. Vermont reported an expansion of their policy requiring separate claims for certain high-cost physician administered drugs in order for the state to collect rebates on those drugs. Alaska and Maine also reported changes related to physician administered drug payment, and Vermont created a biosimilar drug management program. New York reported a number of initiatives targeting high-cost specialty drugs including expanding efforts to negotiate supplemental rebates for high-cost drugs and/or drugs approved under the accelerated approval pathway. New Jersey reported expanding their high-cost drug risk corridor for managed care contracts, and New Hampshire plans to implement one.
  • PBM and MCO-related. At least eight states reported initiatives related to PBMs and/or MCO contracts. In FY 2024, Delaware expanded PBM reporting requirements, New Jersey added a requirement that MCOs have a pass-through model contract with their PBM, Tennessee implemented a risk-sharing model for PBM services, and South Carolina is expanding their MCO Drug Transparency Audit program. Two states, Hawaii (in FY 2025) and Rhode Island (not until FY 2026), reported new initiatives to prohibit PBM spread pricing. Mississippi, effective FY 2025, moved to contracting with a single PBM to process and manage pharmacy claims for all enrollees, including those enrolled in managed care. To increase transparency in MCOs, Oklahoma is adding an MCO pharmacist to provide direct oversight of MCOs in FY 2025.
  • In addition to these, a small number of states also mentioned changes related to quantity limits or medication therapy management services.

Coverage of Obesity Drugs

Twelve state Medicaid programs reported covering GLP-1s when prescribed for the treatment of obesity under FFS as of July 1, 2024 (Figure 19). Among the 12 states that reported coverage of GLP-1s, 11 states cover all three GLP-1s currently approved for the treatment of obesity (Saxenda, Wegovy, or Zepbound); Mississippi covers Saxenda and Wegovy but not Zepbound, the newest GLP-1 approved for the treatment of obesity. Four additional states have coverage in place but only for one or more older generation products, resulting in a total of 16 states covering at least one medication for the treatment of obesity. The survey asked states about their coverage of “weight-loss medications when prescribed for obesity” and the statutory exception refers to agents used for “weight loss”; however, “obesity drugs” is used to refer to this group of medications throughout this report. Notably, Wegovy was recently also approved for the treatment of cardiovascular disease, and all states are required to cover Wegovy for that label indication. While the survey only asked about FFS coverage, MCO drug coverage must be consistent with the amount, duration, and scope of FFS coverage. MCOs, however, may apply differing utilization controls and medical necessity criteria unless the state’s MCO contract specifies otherwise. For example, a recent HMA survey found that a growing number of MCO states have adopted uniform PDLs requiring MCOs to cover the same drugs and most MCO states also require uniform clinical protocols for some or all drugs with clinical criteria.

State Coverage of Obesity Drugs Under FFS as of July 1, 2024

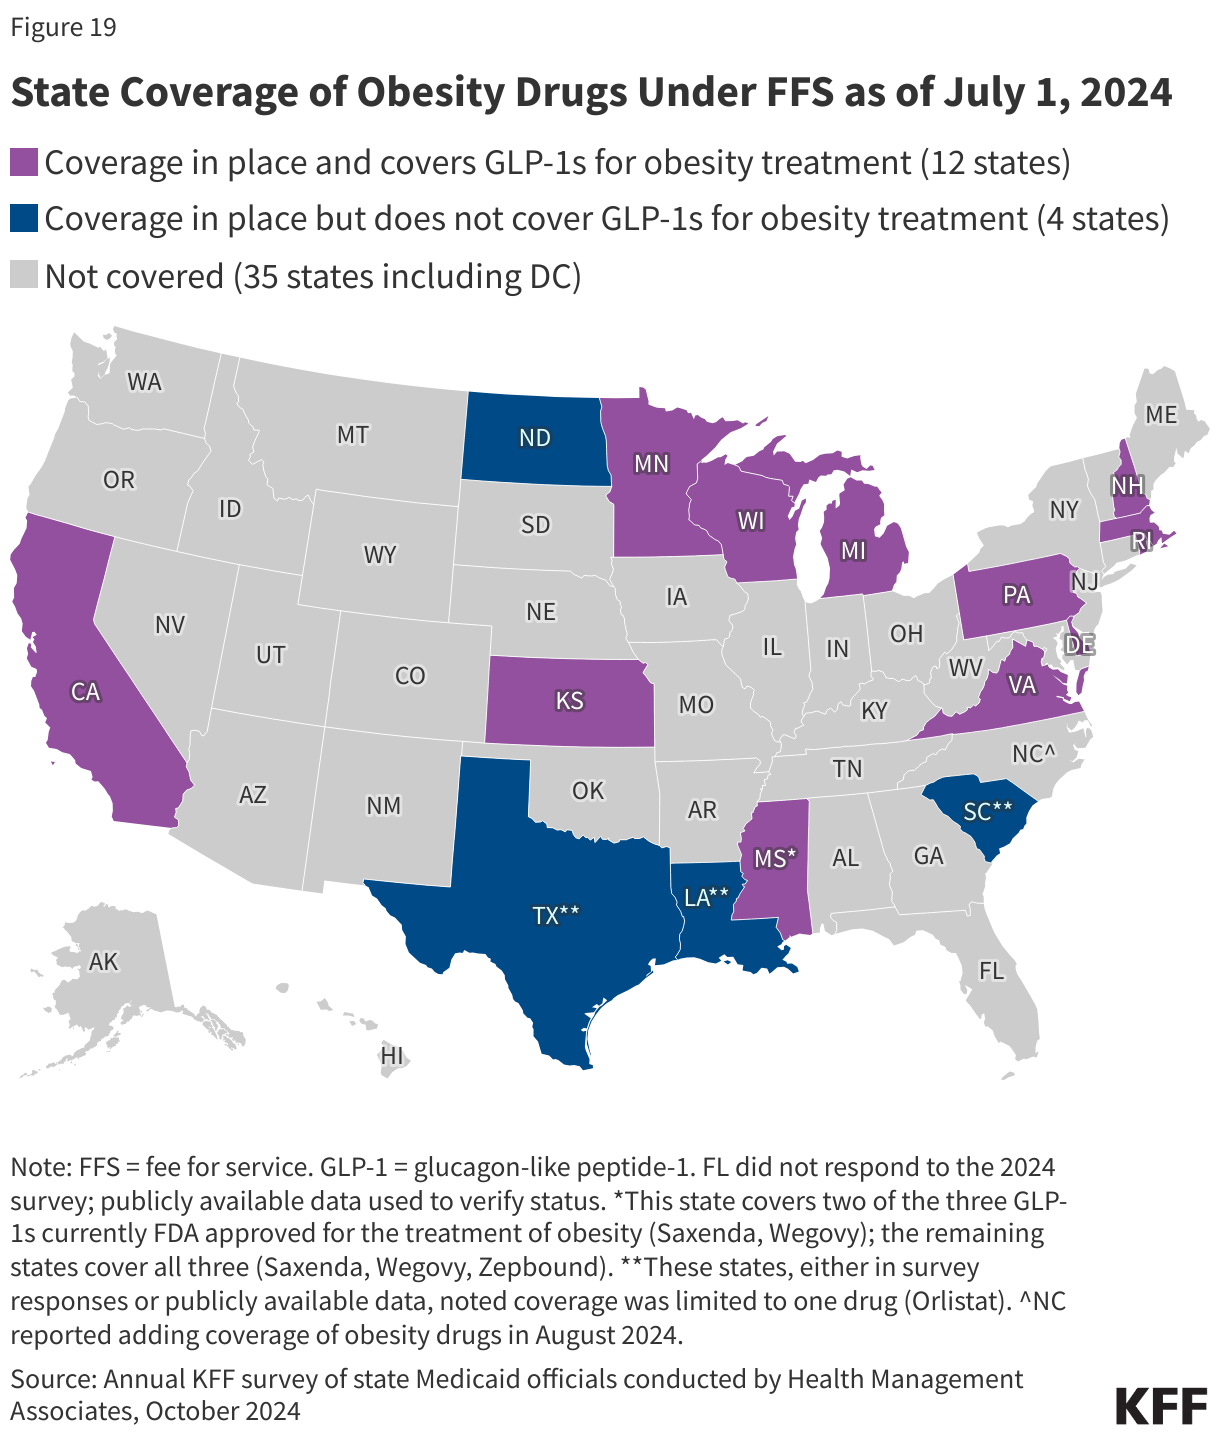
All of the states that cover GLP-1s when prescribed for the treatment of obesity under FFS report that utilization control(s) apply. Eleven states noted prior authorization requirements, 11 states noted body mass index (BMI) requirements, nine states noted a comorbidity requirement, and four states noted step therapy requirements (Figure 20). States also mentioned other utilization controls including counseling or documented weight loss requirements.

Utilization Management Controls in Place For GLP-1 Agonists When Prescribed for Obesity Treatment as of July 1, 2024

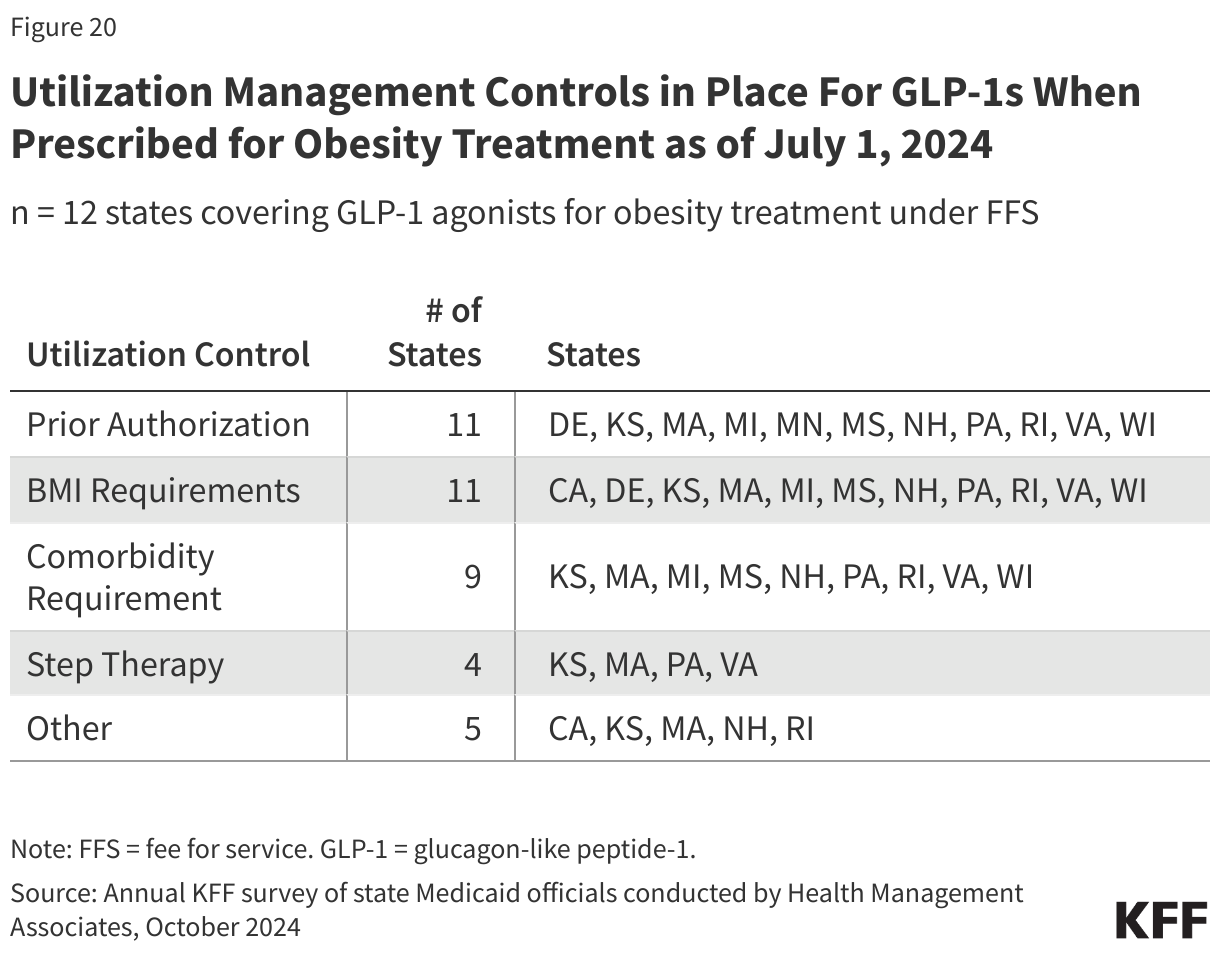
Among those responding states that do not currently cover obesity drugs, half noted they were considering adding coverage, with a few states reporting plans to definitely add or expand coverage. North Carolina reported adding coverage starting August 1, 2024, and South Carolina reported plans to add coverage of additional obesity medications (current coverage is only for Orlistat, an older generation product) at the end of 2024. Also, Kansas reported broadening its existing coverage of Zepbound in FY 2024 after the state secured a supplemental rebate agreement with the manufacturer. Connecticut reported a legislative mandate to add coverage but has not yet implemented coverage.

Almost two-thirds of responding states reported that cost was a key factor contributing to their obesity drug coverage decision (Figure 21). A few states mentioned they had conducted or are in the process of conducting studies to assess the cost implications of coverage in their state. A fifth of states also noted the need for legislative action such as changes to the state’s SPA or additional budget appropriations before they could implement coverage of these drugs. In addition, a few states mentioned concerns regarding adherence, developing clinical criteria, and potential side effects in their state’s decision not to cover obesity drugs at this time. Conversely, 4 in 10 states noted that positive health outcomes and longer-term savings on chronic diseases associated with obesity were key factors in their decision to cover or consider covering in the future. A few states also mentioned increasing enrollee access and health equity, recommendations from providers, and ability to negotiate supplemental rebate agreements were important factors.

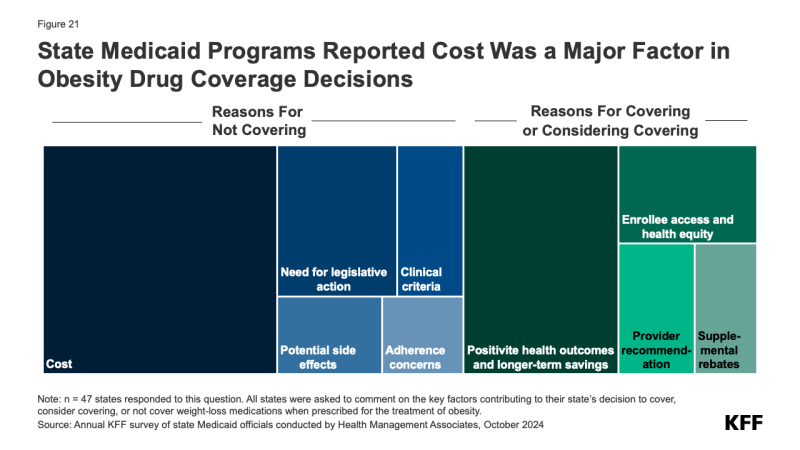
Future Outlook: Key Priorities And Challenges In FY 2025 And Beyond

At the start of FY 2025 states were wrapping up the unwinding of the pandemic-related continuous enrollment provision and focusing on an array of other priorities. With a return to more routine operations, Medicaid directors reported a focus on behavioral health, long-term services and supports, and key initiatives related to social determinants of health or reentry services for justice-involved populations in FY 2025 and beyond. However, directors also noted challenges related to state workforce shortages, systems issues, and emerging state budget pressures.

Two-thirds of responding states reported administrative challenges including workforce, system modernization and maintenance, and compliance with federal rules. Headed into FY 2025 after the intensity of managing the unwinding of the continuous enrollment provision, states were worried about ongoing workforce shortages, hiring freezes, recruitment and retention issues, as well as managing bandwidth and staff burnout. States also reported managed care procurements, new contract implementations, and increasing MCO accountability and oversight as both a challenge and priority. A handful of states mentioned prioritizing system and operational efficiencies, with a focus on maintaining and enhancing eligibility and enrollment improvements post-pandemic. In addition, many states raised the need for systems modernization or essential maintenance as an ongoing administrative challenge. States also noted that adequate staffing and systems are necessary to ensure compliance with recently promulgated federal rules, particularly the Access and Managed Care rules which present new reporting, oversight, and beneficiary protection responsibilities for states. States further noted that the upcoming election adds uncertainty to their current program administration responsibilities.

Nearly half of responding states reported Medicaid budget challenges, including increasing budget pressures or fiscal uncertainty. For the three-year period following the onset of the COVID-19 pandemic, states provided continuous enrollment in Medicaid in exchange for enhanced federal matching funds, resulting in a sharp increase in Medicaid enrollment and spending. When the enhanced federal matching funds expired at the end of 2023, as anticipated, the state share of Medicaid spending grew significantly. At the same time, states also reported facing new spending pressures from inflation, efforts to further expand access and address provider workforce shortages, and the introduction of high cost but promising treatments such as cell and gene therapies and obesity medications. Some states also mentioned sustaining and continuing provider rate enhancements and benefit expansions implemented during the pandemic as priorities. Although the total Medicaid caseload dropped in FY 2024, many states reported a notable increase in per enrollee costs due to the greater health care needs of enrollees that retained coverage. Beyond Medicaid, states expressed concerns that overall state fiscal conditions and state revenue decreases or slowdowns could put pressure on Medicaid agencies to focus on limited cost growth or potentially implement cuts.

Amid these administrative and budget challenges, nearly half of responding states mentioned addressing mental health and substance use disorders as a top priority or opportunity. For example, states are working to strengthen the delivery system by building out the behavioral health continuum of care, expanding access points and the availability of community-based services and supports, assuring access to crisis services, integrating physical health and behavioral health services, designing new payment models or incentives for improved mental health and SUD outcomes, increasing provider rates, implementing Certified Community Behavioral Health Clinics (CCBHCs), and adding coverage of evidence-based behavioral health service models. Many states commented on efforts to improve care and quality for children, youth, and young adults, including youth in foster care. Consistent with state-identified behavioral health priorities, a number of states reported behavioral health challenges including increased demand for services, workforce shortages, lack of access to services, gaps in the service continuum (especially for children and youth), challenges related to integrating physical health and behavioral health, and complexity of aligning available behavioral health funding sources.

Nearly half of responding states reported key initiatives related to social determinants of health or reentry services for justice-involved populations. Many states reported designing or preparing for implementation of reentry services for incarcerated populations, housing services and supports, and food and nutrition services. In highlighting these initiatives, states emphasized related efforts to engage enrollees and community stakeholders, build capacity, coordinate across systems and agencies, and develop networks of service providers. These initiatives frequently rely on the use of Section 1115 demonstration waivers and are often tied to broader goals involving reducing health disparities. Several states noted new requirements for Medicaid and CHIP programs to provide certain services to eligible youth who are incarcerated (beginning January 1, 2025) as a priority and challenge.

More than one-third of responding states mentioned a focus on long-term services and supports (LTSS), including LTSS workforce issues. For example, states reported priorities such as stabilization and sustainability of LTSS, implementation of managed LTSS programs, home and community-based services (HCBS) waiver redesign, and transitioning Medicare-Medicaid models to integrated D-SNP programs as LTSS priorities. At the same time, states cited workforce challenges and increased demand for services, highlighting the direct care workforce in particular. Some states are transforming nursing facility reimbursement, increasing rates, or implementing minimum fee schedules to support HCBS providers.

Many states also mentioned access, payment, and delivery system reforms as key priorities. This includes efforts to improve maternal and child health, rural initiatives and targeted rate increases, expansion of school-based services, implementation of continuous coverage for children or other targeted populations, value-based payment and quality initiatives, and network monitoring and oversight. A handful of states noted improving the enrollee and provider experience and enhancing stakeholder engagement as additional opportunities or focus areas.

Methods

KFF commissioned Health Management Associates (HMA) to survey Medicaid directors in all 50 states and the District of Columbia to identify and track trends in Medicaid spending, enrollment, and policy making. This is the 24th annual survey conducted at the beginning of the state fiscal year (FY) from FY 2002 through FY 2025. Additionally, ten mid-fiscal year surveys were conducted during FYs 2002-2004, 2009-2013, 2021, and 2022 when a large share of states were considering mid-year Medicaid policy changes due to state budget and revenue shortfalls and/or the COVID-19 pandemic. Findings from previous surveys are referenced in this report when they help to highlight current trends. Archived copies of past reports are available on the following page.

The KFF/HMA Medicaid survey on which this report is based was sent to state Medicaid directors in June 2024. The survey instrument (in Appendix) was designed to document policy actions in place in FY 2024 and implemented or planned for FY 2025 (which began for most states on July 1, 2024).69  The survey captures information consistent with previous surveys, particularly for provider payment rates, benefits and managed care, to provide some trend information. Each year, questions are added or revised to address current issues.

Medicaid directors and staff provided data for this report in response to a written survey followed by a set of focus groups with Medicaid officials in different roles (directors, deputy directors, chief financial officers, and medical directors) from various states. Overall, 50 states responded in mid-summer of 2024, though response rates for specific questions varied.70  The focus group discussions were an important part of the survey to record additional detail and context for state actions, priorities, and challenges noted in state survey responses. The District of Columbia is counted as a state for the purposes of this report, and the U.S. territories were not included in this analysis, given differences in the financing structure of their programs.

The survey does not attempt to catalog all Medicaid policies in place for each state. This report highlights certain policies in place in state Medicaid programs in FY 2024 and policy changes implemented or planned for FY 2025. Experience has shown that adopted policies are sometimes delayed or not implemented for reasons related to legal, fiscal, administrative, systems, or political considerations, or due to delays in approval from CMS. At the end of FY 2024 and heading into FY 2025, states were wrapping up the unwinding of the pandemic-related continuous enrollment provision, focusing on an array of other priorities, and facing uncertainty about the stability of state revenues as well as the outcome of the November elections.

Appendix

Survey Instrument

Download the Survey Instrument (.pdf)

Endnotes

  1. State fiscal years begin on July 1 except for these states: New York on April 1; Texas on September 1; Alabama, the District of Columbia, and Michigan on October 1. ↩︎
  2. Florida did not respond to the 2024 survey. In some instances, we used publicly available data or prior years’ survey responses to obtain information on Florida’s Medicaid program. However, unless otherwise noted, Florida is not included in counts throughout the survey. ↩︎
  3. The four states that had not completed unwinding by August 2024 were Alaska, the District of Columbia, North Carolina, and New York. ↩︎
  4. Florida did not respond to the 2024 survey. In some instances, we used publicly available data or prior years’ survey responses to obtain information on Florida’s Medicaid program. However, unless otherwise noted, Florida is not included in counts throughout the survey. ↩︎
  5. State fiscal years begin on July 1 except for these states: New York on April 1; Texas on September 1; Alabama, the District of Columbia, and Michigan on October 1. ↩︎
  6. Sparer, Michael. “Medicaid managed care: costs, access, and quality of care.” Research Synthesis Report No. 23, Robert Wood Johnson Foundation (2020). ↩︎
  7. Franco Montoya, Daniela, Puneet Kaur Chehal, and E. Kathleen Adams. “Medicaid managed care’s effects on costs, access, and quality: an update.” Annual Review of Public Health 41.1 (2020): 537-549. https://doi.org/10.1146/annurev-publhealth-040119-094345 ↩︎
  8. Medicaid and CHIP Payment and Access Commission, “Managed care’s effect on outcomes,” September 2023, https://www.macpac.gov/subtopic/managed-cares-effect-on-outcomes/ ↩︎
  9. Federal regulations require actuarially sound capitation rates that are “projected to provide for all reasonable, appropriate, and attainable costs that are required under the terms of the contract and for the operation of the MCO, PIHP, or PAHP for the time period and the population covered under the terms of the contract . . .” 42 CFR §438.4(a). ↩︎
  10. Medicaid and CHIP Payment And Access Commission, “Medicaid Managed Care Capitation Rate Setting,” March 2022, https://www.macpac.gov/wp-content/uploads/2022/03/Managed-care-capitation-issue-brief.pdf ↩︎
  11. Connecticut does not have capitated managed care arrangements but does carry out many managed care functions through ASO arrangements that include payment incentives based on performance, intensive care management, community workers, educators, and linkages with primary care practices. ↩︎
  12. Vermont runs a public, non-risk bearing prepaid health plan delivery model under its Section 1115 Global Commitment to Health waiver. ↩︎
  13. Idaho’s Medicaid-Medicare Coordinated Plan has been recategorized by CMS as an MCO but is not counted here as such since it is secondary to Medicare. Publicly available data used to verify status of Florida (state did not respond to the 2024 survey). ↩︎
  14. For purposes of this report, states contracting with “PCCM entities” are also counted as offering a PCCM program. In addition to furnishing basic PCCM services, PCCM entities also provide other services such as intensive case management, provider contracting or oversight, enrollee outreach, and/or performance measurement and quality improvement. 42 CFR §438.2. ↩︎
  15. Florida did not respond to the 2024 survey. Therefore, the status of its dental services PHP was confirmed via publicly available data. ↩︎
  16. The 85% minimum MLR is the same standard that applies to Medicare Advantage and private large group plans. ↩︎
  17. 42 CFR § 438.8(c) ↩︎
  18. During the rating period, states may increase or decrease rates by a “de minimis amount” per rate cell. Federal regulations define the de minimis amount as 1.5% per rate cell (§438.7(c)(3)). If, however, the state initially elects to certify a rate range for a rate cell, the state is not permitted to use this de minimis change authority but may increase or decrease a capitation rate within a rate range by up to 1% during the rating period without submission of a new rate certification as long as the resulting rate does not fall outside of the 5 percent range limit allow by federal regulations (42 CFR §438.4(c)(2)(iii)). ↩︎
  19. One state, Illinois, reported encouraging rather than requiring employment of CHWs, and New Jersey reported plans to implement a voluntary CHW pilot program for MCOs in FY 2025 (these voluntary strategies not included in count). ↩︎
  20. Social Security Act Section 1902(a)(30)(A) and 42 CFR Section 447.204. ↩︎
  21. CMS “Medicaid SPA Processing Tools for States” webpage; https://www.medicaid.gov/resources-for-states/spa-and-1915-waiver-processing/medicaid-spa-processing-tools-for-states/index.html#:~:text=As%20part%20of%20a%20strategy,as%20more%20tools%20are%20developed ↩︎
  22. 42 CFR Sections 438.6 and 438.60. ↩︎
  23. Permissible under 42 CFR Section 438.6(c). ↩︎
  24. 89 Fed. Reg. pp. 40542-40874. ↩︎
  25. 42 CFR Section 442.43. ↩︎
  26. 42 CFR Section 438.207(b)(3). ↩︎
  27. 42 CFR Section 438.6(c)(2)(i). ↩︎
  28. 42 CFR Section 438.6(c)(2)(iii). ↩︎
  29. Medicaid and CHIP Payment and Access Commission, “Medicaid Base and Supplemental Payments to Hospitals,” April 2024, https://www.macpac.gov/publication/medicaid-base-and-supplemental-payments-to-hospitals/ ↩︎
  30. 42 CFR Section 433.68. ↩︎
  31. Social Security Act Sections 1902(a)(13)(A)(iv) and 1923. ↩︎
  32. Medicaid and CHIP Payment And Access Commission, “Medicaid Base and Supplemental Payments to Hospitals,” April 2024, https://www.macpac.gov/publication/medicaid-base-and-supplemental-payments-to-hospitals/ ↩︎
  33. Ibid. ↩︎
  34. Vermont also reported an SDP in place for hospital services. While Vermont does not contract with MCOs, under its Global Commitment to Health Section 1115 demonstration waiver, the Department of Vermont Health Access (DVHA) acts as a public, non-risk-bearing prepaid inpatient health plan. ↩︎
  35. Office of Governor Jim Pillen Press Release, Gov. Pillen, State Senators, and Healthcare Leaders Celebrate Legislation to Provide $1 Billion Annual Boost to Nebraska’s Hospitals, March 29, 2024, https://governor.nebraska.gov/press/gov-pillen-state-senators-and-healthcare-leaders-celebrate-legislation-provide-1-billion ↩︎
  36. Medicaid and CHIP Payment And Access Commission, “Nursing Facility Fee-for-Service Payment Policy,” December 2019, https://www.macpac.gov/wp-content/uploads/2019/12/Nursing-Facility-Fee-for-Service-Payment-Policy.pdf ↩︎
  37. Florida did not respond, and Tennessee’s Medicaid program is entirely managed care so there are no fee-for-service rates to report on. ↩︎
  38. The HCBS and home health payment rate data reported from this survey are not directly comparable to data collected in KFF’s annual HCBS survey. The surveys ask different questions and the Budget Survey is a statewide survey whereas the HCBS Survey is of officials administering HCBS programs, including home health, personal care, and waiver services. ↩︎
  39. S. Silow-Carroll, K. Gifford, C. Rozenzweig, K. Ryland and A. Pham, “Medicaid’s Non-Emergency Medical Transportation Benefit: Stakeholder Perspectives on Trends, Challenges, and Innovations,” August 2021, https://www.healthmanagement.com/wp-content/uploads/HMA.NEMT_.Report.for_.Publication.Aug_.2021.pdf ↩︎
  40. Government Accountability Office, Medicaid: CMS Needs More Information on States’ Financing and Payment Arrangements to Improve Oversight (Washington, DC: Government Accountability Office, December 2020), https://www.gao.gov/assets/gao-21-98.pdf ↩︎
  41. FL did not respond to the 2024 survey; publicly available data used to verify taxes in place. ↩︎
  42. The Deficit Reduction Act amended the federal Medicaid provider tax law to restrict the use of MCO taxes effective July 1, 2009. Prior to that date, states could apply a provider tax to Medicaid MCOs that did not apply to MCOs more broadly and could use that revenue to match Medicaid federal funds. Since 2009, several states have implemented new MCO taxes that tax member months rather than premiums and that meet the federal statistical requirements for broad-based and uniform taxes. In addition to the 20 states reporting implemented MCO taxes, some states have implemented taxes on health insurers more broadly that generate revenue for their Medicaid programs. ↩︎
  43. Twenty-three states reported planned increases to one or more provider taxes in FY 2025: Arizona, California, Colorado, District of Columbia, Hawaii, Idaho, Kansas, Kentucky, Maine, Maryland, Massachusetts, Mississippi, Nevada, New Jersey, North Carolina, Ohio, Pennsylvania, South Carolina, Tennessee, Texas, Utah, Washington, and West Virginia. These increases were most commonly for taxes on hospitals. ↩︎
  44. 42 CFR. Section 440.230(b). ↩︎
  45. Medicaid managed care organizations, which deliver care to more than two-thirds of all Medicaid enrollees, may also limit services based on medical necessity or utilization management tools (e.g., prior authorization) but services must be no less (in amount, duration, and scope) than offered under fee-for-service. ↩︎
  46. 1902(a)(43) and 1905(a)(4)(B) of the Social Security Act. ↩︎
  47. In a few instances throughout this section, publicly available data (e.g., Section 1115 waiver documents or Medicaid State Plan Amendment documents) was used to supplement reported state benefit changes. ↩︎
  48. The Medicaid Certified Community Behavioral Health Center (CCBHC) Medicaid demonstration program aims to improve the availability and quality of ambulatory behavioral health services and to provide coordinated care across behavioral and physical health. CCBHCs provide a comprehensive range of nine types of services. The CCBHC demonstration program was first established by the Protecting Access to Medicare Act of 2014; more recently, the 2022 Bipartisan Safer Communities Act allocated funds for additional planning grants to states to participate in the demonstration. ↩︎
  49. The 11 states that reported adding or expanding crisis services are: Connecticut, Illinois, Louisiana, Maine, Maryland, Montana, Nebraska, New Mexico, South Carolina, West Virgina, and Wisconsin. ↩︎
  50. HHS Office of the Assistance Secretary for Planning and Evaluation, Contingency Management for the Treatment of Substance Use Disorders: Enhancing Access, Quality, and Program Integrity for an Evidence-Based Intervention, November 2023, https://aspe.hhs.gov/sites/default/files/documents/72bda5309911c29cd1ba3202c9ee0e03/contingency-management-sub-treatment.pdf ↩︎
  51. Diamond State Health Plan (DSHP) Section 1115 waiver approval, May 2024, https://www.medicaid.gov/medicaid/section-1115-demonstrations/downloads/de-dshp-dmntn-appvl-05172024.pdf ↩︎
  52. California Advancing and Innovating Medi-Cal (CalAIM) Section 1115 waiver approval, December 2021, https://www.medicaid.gov/medicaid/section-1115-demonstrations/downloads/wa-medicaid-transformation-ca-06302023.pdf Health and Ending Addiction through Recovery and Treatment Demonstration (HEART) Section 1115 waiver approval, February 2024, https://www.medicaid.gov/medicaid/section-1115-demonstrations/downloads/mt-heart-cms-amendment-approval-20240226.pdf Medicaid Transformation Project 2.0 Section 1115 waiver approval, June 2023, https://www.medicaid.gov/medicaid/section-1115-demonstrations/downloads/wa-medicaid-transformation-ca-06302023.pdf ↩︎
  53. Hawaii QUEST Integration Section 1115 waiver extension request, January 2024, https://www.medicaid.gov/medicaid/section-1115-demonstrations/downloads/hi-quest-pa-01172024.pdf Michigan 1115 Behavioral Health Demonstration extension request, April 2024, https://www.medicaid.gov/medicaid/section-1115-demonstrations/downloads/mi-behavioral-health-demo-extn-appl-req-pa.pdf Rhode Island Comprehensive Demonstration Section 1115 waiver extension request, May 13 2024, https://www.medicaid.gov/medicaid/section-1115-demonstrations/downloads/ri-compr-demo-hrsn-cm-adnm-extnsn-aplctn-pa.pdf ↩︎
  54. West Virginia Creating a Continuum of Care for Medicaid Enrollees with Substance Use Disorders (SUD) Section 1115 waiver extension request, May 2022, https://www.medicaid.gov/medicaid/section-1115-demonstrations/downloads/wv-creating-continuum-care-medicaid-enrollees-sud-ext-req-06012022.pdf ↩︎
  55. The 14 states that reported expanding coverage of doula services are: Arizona, Colorado, Delaware, Illinois, Kansas, Massachusetts, Missouri, New Hampshire, New York, Ohio, Oklahoma, Pennsylvania, South Dakota, and Washington. Publicly available information was used to confirm the target implementation date of Washington’s doula benefit:  https://www.hca.wa.gov/billers-providers-partners/program-information-providers/doulas ↩︎
  56. The 8 states that reported expanding coverage of lactation consultation and breastfeeding supports are: Colorado, Connecticut, Illinois, Missouri, Nebraska, New Hampshire, New Mexico, and Tennessee. ↩︎
  57. South Dakota Medicaid Billing and Policy Manual, Pregnancy Program, August 2024, Pregnancy_Program.pdf (sd.gov) ↩︎
  58. New Jersey FamilyCare Comprehensive Demonstration, March 2023, nj-1115-cms-exten-demnstr-aprvl-03302023.pdf (medicaid.gov) ↩︎
  59. MassHealth Medicaid and Children’s Health Insurance Program (CHIP) Section 1115 Demonstration, Special Terms and Conditions, April 2024, https://www.mass.gov/doc/masshealth-amendment-stcs-4-19-24-0/download ↩︎
  60. Beginning October 1, 2023, Section 11405 of the Inflation Reduction Act (IRA) requires Medicaid coverage for approved adult vaccines recommended by the Advisory Committee on Immunization Practices (ACIP) and their administration, without cost sharing. ↩︎
  61. The National Institute for Medical Respite Care reports Michigan’s recuperative care benefit, approved outside of Section 1115 waiver authority, will be funded using a combination of state general fund dollars (for room and board services) and federal Medicaid match (for care coordination services). National Institute for Medical Respite Care, Issue Brief: Status of State-Level Medicaid Benefits for Medical Respite Care (January 2024), https://nimrc.org/wp-content/uploads/2024/01/Status-of-State-Level-Benefits-for-Medical-Respite-Care-4.pdf ↩︎
  62. CMS, Coverage of Health-Related Social Needs (HRSN) Services in Medicaid and CHIP (November 2023, available at Coverage of Health Related Social Needs Services in Medicaid and CHIP. ↩︎
  63. See also KFF Section 1115 Medicaid Waiver Tracker, available at https://modern.kff.org/medicaid/issue-brief/medicaid-waiver-tracker-approved-and-pending-section-1115-waivers-by-state/ A Section 1115 waiver is generally required to include room and board as part of a medical respite benefit. As of October 2, 2024, 7 states (California, Illinois, Massachusetts, New Mexico, New York, North Carolina, and Washington) have approved Section 1115 waivers for medical respite services and 6 states (District of Columbia, Hawaii, Kentucky, Rhode Island, Utah, and Vermont) have Section 1115 waiver requests pending. ↩︎
  64. eMedNY New York State Medicaid Provider Policy Manual: Community Health Worker Services Policy Manual, https://www.emedny.org/ProviderManuals/CommunityHealth/PDFS/CHW_Policy_Manual.pdf ↩︎
  65. State of New Mexico Medical Assistance Program Manual Supplement: Implementation of Community Health Workers (CHW) and Community Health Representatives (CHR), May 2024, https://www.hca.nm.gov/wp-content/uploads/Final-24-08-Supplement-CHW-CHR-LR_TDG5.20.24-003-1.pdf ↩︎
  66. Georgia State Plan Amendment (#24-0005), August 2024, GA-24-0005.pdf (medicaid.gov) ↩︎
  67. Nebraska Department of Health and Human Services, Medicaid Dental Care, https://dhhs.ne.gov/Pages/Medicaid-Dental-Care.aspx ↩︎
  68. Department of Vermont Health Access, Advisory: Dental Benefit Changes are being Implemented July 1, 2023, July 2023, July2023Advisory.pdf (vtmedicaid.com) ↩︎
  69. State fiscal years begin on July 1 except for these states: New York on April 1; Texas on September 1; Alabama, the District of Columbia, and Michigan on October 1. ↩︎
  70. Florida did not respond to the 2024 survey. In some instances, we used publicly available data or prior years’ survey responses to obtain information for Florida. However, unless otherwise noted, Florida is not included in counts throughout the survey. ↩︎
News Release

After Pandemic-Era Policies and Enhanced Funding End, State Medicaid Officials Report Enrollment Declines and Upward Cost Pressures 

Costs are limiting states’ coverage of obesity drugs and could affect other Medicaid priorities

Published: Oct 23, 2024

States expect national Medicaid enrollment to decline by about 4% and state Medicaid spending to rise by 7% in fiscal year (FY) 2025. These rates follow a larger but anticipated enrollment decline and state spending increase in FY 2024, as pandemic-era policies and federal funding expired, according to KFF’s 24th annual survey of state Medicaid directors.While state fiscal conditions remain stable heading into FY 2025, the longer-term fiscal and policy outlook for Medicaid programs is less certain. Reduced state revenue collections, the expiration of pandemic-era federal funding, and macroeconomic uncertainties, may discourage states from increasing funding for access to behavioral health, long-term services and supports, and higher provider reimbursement rates—and could prompt spending reductions. The upcoming election also contributes to a more uncertain outlook for states and their Medicaid programs.With some limits on their use, 12 state Medicaid programs reported covering GLP-1 drugs for obesity treatment (such as Wegovy and Zepbound) as of July 2024. Half of states without coverage are considering adding coverage, but most say that cost was a key factor in their decisions, according to KFF’s companion report, which highlights the key policy priorities and issues that state Medicaid programs focused on in FY 2024 and are prioritizing in FY 2025. Rising prescription drug costs are an ongoing concern for states and nearly three-quarters of them reported at least one new or expanded initiative to contain prescription drug costs in FY 2024 or FY 2025.

The survey was conducted in the summer of 2024 by KFF and Health Management Associates (HMA) in collaboration with the National Association of Medicaid Directors (NAMD). This year’s estimates of Medicaid spending and enrollment reflect what is assumed in states budgets in most cases, though projections always include some uncertainty.

What Are the Primary Medicaid Eligibility Pathways for Dual-Eligible Individuals?

Authors: Alice Burns, Maria T. Peña, Maiss Mohamed, Meredith Freed, and Molly O’Malley Watts
Published: Oct 22, 2024

Issue Brief

In 2021, 1 in 5 Medicare beneficiaries or 13.1 million people, known as “dual-eligible individuals,” had both Medicare and Medicaid coverage. Eligibility for Medicare, which is the primary source of coverage for dual-eligible individuals, is based on their age or disability status. For most dual-eligible individuals, there are two pathways to Medicaid eligibility: one is through Medicaid eligibility pathways for seniors and people with disabilities and the other is through the Medicare Savings Programs. These eligibility pathways confer different benefits. The Medicaid eligibility pathways provide coverage of Medicaid benefits that are not otherwise covered by Medicare including long-term services and supports (LTSS), vision, and dental care. The Medicare Savings Programs cover Medicare premiums and often, cost sharing, but not Medicaid benefits. Medicare beneficiaries who are only eligible for Medicaid through the Medicare Savings Programs are “partial-benefit” dual-eligible individuals because they only receive coverage of Medicare premiums and often, cost sharing. To be a “full-benefit” dual-eligible individual, Medicare beneficiaries must be enrolled in Medicaid through a Medicaid eligibility pathway beyond the Medicare Savings Programs. (Most full-benefit dual-eligible individuals are eligible for both.)

Federal statutes require states to enroll people who receive Supplemental Security Income (SSI) in Medicaid and to enroll eligible Medicare beneficiaries in the Medicare Savings Programs. Beyond these two “mandatory” eligibility pathways, there are optional Medicaid eligibility pathways that states may choose to offer for people who have disabilities or are ages 65 and older, including options to expand coverage beyond what is required under federal law to low-income seniors and people with disabilities; coverage for “medically needy” individuals who qualify for Medicaid after deducting incurred medical expenses from their income; and coverage for people who need LTSS.

States are currently implementing new rules designed to streamline the enrollment and renewal systems for the Medicare Savings Programs and for Medicaid. The rules are intended to help eligible individuals obtain and maintain Medicaid coverage by reducing administrative burdens on applicants and enrollees. As the new requirements start to take effect, this brief examines current Medicaid eligibility policies and enrollment patterns using data from KFF’s 2024 50-state survey of states’ eligibility and enrollment policies for seniors and people with disabilities, and 2021 Medicare and Medicaid claims data from the Centers for Medicare and Medicaid Services (CMS).

Key Takeaways

  • Most of the 13.1 million dual-eligible individuals are enrolled in Medicaid through mandatory eligibility pathways: 4.6 million through SSI and 4.1 million through the Medicare Savings Programs. The remaining 4.5 million are enrolled through optional pathways (Figure 1).
  • Among the 9.7 million dual-eligible individuals with full Medicaid, nearly half (47%) are eligible through the only mandatory pathway to full Medicaid, which is SSI.
  • Although it is only offered by 28 states, the next most common pathway for full Medicaid is an optional pathway that provides coverage for seniors and people with disabilities who have income below the federal poverty level, covering 14% of full-benefit dual-eligible individuals. Other optional pathways are offered by more states but only a small percentage of dual-eligible individuals enroll in each of those pathways (Figure 2).
  • Virtually all (92%) dual-eligible individuals with partial Medicaid (3.1 million) are eligible through the Medicare Savings Programs. Federal law defines minimum income and resource limits for each of the Medicare Savings Programs, but in 2024, 18 states reported having income and/or asset levels above the federally required limits for the Medicare Savings Programs. Those states are home to 1.1 million or a third (33%) of dual-eligible individuals with partial Medicaid.
  • As new federal requirements for enrolling people in the Medicare Savings Programs take effect, most states report being in compliance with the requirements by October 2024.

Enrollment in Key Medicaid Eligibility Pathways for Dual-Eligible IndividualsE

KFF’s Survey of Medicaid Financial Eligibility & Enrollment Policies for Seniors & People with Disabilities, was conducted by KFF and Watts Health Policy Consulting, and describes states’ eligibility and enrollment policies for seniors and people with disabilities as of June 2024. Overall, 49 states and the District of Columbia (hereafter referred to as a state) responded to the survey, though response rates to specific questions varied (Florida was the only state that did not respond). Responses were supplemented with publicly available information and data from KFF’s 2022 survey when available.

The analysis also uses merged beneficiary-level Medicare and Medicaid data from 2021—the most recent full release of Medicaid data—to analyze how many dual-eligible beneficiaries enter Medicaid through each of the eligibility pathways. The enrollment analysis includes 13.1 million dual-eligible individuals in 2021 (see Methods).

How do full-benefit dual-eligible individuals become eligible for Medicaid?

Medicaid Eligibility Pathways for Seniors and People with Disabilities

To qualify for full Medicaid benefits, dual-eligible individuals must meet Medicaid eligibility criteria, typically through eligibility pathways specific to people ages 65 and older (seniors) and people with disabilities (see Appendix). The Medicaid pathways in which eligibility is based on old age or disability are known as “non-MAGI” pathways because they do not use the Modified Adjusted Gross Income (MAGI) financial methodology that applies to children, pregnant individuals, parents, and other non-elderly adults with low incomes. (Medicare beneficiaries who are eligible because of a disability may enroll in Medicaid through all MAGI pathways other than the pathway for adults eligible through the Affordable Care Act, but more often qualify through disability-related pathways. Medicare beneficiaries who are ages 65 and older are generally not eligible for Medicaid through the MAGI pathways.)

In addition to considering income, non-MAGI Medicaid applicants must meet other eligibility requirements that make the application more onerous than is the case for MAGI applicants. Non-MAGI applicants must meet eligibility requirements related to their age or disability status and unless living in a state that has eliminated asset limits, most applicants must demonstrate that they have limited savings and other financial resources (e.g., assets). Medicaid enrollees who use LTSS must also meet requirements related to their functional needs which are generally measured by their ability to perform activities of daily living such as eating and bathing. Beyond SSI (the only mandatory pathway), the main optional non-MAGI pathways to full Medicaid eligibility include state options to expand coverage to low-income seniors and people with disabilities, “medically needy individuals” who qualify for Medicaid by deducting incurred medical expenses from their income, and coverage for people who use LTSS. Each group has different rules about income and assets, making eligibility determinations complex.

Most full-benefit dual-eligible individuals are also eligible for the Medicare Savings Programs, but eligibility for the Medicare Savings Programs does not provide access to full Medicaid. To be a full-benefit dual-eligible individual, people enrolled in the Medicare Savings Programs must also meet the eligibility criteria for one of the other Medicaid eligibility pathways, in which case, they would be eligible for Medicaid through two mechanisms: whichever Medicaid pathway confers eligibility for full Medicaid and the Medicare Savings Programs (which cover Medicare premiums and often, cost sharing).

Mandatory eligibility through SSI

In 2021, 4.6 million full-benefit dual-eligible individuals were enrolled in Medicaid through the only pathway that states are required to cover, SSI (Figure 2). Those enrollees comprised 47% of all full-benefit dual-eligible individuals. To be eligible for SSI, beneficiaries must have low incomes, limited assets, and either be older than 64 or have a qualifying disability. Although there is a standard federal maximum benefit, some states supplement the federal benefit with additional payments. In those states, the SSI benefit levels—and applicable income limits for SSI recipients—are higher.

The proportion of full-benefit dual-eligible individuals enrolled in Medicaid through SSI varied across states—from less than 30% in nine states to over 85% in Maine, Texas, and Missouri (Appendix Table 2). Such variation reflects differences in the SSI income limit and the extent to which the states offer coverage through optional Medicaid eligibility pathways in addition to the mandatory SSI pathway, among other factors such as disability rates, demographic characteristics, eligibility determinations, and data quality/availability.

Basis of Medicaid Eligibility for Full-Benefit Dual-Eligible Individuals

A total of 2.2 million full-benefit dual eligible individuals are eligible for Medicaid through optional eligibility pathways for low-income seniors and people with disabilities. Some of the more prominent options include: “buy in” programs for working people with disabilities (available in 49 states), medically needy coverage (available in 34 states), and coverage for seniors and people with disabilities with incomes above the SSI eligibility thresholds (available in 28 states). The KFF survey did not include the buy in programs in 2024, so states’ policies come from the 2022 KFF survey.

The optional eligibility pathway that was offered by the fewest states enrolled the largest number of full-benefit dual-eligible individuals: low-income seniors and people with disabilities, which covered 14% of full-benefit dual-eligible individuals (1.3 million people). The pathway for low-income seniors and people with disabilities is the simplest pathway administratively because it only requires information about people’s income and in most cases, assets. Most other non-MAGI eligibility pathways also require information about people’s health status, functional status, or spending on health care. The share of full-benefit dual-eligible individuals eligible through the state option to expand coverage to low-income seniors and people with disabilities was 14% nationally and ranged from less than 1% in 33 states to over 40% in Hawaii, Massachusetts, and North Carolina (Appendix Table 2).

More than 775,000 or 8% of full-benefit dual-eligible individuals were enrolled in medically needy coverage in 2021 (Figure 2). This pathway is one of the most complex administratively because people are eligible if their income exceeds the limit of another pathway, but only if they “spend down” to the medically needy limit by deducting health care expenses from their income. The after-health care spending income limits tend to be low—below 50% of the federal poverty level in more than half of the states offering such coverage. There were only four states (Illinois, Maryland, New York, and North Dakota) in which more than 20% of full- benefit dual-eligible individuals were enrolled through medically needy pathways.

The Medicaid buy in program refers to multiple Medicaid eligibility pathways that serve workers with disabilities who are earning income and for whom states may charge premiums as a condition of Medicaid eligibility, which combined enrolled only 2% of full-benefit dual-eligible individuals in 2021 (almost 154,000 people). Under the buy ins, states cover people with disabilities who are working, even if their income or assets exceed the limit for other eligibility pathways. This option enables people with disabilities to retain Medicaid’s coverage of medical care and LTSS as their income increases. Medicaid can fill in coverage gaps for working people with disabilities because private health insurance typically does not cover all the services and supports that they need to live independently and work. Iowa was the only state in which at least 20% of full-benefit dual-eligible individuals were enrolled through a buy in.

In 2024, 1.0 million people were eligible through several widely adopted Medicaid eligibility pathways specific to people using LTSS who require an institutional level of care (Figure 2, Appendix Table 1). The two primary eligibility pathways for people using LTSS include Katie Beckett coverage for children who have significant disabilities requiring an institutional level of care but living at home (43 states) and the special income rule, which covers other people requiring an institutional level of care with incomes up to 300% of the SSI benefit rate ($2,829 in 2024). Overall, 42 states offer coverage through a special income rule, with 41 states offering the option to people in institutions and 41 states offering the option to people living at home. Less is known about states’ other home- and community-based services (HCBS) expansions, which include state-specific demonstration programs and people who are eligible for Medicaid through the Program of All-Inclusive Care for the Elderly. (KFF’s eligibility surveys excluded other HCBS expansions.) LTSS-related pathways are administratively complex because applicants must demonstrate their need for an institutional level of care. As a result, people who may be eligible for Medicaid through LTSS-related pathways and through other pathways are more likely to be enrolled through those other pathways.

Although these optional Medicaid eligibility pathways related to LTSS are adopted by most states, they collectively enrolled only 11% of full-benefit dual-eligible individuals (1 million) in 2021 (Figure 2). Low enrollment in Katie Beckett reflects the fact that there are few dual-eligible individuals under the age of 19. For the other three LTSS-related pathways, dual-eligible individuals comprise three quarters of all Medicaid enrollees (see Appendix). Across the states, the percentage of dual-eligible individuals enrolled in Medicaid through each of the LTSS-related pathways varies, with some states having over 20% of dual-eligible individuals enrolled in other HCBS expansions or a special income rule program (Appendix Table 2).

Other or Unknown Medicaid eligibility pathways

Roughly 1.9 million full-benefit dual-eligible individuals were eligible for Medicaid through other or unknown Medicaid eligibility pathways, including 0.9 million individuals who were in states that recorded their eligibility in the administrative data as the Medicare Savings Programs. In the Medicaid administrative data, enrollees receive only one eligibility code each month; therefore among the full-benefit dual-eligible individuals in the Medicaid Savings Programs it is unknown how those full-benefit dual-eligible individuals became eligible for full Medicaid. The remaining 0.9 million full-benefit dual-eligible individuals were in an “other” or “unknown” Medicaid eligibility group. Those pathways included missing values and values for the smaller eligibility groups, nearly all of which correspond to eligibility for children and parents. (Totals do not add up to 1.9 million due to rounding.) 

How do partial-benefit dual-eligible individuals become eligible for Medicaid?

The Medicare Savings Programs

Dual-eligible individuals with partial Medicaid benefits do not receive coverage of the full range of Medicaid benefits, such as long-term services and supports, but do receive payments of Medicare premiums and, in most cases, cost sharing through the Medicare Savings Programs. Medicare beneficiaries are responsible for payment of Medicare premiums, deductibles, and other cost sharing requirements unless they have supplemental coverage, a Medicare Advantage plan that covers some of the cost sharing, or have incomes and assets low enough to qualify for the Medicare Savings Programs (under which state Medicaid programs provide assistance with Medicare Part A and Part B premiums and/or cost sharing) and the Part D Low-Income Subsidy (LIS) (which helps with Medicare Part D drug plan premiums and cost sharing).

Under the Medicare Savings Programs, state Medicaid programs pay for premiums and/or cost sharing for Medicare beneficiaries who have monthly incomes up to 135% FPL under federal guidelines ($1,715 for individuals and $2,320 for couples in 2024) and assets up to 300% of the limit for Supplemental Security Income ($9,430 for individuals and $14,130 for couples in 2024; unlike SSI, asset limits for the Medicare Savings Programs are adjusted for inflation and increase each year). There are four eligibility categories within the Medicare Savings Programs (box 1), which confer different benefits based on different eligibility criteria. States must cover people who meet the federal eligibility requirements for the Medicare Savings Programs but may elect to increase income or asset eligibility limits beyond federal levels.

Box 1: The Medicare Savings Programs

There are four Medicare Savings Programs that help Medicare beneficiaries get help from Medicaid to pay their Medicare premiums and in many cases, cost sharing.

• The Qualified Medicare Beneficiary (QMB) program pays for Part A and B premiums, deductibles, coinsurance, and copayments. Medicare beneficiaries are eligible for the QMB program if their monthly income is below the FPL ($1,275 for individuals and $1,724 for couples in 2024) and if their assets are below the resource limit ($9,430 for individuals and $14,130 for couples in 2024).

• The Specified Low-Income Medicare Beneficiary (SLMB) program pays for Part B premiums only. Medicare beneficiaries are eligible for the SLMB program if their monthly income is below 120% of the FPL ($1,526 for individuals and $2,064 for couples in 2024) and if their assets are below the resource limit ($9,430 for individuals and $14,130 for couples in 2024).

• The Qualifying Individual (QI) program pays for Part B premiums only. Medicare beneficiaries are eligible for the QI program if their monthly income is below 135% of the FPL ($1,715 for individuals and $2,320 for couples in 2024) and if their assets are below the resource limit ($9,430 for individuals and $14,130 for couples in 2024).

• The Qualified Disabled and Working Individual (QDWI) program pays for Part A premiums only. Medicare beneficiaries are eligible for the QDWI program if they have a disability and lost their premium-free Medicare Part A because they returned to work. Their monthly income must be below 200% of the FPL ($5,105 for individuals and $6,899 for couples in 2024) and if their assets are below the resource limit ($4,000 for individuals and $6,000 for couples in 2024).

(Resource limits do not include $1,500 for burial expenses.)

In 2021, 92% of partial-benefit dual-eligible individuals were primarily eligible for Medicaid through the Medicare Savings Programs (Figure 3, Appendix Table 3). Among the 3.4 million people eligible for partial Medicaid benefits, more than nine in ten were eligible through the Medicare Savings Programs (3.1 million people). In all but six states, more than 80% of partial-benefit dual-eligible individuals were eligible through the Medicare Savings Programs. Among the remaining 8%, the largest eligibility category was through medically needy coverage (2% of partial benefit individuals, fewer than 0.1 million people). Dual-eligible individuals may have partial Medicaid benefits through medically needy programs because states may elect to only cover a subset of Medicaid benefits through their medically needy programs. The remaining 6% of partial-benefit dual-eligible individuals were eligible through other partial-benefit pathways such as those for family planning services, individuals needing treatment for breast or cervical cancer, and other eligibility pathways that may have occurred at some other point in the year.

Basis of Medicaid Eligibility for Partial-Benefit Dual-Eligible Individuals

Changes in eligibility and enrollment for the Medicare Savings Programs

In 2024, 18 states reported having income and/or asset levels above federally required levels for the Medicare Savings Programs. (Figure 4, Appendix Table 3). Overall, 33 states use the federal eligibility criteria, and the remaining 18 states—home to 1.1 million or a third (33%) of partial-benefit dual-eligible individuals—have more generous eligibility limits on income, assets or both:

  • 3 states have either income or asset levels higher than the federally required levels (Colorado, Indiana, and Minnesota)
  • 9 states use the federal income levels but have no asset test (Alabama, Arizona, California, Delaware, Louisiana, Mississippi, New Mexico, Oregon, and Vermont)
  • 6 states have income levels higher than federally required and no asset test (Connecticut, District of Columbia, Maine, Massachusetts, New York, and Washington).

Many of the higher income and asset eligibility policies were new in 2024. Of the 7 states with higher income levels, 3 states reported raising the income eligibility criteria in 2024: Indiana increased the income limit for the Qualified Individuals program to 200% FPL, Massachusetts raised the income limits for all of the programs, and Washington increased the income limit for Qualified Medicare Beneficiary Program. (The remaining 4 states had higher income limits in earlier years but did not increase them in 2024.) Among the two states with asset limits higher than federally required levels, Colorado reported that change for the first time in 2024, but Minnesota had higher asset limits in earlier years. Among the 15 states with no limit on assets, that policy was new to California, Maine, and Massachusetts in 2024.

In 2024, 18 States Reported Having Income and/or Asset Limits Above Federally Required Levels for the Medicare Savings Programs

Some of the 2024 eligibility changes may be responses to a 2023 final rule on eligibility and enrollment in the Medicare Savings Programs. CMS expects the final rule to increase enrollment in the Medicare Savings Programs by nearly 1 million. New enrollments include people who enroll in the Medicare Savings Programs because of the rule, and gains in months of coverage among people who would have enrolled anyway but now face fewer administrative barriers, resulting in either gaining Medicaid earlier or experiencing less churn in and out of the program. Prior KFF research found that many low-income Medicare beneficiaries are not enrolled in the Medicare Savings Programs. The rule reduces barriers to coverage by improving alignment between the Medicare Savings Programs and applications for Medicare’s Part D Low-Income Subsidy, requiring states to automatically enroll Medicare beneficiaries with SSI into the Medicare Savings Programs, and making it easier for applicants to document their financial resources when applying for Medicaid.

In 2024, 31 states reported that they already automatically enroll Medicare beneficiaries who receive SSI into the Medicare Savings Programs, one of the key requirements of the new rule (Appendix Table 4). Of the remaining states, 15 reported plans to do so by October 2024, while 4 states reported needing additional time to comply. Among states not already in compliance, the most common reasons cited were related to modernizing or updating existing systems to implement the change.

Methods

Medicaid Financial Eligibility and Enrollment Policies Data: KFF’s 50-state survey and from administrative records from the Centers for Medicare and Medicaid Services (CMS). KFF’s Survey of Medicaid Financial Eligibility & Enrollment Policies for Seniors & People with Disabilities was conducted in March 2024 by KFF and Watts Health Policy Consulting.

Enrollment Data: Data are from a KFF analytic file that merged the Centers for Medicare & Medicaid Services Chronic Conditions Data Warehouse 2021 research-identifiable Master Beneficiary Summary File (MBSF) Base and the 2021 Transformed Medicaid Statistical Information System (T-MSIS) Analytic Files (TAF) Research Identifiable Files (RIF) file using a Chronic Conditions Warehouse (CCW) beneficiary identifier crosswalk.

State inclusion criteria: Estimates include enrollees living in the 50 states and DC, excluding residents in the territories.

Dual-eligible individual inclusion criteria: Dual-eligible individuals were included if (1) they were in both the MBSF and T-MSIS files using the CCW crosswalk, and (2) Dual-eligible individuals are assigned full-benefit status and partial benefit status using an “ever” approach and a hierarchy by giving priority to the full-benefit status. Individuals were a full-benefit dual-eligible individual in 2021 using the Medicare monthly DUAL_STUS_CD with values of 02,04,08 or the Medicaid monthly code DUAL_ELGBL_CD with values of 02,04,08 or the monthly code RSTRCTD_BNFTS_CD_03 values of 1,A,D,4,5,7.If not a full-benefit dual-eligible and the individual had  DUAL_STUS_CD with values of 01,03,05,06 or the Medicaid monthly code DUAL_ELGBL_CD with values of 01,03,05,06 or the monthly code RSTRCTD_BNFTS_CD_03 values of 2,3,C,6,E,F they were assigned partial-benefit status.

Assignment to Medicaid eligibility categories. Dual-eligible individuals were assigned to each eligibility category by using the ELGBLTY_GRP_CD_LTST in 2021.

Eligibility groups for full-benefit dual-eligible individuals:

  • Supplemental social security income (SSI) with values of 11-22, 37, 38, 40, 41
  • Seniors and People with Disabilities up to 100% FPL (SPD) with values of 46.
  • Medically needy with values of 53-56, 59, 60.
  • HCBS Expansion with values of 39, 43, 51.
  • Special Income Rule to Extend LTSS Eligibility up to 300% SSI (Institutional) with a value of 42.
  • Special Income Rule to Extend LTSS Eligibility up to 300% SSI (HCBS) with a value of 52.
  • Disability work programs with values of 47, 48, 49.
  • Katie Beckett with values of 45, 50.
  • All other ELGBLTY_GRP_CD values were categorized as Other/Unknown.

Eligibility groups for partial-benefit dual-eligible individuals:

  • Medicare Savings Program (MSP) with values of 23-26.
  • Medically needy with values of 53-56, 59, 60.
  • All other ELGBLTY_GRP_CD values were categorized as Other/Unknown.

Other and unknown eligibility groups. Among all dual-eligible individuals, 8% had “other” or “unknown” in the eligibility group variable. Those pathways included missing values and values for the smaller eligibility groups, nearly all of which correspond to eligibility for children and parents. Medicare beneficiaries may be eligible for Medicaid through those pathways, but in practice few are because to qualify for Medicare people must either be ages 65 and older or have disabilities that qualify them for Social Security Disability Insurance. There were a small number of dual-eligible individuals who were recorded has having coverage through the Affordable Care Act (ACA) Medicaid expansion, but people are not eligible for ACA coverage if they are enrolled in Medicare. The classification of dual-eligible individuals as having ACA coverage in the data may be partially due to the continuous enrollment provision, which could have carried over an eligibility status from before the person qualified for Medicare.

One limitation to the analysis is that a significant minority (10%) of full-benefit dual-eligible individuals have the Medicare Savings Programs identified as their eligibility code in the Medicaid administrative data. Most full-benefit dual-eligible individuals are eligible for the Medicare Savings Programs, but that eligibility only qualifies them to receive Medicaid coverage of Medicare premiums and often, cost sharing. To receive full Medicaid benefits, they must also be eligible through one of the Medicaid eligibility pathways, but that pathway is unknown if the state recorded “Medicare Savings Programs” as their eligibility code in the administrative data. Related, this analysis does not include estimates of the total number of people enrolled in the Medicare Savings Programs—only the number of dual-eligible individuals for whom the Medicare Savings Programs are the only basis for their Medicaid eligibility.

This work was supported in part by Arnold Ventures. KFF maintains full editorial control over all of its policy analysis, polling, and journalism activities.

Appendix

Key Pathways to Full Medicaid for Dual-Eligible Individuals

To qualify for full Medicaid benefits, Medicare beneficiaries must meet the eligibility criteria for one of the Medicaid eligibility pathways. Among the eligibility pathways that are most common for dual-eligible individuals, some pathways enroll mostly people without Medicare while dual-eligible individuals comprise most enrollees in other pathways.

Supplemental Security Income: States generally must provide Medicaid to people who receive SSI, except in the 8 Section “209(b)” states for which eligibility is not directly tied to SSI. The 209(b) states (Connecticut, Hawaii, Illinois, Minnesota, Missouri, New Hampshire, North Dakota, and Virginia) use financial or functional eligibility criteria that are more restrictive than the federal SSI rules, but no more restrictive than the rules the state had in place in 1972 when SSI was established. In 2021, the 4.6 million dual-eligible individuals enrolled through SSI represented almost half of the 9.6 million total Medicaid enrollees eligible through this pathway.

Poverty Related Coverage: States may choose to offer coverage to seniors and people with disabilities who have low incomes. In 2021, the 1.3 million dual-eligible individuals enrolled through this pathway comprised two thirds of the 1.9 Medicaid enrollees who were enrolled through pathways for low-income seniors and people with disabilities.

Medically Needy Coverage: States may use medically needy pathways to extend coverage to people who would be eligible through another pathway but have income or assets that exceed the limit for that pathwayPeople may qualify through a medically needy pathway if their income is higher than permitted under a different pathway but lower than the medically needy limit, or if they “spend down” to the medically needy limit by deducting health care expenses from their income. For people who spend down to eligibility, states select a budget period between one and six months during which the individual must incur enough expenses to decrease their income below the limit. In 2021, there were 0.9 million dual-eligible individuals, 23% of all Medicaid enrollees eligible through medically needy pathways.

Buy In Programs: Medicaid buy in programs allow people with disabilities to retain Medicaid coverage when their income increases above eligibility levels on account of their own employment. In 2022, the median income limit for the buy in was 250% FPL and the median asset limit was $10,000 for an individual. Although fewer than 0.2 million full-benefit dual-eligible individuals enrolled in the buy in programs in 2021, dual-eligible individuals comprised nearly 80% of all people participating in such programs that year.

Long-Term Services and Supports: States have many options to cover people who use LTSS through Medicaid. Dual-eligible individuals comprise 83% of Medicaid enrollees that are enrolled through the pathways using a special income rule for people who require an institutional level of care and other expansions specifically for people using home- and community-based services (1 million out of 1.2 million). The one LTSS-related pathway that enrolls few duals is the Katie Beckett option, which covers children up to age 19 who require an institutional level of care but are living at home. Nearly 50,000 children were enrolled in 2021, roughly 100 of whom were dual-eligible individuals.

Appendix Tables

State Adoption of Key Medicaid Eligibility Pathways Based on Old Age or Disability as of June 2024

Enrollment of Full-Benefit Dual-Eligible Individuals In Key Medicaid Pathways by State, 2021

Eligibility for and Enrollment in the Medicare Savings Programs Among Partial-Benefit Dual-Eligible Individuals

States' Status for Auto-Enrolling SSI Recipients into the Medicare Savings Programs

Dependent Coverage for Young Adults in Employer-Sponsored Health Plans

Authors: Matthew Rae, Gary Claxton, and Anthony Damico
Published: Oct 21, 2024

Most employers that offer health insurance include the option for enrollees to cover a spouse or other qualified dependents. Dependent coverage plays a key role in providing health insurance for individuals who either do not have access to their own employer-sponsored plan or find the plan they are offered unaffordable. This data note examines how dependent coverage changes with age, using data from the Current Population Survey (CPS) Annual Social and Economic Supplements for 2024.

Overall, just under half of individuals with job-based health coverage are enrolled as a dependent on a family member’s plan (47%). The likelihood of enrolling as a dependent decreases with age. Nearly all children (ages 0-17) with employer-sponsored coverage are enrolled as dependents, usually on a parent’s plan. Young adults, particularly those ages 18-25, are more likely to be covered as dependents than adults overall (72% vs. 32%). The Affordable Care Act (ACA) requires most employer plans allow young adults to remain on a parent’s plan until age 26. Before the ACA, employers typically limited dependent eligibility for young adults to an age less than 26 and often imposed additional eligibility requirements. This provision of the ACA, maintains considerable popularity, and has been credited with reducing the uninsured rate among young adults. In 2024, 56% or 19.3 million young adults aged 18-25 were covered on an employer-sponsored plan (Figure 1).

As young adults age, a greater share of those with employer coverage transitions from dependent coverage to being policyholders. For instance, while a majority of 18 and 19-year-olds with employer-sponsored coverage are still covered as dependents, the proportion decreases among those aged 24 and 25 (93% vs. 50%) (Figure 2).

The CPS asks about individuals’ health coverage and their relationships within the households. The survey does not capture details on how someone enrolled in a plan sponsored by someone outside the household is related to the policy holder. For example, it is not possible to ascertain who sponsors coverage for a young adult living away from home. In many cases, those covered as dependents on an employer plan sponsored by someone outside of the household may be a parent. In total, 17% of young adults with employer sponsored coverage are covered as dependents on a plan sponsored by someone outside the household and 55% are covered by someone in the household. Among young adults enrolled as dependents on a plan sponsored by someone within the household, 93% are covered by a parent, 4% are covered by a spouse and 3% by partner or other family member. These percentages change significantly once an individual reaches age 26, when the share of those covered on dependent employer coverage by a spouse increases substantially compared to those aged 25 (81% vs. 16%). In total, 1.2 million 25-year-olds are covered as dependents on employer plans, compared to 300,000 26-year-olds (Figure 3). The increasing share of 26-year-olds covered as policy holders may reflect a variety of factors, including a general trend of more young adults having job-based offers as they become established in the workforce, and more age 26-years-olds electing to enroll in their own employer plan when they are no longer eligible to enroll as a dependent on a parent’s plan.

More Than Half of Young Adults Are Covered By An Employer Plan
Until Age 26, Most Individuals on Job-Based Plans are Covered Under Someone Else's Plan
Fewer 26 Year Olds are Covered as Dependents on Employer Plans than 25 Year Olds
7-in-10 Adults With Employer Coverage Are Policy Holders

Access to Fertility Care: Findings from the 2024 KFF Women’s Health Survey

Published: Oct 21, 2024

Key Takeaways

  • One in eight (13%) reproductive age women say they or their partner have ever needed fertility services to help them become pregnant or prevent a miscarriage. Similar shares of women across party lines report needing fertility care at some point.
  • However, a smaller share say they have actually received services. One in ten women ages 18 to 49 say they or their partner have received fertility assistance, but 3% of women say they were unable to get the fertility care they needed. Most reproductive age women (87%) say they have never needed fertility services.
  • Cost is the leading reason why women say they could not obtain the fertility care they need. Higher shares of women with low incomes report cost as the main barrier compared to those with higher incomes.
  • The fertility services that reproductive age women most commonly use are fertility advice, fertility testing, and medications to improve ovulation. Among women who say they or their partner ever needed fertility care, 14% report they received in-vitro fertilization (IVF), and 14% report they received artificial insemination (IUI), which translates to 2% of all reproductive age women who report ever receiving either service.
  • One-third (32%) of reproductive age women say it is difficult to access infertility services in their state. Nearly half of women who have ever needed infertility services (48%) say it is difficult to get care in their state, compared to 30% of those who have never needed infertility services.

Fertility care, particularly in vitro fertilization (IVF), came into the spotlight earlier this year when the Alabama Supreme Court issued a ruling declaring that embryos created during the IVF process are “unborn children.” The decision sparked widespread outrage and attention over the role of fetal personhood policies in limiting care for a range of reproductive health care services beyond abortion, including some contraceptives and fertility assistance. IVF has also become an issue on the presidential campaign trail.

The 2024 KFF Women’s Health Survey provides new data on access to fertility care, including women’s opinions about access in their state, cost barriers, and the range of fertility services that women use. The survey was conducted from May 13 – June 18, 2024, online and by telephone among a nationally representative sample of 6,246 adults ages 18 to 64, including 3,901 women ages 18 to 49. This paper presents data among women ages 18 to 49.

Need for Fertility Care and Cost Barriers

One in eight (13%) women ages 18 to 49 say they or their partner needed fertility assistance services at some point. Nationally, 13% of reproductive age women report needing fertility services to become pregnant or prevent a miscarriage at some time in their lives (Figure 1). Higher shares of women ages 36 to 49 (18%) report ever needing fertility services at some point, compared to 4% of women ages 18 to 25 and 13% of those ages 26 to 35.

The need for fertility care is similar across most other demographic groups, except slightly lower among Black women (9%) compared to their White counterparts (14%). Similarly, 10% of women with lower incomes report needing fertility services, slightly less than women with higher incomes (15%). The survey finds that similar shares of women across party lines report needing fertility care at some point. Similar shares of lesbian/gay women (12%), bisexual women (12%), and non-LGB women (14%) report needing fertility services at some point to become pregnant or prevent a miscarriage. Compared to women who do not follow any religion in particular (11%), higher shares of those who identify as Protestants (16%) or some other religion (16%) report ever needing fertility assistance.

One in Eight Women of Reproductive Age Say They Needed Fertility Assistance At Some Point to Become Pregnant or Prevent a Miscarriage

Among all reproductive age women, one in ten say they or their partner have received fertility services at some point. One in ten women have received fertility services, while 3% say they needed services but were not able to obtain it (Figure 2). While a relatively small share of women say they could not obtain fertility services, they may not be able to grow their families as desired because they could not get the care they needed. Most reproductive age women (87%) say they have never needed fertility services. This may include women who have not yet tried to become pregnant as well as women who do not want to have children.

One in Ten Reproductive Age Women Say They Have Received Fertility Assistance Services At Some Point

The leading reason why women say they didn’t get needed fertility services is cost. This is more commonly reported among women with low incomes.

There are many obstacles to receiving fertility care, including costs, coverage, provider availability, and time constraints. However, cost is by far the single largest barrier. Among reproductive age women who reported needing fertility services at some point, 12% (2%of all reproductive age women) say they did not receive these services and cost was the primary reason (Figure 3). Not surprisingly, this is more common among women with lower incomes. Among women who said they ever needed fertility services, a quarter (24%) with lower incomes cite cost as the main reason they could not obtain fertility services, compared to 6% of women with higher incomes. Overall, this represents 2% of all reproductive age women with low incomes and less than 1% of those with higher incomes who say they did not obtain fertility services because of cost.

Coverage for fertility services is limited in both private insurance and Medicaid. The 2024 KFF Employer Health Benefits Survey finds that about a quarter (27%) of large firms that offer health benefits cover IVF services. Some states require state-regulated private insurers to cover some level of fertility services, but Medicaid, the health coverage program for people with lower incomes, rarely covers fertility services. In fact, federal law exempts state Medicaid programs from a requirement to cover fertility medications, which is different from most other outpatient prescription drugs which typically must be covered by the program.

There is a wide range of services that people may use for fertility assistance and the costs vary widely too, with the most expensive services exceeding thousands of dollars on average, which makes them out of reach for most people, particularly those with lower incomes and those with limited or no insurance coverage.

The Majority of Women Who Needed Fertility Services Received Them, But Cost Was the Primary Reason For Not Receiving Needed Fertility Services

Types of Fertility Services

The leading fertility services that women report receiving are advice, testing, and drugs to improve ovulation.

Fertility assistance encompasses a broad array of services, including advice and counseling, medications, surgical procedures, diagnostic tests, imaging studies, cryopreservation, intrauterine insemination (IUI), in-vitro fertilization (IVF), and surrogacy. Depending on individual circumstances, people may use a variety of these services to become pregnant and/or to prevent miscarriages, particularly if they have a history of or are at higher risk for pregnancy loss. The costs of services also vary greatly.

Among the 13% of reproductive age women who ever needed fertility services, about half said they received advice (50%) or testing for themselves or their partner (45%), and more than a third (38%) received drugs (e.g. clomid, hormones, etc.) to improve ovulation (Figure 4). Just over one in ten (12%) women said they had a corrective surgery or drugs to address an issue such as fibroids or endometriosis. Among all reproductive age women, the shares who have used these services are smaller and presented in Figure 4 and Appendix Table 1.

Among the one in eight reproductive age women who said they or their partner ever needed fertility services, 14% report they received IVF, and 14% report they received artificial insemination, also known as IUI. This translates to 2% of all reproductive age women who report receiving IVF or IUI.

IVF is a medical procedure where a sperm and egg are combined in a lab setting to create an embryo, which is then placed in the uterus. While a relatively small share of people ever use IVF or IUI, many seek these services after trying a range of other services such as medications, acupuncture, and surgeries. The IVF process is complex and can involve several procedures, including egg freezing, which 7% of women who needed fertility services said they received. Costs for a single course of IVF average between $9,000 and $14,000, and many people require multiple rounds. Insurance coverage of IVF is limited in private insurance and nearly non-existent for those covered by Medicaid, making it unaffordable for many people. Some grant programs are available to help offset costs, but they are limited and only reach a relatively small portion of people in need of services.

Artificial insemination, also known as Intrauterine insemination (IUI) is another fertility procedure that involves injecting sperm into the uterus. It is less invasive and less expensive than IVF, and some people choose it for those reasons.

In the wake of public outrage at the Alabama court ruling, politicians across parties have said they want to promote greater access to IVF, including former President Donald Trump who has said that he would provide access to full coverage of IVF costs if elected President through a mandate on insurance companies and federal funding. At the same time, a federal proposal to guarantee a right to IVF access across the country failed to pass in the U.S. Senate twice in 2024, with opposition from nearly all Republican members, including Vice Presidential Nominee JD Vance during the first IVF vote in June.

Among the One in Eight Reproductive Age Women Who Say They Ever Needed Fertility Assistance, 14% Report Receiving In Vitro Fertilization (IVF)

Smaller shares of women with lower incomes report receiving fertility services.

Fertility services can be very costly, and women with lower incomes report using many services at lower rates compared to those with higher incomes (Figure 5). Among the 13% of reproductive age women who needed fertility services, one-third of women with lower incomes say they received advice, compared to nearly six in ten women with higher incomes (59%). About one in four women with lower incomes who needed fertility services say that have used drugs for ovulation (28%) and testing services for themselves or a partner (25%), which is lower than women with higher incomes (44%and 56% respectively). Eight percent of women with low incomes who have ever needed fertility services say they received IVF, compared to 17% of women with higher incomes. Similarly, smaller shares of women with low incomes who needed fertility services (4%) report receiving IUI compared to those with higher incomes (18%).

Among the 13% of Women Who Say They Ever Needed Fertility Assistance, Those With Low Incomes Report Lower Use of Fertility Services

Women’s Perceptions on Access to Fertility Services

One-third of women ages 18 to 49 say it is difficult to access infertility services in their state.

One-third of women of reproductive age say it is difficult (32%) to access infertility services in their state. A smaller share say it is easy (19%), while almost half (48%) do not know, likely because 93% of this group (data not shown) say they have never needed such care. Notably, among women who say they have needed fertility care at some point, almost half (48%) characterize access as difficult (Figure 6).

About Half of Reproductive Age Women Who Have Needed Infertility Services Say it Is Difficult to Access in Their State

Cost stands out as the single largest barrier to fertility care, and across the board, access to the range of fertility services is lower among people with lower incomes. There are no federal requirements to cover fertility services in insurance plans. Some states have enacted fertility coverage requirements, but their reach is limited and piecemeal. Former President Trump has said that if elected, his administration would require full coverage for the costs of IVF, but this would not be possible without Congress passing a law. This seems unlikely given the two failed attempts to pass a law recognizing the right to IVF services.

Women's Access to and Use of Fertility Services, by Income Level

Key Facts About Medigap Enrollment and Premiums for Medicare Beneficiaries

Published: Oct 18, 2024

Issue Brief

Health insurance through Medicare provides important financial protections for 67 million Americans. However, people with Medicare can face substantial cost-sharing requirements for Medicare-covered services, and unlike most health insurance policies, Medicare has no limit on out-of-pocket spending. Many Medicare beneficiaries have modest incomes and little savings to draw on to pay for expensive medical care, and medical debt is a concern for more than one in five (22%) older adults. In light of these facts, the Medicare supplement insurance market, also known as Medigap, plays a key role in helping beneficiaries afford medical care by limiting their exposure to catastrophic out-of-pocket medical costs.

This brief presents facts about Medigap, including the characteristics of Medicare beneficiaries with a Medigap policy, variation in Medigap enrollment by state, and Medigap premiums. This analysis is based on data from the National Association of Insurance Commissioners (NAIC) compiled by Mark Farrah Associates (MFA), through the end of 2023 (the most recent year of annual data) and the Centers for Medicare & Medicaid Services (CMS) Medicare Current Beneficiary Survey 2022 Survey File data. See methods for more information. A companion brief Medigap May Be Elusive for Medicare Beneficiaries with Pre-Existing Conditions analyzes federal and state guaranteed issue rules and how they impact beneficiaries’ access to Medigap.

Key Takeaways

  • In 2022, 12.5 million, or four in 10 (42%) people in traditional Medicare had a Medigap policy. Compared to all traditional Medicare beneficiaries in 2022, traditional Medicare beneficiaries with a Medigap policy are more likely to be White, have higher incomes, and report better health. Among traditional Medicare beneficiaries, a smaller share of beneficiaries under age 65 with disabilities have a Medigap policy compared to beneficiaries ages 65 and older (7% vs 46%), due in part to a lack of Medigap guaranteed issue protections under federal law for those under age 65.
  • The share of traditional Medicare beneficiaries with Medigap varies by state, ranging from 9% in Hawaii to 67% in Iowa. States with higher Medigap enrollment tend to be in the Midwest and plains states, where relatively fewer beneficiaries are enrolled in Medicare Advantage plans.
  • Medigap Plan G, which is the most comprehensive Medigap policy available to new policyholders, was the most popular plan type in 2023, accounting for 39% of all policyholders, or nearly 5.3 million people. Part F, which has the same benefits as Plan G but also covers the Part B deductible, has the second largest share of Medigap policyholders in 2023 (36% or nearly 4.9 million people), although it has not been available to new beneficiaries since 2020.
  • The average monthly premium among current Medigap policyholders was $217 in 2023, or $2,604 for a full year of coverage, according to KFF analysis of NAIC data from MFA.
  • Medigap premiums vary by state and by policy type. For example, in 2023, the average monthly premium for people enrolled in Plan G was $164 ($1,968 for 12 months), but this varied from a low of around $140 in D.C., Hawaii, and New Mexico to $236 in New York.

Overview of Medigap

Medicare beneficiaries can choose to get their Medicare Part A and B benefits through the traditional Medicare program or a Medicare Advantage plan, such as a Medicare HMO or PPO. Among the nearly 60 million people enrolled in Medicare Part A and B in 2022, half (50%) of Medicare beneficiaries were in traditional Medicare. Most traditional Medicare beneficiaries had some form of additional coverage that helps to cover the cost-sharing requirements under the benefit design of traditional Medicare, such as Medigap, employer-sponsored retiree benefits, or Medicaid.

Medigap is private supplemental health insurance that helps cover Medicare Part A and Part B cost-sharing requirements, including deductibles, copayments, and coinsurance. Medigap is a key source of supplemental insurance for people in traditional Medicare without employer-sponsored retiree benefits or Medicaid (Medigap does not work with Medicare Advantage). In 2022, 12.5 million Medicare beneficiaries, or 42% of all traditional Medicare beneficiaries, had a Medigap policy.

By helping to cover Medicare’s cost-sharing requirements, Medigap insurance limits the financial exposure of Medicare beneficiaries and provides protection against catastrophic expenses for Medicare-covered services. Medigap policies also make health care costs more predictable by spreading costs over the course of the year through monthly premium payments and reduce the paperwork burden for beneficiaries associated with medical bills. According to KFF analysis, traditional Medicare beneficiaries with Medigap are less likely to report cost-related problems than similar Medicare Advantage enrollees or traditional Medicare beneficiaries without supplemental coverage.

Characteristics of People with Medigap

A larger share of traditional Medicare beneficiaries with Medigap than traditional Medicare beneficiaries overall are White (94% vs 86%), have incomes of $40,000 or above (54% versus 47%), and report their health as excellent, very good, or good (88% versus 82%) (Figure 1; See Appendix Table 1 for a comparison of Medigap enrollee characteristics to beneficiaries with other types of coverage).

People With Medigap Are More Likely to Be White, Have Higher Income, and Report Better Health Status Compared to Traditional Medicare Beneficiaries Overall

Medicare beneficiaries with pre-existing medical conditions or who are under age 65 and qualify for Medicare based on having a long-term disability may have difficulty purchasing a Medigap policy. Federal law offers a one-time, six-month Medigap open enrollment period for beneficiaries ages 65 and older when they age on to Medicare, but federal and state laws place very limited restrictions on the practice of medical underwriting outside of this initial open enrollment period. Moreover, the guaranteed issue right under federal law does not extend to Medicare beneficiaries under age 65 who qualify for Medicare on the basis of having a long-term disability. This is one reason why a much smaller share of traditional Medicare beneficiaries under age 65 and older have a Medigap policy compared with people age 65 and older (7% versus 46%). In addition, people under age 65 are more likely to have no supplemental coverage compared to people 65 and older (17% vs. 10%) and more likely to qualify for Medicaid (65% vs. 10%). While most states (36 states) go beyond federal law and require Medigap insurers to offer at least one policy to people under age 65 during an initial open enrollment period, premiums in these states vary and may be higher for people under age 65 (see section below Premium Rules Vary Across States That Require Insurers to Offer at Least One Medigap Policy Type to People Under Age 65 for more details).

Additionally, Medigap premiums can be costly (as discussed in more detail below), making it more difficult for people with lower incomes to afford a Medigap policy. This, along with relatively high supplemental coverage under Medicaid, could be a factor in lower enrollment of Black and Hispanic Medicare beneficiaries in Medigap relative to Medicare Advantage, since Black and Hispanic beneficiaries have lower income and assets compared to White beneficiaries. Black and Hispanic beneficiaries are also more likely to report relatively poor health and have higher prevalence rates of certain chronic conditions that would be classified as pre-existing conditions by Medigap insurers, which could also make it difficult for individuals in these groups to obtain Medigap, particularly outside of guaranteed issue periods when medical underwriting is not allowed.

Medigap Enrollment Varies by State

Medigap enrollment varies widely by state: from 9% of traditional Medicare beneficiaries in Hawaii to 67% in Iowa, based on KFF analysis of 2023 NAIC data (Figure 2, Appendix Table 2). In eleven states, more than 50% of Medicare beneficiaries in traditional Medicare have a Medigap policy. States with higher Medigap enrollment tend to be in the Midwest and plains states, where relatively fewer beneficiaries are enrolled in Medicare Advantage plans.

More Than Four in Ten (42%) Beneficiaries in Traditional Medicare Have a Medigap Policy, But Enrollment Varies by State

What Are the Different Types of Medigap Policies and What Benefits Do They Cover?

There are 10 different types of Medigap policies (labeled A through N), each having a different, standardized set of benefits (Appendix Table 3).

Plan G is the most popular Medigap policy, accounting for 39% of all policyholders, or nearly 5.3 million people, in 2023 (Figure 3). Plan G is the most comprehensive policy available to new policyholders, covering the Part A deductible and all cost sharing for Part A and B covered services, but not the Part B deductible. Plan G has become the most popular plan since plan F, which covers all the same benefits as Plan G as well as the Part B deductible, can no longer be sold to new beneficiaries who turned 65 on or after January 1, 2020 due to a change in law (Plan C also is no longer available as of that date because it also covered the Part B deductible). Plan F has the second largest share of Medigap enrollment, covering 36% of Medigap policyholders or nearly 4.9 million people. Plan N has the third largest share of Medigap enrollment, covering 10% of policyholders or nearly 1.4 million people. Plan N is similar to Plan G, except that there are Part B copayments for some office visits and some emergency room visits, and it does not cover Part B excess charges.

Plan G is the Most Popular Policy Type in the Medigap Market in 2023, With 39% of Medigap Enrollees, or Nearly 5.3 Million People, Choosing that Policy

Who Can Buy a Medigap Policy and When?

Federal law provides guaranteed issue protections for Medigap policies during a one-time, six-month Medigap open enrollment period for beneficiaries ages 65 and older, which begins the first month of Medicare Part B coverage, as well as for certain qualifying events. Some of these qualifying events may include instances when people involuntary lose certain types of supplemental coverage, such as when an employer cancels retiree coverage or when a Medicare Advantage plan discontinues coverage in their area. The federally guaranteed one-time, six-month Medigap open enrollment period does not extend to beneficiaries who qualify for Medicare under age 65.

Beneficiaries also have guaranteed issue rights during specified “trial” periods, such as the first year that adults ages 65 and older are in Medicare Advantage. During that time, older adults can try a Medicare Advantage plan, and if they disenroll within the first year, they have guaranteed issue rights to purchase any Medigap policy that is sold in their state.

During these defined periods, Medigap insurers cannot deny a Medigap policy to any qualifying applicant based on factors such as age, gender, or health status. Further, during these periods, Medigap insurers cannot vary premiums based on an applicant’s pre-existing medical conditions or exclude coverage for a pre-existing medical condition (i.e., medical underwriting).

However, under federal law, Medigap insurers may impose a waiting period of up to six months to cover services related to pre-existing conditions if the applicant did not have at least six months of prior continuous creditable coverage. For qualifying events that trigger guaranteed issue rights, people ages 65 and older in Medicare generally have 63 days to apply for a Medigap policy.

States can choose to establish Medigap consumer protections that go further than the minimum federal standards. Four states – Connecticut, Massachusetts, Maine, and New York – require Medigap insurers to offer policies either continuously throughout the year or once per year to Medicare beneficiaries age 65 and older without regard to their medical conditions. Other states have also expanded on the federal minimum standards to allow beneficiaries to purchase Medigap on a guaranteed issue basis after certain qualifying events or for beneficiaries under 65 with disabilities to purchase Medigap during an initial open enrollment period. (For more information on qualifying events and additional Medigap protections, see Medigap May Be Elusive for Medicare Beneficiaries with Pre-Existing Conditions for more details.)

Premiums Vary Across Medigap Policies

States establish certain rules for Medigap insurers, including how to set premiums. Premiums may be based on factors such as a policyholder’s age, smoking status, gender, and residential area, even during open enrollment and guaranteed issue periods.

Premium costs are one of the primary concerns for people with Medigap. KFF focus groups indicate that while most beneficiaries with Medigap are satisfied with their coverage and like many of its elements, including coverage of most or all of Medicare’s cost-sharing requirements, comprehensiveness of their coverage, control over their health care, and ability to see any provider they want (by virtue of being in traditional Medicare rather than Medicare Advantage), some participants noted their premiums were expensive or cost more than they would like.

There are three different rating systems that can affect how Medigap insurers determine premiums: community rating, issue-age rating, or attained-age rating.

  • Community rating: The same premium is generally charged to everyone, regardless of age or gender. Premiums may go up because of inflation and other factors, such as smoking status and residential area, but not due to age.
  • Issue-age rating: The premium is based on the age of the beneficiary when they purchase the Medigap policy. Premiums are lower for people who buy at a younger age and will not change as they get older, but premiums may go up because of inflation and other factors, such as smoking status and residential area, but not due to age.
  • Attained-age rating: The premium is based on a beneficiary’s current age, so the premium goes up as they get older. Premiums are lower for younger buyers but increase as they get older, which means that premiums may be the least expensive at first but can eventually become the most expensive. Premiums may also go up because of inflation and other factors, such as smoking status and residential area.

States can impose regulations on which of these rating systems are permitted or required for Medigap policies sold in their state. Currently, nine states (AR, CT, ID, MA, ME, MN, NY, VT, and WA) require premiums to be community rated among policyholders ages 65 and older (Appendix Table 4). Four states – Arizona, Florida, Georgia, and Missouri – permit issue-age rating but prohibit attained-age rating, while the majority of states (37 states and D.C.) allow any rating system.

Premium Rules Vary Across States That Require Insurers to Offer at Least One Medigap Policy Type to People Under Age 65

There are 36 states that require insurers to make at least one kind of Medigap policy guaranteed issue during an initial open enrollment period for beneficiaries under age 65, which is not a federal requirement. In these states, rules vary as to whether the same premiums are required for people under ages 65 and people ages 65 and older.

Among these 36 states, 21 states limit how much insurers can charge in premiums for beneficiaries under age 65. (Figure 4, Appendix Table 5). The remaining 15 states have no specified rules on premium costs.

In the 36 States Requiring Insurers to Offer at Least One Medigap Plan to Beneficiaries Under Age 65 With Disabilities, Rules on Premiums Vary by State

Average Medigap Premiums Among Current Policyholders

The average monthly Medigap premium across all current Medigap policyholders (including people under 65, people who smoke tobacco, and people who are in a high deductible or SELECT plan) was $217, ranging from $191 in Alaska to $267 in New York in 2023 (Figure 5, Appendix Table 4).

The Average Monthly Medigap Premium Across All Current Medigap Policyholders Was $217 and Varied Across States, Ranging From $191 in Alaska to $267 in New York

Average premiums also vary considerably depending on the policy type. For Plan G, the most popular and comprehensive plan available to new enrollees, the average monthly premium among current policyholders in 2023 was $164, and ranged from $140 in Washington D.C. and $141 in Hawaii and New Mexico to $236 in New York (Figure 6, Appendix Table 4). For Plan F, the plan with the second highest enrollment (but no longer available to new enrollees as of 2020), the average premium among current policyholders is $274, ranging from $214 in Vermont to $313 in New York. The difference in premiums may be due in part to the fact that Plan F covers the Part B deductible, which Plan G does not cover, but may also be related to other factors, as described below.

The Average Monthly Medigap Premium Varies by Policy Type - the Average Premium for Plan G Was $164, Ranging from $140 to $236

In the five states with the most expensive monthly premiums on average in 2023 for Plan G, four states (NY, CT, ME, WA) require community rating, while the fifth (FL) only allows issue-age rating. Further, the three states with highest premiums – New York, Connecticut, and Maine – have continuous or annual guaranteed issue protections. For Plan F, however, while the state with the highest monthly premium is New York, the four states with the next highest premiums (IN, NE, MD, and WV) are not community rated and do not have guaranteed issue protections.

Overall, for average Medigap premiums across all current policyholders, there is not a clear relationship between states with community rating rules or guaranteed issue protections and having higher premiums. For example, New York has the highest average monthly premium, while Maine is slightly above the national average, and Connecticut and Massachusetts are about the national average. Differences in average premiums across states can be due to several factors, including Medigap rating requirements, guaranteed issue requirements, the number of Medicare beneficiaries, the characteristics of the Medicare population, Medicare Advantage penetration, urbanicity of the county, and health care cost and usage patterns. Due to limitations in the data, we are unable to evaluate differences in average premiums across gender, age, or smoking status.

“New or Innovative” Benefits in Medigap Policies

According to federal guidelines, Medigap insurers may offer policies that cover “new or innovative” benefits that are cost-effective, in addition to the standardized Medigap benefits provided in a given policy. These new or innovative benefits can include vision, dental, and hearing benefits, access to a 24/7 nurse phone line, access to Silver Sneaker fitness benefits, and other wellness benefits. Medigap policies that include these types of additional benefits often have slightly higher premiums than the standard version of the policy.

The scope of these benefits varies across policy types and insurers. For example, some policies include coverage of specific dental services, such as 100% coverage of dental diagnostic evaluations, preventive services, and diagnostic radiographs (x-rays), and 80% of some restorative services from in-network dentists, though they may not cover more comprehensive dental services. For other policies, rather than dental insurance, enrollees can receive discounts off of nationally contracted rates for a range of dental services that are not covered by traditional Medicare, including cleanings, exams, fillings and crowns, from in-network dentists.

These benefits, which are not available generally in traditional Medicare, may be offered to help Medigap insurers compete for business with Medicare Advantage plans, nearly all of which offer dental, vision, and hearing, as well as other extra benefits. KFF focus groups show that the availability of extra benefits in Medicare Advantage plans, such as dental and vision, is a major consideration when beneficiaries make their Medicare coverage choices. Moreover, KFF’s analysis of television ads from 2022 confirms that messaging about extra benefits is an important tool to attract enrollees, and were mentioned in more than 90% of ads promoting Medicare Advantage. Dental coverage was the most advertised extra benefit (included in 84% of ads), followed by coverage of vision (63%) and hearing (56%) services.

Methods

This analysis uses data from Health Coverage PortalTM, a market database maintained by Mark Farrah Associates, which includes information from the National Association of Insurance Commissioners (NAIC). We used the “Medicare Supplement Market Data” report (accessed June 14, 2024) for this analysis. For the analysis of Medigap enrollment and premiums, territories, including Puerto Rico, are excluded. For Medigap enrollment overall, data reported to the Department of Managed Health Care in California (536,659 beneficiaries in 2023) is included in overall California enrollment counts, but this data is not included for analysis of enrollment by policy type. For the analysis of average premiums among current Medigap policyholders, only data that is reported to the NAIC is included because data from the California Department of Managed Health Care does not include information about premiums or policy type. For that analysis, KFF excluded policies that have negative or zero dollars in premiums. Premiums for current policyholders include those who smoke tobacco and those with high deductible or SELECT policies.

For characteristics of Medicare beneficiaries with Medigap versus those with Medicare Advantage, KFF used the Centers for Medicare & Medicaid Services (CMS) Medicare Current Beneficiary Survey 2022 Survey File data. Data excludes beneficiaries with Part A only or Part B only for most of the year or Medicare as a Secondary Payer. Persons of Hispanic origin may be of any race but are categorized as Hispanic; other groups are non-Hispanic.

Appendix

Characteristics of People With a Medigap Policy and Other Types of Medicare Coverage
Number and Share of Medicare Beneficiaries with a Medigap Policy in 2023
Standard Medigap Plan Benefits, 2024
Average Medigap Premiums by State and Plan Type, 2023
Premium Rules for States with Initial Open Enrollment Period for Medigap for Medicare Beneficiaries Under Age 65, 2024

Medigap May Be Elusive for Medicare Beneficiaries with Pre-Existing Conditions

Published: Oct 18, 2024

Issue Brief

Medicare supplement insurance, known as Medigap, helps cover Medicare Part A and Part B cost-sharing requirements, including deductibles, copayments, and coinsurance. Medigap policies, which are sold by private insurance companies, are a key source of supplemental coverage for people in traditional Medicare without employer-sponsored retiree benefits or Medicaid (Medigap does not work with Medicare Advantage). In 2022, 12.5 million Medicare beneficiaries, or 42% of all traditional Medicare beneficiaries, had a Medigap policy. However, federal requirements that prohibit the use of medical underwriting by insurers when issuing Medigap policies – known as guaranteed issue protections – are limited, which means it may be hard or impossible for people with pre-existing conditions, like asthma or cancer, to get a Medigap policy, outside of specified time periods. (For more information on the basics of Medigap, see Key Facts About Medigap Enrollment and Premiums for Medicare Beneficiaries).

Federal law requires Medigap insurers to issue Medigap policies without medical underwriting during a one-time, six-month Medigap open enrollment period for beneficiaries ages 65 and older when first enrolling in Medicare Part B, and for certain qualifying events, such as during a Medicare Advantage trial period. But federal law allows Medigap insurers to use medical underwriting to either deny Medicare beneficiaries a policy or charge higher premiums outside of guaranteed issue periods. Federal law also does not require Medigap insurers to issue Medigap policies to people who choose to disenroll from a Medicare Advantage plan, except under limited circumstances, or to beneficiaries under age 65 who qualify for Medicare due to a long-term disability. Some lawmakers have proposed to strengthen federal guaranteed issue protections for the Medigap market, though doing so could impact premiums.

This issue brief analyzes federal and state guaranteed issue rules and how they impact beneficiaries’ access to Medigap, including the implications for Medicare beneficiaries with pre-existing conditions and those under age 65 with long-term disabilities. This brief also explores a recently finalized rule: Nondiscrimination in Health Programs and Activities regarding Section 1557 of the Affordable Care Act that may have implications for the Medigap market. This analysis is based on KFF review and collection of federal and state insurance regulations, insurers’ Medigap applications, other publicly available information, and KFF analysis of data from the Centers for Medicare & Medicaid Services (CMS) Chronic Conditions Data Warehouse Master Beneficiary Summary File (MBSF), 2022.

Key Takeaways

  • Federal law provides some guaranteed issue protections for Medicare beneficiaries who seek to purchase a Medigap policy, such as during the first six months after signing up for Medicare Part B or if their Medicare Advantage plan terminates coverage in their area. However, in all but four states, beneficiaries may be denied a Medigap policy if they have a pre-existing condition if they choose to switch from Medicare Advantage to traditional Medicare outside the initial trial period or seek to purchase a Medigap policy years after enrolling in Medicare.
  • Nine out of ten (90%) Medicare Advantage enrollees ages 65 and older, or 22.4 million people, do not have guaranteed issue protections to purchase Medigap beyond the initial Medicare Advantage trial period, as of 2022.
  • The list of potentially deniable medical conditions includes Alzheimer’s disease, asthma, cancer, congestive heart disease, diabetes with complications, end-stage renal disease (ESRD), high blood pressure, limitations of daily activities, stroke and other conditions, based on KFF’s review of Medigap applications of leading insurers. Applicants may also be charged higher Medigap premiums if they have conditions such as diabetes with no complications, bipolar disorder, or osteoporosis that is treated with infusion. The Affordable Care Act prohibits insurance companies from denying coverage or charging higher premiums based on pre-existing conditions, but does not apply to Medigap insurers.
  • Four states (CT, MA, ME, NY) require either continuous or annual guaranteed issue protections for Medigap for all beneficiaries ages 65 and older, regardless of medical history. With continuous enrollment, insurers are required to issue Medigap policies at any time during the year in Connecticut, Massachusetts and New York; in Maine, which has a one-month guaranteed issue period each year, insurers are required to offer only Medigap Plan A, which is less comprehensive than some Medigap plans, such as Plan G – the most popular policy in 2023. Minnesota enacted legislation to institute annual guaranteed issue protections, which are slated to go into effect on August 1, 2025, though there are indications that implementation may be delayed.
  • Thirty-five states require Medigap insurers to issue policies to Medicare beneficiaries ages 65 and older due to certain qualifying events, such as when an applicant has a change in their employer (retiree) coverage (29 states) or when beneficiaries lose their Medicaid eligibility (10 states).
  • Thirty-six states require insurance companies to offer at least one kind of Medigap policy to Medicare beneficiaries under age 65 with disabilities during an initial open enrollment period, regardless of medical conditions.

The Role of Federal Law in Regulating Medical Underwriting in the Medigap Market

In general, Medigap insurance is state regulated, but also subject to certain federal minimum requirements. Medigap was first federally regulated through the Social Security Disability Amendments, also referred to as the “Baucus Amendments,” in 1980, followed by a second key set of federal regulations that were enacted as part of the Omnibus Budget Reconciliation Act of 1990 (OBRA-90). That law required:

  • The institution of a six-month open enrollment period beginning the first month a beneficiary is enrolled in Medicare Part B, for beneficiaries ages 65 and older
  • A standardized set of benefits across Medigap policies, leading to 10 standard Medigap policies available to beneficiaries. (Three states – Massachusetts, Minnesota, and Wisconsin – have a different set of standardized policies.)
  • Guaranteed plan renewability (with few exceptions)
  • Minimum medical loss ratio requirements
  • Limiting the exclusion period for pre-existing conditions to six months.

The Medicare Access and CHIP Reauthorization Act of 2015 (MACRA) made some additional changes to the Medigap market, prohibiting insurers from issuing new policies that cover the full Part B deductible, making Plans C and F no longer available to beneficiaries who turned age 65 on or after January 1, 2020.

Pursuant to the requirements mentioned above, federal law provides guaranteed issue protections for Medigap policies during a one-time, six-month Medigap open enrollment period for beneficiaries ages 65 and older, which begins the first month of Medicare Part B coverage, and for certain qualifying events (Table 1). During these defined periods, Medigap insurers cannot deny a Medigap policy to any qualifying applicant based on factors such as age, gender, or health status, nor can they vary premiums based on an applicant’s pre-existing medical conditions or exclude coverage for a pre-existing medical condition (i.e., medical underwriting).

The one-time, six-month guaranteed issue period is intended to mitigate potential selection issues in the Medigap market. Rather than waiting until they incur high health care costs before purchasing a Medigap policy, beneficiaries must generally purchase a policy during the initial open enrollment period or risk not being able to purchase a Medigap policy later. This also has the effect of ensuring that the risk pool includes a mix of both healthier and sicker enrollees, which could keep premiums lower, on average. However, as discussed in more detail below, the one-time open enrollment period also has the effect of locking people out of the Medigap market who might not be at higher risk of incurring high medical expenses in the short term. This could include, for example, a beneficiary who has been enrolled in a Medicare Advantage plan for a few years and wants to switch to traditional Medicare because of network restrictions in Medicare Advantage, but faces medical underwriting based on having pre-existing conditions.

Under federal law, Medigap insurers may impose a waiting period of up to six months to cover services related to pre-existing conditions if the applicant did not have at least six months of prior continuous creditable coverage. For qualifying events that have guaranteed issue rights, people ages 65 and older in Medicare generally have 63 days to apply for a Medigap policy.

When Do People Seeking a Medigap Policy Have Guaranteed Issue Protections Under Federal Law?

Beneficiaries with Traditional Medicare and Employer Retiree Coverage: Medicare beneficiaries have federally qualified guaranteed issue rights to purchase Medigap if their employer cancels their retiree coverage. However, they do not have guaranteed issue rights to purchase Medigap if their retiree coverage changes or if they voluntarily drop retiree coverage.

Beneficiaries with Traditional Medicare and Medigap: Federal law requires that a trial period applies to Medicare beneficiaries in traditional Medicare who cancel their Medigap policy when they enroll in a Medicare Advantage plan (this is not limited to just the first year of enrolling in Medicare). These beneficiaries have time-limited guaranteed issue rights to purchase their same Medigap policy if, within a year of first signing up for a Medicare Advantage plan, they decide to disenroll to return to traditional Medicare. Guaranteed issue rights also apply if their Medigap insurance company goes bankrupt or Medigap coverage ends through no fault of their own, or their Medigap insurance company commits fraud.

Beneficiaries who currently have Medigap do not have federal guaranteed issue protections to switch Medigap policies. They also do not have guaranteed issue protections if they voluntarily drop Medigap and wish to purchase a policy again later. However, beneficiaries may suspend Medigap for up to two years if they become eligible for Medicaid, in which case they have no new medical underwriting or waiting periods for pre-existing conditions when they restart their Medigap.

Beneficiaries with Medicare and Medicaid: Medicare beneficiaries who are dually-eligible individuals, meaning they have both Medicare and Medicaid have premium and cost-sharing protections through Medicaid. Therefore, they typically do not need Medigap protections and in general, Medigap insurers cannot sell Medigap policies to people with Medicaid. If dual-eligible individuals lose their Medicaid eligibility, they are not entitled to a guaranteed issue period to purchase Medigap. However, as noted above, this is not the case for beneficiaries who had Medigap before becoming eligible for Medicaid, in which case they have no new medical underwriting or waiting periods for pre-existing conditions when they restart their Medigap (as long as they did not have Medicaid for more than two years).

Beneficiaries Under Age 65: The federally guaranteed one-time, six-month Medigap open enrollment period does not extend to beneficiaries who qualify for Medicare under age 65. However, when these beneficiaries turn age 65, federal law requires that they are entitled to the same time-limited six-month open enrollment period for Medigap that is available to new beneficiaries ages 65 and older. As discussed below, many states have rules in place that go beyond minimum federal requirements and require insurance companies to offer at least one kind of Medigap policy to Medicare beneficiaries under age 65 with disabilities during an initial open enrollment period, regardless of medical conditions.

Beneficiaries with Medicare Advantage. Medicare Advantage enrollees with pre-existing conditions have limited opportunities to buy Medigap policies if they want to switch to traditional Medicare. Federal law requires that Medigap policies be sold with guaranteed issue rights during a specified trial period for Medicare Advantage plans. This trial period is during the first year adults ages 65 and older enroll in Medicare. During that time, older adults can try a Medicare Advantage plan, but if they disenroll within the first year, they have guaranteed issue rights to purchase any Medigap policy that is sold in their state.

Medicare Advantage enrollees also have guaranteed issue rights to purchase a Medigap policy to supplement coverage under traditional Medicare if:

  • their Medicare Advantage plan discontinues coverage in their area
  • they move to a new area and can no longer access coverage from their Medicare Advantage plan
  • their Medicare Advantage plan is terminated
  • their Medicare Advantage plan commits fraud.

Outside of the trial period and other limited circumstances, Medicare Advantage enrollees who disenroll and obtain coverage under traditional Medicare can be denied a Medigap policy if they have a pre-existing condition. This includes Medicare Advantage enrollees who voluntarily leave a retiree health plan through Medicare Advantage and who seek to purchase a Medigap policy. In the majority of states that allow medical underwriting for Medigap, Medicare Advantage enrollees with pre-existing conditions may be reluctant to switch to traditional Medicare if they are unable to purchase a Medigap policy. This is because Medigap provides added financial protection as a supplement to traditional Medicare, which does not have an out-of-pocket cap for services covered under Medicare Parts A and B, unlike most health insurance plans. In contrast, Medicare Advantage plans are required to have an out-of-pocket limit for Parts A and B.

Nine out of ten (90%) Medicare Advantage enrollees ages 65 and older, or 22.4 million people, are subject to medical underwriting and may be denied coverage if they apply for a Medigap policy outside of the Medicare Advantage trial period or other specific guaranteed issue periods, as of 2022 (Figure 1; Appendix Table 1; see below for state-specific information on guaranteed issue rules).

Nine Out of Ten (90%) Medicare Advantage Enrollees Ages 65 and Older, or 22.4 Million People, Do Not Have Guaranteed Issue Protections for Medigap Outside of the Medicare Advantage Trial Period

The vast majority of Medicare Advantage enrollees do not live in one of the four states with rules in place that require continuous or annual rights to purchase a Medigap policy if they choose coverage under traditional Medicare. Only 10% of Medicare Advantage enrollees ages 65 and older live in these four states, which require insurers to issue Medigap policies without regard to pre-existing conditions, even after their Medicare Advantage trial period ends. (For more detail on the 4 states, see section below: Only Four States Require Continuous or Annual Guaranteed Issue Protections for Medigap for People Ages 65 and Older.)

The total number of Medicare Advantage enrollees who may not be able to switch to traditional Medicare and a purchase a Medigap policy would be even higher if Medicare Advantage enrollees under age 65, who also do not have guaranteed issue protections, were included.

Medigap Insurers Can Deny Coverage Based on Pre-Existing Conditions, Except Under Limited Circumstances

Under current federal law, insurance companies that sell Medigap policies may refuse to sell a policy to an applicant with certain medical conditions, or who has had certain medical procedures or used specific prescription drugs, outside of open enrollment or a guaranteed issue period. This contrasts with other insurance products, like plans sold in the ACA Marketplace or Medicare Advantage, which are not permitted to deny coverage based on pre-existing conditions at any time.

Based on a KFF review of 15 Medigap policy applications from 12 major Medigap insurers, several medical conditions and prescription drugs are listed as possible reasons for medical underwriting or coverage denial (Table 2):

Examples of Declinable Conditions in the Medigap Market, Based on 15 Medigap Applications From Insurers
  • Medical conditions: Medical conditions that are listed by Medigap insurers as reasons for a potential denial on the application include but are not limited to: Alzheimer’s disease, asthma that requires use of inhalers, cancer, congestive heart failure, diabetes with complications (e.g., neuropathy), ESRD, high blood pressure, and stroke (Table 2). Insurers also deny applicants who have undergone certain related procedures, such as a bone marrow, stem cell, or organ transplant or implant of a pacemaker. Many of these conditions are prevalent among Medicare beneficiaries. For example, about two-thirds (67%) of people on Medicare have hypertension, more than a quarter (26%) have diabetes, 19% have chronic kidney disease, 12% have been diagnosed with heart failure, and 10% have had prostate cancer.
  • Functional status: Several applications list indicators of functional status as a potential reason for denial, including having any difficulty performing activities of daily living, being dependent on a wheelchair or motorized device, or being confined to the home.
  • Medications: Underwriting guidelines include long lists of medications that will lead to a potential denial. These medications include insulin greater than 50 units per day to treat diabetes, Zestril for high blood pressure, Revlimid for cancer, Remicade for rheumatoid arthritis, and Lasix for heart disease. For example, one application states, “if the application has taken one or more of the following [medications] within the past 12 months, do not submit the application.”
  • Medical advice: Some applications cite medical advice that has not been addressed as reason for denial. For example, one application asks, “within the past 12 months, have you been advised by a medical professional to have treatment, further evaluation, diagnostic testing, or surgery that has not been performed or do you have pending test results?”
  • Medical service use: Utilization of home health services, rehabilitation services, inpatient hospitalization within a specific time frame (e.g., three or more times within the past two years), or confinement to a nursing facility are also listed as reasons for a declined application.

Several Medigap applications instruct individuals not to submit applications if they have any of the listed pre-existing conditions. For example, one application states, “if the answer to any question…is yes, the application should not be submitted.” Another specifies that “if you answer YES to any [health] question, you are not eligible for coverage.”

A few applications list conditions that will result in higher Medigap premiums but may not result in someone being denied a policy. Examples of these conditions include diabetes with no complications or that requires 50 or less units of insulin, hemophilia, macular degeneration that does not require injections, bipolar disorder or schizophrenia, and osteoporosis that is treated with infusion.

Only Four States Require Continuous or Annual Guaranteed Issue Protections for Medigap for People Ages 65 and Older

States can establish Medigap consumer protections that go further than the minimum federal standards. Only four states – Connecticut, Massachusetts, Maine, and New York – require Medigap insurers to offer policies either continuously throughout the year or once per year to Medicare beneficiaries ages 65 and older without regard to their medical conditions, consistent with prior KFF analysis (Figure 2; Appendix Table 2).

Only Four States (CT, MA, ME, NY) Have Guaranteed Issue Protections for Medigap Either Continuously or Annually, For All Medicare Beneficiaries Ages 65 and Older

Two of these states – Connecticut and New York – have continuous open enrollment, with guaranteed issue rights throughout the year. Massachusetts regulation requires an annual guaranteed issue open enrollment period from February 1st to March 31st, but all insurers in Massachusetts offer continuous open enrollment throughout the year. Maine requires insurers to issue Medigap Plan A during an annual one-month open enrollment period of the insurer’s choosing.

Minnesota has enacted legislation that includes the institution of two guaranteed issue open enrollment periods (one during the annual Medicare open enrollment period from October 15 to December 7 and one during the Medicare Advantage open enrollment period, from January 1 to March 31), which require insurers to issue Medigap policies during these time frames without medical underwriting. Institutionalized individuals can purchase Medigap on a continual basis, with guaranteed issue rights throughout the year. These new rules are slated to go into effect on August 1, 2025, though there are indications that implementation may be delayed.

Consistent with federal law, Medigap insurers in New York, Connecticut, and Maine may impose up to a six-month “waiting period” to cover services related to pre-existing conditions if the applicant did not have six months of continuous creditable coverage prior to purchasing a policy during the initial Medigap open enrollment period. Massachusetts prohibits pre-existing condition waiting periods for its Medicare supplement policies.

States establish certain rules for Medigap insurers, including how to set premiums, and premiums may be based on factors such as a policyholder’s age, smoking status, gender, residential area, and rating system, even during open enrollment and guaranteed issue periods. Premiums can also vary across states due to states’ guaranteed issue requirements, the characteristics of the Medicare population, the number of Medicare beneficiaries, Medicare Advantage penetration, urbanicity of the county, and health care cost and usage patterns. Due to the variety of factors at play, KFF analysis shows that there is not a clear relationship between states with continuous or annual guaranteed issue protections and having consistently higher premiums for Medigap than in other states. However, for Plan G, the states with the three highest average premiums do have more robust guaranteed issue protections. Further, Minnesota recently commissioned a study on the impact of instituting annual guaranteed issue protections and estimated that average annual premiums across all Minnesota Medigap plans would be 6% higher during the first year of implementation, with enrollment in Medigap expected to be 32% higher than if these changes were not in effect.

Thirty-Five States Require Medigap Insurers to Issue Medigap Policies to Beneficiaries Ages 65 and Older Due to Certain Qualifying Events

An additional thirty-three states (as well as Maine and Minnesota since they only have annual guaranteed issue protections) require Medigap insurers to offer policies to eligible applicants ages 65 and older based on certain qualifying events beyond the minimum federal standards (Figure 3, Appendix Table 2):

  • Twenty-nine states require Medigap insurers to issue policies when an applicant has an change in their employer (retiree) coverage, such as a reduction in benefits or an increase in costs, depending on the state. This qualifying event is more expansive than federal law, which applies only when retiree coverage is completely eliminated.
  • Ten states require Medigap insurers to issue policies if Medicare beneficiaries lose their Medicaid eligibility. Medicare beneficiaries who are dually-eligible individuals would no longer have premium and cost-sharing protections through Medicaid if they lose their Medicaid coverage.
  • Twelve states have guaranteed issues rules for other types of qualifying events. For example, Maine extends the federally-required Medicare Advantage trial period from one year to three years. California allows Medicare Advantage enrollees to purchase a Medigap policy from the same Medicare Advantage insurer they are enrolled in (if it sells one) if their Medicare Advantage plan reduced any of its benefits, increased cost sharing, or terminated a contract with a provider currently treating them. If a Medigap policy is not available from their current Medicare Advantage insurer, they can purchase a Medigap policy from a different company if their Medicare Advantage plan increased premiums or copayments by 15% or more, reduced benefits, or terminated a contract with a provider currently treating them.

Additionally, some states have a guaranteed issue period for individuals who missed their 6-month Medigap enrollment period because they were enrolled in Medicaid during the COVID-19 public health emergency (PHE). These individuals were not terminated from Medicaid when they became eligible for Medicare Part B because of the continuous enrollment policy during the PHE, but were later terminated from Medicaid following the end of the PHE.

Thirty-Five States Require Medigap Insurers to Issue Medigap Policies to Beneficiaries Ages 65 and Older to Due to Certain Qualifying Events

Some of these states provide guaranteed issue protections for current Medigap policyholders who want to switch policies (Figure 3, Appendix Table 2):

  • Nine states have what are called “birthday rules” (CA, ID, IL, KY, LA, MD, NV, OK and OR), which require Medigap insurers to allow current policyholders switch each year to a different Medigap policy with equal or lesser benefits from either the same or different insurance carrier, depending on the state, around the time of their birthday. Depending on the state, these Medigap policyholders have between 30 and 63 days to switch policies. (This allowance does not enable beneficiaries who do not already have Medigap to newly purchase a Medigap policy.)
  • Missouri requires Medigap insurers to allow current Medigap policyholders to switch to an equivalent policy from a different insurer within 30 days before or after the annual anniversary date of their policy.
  • Maine requires Medigap insurers to allow current Medigap policyholders to switch to a policy with equal or less generous benefits at any time during the year if there is less than a 90-day gap in coverage.
  • Washington requires Medigap insurers to allow Medigap policyholders to switch to a policy with equal or less generous benefits at any time during the year if there is less than a 90-day gap in coverage, though policyholders with Medigap Plan A are limited to switching to another Plan A, while those with Plans B through N can switch to any other Plan B through N.

Access to Medigap Is More Limited for Medicare Beneficiaries Under Age 65 with Disabilities

Under federal law, Medigap insurers are not required to sell Medigap policies to the over 7 million Medicare beneficiaries who are under age 65, a majority of whom qualify for Medicare based on having a long-term disability and receiving Social Security disability benefits (a small number qualify due to having ESRD or ALS). Higher rates of Medicaid coverage among these beneficiaries, who tend to have relatively low incomes, also contribute to low enrollment in Medigap among beneficiaries under age 65. For these reasons, a significantly smaller share of traditional Medicare beneficiaries under age 65 have Medigap compared to beneficiaries with traditional Medicare ages 65 and older: 7% vs. 46% in 2022 (Figure 4). When these beneficiaries turn age 65, federal law requires that they are entitled to the same six-month open enrollment period for Medigap that is available to new beneficiaries ages 65 and older.

A Small Share (7%) of Adults Under 65 in Traditional Medicare Had a Medigap Policy in 2022

Although Not Required Under Federal Law, Most States Require Medigap Insurers to Offer an Initial Guaranteed Issue Period to Purchase Medigap to People Under Age 65 with Disabilities

Thirty-six states require insurers to issue at least one kind of Medigap policy to beneficiaries under age 65, typically through an initial open enrollment period (Figure 5, Appendix Table 3). Of these 36 states, 25 require insurers to sell all plan types to people under age 65 during the guaranteed issue period. Starting January 1, 2025, Nebraska will require insurers to offer at least one kind of Medigap policy to beneficiaries under age 65, and Indiana, which currently requires insurers to sell only Plan A to people under age 65, will extend this requirement to all Medigap plan types offered by insurers.

In addition to the initial open enrollment period it already offers, when Minnesota institutes two annual Medigap guaranteed issue open enrollment periods: one during the annual Medicare open enrollment period from October 15 to December 7 and one during the Medicare Advantage open enrollment period, from January 1 to March 31, these will apply for beneficiaries ages 65 and older as well as people under age 65 with disabilities.

Thirty-Six States Require Medigap Insurers to Offer at Least One Policy to Beneficiaries Under Age 65 With Disabilities During an Initial Open Enrollment Period

Requirements for People with ESRD: Of the 36 states that require insurers to issue at least one kind of Medigap policy to people under age 65 with disabilities, 26 states explicitly require insurers to also sell these policies to people with ESRD. Four states (California, Massachusetts, Vermont, and Indiana) explicitly state that insurers are not required to sell policies to people with ESRD, though Indiana has enacted a new law requiring insurers to sell Medigap policies to people under 65 with ESRD starting January 1, 2025. The remaining six states are silent on whether insurers must sell at least one policy to people with ESRD.

Requirements for People with ALS: Of the 36 states that require insurers to issue at least one kind of Medigap policy to people under age 65 with disabilities, 25 states specify that they must be sold to people with ALS. Eleven states (including CA, MA, and VT) are silent on whether insurers must sell policies to people with ALS.

This is in addition to the 14 states and D.C that do not require insurers to sell a Medigap policy to people under age 65 with disabilities, including people with ESRD and ALS.

The same four states that have expanded Medigap guaranteed issue rights most broadly for beneficiaries ages 65 and older also require broader access to Medigap for people under age 65.

In addition to offering an initial guaranteed issue period to purchase Medigap, Massachusetts, Maine, New York, and Connecticut require continuous or annual guaranteed protections for people under age 65 with disabilities, though with slightly different requirements than for people ages 65 and older: in Massachusetts, insurers are not required to issue policies to people with ESRD, while in Connecticut, insurers must issue Plan A to people under age 65, as well as Plans B, C, and/or D for insurers that sell these plan types to people ages 65 and older. In Maine, all Medigap plan types must be available to beneficiaries under age 65 with disabilities during the open enrollment period, but after this period, insurers are only required to issue Medigap Plan A to beneficiaries under age 65 during the one-month open enrollment period that happens each year (the same as for people ages 65 and older).

19 of the 36 States That Require Medigap Insurers to Offer Policies to Eligible Applicants Under Age 65 During an Initial Open Enrollment Period Also Do So for Certain Qualifying Events

Nineteen states require Medigap insurers to offer policies to eligible applicants under age 65 based on certain qualifying events (Figure 6, Appendix Table 4):

  • Ten states require Medigap insurers to issue policies when an applicant under age 65 has a change in their employer (retiree) coverage. These 10 states (CA, CO, FL, ID, IL, MN, MO, OR, TX, and VA) also offer guaranteed issue rights for applicants ages 65 and older who have a change in their employer (retiree) coverage. However, some states have more restrictive policies for people under age 65. For example, in Texas, this guaranteed issue right applies only for Medigap Plan A for people under age 65.
  • Five states (CA, CO, OR, TN, and TX) require insurers to issue Medigap policies to beneficiaries under age 65 who lose their Medicaid eligibility. These five states also offer the same guaranteed issue protections for people ages 65 and older, but in the case of Texas, the guaranteed issue right for people under age 65 applies only in the case of Plan A.
  • Ten states have other types of qualifying events:
    • Eight states (CA, ID, KY, ME, MD, MO, OK, OR) require Medigap insurers to allow Medigap policyholders under age 65 to switch to a policy with equal or less generous benefits (e.g., under “birthday rules”).
    • Illinois extends the same federal Medicare Advantage guaranteed issue protections that are available to people ages 65 and older, to people under age 65 in the state. For example, Medicare Advantage enrollees under age 65 in Illinois who move out of their Medicare Advantage plan’s service area, or whose Medicare Advantage plan goes out business, have a 6-month guaranteed issue right to purchase a Medigap policy.
    • Oregon requires that insurers offer a guaranteed issue period to individuals who move to Oregon from a state that does not require Medigap insurers to issue policies to people under age 65.
Nineteen States Require Medigap Insurers to Offer Policies to Eligible Applicants Under Age 65 With Disabilities During Additional Qualifying Events

A New Federal Rule May Have Implications for the Medigap Market

A new federal rule – Nondiscrimination in Health Programs and Activities – has the potential to bring changes to the Medigap market. To date, Medigap policies have not been subject to Section 1557 of the Affordable Care Act, which prohibits discrimination on the basis of race, color, national origin, sex, age, or disability in certain health programs and activities. In May 2024, the Department of Health and Human Services (HHS) issued a final rule clarifying that Section 1557 would apply to Medigap policies offered by insurers that are “principally engaged” in providing health insurance coverage beginning January 1, 2025, and may not engage in behavior that is discriminatory, which could include charging higher rates based on age. This could mean that some current medical underwriting or premium rating practices in the Medigap market could violate Section 1557. The new rule would not apply to companies that sell Medigap policies that do not engage principally in the provision of health insurance coverage, such as those that primarily provide home or auto coverage.

It is unclear the extent to which this rule will change Medigap insurers’ practices and how the rule will be enforced. The rule is also subject to ongoing litigation, including a postponement of the rule in its entirety in Texas and Montana, which could further delay its implementation.

Federal and State Proposals to Enhance Consumer Protections for Medigap

Federal legislation: The Elijah E. Cummings Lower Drug Costs Now Act, which passed the House of Representatives in December 2019, included provisions that would have provided some guaranteed issue protections to Medicare beneficiaries, including requiring the one-time, six-month Medigap open enrollment period to apply to all Medigap-eligible beneficiaries, without regard to age (meaning it would apply to people under age 65), and providing a one-time opportunity for Medicare Advantage enrollees to switch to Medigap, even if they had been in Medicare Advantage beyond the one-year trial period. CBO estimated that these provisions would increase Medicare spending by $14 billion over 10 years (2020-2029). CBO did not estimate the impact on Medigap premiums.

While CBO did not provide a detailed explanation of its cost estimate, certain assumptions might explain the projected increase in Medicare spending. For example, beneficiaries who switch to traditional Medicare may use more services because they have the protection of Medigap coverage, substantially limiting their out-of-pocket costs, which studies show can increase utilization of health care services. The higher use of services under traditional Medicare would have the effect of increasing Medicare spending and raising Medigap premiums. It is not clear whether CBO’s estimate took into account potential savings associated with covering more beneficiaries under traditional Medicare than Medicare Advantage, since Medicare currently pays more, on average, for similar beneficiaries in Medicare Advantage than traditional Medicare.

A change in rules could also impact Medigap premiums if broadening guaranteed issue protections results in “adverse selection” in the Medigap market. Studies show that sicker Medicare Advantage enrollees disenroll into traditional Medicare at relatively higher rates, such as beneficiaries who have 2 or more complex chronic conditions or impairments in activities of daily living. If higher cost beneficiaries gain access to Medigap, premiums could rise. However, if Congress adopted an out-of-pocket cap for traditional Medicare, as some lawmakers have proposed, this might mitigate an increase in premiums or even reduce premiums because Medigap insurers would no longer be liable for costs that enrollees incur above the new limit.

Other bills previously introduced would prohibit medical underwriting in Medigap at all times, except for people who qualify for Medicare on the basis of ESRD or would expand the initial federal guaranteed issue period to all Medicare beneficiaries, including those under age 65 with disabilities, among other changes.

State legislation: Some states have also introduced legislation to expand consumer protections in Medigap. For example, California lawmakers introduced legislation that would require guaranteed issue rights during a 90-day annual open enrollment period. Iowa lawmakers introduced legislation to require guaranteed issue rights during a 30-day annual open enrollment period. Vermont lawmakers also introduced legislation that would provide guaranteed issue rights for people switching from Medicare Advantage to traditional Medicare around the time of their birthday. Other states have bills pending that would offer “birthday rules” in their state – allowing people who currently have Medigap policies to switch policies around the time of their birthday including South Dakota and Wisconsin. None of these legislative efforts have been signed into law.

Methods

The analysis on the share of Medicare Advantage enrollees 65 and older subject to medical underwriting outside of the Medicare Advantage trial period is based on based on Centers for Medicare & Medicaid Services (CMS) Chronic Conditions Data Warehouse Master Beneficiary Summary File (MBSF), 2022.

The state-level analyses on guaranteed issue protections for people ages 65 and older and people under age 65 with disabilities are based on a review of each state’s regulations, guidance documents/manuals, directives, and other publicly accessible government-issued documents.

Additionally, KFF staff contacted states’ insurance departments or State Health Insurance State Health Insurance Department Program (SHIP) offices for clarity in cases where publicly accessible documents were silent on a particular issue.

For the state-level analysis for people ages 65 and older:

  • States are marked as “no” if their regulations or other publicly accessible documents do not specify any additional qualifying events (beyond the federal standard).

For the state-level analysis for people under age 65:

  • States are marked as “no” to having any special qualifying events if 1) they do not require insurers to offer Medigap policies to people under age 65, or 2) they do not have any specified qualifying events or guaranteed issued protections for people under age 65, based on KFF review of state regulations, guidance documents, and contact with insurance departments or State Health Insurance Department Program (SHIP).
  • States are marked as “not specified” if publicly accessible documents do not specify requirements pertaining to each guaranteed issue qualifying event. These qualifying events were identified based on whether they are available to people 65 and older in that state.

Although best efforts were made to check each state’s regulations, guidance documents, and call insurance departments/SHIP offices, it is possible that states marked as “not specified” have rules that were not identified by the research team.

Appendix

Medicare Advantage Enrollees Ages 65 and Older in 37 States Do Not Have Guaranteed Issue Protections Outside of the Initial Trial Period and Other Limited Circumstances
Medigap Guaranteed Issue Requirements for Medicare Beneficiaries Ages 65 and Older by State, 2024
States with Initial Open Enrollment Period for Medigap for Medicare Beneficiaries Under Age 65 by State, 2024
Medigap Guaranteed Issue Requirements for Medicare Beneficiaries Under Age 65 by State, 2024

Gaps in Awareness of Insurance Requirements to Cover Preventive Services Among Women

Published: Oct 18, 2024

The Affordable Care Act (ACA) was passed over 14 years ago and yet, there are still gaps in awareness that federal law requires plans to cover the full cost of recommended preventive health care services, especially contraception.

Under the ACA, most private health plans and Medicaid expansion programs must provide coverage with no cost-sharing for many recommended preventive services that are important to women, including female contraceptives, mammograms, and yearly checkup visits. After a decade of major debates over the future of the ACA, today large majorities across partisanship have a favorable opinion of this ACA policy. However, there have been several legal challenges contesting part or all of the ACA, including an ongoing lawsuit, Braidwood Management Inc. v. Becerra, that aims to eliminate the coverage requirement for certain preventive services. While large shares of women ages 18 to 64 (71%) are aware that the ACA’s preventive services requirements cover an annual check-up for women without cost-sharing, nearly three in ten (29%) women either don’t know or believe it does not. Awareness of the benefit is much lower among women ages 18 to 25 compared to women ages 50 to 64 (52% vs. 77%). Knowledge of the requirement to cover routine mammograms is high (73%) among women over the age of 40, but one in four (26%) are not aware (Figure 1).

Most Women Are Aware That Their Health Plans Must Cover the Full Costs of Annual Check-Ups and Routine Mammograms, But Fewer Are Aware of Contraceptive Coverage Requirements

Even though most women use contraceptives, and plans are required to cover all FDA-approved prescription methods, less than half of reproductive age women (43%) and contraceptive users (47%) know that their insurance should cover the costs in full. Higher shares of Black women are aware of this requirement compared to White women (49% vs. 42%). Notably, less than half (44%) of women with private insurance coverage, for whom this requirement applies, are aware that most insurance plans are required to pay the full cost of birth control for women (Figure 2).

Most Reproductive Age Women Are Not Aware That Plans Are Required to Cover the Full Costs of Contraceptive Services and Supplies

It is possible that some women who are not aware of the contraceptive coverage requirement, have actually paid some out-of-pocket costs for their contraception. There have been a number of reports of people still paying out-of-pocket for their contraception, and recent Congressional investigations have found that some health insurers have continued to charge for contraception that is supposed to be covered in full. In response, the federal government continues to release guidance to clarify and reiterate the requirements for health plans.

Currently, all ACA preventive service requirements are in effect, however, the future is uncertain with legal challenges pending. Furthermore, the lack of knowledge of this benefit may result in fewer women accessing recommended preventive care.

Methodology

The 2024 KFF Women’s Health Survey was designed and analyzed by women’s health researchers at KFF. The survey was conducted from May 13 – June 18, 2024, online and by telephone among a nationally representative sample of 6,246 adults ages 18 to 64, including 3,901 women ages 18 to 49. Women include anyone who selected woman as their gender or who said they were non-binary transgender, or another gender and chose to answer the female set of questions about sexual and reproductive health.

Racial and Ethnic Health Disparities: Potential Implications of the Election

Published: Oct 17, 2024

Former President Trump and Vice President Harris have taken widely different stances and approaches on recognizing and addressing racial and ethnic disparities in health and health care. Former President Trump took executive action to prohibit federal agencies and contractors from providing training based on “divisive concepts” such as racism and sexism. As candidate, he has vowed to focus on “anti-White” racism, not racism against people of color. The Biden-Harris Administration has identified advancing racial equity as a federal priority, acknowledged that structural and systemic racism drive disparities, and recognized that social and economic factors play an important role in determining individuals’ health and well-being. Beyond these differences, variation in the candidates’ actions and proposals across different areas of health care, including health coverage, reproductive and maternal health, and immigrant health and well-being are likely to have important implications for future efforts to address health disparities as outlined below.

Health Coverage

Trump’s record as president included plans to repeal or weaken the Affordable Care Act (ACA) and cap and reduce federal Medicaid financing, while Vice President Harris has focused on efforts to “protect and strengthen Medicaid and the ACA.” Trump has said in the recent campaign that he’s not planning to repeal the ACA, though he has said he has “concepts” of a plan to replace it and would create a plan with “much better health care.” Although the Trump Administration never issued a detailed plan to replace the ACA, Trump’s budget proposals as president included plans to convert the ACA into a block grant to states, cap federal funding for Medicaid, and allow states to relax the ACA’s rules protecting people with preexisting conditions. Those plans, if enacted, would have reduced federal funding for health care by about $1 trillion over a decade, with trade-offs of higher out-of-pocket premiums for people, more uninsured, higher spending and greater risk for states, and restrictions in Medicaid eligibility. Under the Biden-Harris Administration, legislation was enacted that provided incentives for remaining non-expansion states to implement the ACA Medicaid expansion and provided enhanced subsidies for people to purchase Marketplace coverage. Harris has proposed making these enhanced subsidies permanent as they are currently set to expire at the end of 2025. Under the Biden-Harris Administration, there has been record ACA enrollment.

Future directions of ACA Marketplace and Medicaid coverage have important implications for racial and ethnic disparities in health coverage. Following the ACA health coverage expansions in 2014, there were large gains in coverage across racial and ethnic groups, which helped to narrow but not eliminate racial disparities in coverage (Figure 1). Continued efforts to increase access to coverage and improve continuity of coverage could further narrow these disparities. Conversely, coverage losses through the Marketplaces or Medicaid could reverse progress and widen disparities. Health coverage plays a key role in enabling people to access health care and protecting families from high medical costs.

Uninsured Rate Among the Nonelderly Population by Race and Ethnicity, 2010-2022

Changes to Medicaid may have particularly important implications for racial and ethnic health disparities given that it is a major source of health coverage for people of color. Medicaid helps to fill gaps in private coverage for many people of color, particularly children (Figure 2). Research suggests that ACA Medicaid expansion has contributed to a reduction in racial and ethnic disparities in health coverage. Adoption of the ACA Medicaid expansion in the remaining ten non-expansion states could continue to close coverage disparities. Nationally, over six in ten people in the coverage gap are people of color. Moreover, uninsured nonelderly Black people are more likely than White people to fall in the Medicaid “coverage gap” because a greater share live in states that have not implemented the Medicaid expansion.

Health Coverage of Nonelderly Population by Race and Ethnicity, 2022

Reproductive and Maternal Health

Vice President Harris has been and is an outspoken leader and advocate for reproductive freedom, while former President Trump has taken credit for the overturning of Roe v. Wade and has expressed support for letting states set their own abortion policy, including banning abortion. While abortion is the most prominent health care campaign issue, the election could also have large implications for contraceptive care and maternal health. Vice President Harris’ call for reproductive freedom includes access to contraception. The Trump Administration issued multiple regulations that restricted the availability of funding for contraception. During his campaign, he initially expressed that states could restrict access to contraceptives, but shortly afterwards, also said that he would not support this. As Senator, Vice President Harris sponsored the MOMNIBUS, a package of bills aimed at improving quality of and access to maternity care. Among other actions, under the Biden-Harris Administration, legislation was passed that allows states to extend Medicaid postpartum coverage from 60 days to 12 months. It also released a Maternal Health Blueprint that outlines future priorities. Former President Trump also issued a maternal health plan near the end of his term and signed federal legislation that provided funding for maternal mortality review committees.

The outcome of the election may have important implications for abortion restrictions, which in turn, will likely impact racial and ethnic disparities in maternal health. Pregnancy-related mortality rates among American Indian and Alaska Native (AIAN) and Black women are over three times higher compared to White women. State restrictions on abortion in the wake of the overturning of Roe v. Wade may widen maternal health disparities. Six in ten Black and AIAN women of reproductive age live in states with bans or restrictions compared to just over half of their White counterparts (Figure 3). People of color also are more likely than their White counterparts to face structural barriers that make it difficult to travel out of state for an abortion.

State Abortion Policies by Race and Ethnicity Among Women Ages 18-49, 2022

Future directions of Medicaid coverage for pregnant women and family planning services as well as efforts to improve maternal health also may impact disparities. Medicaid covers about 4 in 10 births nationally, including more than two-thirds among Black and AIAN people. Nearly all states have implemented the option to extend postpartum coverage from 60 days to 12 months, facilitating more continuous coverage during this period. KFF research also has found that the ACA’s Medicaid expansion promotes continuity of coverage in both the prenatal and postpartum periods. Additionally, over half of the states have established programs that use Medicaid funds to cover the costs of family planning services for low-income women who remain uninsured, and Medicaid accounts for 75% of all publicly funded family planning. Moreover, many state Medicaid programs have implemented policies, programs, and initiatives to improve maternity care and outcomes, including expanding coverage for benefits such as doula care, home visits, and substance use disorder and mental health treatment; and using new payment, delivery, and performance measurement approaches.

Immigrant Health and Well-Being

As president and candidate, Trump pursued restrictive immigration policies and spread anti-immigrant rhetoric and misinformation; the Harris campaign has emphasized her tough on crime stance as a former attorney general of a border state and her support for stricter border security. During his presidential term, Trump implemented more restrictive enforcement policies, issued a proclamation suspending entry of immigrants into the United States unless they provided proof of health insurance, rescinded the Deferred Action for Childhood Arrivals (DACA) program, and made changes to public charge policies that newly considered the use of non-cash assistance programs, including Medicaid, to determine whether people could enter the U.S. On the campaign trail, he has promised to carry out the “largest domestic deportation” in American history and to end birthright citizenship for children of undocumented immigrants. He also has spread misinformation about immigrants, describing them as a source of crime, a burden for taxpayers, and a drain on government programs like Medicare and Social Security. The Biden-Harris Administration reversed the Trump Administration’s public charge changes and the proclamation that suspended entry of immigrants unless they provided proof of health insurance. It also extended Marketplace eligibility to DACA recipients in 2024.

The future of immigration policies has important implications for the health and well-being of immigrants. Immigrants face large disparities in health and health care, including high uninsured rates, which reflect immigrant eligibility restrictions on health coverage programs funded by the federal government (Figure 4). Undocumented immigrants are prohibited from accessing federally funded programs, including Medicaid, Medicare, and the ACA Marketplaces, while many lawfully present immigrants are not eligible for these programs when they first arrive to the U.S. They also face barriers to care, including language access challenges, confusion about eligibility for health coverage and other public programs, and immigration-related fears. Earlier KFF analysis found that the policies and actions taken under the Trump Administration increased these fears, making immigrants more reluctant to access health coverage and care. Overall, research shows that immigrants use less health care and have lower health care costs than their U.S.-born counterparts, reflecting that they are younger and healthier and that they face greater barriers to care. Data also show that undocumented immigrants contribute billions in federal, state, and local taxes, with a sizeable share going toward programs that they cannot access, like Social Security and Medicare, and that they help subsidize health care for U.S.-born citizens

Uninsured Rates among U.S. Adults by Citizenship and Immigration Status, 2023

Understanding the Inequitable Impacts of Hurricanes and Other Natural Disasters in the Wake of Hurricanes Helene and Milton

Published: Oct 16, 2024

Extreme weather events used to be once in a century occurrences, but due to climate change, they have increased in both intensity and frequency. Hurricane Helene has claimed over 200 lives and is the deadliest hurricane to hit the continental U.S. since Hurricane Katrina. It is also projected to be one of the most expensive storms to hit the country. Hurricane Milton is one of the worst storms to hit Florida in over 100 years. The Biden-Harris Administration has mobilized resources to support the Federal Emergency Management Agency (FEMA), the Department of Defense and efforts to provide emergency assistance to families. At the same time, FEMA is facing ongoing misinformation and disinformation that may hamper response efforts. Amid recovery and response efforts, it’s important to recognize that hurricanes and other natural disasters have far-reaching impacts on health and well-being in their immediate aftermath and over the long-term. These impacts are uneven, with many groups who already face disparities in health and health care bearing the brunt of storms and other disasters. The uneven impacts reflect disparities in people’s risk of exposure to natural disasters; their ability to prepare for, evacuate from, and to recover from a natural disaster; and long-term impacts as discussed below.

Many of the same factors that contribute to health inequities leave some communities at higher risk of experiencing a natural disaster. Low income communities and communities of color are on the front lines of natural disasters and climate change. Due to historical residential segregation including redlining, people of color are more likely to live in neighborhoods that have worse infrastructure increasing their risk of harm and limiting their ability to prepare or safely shelter-in-place. In most states, homes in formerly redlined neighborhoods are more likely to be in flood zones, however in Florida more blue- and greenlined “desirable” neighborhoods have a higher risk of flooding due to proximity to the beach. Data on patterns of flooding associated with Hurricanes Helene and Milton are not yet available. Rural communities face challenges responding to natural disasters, ranging from physical isolation, high poverty rates, and limited access to health care as well as limited financial capacity.

The Southeast region of the U.S. is particularly vulnerable to severe tropical storms due to climate change, and its persistently high poverty rates inhibit residents’ ability to prepare for and recover from storms. Further, many of the states in the Southeast have not implemented the ACA Medicaid expansion, leaving lower income residents in those states with more limited access to health care, which may contribute to challenges addressing both immediate and longer term health needs. A significant proportion of people of color live in the South, with more than half of Black people residing in Southern states. Moreover, one study finds that Black communities are about twice as likely as other communities in the Southeast to experience a hurricane. It is estimated that, by 2050, homes owned by Black people in this region will be nearly twice as likely to be damaged by hurricanes compared to other communities.

Evacuation efforts for storms have highlighted disparities in peoples’ abilities to prepare for and evacuate in advance of major storms. About half of immigrants have limited English proficiency (LEP) and may face language barriers accessing evacuation and preparation resources. When Hurricane Beryl tore through Houston in 2024, significant portions of the city’s community with LEP felt unprepared as most emergency resources were written in Spanish and English but not other languages spoken by a large number of residents. Low-income communities, many of whom are people of color, are more likely to face financial challenges in preparing for natural disasters. A survey of Hurricane Harvey evacuees finds that people who evacuated spent on average between $1,200 to $2,300, accounting for lodging, transportation, food, and lost income.

There are also gaps in federal disaster management and response efforts. Research finds that recovery efforts are often inequitably distributed and favor White and wealthier communities over lower income communities and communities of color. In a KFF survey of Texas Gulf residents affected by Hurricane Harvey, six in ten affected Black residents reported feeling like they were not getting the help they needed to recover compared to a third of affected White residents. Further, a federal report finds that there were disparities in response efforts to Hurricane Harvey in Texas and Hurricane Maria in Puerto Rico, with Hurricane Harvey survivors receiving more aid faster compared to survivors of Hurricane Maria. The report also cited language barriers as a major issue that contributed to delays in people receiving aid and recovery support. Noncitizen immigrants are less likely to access recovery assistance programs than citizens, reflecting eligibility restrictions, immigration-related fears, and language barriers.

The impacts of hurricanes and other natural disasters are long-lasting. Research finds that hurricanes contribute to excess mortality years after they have passed, with Black people generally experiencing higher cumulative excess deaths compared to their White counterparts. In addition, major storms can increase the risk of illness and injury, disrupt infrastructure, and negatively impact the economy. For example, Hurricane Helene’s damage to a key manufacturer of IV solutions in North Carolina has led to a temporary supply disruption that will affect the broader U.S. medical system. Damage to infrastructure caused by storms can also compromise emergency response efforts, limit access to basic needs, and disrupt access to necessary health care and prescription medications. Storms can also have long-lasting mental health impacts. Data from a KFF survey of New Orleans residents who lived in the area during Katrina reported lingering stress and problems with their mental health due to the hurricane, ten years after the storm.

The federal government has taken steps to advance climate change adaptation and promote risk reduction and community resilience. For example, the Building Resilient Infrastructure and Communities initiative supports states, local governments, Tribes, and territories in designing projects to strengthen infrastructure and minimize risks before disasters occur. FEMA has developed a National Risk Index to identify locations most at risk for 18 natural hazards, adopted climate resilience building standards, and dedicated funding to support communities at risk for climate-related extreme weather events and other natural disasters. Research suggests that efforts at the local, state, Tribal, and federal levels are key to adapting to and mitigating the worsening impacts of climate change.