Recent Trends in Medicaid Outpatient Prescription Drugs and Spending
In recent years, Medicaid spending on prescription drugs has grown, in part due to the emergence of new, high-cost drugs, including GLP-1s and cell and gene therapies that treat, and sometimes cure, rare diseases. There have been several recent Trump administration prescription drug initiatives (Box 1), including new payment models, that could help combat rising costs for state Medicaid programs, though questions remain about the implementation and impact of the deals. While lower prices for state Medicaid programs through the new models could result in reduced Medicaid prescription drug spending and potentially expanded coverage of certain drugs, the extent of the savings and how states or manufacturers will respond remain unclear. In most cases, Medicaid programs already pay lower prices, net of rebates, than other payers.
Medicaid enrollees are typically protected from high out-of-pocket costs for prescription drugs, meaning the recent federal prescription drug deals will not impact costs for people with Medicaid. However, the 2025 reconciliation law, signed by President Trump on July 4, 2025, is expected to result in significant Medicaid funding cuts and coverage losses. The loss of Medicaid coverage altogether could make it more difficult and costly for families to access the prescription drugs they need. While TrumpRx (see Box 1) offers discounts for uninsured or other cash-paying patients, the costs would likely still be prohibitive for low-income people with Medicaid or people who have recently lost Medicaid coverage.
This issue brief describes recent trends in the number of Medicaid outpatient prescriptions and the spending on those drugs and examines the implications of recent federal actions on future trends. Key findings include:
- Net spending on Medicaid prescription drugs after rebates is estimated to have grown substantially in recent years, increasing from $31 billion in FY 2019 to $46 billion in FY 2024 (or 46%). Both net spending per prescription and net spending per enrollee also grew over the period, increasing by 42% (from $43 in FY 2019 to $61 in FY 2024) and 25% (from $481 in FY 2019 to $603 in FY 2024), respectively.
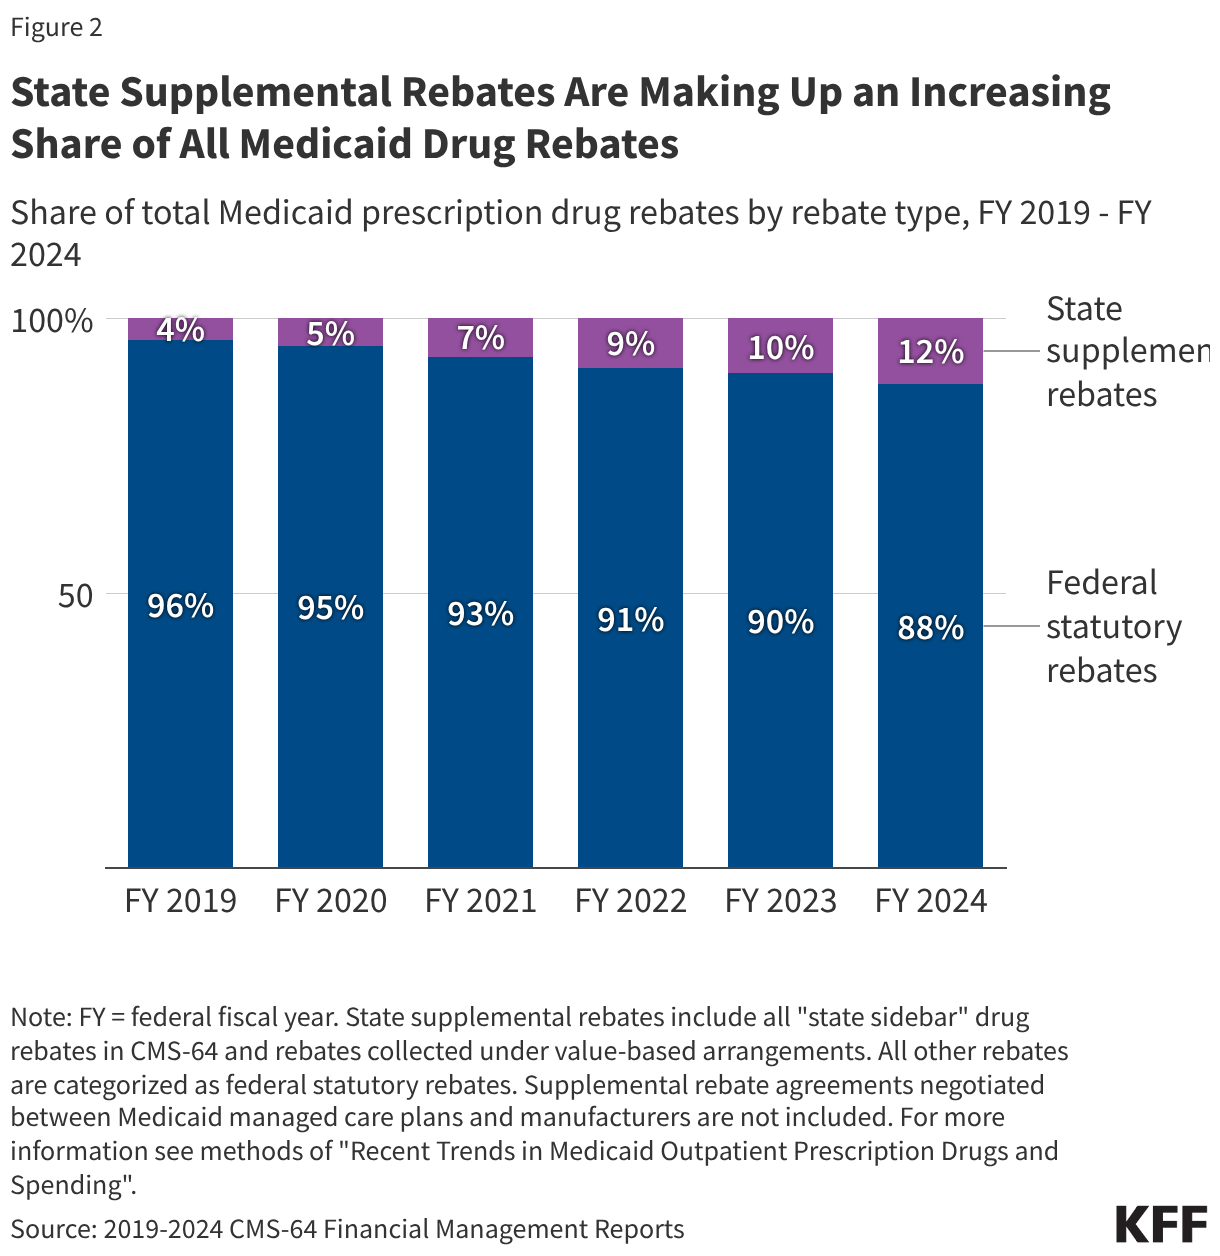
- Rebates reduce Medicaid spending on prescription drugs by over half, with state supplemental rebates making up an increasing share of all rebates.
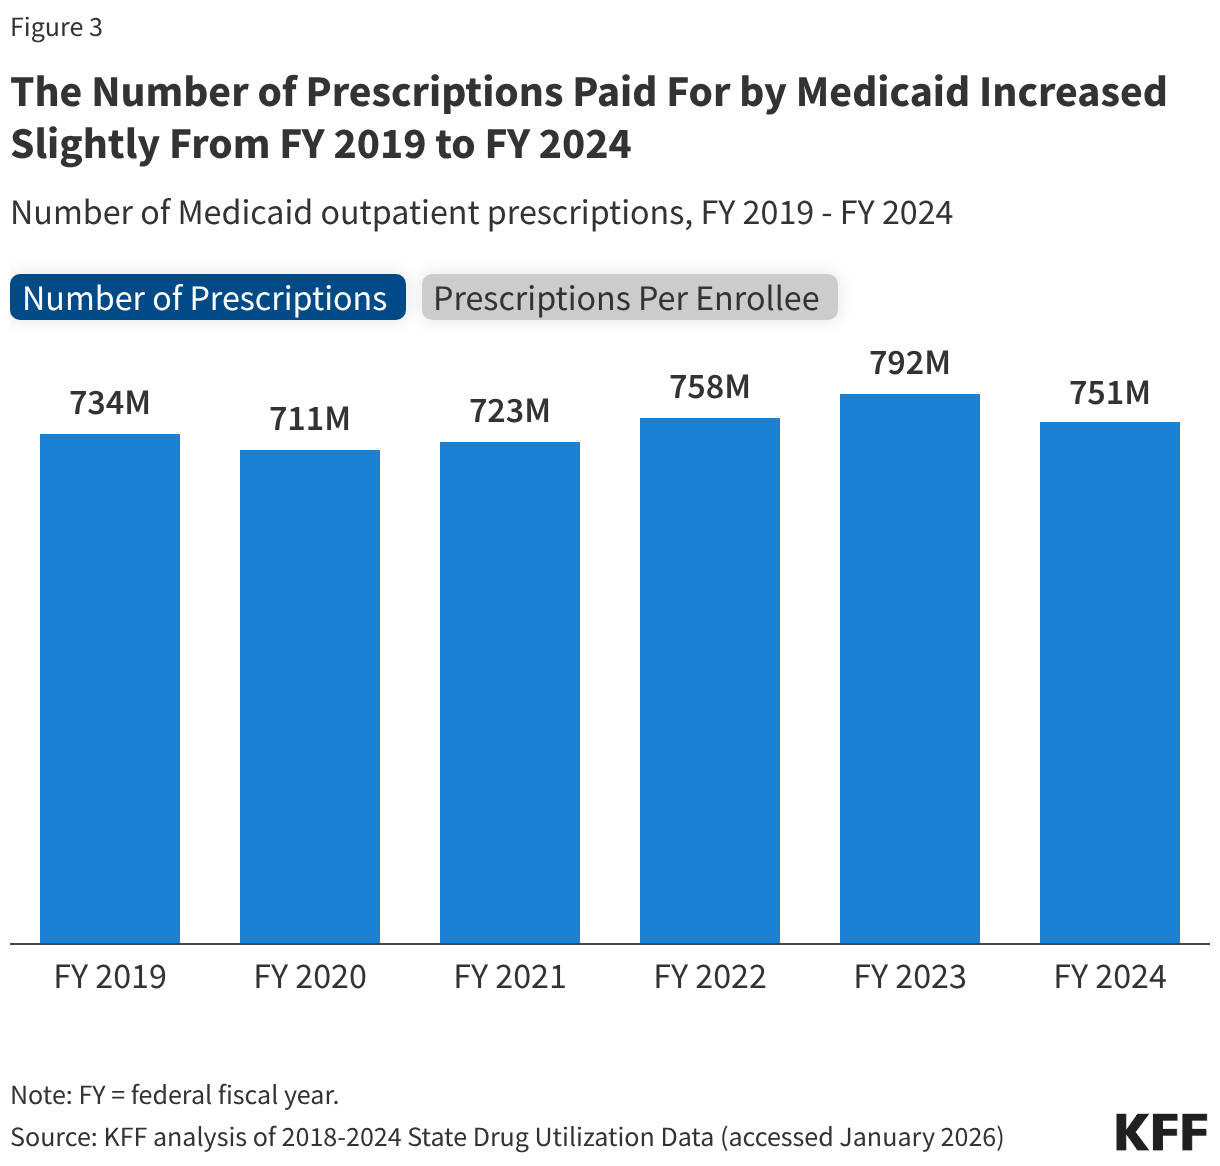
- While net spending increased substantially, the number of prescriptions paid for by Medicaid only grew slightly in recent years, increasing from 734 million in FY 2019 to 751 million in FY 2024 (or 2%). At the same time, the number of Medicaid prescriptions per enrollee declined by 12% (from 11.2 in FY 2019 to 9.9 in FY 2024).
- Looking ahead, more recent quarterly data show the number of Medicaid prescriptions and Medicaid enrollment declining while gross Medicaid spending remains elevated.
Box 1: Recent Federal Medicaid Prescription Drug Initiatives
“Most-favored nation” (MFN) drug pricing: Following an Executive Order in May 2025 and letters to major pharmaceutical companies in July 2025, the Trump administration announced reaching agreements with several drug manufacturers to provide MFN prescription drug pricing in Medicaid, introduce new medications at MFN prices, and sell certain products directly through TrumpRx. The manufacturers also committed to increasing their investment in U.S. manufacturing in return for a 3-year reprieve from tariffs. These MFN agreements are based on the premise that the U.S. shouldn’t pay higher prices for prescription drugs than the prices paid in other comparable nations. Details of these agreements remain confidential, leaving the full scope of the deals largely unknown. Medicaid drug prices, net of rebates, are already typically lower than for other payers in the U.S. However, there is no public information on the extent of rebates for specific drugs, so no way to compare net prices in Medicaid to those in other countries.
New CMS Innovation Center (CMMI) models: In addition to implementing the Cell and Gene Therapy (CGT) Access Model created under the Biden administration, the Trump administration has announced two new Medicaid drug pricing models. The recently announced MFN drug prices will be made available to state Medicaid programs through the GENEROUS (GENErating cost Reductions fOr U.S. Medicaid) Model, a drug payment model through which CMS will negotiate supplemental drug rebates based on prices paid in other countries. The model is voluntary for states and manufacturers and launched in January 2026. The Trump administration also announced the BALANCE (Better Approaches to Lifestyle and Nutrition for Comprehensive hEalth) Model, another model that intends to expand access to obesity drugs in Medicaid and Medicare by negotiating lower GLP-1 prices with manufacturers through supplemental rebates. This model is also voluntary for states and manufacturers and will launch as early as May 2026. Under both models, CMS will negotiate standardized coverage criteria in addition to supplemental rebates, and manufacturers will provide additional lifestyle supports through the BALANCE model.
President Trump’s “Great Healthcare Plan”: In his “Great Healthcare Plan,” President Trump has proposed to “codify” the administration’s MFN drug pricing deals that have been agreed to by drug companies in recent months. However, at this time very little is known publicly about the agreements, making it difficult to understand what it would mean to “codify” these deals.
TrumpRx: The administration also set up a website, TrumpRx.gov, which the public can use to search for discounted prices on brand-name medications when paying without using insurance. Through the TrumpRx website patients cannot purchase medications directly but instead, for the majority of the website’s drugs, can print drug manufacturer coupons that can be used at retail pharmacies at the time of purchase. The website launched in early February 2026, offering discounts on over 40 mostly brand name medications.
What are recent trends in Medicaid prescription drug spending?
Net spending (spending after rebates) on Medicaid prescription drugs is estimated to have grown substantially in recent years, increasing from $31 billion in FY 2019 to $46 billion in FY 2024, a 46% increase (Figure 1). However, from FY 2023 to FY 2024 alone, gross spending remained relatively steady and rebates grew, resulting in net spending decreasing by 10%. Net spending per prescription grew by 42% over the period (from $43 in FY 2019 to $61 in FY 2024) (data not shown), and net spending per enrollee grew by 25% over the period (from $481 in FY 2019 to $603 in FY 2024). There are a number of factors that contribute to changes in drug spending including changes in enrollment and utilization patterns, policy changes, changes in existing drug prices, and the number and price of new drugs coming to market. Analysis has shown that recent growth in Medicaid drug spending is being increasingly driven by spending on high-cost specialty drugs, including new cell and gene therapies that treat, and sometimes cure, rare diseases and other high-cost specialty drugs like those for cancer treatment. Other drugs such as GLP-1s, which are both costly and widely utilized, also further contribute to spending increases. In addition, while there has been a substantial increase in net prescription drug spending over the period, the increase in net spending on prescription drugs is in line with increases in total Medicaid spending, which grew by 52% over the period based on KFF analysis of CMS-64 financial management reports. Overall, prescription drug spending accounted for 6% of all Medicaid spending in 2024 and has remained relatively stable between 5% and 7% of all Medicaid spending over the last two decades.
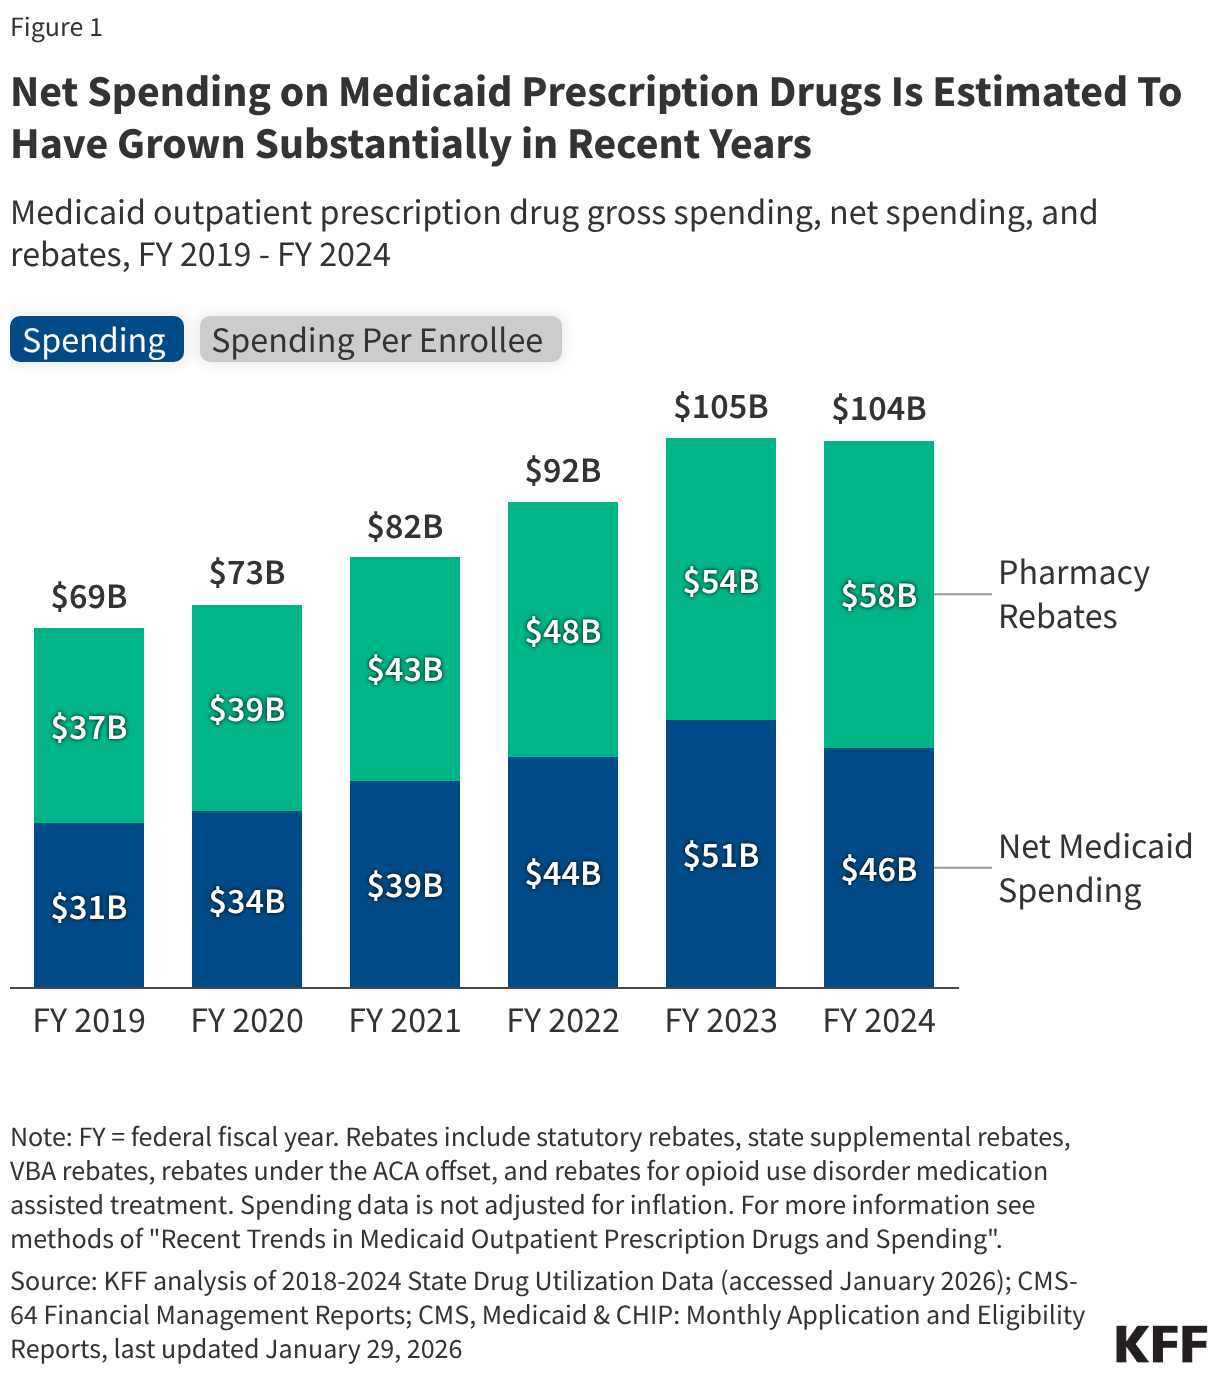
Rebates reduce Medicaid spending on prescription drugs by over half, with state supplemental rebates making up an increasing share of all rebates (Figure 2). Rebates reduced gross Medicaid spending on prescription drugs by 53% on average over the period; the share of gross spending rebates accounted for declined slightly from 54% in FY 2019 to 51% in FY 2023 before increasing to 56% in FY 2024 (Figure 1). State supplemental rebates account for an increasingly larger share of all Medicaid drug rebates (Figure 2). In addition to federal statutory rebates, most states negotiate directly with manufacturers for supplemental rebates, and recent data signal states may be expanding the scope of their negotiations to combat rising drug spending. The recently announced federal models (Box 1) plan to provide lower drug prices by negotiating supplemental rebates on top of statutory rebates, though it is not clear how most-favored nation (MFN) prices under the model compared to net prices states may have already negotiated through supplemental rebate agreements. A number of factors are likely contributing to the overall uptick in rebates for FY 2024 including increasing state supplemental rebates as well as the lifting of the rebate cap beginning January 1, 2024.
What are recent trends in the number of Medicaid prescriptions?
While net spending increased substantially, the number of prescriptions paid for by Medicaid only increased slightly from 734 million in FY 2019 to 751 million in FY 2024, a 2% increase (Figure 3). The number of Medicaid prescriptions declined in FY 2020 before steadily rising and peaking in FY 2023 and then beginning to decline again in FY 2024. The number of Medicaid prescriptions per enrollee declined by 12% over the period, falling from 11.2 in FY 2019 to 9.2 in FY 2023 before increasing to 9.9 in FY 2024. Following the initial onset of the COVID-19 pandemic, increases in Medicaid enrollment due to the continuous enrollment provision likely contributed to modest increases in prescriptions overall but declines in prescriptions per enrollee through FY 2023. Other factors, including increases in the number of days supplied per prescription, may have also played a role (this analysis does not account for days supply, see Methods). For FY 2024, Medicaid enrollment declines during the unwinding of the continuous enrollment provision as well as higher health care needs among enrollees post-unwinding are likely resulting in a decrease in the number of prescriptions but increase in prescriptions per enrollee.
What are early indicators of future Medicaid prescription drug trends?
Quarterly data through most of FY 2025 show the number of Medicaid prescriptions and Medicaid enrollment continue to decline, while gross Medicaid spending remains elevated (Figure 4). Recent trends in the number of prescriptions paid for by Medicaid appear to roughly mirror trends in Medicaid enrollment, with both the quarterly number of Medicaid outpatient prescriptions and average quarterly Medicaid enrollment peaking in 2023, due to the pandemic-era continuous enrollment provision. After, during the unwinding of the provision, both enrollment and the number of prescriptions began to fall. As more provisions in the 2025 reconciliation law are implemented and individuals begin to lose coverage, Medicaid enrollment and the number of prescriptions may continue to decline. Quarterly gross spending has remained elevated despite declines in Medicaid enrollment and in the number of prescriptions. It remains unclear if recent increases in rebates will continue -- blunting the increase in gross spending -- or how federal changes in the 2025 reconciliation law and recent federal prescription drug initiatives (Box 1) may impact future gross and net spending trends.
Methods
Number of Prescriptions and Gross Spending Data: This analysis uses 2018 through 2025 State Drug Utilization Data (SDUD) (downloaded in January 2026) converted to federal fiscal years (FY). The SDUD is publicly available data provided as part of the Medicaid Drug Rebate Program (MDRP), and provides information on the number of prescriptions, Medicaid spending before rebates, and cost-sharing for rebate-eligible Medicaid outpatient drugs by national drug code (NDC), quarter, managed care or fee-for-service, and state. It also provides this data summarized for the whole country. The data do not include information on the number of days supplied in each prescription. CMS has suppressed SDUD cells with fewer than 11 prescriptions, citing the Federal Privacy Act and the HIPAA Privacy Rule. This analysis used the national totals data because less data is suppressed at the national versus state level.
Rebate Data: This analysis uses CMS-64 Financial Management Reports (FMR) for FY 2019 through FY 2024 (downloaded in August 2025). These reports include total Medicaid expenditures broken out by various service categories, and this analysis pulls out the drug rebate line items. The rebate data used includes statutory rebates, state supplemental rebates, rebates under the ACA offset, rebates from VBAs, and rebates for opioid use disorder medication assisted treatment. To estimate net Medicaid spending on prescription drugs each fiscal year in figure 1, the rebates collected in the CMS-64 were subtracted from the gross spending totals from the SDUD. State supplemental rebates in figure 2 include all "state sidebar" drug rebates in CMS-64 and rebates collected under value-based arrangements; all other rebates are categorized as federally required rebates. Supplemental rebate agreements negotiated between Medicaid managed care plans and manufacturers are not included.
Limitations: There are a number of limitations to the estimates of Medicaid prescriptions and spending found in this analysis, including:
- This analysis examines the number of Medicaid prescriptions in the data and does not adjust for days supplied by each prescription. An increase in prescription lengths, especially during the pandemic, could contribute to fewer prescriptions.
- The SDUD are updated quarterly; a new quarter of data is typically released, and the prior five years of data are also updated. This means prescription and gross spending totals can vary depending on when the data is downloaded, and totals may not match other outside sources or prior KFF analysis for this reason.
- The spending collected on the CMS-64 and reported in the FMR data uses a cash-basis of accounting, meaning expenditures are based on the date of payment not necessarily when the service occurred. In practice, states have two years following the date a service was rendered to report their spending. There may be timing differences causing misalignment between the prescriptions paid for by Medicaid in the SDUD and the rebates reported in the CMS-64.
- Drugs not dispensed by a pharmacy but received in other settings, including physician-administered drugs, can be eligible for rebates under the MDRP if they meet the definition of a “covered outpatient drug,” generally meaning a prescription drug that is FDA approved from a rebating manufacturer and identified separately on a claim for payment. This analysis includes any rebate eligible drugs, though billing practices may vary by state.
- Spending data is not adjusted for inflation.