The Impact of the Pandemic on Well-Child Visits for Children Enrolled in Medicaid and CHIP
In Medicaid, states are required to cover all screening services as well as any services “necessary… to correct or ameliorate” a child’s physical or mental health condition under Medicaid’s Early and Periodic Screening, Diagnostic and Treatment (EPSDT) benefit (see Box 1). Many of these screening services along with immunizations are provided at well-child visits. These visits are a key part of comprehensive preventive health services designed to keep children healthy and to identify and treat health conditions in a timely manner. Various studies have also shown that children who forego their well-child visits have an increased chance of going to the emergency room or being hospitalized. Well-child visits are recommended once a year for children ages three to 21 and multiple times a year for children under age three according to the Bright Futures/American Academy of Pediatrics (AAP) periodicity schedule.
A recent Centers for Medicare and Medicaid Services (CMS) analysis shows that half of children under age 19 received a Medicaid or CHIP funded well-child visit in 2020. The onset of the pandemic in 2020 had a substantial impact on health and health care service utilization, but research has shown that many Medicaid-covered children were not receiving recommended screenings and services even before the pandemic. This issue brief examines well-child visit rates overall and for selected characteristics before and after the pandemic began and discusses recent state and federal policy changes that could impact children’s preventive care. The analysis uses Medicaid claims data which track the services enrollees use and may differ from survey data. In future years, claims data will be used to monitor adherence to recommended screenings. Key findings include:
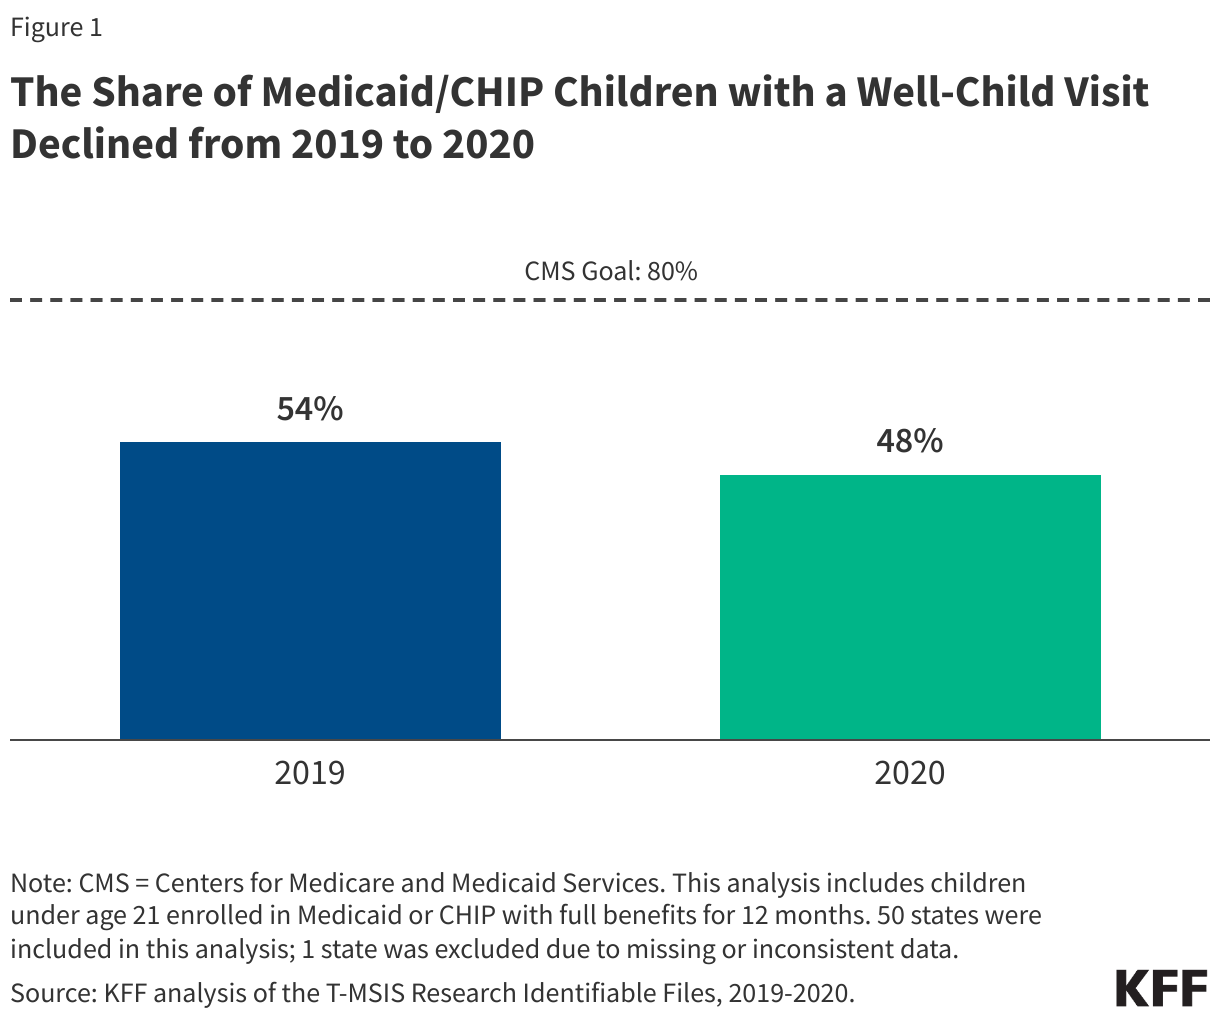
- More than half (54%) of children under age 21 enrolled in Medicaid or CHIP received a well-child visit in 2019, but the share fell to 48% in 2020, the start of the COVID-19 pandemic.
- Despite having the highest well-child visit rates compared to other ethnic and racial groups, Hispanic and Asian children enrolled in Medicaid or CHIP saw the largest percentage point declines in well-child visit rates from 2019 to 2020.
- Children over age three enrolled in Medicaid or CHIP have lower rates of well-child visits and experienced larger declines in well-child visits during the pandemic than children under age three.
- Well-child visit rates are lower for Medicaid/CHIP children in rural areas, but rates in urban areas declined more during the pandemic.
Box 1: Medicaid’s EPSDT Benefit
What is the EPSDT benefit?
Medicaid’s Early and Periodic Screening, Diagnostic and Treatment (EPSDT) benefit provides a set of comprehensive health care services to Medicaid enrollees under age 21. Under EPSDT, states are required to cover all screening services for children as well as any services “necessary… to correct or ameliorate” a child’s physical or mental health condition. States must provide screenings for developmental and behavioral health conditions, as well as for vision, hearing, and dental conditions, on a periodic basis that meets reasonable standards of medical practice. These services must be provided for children, regardless of whether a state chooses to cover them for adults.
What is the goal of the EPSDT benefit and why is it important?
The EPSDT benefit aims to identify health conditions that can impede children’s growth and development early and is key in ensuring low-income children receive the care they need. While the EPSDT benefit is important to all children, it has been especially beneficial for children with special health care needs. Through the EPSDT benefit, Medicaid provides more comprehensive coverage for these children than the typical private insurance plan and increases access to needed services that improve the quality of daily life. Medicaid covers almost half of all children with special health care needs. In addition, EPSDT facilitates greater access to care for children with behavioral health needs, as children diagnosed with mental or other behavioral health conditions must receive any service available under federal Medicaid law necessary to address the condition, even if the state does not cover the behavioral health service for adults.
How did use of well-child visits change during the pandemic?
More than half (54%) of children under 21 enrolled in Medicaid or CHIP received a well-child visit in 2019, but the share fell to 48% in 2020, the first year of the COVID-19 pandemic (Figure 1). Rates examined here use Medicaid claims data which differ substantially from survey data (see Box 2). While the vast majority of children in the analysis (91% in 2019 and 88% in 2020) used a least one Medicaid service, including preventive visits, sick visits, filling prescriptions, or hospital or emergency department visits, well-child visit rates remained low and are substantially below the CMS goal of at least 80%. One recent analysis found that 4 in 10 children enrolled in Medicaid or CHIP experienced at least one challenge when accessing health care. Barriers to Medicaid/CHIP children receiving needed care can include lack of transportation, language barriers, disabilities, and parents having difficulty finding childcare or taking time off for an appointment as well as the availability of and distance to primary care providers. Some states have seen a loss in Medicaid pediatric providers, and one recent story reported that families with Medicaid in California were traveling long distances and experiencing long wait times for primary care appointments. Data have also shown slight declines in the share of kindergarten children up to date on their routine vaccinations since the COVID-19 pandemic, which may, in part, be associated with the decline in well-child visits. The national measles, mumps, and rubella (MMR) vaccination rate is below the goal of at least 95%, and some states are now seeing measle outbreaks among children.
Despite having the highest well-child visit rates compared to other ethnic and racial groups, Hispanic and Asian children enrolled in Medicaid or CHIP saw the largest percentage point declines in well-child visit rates from 2019 to 2020 (Figure 2). Prior to the pandemic in 2019, about half or more of children across most racial and ethnic groups had a well-child visit, with rates highest for Hispanic (60%) and Asian (57%) children. The rate for American Indian and Alaska Native (AIAN) children lagged behind at just over one in three (36%), although this may reflect that some services received from Indian Health Service providers not being captured in the analysis (see Methods). Between 2019 and 2020, the well-child visit rate fell for all racial and ethnic groups. Hispanic and Asian children experienced the largest percentage point declines in well-child rates (9 percentage points for both groups), but they still had higher rates compared to other groups as of 2020. Black, Native Hawaiian, and Other Pacific Islander (NHOPI), and AIAN children also experienced larger percentage point declines in their well-child visit rates compared with White children, and AIAN children had the largest relative decline on account of their lower starting rate. As of 2020, rates remained lowest for NHOPI (42%) and AIAN children (29%). Twenty-two states, including some states that are home to larger shares of AIAN and NHOPI children, were excluded from the race/ethnicity analysis due to data quality issues (see Methods).
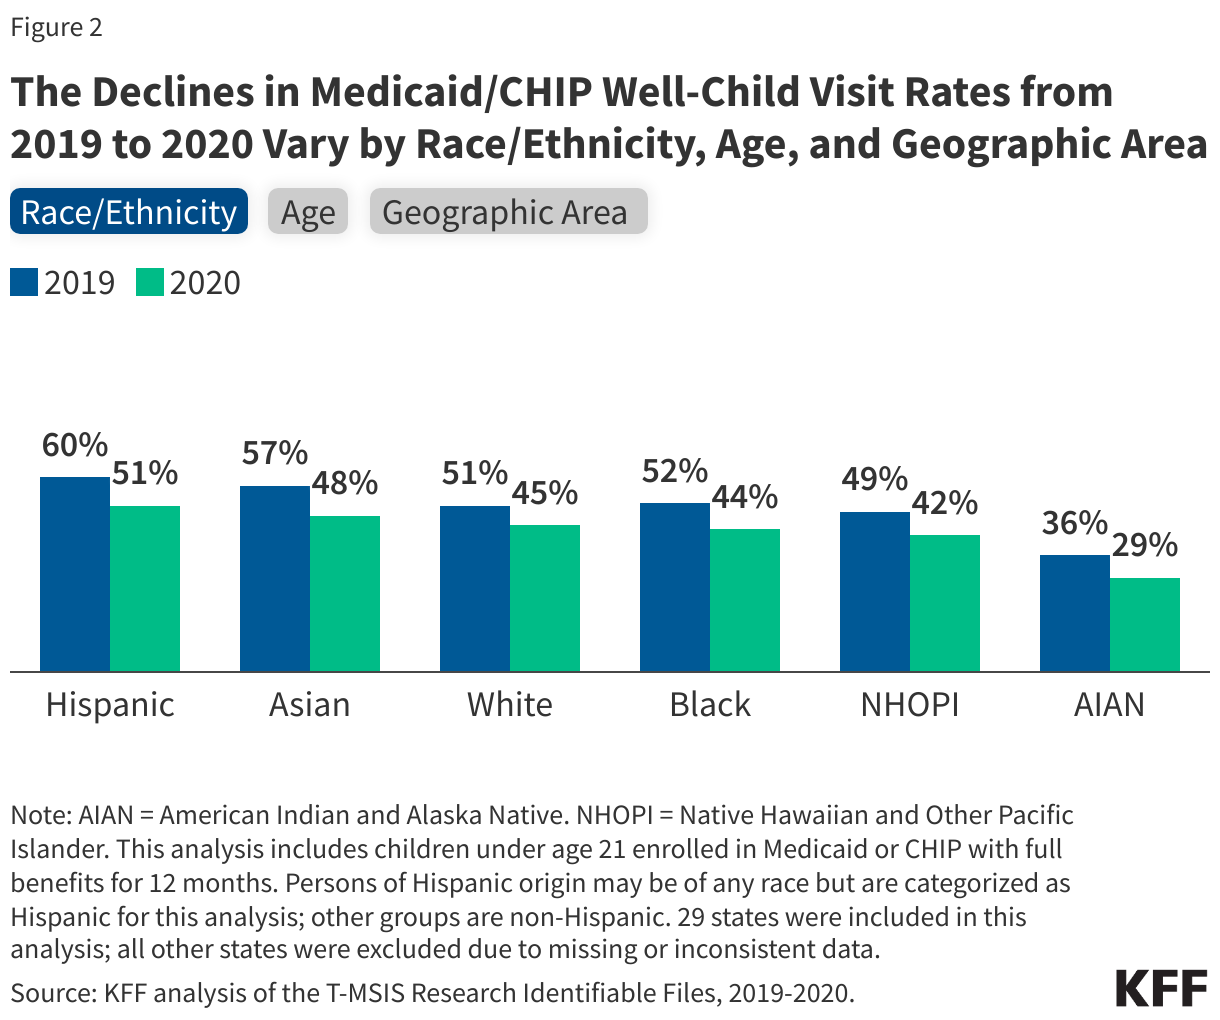
Children ages three and older have lower rates of well-child visits and experienced larger declines in well-child visits during the pandemic than children under age three (Figure 2). Well-child visit rates are highest when children are young because multiple well-child visits are recommended for children under age three. Although children under three have highest rates of a single well-child visit within the year, it is unknown whether the rates of adherence to recommended well-child screenings are higher or lower than that of other groups because this analysis only accounts for one well-child visit in a year. Well-child visit rates steadily decrease as children get older with the exception of the 10-14 age group, where somewhat higher rates may reflect school vaccination requirements.
Well-child visit rates are lower in rural areas than urban ones, but urban areas had larger declines during the first year of the pandemic (Figure 2). The share of Medicaid/CHIP children living in rural areas with a well-child visit declined from 47% in 2019 to 43% in 2020 while the share for urban areas fell from 56% in 2019 to 49% in 2020, narrowing the gap between Medicaid/CHIP well-child visit rates in rural and urban areas. Note that 18% of children in the analysis lived in a rural area, and three states were excluded from the geographic area analysis due to data quality issues (see Methods). This analysis also examined changes for children by eligibility group, managed care status, sex, and presence of a chronic condition; data are not shown but well-child visit rates for Medicaid/CHIP children declined across all groups from 2019 to 2020.
Box 2: Variation in Well-Child Visit Rates Across Data Sources
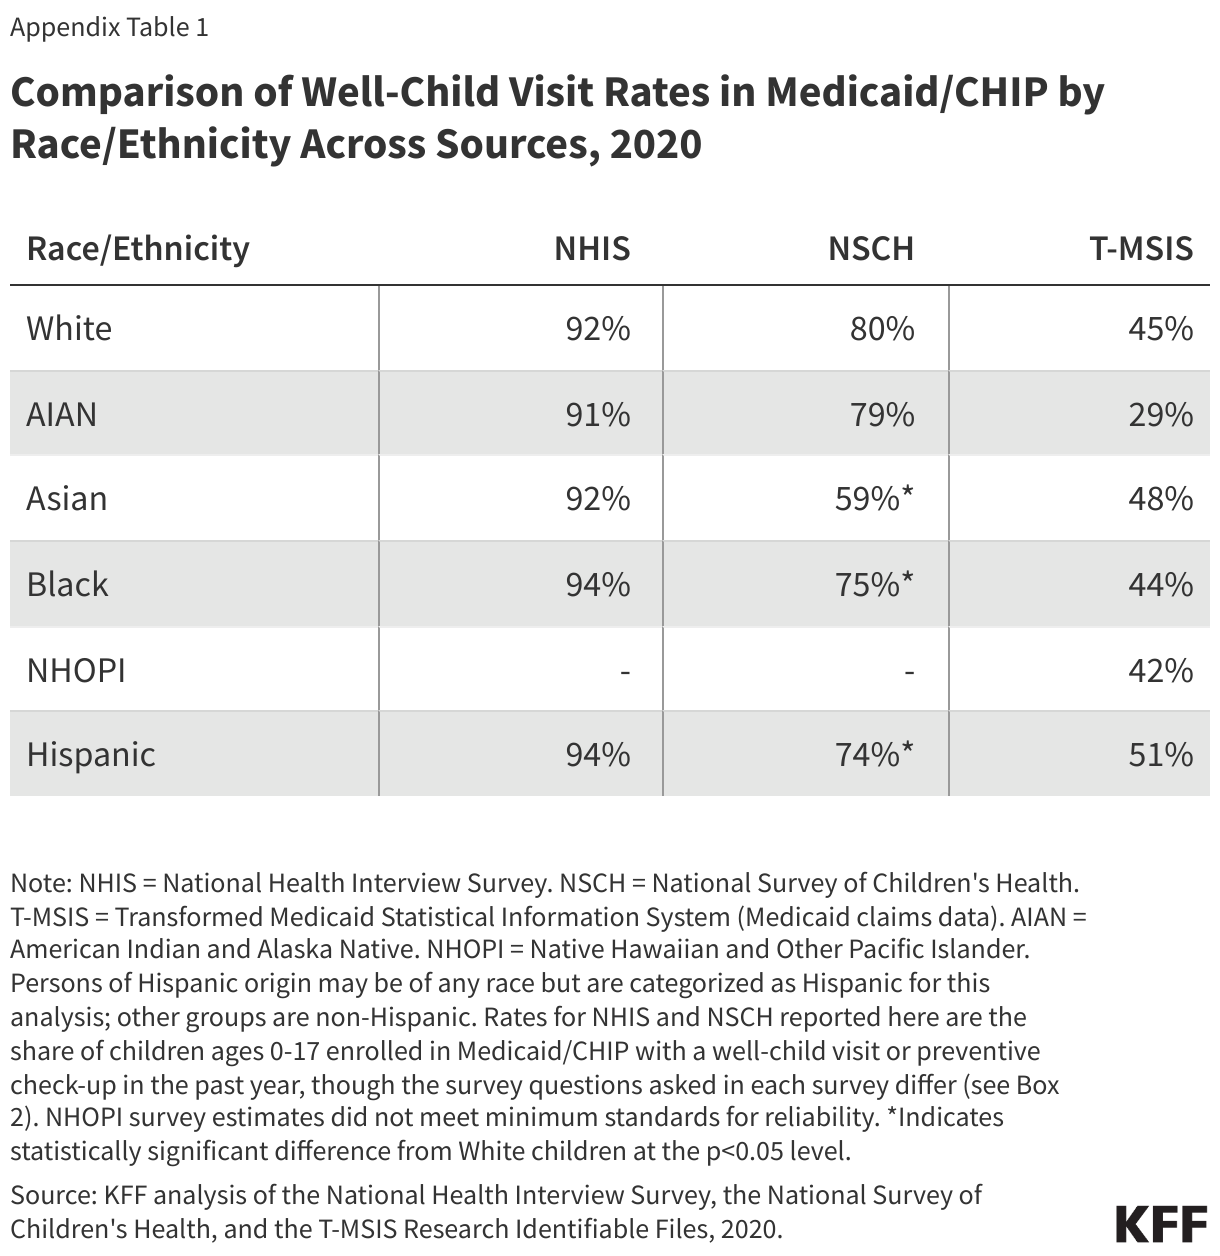
There is substantial variation in children’s well-child visit rates across data sources (Appendix Table 1). Rates vary depending on whether the data are self-reported survey data or medical claims data. KFF analysis of 2020 national survey data and Medicaid claims data (used in this analysis) finds that the share of Medicaid/CHIP children with a well-child visit within the year can vary from 48% in Medicaid claims data to 93% in the National Health Interview Survey (NHIS).
Studies have found that utilization rates can vary substantially between self-reported survey data and claims data, likely due in part to recall bias in surveys and the types of claims being included. Research has shown that the accuracy of self-reported utilization in survey data decline over long recall periods and/or for more routine services. Claims data only capture well-child visits that were billed to the payer, in this case Medicaid, and some settings such as community clinics, schools, or Indian Health Service facilities may not always bill Medicaid.
There can also be variation in utilization rates across survey sources due in part to different survey question designs. National surveys such as NHIS and the National Survey of Children’s Health (NSCH) both collect information on children’s well-child visits, though there are differences in the questions asked. NHIS asks a series of questions about how long it has been since a child has seen a “doctor or other health professional for a well child visit, physical, or general purpose checkup” while NSCH asks about “how many times (in the past 12 months) did this child visit a doctor, nurse, or other health care professional to receive a preventive check-up?”.
Trends in well-child visit rates by race and ethnicity or coverage type vary across data sources. This analysis shows Hispanic and Asian children enrolled in Medicaid/CHIP have the highest well-child visit rates. However, NHIS shows that well-child visit rates in Medicaid/CHIP were similar across racial and ethnic groups in 2020 (Appendix Table 1). NSCH shows that White and AIAN children enrolled in Medicaid/CHIP had the highest rates across all racial and ethnic groups in 2020. Further, different data sources show varying trends by health insurance coverage type. Data from NHIS in 2020 show similar rates for Medicaid/CHIP compared to private insurance while data from the NSCH shows rates are higher for children with private insurance compared with Medicaid/CHIP. Healthcare Effectiveness Data and Information Set (HEDIS) measures for child and adolescent well-care visits also show higher rates in commercial HMO and PPO plans compared with Medicaid HMO plans.
This analysis uses claims data (T-MSIS), not self-reported survey data, to examine trends in well-child visits because of the use of T-MSIS in EPSDT and Child Core Set reporting. States can now opt to have CMS generate their EPSDT CMS-416 reports using T-MSIS; 28 states opted for this in 2021. CMS is also investigating the use of T-MSIS for Child Core Set reporting, which is now mandatory, in attempt to alleviate the reporting burden for states. These reports are intended to monitor the provision of the EPSDT benefit and identify gaps as well as measure health care outcomes and are increasingly using T-MSIS to do so.
What to watch?
Well-child visit rates for Medicaid/CHIP children overall fall below the goal rate, with larger gaps for AIAN, Black and NHOPI children as well as older children and children living in rural areas, highlighting the importance of outreach and other targeted initiatives to address disparities. Addressing access barriers and developing community partnerships have been shown to increase well-child visit rates and reduce disparities. It will be important to track, as data become available, the extent to which well-child visit rates as well as vaccination rates (often administered at well-child visits) rebounded during the pandemic recovery and where gaps remain.
Recent state and federal actions could help promote access, quality and coverage for children that could increase well-child visit rates. The Bipartisan Safer Communities Act included a number of Medicaid/CHIP provisions to ensure access to comprehensive health services and strengthen state implementation of the EPSDT benefit. CMS also released an updated school-based services claiming guide, and states have taken action to expand Medicaid coverage of school-based care in recent years. In 2024, it became mandatory for states to report the Child Core Set, a set of physical and mental health quality measures, with the goal of improving health outcomes for children. In addition, as of January 2024, all states are now required to provide 12-month continuous eligibility for Medicaid and CHIP children, which could help stabilize coverage and help children remain connected to care. Three states also recently received approval to extend continuous eligibility for children in Medicaid for multiple years, which could help children maintain coverage beyond one year. In the recently released FY 2025 budget, the Biden Administration proposes establishing the option for states to provide continuous eligibility in Medicaid and CHIP for children from birth to age six or for 36 month periods for children under 19.
Lastly, millions of children are losing Medicaid coverage during the unwinding of the continuous enrollment provision, which could have implications for access. Data up to March 2024 show that children’s net Medicaid enrollment has declined by over 4 million. In some cases, children dropped from Medicaid may have transitioned to other coverage, but they may also become uninsured, despite in many cases remaining eligible for Medicaid or CHIP. While people of color are more likely to be covered by Medicaid, data on disenrollment patterns by race and ethnicity are limited. KFF analysis shows individuals without insurance coverage have lower access to care and are more likely to delay or forgo care due to costs. A loss of coverage or gaps in coverage can be especially problematic for young children who are recommended to receive frequent screenings and check-ups.
Methods
Data: This analysis used the 2019-2020 T-MSIS Research Identifiable Files including the inpatient (IP), long-term care (LT), other services (OT), and pharmacy (RX) claims files merged with the demographic-eligibility (DE) files from the Chronic Condition Warehouse (CCW).
Identifying Well-Child Visits: This analysis used the procedure and diagnosis codes listed in the Annual Early and Periodic Screening, Diagnostic, and Treatment (EPSDT) Participation Report (CMS-416) reporting instructions (see line 6) to identify when a well-child visit occurred. This method of identifying well-child visits mirrors the recent CMS well-child visit analysis.
Identifying Utilization of Any Medicaid Services: To determine if a child in the analysis utilized any Medicaid services within the year, all fee-for-service or managed care encounter claims across the IP, LT, OT, and RX claims files were flagged (claims for capitated payments or any payments not billed at the enrollee level were excluded). If a child had any flagged claims, the child was identified as utilizing a service within the year.
Defining Rural and Urban Areas: This analysis uses enrollee zip code information and the US Department of Agriculture (USDA) Rural-Urban Commuting Areas (RUCA) codes (based on 2010 census data) to designate rural and urban areas. Zip codes with a RUCA value greater than or equal to 4 are designated as rural.
Enrollee Inclusion Criteria: This analysis includes children ages 0 to 21 who were enrolled in Medicaid or CHIP with full benefits for 12 months. The 12-month enrollment period is consistent with the recent CMS analysis, but that analysis only included children under the age of 19.
State Inclusion Criteria: To assess the usability of states’ data, the analysis examined quality assessments from the DQ Atlas for restricted benefits code, claims volume, and managed care encounters and compared the share of children with a well-child visit in T-MSIS to the share of children receiving at least one initial or periodic screening in the annual EPSDT reporting data files. The analysis excluded any states that, for a particular year, had both a “High Concern/Unusable” DQ Atlas assessment and a more than 10-percentage point difference between the share of children with a well-child visit in T-MSIS and the share reported in the state’s annual EPSDT report. One state (WV) was excluded based on these criteria, leaving 50 states (including DC) in the main analysis.
For reporting by race/ethnicity, we excluded states with “High Concern/Unusable” DQ Atlas assessments in 2019 or 2020. Among states in the main analysis, 21 states were excluded (AL, AZ, AR, CO, CT, DC, HI, IA, KS, LA, MD, MA, MO, MT, NY, OR, RI, SC, TN, UT, and WY). This left 29 states for reporting by race/ethnicity (Figure 2).
For reporting by geographic area, we excluded states with “High Concern/Unusable” DQ Atlas assessments for zip code in 2019 or 2020. Among states in the main analysis, two states were excluded (RI and VT). This left 48 states (including DC) for reporting by geographic region.
Limitations:
- The most recently available data at the time of this analysis was 2020, so it was not possible to report the extent to which well-child visit rates rebounded to pre-pandemic levels.
- At the start of the pandemic, Congress enacted the Families First Coronavirus Response Act (FFCRA), which included a requirement that Medicaid programs keep people continuously enrolled in exchange for enhanced federal funding. The continuous enrollment provision increased Medicaid enrollment (increasing the number of children with 12 months of enrollment), which could have had implications for service utilization rates in 2020.
- As mentioned in Box 2, survey data finds a higher share of children receiving preventive care, which may be due in part to:
- The claims data only capturing well-child visits that were billed to Medicaid (some settings such as community clinics, schools, or Indian Health Service facilities may not always bill Medicaid).
- Research has shown that the accuracy of self-reported utilization in survey data declines over long recall periods and/or for more routine services.