News Release

State Medicaid Officials Anticipate the COVID-19 Public Health Emergency Will End During State FY 2023, Leading to Medicaid Enrollment Declines, Slower Total Medicaid Spending Growth and a Sharp Rise in States’ Share of Costs

The Pandemic Has Shaped States’ Medicaid Policy Priorities to Include Focuses on Reducing Disparities, Preserving Telehealth, and Boosting Access to Behavioral Health Services, Annual Survey Finds

Published: Oct 25, 2022

After steep gains since 2020, state Medicaid agencies expect Medicaid enrollment to begin to decline in FY 2023, following the expiration of the COVID-19 public health emergency (PHE), which most states assumed would occur during FY 2023, according to KFF’s new state Medicaid budget survey.

Projections of declining enrollment tied to the end of the federal continuous enrollment requirement are also expected to translate into slower total Medicaid spending growth in FY 2023. At the same time, the loss of temporary pandemic-era enhanced federal matching funding is expected to result in a rebalancing of the mix of federal and state spending, increasing state spending even though total Medicaid spending growth is expected to slow. Medicaid officials reported that uncertainty related to the end of the PHE makes it difficult for states to plan for unwinding of the PHE and to develop state budgets.

The 22nd annual survey of state Medicaid directors finds that states expect growth in Medicaid enrollment to slow to 8.4 percent in FY 2022 (down from 11.2 percent the previous year) before declining by 0.4 percent in FY 2023.

Enrollment declines are likely to accelerate over time, as many states anticipated the public health emergency and continuous coverage requirement to run until the end of this calendar year, midway through fiscal year 2023 for most states. The Biden Administration recently announced that the PHE will go until mid-January, and has promised to give states 60 days notice before ending the emergency declaration.

The survey also finds that total Medicaid spending growth – federal and state spending combined – is expected to peak at 12.5 percent in FY 2022, before slowing to 4.2 percent in FY 2023. State Medicaid officials reported that the state (nonfederal) share of Medicaid spending grew by 9.9 percent in FY 2022. They projected sharper state spending growth of 16.3 percent in FY 2023 with the federal government expected to end its temporary enhanced funding.

In addition to enrollment growth, other drivers of increased Medicaid spending reported by state Medicaid agencies included inflationary pressures, increased service utilization, and increased home and community-based services (HCBS) spending.

The survey, conducted by analysts at KFF and Health Management Associates, provides an annual look at Medicaid enrollment and spending trends, currently for state fiscal years 2022 and 2023. Forty-nine states responded to the survey, although response rates for specific questions varied. A companion survey report offers an in-depth, state-specific examination of policies in place in state Medicaid programs, as well important changes and initiatives taking place around the country.

While states continue to respond to pandemic-related health issues such as increasing vaccination and booster rates and treating long-COVID, states also reported actions to focus on longstanding issues and new priorities including improving equity and reducing health disparities, maintaining access to telehealth, improving behavioral health access and supports, and addressing workforce challenges.

Some notable findings from the report include:

  • Health Equity. Advancing health equity is an important longstanding priority that has been elevated during the pandemic. Two-thirds of states reported using at least one strategy to improve race, ethnicity, and language (REL) data completeness. About one quarter of states reported use of financial incentives linked to health equity, mostly in Medicaid managed care arrangements.
  • Benefits: States reported far more benefit expansions than benefit cuts in both FY 2022 and FY 2023. States are particularly focused on service expansions across the behavioral health care continuum as well as expansions of pregnancy and postpartum services. Other areas of benefit expansion include preventive services, dental services, and services to address enrollees’ social needs (such as food and housing needs).
  • Telehealth. States noted that expanded telehealth policies increased access to care during the COVID-19 pandemic and resulted in high telehealth utilization across populations. Most states have implemented or are planning initiatives to assess telehealth quality and to address other telehealth challenges (including access to technology and broadband, program integrity, outreach and education, and equity). Most states have or plan to adopt permanent Medicaid telehealth policy expansions that will remain in place even after the pandemic, though some are considering adding limitations or guardrails.
  • Managed Care. More than three quarters of states that contract with managed care organizations (MCOs) reported that 75 percent or more of their Medicaid beneficiaries were enrolled in MCOs as of July 1, 2022. In FY 2022, North Carolina implemented its first MCO program. Missouri enrolled all ACA expansion adults in Medicaid MCOs when it implemented the ACA Medicaid expansion in October 2021.
  • Provider Rates. Provider rate increases outnumbered rate restrictions for fee-for-service in FY 2022 and FY 2023. Increases were more common for nursing facilities and home and community-based services (HCBS) providers than for other provider categories. While most states rely on capitated arrangements with managed care organizations to deliver Medicaid services, fee-for-service rates remain important payment benchmarks for managed care payments. Many states noted that worsening inflation and workforce shortages driving higher labor costs were resulting in pressure for rate increases. Some states noted that adopted FY 2023 budgets do not account for current inflation levels, though inflation remains a concern.
  • Looking Ahead. States are preparing for challenges tied to the unwinding of the continuous enrollment requirements and the expiration of other emergency authorities in place during the PHE. In addition, states were facing fiscal uncertainty due to slower revenue growth projections, rising inflation, and workforce shortages as well as potential shifts in political landscapes, as 36 states await the results of gubernatorial elections in November 2022, with outcomes that could have implications for state Medicaid policies and for Medicaid enrollees.

The survey is to be discussed today at Noon ET during a web briefing held by KFF with the National Association of Medicaid Directors. The two new reports released today in advance of the briefing are:

Medicaid Enrollment & Spending Growth: FY 2022 & 2023

How the Pandemic Continues to Shape Medicaid Priorities: Results from an Annual Medicaid Budget Survey for State Fiscal Years 2022 and 2023

For more data and analyses about Medicaid, visit kff.org.

Medicaid Enrollment & Spending Growth: FY 2022 & 2023

Published: Oct 25, 2022

Key Takeaways

Since March 2020, the COVID-19 pandemic and its economic impact have had significant implications for Medicaid spending and enrollment. To provide broad fiscal relief to states while preventing coverage losses during the pandemic, Congress passed the Families First Coronavirus Response Act (FFCRA) early in the pandemic to provide a 6.2 percentage point increase in the federal Medicaid match rate (“FMAP”) for states that meet certain “maintenance of eligibility” (MOE) requirements, including a continuous enrollment requirement. These provisions have driven Medicaid enrollment to record highs and contributed to declines in the uninsured rate. Medicaid spending has also increased, though KFF estimates show the fiscal relief from the enhanced FMAP met or exceeded the state costs of the additional enrollment through federal fiscal year (FFY) 2022 in every state.

This brief analyzes Medicaid enrollment and spending trends for state fiscal year (FY) 2022 and FY 2023 (which for most states began on July 1)1 , based on data provided by state Medicaid directors as part of the 22nd annual survey of Medicaid directors in states and the District of Columbia. Forty-nine states2  responded to the 2022 survey, although response rates for specific questions varied.

When the public health emergency (PHE) expires, the enhanced FMAP will continue through the end of the quarter and states must meet MOE requirements through the end of the month. Most responding state Medicaid agencies had assumed that the fiscal relief and continuous enrollment requirement would end by December 31, 2022 (including one-third of states that anticipated the continuous enrollment requirement would end October 31, 2022). The PHE, however, was recently extended to mid-January 2023, somewhat delaying the anticipated effects described in this brief. The methodology used to calculate enrollment and spending growth and additional information about Medicaid financing can be found at the end of the brief. Key survey findings include the following:

Enrollment growth: Following a sharp increase the previous year, responding state Medicaid agencies reported that Medicaid enrollment growth slowed in FY 2022 (to 8.4%) and is projected to decline (-0.4%) in FY 2023, based largely on the assumption that the PHE and the related MOE requirements would end by mid-FY 2023. Even larger enrollment declines are expected in the future as Medicaid renewals resume over a period of time.

Spending growth: State Medicaid agencies expect total Medicaid spending (including both federal and state funds) to reach a peak growth rate of 12.5% in FY 2022 and slow to 4.2% in FY 2023. States identified enrollment growth as the primary driver of FY 2022 expenditure growth and assume slower enrollment growth will result in a lower total spending growth rate in FY 2023. States reported that the state (nonfederal) share of Medicaid spending grew by 9.9% in FY 2022 but projected a sharper growth rate of 16.3% in FY 2023 based on the assumption that the fiscal relief would expire by mid–FY 2023, shifting the state and federal spending shares even though total Medicaid spending growth is expected to slow.

While state economic conditions have improved and COVID-19 vaccines and boosters are broadly available, uncertainty remains about booster take-up and the trajectory of the pandemic. State officials responsible for the unwinding of the continuous enrollment requirement and for overall state budgeting also face planning and operational challenges due to the uncertainty of the PHE duration. At the time of this brief, the PHE is due to expire in mid-January 2023 but could be extended further. In keeping with the Biden administration’s pledge to provide states with 60 days-notice before the expiration of the PHE, if there is no notice by mid-November the PHE could be extended beyond January. If the PHE is extended, state spending increases and enrollment decreases that states anticipated for FY 2023 could occur later. Also, the longer the PHE lasts, states will continue to receive enhanced federal fiscal relief through the increased Medicaid match rate if they comply with the continuous enrollment requirements.

Context

Following declines from 2017 through 2019, total Medicaid and CHIP enrollment nationwide began to grow following the onset of the COVID-19 pandemic. Between February 2020 and June 2022, enrollment grew to 89.4 million, an increase of 18.2 million or 25.6%. Many factors have likely contributed to Medicaid enrollment growth during the pandemic, including the MOE continuous enrollment requirement, which kept people enrolled in the program irrespective of changes in income and halted churn, as well as other economic factors. Total Medicaid spending exceeded $728 billion in FY 2021, with 31% financed by states and 69% paid by the federal government – a somewhat higher federal share than in recent years due to the FFCRA enhanced FMAP that became available as of January 2020. Overall, Medicaid accounts for nearly one in six dollars spent in the health care system and over half of spending on long-term services and supports.

State economic conditions worsened rapidly when the pandemic hit in March 2020 but recovered quickly compared to past recessions. Following the onset of the pandemic, the unemployment rate soared to a peak of 14.7% in April 2020 as unemployment claims spiked. National economic indicators steadily improved in the ensuing months, and by July 2022 the 22 million jobs lost during the pandemic had been recovered and the national unemployment rate had fallen to its pre-pandemic rate of 3.5%. State revenues followed a similar pattern, with revenues generally declining early in the pandemic but rebounding quickly and then exceeding pre-pandemic revenue levels. The quick rebound was due, in part, to unprecedented amounts of federal aid, increased tax collections on purchased goods, and a strong stock market. Despite strong revenues overall, the speed of recovery has varied by state depending on state characteristics such as tax structure and industry reliance, and some states’ cumulative tax revenues remain below pre-COVID growth projections.

Improving state economic conditions as well as federal fiscal relief mitigated the need for the widespread state spending cuts that occurred in prior recessions. Due to stronger than expected state revenue gains, many states experienced surpluses in FY 2021 and FY 2022, and states took the opportunity to build reserves and pay down debts, enact tax cuts, and make additional investments, such as training programs or salary increases to address workforce challenges. State general fund spending grew by an estimated 13.6% in FY 2022, the largest annual growth rate since 1981, and 49 states found general fund revenues exceeded original projections. Further, state rainy-day funds reached record highs, increasing by 62% in FY 2021 with further increases projected for FY 2022.

State revenue growth is expected to slow in FY 2023 and states’ longer-term fiscal outlooks remain uncertain. Recent economic turmoil, including rising inflation, the Russian invasion of Ukraine, supply chain issues, and declining labor force participation rates, along with tapering federal fiscal relief, makes the state budget projection process challenging. Further, the real gross domestic product (GDP) declined in the first two quarters of 2022 which some indicate could signal a looming recession. State revenues, however, remain strong and are projected to continue to grow in FY 2023 but at a slower rate than in recent years. According to governors’ proposed budgets for FY 2023, states expect general fund spending to increase by 4.2% in FY 2023 (compared to 13.6% for FY 2022).

Key Findings

After peaking in FY 2021, Medicaid enrollment growth slowed in FY 2022 and is expected to decline in FY 2023, reflecting state Medicaid agencies’ assumptions about the end of the MOE continuous enrollment requirement (Figure 1). After peaking in FY 2015 due to the implementation of the ACA, Medicaid enrollment growth tapered thereafter and actually declined in FY 2018 and FY 2019. Enrollment remained relatively flat in FY 2020, likely due to improving economic conditions and restrictions permitted under the Trump Administration. Enrollment then rose sharply, however, in FY 2021 (11.2%) and continued to grow, though more slowly, in FY 2022 (8.4%). In FY 2023, enrollment is projected to decline slightly (-0.4%) due to assumptions related to the duration of the PHE and related MOE requirements. States must meet MOE requirements through the end of the month in which the PHE ends, and most responding states assumed the MOE would end by mid-FY 2023 when producing the projections reported here, including almost one-third that anticipated an October 31, 2022, end date and nearly another third that anticipated a December 31, 2022, end date. These assumptions reflect enrollment growth projections over the entire fiscal year so could account for enrollment growth for the first part of the year and then gradual enrollment declines for the second part of the year once the MOE ends. The net effect yields national projections of relatively flat enrollment growth for FY 2023, though there was considerable variation across states. Following the end of the MOE, states will have 12 months to initiate redeterminations for all current enrollees. As redeterminations resume over time, individuals may lose Medicaid coverage if they are no longer eligible or are unable to navigate administrative barriers despite remaining eligible.

State Medicaid agencies largely attributed enrollment changes to the FFCRA’s MOE requirements. Almost all responding states reported that the MOE continuous enrollment requirement was the most significant factor driving FY 2022 enrollment growth. About one half of responding states reported that the MOE would continue to put upward pressure on enrollment growth for FY 2023, though many assumed that this upward pressure would end part way through the year. At the same time, over three-quarters of states identified the unwinding of the PHE and MOE requirements as the most significant downward pressure in FY 2023. Some states also cited improving economic conditions as a downward pressure on enrollment in FY 2022, and other states reported state population growth and expanded eligibility as upward pressures across both years. The vast majority of states reported implementing or planning to implement eligibility policy changes in either FY 2022 or FY 2023 (or both), with postpartum coverage extensions the most commonly reported eligibility policy change.

Percent Change in Medicaid Spending and Enrollment,1998-2023

Following the onset of the pandemic, the total Medicaid spending growth rate increased and is expected to peak at 12.5% in FY 2022 and slow to 4.2% in FY 2023 (Figure 1). High enrollment growth rates, tied first to the Great Recession and later to ACA implementation, were the primary drivers of total Medicaid spending growth over the last decade. Following ACA implementation but prior to the pandemic, declining or slowing enrollment growth resulted in more moderate spending growth. Spending growth increased sharply when the pandemic began in FY 2020 and continued to increase in FY 2021.

State Medicaid agencies reported enrollment changes as the most significant factor driving changes in total Medicaid spending. The rate of total spending growth continued to increase in FY 2022, with almost all states reporting enrollment growth as the most significant upward pressure. For FY 2023, the total spending growth rate is projected to slow, and the majority of states point to declines in enrollment at the end of the MOE as the main driver. However, about half of states cited enrollment as an upward pressure at least for part of the year, with some noting they expect enrollment levels to remain high as they take the maximum allotted time to process renewals following the end of the PHE.

Reporting state Medicaid agencies identified a number of factors beyond enrollment that were driving total spending growth. For FY 2022, almost one-third of states noted managed care and/or provider rate increases were putting upward pressure on spending. A few states reported increased utilization driven by a return to pre-pandemic levels or by pent up demand from pandemic-related delays in care were also contributing to spending growth, though a few states reported decreased utilization (thought to be still pandemic-related). While a few states reported declines in nursing home spending as a downward pressure for FY 2022, states also reported increases in expenditures for home and community-based services (HCBS) as upward pressures. Last year’s survey found that while most states saw declines in nursing facility utilization, a majority of states noted the decreased utilization was partially or fully offset by increased HCBS utilization. For FY 2023, states reported upward spending pressure coming from provider rate or cost increases, rising inflation, and HCBS spending.

Assumptions about the duration of the PHE and the expiration of the enhanced FMAP affected state Medicaid spending growth assumptions (Figure 2). The state share of Medicaid spending typically grows at a similar rate as total Medicaid spending growth unless there is a change in the FMAP rate. During the Great Recession, state spending for Medicaid declined in FY 2009 and FY 2010 due to fiscal relief from a temporary FMAP increase provided in the American Recovery and Reinvestment Act (ARRA). State spending increased sharply when that fiscal relief ended.

This pattern has repeated during the pandemic-induced economic downturn, with state Medicaid spending declining in FY 2020 and FY 2021, increasing but at a slower rate than total spending in FY 2022, and then projected to increase sharply in FY 2023 (surpassing total Medicaid spending) due to assumptions about the expiration of the FFCRA fiscal relief. The enhanced FMAP was available retroactively to states beginning January 1, 2020 and will continue through the quarter in which the PHE ends. Almost two-thirds of responding states assumed the enhanced FMAP would end December 31, 2022, though nearly one-third assumed an earlier end date.

The spike in state spending growth expected in FY 2023 reflects these assumptions. The recent PHE extension to mid-January 2023, however, extends the enhanced FMAP through at least March 2023, delaying the state spending increase that most states reported in the survey. When asked about how another PHE extension would impact spending and enrollment projections, most states reported they would expect enrollment growth to continue to increase total Medicaid spending projections and that the expected increase in state Medicaid spending would be delayed.

Percent Change in Total and State Medicaid Spending, 2000-2023

The vast majority of state Medicaid agencies at the time of the survey did not anticipate state revenue shortfalls or Medicaid budget cuts. About half of the states, however, did note uncertainty in their state’s longer term fiscal outlook due to economic factors such as rising inflation and costs of medical care, supply chain issues, workforce challenges, and the possibility of another recession. State responses also highlighted the importance of the enhanced FMAP to offset costs related to increased enrollment levels; however, a few states raised concerns that, following the end of the PHE, the enhanced FMAP would expire while enrollment remains elevated as states take the maximum allotted time to process renewals. In last year’s survey, nearly all responding states reported using the federal fiscal relief provided by the FFCRA enhanced FMAP to support costs related to increased Medicaid enrollment and to avert Medicaid budget shortfalls.

Looking Ahead

While state fiscal conditions have vastly improved since the pandemic began, recent economic developments have raised concerns and heightened uncertainty. Almost all states have adopted budgets for FY 2023 (which started July 1 in most states) that generally assumed strong revenue projections. However, states are beginning to contend with new challenges due to rising inflation, workforce shortages, and a slowing economy. How these issues will impact future state budgeting is uncertain. Medicaid plays a significant role in state budgets as both a spending and revenue source and has played a key role in the COVID-19 response and recovery across states. Unlike the federal government, states must meet balanced budget requirements, so dealing with macroeconomic uncertainties make it difficult for states to develop broader revenue and spending projections.

The PHE end date also remains uncertain and will have significant implications for Medicaid enrollment and spending. When the PHE and MOE requirements end, states will begin processing redeterminations and renewals, likely leading to enrollment declines and decreased total Medicaid spending growth. The end of the PHE, however, will also lead to the expiration of the enhanced FMAP. This will require increased state spending to replace the expiring federal funds. States will likely face pressure to contain growth in state spending after the enhanced FMAP ends. At the same time, states may need to overcome systems and staffing challenges to ensure eligible individuals remain enrolled or transition to other coverage sources. While changes in Medicaid enrollment and spending are an inevitable consequence of the end of the PHE and will likely vary by state, initial KFF estimates found millions could lose Medicaid coverage.

Methods

Definition of Medicaid Spending. Total Medicaid spending includes all payments to Medicaid providers for Medicaid-covered services provided to enrolled Medicaid beneficiaries. Medicaid spending also includes special disproportionate share hospital (DSH) payments that subsidize uncompensated hospital care for persons who are uninsured and unreimbursed costs of care for persons on Medicaid. Total Medicaid spending does not include Medicaid administrative costs and federally mandated state “Clawback” payments to help finance the Medicare Part D prescription drug benefit for Medicaid beneficiaries who are also enrolled in Medicare. States are also asked to exclude costs for the Children’s Health Insurance Program (CHIP). Total Medicaid spending includes payments financed from all sources, including state funds, local contributions, and federal matching funds. Historical state Medicaid spending refers to all nonfederal spending, which may include local funds and provider taxes and fees as well as state general fund dollars.

Methodology. KFF commissioned Health Management Associates (HMA) to survey Medicaid directors in all 50 states and DC to identify and track trends in Medicaid spending, enrollment, and policymaking. Given differences in the financing structure of their programs, the U.S. territories were not included in this analysis. This is the 22nd annual survey, conducted at the beginning of each state fiscal year from FY 2002 through FY 2023. The KFF/HMA Medicaid survey for this report was sent to each Medicaid director in June 2022. Forty-nine states provided survey responses by October 2022. The two states that did not respond by this time are Arkansas and Georgia.

For FY 2022 and FY 2023, annual rates of growth for Medicaid spending were calculated as weighted averages across all states. For FY 2022 and FY 2023, 49 states reported Medicaid expenditure growth rates. Weights for spending were derived from the most recent state Medicaid expenditure data for FY 2021, based on estimates prepared for KFF by the Urban Institute using CMS Form 64 reports, adjusted for state fiscal years. These CMS-64 data were also used for historic Medicaid spending and include all 50 states and DC. For FY 2018 and 2019, spending for New York was adjusted to reflect unexplained anomalies in the state spending on the CMS-64 data.

The average annual Medicaid enrollment growth rate for FY 2023 was calculated using weights based on Medicaid and CHIP preliminary monthly enrollment data for June 2022 published by CMS. For FY 2023, 46 states reported Medicaid enrollment growth rates. The data reported for FY 2022 and FY 2023 for Medicaid spending and FY 2023 for Medicaid enrollment are weighted averages, and therefore, data reported for states with larger enrollment and spending have a greater effect on the national average.

Historical enrollment trend data for FY 1998 to FY 2013 reflects the annual percentage change from June to June of monthly enrollment data for Medicaid beneficiaries collected from all states and DC. Enrollment trend data for FY 2014 to FY 2022 reflects growth in average monthly enrollment based on KFF analysis of the Medicaid & CHIP Monthly Applications, Eligibility Determinations, and Enrollment Reports from CMS for all 50 states and DC. Note that several states have revised monthly enrollment data as far back as June 2017 to better align with reporting criteria for the CMS, Medicaid & CHIP Monthly Applications, Eligibility Determinations, and Enrollment Reports. Data for months prior to June 2017 have not been revised and may use slightly different criteria for reporting monthly enrollment and generally result in larger enrollment totals.

Appendix

Medicaid Financing Structure. The federal government jointly funds the Medicaid program with states by matching qualifying state Medicaid expenditures. The federal match rate (known as the Federal Medical Assistance percentage, or “FMAP”) is calculated annually for each state using a statutory formula based on a state’s average personal income relative to the national average which results in higher FMAP rates for poorer states. The FMAP formula relies on three years of lagged personal income data, so data for federal fiscal years (FFYs) 2018 to 2020 was used to calculate FFY 2023 FMAP rates, which range from a floor of 50% (applicable to 12 states) to a high of 78% (for Mississippi). Because of the federal matching structure, Medicaid is both a state budget expenditure item and a source of federal revenue for states. In FY 2020 (the latest year of actual data), Medicaid accounted for 28.3% of total state spending, but 15.6% of state funds (general fund plus other state funds), a far second to spending on K-12 education (25.2% of state funds). Medicaid is the largest single source of federal funds for states, accounting for over half (53.2%) of all federal funds received by states (Figure 3).

Medicaid Spending as a Share of Total, State, and Federal Funds, FY 2020

Medicaid and the Economy. Medicaid is a countercyclical program. During economic downturns, more people qualify and enroll in Medicaid, increasing program spending at the same time that state tax revenues may be stagnating or falling. Prior to the current pandemic, to mitigate these budget pressures, Congress had twice passed temporary FMAP increases to help support states during economic downturns, most recently in 2009 as part of the American Recovery and Reinvestment Act (ARRA). However, the COVID-19 recession has differed from the Great Recession in a number of ways, including the overall scale of the federal fiscal relief, the passage of the ACA, and a continuous enrollment requirement tied to the FMAP increase.

Medicaid and the ACA. Effective January 1, 2014, the ACA expanded Medicaid eligibility to millions of non-elderly adults with income at or below 138% of the federal poverty level (FPL) –$18,754 per year for an individual in 2022. The law also provided 100% federal funding for expansion adults through 2016, phasing down to 90% in 2020 and future years. The June 2012 Supreme Court ruling on the ACA effectively made the Medicaid expansion optional for states; as of October 2022, 39 states (including DC) had adopted the expansion, including Missouri and Oklahoma, which adopted the expansion through ballot measures and implemented in state fiscal year 2022.

  1. State fiscal years begin on July 1 except for these states: New York on April 1; Texas on September 1; Alabama, Michigan, and District of Columbia on October 1. ↩︎
  2. The two states that did not respond to the 2022 survey are Arkansas and Georgia. ↩︎

How the Pandemic Continues to Shape Medicaid Priorities: Results from an Annual Medicaid Budget Survey for State Fiscal Years 2022 and 2023

Authors: Elizabeth Hinton, Madeline Guth, Jada Raphael, Sweta Haldar, Robin Rudowitz, Kathleen Gifford, Aimee Lashbrook, Mike Nardone, and Matt Wimmer
Published: Oct 25, 2022

Overview

This annual Medicaid budget survey report highlights certain policies in place in state Medicaid programs in state fiscal year (FY) 2022 and policy changes implemented or planned for FY 2023. The findings are drawn from the 22nd annual budget survey of Medicaid officials conducted by the Kaiser Family Foundation (KFF) and Health Management Associates (HMA), in collaboration with the National Association of Medicaid Directors (NAMD).

Medicaid budget survey reports from prior years are available in our archives.

NEWS RELEASE

  • A news release announcing the publication of the 2022 Medicaid Budget Survey is available.

EXECUTIVE SUMMARY

  • The Executive Summary provides an overview of the 2022 survey results and is available under the Executive Summary.

FULL REPORT

  • The complete 2022 Medicaid Budget Survey Report is available under the Report. The Report contains 8 separate sections. Users can view each section separately or download a full Report PDF from the right side of the page.

SPENDING & ENROLLMENT BRIEF

  • This companion issue brief provides an overview of Medicaid spending and enrollment growth with a focus on FY 2022 and FY 2023.

WEB BRIEFING

  • A recording of an October 25 web briefing highlighting key findings from the 2022 report will be available.

ADDITIONAL BRIEFS

BEHAVIORAL HEALTH SUPPLEMENTAL SURVEY

    Executive Summary

    The COVID-19 pandemic has profoundly affected Medicaid program spending, enrollment, and policy, challenging state Medicaid agencies, providers, and enrollees in a variety of ways. Serving nearly 90 million low-income Americans and accounting for one-sixth of health care spending (and half of long-term care spending) and a large share of state budgets, Medicaid is a key part of the overall health care system and has had a significant role in COVID-19 response efforts. While the end date of the federal public health emergency (PHE) is currently unknown, state Medicaid programs are preparing for the unwinding of policies in place during the PHE. The PHE is currently set to end in mid-January, and the Biden Administration has indicated it will provide states with 60-day notice before it ends (i.e., in mid-November if the PHE is not extended again). The duration of the PHE will affect a range of emergency policy options in place as well as a 6.2 percentage point increase in the federal match rate (“FMAP”)1  available if states meet certain “maintenance of eligibility” requirements included in the Families First Coronavirus Response Act (FFCRA).

    This report highlights certain policies in place in state Medicaid programs in state fiscal year (FY) 2022 and policy changes implemented or planned for FY 2023, which began on July 1, 2022 for most states.2  The findings are drawn from the 22nd annual budget survey of Medicaid officials in all 50 states and the District of Columbia conducted by the Kaiser Family Foundation (KFF) and Health Management Associates (HMA), in collaboration with the National Association of Medicaid Directors (NAMD). Overall, 49 states responded to this year’s survey, although response rates for specific questions varied.3  States completed this survey in mid-summer of 2022, as COVID-19 deaths started to rise after a low in April 2022, due to the highly transmissible Omicron variant, waning vaccine immunity, and relatively low booster uptake.

    Key Take-Aways

    • States are focusing on both longstanding issues and new priorities, including new and expanded initiatives to improve equity and reduce health disparities, maintain access to telehealth, improve behavioral health access and supports, and address workforce challenges. States also continue to respond to pandemic-related health concerns such as increasing vaccination and booster rates and the utilization of preventive care services.
    • States continue to manage and advance complex delivery system and information system procurements to drive improved quality and health outcomes.
    • At the same time, states are also preparing for the unwinding of the federal public health emergency and the return to normal operations.

    Heading into FY 2023, most states were in a strong fiscal position, but many identified uncertainty in their longer term fiscal outlook due to economic factors including slowing revenue growth, rising inflation, and wage pressures driven by workforce shortages. Also, the outcomes of gubernatorial elections in nearly three-quarters of states (36 states) in November 2022 could have implications for state Medicaid policies and for Medicaid enrollees.

    Key Findings From KFF’s 2022 Medicaid Budget Survey

    Summary of Findings

    Key findings across the six sections of this report include:

    • Delivery Systems. Capitated managed care remains the predominant delivery system for Medicaid in most states. More than three-quarters of states that contract with MCOs reported that 75% or more of their Medicaid beneficiaries were enrolled in MCOs as of July 1, 2022. In FY 2022, North Carolina implemented its first MCO program. Missouri implemented the ACA Medicaid expansion in October 2021, enrolling all expansion adults in Medicaid MCOs. Although not counted in this year’s report, Oklahoma expects to implement capitated, comprehensive Medicaid managed care in FY 2024. In addition to expanding the use of risk-based, comprehensive managed care, state Medicaid programs have expanded their use of other service delivery and payment system reforms (e.g., patient centered medical homes (PCMHs), accountable care organizations (ACOs), etc.) in recent years.
    • Health Equity. The COVID-19 pandemic has highlighted and exacerbated longstanding racial and ethnic disparities in health and health care. Over the past few years, the federal government and many states have identified advancing health equity as an important priority for the Medicaid program. High-quality, comprehensive data are essential for identifying and addressing health disparities and measuring progress over time. However, inadequate, incomplete, and inconsistent demographic data, particularly race and ethnicity data, is a longstanding challenge across many areas of health care, including in state Medicaid and CHIP programs (as these data must remain optional for enrollees to report). Two-thirds of states reported using at least one strategy to improve race, ethnicity, and language (REL) data completeness. States also reported MCO financial quality incentives (e.g., performance bonuses, withholds, or value-based state directed payments) tied to health equity-related performance goals and other MCO contract requirements to advance health equity, such as requiring MCOs to achieve the NCQA Distinction in Multicultural Health Care.
    • Benefits. The number of states reporting new benefits and benefit enhancements greatly outpaced the number of states reporting benefit cuts and limitations in FY 2022 and FY 2023. In particular, states are focused on service expansions across the behavioral health care continuum, including programming for youth, physical and behavioral health care integration, and crisis services. States are also focused on expansions of pregnancy and postpartum services, often alongside eligibility changes to extend the postpartum period to 12 months (as allowed under the American Rescue Plan Act). Other areas of benefit expansion include preventive services; dental services (including the addition of comprehensive adult dental services); and services to address social determinants of health (SDOH), such as housing-related supports. Also, most states that contract with MCOs reported allowing MCOs to use “in lieu of” authority to cover certain services, especially behavioral health services such as coverage for nonelderly adults in “institutions for mental disease” (IMDs). Additionally, nearly one-third of states permitting ILOS reported that allowable ILOS include services to address SDOH, such as food and housing needs.
    • Telehealth. Many states noted that expanded use of telehealth was a positive outcome of the COVID-19 pandemic that increased access to care. In particular, nearly all responding states added or expanded audio-only telehealth coverage in response to the pandemic. States have seen high utilization of telehealth across populations of Medicaid enrollees (e.g., ACA expansion adults, children, and individuals with disabilities), especially for behavioral health care. Most states have implemented or are planning initiatives to assess telehealth quality, though many states report ongoing considerations and uncertainty over how to effectively evaluate quality. States also report actions to address other telehealth challenges, including access to technology and broadband, program integrity, outreach and education, and equity. Most states have or plan to adopt permanent Medicaid telehealth expansions that will remain in place even after the pandemic, though some are considering guardrails on such policies. Looking ahead, key issues that may influence future Medicaid telehealth policy decisions include analysis of data, state legislation and federal guidance, and cost concerns.
    • Provider Rates and Taxes. Reported fee-for-service (FFS) rate increases outnumbered rate restrictions in FY 2022 and FY 2023. States reported rate increases for nursing facilities and home and community-based services (HCBS) providers more often than other provider categories. Several states reported comprehensive rate reform analyses impacting multiple provider types had been completed or were underway. Many states noted that worsening inflation and workforce shortages driving higher labor costs were resulting in growing calls from providers and others for rate increases. Some states noted, however, that their FY 2023 budgets do not account for current inflation levels, as they were introduced in late calendar year 2021 and early 2022 before inflation began to dramatically accelerate, but that inflation remains a concern looking ahead. Provider taxes continue to be an important source of Medicaid financing, with very few states making significant changes to their provider tax structure. Taxes on ambulance providers represent the most common type of “other” taxes implemented by states, and the new taxes planned for FY 2023 will increase the number of states with ambulance taxes to 13.
    • Pharmacy. The administration of the Medicaid pharmacy benefit has evolved over time to include delivery of these benefits through MCOs and increased reliance on pharmacy benefit managers (PBMs). While most states that contract with MCOs carve in Medicaid pharmacy benefits to MCO contracts, some states “carve out” prescription drug coverage from managed care. As of January 1, 2022, California carved the pharmacy benefit out of managed care, becoming the latest state to implement a full pharmacy carve out. Two states (New York and Ohio) report plans to carve out pharmacy from MCO contracts in state fiscal year FY 2023 or later. Other states are moving to require MCOs to contract with a single PBM designated by the state. Many states are implementing or expanding initiatives to contain prescription drug costs. Seven states reported value-based arrangements (VBAs) in place with one or more drug manufacturers as of July 1, 2022, and 16 additional states are considering opportunities or are developing and executing plans to implement a VBA arrangement in FY 2023 or later. Many states reported reforms aimed at spread pricing and the role of PBMs in administering Medicaid pharmacy benefits.

    Looking Ahead

    As states anticipate a new “endemic reality” phase of the pandemic, they are considering future operations within the context of the significant pandemic-related impacts on enrollees’ health and wellbeing and on the health care workforce. Many states note that the pandemic has resulted in both opportunities and challenges and has shaped ongoing Medicaid priorities.

    • Opportunities. The pandemic presented states with opportunities to expand access for enrollees via telehealth, improve relationships with stakeholders, and focus on data collection improvements. One state commented that telehealth was the “silver lining” of the pandemic. States also noted that the pandemic had resulted in improved relationships and engagement with enrollees, providers, plans, and/or other state and federal agencies. States mentioned that the pandemic had highlighted the importance of obtaining better and more timely data, and that improved data collection and stratification would help to identify and address health disparities.
    • Challenges. States are facing challenges related to planning and preparing for the COVID-19 PHE unwinding and associated with entering an “endemic reality” phase of the pandemic. Many states mentioned the immense administrative challenges of restarting redeterminations, particularly workforce needs, as well as the challenge of making permanent or unwinding other emergency authorities in place. Even after the end of the PHE, states will still face pandemic-generated concerns such as the need to increase utilization of preventive care services in addition to vaccinations and boosters.
    • Priorities. Looking ahead, states are focused on addressing health inequities that the pandemic had exposed and often exacerbated. States are also prioritizing access and outcomes for specific populations or service categories, including behavioral health, long-term services and supports, and maternal and child health. States are also addressing health care workforce challenges, especially related to behavioral health and HCBS providers. Many states also continue to focus on payment and delivery system initiatives and operations, including value-based purchasing and MCO procurements. Many states are prioritizing IT systems projects, which also support other program objectives. Finally, many states reported a focus on addressing social determinants of health to improve health outcomes.

      AcknowledgementsPulling together this report is a substantial effort, and the final product represents contributions from many people. The combined analytic team from KFF and Health Management Associates (HMA) would like to thank the state Medicaid directors and staff who participated in this effort. In a time of limited resources and challenging workloads, we truly appreciate the time and effort provided by these dedicated public servants to complete the survey and respond to our follow-up questions. Their work made this report possible. We also thank the leadership and staff at the National Association of Medicaid Directors (NAMD) for their collaboration on this survey. We offer special thanks to Jim McEvoy and Kraig Gazley at HMA who developed and managed the survey database and whose work is invaluable to us.

    Introduction

    The COVID-19 pandemic public health emergency (PHE), in place for more than two and a half years at the time of this report, has had profound impacts on the ongoing operations of state Medicaid programs, requiring states to rapidly adapt to meet the changing needs of Medicaid enrollees and providers. Nationwide, Medicaid provided health insurance coverage to about one in four Americans in 2020 and accounted for nearly one-sixth of all U.S. health care expenditures in 2020.4  Total Medicaid/CHIP enrollment grew to 89.4 million in June 2022, an increase of 18.2 million (25.6%) from February 2020, right before the pandemic, when enrollment began to steadily increase. Beginning early in the pandemic, states and the federal government implemented numerous Medicaid emergency authorities to enhance state capacity to respond to the emerging public health and economic crises. In addition, Congress authorized changes to Medicaid through the Families First Coronavirus Response Act (FFCRA) and Coronavirus Aid, Relief, and Economic Security (CARES) Act, including a 6.2 percentage point increase in federal Medicaid matching funds (FMAP) (retroactive to January 1, 2020). This “enhanced FMAP” is available to states that meet “maintenance of eligibility” (MOE) conditions which ensure continued coverage for current enrollees as well as coverage of coronavirus testing and treatment. All of these changes (the emergency policy actions, the fiscal relief, and the MOE) are tied to the duration of the PHE. The PHE is currently set to end in mid-January, and the Biden Administration has indicated it will provide states with 60-day notice before it ends (i.e., in mid-November if the PHE is not extended again).

    When the PHE ends, states will begin processing redeterminations and millions of people could lose coverage if they are no longer eligible or face administrative barriers despite remaining eligible.5  Current CMS guidance indicates states must initiate all renewals and other outstanding eligibility actions within 12 months after the PHE ends. Medicaid emergency authorities related to the PHE expire at different times, but states can choose to continue some of these changes even after the PHE ends. Some unwinding of PHE emergency authorities is already completed or underway. The temporary 6.2 percentage point increase in federal matching funds will expire at the end of the quarter in which the PHE ends.

    This report draws upon findings from the 22nd annual budget survey of Medicaid officials in all 50 states and the District of Columbia conducted by KFF and Health Management Associates (HMA), in collaboration with the National Association of Medicaid Directors (NAMD). (Previous reports are archived here.) This year’s KFF/HMA Medicaid budget survey was conducted from June through September 2022 via a survey sent to each state Medicaid director in June 2022 and then a follow-up telephone interview. Overall, 49 states responded by September 2022,6  although response rates for specific questions varied. The District of Columbia is counted as a state for the purposes of this report. Given differences in the financing structure of their programs, the U.S. territories were not included in this analysis. The survey instrument is included as an appendix to this report.

    This report examines Medicaid policies in place or implemented in FY 2022, policy changes implemented at the beginning of FY 2023, and policy changes for which a definite decision has been made to implement in FY 2023 (which began for most states on July 1).7  Policies adopted for the upcoming year are occasionally delayed or not implemented for reasons related to legal, fiscal, administrative, systems, or political considerations, or due to CMS approval delays. Key findings, along with state-by-state tables, are included in the following sections:

    Delivery Systems

    Context

    For more than two decades, states have increased their reliance on managed care delivery systems to improve access and outcomes, enhance care management and care coordination, and better control costs. State managed care contracts vary widely, for example, in the populations required to enroll, the services covered (or “carved in”), and the quality and performance incentives and penalties employed. Most states contract with risk-based managed care organizations (MCOs) that cover a comprehensive set of benefits (acute care services and sometimes long-term services and supports), but many also contract with limited benefit prepaid health plans (PHPs) that offer a narrow set of services such as dental care, non-emergency medical transportation, or behavioral health services. Managed care plans are at financial risk for the services covered under their contracts and receive a per member per month "capitation" payment for these services. A minority of states operate primary care case management (PCCM) programs which retain fee-for-service (FFS) reimbursements to providers but enroll beneficiaries with a primary care provider who is paid a small monthly fee to provide case management services in addition to primary care.

    Enrollment in Medicaid MCOs has grown since the start of the pandemic, tracking with overall growth in Medicaid enrollment. After the PHE ends, state Medicaid agencies will need to complete a large number of eligibility and enrollment tasks and actions, including processing renewals, redeterminations, and post-enrollment verifications. Medicaid MCOs may be well positioned to assist states in conducting outreach and providing support to enrollees who will need to navigate eligibility renewals or redeterminations. CMS guidance for state Medicaid agencies on the resumption of normal operations also includes strategies for working with managed care plans to promote continuity of coverage when the PHE’s continuous coverage requirement ends.

    In addition to managed care, state Medicaid programs also use an array of other service delivery and payment system reforms. There is interest among public and private payers alike in restructuring delivery systems to be more integrated and patient-centered and to help achieve better outcomes and lower costs. Common delivery and payment reform models used by state Medicaid programs include patient-centered medical homes (PCMHs), ACA Health Homes, accountable care organizations (ACOs), and episodes of care. Some models may be implemented in Medicaid fee-for-service delivery systems while other payment and delivery system reform models are implemented through managed care. Although the literature is not conclusive regarding the impact of these initiatives and more research is needed, states have seen successes and many models have evolved over time in response to state experience and evaluation findings.8 ,9 ,10 ,11 ,12 

    Uncertainty and disruptions caused by the COVID-19 pandemic, including lack of stability in utilization patterns, labor shortages, provider capacity, and the appropriateness of pre-pandemic performance measures, among other factors, have affected (and may continue to affect) how states can advance delivery system and payment reform initiatives as well as efforts to monitor and incentivize MCO and provider performance. Additionally, when the continuous enrollment requirement ends and states resume renewals and redeterminations, millions of people could lose coverage if they are no longer eligible or are unable to navigate administrative barriers despite remaining eligible. As a result, Medicaid MCOs may see the overall acuity of their membership increase, with implications for per member utilization and costs, and also the return of member churn (i.e., the temporary loss of coverage in which enrollees disenroll and then re-enroll within a short period of time) which can lead to care disruptions.

    This section provides information about:

    • Managed care models
    • Populations covered by risk-based managed care
    • Managed care changes
    • Other state-contracted delivery systems or initiatives

    Findings

    Managed Care Models

    Capitated managed care remains the predominant delivery system for Medicaid in most states. As of July 2022, all states except five – Alaska, Connecticut,13  Maine, Vermont,14  and Wyoming – had some form of managed care (MCOs and/or PCCM) in place. As of July 2022, 41 states15  were contracting with MCOs (unchanged from 2021), and only two of these states (Colorado and Nevada) did not offer MCOs statewide. Twelve states16  reported operating a PCCM program, one fewer than reported in 2021 (as Maine ended its PCCM program in FY 2022).17  Although not counted in this year’s report, following the passage of SB 1337 in May 2022, Oklahoma expects to implement capitated, comprehensive Medicaid managed care in FY 2024 (as of October 1, 2023),18 ,19  and release an RFP to procure MCO vendors in the fall of 2022.

    Of the 46 states that operate some form of comprehensive managed care (MCOs and/or PCCM), 34 states operate MCOs only, five states operate PCCM programs only,20  and seven states operate both MCOs and a PCCM program (Figure 2 and Table 1). In total, 27 states21  were contracting with one or more PHPs to provide Medicaid benefits including behavioral health care, dental care, vision care, non-emergency medical transportation (NEMT), or long-term services and supports (LTSS).

    Comprehensive Medicaid Managed Care Models in States as of July 1, 2022

    Populations Covered by Risk-Based Managed Care

    The vast majority of states that contract with MCOs (35 of 41) reported that 75% or more of their Medicaid beneficiaries were enrolled in MCOs as of July 1, 2022, a decrease of one state22  compared to the 2021 survey and includes the ten states with the largest total Medicaid enrollment (Figure 3 and Table 1). These ten states account for over half of all Medicaid beneficiaries across the country.23 

    Children and adults, particularly those enrolled through the ACA Medicaid expansion, are much more likely to be enrolled in an MCO than elderly Medicaid beneficiaries or persons with disabilities. Thirty-six of the 41 MCO states reported covering 75% or more of all children through MCOs.24  Of the 39 states that had implemented the ACA Medicaid expansion as of July 1, 2022, 32 were using MCOs to cover newly eligible adults. The large majority of these states (29 states) covered more than 75% of beneficiaries in this group through capitated managed care. Thirty-five of the 41 MCO states reported covering 75% or more of low-income adults in pre-ACA expansion groups (e.g., parents, pregnant women) through MCOs. In contrast, the elderly and people with disabilities were the group least likely to be covered through managed care contracts, with only 16 of the 41 MCO states reporting coverage of 75% or more such enrollees through MCOs (Figure 3).

    MCO Managed Care Penetration Rates for Select Groups of Medicaid Beneficiaries as of July 1, 2022

    Managed Care Changes

    A number of states reported a variety of managed care changes made in FY 2022 or planned for FY 2023. Notable changes included the following:

    • North Carolina implemented its first MCO program. On July 1, 2021, North Carolina launched new MCO “Standard Plans,” offering integrated physical and behavioral health services statewide, with mandatory enrollment for most population groups.25  Over 1.7 million Medicaid beneficiaries were enrolled in Standard Plans as of September 2022.26  North Carolina will launch “Tailored Plans” on December 1, 2022, offering integrated services to enrollees with significant behavioral health needs and intellectual/developmental disabilities (I/DD).27 
    • Five states (California, Missouri, Nevada, New Jersey, and New York) reported expanding mandatory MCO enrollment for targeted populations. Missouri implemented the ACA Medicaid expansion in October 2021 (with coverage retroactive to July 1, 2021) enrolling all expansion adults in Medicaid MCOs. The California Advancing and Innovating Medi-Cal (CalAIM) initiative includes mandatory enrollment of multiple populations into managed care in both FY 2022 and FY 2023.28  In FY 2023, dual eligible beneficiaries across the state will be required to enroll in managed care. Currently, mandatory enrollment of dual eligibles is limited to certain California counties.29 ,30  Effective January 1, 2022, Nevada is no longer allowing enrollees with a seriously mentally ill (SMI) determination to disenroll from managed care. New Jersey expanded managed care for acute care and LTSS to nursing home residents, who were previously grandfathered and allowed to remain in FFS after the state first transitioned to managed long-term services and supports (MLTSS). New York began mandatory MCO enrollment of children and youth in direct placement foster care in New York City and children and youth placed in foster care in the care of Voluntary Foster Care Agencies statewide in July 2021.31 
    • Two states (Missouri and Ohio) reported introducing specialized managed care programs for children with complex needs. Missouri awarded a specialty plan contract to consolidate state care and custody enrollees into one health plan. On July 1, 2022, Missouri launched a new specialty health plan, called Show Me Healthy Kids, to provide coverage to youth in Department of Social Services custody, former foster children, and for individuals receiving adoption assistance payments. The specialized managed care plan was awarded to Home State Health (Centene).32  On July 1, 2022, Ohio introduced a specialized managed care program for youth with complex behavioral health and multisystem needs. OhioRISE (Resilience through Integrated Systems and Excellence), a prepaid inpatient health plan (PIHP), creates access to new in-home and community-based services for children with complex behavioral health challenges.33  OhioRISE also includes a 1915(c) waiver component which aims to prevent institutionalization and keep families supported in the community.
    • Three states (California, Nevada, and Tennessee) indicated that they were carving in certain long-term services and supports into their managed care programs. California will be carving in institutional long term care in to MCO contracts in all counties in 2023, making coverage for these services consistent across California.34  Tennessee plans to incorporate Intermediate Care Facility (ICF) Services as well as home and community based LTSS services for people with intellectual and developmental disabilities into its MCO contract in FY 2023. Finally, Nevada extended the number of days its plans must cover nursing facility services from 45 to 180 days in its MCO contracts effective January 2022.
    • Three states (California, District of Columbia, and Ohio) reported carving out specific benefits from managed care contracts. California and Ohio – reported carving out pharmacy services in FY 2022 or FY 2023, respectively. The District of Columbia carved out emergency medical transportation from its MCO contracts in FY 2022.
    • Four states (Maine, North Carolina, Oregon, and Washington) reported changes to their PCCM programs. Maine ended its PCCM program, moving to a new value-based approach to support primary care. On July 1, 2022, Maine launched a single, integrated initiative called Primary Care Plus (aligned with the Center for Medicare and Medicaid Innovation’s (CMMI’s) Primary Care First multi-payer initiative). Primary Care Plus aims to move away from a fee-for-service payment system toward population-based payments tied to cost- and quality-related outcomes.35  North Carolina launched a new PCCM option in July 2021 available only to Indian Health Service (IHS) eligible beneficiaries associated with the Eastern Band of Cherokee Indians in select counties in the western part of the state.36  Oregon reported plans to implement an Indian PCCM program in FY 2023. Washington is planning to implement a tribal PCCM entity program in FY 2023 and released a draft SPA for comment in May 2022.37  This program will expand options for Indian health care providers (IHCPs) interested in providing primary case management services. It is like the current PCCM program available to IHCPs but with a larger, more defined list of provider responsibilities.
    • Several states also reported efforts to streamline managed care programs. In FY 2023, Virginia plans to implement Cardinal Care, merging the state’s two existing managed care programs: Medallion 4.0 (serving children, pregnant individuals, and adults) and Commonwealth Coordinated Care Plus (CCC Plus) (serving seniors, children and adults with disabilities, and individuals who require LTSS).38 ,39  The six MCOs currently serving members statewide in Medallion 4.0 and CCC Plus will continue to do so under Cardinal Care. Mississippi and Ohio report that in FY 2023 they are centralizing credentialing processes for providers in MCO networks at the state level to reduce the administrative burden on Medicaid providers. In addition, Ohio plans to implement a fiscal intermediary in FY 2023 requiring all provider claims and prior authorization requests to go through the fiscal intermediary rather than through individual MCOs.40 

    Other State-Contracted Delivery Systems or Initiatives

    In addition to expanding the use of risk-based, comprehensive managed care, state Medicaid programs have expanded their use of other service delivery and payment system reforms in recent years. State Medicaid programs utilize a range of delivery and payment reform; however, there is wide state variation in Medicaid health care delivery and payment systems, as states design and combine service delivery models and payment approaches in different ways.

    The vast majority of states (41 of 51) had at least one specified delivery system and payment reform initiative41  designed to address Medicaid cost and quality in place as of July 2022 and nearly half (24 of 51) had multiple initiatives in place (Figure 4).42  These initiatives are defined in Exhibit 1. Three states (New York, Rhode Island, and Vermont) had implemented initiatives in all five specified areas. For example, Vermont is participating in an All-Payer ACO Model with CMS; has in place a multi-payer advanced primary care initiative, including PCMH and community health teams through the state’s Blueprint for Health; has a “Hub and Spoke” Health Home model for people experiencing opioid dependence; has episodic payments for its residential substance use disorder (SUD) program; and has a mature all-payer claims data base (APCD). Total states with each initiative include:

    • Patient-Centered Medical Home – 26 states43 
    • ACA Health Homes – 20 states
    • All-Payer Claims Database (APCD) – 18 states
    • Accountable Care Organization – 11 states
    • Episode of Care – 9 states
    Delivery System and Payment Reform Initiatives as of July 1, 2022

    Many of these delivery system and payment reform initiatives are longstanding and have been in place for many years. Although the survey did not ask for details regarding each initiative, several states identified changes to initiatives as well as plans to implement in the near future. For example, in FY 2022 California transitioned from its former ACA Health Home program to an “Enhanced Care Management” managed care benefit available statewide. This initiative is part of a framework for broad-based delivery system, program, and payment reform across the Medi-Cal program, called California Advancing and Innovating Medi-Cal (CalAIM).44  Also in FY 2022, Maine replaced its PCMH and PCCM programs with the new “Primary Care Plus” program, an integrated care model that provides monthly payments to eligible primary care providers that vary by practice characteristics and are risk adjusted and performance-based. Although Nevada does not currently have an APCD in place, one was approved for implementation in the 2021 legislative session with an anticipated go-live date of January 2023. Several other states including California, Indiana, Oklahoma, and West Virginia indicated an APCD is planned or currently under development.

    Share of the Medicaid Population Covered Under Different Delivery Systems in All 50 States and DC, as of July 1, 2022
    Exhibit 1: Delivery System Reform Initiatives Defined

    Health Equity

    Context

    The COVID-19 pandemic has highlighted and exacerbated longstanding racial and ethnic disparities in health and health care. Prior to the pandemic, people of color fared worse than White people across many measures of health and health care, reflecting inequities within the health care system as well as across broader social and economic factors that drive health (often referred to as social determinants of health or social drivers of health) that are rooted in racism and discrimination. As a major source of health coverage for people of color, Medicaid programs can help to address health disparities. Over the past few years, the federal government and many states have identified advancing health equity as an important priority for the Medicaid program. In November 2021, CMS published its strategic vision for Medicaid and CHIP which identified equity and reducing health disparities as key focus areas, emphasizing Section 1115 demonstration waivers can help foster improved quality and equity.

    High-quality, comprehensive data are essential for identifying and addressing health disparities and measuring progress over time. For example, during the COVID-19 pandemic, disaggregated demographic data were crucial to identifying disparities and implementing policy solutions. Unfortunately, inadequate, incomplete, and inconsistent demographic data, particularly race and ethnicity data, is a longstanding challenge across many areas of health care, including in state Medicaid and CHIP programs. For example, a Medicaid and CHIP Payment and Access Commission (MACPAC) analysis of 2018 Medicaid administrative data found high rates of missing or unknown race and ethnicity data and conflicts with key benchmark data.

    Federal Medicaid managed care regulations also require states that contract with managed care plans to develop and publicly post quality strategies that include plans to reduce health care disparities. To further these quality strategies, states develop access and quality standards within federal guidelines that MCOs are required to meet. Some state MCO contracts incorporate requirements to advance health equity, such as requiring MCOs to achieve the NCQA Distinction in Multicultural Health Care,45  and states may also tie MCO financial quality incentives (e.g., performance bonuses, withholds, or value-based state directed payments) to health equity-related performance goals. States must also require MCOs to implement performance improvement projects (PIPs) to examine access to and quality of care, and these projects often include analysis of health disparities.

    This section provides information about:

    • Improving Medicaid race, ethnicity, and language (REL) data collection
    • Financial incentives (FFS and MCO) tied to health equity-related performance goals
    • Other MCO health equity requirements
    • Performance improvement projects (PIPs) focused on health disparities

    Findings

    Improving Medicaid Race, Ethnicity, and Language (REL) Data Collection

    Although all Medicaid agencies ask applicants to self-report their race and ethnicity, it is not mandatory for applicants to do so. During Medicaid eligibility determinations (and redeterminations), race and ethnicity are not considered, and data not being used in Medicaid determinations must remain optional for applicants to report. While states must inform applicants that submitting race/ethnicity data is optional, this can lead to missing data, particularly if the instructions and rationale for providing race/ethnicity data are unclear, if the applicant has concerns or questions about how the data may be used, or if the applicant does not feel he or she fits into the options provided. Race and ethnicity categories on Medicaid applications vary considerably across states. An audit of state Medicaid enrollment applications conducted by the State Health Access Data Assistance Center (SHADAC) revealed substantial variation in the number and type of race/ethnicity categories used by states, ranging from 5 to 37 race categories and 2 to 8 ethnicity categories. States vary in the amount of race/ethnicity data they report as unknown or missing. A December 2021 analysis by CMS found that in 14 states, more than 20 percent of race/ethnicity data was missing. State Medicaid programs can implement a variety of strategies to enhance or improve REL data collection. On this year’s survey, we asked states whether specified strategies were in place (as of July 1, 2022) to improve the completeness of REL data.

    Over half of the states that responded to this question (25 of 45) reported using at least one specified strategy to improve race, ethnicity, and language (REL) data completeness (Exhibit 2). Over one-third of responding states (16 of 45) reported requiring MCOs and other applicable contractors to collect REL data. About one-quarter of responding states (12 of 45) reported that eligibility, renewal materials, and/or applications explain how REL data will be used and/or why reporting these data are important. About the same number of responding states reported linking Medicaid enrollment data with public health department vital records data (9 of 45) and partnering with one or more health information exchanges (HIEs) to obtain additional REL data for Medicaid enrollees (8 of 45). Several states identified issues with data systems and lack of integration between systems as barriers.

    Exhibit 2: State Strategies to Improve Completeness of Medicaid Member Data Regarding Race, Ethnicity and Language (REL), as of July 1, 2022

    Eighteen states reported “other” strategies to improve Medicaid REL data.46  For example:

    • Multiple states (Alaska, Colorado, Minnesota, Ohio, and Oregon) reported using data from alternate sources, such as administrative records from other agencies or third-party databases, to populate missing REL values. Washington state reported developing a new eligibility infrastructure that would integrate data across systems to improve data quality.
    • Several states mentioned changes made to the Medicaid application to improve REL data including translating the application into other languages (Oklahoma), adding disability questions and gender identity and modality questions (Oregon), changing the phrasing of REL data questions (South Carolina), allowing applicants to provide more detailed race and ethnicity information (Wisconsin), and implementing, or planning to implement, “opt-out” options for race and ethnicity questions (Maryland and Louisiana).
    • Two states (Arizona and Connecticut) reported that health equity-related committees or task forces within their state governments were developing recommendations related to REL data collection and disaggregation.
    • Massachusetts, through its approved MassHealth Section 1115 demonstration waiver, will financially incentivize ACOs and ACO-participating hospitals to provide complete data on race, ethnicity, language, disability, sexual orientation and gender identity (RELD SOGI) starting in FY 2023. The state is working to update enrollment platforms to clarify and add questions related to RELD SOGI and modify downstream systems accordingly.
    • South Carolina reported using training to emphasize the value of REL data collection with its eligibility staff.

    States use an array of financial incentives to improve quality including linking performance bonuses or penalties, capitation withholds, or value-based state-directed payments to quality measures. States implement financial incentives across delivery systems (fee-for-service and managed care). On this year’s survey, we asked states if they had an MCO financial quality incentive or FFS financial incentive for providers tied to a health equity-related performance goal (e.g., reducing disparities by race/ethnicity, gender, disability status, etc.) in place in FY 2022 or planned for FY 2023.

    About one-quarter of responding states (12 of 44) reported at least one financial incentive tied to health equity in place in FY 2022 (Exhibit 3). The vast majority of these incentives were in place in managed care arrangements (11 of 13). Only two states (Connecticut and Minnesota), reported a FFS financial incentive in FY 2022. Five additional states report plans to implement financial incentives linked to health equity in FY 2023. Within managed care arrangements, states most commonly reported linking (or planning to link) capitation withholds, pay for performance incentives, and/or state-directed provider payments to health equity-related quality measures. Three states (Ohio, Oregon, and Wisconsin) reported implementing MCO incentive funding focused on reducing disparities in COVID-19 vaccination rates. Two states with FFS incentives (in place or planned) (Massachusetts and Minnesota) reported health equity incentives for ACOs.

    Exhibit 3: Financial Incentives Tied to Health Equity, FYs 2022-2023

    Other notable state examples include:

    • California’s Quality Incentive Pool (QIP) program is a managed care directed payment program for California’s public health care systems (i.e., designated public hospitals and district/municipal public hospitals) that ties payments to performance on designated quality measures. The QIP program explicitly incorporates two Improving Health Equity (IHE) metrics, one of which is required for the larger public hospitals. The IHE measure allows hospitals to report a disparity-sensitive measure on a priority population selected by each hospital. Hospitals are also required to stratify by race/ethnicity for up to five designated measures on an informational basis.47  Additionally, in 2023, the state plans to adjust base capitation rates in counties with more than one plan based on plan performance on select quality measures. Performance on health equity will be incorporated once race and ethnicity stratifications are available.
    • Connecticut has had an obstetrics pay for performance program in place for six years that targets birthing people at risk for adverse outcomes, including Black and birthing people of color. In FY 2023, the state plans to launch a maternity payment bundle where financial incentives will be tied to health equity outcomes. The state will include doulas and breastfeeding supports to remedy disparities in maternal and birth outcomes for historically marginalized groups including Black and birthing people of color and those with substance use disorders.
    • In Massachusetts, one of the key goals for MassHealth’s next Section 1115 demonstration period is to advance health equity, with a focus on initiatives addressing health-related social needs and specific disparities. MassHealth intends to implement health equity incentives for ACOs and acute care hospitals to improve social risk factor data collection, increase reporting of quality metrics stratified by social risk factors to identify disparities, and then actually close gaps in the identified disparities.
    • In both FY 2022 and FY 2023, a portion of Michigan’s MCO capitation withhold pay for performance payments (P4P) is based on health equity Healthcare Effectiveness Data and Information Set (HEDIS) measure performance (30%) and performance on shared metrics that address health equity in the care management that MCOs provide in coordination with behavioral health prepaid inpatient health plans (PIHPs) (15%). In FY 2022, there are 10 HEDIS measures that are part of the health equity measures (comparing people of color to the White population).
    • New Jersey reported implementing a perinatal episode of care three-year pilot to test a new alternative payment model for prenatal, labor, and postpartum services statewide. The pilot requires participating providers to complete a Health Equity Action Plan and includes reporting of a provider's quality metrics broken down by the member's race/ethnicity.
    • Pennsylvania’s MCO P4P program incentivizes reductions in racial disparities for specific quality measures, including rates of hypertension, diabetes, and prenatal care.

    Other MCO Health Equity Requirements

    In addition to implementing financial incentives tied to health equity-related performance goals, states can leverage managed care contracts in other ways to promote health equity-related goals. For example, states can require MCOs to achieve national standards for culturally competent care, conduct staff training on health equity and/or implicit bias, develop new positions related to health equity, report racial disparities data, incorporate enrollee feedback, among other requirements. On this year’s survey, we asked states that contract with MCOs about whether certain MCO contract requirements related to health equity were in place in FY 2022 or planned for implementation in FY 2023.

    Nearly one-half of responding MCO states (16 of 37) reported at least one specified health equity MCO requirement in place in FY 2022 (Figure 5). In FY 2022, similar numbers of states (about one-quarter) reported requiring MCOs to have a health equity plan in place (10 of 37), meet health equity reporting requirements (10 of 37), and train staff on health equity and/or implicit bias (9 of 37). Fewer states reported requiring MCOs to seek beneficiary input or feedback to inform health equity initiatives (6 of 37), have a health equity officer (5 of 37), and achieve NCQA’s Distinction in Multicultural Health Care (MHC) (3 of 37).48  Among states with at least one requirement in place in FY 2022, half (8 of 16) reported requiring three or more specified initiatives in place (data not shown). The number of MCO states with at least one specified health equity MCO requirement in place is expected to grow significantly in FY 2023, from 16 to 25 states. A few other states reported that though equity-related requirements for MCOs are not planned for FY 2023, they are actively considering or planning to adopt these requirements in the future.

    MCO Requirements to Address Health Equity, FYs 2022 - 2023

    Although states were not asked to describe MCO requirements related to health equity (in place or planned), several states provided additional details including:

    • Michigan requires MCOs to implement diversity, equity, and inclusion (DEI) assessment and training programs that are evidence-based and comprehensive. The programs must assess all organizational personnel, policies, and practices and include at least one implicit bias training workshop in 2022 for all personnel. MCOs must also report certain HEDIS measures by race and this data is used by the Department of Health and Human Services in its annual Medicaid Health Equity Project.
    • Nevada encourages, but does not require, NCQA MHC distinction as a way of building a strong cultural competency program. Health equity is a component of the required MCO Population Health Program, which must address racial and ethnic disparities, and the required Population Health Program Manager position includes health equity responsibilities. As part of population health program reporting, MCOs must submit an annual population health strategy.
    • Oregon requires MCOs to develop a health equity plan and provide updates and progress reports every year. In addition, MCOs must develop a yearly organization-wide training plan on health equity fundamentals which may include training offerings for provider networks. MCOs are also asked to report on training plan progress every year.

    Performance Improvement Projects (PIPs) Focused on Health Disparities

    For contracts starting on or after July 1, 2017, federal regulations mandate that states require each MCO or limited benefit prepaid health plan (PHP) to establish and implement an ongoing comprehensive quality assessment and performance improvement (QAPI) program for Medicaid services that includes Performance Improvement Projects (PIPs). PIPs may be designated by CMS, by states, or developed by health plans, but must be designed to achieve significant, sustainable improvement in health outcomes and enrollee satisfaction. On this year’s survey, we asked states if they required MCOs to participate in PIPs focused on health disparities in FY 2022 or planned to in FY 2023.

    About half of responding states that contract with MCOs (17 of 37) reported requiring MCOs to participate in PIPs focused on health disparities in FY 2022 (Figure 6). States reported a range of state-mandated PIP focus areas which include an emphasis on reducing disparities / improving health equity including related to:

    • Maternal and child health (Illinois, Michigan, Minnesota, Nevada, and Texas)
    • Social determinants of health assessment, referral, and follow up (Kentucky)
    • Diabetes education and management (Ohio)
    • Substance use disorder (SUD) (Pennsylvania)
    • Access to culturally and linguistically appropriate services (Wisconsin)
    • Lead screening in children (Rhode Island)

    Three states (Arizona, Louisiana, and Massachusetts) reported all PIPs must include a health equity component or equity and disparities analysis; two states (California and New Jersey) reported requirements for MCOs to engage in at least one PIP focused on health disparities, and one state (Washington) requires MCOs to collaborate with other MCOs and the state on a statewide PIP addressing health equity. One state (West Virginia) did not specifically describe its health equity-related PIP requirement. One state (Maryland) reported plans to require MCO participation in PIPs focused on prenatal and postpartum care health disparities in FY 2023. While not within the survey period, Mississippi reported that its new MCO contracts, which will become operational in FY 2024, will require MCOs to collaborate with each other and with the state on joint PIPs addressing health disparities identified by the state.

    Performance Improvement Projects Focused on Health Disparities, FYs 2022 – 2023

    Benefits

    Context

    State Medicaid programs are statutorily required to cover a core set of “mandatory” benefits, but may choose whether to cover a broad range of optional benefits. States may apply reasonable service limits based on medical necessity or to control utilization, but once covered, services must be “sufficient in amount, duration and scope to reasonably achieve their purpose.”49  State benefit actions are often influenced by prevailing economic conditions: states are more likely to adopt restrictions during downturns and expand or restore benefits as conditions improve. However, during the COVID-19 pandemic, despite an early and deep economic downturn, additional federal funds and the goal to maintain access to needed services resulted in states using Medicaid emergency authorities to temporarily expand or enhance benefits. Similarly, in 2020 and 2021, permanent (i.e., non-emergency) benefit expansions continued to far outweigh benefit restrictions, consistent with prior years.

    Recent trends in state changes to Medicaid benefits (both prior to and during the COVID-19 pandemic) include behavioral health service expansions as well as efforts to advance maternal and infant health. New federal legislation and requirements can also affect state Medicaid benefits; for example:

    • The American Rescue Plan Act of 2021 included expanded federal funding for home and community-based services (HCBS).50 
    • The Bipartisan Safer Communities Act of 2022 aimed to improve and expand provision of the Medicaid EPSDT benefit and school-based Medicaid services by providing updated guidance for states. The Act also allocated grant funding for states to expand school-based Medicaid services.51 
    • The Inflation Reduction Act of 2022 requires Medicaid coverage of all adult vaccines recommended by the Advisory Committee on Immunization Practices (ACIP) without cost-sharing, beginning in 2023.52 
    • In July 2022, the federally mandated crisis number, 988, became available to all landline and cell phone users, per the National Suicide Hotline Designation Act of 2020.53  988 provides a single three-digit number to access a network of over 200 local and state funded crisis centers. State Medicaid programs may participate in financing of services provided through 988.
    • The Consolidated Appropriations Act of 2021 requires states to cover routine patient costs associated with participation in qualifying clinical trials, beginning January 1, 2022.54 

    This section provides information about:

    • Non-emergency benefit changes
    • Clinical trial participation coverage
    • In lieu of services

    Findings

    Non-Emergency Benefit Changes

    We asked states about non-emergency benefit changes implemented during FY 2022 or planned for FY 2023, excluding telehealth, pharmacy, and temporary changes adopted via emergency authorities in response to the COVID-19 pandemic but including emergency changes that have or will become permanent (i.e., transitioned to traditional, non-emergency authorities). Benefit changes may be planned at the direction of state legislatures and may require CMS approval.

    Benefit Changes Reported by States, FYs 2011 - 2023

    The number of states reporting new benefits and benefit enhancements greatly outpaces the number of states reporting benefit cuts and limitations (Figure 7 and Table 2). Thirty-three states reported new or enhanced benefits in FY 2022 and 34 states are adding or enhancing benefits in FY 2023.55  Two states reported benefit cuts or limitations in FY 2022 and no states reported cuts or limitations in FY 2023. We provide additional details about several benefit categories below (Exhibit 4). In addition to these benefit categories, several states reported updated and expanded benefits in HCBS waivers (which may be reflected in other categories below); such expansions may take advantage of enhanced ARPA HCBS funding.

    Exhibit 4: Select Categories of Benefit Enhancements or Additions

    Behavioral Health ServicesStates continue to focus on behavioral health through the introduction of new and expanded mental health and/or substance use disorder (SUD) services in FY 2022 and FY 2023. States reported service expansions across the behavioral health care continuum, including institutional, intensive, outpatient, home and community-based, and crisis services (see Exhibit 5 for state examples). Many of these benefit expansions are targeted to specific populations, including notable expansions and programming for youth. A number of states reported benefits aimed to improve the integration of physical and behavioral health care, including adoption of Certified Community Behavioral Health Clinics (CCBHCs)56  or the Collaborative Care model (CoCM).57  State approaches to addressing SUD outcomes include coverage of opioid treatment programs, peer supports, and enhanced care management. At least ten states are expanding coverage of crisis services, which aim to connect Medicaid enrollees experiencing behavioral health crises to appropriate community-based care.58  These include mobile crisis response services and crisis stabilization centers. In many states, crisis service expansions require coordination with state behavioral health agencies, including related to the implementation and funding of the new national 988 crisis number.

    Exhibit 5: Examples of State Behavioral Health Benefit Expansions in FY 2022 and FY 2023

    Pregnancy and Postpartum ServicesStates continue to expand and transform care for pregnant and postpartum individuals to improve maternal health and birth outcomes. In April 2022, a temporary option to extend Medicaid postpartum coverage from 60 days to 12 months took effect. This option, included in the American Rescue Plan Act, is part of broader federal and state efforts to improve maternal and infant health outcomes and address racial/ethnic health disparities. Alongside this eligibility change, some states are enhancing Medicaid services available during the postpartum period. Additionally, nine states are adding coverage of services provided by doulas (California, District of Columbia, Illinois, Maryland, Michigan, New Mexico, Nevada, Rhode Island, and Virginia). Doulas are trained professionals who provide holistic support to individuals before, during, and shortly after childbirth. Seven states are investing in the implementation or expansion of home visiting programs to teach positive parenting and other skills aimed at keeping children healthy and promoting self-sufficiency (Alabama, Delaware, Illinois, Maryland, Ohio, Oregon, and Vermont). Other examples of expanded pregnancy and postpartum services include:

    • In FY 2023, Illinois plans to expand services available during the postpartum period to include those provided by certified lactation counselors and consultants, public health nurses, and medical caseworkers.
    • In FY 2022, Washington implemented a Newborn Administrative Day Rate to cover hospital stays up to five days for a postpartum parent who has been medically discharged, but whose newborn remains inpatient due to monitoring for neonatal abstinence syndrome (NAS) or neonatal opioid withdrawal syndrome (NOWS). The rate will provide daily reimbursement to help offset hospital costs of providing these postpartum parents with room and board and limited additional services centered on the care and well-being of the newborn, including medications to treat SUD.59 
    • In FY 2023, West Virginia plans to implement its Drug Free Moms and Babies (DFMB) Program (previously a pilot project), an integrated comprehensive medical and behavioral health program for pregnant and postpartum individuals with SUD that provides a targeted case management benefit.60 
    • In FY 2023, Maine and Maryland are expanding their Maternal Opioid Misuse (MOM) Models, a Center for Medicare and Medicaid Innovation (CMMI) initiative for pregnant and postpartum women with opioid use disorder.

    Preventive ServicesSixteen states reported expansions of preventive care in FY 2022 or FY 2023. Preventive care—including immunizations and regular screenings that permit early detection, treatment, and improved management of chronic conditions—improves the prospects for better health outcomes. States must cover certain preventive services for adults newly eligible under the ACA’s Medicaid expansion, but this coverage is not required for “traditional” Medicaid adults. (In contrast, states are required to provide comprehensive preventive care to children through the EPSDT benefit.) States reported enhancing a range of preventive benefits, especially for adult enrollees, in FY 2022 and FY 2023. For example, seven states are expanding services to prevent and/or manage diabetes, such as continuous glucose monitoring.61  Other reported preventive benefit enhancements relate to asthma services, vaccinations, and genetic testing and/or counseling.

    Services Targeting Social Determinants of HealthMany states reported new and expanded benefits related to enrollees’ social needs. Social determinants of health (SDOH) are the conditions in which people are born, grow, live, work, and age that shape health; these include but are not limited to housing, food, education, employment, healthy behaviors, transportation, and personal safety. Generally, states have not been able to use federal Medicaid funds to pay the direct costs of non-medical services like housing and food.62  However, within Medicaid, states can use a range of state plan and waiver authorities to add certain non-clinical services to the Medicaid benefit package. Historically, non-medical services have been included as part of Medicaid HCBS programs for people who need help with self-care or household activities as a result of disability or chronic illness, and states have more limited flexibility to address SDOH outside of Medicaid HCBS authorities. CMS released guidance for states about opportunities to use Medicaid and CHIP to address SDOH in January 2021. In December 2021, CMS approved a California proposal to use “in lieu of” services (ILOS) to offer a menu of health-related services through managed care, and further guidance from CMS on the ILOS regulation is expected (also see ILOS section below).

    In FY 2022 and/or 2023, twelve states reported new or expanded housing-related supports, as well as other services and programs tailored for individuals experiencing homelessness or at risk of being homeless.63  Some states reported enhancing benefits that target the social needs of enrollees receiving HCBS, such as home-delivered meals or supported employment. Examples of expanded services targeting SDOH include:

    • California’s CalAIM initiative, which launched in January 2022, seeks to take the state’s whole person care approach statewide, with a central focus on improving health and reducing health disparities and inequities. Under CalAIM, Medi-Cal managed care plans will provide Enhanced Care Management (ECM) and Community Supports to targeted high-need beneficiaries.64  The new ECM benefit includes care coordination and comprehensive care management services to address clinical, behavioral, and social needs. Community Supports will address social drivers of health; examples include housing navigation services, recuperative care (medical respite), short-term post hospitalization housing services (up to six months), environmental accessibility adaptations, medically tailored meals, and sobering centers (also see ILOS section below).65 
    • Recently approved Section 1115 waivers in Arizona, Massachusetts, and Oregon allow the states to provide evidence-based health-related social needs (HRSN) services to certain high-need enrollees, when clinically appropriate, to address food insecurity and/or housing instability. HRSN services vary by state and include housing supports (such as eviction prevention, security deposits, housing transition navigation services, and medically necessary home modifications); short-term post-transition rent/temporary housing for up to six months (in Arizona and Oregon only); case management and linkages to other benefit programs; and nutrition supports (such as nutrition counseling and education, time-limited food assistance, and medically tailored meals) (in Massachusetts and Oregon only). Enrollees must meet health and risk criteria (which vary by state) to be eligible for HRSN services. For example, target populations include homelessness or risk of homelessness, justice-involvement, and behavioral health needs/diagnoses.66 
    • In FY 2022, Connecticut implemented its Connecticut Housing Engagement and Support Services (CHESS) initiative that provides eligible enrollees with supportive housing benefits under Medicaid, coordinated with Medicaid services and non-Medicaid housing subsidies.67  Beginning July 1, 2022, Connecticut is also covering Community Violence Prevention Services to promote improved outcomes, prevent injury, reduce recidivism, and decrease the likelihood that victims of violence will commit violence themselves.68 
    • If approved by CMS, in FY 2023 Wisconsin plans to establish a new Section 1915(i) HCBS eligibility group of adults with certain health conditions who are experiencing homelessness and will provide these enrollees with housing support services such as housing consultation, housing transition and sustaining supports, and relocation supports.69 
    • Two states (Oregon and Wisconsin) reported coverage for interpretation services for enrollees with limited English proficiency (LEP). All Medicaid providers are obligated to make language services available to those with LEP; states are permitted but not required to reimburse providers for the cost of these services. Both Oregon and Wisconsin are adding reimbursement for the cost of ensuring access to interpreters in conjunction with a Medicaid-covered service.

    Dental ServicesStates aim to improve oral health by expanding covered dental benefits and extending coverage to new populations. Nine states are adding comprehensive adult dental coverage,70  while additional states report expanding specific dental services for adults. Several states expanded dental services for certain populations, including pregnant individuals or people with disabilities. For example, in FY 2023, Nevada proposes to offer a limited dental benefit to adults with diabetes to address their unmet oral health needs, improve health outcomes, and lower overall costs for a population at higher risk for periodontal disease.71  A few states are adding or expanding coverage of fluoride, including three states that are adding coverage of Silver Diamine Fluoride (SDF).72  SDF is a topical agent that can be used to halt the development of cavities in children and adults.73 

    Just two states reported benefit restrictions in FY 2022 and no states reported such restrictions planned for FY 2023. Benefit restrictions reflect the elimination of a covered benefit, benefit caps, or the application of utilization controls such as prior authorization for existing benefits. In FY 2022, Montana eliminated its Nurse Advice Line and Oklahoma eliminated its behavioral health ACA Health Home initiative. In both states, however, public documents suggest enrollees will continue to have access to similar services. For example, Montana acknowledged increased availability of telehealth in its state plan amendment to eliminate its Nurse Advice Line.74  In Oklahoma, the Health Home population will continue to receive integrated services provided by Community Mental Health Centers (CMHCs) and through Certified Community Behavioral Health (CCBH) service delivery, as well as other care coordination models, with most Health Home providers transitioning to the CCBH model.75 

    Clinical Trial Participation Coverage

    Historically, state Medicaid programs were not required to cover costs associated with participation in clinical trials, even if such costs were for services that Medicaid would ordinarily cover. However, as documented in a State Medicaid Director letter, the Consolidated Appropriations Act of 2021 requires states to cover routine patient costs associated with participation in qualifying clinical trials beginning January 1, 2022. These costs include any item or service (such as physician, laboratory, or medical imaging services) provided to the individual under the qualifying clinical trial that would otherwise be covered under the Medicaid state plan or Section 1115 waiver.76 

    Most states reported coverage of routine patient costs associated with participation in qualifying clinical trials prior to the new federal requirement. Thirty-three states (of 47 responding) indicated that at least some of these costs were covered prior to the requirement’s effective date of January 1, 2022. About one-quarter of all responding states noted operational challenges and other concerns. These included having to expand the benefit to cover additional costs (e.g., transportation and/or out-of-state coverage), increased administrative burden (e.g., new provider attestation requirements and/or the 72-hour coverage determination timeframe), and regulatory efforts (e.g., legislation, rulemaking, and/or provider manual updates needed). A small number of states reported other challenges, including difficulty identifying eligible populations and provider education and outreach needed to ensure awareness.

    In Lieu of Services

    States use a combination of fee-for-service and managed care arrangements to deliver care to Medicaid beneficiaries, with many services increasingly being provided by managed care organizations (MCOs). Under federal Medicaid regulations, states may allow MCOs the option to offer services or settings that substitute for those that are covered under the state plan, so long as the substitute service is determined to be medically appropriate and cost-effective.77  If an MCO opts to offer in lieu of services (ILOS), the services must be identified in the MCO contract and enrollees may not be required to use them.78  In recent years, states have increasingly used MCO “in lieu of” authority to cover services provided to nonelderly adults in “institutions for mental disease” (IMDs) that otherwise would be ineligible for federal Medicaid funding. The 2018 SUPPORT Act codified the existing Medicaid managed care regulation allowing capitation payments to include IMD services up to 15 days per month using “in lieu of” authority.

    Most states reported allowing MCOs to use “in lieu of” authority to cover certain services, especially behavioral health services and services to address SDOH. Thirty-four of 39 responding MCO states indicated permitting at least one ILOS as of July 1, 2021; nearly all of these states reported that the permitted ILOS included certain behavioral health services. By far, the most commonly cited ILOS was services provided to nonelderly adults in IMDs, which are otherwise ineligible for Medicaid funding except through in lieu of or waiver authority. Some states mentioned other approved behavioral health services (including mental health and SUD services), such as mobile crisis and crisis stabilization services, outpatient treatment in lieu of hospitalization, and group or peer supports. Nearly one-third of states permitting ILOS reported that allowable ILOS include services to address SDOH, such as food and housing needs. For example, California’s Community Supports ILOS package builds on the state’s experience with Whole Person Care Pilots and includes housing transition navigation services, environmental accessibility adaptations (home modifications), asthma remediation, medically tailored meals, and sobering centers.79  Following the CMS approval of California’s Community Supports, guidance from CMS on the ILOS regulation is expected. Approximately one-quarter of states that permit ILOS reported leveraging this authority to provide coverage of HCBS, such as adult day care, homemaker services, and covered HCBS services in excess of established limits. At least one state acknowledged MCOs have been slow to take advantage of their optional ILOS authority, particularly for SDOH-related services, and the state will be evaluating updated approaches to ensure coverage in the future.

    Benefit Changes in all 50 States and DC, FY 2022 and FY 2023

    Telehealth

    Context

    Telehealth can be an important component of facilitating access to care for Medicaid enrollees during and beyond the COVID-19 pandemic. States have broad authority to cover telehealth in Medicaid without federal approval, including flexibilities for allowable populations, services and payment rates, providers, technology, and managed care requirements. Prior to the pandemic, the use of telehealth in Medicaid was becoming more common. However, while all states had some form of Medicaid telehealth coverage, policies regarding allowable services, providers, and originating sites varied widely;80  further, Medicaid telehealth payment policies were unclear in many states.81  To increase health care access and limit risk of viral exposure during the pandemic, all 50 states and DC expanded coverage and/or access to telehealth services in Medicaid. For example, states expanded the range of services that can be delivered via telehealth; established payment parity with face-to-face visits; expanded permitted telehealth modalities; and broadened the provider types that may be reimbursed for telehealth services. As of July 2021, most states reported covering a range of services delivered via audio-visual and audio-only telehealth in their Medicaid fee-for-service (FFS) and managed care programs.

    These telehealth expansions contributed to substantial growth in Medicaid and CHIP services delivered via telehealth during the public health emergency (PHE).82  However, telehealth access may not be equally available to all enrollees. For example, research indicates that video telehealth rates have been lowest among Black, Asian, and Hispanic individuals, potentially due to more limited internet or computer access—leading researchers to conclude that “policy efforts to ensure equitable access to telehealth, in particular video-enabled telehealth, are needed to ensure that disparities that emerged during the pandemic do not become permanent.” Similarly, while telehealth has the potential to facilitate access to care for Medicaid enrollees in rural areas with fewer provider and hospital resources,83  inadequate and/or unaffordable broadband access can be a barrier. Research suggests that telehealth utilization during the pandemic has been lower for rural Medicaid enrollees versus those living in urban areas.84 

    This section provides information about:

    • Telehealth policy adopted in response to COVID-19 (audio-only coverage)
    • Telehealth utilization trends during the pandemic
    • Telehealth quality and other challenges
    • Permanent telehealth policy changes and key issues to watch

    Findings

    Telehealth POLICY ADOPTED IN RESPONSE TO COVID-19

    To increase health care access and limit risk of viral exposure during the pandemic, all 50 states and DC expanded coverage and/or access to telehealth services in Medicaid. Because states previously reported somewhat less coverage of audio-only telehealth and indicated that continued coverage of this modality was under consideration, on this year’s survey we asked states to report prior changes to and current coverage of audio-only telehealth.

    Nearly all responding states added or expanded audio-only telehealth coverage in Medicaid in response to the COVID-19 pandemic. Twenty-eight states reported that they newly added audio-only coverage (i.e., had no audio-only Medicaid coverage prior to the pandemic) while 19 states expanded existing coverage.85  We also asked states to indicate whether, as of July 1, 2022, Medicaid provided any coverage of specified services delivered via audio-only telehealth, when within the provider’s scope of practice. For each service type, a majority of states reported providing audio-only coverage (at least sometimes) (Figure 8). In particular, nearly all states reported audio-only coverage of mental health and substance use disorder (SUD) services. States least frequently reported audio-only coverage of home and community-based services (HCBS) and dental services. Two states (Mississippi and Wyoming) reported no coverage of audio-only telehealth for the services in question.

    States Providing Medicaid Coverage of Services Delivered via Audio-Only Telehealth, as of July 1, 2022

    To better understand the impacts of telehealth policy changes during the pandemic, we asked states to report notable trends in Medicaid telehealth utilization in FY 2022 or anticipated for FY 2023. Notable trends reported included telehealth utilization over time, top services with high or increased telehealth utilization, and populations most likely to use telehealth.

    States report that telehealth utilization by Medicaid enrollees has been high during the pandemic but has decreased and/or leveled off more recently. These trends are consistent with preliminary CMS data showing that per-enrollee telehealth use in Medicaid and CHIP spiked in April 2020, stabilized from June 2020 through March 2021, and has since declined (but remains substantially higher compared to the pre-PHE period).86  Many states noted that telehealth utilization trends over time correspond to COVID-19 outbreaks, with higher utilization during COVID-19 surges and lower utilization when case counts are lower. States reported that telehealth helped maintain access to care during the surges, when in-person service utilization decreased. In general, states reported that telehealth utilization was projected to continue at higher levels than before the pandemic, at least for some service categories, but at a lower level than during peak COVID-19 surges.

    Behavioral health, especially mental health, remains a top category of services with high telehealth utilization across states, followed by evaluation and management (E/M) services and office/outpatient services generally. We asked states to list the top two to three categories of services that had the highest utilization in FY 2022 (we also asked states to list the top categories of services that had the greatest increase in telehealth utilization in FY 2022 compared to FY 2019; results were similar for both questions). More than three-quarters of responding states (37 of 47) reported that behavioral health services were among those with the highest utilization;87  this result is consistent with data from CMS and other sources. In particular, about half of states identified mental health services as the most utilized, particularly psychotherapy. Additionally, a majority of states reported high utilization of evaluation and management (E/M) services and/or other physician/qualified health care professional office/outpatient services, including primary care. Finally, services identified by a few states each as among those with highest utilization included: federally qualified health center (FQHC) and other clinic services; speech, hearing, occupational, and/or physical therapy; services to treat COVID-19; and case management. Four responding states indicated they did not have the requested FY 2022 telehealth utilization data available at this time.88 

    States reported telehealth utilization across all population groups during the pandemic, with considerable state-by-state variation in the groups with highest utilization (Figure 9). We asked states to indicate which Medicaid eligibility group was most likely to use telehealth services in FY 2022. States that responded most frequently identified ACA expansion adults as one of the groups most likely to use telehealth (about one-third of responding states), followed by children and individuals with disabilities (each identified by about one-sixth of responding states). A few states noted that within nonelderly, non-pregnant adult eligibility groups (with or without disabilities), telehealth utilization was higher among younger adults (e.g., under age 40). One-quarter of responding states reported that utilization trends by eligibility groups were unknown; several of these states noted that data analysis was planned or underway.

    Medicaid Eligibility Groups Most Likely to Use Telehealth in FY 2022

    We also asked states to describe any other notable population trends in Medicaid telehealth utilization in FY 2022 or anticipated for FY 2023; just over half of states responded to this question. Among responding states, reported trends included varying telehealth utilization by:

    • Geography (urban vs. rural). Six states reported that Medicaid enrollees living in urban areas were more likely to utilize telehealth compared to those living in rural areas, at least for some service categories.89  This finding is consistent with Government Accountability Office (GAO) research suggesting that telehealth utilization during the pandemic has been lower for rural Medicaid enrollees,90  who may face challenges with inadequate and/or unaffordable broadband access. In contrast, three states reported that enrollees in rural areas had higher utilization of telehealth.91 
    • Race and sex. Of the five states that indicated trends in telehealth utilization by race/ethnicity, all reported that utilization was higher among White enrollees compared to enrollees of color.92  Similarly, all six states that shared trends by sex indicated that telehealth utilization was higher among female versus male enrollees.93 
    • Health conditions. A small number of states reported that enrollees with disabilities, chronic health conditions, and/or behavioral health conditions were more likely to utilize telehealth.

    Telehealth Quality and Other Challenges

    Telehealth Quality: State Concerns and Initiatives

    The rapid expansion of Medicaid telehealth policies and utilization during the pandemic has prompted questions about the quality of services delivered via telehealth. To fulfill a directive in the 2020 CARES Act to report on the federal pandemic response, in March 2022 the GAO released a report that analyzed states’ experiences with telehealth in Medicaid and evaluated state and federal oversight of quality of care and program integrity risks.94  In the report, the GAO raised concerns about the impact of telehealth delivery on quality of care for Medicaid enrollees and recommended that CMS collect information to assess these effects and inform state decisions; CMS acknowledged but has not yet acted on these recommendations. Further, the Bipartisan Safer Communities Act signed into law in June 2022 directs the agency to issue guidance to states on options and best practices for expanding access to telehealth in Medicaid, including strategies for evaluating the impact of telehealth on quality and outcomes.95  Given this federal interest in the quality of care delivered via telehealth, we asked states to list concerns related to telehealth quality and to describe recent or planned initiatives to assess telehealth quality in Medicaid.

    More than three-quarters of responding states reported questions and/or concerns about the quality or clinical effectiveness of services delivered via telehealth. We asked states to list their top two to three concerns in this area; common areas of top concern included:

    • Concerns about the quality of diagnoses when delivered via telehealth as well as the impact of telehealth on receipt of other services, most commonly preventive services (such as immunizations and screenings, for children and adults). For example, North Carolina reported concerns about potential delayed diagnoses should virtual care replace in-person visits, rendering vitals or full clinical examinations not possible. States also noted concerns about the quality of telehealth visits for maternity care, behavioral health care, dental services, and services for children.
    • Concerns that audio-only telehealth may be less effective than in-person visits or audio-visual telehealth. Several states noted a lack of adequate data to assess the effectiveness of audio-only services. In some cases, these concerns about audio-only quality have resulted in limitations to coverage or payment of this modality, or states are considering such limitations in the future.
    • Concerns that inadequate access to all forms of telehealth may negatively and inequitably impact quality of care, resulting in disparities and/or hampering continuity of care. States also emphasized the importance of ensuring that members always have a meaningful choice of receiving services in-person if that is their preference.

    Additional reported quality concerns included: privacy (e.g., that lack of privacy may inhibit quality of engagement in treatment), billing and coding challenges, and the potential for fraud and abuse. Many states also acknowledged the need for more data on the effectiveness of telehealth services compared to in-person modalities, as well as data on telehealth quality for particular services or conditions.

    Most states have implemented or are planning initiatives to assess telehealth quality, though many report ongoing considerations and uncertainty over how to effectively evaluate quality. When asked to describe initiatives to assess telehealth quality, two-thirds of states reported that such initiatives were in place or planned. States report a range of initiatives to collect, analyze, and/or publish data related to telehealth quality, including data from member or provider surveys and utilization data. Several states indicated they also planned to use demographic data to understand which members use telehealth and evaluate potential impacts on equity. Several states are partnering with universities or other external partners to collect and analyze telehealth utilization and quality data. Additionally, a few states report working with providers to better understand and address telehealth quality, such as collecting provider feedback and issuing coding guidance to help the state differentiate telehealth services in its encounter data. A few states emphasized that their evaluations will inform future telehealth policy decisions. Examples of state initiatives to assess telehealth quality in Medicaid include:

    • Arizona included supplemental telehealth questions in its 2021 Consumer Assessment of Healthcare Providers and Systems (CAHPS) survey. Findings included that most members viewed services delivered via phone or video telehealth as about the same or better quality than in-person services. Additionally, most members reported no privacy concerns during telehealth visits and indicated that telehealth technology was easy to use.96  Similarly, Maine added a telehealth section to its annual CAHPS survey and North Carolina stratifies CAHPS results by the telehealth-utilizing population to understand their satisfaction compared to others.
    • State legislation in Maryland directed the state’s Health Care Commission to submit a report in December 2022 that evaluates the impact of telehealth on service utilization and quality, which will include Medicaid data. The report will include an assessment of patient satisfaction with telehealth and a review of the appropriateness of telehealth across the continuum of care. The goal of the report is to inform policy decisions on coverage of and payment for services delivered via telehealth.
    • Massachusetts reported evaluating member experiences with telehealth as well as utilization data to better understand how telehealth is complementing in-person services. The state is seeking opportunities to utilize standard quality metrics to better understand the quality of services delivered via telehealth. The Medicaid agency is also partnering with external researchers to better understand telehealth utilization, qualitative member experience, and disparities in telehealth utilization among enrollees by social risk factors.
    • In addition to conducting stakeholder surveys, South Carolina has hired additional staff to improve oversight and monitoring and understand any differences in service quality between telehealth and in-person services.

    State Initiatives to Address Other Telehealth Challenges

    States report undertaking many different Medicaid and cross-agency initiatives to mitigate telehealth-related challenges. In 2021, states reported a range of telehealth challenges faced by members, providers, and the state Medicaid agency, including access to internet and technology and the need for education and outreach. This year, we asked states to describe any initiatives in place or planned for FY 2023 to mitigate challenges with outreach/education, program integrity/fraud, broadband access, technology availability, or equity of access. In response, more than two-thirds of responding states (33 of 48) reported an initiative in at least one of the specified areas. About half of all responding states reported outreach/education initiatives, while just under half of states reported initiatives in each of the other areas (Exhibit 6). Some initiatives were Medicaid-specific, whereas others were broader and might utilize other funding, such as by connecting enrollees to grant programs to facilitate access to technology and broadband. Five states (Arizona, Colorado, Maine, Nebraska, and New Hampshire) reported plans to use ARPA funding to address telehealth challenges.97  Several states reported statewide initiatives to address telehealth challenges across the health care system. For additional examples, see Exhibit 6.

    Exhibit 6: State Reporting Initiatives to Mitigate Telehealth Challenges

    Permanent Telehealth Policy Changes and Key Issues to Watch

    During the COVID-19 pandemic, many states used temporary Medicaid emergency authorities to expand telehealth coverage and also took advantage of broad authority to further expand telehealth without the need for CMS approval. As discussed above, these policy expansions resulted in high telehealth utilization across populations, though many states have raised concerns about the quality of telehealth visits as well as the need to address other telehealth challenges. Looking ahead, permanent telehealth policies are under consideration in many states, as states weigh expanded access against quality, equity, program integrity, and other concerns. In 2021, most states reported that future changes to telehealth policies were undetermined, though some states had already implemented permanent expansions, especially to allow telehealth for behavioral health services, and a few had already implemented limitations to pandemic-era telehealth policy (e.g. to limit coverage of or payment parity for audio-only). This year, we asked states to report expansions and limitations to fee-for-service (FFS) telehealth policies implemented in FY 2022 or planned for FY 2023, and to describe such changes and key considerations.

    Most states have or plan to adopt permanent Medicaid telehealth expansions that will remain in place even after the pandemic, though some are considering guardrails on such policies. Two-thirds of responding states reported expansions to FFS telehealth policies implemented in FY 2022 and/or planned for FY 2023, including permanent (i.e., non-emergency) adoption of telehealth policy expansions that were initially enacted during the pandemic on a temporary basis. One-quarter of states reported limitations to telehealth policies that had been temporarily expanded during the pandemic (Figure 10).

    Changes to FFS Medicaid Telehealth Policy, FY 2022 or FY 2023

    Reported changes in FY 2022 or 2023 include expansions or limitations to:

    • Allowable modalities. States most commonly report making changes to allowable telehealth modalities, either to permanently add or to limit audio-only telehealth. For example, in New York audio-only telehealth is currently authorized during the PHE and pending regulations will make this coverage permanent. Many states noted that expanded audio-only coverage is crucial to maintain access to care, especially in rural areas and for older populations; however, some states are also particularly concerned about the clinical effectiveness and quality of audio-only visits. For example, after the PHE, Michigan will largely eliminate coverage of audio-only services, but will keep some audio-only codes, such as for behavioral health counseling, to provide continued access for individuals with limited broadband.
    • Allowable services. Many states report permanently expanding services allowed to be delivered via telehealth. For example, in FY 2023 Ohio expanded its telehealth coverage policy to include pregnancy education, diabetes management, and behavioral health services.98  A smaller number of states are eliminating telehealth coverage of specific services. For example, after considering utilization, clinical evidence, and stakeholder input, South Carolina will no longer cover telehealth delivery of certain behavioral health services after the PHE ends; however, the state will extend telehealth coverage of other services (including addiction-related services, physical and speech therapy, and well-child visits and EPSDT) for one-year post-PHE for further evaluation.99 
    • Allowable providers. States report permanent expansions of provider types allowed to utilize telehealth, such as to allow out-of-state providers. For example, July 2022 state legislation in Alaska makes several emergency telehealth policies permanent, including allowing out-of-state providers.100  Effective April 2022, Texas began allowing rural health clinic providers to receive facility fee reimbursement for services delivered via telehealth.101  (No states reported limiting allowable provider types in either year.)
    • Allowable originating sites. States report permanent expansions of originating site policies to allow patients to receive services via telehealth from their homes. For example, several states adopted place of service code 10 to identify services provided in the enrollee’s home via telehealth. (No states reported limiting allowable originating sites in either year.)
    • Reimbursement parity. In 2021, all responding states indicated that they ensured payment parity between telehealth and in-person delivery of FFS services (as of July 1, 2021), which may have been under emergency policy; this year, most states reported no changes in FY 2022 or FY 2023 to parity requirements. A small number of states reported that in FY 2022 or FY 2023 they established telehealth payment parity on a permanent basis. For example, Rhode Island state legislation enacted in July 2021 requires Medicaid telehealth coverage and payment parity,102  thus making permanent emergency flexibilities originally established in a 2020 executive order.103 

    Additionally, a few states that reported no changes in either year noted that they had already adopted permanent telehealth expansions in FY 2020 or 2021. For example, Mississippi previously made some emergency telehealth flexibilities permanent, but opted to continue allowing other flexibilities only during a state of emergency (including audio-only telehealth). Also, 18 states reported that FY 2023 telehealth policy changes were undetermined, with common areas of consideration including allowable services, modalities, payment parity, and/or other guardrails. For example, Delaware aims to keep most current flexibilities in place, but is considering requiring an in-person component for certain services. Delaware also plans to submit a SPA to remove telehealth from the State Plan and thus gain more flexibility in making telehealth policy decisions, as CMS considers telehealth to be a modality rather than a benefit.

    Nearly all responding states that contract with managed care organizations (MCOs) reported that changes to FFS telehealth policies would also apply to MCOs. Several states noted that though they require MCOs to follow minimum FFS telehealth requirements, MCOs could opt to have a more expansive telehealth policy.

    Looking ahead, key issues that may influence future Medicaid telehealth policy decisions include analysis of data, state legislation and federal guidance, and cost concerns. In addition to the implemented/planned expansions and limitations described above, many states reported that they remained undetermined about some or all potential telehealth policy changes in FY 2023 and beyond. For example, states hope that ongoing and future analyses of telehealth data—including utilization data, quality data, and feedback from members and providers—can help to inform policy decisions. Additionally, many states reported ongoing state legislative activity related to telehealth policy, including potential expansions and limitations that would apply to Medicaid—for example, one state referred to telehealth as “legislative sport.” States also await guidance from the federal government, including from CMS, related to HIPAA, and Medicare policies. While a small number of states report that budgetary concerns may impact telehealth policy due to increased service utilization, other states noted that telehealth has not substantially increased costs. Several states noted that telehealth policies related to FQHCs were under review, as such telehealth visits may be particularly costly given the prospective payment system (PPS) model unique to these providers. Finally, states reported that they are focused on protecting member choice: ensuring that enrollees have access to high-quality telehealth if preferred, but that they are not forced or pressured to use telehealth if they would rather receive services face-to-face.

    Provider Rates And Taxes

    Context

    In general, states have broad latitude under federal laws and regulations to determine fee-for-service (FFS) provider payments so long as the payments: are consistent with efficiency, economy, and quality of care; safeguard against unnecessary utilization; and are sufficient to enlist enough providers to ensure that Medicaid beneficiaries have access to care that is equal to the level of access enjoyed by the general population in the same geographic area.104  Subject to certain exceptions,105  states are not permitted to set the rates that managed care entities pay to providers. However, state-determined FFS rates remain important benchmarks for MCO payments in most states, often serving as the state-mandated payment floor.

    Historically, FFS provider rate changes generally reflect broader economic conditions. During economic downturns where states may face revenue shortfalls, states have typically turned to provider rate restrictions to contain costs. Conversely, states are more likely to increase provider rates during periods of recovery and revenue growth. Early in the COVID-19 pandemic, however, states were largely deterred from using rate reductions to address budget challenges due to the financial strains that providers were experiencing from the increased costs of COVID-19 testing and treatment or from declining utilization for non-urgent care. Instead, Congress, states, and the Administration adopted a number of policies to ease financial pressure on states, hospitals, and other health care providers, including enhanced Medicaid matching funds for states – tied to the Public Health Emergency (PHE) – and enhanced funding for home and community-based services (HCBS) (that remains available for expenditure through March 21, 2025) designed to bolster rates and the direct care workforce.

    States have considerable flexibility in determining how to finance the non-federal share of state Medicaid payments, within certain limits. In addition to state general funds appropriated directly to the state Medicaid program, most states also rely on funding from health care providers and local governments generated through provider taxes, intergovernmental transfers (IGTs), and certified public expenditures (CPEs). Over time, states have increased their reliance on provider taxes, with expansions often driven by economic downturns.

    This section provides information about:

    • FFS reimbursement rates
    • Provider taxes

    Findings

    FFS Reimbursement Rates

    At the time of the survey, responding states had implemented or were planning more FFS rate increases than rate restrictions in both FY 2022 and FY 2023 (Figure 11 and Tables 3 and 4). All responding states in FY 2022 (49 states) and all but one responding state in FY 2023 (48 of 49), reported implementing rate increases for at least one category of provider. Significantly fewer states (19 in FY 2022 and 25 in FY 2023), had implemented or were planning to implement at least one rate restriction.

    FFS Provider Rate Changes Implemented in FY 2003 - FY 2022 and Adopted for FY 2023

    Many states noted that worsening inflation in recent months and workforce shortages driving higher labor costs were resulting in growing calls from providers and others for rate increases. Some states noted, however, that their FY 2023 budgets do not account for current inflation levels, as they were introduced in late calendar year 2021 and early 2022 before inflation began to dramatically accelerate, but that inflation remains a concern looking ahead. Many states also noted that they employ cost-based reimbursement methodologies for some provider types, such as nursing facilities, that automatically adjust for inflation and other cost factors during the rate setting process. A number of states reported that rates for some provider types are benchmarked to Medicare rates and therefore increase commensurate with Medicare increases. Finally, several states reported comprehensive rate reform analyses impacting multiple provider types had been completed or were underway. For example:

    • Alabama reported that it was in the process of putting an access assessment process into place that would include rate reassessments every three to five years in alignment with the assessment process.
    • Indiana reported plans to initiate “rate matrix” work, starting first with home health and HCBS waiver rates. The goal of this long-term project, in part, is to establish a regular cadence of rate updates by provider category.
    • As a result of a comprehensive rate system analysis, first initiated in 2019, Maine is implementing its Rate System Reform plan in FY 2023. The plan calls for the utilization of Medicare benchmarks across services, where available; review and update of methodologies and rates on a regular schedule; and continued movement away from cost-based methodologies and toward value-based payments.
    • New Mexico is currently conducting a Provider Rate Benchmarking Study to further the goals of ensuring access to high-quality care for its members; attracting and retaining providers; and establishing a methodology, process, and schedule for conducting routine rate reviews.
    • South Carolina reported that it is currently conducting rate analyses for several services that could result in additional rate increase recommendations in FY 2023.

    States reported rate increases for nursing facilities and home and community-based services (HCBS) providers more often than other provider categories (Figure 12). In some cases, state officials reported that nursing facility and HCBS rate increases included, at least in part, the continuation of pandemic-related payments (e.g., retainer payments and/or add-on payments) or represent temporary rate increases or supplemental payments to HCBS providers using ARPA funds. Some states noted that certain rate increases would be difficult to sustain without continuation of enhanced federal funding. Reflecting the ongoing staffing-related challenges impacting nursing facility and HCBS services, several states reported more significant nursing facility or HCBS rate increases. Examples of HCBS rate increases include the following:

    • The District of Columbia reported that, beginning in FY 2023, the District will begin to issue a supplemental payment to qualifying HCBS providers to support increased wages for qualifying Direct Support Professionals (DSPs) to achieve an average wage rate of 117.6% of the District’s living/minimum wage by FY 2025. This supplemental payment aims to assist in the effort of maintaining the direct support workforce to ensure continuity of care.
    • Oklahoma reported making a temporary 20% retroactive rate increase in FY 2022 for HCBS services paid during most of the PHE period and a 25% permanent rate increase for providers in its Advantage HCBS waiver (for frail seniors and adults with physical disabilities) effective October 1, 2022, or upon CMS approval.
    • West Virginia reported a temporary 50% HCBS rate increase to improve retention in FY 2022 and a permanent 5% HCBS rate increase in FY 2023.

    Examples of nursing facility rate increases include the following:

    • Illinois reported a 27% nursing facility rate increase in FY 2023 to fund the recently enacted nursing home reform legislation that ties increased funding to staffing levels, creates a new pay scale for certified nursing assistants, and provides funding for improvement in key quality metrics.
    • Nebraska reported a 20.2% nursing facility rate increase in FY 2023 intended to address the ongoing issue of facility closures in rural and frontier areas where the population is declining.
    • Pennsylvania will increase Medicaid nursing facility rates by 17.5% in FY 2023 to increase staffing and accountability requirements, an increase described as the “single largest Medicaid reimbursement bump for nursing home resident care during a single Pennsylvania budget-cycle in the modern reimbursement era” by the Pennsylvania Health Care Association President.106 

    The 2022 survey found an increased focus on dental rates with about half of reporting states (20 in FY 2022 and 25 in FY 2023) reporting implementing or plans to implement a dental rate increase, in some cases benchmarked to the American Dental Association national fee survey. This compares to 14 states reporting increases each year in the 2019, 2020, and 2021 surveys.107  Most notably, Virginia reported plans to increase dental rates by 30% in FY 2023; Washington increased rates for adult dental services by 100% in FY 2022 and plans to increase rates for specific children’s dental services in FY 2022; and Wisconsin increased dental rates by 40% as of January 2022.

    While states reported imposing more restrictions on inpatient hospital and nursing facility rates than on other provider types, most of these restrictions were rate freezes rather than actual reductions. (Because inpatient hospital and nursing facility services are more likely to receive routine cost-of-living adjustments than other provider types, this report counts rate freezes for these providers as restrictions.) No states reported legislative action to freeze or reduce rates across all or most provider categories in either FY 2022 or FY 2023. Mississippi indicated the legislative rate freeze enacted for all providers for FY 2022 through FY 2024 was lifted by the legislature before the end of 2022.

    FFS Provider Rate Changes Implemented in FY 2022 and Adopted for FY 2023

    Provider Taxes

    States continue to rely on provider taxes and fees to fund a portion of the non-federal share of Medicaid costs (Figure 13). Provider taxes are an integral source of Medicaid financing, comprising approximately 17% of the nonfederal share of total Medicaid payments in FY 2018 according to the Government Accountability Office (GAO).108  At the beginning of FY 2003, 21 states had at least one provider tax in place. Over the next decade, most states imposed new taxes or fees and increased existing tax rates and fees to raise revenue to support Medicaid. By FY 2013, all but one state (Alaska) had at least one provider tax or fee in place. In this year’s survey, states reported a continued reliance on provider taxes and fees to fund a portion of the non-federal share of Medicaid costs. Thirty-eight states had three or more provider taxes in place in FY 2022 and eight other states had two provider taxes in place (Figure 13).109 

    States with Provider Taxes or Fees in Place in FY 2022

    Few states made or are making significant changes to their provider tax structure in FY 2022 or FY 2023 (Table 5). The most common Medicaid provider taxes in place in FY 2022 were taxes on nursing facilities (46 states), followed by taxes on hospitals (44 states), intermediate care facilities for individuals with intellectual disabilities (33 states), and MCOs110  (18 states). Only three states reported plans to add new taxes in FY 2023: Alabama, Mississippi, and Wyoming reported new ambulance taxes. Taxes on ambulance providers represent the most common type of “other” taxes implemented by states, and the new taxes planned for FY 2023 will increase the number of states with ambulance taxes in FY 2023 to 13.111  Only one state (California) reported plans to eliminate a tax in FY 2023 (MCO tax is slated to expire on December 31, 2022). Eleven states reported planned increases to one or more provider taxes in FY 2023, while seven states reported planned decreases.112 

    FFS Provider Rates Changes in all 50 States and DC, FY 2022
    FFS Provider Rates Changes in all 50 States and DC, FY 2023


    Provider Taxes in Place in all 50 States and DC, FY 2022 and FY 2023

    Pharmacy

    Context

    States may administer the Medicaid pharmacy benefit on their own or may contract out one or more functions to other parties. The administration of the pharmacy benefit has evolved over time to include delivery of these benefits through managed care organizations (MCOs) and increased reliance on pharmacy benefit managers (PBMs). PBMs may perform a variety of administrative and clinical services for Medicaid programs (e.g., negotiating rebates with drug manufacturers, adjudicating claims, monitoring utilization, overseeing preferred drug lists (PDLs), etc.) and are used in fee-for-service (FFS) and managed care settings. MCO subcontracts with PBMs are under increasing scrutiny as more states recognize a need for transparency and stringent oversight of the arrangements.

    Managing the Medicaid prescription drug benefit and pharmacy expenditures is a policy priority for state Medicaid programs. Despite remaining stable from 2015 to 2019, net Medicaid spending on prescription drugs increased in 2020. At the same time, Medicaid prescription drug utilization declined in 2020, reflecting the impact of the COVID-19 pandemic on prescription drug patterns. Because state Medicaid programs are required under the Medicaid Drug Rebate Program (MDRP) to cover all FDA-approved drugs from manufacturers that have entered into a federal rebate agreement (in both managed care and FFS settings), states cannot limit the scope of covered drugs to control drug costs. Instead, states use an array of payment strategies and utilization controls to manage pharmacy expenditures, including PDLs, managed care pharmacy carve-outs, and multi-state purchasing pools. States update and expand cost containment strategies in response to changes in the pharmaceutical marketplace, continuously innovating to address pressures such as rising unit prices and the introduction of new “blockbuster” drugs.113  Certain policies traditionally implemented under the pharmacy benefit are being adopted under the medical benefit to better manage the cost and utilization of expensive, physician administered drugs. Some states are also using alternative payment methods to increase supplemental rebates through value-based arrangements (VBAs) negotiated with individual pharmaceutical manufacturers.

    The recent passage of the Inflation Reduction Act included a number of prescription drug reforms that primarily apply to Medicare; however, some of the provisions interact with the MDRP and are expected to increase Medicaid prescription drug spending in the coming years.114  There remain an array of other federal and state policy drug pricing proposals that address rising Medicaid prescription drug spending and generate federal or state savings. These proposals could be included in future budget reconciliation bills and include provisions that increase Medicaid drug rebates, increase price transparency, and target drug prices.

    This section provides information about:

    • Managed care’s role in administering pharmacy benefits
    • Pharmacy cost containment

    Findings

    Managed Care’s Role in Administering Pharmacy Benefits

    Most states that contract with MCOs carve in Medicaid pharmacy benefits to MCO contracts, but some states “carve out” prescription drug coverage from managed care. While the vast majority of states that contract with MCOs report that the pharmacy benefit is carved in to managed care (34 out of 41 states that contract with MCOs115 ), six states (California, Missouri, North Dakota, Tennessee, Wisconsin, and West Virginia) report that pharmacy benefits are carved out of MCO contracts as of July 1, 2022 (Figure 14). As of January 1, 2022, California carved the pharmacy benefit out of managed care, becoming the latest state to implement a full pharmacy carve out. Two states report plans to carve out pharmacy from MCO contracts in FY 2023 or later (New York and Ohio116 ), with the original implementation date having been delayed in New York.117  Instead of implementing a traditional carve-out of pharmacy from managed care, in FY 2022, Kentucky began contracting with a single PBM for the managed care population. Under this “hybrid” model, MCOs remain at risk for the pharmacy benefit but must contract with the state’s PBM to process pharmacy claims and pharmacy prior authorizations according to a single formulary and PDL.118  Louisiana and Mississippi119  report that they are moving to a similar model in FY 2023 and FY 2024, respectively, and will require MCOs to contract with a single PBM designated by the state.

    State Coverage of Pharmacy Benefits in MCO Contracts as of July 1, 2022

    The majority of states that contract with MCOs report targeted carve-outs of one or more drugs or drug classes. As of July 1, 2022, 18 of 39 responding states that contract with MCOs report carving out one or more drug classes from MCO capitation payments (Exhibit 7). These targeted drug carve-outs can include drugs covered under the pharmacy benefit or the medical benefit. Some of the most commonly carved out drugs include hemophilia products, spinal muscular atrophy agents, Hepatitis C drugs, and behavioral health drugs such as psychotropic medications. States may use targeted drug carve-outs as part of MCO risk mitigation strategies or for other reasons, including beneficiary protection.

    Exhibit 7: Drug Classes Carved Out of MCO Benefits as of July 1, 2022

    Cost Containment and Other Pharmacy Initiatives

    A number of states report laying the groundwork to employ value-based arrangements (VBAs) with pharmaceutical manufacturers as a way to control pharmacy costs. However, only a handful of states have active VBA agreements in place. As of July 1, 2022, seven states have VBAs in place with one or more drug manufacturers (Alabama, Arizona, Colorado, Massachusetts, Michigan, Oklahoma, and Washington), an increase of one state (Colorado) from last year. Most states with VBAs in place also reported plans to expand VBA efforts in FY 2023.120  Drugs covered by the VBAs include but are not limited to Entresto (chronic heart failure), Zolgensma (spinal muscular atrophy), Onpattro (tansthretin-mediated amyloidosis), Givlaari (acute hepatic porphyria), Stelara (psoriasis), re-SET (SUD digital therapeutic), Sublocade (SUD), and hepatitis C treatments. Sixteen additional states121  are considering opportunities or are developing and executing plans to implement a VBA arrangement in FY 2023 or later. Of those states, six122  are considering, or planning to take advantage of, VBAs that are offered by manufacturers to all states under a recently enacted federal rule. At the time of the survey, however, no national-level VBA arrangements were available.123 

    More than half of responding states reported newly implementing or expanding at least one initiative to contain prescription drug costs in FY 2022 or FY 2023. On this year’s survey, we asked states to describe any new or expanded pharmacy program cost containment strategies implemented in FY 2022 or planned for FY 2023, including initiatives to address PBM spread pricing. We asked states to exclude routine updates, such as to PDLs or state maximum allowable cost programs, as these utilization management strategies are employed by states regularly and are not typically considered major new or expanded policy initiatives. As in prior years, states reported imposition of new prior authorization policies (for specialty drugs in particular), utilization management controls, quantity limits, and rebate maximization generally. Among states that reported newly implementing or expanding at least one cost containment initiative, one-fifth124  reported new or expanded pharmacy cost containment initiatives targeted to physician administered drugs.125  A handful of states reported plans to newly cover or expand coverage of diabetic supplies, durable medical equipment (DME), and other non-drug products under the pharmacy benefit, which can improve access and contain costs. Other cost containment policy changes reported in FY 2022 and FY 2023 include:

    • Uniform PDLs. Uniform PDLs help states maximize supplemental rebates by covering drugs administered under both the FFS and managed care delivery system. They also streamline pharmacy benefit coverage for members and providers. Kentucky (through its hybrid model for pharmacy benefit administration), Massachusetts, Michigan, and Washington reported expanding uniform PDL policies for at least a subset of drugs as a cost containment initiative in FY 2022 or FY 2023. Indiana plans to implement a uniform PDL by July 1, 2023.
    • Pharmacy Reimbursement. Aside from VBAs, three states (Missouri, Maine, and Kansas) reported revising pharmacy reimbursement policy to reduce program costs. Kansas transitioned specialty drugs for managed care populations to fall under the “lesser of” reimbursement methodology set by the state instead of MCO pricing and expanded this approach in FY 2022. Maine reported plans to significantly revise their state maximum allowable cost program beginning in FY 2023.
    • Extending Covered Days’ Supply. Extending covered days’ supply has the potential to improve medication compliance for chronic conditions, as well as reduce aggregate pharmacy dispensing fees. Two states (Alaska and West Virginia) reported new and expanded policies for 90-day fills of certain medications as a cost containment policy change in FY 2022 and/or FY 2023.
    • Prescriber Resources and Tools. In both FY 2022 and FY 2023, Oklahoma reported expanding its academic detailing program as a cost containment policy that also improves prescribing practices and encourages use of evidence-based guidelines through provider outreach and education. Oregon reported updating its dose optimization system as a new cost containment initiative in FY 2022 that will also better support prescribers.

    Many states reported reforms aimed at spread pricing and the role of PBMs in administering Medicaid pharmacy benefits, either as a new or expanded cost containment action or as a separate but notable pharmacy initiative recently implemented or under development. Six states reported recently implemented or planned policies to prohibit spread pricing126  or require pass through pricing in MCO contracts with PBMs.127  Other states address spread pricing concerns in alternative ways. For example, North Carolina reported that its MCOs cannot include the expenses related to spread pricing in the numerator of the medical loss ratio (MLR) calculation. This disincentive lowers the MLR for MCOs with spread pricing arrangements, putting the MCOs at risk of having to pay back capitation received in amounts over the MLR target. Additional PBM-related policies reported by states in this year’s survey include increased transparency and oversight, limits on additional fees paid by MCOs to PBMs or charged to pharmacies, and restricting PBM claw back procedures.

    Recent state pharmacy initiatives most frequently cited as having a big impact on cost and administration include managed care drug carve outs and uniform PDLs, restrictions on spread pricing and related PBM reforms, and VBAs. On this year’s survey, we asked states to highlight recently implemented or planned initiatives expected to have the biggest impact on improving pharmacy benefit administration, addressing rising drug costs and emerging gene and cell therapies, or enhancing the value of the Medicaid pharmacy benefit. States highlighted a range of initiatives, some of which overlap with specific cost containment policy changes described above. Four states reported planned or recently implemented strategies to address rising costs associated with gene and cell therapy, including expanded prior authorization requirements and leveraging the National Medicaid Pooling Initiative (NMPI) for supplemental rebates.128  A couple states are reviewing reimbursement options for inpatient drugs like gene and cell therapies, including carve outs from the inpatient bundle which allows for rebates under the MDRP. Ohio is carving out the pharmacy benefit from managed care contracts and will contract with a single PBM instead, beginning in October 2022. It is also contracting with a Pharmacy Pricing and Audit Consultant (PPAC) who will provide operational and consulting support in the areas of pharmacy reimbursement, benefit design, oversight, and auditing of the PBM. Massachusetts and Wyoming have implemented, or are in the process of implementing, mandatory 90-day fill policies for maintenance medications.

    Future Outlook: Key Opportunities, Challenges, And Priorities In Fy 2023 And Beyond And Conclusion

    The COVID-19 pandemic public health emergency, in place for more than two and half years at the time of this report, has had profound impacts on the ongoing operations and priorities of state Medicaid programs, including accelerating some priorities but delaying others. One director noted that while the pandemic did not fundamentally change program priorities, it did give the state a new lens to view many longstanding issues (e.g., equity, behavioral health, telehealth). Another state official observed that there have been at least three pandemic phases that presented differing challenges:

    1. The initial shutdown phase when states took urgent steps to shore up providers and preserve access by implementing emergency authorities and flexibility measures,
    2. A second phase where states worked with providers and stakeholders to implement policies and initiatives to promote COVID-19 vaccinations, and
    3. A third phase requiring states to prepare and plan for the eventual unwinding of PHE emergency authorities, with some unwinding efforts already completed or underway.

    The progression from each of these phases to the next has not been linear due to waves of new COVID-19 variants. States are now anticipating a fourth pandemic phase – an “endemic reality” – requiring states to consider how to operate going forward with a continued emphasis on vaccine access, but also recognizing the significant pandemic-related impacts on members’ health and wellbeing and on health care providers and the health care workforce.

    COVID-19 Opportunities and Challenges

    During survey interviews and in their written responses, state Medicaid officials identified lessons learned from the pandemic as opportunities. One director commented that the pandemic had pushed the state “in ways that did not seem possible before.” COVID-19 opportunities identified include expanded access for enrollees via telehealth, improved relationships with providers and other stakeholders, and data collection improvements:

    • Telehealth. States commented on the pandemic-related expansion of telehealth, referred to as the “silver lining of the pandemic” by one official. Others reported that the pandemic had demonstrated the value of telehealth, overcoming, in some cases, prior cost and quality concerns. Looking ahead, states are weighing the expanded access that telehealth brings—especially for behavioral health services and in rural areas—against quality and other concerns.
    • Coordination and Collaboration. States noted that the pandemic had demonstrated the capacity of state Medicaid programs to be “nimble,” rapidly responding to urgent needs. Several states commented on improved relationships and engagement with enrollees, providers, plans, and/or other state and federal agencies that had resulted from response efforts initiated during the pandemic.
    • Data Improvements. A handful of states mentioned that the pandemic had highlighted the importance of obtaining better and more timely data and using data analytics to inform decision making, including data related to COVID-19 and other public health data. States also highlighted that improved data collection and stratification would help to identify and address health disparities by race/ethnicity and/or other factors.

    States also commented on challenges related to planning and preparing for the COVID-19 PHE unwinding and associated with entering the “endemic reality” phase of the pandemic:

    • Unwinding Challenges. States identified the resumption of redeterminations at the end of the PHE as an enormous upcoming challenge that will require a “surge” of administrative resources for states and county agencies including staff as well as training and systems changes. A number of states commented on their goals to minimize coverage losses when the PHE ends, including one state that expressed concerns about poor health outcomes if individuals needing mental health services or postpartum care were to lose coverage. Officials noted they were focused on efforts to communicate with members about the need to update contact information as well as on efforts to coordinate with a range of partners (e.g., MCOs, providers, etc.) to help enrollees navigate renewals and prevent coverage loss for procedural reasons. Some states also commented on efforts to coordinate with state-based Marketplaces to promote other coverage for persons determined no longer eligible for Medicaid. Several states noted that the uncertain timing of the PHE end has made it very difficult to plan and communicate with members and other partners. Finally, several states noted that the end of the Families First Coronavirus Response Act (FFCRA) enhanced federal Medicaid match before all redeterminations are completed would be challenging.
    • Expiration of Emergency Authorities. Several states commented on challenges related to the expiration of HCBS waiver emergency authorities including, for example, emergency waivers related to HCBS reimbursement policies, payments to family caregivers, and service setting requirements. A few states commented on challenges related to provider impacts such as the end of emergency credentialing and provider enrollment authorities and the reinstitution of prior authorization and concurrent review requirements. Identifying and “noticing” all impacted providers regarding the end of Medicaid flexibilities will require significant administrative capacity. For example, one state referenced preparations for unwinding over 40 administrative programmatic flexibilities while another state referenced over 100 authorities that have been granted during the PHE. Emergency flexibilities adopted during the PHE will need to be part of unwinding or transitioned to permanent authority (which will require coordination with CMS).
    • Lasting Focus on COVID-19. Even after unwinding emergency authorities and resuming normal eligibility operations, the effects of COVID-19 will continue. For example, states remain focused on COVID-19 vaccinations and are also wrestling with program implications and challenges associated with long-COVID as well as decreased utilization of preventive care services. Responding to the COVID-19 pandemic has also highlighted the importance of additional efforts to ensure future emergency preparedness.

    Future Priorities Shaped by COVID-19 and Beyond

    Many states noted that the COVID-19 pandemic has shaped their Medicaid priorities. States also reported a renewed focus on priorities in place prior to the pandemic.

    • Health Equity. States are focused on addressing health inequities and disparities that the pandemic exposed and often exacerbated. Several states noted that while health equity had been a priority before, the pandemic helped to “move the needle” and allow for difficult conversations to take place. States described aims to embed health equity throughout policies and programs, including as part of Section 1115 demonstration waivers or as a central focus of new managed care contracts or managed care procurement efforts. States are also helping to advance equity in more targeted ways including, for example, one state that commented on using morbidity and mortality disparity data to inform its nursing facility rate reform efforts.
    • Specific Populations or Service Categories. States identified access and outcomes for a number of specific populations or service categories as top priorities:
    • Behavioral Health. In light of the pandemic’s adverse effects on behavioral health conditions, states are developing new initiatives in this area and accelerating attention to initiatives already underway. For example, states are focusing on integrating care, working with justice-involved populations, incorporating behavioral health into managed care contracts, and expanding crisis response capacity and mobile crisis services. Given that children’s mental health challenges were on the rise even before COVID-19 and may have worsened during the pandemic, many states are targeting children’s behavioral health care, such as by expanding school-based mental health care. In general, some Medicaid behavioral health initiatives are part of comprehensive statewide behavioral health transformations, which may include but extend beyond Medicaid programs.
    • Long-term Services and Supports (LTSS). The disproportionate share of COVID-19 deaths in nursing facilities and enhanced HCBS funding made available in the 2021 American Rescue Plan Act (ARPA) catalyzed state efforts to improve HCBS access. In addition to using ARPA funds to improve HCBS direct care worker pay, states employed a variety of emergency authorities designed to expand HCBS, maintain eligibility, and secure financing for LTSS providers. Several states mentioned ongoing initiatives to redesign HCBS waivers, sometimes citing specific attention to rates, quality, or infrastructure. Other states mentioned LTSS priorities related to nursing facility rate reform, implementation of LTSS managed care, and expanding HCBS enrollment, including through nursing facility diversion or deinstitutionalization efforts.
    • Maternal and Child Health. A number of states identified maternal and child health initiatives as key ongoing priorities. Many states have newly adopted and implemented the ARPA 12-month postpartum coverage option but are also expanding services for pregnant women, such as coverage of doulas. Some of these initiatives are directly tied to addressing disparities in maternal health. In the wake of the Supreme Court decision to overturn Roe vs. Wade, one state mentioned “identifying and acting on opportunities to support reproductive rights” as a priority. States also report plans to focus on pandemic-related impacts on preventive care for children, especially efforts to improve childhood immunization rates that declined during the pandemic.
    • Workforce. States are prioritizing addressing health care workforce challenges that were created or exacerbated by the pandemic, especially related to behavioral health and HCBS providers. In many cases, these challenges are driving states to reconsider provider rate-setting policies and implement initiatives (often ARPA-funded) to meet the demand for behavioral health and HCBS, including for example, through rate increases, recruitment and retention bonuses, and training and career development initiatives. A number of states also pointed to specific initiatives to improve access through the use of community health workers and doulas or by modifying provider qualification requirements. While there has been a focus on the pandemic’s impact on the health care workforce, many officials noted that state agency staff have also been strained, fatigued, and burned out from constantly shifting gears and operating in “emergency response” mode.
    • Payment and Delivery System Initiatives and Operations. Although the pandemic may have delayed value-based purchasing initiatives in some states, several states reported working to reinitiate or advance these priorities. In addition, some states are focused on payment system reform including reviews and restructuring of payment rates and methods. Many states that contract with managed care plans point to MCO procurements as a major upcoming priority. Managed care contracts are often extensive and sophisticated and represent very large dollar value contracts for states. Some states are focused on integration of services under managed care contracts (e.g., carving in behavioral health services) while other states are taking action to carve out certain services from managed care contracts (e.g., pharmacy benefits). North Carolina and Oklahoma are transitioning to managed care amid competing pandemic-related priorities.
    • IT System Modernization. Nearly one-third of responding states reported prioritizing IT systems projects, predominately reprocurements, implementations, or modernizations of Medicaid Enterprise Systems. These vital systems are used for claims and encounter processing, but also support other program objectives related to delivery system reform and value-based purchasing, quality improvement, provider and MCO monitoring, and cost control strategies.
    • Addressing SDOH to Improve Health Outcomes. States recognize that social determinants of health are major contributors to overall health and drivers of health equity. States are therefore working to leverage Medicaid to help address these needs, including housing, through demonstration waivers, MCO contracts, and other state-driven initiatives.

    Conclusion

    States completed this survey in mid-summer of 2022, as COVID-19 deaths were rising after a low in April 2022, due to the highly transmissible Omicron variant, waning vaccine immunity, and relatively low booster uptake. States were continuing to respond to ongoing and emerging pandemic-related health concerns such as the need to improve utilization of preventive care services in addition to the ongoing need to focus on vaccines and boosters. At the same time, states are preparing for the challenges tied to the end of the PHE including the unwinding of continuous coverage and emergency authorities. As states anticipate a new “endemic reality” phase of the pandemic, they report that COVID-19 has presented both new opportunities and challenges and has also shifted and shaped ongoing Medicaid priorities. Looking ahead, states remain focused on developing and evaluating telehealth policy, addressing health equity, improving access and outcomes for specific populations and service categories, addressing workforce shortages, and improving data and IT systems to inform all these efforts. In many states, Medicaid policy may be informed by the outcome of gubernatorial elections in November 2022. The Biden Administration may also shape Medicaid policy, including by promoting Section 1115 demonstration waivers that align with administrative priorities and through administrative rulemaking. Even as pandemic, economic, and political landscapes shift, Medicaid has and will continue to serve a large share of Americans, providing comprehensive health coverage and long-term care that are likely to remain key aspects of pandemic response and recovery.

    Methods

    KFF commissioned Health Management Associates (HMA) to survey Medicaid directors in all 50 states and the District of Columbia to identify and track trends in Medicaid spending, enrollment, and policy making. This is the 22nd annual survey, each conducted at the beginning of the state fiscal year (FY) from FY 2002 through FY 2023. Additionally, ten mid-fiscal year surveys were conducted during state fiscal years 2002-2004, 2009-2013, 2021, and 2022 when a large share of states were considering mid-year Medicaid policy changes due to state budget and revenue shortfalls and/or the COVID-19 pandemic. Findings from previous surveys are referenced in this report when they help to highlight current trends. Archived copies of past reports are available on the following page.

    The KFF/HMA Medicaid survey on which this report is based was sent to state Medicaid directors in June 2022. The survey instrument (in Appendix) was designed to document policy actions in place in FY 2022 and implemented or planned for FY 2023 (which began for most states on July 1, 2022).129  The survey captures information consistent with previous surveys, particularly for provider payment rates, benefits, and managed care, to provide some trend information. Each year, questions are added or revised to address current issues.

    Medicaid directors and staff provided data for this report in response to a written survey and a follow-up telephone interview. Overall, 49 states responded in mid-summer of 2022, though response rates for specific questions varied.130  Forty-eight states participated in a follow-up telephone interview, conducted between July and September 2022.131  The telephone discussions are an important part of the survey to ensure complete and accurate responses and to record additional context for and complexities of state actions.

    The survey does not attempt to catalog all Medicaid policies in place for each state. This report highlights certain policies in place in state Medicaid programs in FY 2022 and policy changes implemented or planned for FY 2023. Experience has shown that adopted policies are sometimes delayed or not implemented for reasons related to legal, fiscal, administrative, systems, or political considerations, or due to delays in approval from CMS. Policy changes under consideration without a definite decision to implement are not included in the survey. States completed this survey in mid-summer of 2022, as COVID-19 deaths started to rise after a low in April 2022, due to the highly transmissible Omicron variant, waning vaccine immunity, and relatively low booster uptake. Given differences in the financing structure of their programs, the U.S. territories were not included in this analysis.

    Appendix

    Survey Instrument

    Download the Survey (.pdf)

    Endnotes

    1. FMAP = Federal Medicaid Assistance Percentage. ↩︎
    2. State fiscal years begin on July 1 except for these states: New York on April 1; Texas on September 1; Alabama, Michigan, and District of Columbia on October 1. ↩︎
    3. Arkansas and Georgia did not respond to the 2022 survey. In some instances, we used publicly available data or prior years’ survey responses to obtain information for these states. However, unless otherwise noted, these states are not included in counts throughout the survey. ↩︎
    4. Centers for Medicare & Medicaid Services (CMS), National Health Expenditure Data Fact Sheet: Table 4, National Health Expenditures by Source of Funds and Type of Expenditure: Calendar Years 2011-2018 (CMS, March 2020), https://www.cms.gov/Research-Statistics-Data-and-Systems/Statistics-Trends-and-Reports/NationalHealthExpendData/NHE-Fact-Sheet.html. ↩︎
    5. States must provide continuous coverage to Medicaid enrollees until the end of the month in which the PHE ends to receive enhanced federal funding. ↩︎
    6. Arkansas and Georgia did not respond to the 2022 survey. In some instances, we used publicly available data or prior years’ survey responses to obtain information for these states. However, unless otherwise noted, these states are not included in counts throughout the survey. Among responding states, one state (Texas) did not participate in a follow-up telephone interview. ↩︎
    7. State fiscal years begin on July 1 except for these states: New York on April 1; Texas on September 1; Alabama, District of Columbia, and Michigan on October 1. ↩︎
    8. Center for Health Care Strategies, Medicaid Accountable Care Organizations: State Update, (Hamilton, NJ: Center for Health Care Strategies, February 2018), https://www.chcs.org/media/ACO-Fact-Sheet-02-27-2018-1.pdf ↩︎
    9. Michael Wilson et al., “The impacts of accountable care organizations on patient experience, health outcomes, and cost: a rapid review,” Journal of Health Services Research & Policy 25 no. 2 (April 2020): 130-138, https://journals.sagepub.com/doi/full/10.1177/1355819620913141 ↩︎
    10. Office of the Assistant Secretary for Planning and Evaluation (ASPE), Evaluation of the Medicaid Health Home Option for Beneficiaries with Chronic Conditions: Evaluation of Outcomes of Selected Health Home Programs Annual Report - Year Five, (Washington, DC: Office of the Assistant Secretary for Planning and Evaluation, May 2017), https://aspe.hhs.gov/basic-report/evaluation-medicaid-health-home-option-beneficiaries-chronic-conditions-evaluation-outcomes-selected-health-home-programs-annual-report-year-five ↩︎
    11. Office of the Assistant Secretary for Planning and Evaluation (ASPE), Report to Congress on the Medicaid Health Home State Plan Option, (Washington, DC: Office of the Assistant Secretary for Planning and Evaluation, May 2018), https://www.medicaid.gov/state-resource-center/medicaid-state-technical-assistance/health-home-information-resource-center/downloads/medicaidhomehealthstateplanoptionrtc.pdf ↩︎
    12. Kevin Grumbach, Thomas Bodenheimer, and Paul Grundy, “The Outcomes of Implementing Patient-Centered Medical Home Interventions: A Review of the Evidence on Quality, Access and Cost from Recent Prospective Evaluation Studies, August 2009,” (Washington DC: Patient-Centered Primary Care Collaborative, August 2009), https://pcmh.ahrq.gov/sites/default/files/attachments/The%20Outcomes%20of%20Implementing%20 Patient-Centered%20Medical%20Home%20Interventions.pdf ↩︎
    13. Connecticut does not have capitated managed care arrangements, but does carry out many managed care functions through ASO arrangements that include payment incentives based on performance, intensive care management, community workers, educators, and linkages with primary care practices. ↩︎
    14. Vermont runs a public, non-risk bearing prepaid health plan delivery model under its Section 1115 Global Commitment to Health waiver. ↩︎
    15. Idaho’s Medicaid-Medicare Coordinated Plan has been recategorized by CMS as an MCO but is not counted here as such since it is secondary to Medicare. Publicly available data used to verify status of two states that did not respond to the 2022 survey (Arkansas and Georgia). ↩︎
    16. Includes the Arizona Indian Medical Home Program, conducted under PCCM authority and in place since 2017, that was not counted in prior year reports as a PCCM program. ↩︎
    17. For purposes of this report, states contracting with “PCCM entities” are also counted as offering a PCCM program. In addition to furnishing basic PCCM services, PCCM entities also provide other services such as intensive case management, provider contracting or oversight, enrollee outreach, and/or performance measurement and quality improvement. 42 CFR §438.2. ↩︎
    18. Oklahoma Health Care Authority, “OHCA to Transition to New Health Care Model News Release,” May 26, 2022: https://oklahoma.gov/ohca/about/newsroom/2022/may/ohca-to-transition-to-new-health-care-model.html ↩︎
    19. A previously planned managed care transition was struck down, in June 2021, by the Oklahoma Supreme Court which ruled that the Oklahoma Health Care Authority did not have the authority to implement the program without legislative approval. ↩︎
    20. For purposes of this report, the following two states are not counted here as PCCM states: Connecticut uses PCCM authority to reimburse medical home-related costs and South Carolina uses PCCM authority to provide care management services to medically complex children. ↩︎
    21. Arkansas did not respond to the 2022 survey. Therefore, its dental services PHP status was confirmed via publicly available data. ↩︎
    22. Mississippi reported a total MCO penetration rate of 46.2% in the 2022 survey compared to 99.4% in the 2021 survey (and 76.3% in the 2020 survey), noting that to contain costs during the pandemic, MCO enrollees with no utilization were shifted to FFS unless they elected to stay enrolled with an MCO. ↩︎
    23. In order of Medicaid enrollment size, the 10 states are: California, New York, Texas, Florida, Pennsylvania, Illinois, Ohio, Michigan, Arizona, and Georgia. Centers for Medicare and Medicaid Services (CMS), “Medicaid & CHIP Monthly Application, Eligibility Determinations, and Enrollment Reports,” last updated August 2022, https://www.medicaid.gov/medicaid/program-information/medicaid-and-chip-enrollment-data/monthly-reports/index.html ↩︎
    24. For this section regarding MCO penetration rates, 2021 survey data were used for the two states that did not respond to the 2022 survey (Arkansas and Georgia) and for two states (North Carolina and Virginia) that did not provide complete data for the MCO penetration rate question. Also, data for Washington is based on our own calculations using July 2022 data reported on the Apple Health Client Eligibility dashboard. ↩︎
    25. NC Medicaid, “Fact Sheet: Standard Plan Overview, County Playbook: Medicaid Managed Care,” November 15, 2021, https://medicaid.ncdhhs.gov/media/10407/download?attachment ↩︎
    26. NC Medicaid, “Enrollment Overview Dashboard,” accessed October 12, 2022, https://medicaid.ncdhhs.gov/reports/dashboards#enroll ↩︎
    27. NC Medicaid, “Tailored Plan Information for Beneficiaries, Five Things You Need to Know About North Carolina’s Behavioral Health and Intellectual/Developmental Disability (I/DD) Tailored Plans,”  https://medicaid.ncdhhs.gov/media/10862/download?attachment ↩︎
    28. In FY 2022, California will transition several non-dual-eligible populations into mandatory managed care, including individuals in the following aid categories: Trafficking and Crime Victims Assistance Program; accelerated enrollment; Child Health and Disability Prevention infant deeming; Pregnancy-related Medi-Cal (Pregnant Women only, 138–213 percent of the federal poverty level (FPL)), beneficiaries with other health coverage and those residing in certain formerly excluded rural zip codes. ↩︎
    29. California Department of Health Care Services, “Section 1915(b) Waiver Proposal for California Advancing and Innovating Medi-Cal (CalAIM),” updated December 16, 2021 with technical corrections incorporated January 2022, https://www.medicaid.gov/medicaid/section-1115-demonstrations/downloads/ca-17-apprvd-app.pdf ↩︎
    30. Dual-eligible beneficiaries in the seven Coordinated Care Initiative (CCI) counties (Los Angeles, Orange, Riverside, San Bernardino, San Diego, San Mateo, Santa Clara) participating in California’s Financial Alignment Demonstration and the County Organized Health System counties are already required to enroll in managed care. ↩︎
    31. New York Department of Health, “Transition of Children placed in Foster care and NYS Public Health Law Article 29-I Health Facility Services into Medicaid Managed Care Effective July 1, 2021,” July 2021 presentation, https://www.health.ny.gov/health_care/medicaid/redesign/behavioral_health/children/docs/ foster_care_transition_overview_7_30_21.pdf ↩︎
    32. Missouri Department of Social Services, “News Release: DSS announces new Specialty Health Plan, awards contract to Home State Health,” June 2, 2022, https://dss.mo.gov/press/06-02-2022-new-specialty-health-plan.htm ↩︎
    33. Ohio Medicaid Managed Care, “OhioRISE (Resilience through Integrated Systems and Excellence),” https://managedcare.medicaid.ohio.gov/managed-care/ohiorise ↩︎
    34. California Department of Health Care Services, “​​​​CalAIM Long-Term Care Carve-In Transition,” upated October 17, 2022, https://www.dhcs.ca.gov/provgovpart/Pages/Long-Term-Care-Carve-In-Transition.aspx ↩︎
    35. Maine Department of Health and Human Services, “Primary Care Plus (PCPlus),” https://www.maine.gov/dhhs/oms/providers/value-based-purchasing/primary-care ↩︎
    36. NC Medicaid, “Fact Sheet: Eastern Band of Cherokee Indians Tribal Option Overview, County Playbook: NC Medicaid Managed Care,” December 21, 2021, https://medicaid.ncdhhs.gov/media/8154/download ↩︎
    37. Washington State Health Care Authority, “Primary care case management entities (PCCMe) State Plan Amendment,” https://www.hca.wa.gov/about-hca/who-we-are/tribal-relations/primary-care-case-management-entities-pccme-state-plan-amendment ↩︎
    38. The state intent of this change is to reduce member transitions between programs and gaps in case, simplify provider contracting and credentialing processes, and streamline the administration of the program. ↩︎
    39. Virginia Medicaid, “Cardinal Care: A Program for All Medicaid Members,” https://www.dmas.virginia.gov/for-members/cardinal-care/ Virginia Medicaid, “Cardinal Care Transition: What Providers Should Know,” https://www.dmas.virginia.gov/for-providers/cardinal-care-transition/ ↩︎
    40. Ohio Medicaid Managed Care, “PNM & Centralized Credentialing,” https://managedcare.medicaid.ohio.gov/managed-care/centralized-credentialing Ohio Medicaid Managed Care, “Fiscal Intermediary,” https://managedcare.medicaid.ohio.gov/managed-care/fiscal-intermediary ↩︎
    41. We asked states to indicate whether the following specified delivery system and payment reform initiatives were in place as of July 1, 2022: patient-centered medical home (PCMH); Health Home (under ACA section 2703); Accountable Care Organization (ACOs); episode of care; and all-payer claims database. ↩︎
    42. Arkansas and Georgia did not respond to the 2022 survey; 2021 survey data and publicly available data were used to identify delivery system and payment reform initiatives in place for these states. ↩︎
    43. Publicly available data was used to verify PCMH program of two states that did not respond to the 2022 survey (Arkansas and Georgia). ↩︎
    44. Building off the experience of Health Homes and California’s Whole Person Pilots, the goal of this new benefit is to bring a whole person focus to the care of certain high-need Medi-Cal beneficiaries, e.g., children/youth with complex physical, behavioral, developmental, and oral health needs, individuals who are homeless or at risk of homelessness, among other target populations, to address both their clinical and non-clinical needs. For more information, see: State of California – Health and Human Services Agency, CalAIM Enhanced Care Management Policy Guide, Sacramento, CA: State of California – Health and Human Services Agency, September 2021, https://www.dhcs.ca.gov/Documents/MCQMD/ECM-Policy-Guide-September-2021.pdf ↩︎
    45. The NCQA distinction in Multicultural Health Care is in the process of being updated to the more comprehensive Health Equity Accreditation. NCQA, “Current Multicultural Healthcare Customers,” https://www.ncqa.org/current-multicultural-healthcare-customers/ ↩︎
    46. Eighteen states reported “other” strategies to improve completeness of REL data: Alaska, Arizona, Colorado, Connecticut, Kansas, Louisiana, Maryland, Massachusetts, Minnesota, New Jersey, New Mexico, Ohio, Oklahoma, Oregon, Pennsylvania, South Carolina, Washington, and Wisconsin. ↩︎
    47. https://www.dhcs.ca.gov/services/Pages/DP-DPH-QIP.aspx ↩︎
    48. The NCQA distinction in Multicultural Health Care is in the process of being updated to the more comprehensive Health Equity Accreditation. NCQA, “Current Multicultural Healthcare Customers,” https://www.ncqa.org/current-multicultural-healthcare-customers/ ↩︎
    49. 42 C.F.R. Section 440.230(b). ↩︎
    50. American Rescue Plan Act of 2021, Pub. L. No. 117-2 (March 11, 2021), https://www.congress.gov/117/plaws/publ2/PLAW-117publ2.pdf ↩︎
    51. Bipartisan Safer Communities Act, Pub. L. No. 117-159 (June 25, 2022), https://www.congress.gov/117/plaws/publ159/PLAW-117publ159.pdf ↩︎
    52. Inflation Reduction Act of 2022, Pub. L. No. 117-169 (August 16, 2022), https://www.congress.gov/bill/117th-congress/house-bill/5376/text ↩︎
    53. National Suicide Hotline Designation Act of 2020, Pub. L. No. 116-172 (October 17, 2020), https://www.congress.gov/116/plaws/publ172/PLAW-116publ172.pdf ↩︎
    54. Consolidated Appropriations Act, 2021, Pub. L. No. 116-260 (December 27, 2020), https://www.congress.gov/116/plaws/publ260/PLAW-116publ260.pdf ↩︎
    55. In a few instances throughout this section, we rely on publicly available data (e.g. Section 1115 waiver documents or Medicaid State Plan Amendment documents) to supplement reported state benefit changes. ↩︎
    56. Three states reported addition of CCBHCs in FY 2022 or FY 2023: Kansas, New Mexico, and West Virginia. The Medicaid Certified Community Behavioral Health Center (CCBHC) Medicaid demonstration program aims to improve the availability and quality of ambulatory behavioral health services and to provide coordinated care across behavioral and physical health. CCBHCs provide a comprehensive range of nine types of services. The CCBHC demonstration program was first established by the Protecting Access to Medicare Act of 2014; more recently, the 2022 Bipartisan Safer Communities Act allocated funds for additional planning grants to states to participate in the demonstration. U.S. Department of Health and Human Services, Office of the Assistant Secretary for Planning and Evaluation and Office of Behavioral Health, Disability, and Aging Policy, Certified Community Behavioral Health Clinics Demonstration Program: Report to Congress, 2019 (U.S. Department of Health and Human Services, September 2020), https://aspe.hhs.gov/sites/default/files/migrated_legacy_files/196036/CCBHCRptCong19.pdf Protecting Access to Medicare Act of 2014, Pub. L. No. 113-93 (April 1, 2014), https://www.congress.gov/113/statute/STATUTE-128/STATUTE-128-Pg1040.pdf Bipartisan Safer Communities Act, Pub. L. No. 117-159 (June 25, 2022), https://www.congress.gov/117/plaws/publ159/PLAW-117publ159.pdf ↩︎
    57. Three states reported adoption of the CoCM model in FY 2022 or FY 2023: Illinois, Texas, and Wisconsin. Collaborative care models are evidence-based and generally include care coordination, care management, monitoring and treatment, and regularly scheduled psychiatric review and consultation for patients who do not show improvement. Jürgen Unützer et al.,  The Collaborative Care Model: An Approach for Integrating Physical and Mental Health Care in Medicaid Health Homes, (Center for Health Care Strategies and Mathematica Policy Research, May 2013): https://www.chcs.org/media/HH_IRC_Collaborative_Care_Model__052113_2.pdf American Psychiatric Association, “Learn About the Collaborative Care Model,” https://www.psychiatry.org/psychiatrists/practice/professional-interests/integrated-care/learn ↩︎
    58. The 10 states are: California, Colorado, Kansas, Maine, Maryland, Montana, Nevada, Ohio, Oregon, and South Carolina. The American Rescue Plan Act provided a new option for states to provide community-based mobile crisis intervention services, with 85% federal matching funds for these services for the first three years. On September 12, 2022, Oregon became the first state to receive CMS approval of this new Medicaid option. U.S. Department of Health and Human Services Press Office, “HHS Approves Nation’s First Medicaid Mobile Crisis Intervention Services Program, To Be Launched in Oregon,” September 12, 2022, https://www.hhs.gov/about/news/2022/09/12/hhs-approves-nations-first-medicaid-mobile-crisis-intervention-services-program-to-be-launched-in-oregon.html CMS, State Plan Amendment (SPA) OR 22-0012 (September 12, 2022), https://www.medicaid.gov/medicaid/spa/downloads/OR-22-0012.pdf ↩︎
    59. Wash. Admin. Code § 182-550-4550, https://casetext.com/regulation/washington-administrative-code/title-182-health-care-authority/washington-apple-health/chapter-182-550-hospital-services/section-182-550-4550-effective1012022administrative-day-rate-and-swing-bed-day-rate CMS, State Plan Amendment (SPA) WA-21-0032 (June 2, 2022), https://www.medicaid.gov/medicaid/spa/downloads/WA-21-0032.pdf ↩︎
    60. West Virginia Department of Health & Human Resources, “Pilot Program for Treatment for Pregnant and Postpartum Women Awarded to WV,” August 27, 2021, https://dhhr.wv.gov/News/2021/Pages/Pilot-Program-for-Treatment-for-Pregnant-and-Postpartum-Women-Awarded-to-WV.aspx CMS, State Plan Amendment (SPA) WV-22-0003 (September 7, 2022), https://www.medicaid.gov/medicaid/spa/downloads/WV-22-0003.pdf ↩︎
    61. The 7 states are: Arizona, Colorado, Illinois, Nebraska, New York, Ohio, and Utah. In addition, Louisiana began covering skin substitutes for chronic diabetic lower extremity ulcers (FY 2022) and Nevada plans to provide a limited dental benefit to adults with diabetes, if approved by CMS (FY 2023). ↩︎
    62. Federal financial participation is not available to state Medicaid programs for room and board except in certain medical institutions. Federal financial participation is generally available under certain housing-related supports and services that promote health and community integration. These include home accessibility modifications, one-time community transition costs, and housing tenancy supports. These depend on the individual’s disability and/or health status and are not used for generality utilities in the home. See: Centers for Medicare & Medicaid Services, Opportunities in Medicaid and CHIP to Address Social Determinants of Health (SDOH), Baltimore, MD: Department of Health and Human Services, January 2021, https://www.medicaid.gov/federal-policy-guidance/downloads/sho21001.pdf ↩︎
    63. The 12 states are: AZ, CA, CT, DC, ME, MA, NC, NH, OR, UT, WA, and WI. ↩︎
    64. The CalAIM demonstration and its various components are authorized under Section 1115, Section 1915(b), and through state plan amendments. ↩︎
    65. California Department of Health Care Services, Medi-Cal Community Supports, or In Lieu of Services (ILOS), Policy Guide (August 2022), https://www.dhcs.ca.gov/Documents/MCQMD/DHCS-Community-Supports-Policy-Guide.pdf Centers for Medicare and Medicaid Services, Letter to Jacey Cooper, Chief Deputy Director, Health Care Programs, California Department of Health Care Services, from Deputy Administrator and Director, Daniel Tsai (December 29, 2021), https://www.medicaid.gov/medicaid/section-1115-demonstrations/downloads/ca-calaim-ext-appvl-12292021.pdf ↩︎
    66. Centers for Medicare and Medicaid Services, Letter to Amanda Cassel Kraft, Assistant Secretary, MassHealth, from CMS Administrator, Chiquita Brooks-LaSure (September 28, 2022), https://www.medicaid.gov/medicaid/section-1115-demonstrations/downloads/ma-masshealth-ca1.pdf Centers for Medicare and Medicaid Services, Letter to Dana Hittle, Interim Medicaid Director, Oregon Health Authority, from CMS Administrator, Chiquita Brooks-LaSure (September 28, 2022), https://www.medicaid.gov/medicaid/section-1115-demonstrations/downloads/or-health-plan-09282022-ca.pdf Centers for Medicare and Medicaid Services, Letter to Jami Snyder, Director, Arizona Health Care Cost Containment System, from Deputy Administrator and Director, Daniel Tsai (October 14, 2022), https://www.medicaid.gov/medicaid/section-1115-demonstrations/downloads/az-hccc-ca-10142022.pdf ↩︎
    67. Connecticut Department of Social Services, “Connecticut Housing Engagement and Support Services (CHESS) Initiative,” updated September 2, 2021, https://portal.ct.gov/DSS/Health-And-Home-Care/Connecticut-Housing-Engagement-and-Support/Connecticut-Housing-Engagement-and-Support-Services---CHESS ↩︎
    68. Connecticut Medical Assistance Program, Provider Bulletin 2022-52, July 2022, https://portal.ct.gov/-/media/DPH/Injury-Prevention/CTVDRS/Connecticut-Medical-Assistance-Program_Community-Violence-Prevention-Services.pdf ↩︎
    69. Wisconsin Department of Health Services, “Housing Support Services,” updated May 11, 2022, https://www.dhs.wisconsin.gov/medicaid/housing-supports.htm Leah Ramirez, Wisconsin Department of Health Services, “Housing Support Services,” https://publicmeetings.wi.gov/download-attachment/204ce20a-8a6b-4b3f-9520-783bc417e027 ↩︎
    70. The 9 states are: Hawaii, Iowa, Kentucky, Maryland, Maine, New Hampshire, Oklahoma, Tennessee, and Virginia. ↩︎
    71. Nevada Department of Health and Human Services, Section 1115 Demonstration Waiver Application: Expansion of Dental Services for Adults with Diabetes (July 2022): https://dhcfp.nv.gov/uploadedFiles/dhcfpnvgov/content/Board/1115_Dental_Waiver_NV _Oral_Health_Section.pdf ↩︎
    72. The 3 states adding coverage of SDF are: California, Rhode Island, and Utah. ↩︎
    73. American Dental Association, “Silver Diamine Fluoride,” updated July 19, 2021, https://www.ada.org/resources/research/science-and-research-institute/oral-health-topics/silver-diamine-fluoride ↩︎
    74. CMS, State Plan Amendment (SPA) MT-22-005 (June 23, 2022), https://www.medicaid.gov/medicaid/spa/downloads/MT-22-0005.pdf ↩︎
    75. CMS, State Plan Amendment (SPA) OK-21-0022-A (September 24, 2021), https://www.medicaid.gov/Medicaid/spa/downloads/OK-21-0022-A ↩︎
    76. Consolidated Appropriations Act, 2021, Pub. L. No. 116-260 (December 27, 2020), https://www.congress.gov/116/plaws/publ260/PLAW-116publ260.pdf Center for Medicare and Medicaid (CMS), SMD #21-005, “UPDATED: Mandatory Medicaid Coverage of Routine Patient Costs Furnished in Connection with Participation in Qualifying Clinical Trials,” April 13, 2022, https://www.medicaid.gov/federal-policy-guidance/downloads/smd21005.pdf ↩︎
    77. 42 CFR 438.3(e)(2). ↩︎
    78. 42 CFR § 438.3 (e)(2)(iv). ↩︎
    79. California Department of Health Care Services, Medi-Cal Community Supports, or In Lieu of Services (ILOS), Policy Guide (August 2022), https://www.dhcs.ca.gov/Documents/MCQMD/DHCS-Community-Supports-Policy-Guide.pdf ↩︎
    80. State Telehealth Medicaid Fee-For-Service Policy: A Historical Analysis of Telehealth: 2013-2019 (Center for Connected Health Policy, January 2020), https://www.cchpca.org/2021/04/Historical-State-Telehealth-Medicaid-Fee-For-Service-Policy-Report-FINAL.pdf ↩︎
    81. Rose C. Chu, Christie Peters, Nancy De Lew, and Benjamin D. Sommers, State Medicaid Telehealth Policies Before and During the COVID-19 Public Health Emergency (Washington, DC: U.S. Department of Health and Human Services, Office of the Assistant Secretary for Planning and Evaluation, July 19, 2021), https://aspe.hhs.gov/sites/default/files/2021-07/medicaid-telehealth-brief.pdf ↩︎
    82. Centers for Medicare and Medicaid (CMS), “Medicaid and CHIP and the COVID-19 Public Health Emergency: Preliminary Medicaid and CHIP Data Snapshot,” June 2022, https://www.medicaid.gov/state-resource-center/downloads/covid-19-medicaid-data-snapshot-01312022.pdf ↩︎
    83. MACPAC, Medicaid and Rural Health (Washington, DC: MACPAC, June 2021), https://www.macpac.gov/wp-content/uploads/2021/04/Medicaid-and-Rural-Health.pdf ↩︎
    84. Government Accountability Office, Medicaid: CMS Should Assess Effect of Increased Telehealth Use on Beneficiaries’ Quality of Care (Washington, DC: Government Accountability Office, March 2022), https://www.gao.gov/assets/gao-22-104700.pdf ↩︎
    85. The 28 states that newly added audio-only coverage are: AL, CO, CT, DC, IA, IL, IN, KS, LA, MD, MI, MO, NC, ND, NE, NH, NY, OH, OK, OR, PA, RI, SC, SD, TX, VT, WI, and WV. The 19 states that expanded existing audio-only coverage are: AK, CA, DE, FL, HI, ID, KY, MA, ME, MN, MS, MT, NJ, NM, NV, TN, UT, VA, and WA. ↩︎
    86. Centers for Medicare and Medicaid (CMS), “Medicaid and CHIP and the COVID-19 Public Health Emergency: Preliminary Medicaid and CHIP Data Snapshot,” June 2022, https://www.medicaid.gov/state-resource-center/downloads/covid-19-medicaid-data-snapshot-01312022.pdf ↩︎
    87. The 37 states are: AK, AL, AZ, CA, CT, DC, HI, IA, ID, IN, KS, KY, MA, MD, ME, MI, MN, MO, MS, MT, NC, NE, NH, NM, NV, NY, OH, OK, OR, RI, SC, UT, VA, VT, WI, WV, and WY. ↩︎
    88. The 4 states are: Louisiana, New Jersey, Pennsylvania, and Texas. ↩︎
    89. The 6 states are: Colorado, Iowa, Nevada, New Hampshire, North Carolina, and Utah. North Carolina noted that overall telehealth utilization among rural populations has grown to be equivalent to utilization among urban populations; however, telehealth utilization for specialized services is higher among urban populations. ↩︎
    90. Government Accountability Office, Medicaid: CMS Should Assess Effect of Increased Telehealth Use on Beneficiaries’ Quality of Care (Washington, DC: Government Accountability Office, March 2022), https://www.gao.gov/assets/gao-22-104700.pdf ↩︎
    91. The 3 states are: California, Kansas, and Ohio. ↩︎
    92. The 5 states are: Indiana, Iowa, Michigan, North Carolina, and Rhode Island. ↩︎
    93. The 6 states are: California, Indiana, Nevada, New York, Rhode Island, and Tennessee. ↩︎
    94. Government Accountability Office, Medicaid: CMS Should Assess Effect of Increased Telehealth Use on Beneficiaries’ Quality of Care (Washington, DC: Government Accountability Office, March 2022), https://www.gao.gov/assets/gao-22-104700.pdf ↩︎
    95. Bipartisan Safer Communities Act, Pub. L. No. 117-159 (June 25, 2022), https://www.congress.gov/117/plaws/publ159/PLAW-117publ159.pdf ↩︎
    96. State of Arizona and Health Services Advisory Group, 2021 ACC Adult and Child CAHPS Summary Report (January 2022), https://www.azahcccs.gov/Resources/HPRC/Downloads/2021_CAHPS_ACC_Report-ForPosting.pdf ↩︎
    97. Specifically, Arizona, Maine, and Nebraska reported plans to use enhanced ARPA HCBS funding. ARPA also included funding to invest in affordable high-speed internet and connectivity. The White House, “FACT SHEET: Biden-⁠Harris Administration Announces Over $25 Billion in American Rescue Plan Funding to Help Ensure Every American Has Access to High Speed, Affordable Internet,” June 7, 2022, https://www.whitehouse.gov/briefing-room/statements-releases/2022/06/07/fact-sheet-biden-harris-administration-announces-over-25-billion-in-american-rescue-plan-funding-to-help-ensure-every-american-has-access-to-high-speed-affordable-internet/ ↩︎
    98. Ohio Administrative Code 5160-1-18 (July 15, 2022), https://codes.ohio.gov/ohio-administrative-code/rule-5160-1-18 ↩︎
    99. South Carolina Healthy Connections Medicaid, “Update on Telehealth Flexibilities Issued During the COVID-19 Public Health Emergency,” April 29, 2022, https://www.scdhhs.gov/press-release/update-telehealth-flexibilities-issued-during-covid-19-public-health-emergency ↩︎
    100. Alaska House Bill 265 (July 14, 2022), https://legiscan.com/AK/text/HB265/id/2479085 ↩︎
    101. Texas Medicaid & Healthcare Partnership, “Telemedicine and Telehealth Services Provided by Rural Health Clinics,” February 28, 2022, https://www.tmhp.com/news/2022-02-28-telemedicine-and-telehealth-services-provided-rural-health-clinics ↩︎
    102. Rhode Island House Bill 6032 (July 6, 2021), https://legiscan.com/RI/bill/H6032/2021 ↩︎
    103. Rhode Island Executive Order 20-06 (March 18, 2020), https://health.ri.gov/publications/exec-orders/ExecOrder20-06.pdf ↩︎
    104. Social Security Act Section 1902(a)(30)(A) and 42 CFR Section 447.204. ↩︎
    105. Federal regulations permit only the following exceptions that allow states to make payments directly to providers or direct managed care plan expenditures for plan-covered services: state directed payments and permissible pass-through payments that comply with the requirements at 42 C.F.R. § 438.6, and provider payments required by federal law or regulation, for example, prospective payment system rates required for federally qualified health centers (FQHCs). ↩︎
    106. Alex Zorn, “Nursing Homes Score Win With 17.5% Medicaid Increase in Pennsylvania for 2023,” Skilled Nursing News, July 11, 2022, https://skillednursingnews.com/2022/07/nursing-homes-score-win-with-17-5-medicaid-increase-in-pennsylvania-for-2023/ ↩︎
    107. The total number of states responding to this question in the prior surveys was 51 in the 2019 survey, 43 in the 2020 survey, and 47 in the 2021 survey. ↩︎
    108. Government Accountability Office, Medicaid: CMS Needs More Information on States’ Financing and Payment Arrangements to Improve Oversight (Washington, DC: Government Accountability Office, December 2020), https://www.gao.gov/assets/gao-21-98.pdf ↩︎
    109. Throughout the Provider Taxes section, we use 2021 survey data for Arkansas and Georgia because these states did not respond to the 2022 survey. ↩︎
    110. The Deficit Reduction Act of 2005 amended the federal Medicaid provider tax law to restrict the use of MCO taxes effective July 1, 2009. Prior to that date, states could apply a provider tax to Medicaid MCOs that did not apply to MCOs more broadly and could use that revenue to match Medicaid federal funds. Since 2009, several states have implemented new MCO taxes that tax member months rather than premiums and that meet the federal statistical requirements for broad-based and uniform taxes. In addition to the 12 states reporting implemented MCO taxes, some states have implemented taxes on health insurers more broadly that generate revenue for their Medicaid programs. ↩︎
    111. 10 states reported having an ambulance tax in place in FY 2022: CA, KY, LA, MA, MI, MO, OK, TN, UT, and VT. MA was still awaiting CMS approval at the time of the survey but planned to implement the tax retroactively to FY 2022. ↩︎
    112. 11 states reported planned increases to one or more provider taxes in FY 2023: AZ, CA, CO, IL, KS, LA, MA, NC, OK, PA, and WV. These increases were most commonly for taxes on hospitals. 7 states reported planned decreases to one or more provider taxes in FY 2023: California, Colorado, Hawaii, Idaho, Missouri, Rhode Island, and Washington. ↩︎
    113. State policymakers remain concerned about Medicaid prescription drug spending growth and the entry of new high-cost drugs to the market, like Aduhelm, which could cost states anywhere from $230 to $695 million and states report developing strategies and policies to address these drugs is a priority. ↩︎
    114. Inflation Reduction Act of 2022, Pub. L. No. 117-169 (August 16, 2022), https://www.congress.gov/bill/117th-congress/house-bill/5376/text ↩︎
    115. 2021 survey data were used for the two states that did not respond to the 2022 survey (Arkansas and Georgia). ↩︎
    116. Ohio is “unbundling” many components of pharmacy benefit administration from MCO responsibilities and will contract with a single PBM instead. It is also contracting with a Pharmacy Pricing and Audit Consultant (PPAC) who will provide operational and consulting support in the areas of pharmacy reimbursement, benefit design, oversight, and auditing. Additional information about the program change is available at Ohio Medicaid Managed Care, “Ohio Medicaid Single Pharmacy Benefit Manager (SPBM),” https://managedcare.medicaid.ohio.gov/wps/portal/gov/manc/managed-care/single-pharmacy-benefit-manager ↩︎
    117. In New York, effective April 1, 2023, the pharmacy benefit will be transitioned from managed care to FFS. This was previously scheduled for implementation on April 1, 2021 but was delayed for two years by the state legislature. ↩︎
    118. Kentucky Cabinet for Health and Family Services, Provider Bulletin “Kentucky Managed Care Organization Single Pharmacy Benefit Manager Announcement,” April 1, 2021,  https://chfs.ky.gov/agencies/dms/dpo/ppb/Documents/ProviderMailingApril2021Final.pdf ↩︎
    119. Mississippi is conducting an MCO procurement and plans to move to processing pharmacy claims through a single pharmacy benefits administrator beginning in FY 2024. See https://medicaid.ms.gov/coordinated-care-procurement/ for more information. ↩︎
    120. Arizona, Colorado, Massachusetts, Michigan, and Oklahoma are exploring adding additional VBAs. ↩︎
    121. The 16 states are AK, CT, ID, IL, IN, MS, MT, ND, NV, NY, OR, PA, SC, TN, TX, and VT. ↩︎
    122. The 6 states are: Alaska, Indiana, Montana, North Dakota, Vermont, and Texas. Arizona, a state that already has a VBA in place, also indicated that it would evaluate national-level VBA arrangements that become available. ↩︎
    123. See Medicaid Drug Rebate Program Notice, Release No. 189, March 23, 2022, Technical Guidance - Value-Based Purchasing (VBP) Arrangements for Drug Therapies using Multiple Best Prices; State Reporting of VBP Supplemental Rebate Agreements; accessed at https://www.medicaid.gov/prescription-drugs/downloads/state-rel-189-vbp.pdf. This notice provides: “Beginning July 1, 2022, manufacturers will be able to report varying “best price” points (i.e., multiple best prices) for a covered outpatient drug to the Medicaid Drug Rebate Program (MDRP) if associated with a value-based purchasing (VBP) arrangement that meets the definition of such an arrangement at 42 CFR § 447.502, and that arrangement is offered to all states.” ↩︎
    124. These states are: Alaska, District of Columbia, Maine, Mississippi, Nevada, and Virginia. ↩︎
    125. Maine is implementing a preferred drug list specific to physician administered drugs, while other states reported making changes to utilization management practices, clinical policy, or reimbursement of physician administered drugs. ↩︎
    126. Spread pricing refers to the difference between the payment the PBM receives from the MCO and the reimbursement amount it pays to the pharmacy. In the absence of oversight, some PBMs have been able to keep this “spread” as profit. ↩︎
    127. The 4 states that reported recently implemented or planned policies to prohibit spread pricing are: Florida, Kentucky, Massachusetts, and Maryland. The 2 states that reported recently implemented or planned policies to require pass through pricing in MCO contracts with PBMs are: Nebraska and Nevada. ↩︎
    128. The 4 states are: Connecticut, District of Columbia, Mississippi, and Texas. ↩︎
    129. State fiscal years begin on July 1 except for these states: New York on April 1; Texas on September 1; Alabama, District of Columbia, and Michigan on October 1. ↩︎
    130. Arkansas and Georgia did not respond to the 2022 survey. In some instances, we used publicly available data or prior years’ survey responses to obtain information for these states. However, unless otherwise noted, these states are not included in counts throughout the survey. ↩︎
    131. Among responding states, one state (Texas) did not participate in a follow-up telephone interview. ↩︎
    News Release

    New theGrio/KFF Survey Project Examines Diverse Views of Black Voters Heading into 2022 Midterm Election

    Half of Black Voters are More Motivated to Vote This Year, with Older Voters and Those Who Approve of President Biden among the Most Eager

    Published: Oct 18, 2022

    7 in 10 Worry About Voter Suppression Interfering with a Fair and Accurate Count

    Allen Media Group’s African American-focused news, lifestyle, and entertainment platform theGrio and KFF today released a joint national survey examining the mood and views of Black voters, the only in-depth public survey this election cycle focused exclusively on this group, which has historically been a solid Democratic voting bloc but holds diverse views that often get overlooked in national polling. Coverage of the survey’s findings also begins today at theGrio.com and will run throughout the week on their website and cable television channel.

    Unlike a typical national voter poll, the survey reaches a large enough sample of Black voters to examine variations by factors such as age, gender, education, and political affiliation.

    The survey finds that about half (51%) of Black voters say they are more motivated to vote this year compared to previous elections, largely due to a desire to elect Democrats or keep Republicans out of power, as well as a general desire for change.

    While large shares across groups express increased motivation this year, they are higher among older Black voters (58% of those ages 50 and older say they are more motivated to vote) and those who approve of President Biden (58%). Similar shares of those who identify as or lean Democrat (55%) and who identify as or lean Republican (54%) say they are more motivated this year.

    The project finds that Black voters are greatly concerned about the economy, inflation, and the affordability of health care and housing. At the same time, these voters also rank some non-economic issues as important to their vote, including voter rights, gun violence, and criminal justice and policing.

    Other key findings include:

    • Electoral integrity. Seven in ten (71%) of all Black voters say they are worried about voter suppression interfering with a fair and accurate election in their state. This may reflect Black voters’ experiences at the polls: Nearly half (46%) say they have had to wait in long lines at their polling place in the past, and one in five (20%) say they have either had their voter registration questioned or were told they were not registered to vote, requested a mail-in ballot that never arrived or arrived too late, had their mail-in ballot rejected, and/or were told they didn’t have the correct identification.
    • Housing costs. About three in ten (31%) Black voters say that the cost of housing is the economic issue that they most want President Biden and the Congress to address, more than those who say the same about the cost of food (24%), health care (23%), gasoline (10%), or student debt (12%). In addition, three-quarters of Black voters say the issue of housing affordability is very important to their vote, including even higher shares of lower-income Black voters (84% of those with annual incomes under $40,000), Black women voters (82%), and younger Black voters (78% of those under age 50).
    • Partisan identification. While about three quarters of Black voters identify as a Democrat (61%) or lean Democratic (13%), about one in ten identify as Republican (7%) or lean Republican (4%). A further 13% identify as independents or something else and do not lean toward either the Democratic or Republican party. These groups hold vastly different views than the Democratic majority, especially on recent Supreme Court decisions and gender and sexual identity issues.

    TheGrio will begin rolling out its release of theGrio/KFF survey of Black voters on Oct. 18 through a series of original stories reported by the brand’s political team, including White House Correspondent April Ryan and senior correspondent Natasha S. Alford. The reporting will include insights from experts and stakeholders to contextualize some of the standout findings, from Black voters’ approval ratings of President Joe Biden (69%) and Vice President Kamala Harris (65%) to Black voters’ feelings about funding for police, and inflation and other economic issues (73%) as the biggest concern for Black voters and their families right now when asked to state this in their own words.

    Additionally, theGrio will explore the survey’s findings on Black voters’ opinions of the Supreme Court since overturning Roe v. Wade and concerns over voter suppression through opinion columns from writers Touré and Michael Harriot. TheGrio’s reporters and columnists will also dissect the findings on the brand new television series “TheGrio with Eboni K. Williams” and “TheGrio with Marc Lamont Hill,” scheduled to debut Monday, October 24 on the platform’s cable channel.

    The poll was jointly developed and analyzed by theGrio and KFF’s polling and survey research group and was conducted August 24-September 5 among a national probability-based sample of 1,000 adults ages 18 and older who identify as Black or African American and are registered to vote. Interviews were conducted in English online and by live telephone interviewers. The results from the full survey have a margin of sampling error of plus or minus 4 percentage points. Each partner bears responsibility for its editorial content about the poll.

    About theGrio

    In 2016, Allen Media Group purchased theGrio, a highly rated digital video-centric news community platform devoted to providing African-Americans with compelling stories and perspectives currently underrepresented in existing national news outlets. TheGrio features aggregated and original video packages, news articles, and opinion pieces on topics that include breaking news, politics, health, business, and entertainment. The digital platform remains focused on curating exciting digital content and currently has more than 100 million annual visitors. TheGrio is available everywhere people consume information—on a mobile app, Facebook, Twitter, YouTube, Instagram, LinkedIn, Roku, Amazon Fire TV, AppleTV, and now as an over-the-air television network.

    About KFF

    Filling the need for trusted information on national health issues, KFF is a nonprofit organization based in San Francisco, California, that produces non-partisan analysis, polling, journalism and social impact media campaigns for policymakers, the media, and the public. KFF develops and runs its own policy analysis, journalism. and communications programs. It has no association with Kaiser Permanente.

    News Release

    With Government Funding Running Out, Americans Could Soon Face New Challenges in Accessing COVID-19 Treatments and Testing

    Published: Oct 18, 2022

    A new KFF brief analyzes how the accessibility and cost of COVID-19 vaccines, treatments, and tests will change after the current government supply is depleted and the public health emergency ends.

    The Biden Administration has announced that it will have to end its purchase and distribution of COVID supplies as government funding is depleted. The public health emergency was recently extended for 90 additional days but is widely expected to end next year. These developments signal a shift in the United States’ response to the pandemic and a transition from government-supplied countermeasures to the commercial market for manufacturing, procurement, and pricing.

    This transition to the commercial market could curtail access to vaccines (including boosters), treatments, and tests. Without the federal government’s guaranteed “market” for these products through their advance purchase, it is uncertain whether manufacturers will have an incentive to produce enough. Meanwhile, people with insurance could face new or higher cost-sharing for treatments and testing, depending on their coverage and the type of treatment or test they want to access. People who are uninsured and underinsured stand to lose the most, with limited access to free vaccines and no coverage for the cost of treatments and tests. Everyone could face access challenges if sufficient supplies are not available from manufacturers or procured by pharmacies or other providers.

    Read the brief, “Commercialization of COVID-19 Vaccines, Treatments, and Tests: Implications for Access and Coverage” to learn about the changes and their implications for access to COVID countermeasures by payer.

    Additionally, RSVP for the latest installment of The Health Wonk Shop, a 45-minute discussion on Wednesday, October 19th at 12 p.m. ET, during which a panel of experts, moderated by Larry Levitt, will explore the government’s plan to transition the distribution of COVID tests, vaccines, and therapeutics to the commercial market and its potential implications for consumers and insurers.

    KFF/theGrio Survey of Black Voters

    Authors: Liz Hamel, Shannon Schumacher, Grace Sparks, Mellisha Stokes, and Mollyann Brodie
    Published: Oct 18, 2022

    Overview

    The Survey of Black Voters, the first under a new partnership between KFF and theGrio, examines the mood and opinions of Black voters as the 2022 midterm election approaches. For this project, we interviewed 1,000 Black registered voters, allowing for analysis that goes beyond the topline findings and paints a richer picture of the diversity of attitudes within the Black voting population.

    The survey explores Black voters’ voting intentions, motivations, and views on key electoral issues for the upcoming midterm. It also examines Black voters’ attitudes toward the Democratic and Republican Parties, views on electoral integrity, and past experiences with voter suppression. In addition to these election-related topics, the survey sheds light on how Black voters feel about timely topics including recent Supreme Court decisions, policies affecting LGBT individuals, and policies aimed at improving health for Black people in the United States.

    Read theGrio’s coverage:

    Black voters’ mood ahead of midterms tempered by age, economy and racism, TheGrio/KFF Survey finds, published Oct. 18, 2022.

    Black voters name inflation, economic issues as biggest concern ahead of midterm elections, published Oct. 18, 2022.

    Black voters solidly approve of Biden and Harris, less firm on the president’s reelection in 2024, published Oct. 18, 2022.

    Majority of Black voters say Trump should be criminally charged for Jan. 6 insurrection in TheGrio/KFF survey, published Oct. 19, 2022.

    As Republicans still scream fraud in 2020 election, Black voters surveyed by theGrio/KFF still believe their votes count, published Oct. 20, 2022.

    Black voters surveyed by theGrio/KFF want Biden to address inflation; only 12% named student debt as top economic issue, published Oct. 24, 2022.

    Most Black voters tell theGrio/KFF survey they support funding or increased funding for police, published Oct. 25, 2022.

    Black voters surveyed by theGrio/KFF think the Supreme Court is politicized and see this as a bad sign for Black people, published Oct. 26, 2022.

    Why Black voters don’t want to defund the police, explained, published Oct. 27, 2022.

    Young Black voters could be essential in future elections, analysis of theGrio/KFF survey shows, published Oct. 29, 2022.

    Black voters say recent Supreme Court decisions are a step backward, hurt Black people: theGrio/KFF survey, published Oct. 30, 2022.

    TheGrio/KFF survey shows that Black voters are concerned with voter suppression tactics, published Nov. 1, 2022.

    Majority of Black voters support LGBT rights, more divided on the issue of trans student-athletes: theGrio/KFF survey, published Nov. 5, 2022.

    Findings

    Introduction

    The Survey of Black Voters, the first under a new partnership between KFF and theGrio, examines the mood and opinions of an important group of voters as the 2022 midterm election approaches. A group that has historically been a solid voting bloc for Democrats, the views of Black voters are often examined as one monolithic group or even sometimes overlooked in midterm election polling. This survey goes beyond the insights that can be gleaned about Black voters from polls of the general public by collecting data from a large enough sample of Black voters to examine variations within the Black electorate by factors such as age, education, political affiliation, and ideology. The survey explores Black voters’ voting intentions, motivations, and views on key electoral issues for the upcoming midterm. It also examines Black voters’ attitudes toward the Democratic and Republican Parties, views on electoral integrity, and past experiences with voter suppression. In addition to these election-related topics, the survey sheds light on how Black voters feel about timely topics including recent Supreme Court decisions, policies affecting LGBT individuals, and policies aimed at improving health for Black people in the United States.

    The survey sample is comprised of 1,000 Black adults who identify as Black or African American (including those who identify as Hispanic and/or multi-racial) and who say they are registered to vote.

    Executive Summary

    The survey reveals a Black electorate that is greatly concerned about the economy and the rising cost of living, but one that is weighing a variety of economic and non-economic issues in deciding how to vote in November. In addition to inflation and the affordability of health care and housing, voting rights, gun violence, and criminal justice emerge as top issues for Black voters.

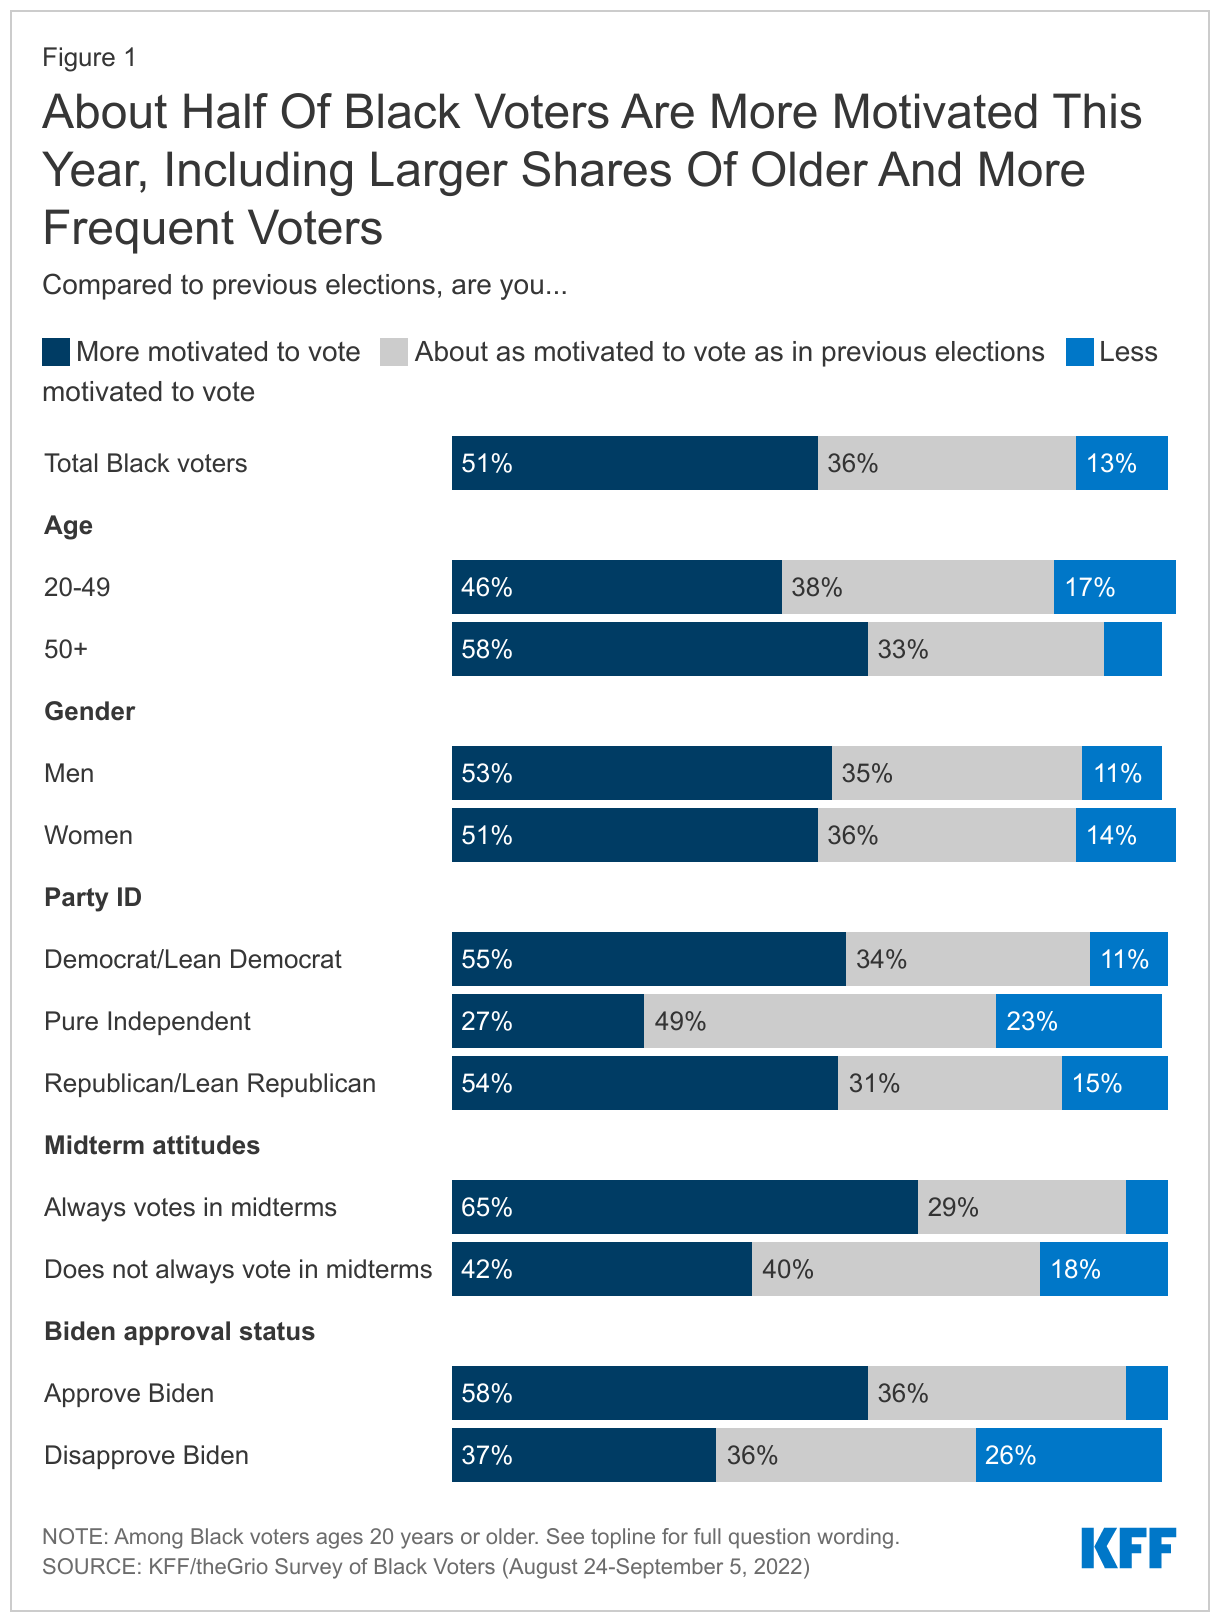
    About half of Black voters say they are more motivated to vote this year compared to previous elections, with those who are more motivated largely driven by a desire to vote for Democrats or keep Republicans out of office or a general desire for change. While substantial shares across groups express increased motivation this year, the shares are higher among older voters, those who approve of President Joe Biden, and those who lean toward one of the major parties, suggesting that larger shares of younger voters, unaffiliated Black voters, and those who disapprove of the president’s job performance may choose to stay home in November.

    Black voters are also concerned about electoral integrity. While a large majority are at least somewhat confident that their own vote will be accurately counted in November, seven in ten are concerned about voter suppression interfering with a fair and accurate election in their state. Half say they have experienced waiting in long lines at their polling place in the past, and one in five have experienced potential voter suppression such as having their registration or identification questioned. Younger Black voters and those who have experienced potential voter suppression in the past are less confident that their vote will be accurately counted this November.

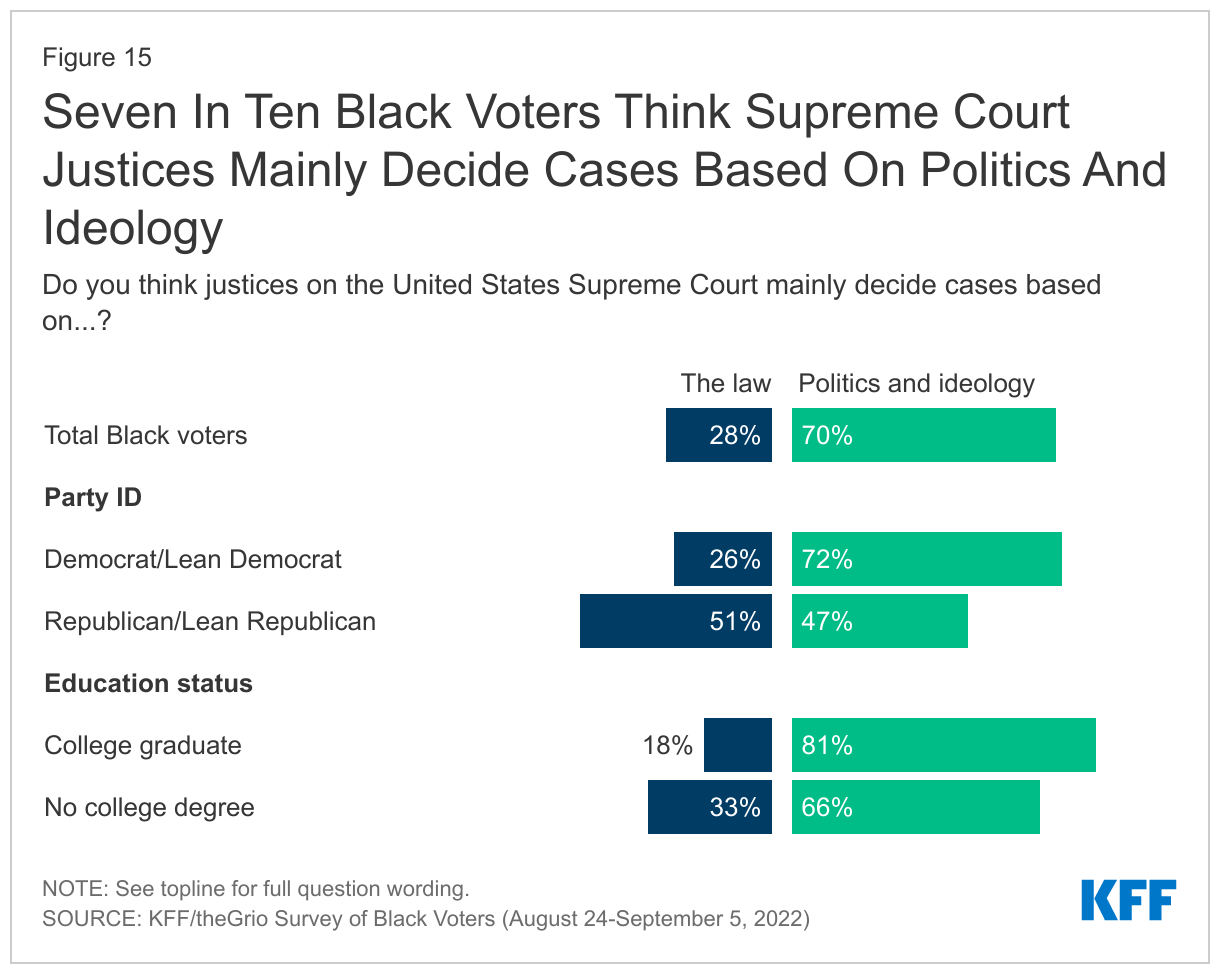
    Black voters also express negative views of the Supreme Court. Eight in ten disapprove of the decision to overturn Roe v. Wade (higher than the share of White voters who say the same in other recent surveys), and most say the Court’s recent decisions have been a step backward when it comes to women’s rights, racial equity, climate change, and voting rights. Seven in ten believe the Court’s justices make their decisions mainly based on politics and ideology rather than the law.

    The survey also finds that while Black voters continue to solidly identify with the Democratic party, there are some signs of disillusionment with the Democratic establishment. Black voters express a clear preference for the Democratic party over the Republican party when it comes to representing their interests, the parties’ commitment to electoral integrity, and views of racism in the parties. Still, less than a quarter of Black voters say the Democratic party represents their interests very well, and eight in ten say racism is at least a minor problem in the party.

    In addition to these topics, the survey also explores more nuances in the attitudes of Black voters. While most Black voters identify as Democrat and hold largely liberal views, they are not a monolith. About one in four Black voters identify as independent, and 11% identify as or lean Republican. These groups express vastly different views from the majority who identify with or lean Democrat, especially on recent Supreme Court decisions, and gender and sexual identity issues. Views on other topics also differ among Black voters by factors such as age, gender, and education, as detailed in this report.

    Who Are Black Voters?

    Partisan identity: A large majority of Black registered voters either identify as Democrats (61%) or say they lean toward the Democratic Party (13%). About one in ten say they are Republicans (7%) or lean that way (4%). A further 13% of Black voters identify as independents or something else and say they don’t lean toward either the Democratic or Republican Party.

    Ideology: About half of Black voters say their views in most political matters are moderate (54%), while 28% say they are liberal and 17% say conservative.

    Age: Black voters are older on average than the Black adult population overall. About 1 in 5 (21%) Black voters are under the age of 30, slightly more than a third (36%) are between 30 and 49, a quarter (26%) are 50-64 and 18% are 65 or older.

    Gender: Black voters are disproportionately women. A majority of Black voters (57%) are women, compared to about four in ten (42%) men.

    Race and ethnicity: Nine in ten Black voters identify as Non-Hispanic Black, while 5% say they are Black and Hispanic or Latino, and a further 5% identify as non-Hispanic Black in addition to at least one other race.

    How Do Black Voters View Biden, Harris, and Trump?

    Approval of President Joe Biden: About seven in ten (69%) approve of the way Joe Biden is handling his job as president, while 30% disapprove. Biden’s approval rating is 59% among Black voters under age 50 compared to 82% among those ages 50 and older.

    Approval of Vice President Kamala Harris: About two-thirds (65%) of Black voters approve of Kamala Harris’s handling of her job as vice president, while 33% disapprove. Harris’s approval rating differs by age as well (56% of those under age 50 approve vs. 77% of those ages 50 and older).

    Views of Donald Trump: More than eight in ten (84%) Black voters have unfavorable views of former President Donald Trump, compared to just 15% who view him favorably. Black voters under age 50 are somewhat more likely than their older counterparts to have a favorable view of Trump (21% vs. 7%), though a large majority of both age groups (79% of those ages 18-49 and 91% of those ages 50 and over) view him unfavorably.

    Half Of Black Voters Say They Are More Motivated to Vote This Year

    Half (51%) of Black voters say they are more motivated to vote this year compared to previous elections, while 36% say they are about as motivated and 13% say they are less motivated to vote this year. The share of Black voters who say they are more motivated is similar to the share of White voters (53%) who said the same in another KFF survey fielded in September. Substantial shares of Black voters across groups say they are more motivated this year, but motivation is somewhat higher among older vs. younger Black voters (58% vs. 46%), among those who say they always vote in midterms vs. those who vote less often (65% vs. 42%), and among those who approve of Biden’s job performance vs. those who disapprove (58% vs. 37%). About half of both Black men voters and Black women voters say they are more motivated to vote this year, as do similar shares of those who identify as or lean Democrat and those who identify as or lean Republican. A much smaller share (27%) of those who say they are independent and don’t lean toward either party say they are more motivated to vote this year.

    About Half Of Black Voters Are More Motivated This Year, Including Larger Shares Of Older And More Frequent Voters

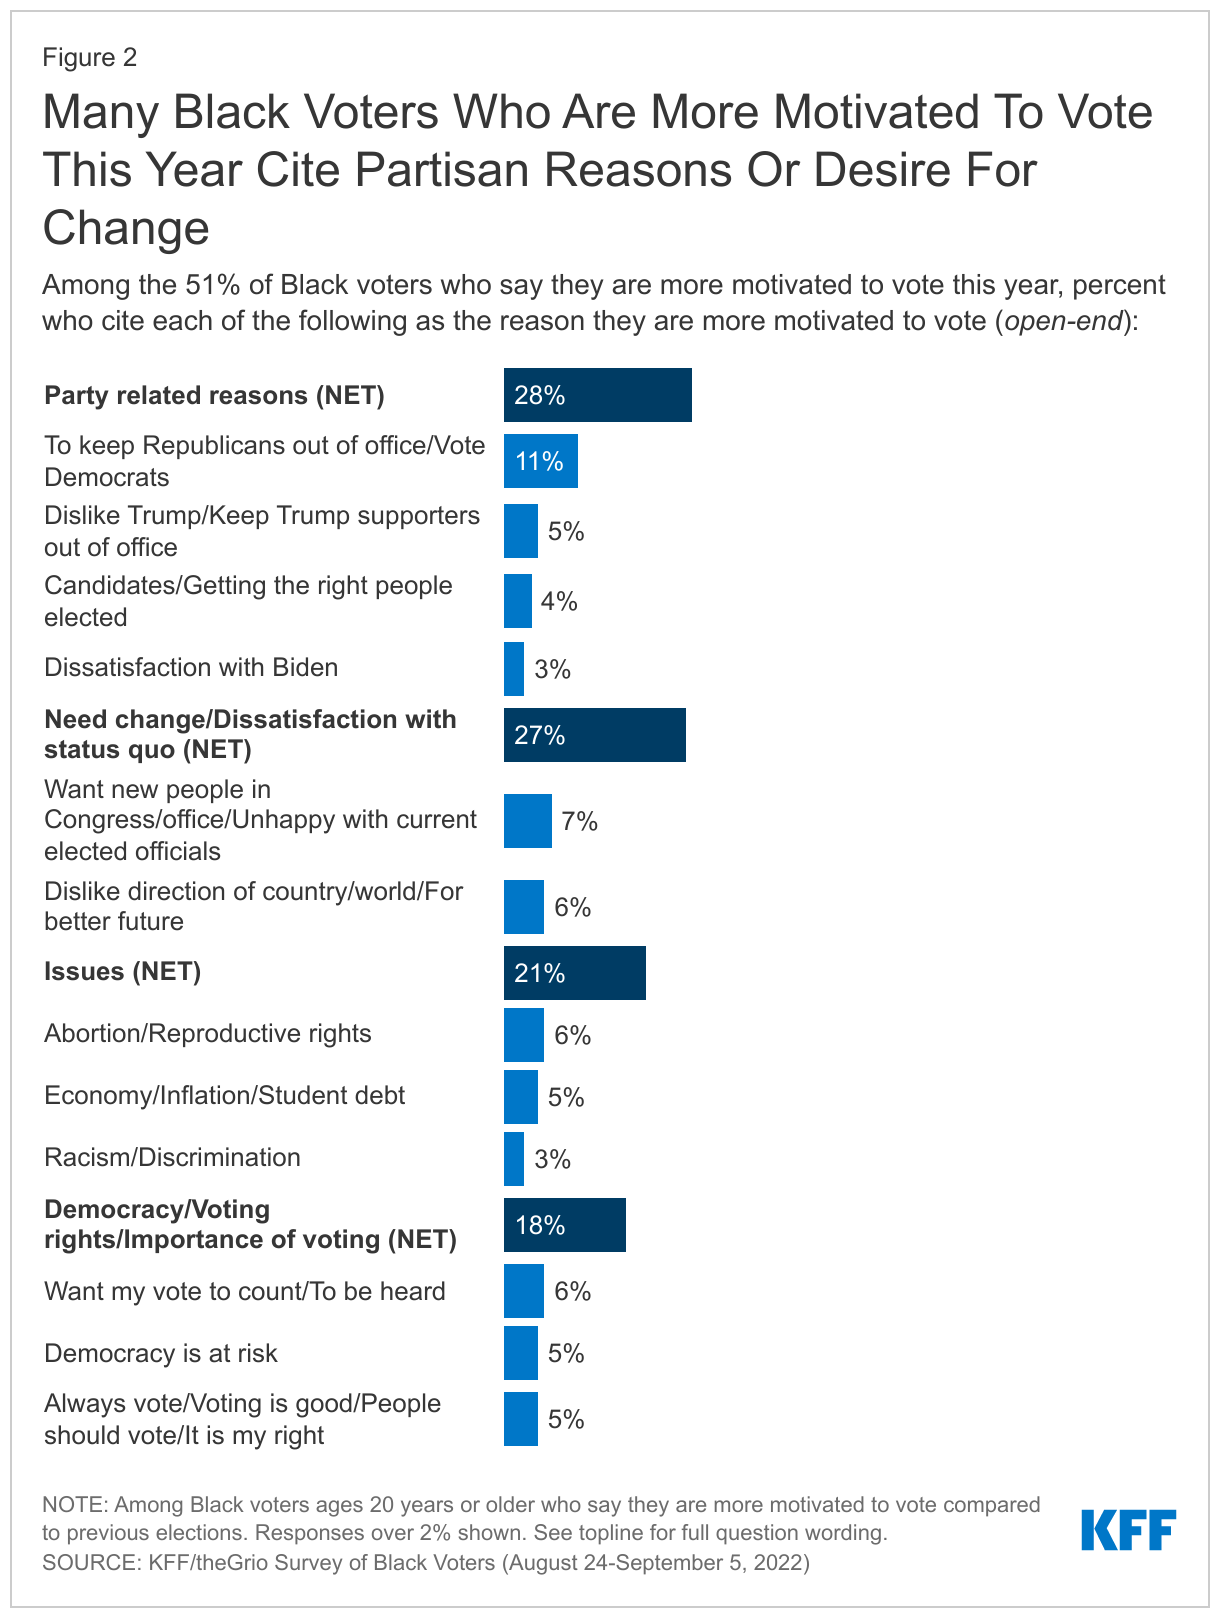
    Black voters who are more motivated this year are largely driven by a desire to vote for Democrats or keep Republicans out of office or a general desire for change. Among the 51% of Black voters who say they are more motivated to vote this year compared to previous elections, 28% cite party-related reasons, such as a desire to elect Democrats or to keep Republicans and Trump supporters out of office, and 27% cite a desire for change or dissatisfaction with the status quo. About one in five cite specific issues (21%) or reasons related to democracy, voting rights, and the importance of voting (18%) for their greater motivation. Among the specific issues mentioned, 6% cite abortion rights and 5% cite economic issues as the source of their motivation.

    Those who are less motivated largely say that they don’t think their vote will make a difference (22%), that they dislike the candidates (16%), or that they feel all politicians are dishonest (10%).

    Many Black Voters Who Are More Motivated To Vote This Year Cite Partisan Reasons Or Desire For Change

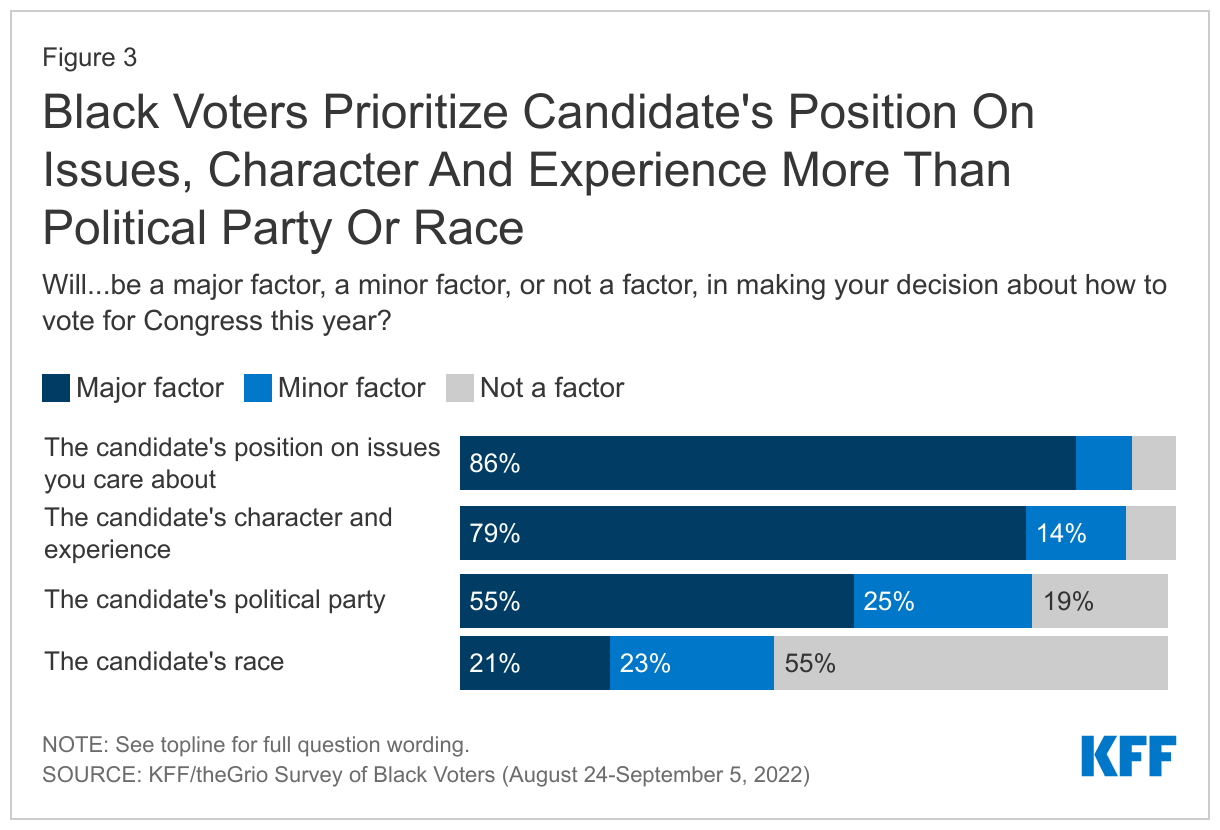
    Majorities of Black voters say they consider candidate’s issue positions, character and experience, and political party when deciding how to vote, but fewer say a candidate’s race is a major factor. Large majorities of Black voters say that a candidate’s position on issues (86%) and character and experience (79%) are major factors in making their decision about how to vote for Congress this year, and a smaller majority (55%) say the same about the candidate’s political party. A much smaller share (21%) say a candidate’s race is a major factor in their decision.

    Despite reporting they will consider many things beyond the candidate’s party, three-quarters (77%) of Black voters say that if the election were held at the time of the survey, they would be most likely to vote for the Democratic candidate for Congress in their district, while 11% say they would be more likely to vote for a Republican and another 11% for a candidate from another party.

    Black Voters Prioritize Candidate's Position On Issues, Character And Experience More Than Political Party Or Race

    Black Voters Generally Confident Their Vote Will Be Counted, But Concerned About Voter Suppression

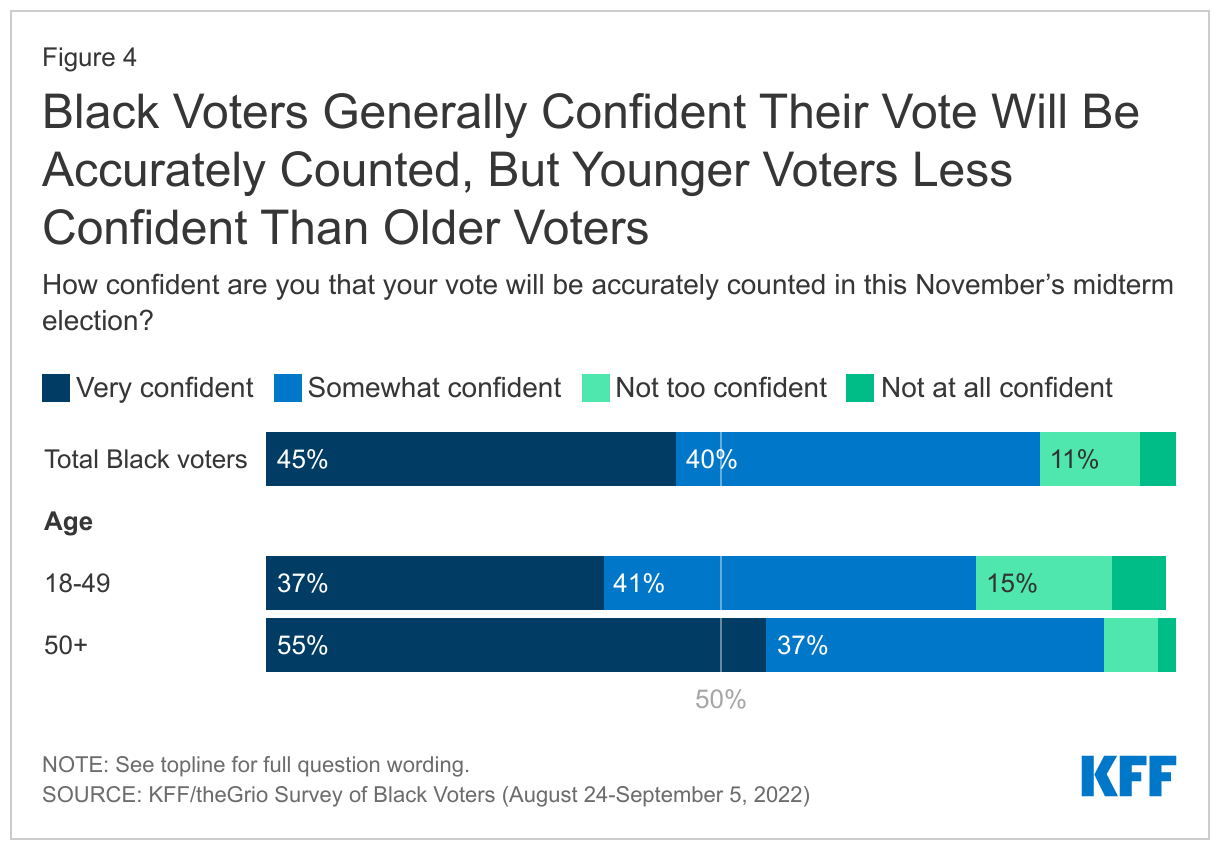
    Black voters are generally confident that their vote will be accurately counted this November. A large majority (84%) of Black voters say they are at least “somewhat” confident their vote will be accurately counted in this November’s election, including more than four in ten (45%) who say they are very confident. However, younger voters under age 50 are less likely to feel very confident compared to their older counterparts (37% vs. 55%), and about one in five younger Black voters (22%) say they are “not too confident” or “not at all confident” that their vote will be counted accurately.

    Black Voters Generally Confident Their Vote Will Be Accurately Counted, But Younger Voters Less Confident


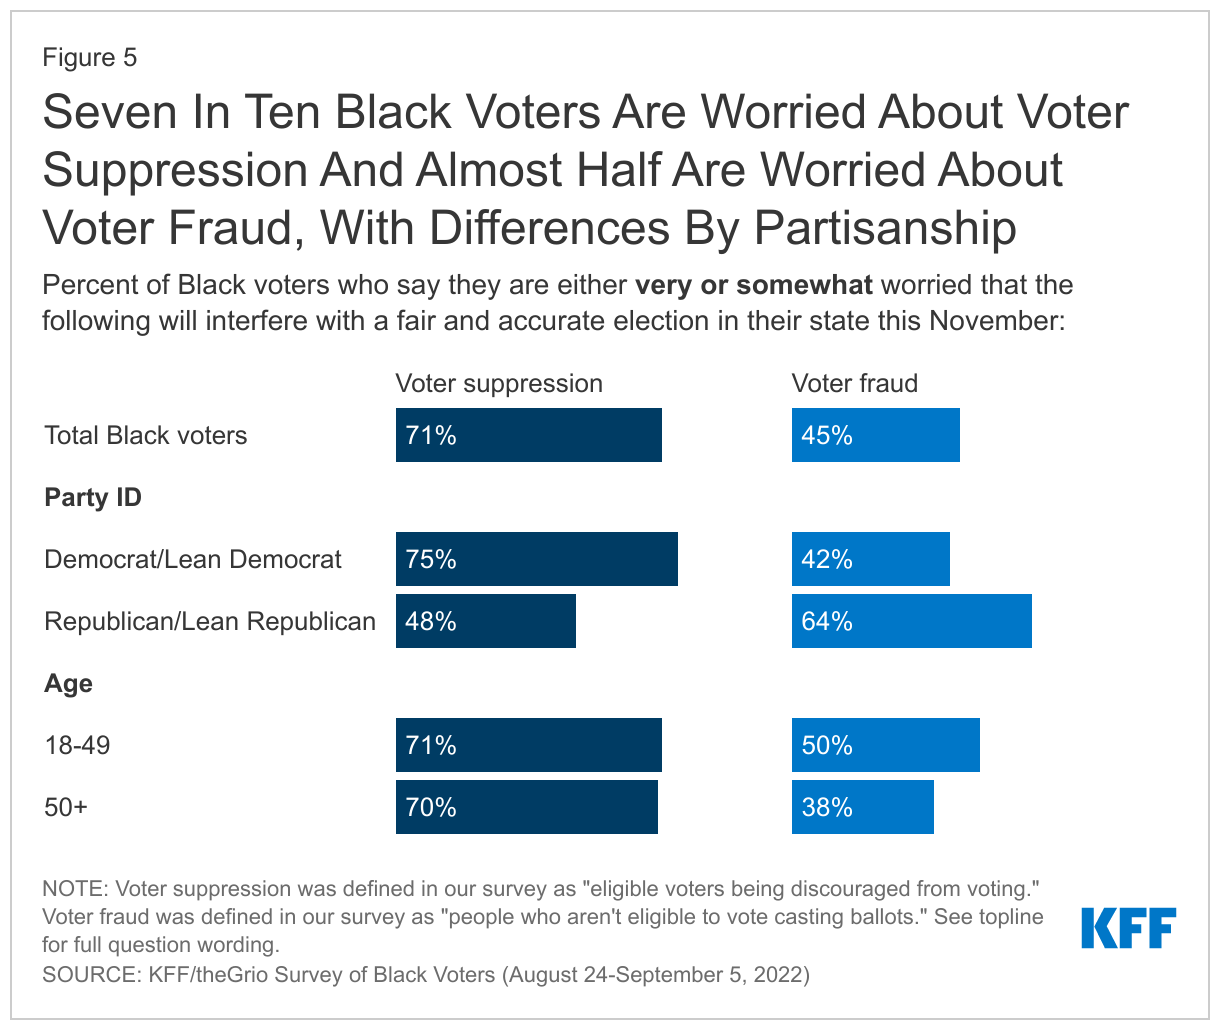
    Seven in ten Black voters are worried about voter suppression and almost half are worried about voter fraud interfering with a fair and accurate election in their state this November. Three in four Black voters who are Democrat or lean Democrat say they are worried about voter suppression, compared to about half (48%) of their Republican counterparts. Conversely, Black voters who are Republican or lean toward the party (64%) are more likely than Black Democrats/leaners (42%) to say they are worried about voter fraud. Black voters of all ages are equally likely to express worry about voter suppression, but there is an age gap on concerns about fraud. Half of Black voters under age 50 say they are very or somewhat worried about voter fraud, compared to 38% of voters over 50.

    Seven In Ten Black Voters Are Worried About Voter Suppression And Almost Half Are Worried About Voter Fraud, With Differences By Partisanship

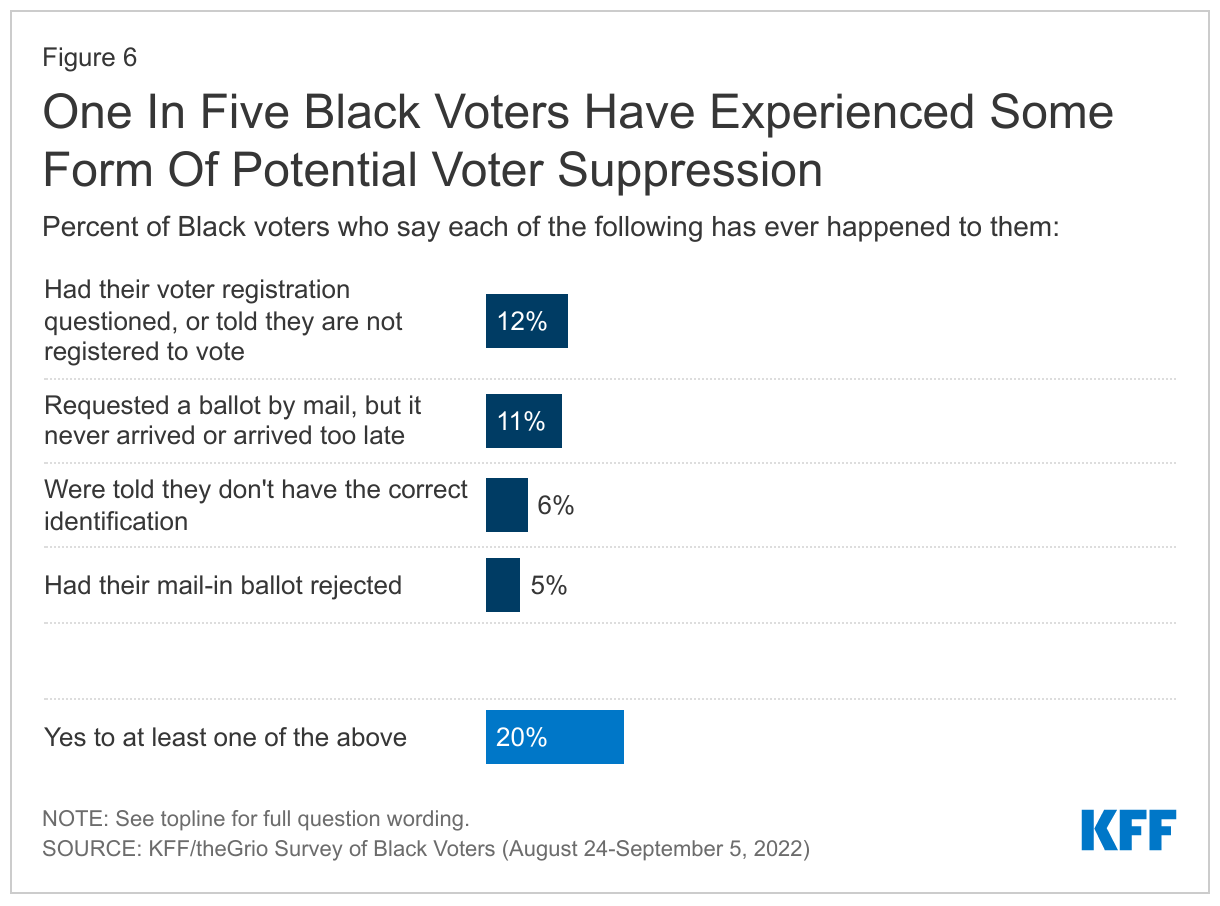
    About half of Black voters say they have experienced waiting in long lines at their polling place, while one in five report experiencing acts of potential voter suppression, such as having their voter registration questioned. Nearly half (46%) of Black voters say they have experienced waiting in long lines at their polling place in the past. In addition, small but important shares report experiencing forms of potential voter suppression, including 12% who say they had their voter registration questioned, 11% who say they requested a mail-in ballot but it never arrived or arrived too late, 6% who were told they didn’t have the correct identification, and 5% who say they had their mail-in ballot rejected. Overall, one in five Black voters say they have experienced at least one of these things.

    One in Five Black Voters Have Experienced Some Form Of Potential Voter Suppression

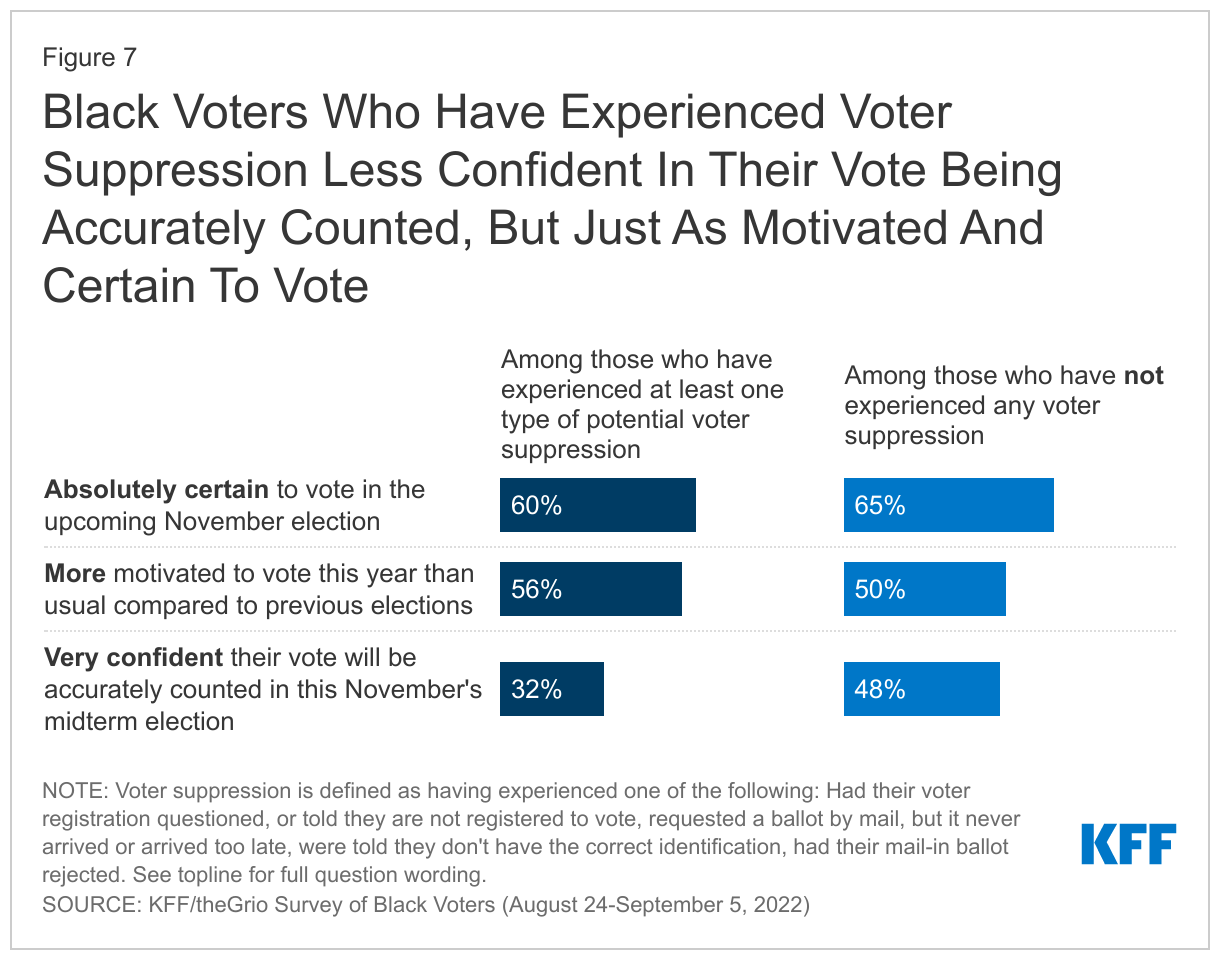
    Experiences with potential voter suppression may impact Black voters’ confidence in the electoral process overall, though the survey does not suggest that it will decrease turnout this November. About a third (32%) of Black voters who have experienced potential voter suppression in the past say they are “very confident” their vote will be accurately counted this fall, compared to a larger share of those who have not experienced voter suppression (48%). However, at this point there is no evidence in the survey that these experiences will suppress turnout in November: these two groups are about equally likely to say they are absolutely certain to vote in the upcoming midterm (60% and 65%, respectively) and that they are more motivated to vote this year compared to previous elections (56% and 50%, respectively).

    Black Voters Who Have Experienced Voter Suppression Less Confident In Their Vote Being Accurately Counted, But Just As Motivated And Certain To Vote


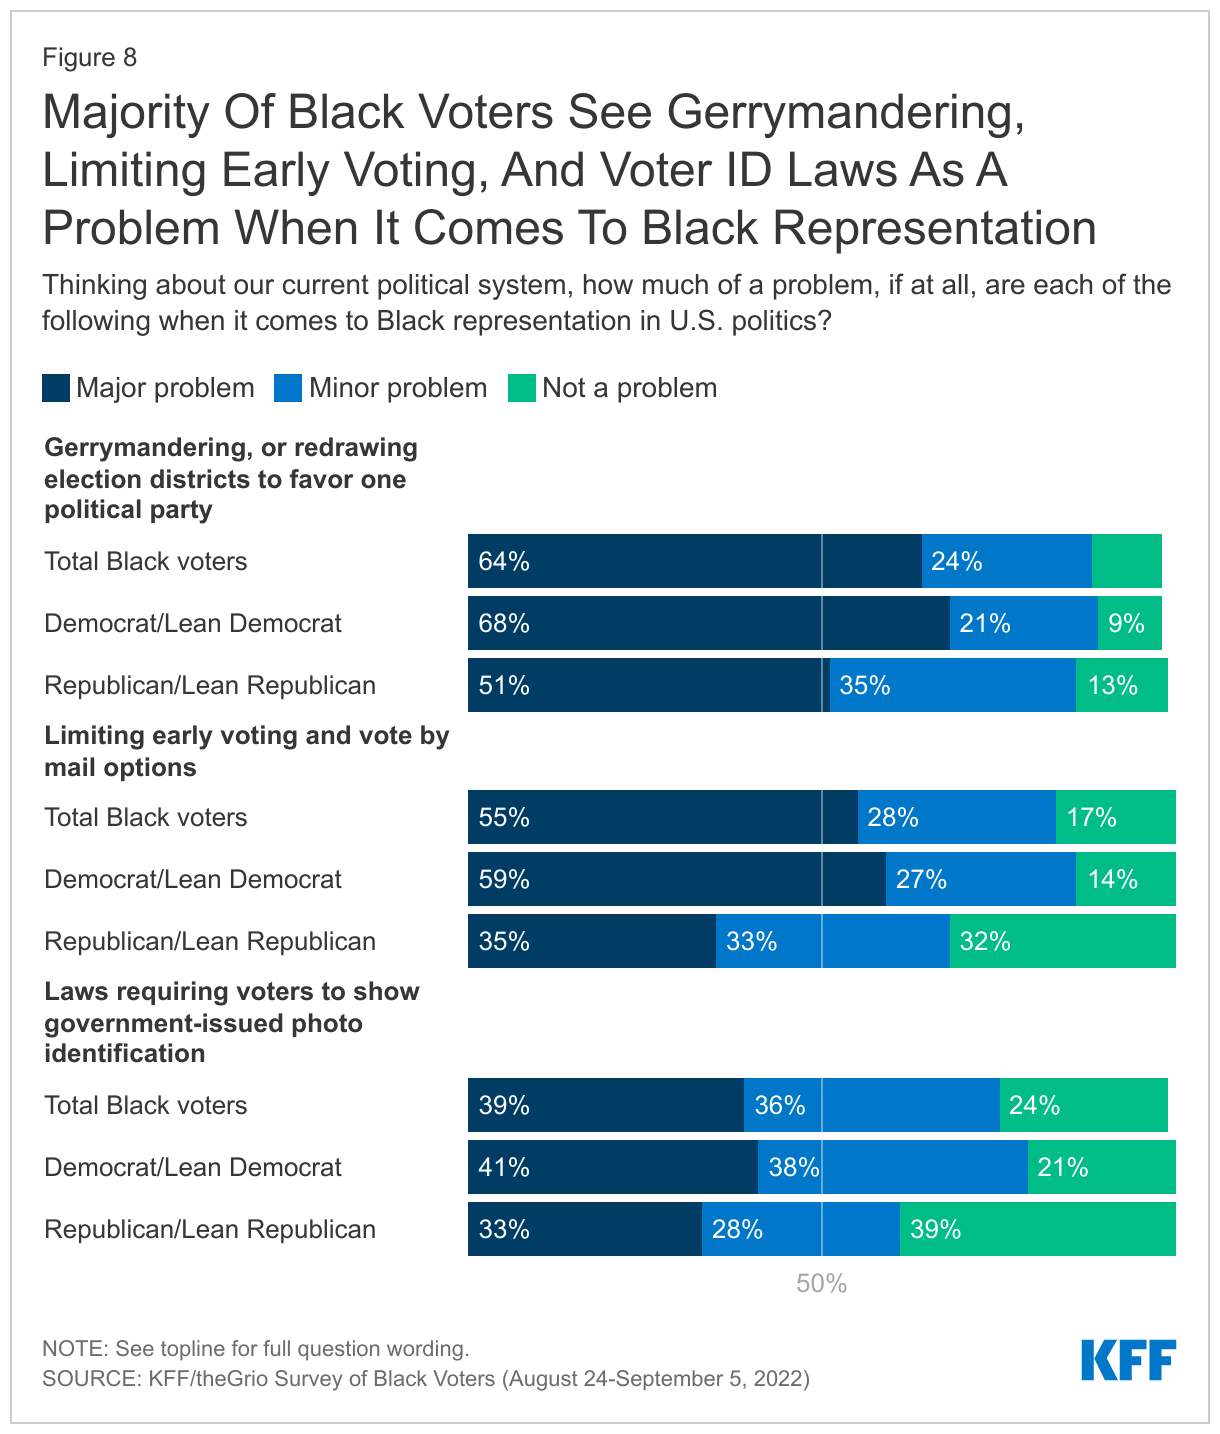
    Majorities of Black voters say gerrymandering, limiting early voting, and voter ID laws are problems for Black representation in U.S. politics, with larger shares identifying gerrymandering and limiting early voting as major problems. Majorities of Black voters say these things are at least minor problems for Black representation in U.S. politics, with the largest share identifying gerrymandering as a major problem (64%), followed by limiting early voting (55%) and voter ID laws (39%). On all three issues polled, Black Democrats and those who lean Democratic are more likely to say these are problems than Republicans and those who lean toward the Republican party.

    Majority Of Black Voters See Gerrymandering, Limiting Early Voting, And Voter ID Laws As A Problem When It Comes To Black Representation

    Economic Concerns Top Of Mind For Black Voters, But Non-Economic Issues Also Seen As Important In Voting Decisions

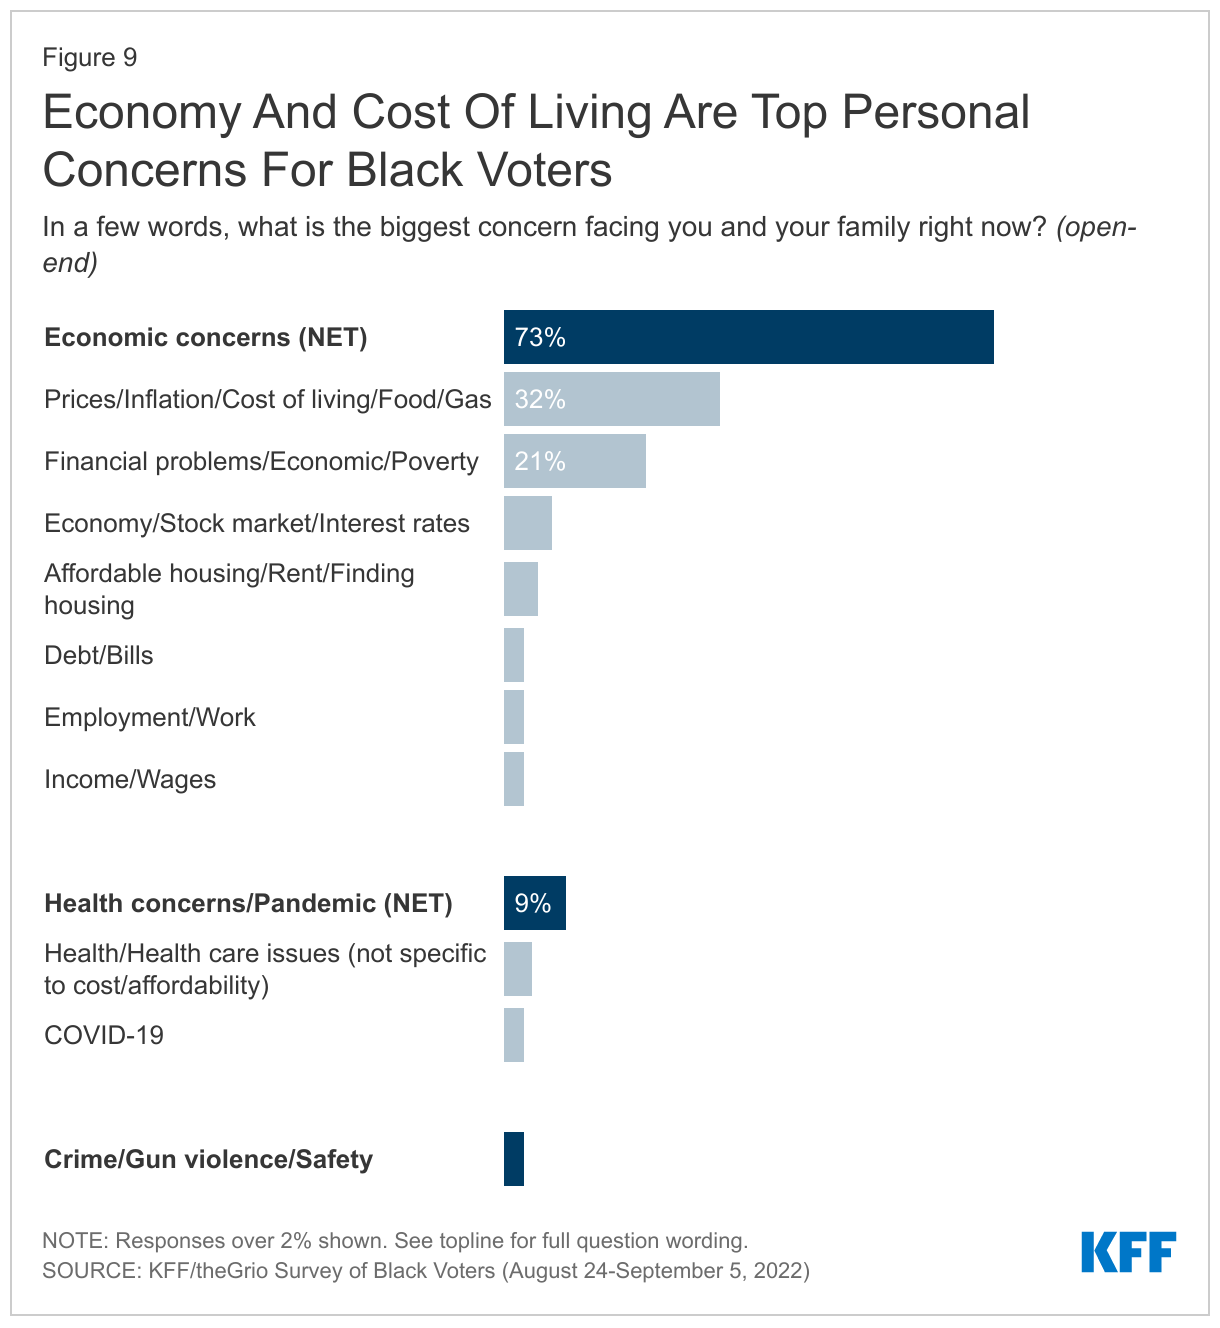
    As the election approaches, economic issues loom large for Black voters and their families. When asked to state in their own words the top concern facing them and their families, about three in four (73%) Black voters point to economic concerns, including 32% who mention inflation and the cost of living and 21% who mention financial problems such as loss of income and making ends meet. Voters under age 65 are particularly likely to mention economic concerns (78% vs. 53% of those ages 65 and older), while a larger share of those ages 65 and older mention health concerns (17% vs. 7% of those under age 65). Crime, gun violence, and safety were raised by 3% of Black voters, while 2% named racism and racial disparities.

    More broadly, at least six in ten Black voters say it’s a bad time to be a Black man (67%), a Black woman (62%), or a Black child (67%) in the US. Further, around eight in ten (81%) feel the economic system in the U.S. is stacked against people like them and a similar share say the same about the U.S. political system (79%).

    Economy And Cost Of Living Are Top Personal Concerns For Black Voters

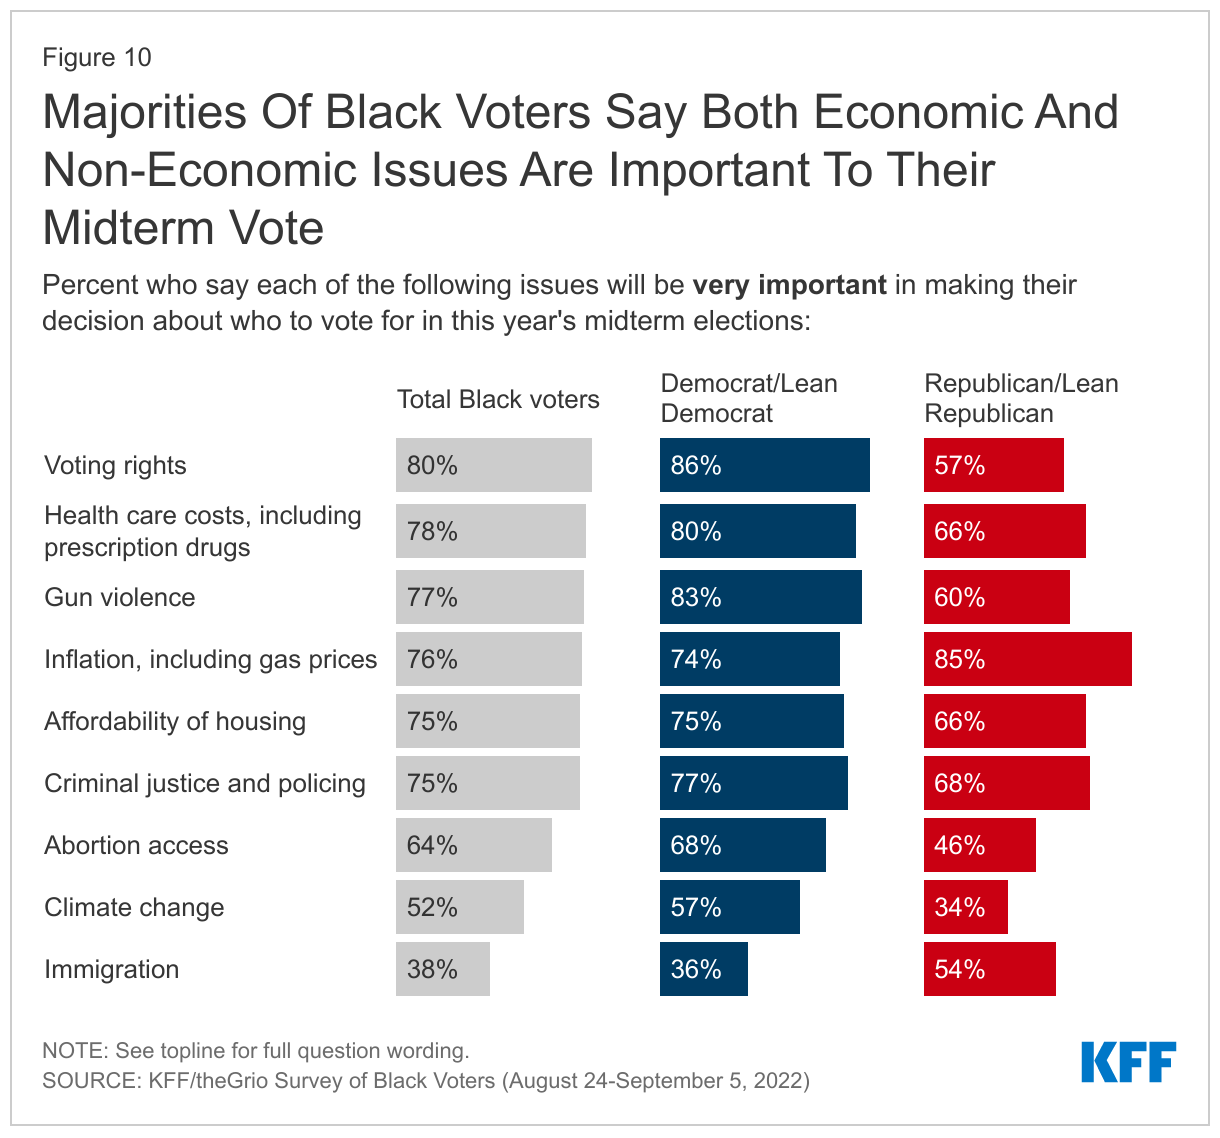
    Black voters prioritize a variety of issues as very important to their midterm vote, including economic as well as non-economic issues. Black voters cite an array of issues as very important when considering who to vote for this fall, with no one issue taking the top spot. In a top tier, six issues are clustered together, each with three in four or more Black voters who say the following are very important to their midterm vote: voting rights (80%), health care costs (78%), gun violence (77%), inflation, including gas prices (76%), criminal justice and policing (75%), and the affordability of housing (75%). Ranking somewhat lower is abortion access (64%), followed by climate change (52%), and immigration (38%). Mirroring broader partisan differences in the population as a whole, Black voters who identify as Democrats or lean toward the Democratic party are more likely to cite voting rights, health care costs, gun violence, abortion access, and climate change as important issues in their vote; those who identify or lean Republican are more likely to prioritize inflation and immigration.

    Black Voters Say Both Economic And Non-Economic Issues Are Important To Their Midterm Vote

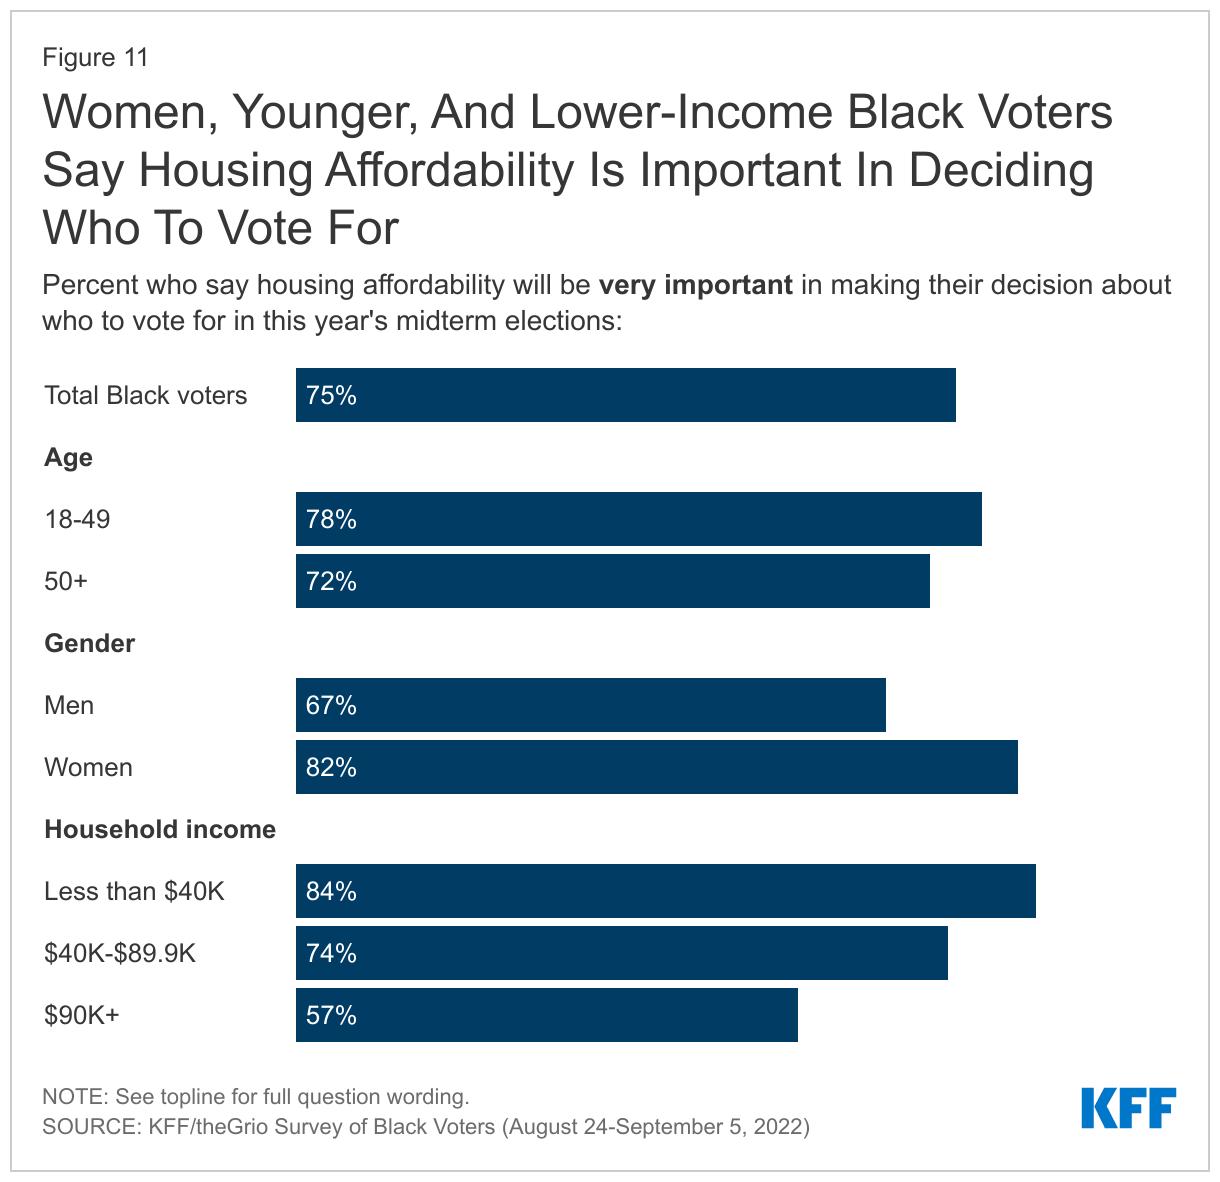
    Housing affordability ranks higher as a voting issue for certain groups of Black voters, including women, younger voters, and those with lower incomes. Housing affordability is a top issue for lower-income Black voters, with 84% of voters with incomes under $40,000 saying it is very important to their vote, compared to 57% of those with incomes of $90,000 or more. The cost of housing is also named as an important voting issue by a larger share of younger voters compared to older Black voters (78% of those under age 50 vs. 72% of those 50 and older) and for Black women compared to men (82% vs. 67%).

    Gender is an important divide on other issues as well. Beyond housing affordability, Black women voters are more likely than Black men voters to say certain issues are very important to their vote, including health care costs (83% vs. 73%), gun violence (84% vs. 69%), inflation (79% vs. 71%), and abortion access (68% vs. 58%).

    Women, Younger, And Lower-Income Black Voters Prioritize Housing Affordability In Making Decision About Who To Vote For


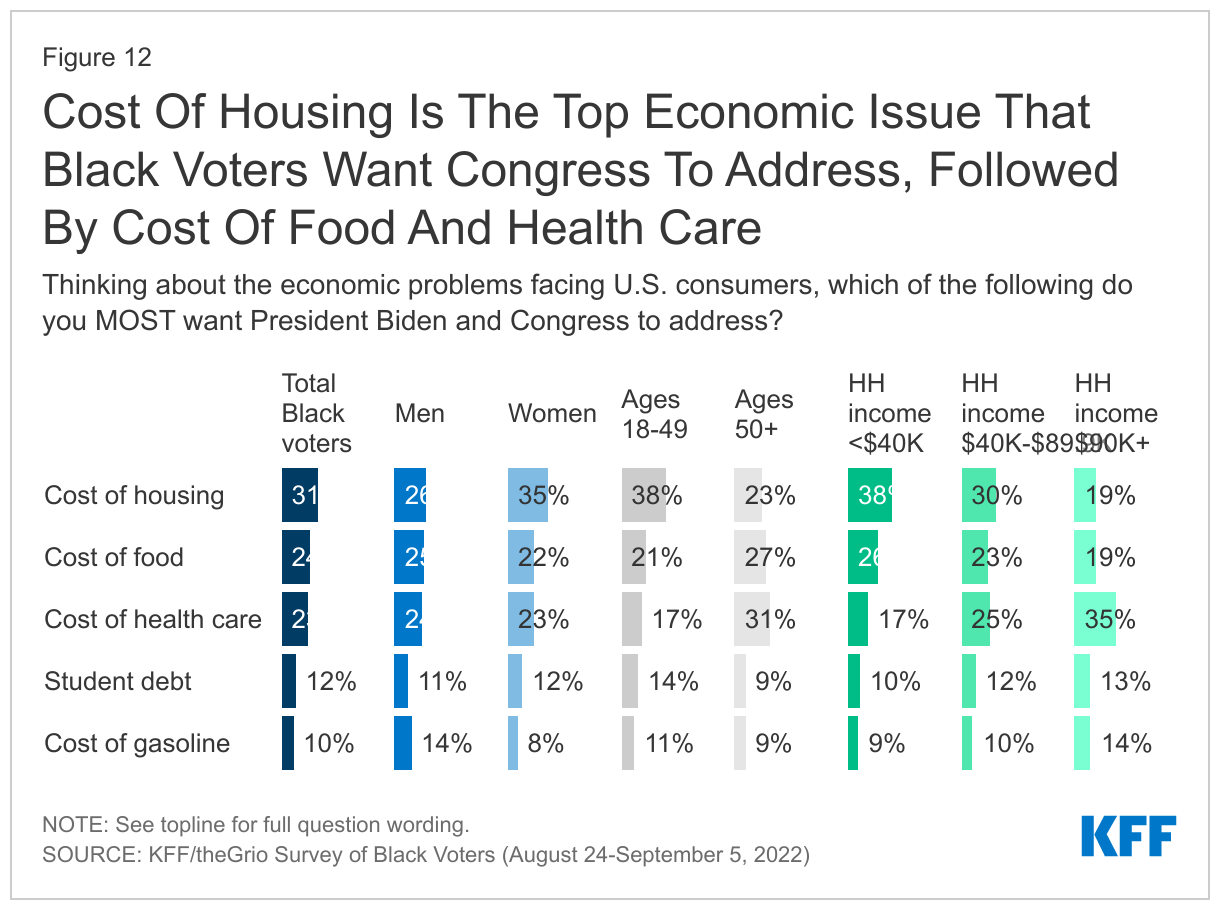
    When asked about economic issues they would most like Biden and Congress to address, Black voters focus on basics like food and housing as well as the cost of health care. Of the issues polled, the cost of housing is a top concern for Black voters, with about three in ten (31%) saying it is the economic issue facing U.S. consumers they most want the President and Congress to address, including higher shares of women, younger voters, and those with lower incomes. About a quarter cite other necessities like the cost of food and health care, respectively.

    In a sharp turnaround from early this summer, when gas prices were at their peak and the cost of gasoline took the top spot in a KFF poll of all adults, the cost of gas now ranks lower as a priority among Black voters.1  One in ten Black voters now cite the cost of gasoline as the economic problem they most want the President and Congress to address, while a similar share (12%) cites student debt.2 

    Cost Of Housing Top Economic Issue Black Voters Want President And Congress To Address, Followed By Cost Of Food And Healthcare

    Black Voters Express Negative Views Of The Supreme Court

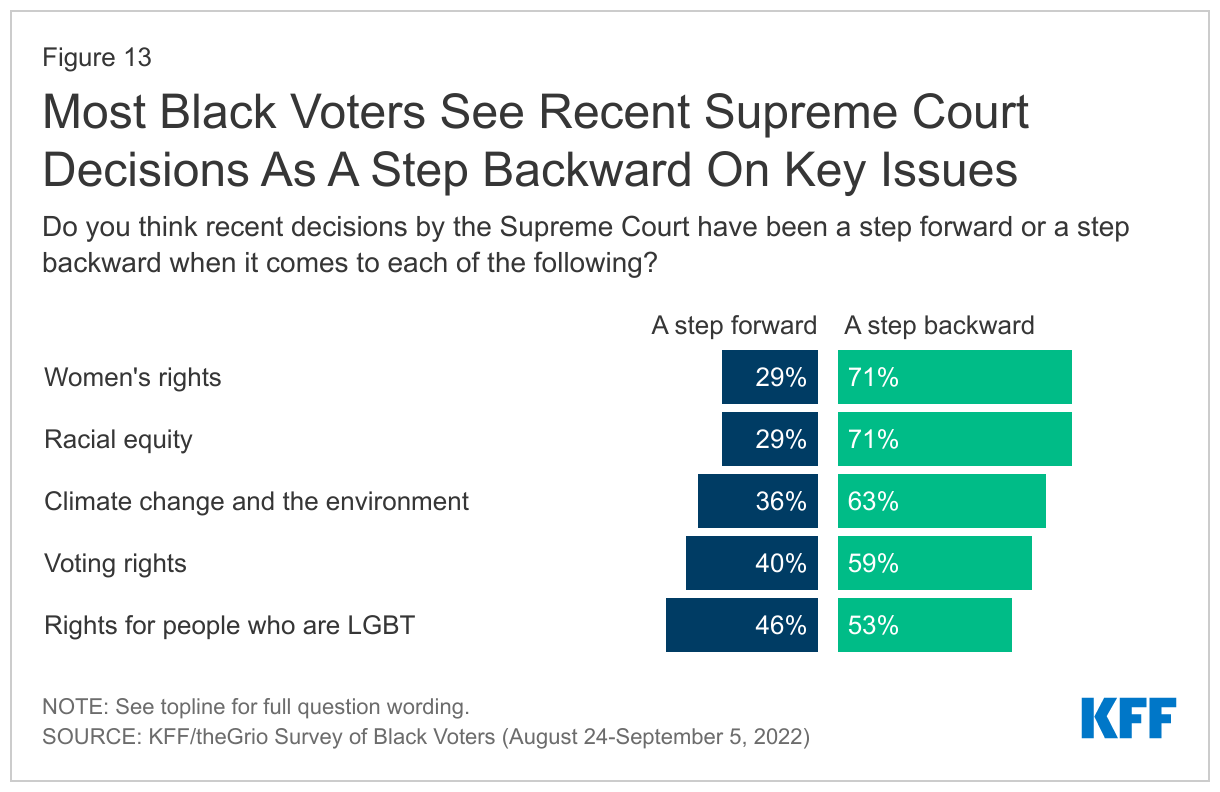
    Most Black voters say recent Supreme Court decisions are a step backward when it comes to women’s rights, racial equality, climate change, and voting rights. About seven in ten Black voters say recent Supreme Court decisions have been a step backward on women’s rights (71%) and racial equity (71%), while about six in ten say the same about climate change (63%) and voting rights (59%). Black voters are more divided on the impact of recent Court decisions on LGBT rights, about half (53%) see the decisions as a step backward and nearly as many (46%) seeing a step forward.

    Most Black Voters See Recent Supreme Court Decisions As A Step Backward On Key Issues

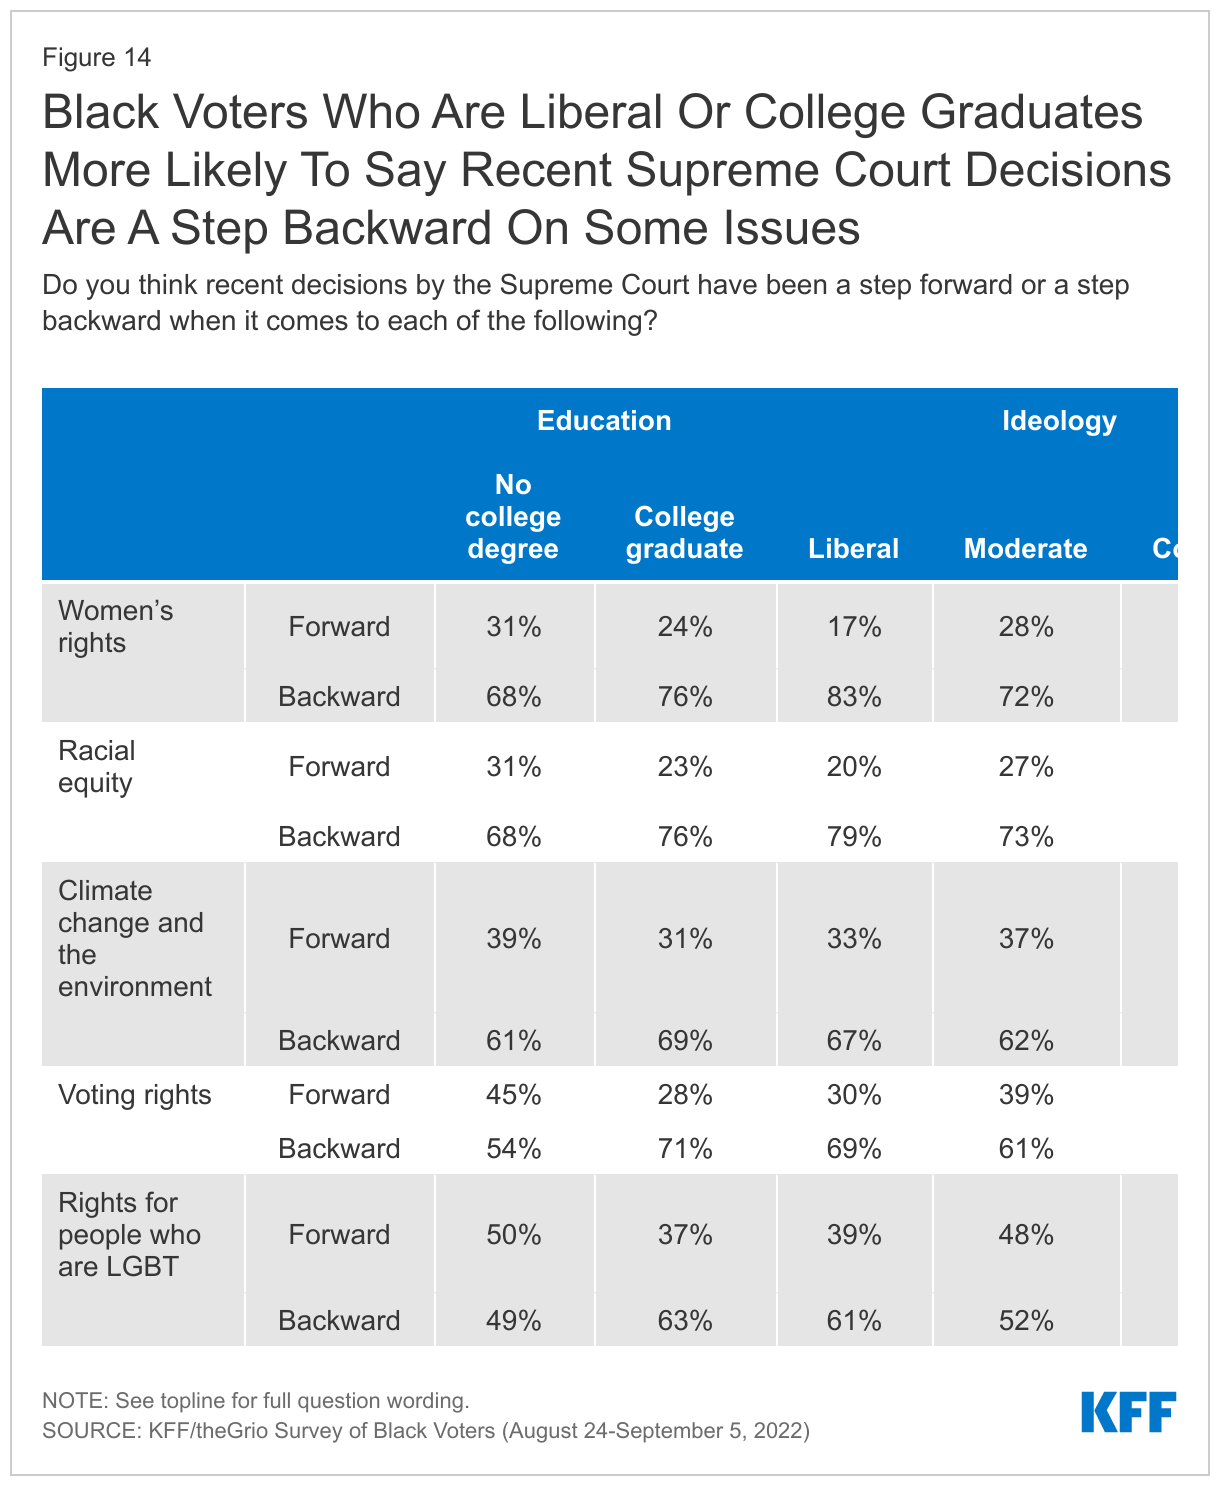
    Black voters who identify as Evangelical Christians, conservatives, and those who are Republican or lean toward the Republican party are more likely to say the recent decisions are a step forward on most of the issues asked. And Black voters who are college graduates are more likely than non-graduates to see recent decisions as a step backward on each of the topics polled.

    Black Voters Who Are Liberal, College Graduates More Likely To Say Recent Supreme Court Decisions Are A Step Backward

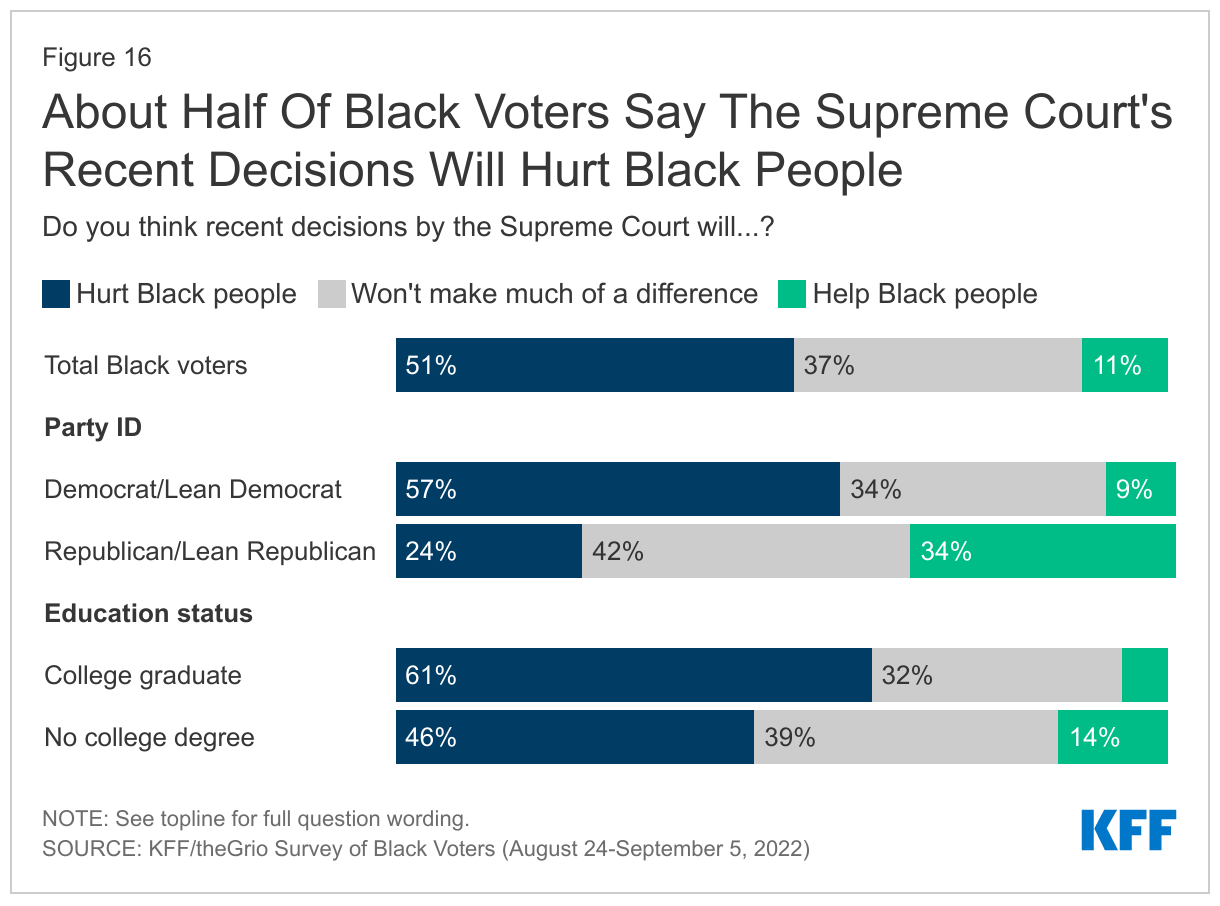
    A large majority of Black voters believe that Supreme Court justices decide cases based on politics and ideology rather than the law, and about half of Black voters say recent Court decisions will directly hurt Black people. Seven in ten Black voters believe Supreme Court justices decide cases mainly based on politics and ideology rather than the law. The majority of Black Democrats and those who lean Democrat (72%) think decisions are based on politics and ideology, but Republicans and Republican leaners are more split: 51% say decisions are made on the law, while 47% say they are made on politics and ideology.

    Seven In Ten Black Voters Think Supreme Court Justices Mainly Decide Cases Based On Politics And Ideology

    When asked more directly about the impact of recent Court decisions on Black people, 51% of Black voters say recent decisions will hurt Black people, 11% say they will help, and 37% say they won’t make much of a difference.

    About Half Of Black Voters Say The Supreme Court's Recent Decisions Will Hurt Black People

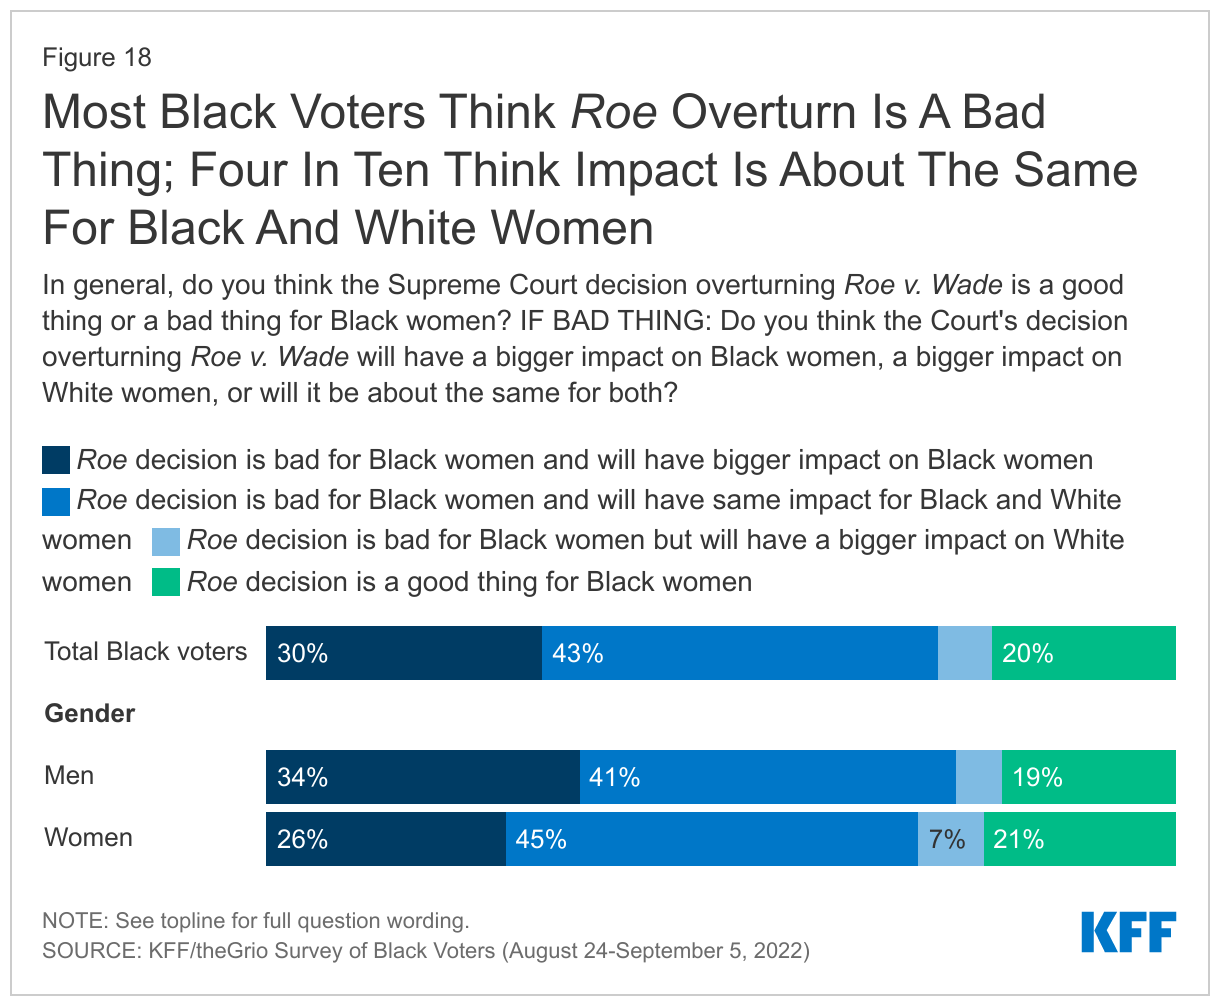
    Eight in ten Black voters disapprove of the Supreme Court’s decision to overturn Roe v. Wade (81%). This share is similar across gender, age, education, and income groups. Black voters who identify as Republicans or lean toward the party are the only group that is more split on the decision, with about half (54%) approving and the other half disapproving (46%). About a quarter (27%) of Black voters who identify as Evangelical Christians approve of the overturn of Roe, far fewer compared to White Evangelicals (72%) as measured in a KFF survey of all adults in September. The same survey also found that Black voters are more likely to disapprove of the Roe overturn than are Hispanic voters (67%) and White voters (57%).

    Eight In Ten Black Voters Disapprove Of Roe Overturn

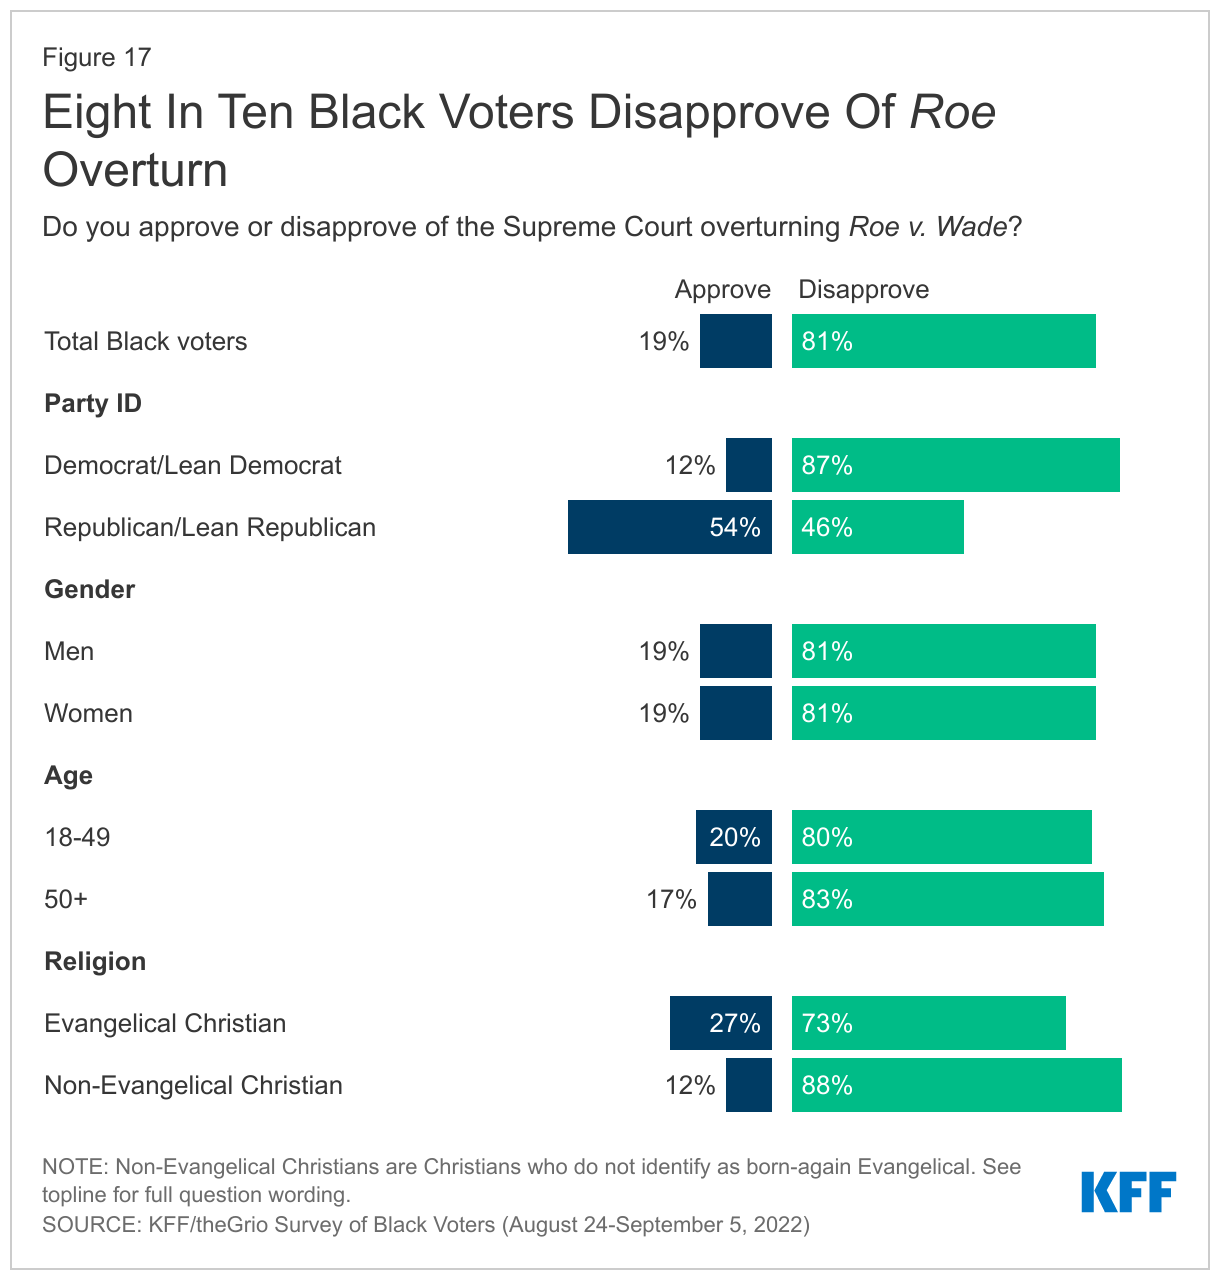
    Most Black voters see the Court’s overturn as a bad thing for Black women, but a smaller share believes the Roe overturn will have a disproportionate impact on Black women compared to White women. Nearly eight in ten (79%) of Black voters say the decision to overturn Roe is a bad thing for Black women. However, most don’t see the decision disproportionately impacting Black women: 30% say the decision will have a bigger negative impact on Black women compared to White women, while 43% say the negative impact will be about the same for both groups. Black men are slightly more likely than Black women to say the decision will have a bigger negative impact on Black women than White women (34% vs. 26%), while almost half (45%) of Black women say the negative impact will be the same for both Black and White women.

    Most Black Voters Think Roe Overturn Is A Bad Thing; Four In Ten Think Impact Of Overturn Is About The Same For Black And White Women


    Six In Ten Black Voters Say Congress Should Prioritize Policies To Improve Health Care For Black People

    When asked about various things Congress could do to help improve health care for Black people in the US, Black voters prioritize many potential policies, with about six in ten saying each option polled should be a top priority. Nearly two-thirds (64%) of Black voters say increasing funding for services that would improve health care for Black mothers and babies is a top priority. About six in ten prioritize expanding government health insurance for lower-income people in states that have not expanded their Medicaid programs (62%) as well as increasing funding for treating health problems like heart disease and diabetes that disproportionately affect Black people (60%). A similar share (57%) also say it should be a top priority for Congress to increase funding to train medical professionals on anti-racism and how to provide culturally appropriate health care to Black people.

    A Majority of Black Voters Prioritize Policies to Improve Black Health Care For Black People

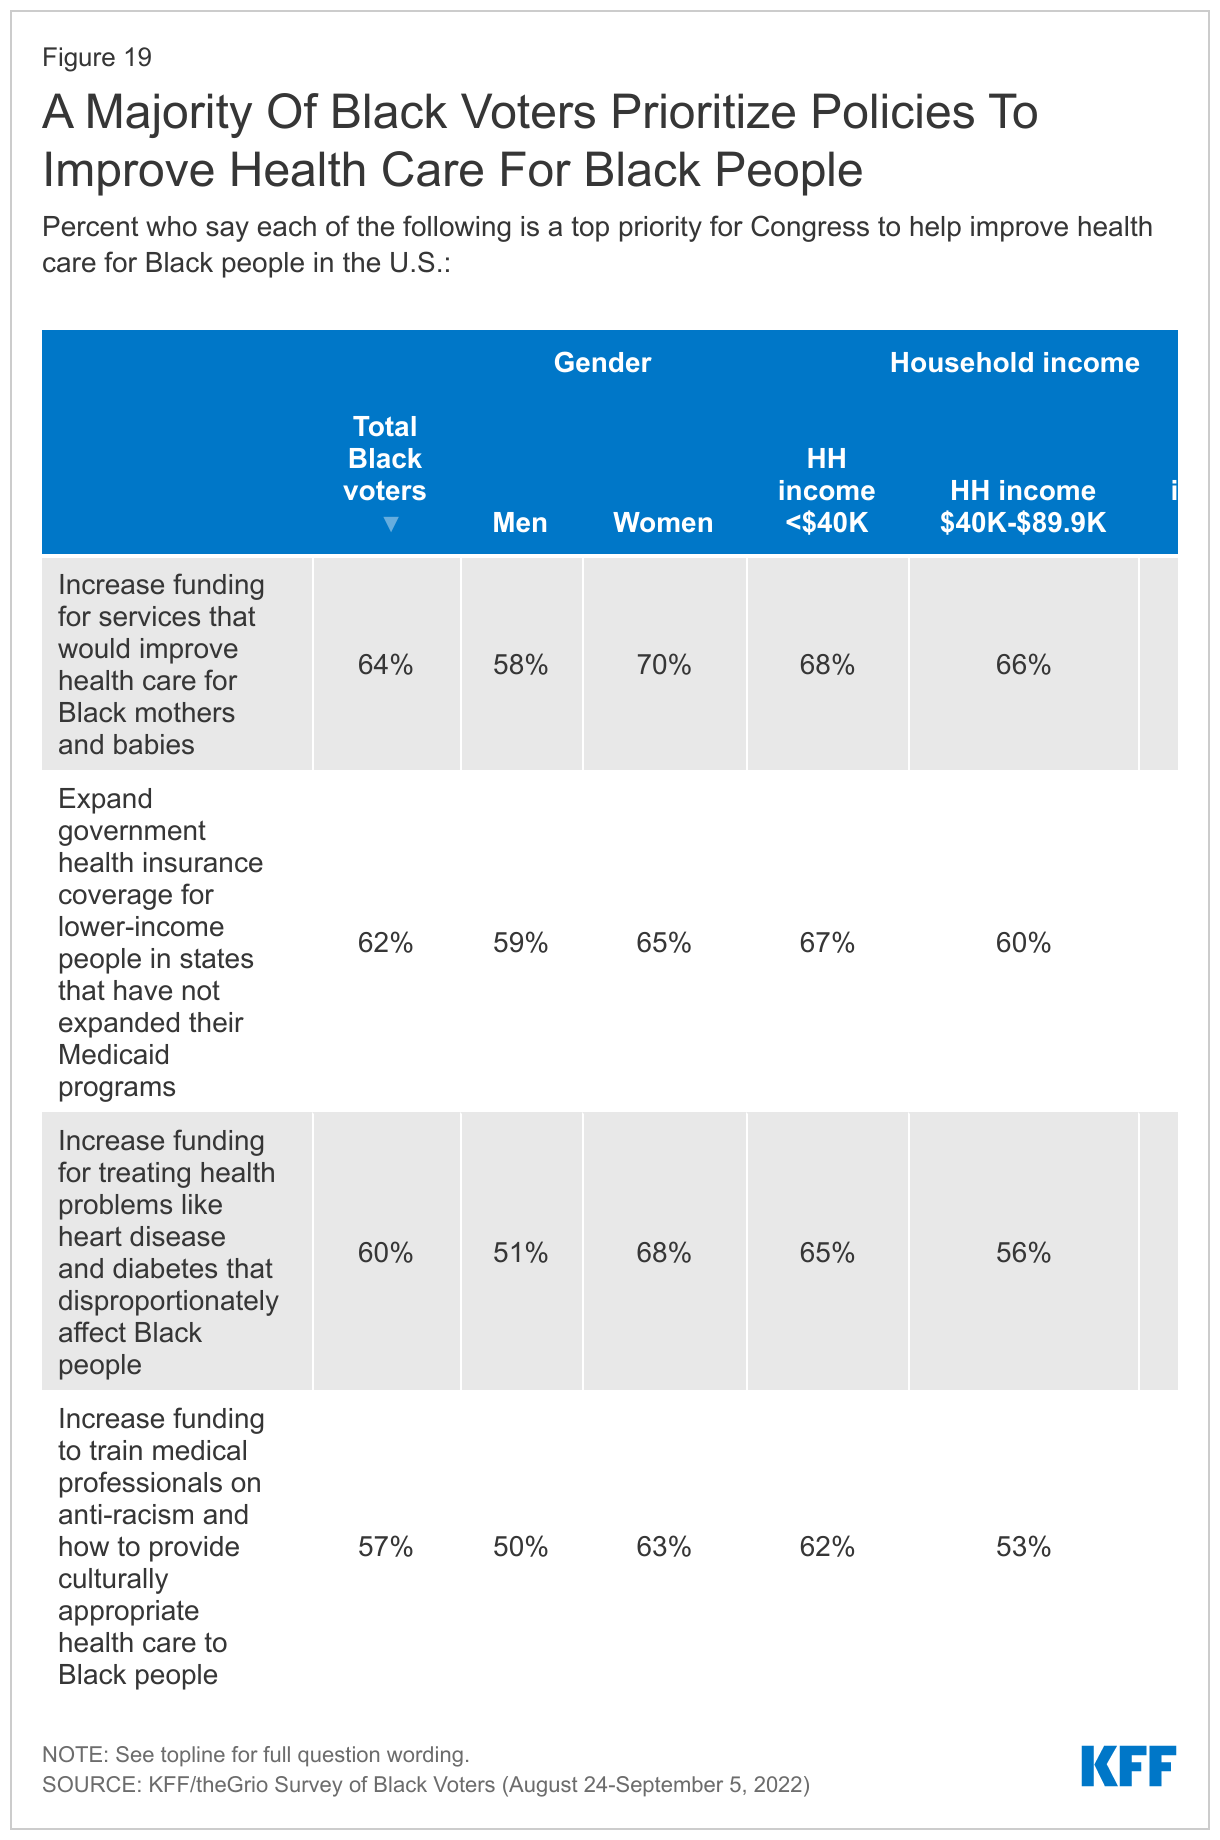
    On many of these issues, Black women voters and those with lower incomes are particularly likely to see each of these as top priorities for Congress. Larger shares of Black women than Black men voters say increasing funding for services that would improve health care for Black mothers and babies (70% vs. 58%), increasing funding for health problems that disproportionately affect Black people (68% vs. 51%), and training medical professionals on anti-racism and culturally appropriate care (63% vs. 50%) should be top priorities for Congress.

    Black voters with household incomes of less than $40,000 a year are more likely than those with incomes of $90,000 or more to say Congress should prioritize increasing funding for services to improve health care for Black mothers and babies (68% vs. 52%). There is a similar gap in the share of lower-income and higher-income Black voters who say it should be a top priority for Congress to expand government health insurance coverage for lower-income people in states that have not expanded their Medicaid programs (67% vs. 54%).

    Views On Gender And Sexual Identity Issues

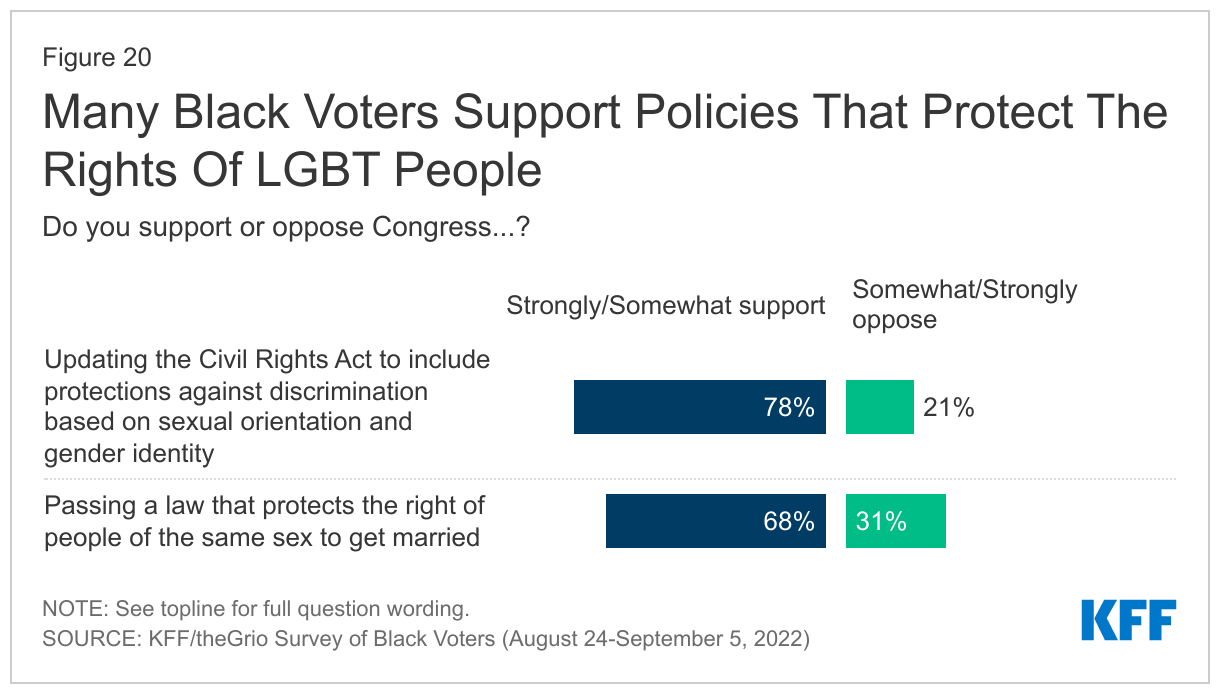
    In general, Black voters are supportive of policies that protect the rights of LGBT individuals, with more support among younger voters, those who identify as liberal, and those who themselves identify as LGBT. A large majority (78%) of Black voters support Congress updating the Civil Rights Act to include protections against discrimination based on sexual orientation and gender identity, including large majorities across age groups, and 93% of Black voters who identify as LGBT. Nine in ten liberal Black voters support updating the Civil Rights Act in this way (89%), but a majority (58%) of those who identify as conservatives do as well.

    Same sex marriage also garners solid support among Black voters, with more than two in three (68%) saying they support Congress passing a law to protect same sex marriage (including 44% who say they strongly support this measure). About nine in ten (93%) Black voters who identify as LGBT support protecting same sex marriage. Support differs by age among all Black voters, with nearly eight in ten (78%) Black voters ages 18-29 saying they support this compared to a narrower majority (55%) of those ages 65 and older. On this topic, about eight in ten (83%) liberal Black voters are in support, but conservative Black voters are split: 49% support it, while 51% oppose.

    Many Black Voters Support Policies That Protect The Rights Of LGBT People

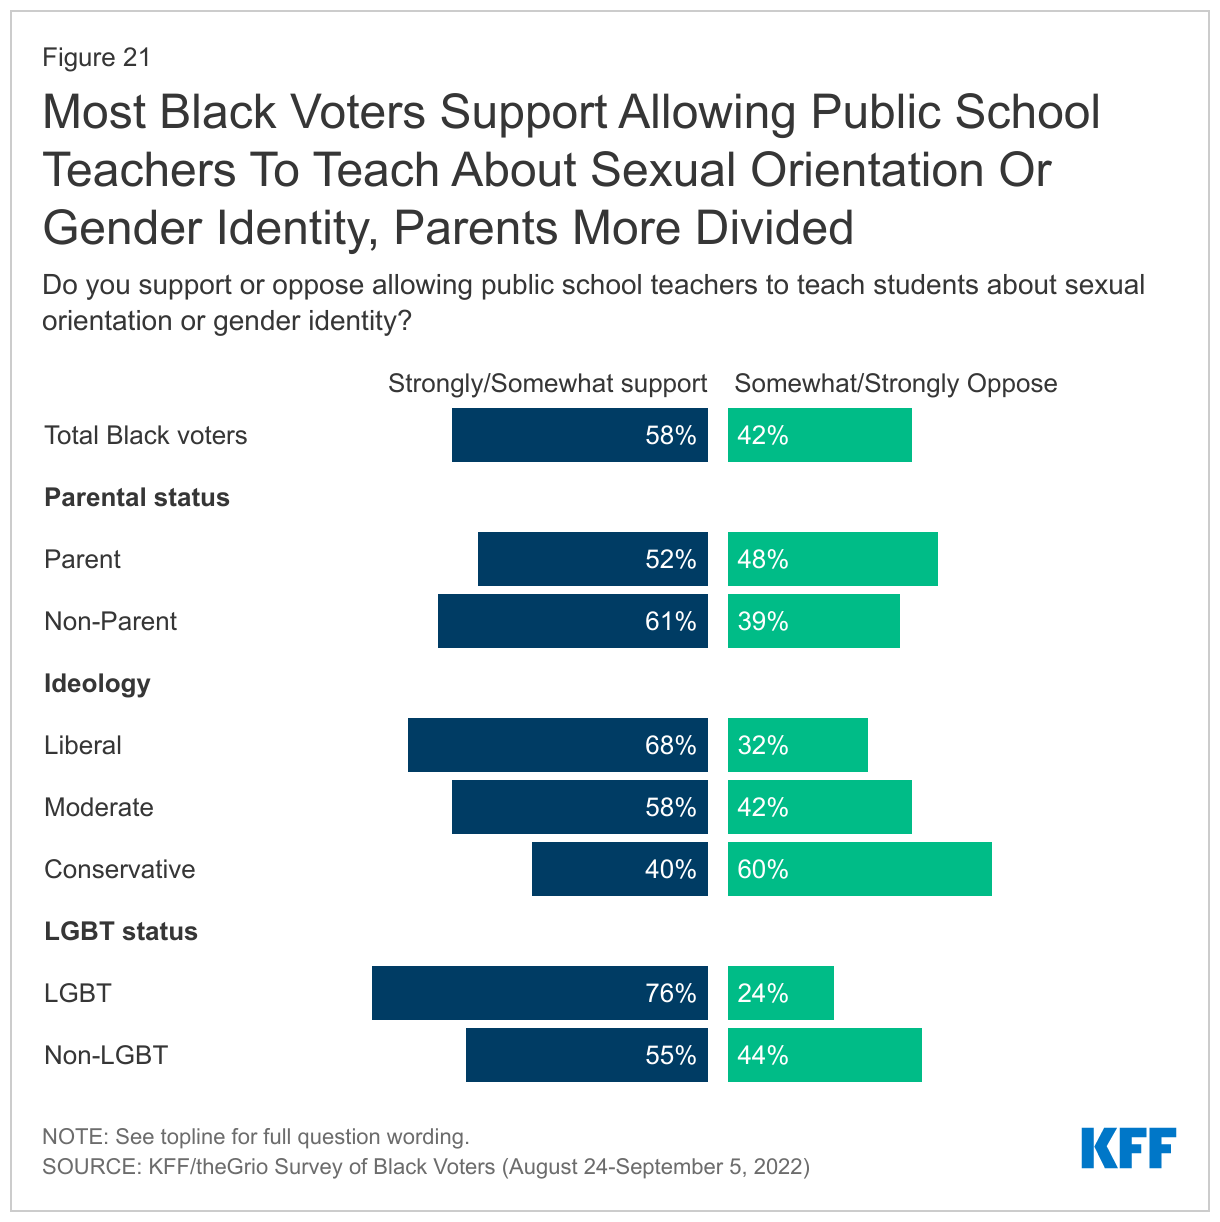
    Most Black voters support allowing public schools to teach students about sexual orientation and gender identity, but those who are parents are more divided. Nearly six in ten (58%) Black voters support allowing public school teachers to teach students about sexual orientation and gender identity. However, while a clear majority (61%) of Black voters who are not parents support this, Black voters who are parents of children under 18 are more divided (52% support and 48% oppose).

    Most Black Voters Support Allowing Public School Teachers To Teach About Sexual Orientation Or Gender Identity, Parents More Divided

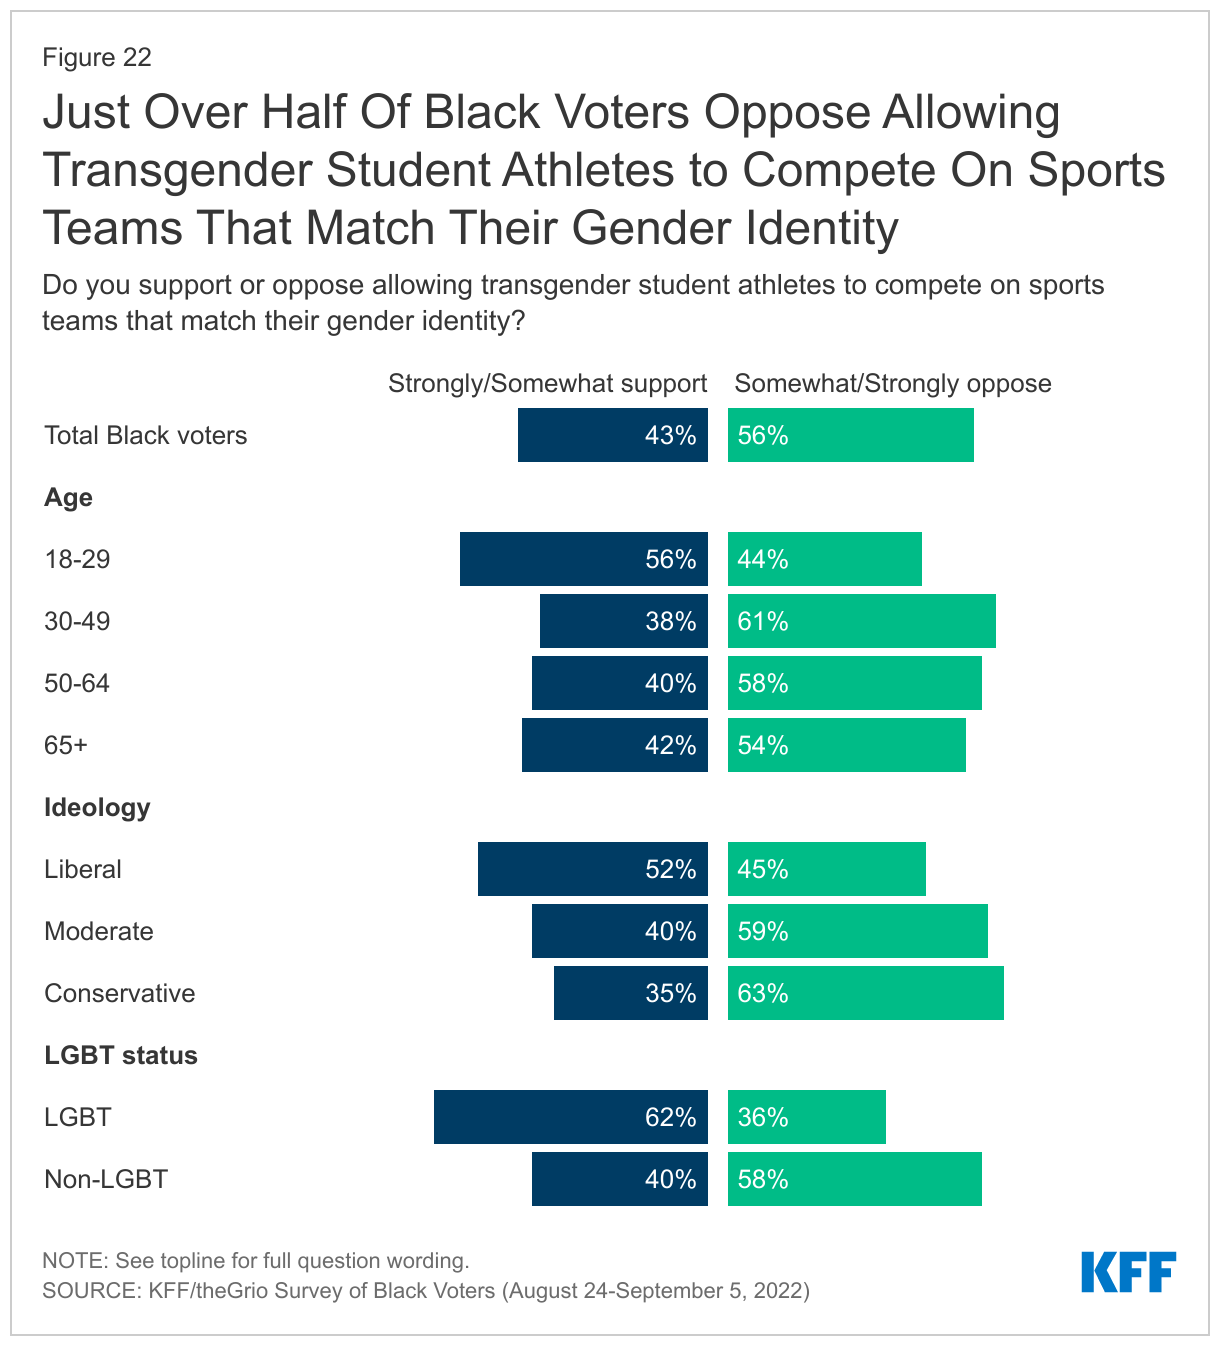
    More Black voters oppose rather than support allowing transgender student athletes to compete on sports teams that match their gender identity, though majorities of younger Black voters and those who identify as LGBT are in support. Fewer than half of Black voters (43%) support allowing transgender student athletes to compete on sports teams that match their gender identity, while 56% oppose. However, a majority (56%) of young Black voters aged 18-29 are in support, as are six in ten Black voters who identify as LGBT (62%) and about half (52%) of liberal Black voters.

    More Than Half Of Black Voters Oppose Allowing Transgender Student Athletes to Compete On Sports Teams That Match Their Gender Identity


    Black Voters And The Democratic And Republican Parties

    A much larger share of Black voters say the Democratic party does a good job of representing Black voters than say the same about the Republican party, but less than a quarter say the Democratic party represents the interests of Black voters very well. About three in four (73%) Black voters say the Democratic party represents the interests of Black voters “very” or “somewhat” well, which is more than three times the share who say the same about the Republican party (21%). However, this comparison masks a lackluster response about the Democrats: just 22% of Black voters say the Democratic Party represents Black voter interests “very” well. This is only slightly higher – 27% – if the sample is limited to Black voters who identify as Democrats or lean that way. And, in a sign that the Democratic party may have a tenuous hold on younger Black voters, there is large gap between Black voters under age 50 (64%) and those ages 50 and older (85%) who say the Democrats represent Black voters’ interests at least somewhat well.

    Black Voters Say The Democratic Party Represents Their Interests, But Fewer Than A Quarter Say Very Well

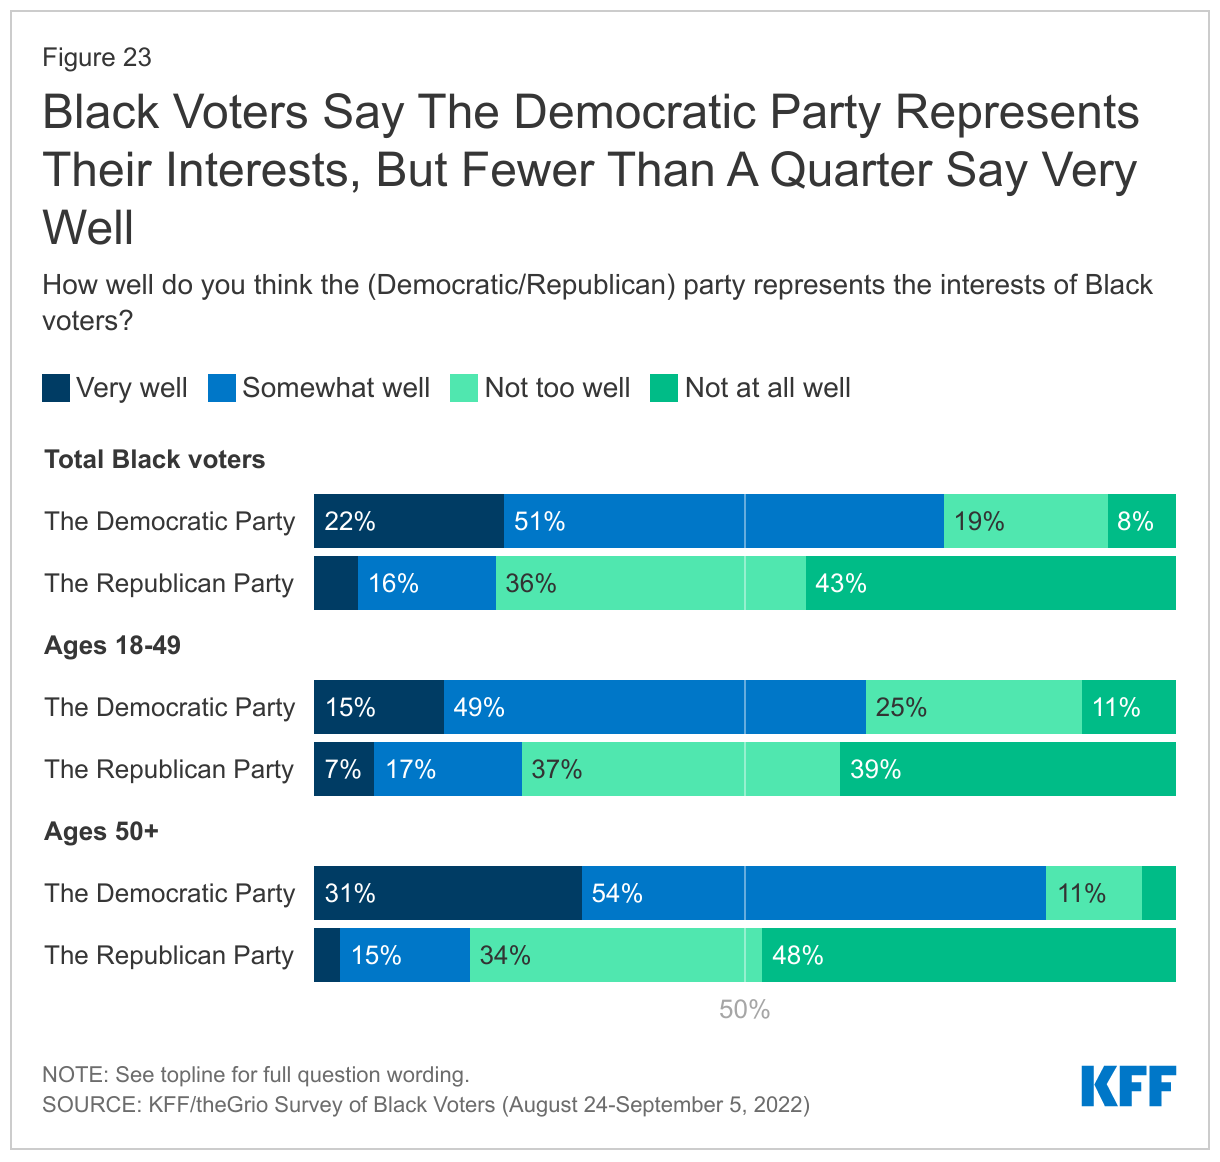
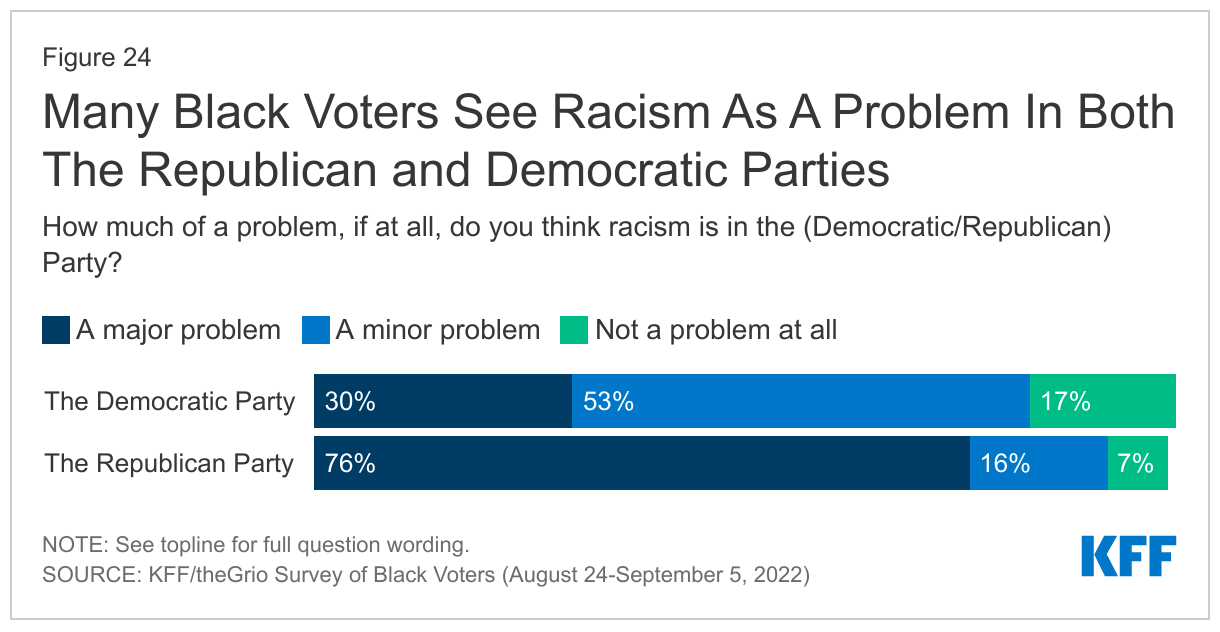
    A large majority of Black voters see racism as a major problem in the Republican Party, and most believe racism is at least a minor problem in the Democratic Party as well. Black voters draw a distinction between the two major parties when it comes to racism, with about three in four saying racism is a major problem in the Republican party (76%), compared to three in ten who say the same of the Democratic party. However, about half (53%) see racism as a minor problem in the Democratic Party, and fewer than one in five (17%) say racism is not a problem at all in the Democratic party.

    Many Black Voters See Racism As A Problem In Both The Republican and Democratic Parties

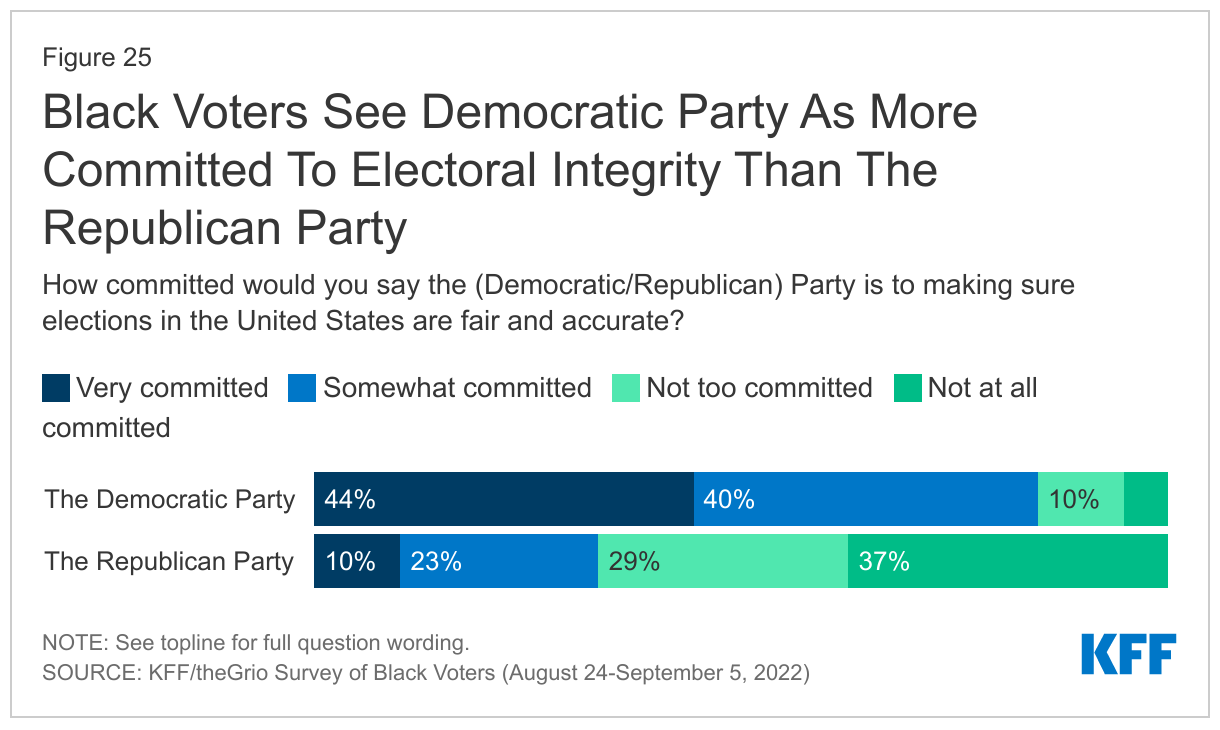
    The Democratic party has a clear advantage among Black voters on the perception of electoral integrity. A large majority (85%) of Black voters say the Democrats are very or somewhat committed to making sure US elections are fair and accurate, compared to about one third (34%) who say the same about the Republican party.

    Democratic Party Seen As More Committed to Electoral Integrity Than Republican Party By Black Voters

    Most Black voters are aware that they are a key voting bloc for the Democrats. About eight in ten (83%) say that Black voters are important for the Democratic party to win elections, including half (50%) who say they are “absolutely essential” to the party’s electoral success, and a third (33%) who say they are “very important.”

    Joe Biden and Kamala Harris in 2024 and Beyond

    Black Democratic voters and those who lean toward the party are split on whether the Democratic Party should renominate Joe Biden for 2024. Among Black voters who identify as Democrats or lean that way, about half (49%) say the party should renominate Biden for President in 2024, while the other half (50%) say the party should nominate someone else. There is an age divide on Joe Biden’s future in office, with Black Democrats and Democratic leaners under 50 more likely to say they want someone else in 2024 than those older 50. About six in ten (59%) younger Black Democrats and leaners say they want someone else, while four in ten want Biden to be renominated. Among Black Democrats and leaners 50 and older, nearly six in ten (57%) say they want Biden to be renominated, and 42% say they want the Democratic Party to nominate someone else for President. Black voters who voted for Biden for president in 2020 are also divided on his future prospects (48% say renominate Biden and 51% say someone else).

    Black Democrats And Those Who Lean Toward The Party Are Split On Whether To Renominate Biden For 2024

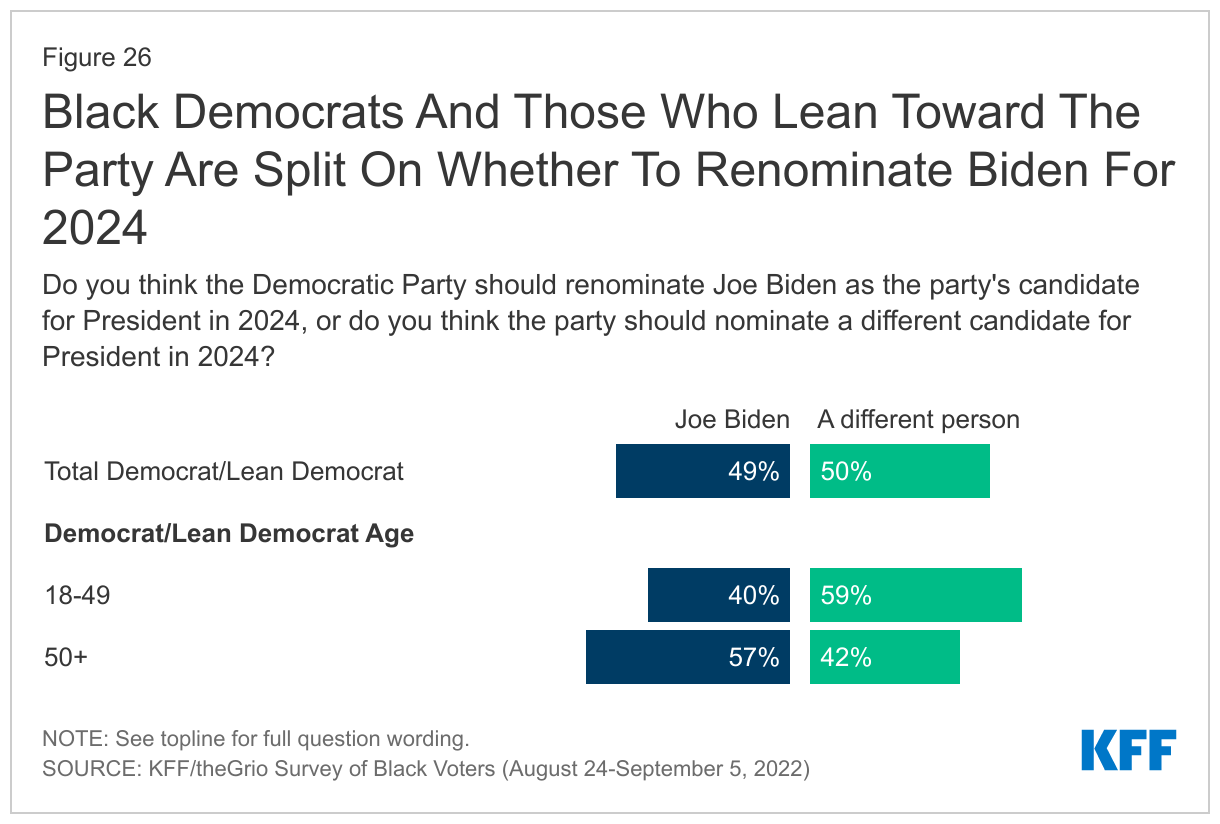
    Black Democratic voters who disapprove of Biden’s job performance are much more likely to say they want a different candidate in 2024. Among Black Democrats and Democratic leaning voters who disapprove of Biden’s job performance, nine in ten (91%) want a different Democratic nominee in 2024. It is notable that even among Black Democrats and leaners who approve of his job performance, about four in ten (41%) want the party to nominate someone else in 2024.

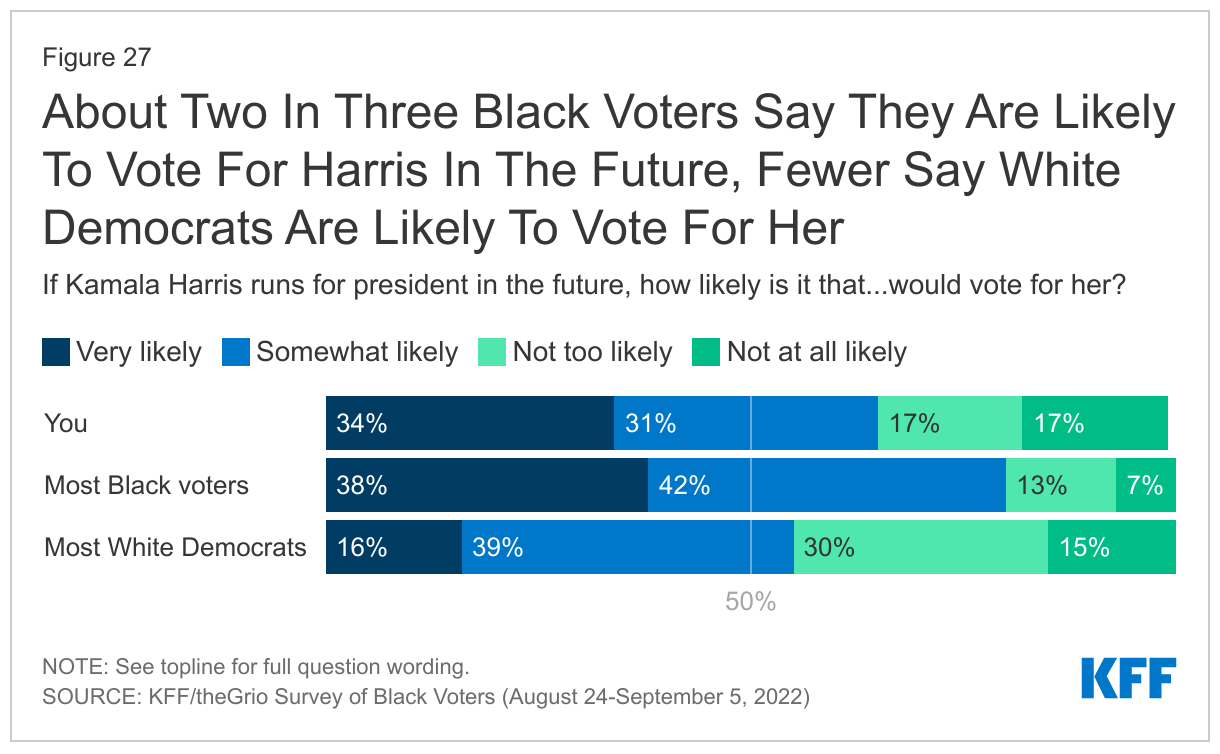
    Most Black voters support a future Presidential bid by Kamala Harris, but her support is weakest among young voters. About two-thirds of Black voters say they would be very or somewhat likely to vote for Kamala Harris if she runs for president in the future, with about a third saying they would be “very likely.” Though most say they would be at least somewhat likely vote for her in the future, support for a future Harris presidential run is lower among Black voters under age 50 (57%) than among voters 50 and older (76%). Harris also gets higher support from women (69% vs. 60% of men), particularly women ages 50 and over (78%).

    Majorities of Black voters say most Black voters would vote for Harris in the future, but fewer say they think White Democrats would. Eight in ten Black voters say they think most Black voters are at least somewhat likely to vote for Harris in the future. A much smaller share, though still a majority (55%) of Black voters say that White Democrats would be somewhat or very likely to vote for Harris, with 16% who say White Democrats would be “very likely”.

    About Two-Thirds Of Black Voters Say They Are Likely To Vote For Harris In The Future, Fewer Believe Most White Democrats Are Likely To Do The Same

    Methodology

    The KFF/theGrio Survey of Black Voters was conducted August 24-September 5, 2022, online and by telephone among a nationally representative sample of 1,000 U.S. adults in English who identify as Black or African American and are registered to vote. The sample includes 800 Black adults registered to vote reached online through the SSRS Opinion Panel. An additional 100 respondents were reached online through the Ipsos KnowledgePanel. To reach Black voters who do not use the Internet, another 100 interviews were conducted by calling back respondents who previously participated in an SSRS Omnibus poll and identified as Black and said they did not use the Internet. Sampling, data collection, weighting, and tabulation were managed by SSRS in close collaboration with KFF researchers. Teams from KFF and theGrio worked together to develop the questionnaire and analyze the data, and KFF financed the survey. Each organization is solely responsible for its content.

    The SSRS Opinion Panel is a nationally representative probability-based panel where panel members are recruited randomly in one of two ways: (a) through invitations mailed to respondents randomly sampled from an Address-Based Sample (ABS) provided by Marketing Systems Groups (MSG) through the U.S. Postal Service’s Computerized Delivery Sequence (CDS); (b) from a dual-frame random digit dial (RDD) sample provided by MSG. The SSRS Omnibus survey is a nationally representative bilingual telephone survey designed to meet standards of quality associated with custom research studies. Sample for the SSRS Omnibus was obtained through Marketing System Groups (MSG). The Ipsos KnowledgePanel is a nationally representative probability-based panel where members are recruited randomly using ABS based on a stratified sample from the CDS. For the online panel components, invitations were first sent by email to panel members who previously identified as Black or African American, followed by up to three reminder emails. Respondents in the phone samples received a $10 incentive.

    Both phone and web samples were asked to confirm their race and voter registration status in order to be eligible. Respondents were considered eligible if they identified as Black or African American even if they also identified as Hispanic or another race group.

    The combined cell phone and panel samples were weighted to match the sample’s demographics to the national U.S. population of Black or African American adults (including Hispanic Black and multi-racial Black adults) who are registered to vote using data from the Census Bureau’s 2020 Current Population Survey (CPS) Voting and Registration supplement. Weighting parameters included sex, age, education, race/ethnicity, region, and education. The weights take into account differences in the probability of selection for each sample type (callback sample and panels). This includes adjustment for the sample design, within household probability of selection, and the design of the panel-recruitment procedure.

    The online questionnaire included two questions designed to establish that respondents were paying attention. Surveys with a length less than one quarter of the mean length by mode were flagged and reviewed. Cases that failed two quality control questions (i.e. trap questions) were also flagged and reviewed. One case was removed due to a short survey length and failure of the two quality control questions.

    The margin of sampling error including the design effect for the full sample is plus or minus 4 percentage points. Numbers of respondents and margins of sampling error for key subgroups are shown in the table below. Sample sizes and margins of sampling error for other subgroups may be higher and are available by request. Sampling error is only one of many potential sources of error and there may be other unmeasured error in this or any other public opinion poll. KFF public opinion and survey research is a charter member of the Transparency Initiative of the American Association for Public Opinion Research.

    GroupN (unweighted)M.O.S.E.
    Total Black voters1,000± 4 percentage points
    Age
    18-49567± 5 percentage points
    50+433± 6 percentage points
    Party identification
    Democrats/Democratic-leaning independents758± 4 percentage points
    Republicans/Republican-leaning independents103± 11 percentage points


    Endnotes

    1. The survey was completed before gas prices started to rise again in September after falling in the prior months. ↩︎
    2. The survey was launched the day after President Biden’s August 24, 2022 student debt relief announcement. ↩︎

    2022 Survey of ACA Marketplace Assister Programs and Brokers

    Authors: Karen Pollitz, Jennifer Tolbert, Kaye Pestaina, and Salem Mengistu
    Published: Oct 17, 2022

    Executive Summary

    The Affordable Care Act (ACA) expanded affordable health coverage options in the U.S., helping to reduce the number of uninsured individuals. Even so, KFF has found that most people who remain uninsured are nonetheless eligible for coverage and financial assistance through the Marketplace or Medicaid. Many consumers – including most uninsured – have limited awareness of affordable coverage options available to them under the ACA. And the steps people must take to get and keep coverage can sometimes be complex. Accordingly, the ACA required federal and state Marketplaces to establish and invest in consumer assistance to conduct outreach and public education and to help connect people to affordable coverage.

    KFF conducted a national, online survey of Marketplace Assister Programs and brokers in 2022. To build the sample for the survey, contact information for Assister Programs and brokers was collected from State Marketplaces (SBM), the Center on Medicare and Medicaid Services (CMS) which administers the Federal Marketplace (FFM), and the Health Resources and Services Administration (HRSA) which oversees enrollment assistance by Federally Qualified Health Clinics (FQHCs). A total of 3,496 Assister Programs were invited by email to participate in the survey, and 258 Programs responded and were included (for a response rate of 7.4%). We also contacted 68,705 brokers certified to sell Marketplace coverage and 1,424 responded and were included (for a response rate of 2.1%). Additional description of survey methods is included in the Topline accompanying this report.

    Our survey asked Assister Program directors and brokers about the help they provided consumers before, during and after the 2022 Open Enrollment Period, reasons people sought help, factors affecting the enrollment process, and other issues. Key findings include:

    Assister Programs and brokers report that the need for consumer assistance is high among people they serve. Overwhelmingly, Assister Programs (76%) and brokers (69%) said most or nearly all of the consumers they helped during this ninth ACA Open Enrollment lacked confidence to apply on their own; about two-thirds of Assister Programs (64%) and brokers (66%) said most to nearly all the people they helped had limited understanding of ACA requirements and benefits. Most Assister Programs and brokers (54% each) also said the majority of consumers they helped had difficulty understanding basic health insurance terms and concepts. Consumers also needed help answering questions about their household income and composition, and help comparing a large number of plan choices. Some consumers present with complex cases or need language assistance – challenges that Assister Programs say require more resources and technical help than is available from the Marketplace.

    Most Assister Programs and brokers said the average time needed to help people newly applying through the Marketplace continued to be between 1 and 2 hours; for consumers returning to renew or change coverage, it was up to 1 hour. This is similar to findings in previous KFF surveys in 2016, 2015, and 2014.

    Consumer awareness about Marketplace subsidies and rules is still limited. Nearly all Assister Programs (89%) and brokers (80%) this year also helped consumers last year to sign up for coverage or update subsidies during the 2021 COVID-19 enrollment period. Newly enhanced Marketplace subsidies became effective during the 2021 COVID enrollment period, though our respondents observed that consumer awareness about the enhanced subsidies was low; 71% of Assister Programs and 75% of brokers said most to nearly all consumers they helped during the 2021 COVID enrollment period were unaware of the new, improved subsidies when they first came in for help.

    Assister Programs report that some consumers eligible for Medicaid experience delays in getting a final eligibility determination. In 17 states the Marketplace determines Medicaid eligibility, while in the rest, the Marketplace transfers files to Medicaid for a final eligibility determination, which can cause delays. As a result, Assister Programs report the time it takes for consumers to receive an eligibility determination varies widely. Forty-three percent of Programs said eligibility determinations were determined in real time or Medicaid enrollment was automatic, while an equal share of Programs said the process takes longer – 11% said Medicaid determinations were provided in up to 7 days, 21% said determinations took from 8 days to one month, and 11% said it took longer than a month.

    Help from Brokers and Assister Programs is similar in many respects but not interchangeable. We also surveyed brokers certified by the Marketplace to sell qualified health plans. The type of help brokers reported providing and people they reported helping resembled that of Assister Programs, though there were important differences, likely reflecting differences in the clients served. In particular, brokers – who rely on commissions – were far less likely to help consumers sign up for Medicaid or CHIP (39% of brokers vs 88% of Assister Programs) and far less likely to conduct outreach activities (27% vs 62% of Assister Programs). Compared to Assisters, Brokers who responded to the survey reported that a smaller share of the consumers they helped were Hispanic, needed language assistance or help with immigration-related problems, or were uninsured.

    Brokers rely on private web sites over Marketplace sites. Most brokers (72%) surveyed report using private websites instead of the Marketplace to enroll consumers in QHPs at least some of the time. In most states brokers can use so-called direct enrollment (DE) sites, for example hosted by insurance companies, where consumers can sign up for Marketplace QHPs, though consumers generally are re-directed to the Marketplace site if they also need subsidies. The federal government also promotes use of Enhanced Direct Enrollment (EDE) sites – only available in federal marketplace states – where consumers can apply for both QHPs and marketplace subsidies without ever visiting HealthCare.gov. A majority of brokers in federal marketplace states (55%) said they never initiate QHP applications on HealthCare.gov. When asked why they prefer these alternate enrollment channels, many brokers cited technological features which HealthCare.gov does not offer, such as dashboards that enable them to more easily track client accounts and communicate with clients. Sixty percent of brokers surveyed who use private sites said they would use the Marketplace website more often if offered similar functionality.

    Brokers also continue to sell non-ACA-compliant policies. Most brokers (75%) said they also sold non-ACA-compliant policies – such as short-term plans — during Open Enrollment as an alternative or supplement to QHPs, though the volume of these sales was lower compared to QHP sales. For example, most brokers (54%) said they sold more than 50 QHPs during the 2022 Open Enrollment period, while most who also sold non-ACA-compliant policies (67%) said they sold 10 or fewer of these policies.

    Most Assister Programs expect to play a role helping consumers through the public health emergency (PHE) unwinding. It is anticipated that the COVID-19 Public Health Emergency may end sometime in 2023, at which point, state Medicaid agencies will resume eligibility redeterminations and will disenroll people who are no longer eligible or who are unable to complete the renewal process even if they remain eligible. As a result, between 5 and 14 million people are estimated to lose Medicaid coverage. Many who lose Medicaid may be eligible to buy subsidized QHPs, if they can navigate that transition. About half of Assister Programs (53%) said they have good working relationships with their state Medicaid agency and nearly 6 in 10 said they have contacted Medicaid to find out how they can help educate consumers about the need to renew their coverage. Half of all Assister Programs reported they are planning outreach activities to educate the public about the PHE unwinding and most (58%) said they will try to re-contact consumers whom they helped apply for Medicaid coverage in the past two years to collect updated contact information.

    Report

    Section 1: Help From Assister Programs During Open Enrollment

    Types of Assister Programs

    In all, based on administrative data, 3,490 Marketplace Assister Programs provided outreach and enrollment help to consumers during the ninth Affordable Care Act (ACA) Open Enrollment period, referred to in this report as the 2022 Open Enrollment. This is a smaller number of Programs (5,094) than operated in 2016. The Appendix to this report provides more detail on different types of Assister Programs. We surveyed Programs that fall into three main types:

    • Navigator Programs, by law, must be established and funded in every federal and state Marketplace to provide free, objective outreach and enrollment assistance. Staff must have expertise in eligibility and enrollment rules, the range of qualified health plan (QHP) options, financial help – both QHP subsidies and Medicaid/CHIP – and the needs of underserved and vulnerable populations, including individuals with limited English proficiency.
    • Certified Application Counselor (CAC) Programs must be certified by every Marketplace but not funded by the Marketplace. Most CAC Programs are sponsored by community non-profit organizations that voluntarily support outreach and enrollment assistance.
    • Federally Qualified Health Center (FQHC) Programs are operated by the network of clinics that receive federal funding to provide health care to low-income and underserved populations. The federal government provides additional funding to FQHCs to also provide eligibility and enrollment assistance in their communities. Most FQHCs (1,249 in 2022) are certified by Marketplaces as CAC Programs, but 85 centers are also certified as Marketplace Navigator Programs. (Figure 1)
    Types of Assister Programs, 2022

    Assister Programs tend to serve local communities. About three-fourths (77%) of Assister Programs served consumers in a limited geographic within a state. However, about four-in-ten (41%) Navigator Programs had state-wide service areas.

    Nearly all Assister Programs (93%) have been providing enrollment assistance for a number of years. Eighty-two percent of Assister Programs this year provided help to consumers during 5 or more Marketplace Enrollment Periods. Only 7% of Assister Programs said they provided enrollment assistance to consumers for the first time during the 2022 Open Enrollment period.

    Consumer Assistance Needs

    Navigator Programs tended to operate at a larger scale, helping more consumers compared to other types of Programs. During the 2022 Open Enrollment, most Navigator Programs (54%) helped at least 500 consumers and 34% of Navigator Programs helped more than 1,000 consumers. By contrast, among the other types of Assister Programs (CAC and FQHC), 40% said they helped no more than 100 consumers and 14% said they helped more than 1,000 people. (Figure 2)

    Number of Consumers Helped By Assister Programs During 2022 Open Enrollment

    Assister Programs also reported helping consumers eligible for Marketplace special enrollment periods (SEP). Outside of Open Enrollment, consumers can sign up for Marketplace coverage if they have a qualifying event, such as loss of other coverage, that makes them eligible for a SEP. Again, Navigator Programs tended to help more consumers with SEPs than did other Assister Programs. (Figure 3)

    Number of Consumers Helped with SEP Enrollments in 2022

    The reasons consumers seek help from Assister Programs has not changed much since 2016. About three-quarters of Assister Programs (76%) said most-to-nearly-all consumers sought help this year because they lacked confidence to apply for coverage and financial help on their own, and 64% said most or nearly all clients had limited understanding of the ACA. These findings are similar to what Programs reported in 2016. This year, fewer Assister Programs said most or all clients lacked Internet at home (16% vs 31% in 2016); but more Programs said most or nearly all clients needed language assistance (24% vs 17%) (Figure 4)

    Reasons Consumers Sought Help, 2016 and 2022

    The need for help, as reported by Assister Programs, continues even though most consumers now come to the Marketplace to renew coverage. This year, 48% of Assister Programs reported that most or nearly all consumers they helped were returning to the Marketplace to renew or change coverage.

    Insurance literacy limitations remain a challenge. Most Assister Programs (69%) said half or more of their clients needed help understanding basic insurance terms such as “deductible” and “in-network service,” (Figure 5)

    Consumers Need Help Understanding Basic Insurance Concepts

    A substantial share of consumers helped by Assister Programs were eligible for Medicaid. Nationwide, 43% of Assister Programs reported that most or nearly all consumers they helped were determined eligible for Medicaid or CHIP. More Programs in State-based marketplaces (SBM) said this was the case compared to those in federal-marketplace (FFM) states (58% vs 22%). All 21 SBM states have implemented the ACA Medicaid eligibility expansion while 12 of the FFM states have not. (Table 1)

    Eligibility Determinations of Consumers Helped by Assister Programs

    Assister Programs report serving consumers of diverse racial/ethnic backgrounds. A majority (56%) of Assister Programs estimate that half or more consumers they helped were non-white; with 32% of Programs reporting that at least three-quarters of their clients were non-white. One in five Programs (22%) reported half or more of the clients they served were Hispanic. Data about race and ethnicity, is key to understanding how the ACA is affecting access to coverage for people of color. All Marketplaces ask consumers to volunteer information about their race/ethnicity, but many do not answer. Most Assister Programs (63%) said they tell their clients why reporting this information can be useful.

    Section 2: Help Applying for Financial Assistance

    A primary role of Assister Programs is to educate the public about the availability of financial assistance – either through Marketplace subsidies or Medicaid – and to help people apply.

    Marketplace subsidy enhancements

    Through the American Rescue Plan Act (ARPA) Congress temporarily strengthened QHP subsidies, effective in 2021, and recently extended this subsidy enhancement through the end of 2025. QHP subsidy improvements were substantial, particularly for the lowest income individuals, making it possible for people with income up to 150% FPL ($19,320 for a single person in 2022, $32,940 for a family of 3) to apply for zero-premium plans with comprehensive cost sharing reductions (CSR). Previously, the poorest individuals were required to contribute at least 2.07% of income toward the premium for CSR plans. People with incomes above 400% of the poverty level ($51,520 for a single person, $87,840 for a family of 3 in 2022) also became eligible for premium assistance for the first time.

    Nearly all Assister Programs (89%) provided help to consumers during the extended COVID Enrollment period in 2021. As the new ARPA subsidies taking effect in 2021, the federal government required all Marketplaces to reopen for a special COVID-19 enrollment period that lasted seven months in HealthCare.gov states, and even longer in some state-based marketplaces. This special enrollment period gave Marketplace enrollees a chance to claim the newly enhanced subsidies and gave uninsured individuals a second chance to sign up for affordable plans. More than 2.5 million consumers signed up for new coverage during the 2021 COVID-19 enrollment period, and more than 2.6 million already-enrolled consumers came back to claim the enhanced subsidies.

    Overwhelmingly, Assister Programs said most consumers they helped during the COVID Enrollment period were unaware of the ARPA subsidy enhancements. 71% of Programs reported that most to nearly all clients first learned about the extra financial help from Assister Programs. (Figure 6)

    Awareness of Enhanced Subsidies Among Consumers Helped During the 2021 COVID-19 Enrollment Period

    Despite enhanced subsidies, assisters report that consumers still face tradeoffs between lower premiums and higher cost sharing. While new ARPA subsidies give consumers with the lowest income (up to 150% FPL) access to zero-premium silver plans with very low deductibles, those earning between 150&-250% FPL must pay at least a portion of the premium for CSR silver plans. For these consumers, cheaper (even zero-premium) bronze plans are also often available, but with very high deductibles, usually in excess of $7,000 per year. We asked Assister Programs to estimate the share of their clients overall who were eligible for CSR silver plans and who nonetheless elected cheaper bronze plans. Just 18% of Assister Programs estimated that none of their clients made this choice, while 27% of Programs estimated that 10% or more of their clients in this situation chose a cheaper bronze plan; 26% were not sure.

    Marketplace coordination with Medicaid

    In all FFM states and in some SBM states, Marketplace and Medicaid eligibility systems are not integrated, requiring consumer files to be transferred between the systems. The ACA creates a “no wrong door” approach to applying for coverage and requires a single streamlined application for financial assistance that can be used to determine eligibility for QHP subsidies and Medicaid or the Children’s Health Insurance Program (CHIP). That means that people must be able to apply for Medicaid or CHIP through the Marketplace. While SBM states can choose to integrate Medicaid and CHIP into their Marketplace eligibility system to facilitate enrollment into each program and transitions of coverage among Medicaid, CHIP, and the Marketplaces, not all states have done so. In ten SBM states, the Marketplace eligibility system also determines eligibility for the expansion Medicaid population, but in eight SBM states, files must be transferred to the Medicaid agency for an eligibility determination. Of the 33 states that use HealthCare.gov, seven states allow HealthCare.gov to determine Medicaid eligibility, though files are then transferred to state Medicaid agencies to complete enrollment. In the remaining states, HealthCare.gov makes an initial assessment of Medicaid eligibility, then transfers the consumer’s file to the state Medicaid agency for a final eligibility determination and to complete enrollment.

    Assister Programs report that some consumers face delays in getting a final Medicaid eligibility determination. Programs reported that over four in ten (43%) clients who were determined eligible for Medicaid were either automatically enrolled into Medicaid or the eligibility determination was made in real time. However, an equal share of Programs reported that the final Medicaid determination took longer, including 11% that said determinations were provided in up to 7 days, 21% that said determinations took from 8 days to one month, and 11% that said it took longer than a month (Figure 7). Federal rules require states to complete Medicaid eligibility determinations in 45 days for MAGI populations. A report on Medicaid application processing times for January 2022 indicated that 48% of applications took from 1 day to more than 45 days. Some Assister Programs said they refer clients who are assessed as eligible for Medicaid or CHIP to other Assister Program (5%) or to the Medicaid/CHIP agency (4%) to complete the application and enrollment process.

    Length of Time to Receive a Final Medicaid Eligibility Determination

    Despite delays in Medicaid eligibility determinations, in most cases, Assister Programs learned whether the client ultimately enrolled in Medicaid. Three-quarters of Assister Programs reported they knew clients’ final Medicaid enrollment status all or most of the time, while 8% said they knew clients’ status about half of the time. The remaining 17% of Assister Programs said they knew the outcome in less than half of the cases, including 6% of Programs that reported knowing the Medicaid enrollment status rarely or never.

    Section 3: Factors Affecting the Enrollment Process

    Most Assister Programs report sufficient capacity to meet demand, but some had to turn people away. The vast majority of Assister Programs said they had capacity to serve all consumers who sought help during the last Open Enrollment period; however, 17% said they had to turn at least some consumers away – similar to the share who said demand exceeded capacity for the 2016 Open Enrollment Period. (Figure 8)

    Capacity of Assister Programs to Meet Consumer Demand for Assistance

    Assister Programs’ reliance on remote assistance developed during the COVID-19 pandemic. Before the pandemic, as a matter of policy, Marketplaces generally encouraged face-to-face enrollment assistance whenever possible. For the 2022 Open Enrollment period, however, 40% of Assister Programs said they provided remote assistance to half or more of their clients. 20% of Programs said they helped most consumers face-to-face, and 39% of Programs said all or nearly all consumers they helped received face-to-face assistance.

    Assister Programs reported mixed experience with remote assistance. Among those who provided both in-person and remote assistance, one-third of Programs said remote assistance appointments generally took less time; 41% said remote appointments took about the same time and 27% said remote appointments generally took longer. Two-thirds of Programs who provide both types of assistance thought the quality of help they could provide was about the same compared to in-person appointments, while 26% said the quality of was not as high. (Figure 9)

    Comparing Remote and In-Person Consumer Assistance

    Most assisters believe the number of plan choices is about right, but comparing Marketplace plan options posed challenges for some. In many states this year consumers faced a choice of more than 100 QHP options. While most Assister Programs (55%) said they thought the number of QHP choices offered their clients was about right, 34% of Programs said they often found it challenging to identify meaningful differences in QHP benefits and costs that their clients cared about.

    Most Assister Programs say they provided language assistance to their clients who needed it. Consumers with limited English proficiency require language assistance – help translating the Marketplace application and plan information into another language, or interpreter services to verbally communicate in another language, or both. Ninety percent of Assister Programs said they helped at least some consumers who needed language assistance. When we asked these Programs about the share of clients who required language assistance during the first half of 2022, 53% of Programs that provide language assistance estimated it was needed by up to 10% of their clients while 20% of Programs said more than half of their clients needed language assistance. (Figure 10)

    Assister Program Clients Who Need Language Assistance

    Nearly three-quarters of Programs that help customers who need language assistance said they have bilingual or multilingual staff or volunteers. Most Programs that provided this help (61%) said they were able to meet clients’ language needs all or nearly all of the time, while 35% of Programs said they could do so most of the time. Even so, more than one-third of Programs that provided language assistance (39%) said it is at least somewhat difficult for their clients to access written information and materials translated into the language they need.

    Some consumers need more complex help. Nearly all Assister programs (97%) reported helping at least some consumers with complex cases, i.e., those that either took longer-than-average to help or presented with problems that challenged Programs’ ability to help. Examples of complex cases could include families with mixed eligibility status for coverage and subsidies, consumers with volatile work status who have trouble estimating annual income, or consumers who need help providing extra documentation to verify their income, immigration, or eligibility status. Many (41%) Assister Programs said fewer than 10% of their clients presented with complex cases. But 10% said more than one-in-five clients presented with complex cases.

    Assister Programs can access outside help with complex cases, though the effectiveness of help varies. For example, 85% of Assister Programs that helped people with complex cases said they sought help from the Marketplace call center’s first tier of customer service, including 51% who said the call center was helpful most or nearly all of the time and one quarter (24%) who said it was helpful rarely or less than half of the time.

    HealthCare.gov offers help with complex cases that Assister Programs can access through a “complex case web form.” It is unclear how many Assister Programs may be aware of this help; 65% of FFM Assister Programs said they did not use this resource at all.

    Nearly all Assister Programs (92%) said that if their Marketplace offered additional training in complex case topics in order to receive advanced certification, they would be interested to have one or more of their staff complete such advanced training.

    For these and other reasons, eligibility and enrollment assistance remains time intensive. As has been the case every year we conducted this survey, most Assister Programs (65%) reported that on average it took between 1 and 2 hours to help consumers who were applying to the Marketplace for the first time. For consumers returning to renew or change coverage, most Programs (63%) said n average appointments took less than 1 hour. (Figure 11)

    Average Time Assister Programs Spent Helping New and Renewing Consumers

    Section 4: Consumer Assistance by Agents and Brokers

    In addition to Marketplace Assister Programs, private health insurance agents and brokers (referred to as “brokers” in this report) also help consumers shop for health coverage. To be certified to sell Marketplace coverage, brokers must be licensed by a state to sell health insurance, register with the Marketplace, and complete the Marketplace required training. Brokers are not paid by the Marketplace, rather they earn commissions from insurers for each consumer they help enroll in a QHP. Distinct from Assister Programs, brokers are permitted to recommend specific plans to consumers. Marketplaces require brokers to provide consumers with correct information and prohibit marketing practices that are misleading, coercive or discriminatory. A 2020 report by the federal government estimated that nearly half of QHP enrollments through HealthCare.gov were broker-assisted, and the Federal marketplace continues to promote broker assistance on its Find Local Help page.

    Most brokers who responded to the survey are licensed to sell health insurance in more than one state. Just over 1/3 of brokers certified to sell Marketplace coverage (37%) reported being licensed in a single state; 35% said they were licensed in 2-4 states, and 28% were licensed in five or more states. For survey questions about state-specific issues, we asked brokers to answer with respect to the state where they sell the most coverage.

    Most brokers (65%) helped up to 100 consumers with eligibility and enrollment through the Marketplace during the 2022 Open Enrollment period. However, one in five brokers helped more than 200 consumers. Brokers also continued to sell ACA-compliant policies offered outside of the Marketplace during 2022 Open Enrollment; such policies are not eligible for subsidies, and the volume sold was much lower. Most brokers (53%) said they sold no more than 10 ACA compliant-policies outside of the Marketplace during 2022 Open Enrollment. (Figure 12) This may be because the extension of premium subsidies to people with incomes above 400% of the poverty level created a strong incentive for these enrollees to switch to the marketplace.

    Number of Consumers Helped by Brokers to Buy ACA-Compliant Plans Inside and Outside of the Marketplace, 2022

    Brokers also reported helping consumers with SEP applications this year and during the COVID-19 SEP. In the 6-month period after OE 2022 ended, 37% of brokers helped 10 or fewer consumers with SEPs, while 16% of brokers helped more than 50. In addition, 80% of brokers said they helped consumers helped apply for 2021 coverage during the special extended COVID Enrollment Period. Like Assister Programs, 75% of brokers reported that most or nearly all consumers they helped during this time were unaware of newly available ARPA subsidy enhancements and instead learned of them first from the broker.

    Broker assisted sale of non-ACA-compliant coverage

    During the 2022 Open Enrollment period, most brokers (75%) reported they also helped consumers enroll in at least some types of non-ACA compliant plans sold outside of the Marketplace. Sixty-two percent of brokers who responded to the survey reported selling short-term policies (which exclude coverage of pre-existing conditions); 40% sold hospital indemnity policies (that pay a flat dollar per day in hospital benefits), 34% sold dread-disease policies (e.g. that only cover cancer), 34% sold accident-only coverage, 11% sold sharing ministry products and 2% sold Farm Bureau policies (neither of which are licensed as health insurance). (Figure 13)

    Share of Brokers Who Sold Non-ACA-Compliant Plans During Open Enrollment

    However, brokers reported selling a much lower volume of non-ACA compliant policies than QHPs during Open Enrollment. Two-thirds of brokers who responded to the survey said that during the 2022 Open Enrollment, they sold 10 or fewer non-ACA compliant policies instead of or as a supplement to QHPs. Eight percent of brokers said they sold more than 50 such policies.

    Comparing consumer assistance from brokers and Assister Programs

    Help provided by brokers is similar in many respects to that provided by Assister Programs. As with Assister Programs, most brokers also report helping consumers apply for financial assistance, compare plan options, and understand how to use their insurance. The time involved in providing enrollment reported by brokers help mirrors that reported by Assister Programs. In other respects, though, the kinds of activities brokers report engaging in and the types of people they report helping are different compared to Assister Programs. (Figure 14)

    Comparing Help from Brokers and Assister Programs
    • 39% of brokers said they help consumers apply for or renew coverage under Medicaid/CHIP, compared to 88% of Assister Programs. Among consumers they did help, most brokers (52%) said few or none of their clients were determined eligible for Medicaid or CHIP compared to 17% of Assister programs who answered the same. Brokers are not paid commissions by Medicaid.
    • 27% of brokers said they conduct outreach activities to inform the public about the Marketplace, compared to 62% of Assister Programs.
    • Brokers were less likely to report helping uninsured consumers; 42% of brokers who responded said most/nearly all new Marketplace applicants they helped were uninsured, compared to 57% of Assister Programs.
    • Brokers were less likely to provide language assistance; 6% of brokers said most to nearly all people they helped during 2022 Open enrollment needed language assistance, vs. 24% of Assister Programs.
    • Brokers were also less likely to report helping Hispanic consumers; 8% of brokers said at least half the people they helped during 2022 Open Enrollment were Hispanic, compared to 22% of Assister Programs. Brokers were also far less likely to say they advise their clients about the importance of reporting information about their race/ethnicity to the Marketplace; 37% of brokers said they do this, compared to 63% of Assister Programs who say they do.
    • 4% of brokers said most or nearly all their clients needed help with immigration issues, and 4% said most/nearly all of their clients lacked Internet at home, compared to 12% and 16% of Assister Programs, respectively.

    Broker use of alternatives to Marketplace web sites

    For years, ACA-compliant policies have also been sold directly by insurers outside of the marketplace; but consumers who needed subsidies were re-directed from these “direct enrollment” (DE) sites back to the Marketplace to apply, then redirected back to the DE site to complete their enrollment. Starting in 2018, however, the federal government opened a new pathway for the sale of subsidized QHPs as an alternative to HealthCare.gov. These so-called enhanced direct enrollment (EDE) sites are privately operated, for example, by web-brokers. They coordinate with HealthCare.gov in the background, transmitting the consumer’s application and receiving the Marketplace’s eligibility determination for subsidies so that consumers can complete their application and select a plan entirely on the EDE site. EDEs offer an alternative to HealthCare.gov, but so far are not permitted in state-based marketplaces.

    EDE sites generally are required display all QHP information shown on HealthCare.gov shows, though sites are permitted to not display information on QHPs they are not authorized to sell. In such cases, EDEs must display a notice that consumers can see additional plan information on HealthCare.gov. EDEs also can display QHP information in a different order, but cannot favorably display QHPs based on the web-broker’s commission.

    CMS has promoted development of EDEs in recent years and reports that enrollment in QHPs through DE and EDE channels is increasing, accounting for 37% of QHP plan selections during the 2021 Open Enrollment period.

    Only 28% of brokers initiate all QHP applications on the Marketplace web site. Most brokers (55%) selling QHPs in FFM states in 2022 said they never initiate applications on HealthCare.gov. In SBM states where DEs are an option but EDEs are not, 42% of brokers said they initiate all QHP applications on the Marketplace web site. (Figure 15)

    Most Brokers Use Private Websites to Sell Marketplace QHPs

    When asked why they rely on private sites over the Marketplace, brokers named several key reasons. Sixty-two percent of brokers who did not always use the marketplace site said it generally takes less time to complete a QHP application on a private site. Sixty-one percent said private sites offer a dashboard or other tools they can use to track the status of their client applications and accounts. Many also cited tools on private sites that that let them track client notices from the Marketplace (48%), or communication tools to help them contact clients (43%). A smaller share said they use private sites because there they can also show consumers other lines of insurance, such as life insurance policies (15%), or non-ACA compliant policies (10%). Federal rules require that such products must be displayed at separate tabs.

    Finally, we asked brokers who use alternative enrollment sites if they would use the Marketplace site more often if it offered a secure broker portal that gave them direct access to client accounts and tools to facilitate tracking and communication with clients; 60% said they would, 11% said they would not, and 30% were not sure.

    Section 5: The Public Health Emergency Unwinding

    Provisions in the Families First Coronavirus Response Act (FFCRA), enacted at the start of the pandemic, prohibit states from disenrolling people from Medicaid until the month after the COVID-19 public health emergency (PHE) ends. This Medicaid continuous enrollment requirement has prompted a substantial increase in Medicaid enrollment during the pandemic. However, once the PHE ends, which is expected sometime in 2023, states will resume Medicaid redeterminations and will disenroll people who are no longer eligible or who are unable to complete the renewal process even if they remain eligible. As a result, KFF estimates that between 5 and 14 million people could lose Medicaid coverage.

    Consumers enrolled in Medicaid today may need more help to remain covered next year. As states resume eligibility redetermination millions of current enrollees may no longer be eligible for Medicaid because of changes in income or other circumstances or may be disenrolled, despite remaining eligible, if they are unable to complete the redetermination process. Medicaid enrollees may need help completing the renewal process and, to avoid becoming uninsured, those who are no longer eligible for Medicaid may need help transitioning to other coverage. Many consumers who are disenrolled due to higher incomes will likely be eligible for subsidized Marketplace coverage, and the extension of enhanced subsidies in the Inflation Reduction Act (IRA) will make the transition easier. However, the 2021 special COVID enrollment experience showed that many such consumers may not be aware of this affordable coverage alternative. Further complicating the situation, the termination of the PHE will occur after the end of the Marketplace Open Enrollment Period and while individuals will qualify for 60-day SEP when they lose Medicaid coverage, that may not be enough time to enroll in Marketplace coverage, especially if they are not aware of the option or how to apply.

    About half of Assister Programs (53%) said they have a good working relationship with their state Medicaid agency and are regularly in touch about matters affecting consumer eligibility and enrollment. But 36% of Programs said they have only limited contact, and 12% said they do not interact with their state Medicaid agency much if at all. In part because of these working relationships with Medicaid agencies, two-thirds of Assister Programs reported being familiar with their state’s plan for resuming routine operations once the PHE ends.

    Most Assister Programs reported proactively reaching out to their states to explore ways to help consumers. Nearly six in ten Assister Programs (58%) said they had contacted their state to explore ways to educate consumers about the need to renew their Medicaid coverage. Given their broader scope of responsibilities, Navigator Programs were more likely than other Programs to report contacting their state (73% vs. 55%). Conducting outreach to consumers to inform them of steps they will need to take to complete the renewal process, and to provide assistance when needed, could help reduce the likelihood that eligible individuals will lose coverage because they could not complete the process.

    Most Assister Programs reported planning outreach activities to raise consumer awareness about the end of the PHE. About half of Assister Programs said they were planning public education events, targeted outreach to consumers in low-income communities, or to partner with local agencies or non-profits to refer consumers who need additional information (Figure 16). A smaller share (17%) of Assister Programs reported adopting other outreach strategies, including social media outreach campaigns, engaging local media to educate the public through stories on the PHE unwinding, and partnering with other community groups that serve low-income people. Fewer Programs (13%) said they planned to hire more staff or recruit more volunteers.

    Assister Program Outreach Strategies to Inform Consumers of Need to Renew Medicaid Coverage

    Assister Programs expressed support for additional actions states could take that would enable them to help consumers retain Medicaid or transition to other coverage. More than six in ten Assister Programs (65%) said they thought the state or Marketplace should provide an extended SEP for people losing Medicaid coverage to enroll in Marketplace coverage. while 59% supported the state sharing contact information on individuals who need to renew their Medicaid coverage. Nearly half of Assister Programs also supported having the state provide additional resources to conduct outreach and/or hire more staff and provide additional training on the Medicaid application process or Marketplace Special Enrollment Periods (Figure 17).

    Assister Program Support for State or Marketplace Actions to Help Consumers Who May Lose Medicaid Coverage

    Both Assister Programs and brokers indicated they will try to re-contact Medicaid clients to update contact information, and most were confident they could reach their clients. About six in ten (58%) Assister Programs and about four in ten (38%) brokers surveyed said they would try to collect updated contact information from Medicaid clients they had helped in the past two years. Providing updated mailing addresses and other contact information to the Medicaid agency can help ensure enrollees receive renewal and other notices and any requests for information. If enrollees do not respond to these requests for information or documentation, even if they do not receive the request, their Medicaid coverage can be terminated. Among Assister Programs and brokers indicating they would re-contact Medicaid clients, eight in ten (83% of Assister Programs and 80% of brokers) said they were very or somewhat confident they would be able to reach those clients.

    Few Assister Programs (29%) and brokers (9%) expect the Medicaid agency to provide them with information on consumers who may be eligible for Marketplace coverage, although nearly half were unsure of their state’s plans. Under certain circumstances], states can share information with trusted partners, including information on consumers who are disenrolled from Medicaid and likely eligible for subsidized coverage in the Marketplace. These consumers will need to complete a Marketplace application to obtain coverage. Assister Programs can educate consumers about the process and assist them with completing the application.

    Although the number of people needing assistance with Medicaid renewals and other issues is expected to increase, most Assister Programs and brokers said they could serve all consumers who seek help. Nearly 60% of Assister Programs and brokers reported having enough resources to serve the all the clients who will need help renewing their coverage or applying for Marketplace coverage after being disenrolled from Medicaid. 17% of Assister Programs and 16% of brokers said they did not have adequate resources while about a quarter were unsure.

    Appendix

    Appendix: Characteristics of Assister Programs

    Three types of Marketplace Assister Programs were surveyed for this report.

    Navigator Programs – The ACA requires all Marketplaces to establish and fund Navigator Programs to provide outreach and enrollment assistance to all consumers. Navigators are required to have expertise in eligibility and enrollment rules, the range of qualified health plan (QHP) options, affordability programs – both QHP subsidies and Medicaid/CHIP – the needs of underserved and vulnerable populations, including individuals with limited English proficiency, and privacy and security standards. Navigators must offer objective advice to consumers. They must not be operated by insurance companies nor receive compensation from insurers; and they may not help with enrollment in any private health coverage offered outside of the Marketplace. At least one Navigator grantee in each state should be a community-based non-profit organization. Navigator Programs tend to be the consumer assistance workhorse – compared to other Assister Programs, they are more likely to operate statewide service areas, serve a higher number of clients, and operate with larger budgets; although some Navigator Programs are small, local, and have more limited resources. For the 2022 coverage year, state and federal Marketplaces provided a combined $162.2 million in funding for Navigator Programs. (Total does not reflect spending for New Mexico or Washington state.) Of this total, the federal Marketplace awarded $90.2 million and SBMs together awarded $72 million.

    Certified Application Counselor Programs (CACs) – Marketplaces are also required to recognize, certify, and provide training for CAC Programs sponsored by non-profits and provider organizations. This Assister Program designation was created prior to the first Open Enrollment – when funding for Navigators, at least in the FFM, was still uncertain – to ensure that willing volunteer Programs would also be available to help. Under federal rules, CAC Programs are not required to engage in all activities required of Navigators, and do not undergo training as extensive as that required for Navigators. CAC Programs generally do not receive funding support from the Marketplace; they are primarily supported by their own sponsoring organizations and other outside sources such as foundations. For the 2022 coverage year, a total of 1,756 CAC Programs served Marketplace consumers.

    Federally Qualified Health Centers (FQHCs) – The federal government supports a network of nonprofit health clinics in the US to provide health care to uninsured, low-income, and other underserved populations. Starting in 2014, the federal government required FQHCs to also provide outreach and enrollment assistance to consumers seeking coverage through the Marketplace and provided additional funding for this purpose. Of the 1,334 FQHCs surveyed, 85 are also certified as Navigators and shown as Navigator Programs in this report. The other 1,249 must complete CAC training to be Marketplace certified and are shown as FQHC Programs in this report. For the 2022 coverage year, the federal government provided FQHCs $150 million to support enrollment assistance.

    While the size of Assister Programs varies, most had a relatively small number of full-time equivalent staff during the 2022 Open Enrollment. Most Assister Programs (73%) indicated that they had five or fewer FTEs during the 2022 Open Enrollment, while 15% had between 6 and 10 FTEs. Navigator Programs had somewhat larger staff compared to the other Program types. (Appendix Table 1) Assister Programs report nearly all FTE staff were paid, not volunteer. Most Assister Programs (66%) indicated that the number of FTEs in 2022 was about same as in prior year; 13% say FTE staff grew from 2021 while 21% of Programs said staff size is smaller than in the year before.

    Assister Program Staff Size, 2022

    Staff continuity in Assister Programs is high. 77% of Programs say most or almost all staff this year worked for them during the previous year’s Open Enrollment. Program staff typically work year-round, not just during Open Enrollment; 71% of Programs say staff size held steady since the 2022 Open Enrollment Period ended; while 21% of Programs say the number of FTEs has since declined.

    Assister Programs were confident that the current level of funding will be available for 2023.Seventy-eight percent of all Assister Programs are very or somewhat confident current funding will continue for 2023. The highest rate of confidence is among Navigator Programs (93%), followed by FQHC (76%) and CAC Programs (68%). Following years of funding cuts, Federal marketplace Navigator funding was significantly increased for the 2022 Open Enrollment to $80 million, with a supplemental $10.2 million awarded shortly thereafter. For 2023, CMS has announced Federal Marketplace Navigator grants of $98.9 million (grants were announced after this survey closed.) Currently CMS cooperative agreements with Navigator Programs are for a 3-year period, through August 2024, though annual funding amounts are determined each year and not guaranteed.

    News Release

    Implementation of the 988 Number Brought More Calls and Texts to the National Suicide Prevention and Crisis Hotline This Summer – And Early Data Show Answer Rates Improved or Held Steady

    Published: Oct 17, 2022

    A new KFF analysis finds that more people contacted the new 988 number for the national suicide prevention and crisis hotline following its launch in July, that callers waited less time on hold, and that callers connected with crisis counselors at higher rates than before the 988 number came online through a combination of calls, chats and texts.

    The easy-to-remember three-digit number steers callers who are suicidal or experiencing a behavioral health crisis to the recently renamed 988 Suicide & Crisis Lifeline, where they can be connected to a local Lifeline counselor and may receive crisis counseling, resources, and referrals.

    Before 988, the Lifeline crisis hotline–established in 2005–was typically accessed through a 10-digit number, which was difficult for callers experiencing a mental health crisis to recall. The new phone number was expected to increase outreach, but there was concern that the Lifeline service might not be able to accommodate the increased demand, potentially resulting in higher rates of unanswered calls.

    Early federal data show that combined call, text, and chat volume to Lifeline increased substantially after the 988 number went live. The combined number of calls, texts, and chats rose by more than 112,000 in August 2022 compared to a year earlier (a 45% increase); however, the overall answer rate actually improved, rising from 67 percent to 88 percent over the same time frame. People who reached out to 988 spent less time waiting on hold for a counselor, with the average wait time for all methods (combined) decreasing from 2 minutes and 30 seconds in August 2021 to 42 seconds in August 2022.

    Lifeline’s 988 calling code became nationally available on July 16, 2022. Despite some early reports of public hesitancy, a recent KFF/CNN poll finds that among those that knew about 988, 85 percent say they would be at least somewhat likely to call the hotline if they or a loved one were experiencing a mental health crisis. However, less than half of people know about 988. Nearly half a million lives (480,622) were lost to suicide between 2010 to 2020 and an additional 47,646 lives were lost in 2021, reflecting a recent rise in suicide rates.

    Additional state and national crisis center metrics may help inform the 988 implementation and future program improvements. Publicly available Lifeline data only capture a small slice of metrics needed to understand implementation, identify gaps, and identify policies and interventions to address shortfalls.

    News Release

    Firearm Deaths of Children and Adolescents Continued to Rise in 2021, Especially Among Black Youth

    About Seven Children Die Each Day Due to Firearms

    Published: Oct 14, 2022

    Gun deaths among children and adolescents continued to rise in 2021, particularly among Black youth, a new KFF analysis of federal injury and mortality data finds.

    The analysis finds that the rate of firearm-related deaths for children ages 17 and younger reached 3.6 per 100,000 children in 2021, a 50% increase from before the COVID-19 pandemic began. This represents about seven children dying each day due to firearms.

    The rate of firearm-related deaths among Black youth was 12.0 per 100,000 – six times higher than White youth and substantially higher than any other racial and ethnic group. Although Black children made up 14% of the nation’s children in 2021, they accounted for 46% of youth firearm deaths.

    While most child firearm deaths stem from assaults, the number of firearms-related deaths by suicide is on the rise, climbing from 657 in 2019 to 827 in 2021. At the same time, youth suicide deaths by other means have declined in recent years. As a result, nearly half (47%) of all youth suicides now involve firearms, the analysis finds.

    The analysis also examines the negative mental health consequences for children and youth stemming from exposure to gun violence and describes recent policy changes aimed at addressing them.

    Half of Adults Say Their Family Has Experienced a Severe Mental Health Crisis

    Published: Oct 13, 2022

    The latest partnership survey between KFF and CNN finds half of adults have experienced a severe mental health crisis in their family, including one in four adults who say they have had a family member receive in-person treatment because they were thought to be a threat to themselves or others, or had a family member engaged in cutting or other self-harming behaviors. The Mental Health in America survey was conducted July 28-August 9, 2022, online and by telephone among a nationally representative sample of 2,004 U.S. adults in order to provide insights into the current state of mental health and mental health care among U.S. adults, including their experiences during the COVID-19 pandemic.