Analysis of Recent Declines in Medicaid and CHIP Enrollment
Following the implementation of the Affordable Care Act (ACA) Medicaid expansion to low-income adults in 2014, there were large increases in Medicaid and CHIP enrollment across states that built on steady progress covering children over the past decade. These increases reflected enrollment among newly eligible adults in states that implemented the expansion as well as enrollment among previously eligible adults and children due to enhanced outreach and enrollment efforts and updated enrollment procedures associated with the ACA. However, enrollment began declining in 2018 and continued to decline in 2019, reversing this trend. This fact sheet provides analysis of recent enrollment trends in Medicaid and CHIP and discusses potential factors contributing to the enrollment decline and its implications for coverage rates. It is based on Kaiser Family Foundation analysis of the Centers for Medicare and Medicaid Services (CMS) Performance Indicator Project Data.1 The enrollment counts include full-benefit individuals of all ages enrolled in Medicaid and CHIP for each month, including those with retroactive, conditional, and presumptive eligibility.
Enrollment Changes December 2017-July 2019
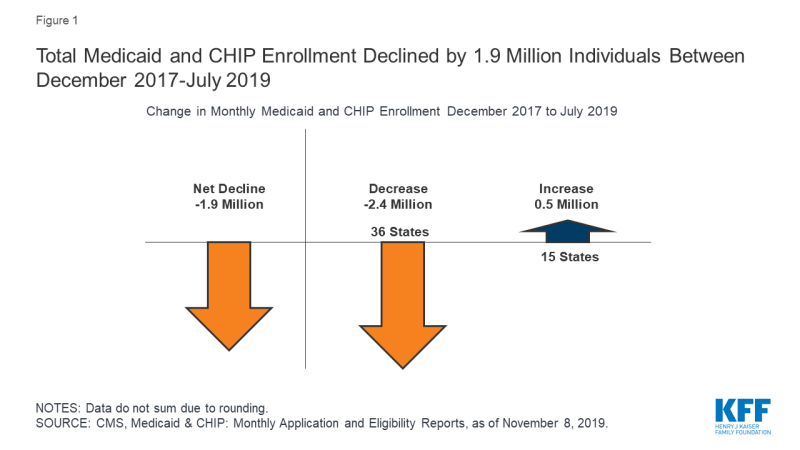
Between December 2017 and July 2019, there was a net decline in total Medicaid and CHIP of 1.9 million people or -2.6%, from 74.3 to 72.4 million enrollees (Figure 1 and Table 1). This reflected an enrollment decrease of 1.7 million or -2.2% between December 2017 to December 2018, and a continued decline of 265,000 or -0.4% from December 2018 to July 2019. While the rate of decline slowed in 2019, the data are not fully comparable to 2018 because they represent partial year data. Total enrollment for both children and adults declined across the 48 states able to report separate data for children and adults for the time period examined:
- Enrollment for children fell by about a 1.1 million or -3.0%, from 35.7 million in December 2017 to 34.7 million in July 2019. This included a decrease of 751,000 or -2.1% between December 2017 to December 2018, and a continued decline of 321,000 or -0.9% between December 2018 and July 2019.
- Enrollment for adults fell by 750,000 or -2.1%, from 35.0 million in December 2017 to 34.3 million in July 2019. This included a decrease of 736,000 or -2.1% between December 2017 and December 2018, and a continued decline of 15,000 or <-1.0% between December 2018 and July 2019.
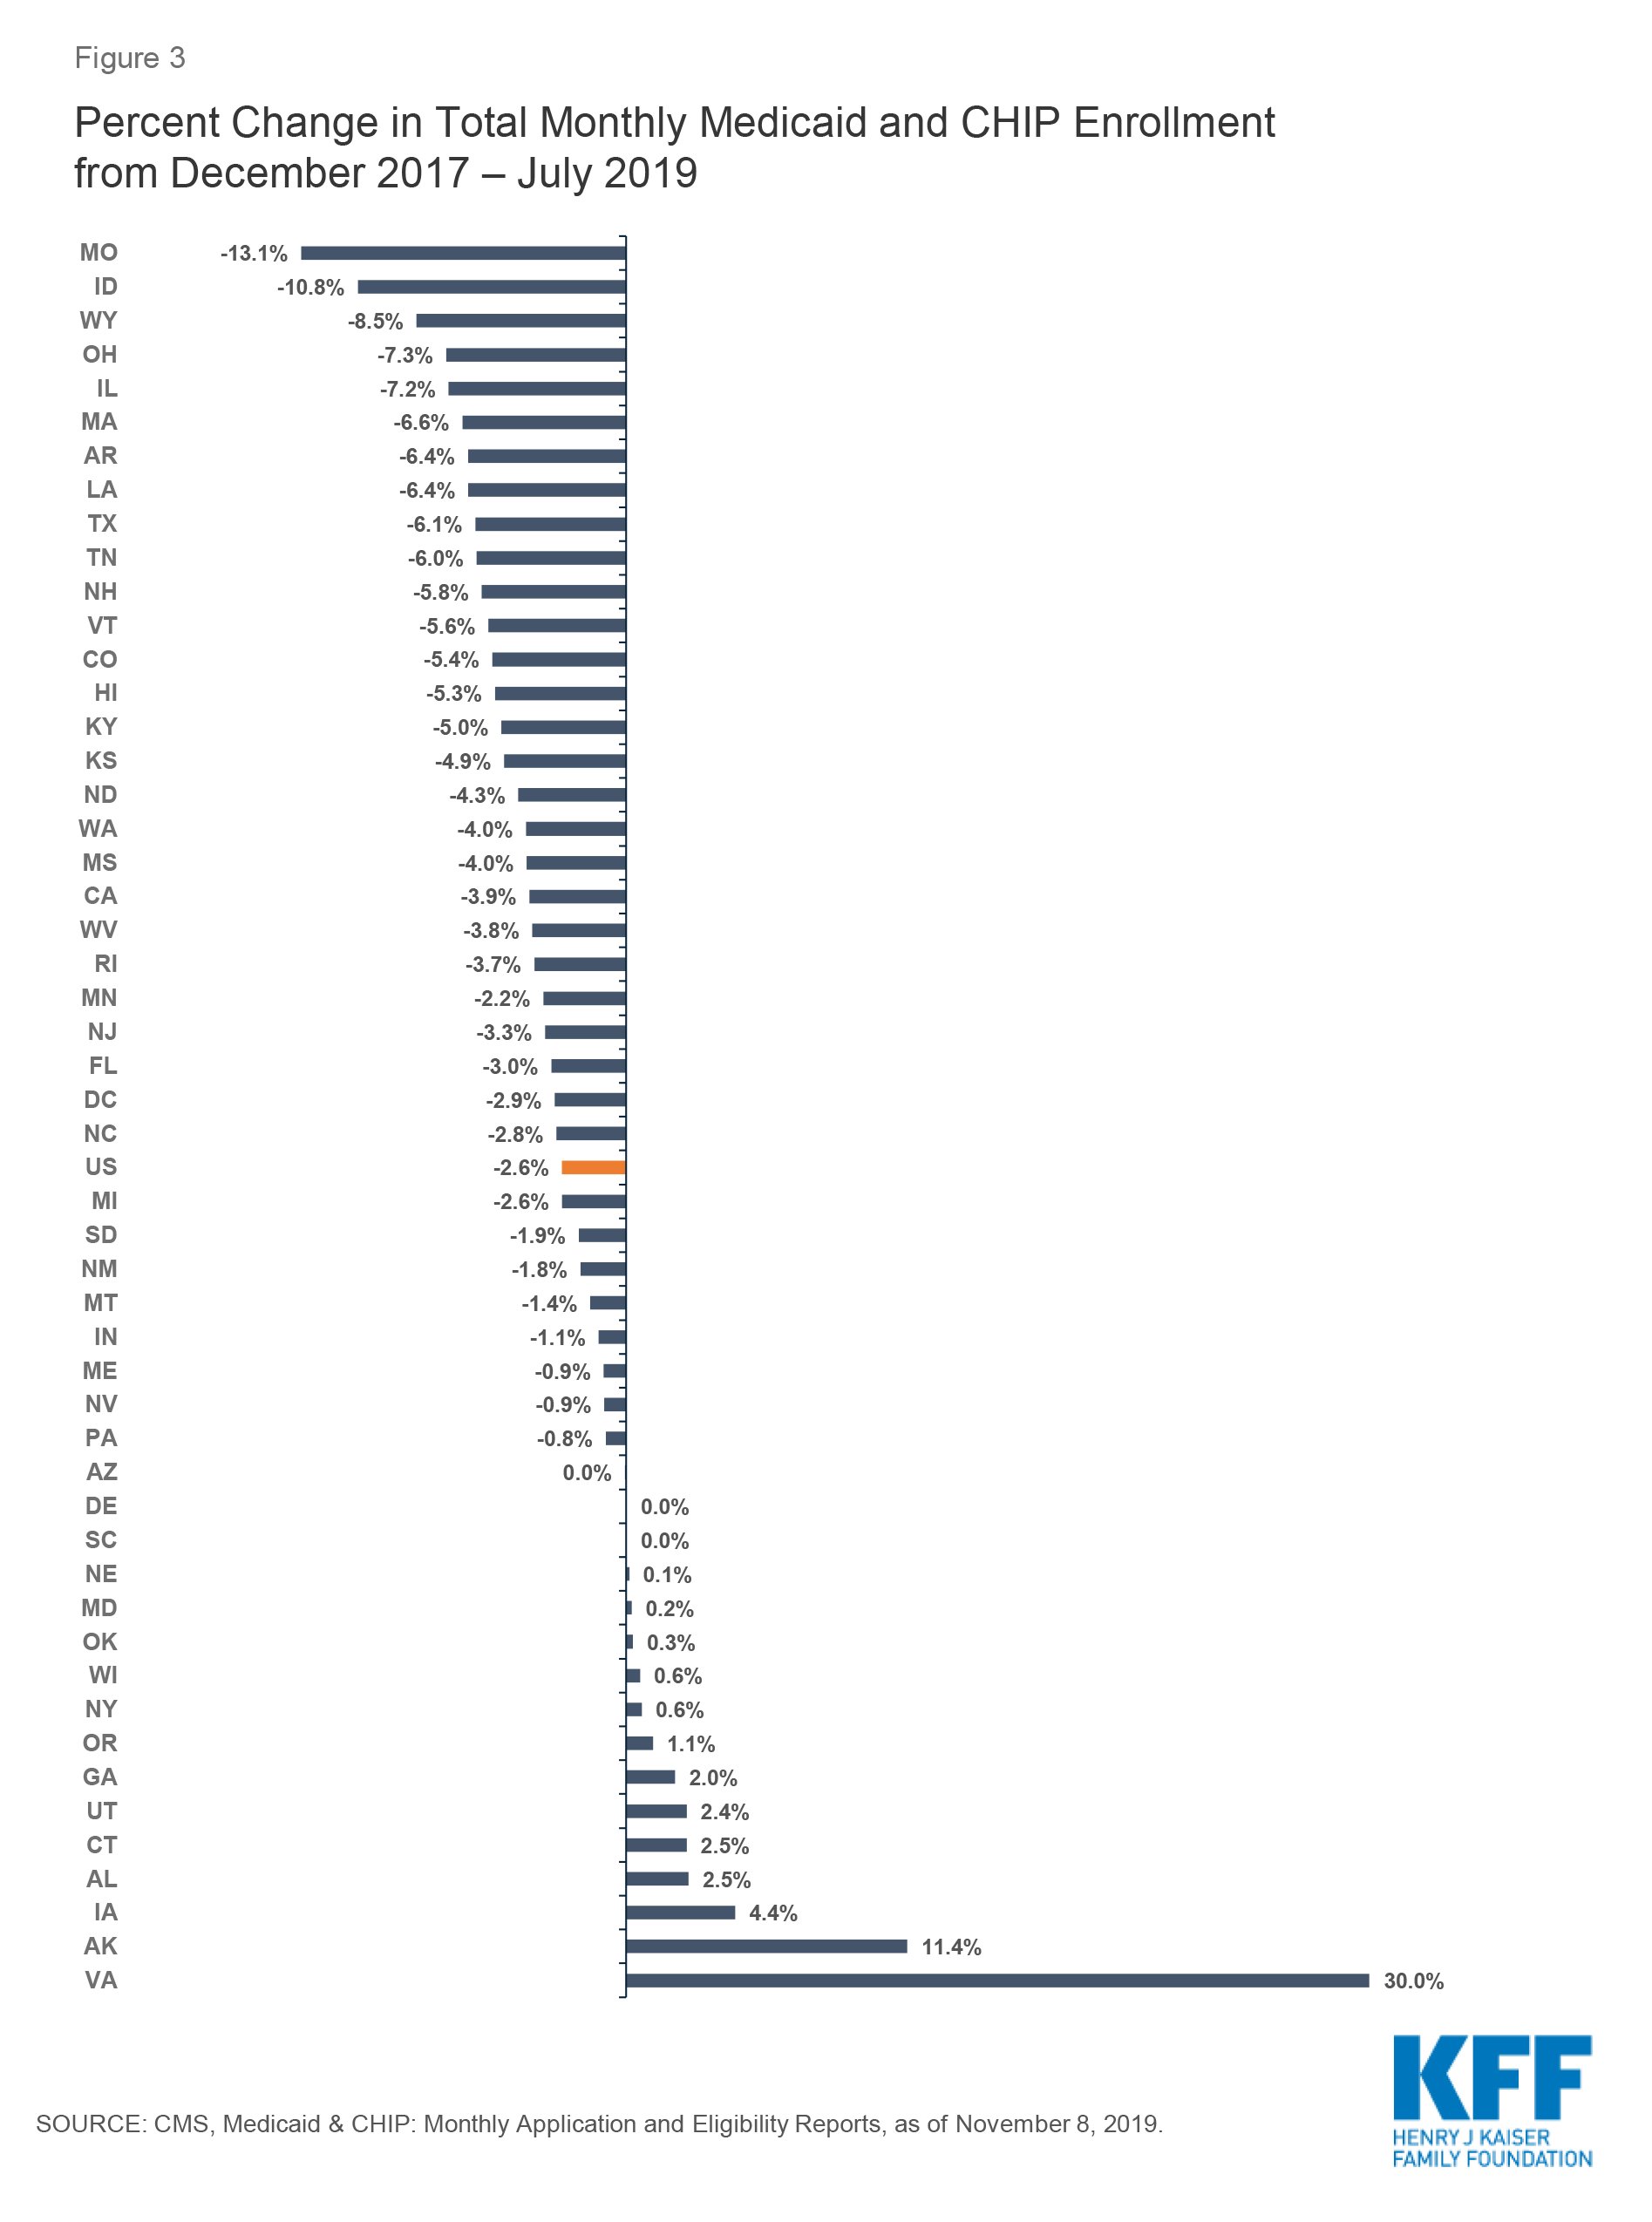
A total of 36 states, including the District of Columbia, had enrollment decreases between December 2017 and July 2019. About a third of states (15) had enrollment decreases of at least -5% between December 2017 and July 2019. States with the largest decreases included Missouri (-13.1%), Idaho (-10.8%), Wyoming (-8.5%), Ohio (-7.3%), and Illinois (-7.2%) (Figures 2 and 3). Enrollment remained flat or increased in 15 states, with the largest percent increases in Virginia (30.0%), Alaska (11.4%), and Iowa (4.4%). Virginia implemented the ACA Medicaid expansion to adults in January 2019, which accounts for its large growth in enrollment. Alaska also had a later implementation of its Medicaid expansion and is processing a backlog of applications, factors which may be contributing to its enrollment increase.2
Among the 48 states able to report separate data for children, between December 2017 and July 2019, there were enrollment declines for children in 36 states, and 34 states had enrollment decreases for adults. States with the largest percent enrollment decreases for children included Missouri (-16.1%), Idaho (-13.2%), and Utah (-9.7%). The largest percent enrollment decreases for adults were in Arkansas (-11.0%), Illinois (-8.9%), and Ohio (-8.7%). The largest percent increases for children occurred in Virginia (7.4%), Alaska (7.2%), and Iowa (4.1%), and, for adults, the largest percent increases were in Virginia (74.7%), Utah (30.2%), and Alaska (14.9%).
Total enrollment as of July 2019 remains 28% higher compared to states’ pre-ACA monthly average enrollment in the 49 states reporting data for both periods. However, July 2019 enrollment fell below pre-ACA monthly average enrollment levels in six states: Wyoming (-17.2%), Vermont (-4.1%), Kansas (-2.1%), Missouri (-1.7%), Oklahoma (-0.9%), and Texas (-0.02%).
Factors Contributing to Enrollment Declines
The enrollment declines observed since December 2017 reverse a previous trend of Medicaid and CHIP enrollment increases and raise questions about whether they reflect a growing number of individuals becoming uninsured or transitioning to other coverage.
Some of the decrease may reflect individuals moving to other coverage as a result of increases in income or changes in employment amid the improving economy. However, gains in employment may not necessarily translate into increases in employer-sponsored insurance (ESI). Lower-income workers are less likely to have an offer of ESI through their job and, even if an offer is available, it may not be affordable. A portion of the decline may also reflect some states catching up on redeterminations after having delayed them for a period of time as they implemented new systems under the ACA. Once states re-start renewals after a period of delay, they experience a drop-off in enrollment as they process renewals that had been in suspended status and determine some people are no longer eligible.
Survey data show a rise in the uninsured rate between 2017 and 2018, driven by decreases in Medicaid and CHIP coverage, suggesting that some individuals being disenrolled are becoming uninsured.3 Experiences in some states suggest that some eligible people may be losing coverage due to barriers maintaining coverage associated with renewal processes and periodic eligibility checks.4 Although states have implemented updated and more automated renewal processes under the ACA and some have taken up options to reduce churn or people moving on and off the program over short periods of time, eligible individuals may still face barriers to maintaining coverage.5 For example, eligible individuals remain at risk for losing coverage if they do not receive or understand notices or forms requesting additional information to verify eligibility or do not respond to requests within required timeframes. Individuals may not understand or receive notices due to language or literacy challenges or if they have unstable housing arrangements or move frequently. Moreover, the growing use of periodic data checks by states may increase coverage gaps or churn, causing people to move on and off of coverage due to a temporary small increase in income, for example, from overtime or seasonal work.
CMS’s heightened focus on reducing errors in eligibility determinations could have trade-offs that make it more difficult for eligible people to obtain and maintain Medicaid coverage. CMS has increased its focus on beneficiary eligibility determinations as part of program integrity efforts, and indicated plans to change eligibility rules and tighten standards for eligibility verification to reduce improper payment rates associated with eligibility errors.6,7 These errors do not necessarily reflect fraud and abuse. HHS notes that the majority of these errors are due to instances where information required for eligibility determination was missing from state systems and/or states did not follow the appropriate process for determining beneficiary eligibility, and that they do not necessarily mean that a person was ineligible for the program. For example, a person could have been eligible but lacked proper documentation of eligibility or the person could have been placed in an incorrect eligibility category. Increased documentation and verification requirements could reduce instances of ineligible people being enrolled in the program and other eligibility errors, but result in greater enrollment barriers for people who are eligible for the program at the same time. The modernized enrollment and renewal processes established under the ACA were designed based on prior research and evidence that frequent documentation requirements serve as an enrollment barrier for eligible families.8
Other factors may also be leading to fall offs in Medicaid and CHIP coverage among individuals who remain eligible for the program. For example, the administration has reduced funds to support outreach and enrollment assistance, which is often an important for getting and keeping eligible families enrolled in coverage.9 Moreover, a growing body of research indicates that the shifting immigration policy environment may be deterring some families from enrolling themselves or their children in coverage or continuing coverage at renewal.10,11

Figure 3: Percent Change in Total Monthly Medicaid and CHIP Enrollment from December 2017 – July 2019
Table 1: Total Monthly Enrollment in Medicaid and CHIP, December 2017 to July 2019
Table 2: Total Monthly Child Enrollment in Medicaid and CHIP, December 2017 to July 2019
Table 3: Total Monthly Adult Enrollment in Medicaid and CHIP, December 2017 to July 2019
Endnotes
The data consists of monthly reports submitted by all 50 states and the District of Columbia on applications, eligibility, and enrollment activity. The enrollment counts include full-benefit individuals enrolled in Medicaid and CHIP for each month, including those with retroactive, conditional, and presumptive eligibility. Limited-benefit enrollees such as those with emergency Medicaid, family planning-only coverage and limited benefit dual eligible individuals are excluded. Centers for Medicare and Medicaid Services, “Medicaid & CHIP Monthly Applications, Eligibility Determinations, and Enrollment Reports: January 2014 - February 2019 (preliminary)”, Centers for Medicare and Medicaid Services, (May 10, 2019), https://www.medicaid.gov/medicaid/program-information/medicaid-and-chip-enrollmentdata/monthly-reports/index.html
Elizabeth Earl, “State wrestles with sizeable backlog of Medicaid applications,” Alaska Journal, February 6, 2019, https://www.alaskajournal.com/2019-02-06/state-wrestles-sizeable-backlog-medicaid-applications
United States Census Bureau, Health Insurance Coverage in the United States: 2018, (Washington, DC: U.S. Census Bureau, September 10, 2019), https://www.census.gov/library/publications/2019/demo/p60-267.html
Samantha Artiga and Olivia Pham, Recent Medicaid/CHIP Enrollment Declines and Barriers to Maintaining Coverage, (Washington, DC: Kaiser Family Foundation, September 2019), https://www.kff.org/medicaid/issue-brief/recent-medicaid-chip-enrollment-declines-and-barriers-to-maintaining-coverage/.
Samantha Artiga and Olivia Pham, Recent Medicaid/CHIP Enrollment Declines and Barriers to Maintaining Coverage, (Washington, DC: Kaiser Family Foundation, September 2019), https://www.kff.org/medicaid/issue-brief/recent-medicaid-chip-enrollment-declines-and-barriers-to-maintaining-coverage/.
Centers for Medicare and Medicaid Services, Oversight of State Medicaid Claiming and Program Integrity Expectations (June 20, 2019), https://www.medicaid.gov/federal-policy-guidance/downloads/cib062019.pdf
Centers for Medicare and Medicaid Services, CMS Administrator Seema Verma’s Speech to the National Association of Medicaid Directors in Washington, D.C., November 12, 2019, https://www.cms.gov/newsroom/press-releases/cms-administrator-seema-vermas-speech-national-association-medicaid-directors-washington-dc
Jessica Stephens and Samantha Artiga, Key Lessons from Medicaid and CHIP for Outreach and Enrollment Under the Affordable Care Act, (Washington, DC: Kaiser Family Foundation, June 4, 2013), https://www.kff.org/medicaid/issue-brief/key-lessons-from-medicaid-and-chip-for-outreach-and-enrollment-under-the-affordable-care-act/ and Anne Dunkelberg and Molly O’Malley, Children’s Medicaid and SCHIP in Texas: Tracking the Impact of Budget Cuts, (Washington, DC: Kaiser Commission on Medicaid and the Uninsured, July 2004), http://www.kff.org/medicaid/7132.cfm.
Karen Pollitz, Jennifer Tolbert, and Maria Diaz, Data Note: Limited Navigator Funding for Federal Marketplace States, (Washington, DC: Kaiser Family Foundation, November 2019), https://www.kff.org/private-insurance/issue-brief/data-note-further-reductions-in-navigator-funding-for-federal-marketplace-states/
Jennifer Tolbert, Samantha Artiga, and Olivia Pham, Impact of Shifting Immigration Policy on Medicaid Enrollment and Utilization of Care among Health Center Patients, (Washington, DC: Kaiser Family Foundation, October 2019), https://www.kff.org/medicaid/issue-brief/impact-of-shifting-immigration-policy-on-medicaid-enrollment-and-utilization-of-care-among-health-center-patients/
Hamutal Bernstein, Dulce Gonzalez, Michael Karpman, and Stephen Zuckerman, With Public Charge Rule Looming, One in Seven Adults in Immigrant Families Reported Avoiding Public Benefit Programs in 2018, (Washington, DC: Urban Institute, May 2019), https://www.urban.org/urban-wire/public-charge-rule-looming-one-seven-adults-immigrant-families-reported-avoiding-public-benefit-programs-2018

