Key Findings
- An overwhelming majority of the public (90%) think there is a mental health crisis in the U.S. today, with most people saying the opioid epidemic, mental health issues in children and teenagers, and severe mental illness are at crisis level in the country. For parents, concerns about the long-term impacts of the pandemic also loom large with nearly half of parents (47%) saying the pandemic had a negative impact on their child’s mental health. At least eight in ten parents are worried about depression, alcohol or drugs, or anxiety impacting the teenagers in the U.S., while around seven in ten are worried that self-harm, loneliness stemming from the pandemic, or eating disorders may negatively impact teenage children.
- The KFF/CNN Mental Health in America survey finds that the youngest adults, ages 18-29, are both the group reporting the most concerns with their mental health and also more likely to report they are seeking mental health services, but not always able to access them. Half of young adults say they have felt anxious either “always” or “often” in the past year (compared to a third of adults overall), one-third describe their mental health or emotional well-being as “only fair” or “poor” (compared to 22% of adults overall), and four in ten say a doctor or other health care professional has told them that they have a mental health condition such as depression or anxiety. Three in ten adults under age 30 say they have received mental health services in the past 12 months, but nearly half (47%) say there was a time in the past 12 months when they thought they might need mental health services or medication, but they did not get them. Cost was among the most cited reasons for why younger adults, as well as all adults, for why they did not receive the mental health services they need.
- While age is one of the strongest factors predicting negative mental health outcomes, there are other demographics that are strongly correlated with poorer self-rated mental health. For example, LGBT adults consistently report poorer mental health outcomes on almost all measures throughout the survey. While the LGBT group in this survey (and in society, generally) are disproportionately made up of younger adults, even when controlling for age this group reports more negative mental health outcomes than those who do not identify as lesbian, gay, bisexual, or transgender. For example, half (51%) of LGBT adults say they thought they needed mental health services in the past year but did not get them and over a third (36%) describe their mental health as either “only fair” or “poor.”
- Economic uncertainty and concerns about personal financial situations are the top stressors for all adults but especially among the individuals with lower household incomes. Six in ten (61%) of those living in households with incomes of $40,000 or less say their personal finances are a major source of stress. This group also reports that the cost of mental health care services may be prohibitive to seeking care with four in ten (39%) saying people like them are not able to get the mental health services they need and a large majority of those with lower incomes saying the cost of mental health care is a “big problem” in the United States.
- Many adults report experiencing what may be considered a severe mental health crisis among their family members. Half of all adults (51%) say they or a family member have experienced a severe mental health crisis, including received in-person treatment because they were a threat to themselves or others (28%), engaged in cutting or self-harm behaviors (26%), had a drug overdose requiring an ER visit (21%), experienced homelessness (16%) or ran away from home (14%) due to mental health problems, died by suicide (16%), or had a severe eating disorder (8%). Among those who had a family member who experienced a severe mental health crisis, over four in ten say it had a major impact on their own mental health or their family’s relationship, and one in five say it had a major impact on the family’s financial situation. In addition, this group, which has the most direct experience with mental health care in this country, are more likely to believe that mental health issues in both children and adults are at a crisis level in the U.S., and that most people are not able to get the mental health services they need.
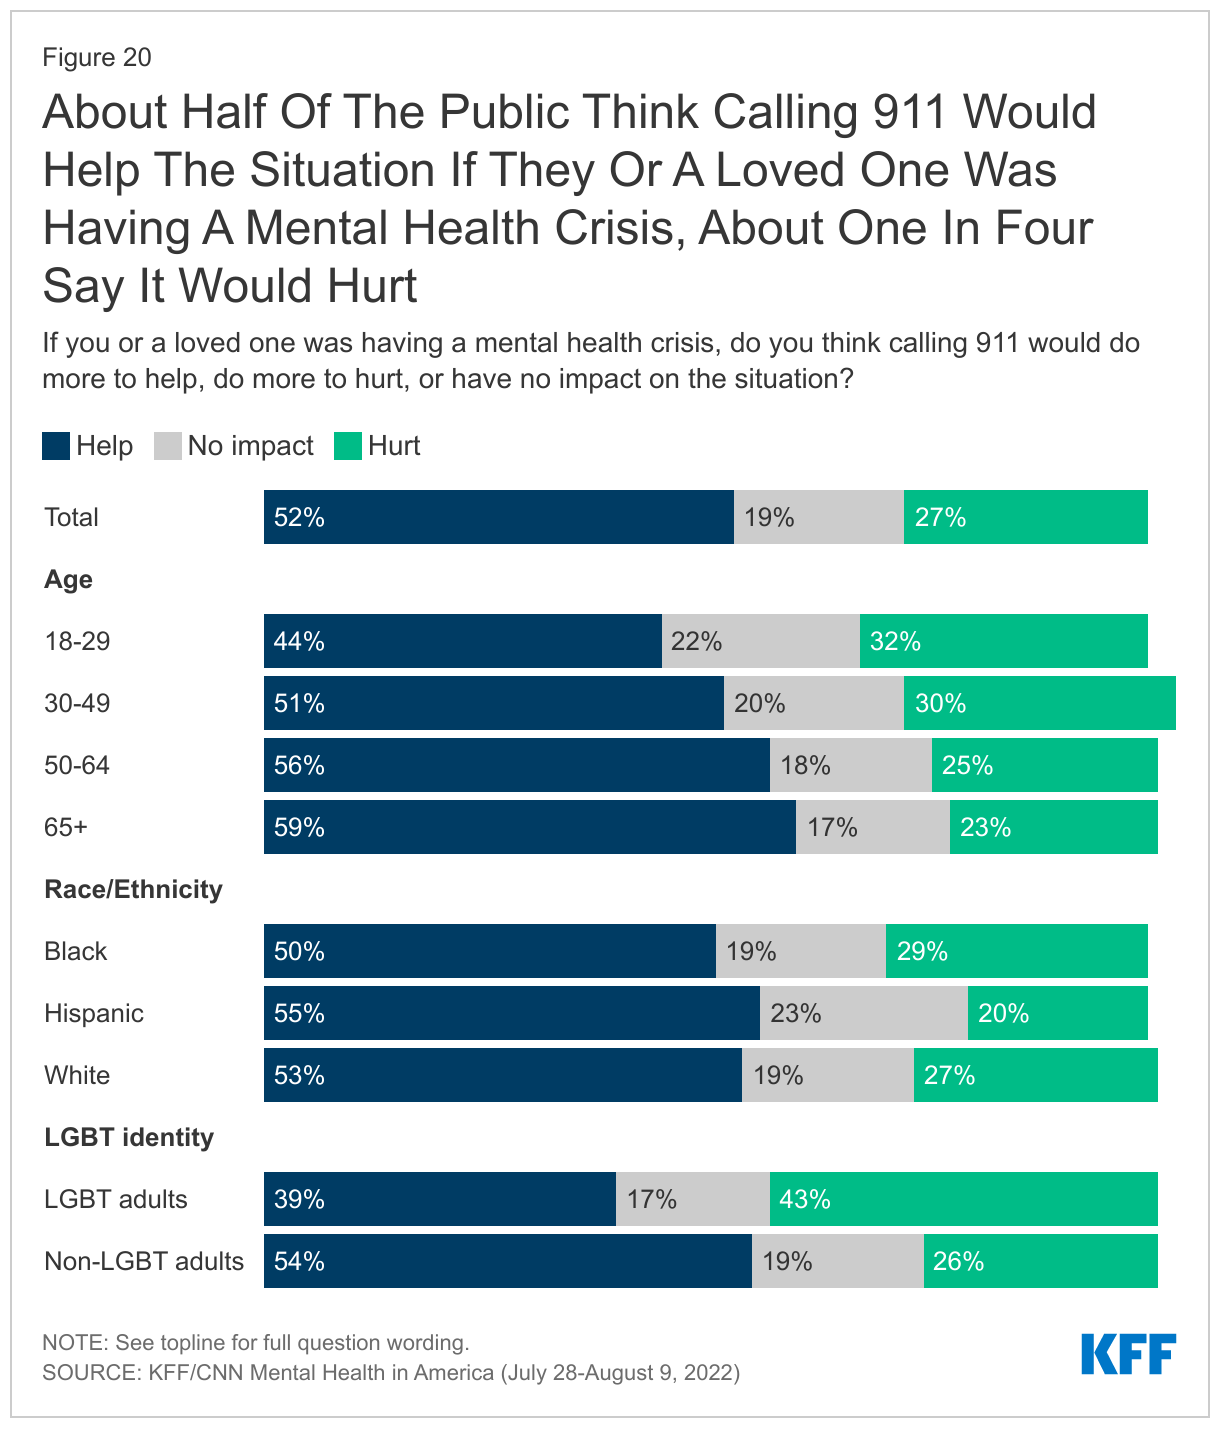
- About one month following the launch of the new 988 crisis hotline that will connect people with mental health counselling and resources, most adults (56%) say they have heard “nothing at all” about the new hotline. However, when told about the new 988 number, a large majority (85%) say they would be ”very” or “somewhat” likely to call it if they or a loved one were experiencing a mental health crisis. This is in light of the fact that about a quarter of adults say they think calling 911 during a mental health crisis would do more to “hurt” rather than “help” the situation (including three in ten Black adults and four in ten LGBT adults). When asked in their own words why they think calling 911 would hurt the situation, about half cite a lack of police training to deal with mental health and that calling 911 would lead to safety concerns for people in a mental health crisis.
- The new 988 crisis hotline may also prove a useful tool for certain populations including Hispanic adults and the uninsured, who disproportionately report they do not know who to call if there was a mental health crisis and also say they would not know where to find mental health services.
Mental Health Crisis In America: Who Is Struggling?
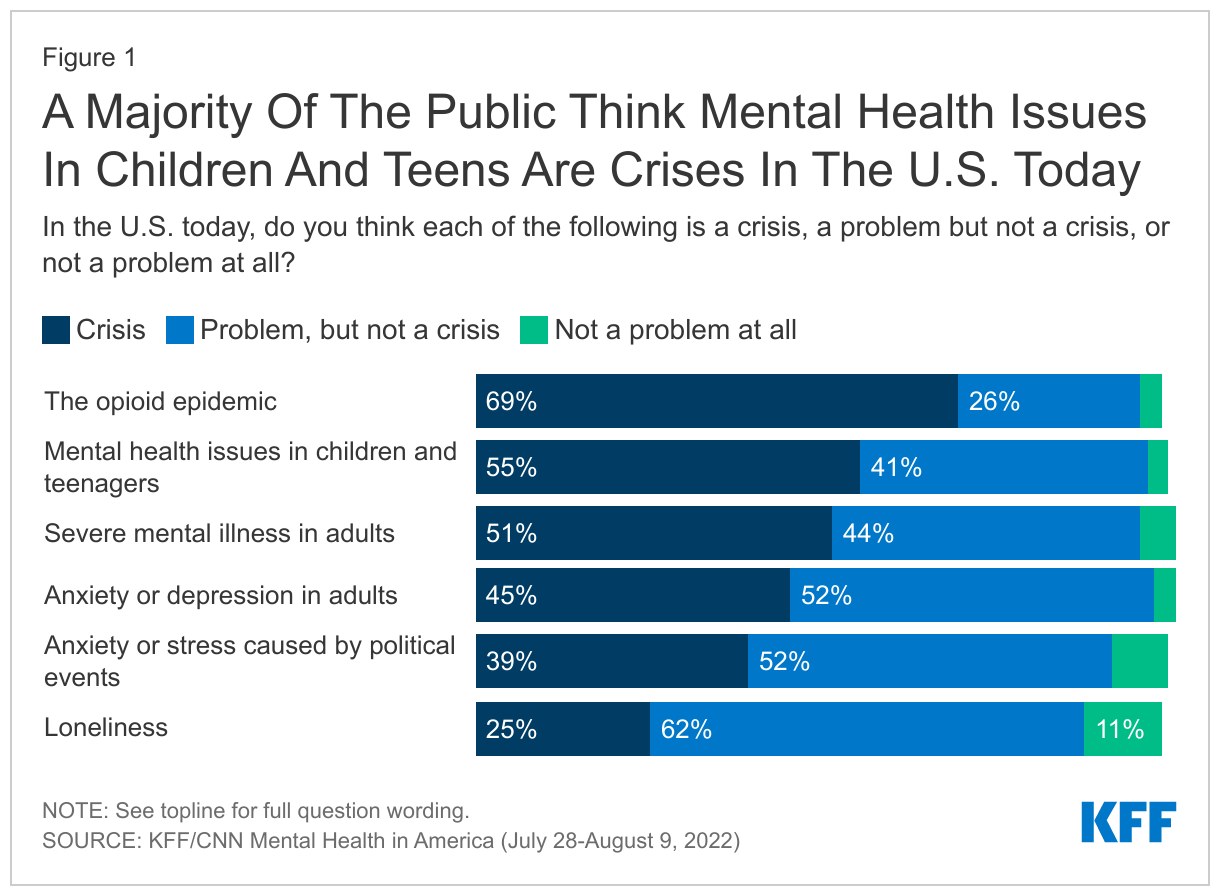
An overwhelming majority of the public (90%) think there is a mental health crisis in the U.S. today with more than eight in ten adults across all major demographic groups think there is a mental health crisis in the country. When asked about more specific mental health related issues, about seven in ten adults (69%) see the opioid epidemic as a crisis in the U.S. today and a slight majority of the public see mental health issues in children and teenagers (55%) as a crisis. About half say severe mental illness in adults (51%) is a crisis in the country, while 45% view anxiety or depression in adults as a crisis. Four in ten (39%) say that anxiety or stress caused by political events is a crisis while fewer (25%) say loneliness is a crisis in the U.S. today.
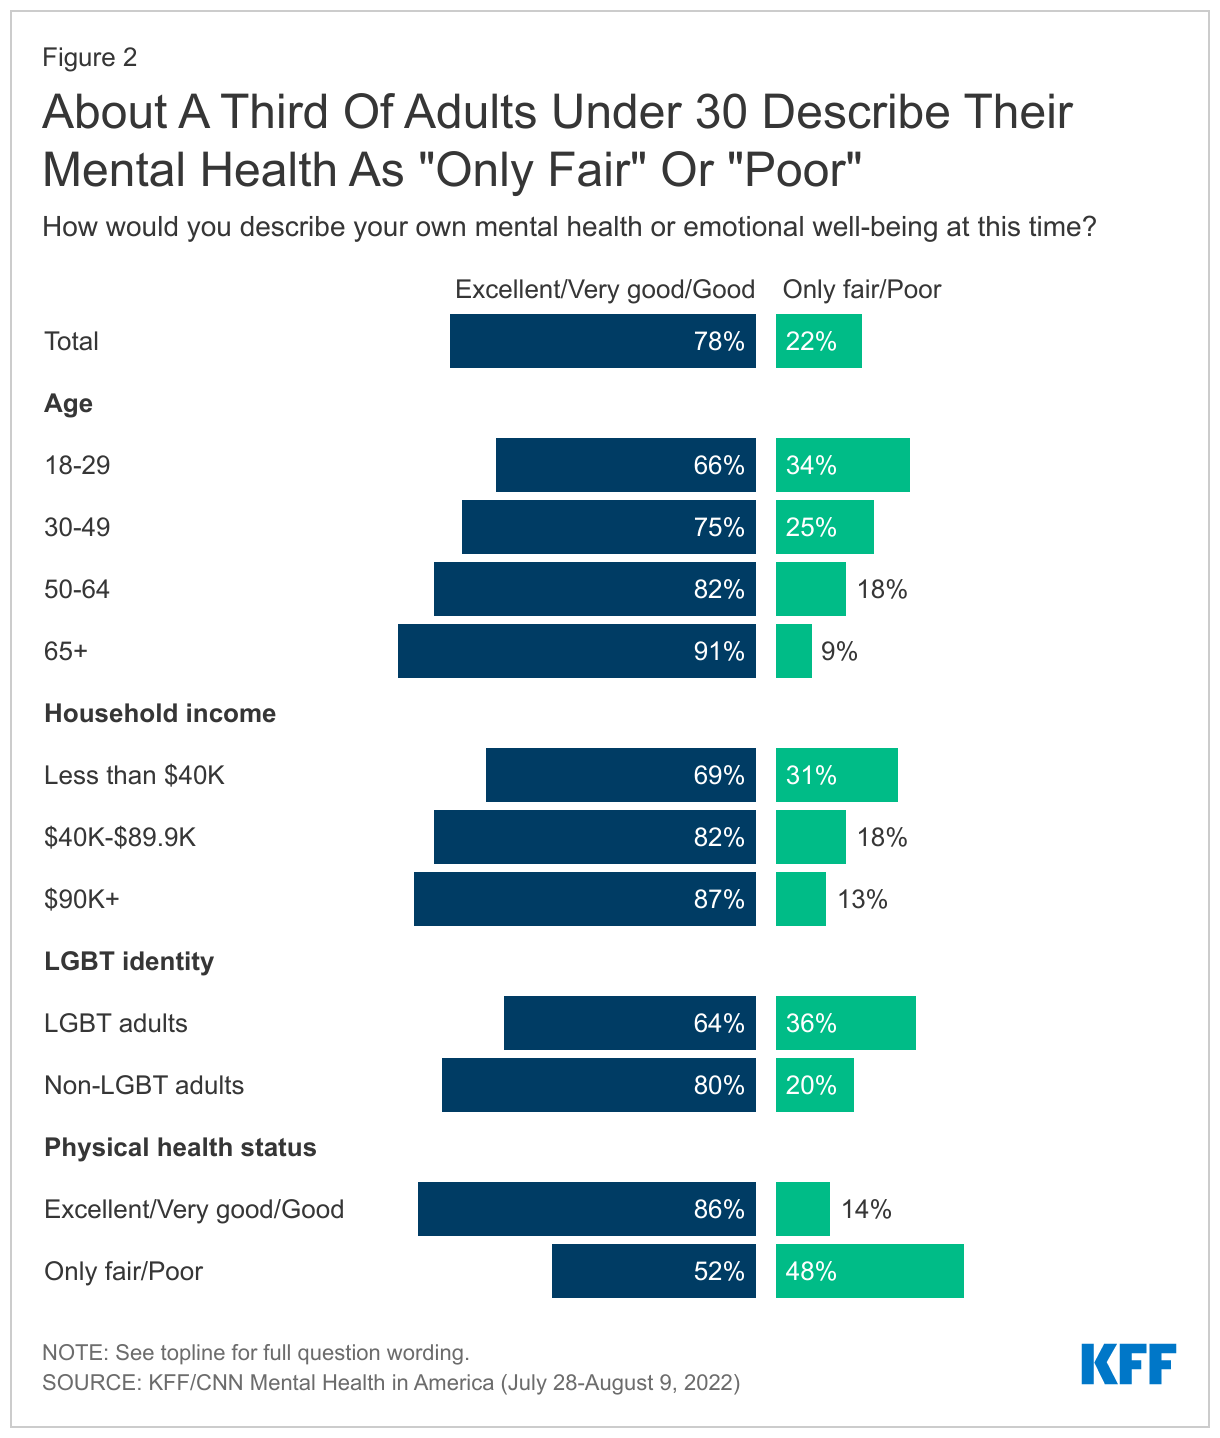
While most adults rate their mental health and emotional well-being positively with nearly eight in ten describing their mental health as “good” (32%), “very good” (29%), or “excellent” (17%), about one in five adults say their mental health or emotional well-being is “only fair” (17%) or “poor” (4%). Younger adults, under the age of 30, are more likely than adults in older age groups to say their mental health is “only fair” or “poor.”1 For example, this group is three times as likely as adults ages 65 and older to rate their mental health negatively (34% vs. 9%).
Income, sexual orientation, and physical health condition also seems to play a role in how people describe their current mental health status. Adults with household incomes under $40,000 are more than twice as likely as those with incomes of $90,000 or more to say their mental health or emotional well-being is “only fair” or “poor” (31% vs. 13%). Notably, more than one-third (36%) of adults who identify as LGBT describe their mental health as “only fair” or “poor” compared to one in five non-LGBT adults.
Poor physical health may also contribute to poor mental health as adults who describe their own physical health as “only fair” or “poor” are more than three times as likely to negatively rate their mental health as those who say they are in “good,” “very good,” or “excellent” physical health (48% vs. 14%).
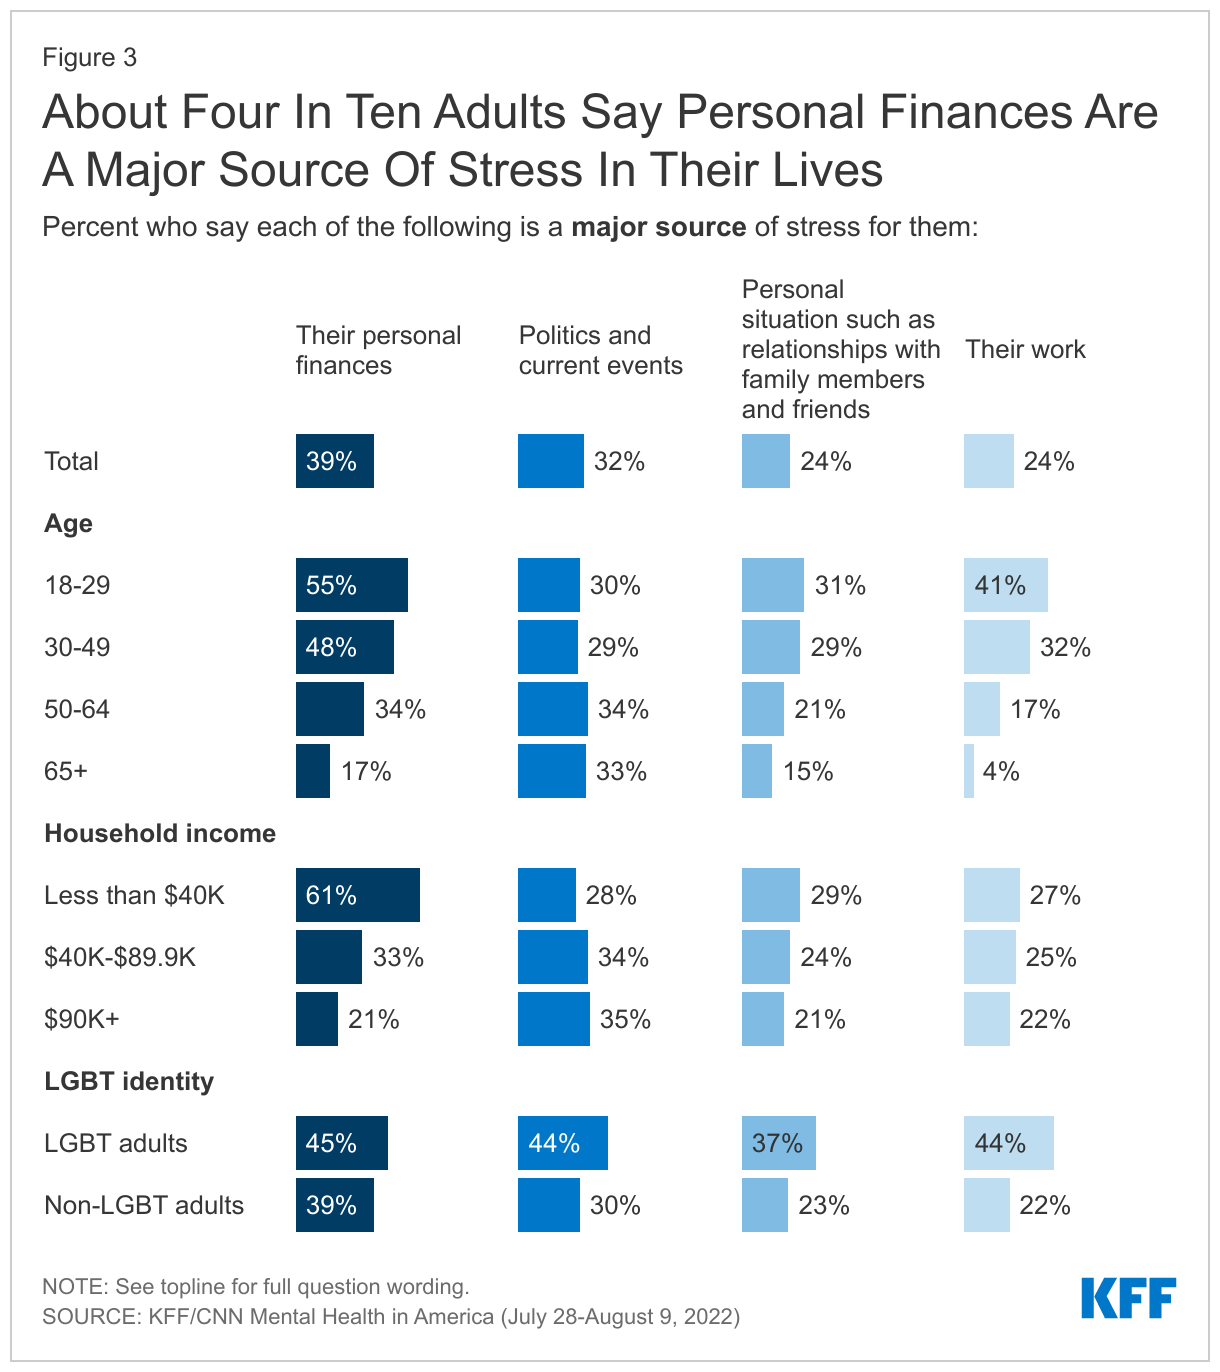
When asked about specific sources of stress, about four in ten adults say their personal finances (39%) are a “major source” of stress for them and a third (32%) say the same about politics and current events. One in four adults say relationships with family and friends (24%) and their work (24%) are major stressors for them.
While personal finances are the biggest stressor for all adults, they are especially daunting for lower income and younger adults. About six in ten adults (61%) with household incomes under $40,000 say their personal finances are a “major source” of stress – nearly three times the share of adults with incomes over $90,000 who say the same (21%). A majority (55%) of adults under the age of 30 say personal finances are a “major source” of stress for them, and four in ten (41%) say the same about their work.
More than four in ten LGBT adults report that their work (44%), politics and current events (44%), and their personal finances (45%) are major sources of stress and notably, nearly four in ten (37%) LGBT adults also say their personal situation, such as relationships with family and friends, are a “major source” of stress to them. Politics and current events are also major sources of stress for somewhat larger shares of Democrats and Democratic-leaning independents (38%) than their Republican counterparts (29%).
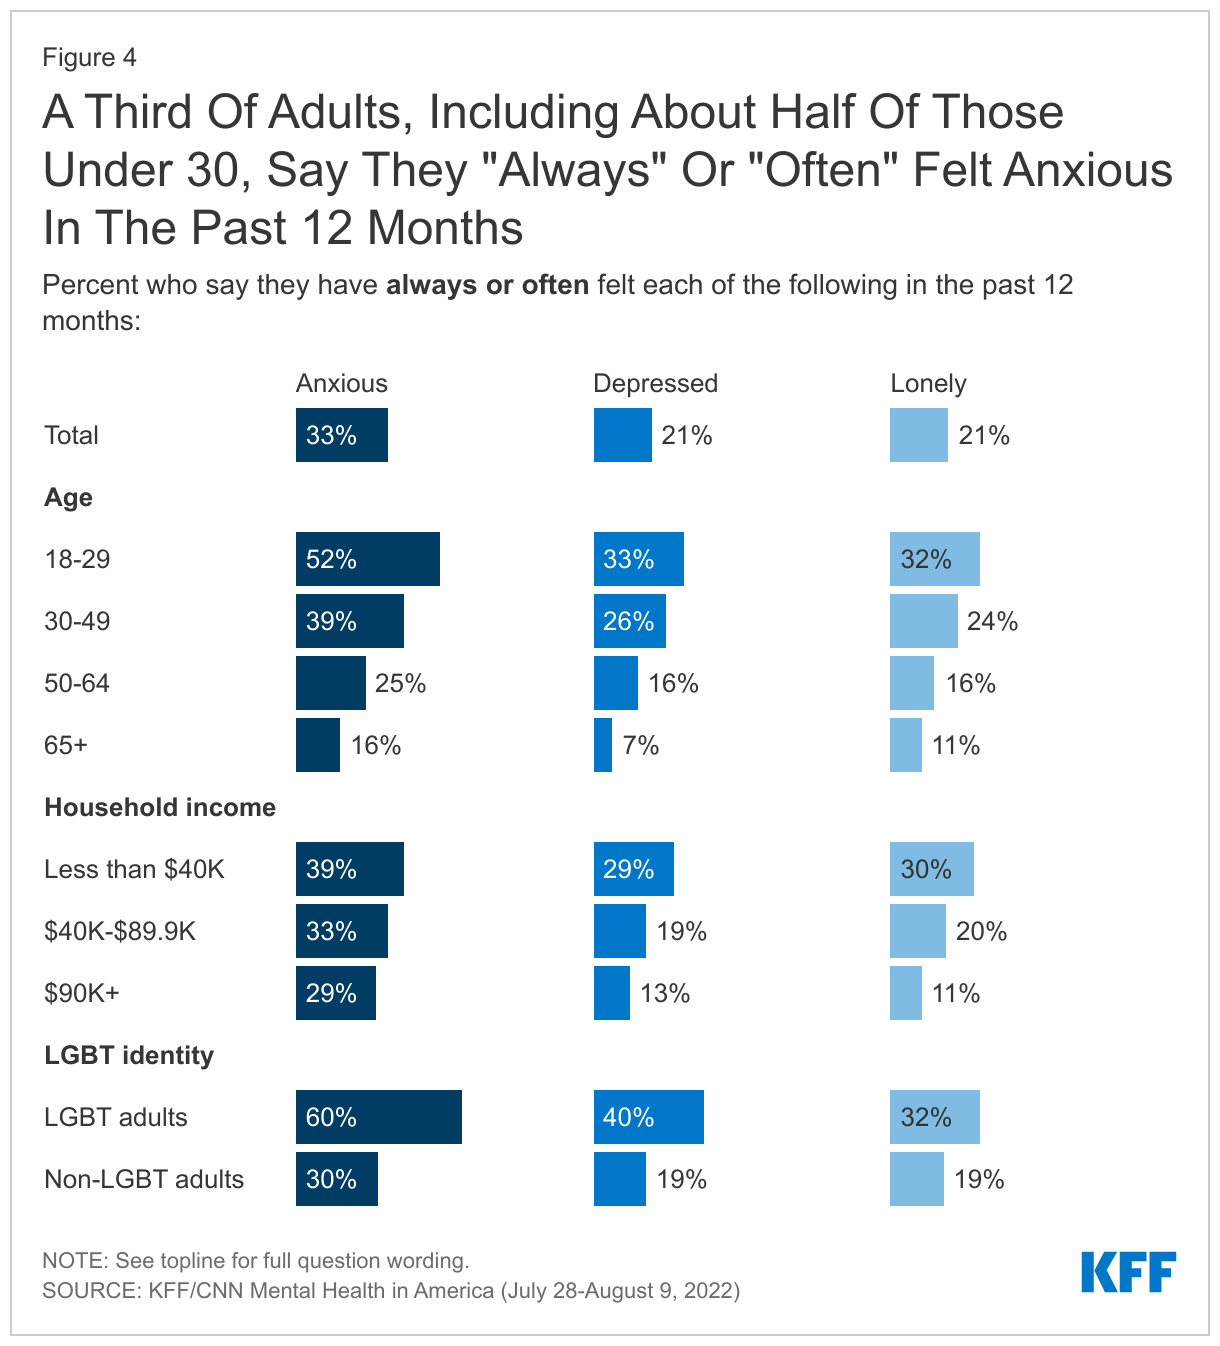
One-third of U.S. adults say they have “always” or “often” felt anxious in the past year, with an additional third saying they felt anxious “sometimes.” A smaller, but notable, share of adults say they have felt depressed (21%) or lonely (21%) “always” or “often” in the past 12 months.
More than half of younger adults (52%), and six in ten LGBT adults, say they feel anxious “always” or “often,” as do four in ten (39%) adults between the ages of 30 and 49 years. Adults with household incomes under $40,000 are more than twice as likely than those with household incomes of $90,000 or more annually to say they “often” or “always” felt lonely (30% v. 11%), or depressed (29% vs. 13%), and are 10 percentage points more likely to report feeling or anxious (39% vs. 29%). While similar shares of men and women report feel lonely or depressed at least often, nearly four in ten women (37%) say they feel anxious “always” or “often,” compared to about three in ten men who say the same (28%).
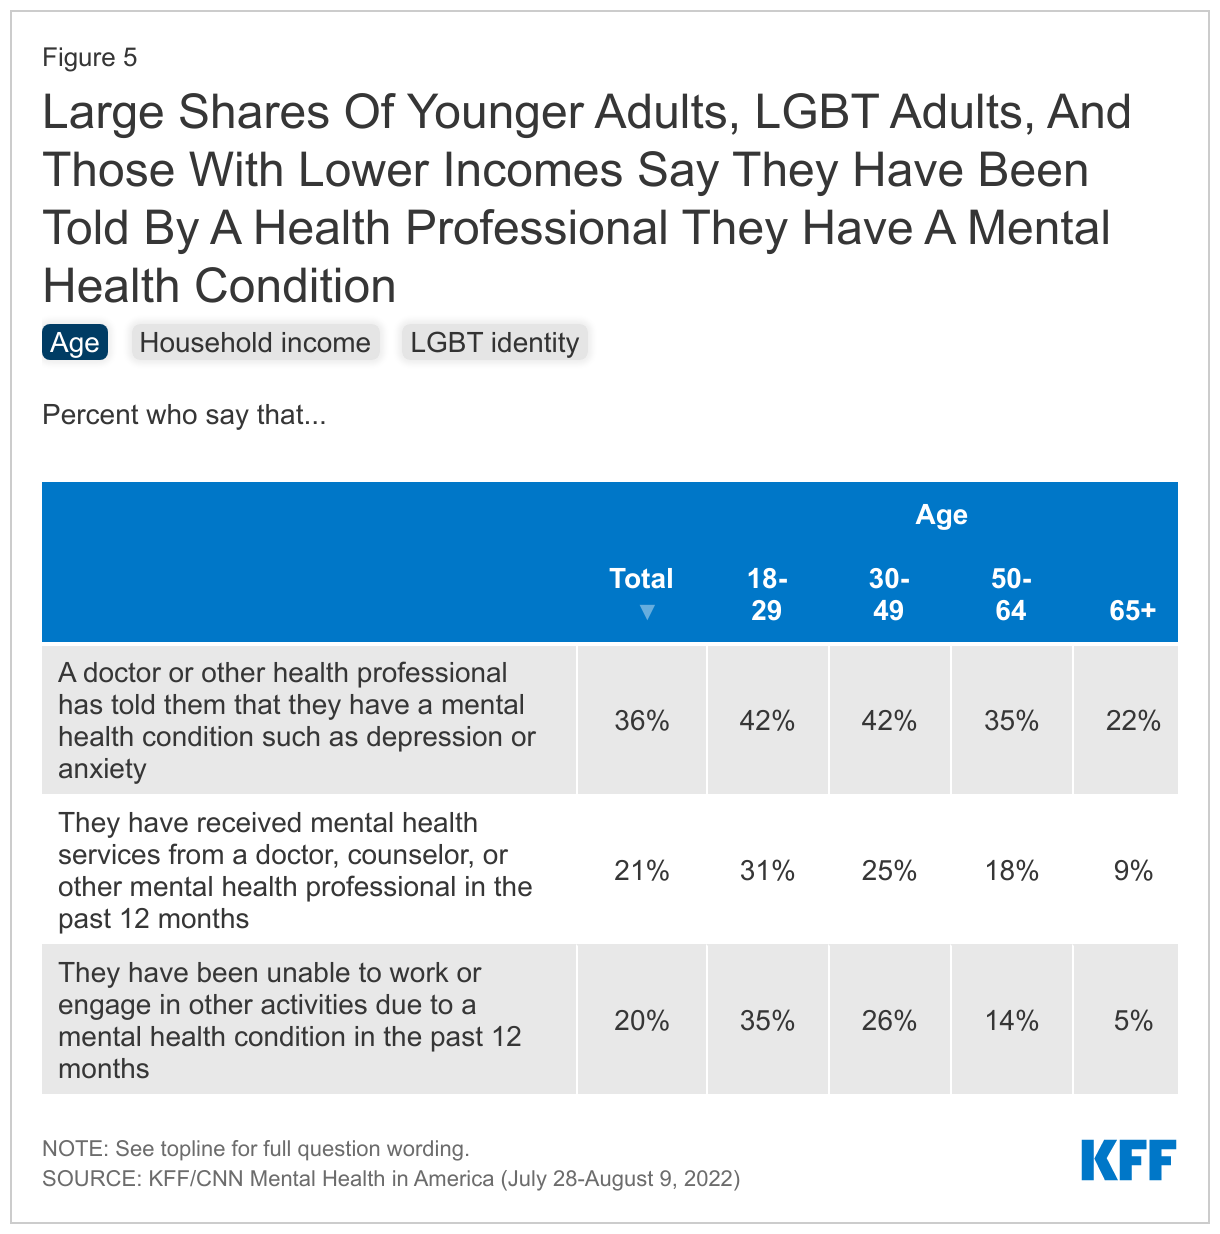
With many people reporting they have felt anxious, depressed, or lonely in the past year, the survey also finds more than a third of adults (36%) say a doctor or health professional has told them they have a mental health condition such as depression or anxiety and one in five (21%) adults say they have received mental health services in the past 12 months.
The groups that are most likely to report difficulty with their mental health are also among the groups most likely to say they received mental health services in the past 12 months. Nearly half (46%) of adults with lower household incomes (under $40,000) say they have been told by a health professional that they have a mental health condition and one-fourth say they have received mental health services in the past year. Nearly six in ten (58%) LGBT adults say they have been told they have a mental health condition such as depression or anxiety and 37% say they have received mental health services this year.
One in five adults say that they have been unable to work or engage in other activities due to a mental health condition in the past 12 months, this share rises to 35% of adults under 30 and 46% among LGBT adults. Among those who say they haven’t been able to work or engage in usual activities, half (51%) say they have received mental health services in the past year, as do 41% of those who report their mental health as either “only fair” or “poor.”
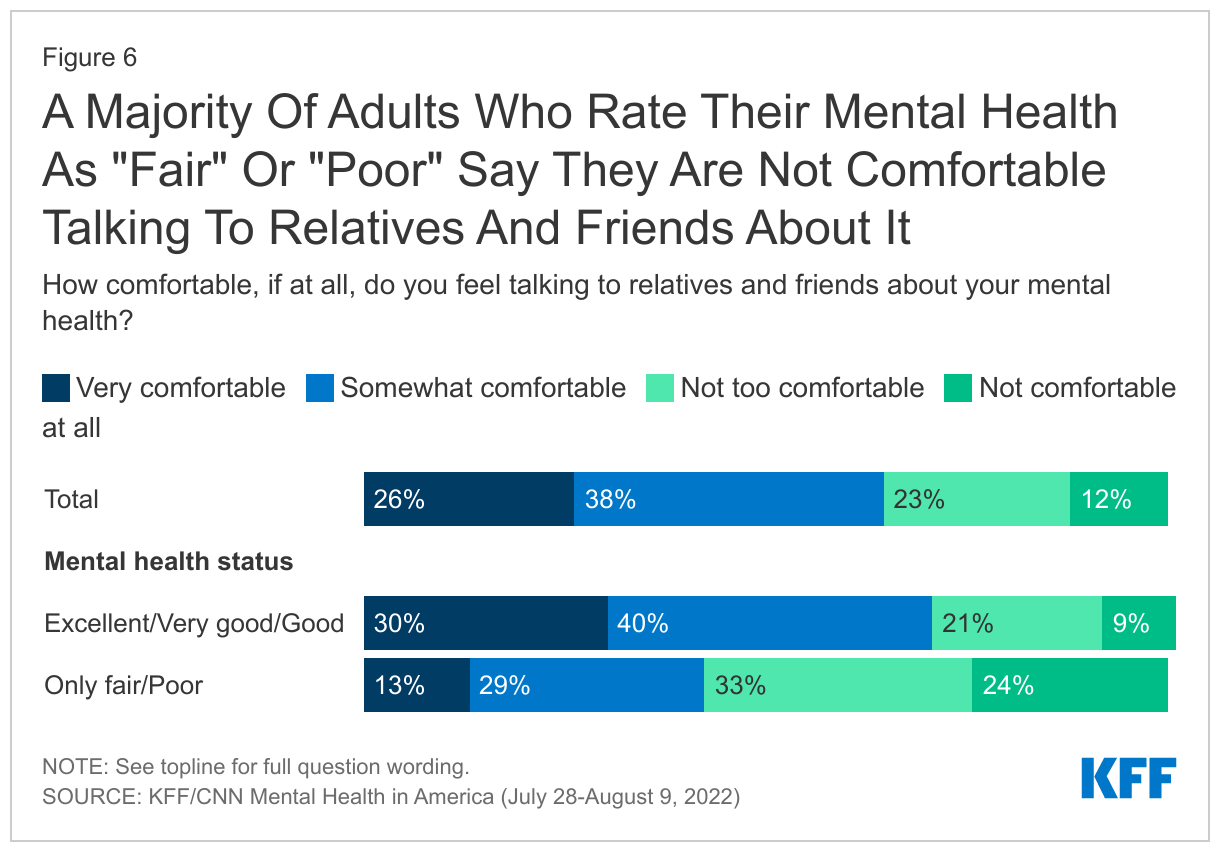
Most adults (64%) do say they feel comfortable talking to relatives and friends about their mental health, though about one-third (35%) say they are “not too comfortable” or “not at all comfortable” doing so. However, among adults who describe their mental health as “only fair” or “poor,” a majority (57%) say they are not comfortable discussing their mental health with relatives and friends.
Majorities across age groups, including 58% of adults under 30 and about two-thirds of those in older age groups say they are at least somewhat comfortable discussing their own mental health with relatives and friends. Similarly, nearly seven in ten Black adults (69%) and about six in ten White adults (63%) and Hispanic adults (61%) say they are at least somewhat comfortable talking to family and friends about their mental health. Among LGBT adults, two-thirds (67%) say they are “very comfortable” or “somewhat comfortable” talking to their relatives and friends about their mental health while one-third (32%) say they are “not too” or “not at all comfortable” doing so.
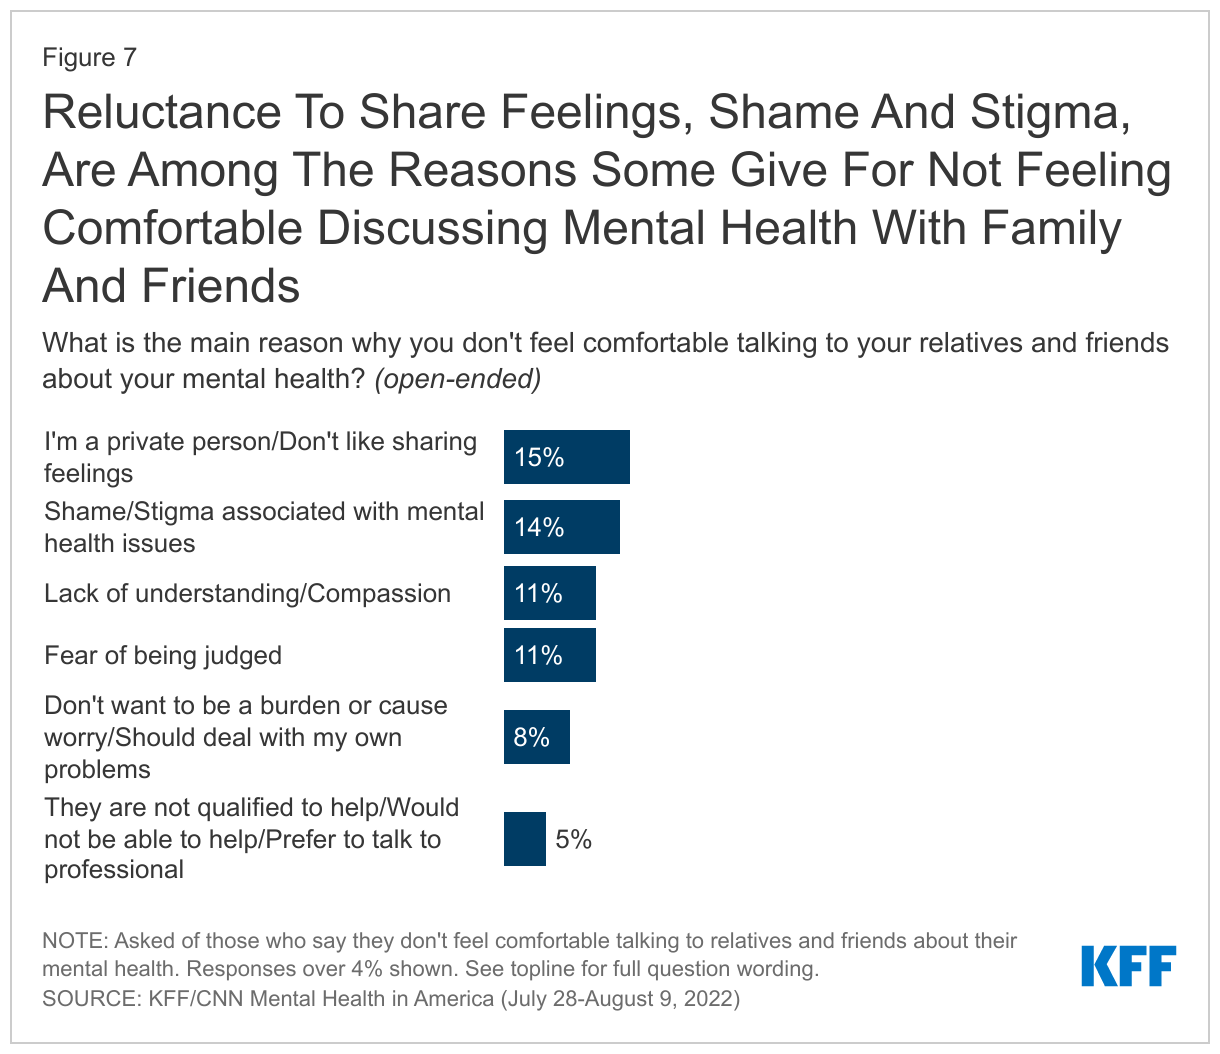
When those who say they are not comfortable discussing their own mental health with family and friends are asked in their own words why they are uncomfortable doing so, about one in seven offer reasons related to privacy and not wanting to share their feelings (15%) while a similar share (14%) cite stigma and shame associated with mental health issues. About one in ten say their family and friends lack understanding or compassion (11%) or say they fear being judged (11%). Adults who rate their mental health as “only fair” or “poor” offer similar reasons why they are uncomfortable discussing their mental health status with relative and friends.
In Their Own Words: What is the main reason why you don’t feel comfortable talking to your relatives and friends about your mental health?
“I don't want anyone to know any thing about me. I am not a good sharer. I do not share my feelings.” – 47 year-old Black woman in Illinois
“I do not feel like they understand mental health issues and treat it like it should not be a big deal.” – 31 year-old White man in Tennesse
“There is a stigma and [I] don't think people would really understand or be there.” – 29 year-old Hispanic woman in California
“I feel like my parents would try to make the problem about them and make me feel bad for telling them how I feel. I think my friends would either laugh it off or give nothing but empty platitudes and worthless advice.” – 20 year-old White man in Florida
“I don't like talking about my feelings in general since I know what to do to work through them and the input of others tends to have a negative impact.” – 25 year-old White man in Utah
“Because it's not considered manly. I've gotten funny looks and debilitating jokes when expressing my concerns in the past.” – 41 year-old Hispanic man in Texas
“Everyone is dealing with their own problems. Feels like an added burden on them.” – 34 year old woman in New York
“I don’t want to worry my friends or family with my own personal struggles.” – 37 year-old White man in Texas
“I'm not a very open person. I like to hide my feelings. I fear being judged. & I fear putting my problems onto people I love.” – 24 year old White woman in Florida
“I am concerned my wife would choose to not understand my feelings, and may even use what I tell her against me with others.” – 59 year-old Hispanic man in California
Parents Have Significant Concerns About Kids’ Mental Health
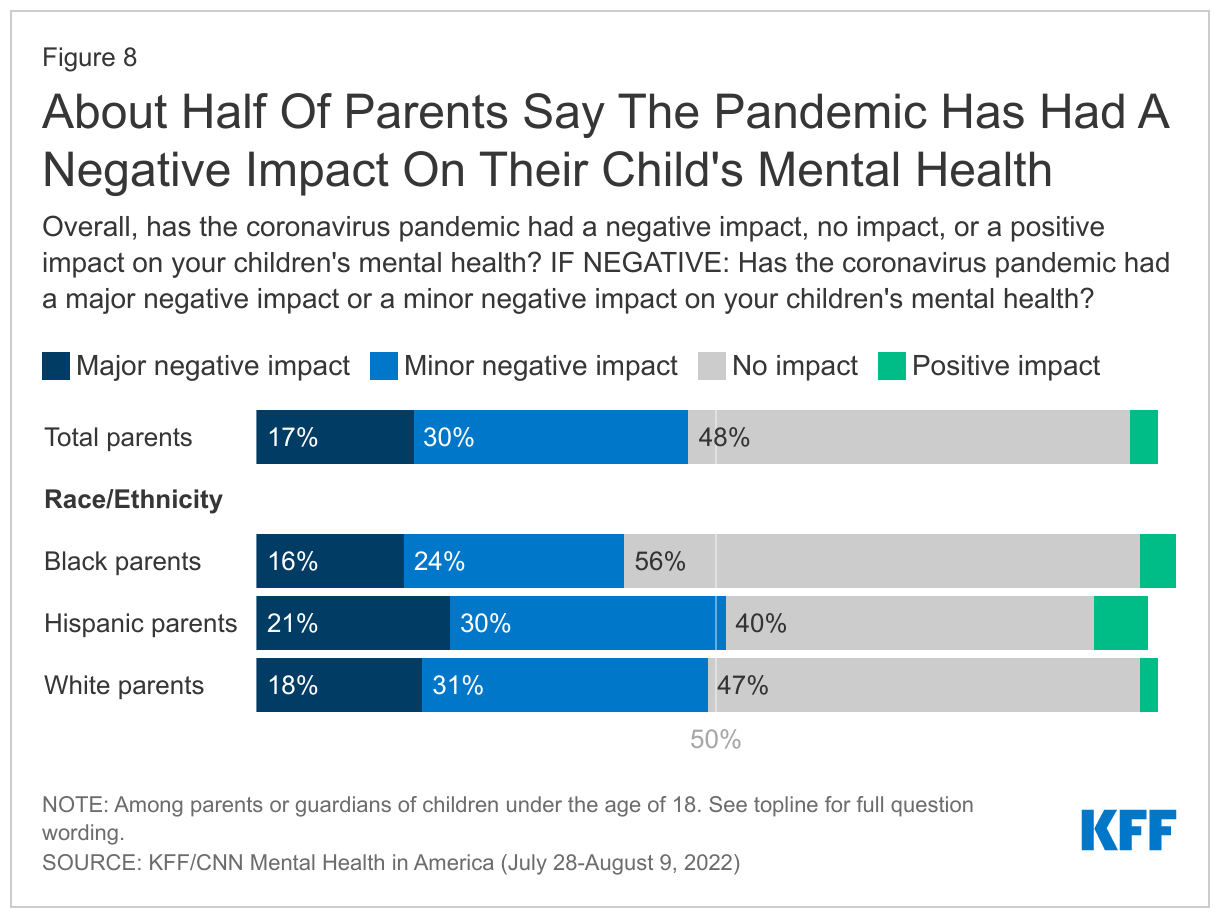
Consistent with previous KFF surveys that found many parents are concerned about the impact of the COVID-19 pandemic on children and teenagers, around half of parents (47%) say the pandemic had a negative impact on their child’s mental health, including 17% who say it had a “major negative impact” and an additional three in ten saying it had a “minor negative impact.” Another half of parents say the pandemic had “no impact” (48%) on their child’s mental health, and less than 1 in 10 say it had a positive impact (3%). Significant shares of parents, across racial and ethnic groups, report that the pandemic had an impact on their child’s mental health with at least four in ten saying it had a negative impact. (40% of Black parents, 49% of White parents, and 51% of Hispanic parents).
Recent reports find that teenagers’ and children’s alcohol and drug use has increased during the pandemic, and rising rates of depression and anxiety. The KFF/CNN survey finds that parents and non-parents are worried about how mental health is impacting teenagers.
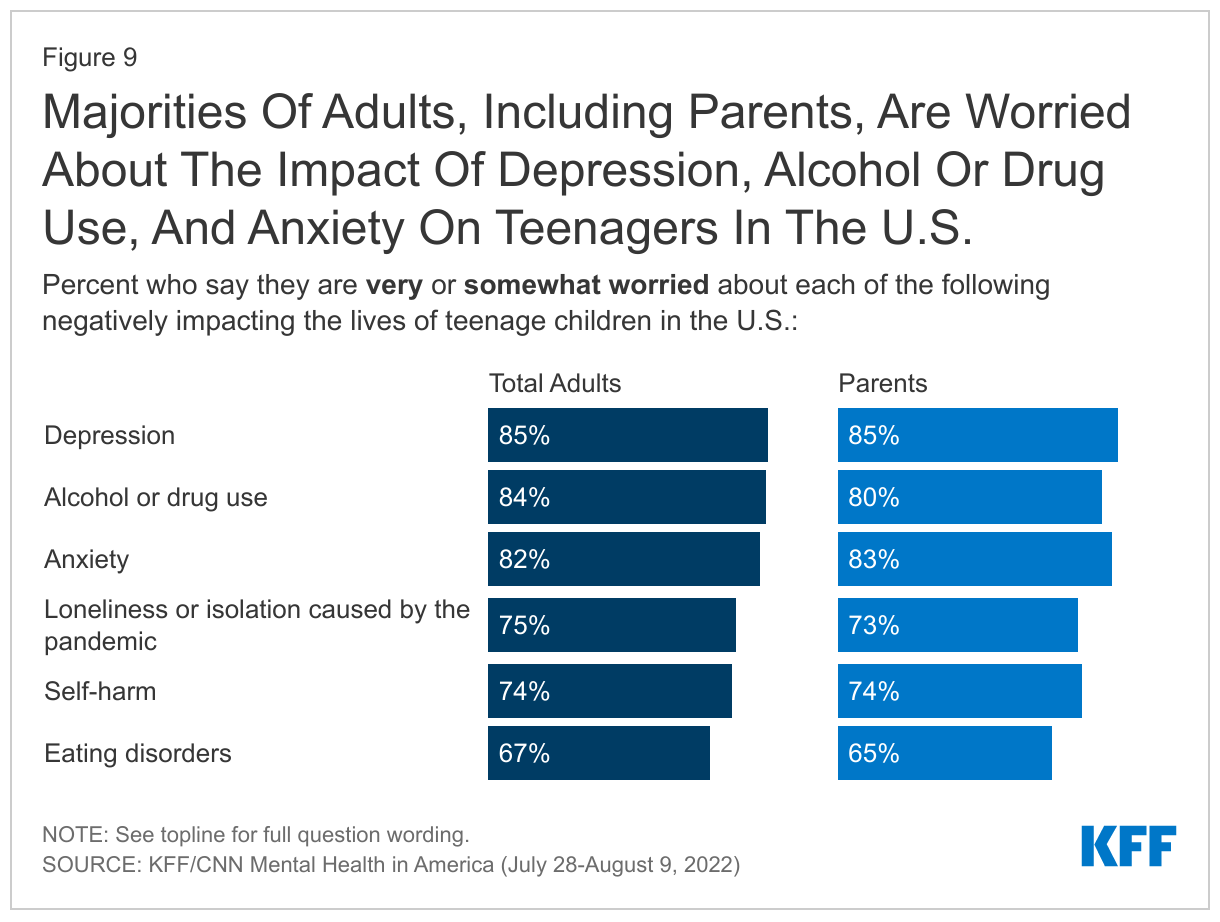
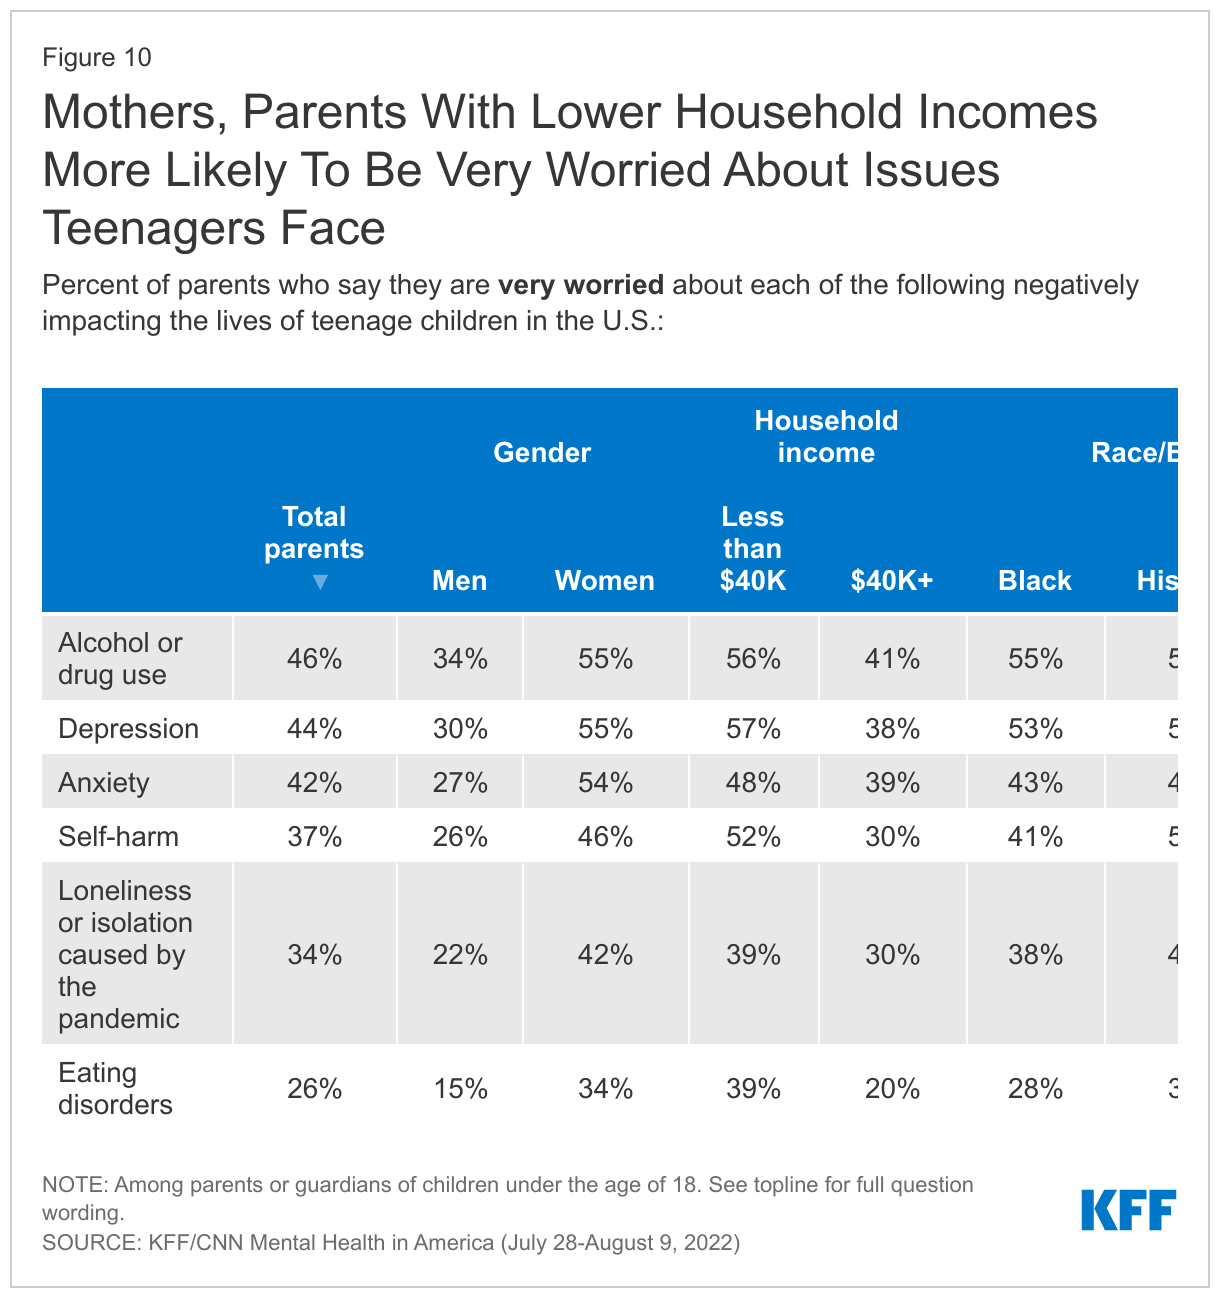
At least eight in ten of all adults and parents, are “very” or “somewhat worried” about depression (85% of all adults, 85% of parents), alcohol or drug use (84%, 80%), or anxiety (82%, 83%) negatively impacting the lives of teenage children in the U.S.
About three-quarters of adults and parents are worried about loneliness or isolation caused by the pandemic (75% adults, 73% parents) or self-harm (74%, 74%) negatively impacting the lives of teenage children. Two-thirds of adults and parents are also worried about eating disorders negatively impacting the lives of teenage children (67%, 65%).
Parents with household incomes under $40,000 are more likely than those with incomes of $40,000 or more to say they are “very worried” that self-harm, eating disorders, depression, and alcohol or drug use will negatively impact the lives of teenagers. With the exception of loneliness and isolation caused by the pandemic and anxiety, larger shares of these low-income parents say they are “very worried” about each of the issues asked about in the survey.
Black and Hispanic parents were more likely to report they were “very worried” about many issues facing teenagers, with more Hispanic and Black parents saying so about the issues of alcohol or drug use (58% of Hispanic parents and 55% of Black parents compared to 37% of White parents). More Hispanic than White parents were also “very worried” about the issues of self-harm (53% of Hispanic parents, 30% of White parents) and pandemic-caused loneliness or isolation (45% of Hispanic parents, 27% of White parents). Black parents report higher levels of worry about teenagers experiencing depression (53%) than White parents (39%).
Additionally, mothers are more likely than fathers to say they are “very worried” about each issue asked in the survey.
Half Of U.S. Adults Report Experiencing A Severe Mental Health Crisis In Their Families
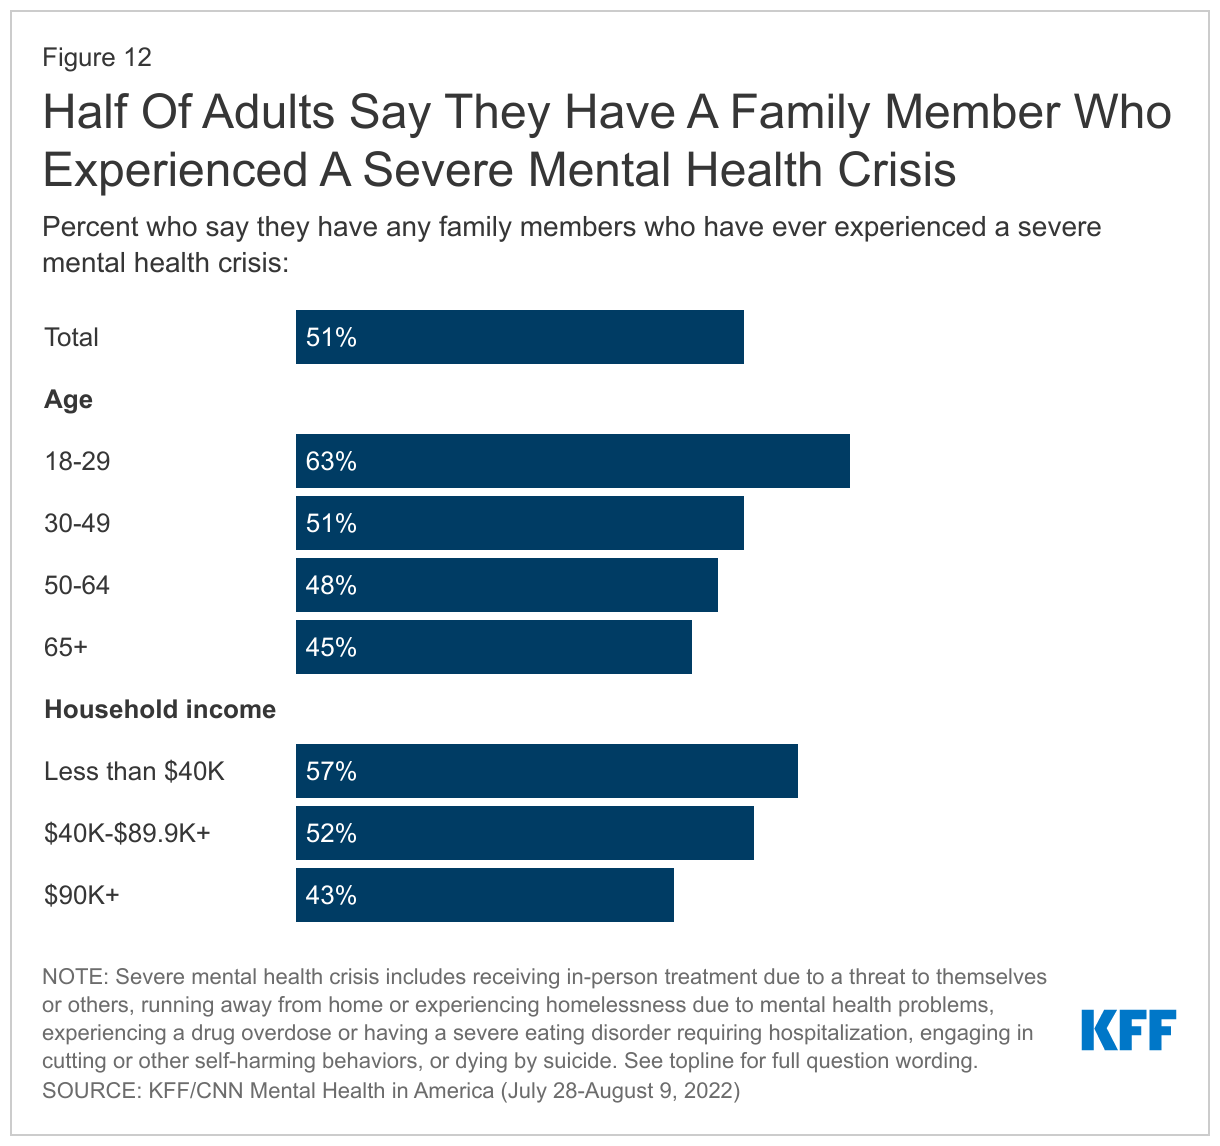
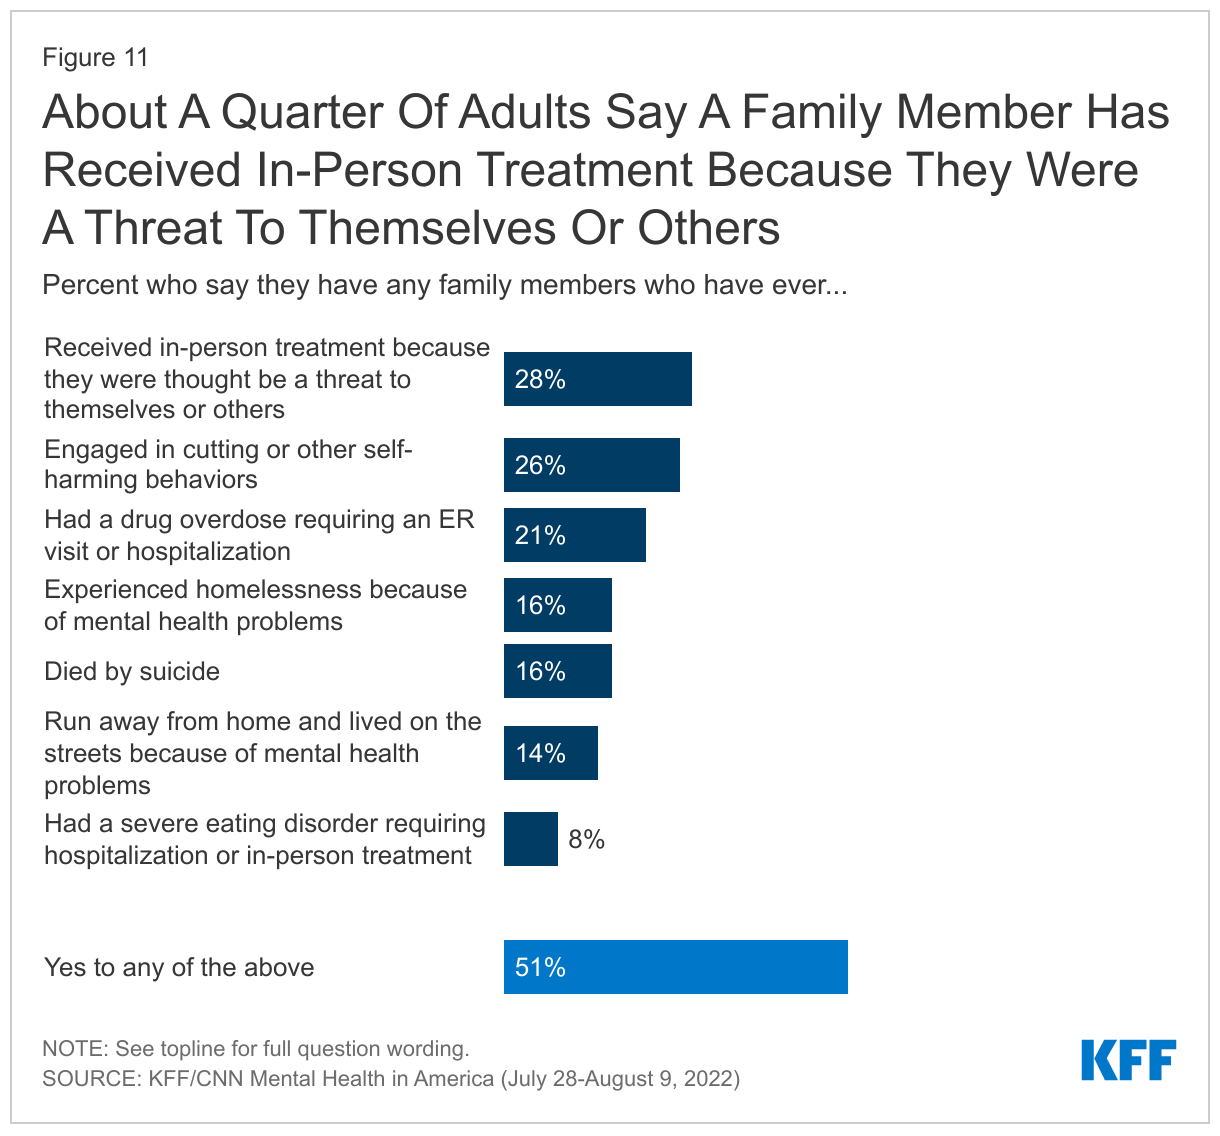
Half of adults (51%) say they have experienced a severe mental health crisis in their family, including one in four adults who say they have had a family member receive in-person treatment because they were thought to be a threat to themselves or others (28%) or had a family member engaged in cutting or other self-harming behaviors (26%). Smaller, but still substantial shares, report a family history with a member who experienced a drug overdose requiring an ER visit or hospitalization (21%), died by suicide (16%), experienced homelessness (16%), ran away from home and lived on the streets (14%), or had a severe eating disorder requiring in-person treatment or hospitalization (8%).
About two-thirds of adults under age 30 (63%) and LGBT adults (67%) say they have had a family member experience a severe mental health crisis, perhaps reflecting more awareness and comfortability around severe mental health issues rather than actual incidence; and notably, nearly half of adults under 30 (45%) and LGBT adults (45%) say they had a family member engaged in cutting or other self-harming behaviors.
Adults with lower incomes (under $40,000) are more likely than those with higher incomes to say have had a family member who experienced a mental health crisis (57% vs. 48%). Similarly, adults without a college degree are more likely than college graduates to say they have experienced a severe mental health crisis in their family (56% vs. 42%). About half of adults across partisans, racial and ethnic identities, and across community type say they have had a family member experience a mental health crisis.
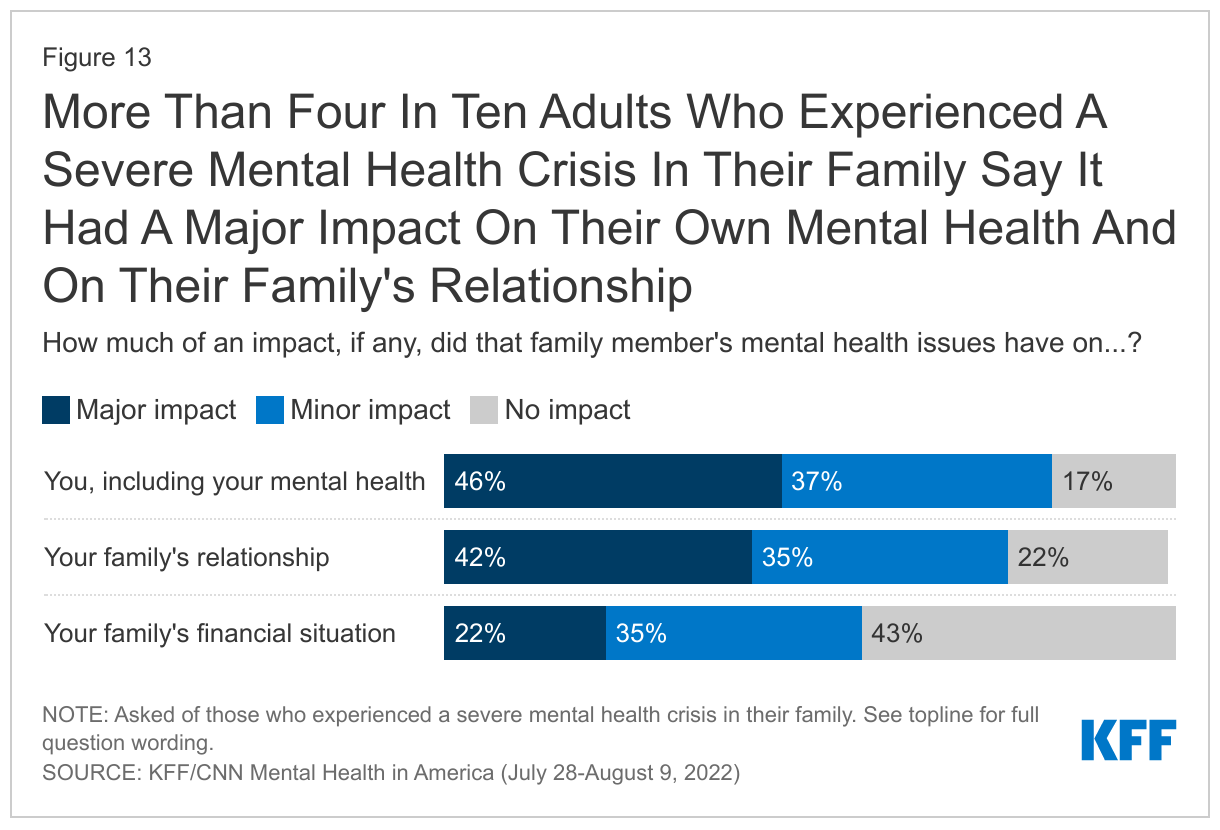
Among adults who had a family member who experienced a mental health crisis, more than four in ten (46%) say it had a major impact on them, including their own mental health and four in ten say it had a major impact on their family’s relationship (42%). About one in five (22%) adults who had a family member experience a mental health crisis say their family member’s mental health issues had a major impact on their family’s financial situation.
Who Is Able To Access Mental Health Care?
About half of the public (51%) say they think that most adults in the U.S. are not able to get mental health services and 55% say kids and teens in the U.S. are not able to get the mental health services they need. Majorities of adults who have a family member who has experienced a mental health crisis say adults (54%) and children and teenagers (57%) are not able to get the mental health services they need. Among adults who have themselves received mental health services in the past year, six in ten say adults in the U.S are not able to get the mental health services they need (60%).
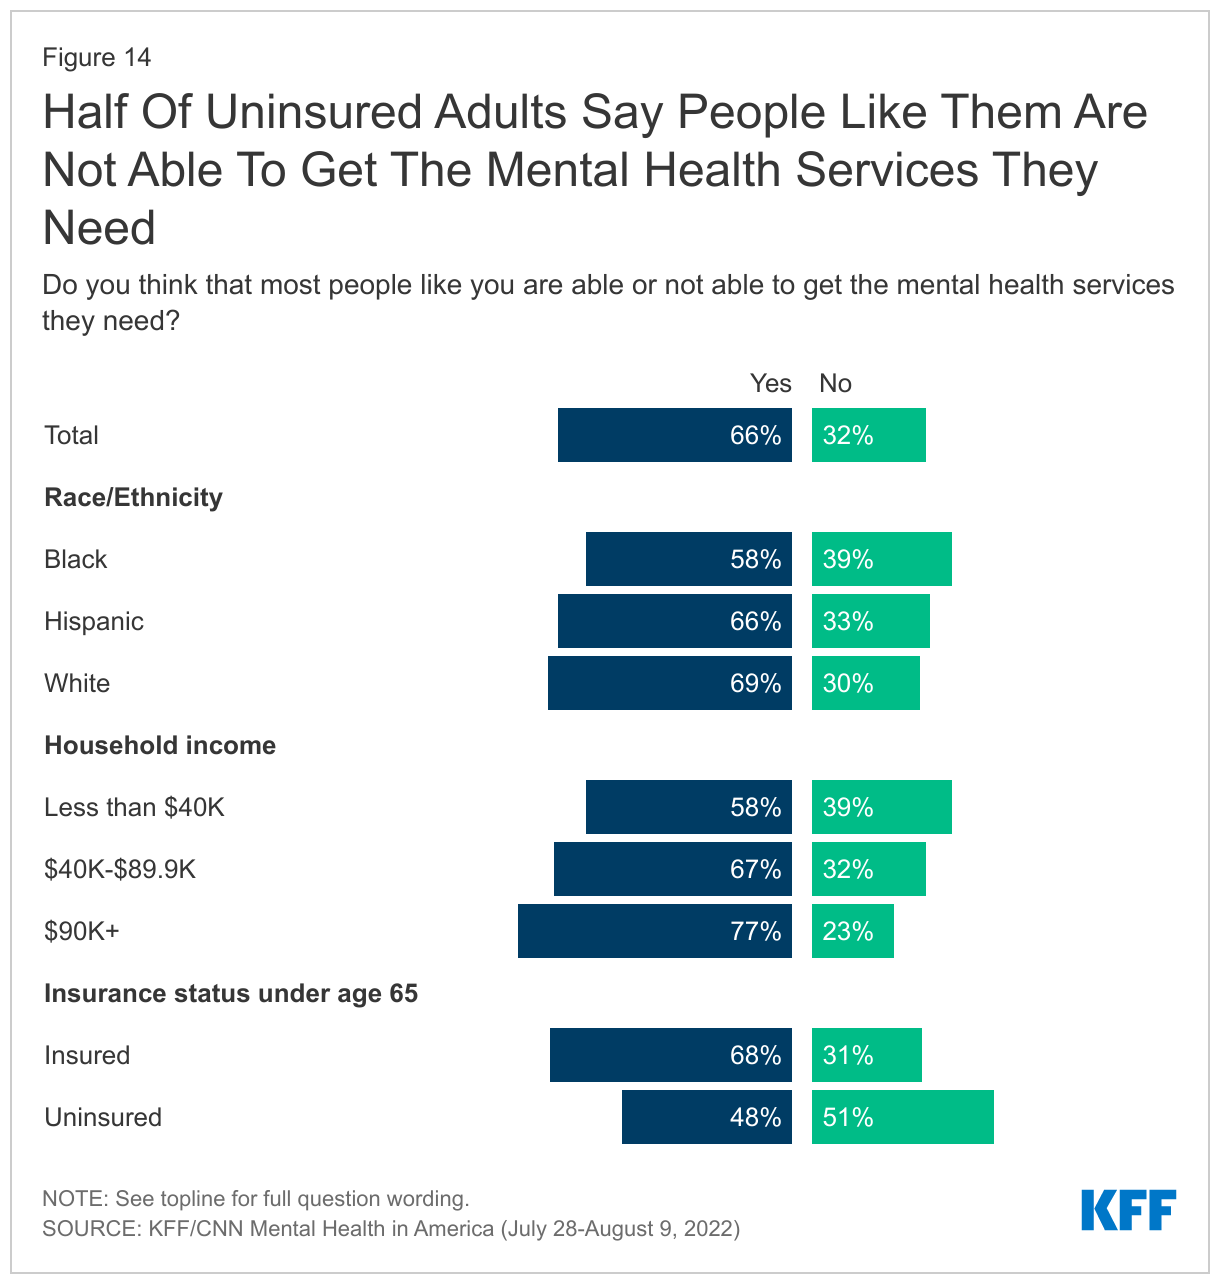
While most people say they are able to get the mental health services they may need (66%), significant shares of Black adults (39%), adults with incomes under $40,000 (39%), and uninsured adults under age 65 (51%) say people like themselves are not able to get needed mental health services.
For Many, Cost of Mental health Services Is Prohibitive
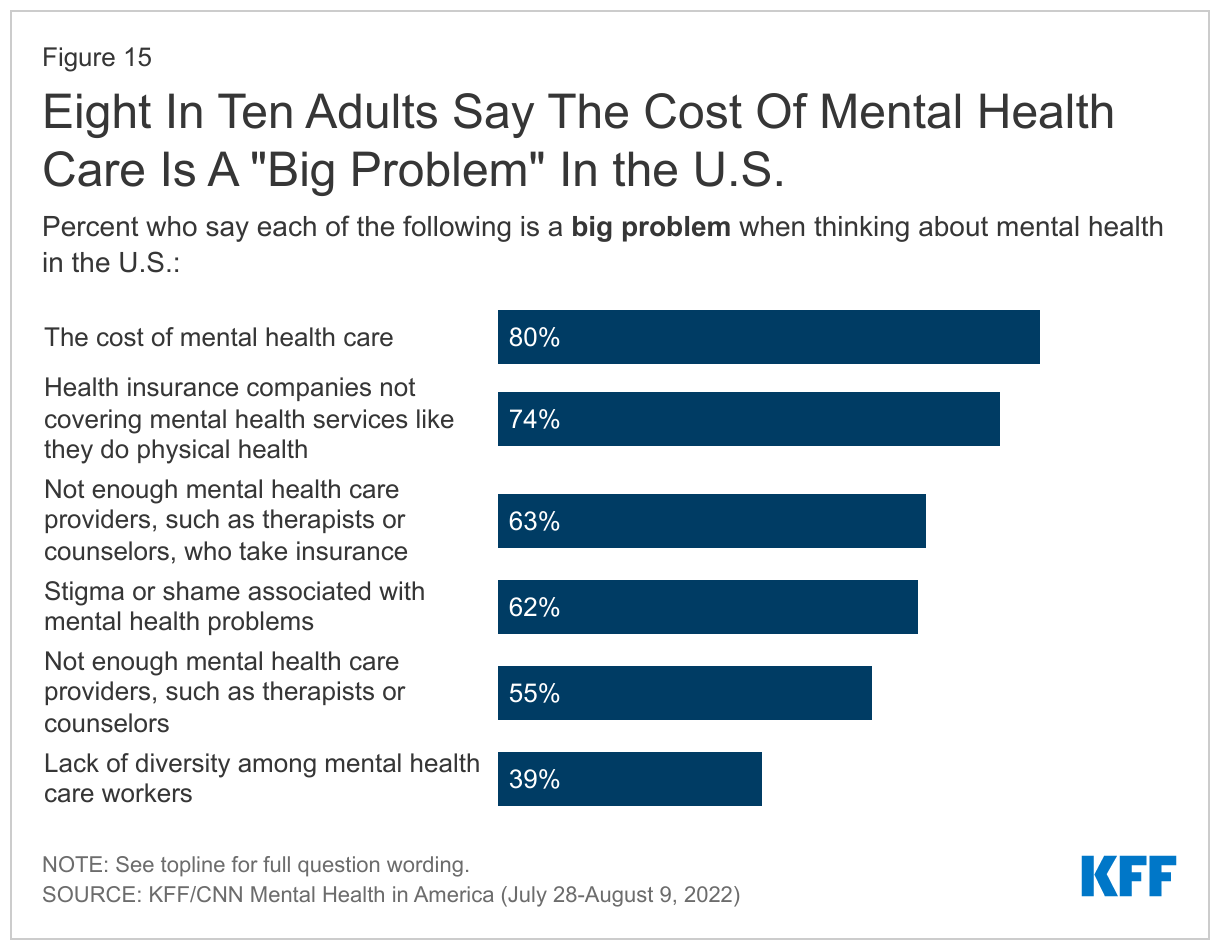
When asked about specific barriers that may prevent people from accessing mental health services, cost emerges as a key problem with eight in ten adults saying the cost of mental health care is a “big problem” in the United States. Relatedly, about three in four adults (74%) say that health insurance not covering mental health care in the same manner it covers physical health is a “big problem.” Around six in ten adults (63%) say the lack of mental health care providers who take insurance is a “big problem.”
Beyond these cost-related issues, six in ten adults (62%) say stigma or shame associated with mental health is a “big problem” and 55% identify a lack of mental health providers as a “big problem” in the U.S.
About four in ten adults (39%) say lack of diversity among mental health care workers as a “big problem”, though about seven in ten say it is as at least a “small problem.” Notably, slight majorities of Black (55%) and Hispanic (53%) adults see the lack of diversity among mental health care workers as a “big problem,” compared to three in ten White adults who say the same (30%).
Who Isn’t Able To access Needed Mental health Services?
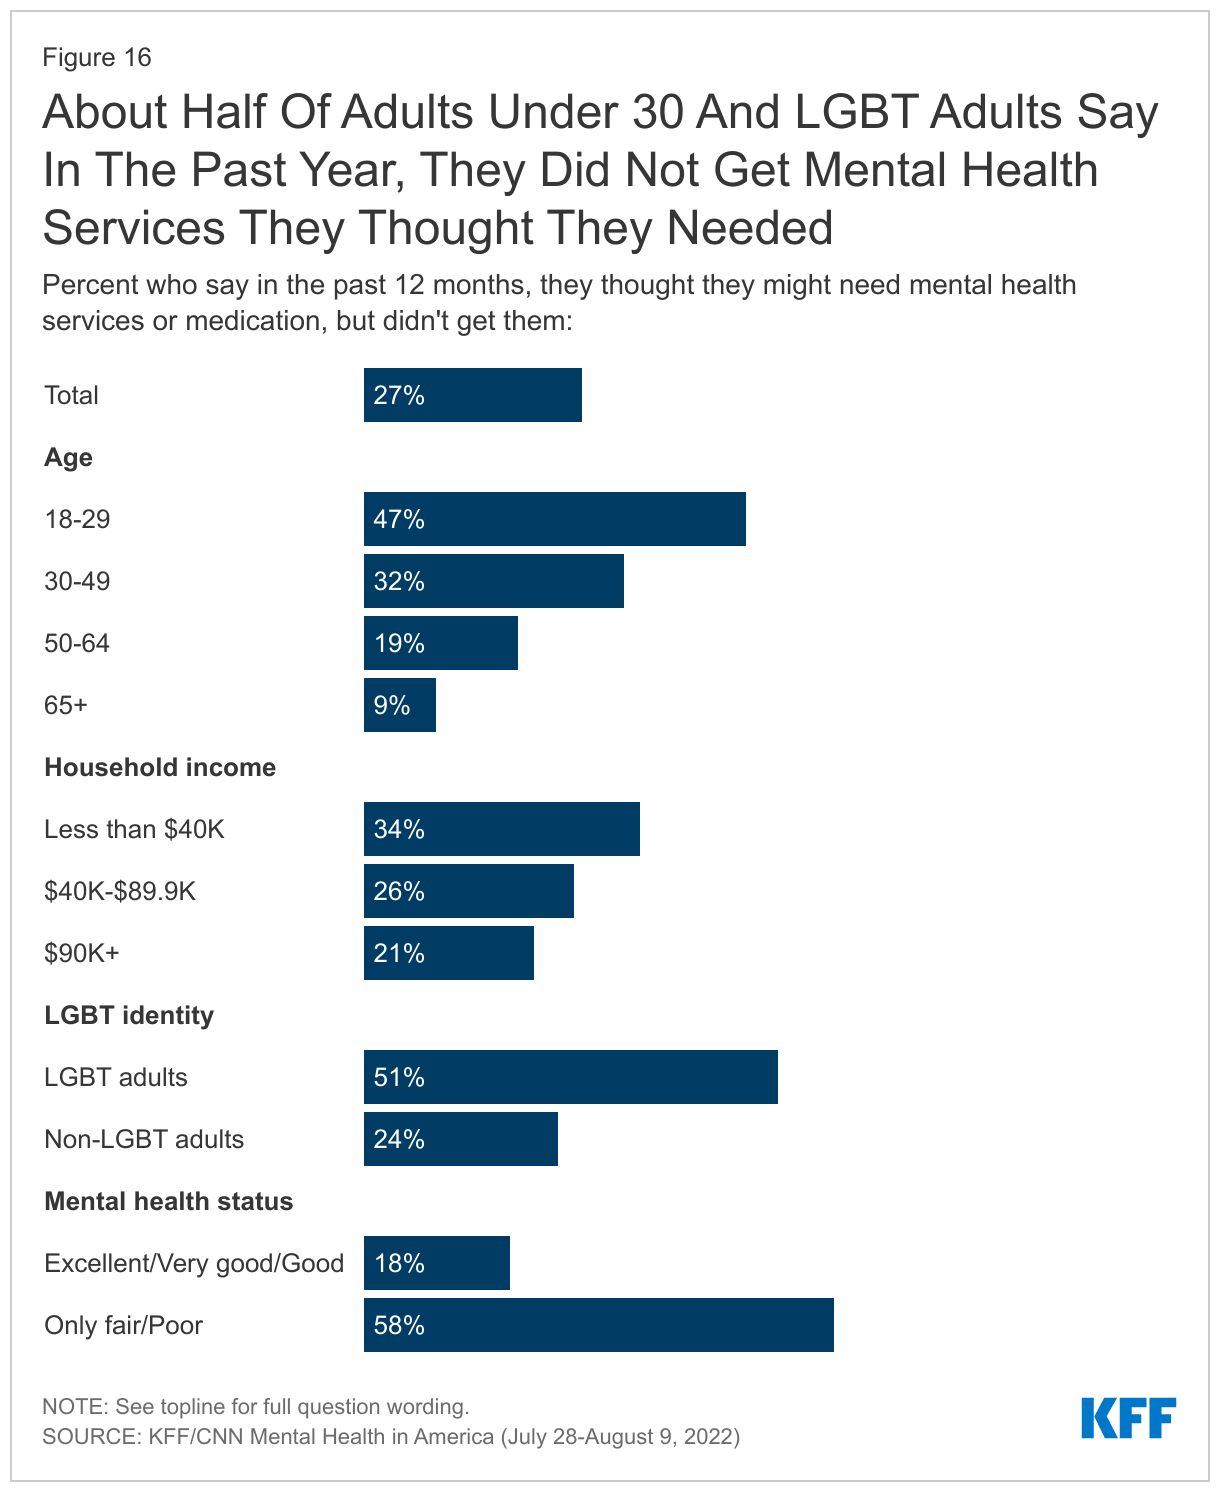
About one in four adults (27%) say there was a time in the past 12 months when they thought they might need mental health services or medication, but they did not get them. This rises to six in ten (58%) among those who describe their own mental health as “only fair” or “poor.” About half of adults under age 30 (47%) and LGBT adults (51%) – groups who are among the most likely to describe their mental health status are “only fair” or “poor” – say there was a time in the past year they thought they might need mental health services or medication but did not get them.
About a third (34%) of adults with household incomes under $40,000 say they thought they might need mental health services or medication in the past year but did not get them, compared to about a quarter (26%) of those with incomes between $40,000 and $90,000 and about one in five (21%) adults with household incomes of $90,000 or more. At least a third of Hispanic adults (35%) say there was a time they didn’t get mental health services or medication in the past 12 months when they thought they needed them, compared to three in ten Black adults and one-fourth of White adults.
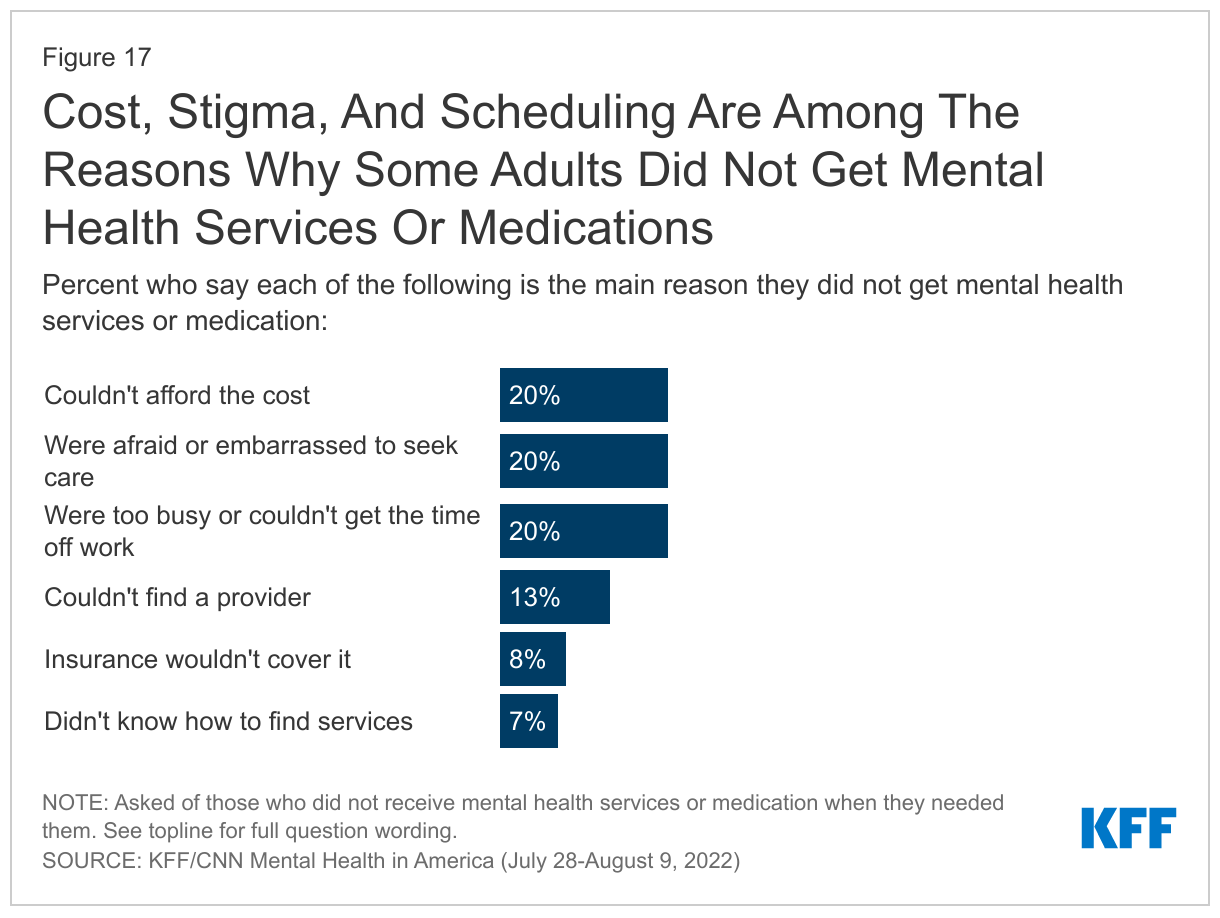
Among those who did not get services or medication they thought they may have needed, reasons vary; about one in five say they could not afford the cost (20%), they were too busy or could not get the time off work (20%), or say they were afraid or embarrassed to seek care (20%). A further 13% say they could not find a provider and 7% say they did not know how to find services, while 8% say their insurance would not cover the mental health services or medications.
While there have been significant concerns about mental health for kids and teens during the pandemic, about one in seven parents (15%) say there was a time in the last year they thought their child might need mental health services or medication, but they did not get them.
Role of Institutions and Individuals in Addressing Mental Health Problems
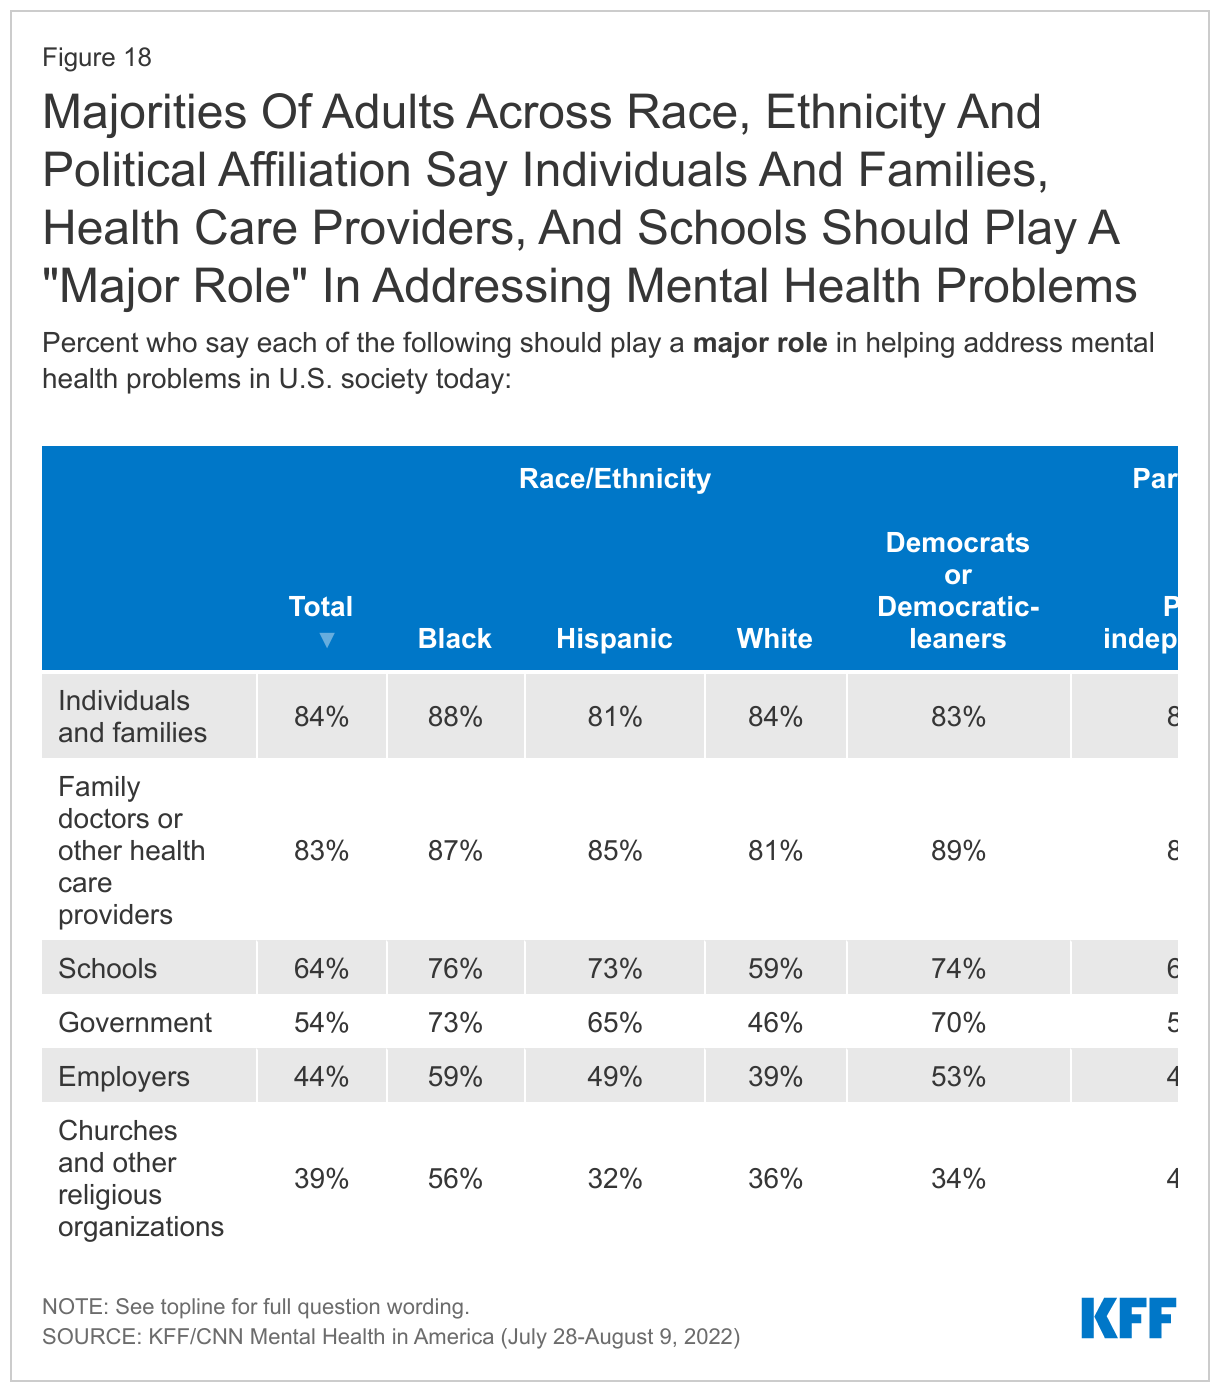
A majority of the public say the government, schools, family doctors and health care providers, and individuals and families play a major role in helping address mental health problems in this country. When asked what role certain groups and institutions should play in helping address the mental health problems in society, more than eight in ten adults say individuals and families (84%) and family doctors and other health care providers (83%) should play a “major role.” Across race and ethnic groups and across partisans, large majorities say individuals and families and doctors should play a “major role.”
About two-thirds of adults think schools should play a major role in helping address mental health problems in society (64%) – including at least seven in ten Black adults (76%), Hispanic adults (73%) and Democrats or Democratic-leaning independents (74%). Notably, at least nine in ten adults across partisans think schools should play at least a minor role in helping address mental health problems.
A slight majority of the public (54%) say government should play a major role in helping address mental health problems in society – with large gaps across race/ethnicity and partisan groups. About three in four Black adults (73%) and two-thirds of Hispanic adults (65%) say government should play a major role, compared to fewer than half of White adults who say the same (46%). Seven in ten Democrats and Democratic-leaning independents say government should play a major role, compared to about a third of Republican and Republican-leaning independents who say the same (70% vs. 36%).
About four in ten adults say employers (44%) and churches or other religious organizations (39%) should play a “major role” in helping address mental health problems. A majority of Black adults (56%) say religious organizations should play a “major role” in helping address mental health problems in U.S. society today.
Where People Can Turn For Help
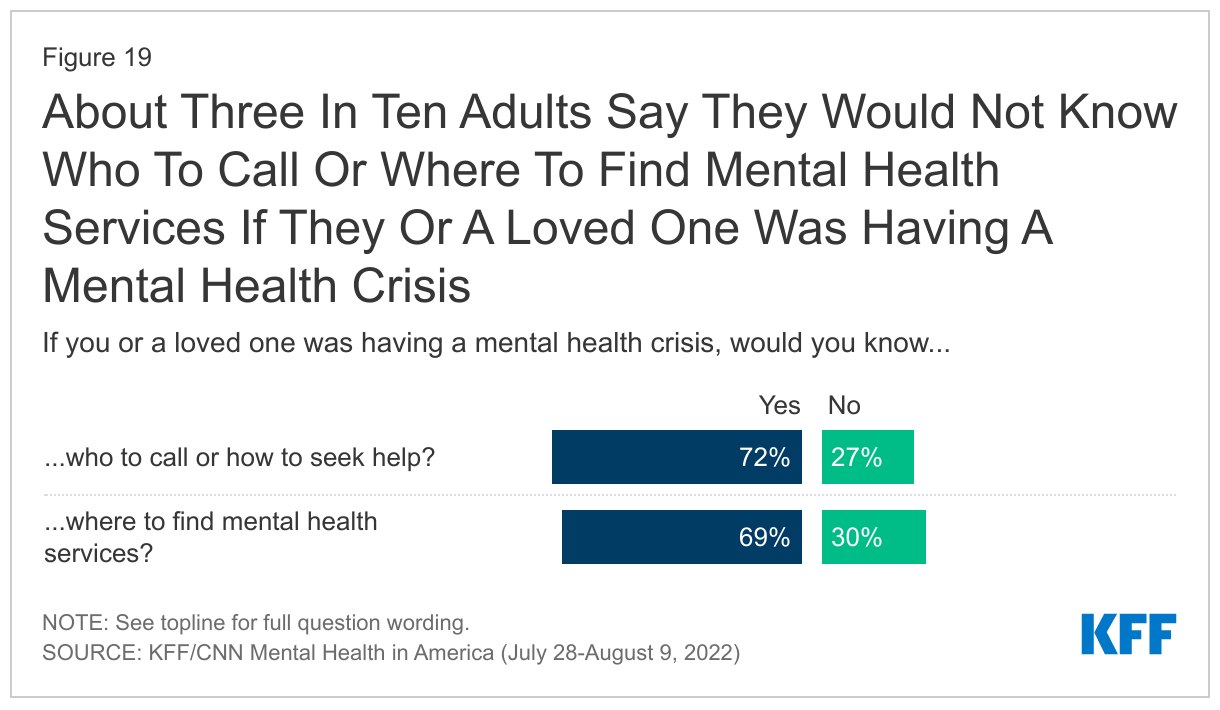
Most adults say that if they or a loved one was having a mental health crisis, they would know who to call or how to seek help (72%) or would know where to find mental health services (69%). However, about three in ten adults say they would not know where to seek help (27%) or where to find services (30%).
Yet, there are some groups who are more unsure of who to call or where to get services. Four in ten uninsured adults under age 65 say they would not know who to call or how to seek help if they or a loved one was having a mental health crisis, and nearly half (47%) say they would not know where to find mental health services. A larger share of Hispanic adults compared to White adults also report not knowing who to call if there was a mental health crisis (34%) or where to find mental health services (41%). Four in ten (37%) adults younger under age 30 also report not knowing where to find mental health services and three in ten (31%) say they would not know who to call or how to seek help.
One in five (20%) adults say they have called 911 in the past because they or a loved one was having a mental health, alcohol or drug, or suicide crisis. This includes three in ten adults under 30, 36% of LGBT adults, and 31% of people whose family has had a severe mental health episode or crisis.
About half of the public think that if they or a loved one was having a mental health crisis, calling 911 would “help the situation” (51%) but about a quarter of the public say calling 911 would “do more to hurt the situation” (27%), while another one in ten (19%) say it wouldn’t have any impact. The share who believe calling 911 would “do more to hurt the situation” in a mental health crisis is somewhat higher among LGBT adults (43%), those ages 18-29 (32%) and 30-49 (30%), and Black adults (29%).
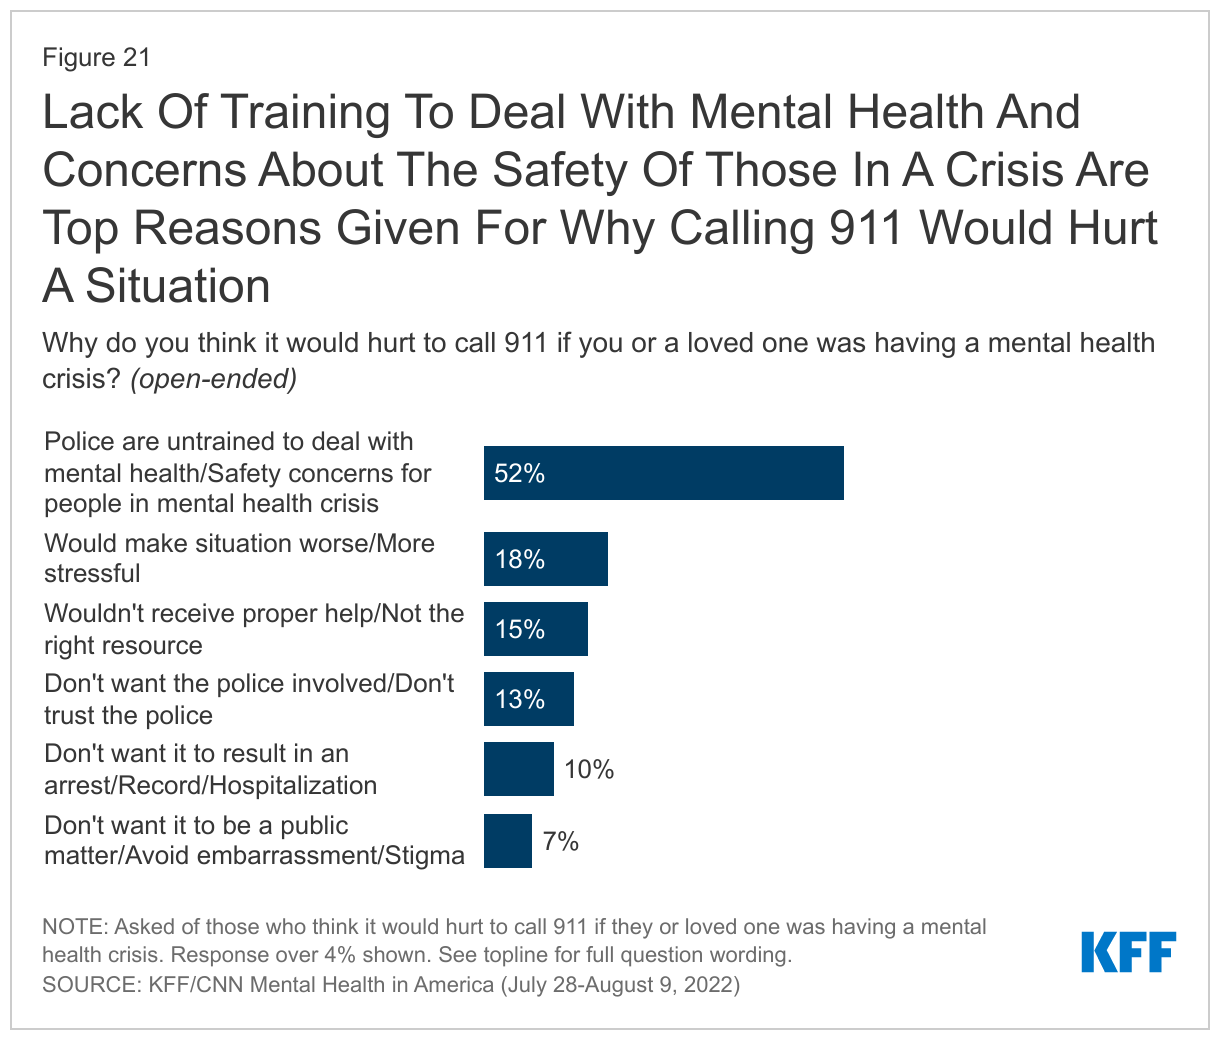
When asked why they think calling 911 would do more to hurt the situation, about half (52%) cite lack of police training to deal with mental health and concerns about the safety of people in a mental health crisis as reasons why calling 911 would hurt the situation. Other reasons for thinking calling 911 would worsen the situation include thinking it would make the situation more stressful (18%), that 911 is not the right resource for someone having a mental health crisis (15%), not trusting the police and not wanting them involved (13%), not wanting it to lead to an arrest, official record, or hospitalization (10%) and wanting to avoid embarrassment and stigma (7%).
In Their Own Words: Why do you think it would hurt to call 911 if you or a loved one was having a mental health crisis?
“Law enforcement are not trained to properly to deal with mental health.” – 27 year-old Black man in Georgia
“The 911 operators are not trained to help with mental health crisis issues.” – 21 year-old Hispanic man in Alabama
“Sometimes emergency responders are not trained how to handle these crisis situations and can upset or worsen the problem / situations.” – 64 year-old White woman in South Carolina
“Because most first responders don't know how or what to do to treat mental health and they only make the problem worse.” – 66 year-old Black man in Michigan
“They are not trained well enough to take care of mental health crisis. My brother was schizophrenic and we called the police and he was killed by the police because they did not know that he was going through a mental health crisis.” – 39 year-old White man in Colorado
“If they send the police, they don’t know how to deal with it. They wind up shooting the person who is in crisis.” – 72 year-old White woman in New Jersey
“The police aren't really prepared or trained to deal with mental health issues. Frankly I'd be worried they would overreact and create more of an issue.” – 29 year-old White man in Illinois
“It would increase the anxiety or situation. I would call our pastor or a friend who is a counselor first. If the situation becomes worse I would then not be opposed to calling 911, but it would not be the first thing I would try.” – 58 year-old White woman in Virginia
“Resistance and shame, plus if the person in need was in the position as the main financial provider for the family and lost the ability to earn a living for the family, due to a need for temporary hospitalization, that would devastate the family.” – 51 year-old White man in Connecticut
“Don't feel that all first responders are poorly trained to recognize, treat and handle someone with a mental health condition. This often times results in the individual being wrongfully arrested or possibly even killed.” – 44 year-old Black man in Virginia
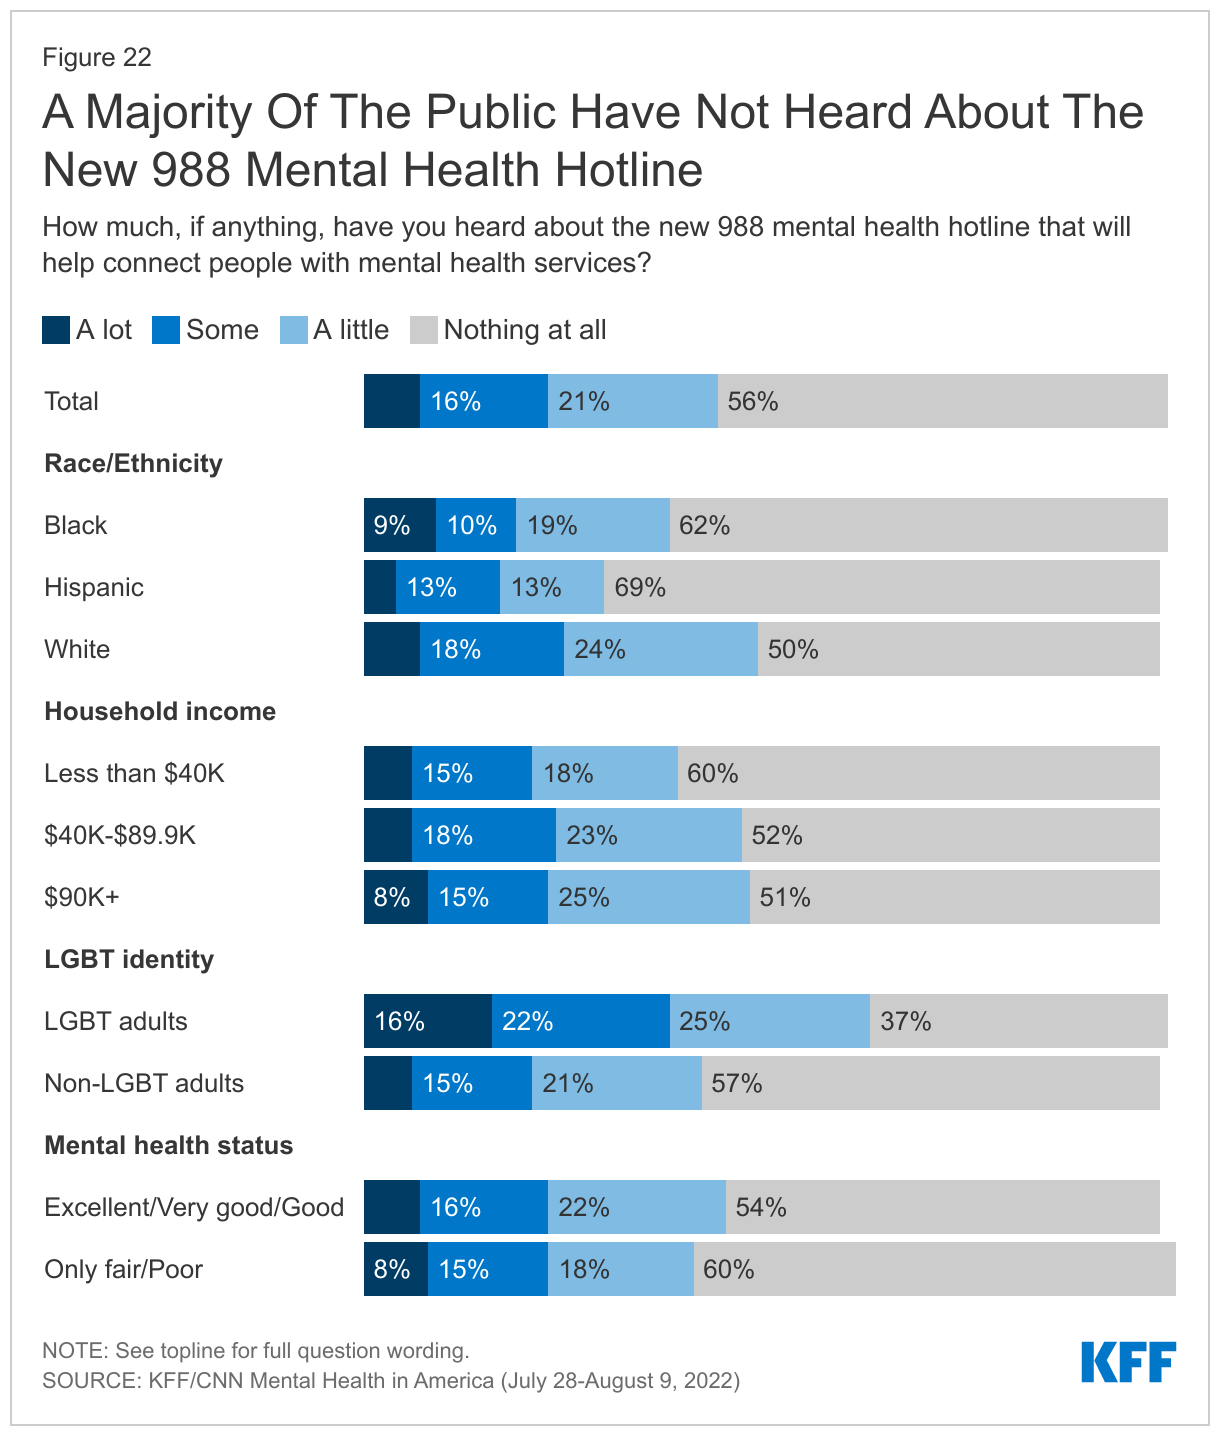
In July, the U.S. transitioned the phone number for the National Suicide Prevention Lifeline to a federally mandated three digit crisis number, 988, that is intended to be easier for people to remember and also provides access to other crisis counseling services. One month in, a majority of adults (56%) say they have heard “nothing at all” about the new 988 number with an additional one in five (21%) saying they have heard “a little.” Only about one in four adults say they have heard either “a lot” (7%) or “some” (16%) about the new 988 mental health hotline that will connect people with mental health services.
Notably, Black adults (62%) and Hispanic adults (69%) are more likely than White adults (50%) to say they have heard “nothing at all” about the new 988 number. Similarly, adults with household incomes under $40,000 (60%) are more likely than their higher-income counterparts (52% of those with an income of $40,000 or more) to say they have heard “nothing at all” about the new 988 crisis hotline.
Despite the low levels of awareness, when told about the new hotline, large majorities of adults (85%) including 91% of Black adults, 86% of White adults, and 80% of Hispanic adults say they are “very” or “somewhat” likely to call the number if they or a loved one were experiencing a mental health crisis.
While few people who say they are currently experiencing “only fair” or “poor” mental health say they have heard of the 988 service, most (85%) say they would be likely to call the number if needed.