How Many People Might Lose Medicaid When States Unwind Continuous Enrollment?
Starting April 1, 2023 some states resumed disenrolling people from Medicaid after a three-year period during which states provided continuous enrollment in exchange for enhanced federal funding. Between February 2020 and March 2023, Medicaid enrollment grew by an estimated 20 million people, contributing to declines in the uninsured rate, which dropped to the lowest level on record in early 2022. As states unwind the continuous enrollment provision, we estimate, based on a recent KFF survey, that 17 million people could lose Medicaid coverage – including some who are no longer eligible and others who are still eligible but face administrative barriers to renewal. Decreases in Medicaid enrollment could reverse the recent gains in insurance coverage overall.
This analysis estimates the number of people who could lose Medicaid during the unwinding period under three possible rates of Medicaid coverage loss, and shows for each illustrative rate, state-by-state coverage reductions among Medicaid children and adults. In practice, rates of Medicaid coverage loss will vary across the states, depending on states’ approaches to the unwinding and the extent to which they engage in outreach and assistance activities to minimize disenrollment among people who are still eligible.
The analysis uses a combination of enrollment data from the Centers for Medicare and Medicaid Services (CMS) Performance Indicator Project (PI data), Medicaid claims data (T-MSIS data), and some state-specific sources (see Methods for a detailed explanation of the analysis). We exclude people enrolled in the Children’s Health Insurance program (CHIP) because it is expected that some of the people who disenroll from Medicaid will enroll in CHIP and CHIP enrollment may increase during the unwinding. (In some states, CHIP enrollment decreased during the continuous enrollment period, potentially because some people who were eligible for CHIP remained instead on Medicaid.)
Our estimates are based on the best available public data on states’ Medicaid enrollment, but predicting the future here with incomplete data is highly uncertain and the scenarios described in this data note are intended to be illustrative only. The scenarios presented here represent a range of outcomes that states predicted in the recent KFF survey, but the range reflects predictions reported across all states that responded to the question. The analysis excludes estimates of people who may newly enroll in Medicaid during the unwinding period and among those who disenroll, how many will re-enroll within a short time (e.g., “churn”). Our analysis projects the rate of disenrollment, but net changes in Medicaid enrollment—which reflect new enrollment and churn—will be smaller than the number of people who lose coverage.
How Many People Might Lose Medicaid?
If Medicaid enrollment decreased by 18% in all states between March 2023 and May 2024, as suggested by a recent KFF survey, 17 million would lose Medicaid coverage (Figure 1). In KFF’s recent survey of states about their Medicaid eligibility policies, just over one-third of states were able to report their projected coverage losses associated with the unwinding. The midpoint of state responses was that 18% of Medicaid enrollees could be disenrolled over the course of the unwinding, responses were quite varied, ranging from 7% to 33%. We use 18% for this analysis to illustrate how much enrollment could decrease. But, recognizing the uncertainty and the expected variation across states, we present disenrollment numbers if the rate is 10 percentage points above or below the median, a range of 8% to 28% which is similar to the range coming from state responses.
An 18% decline in enrollment would translate to 17 million people losing Medicaid, of whom 5 million are children and 12 million are adults. These projected coverage losses are consistent with estimates from the Department of Health and Human Services (HHS) suggesting that as many as 15 million people will be disenrolled, including 5 million children and 10 million adults. HHS estimates that among the 15 million people who lose coverage, nearly 7 million will still be eligible. (KFF’s analysis models disenrollment but does not attempt to estimate the number of people who are still eligible.)
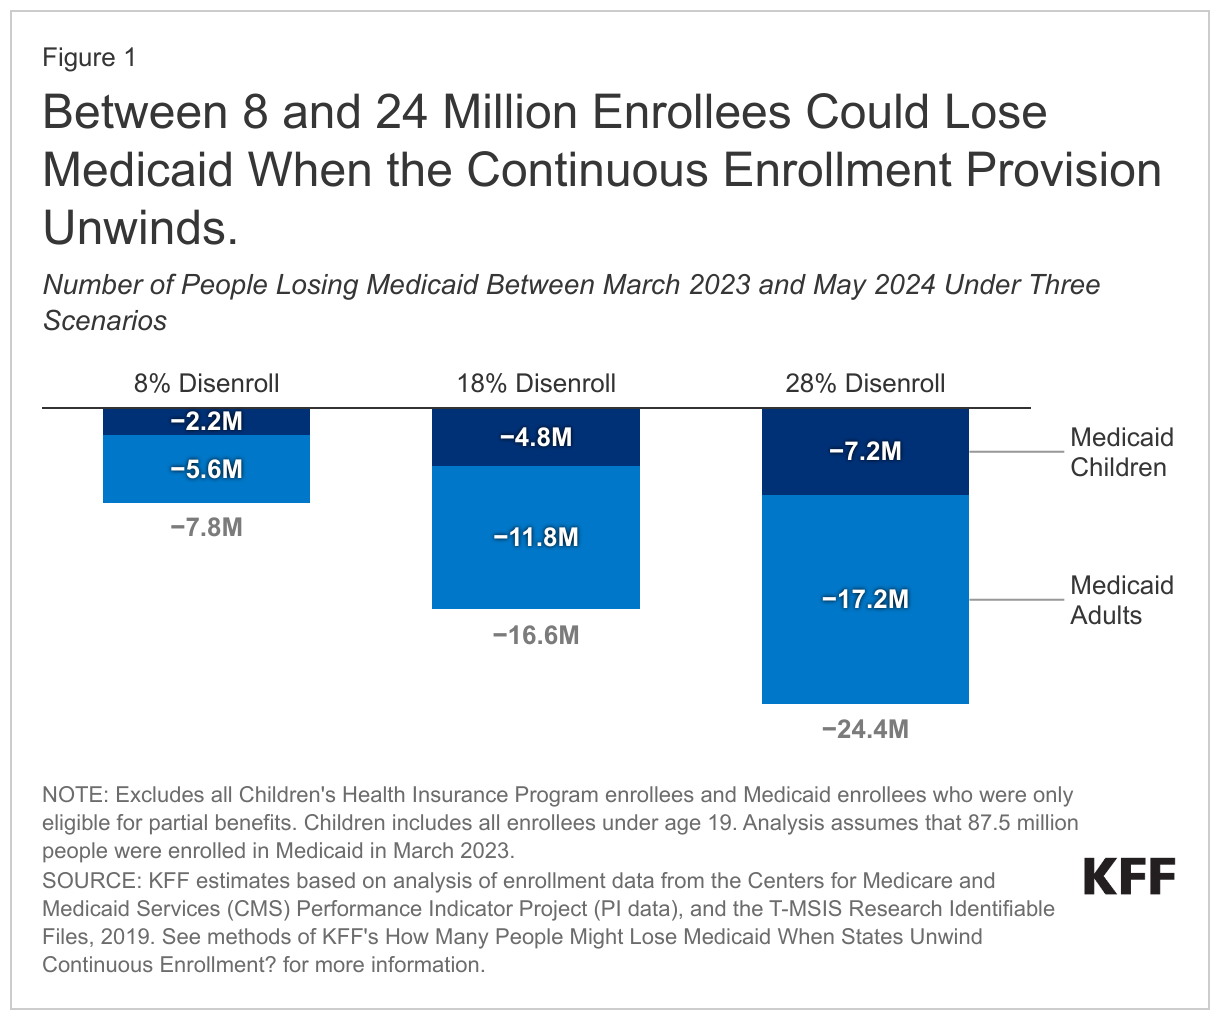
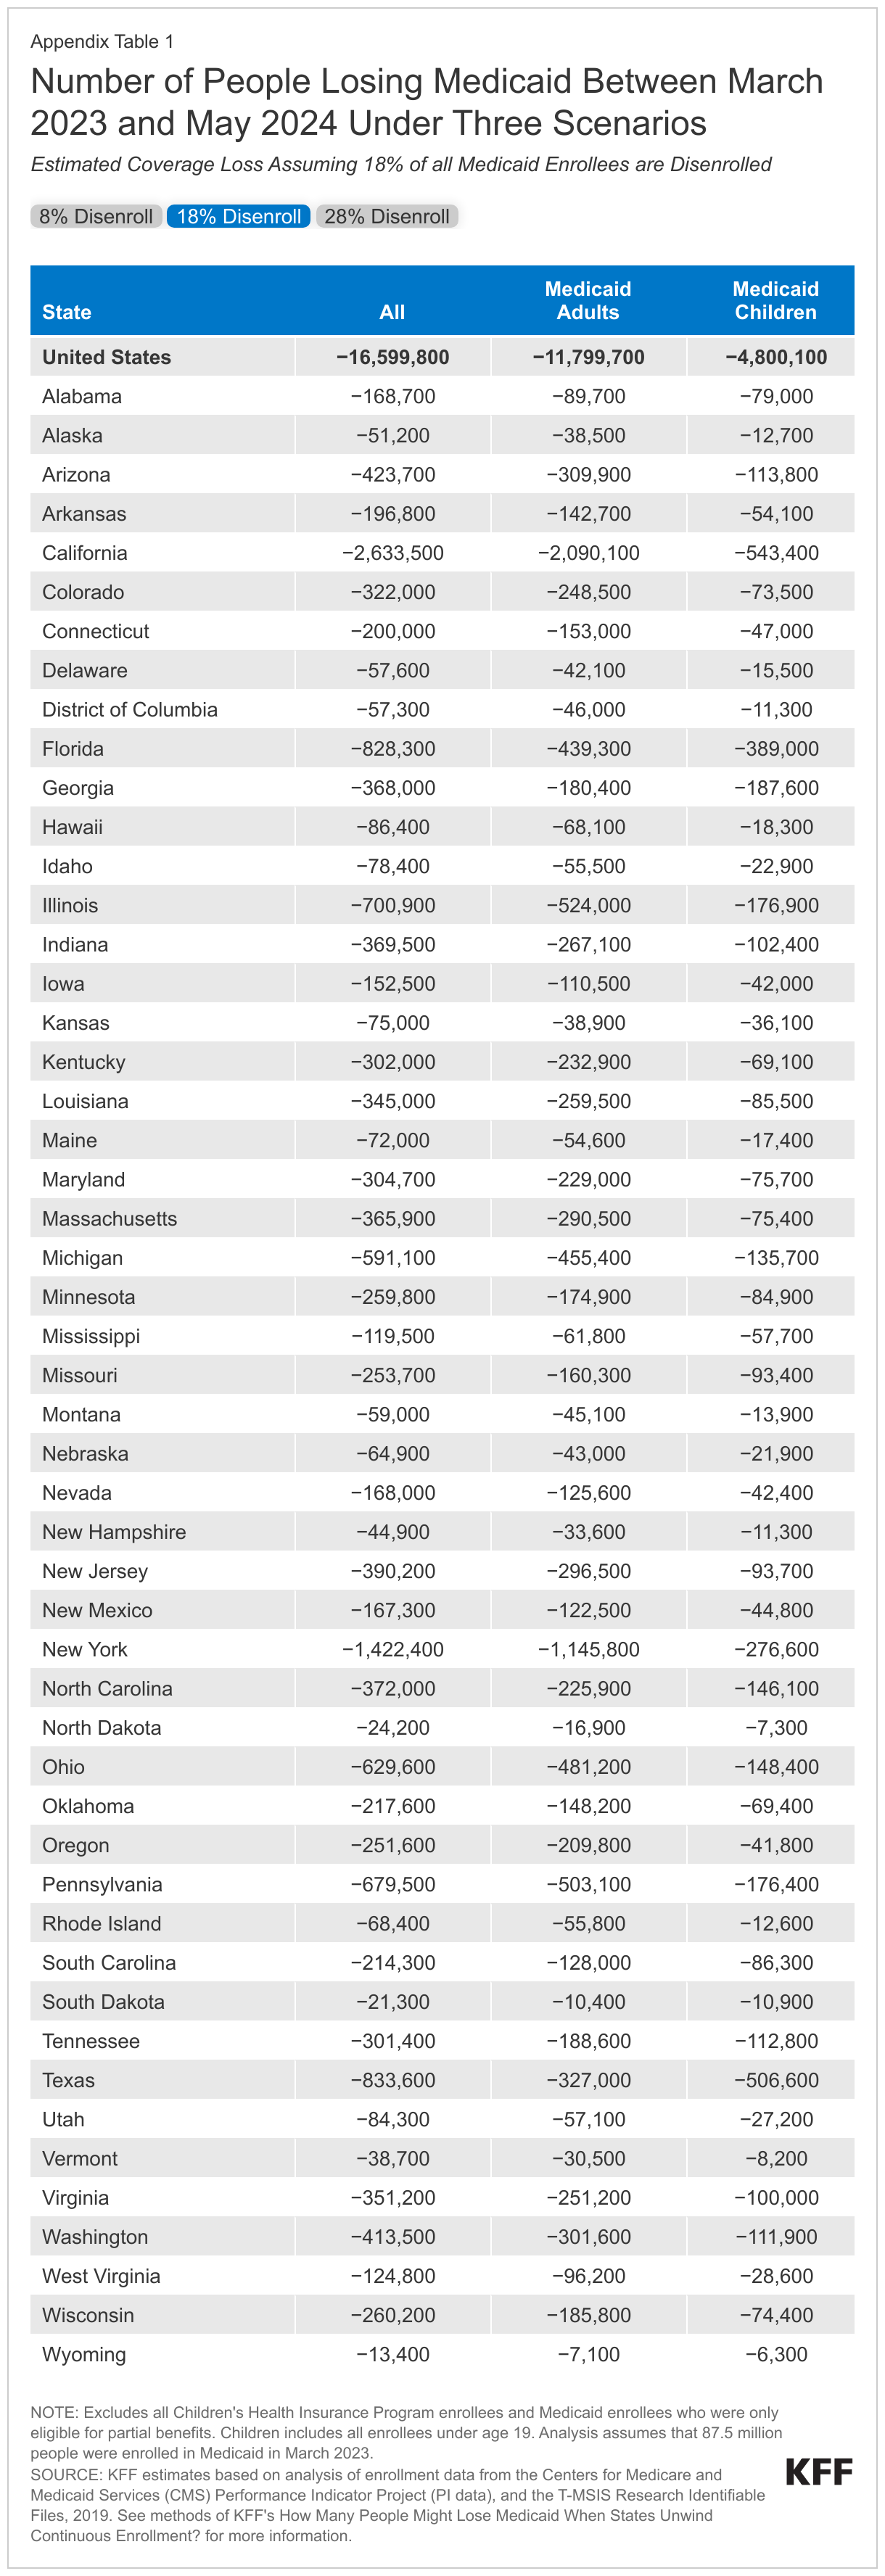
Although the midpoint of states’ estimated disenrollment rate was 18%, rates will range considerably across the states. If rates range from 8% to 28%, 8 million to 24 million people could lose Medicaid, including 2 million to 7 million children and 5 million to 17 million adults (see Appendix Table 1 for state-specific estimates). While neither the lowest nor highest rate of disenrollment is an expected national outcome, the range may be helpful in examining what the variation could be across states.
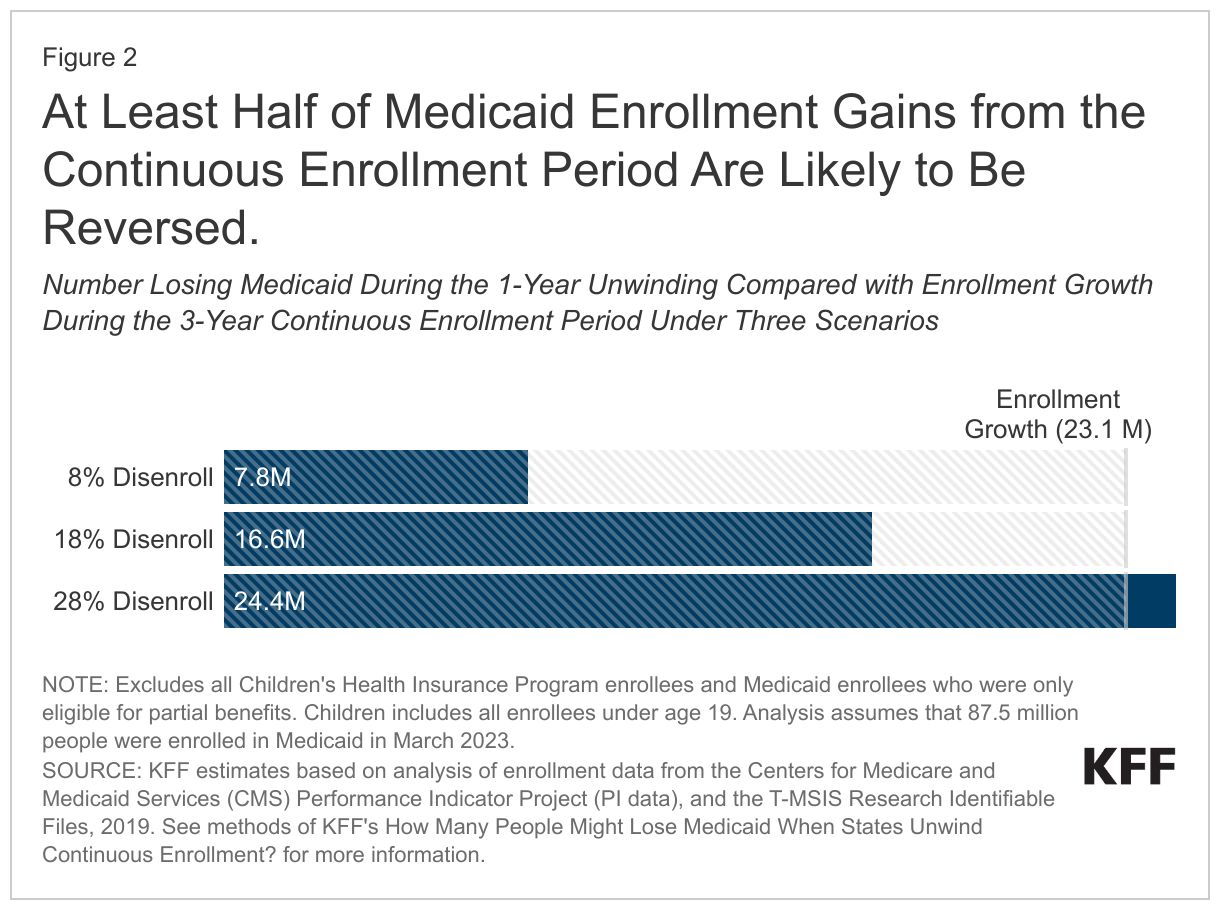
Expected disenrollments during the unwinding could reverse more than half of the Medicaid enrollment gains experienced during the continuous enrollment period (Figure 2). Comparing the number of people who could lose Medicaid with estimated enrollment growth during the continuous enrollment period, shows that the number of people losing Medicaid coverage would be nearly three-quarters of the enrollment increase under the midpoint scenario. Under this midpoint scenario, just over one-quarter of the enrollment increase during the pandemic would persist, meaning Medicaid coverage would be higher than pre-pandemic levels. The higher-range estimate of Medicaid coverage loss—which is not expected to occur in most states—suggests that in some states, Medicaid disenrollments during the 14-month unwinding period could exceed the enrollment gains from the 3-year continuous enrollment period. In some states, the number of people losing Medicaid could exceed the coverage gains because all current Medicaid enrollees will have to go through a renewal process.
What Might Happen to the Uninsured Rate During the Unwinding?
As states resume renewals for all Medicaid enrollees, there is substantial uncertainty regarding how many people will lose Medicaid and of those, how many will transition to other coverage or become uninsured. A large share of people are covered by Medicaid, and one analysis shows that over half of children are covered by Medicaid and CHIP. Significant declines in Medicaid enrollment are likely to increase the number of uninsured, and other estimates suggest that there will be increases in the uninsured rate, in addition to increased enrollment in private health insurance and CHIP. The extent to which the uninsured rate may rise is difficult to predict based on current data sources. For example, because enrollment in Medicaid has been automatically sustained during the pandemic, it is possible that some people who are identified as enrollees with administrative data may have since transitioned to a job with employer-provided health coverage. And, federal surveys that are used to measure the uninsured rate – which rely on respondents self-reporting their health insurance status – show smaller increases in Medicaid enrollment than are observed in administrative data.
Even if people who disenroll from Medicaid are eligible for CHIP or for subsidies to purchase nearly-free private insurance through the ACA, they may not know they are eligible or transition to other coverage without a gap in coverage. Our recent analysis of coverage outcomes after disenrolling from Medicaid or CHIP found that nearly two-thirds of people experienced a period of uninsurance. Actual outcomes will vary across states depending on an array of state policy decisions. State efforts to provide outreach and enrollment assistance can help ensure that those who remain eligible for Medicaid—an unknown share of current enrollees—are able to retain coverage, and that those who are no longer eligible transition to other coverage.
Appendix Table
Methods
Data: This analysis uses data from the Centers for Medicare and Medicaid Services (CMS) Performance Indicator Project Data (PI data) and the T-MSIS Research Identifiable Demographic-Eligibility (T-MSIS data). We used PI data from February 2020 through August 2022 and TMSIS data from 2019, Release 1.
Overview of Approach: We started our analysis with the enrollment projections through March 2023 as described in a prior analysis (although that analysis included CHIP and this analysis does not). To estimate the number of people who could lose coverage between March 2023 and May 2024, we:
- Set up a placeholder where we input the assumed rate of coverage loss that would occur by the end of the unwinding period (May 2024), and
- Calculated decreased enrollment rates among Medicaid children and adults for a given overall rate of disenrollment using information about enrollment growth during the continuous enrollment period.
Definitions and Limitations: Our estimates are intended to provide a range of disenrollment outcomes for each state’s child and adult Medicaid populations, but actual outcomes are unknown. It is expected that states will experience a wide range of outcomes and national numbers will reflect those varied experiences. Our estimates are also likely to differ from estimates of enrollment maintained by individual states. There are two primary reasons for these differences: the exclusion of some enrollees and the use of age-based eligibility for children. Specifically:
- The PI enrollment data exclude people who are not eligible for full Medicaid coverage, such as enrollees who are only eligible for coverage of Medicare premiums, family planning services, or emergency care. Such enrollees are excluded from the enrollment totals in this analysis, resulting in lower estimates of total enrollment than in data maintained by individual states.
- We define children as Medicaid enrollees who are grouped with children in the PI data, which are based on age rather than eligibility group.
We provide more detail about each step in the details below.
1. Placeholder for Overall Coverage Loss Rate. The rate of coverage loss is unknown. Our model is set up to show how many people could lose Medicaid by state under a range of possible outcomes. To estimate monthly disenrollments from the overall enrollment decrease, we assume that rates of coverage loss will be mostly the same across the 14-month unwinding period, but smaller in the first two and last months (April – May 2023 and April – May 2024).
2. Calculating Coverage Loss Among Children and Adults. For a given rate of coverage loss, we calculate disenrollment among children and adults using the ratio of coverage gains for each group to the overall coverage gain. Specifically, during the continuous enrollment period, enrollment in Medicaid and CHIP grew by 27%, but enrollment Medicaid children grew by 20% and enrollment among Medicaid adults grew by 38%. We assume that during the unwinding, coverage loss will be proportionally smaller among Medicaid children and proportionally larger among Medicaid adults relative to the overall rate of coverage loss.
Our model is set up to estimate coverage losses for the adult eligibility groups, using the simulation model described in our prior analysis. There is considerably uncertainty associated with estimates for the adult eligibility groups, so we do not present those numbers in this data note. In finalizing the estimates, we focused analytic efforts on separating adult enrollees who were eligible for Medicaid through the Affordable Care Act expansion from adults eligible through another pathway. That distinction is important to understanding how the losses of Medicaid coverage might affect the amount of money states receive from the enhanced federal matching funds, which are available—but being phased down—through 2023.