How the Pandemic Continues to Shape Medicaid Priorities: Results from an Annual Medicaid Budget Survey for State Fiscal Years 2022 and 2023
Overview
This annual Medicaid budget survey report highlights certain policies in place in state Medicaid programs in state fiscal year (FY) 2022 and policy changes implemented or planned for FY 2023. The findings are drawn from the 22nd annual budget survey of Medicaid officials conducted by the Kaiser Family Foundation (KFF) and Health Management Associates (HMA), in collaboration with the National Association of Medicaid Directors (NAMD).
Medicaid budget survey reports from prior years are available in our archives.
NEWS RELEASE
- A news release announcing the publication of the 2022 Medicaid Budget Survey is available.
EXECUTIVE SUMMARY
- The Executive Summary provides an overview of the 2022 survey results and is available under the Executive Summary.
FULL REPORT
- The complete 2022 Medicaid Budget Survey Report is available under the Report. The Report contains 8 separate sections. Users can view each section separately or download a full Report PDF from the right side of the page.
SPENDING & ENROLLMENT BRIEF
- This companion issue brief provides an overview of Medicaid spending and enrollment growth with a focus on FY 2022 and FY 2023.
WEB BRIEFING
- A recording of an October 25 web briefing highlighting key findings from the 2022 report will be available.
ADDITIONAL BRIEFS
- Additional briefs using 2022 Medicaid budget survey data are published separately:
- State Policies for Expanding Medicaid Coverage of Community Health Worker (CHW) Services
- Strategies to Manage Unwinding Uncertainty for Medicaid Managed Care Plans: Medical Loss Ratios, Risk Corridors, and Rate Amendments
- Medicaid Arrangements to Coordinate Medicare and Medicaid for Dual-Eligible Individuals
- Medicaid Managed Care Network Adequacy & Access: Current Standards and Proposed Changes
BEHAVIORAL HEALTH SUPPLEMENTAL SURVEY
- In 2022, KFF and HMA also fielded a survey on Medicaid behavioral health (mental health and substance use disorder) benefits and other policy. Results from this supplemental survey are published in a series of briefs:
- Telehealth Delivery of Behavioral Health Care in Medicaid: Findings from a Survey of State Medicaid Programs
- A Look at Strategies to Address Behavioral Health Workforce Shortages: Findings from a Survey of State Medicaid Programs
- Leveraging Medicaid for School-Based Behavioral Health Services: Findings from a Survey of State Medicaid Programs
- Medicaid Coverage of Behavioral Health Services in 2022: Findings from a Survey of State Medicaid Programs
- For state-by-state detail, see: Medicaid Behavioral Health Services Data Collection
- How do States Deliver, Administer, and Integrate Behavioral Health Care? Findings from a Survey of State Medicaid Programs
- Behavioral Health Crisis Response: Findings from a Survey of State Medicaid Programs
Executive Summary
The COVID-19 pandemic has profoundly affected Medicaid program spending, enrollment, and policy, challenging state Medicaid agencies, providers, and enrollees in a variety of ways. Serving nearly 90 million low-income Americans and accounting for one-sixth of health care spending (and half of long-term care spending) and a large share of state budgets, Medicaid is a key part of the overall health care system and has had a significant role in COVID-19 response efforts. While the end date of the federal public health emergency (PHE) is currently unknown, state Medicaid programs are preparing for the unwinding of policies in place during the PHE. The PHE is currently set to end in mid-January, and the Biden Administration has indicated it will provide states with 60-day notice before it ends (i.e., in mid-November if the PHE is not extended again). The duration of the PHE will affect a range of emergency policy options in place as well as a 6.2 percentage point increase in the federal match rate (“FMAP”)1 available if states meet certain “maintenance of eligibility” requirements included in the Families First Coronavirus Response Act (FFCRA).
This report highlights certain policies in place in state Medicaid programs in state fiscal year (FY) 2022 and policy changes implemented or planned for FY 2023, which began on July 1, 2022 for most states.2 The findings are drawn from the 22nd annual budget survey of Medicaid officials in all 50 states and the District of Columbia conducted by the Kaiser Family Foundation (KFF) and Health Management Associates (HMA), in collaboration with the National Association of Medicaid Directors (NAMD). Overall, 49 states responded to this year’s survey, although response rates for specific questions varied.3 States completed this survey in mid-summer of 2022, as COVID-19 deaths started to rise after a low in April 2022, due to the highly transmissible Omicron variant, waning vaccine immunity, and relatively low booster uptake.
Key Take-Aways
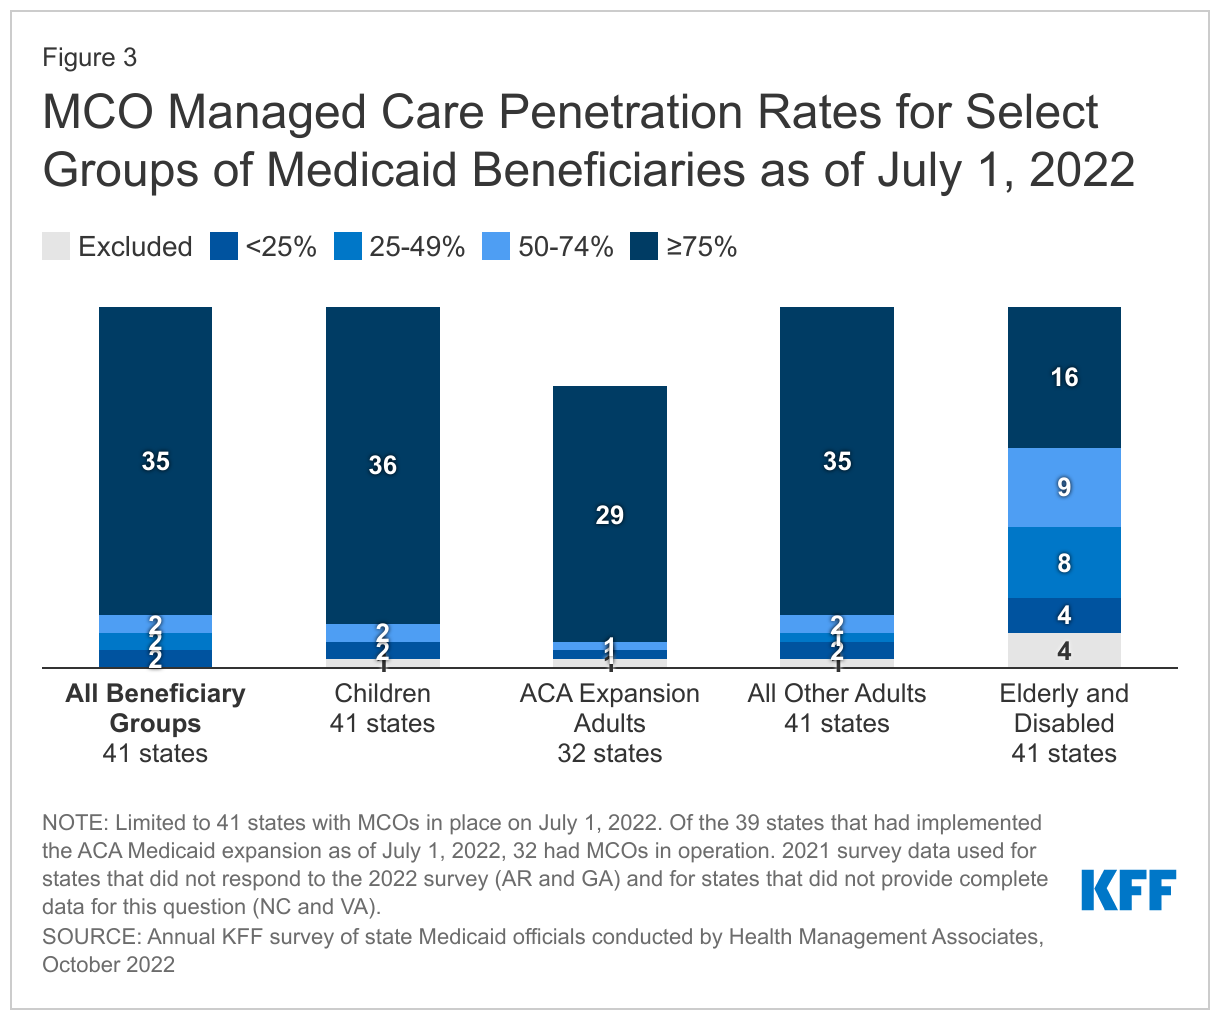
- States are focusing on both longstanding issues and new priorities, including new and expanded initiatives to improve equity and reduce health disparities, maintain access to telehealth, improve behavioral health access and supports, and address workforce challenges. States also continue to respond to pandemic-related health concerns such as increasing vaccination and booster rates and the utilization of preventive care services.
- States continue to manage and advance complex delivery system and information system procurements to drive improved quality and health outcomes.
- At the same time, states are also preparing for the unwinding of the federal public health emergency and the return to normal operations.
Heading into FY 2023, most states were in a strong fiscal position, but many identified uncertainty in their longer term fiscal outlook due to economic factors including slowing revenue growth, rising inflation, and wage pressures driven by workforce shortages. Also, the outcomes of gubernatorial elections in nearly three-quarters of states (36 states) in November 2022 could have implications for state Medicaid policies and for Medicaid enrollees.
Summary of Findings
Key findings across the six sections of this report include:
- Delivery Systems. Capitated managed care remains the predominant delivery system for Medicaid in most states. More than three-quarters of states that contract with MCOs reported that 75% or more of their Medicaid beneficiaries were enrolled in MCOs as of July 1, 2022. In FY 2022, North Carolina implemented its first MCO program. Missouri implemented the ACA Medicaid expansion in October 2021, enrolling all expansion adults in Medicaid MCOs. Although not counted in this year’s report, Oklahoma expects to implement capitated, comprehensive Medicaid managed care in FY 2024. In addition to expanding the use of risk-based, comprehensive managed care, state Medicaid programs have expanded their use of other service delivery and payment system reforms (e.g., patient centered medical homes (PCMHs), accountable care organizations (ACOs), etc.) in recent years.
- Health Equity. The COVID-19 pandemic has highlighted and exacerbated longstanding racial and ethnic disparities in health and health care. Over the past few years, the federal government and many states have identified advancing health equity as an important priority for the Medicaid program. High-quality, comprehensive data are essential for identifying and addressing health disparities and measuring progress over time. However, inadequate, incomplete, and inconsistent demographic data, particularly race and ethnicity data, is a longstanding challenge across many areas of health care, including in state Medicaid and CHIP programs (as these data must remain optional for enrollees to report). Two-thirds of states reported using at least one strategy to improve race, ethnicity, and language (REL) data completeness. States also reported MCO financial quality incentives (e.g., performance bonuses, withholds, or value-based state directed payments) tied to health equity-related performance goals and other MCO contract requirements to advance health equity, such as requiring MCOs to achieve the NCQA Distinction in Multicultural Health Care.
- Benefits. The number of states reporting new benefits and benefit enhancements greatly outpaced the number of states reporting benefit cuts and limitations in FY 2022 and FY 2023. In particular, states are focused on service expansions across the behavioral health care continuum, including programming for youth, physical and behavioral health care integration, and crisis services. States are also focused on expansions of pregnancy and postpartum services, often alongside eligibility changes to extend the postpartum period to 12 months (as allowed under the American Rescue Plan Act). Other areas of benefit expansion include preventive services; dental services (including the addition of comprehensive adult dental services); and services to address social determinants of health (SDOH), such as housing-related supports. Also, most states that contract with MCOs reported allowing MCOs to use “in lieu of” authority to cover certain services, especially behavioral health services such as coverage for nonelderly adults in “institutions for mental disease” (IMDs). Additionally, nearly one-third of states permitting ILOS reported that allowable ILOS include services to address SDOH, such as food and housing needs.
- Telehealth. Many states noted that expanded use of telehealth was a positive outcome of the COVID-19 pandemic that increased access to care. In particular, nearly all responding states added or expanded audio-only telehealth coverage in response to the pandemic. States have seen high utilization of telehealth across populations of Medicaid enrollees (e.g., ACA expansion adults, children, and individuals with disabilities), especially for behavioral health care. Most states have implemented or are planning initiatives to assess telehealth quality, though many states report ongoing considerations and uncertainty over how to effectively evaluate quality. States also report actions to address other telehealth challenges, including access to technology and broadband, program integrity, outreach and education, and equity. Most states have or plan to adopt permanent Medicaid telehealth expansions that will remain in place even after the pandemic, though some are considering guardrails on such policies. Looking ahead, key issues that may influence future Medicaid telehealth policy decisions include analysis of data, state legislation and federal guidance, and cost concerns.
- Provider Rates and Taxes. Reported fee-for-service (FFS) rate increases outnumbered rate restrictions in FY 2022 and FY 2023. States reported rate increases for nursing facilities and home and community-based services (HCBS) providers more often than other provider categories. Several states reported comprehensive rate reform analyses impacting multiple provider types had been completed or were underway. Many states noted that worsening inflation and workforce shortages driving higher labor costs were resulting in growing calls from providers and others for rate increases. Some states noted, however, that their FY 2023 budgets do not account for current inflation levels, as they were introduced in late calendar year 2021 and early 2022 before inflation began to dramatically accelerate, but that inflation remains a concern looking ahead. Provider taxes continue to be an important source of Medicaid financing, with very few states making significant changes to their provider tax structure. Taxes on ambulance providers represent the most common type of “other” taxes implemented by states, and the new taxes planned for FY 2023 will increase the number of states with ambulance taxes to 13.
- Pharmacy. The administration of the Medicaid pharmacy benefit has evolved over time to include delivery of these benefits through MCOs and increased reliance on pharmacy benefit managers (PBMs). While most states that contract with MCOs carve in Medicaid pharmacy benefits to MCO contracts, some states “carve out” prescription drug coverage from managed care. As of January 1, 2022, California carved the pharmacy benefit out of managed care, becoming the latest state to implement a full pharmacy carve out. Two states (New York and Ohio) report plans to carve out pharmacy from MCO contracts in state fiscal year FY 2023 or later. Other states are moving to require MCOs to contract with a single PBM designated by the state. Many states are implementing or expanding initiatives to contain prescription drug costs. Seven states reported value-based arrangements (VBAs) in place with one or more drug manufacturers as of July 1, 2022, and 16 additional states are considering opportunities or are developing and executing plans to implement a VBA arrangement in FY 2023 or later. Many states reported reforms aimed at spread pricing and the role of PBMs in administering Medicaid pharmacy benefits.
Looking Ahead
As states anticipate a new “endemic reality” phase of the pandemic, they are considering future operations within the context of the significant pandemic-related impacts on enrollees’ health and wellbeing and on the health care workforce. Many states note that the pandemic has resulted in both opportunities and challenges and has shaped ongoing Medicaid priorities.
- Opportunities. The pandemic presented states with opportunities to expand access for enrollees via telehealth, improve relationships with stakeholders, and focus on data collection improvements. One state commented that telehealth was the “silver lining” of the pandemic. States also noted that the pandemic had resulted in improved relationships and engagement with enrollees, providers, plans, and/or other state and federal agencies. States mentioned that the pandemic had highlighted the importance of obtaining better and more timely data, and that improved data collection and stratification would help to identify and address health disparities.
- Challenges. States are facing challenges related to planning and preparing for the COVID-19 PHE unwinding and associated with entering an “endemic reality” phase of the pandemic. Many states mentioned the immense administrative challenges of restarting redeterminations, particularly workforce needs, as well as the challenge of making permanent or unwinding other emergency authorities in place. Even after the end of the PHE, states will still face pandemic-generated concerns such as the need to increase utilization of preventive care services in addition to vaccinations and boosters.
- Priorities. Looking ahead, states are focused on addressing health inequities that the pandemic had exposed and often exacerbated. States are also prioritizing access and outcomes for specific populations or service categories, including behavioral health, long-term services and supports, and maternal and child health. States are also addressing health care workforce challenges, especially related to behavioral health and HCBS providers. Many states also continue to focus on payment and delivery system initiatives and operations, including value-based purchasing and MCO procurements. Many states are prioritizing IT systems projects, which also support other program objectives. Finally, many states reported a focus on addressing social determinants of health to improve health outcomes.
AcknowledgementsPulling together this report is a substantial effort, and the final product represents contributions from many people. The combined analytic team from KFF and Health Management Associates (HMA) would like to thank the state Medicaid directors and staff who participated in this effort. In a time of limited resources and challenging workloads, we truly appreciate the time and effort provided by these dedicated public servants to complete the survey and respond to our follow-up questions. Their work made this report possible. We also thank the leadership and staff at the National Association of Medicaid Directors (NAMD) for their collaboration on this survey. We offer special thanks to Jim McEvoy and Kraig Gazley at HMA who developed and managed the survey database and whose work is invaluable to us.
Introduction
The COVID-19 pandemic public health emergency (PHE), in place for more than two and a half years at the time of this report, has had profound impacts on the ongoing operations of state Medicaid programs, requiring states to rapidly adapt to meet the changing needs of Medicaid enrollees and providers. Nationwide, Medicaid provided health insurance coverage to about one in four Americans in 2020 and accounted for nearly one-sixth of all U.S. health care expenditures in 2020.4 Total Medicaid/CHIP enrollment grew to 89.4 million in June 2022, an increase of 18.2 million (25.6%) from February 2020, right before the pandemic, when enrollment began to steadily increase. Beginning early in the pandemic, states and the federal government implemented numerous Medicaid emergency authorities to enhance state capacity to respond to the emerging public health and economic crises. In addition, Congress authorized changes to Medicaid through the Families First Coronavirus Response Act (FFCRA) and Coronavirus Aid, Relief, and Economic Security (CARES) Act, including a 6.2 percentage point increase in federal Medicaid matching funds (FMAP) (retroactive to January 1, 2020). This “enhanced FMAP” is available to states that meet “maintenance of eligibility” (MOE) conditions which ensure continued coverage for current enrollees as well as coverage of coronavirus testing and treatment. All of these changes (the emergency policy actions, the fiscal relief, and the MOE) are tied to the duration of the PHE. The PHE is currently set to end in mid-January, and the Biden Administration has indicated it will provide states with 60-day notice before it ends (i.e., in mid-November if the PHE is not extended again).
When the PHE ends, states will begin processing redeterminations and millions of people could lose coverage if they are no longer eligible or face administrative barriers despite remaining eligible.5 Current CMS guidance indicates states must initiate all renewals and other outstanding eligibility actions within 12 months after the PHE ends. Medicaid emergency authorities related to the PHE expire at different times, but states can choose to continue some of these changes even after the PHE ends. Some unwinding of PHE emergency authorities is already completed or underway. The temporary 6.2 percentage point increase in federal matching funds will expire at the end of the quarter in which the PHE ends.
This report draws upon findings from the 22nd annual budget survey of Medicaid officials in all 50 states and the District of Columbia conducted by KFF and Health Management Associates (HMA), in collaboration with the National Association of Medicaid Directors (NAMD). (Previous reports are archived here.) This year’s KFF/HMA Medicaid budget survey was conducted from June through September 2022 via a survey sent to each state Medicaid director in June 2022 and then a follow-up telephone interview. Overall, 49 states responded by September 2022,6 although response rates for specific questions varied. The District of Columbia is counted as a state for the purposes of this report. Given differences in the financing structure of their programs, the U.S. territories were not included in this analysis. The survey instrument is included as an appendix to this report.
This report examines Medicaid policies in place or implemented in FY 2022, policy changes implemented at the beginning of FY 2023, and policy changes for which a definite decision has been made to implement in FY 2023 (which began for most states on July 1).7 Policies adopted for the upcoming year are occasionally delayed or not implemented for reasons related to legal, fiscal, administrative, systems, or political considerations, or due to CMS approval delays. Key findings, along with state-by-state tables, are included in the following sections:
Delivery Systems
Context
For more than two decades, states have increased their reliance on managed care delivery systems to improve access and outcomes, enhance care management and care coordination, and better control costs. State managed care contracts vary widely, for example, in the populations required to enroll, the services covered (or “carved in”), and the quality and performance incentives and penalties employed. Most states contract with risk-based managed care organizations (MCOs) that cover a comprehensive set of benefits (acute care services and sometimes long-term services and supports), but many also contract with limited benefit prepaid health plans (PHPs) that offer a narrow set of services such as dental care, non-emergency medical transportation, or behavioral health services. Managed care plans are at financial risk for the services covered under their contracts and receive a per member per month "capitation" payment for these services. A minority of states operate primary care case management (PCCM) programs which retain fee-for-service (FFS) reimbursements to providers but enroll beneficiaries with a primary care provider who is paid a small monthly fee to provide case management services in addition to primary care.
Enrollment in Medicaid MCOs has grown since the start of the pandemic, tracking with overall growth in Medicaid enrollment. After the PHE ends, state Medicaid agencies will need to complete a large number of eligibility and enrollment tasks and actions, including processing renewals, redeterminations, and post-enrollment verifications. Medicaid MCOs may be well positioned to assist states in conducting outreach and providing support to enrollees who will need to navigate eligibility renewals or redeterminations. CMS guidance for state Medicaid agencies on the resumption of normal operations also includes strategies for working with managed care plans to promote continuity of coverage when the PHE’s continuous coverage requirement ends.
In addition to managed care, state Medicaid programs also use an array of other service delivery and payment system reforms. There is interest among public and private payers alike in restructuring delivery systems to be more integrated and patient-centered and to help achieve better outcomes and lower costs. Common delivery and payment reform models used by state Medicaid programs include patient-centered medical homes (PCMHs), ACA Health Homes, accountable care organizations (ACOs), and episodes of care. Some models may be implemented in Medicaid fee-for-service delivery systems while other payment and delivery system reform models are implemented through managed care. Although the literature is not conclusive regarding the impact of these initiatives and more research is needed, states have seen successes and many models have evolved over time in response to state experience and evaluation findings.8 ,9 ,10 ,11 ,12
Uncertainty and disruptions caused by the COVID-19 pandemic, including lack of stability in utilization patterns, labor shortages, provider capacity, and the appropriateness of pre-pandemic performance measures, among other factors, have affected (and may continue to affect) how states can advance delivery system and payment reform initiatives as well as efforts to monitor and incentivize MCO and provider performance. Additionally, when the continuous enrollment requirement ends and states resume renewals and redeterminations, millions of people could lose coverage if they are no longer eligible or are unable to navigate administrative barriers despite remaining eligible. As a result, Medicaid MCOs may see the overall acuity of their membership increase, with implications for per member utilization and costs, and also the return of member churn (i.e., the temporary loss of coverage in which enrollees disenroll and then re-enroll within a short period of time) which can lead to care disruptions.
This section provides information about:
- Managed care models
- Populations covered by risk-based managed care
- Managed care changes
- Other state-contracted delivery systems or initiatives
Findings
Managed Care Models
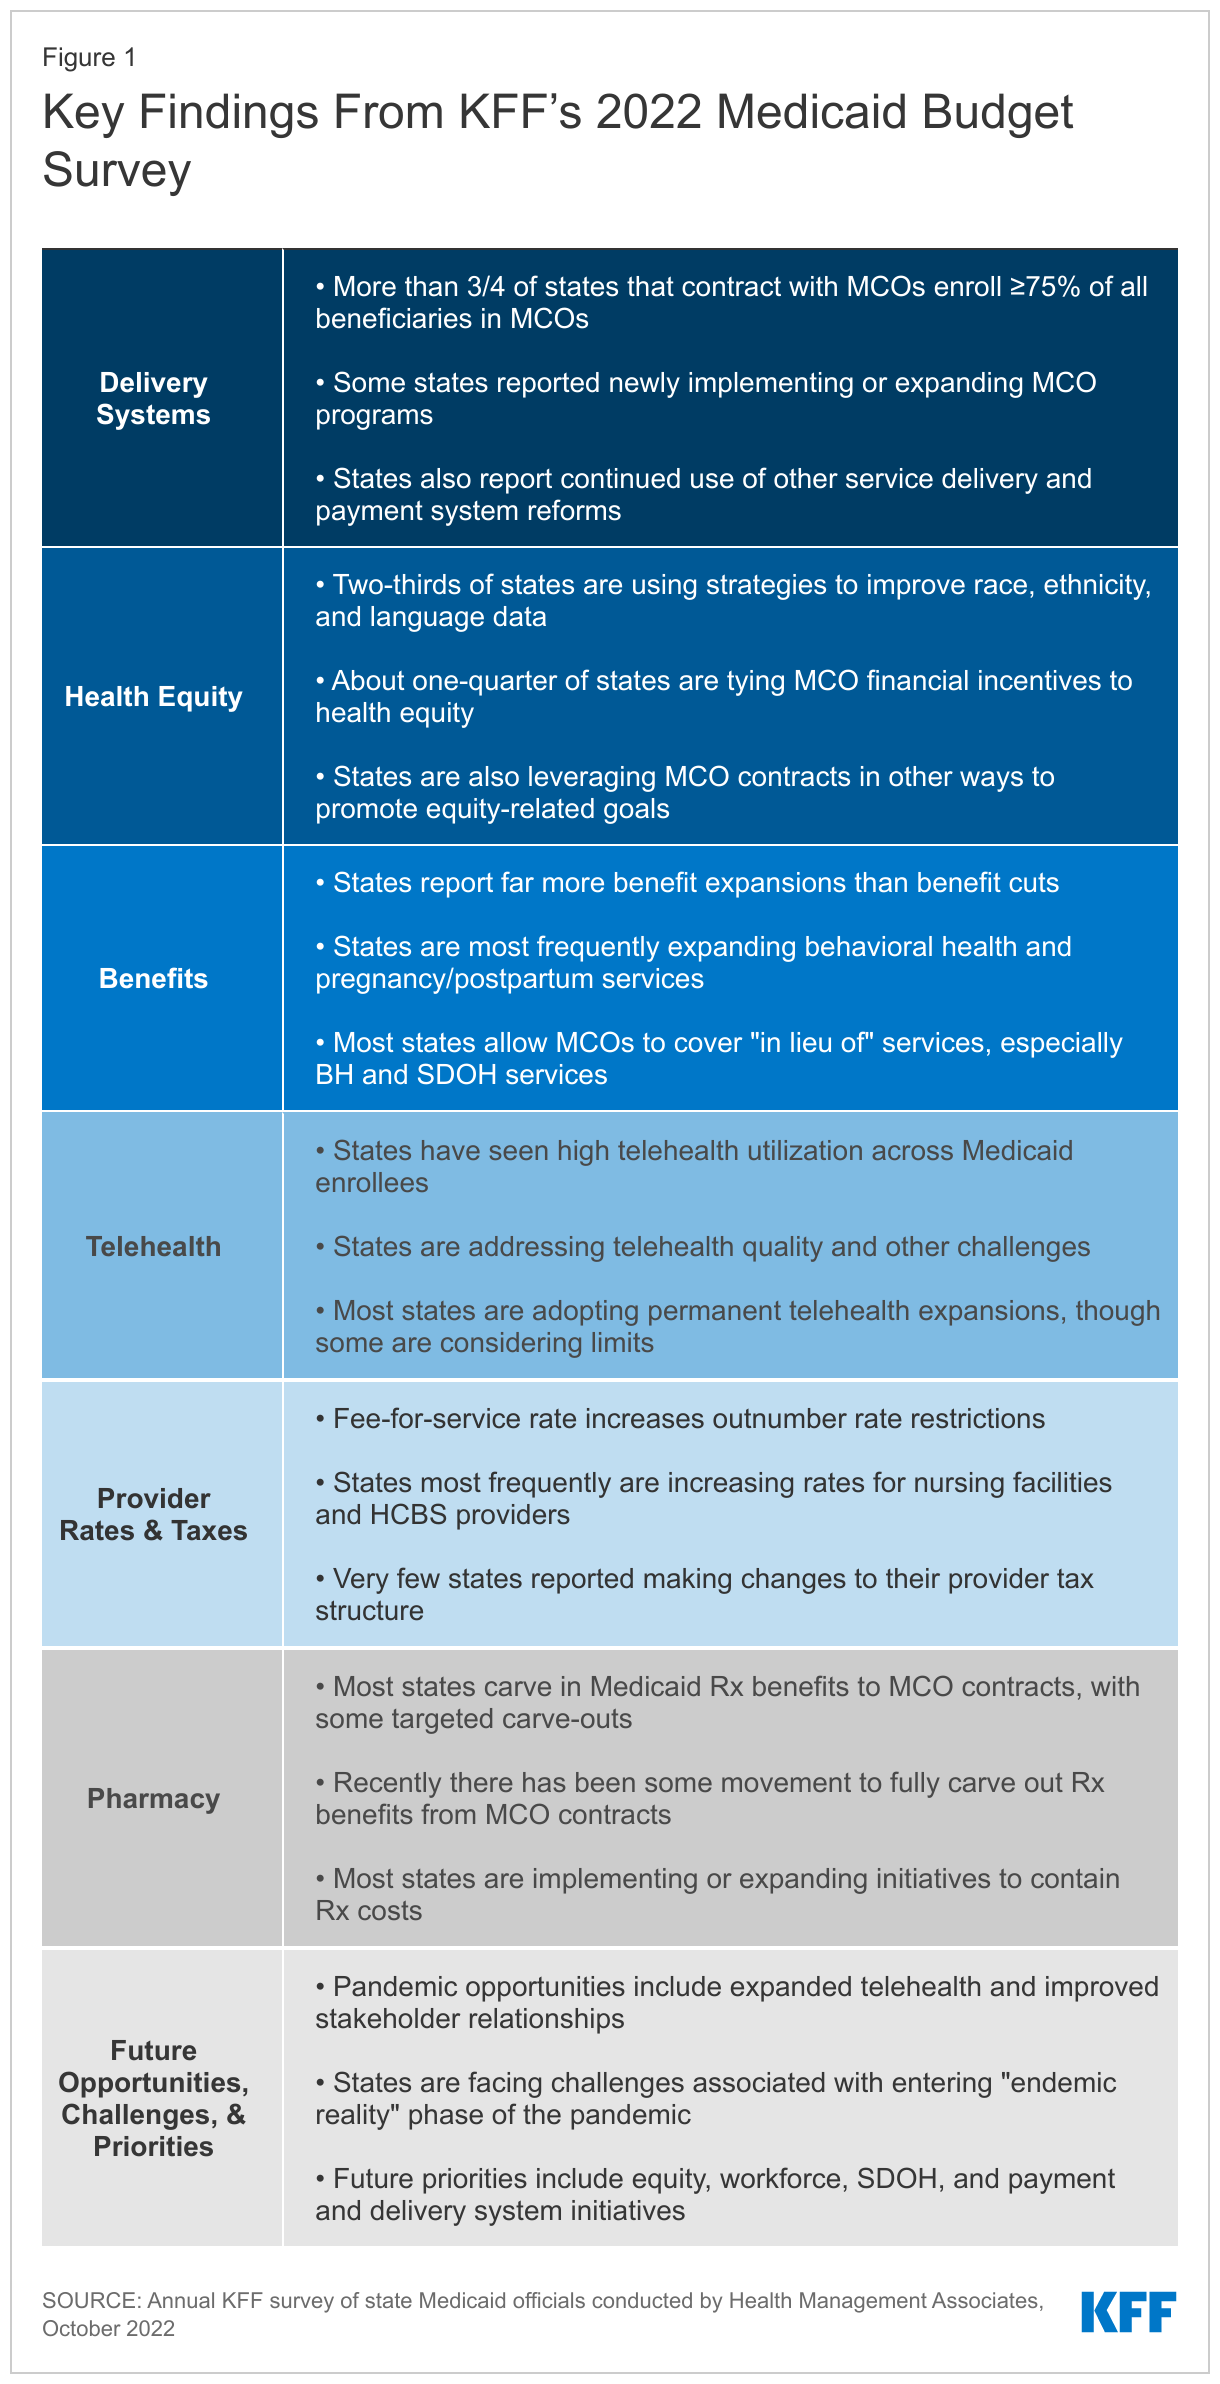
Capitated managed care remains the predominant delivery system for Medicaid in most states. As of July 2022, all states except five – Alaska, Connecticut,13 Maine, Vermont,14 and Wyoming – had some form of managed care (MCOs and/or PCCM) in place. As of July 2022, 41 states15 were contracting with MCOs (unchanged from 2021), and only two of these states (Colorado and Nevada) did not offer MCOs statewide. Twelve states16 reported operating a PCCM program, one fewer than reported in 2021 (as Maine ended its PCCM program in FY 2022).17 Although not counted in this year’s report, following the passage of SB 1337 in May 2022, Oklahoma expects to implement capitated, comprehensive Medicaid managed care in FY 2024 (as of October 1, 2023),18 ,19 and release an RFP to procure MCO vendors in the fall of 2022.
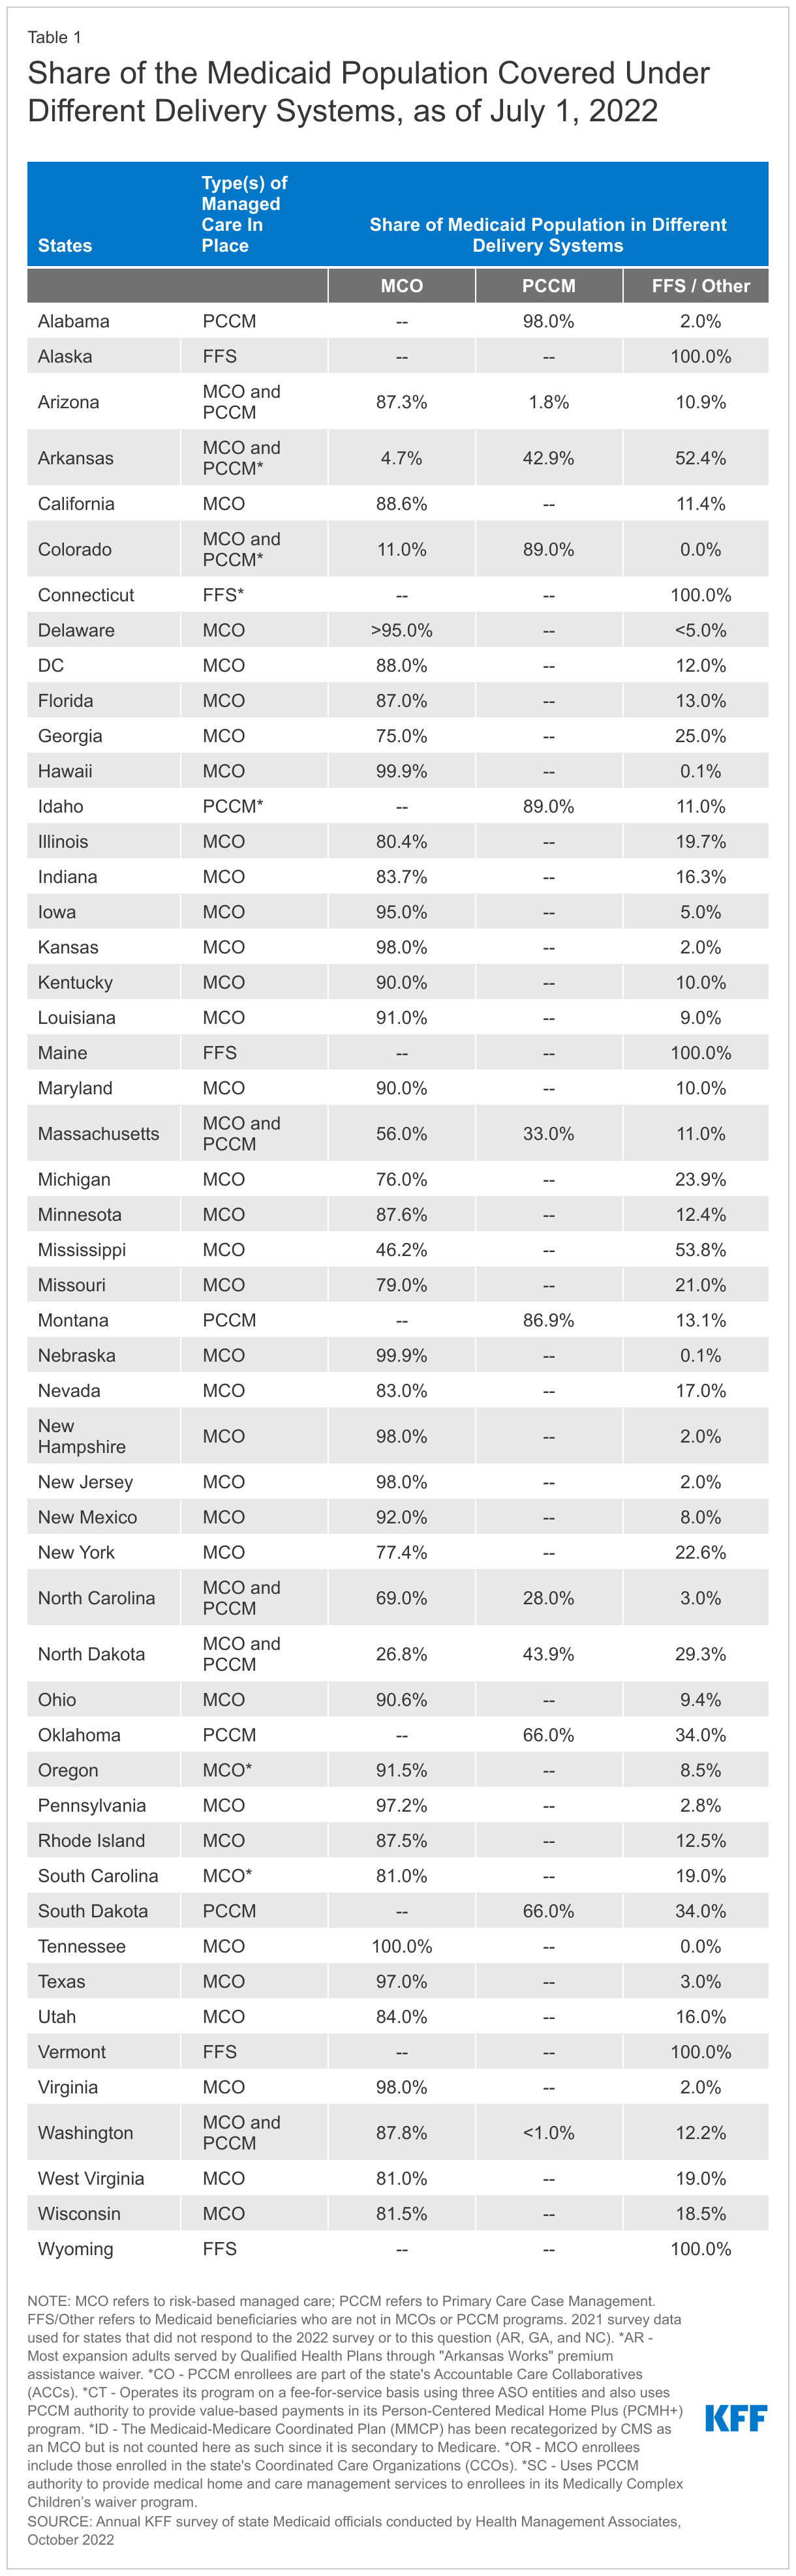
Of the 46 states that operate some form of comprehensive managed care (MCOs and/or PCCM), 34 states operate MCOs only, five states operate PCCM programs only,20 and seven states operate both MCOs and a PCCM program (Figure 2 and Table 1). In total, 27 states21 were contracting with one or more PHPs to provide Medicaid benefits including behavioral health care, dental care, vision care, non-emergency medical transportation (NEMT), or long-term services and supports (LTSS).
Populations Covered by Risk-Based Managed Care
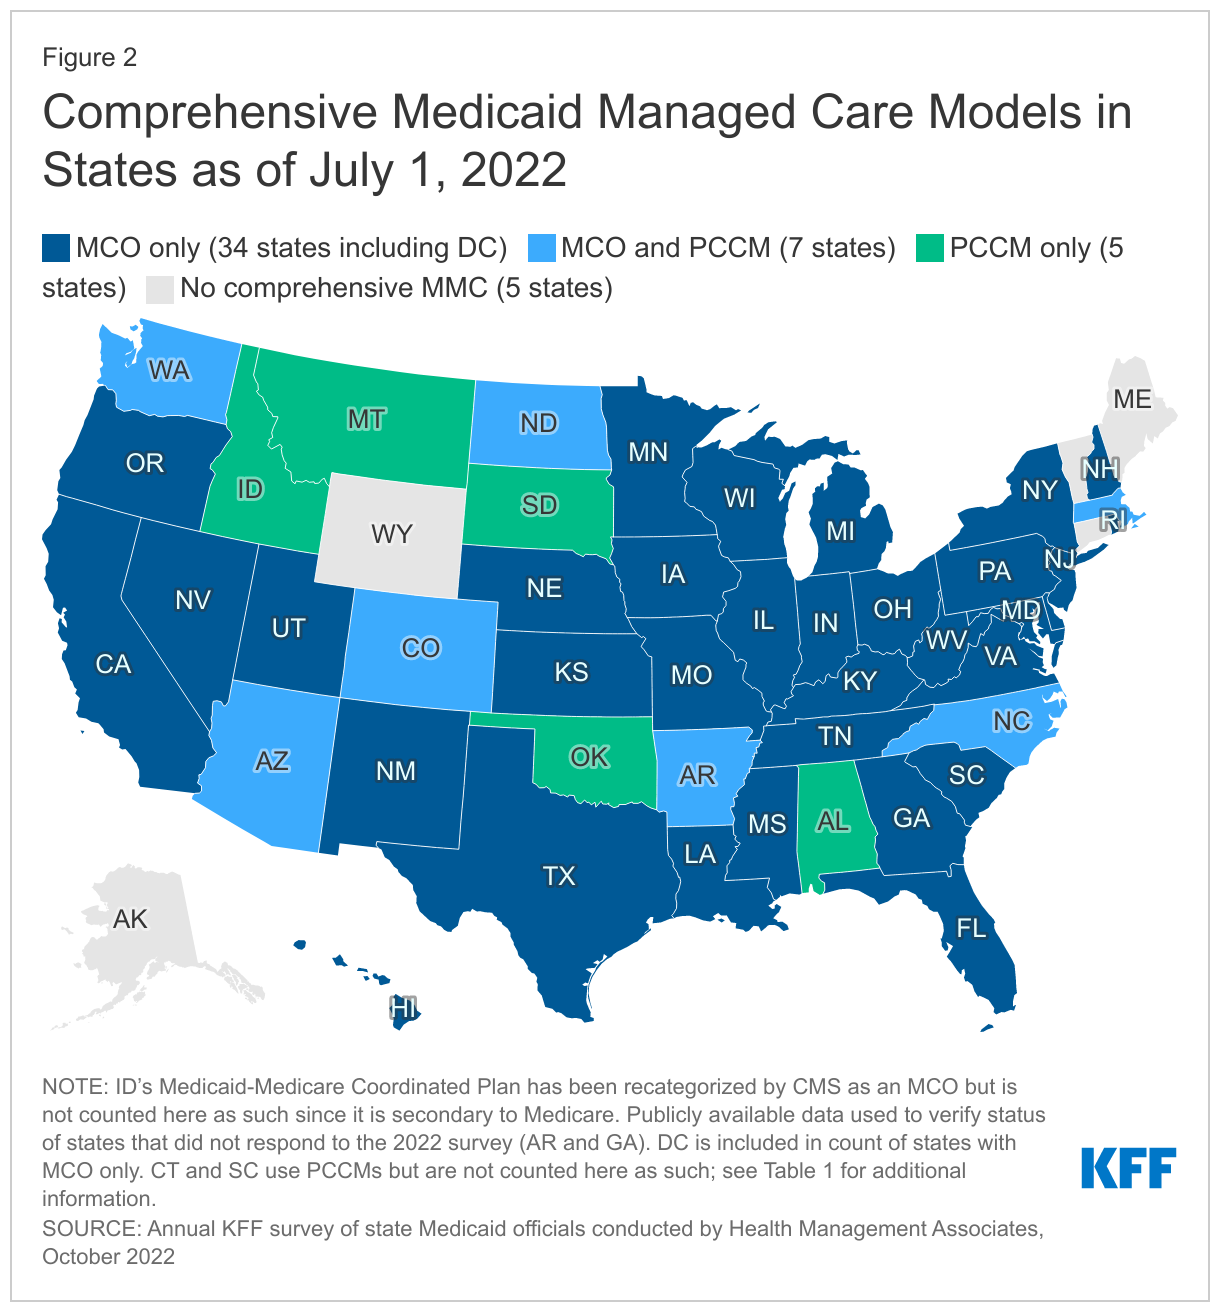
The vast majority of states that contract with MCOs (35 of 41) reported that 75% or more of their Medicaid beneficiaries were enrolled in MCOs as of July 1, 2022, a decrease of one state22 compared to the 2021 survey and includes the ten states with the largest total Medicaid enrollment (Figure 3 and Table 1). These ten states account for over half of all Medicaid beneficiaries across the country.23
Children and adults, particularly those enrolled through the ACA Medicaid expansion, are much more likely to be enrolled in an MCO than elderly Medicaid beneficiaries or persons with disabilities. Thirty-six of the 41 MCO states reported covering 75% or more of all children through MCOs.24 Of the 39 states that had implemented the ACA Medicaid expansion as of July 1, 2022, 32 were using MCOs to cover newly eligible adults. The large majority of these states (29 states) covered more than 75% of beneficiaries in this group through capitated managed care. Thirty-five of the 41 MCO states reported covering 75% or more of low-income adults in pre-ACA expansion groups (e.g., parents, pregnant women) through MCOs. In contrast, the elderly and people with disabilities were the group least likely to be covered through managed care contracts, with only 16 of the 41 MCO states reporting coverage of 75% or more such enrollees through MCOs (Figure 3).
Managed Care Changes
A number of states reported a variety of managed care changes made in FY 2022 or planned for FY 2023. Notable changes included the following:
- North Carolina implemented its first MCO program. On July 1, 2021, North Carolina launched new MCO “Standard Plans,” offering integrated physical and behavioral health services statewide, with mandatory enrollment for most population groups.25 Over 1.7 million Medicaid beneficiaries were enrolled in Standard Plans as of September 2022.26 North Carolina will launch “Tailored Plans” on December 1, 2022, offering integrated services to enrollees with significant behavioral health needs and intellectual/developmental disabilities (I/DD).27
- Five states (California, Missouri, Nevada, New Jersey, and New York) reported expanding mandatory MCO enrollment for targeted populations. Missouri implemented the ACA Medicaid expansion in October 2021 (with coverage retroactive to July 1, 2021) enrolling all expansion adults in Medicaid MCOs. The California Advancing and Innovating Medi-Cal (CalAIM) initiative includes mandatory enrollment of multiple populations into managed care in both FY 2022 and FY 2023.28 In FY 2023, dual eligible beneficiaries across the state will be required to enroll in managed care. Currently, mandatory enrollment of dual eligibles is limited to certain California counties.29 ,30 Effective January 1, 2022, Nevada is no longer allowing enrollees with a seriously mentally ill (SMI) determination to disenroll from managed care. New Jersey expanded managed care for acute care and LTSS to nursing home residents, who were previously grandfathered and allowed to remain in FFS after the state first transitioned to managed long-term services and supports (MLTSS). New York began mandatory MCO enrollment of children and youth in direct placement foster care in New York City and children and youth placed in foster care in the care of Voluntary Foster Care Agencies statewide in July 2021.31
- Two states (Missouri and Ohio) reported introducing specialized managed care programs for children with complex needs. Missouri awarded a specialty plan contract to consolidate state care and custody enrollees into one health plan. On July 1, 2022, Missouri launched a new specialty health plan, called Show Me Healthy Kids, to provide coverage to youth in Department of Social Services custody, former foster children, and for individuals receiving adoption assistance payments. The specialized managed care plan was awarded to Home State Health (Centene).32 On July 1, 2022, Ohio introduced a specialized managed care program for youth with complex behavioral health and multisystem needs. OhioRISE (Resilience through Integrated Systems and Excellence), a prepaid inpatient health plan (PIHP), creates access to new in-home and community-based services for children with complex behavioral health challenges.33 OhioRISE also includes a 1915(c) waiver component which aims to prevent institutionalization and keep families supported in the community.
- Three states (California, Nevada, and Tennessee) indicated that they were carving in certain long-term services and supports into their managed care programs. California will be carving in institutional long term care in to MCO contracts in all counties in 2023, making coverage for these services consistent across California.34 Tennessee plans to incorporate Intermediate Care Facility (ICF) Services as well as home and community based LTSS services for people with intellectual and developmental disabilities into its MCO contract in FY 2023. Finally, Nevada extended the number of days its plans must cover nursing facility services from 45 to 180 days in its MCO contracts effective January 2022.
- Three states (California, District of Columbia, and Ohio) reported carving out specific benefits from managed care contracts. California and Ohio – reported carving out pharmacy services in FY 2022 or FY 2023, respectively. The District of Columbia carved out emergency medical transportation from its MCO contracts in FY 2022.
- Four states (Maine, North Carolina, Oregon, and Washington) reported changes to their PCCM programs. Maine ended its PCCM program, moving to a new value-based approach to support primary care. On July 1, 2022, Maine launched a single, integrated initiative called Primary Care Plus (aligned with the Center for Medicare and Medicaid Innovation’s (CMMI’s) Primary Care First multi-payer initiative). Primary Care Plus aims to move away from a fee-for-service payment system toward population-based payments tied to cost- and quality-related outcomes.35 North Carolina launched a new PCCM option in July 2021 available only to Indian Health Service (IHS) eligible beneficiaries associated with the Eastern Band of Cherokee Indians in select counties in the western part of the state.36 Oregon reported plans to implement an Indian PCCM program in FY 2023. Washington is planning to implement a tribal PCCM entity program in FY 2023 and released a draft SPA for comment in May 2022.37 This program will expand options for Indian health care providers (IHCPs) interested in providing primary case management services. It is like the current PCCM program available to IHCPs but with a larger, more defined list of provider responsibilities.
- Several states also reported efforts to streamline managed care programs. In FY 2023, Virginia plans to implement Cardinal Care, merging the state’s two existing managed care programs: Medallion 4.0 (serving children, pregnant individuals, and adults) and Commonwealth Coordinated Care Plus (CCC Plus) (serving seniors, children and adults with disabilities, and individuals who require LTSS).38 ,39 The six MCOs currently serving members statewide in Medallion 4.0 and CCC Plus will continue to do so under Cardinal Care. Mississippi and Ohio report that in FY 2023 they are centralizing credentialing processes for providers in MCO networks at the state level to reduce the administrative burden on Medicaid providers. In addition, Ohio plans to implement a fiscal intermediary in FY 2023 requiring all provider claims and prior authorization requests to go through the fiscal intermediary rather than through individual MCOs.40
Other State-Contracted Delivery Systems or Initiatives
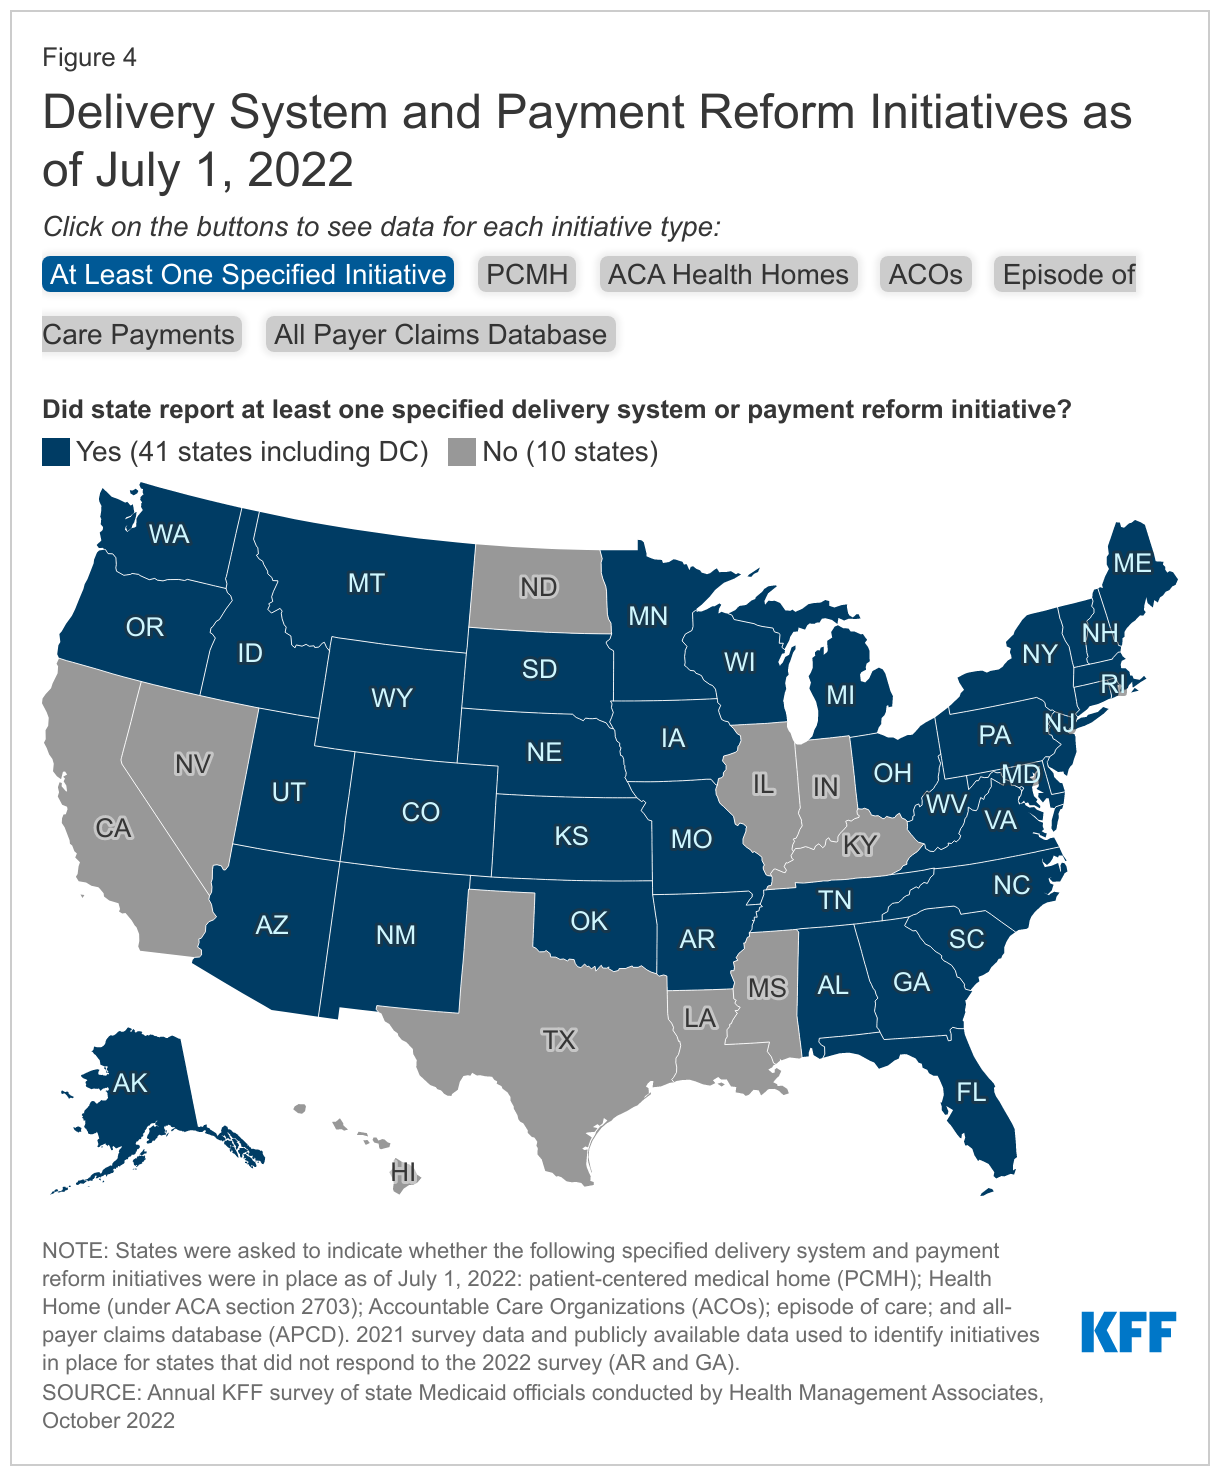
In addition to expanding the use of risk-based, comprehensive managed care, state Medicaid programs have expanded their use of other service delivery and payment system reforms in recent years. State Medicaid programs utilize a range of delivery and payment reform; however, there is wide state variation in Medicaid health care delivery and payment systems, as states design and combine service delivery models and payment approaches in different ways.
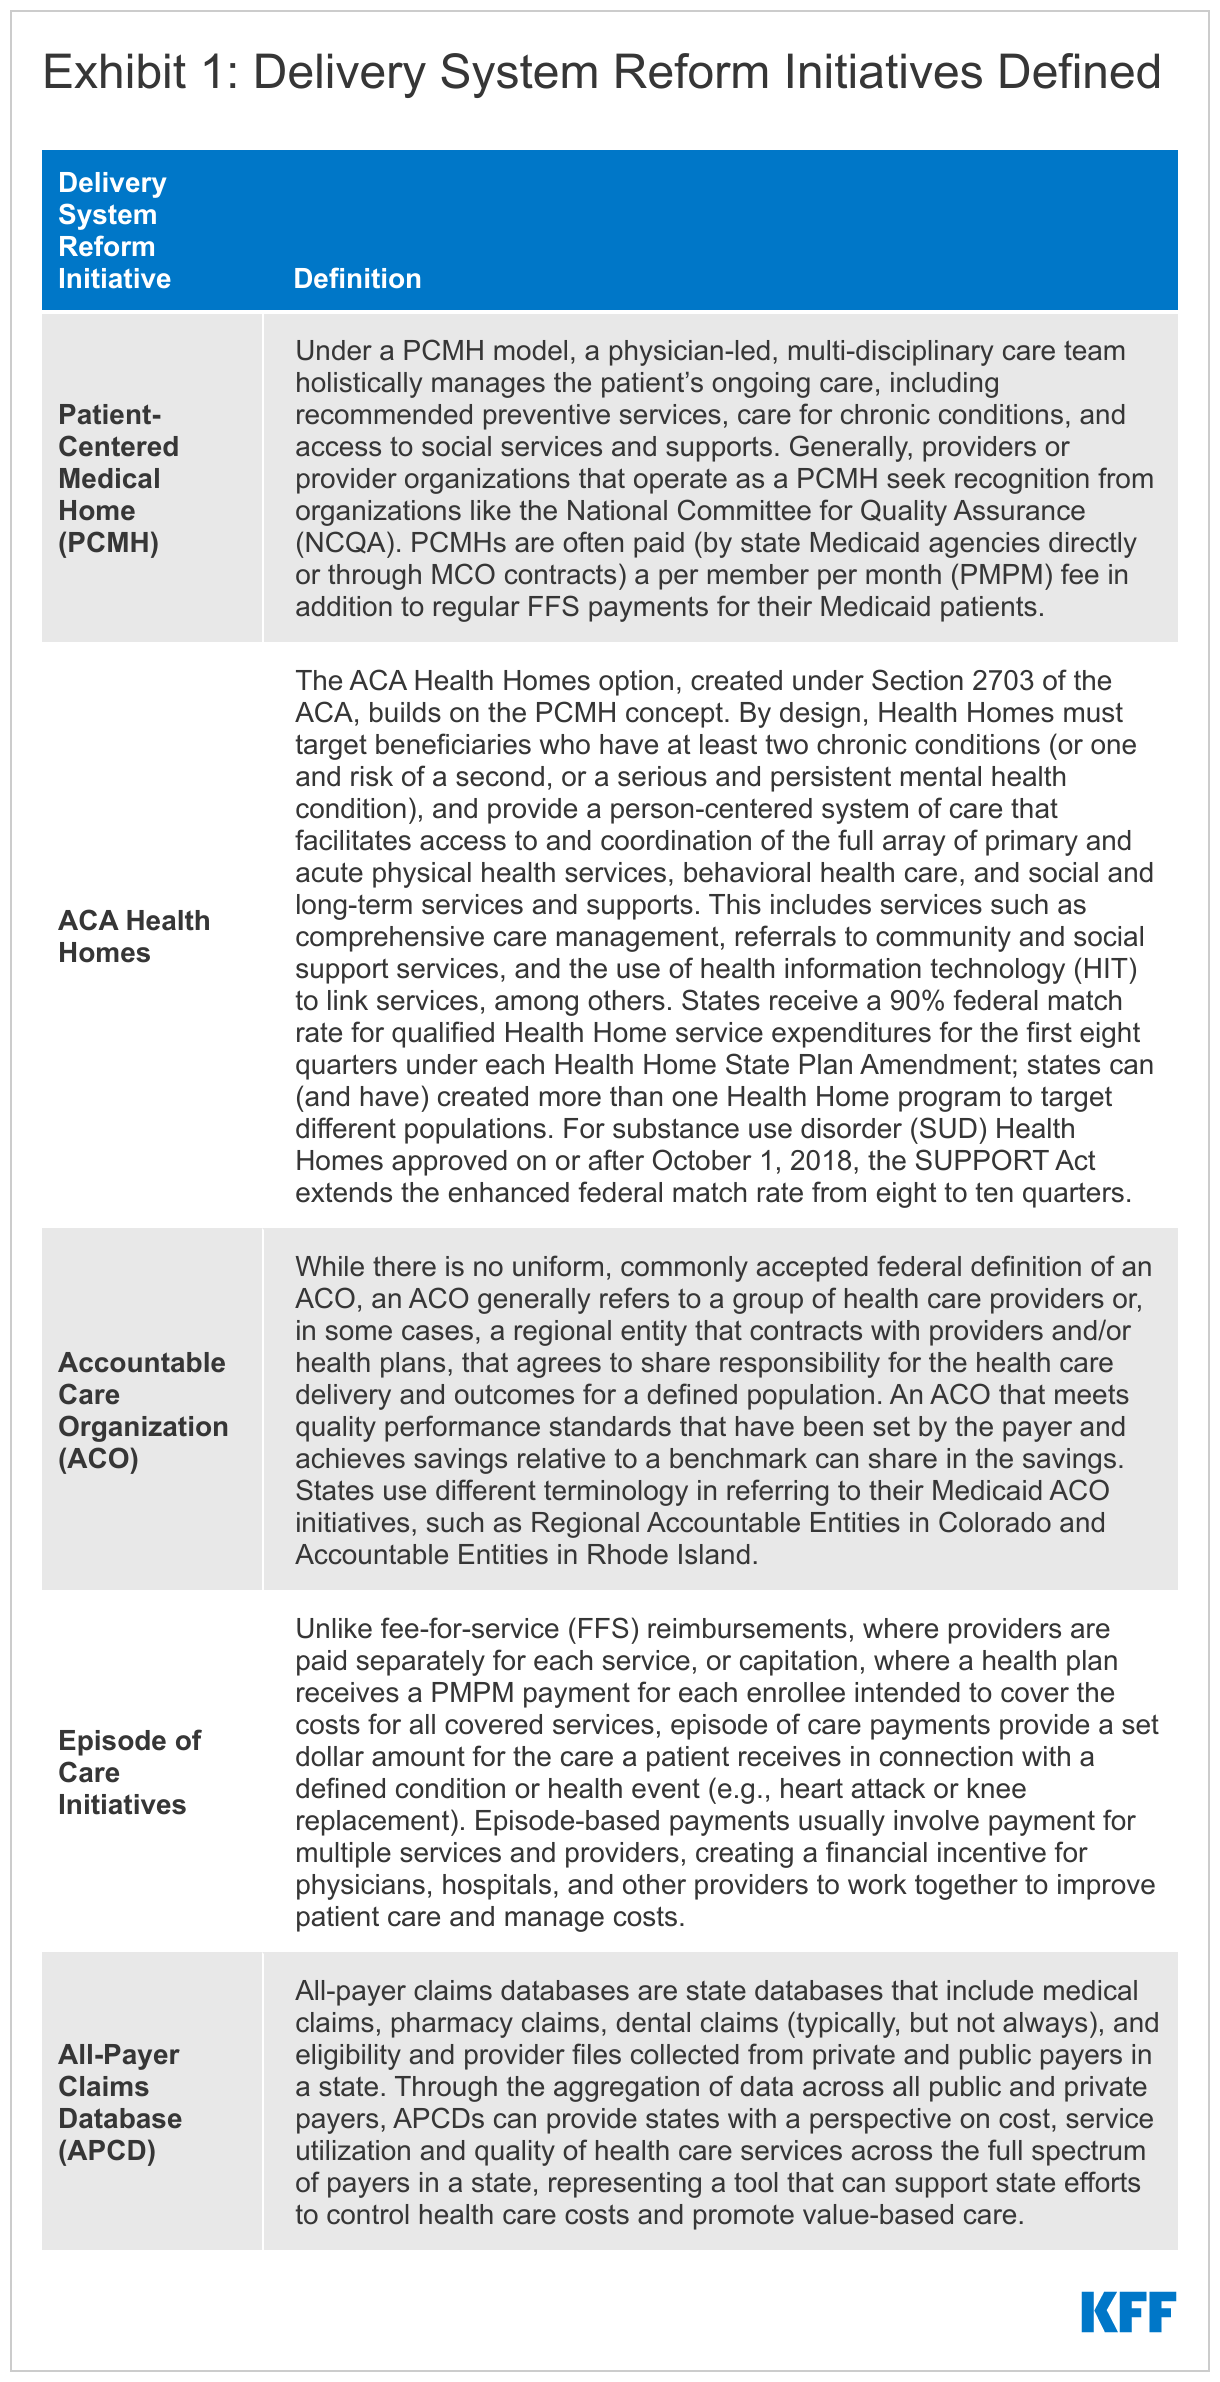
The vast majority of states (41 of 51) had at least one specified delivery system and payment reform initiative41 designed to address Medicaid cost and quality in place as of July 2022 and nearly half (24 of 51) had multiple initiatives in place (Figure 4).42 These initiatives are defined in Exhibit 1. Three states (New York, Rhode Island, and Vermont) had implemented initiatives in all five specified areas. For example, Vermont is participating in an All-Payer ACO Model with CMS; has in place a multi-payer advanced primary care initiative, including PCMH and community health teams through the state’s Blueprint for Health; has a “Hub and Spoke” Health Home model for people experiencing opioid dependence; has episodic payments for its residential substance use disorder (SUD) program; and has a mature all-payer claims data base (APCD). Total states with each initiative include:
- Patient-Centered Medical Home – 26 states43
- ACA Health Homes – 20 states
- All-Payer Claims Database (APCD) – 18 states
- Accountable Care Organization – 11 states
- Episode of Care – 9 states
Many of these delivery system and payment reform initiatives are longstanding and have been in place for many years. Although the survey did not ask for details regarding each initiative, several states identified changes to initiatives as well as plans to implement in the near future. For example, in FY 2022 California transitioned from its former ACA Health Home program to an “Enhanced Care Management” managed care benefit available statewide. This initiative is part of a framework for broad-based delivery system, program, and payment reform across the Medi-Cal program, called California Advancing and Innovating Medi-Cal (CalAIM).44 Also in FY 2022, Maine replaced its PCMH and PCCM programs with the new “Primary Care Plus” program, an integrated care model that provides monthly payments to eligible primary care providers that vary by practice characteristics and are risk adjusted and performance-based. Although Nevada does not currently have an APCD in place, one was approved for implementation in the 2021 legislative session with an anticipated go-live date of January 2023. Several other states including California, Indiana, Oklahoma, and West Virginia indicated an APCD is planned or currently under development.
Health Equity
Context
The COVID-19 pandemic has highlighted and exacerbated longstanding racial and ethnic disparities in health and health care. Prior to the pandemic, people of color fared worse than White people across many measures of health and health care, reflecting inequities within the health care system as well as across broader social and economic factors that drive health (often referred to as social determinants of health or social drivers of health) that are rooted in racism and discrimination. As a major source of health coverage for people of color, Medicaid programs can help to address health disparities. Over the past few years, the federal government and many states have identified advancing health equity as an important priority for the Medicaid program. In November 2021, CMS published its strategic vision for Medicaid and CHIP which identified equity and reducing health disparities as key focus areas, emphasizing Section 1115 demonstration waivers can help foster improved quality and equity.
High-quality, comprehensive data are essential for identifying and addressing health disparities and measuring progress over time. For example, during the COVID-19 pandemic, disaggregated demographic data were crucial to identifying disparities and implementing policy solutions. Unfortunately, inadequate, incomplete, and inconsistent demographic data, particularly race and ethnicity data, is a longstanding challenge across many areas of health care, including in state Medicaid and CHIP programs. For example, a Medicaid and CHIP Payment and Access Commission (MACPAC) analysis of 2018 Medicaid administrative data found high rates of missing or unknown race and ethnicity data and conflicts with key benchmark data.
Federal Medicaid managed care regulations also require states that contract with managed care plans to develop and publicly post quality strategies that include plans to reduce health care disparities. To further these quality strategies, states develop access and quality standards within federal guidelines that MCOs are required to meet. Some state MCO contracts incorporate requirements to advance health equity, such as requiring MCOs to achieve the NCQA Distinction in Multicultural Health Care,45 and states may also tie MCO financial quality incentives (e.g., performance bonuses, withholds, or value-based state directed payments) to health equity-related performance goals. States must also require MCOs to implement performance improvement projects (PIPs) to examine access to and quality of care, and these projects often include analysis of health disparities.
This section provides information about:
- Improving Medicaid race, ethnicity, and language (REL) data collection
- Financial incentives (FFS and MCO) tied to health equity-related performance goals
- Other MCO health equity requirements
- Performance improvement projects (PIPs) focused on health disparities
Findings
Improving Medicaid Race, Ethnicity, and Language (REL) Data Collection
Although all Medicaid agencies ask applicants to self-report their race and ethnicity, it is not mandatory for applicants to do so. During Medicaid eligibility determinations (and redeterminations), race and ethnicity are not considered, and data not being used in Medicaid determinations must remain optional for applicants to report. While states must inform applicants that submitting race/ethnicity data is optional, this can lead to missing data, particularly if the instructions and rationale for providing race/ethnicity data are unclear, if the applicant has concerns or questions about how the data may be used, or if the applicant does not feel he or she fits into the options provided. Race and ethnicity categories on Medicaid applications vary considerably across states. An audit of state Medicaid enrollment applications conducted by the State Health Access Data Assistance Center (SHADAC) revealed substantial variation in the number and type of race/ethnicity categories used by states, ranging from 5 to 37 race categories and 2 to 8 ethnicity categories. States vary in the amount of race/ethnicity data they report as unknown or missing. A December 2021 analysis by CMS found that in 14 states, more than 20 percent of race/ethnicity data was missing. State Medicaid programs can implement a variety of strategies to enhance or improve REL data collection. On this year’s survey, we asked states whether specified strategies were in place (as of July 1, 2022) to improve the completeness of REL data.
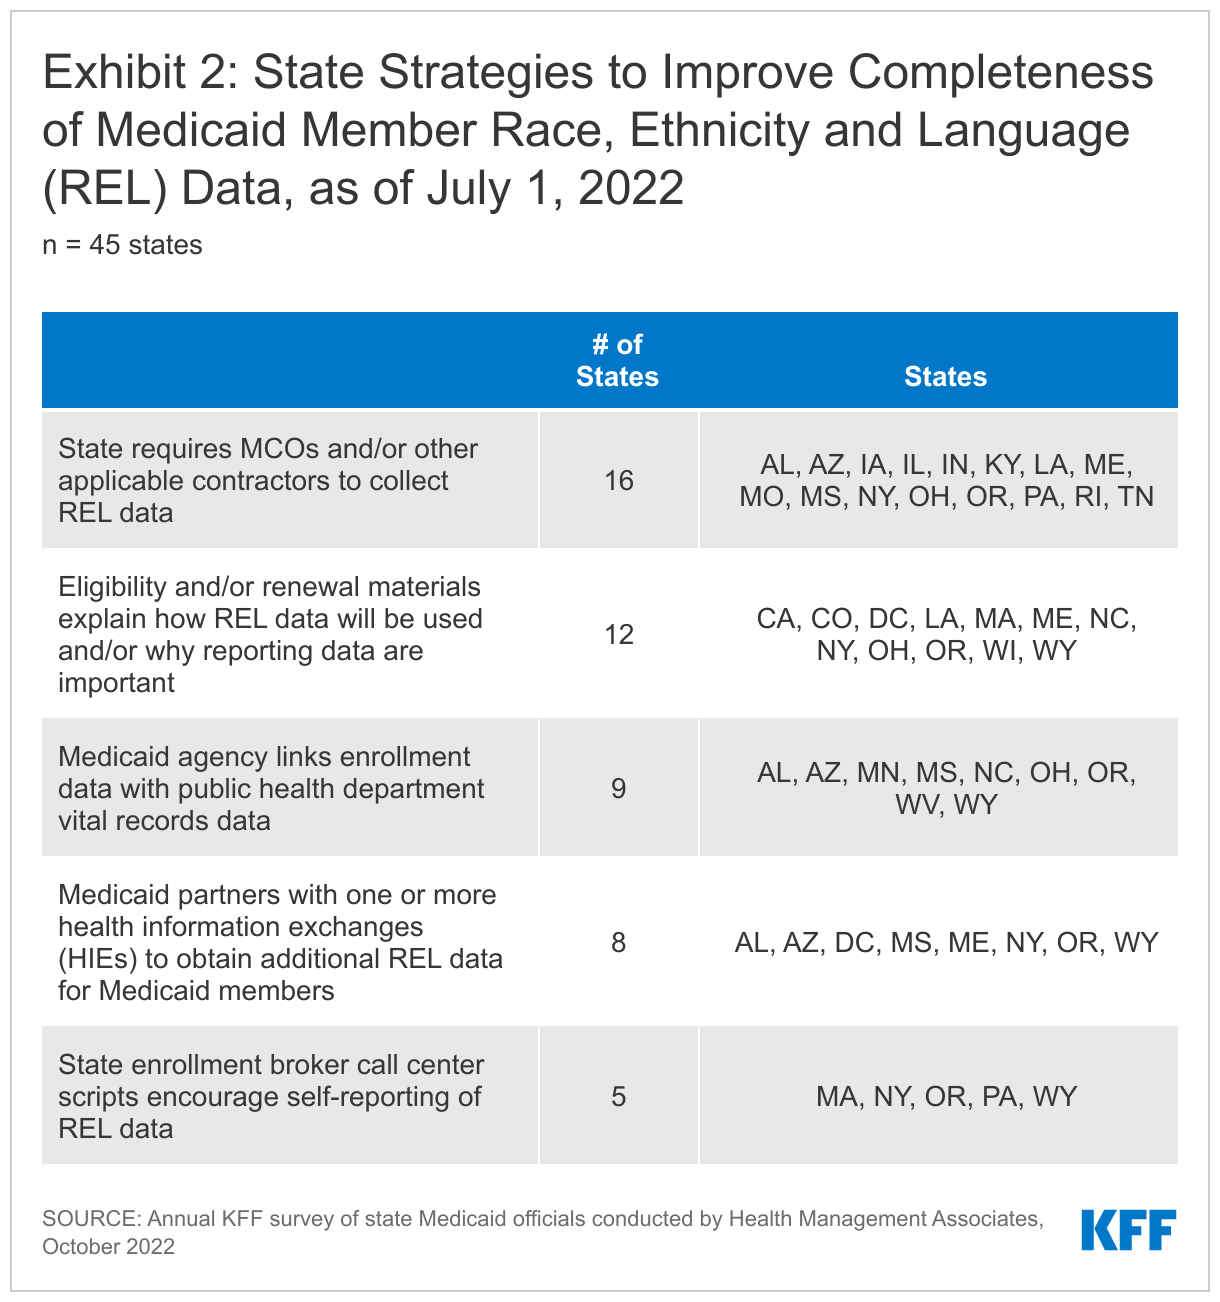
Over half of the states that responded to this question (25 of 45) reported using at least one specified strategy to improve race, ethnicity, and language (REL) data completeness (Exhibit 2). Over one-third of responding states (16 of 45) reported requiring MCOs and other applicable contractors to collect REL data. About one-quarter of responding states (12 of 45) reported that eligibility, renewal materials, and/or applications explain how REL data will be used and/or why reporting these data are important. About the same number of responding states reported linking Medicaid enrollment data with public health department vital records data (9 of 45) and partnering with one or more health information exchanges (HIEs) to obtain additional REL data for Medicaid enrollees (8 of 45). Several states identified issues with data systems and lack of integration between systems as barriers.
Eighteen states reported “other” strategies to improve Medicaid REL data.46 For example:
- Multiple states (Alaska, Colorado, Minnesota, Ohio, and Oregon) reported using data from alternate sources, such as administrative records from other agencies or third-party databases, to populate missing REL values. Washington state reported developing a new eligibility infrastructure that would integrate data across systems to improve data quality.
- Several states mentioned changes made to the Medicaid application to improve REL data including translating the application into other languages (Oklahoma), adding disability questions and gender identity and modality questions (Oregon), changing the phrasing of REL data questions (South Carolina), allowing applicants to provide more detailed race and ethnicity information (Wisconsin), and implementing, or planning to implement, “opt-out” options for race and ethnicity questions (Maryland and Louisiana).
- Two states (Arizona and Connecticut) reported that health equity-related committees or task forces within their state governments were developing recommendations related to REL data collection and disaggregation.
- Massachusetts, through its approved MassHealth Section 1115 demonstration waiver, will financially incentivize ACOs and ACO-participating hospitals to provide complete data on race, ethnicity, language, disability, sexual orientation and gender identity (RELD SOGI) starting in FY 2023. The state is working to update enrollment platforms to clarify and add questions related to RELD SOGI and modify downstream systems accordingly.
- South Carolina reported using training to emphasize the value of REL data collection with its eligibility staff.
Financial Incentives Tied to Health Equity-Related Performance Goals
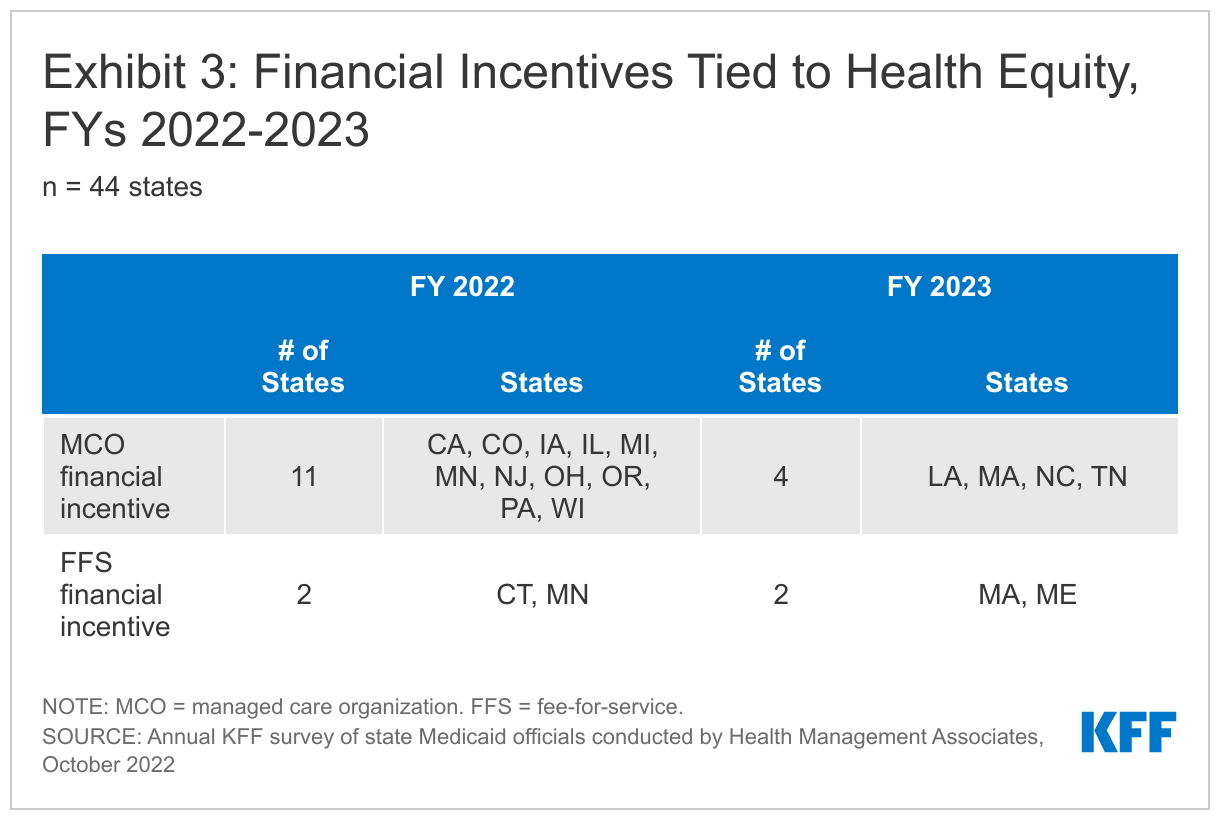
States use an array of financial incentives to improve quality including linking performance bonuses or penalties, capitation withholds, or value-based state-directed payments to quality measures. States implement financial incentives across delivery systems (fee-for-service and managed care). On this year’s survey, we asked states if they had an MCO financial quality incentive or FFS financial incentive for providers tied to a health equity-related performance goal (e.g., reducing disparities by race/ethnicity, gender, disability status, etc.) in place in FY 2022 or planned for FY 2023.
About one-quarter of responding states (12 of 44) reported at least one financial incentive tied to health equity in place in FY 2022 (Exhibit 3). The vast majority of these incentives were in place in managed care arrangements (11 of 13). Only two states (Connecticut and Minnesota), reported a FFS financial incentive in FY 2022. Five additional states report plans to implement financial incentives linked to health equity in FY 2023. Within managed care arrangements, states most commonly reported linking (or planning to link) capitation withholds, pay for performance incentives, and/or state-directed provider payments to health equity-related quality measures. Three states (Ohio, Oregon, and Wisconsin) reported implementing MCO incentive funding focused on reducing disparities in COVID-19 vaccination rates. Two states with FFS incentives (in place or planned) (Massachusetts and Minnesota) reported health equity incentives for ACOs.
Other notable state examples include:
- California’s Quality Incentive Pool (QIP) program is a managed care directed payment program for California’s public health care systems (i.e., designated public hospitals and district/municipal public hospitals) that ties payments to performance on designated quality measures. The QIP program explicitly incorporates two Improving Health Equity (IHE) metrics, one of which is required for the larger public hospitals. The IHE measure allows hospitals to report a disparity-sensitive measure on a priority population selected by each hospital. Hospitals are also required to stratify by race/ethnicity for up to five designated measures on an informational basis.47 Additionally, in 2023, the state plans to adjust base capitation rates in counties with more than one plan based on plan performance on select quality measures. Performance on health equity will be incorporated once race and ethnicity stratifications are available.
- Connecticut has had an obstetrics pay for performance program in place for six years that targets birthing people at risk for adverse outcomes, including Black and birthing people of color. In FY 2023, the state plans to launch a maternity payment bundle where financial incentives will be tied to health equity outcomes. The state will include doulas and breastfeeding supports to remedy disparities in maternal and birth outcomes for historically marginalized groups including Black and birthing people of color and those with substance use disorders.
- In Massachusetts, one of the key goals for MassHealth’s next Section 1115 demonstration period is to advance health equity, with a focus on initiatives addressing health-related social needs and specific disparities. MassHealth intends to implement health equity incentives for ACOs and acute care hospitals to improve social risk factor data collection, increase reporting of quality metrics stratified by social risk factors to identify disparities, and then actually close gaps in the identified disparities.
- In both FY 2022 and FY 2023, a portion of Michigan’s MCO capitation withhold pay for performance payments (P4P) is based on health equity Healthcare Effectiveness Data and Information Set (HEDIS) measure performance (30%) and performance on shared metrics that address health equity in the care management that MCOs provide in coordination with behavioral health prepaid inpatient health plans (PIHPs) (15%). In FY 2022, there are 10 HEDIS measures that are part of the health equity measures (comparing people of color to the White population).
- New Jersey reported implementing a perinatal episode of care three-year pilot to test a new alternative payment model for prenatal, labor, and postpartum services statewide. The pilot requires participating providers to complete a Health Equity Action Plan and includes reporting of a provider's quality metrics broken down by the member's race/ethnicity.
- Pennsylvania’s MCO P4P program incentivizes reductions in racial disparities for specific quality measures, including rates of hypertension, diabetes, and prenatal care.
Other MCO Health Equity Requirements
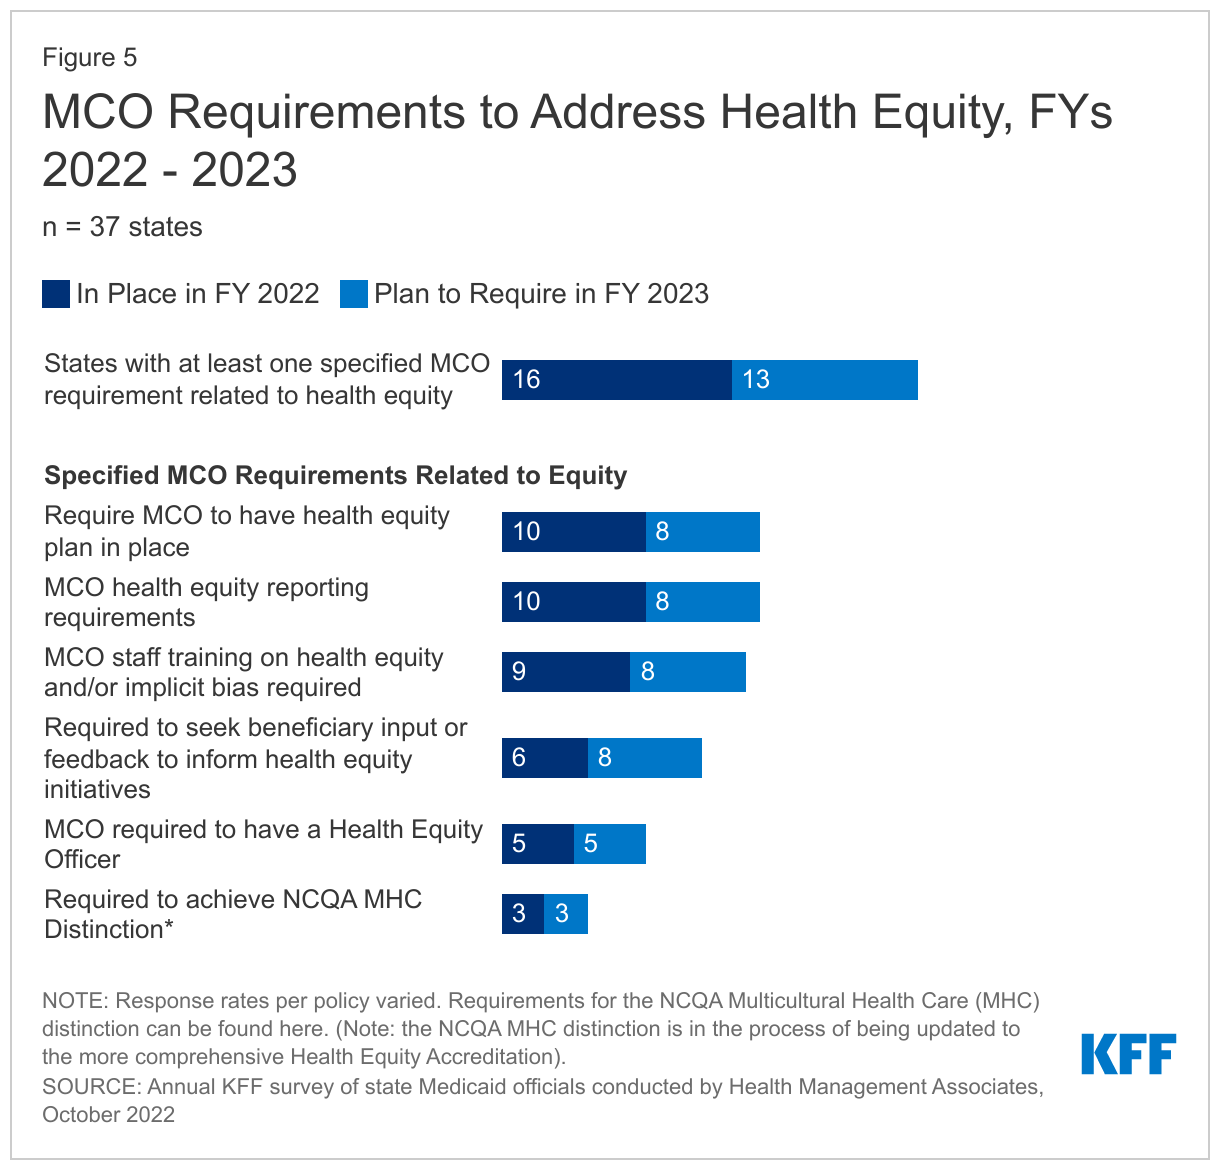
In addition to implementing financial incentives tied to health equity-related performance goals, states can leverage managed care contracts in other ways to promote health equity-related goals. For example, states can require MCOs to achieve national standards for culturally competent care, conduct staff training on health equity and/or implicit bias, develop new positions related to health equity, report racial disparities data, incorporate enrollee feedback, among other requirements. On this year’s survey, we asked states that contract with MCOs about whether certain MCO contract requirements related to health equity were in place in FY 2022 or planned for implementation in FY 2023.
Nearly one-half of responding MCO states (16 of 37) reported at least one specified health equity MCO requirement in place in FY 2022 (Figure 5). In FY 2022, similar numbers of states (about one-quarter) reported requiring MCOs to have a health equity plan in place (10 of 37), meet health equity reporting requirements (10 of 37), and train staff on health equity and/or implicit bias (9 of 37). Fewer states reported requiring MCOs to seek beneficiary input or feedback to inform health equity initiatives (6 of 37), have a health equity officer (5 of 37), and achieve NCQA’s Distinction in Multicultural Health Care (MHC) (3 of 37).48 Among states with at least one requirement in place in FY 2022, half (8 of 16) reported requiring three or more specified initiatives in place (data not shown). The number of MCO states with at least one specified health equity MCO requirement in place is expected to grow significantly in FY 2023, from 16 to 25 states. A few other states reported that though equity-related requirements for MCOs are not planned for FY 2023, they are actively considering or planning to adopt these requirements in the future.
Although states were not asked to describe MCO requirements related to health equity (in place or planned), several states provided additional details including:
- Michigan requires MCOs to implement diversity, equity, and inclusion (DEI) assessment and training programs that are evidence-based and comprehensive. The programs must assess all organizational personnel, policies, and practices and include at least one implicit bias training workshop in 2022 for all personnel. MCOs must also report certain HEDIS measures by race and this data is used by the Department of Health and Human Services in its annual Medicaid Health Equity Project.
- Nevada encourages, but does not require, NCQA MHC distinction as a way of building a strong cultural competency program. Health equity is a component of the required MCO Population Health Program, which must address racial and ethnic disparities, and the required Population Health Program Manager position includes health equity responsibilities. As part of population health program reporting, MCOs must submit an annual population health strategy.
- Oregon requires MCOs to develop a health equity plan and provide updates and progress reports every year. In addition, MCOs must develop a yearly organization-wide training plan on health equity fundamentals which may include training offerings for provider networks. MCOs are also asked to report on training plan progress every year.
Performance Improvement Projects (PIPs) Focused on Health Disparities
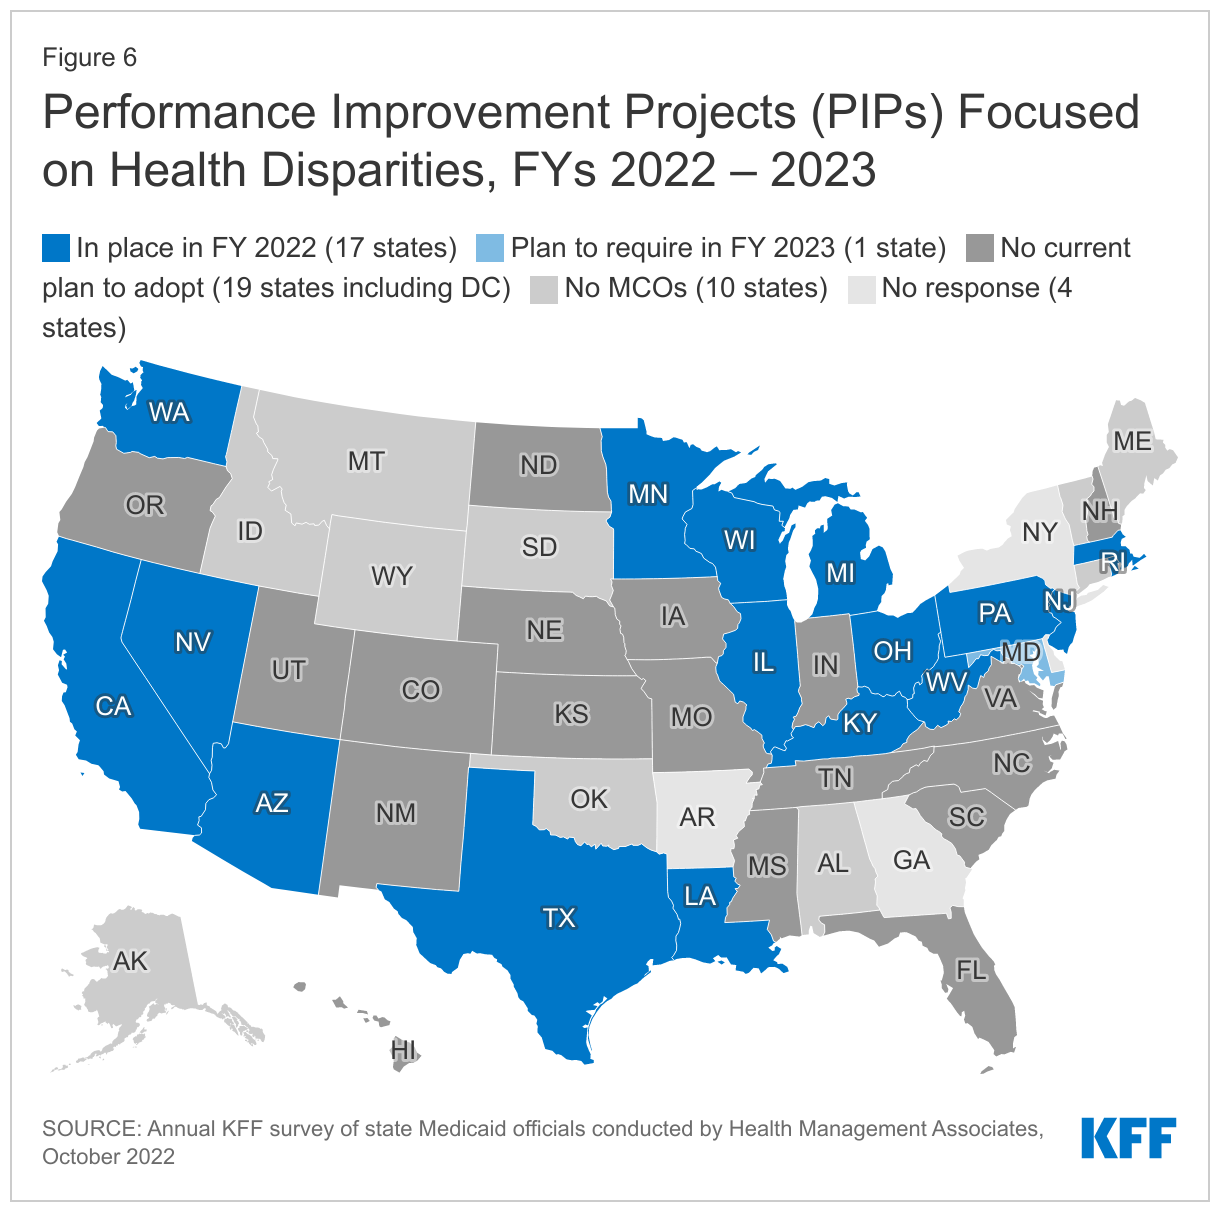
For contracts starting on or after July 1, 2017, federal regulations mandate that states require each MCO or limited benefit prepaid health plan (PHP) to establish and implement an ongoing comprehensive quality assessment and performance improvement (QAPI) program for Medicaid services that includes Performance Improvement Projects (PIPs). PIPs may be designated by CMS, by states, or developed by health plans, but must be designed to achieve significant, sustainable improvement in health outcomes and enrollee satisfaction. On this year’s survey, we asked states if they required MCOs to participate in PIPs focused on health disparities in FY 2022 or planned to in FY 2023.
About half of responding states that contract with MCOs (17 of 37) reported requiring MCOs to participate in PIPs focused on health disparities in FY 2022 (Figure 6). States reported a range of state-mandated PIP focus areas which include an emphasis on reducing disparities / improving health equity including related to:
- Maternal and child health (Illinois, Michigan, Minnesota, Nevada, and Texas)
- Social determinants of health assessment, referral, and follow up (Kentucky)
- Diabetes education and management (Ohio)
- Substance use disorder (SUD) (Pennsylvania)
- Access to culturally and linguistically appropriate services (Wisconsin)
- Lead screening in children (Rhode Island)
Three states (Arizona, Louisiana, and Massachusetts) reported all PIPs must include a health equity component or equity and disparities analysis; two states (California and New Jersey) reported requirements for MCOs to engage in at least one PIP focused on health disparities, and one state (Washington) requires MCOs to collaborate with other MCOs and the state on a statewide PIP addressing health equity. One state (West Virginia) did not specifically describe its health equity-related PIP requirement. One state (Maryland) reported plans to require MCO participation in PIPs focused on prenatal and postpartum care health disparities in FY 2023. While not within the survey period, Mississippi reported that its new MCO contracts, which will become operational in FY 2024, will require MCOs to collaborate with each other and with the state on joint PIPs addressing health disparities identified by the state.
Benefits
Context
State Medicaid programs are statutorily required to cover a core set of “mandatory” benefits, but may choose whether to cover a broad range of optional benefits. States may apply reasonable service limits based on medical necessity or to control utilization, but once covered, services must be “sufficient in amount, duration and scope to reasonably achieve their purpose.”49 State benefit actions are often influenced by prevailing economic conditions: states are more likely to adopt restrictions during downturns and expand or restore benefits as conditions improve. However, during the COVID-19 pandemic, despite an early and deep economic downturn, additional federal funds and the goal to maintain access to needed services resulted in states using Medicaid emergency authorities to temporarily expand or enhance benefits. Similarly, in 2020 and 2021, permanent (i.e., non-emergency) benefit expansions continued to far outweigh benefit restrictions, consistent with prior years.
Recent trends in state changes to Medicaid benefits (both prior to and during the COVID-19 pandemic) include behavioral health service expansions as well as efforts to advance maternal and infant health. New federal legislation and requirements can also affect state Medicaid benefits; for example:
- The American Rescue Plan Act of 2021 included expanded federal funding for home and community-based services (HCBS).50
- The Bipartisan Safer Communities Act of 2022 aimed to improve and expand provision of the Medicaid EPSDT benefit and school-based Medicaid services by providing updated guidance for states. The Act also allocated grant funding for states to expand school-based Medicaid services.51
- The Inflation Reduction Act of 2022 requires Medicaid coverage of all adult vaccines recommended by the Advisory Committee on Immunization Practices (ACIP) without cost-sharing, beginning in 2023.52
- In July 2022, the federally mandated crisis number, 988, became available to all landline and cell phone users, per the National Suicide Hotline Designation Act of 2020.53 988 provides a single three-digit number to access a network of over 200 local and state funded crisis centers. State Medicaid programs may participate in financing of services provided through 988.
- The Consolidated Appropriations Act of 2021 requires states to cover routine patient costs associated with participation in qualifying clinical trials, beginning January 1, 2022.54
This section provides information about:
- Non-emergency benefit changes
- Clinical trial participation coverage
- In lieu of services
Findings
Non-Emergency Benefit Changes
We asked states about non-emergency benefit changes implemented during FY 2022 or planned for FY 2023, excluding telehealth, pharmacy, and temporary changes adopted via emergency authorities in response to the COVID-19 pandemic but including emergency changes that have or will become permanent (i.e., transitioned to traditional, non-emergency authorities). Benefit changes may be planned at the direction of state legislatures and may require CMS approval.
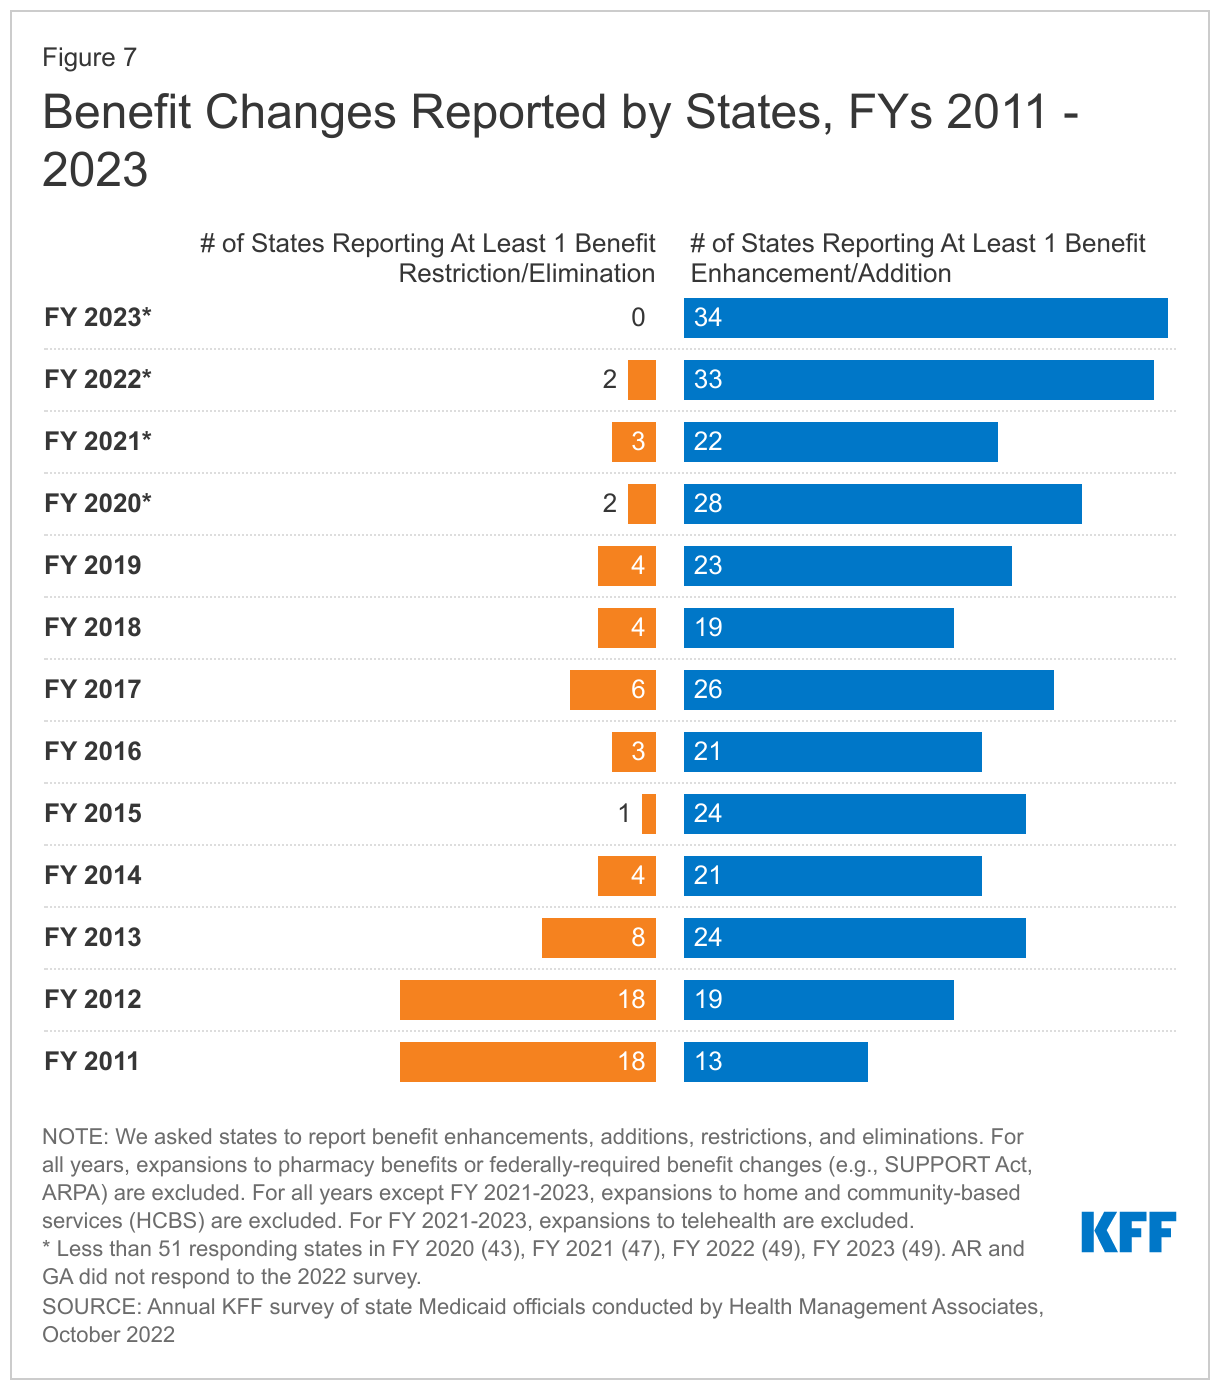
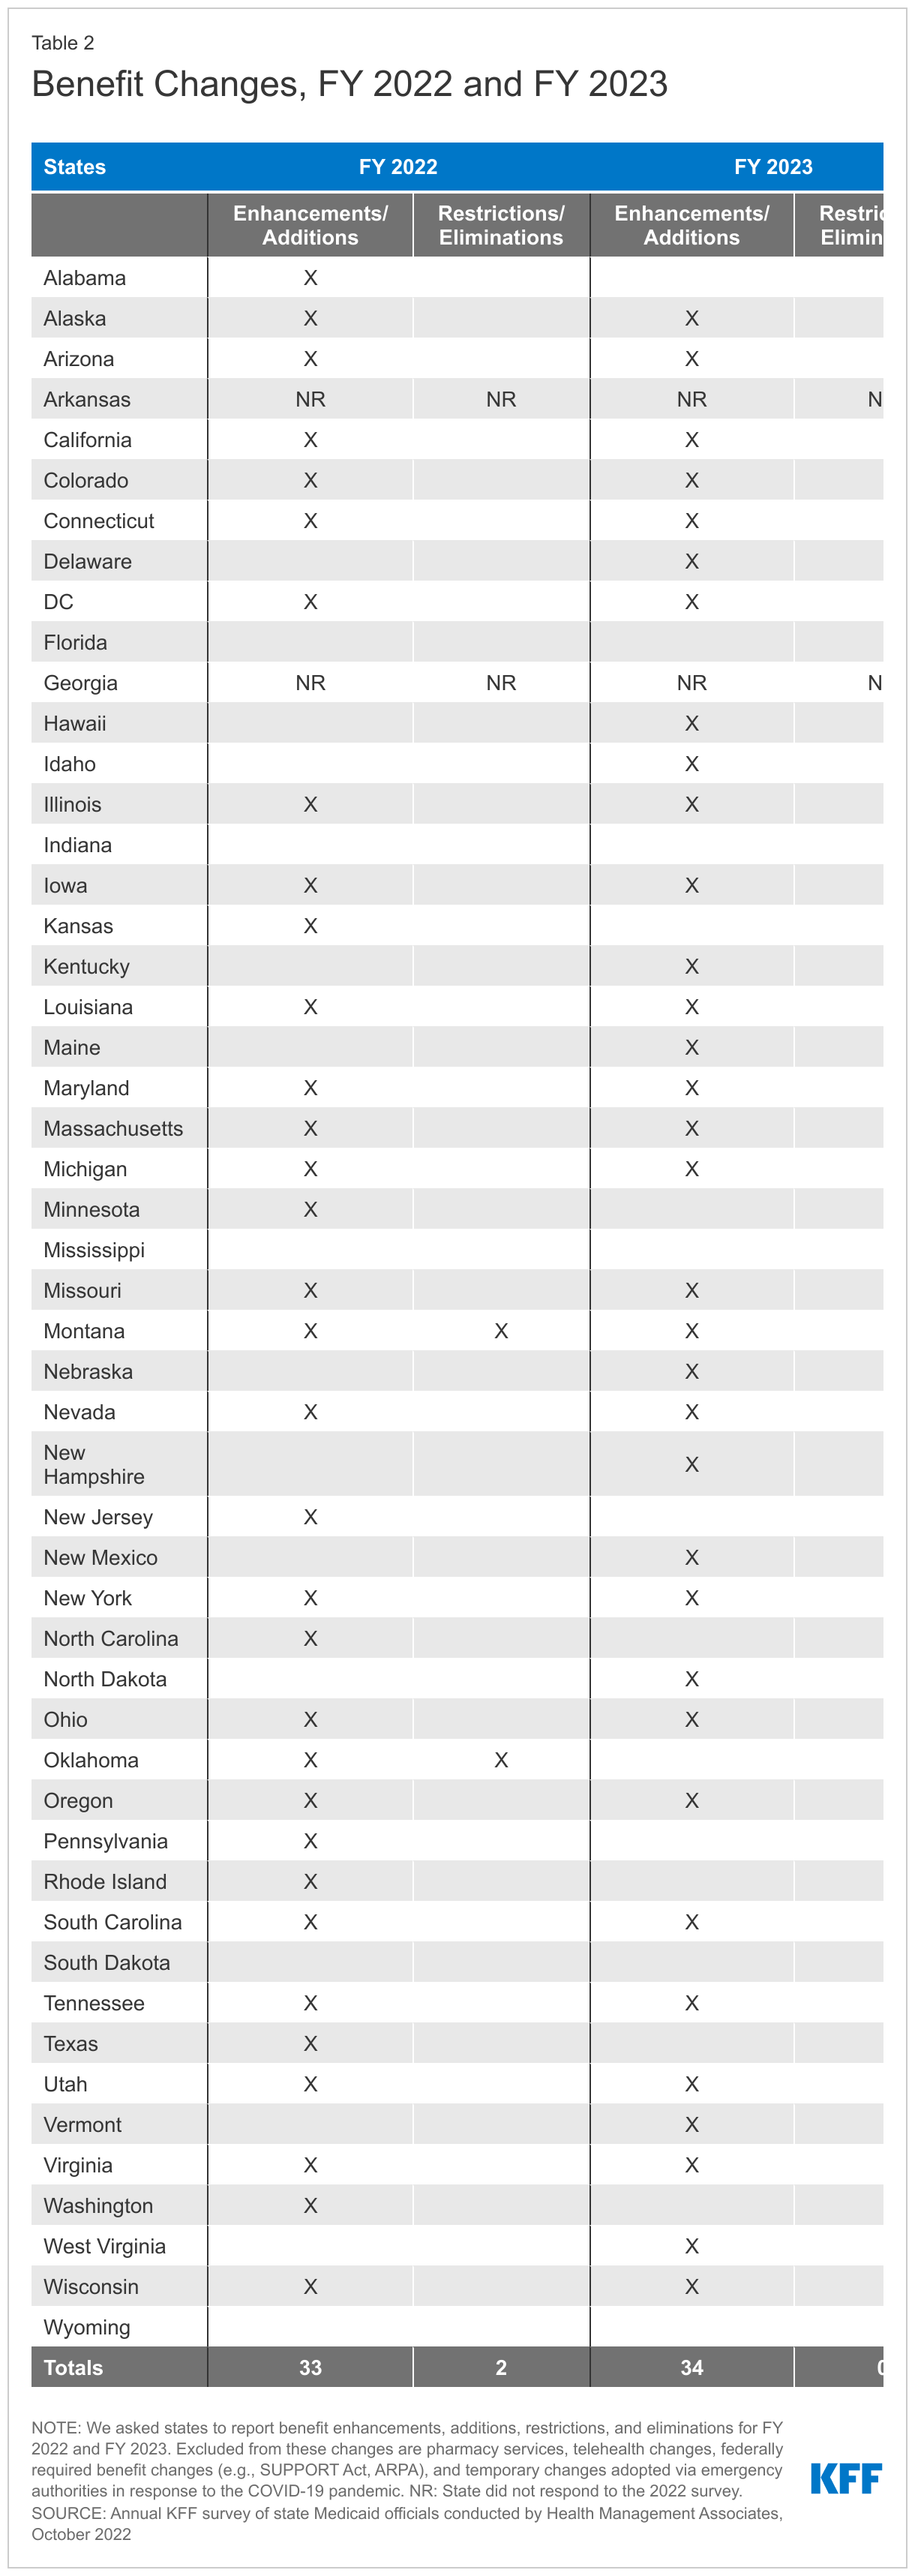
The number of states reporting new benefits and benefit enhancements greatly outpaces the number of states reporting benefit cuts and limitations (Figure 7 and Table 2). Thirty-three states reported new or enhanced benefits in FY 2022 and 34 states are adding or enhancing benefits in FY 2023.55 Two states reported benefit cuts or limitations in FY 2022 and no states reported cuts or limitations in FY 2023. We provide additional details about several benefit categories below (Exhibit 4). In addition to these benefit categories, several states reported updated and expanded benefits in HCBS waivers (which may be reflected in other categories below); such expansions may take advantage of enhanced ARPA HCBS funding.
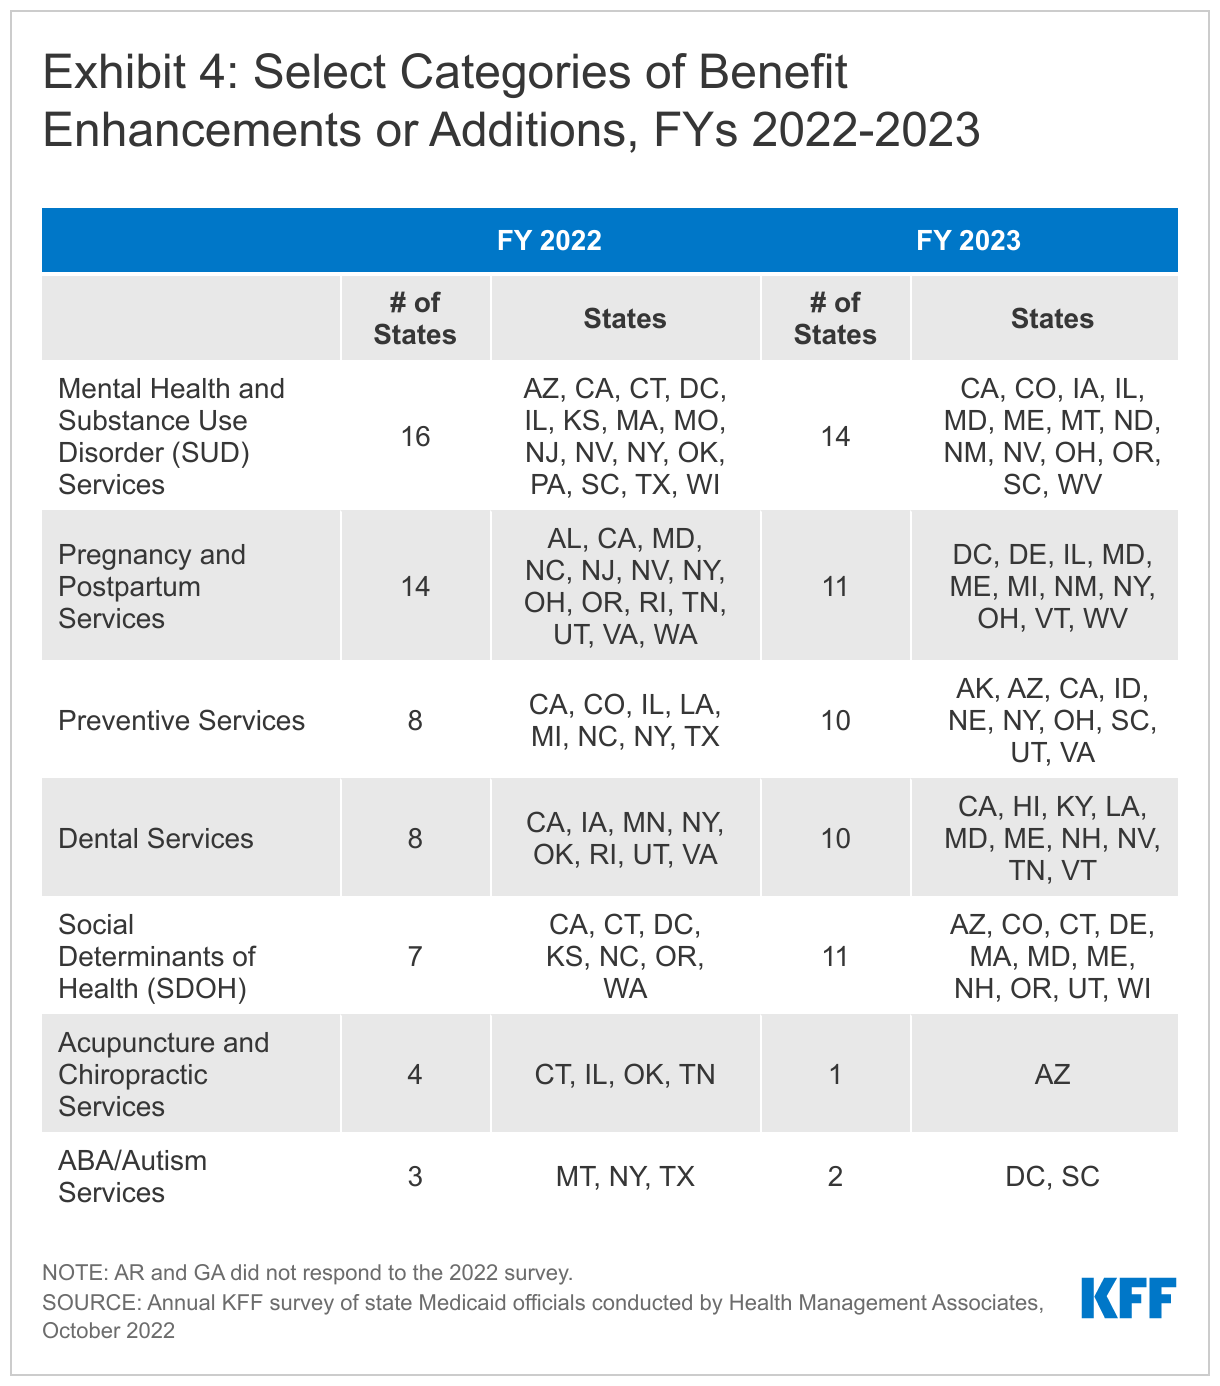
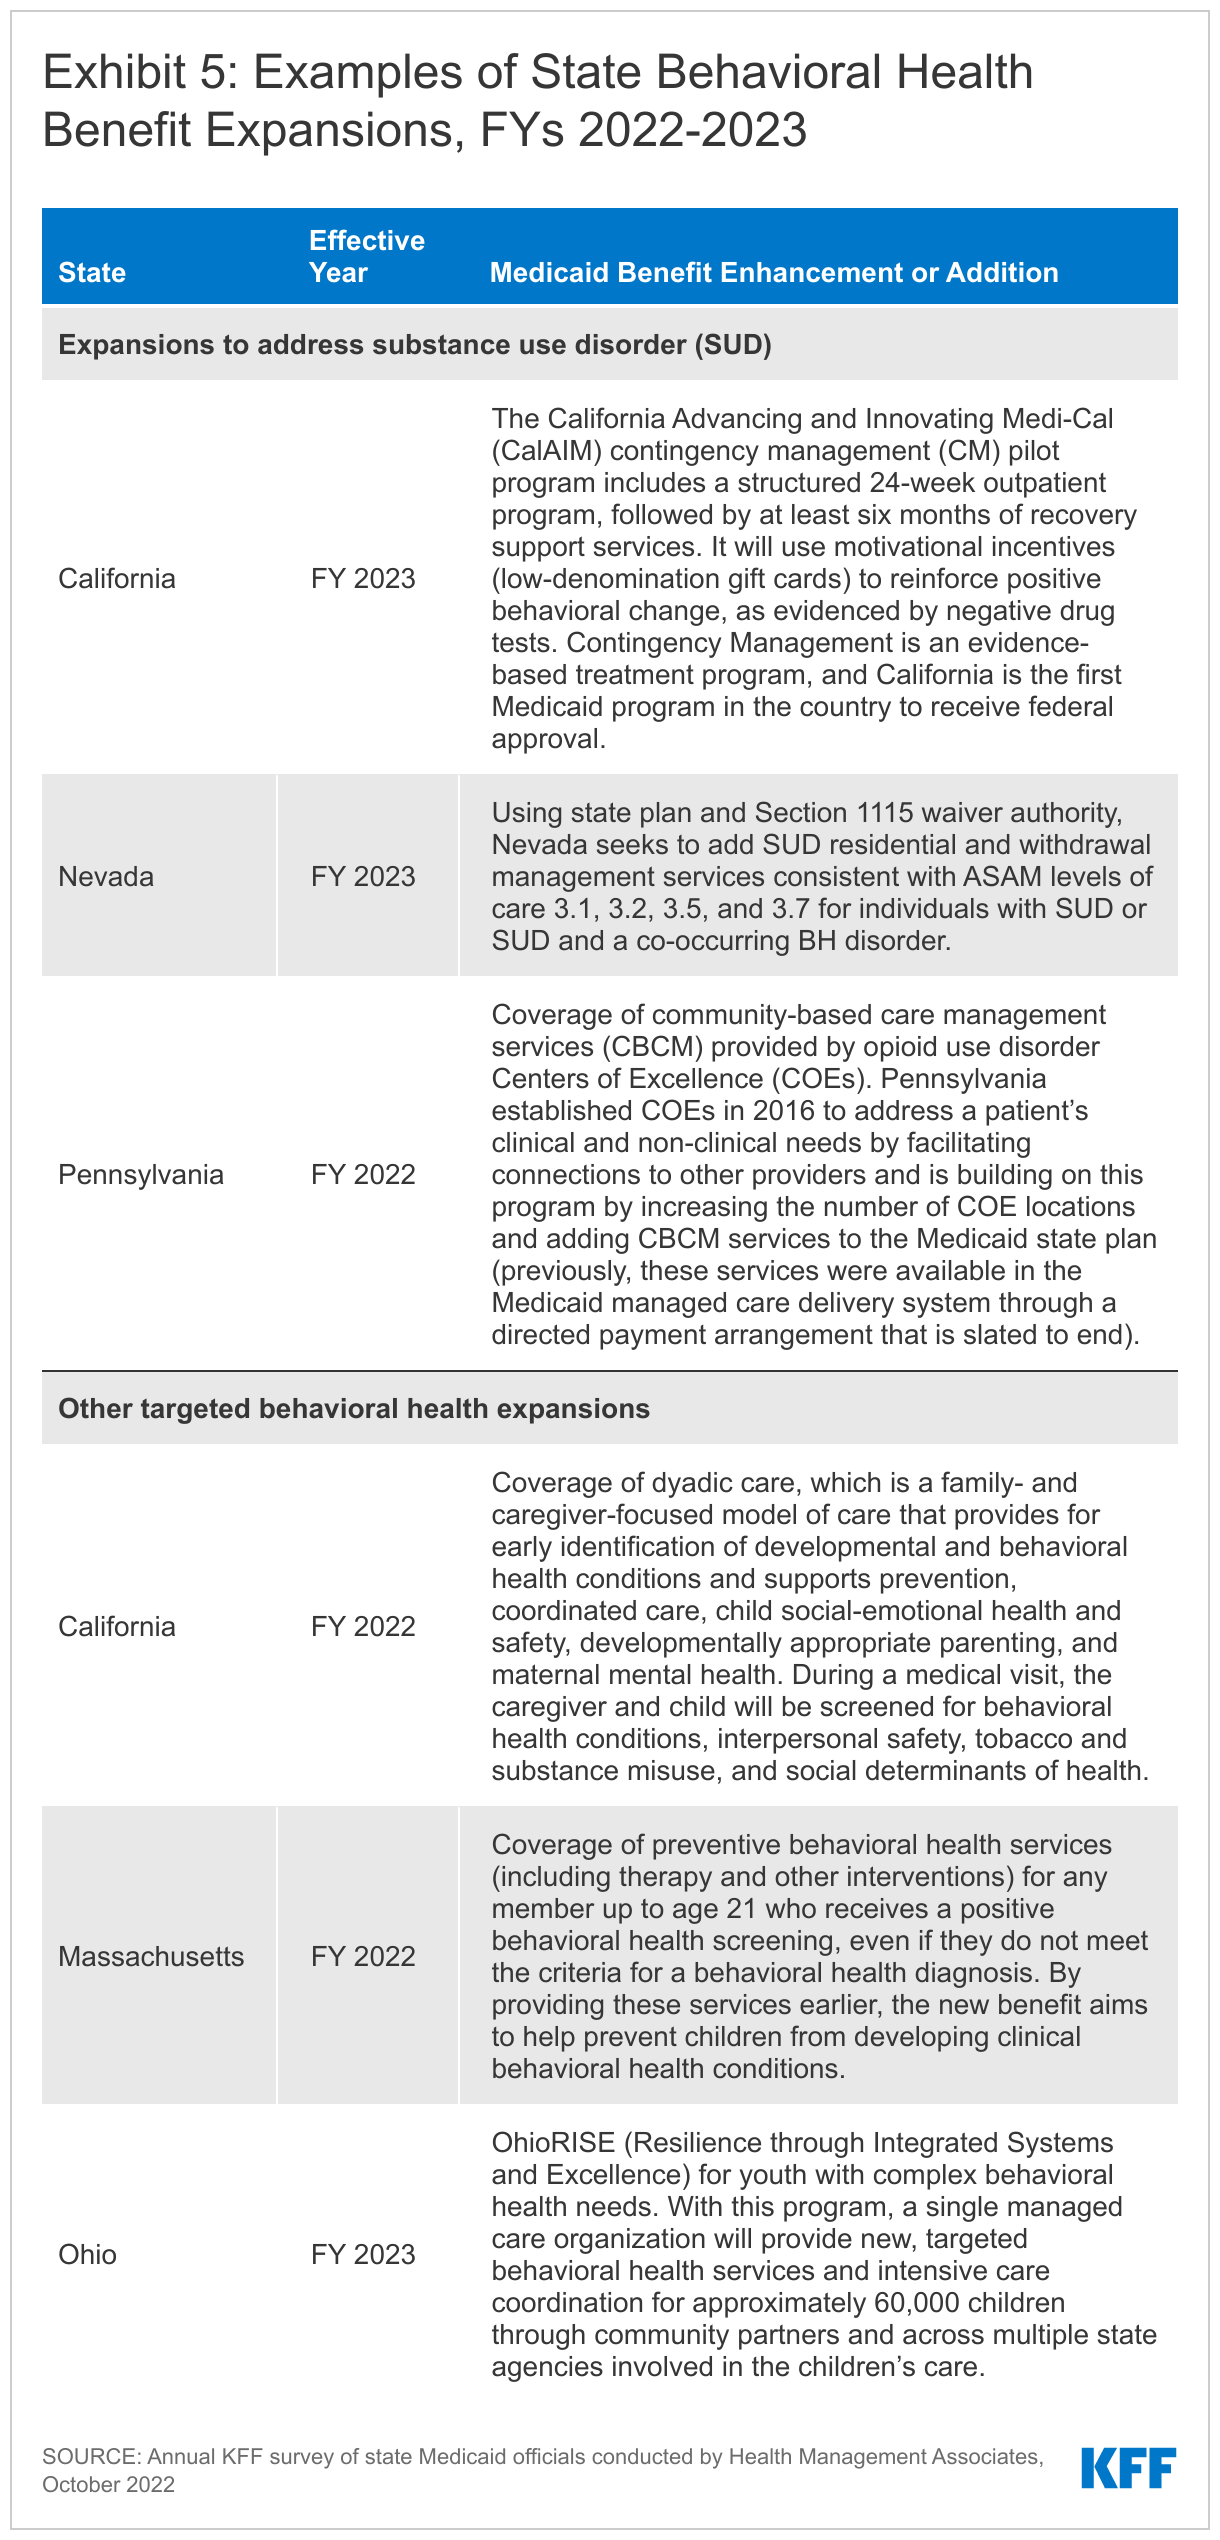
Behavioral Health ServicesStates continue to focus on behavioral health through the introduction of new and expanded mental health and/or substance use disorder (SUD) services in FY 2022 and FY 2023. States reported service expansions across the behavioral health care continuum, including institutional, intensive, outpatient, home and community-based, and crisis services (see Exhibit 5 for state examples). Many of these benefit expansions are targeted to specific populations, including notable expansions and programming for youth. A number of states reported benefits aimed to improve the integration of physical and behavioral health care, including adoption of Certified Community Behavioral Health Clinics (CCBHCs)56 or the Collaborative Care model (CoCM).57 State approaches to addressing SUD outcomes include coverage of opioid treatment programs, peer supports, and enhanced care management. At least ten states are expanding coverage of crisis services, which aim to connect Medicaid enrollees experiencing behavioral health crises to appropriate community-based care.58 These include mobile crisis response services and crisis stabilization centers. In many states, crisis service expansions require coordination with state behavioral health agencies, including related to the implementation and funding of the new national 988 crisis number.
Pregnancy and Postpartum ServicesStates continue to expand and transform care for pregnant and postpartum individuals to improve maternal health and birth outcomes. In April 2022, a temporary option to extend Medicaid postpartum coverage from 60 days to 12 months took effect. This option, included in the American Rescue Plan Act, is part of broader federal and state efforts to improve maternal and infant health outcomes and address racial/ethnic health disparities. Alongside this eligibility change, some states are enhancing Medicaid services available during the postpartum period. Additionally, nine states are adding coverage of services provided by doulas (California, District of Columbia, Illinois, Maryland, Michigan, New Mexico, Nevada, Rhode Island, and Virginia). Doulas are trained professionals who provide holistic support to individuals before, during, and shortly after childbirth. Seven states are investing in the implementation or expansion of home visiting programs to teach positive parenting and other skills aimed at keeping children healthy and promoting self-sufficiency (Alabama, Delaware, Illinois, Maryland, Ohio, Oregon, and Vermont). Other examples of expanded pregnancy and postpartum services include:
- In FY 2023, Illinois plans to expand services available during the postpartum period to include those provided by certified lactation counselors and consultants, public health nurses, and medical caseworkers.
- In FY 2022, Washington implemented a Newborn Administrative Day Rate to cover hospital stays up to five days for a postpartum parent who has been medically discharged, but whose newborn remains inpatient due to monitoring for neonatal abstinence syndrome (NAS) or neonatal opioid withdrawal syndrome (NOWS). The rate will provide daily reimbursement to help offset hospital costs of providing these postpartum parents with room and board and limited additional services centered on the care and well-being of the newborn, including medications to treat SUD.59
- In FY 2023, West Virginia plans to implement its Drug Free Moms and Babies (DFMB) Program (previously a pilot project), an integrated comprehensive medical and behavioral health program for pregnant and postpartum individuals with SUD that provides a targeted case management benefit.60
- In FY 2023, Maine and Maryland are expanding their Maternal Opioid Misuse (MOM) Models, a Center for Medicare and Medicaid Innovation (CMMI) initiative for pregnant and postpartum women with opioid use disorder.
Preventive ServicesSixteen states reported expansions of preventive care in FY 2022 or FY 2023. Preventive care—including immunizations and regular screenings that permit early detection, treatment, and improved management of chronic conditions—improves the prospects for better health outcomes. States must cover certain preventive services for adults newly eligible under the ACA’s Medicaid expansion, but this coverage is not required for “traditional” Medicaid adults. (In contrast, states are required to provide comprehensive preventive care to children through the EPSDT benefit.) States reported enhancing a range of preventive benefits, especially for adult enrollees, in FY 2022 and FY 2023. For example, seven states are expanding services to prevent and/or manage diabetes, such as continuous glucose monitoring.61 Other reported preventive benefit enhancements relate to asthma services, vaccinations, and genetic testing and/or counseling.
Services Targeting Social Determinants of HealthMany states reported new and expanded benefits related to enrollees’ social needs. Social determinants of health (SDOH) are the conditions in which people are born, grow, live, work, and age that shape health; these include but are not limited to housing, food, education, employment, healthy behaviors, transportation, and personal safety. Generally, states have not been able to use federal Medicaid funds to pay the direct costs of non-medical services like housing and food.62 However, within Medicaid, states can use a range of state plan and waiver authorities to add certain non-clinical services to the Medicaid benefit package. Historically, non-medical services have been included as part of Medicaid HCBS programs for people who need help with self-care or household activities as a result of disability or chronic illness, and states have more limited flexibility to address SDOH outside of Medicaid HCBS authorities. CMS released guidance for states about opportunities to use Medicaid and CHIP to address SDOH in January 2021. In December 2021, CMS approved a California proposal to use “in lieu of” services (ILOS) to offer a menu of health-related services through managed care, and further guidance from CMS on the ILOS regulation is expected (also see ILOS section below).
In FY 2022 and/or 2023, twelve states reported new or expanded housing-related supports, as well as other services and programs tailored for individuals experiencing homelessness or at risk of being homeless.63 Some states reported enhancing benefits that target the social needs of enrollees receiving HCBS, such as home-delivered meals or supported employment. Examples of expanded services targeting SDOH include:
- California’s CalAIM initiative, which launched in January 2022, seeks to take the state’s whole person care approach statewide, with a central focus on improving health and reducing health disparities and inequities. Under CalAIM, Medi-Cal managed care plans will provide Enhanced Care Management (ECM) and Community Supports to targeted high-need beneficiaries.64 The new ECM benefit includes care coordination and comprehensive care management services to address clinical, behavioral, and social needs. Community Supports will address social drivers of health; examples include housing navigation services, recuperative care (medical respite), short-term post hospitalization housing services (up to six months), environmental accessibility adaptations, medically tailored meals, and sobering centers (also see ILOS section below).65
- Recently approved Section 1115 waivers in Arizona, Massachusetts, and Oregon allow the states to provide evidence-based health-related social needs (HRSN) services to certain high-need enrollees, when clinically appropriate, to address food insecurity and/or housing instability. HRSN services vary by state and include housing supports (such as eviction prevention, security deposits, housing transition navigation services, and medically necessary home modifications); short-term post-transition rent/temporary housing for up to six months (in Arizona and Oregon only); case management and linkages to other benefit programs; and nutrition supports (such as nutrition counseling and education, time-limited food assistance, and medically tailored meals) (in Massachusetts and Oregon only). Enrollees must meet health and risk criteria (which vary by state) to be eligible for HRSN services. For example, target populations include homelessness or risk of homelessness, justice-involvement, and behavioral health needs/diagnoses.66
- In FY 2022, Connecticut implemented its Connecticut Housing Engagement and Support Services (CHESS) initiative that provides eligible enrollees with supportive housing benefits under Medicaid, coordinated with Medicaid services and non-Medicaid housing subsidies.67 Beginning July 1, 2022, Connecticut is also covering Community Violence Prevention Services to promote improved outcomes, prevent injury, reduce recidivism, and decrease the likelihood that victims of violence will commit violence themselves.68
- If approved by CMS, in FY 2023 Wisconsin plans to establish a new Section 1915(i) HCBS eligibility group of adults with certain health conditions who are experiencing homelessness and will provide these enrollees with housing support services such as housing consultation, housing transition and sustaining supports, and relocation supports.69
- Two states (Oregon and Wisconsin) reported coverage for interpretation services for enrollees with limited English proficiency (LEP). All Medicaid providers are obligated to make language services available to those with LEP; states are permitted but not required to reimburse providers for the cost of these services. Both Oregon and Wisconsin are adding reimbursement for the cost of ensuring access to interpreters in conjunction with a Medicaid-covered service.
Dental ServicesStates aim to improve oral health by expanding covered dental benefits and extending coverage to new populations. Nine states are adding comprehensive adult dental coverage,70 while additional states report expanding specific dental services for adults. Several states expanded dental services for certain populations, including pregnant individuals or people with disabilities. For example, in FY 2023, Nevada proposes to offer a limited dental benefit to adults with diabetes to address their unmet oral health needs, improve health outcomes, and lower overall costs for a population at higher risk for periodontal disease.71 A few states are adding or expanding coverage of fluoride, including three states that are adding coverage of Silver Diamine Fluoride (SDF).72 SDF is a topical agent that can be used to halt the development of cavities in children and adults.73
Just two states reported benefit restrictions in FY 2022 and no states reported such restrictions planned for FY 2023. Benefit restrictions reflect the elimination of a covered benefit, benefit caps, or the application of utilization controls such as prior authorization for existing benefits. In FY 2022, Montana eliminated its Nurse Advice Line and Oklahoma eliminated its behavioral health ACA Health Home initiative. In both states, however, public documents suggest enrollees will continue to have access to similar services. For example, Montana acknowledged increased availability of telehealth in its state plan amendment to eliminate its Nurse Advice Line.74 In Oklahoma, the Health Home population will continue to receive integrated services provided by Community Mental Health Centers (CMHCs) and through Certified Community Behavioral Health (CCBH) service delivery, as well as other care coordination models, with most Health Home providers transitioning to the CCBH model.75
Clinical Trial Participation Coverage
Historically, state Medicaid programs were not required to cover costs associated with participation in clinical trials, even if such costs were for services that Medicaid would ordinarily cover. However, as documented in a State Medicaid Director letter, the Consolidated Appropriations Act of 2021 requires states to cover routine patient costs associated with participation in qualifying clinical trials beginning January 1, 2022. These costs include any item or service (such as physician, laboratory, or medical imaging services) provided to the individual under the qualifying clinical trial that would otherwise be covered under the Medicaid state plan or Section 1115 waiver.76
Most states reported coverage of routine patient costs associated with participation in qualifying clinical trials prior to the new federal requirement. Thirty-three states (of 47 responding) indicated that at least some of these costs were covered prior to the requirement’s effective date of January 1, 2022. About one-quarter of all responding states noted operational challenges and other concerns. These included having to expand the benefit to cover additional costs (e.g., transportation and/or out-of-state coverage), increased administrative burden (e.g., new provider attestation requirements and/or the 72-hour coverage determination timeframe), and regulatory efforts (e.g., legislation, rulemaking, and/or provider manual updates needed). A small number of states reported other challenges, including difficulty identifying eligible populations and provider education and outreach needed to ensure awareness.
In Lieu of Services
States use a combination of fee-for-service and managed care arrangements to deliver care to Medicaid beneficiaries, with many services increasingly being provided by managed care organizations (MCOs). Under federal Medicaid regulations, states may allow MCOs the option to offer services or settings that substitute for those that are covered under the state plan, so long as the substitute service is determined to be medically appropriate and cost-effective.77 If an MCO opts to offer in lieu of services (ILOS), the services must be identified in the MCO contract and enrollees may not be required to use them.78 In recent years, states have increasingly used MCO “in lieu of” authority to cover services provided to nonelderly adults in “institutions for mental disease” (IMDs) that otherwise would be ineligible for federal Medicaid funding. The 2018 SUPPORT Act codified the existing Medicaid managed care regulation allowing capitation payments to include IMD services up to 15 days per month using “in lieu of” authority.
Most states reported allowing MCOs to use “in lieu of” authority to cover certain services, especially behavioral health services and services to address SDOH. Thirty-four of 39 responding MCO states indicated permitting at least one ILOS as of July 1, 2021; nearly all of these states reported that the permitted ILOS included certain behavioral health services. By far, the most commonly cited ILOS was services provided to nonelderly adults in IMDs, which are otherwise ineligible for Medicaid funding except through in lieu of or waiver authority. Some states mentioned other approved behavioral health services (including mental health and SUD services), such as mobile crisis and crisis stabilization services, outpatient treatment in lieu of hospitalization, and group or peer supports. Nearly one-third of states permitting ILOS reported that allowable ILOS include services to address SDOH, such as food and housing needs. For example, California’s Community Supports ILOS package builds on the state’s experience with Whole Person Care Pilots and includes housing transition navigation services, environmental accessibility adaptations (home modifications), asthma remediation, medically tailored meals, and sobering centers.79 Following the CMS approval of California’s Community Supports, guidance from CMS on the ILOS regulation is expected. Approximately one-quarter of states that permit ILOS reported leveraging this authority to provide coverage of HCBS, such as adult day care, homemaker services, and covered HCBS services in excess of established limits. At least one state acknowledged MCOs have been slow to take advantage of their optional ILOS authority, particularly for SDOH-related services, and the state will be evaluating updated approaches to ensure coverage in the future.
Telehealth
Context
Telehealth can be an important component of facilitating access to care for Medicaid enrollees during and beyond the COVID-19 pandemic. States have broad authority to cover telehealth in Medicaid without federal approval, including flexibilities for allowable populations, services and payment rates, providers, technology, and managed care requirements. Prior to the pandemic, the use of telehealth in Medicaid was becoming more common. However, while all states had some form of Medicaid telehealth coverage, policies regarding allowable services, providers, and originating sites varied widely;80 further, Medicaid telehealth payment policies were unclear in many states.81 To increase health care access and limit risk of viral exposure during the pandemic, all 50 states and DC expanded coverage and/or access to telehealth services in Medicaid. For example, states expanded the range of services that can be delivered via telehealth; established payment parity with face-to-face visits; expanded permitted telehealth modalities; and broadened the provider types that may be reimbursed for telehealth services. As of July 2021, most states reported covering a range of services delivered via audio-visual and audio-only telehealth in their Medicaid fee-for-service (FFS) and managed care programs.
These telehealth expansions contributed to substantial growth in Medicaid and CHIP services delivered via telehealth during the public health emergency (PHE).82 However, telehealth access may not be equally available to all enrollees. For example, research indicates that video telehealth rates have been lowest among Black, Asian, and Hispanic individuals, potentially due to more limited internet or computer access—leading researchers to conclude that “policy efforts to ensure equitable access to telehealth, in particular video-enabled telehealth, are needed to ensure that disparities that emerged during the pandemic do not become permanent.” Similarly, while telehealth has the potential to facilitate access to care for Medicaid enrollees in rural areas with fewer provider and hospital resources,83 inadequate and/or unaffordable broadband access can be a barrier. Research suggests that telehealth utilization during the pandemic has been lower for rural Medicaid enrollees versus those living in urban areas.84
This section provides information about:
- Telehealth policy adopted in response to COVID-19 (audio-only coverage)
- Telehealth utilization trends during the pandemic
- Telehealth quality and other challenges
- Permanent telehealth policy changes and key issues to watch
Findings
Telehealth POLICY ADOPTED IN RESPONSE TO COVID-19
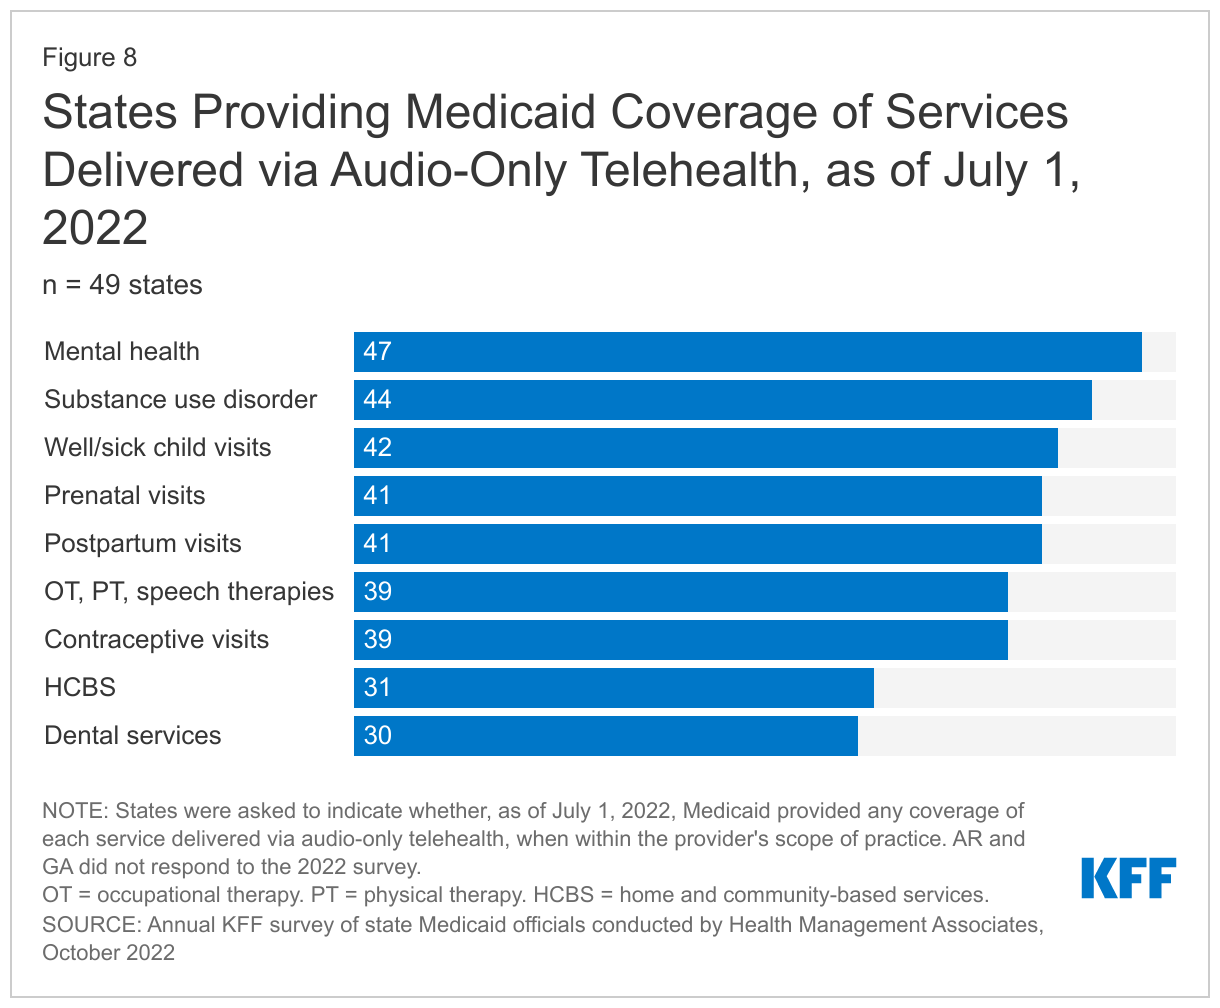
To increase health care access and limit risk of viral exposure during the pandemic, all 50 states and DC expanded coverage and/or access to telehealth services in Medicaid. Because states previously reported somewhat less coverage of audio-only telehealth and indicated that continued coverage of this modality was under consideration, on this year’s survey we asked states to report prior changes to and current coverage of audio-only telehealth.
Nearly all responding states added or expanded audio-only telehealth coverage in Medicaid in response to the COVID-19 pandemic. Twenty-eight states reported that they newly added audio-only coverage (i.e., had no audio-only Medicaid coverage prior to the pandemic) while 19 states expanded existing coverage.85 We also asked states to indicate whether, as of July 1, 2022, Medicaid provided any coverage of specified services delivered via audio-only telehealth, when within the provider’s scope of practice. For each service type, a majority of states reported providing audio-only coverage (at least sometimes) (Figure 8). In particular, nearly all states reported audio-only coverage of mental health and substance use disorder (SUD) services. States least frequently reported audio-only coverage of home and community-based services (HCBS) and dental services. Two states (Mississippi and Wyoming) reported no coverage of audio-only telehealth for the services in question.
Telehealth Utilization Trends
To better understand the impacts of telehealth policy changes during the pandemic, we asked states to report notable trends in Medicaid telehealth utilization in FY 2022 or anticipated for FY 2023. Notable trends reported included telehealth utilization over time, top services with high or increased telehealth utilization, and populations most likely to use telehealth.
States report that telehealth utilization by Medicaid enrollees has been high during the pandemic but has decreased and/or leveled off more recently. These trends are consistent with preliminary CMS data showing that per-enrollee telehealth use in Medicaid and CHIP spiked in April 2020, stabilized from June 2020 through March 2021, and has since declined (but remains substantially higher compared to the pre-PHE period).86 Many states noted that telehealth utilization trends over time correspond to COVID-19 outbreaks, with higher utilization during COVID-19 surges and lower utilization when case counts are lower. States reported that telehealth helped maintain access to care during the surges, when in-person service utilization decreased. In general, states reported that telehealth utilization was projected to continue at higher levels than before the pandemic, at least for some service categories, but at a lower level than during peak COVID-19 surges.
Behavioral health, especially mental health, remains a top category of services with high telehealth utilization across states, followed by evaluation and management (E/M) services and office/outpatient services generally. We asked states to list the top two to three categories of services that had the highest utilization in FY 2022 (we also asked states to list the top categories of services that had the greatest increase in telehealth utilization in FY 2022 compared to FY 2019; results were similar for both questions). More than three-quarters of responding states (37 of 47) reported that behavioral health services were among those with the highest utilization;87 this result is consistent with data from CMS and other sources. In particular, about half of states identified mental health services as the most utilized, particularly psychotherapy. Additionally, a majority of states reported high utilization of evaluation and management (E/M) services and/or other physician/qualified health care professional office/outpatient services, including primary care. Finally, services identified by a few states each as among those with highest utilization included: federally qualified health center (FQHC) and other clinic services; speech, hearing, occupational, and/or physical therapy; services to treat COVID-19; and case management. Four responding states indicated they did not have the requested FY 2022 telehealth utilization data available at this time.88
States reported telehealth utilization across all population groups during the pandemic, with considerable state-by-state variation in the groups with highest utilization (Figure 9). We asked states to indicate which Medicaid eligibility group was most likely to use telehealth services in FY 2022. States that responded most frequently identified ACA expansion adults as one of the groups most likely to use telehealth (about one-third of responding states), followed by children and individuals with disabilities (each identified by about one-sixth of responding states). A few states noted that within nonelderly, non-pregnant adult eligibility groups (with or without disabilities), telehealth utilization was higher among younger adults (e.g., under age 40). One-quarter of responding states reported that utilization trends by eligibility groups were unknown; several of these states noted that data analysis was planned or underway.
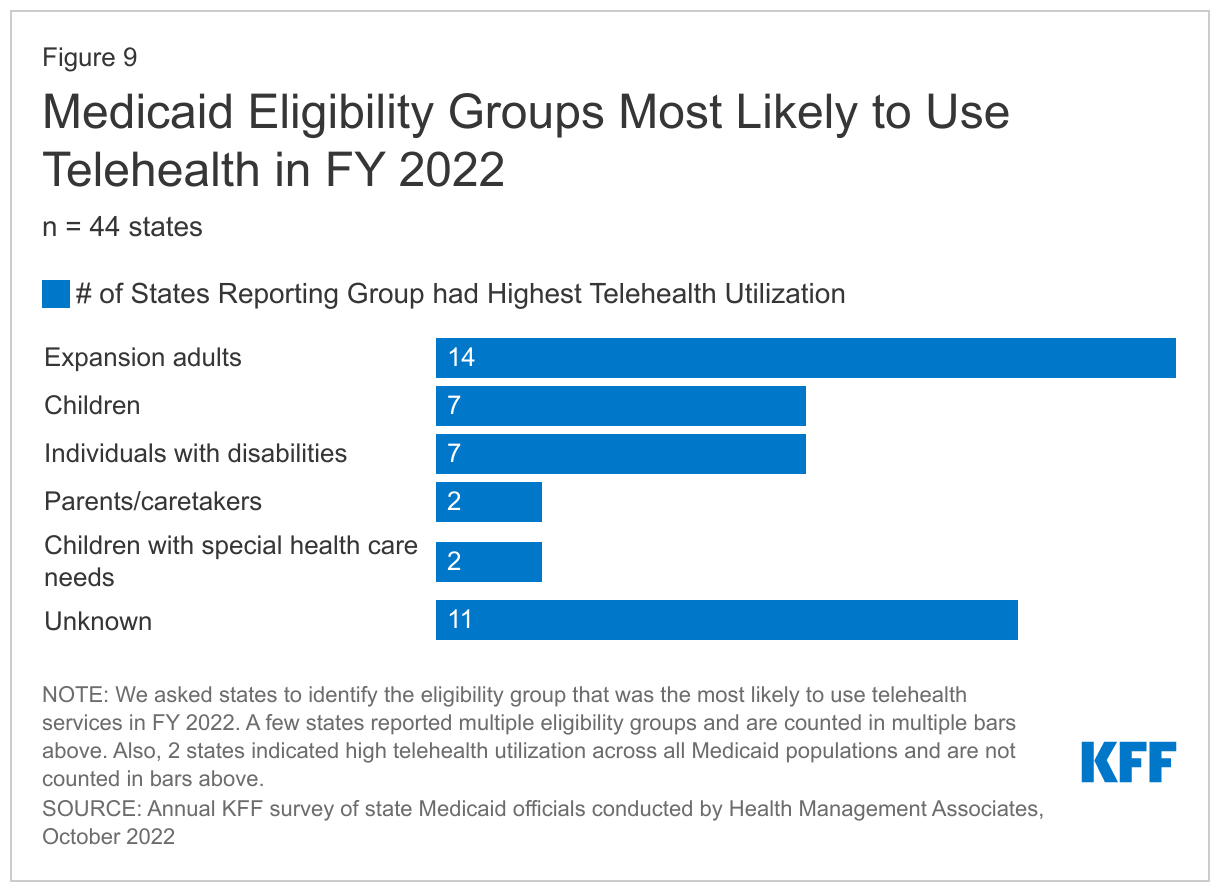
We also asked states to describe any other notable population trends in Medicaid telehealth utilization in FY 2022 or anticipated for FY 2023; just over half of states responded to this question. Among responding states, reported trends included varying telehealth utilization by:
- Geography (urban vs. rural). Six states reported that Medicaid enrollees living in urban areas were more likely to utilize telehealth compared to those living in rural areas, at least for some service categories.89 This finding is consistent with Government Accountability Office (GAO) research suggesting that telehealth utilization during the pandemic has been lower for rural Medicaid enrollees,90 who may face challenges with inadequate and/or unaffordable broadband access. In contrast, three states reported that enrollees in rural areas had higher utilization of telehealth.91
- Race and sex. Of the five states that indicated trends in telehealth utilization by race/ethnicity, all reported that utilization was higher among White enrollees compared to enrollees of color.92 Similarly, all six states that shared trends by sex indicated that telehealth utilization was higher among female versus male enrollees.93
- Health conditions. A small number of states reported that enrollees with disabilities, chronic health conditions, and/or behavioral health conditions were more likely to utilize telehealth.
Telehealth Quality and Other Challenges
Telehealth Quality: State Concerns and Initiatives
The rapid expansion of Medicaid telehealth policies and utilization during the pandemic has prompted questions about the quality of services delivered via telehealth. To fulfill a directive in the 2020 CARES Act to report on the federal pandemic response, in March 2022 the GAO released a report that analyzed states’ experiences with telehealth in Medicaid and evaluated state and federal oversight of quality of care and program integrity risks.94 In the report, the GAO raised concerns about the impact of telehealth delivery on quality of care for Medicaid enrollees and recommended that CMS collect information to assess these effects and inform state decisions; CMS acknowledged but has not yet acted on these recommendations. Further, the Bipartisan Safer Communities Act signed into law in June 2022 directs the agency to issue guidance to states on options and best practices for expanding access to telehealth in Medicaid, including strategies for evaluating the impact of telehealth on quality and outcomes.95 Given this federal interest in the quality of care delivered via telehealth, we asked states to list concerns related to telehealth quality and to describe recent or planned initiatives to assess telehealth quality in Medicaid.
More than three-quarters of responding states reported questions and/or concerns about the quality or clinical effectiveness of services delivered via telehealth. We asked states to list their top two to three concerns in this area; common areas of top concern included:
- Concerns about the quality of diagnoses when delivered via telehealth as well as the impact of telehealth on receipt of other services, most commonly preventive services (such as immunizations and screenings, for children and adults). For example, North Carolina reported concerns about potential delayed diagnoses should virtual care replace in-person visits, rendering vitals or full clinical examinations not possible. States also noted concerns about the quality of telehealth visits for maternity care, behavioral health care, dental services, and services for children.
- Concerns that audio-only telehealth may be less effective than in-person visits or audio-visual telehealth. Several states noted a lack of adequate data to assess the effectiveness of audio-only services. In some cases, these concerns about audio-only quality have resulted in limitations to coverage or payment of this modality, or states are considering such limitations in the future.
- Concerns that inadequate access to all forms of telehealth may negatively and inequitably impact quality of care, resulting in disparities and/or hampering continuity of care. States also emphasized the importance of ensuring that members always have a meaningful choice of receiving services in-person if that is their preference.
Additional reported quality concerns included: privacy (e.g., that lack of privacy may inhibit quality of engagement in treatment), billing and coding challenges, and the potential for fraud and abuse. Many states also acknowledged the need for more data on the effectiveness of telehealth services compared to in-person modalities, as well as data on telehealth quality for particular services or conditions.
Most states have implemented or are planning initiatives to assess telehealth quality, though many report ongoing considerations and uncertainty over how to effectively evaluate quality. When asked to describe initiatives to assess telehealth quality, two-thirds of states reported that such initiatives were in place or planned. States report a range of initiatives to collect, analyze, and/or publish data related to telehealth quality, including data from member or provider surveys and utilization data. Several states indicated they also planned to use demographic data to understand which members use telehealth and evaluate potential impacts on equity. Several states are partnering with universities or other external partners to collect and analyze telehealth utilization and quality data. Additionally, a few states report working with providers to better understand and address telehealth quality, such as collecting provider feedback and issuing coding guidance to help the state differentiate telehealth services in its encounter data. A few states emphasized that their evaluations will inform future telehealth policy decisions. Examples of state initiatives to assess telehealth quality in Medicaid include:
- Arizona included supplemental telehealth questions in its 2021 Consumer Assessment of Healthcare Providers and Systems (CAHPS) survey. Findings included that most members viewed services delivered via phone or video telehealth as about the same or better quality than in-person services. Additionally, most members reported no privacy concerns during telehealth visits and indicated that telehealth technology was easy to use.96 Similarly, Maine added a telehealth section to its annual CAHPS survey and North Carolina stratifies CAHPS results by the telehealth-utilizing population to understand their satisfaction compared to others.
- State legislation in Maryland directed the state’s Health Care Commission to submit a report in December 2022 that evaluates the impact of telehealth on service utilization and quality, which will include Medicaid data. The report will include an assessment of patient satisfaction with telehealth and a review of the appropriateness of telehealth across the continuum of care. The goal of the report is to inform policy decisions on coverage of and payment for services delivered via telehealth.
- Massachusetts reported evaluating member experiences with telehealth as well as utilization data to better understand how telehealth is complementing in-person services. The state is seeking opportunities to utilize standard quality metrics to better understand the quality of services delivered via telehealth. The Medicaid agency is also partnering with external researchers to better understand telehealth utilization, qualitative member experience, and disparities in telehealth utilization among enrollees by social risk factors.
- In addition to conducting stakeholder surveys, South Carolina has hired additional staff to improve oversight and monitoring and understand any differences in service quality between telehealth and in-person services.
State Initiatives to Address Other Telehealth Challenges
States report undertaking many different Medicaid and cross-agency initiatives to mitigate telehealth-related challenges. In 2021, states reported a range of telehealth challenges faced by members, providers, and the state Medicaid agency, including access to internet and technology and the need for education and outreach. This year, we asked states to describe any initiatives in place or planned for FY 2023 to mitigate challenges with outreach/education, program integrity/fraud, broadband access, technology availability, or equity of access. In response, more than two-thirds of responding states (33 of 48) reported an initiative in at least one of the specified areas. About half of all responding states reported outreach/education initiatives, while just under half of states reported initiatives in each of the other areas (Exhibit 6). Some initiatives were Medicaid-specific, whereas others were broader and might utilize other funding, such as by connecting enrollees to grant programs to facilitate access to technology and broadband. Five states (Arizona, Colorado, Maine, Nebraska, and New Hampshire) reported plans to use ARPA funding to address telehealth challenges.97 Several states reported statewide initiatives to address telehealth challenges across the health care system. For additional examples, see Exhibit 6.
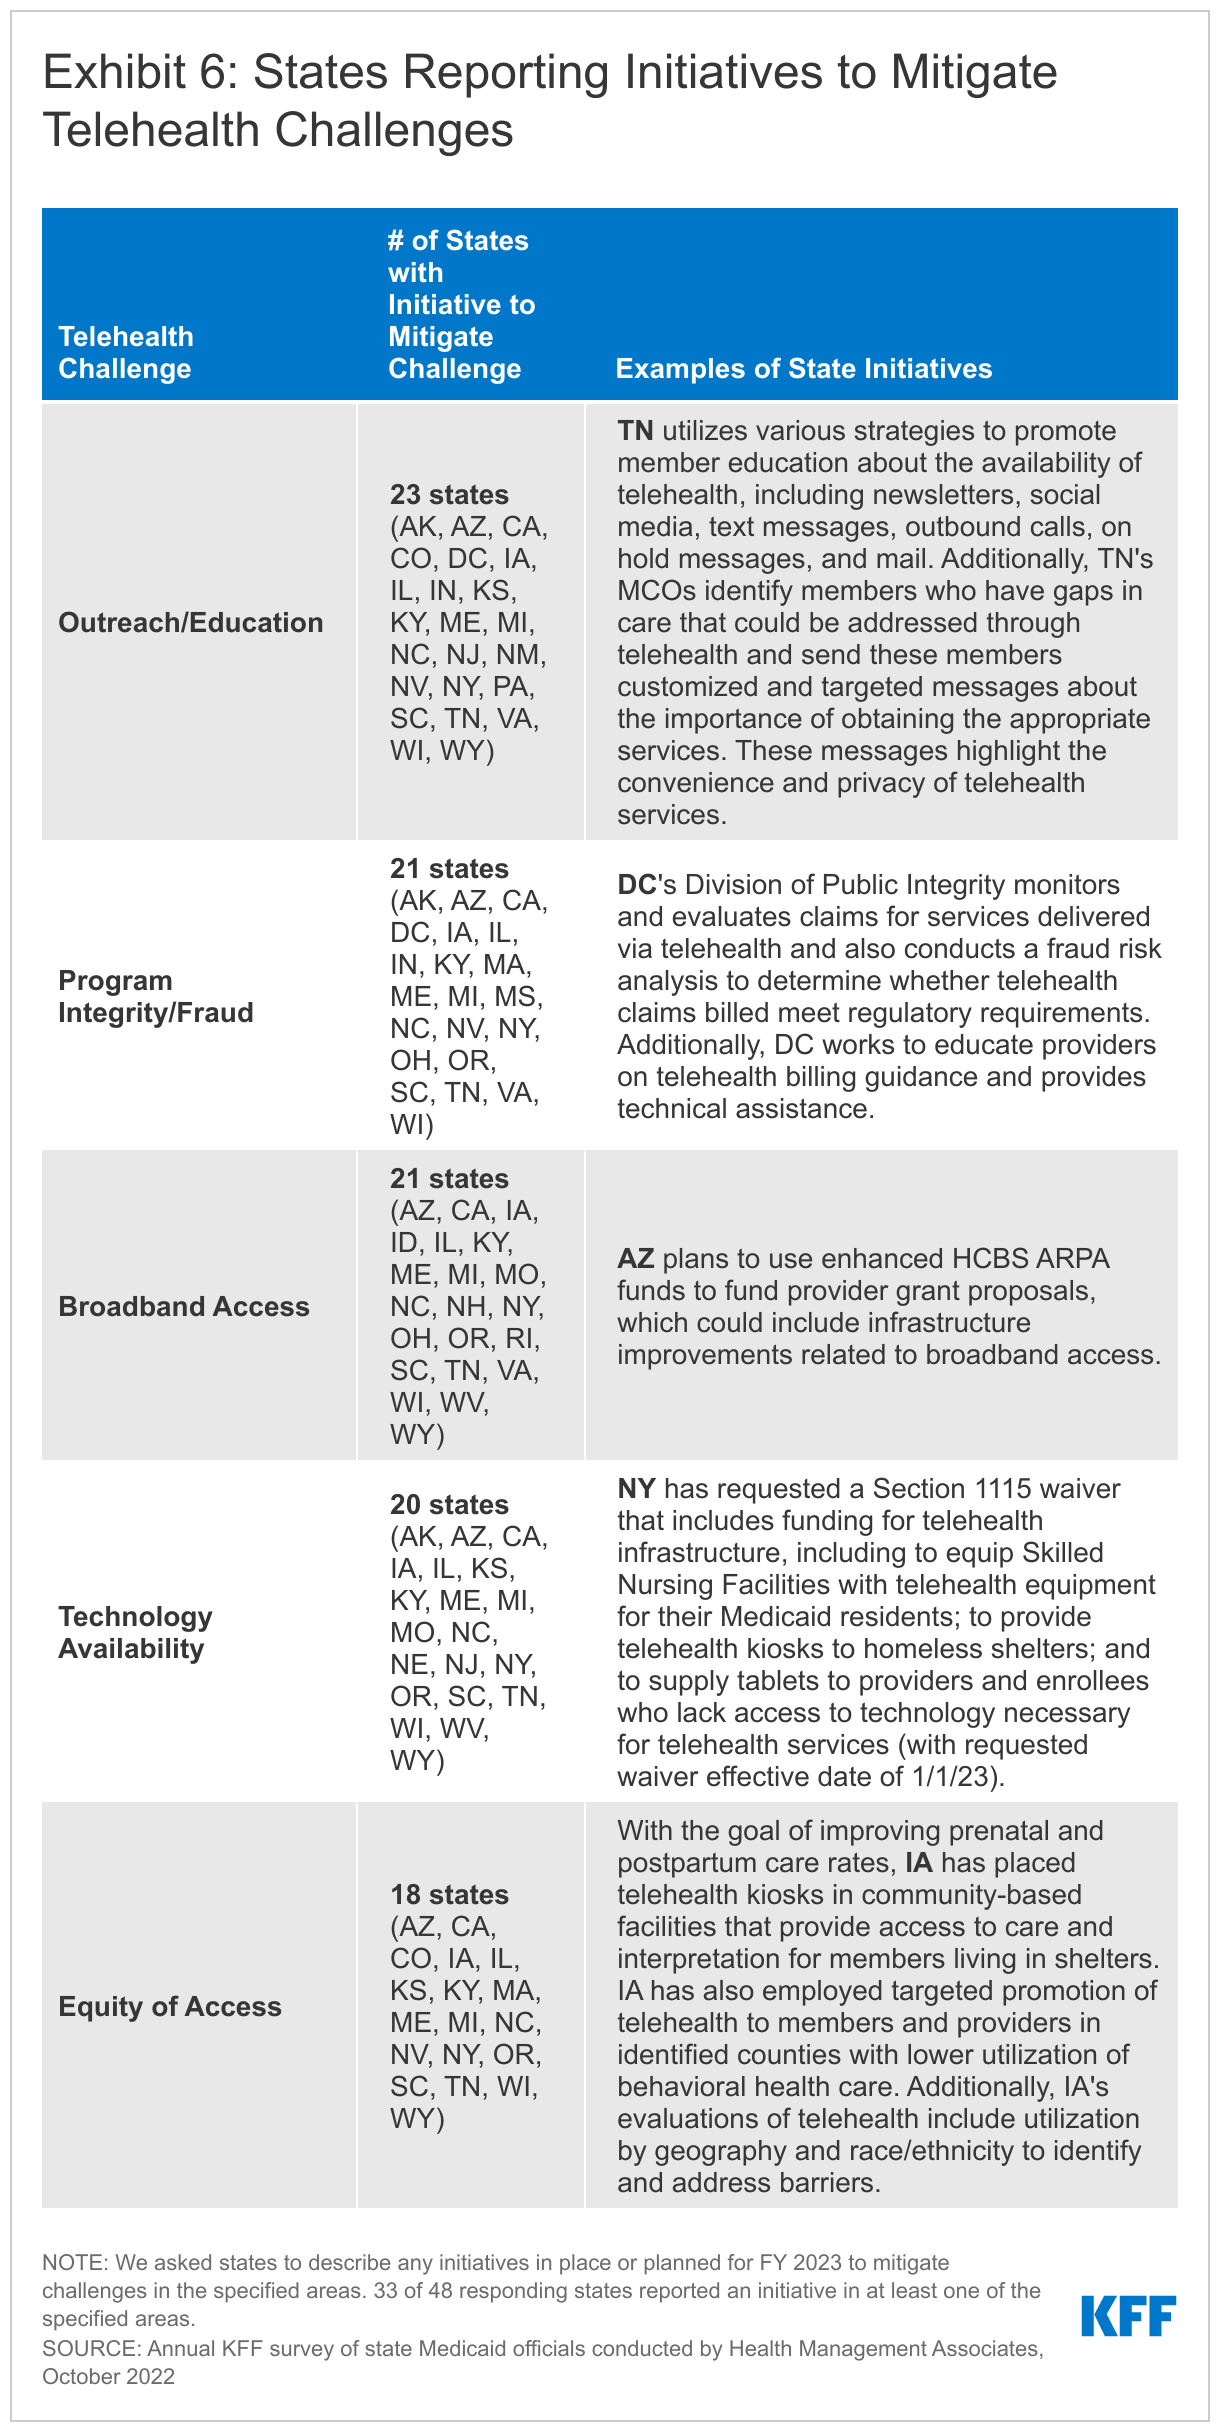
Permanent Telehealth Policy Changes and Key Issues to Watch
During the COVID-19 pandemic, many states used temporary Medicaid emergency authorities to expand telehealth coverage and also took advantage of broad authority to further expand telehealth without the need for CMS approval. As discussed above, these policy expansions resulted in high telehealth utilization across populations, though many states have raised concerns about the quality of telehealth visits as well as the need to address other telehealth challenges. Looking ahead, permanent telehealth policies are under consideration in many states, as states weigh expanded access against quality, equity, program integrity, and other concerns. In 2021, most states reported that future changes to telehealth policies were undetermined, though some states had already implemented permanent expansions, especially to allow telehealth for behavioral health services, and a few had already implemented limitations to pandemic-era telehealth policy (e.g. to limit coverage of or payment parity for audio-only). This year, we asked states to report expansions and limitations to fee-for-service (FFS) telehealth policies implemented in FY 2022 or planned for FY 2023, and to describe such changes and key considerations.
Most states have or plan to adopt permanent Medicaid telehealth expansions that will remain in place even after the pandemic, though some are considering guardrails on such policies. Two-thirds of responding states reported expansions to FFS telehealth policies implemented in FY 2022 and/or planned for FY 2023, including permanent (i.e., non-emergency) adoption of telehealth policy expansions that were initially enacted during the pandemic on a temporary basis. One-quarter of states reported limitations to telehealth policies that had been temporarily expanded during the pandemic (Figure 10).
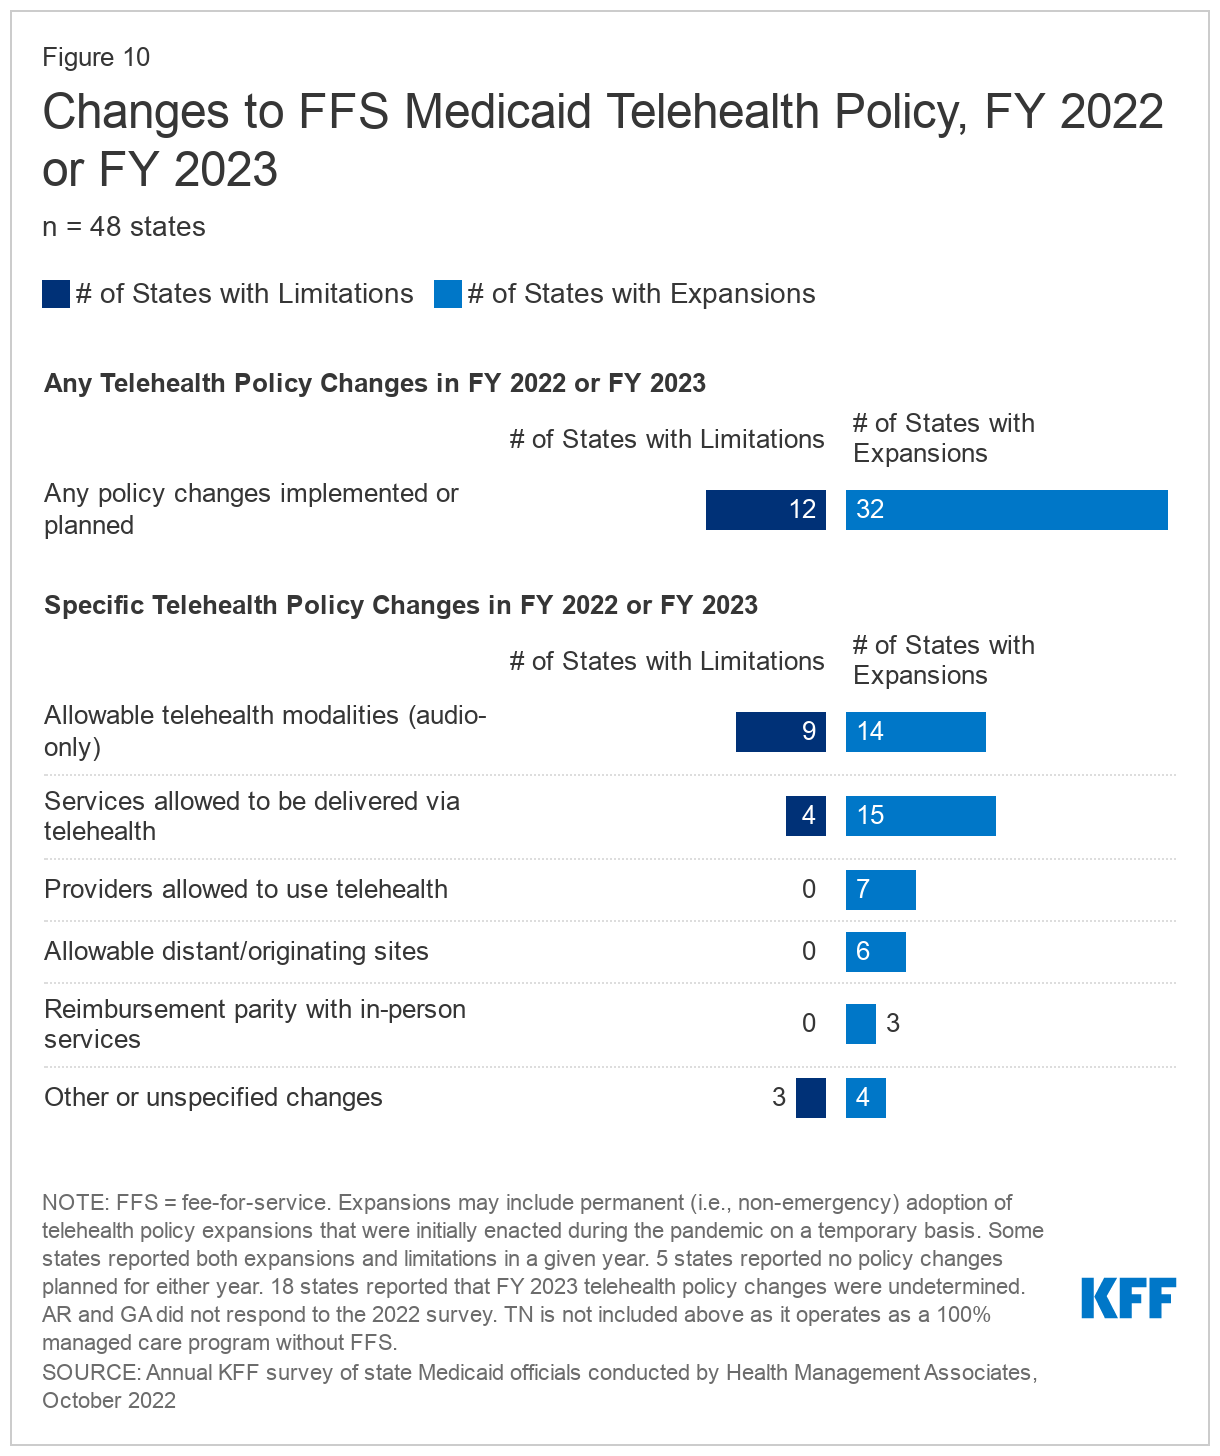
Reported changes in FY 2022 or 2023 include expansions or limitations to:
- Allowable modalities. States most commonly report making changes to allowable telehealth modalities, either to permanently add or to limit audio-only telehealth. For example, in New York audio-only telehealth is currently authorized during the PHE and pending regulations will make this coverage permanent. Many states noted that expanded audio-only coverage is crucial to maintain access to care, especially in rural areas and for older populations; however, some states are also particularly concerned about the clinical effectiveness and quality of audio-only visits. For example, after the PHE, Michigan will largely eliminate coverage of audio-only services, but will keep some audio-only codes, such as for behavioral health counseling, to provide continued access for individuals with limited broadband.
- Allowable services. Many states report permanently expanding services allowed to be delivered via telehealth. For example, in FY 2023 Ohio expanded its telehealth coverage policy to include pregnancy education, diabetes management, and behavioral health services.98 A smaller number of states are eliminating telehealth coverage of specific services. For example, after considering utilization, clinical evidence, and stakeholder input, South Carolina will no longer cover telehealth delivery of certain behavioral health services after the PHE ends; however, the state will extend telehealth coverage of other services (including addiction-related services, physical and speech therapy, and well-child visits and EPSDT) for one-year post-PHE for further evaluation.99
- Allowable providers. States report permanent expansions of provider types allowed to utilize telehealth, such as to allow out-of-state providers. For example, July 2022 state legislation in Alaska makes several emergency telehealth policies permanent, including allowing out-of-state providers.100 Effective April 2022, Texas began allowing rural health clinic providers to receive facility fee reimbursement for services delivered via telehealth.101 (No states reported limiting allowable provider types in either year.)
- Allowable originating sites. States report permanent expansions of originating site policies to allow patients to receive services via telehealth from their homes. For example, several states adopted place of service code 10 to identify services provided in the enrollee’s home via telehealth. (No states reported limiting allowable originating sites in either year.)
- Reimbursement parity. In 2021, all responding states indicated that they ensured payment parity between telehealth and in-person delivery of FFS services (as of July 1, 2021), which may have been under emergency policy; this year, most states reported no changes in FY 2022 or FY 2023 to parity requirements. A small number of states reported that in FY 2022 or FY 2023 they established telehealth payment parity on a permanent basis. For example, Rhode Island state legislation enacted in July 2021 requires Medicaid telehealth coverage and payment parity,102 thus making permanent emergency flexibilities originally established in a 2020 executive order.103
Additionally, a few states that reported no changes in either year noted that they had already adopted permanent telehealth expansions in FY 2020 or 2021. For example, Mississippi previously made some emergency telehealth flexibilities permanent, but opted to continue allowing other flexibilities only during a state of emergency (including audio-only telehealth). Also, 18 states reported that FY 2023 telehealth policy changes were undetermined, with common areas of consideration including allowable services, modalities, payment parity, and/or other guardrails. For example, Delaware aims to keep most current flexibilities in place, but is considering requiring an in-person component for certain services. Delaware also plans to submit a SPA to remove telehealth from the State Plan and thus gain more flexibility in making telehealth policy decisions, as CMS considers telehealth to be a modality rather than a benefit.
Nearly all responding states that contract with managed care organizations (MCOs) reported that changes to FFS telehealth policies would also apply to MCOs. Several states noted that though they require MCOs to follow minimum FFS telehealth requirements, MCOs could opt to have a more expansive telehealth policy.
Looking ahead, key issues that may influence future Medicaid telehealth policy decisions include analysis of data, state legislation and federal guidance, and cost concerns. In addition to the implemented/planned expansions and limitations described above, many states reported that they remained undetermined about some or all potential telehealth policy changes in FY 2023 and beyond. For example, states hope that ongoing and future analyses of telehealth data—including utilization data, quality data, and feedback from members and providers—can help to inform policy decisions. Additionally, many states reported ongoing state legislative activity related to telehealth policy, including potential expansions and limitations that would apply to Medicaid—for example, one state referred to telehealth as “legislative sport.” States also await guidance from the federal government, including from CMS, related to HIPAA, and Medicare policies. While a small number of states report that budgetary concerns may impact telehealth policy due to increased service utilization, other states noted that telehealth has not substantially increased costs. Several states noted that telehealth policies related to FQHCs were under review, as such telehealth visits may be particularly costly given the prospective payment system (PPS) model unique to these providers. Finally, states reported that they are focused on protecting member choice: ensuring that enrollees have access to high-quality telehealth if preferred, but that they are not forced or pressured to use telehealth if they would rather receive services face-to-face.
Provider Rates And Taxes
Context
In general, states have broad latitude under federal laws and regulations to determine fee-for-service (FFS) provider payments so long as the payments: are consistent with efficiency, economy, and quality of care; safeguard against unnecessary utilization; and are sufficient to enlist enough providers to ensure that Medicaid beneficiaries have access to care that is equal to the level of access enjoyed by the general population in the same geographic area.104 Subject to certain exceptions,105 states are not permitted to set the rates that managed care entities pay to providers. However, state-determined FFS rates remain important benchmarks for MCO payments in most states, often serving as the state-mandated payment floor.
Historically, FFS provider rate changes generally reflect broader economic conditions. During economic downturns where states may face revenue shortfalls, states have typically turned to provider rate restrictions to contain costs. Conversely, states are more likely to increase provider rates during periods of recovery and revenue growth. Early in the COVID-19 pandemic, however, states were largely deterred from using rate reductions to address budget challenges due to the financial strains that providers were experiencing from the increased costs of COVID-19 testing and treatment or from declining utilization for non-urgent care. Instead, Congress, states, and the Administration adopted a number of policies to ease financial pressure on states, hospitals, and other health care providers, including enhanced Medicaid matching funds for states – tied to the Public Health Emergency (PHE) – and enhanced funding for home and community-based services (HCBS) (that remains available for expenditure through March 21, 2025) designed to bolster rates and the direct care workforce.
States have considerable flexibility in determining how to finance the non-federal share of state Medicaid payments, within certain limits. In addition to state general funds appropriated directly to the state Medicaid program, most states also rely on funding from health care providers and local governments generated through provider taxes, intergovernmental transfers (IGTs), and certified public expenditures (CPEs). Over time, states have increased their reliance on provider taxes, with expansions often driven by economic downturns.
This section provides information about:
- FFS reimbursement rates
- Provider taxes
Findings
FFS Reimbursement Rates
At the time of the survey, responding states had implemented or were planning more FFS rate increases than rate restrictions in both FY 2022 and FY 2023 (Figure 11 and Tables 3 and 4). All responding states in FY 2022 (49 states) and all but one responding state in FY 2023 (48 of 49), reported implementing rate increases for at least one category of provider. Significantly fewer states (19 in FY 2022 and 25 in FY 2023), had implemented or were planning to implement at least one rate restriction.
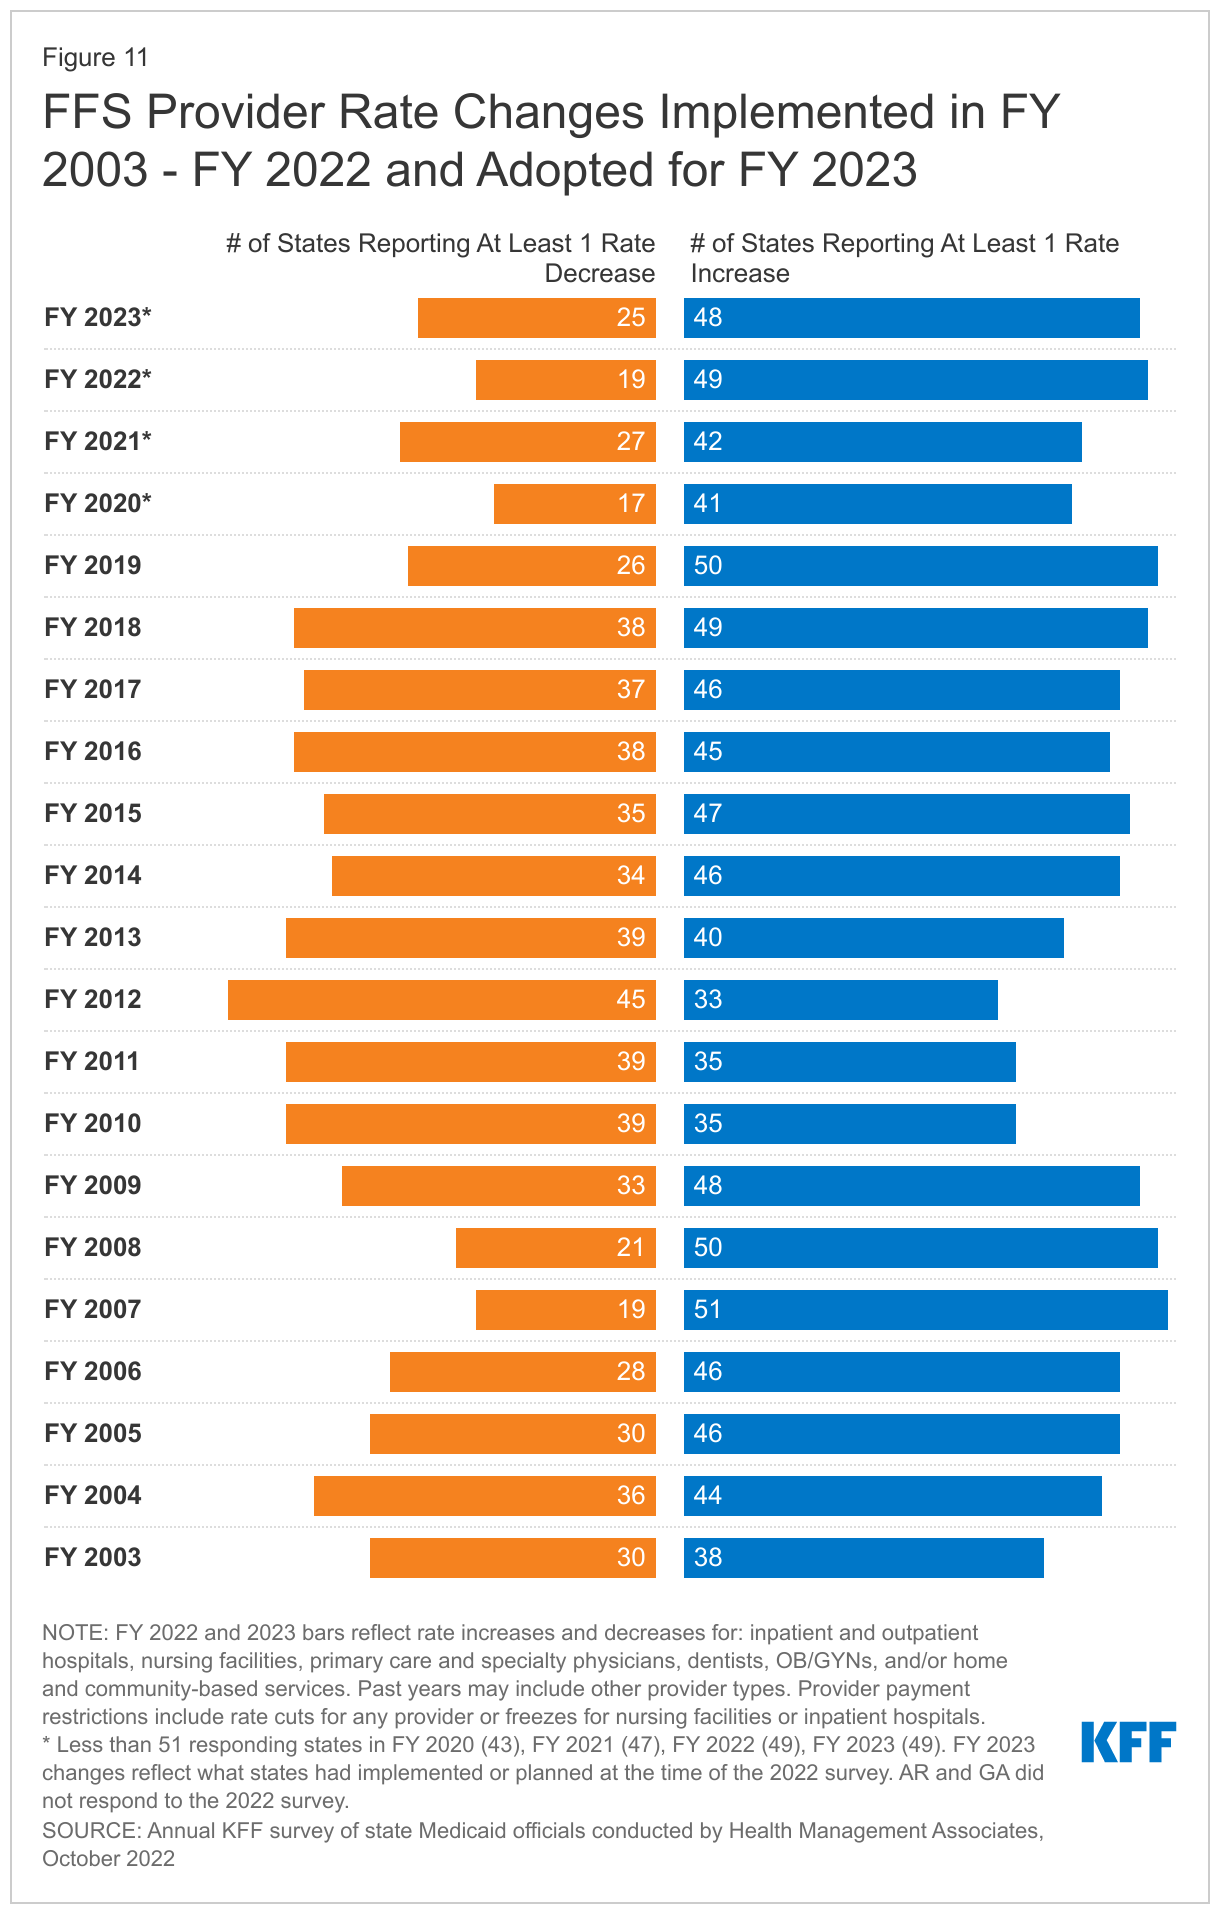
Many states noted that worsening inflation in recent months and workforce shortages driving higher labor costs were resulting in growing calls from providers and others for rate increases. Some states noted, however, that their FY 2023 budgets do not account for current inflation levels, as they were introduced in late calendar year 2021 and early 2022 before inflation began to dramatically accelerate, but that inflation remains a concern looking ahead. Many states also noted that they employ cost-based reimbursement methodologies for some provider types, such as nursing facilities, that automatically adjust for inflation and other cost factors during the rate setting process. A number of states reported that rates for some provider types are benchmarked to Medicare rates and therefore increase commensurate with Medicare increases. Finally, several states reported comprehensive rate reform analyses impacting multiple provider types had been completed or were underway. For example:
- Alabama reported that it was in the process of putting an access assessment process into place that would include rate reassessments every three to five years in alignment with the assessment process.
- Indiana reported plans to initiate “rate matrix” work, starting first with home health and HCBS waiver rates. The goal of this long-term project, in part, is to establish a regular cadence of rate updates by provider category.
- As a result of a comprehensive rate system analysis, first initiated in 2019, Maine is implementing its Rate System Reform plan in FY 2023. The plan calls for the utilization of Medicare benchmarks across services, where available; review and update of methodologies and rates on a regular schedule; and continued movement away from cost-based methodologies and toward value-based payments.
- New Mexico is currently conducting a Provider Rate Benchmarking Study to further the goals of ensuring access to high-quality care for its members; attracting and retaining providers; and establishing a methodology, process, and schedule for conducting routine rate reviews.
- South Carolina reported that it is currently conducting rate analyses for several services that could result in additional rate increase recommendations in FY 2023.
States reported rate increases for nursing facilities and home and community-based services (HCBS) providers more often than other provider categories (Figure 12). In some cases, state officials reported that nursing facility and HCBS rate increases included, at least in part, the continuation of pandemic-related payments (e.g., retainer payments and/or add-on payments) or represent temporary rate increases or supplemental payments to HCBS providers using ARPA funds. Some states noted that certain rate increases would be difficult to sustain without continuation of enhanced federal funding. Reflecting the ongoing staffing-related challenges impacting nursing facility and HCBS services, several states reported more significant nursing facility or HCBS rate increases. Examples of HCBS rate increases include the following:
- The District of Columbia reported that, beginning in FY 2023, the District will begin to issue a supplemental payment to qualifying HCBS providers to support increased wages for qualifying Direct Support Professionals (DSPs) to achieve an average wage rate of 117.6% of the District’s living/minimum wage by FY 2025. This supplemental payment aims to assist in the effort of maintaining the direct support workforce to ensure continuity of care.
- Oklahoma reported making a temporary 20% retroactive rate increase in FY 2022 for HCBS services paid during most of the PHE period and a 25% permanent rate increase for providers in its Advantage HCBS waiver (for frail seniors and adults with physical disabilities) effective October 1, 2022, or upon CMS approval.
- West Virginia reported a temporary 50% HCBS rate increase to improve retention in FY 2022 and a permanent 5% HCBS rate increase in FY 2023.
Examples of nursing facility rate increases include the following:
- Illinois reported a 27% nursing facility rate increase in FY 2023 to fund the recently enacted nursing home reform legislation that ties increased funding to staffing levels, creates a new pay scale for certified nursing assistants, and provides funding for improvement in key quality metrics.
- Nebraska reported a 20.2% nursing facility rate increase in FY 2023 intended to address the ongoing issue of facility closures in rural and frontier areas where the population is declining.
- Pennsylvania will increase Medicaid nursing facility rates by 17.5% in FY 2023 to increase staffing and accountability requirements, an increase described as the “single largest Medicaid reimbursement bump for nursing home resident care during a single Pennsylvania budget-cycle in the modern reimbursement era” by the Pennsylvania Health Care Association President.106
The 2022 survey found an increased focus on dental rates with about half of reporting states (20 in FY 2022 and 25 in FY 2023) reporting implementing or plans to implement a dental rate increase, in some cases benchmarked to the American Dental Association national fee survey. This compares to 14 states reporting increases each year in the 2019, 2020, and 2021 surveys.107 Most notably, Virginia reported plans to increase dental rates by 30% in FY 2023; Washington increased rates for adult dental services by 100% in FY 2022 and plans to increase rates for specific children’s dental services in FY 2022; and Wisconsin increased dental rates by 40% as of January 2022.
While states reported imposing more restrictions on inpatient hospital and nursing facility rates than on other provider types, most of these restrictions were rate freezes rather than actual reductions. (Because inpatient hospital and nursing facility services are more likely to receive routine cost-of-living adjustments than other provider types, this report counts rate freezes for these providers as restrictions.) No states reported legislative action to freeze or reduce rates across all or most provider categories in either FY 2022 or FY 2023. Mississippi indicated the legislative rate freeze enacted for all providers for FY 2022 through FY 2024 was lifted by the legislature before the end of 2022.
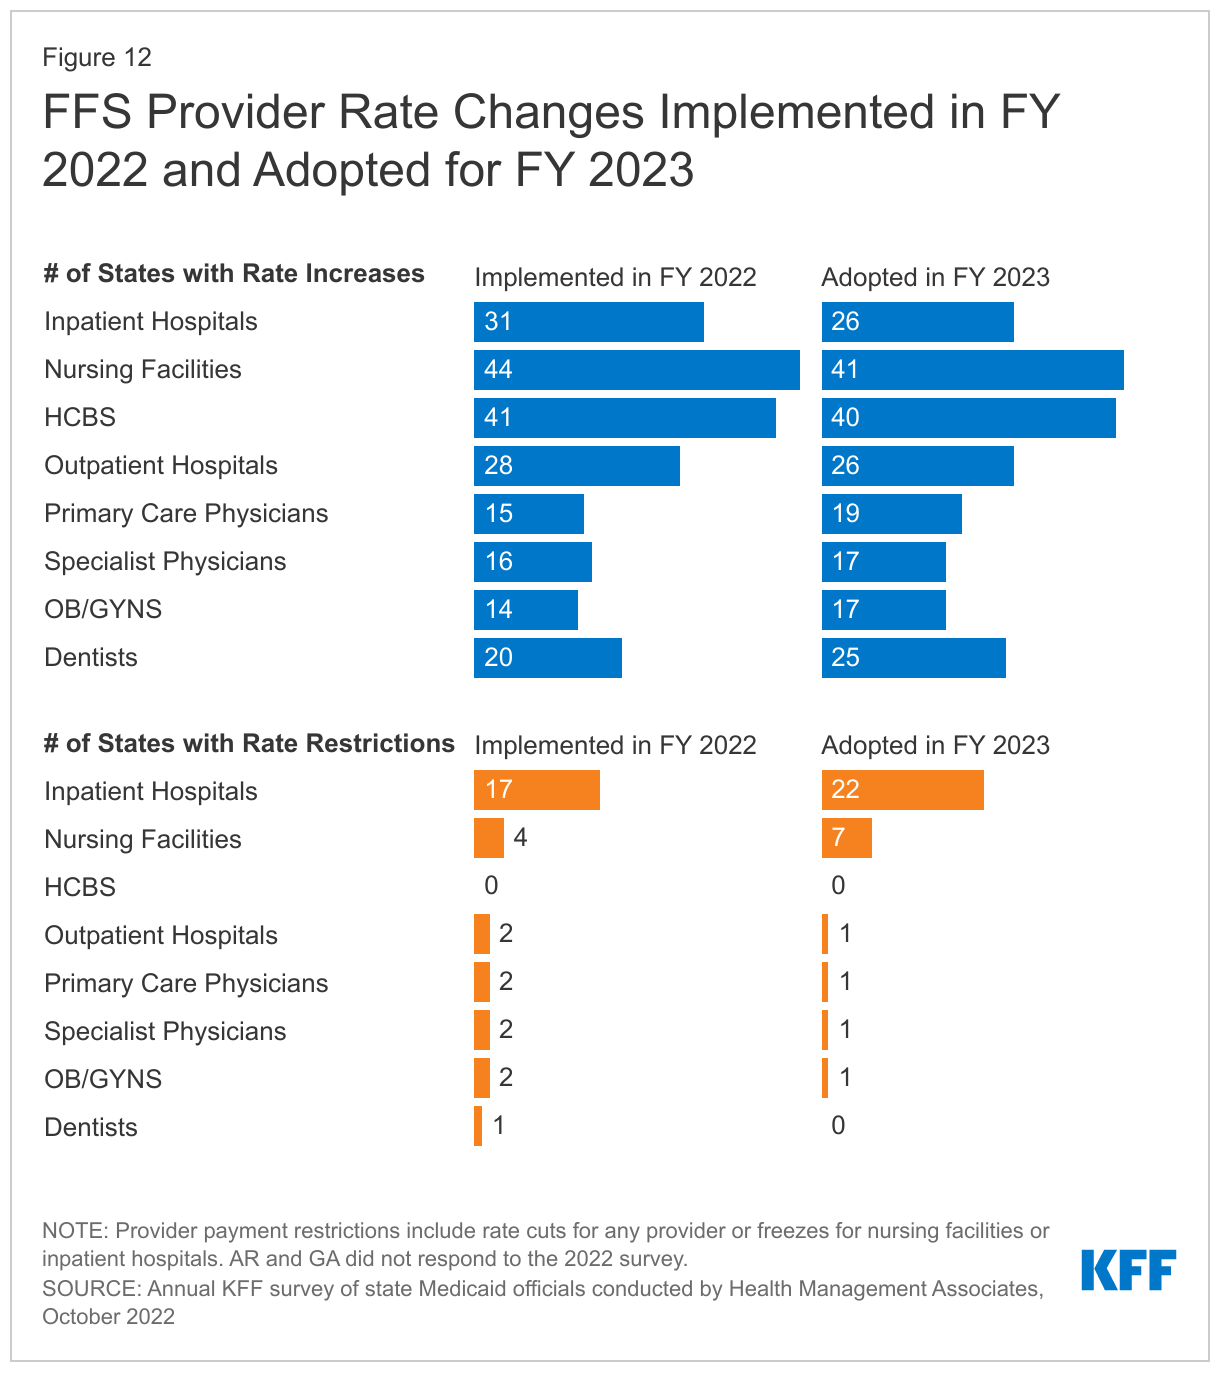
Provider Taxes
States continue to rely on provider taxes and fees to fund a portion of the non-federal share of Medicaid costs (Figure 13). Provider taxes are an integral source of Medicaid financing, comprising approximately 17% of the nonfederal share of total Medicaid payments in FY 2018 according to the Government Accountability Office (GAO).108 At the beginning of FY 2003, 21 states had at least one provider tax in place. Over the next decade, most states imposed new taxes or fees and increased existing tax rates and fees to raise revenue to support Medicaid. By FY 2013, all but one state (Alaska) had at least one provider tax or fee in place. In this year’s survey, states reported a continued reliance on provider taxes and fees to fund a portion of the non-federal share of Medicaid costs. Thirty-eight states had three or more provider taxes in place in FY 2022 and eight other states had two provider taxes in place (Figure 13).109
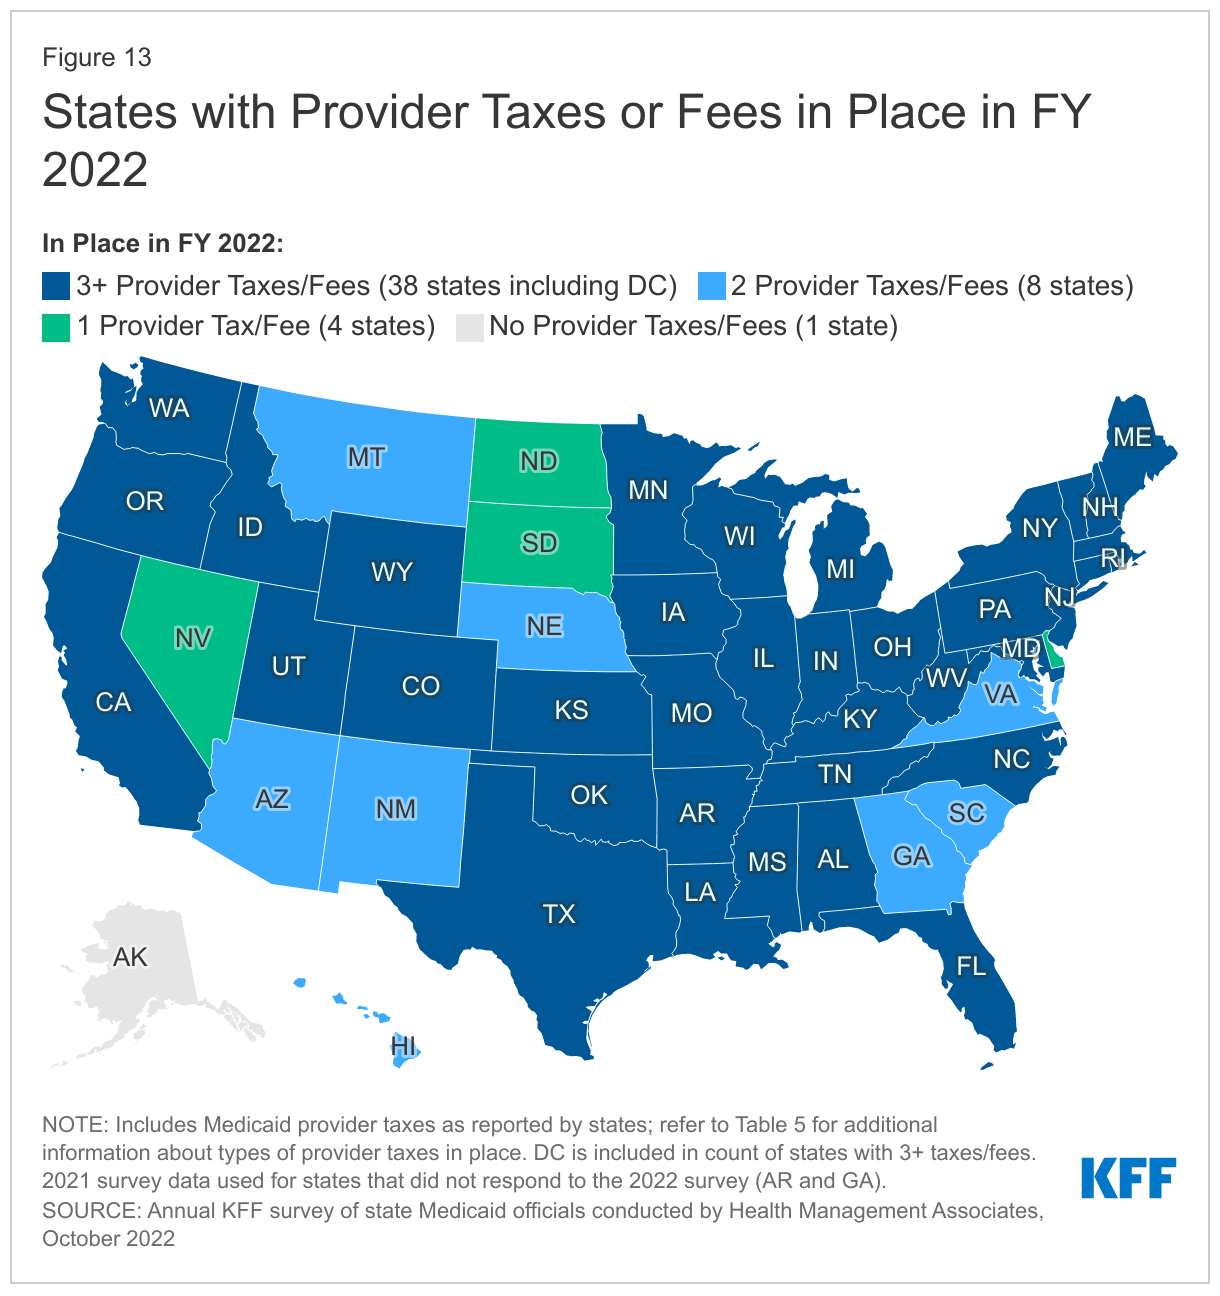
Few states made or are making significant changes to their provider tax structure in FY 2022 or FY 2023 (Table 5). The most common Medicaid provider taxes in place in FY 2022 were taxes on nursing facilities (46 states), followed by taxes on hospitals (44 states), intermediate care facilities for individuals with intellectual disabilities (33 states), and MCOs110 (18 states). Only three states reported plans to add new taxes in FY 2023: Alabama, Mississippi, and Wyoming reported new ambulance taxes. Taxes on ambulance providers represent the most common type of “other” taxes implemented by states, and the new taxes planned for FY 2023 will increase the number of states with ambulance taxes in FY 2023 to 13.111 Only one state (California) reported plans to eliminate a tax in FY 2023 (MCO tax is slated to expire on December 31, 2022). Eleven states reported planned increases to one or more provider taxes in FY 2023, while seven states reported planned decreases.112
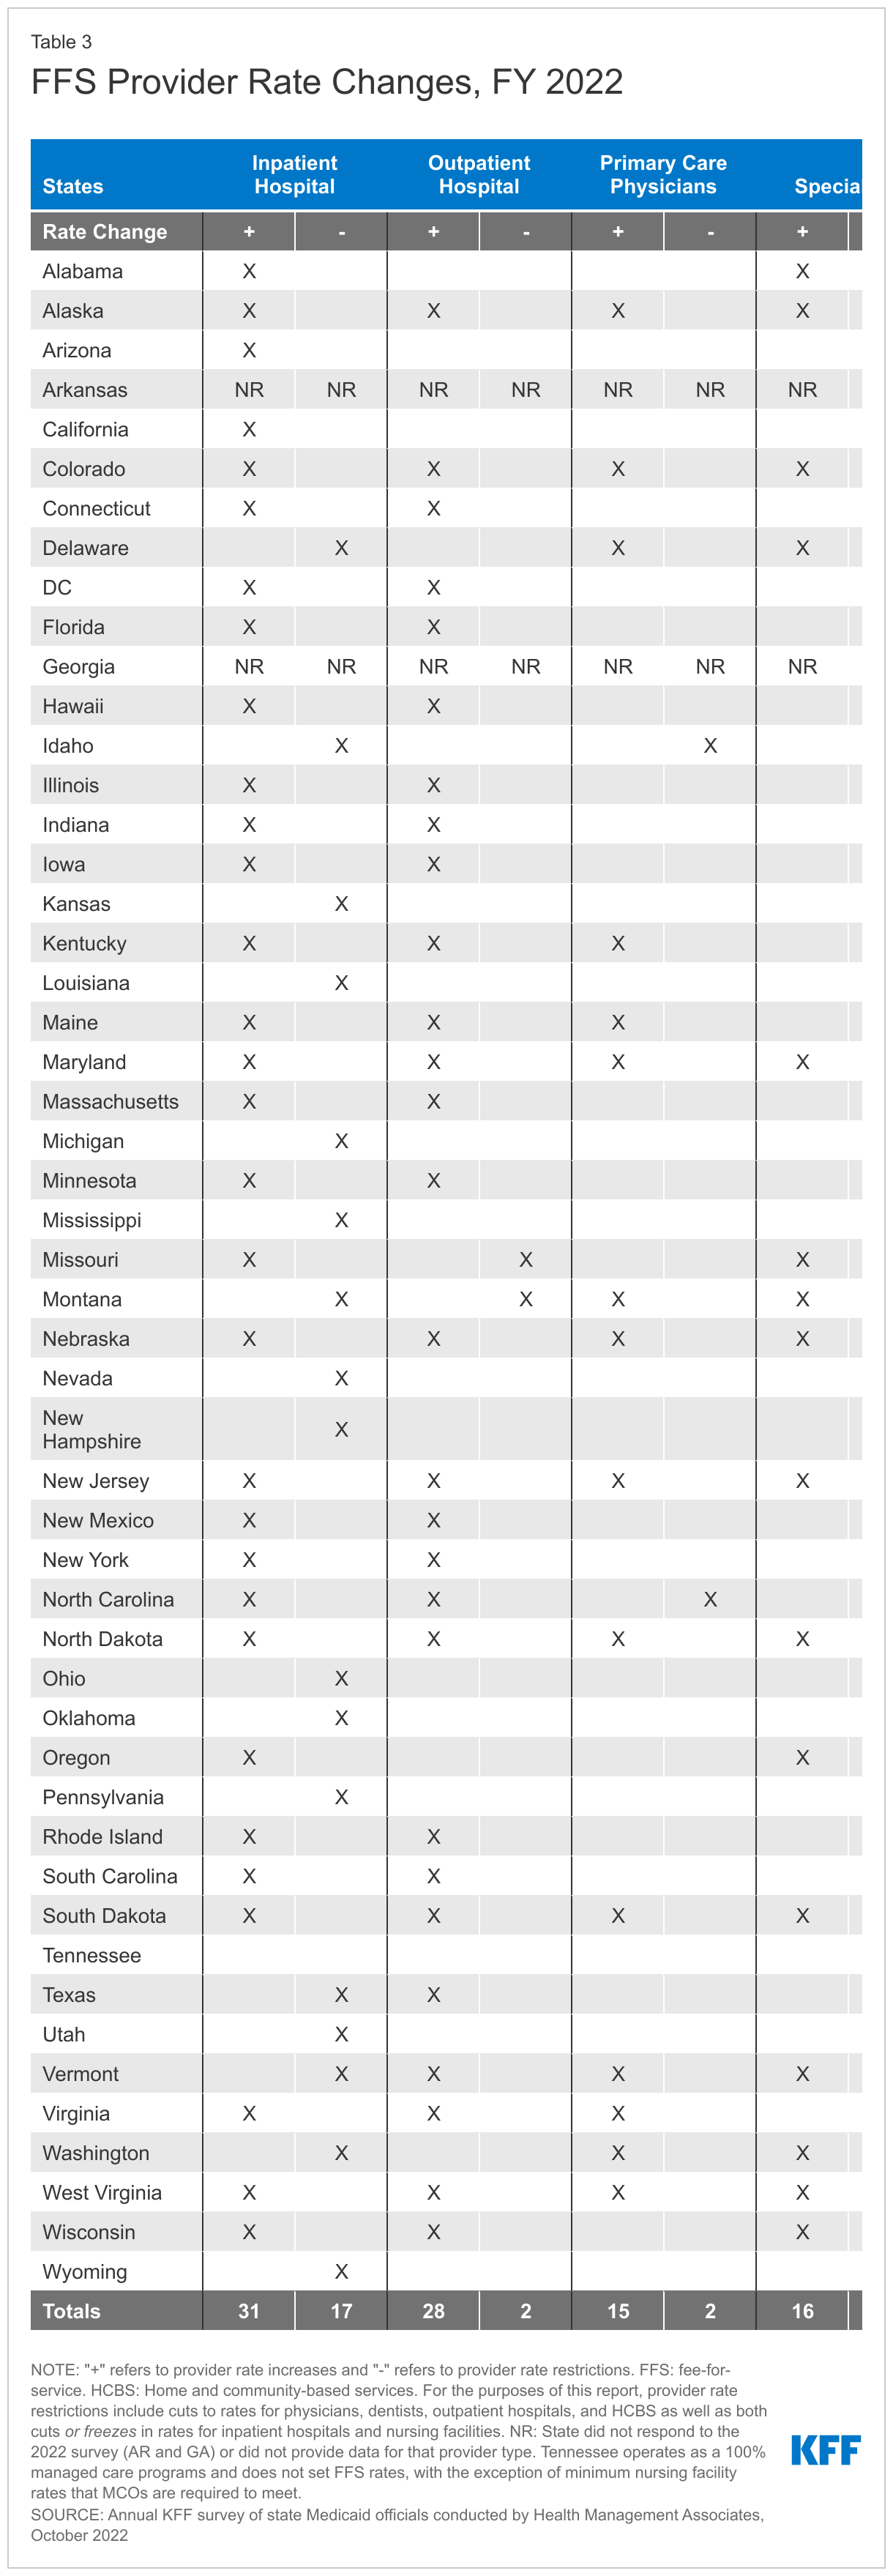
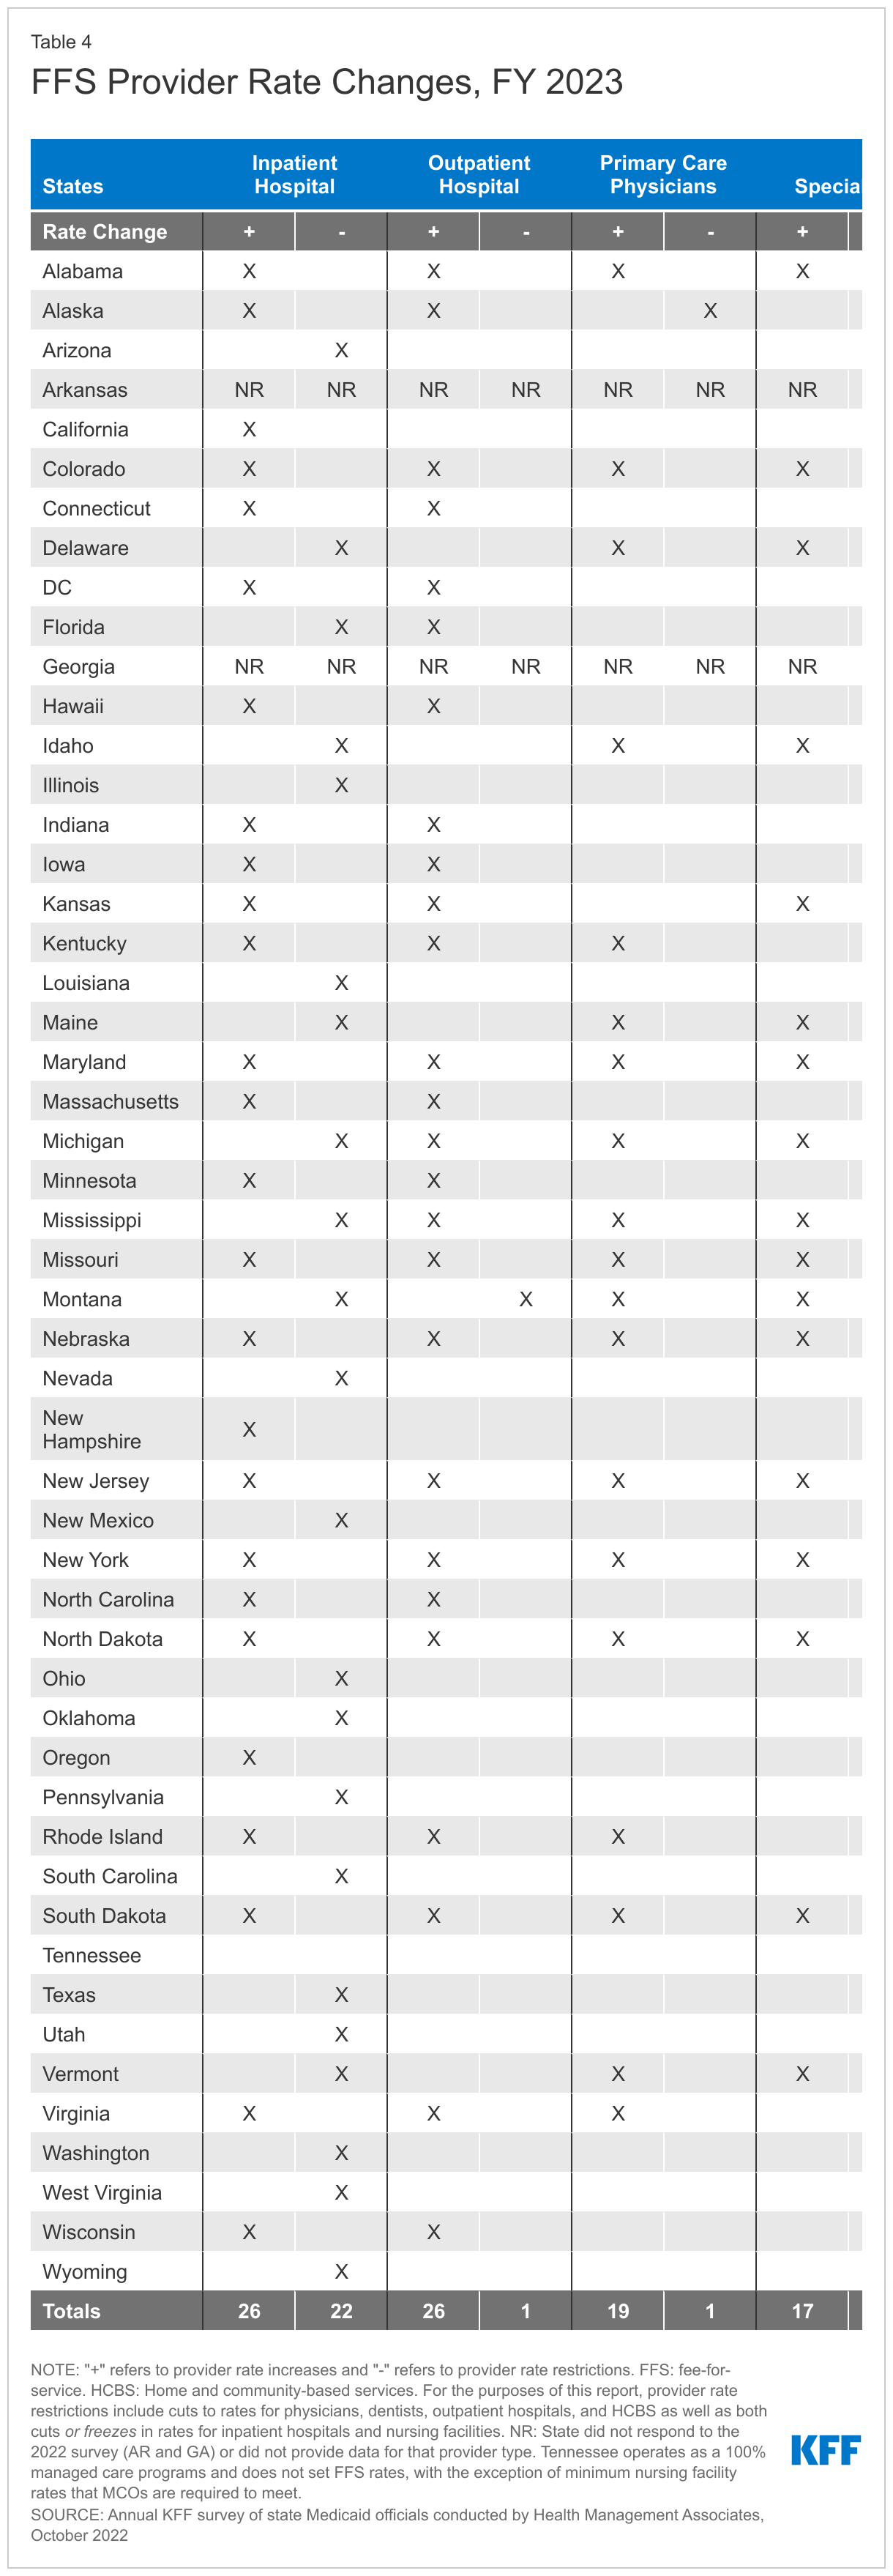
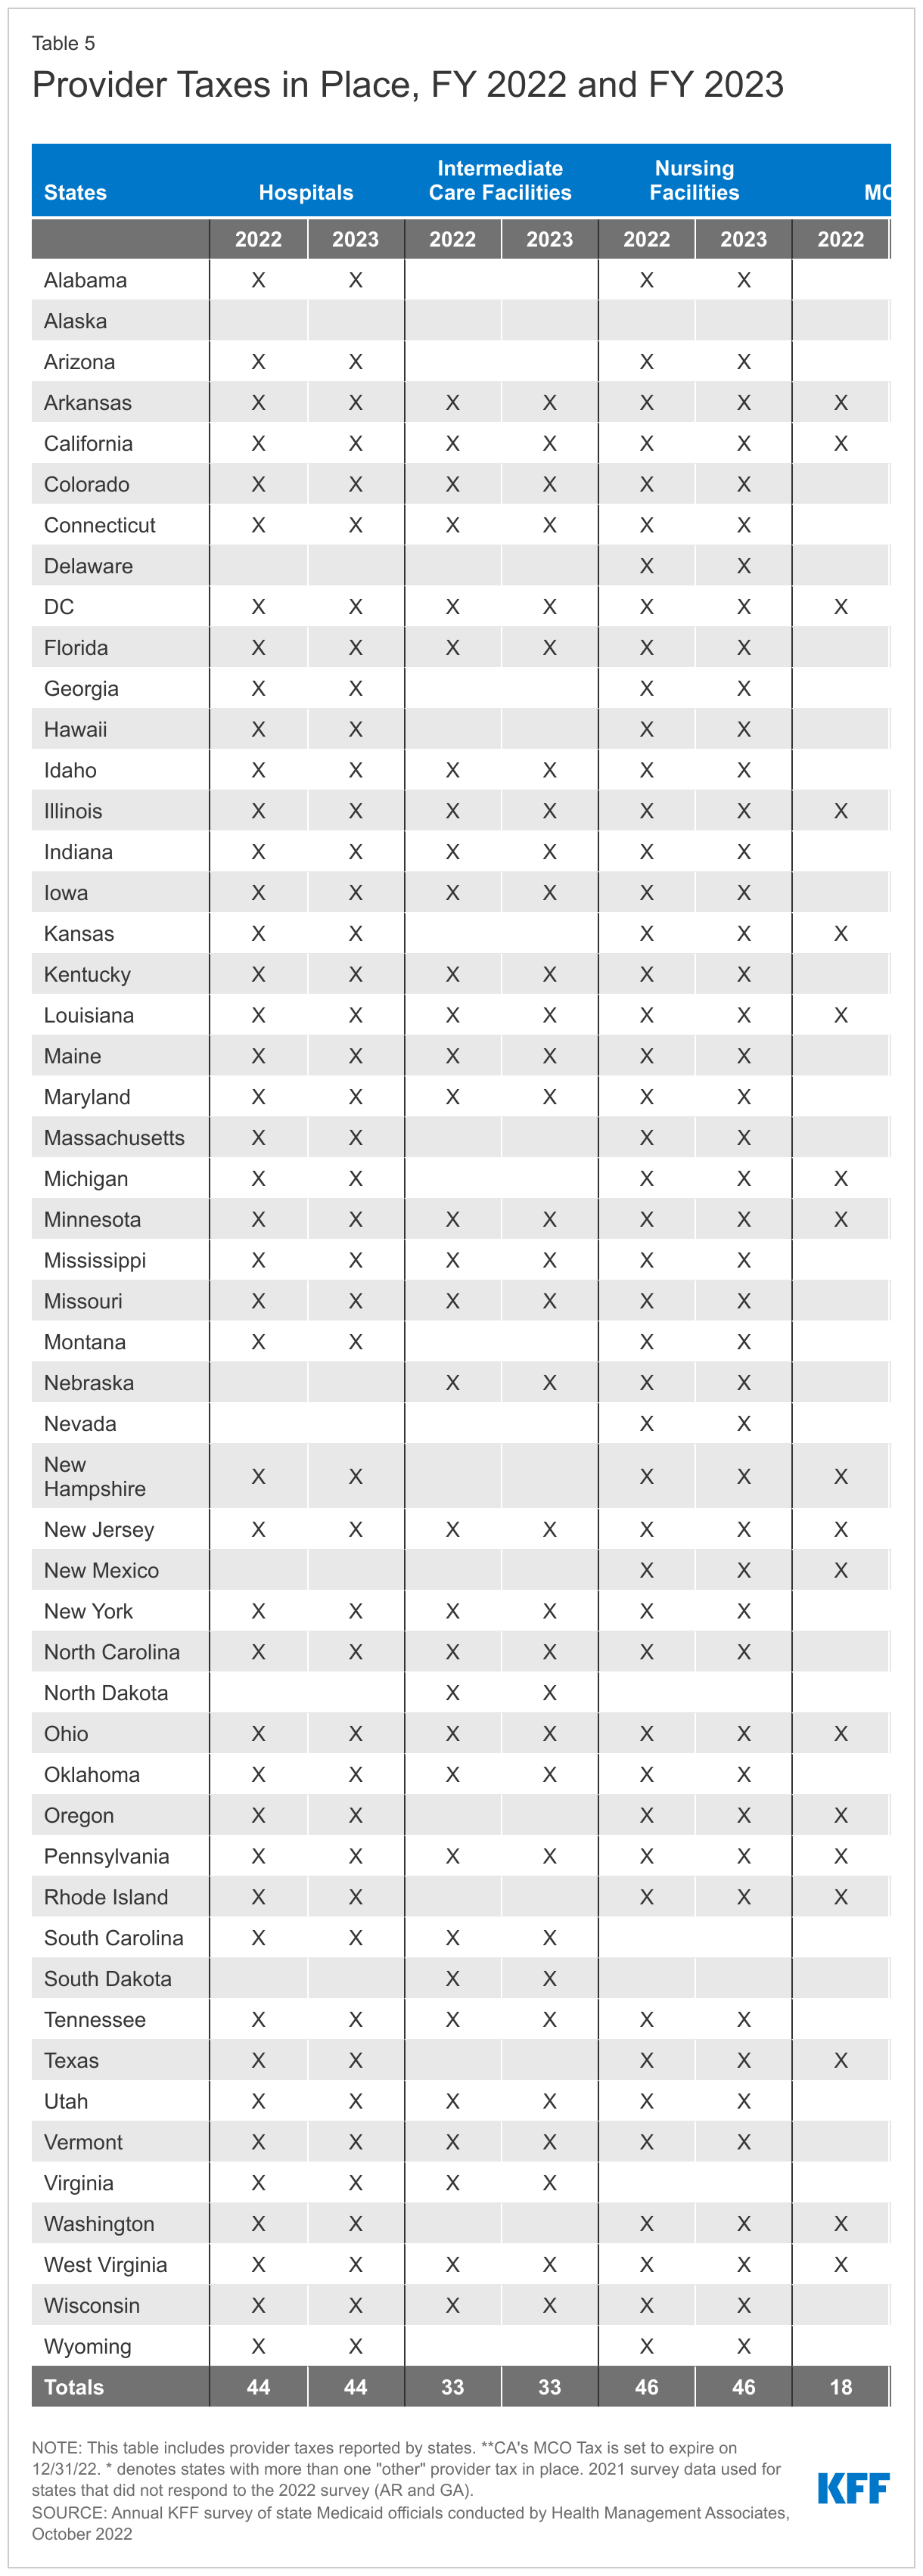
Pharmacy
Context
States may administer the Medicaid pharmacy benefit on their own or may contract out one or more functions to other parties. The administration of the pharmacy benefit has evolved over time to include delivery of these benefits through managed care organizations (MCOs) and increased reliance on pharmacy benefit managers (PBMs). PBMs may perform a variety of administrative and clinical services for Medicaid programs (e.g., negotiating rebates with drug manufacturers, adjudicating claims, monitoring utilization, overseeing preferred drug lists (PDLs), etc.) and are used in fee-for-service (FFS) and managed care settings. MCO subcontracts with PBMs are under increasing scrutiny as more states recognize a need for transparency and stringent oversight of the arrangements.
Managing the Medicaid prescription drug benefit and pharmacy expenditures is a policy priority for state Medicaid programs. Despite remaining stable from 2015 to 2019, net Medicaid spending on prescription drugs increased in 2020. At the same time, Medicaid prescription drug utilization declined in 2020, reflecting the impact of the COVID-19 pandemic on prescription drug patterns. Because state Medicaid programs are required under the Medicaid Drug Rebate Program (MDRP) to cover all FDA-approved drugs from manufacturers that have entered into a federal rebate agreement (in both managed care and FFS settings), states cannot limit the scope of covered drugs to control drug costs. Instead, states use an array of payment strategies and utilization controls to manage pharmacy expenditures, including PDLs, managed care pharmacy carve-outs, and multi-state purchasing pools. States update and expand cost containment strategies in response to changes in the pharmaceutical marketplace, continuously innovating to address pressures such as rising unit prices and the introduction of new “blockbuster” drugs.113 Certain policies traditionally implemented under the pharmacy benefit are being adopted under the medical benefit to better manage the cost and utilization of expensive, physician administered drugs. Some states are also using alternative payment methods to increase supplemental rebates through value-based arrangements (VBAs) negotiated with individual pharmaceutical manufacturers.
The recent passage of the Inflation Reduction Act included a number of prescription drug reforms that primarily apply to Medicare; however, some of the provisions interact with the MDRP and are expected to increase Medicaid prescription drug spending in the coming years.114 There remain an array of other federal and state policy drug pricing proposals that address rising Medicaid prescription drug spending and generate federal or state savings. These proposals could be included in future budget reconciliation bills and include provisions that increase Medicaid drug rebates, increase price transparency, and target drug prices.
This section provides information about:
- Managed care’s role in administering pharmacy benefits
- Pharmacy cost containment
Findings
Managed Care’s Role in Administering Pharmacy Benefits
Most states that contract with MCOs carve in Medicaid pharmacy benefits to MCO contracts, but some states “carve out” prescription drug coverage from managed care. While the vast majority of states that contract with MCOs report that the pharmacy benefit is carved in to managed care (34 out of 41 states that contract with MCOs115 ), six states (California, Missouri, North Dakota, Tennessee, Wisconsin, and West Virginia) report that pharmacy benefits are carved out of MCO contracts as of July 1, 2022 (Figure 14). As of January 1, 2022, California carved the pharmacy benefit out of managed care, becoming the latest state to implement a full pharmacy carve out. Two states report plans to carve out pharmacy from MCO contracts in FY 2023 or later (New York and Ohio116 ), with the original implementation date having been delayed in New York.117 Instead of implementing a traditional carve-out of pharmacy from managed care, in FY 2022, Kentucky began contracting with a single PBM for the managed care population. Under this “hybrid” model, MCOs remain at risk for the pharmacy benefit but must contract with the state’s PBM to process pharmacy claims and pharmacy prior authorizations according to a single formulary and PDL.118 Louisiana and Mississippi119 report that they are moving to a similar model in FY 2023 and FY 2024, respectively, and will require MCOs to contract with a single PBM designated by the state.
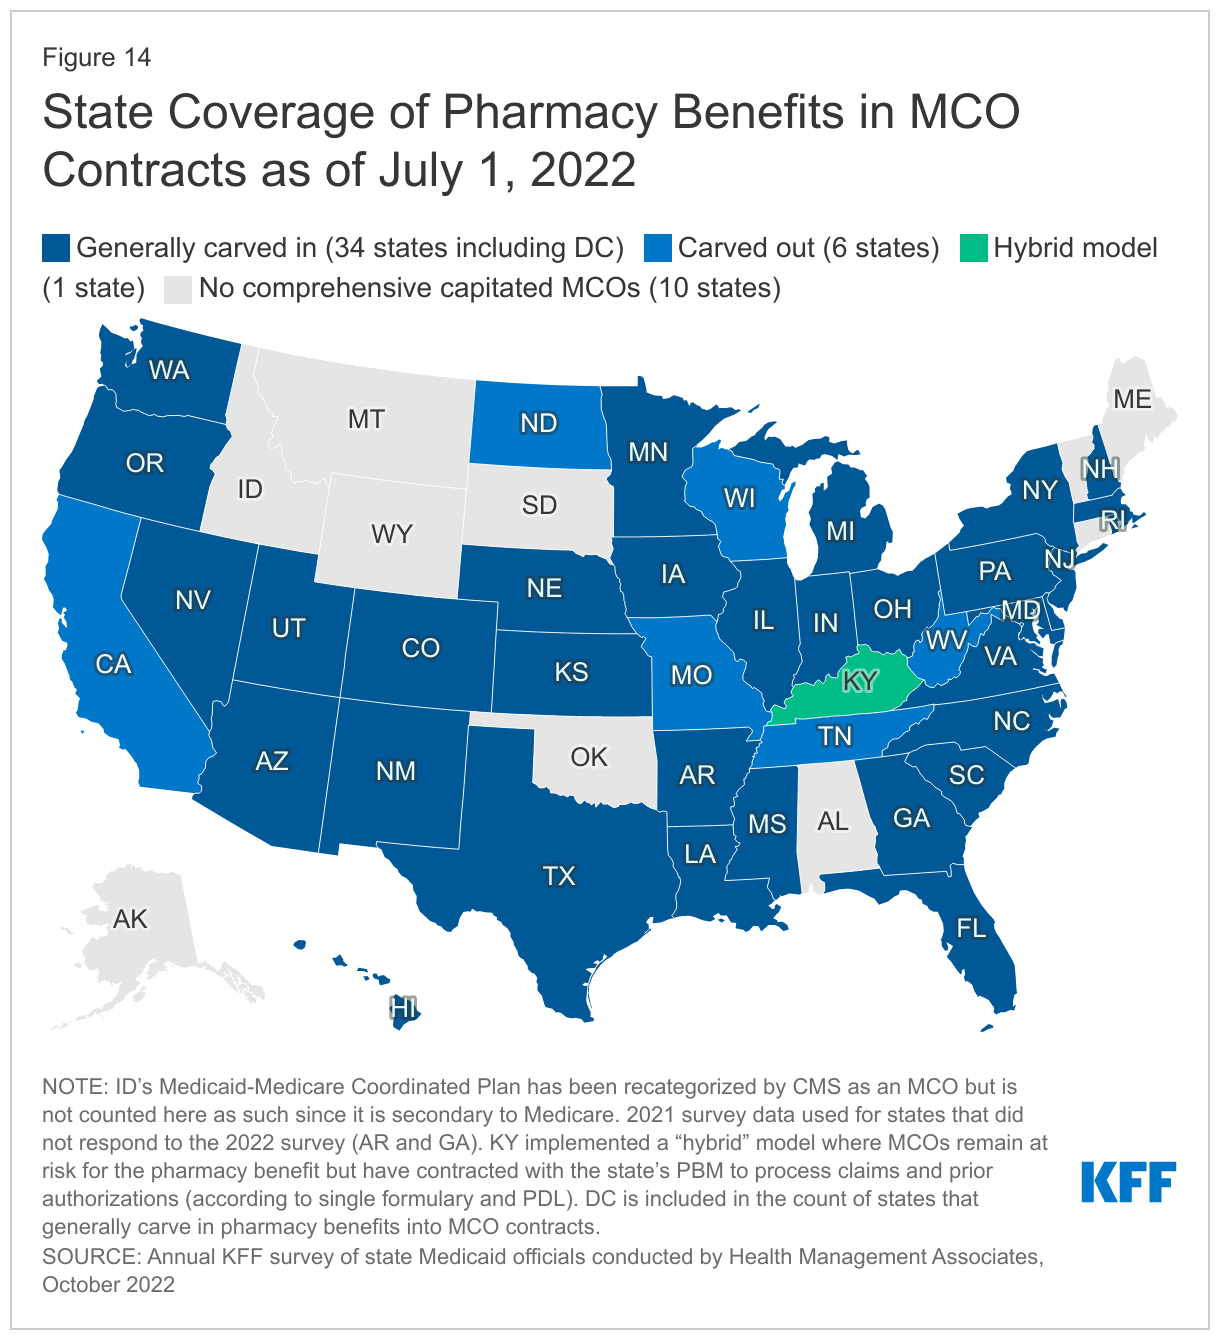
The majority of states that contract with MCOs report targeted carve-outs of one or more drugs or drug classes. As of July 1, 2022, 18 of 39 responding states that contract with MCOs report carving out one or more drug classes from MCO capitation payments (Exhibit 7). These targeted drug carve-outs can include drugs covered under the pharmacy benefit or the medical benefit. Some of the most commonly carved out drugs include hemophilia products, spinal muscular atrophy agents, Hepatitis C drugs, and behavioral health drugs such as psychotropic medications. States may use targeted drug carve-outs as part of MCO risk mitigation strategies or for other reasons, including beneficiary protection.
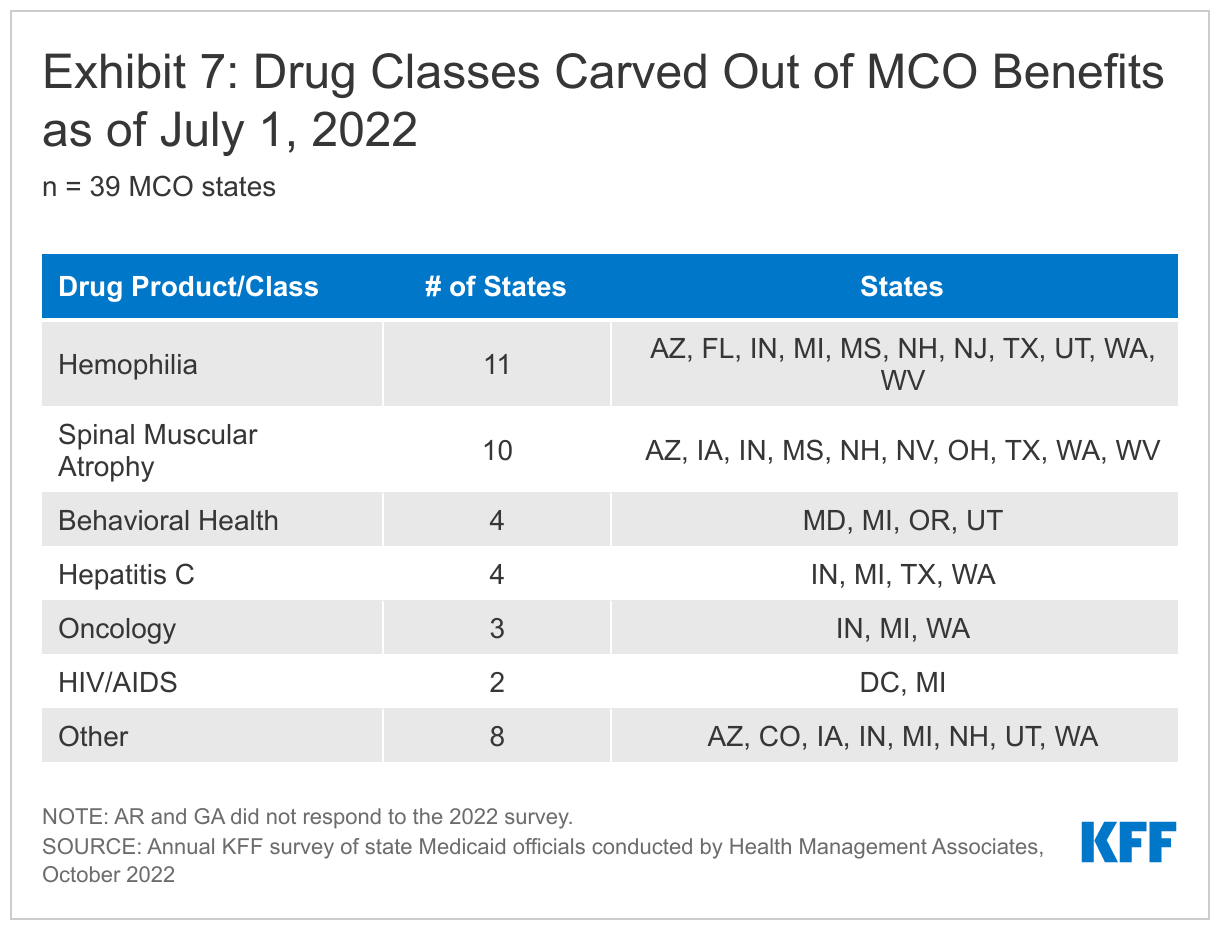
Cost Containment and Other Pharmacy Initiatives
A number of states report laying the groundwork to employ value-based arrangements (VBAs) with pharmaceutical manufacturers as a way to control pharmacy costs. However, only a handful of states have active VBA agreements in place. As of July 1, 2022, seven states have VBAs in place with one or more drug manufacturers (Alabama, Arizona, Colorado, Massachusetts, Michigan, Oklahoma, and Washington), an increase of one state (Colorado) from last year. Most states with VBAs in place also reported plans to expand VBA efforts in FY 2023.120 Drugs covered by the VBAs include but are not limited to Entresto (chronic heart failure), Zolgensma (spinal muscular atrophy), Onpattro (tansthretin-mediated amyloidosis), Givlaari (acute hepatic porphyria), Stelara (psoriasis), re-SET (SUD digital therapeutic), Sublocade (SUD), and hepatitis C treatments. Sixteen additional states121 are considering opportunities or are developing and executing plans to implement a VBA arrangement in FY 2023 or later. Of those states, six122 are considering, or planning to take advantage of, VBAs that are offered by manufacturers to all states under a recently enacted federal rule. At the time of the survey, however, no national-level VBA arrangements were available.123
More than half of responding states reported newly implementing or expanding at least one initiative to contain prescription drug costs in FY 2022 or FY 2023. On this year’s survey, we asked states to describe any new or expanded pharmacy program cost containment strategies implemented in FY 2022 or planned for FY 2023, including initiatives to address PBM spread pricing. We asked states to exclude routine updates, such as to PDLs or state maximum allowable cost programs, as these utilization management strategies are employed by states regularly and are not typically considered major new or expanded policy initiatives. As in prior years, states reported imposition of new prior authorization policies (for specialty drugs in particular), utilization management controls, quantity limits, and rebate maximization generally. Among states that reported newly implementing or expanding at least one cost containment initiative, one-fifth124 reported new or expanded pharmacy cost containment initiatives targeted to physician administered drugs.125 A handful of states reported plans to newly cover or expand coverage of diabetic supplies, durable medical equipment (DME), and other non-drug products under the pharmacy benefit, which can improve access and contain costs. Other cost containment policy changes reported in FY 2022 and FY 2023 include:
- Uniform PDLs. Uniform PDLs help states maximize supplemental rebates by covering drugs administered under both the FFS and managed care delivery system. They also streamline pharmacy benefit coverage for members and providers. Kentucky (through its hybrid model for pharmacy benefit administration), Massachusetts, Michigan, and Washington reported expanding uniform PDL policies for at least a subset of drugs as a cost containment initiative in FY 2022 or FY 2023. Indiana plans to implement a uniform PDL by July 1, 2023.
- Pharmacy Reimbursement. Aside from VBAs, three states (Missouri, Maine, and Kansas) reported revising pharmacy reimbursement policy to reduce program costs. Kansas transitioned specialty drugs for managed care populations to fall under the “lesser of” reimbursement methodology set by the state instead of MCO pricing and expanded this approach in FY 2022. Maine reported plans to significantly revise their state maximum allowable cost program beginning in FY 2023.
- Extending Covered Days’ Supply. Extending covered days’ supply has the potential to improve medication compliance for chronic conditions, as well as reduce aggregate pharmacy dispensing fees. Two states (Alaska and West Virginia) reported new and expanded policies for 90-day fills of certain medications as a cost containment policy change in FY 2022 and/or FY 2023.
- Prescriber Resources and Tools. In both FY 2022 and FY 2023, Oklahoma reported expanding its academic detailing program as a cost containment policy that also improves prescribing practices and encourages use of evidence-based guidelines through provider outreach and education. Oregon reported updating its dose optimization system as a new cost containment initiative in FY 2022 that will also better support prescribers.
Many states reported reforms aimed at spread pricing and the role of PBMs in administering Medicaid pharmacy benefits, either as a new or expanded cost containment action or as a separate but notable pharmacy initiative recently implemented or under development. Six states reported recently implemented or planned policies to prohibit spread pricing126 or require pass through pricing in MCO contracts with PBMs.127 Other states address spread pricing concerns in alternative ways. For example, North Carolina reported that its MCOs cannot include the expenses related to spread pricing in the numerator of the medical loss ratio (MLR) calculation. This disincentive lowers the MLR for MCOs with spread pricing arrangements, putting the MCOs at risk of having to pay back capitation received in amounts over the MLR target. Additional PBM-related policies reported by states in this year’s survey include increased transparency and oversight, limits on additional fees paid by MCOs to PBMs or charged to pharmacies, and restricting PBM claw back procedures.
Recent state pharmacy initiatives most frequently cited as having a big impact on cost and administration include managed care drug carve outs and uniform PDLs, restrictions on spread pricing and related PBM reforms, and VBAs. On this year’s survey, we asked states to highlight recently implemented or planned initiatives expected to have the biggest impact on improving pharmacy benefit administration, addressing rising drug costs and emerging gene and cell therapies, or enhancing the value of the Medicaid pharmacy benefit. States highlighted a range of initiatives, some of which overlap with specific cost containment policy changes described above. Four states reported planned or recently implemented strategies to address rising costs associated with gene and cell therapy, including expanded prior authorization requirements and leveraging the National Medicaid Pooling Initiative (NMPI) for supplemental rebates.128 A couple states are reviewing reimbursement options for inpatient drugs like gene and cell therapies, including carve outs from the inpatient bundle which allows for rebates under the MDRP. Ohio is carving out the pharmacy benefit from managed care contracts and will contract with a single PBM instead, beginning in October 2022. It is also contracting with a Pharmacy Pricing and Audit Consultant (PPAC) who will provide operational and consulting support in the areas of pharmacy reimbursement, benefit design, oversight, and auditing of the PBM. Massachusetts and Wyoming have implemented, or are in the process of implementing, mandatory 90-day fill policies for maintenance medications.
Future Outlook: Key Opportunities, Challenges, And Priorities In Fy 2023 And Beyond And Conclusion
The COVID-19 pandemic public health emergency, in place for more than two and half years at the time of this report, has had profound impacts on the ongoing operations and priorities of state Medicaid programs, including accelerating some priorities but delaying others. One director noted that while the pandemic did not fundamentally change program priorities, it did give the state a new lens to view many longstanding issues (e.g., equity, behavioral health, telehealth). Another state official observed that there have been at least three pandemic phases that presented differing challenges:
- The initial shutdown phase when states took urgent steps to shore up providers and preserve access by implementing emergency authorities and flexibility measures,
- A second phase where states worked with providers and stakeholders to implement policies and initiatives to promote COVID-19 vaccinations, and
- A third phase requiring states to prepare and plan for the eventual unwinding of PHE emergency authorities, with some unwinding efforts already completed or underway.
The progression from each of these phases to the next has not been linear due to waves of new COVID-19 variants. States are now anticipating a fourth pandemic phase – an “endemic reality” – requiring states to consider how to operate going forward with a continued emphasis on vaccine access, but also recognizing the significant pandemic-related impacts on members’ health and wellbeing and on health care providers and the health care workforce.
COVID-19 Opportunities and Challenges
During survey interviews and in their written responses, state Medicaid officials identified lessons learned from the pandemic as opportunities. One director commented that the pandemic had pushed the state “in ways that did not seem possible before.” COVID-19 opportunities identified include expanded access for enrollees via telehealth, improved relationships with providers and other stakeholders, and data collection improvements:
- Telehealth. States commented on the pandemic-related expansion of telehealth, referred to as the “silver lining of the pandemic” by one official. Others reported that the pandemic had demonstrated the value of telehealth, overcoming, in some cases, prior cost and quality concerns. Looking ahead, states are weighing the expanded access that telehealth brings—especially for behavioral health services and in rural areas—against quality and other concerns.
- Coordination and Collaboration. States noted that the pandemic had demonstrated the capacity of state Medicaid programs to be “nimble,” rapidly responding to urgent needs. Several states commented on improved relationships and engagement with enrollees, providers, plans, and/or other state and federal agencies that had resulted from response efforts initiated during the pandemic.
- Data Improvements. A handful of states mentioned that the pandemic had highlighted the importance of obtaining better and more timely data and using data analytics to inform decision making, including data related to COVID-19 and other public health data. States also highlighted that improved data collection and stratification would help to identify and address health disparities by race/ethnicity and/or other factors.
States also commented on challenges related to planning and preparing for the COVID-19 PHE unwinding and associated with entering the “endemic reality” phase of the pandemic:
- Unwinding Challenges. States identified the resumption of redeterminations at the end of the PHE as an enormous upcoming challenge that will require a “surge” of administrative resources for states and county agencies including staff as well as training and systems changes. A number of states commented on their goals to minimize coverage losses when the PHE ends, including one state that expressed concerns about poor health outcomes if individuals needing mental health services or postpartum care were to lose coverage. Officials noted they were focused on efforts to communicate with members about the need to update contact information as well as on efforts to coordinate with a range of partners (e.g., MCOs, providers, etc.) to help enrollees navigate renewals and prevent coverage loss for procedural reasons. Some states also commented on efforts to coordinate with state-based Marketplaces to promote other coverage for persons determined no longer eligible for Medicaid. Several states noted that the uncertain timing of the PHE end has made it very difficult to plan and communicate with members and other partners. Finally, several states noted that the end of the Families First Coronavirus Response Act (FFCRA) enhanced federal Medicaid match before all redeterminations are completed would be challenging.
- Expiration of Emergency Authorities. Several states commented on challenges related to the expiration of HCBS waiver emergency authorities including, for example, emergency waivers related to HCBS reimbursement policies, payments to family caregivers, and service setting requirements. A few states commented on challenges related to provider impacts such as the end of emergency credentialing and provider enrollment authorities and the reinstitution of prior authorization and concurrent review requirements. Identifying and “noticing” all impacted providers regarding the end of Medicaid flexibilities will require significant administrative capacity. For example, one state referenced preparations for unwinding over 40 administrative programmatic flexibilities while another state referenced over 100 authorities that have been granted during the PHE. Emergency flexibilities adopted during the PHE will need to be part of unwinding or transitioned to permanent authority (which will require coordination with CMS).
- Lasting Focus on COVID-19. Even after unwinding emergency authorities and resuming normal eligibility operations, the effects of COVID-19 will continue. For example, states remain focused on COVID-19 vaccinations and are also wrestling with program implications and challenges associated with long-COVID as well as decreased utilization of preventive care services. Responding to the COVID-19 pandemic has also highlighted the importance of additional efforts to ensure future emergency preparedness.
Future Priorities Shaped by COVID-19 and Beyond
Many states noted that the COVID-19 pandemic has shaped their Medicaid priorities. States also reported a renewed focus on priorities in place prior to the pandemic.
- Health Equity. States are focused on addressing health inequities and disparities that the pandemic exposed and often exacerbated. Several states noted that while health equity had been a priority before, the pandemic helped to “move the needle” and allow for difficult conversations to take place. States described aims to embed health equity throughout policies and programs, including as part of Section 1115 demonstration waivers or as a central focus of new managed care contracts or managed care procurement efforts. States are also helping to advance equity in more targeted ways including, for example, one state that commented on using morbidity and mortality disparity data to inform its nursing facility rate reform efforts.
- Specific Populations or Service Categories. States identified access and outcomes for a number of specific populations or service categories as top priorities:
- Behavioral Health. In light of the pandemic’s adverse effects on behavioral health conditions, states are developing new initiatives in this area and accelerating attention to initiatives already underway. For example, states are focusing on integrating care, working with justice-involved populations, incorporating behavioral health into managed care contracts, and expanding crisis response capacity and mobile crisis services. Given that children’s mental health challenges were on the rise even before COVID-19 and may have worsened during the pandemic, many states are targeting children’s behavioral health care, such as by expanding school-based mental health care. In general, some Medicaid behavioral health initiatives are part of comprehensive statewide behavioral health transformations, which may include but extend beyond Medicaid programs.
- Long-term Services and Supports (LTSS). The disproportionate share of COVID-19 deaths in nursing facilities and enhanced HCBS funding made available in the 2021 American Rescue Plan Act (ARPA) catalyzed state efforts to improve HCBS access. In addition to using ARPA funds to improve HCBS direct care worker pay, states employed a variety of emergency authorities designed to expand HCBS, maintain eligibility, and secure financing for LTSS providers. Several states mentioned ongoing initiatives to redesign HCBS waivers, sometimes citing specific attention to rates, quality, or infrastructure. Other states mentioned LTSS priorities related to nursing facility rate reform, implementation of LTSS managed care, and expanding HCBS enrollment, including through nursing facility diversion or deinstitutionalization efforts.
- Maternal and Child Health. A number of states identified maternal and child health initiatives as key ongoing priorities. Many states have newly adopted and implemented the ARPA 12-month postpartum coverage option but are also expanding services for pregnant women, such as coverage of doulas. Some of these initiatives are directly tied to addressing disparities in maternal health. In the wake of the Supreme Court decision to overturn Roe vs. Wade, one state mentioned “identifying and acting on opportunities to support reproductive rights” as a priority. States also report plans to focus on pandemic-related impacts on preventive care for children, especially efforts to improve childhood immunization rates that declined during the pandemic.
- Workforce. States are prioritizing addressing health care workforce challenges that were created or exacerbated by the pandemic, especially related to behavioral health and HCBS providers. In many cases, these challenges are driving states to reconsider provider rate-setting policies and implement initiatives (often ARPA-funded) to meet the demand for behavioral health and HCBS, including for example, through rate increases, recruitment and retention bonuses, and training and career development initiatives. A number of states also pointed to specific initiatives to improve access through the use of community health workers and doulas or by modifying provider qualification requirements. While there has been a focus on the pandemic’s impact on the health care workforce, many officials noted that state agency staff have also been strained, fatigued, and burned out from constantly shifting gears and operating in “emergency response” mode.
- Payment and Delivery System Initiatives and Operations. Although the pandemic may have delayed value-based purchasing initiatives in some states, several states reported working to reinitiate or advance these priorities. In addition, some states are focused on payment system reform including reviews and restructuring of payment rates and methods. Many states that contract with managed care plans point to MCO procurements as a major upcoming priority. Managed care contracts are often extensive and sophisticated and represent very large dollar value contracts for states. Some states are focused on integration of services under managed care contracts (e.g., carving in behavioral health services) while other states are taking action to carve out certain services from managed care contracts (e.g., pharmacy benefits). North Carolina and Oklahoma are transitioning to managed care amid competing pandemic-related priorities.
- IT System Modernization. Nearly one-third of responding states reported prioritizing IT systems projects, predominately reprocurements, implementations, or modernizations of Medicaid Enterprise Systems. These vital systems are used for claims and encounter processing, but also support other program objectives related to delivery system reform and value-based purchasing, quality improvement, provider and MCO monitoring, and cost control strategies.
- Addressing SDOH to Improve Health Outcomes. States recognize that social determinants of health are major contributors to overall health and drivers of health equity. States are therefore working to leverage Medicaid to help address these needs, including housing, through demonstration waivers, MCO contracts, and other state-driven initiatives.
Conclusion
States completed this survey in mid-summer of 2022, as COVID-19 deaths were rising after a low in April 2022, due to the highly transmissible Omicron variant, waning vaccine immunity, and relatively low booster uptake. States were continuing to respond to ongoing and emerging pandemic-related health concerns such as the need to improve utilization of preventive care services in addition to the ongoing need to focus on vaccines and boosters. At the same time, states are preparing for the challenges tied to the end of the PHE including the unwinding of continuous coverage and emergency authorities. As states anticipate a new “endemic reality” phase of the pandemic, they report that COVID-19 has presented both new opportunities and challenges and has also shifted and shaped ongoing Medicaid priorities. Looking ahead, states remain focused on developing and evaluating telehealth policy, addressing health equity, improving access and outcomes for specific populations and service categories, addressing workforce shortages, and improving data and IT systems to inform all these efforts. In many states, Medicaid policy may be informed by the outcome of gubernatorial elections in November 2022. The Biden Administration may also shape Medicaid policy, including by promoting Section 1115 demonstration waivers that align with administrative priorities and through administrative rulemaking. Even as pandemic, economic, and political landscapes shift, Medicaid has and will continue to serve a large share of Americans, providing comprehensive health coverage and long-term care that are likely to remain key aspects of pandemic response and recovery.
Methods
KFF commissioned Health Management Associates (HMA) to survey Medicaid directors in all 50 states and the District of Columbia to identify and track trends in Medicaid spending, enrollment, and policy making. This is the 22nd annual survey, each conducted at the beginning of the state fiscal year (FY) from FY 2002 through FY 2023. Additionally, ten mid-fiscal year surveys were conducted during state fiscal years 2002-2004, 2009-2013, 2021, and 2022 when a large share of states were considering mid-year Medicaid policy changes due to state budget and revenue shortfalls and/or the COVID-19 pandemic. Findings from previous surveys are referenced in this report when they help to highlight current trends. Archived copies of past reports are available on the following page.
The KFF/HMA Medicaid survey on which this report is based was sent to state Medicaid directors in June 2022. The survey instrument (in Appendix) was designed to document policy actions in place in FY 2022 and implemented or planned for FY 2023 (which began for most states on July 1, 2022).129 The survey captures information consistent with previous surveys, particularly for provider payment rates, benefits, and managed care, to provide some trend information. Each year, questions are added or revised to address current issues.
Medicaid directors and staff provided data for this report in response to a written survey and a follow-up telephone interview. Overall, 49 states responded in mid-summer of 2022, though response rates for specific questions varied.130 Forty-eight states participated in a follow-up telephone interview, conducted between July and September 2022.131 The telephone discussions are an important part of the survey to ensure complete and accurate responses and to record additional context for and complexities of state actions.
The survey does not attempt to catalog all Medicaid policies in place for each state. This report highlights certain policies in place in state Medicaid programs in FY 2022 and policy changes implemented or planned for FY 2023. Experience has shown that adopted policies are sometimes delayed or not implemented for reasons related to legal, fiscal, administrative, systems, or political considerations, or due to delays in approval from CMS. Policy changes under consideration without a definite decision to implement are not included in the survey. States completed this survey in mid-summer of 2022, as COVID-19 deaths started to rise after a low in April 2022, due to the highly transmissible Omicron variant, waning vaccine immunity, and relatively low booster uptake. Given differences in the financing structure of their programs, the U.S. territories were not included in this analysis.
Appendix
Survey Instrument
Download the Survey (.pdf)
Endnotes
- FMAP = Federal Medicaid Assistance Percentage. ↩︎
- State fiscal years begin on July 1 except for these states: New York on April 1; Texas on September 1; Alabama, Michigan, and District of Columbia on October 1. ↩︎
- Arkansas and Georgia did not respond to the 2022 survey. In some instances, we used publicly available data or prior years’ survey responses to obtain information for these states. However, unless otherwise noted, these states are not included in counts throughout the survey. ↩︎
- Centers for Medicare & Medicaid Services (CMS), National Health Expenditure Data Fact Sheet: Table 4, National Health Expenditures by Source of Funds and Type of Expenditure: Calendar Years 2011-2018 (CMS, March 2020), https://www.cms.gov/Research-Statistics-Data-and-Systems/Statistics-Trends-and-Reports/NationalHealthExpendData/NHE-Fact-Sheet.html. ↩︎
- States must provide continuous coverage to Medicaid enrollees until the end of the month in which the PHE ends to receive enhanced federal funding. ↩︎
- Arkansas and Georgia did not respond to the 2022 survey. In some instances, we used publicly available data or prior years’ survey responses to obtain information for these states. However, unless otherwise noted, these states are not included in counts throughout the survey. Among responding states, one state (Texas) did not participate in a follow-up telephone interview. ↩︎
- State fiscal years begin on July 1 except for these states: New York on April 1; Texas on September 1; Alabama, District of Columbia, and Michigan on October 1. ↩︎
- Center for Health Care Strategies, Medicaid Accountable Care Organizations: State Update, (Hamilton, NJ: Center for Health Care Strategies, February 2018), https://www.chcs.org/media/ACO-Fact-Sheet-02-27-2018-1.pdf ↩︎
- Michael Wilson et al., “The impacts of accountable care organizations on patient experience, health outcomes, and cost: a rapid review,” Journal of Health Services Research & Policy 25 no. 2 (April 2020): 130-138, https://journals.sagepub.com/doi/full/10.1177/1355819620913141 ↩︎
- Office of the Assistant Secretary for Planning and Evaluation (ASPE), Evaluation of the Medicaid Health Home Option for Beneficiaries with Chronic Conditions: Evaluation of Outcomes of Selected Health Home Programs Annual Report - Year Five, (Washington, DC: Office of the Assistant Secretary for Planning and Evaluation, May 2017), https://aspe.hhs.gov/basic-report/evaluation-medicaid-health-home-option-beneficiaries-chronic-conditions-evaluation-outcomes-selected-health-home-programs-annual-report-year-five ↩︎
- Office of the Assistant Secretary for Planning and Evaluation (ASPE), Report to Congress on the Medicaid Health Home State Plan Option, (Washington, DC: Office of the Assistant Secretary for Planning and Evaluation, May 2018), https://www.medicaid.gov/state-resource-center/medicaid-state-technical-assistance/health-home-information-resource-center/downloads/medicaidhomehealthstateplanoptionrtc.pdf ↩︎
- Kevin Grumbach, Thomas Bodenheimer, and Paul Grundy, “The Outcomes of Implementing Patient-Centered Medical Home Interventions: A Review of the Evidence on Quality, Access and Cost from Recent Prospective Evaluation Studies, August 2009,” (Washington DC: Patient-Centered Primary Care Collaborative, August 2009), https://pcmh.ahrq.gov/sites/default/files/attachments/The%20Outcomes%20of%20Implementing%20 Patient-Centered%20Medical%20Home%20Interventions.pdf ↩︎
- Connecticut does not have capitated managed care arrangements, but does carry out many managed care functions through ASO arrangements that include payment incentives based on performance, intensive care management, community workers, educators, and linkages with primary care practices. ↩︎
- Vermont runs a public, non-risk bearing prepaid health plan delivery model under its Section 1115 Global Commitment to Health waiver. ↩︎
- Idaho’s Medicaid-Medicare Coordinated Plan has been recategorized by CMS as an MCO but is not counted here as such since it is secondary to Medicare. Publicly available data used to verify status of two states that did not respond to the 2022 survey (Arkansas and Georgia). ↩︎
- Includes the Arizona Indian Medical Home Program, conducted under PCCM authority and in place since 2017, that was not counted in prior year reports as a PCCM program. ↩︎
- For purposes of this report, states contracting with “PCCM entities” are also counted as offering a PCCM program. In addition to furnishing basic PCCM services, PCCM entities also provide other services such as intensive case management, provider contracting or oversight, enrollee outreach, and/or performance measurement and quality improvement. 42 CFR §438.2. ↩︎
- Oklahoma Health Care Authority, “OHCA to Transition to New Health Care Model News Release,” May 26, 2022: https://oklahoma.gov/ohca/about/newsroom/2022/may/ohca-to-transition-to-new-health-care-model.html ↩︎
- A previously planned managed care transition was struck down, in June 2021, by the Oklahoma Supreme Court which ruled that the Oklahoma Health Care Authority did not have the authority to implement the program without legislative approval. ↩︎
- For purposes of this report, the following two states are not counted here as PCCM states: Connecticut uses PCCM authority to reimburse medical home-related costs and South Carolina uses PCCM authority to provide care management services to medically complex children. ↩︎
- Arkansas did not respond to the 2022 survey. Therefore, its dental services PHP status was confirmed via publicly available data. ↩︎
- Mississippi reported a total MCO penetration rate of 46.2% in the 2022 survey compared to 99.4% in the 2021 survey (and 76.3% in the 2020 survey), noting that to contain costs during the pandemic, MCO enrollees with no utilization were shifted to FFS unless they elected to stay enrolled with an MCO. ↩︎
- In order of Medicaid enrollment size, the 10 states are: California, New York, Texas, Florida, Pennsylvania, Illinois, Ohio, Michigan, Arizona, and Georgia. Centers for Medicare and Medicaid Services (CMS), “Medicaid & CHIP Monthly Application, Eligibility Determinations, and Enrollment Reports,” last updated August 2022, https://www.medicaid.gov/medicaid/program-information/medicaid-and-chip-enrollment-data/monthly-reports/index.html ↩︎
- For this section regarding MCO penetration rates, 2021 survey data were used for the two states that did not respond to the 2022 survey (Arkansas and Georgia) and for two states (North Carolina and Virginia) that did not provide complete data for the MCO penetration rate question. Also, data for Washington is based on our own calculations using July 2022 data reported on the Apple Health Client Eligibility dashboard. ↩︎
- NC Medicaid, “Fact Sheet: Standard Plan Overview, County Playbook: Medicaid Managed Care,” November 15, 2021, https://medicaid.ncdhhs.gov/media/10407/download?attachment ↩︎
- NC Medicaid, “Enrollment Overview Dashboard,” accessed October 12, 2022, https://medicaid.ncdhhs.gov/reports/dashboards#enroll ↩︎
- NC Medicaid, “Tailored Plan Information for Beneficiaries, Five Things You Need to Know About North Carolina’s Behavioral Health and Intellectual/Developmental Disability (I/DD) Tailored Plans,” https://medicaid.ncdhhs.gov/media/10862/download?attachment ↩︎
- In FY 2022, California will transition several non-dual-eligible populations into mandatory managed care, including individuals in the following aid categories: Trafficking and Crime Victims Assistance Program; accelerated enrollment; Child Health and Disability Prevention infant deeming; Pregnancy-related Medi-Cal (Pregnant Women only, 138–213 percent of the federal poverty level (FPL)), beneficiaries with other health coverage and those residing in certain formerly excluded rural zip codes. ↩︎
- California Department of Health Care Services, “Section 1915(b) Waiver Proposal for California Advancing and Innovating Medi-Cal (CalAIM),” updated December 16, 2021 with technical corrections incorporated January 2022, https://www.medicaid.gov/medicaid/section-1115-demonstrations/downloads/ca-17-apprvd-app.pdf ↩︎
- Dual-eligible beneficiaries in the seven Coordinated Care Initiative (CCI) counties (Los Angeles, Orange, Riverside, San Bernardino, San Diego, San Mateo, Santa Clara) participating in California’s Financial Alignment Demonstration and the County Organized Health System counties are already required to enroll in managed care. ↩︎
- New York Department of Health, “Transition of Children placed in Foster care and NYS Public Health Law Article 29-I Health Facility Services into Medicaid Managed Care Effective July 1, 2021,” July 2021 presentation, https://www.health.ny.gov/health_care/medicaid/redesign/behavioral_health/children/docs/ foster_care_transition_overview_7_30_21.pdf ↩︎
- Missouri Department of Social Services, “News Release: DSS announces new Specialty Health Plan, awards contract to Home State Health,” June 2, 2022, https://dss.mo.gov/press/06-02-2022-new-specialty-health-plan.htm ↩︎
- Ohio Medicaid Managed Care, “OhioRISE (Resilience through Integrated Systems and Excellence),” https://managedcare.medicaid.ohio.gov/managed-care/ohiorise ↩︎
- California Department of Health Care Services, “CalAIM Long-Term Care Carve-In Transition,” upated October 17, 2022, https://www.dhcs.ca.gov/provgovpart/Pages/Long-Term-Care-Carve-In-Transition.aspx ↩︎
- Maine Department of Health and Human Services, “Primary Care Plus (PCPlus),” https://www.maine.gov/dhhs/oms/providers/value-based-purchasing/primary-care ↩︎
- NC Medicaid, “Fact Sheet: Eastern Band of Cherokee Indians Tribal Option Overview, County Playbook: NC Medicaid Managed Care,” December 21, 2021, https://medicaid.ncdhhs.gov/media/8154/download ↩︎
- Washington State Health Care Authority, “Primary care case management entities (PCCMe) State Plan Amendment,” https://www.hca.wa.gov/about-hca/who-we-are/tribal-relations/primary-care-case-management-entities-pccme-state-plan-amendment ↩︎
- The state intent of this change is to reduce member transitions between programs and gaps in case, simplify provider contracting and credentialing processes, and streamline the administration of the program. ↩︎
- Virginia Medicaid, “Cardinal Care: A Program for All Medicaid Members,” https://www.dmas.virginia.gov/for-members/cardinal-care/ Virginia Medicaid, “Cardinal Care Transition: What Providers Should Know,” https://www.dmas.virginia.gov/for-providers/cardinal-care-transition/ ↩︎
- Ohio Medicaid Managed Care, “PNM & Centralized Credentialing,” https://managedcare.medicaid.ohio.gov/managed-care/centralized-credentialing Ohio Medicaid Managed Care, “Fiscal Intermediary,” https://managedcare.medicaid.ohio.gov/managed-care/fiscal-intermediary ↩︎
- We asked states to indicate whether the following specified delivery system and payment reform initiatives were in place as of July 1, 2022: patient-centered medical home (PCMH); Health Home (under ACA section 2703); Accountable Care Organization (ACOs); episode of care; and all-payer claims database. ↩︎
- Arkansas and Georgia did not respond to the 2022 survey; 2021 survey data and publicly available data were used to identify delivery system and payment reform initiatives in place for these states. ↩︎
- Publicly available data was used to verify PCMH program of two states that did not respond to the 2022 survey (Arkansas and Georgia). ↩︎
- Building off the experience of Health Homes and California’s Whole Person Pilots, the goal of this new benefit is to bring a whole person focus to the care of certain high-need Medi-Cal beneficiaries, e.g., children/youth with complex physical, behavioral, developmental, and oral health needs, individuals who are homeless or at risk of homelessness, among other target populations, to address both their clinical and non-clinical needs. For more information, see: State of California – Health and Human Services Agency, CalAIM Enhanced Care Management Policy Guide, Sacramento, CA: State of California – Health and Human Services Agency, September 2021, https://www.dhcs.ca.gov/Documents/MCQMD/ECM-Policy-Guide-September-2021.pdf ↩︎
- The NCQA distinction in Multicultural Health Care is in the process of being updated to the more comprehensive Health Equity Accreditation. NCQA, “Current Multicultural Healthcare Customers,” https://www.ncqa.org/current-multicultural-healthcare-customers/ ↩︎
- Eighteen states reported “other” strategies to improve completeness of REL data: Alaska, Arizona, Colorado, Connecticut, Kansas, Louisiana, Maryland, Massachusetts, Minnesota, New Jersey, New Mexico, Ohio, Oklahoma, Oregon, Pennsylvania, South Carolina, Washington, and Wisconsin. ↩︎
- https://www.dhcs.ca.gov/services/Pages/DP-DPH-QIP.aspx ↩︎
- The NCQA distinction in Multicultural Health Care is in the process of being updated to the more comprehensive Health Equity Accreditation. NCQA, “Current Multicultural Healthcare Customers,” https://www.ncqa.org/current-multicultural-healthcare-customers/ ↩︎
- 42 C.F.R. Section 440.230(b). ↩︎
- American Rescue Plan Act of 2021, Pub. L. No. 117-2 (March 11, 2021), https://www.congress.gov/117/plaws/publ2/PLAW-117publ2.pdf ↩︎
- Bipartisan Safer Communities Act, Pub. L. No. 117-159 (June 25, 2022), https://www.congress.gov/117/plaws/publ159/PLAW-117publ159.pdf ↩︎
- Inflation Reduction Act of 2022, Pub. L. No. 117-169 (August 16, 2022), https://www.congress.gov/bill/117th-congress/house-bill/5376/text ↩︎
- National Suicide Hotline Designation Act of 2020, Pub. L. No. 116-172 (October 17, 2020), https://www.congress.gov/116/plaws/publ172/PLAW-116publ172.pdf ↩︎
- Consolidated Appropriations Act, 2021, Pub. L. No. 116-260 (December 27, 2020), https://www.congress.gov/116/plaws/publ260/PLAW-116publ260.pdf ↩︎
- In a few instances throughout this section, we rely on publicly available data (e.g. Section 1115 waiver documents or Medicaid State Plan Amendment documents) to supplement reported state benefit changes. ↩︎
- Three states reported addition of CCBHCs in FY 2022 or FY 2023: Kansas, New Mexico, and West Virginia. The Medicaid Certified Community Behavioral Health Center (CCBHC) Medicaid demonstration program aims to improve the availability and quality of ambulatory behavioral health services and to provide coordinated care across behavioral and physical health. CCBHCs provide a comprehensive range of nine types of services. The CCBHC demonstration program was first established by the Protecting Access to Medicare Act of 2014; more recently, the 2022 Bipartisan Safer Communities Act allocated funds for additional planning grants to states to participate in the demonstration. U.S. Department of Health and Human Services, Office of the Assistant Secretary for Planning and Evaluation and Office of Behavioral Health, Disability, and Aging Policy, Certified Community Behavioral Health Clinics Demonstration Program: Report to Congress, 2019 (U.S. Department of Health and Human Services, September 2020), https://aspe.hhs.gov/sites/default/files/migrated_legacy_files/196036/CCBHCRptCong19.pdf Protecting Access to Medicare Act of 2014, Pub. L. No. 113-93 (April 1, 2014), https://www.congress.gov/113/statute/STATUTE-128/STATUTE-128-Pg1040.pdf Bipartisan Safer Communities Act, Pub. L. No. 117-159 (June 25, 2022), https://www.congress.gov/117/plaws/publ159/PLAW-117publ159.pdf ↩︎
- Three states reported adoption of the CoCM model in FY 2022 or FY 2023: Illinois, Texas, and Wisconsin. Collaborative care models are evidence-based and generally include care coordination, care management, monitoring and treatment, and regularly scheduled psychiatric review and consultation for patients who do not show improvement. Jürgen Unützer et al., The Collaborative Care Model: An Approach for Integrating Physical and Mental Health Care in Medicaid Health Homes, (Center for Health Care Strategies and Mathematica Policy Research, May 2013): https://www.chcs.org/media/HH_IRC_Collaborative_Care_Model__052113_2.pdf American Psychiatric Association, “Learn About the Collaborative Care Model,” https://www.psychiatry.org/psychiatrists/practice/professional-interests/integrated-care/learn ↩︎
- The 10 states are: California, Colorado, Kansas, Maine, Maryland, Montana, Nevada, Ohio, Oregon, and South Carolina. The American Rescue Plan Act provided a new option for states to provide community-based mobile crisis intervention services, with 85% federal matching funds for these services for the first three years. On September 12, 2022, Oregon became the first state to receive CMS approval of this new Medicaid option. U.S. Department of Health and Human Services Press Office, “HHS Approves Nation’s First Medicaid Mobile Crisis Intervention Services Program, To Be Launched in Oregon,” September 12, 2022, https://www.hhs.gov/about/news/2022/09/12/hhs-approves-nations-first-medicaid-mobile-crisis-intervention-services-program-to-be-launched-in-oregon.html CMS, State Plan Amendment (SPA) OR 22-0012 (September 12, 2022), https://www.medicaid.gov/medicaid/spa/downloads/OR-22-0012.pdf ↩︎
- Wash. Admin. Code § 182-550-4550, https://casetext.com/regulation/washington-administrative-code/title-182-health-care-authority/washington-apple-health/chapter-182-550-hospital-services/section-182-550-4550-effective1012022administrative-day-rate-and-swing-bed-day-rate CMS, State Plan Amendment (SPA) WA-21-0032 (June 2, 2022), https://www.medicaid.gov/medicaid/spa/downloads/WA-21-0032.pdf ↩︎
- West Virginia Department of Health & Human Resources, “Pilot Program for Treatment for Pregnant and Postpartum Women Awarded to WV,” August 27, 2021, https://dhhr.wv.gov/News/2021/Pages/Pilot-Program-for-Treatment-for-Pregnant-and-Postpartum-Women-Awarded-to-WV.aspx CMS, State Plan Amendment (SPA) WV-22-0003 (September 7, 2022), https://www.medicaid.gov/medicaid/spa/downloads/WV-22-0003.pdf ↩︎
- The 7 states are: Arizona, Colorado, Illinois, Nebraska, New York, Ohio, and Utah. In addition, Louisiana began covering skin substitutes for chronic diabetic lower extremity ulcers (FY 2022) and Nevada plans to provide a limited dental benefit to adults with diabetes, if approved by CMS (FY 2023). ↩︎
- Federal financial participation is not available to state Medicaid programs for room and board except in certain medical institutions. Federal financial participation is generally available under certain housing-related supports and services that promote health and community integration. These include home accessibility modifications, one-time community transition costs, and housing tenancy supports. These depend on the individual’s disability and/or health status and are not used for generality utilities in the home. See: Centers for Medicare & Medicaid Services, Opportunities in Medicaid and CHIP to Address Social Determinants of Health (SDOH), Baltimore, MD: Department of Health and Human Services, January 2021, https://www.medicaid.gov/federal-policy-guidance/downloads/sho21001.pdf ↩︎
- The 12 states are: AZ, CA, CT, DC, ME, MA, NC, NH, OR, UT, WA, and WI. ↩︎
- The CalAIM demonstration and its various components are authorized under Section 1115, Section 1915(b), and through state plan amendments. ↩︎
- California Department of Health Care Services, Medi-Cal Community Supports, or In Lieu of Services (ILOS), Policy Guide (August 2022), https://www.dhcs.ca.gov/Documents/MCQMD/DHCS-Community-Supports-Policy-Guide.pdf Centers for Medicare and Medicaid Services, Letter to Jacey Cooper, Chief Deputy Director, Health Care Programs, California Department of Health Care Services, from Deputy Administrator and Director, Daniel Tsai (December 29, 2021), https://www.medicaid.gov/medicaid/section-1115-demonstrations/downloads/ca-calaim-ext-appvl-12292021.pdf ↩︎
- Centers for Medicare and Medicaid Services, Letter to Amanda Cassel Kraft, Assistant Secretary, MassHealth, from CMS Administrator, Chiquita Brooks-LaSure (September 28, 2022), https://www.medicaid.gov/medicaid/section-1115-demonstrations/downloads/ma-masshealth-ca1.pdf Centers for Medicare and Medicaid Services, Letter to Dana Hittle, Interim Medicaid Director, Oregon Health Authority, from CMS Administrator, Chiquita Brooks-LaSure (September 28, 2022), https://www.medicaid.gov/medicaid/section-1115-demonstrations/downloads/or-health-plan-09282022-ca.pdf Centers for Medicare and Medicaid Services, Letter to Jami Snyder, Director, Arizona Health Care Cost Containment System, from Deputy Administrator and Director, Daniel Tsai (October 14, 2022), https://www.medicaid.gov/medicaid/section-1115-demonstrations/downloads/az-hccc-ca-10142022.pdf ↩︎
- Connecticut Department of Social Services, “Connecticut Housing Engagement and Support Services (CHESS) Initiative,” updated September 2, 2021, https://portal.ct.gov/DSS/Health-And-Home-Care/Connecticut-Housing-Engagement-and-Support/Connecticut-Housing-Engagement-and-Support-Services---CHESS ↩︎
- Connecticut Medical Assistance Program, Provider Bulletin 2022-52, July 2022, https://portal.ct.gov/-/media/DPH/Injury-Prevention/CTVDRS/Connecticut-Medical-Assistance-Program_Community-Violence-Prevention-Services.pdf ↩︎
- Wisconsin Department of Health Services, “Housing Support Services,” updated May 11, 2022, https://www.dhs.wisconsin.gov/medicaid/housing-supports.htm Leah Ramirez, Wisconsin Department of Health Services, “Housing Support Services,” https://publicmeetings.wi.gov/download-attachment/204ce20a-8a6b-4b3f-9520-783bc417e027 ↩︎
- The 9 states are: Hawaii, Iowa, Kentucky, Maryland, Maine, New Hampshire, Oklahoma, Tennessee, and Virginia. ↩︎
- Nevada Department of Health and Human Services, Section 1115 Demonstration Waiver Application: Expansion of Dental Services for Adults with Diabetes (July 2022): https://dhcfp.nv.gov/uploadedFiles/dhcfpnvgov/content/Board/1115_Dental_Waiver_NV _Oral_Health_Section.pdf ↩︎
- The 3 states adding coverage of SDF are: California, Rhode Island, and Utah. ↩︎
- American Dental Association, “Silver Diamine Fluoride,” updated July 19, 2021, https://www.ada.org/resources/research/science-and-research-institute/oral-health-topics/silver-diamine-fluoride ↩︎
- CMS, State Plan Amendment (SPA) MT-22-005 (June 23, 2022), https://www.medicaid.gov/medicaid/spa/downloads/MT-22-0005.pdf ↩︎
- CMS, State Plan Amendment (SPA) OK-21-0022-A (September 24, 2021), https://www.medicaid.gov/Medicaid/spa/downloads/OK-21-0022-A ↩︎
- Consolidated Appropriations Act, 2021, Pub. L. No. 116-260 (December 27, 2020), https://www.congress.gov/116/plaws/publ260/PLAW-116publ260.pdf Center for Medicare and Medicaid (CMS), SMD #21-005, “UPDATED: Mandatory Medicaid Coverage of Routine Patient Costs Furnished in Connection with Participation in Qualifying Clinical Trials,” April 13, 2022, https://www.medicaid.gov/federal-policy-guidance/downloads/smd21005.pdf ↩︎
- 42 CFR 438.3(e)(2). ↩︎
- 42 CFR § 438.3 (e)(2)(iv). ↩︎
- California Department of Health Care Services, Medi-Cal Community Supports, or In Lieu of Services (ILOS), Policy Guide (August 2022), https://www.dhcs.ca.gov/Documents/MCQMD/DHCS-Community-Supports-Policy-Guide.pdf ↩︎
- State Telehealth Medicaid Fee-For-Service Policy: A Historical Analysis of Telehealth: 2013-2019 (Center for Connected Health Policy, January 2020), https://www.cchpca.org/2021/04/Historical-State-Telehealth-Medicaid-Fee-For-Service-Policy-Report-FINAL.pdf ↩︎
- Rose C. Chu, Christie Peters, Nancy De Lew, and Benjamin D. Sommers, State Medicaid Telehealth Policies Before and During the COVID-19 Public Health Emergency (Washington, DC: U.S. Department of Health and Human Services, Office of the Assistant Secretary for Planning and Evaluation, July 19, 2021), https://aspe.hhs.gov/sites/default/files/2021-07/medicaid-telehealth-brief.pdf ↩︎
- Centers for Medicare and Medicaid (CMS), “Medicaid and CHIP and the COVID-19 Public Health Emergency: Preliminary Medicaid and CHIP Data Snapshot,” June 2022, https://www.medicaid.gov/state-resource-center/downloads/covid-19-medicaid-data-snapshot-01312022.pdf ↩︎
- MACPAC, Medicaid and Rural Health (Washington, DC: MACPAC, June 2021), https://www.macpac.gov/wp-content/uploads/2021/04/Medicaid-and-Rural-Health.pdf ↩︎
- Government Accountability Office, Medicaid: CMS Should Assess Effect of Increased Telehealth Use on Beneficiaries’ Quality of Care (Washington, DC: Government Accountability Office, March 2022), https://www.gao.gov/assets/gao-22-104700.pdf ↩︎
- The 28 states that newly added audio-only coverage are: AL, CO, CT, DC, IA, IL, IN, KS, LA, MD, MI, MO, NC, ND, NE, NH, NY, OH, OK, OR, PA, RI, SC, SD, TX, VT, WI, and WV. The 19 states that expanded existing audio-only coverage are: AK, CA, DE, FL, HI, ID, KY, MA, ME, MN, MS, MT, NJ, NM, NV, TN, UT, VA, and WA. ↩︎
- Centers for Medicare and Medicaid (CMS), “Medicaid and CHIP and the COVID-19 Public Health Emergency: Preliminary Medicaid and CHIP Data Snapshot,” June 2022, https://www.medicaid.gov/state-resource-center/downloads/covid-19-medicaid-data-snapshot-01312022.pdf ↩︎
- The 37 states are: AK, AL, AZ, CA, CT, DC, HI, IA, ID, IN, KS, KY, MA, MD, ME, MI, MN, MO, MS, MT, NC, NE, NH, NM, NV, NY, OH, OK, OR, RI, SC, UT, VA, VT, WI, WV, and WY. ↩︎
- The 4 states are: Louisiana, New Jersey, Pennsylvania, and Texas. ↩︎
- The 6 states are: Colorado, Iowa, Nevada, New Hampshire, North Carolina, and Utah. North Carolina noted that overall telehealth utilization among rural populations has grown to be equivalent to utilization among urban populations; however, telehealth utilization for specialized services is higher among urban populations. ↩︎
- Government Accountability Office, Medicaid: CMS Should Assess Effect of Increased Telehealth Use on Beneficiaries’ Quality of Care (Washington, DC: Government Accountability Office, March 2022), https://www.gao.gov/assets/gao-22-104700.pdf ↩︎
- The 3 states are: California, Kansas, and Ohio. ↩︎
- The 5 states are: Indiana, Iowa, Michigan, North Carolina, and Rhode Island. ↩︎
- The 6 states are: California, Indiana, Nevada, New York, Rhode Island, and Tennessee. ↩︎
- Government Accountability Office, Medicaid: CMS Should Assess Effect of Increased Telehealth Use on Beneficiaries’ Quality of Care (Washington, DC: Government Accountability Office, March 2022), https://www.gao.gov/assets/gao-22-104700.pdf ↩︎
- Bipartisan Safer Communities Act, Pub. L. No. 117-159 (June 25, 2022), https://www.congress.gov/117/plaws/publ159/PLAW-117publ159.pdf ↩︎
- State of Arizona and Health Services Advisory Group, 2021 ACC Adult and Child CAHPS Summary Report (January 2022), https://www.azahcccs.gov/Resources/HPRC/Downloads/2021_CAHPS_ACC_Report-ForPosting.pdf ↩︎
- Specifically, Arizona, Maine, and Nebraska reported plans to use enhanced ARPA HCBS funding. ARPA also included funding to invest in affordable high-speed internet and connectivity. The White House, “FACT SHEET: Biden-Harris Administration Announces Over $25 Billion in American Rescue Plan Funding to Help Ensure Every American Has Access to High Speed, Affordable Internet,” June 7, 2022, https://www.whitehouse.gov/briefing-room/statements-releases/2022/06/07/fact-sheet-biden-harris-administration-announces-over-25-billion-in-american-rescue-plan-funding-to-help-ensure-every-american-has-access-to-high-speed-affordable-internet/ ↩︎
- Ohio Administrative Code 5160-1-18 (July 15, 2022), https://codes.ohio.gov/ohio-administrative-code/rule-5160-1-18 ↩︎
- South Carolina Healthy Connections Medicaid, “Update on Telehealth Flexibilities Issued During the COVID-19 Public Health Emergency,” April 29, 2022, https://www.scdhhs.gov/press-release/update-telehealth-flexibilities-issued-during-covid-19-public-health-emergency ↩︎
- Alaska House Bill 265 (July 14, 2022), https://legiscan.com/AK/text/HB265/id/2479085 ↩︎
- Texas Medicaid & Healthcare Partnership, “Telemedicine and Telehealth Services Provided by Rural Health Clinics,” February 28, 2022, https://www.tmhp.com/news/2022-02-28-telemedicine-and-telehealth-services-provided-rural-health-clinics ↩︎
- Rhode Island House Bill 6032 (July 6, 2021), https://legiscan.com/RI/bill/H6032/2021 ↩︎
- Rhode Island Executive Order 20-06 (March 18, 2020), https://health.ri.gov/publications/exec-orders/ExecOrder20-06.pdf ↩︎
- Social Security Act Section 1902(a)(30)(A) and 42 CFR Section 447.204. ↩︎
- Federal regulations permit only the following exceptions that allow states to make payments directly to providers or direct managed care plan expenditures for plan-covered services: state directed payments and permissible pass-through payments that comply with the requirements at 42 C.F.R. § 438.6, and provider payments required by federal law or regulation, for example, prospective payment system rates required for federally qualified health centers (FQHCs). ↩︎
- Alex Zorn, “Nursing Homes Score Win With 17.5% Medicaid Increase in Pennsylvania for 2023,” Skilled Nursing News, July 11, 2022, https://skillednursingnews.com/2022/07/nursing-homes-score-win-with-17-5-medicaid-increase-in-pennsylvania-for-2023/ ↩︎
- The total number of states responding to this question in the prior surveys was 51 in the 2019 survey, 43 in the 2020 survey, and 47 in the 2021 survey. ↩︎
- Government Accountability Office, Medicaid: CMS Needs More Information on States’ Financing and Payment Arrangements to Improve Oversight (Washington, DC: Government Accountability Office, December 2020), https://www.gao.gov/assets/gao-21-98.pdf ↩︎
- Throughout the Provider Taxes section, we use 2021 survey data for Arkansas and Georgia because these states did not respond to the 2022 survey. ↩︎
- The Deficit Reduction Act of 2005 amended the federal Medicaid provider tax law to restrict the use of MCO taxes effective July 1, 2009. Prior to that date, states could apply a provider tax to Medicaid MCOs that did not apply to MCOs more broadly and could use that revenue to match Medicaid federal funds. Since 2009, several states have implemented new MCO taxes that tax member months rather than premiums and that meet the federal statistical requirements for broad-based and uniform taxes. In addition to the 12 states reporting implemented MCO taxes, some states have implemented taxes on health insurers more broadly that generate revenue for their Medicaid programs. ↩︎
- 10 states reported having an ambulance tax in place in FY 2022: CA, KY, LA, MA, MI, MO, OK, TN, UT, and VT. MA was still awaiting CMS approval at the time of the survey but planned to implement the tax retroactively to FY 2022. ↩︎
- 11 states reported planned increases to one or more provider taxes in FY 2023: AZ, CA, CO, IL, KS, LA, MA, NC, OK, PA, and WV. These increases were most commonly for taxes on hospitals. 7 states reported planned decreases to one or more provider taxes in FY 2023: California, Colorado, Hawaii, Idaho, Missouri, Rhode Island, and Washington. ↩︎
- State policymakers remain concerned about Medicaid prescription drug spending growth and the entry of new high-cost drugs to the market, like Aduhelm, which could cost states anywhere from $230 to $695 million and states report developing strategies and policies to address these drugs is a priority. ↩︎
- Inflation Reduction Act of 2022, Pub. L. No. 117-169 (August 16, 2022), https://www.congress.gov/bill/117th-congress/house-bill/5376/text ↩︎
- 2021 survey data were used for the two states that did not respond to the 2022 survey (Arkansas and Georgia). ↩︎
- Ohio is “unbundling” many components of pharmacy benefit administration from MCO responsibilities and will contract with a single PBM instead. It is also contracting with a Pharmacy Pricing and Audit Consultant (PPAC) who will provide operational and consulting support in the areas of pharmacy reimbursement, benefit design, oversight, and auditing. Additional information about the program change is available at Ohio Medicaid Managed Care, “Ohio Medicaid Single Pharmacy Benefit Manager (SPBM),” https://managedcare.medicaid.ohio.gov/wps/portal/gov/manc/managed-care/single-pharmacy-benefit-manager ↩︎
- In New York, effective April 1, 2023, the pharmacy benefit will be transitioned from managed care to FFS. This was previously scheduled for implementation on April 1, 2021 but was delayed for two years by the state legislature. ↩︎
- Kentucky Cabinet for Health and Family Services, Provider Bulletin “Kentucky Managed Care Organization Single Pharmacy Benefit Manager Announcement,” April 1, 2021, https://chfs.ky.gov/agencies/dms/dpo/ppb/Documents/ProviderMailingApril2021Final.pdf ↩︎
- Mississippi is conducting an MCO procurement and plans to move to processing pharmacy claims through a single pharmacy benefits administrator beginning in FY 2024. See https://medicaid.ms.gov/coordinated-care-procurement/ for more information. ↩︎
- Arizona, Colorado, Massachusetts, Michigan, and Oklahoma are exploring adding additional VBAs. ↩︎
- The 16 states are AK, CT, ID, IL, IN, MS, MT, ND, NV, NY, OR, PA, SC, TN, TX, and VT. ↩︎
- The 6 states are: Alaska, Indiana, Montana, North Dakota, Vermont, and Texas. Arizona, a state that already has a VBA in place, also indicated that it would evaluate national-level VBA arrangements that become available. ↩︎
- See Medicaid Drug Rebate Program Notice, Release No. 189, March 23, 2022, Technical Guidance - Value-Based Purchasing (VBP) Arrangements for Drug Therapies using Multiple Best Prices; State Reporting of VBP Supplemental Rebate Agreements; accessed at https://www.medicaid.gov/prescription-drugs/downloads/state-rel-189-vbp.pdf. This notice provides: “Beginning July 1, 2022, manufacturers will be able to report varying “best price” points (i.e., multiple best prices) for a covered outpatient drug to the Medicaid Drug Rebate Program (MDRP) if associated with a value-based purchasing (VBP) arrangement that meets the definition of such an arrangement at 42 CFR § 447.502, and that arrangement is offered to all states.” ↩︎
- These states are: Alaska, District of Columbia, Maine, Mississippi, Nevada, and Virginia. ↩︎
- Maine is implementing a preferred drug list specific to physician administered drugs, while other states reported making changes to utilization management practices, clinical policy, or reimbursement of physician administered drugs. ↩︎
- Spread pricing refers to the difference between the payment the PBM receives from the MCO and the reimbursement amount it pays to the pharmacy. In the absence of oversight, some PBMs have been able to keep this “spread” as profit. ↩︎
- The 4 states that reported recently implemented or planned policies to prohibit spread pricing are: Florida, Kentucky, Massachusetts, and Maryland. The 2 states that reported recently implemented or planned policies to require pass through pricing in MCO contracts with PBMs are: Nebraska and Nevada. ↩︎
- The 4 states are: Connecticut, District of Columbia, Mississippi, and Texas. ↩︎
- State fiscal years begin on July 1 except for these states: New York on April 1; Texas on September 1; Alabama, District of Columbia, and Michigan on October 1. ↩︎
- Arkansas and Georgia did not respond to the 2022 survey. In some instances, we used publicly available data or prior years’ survey responses to obtain information for these states. However, unless otherwise noted, these states are not included in counts throughout the survey. ↩︎
- Among responding states, one state (Texas) did not participate in a follow-up telephone interview. ↩︎