What Does the CPS Tell Us About Health Insurance Coverage in 2020?
Data Note
As job and income losses mounted during 2020, many experts feared the economic upheaval caused by the COVID-19 pandemic would lead to disruptions in health coverage and increases in the number of people without health insurance. Yet, due to delays or data quality problems in federal surveys typically used to measure health coverage in the US, there has been limited comprehensive data to measure what happened to the number of uninsured people during 2020. The recent release of the Census Bureau’s Current Population Survey (CPS) Annual Social and Economic Supplement (ASEC) provides data on changes to health coverage during 2020. The data show that the number of people who were uninsured and the uninsured rate held steady in 2020.
This data note provides additional context and analysis to understand the 2020 CPS findings. It describes trends in health coverage prior to and during the pandemic and examines the characteristics of the uninsured population in 2020. We focus on nonelderly people, since there is virtually universal coverage among those age 65 and over because of Medicare. Due to known data quality issues with the 2019 CPS ASEC data, which was collected in March 2020 just at the onset of the pandemic and experienced low response rates, we use 2018 for comparisons to pre-pandemic coverage. We also discuss possible reasons for the stability in coverage shown in the recent data, including ongoing challenges with measuring coverage during the pandemic.
What happened to health coverage in 2020?
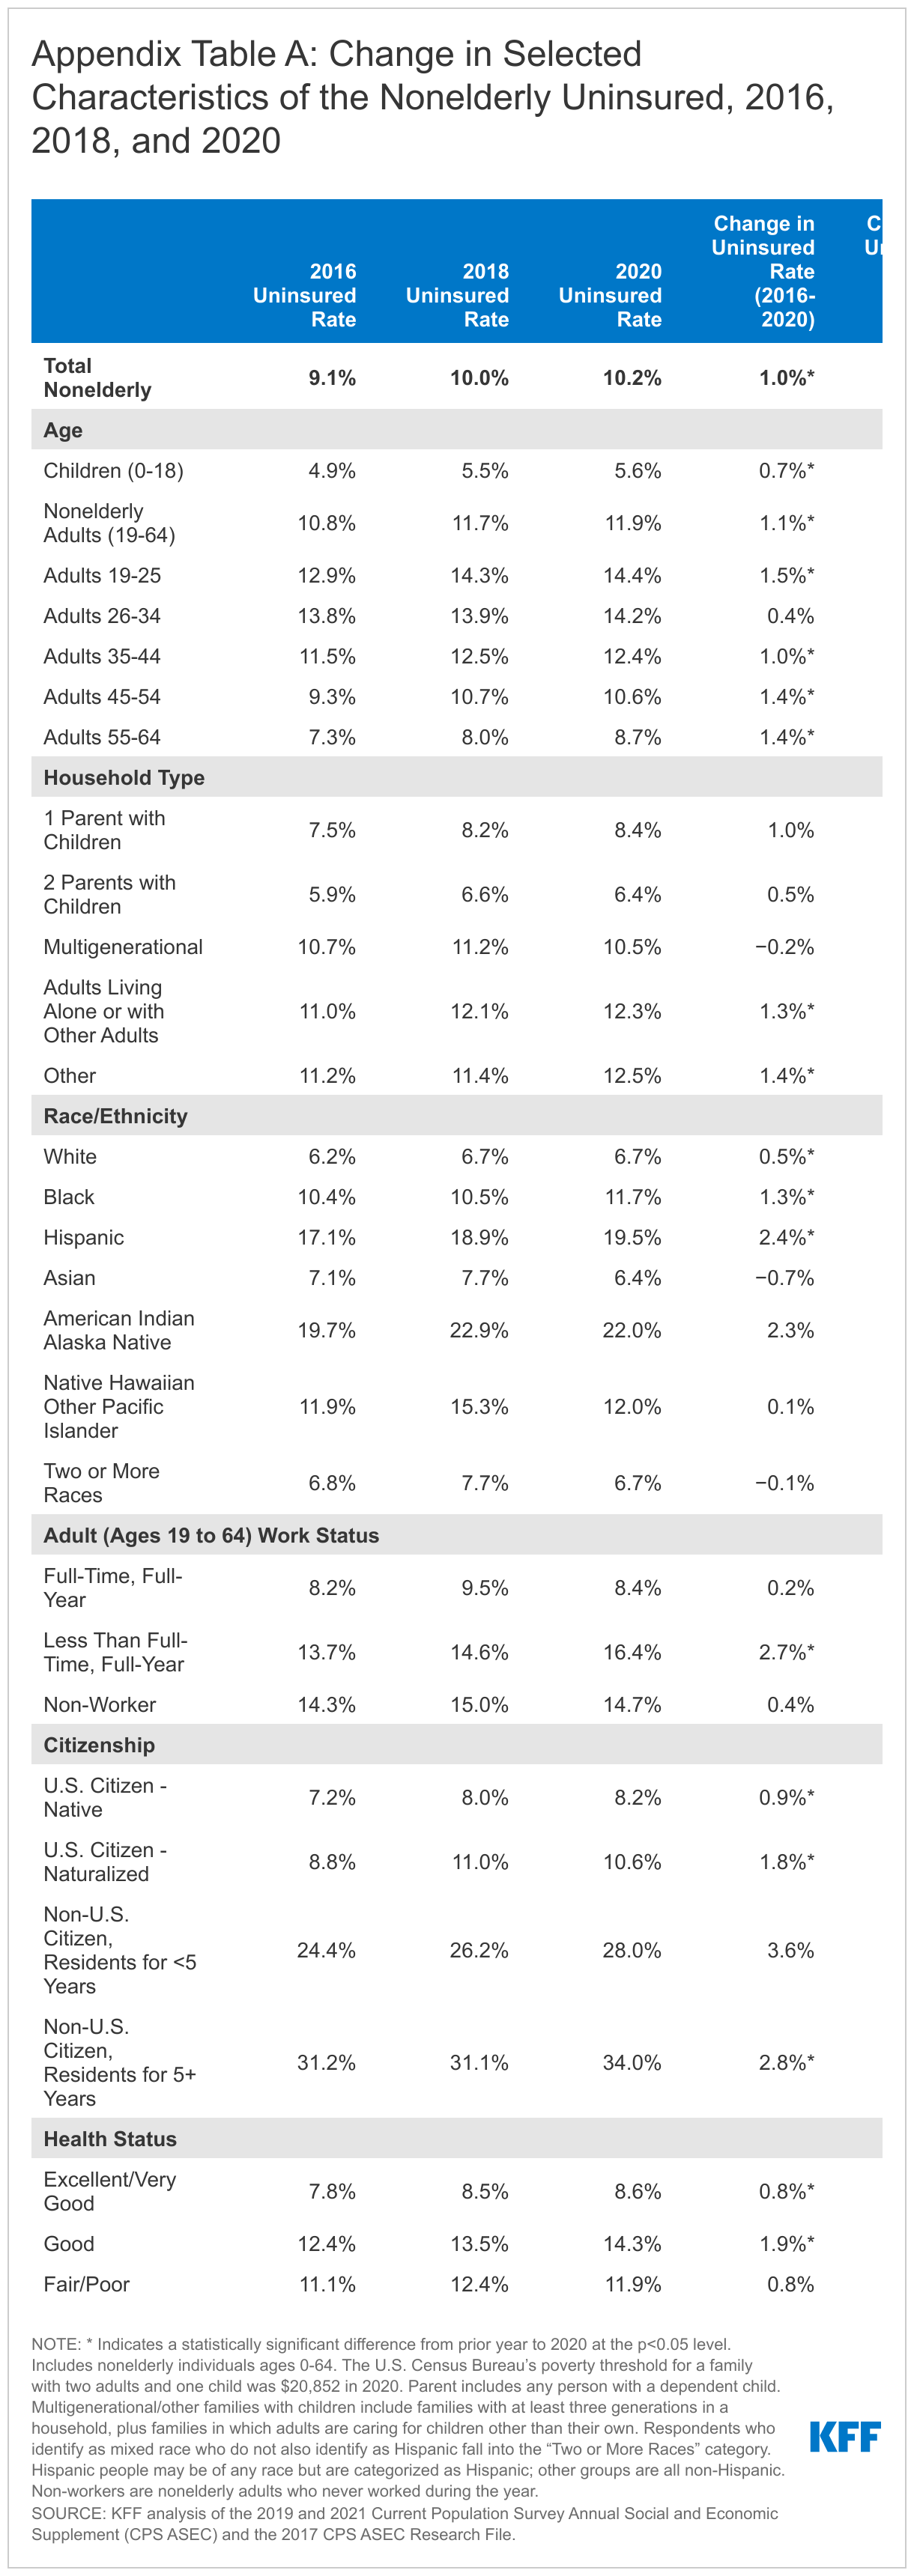
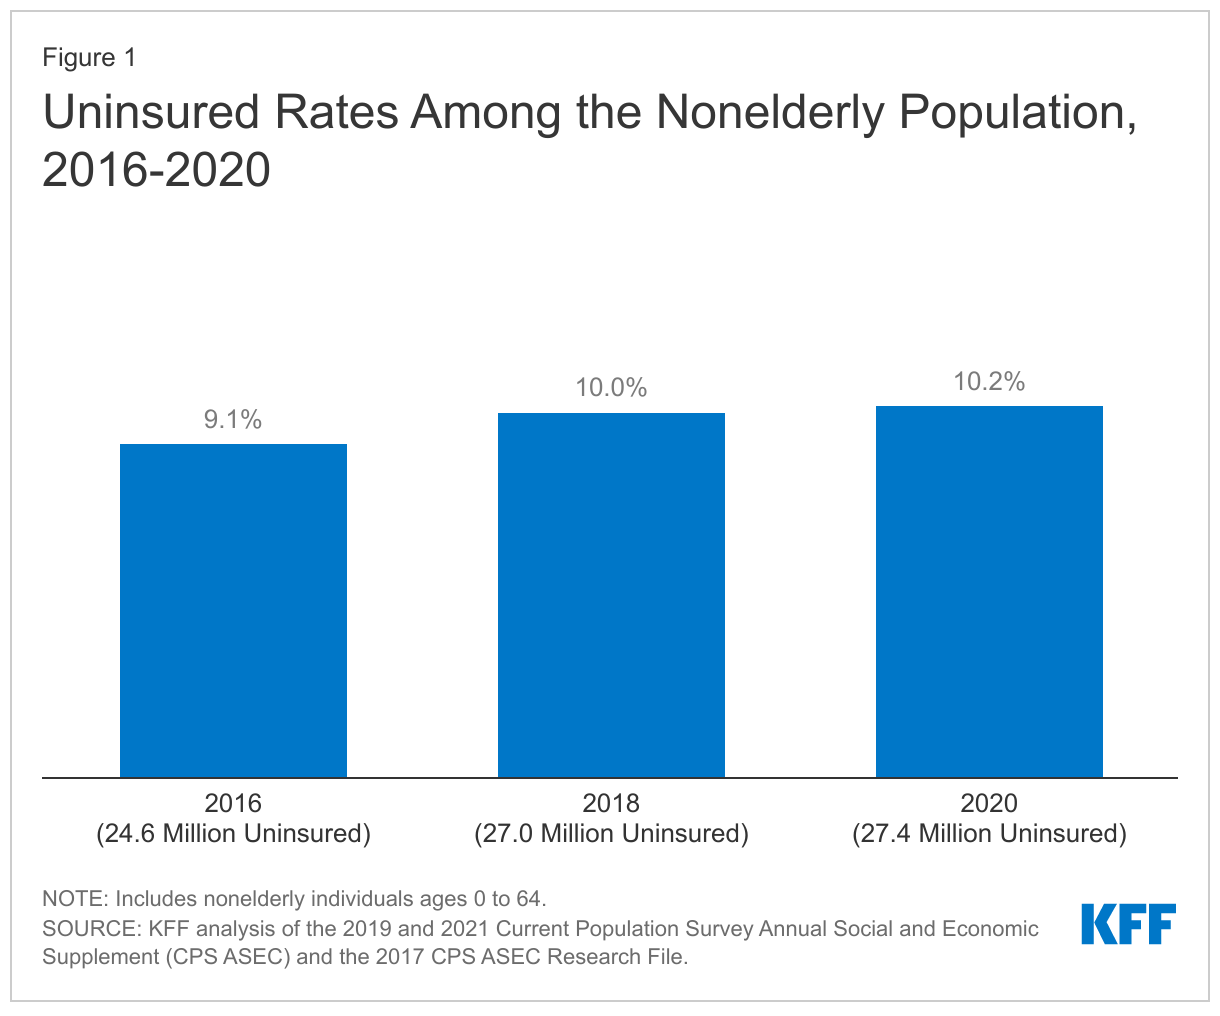
- In 2020, 27.4 million nonelderly people were uninsured, and the uninsured rates was 10.2%. The uninsured rate was unchanged from 2018 but was higher than the uninsured rate in 2016 (9.1%) (Appendix Table A). The number of people who were uninsured in 2020 grew by more than 2.5 million from 2016 (Figure 1).
- Coverage declines in recent years reverse a trend that began following enactment of the ACA in 2010, when coverage for young adults below age 26 and early Medicaid expansion went into effect, and the number of uninsured people and the uninsured rate began to drop. When the major ACA coverage provisions went into effect in 2014, the number of uninsured and uninsured rate dropped dramatically and continued to fall through 2016.
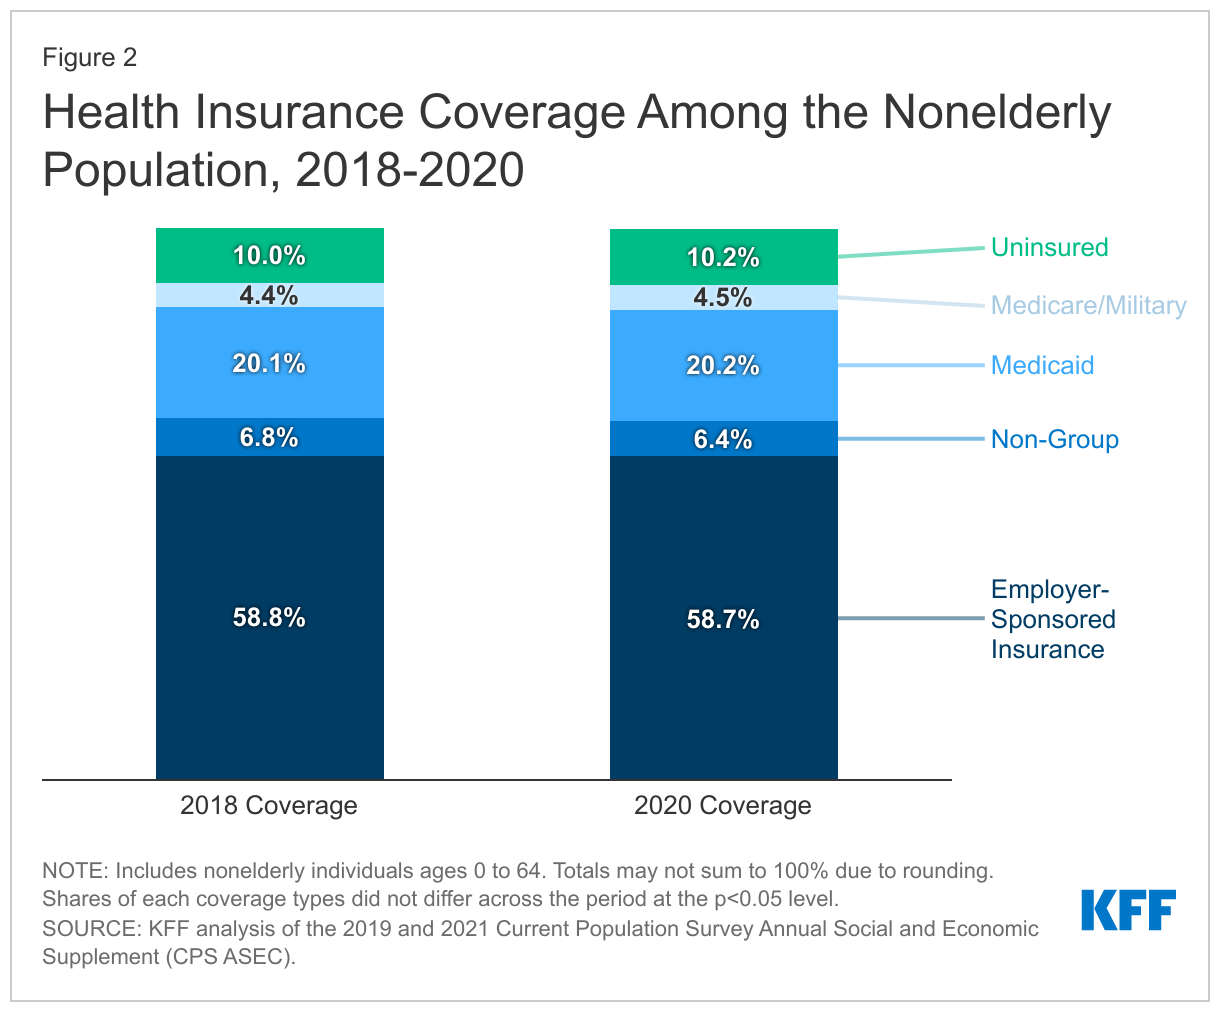
- For the nonelderly population, health coverage type remained surprisingly constant in 2020 compared to 2018. Similar to 2018, 58.7% of the nonelderly population was covered by employer-sponsored insurance, 6.4% purchased non-group coverage, 20.2% had Medicaid, and 4.5% had Medicare or military coverage in 2020 (Figure 2, Appendix Table A).
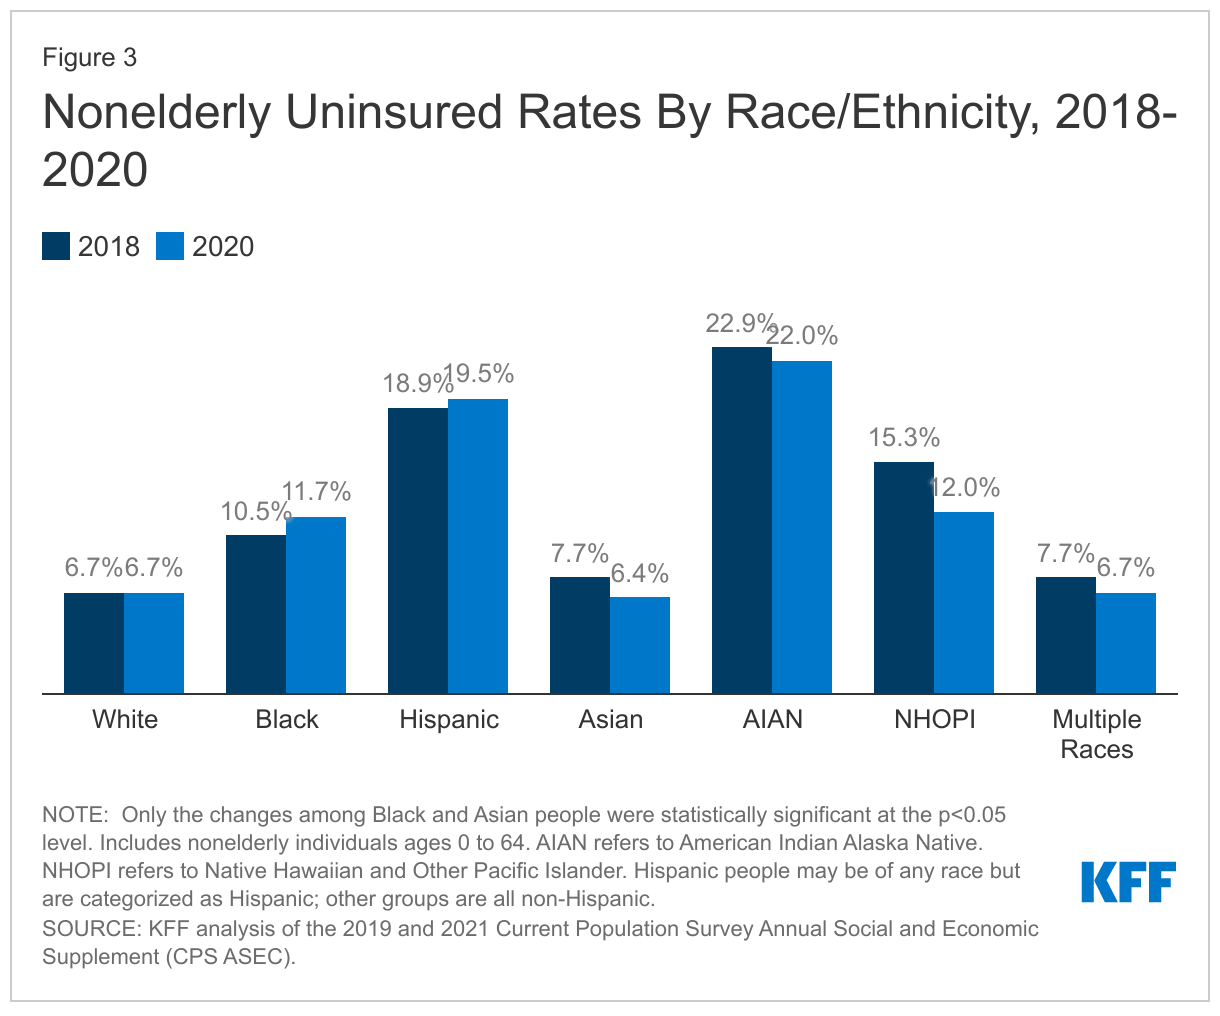
- For most demographic groups, changes in the uninsured rates from 2018 to 2020 were not significantly different. However, the uninsured rate among nonelderly non-Hispanic Black people increased from 10.5% in 2018 to 11.7% in 2020 while the rate for Asian people decreased from 7.7% in 2018 to 6.4% in 2020 (Figure 3).
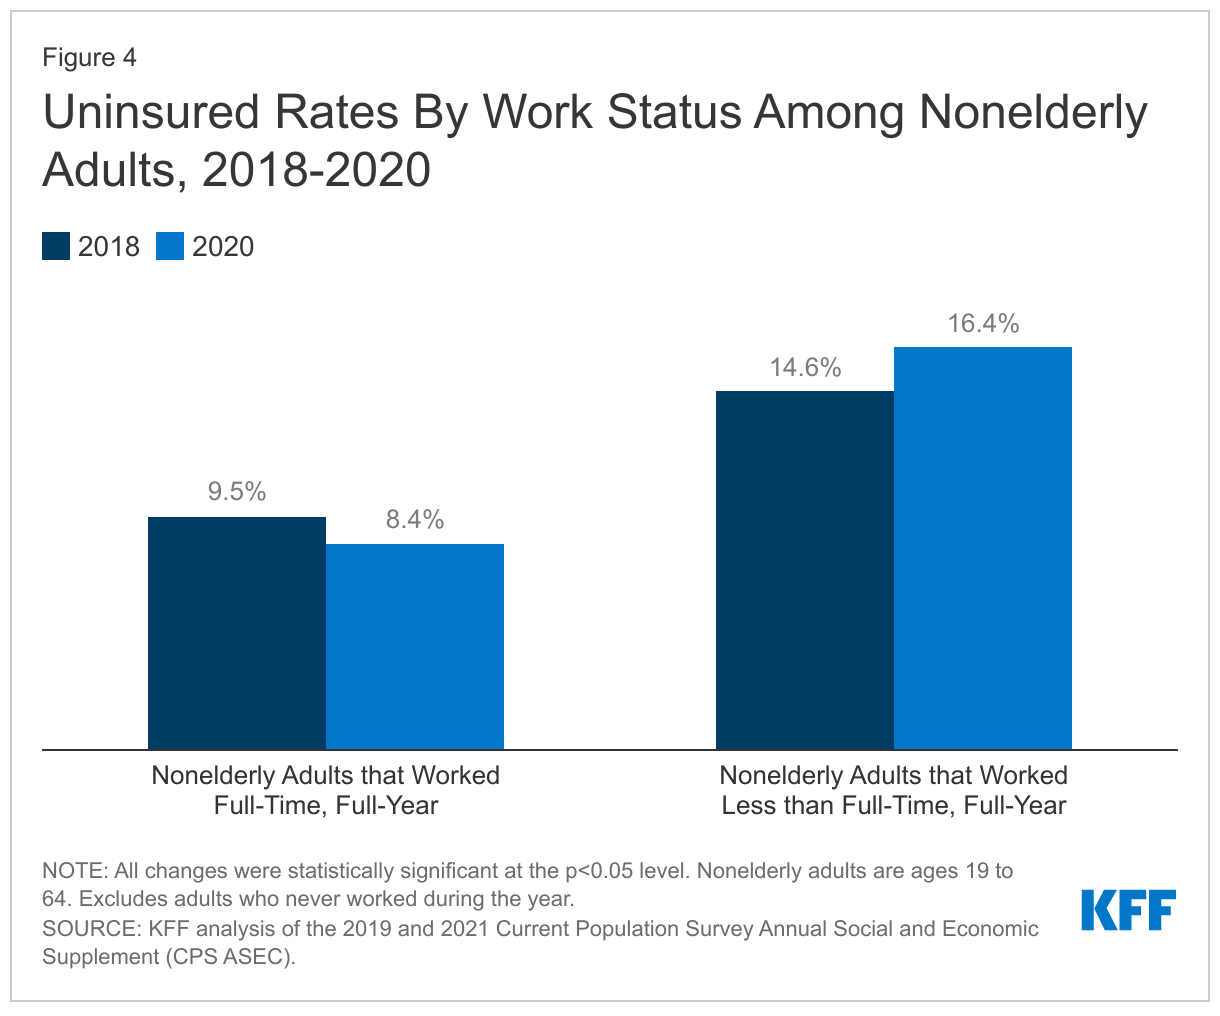
- Having a full-time, full-year job in 2020 reduced the risk of becoming uninsured. Among nonelderly adults working less than full-time full-year, the uninsured rate increased to 16.4% in 2020, up from 14.6% in 2018. In contrast, the uninsured rate for full-time full-year nonelderly adult workers was 8.4% in 2020, a decline of 1.1 percentage points from 2018 (Figure 4).
Who remained uninsured in 2020?
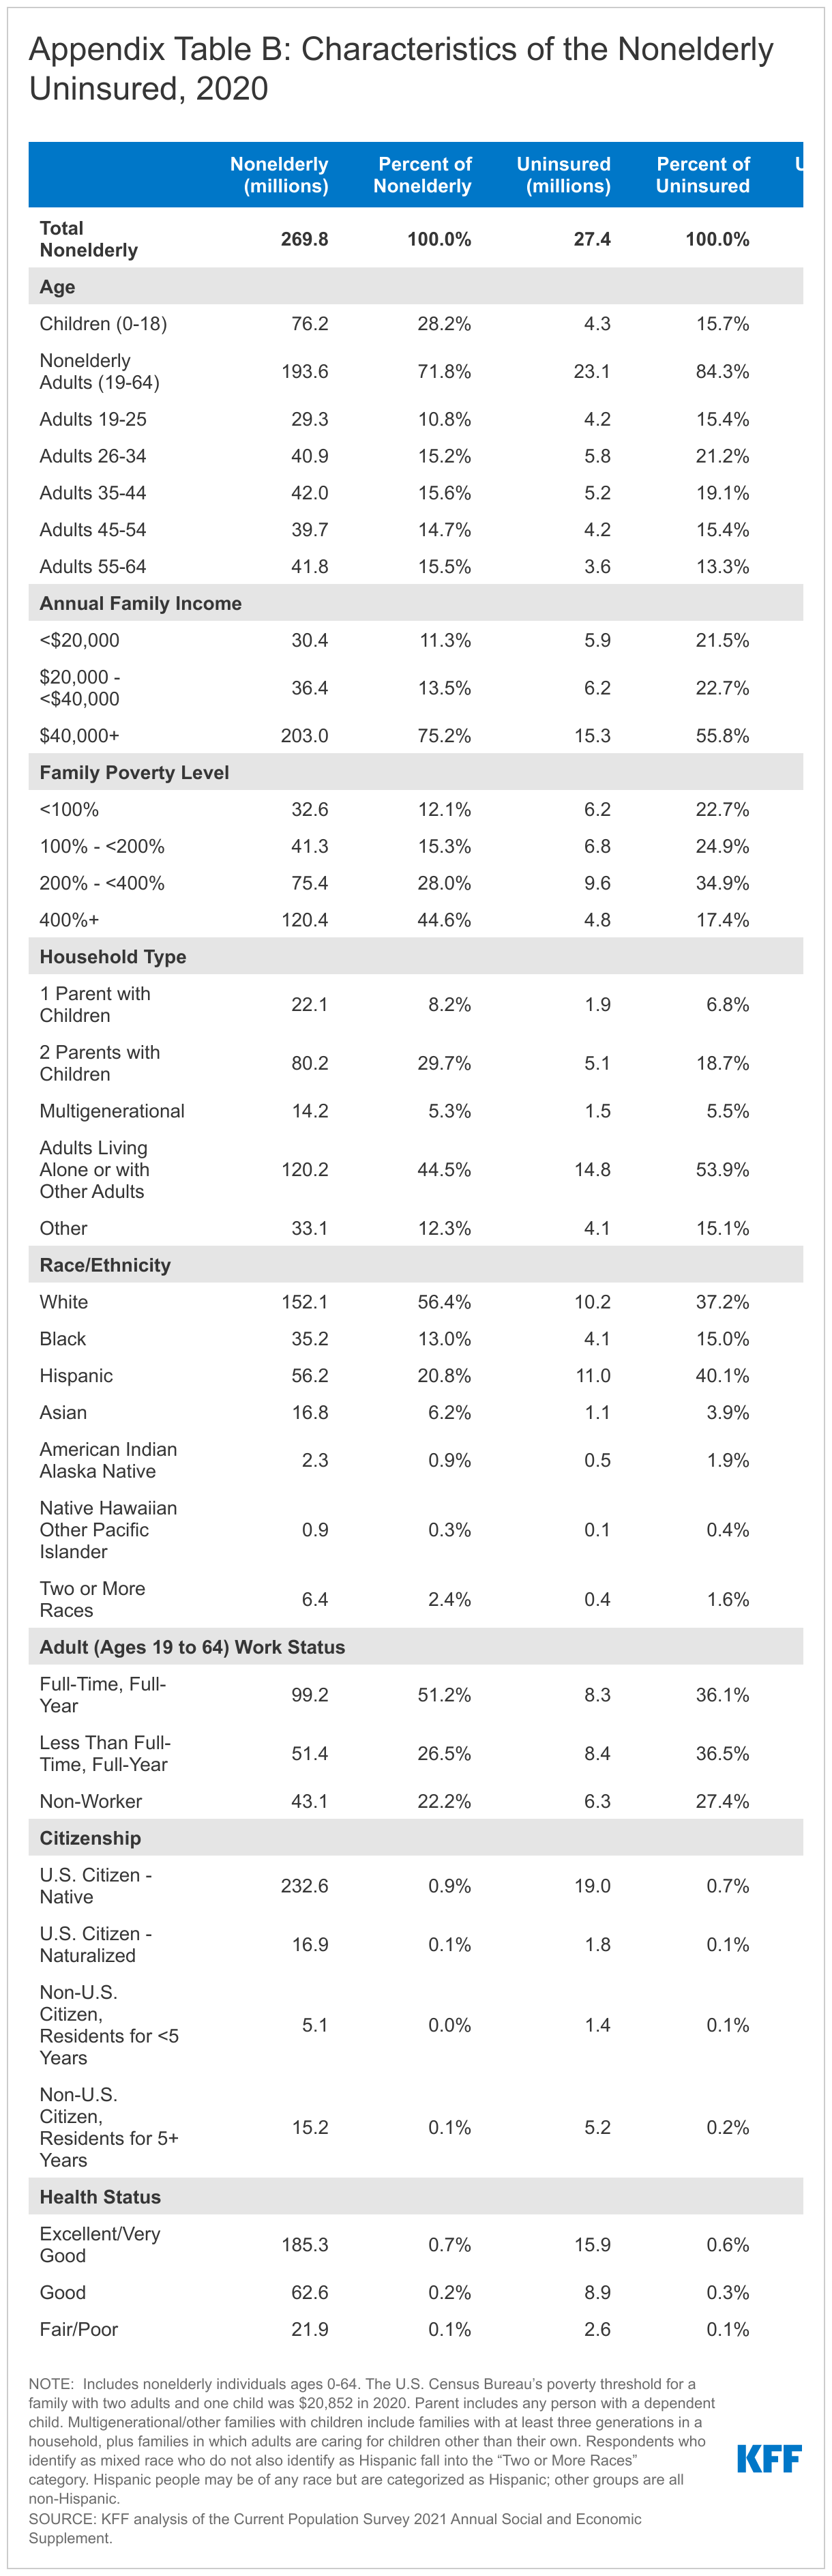
- Most (84.3%) of the nonelderly uninsured are nonelderly adults. The uninsured rate among children was 5.6% in 2020, less than half the rate among nonelderly adults (11.9%), largely due to broader availability of Medicaid and CHIP coverage for children than for adults (Appendix Table B).
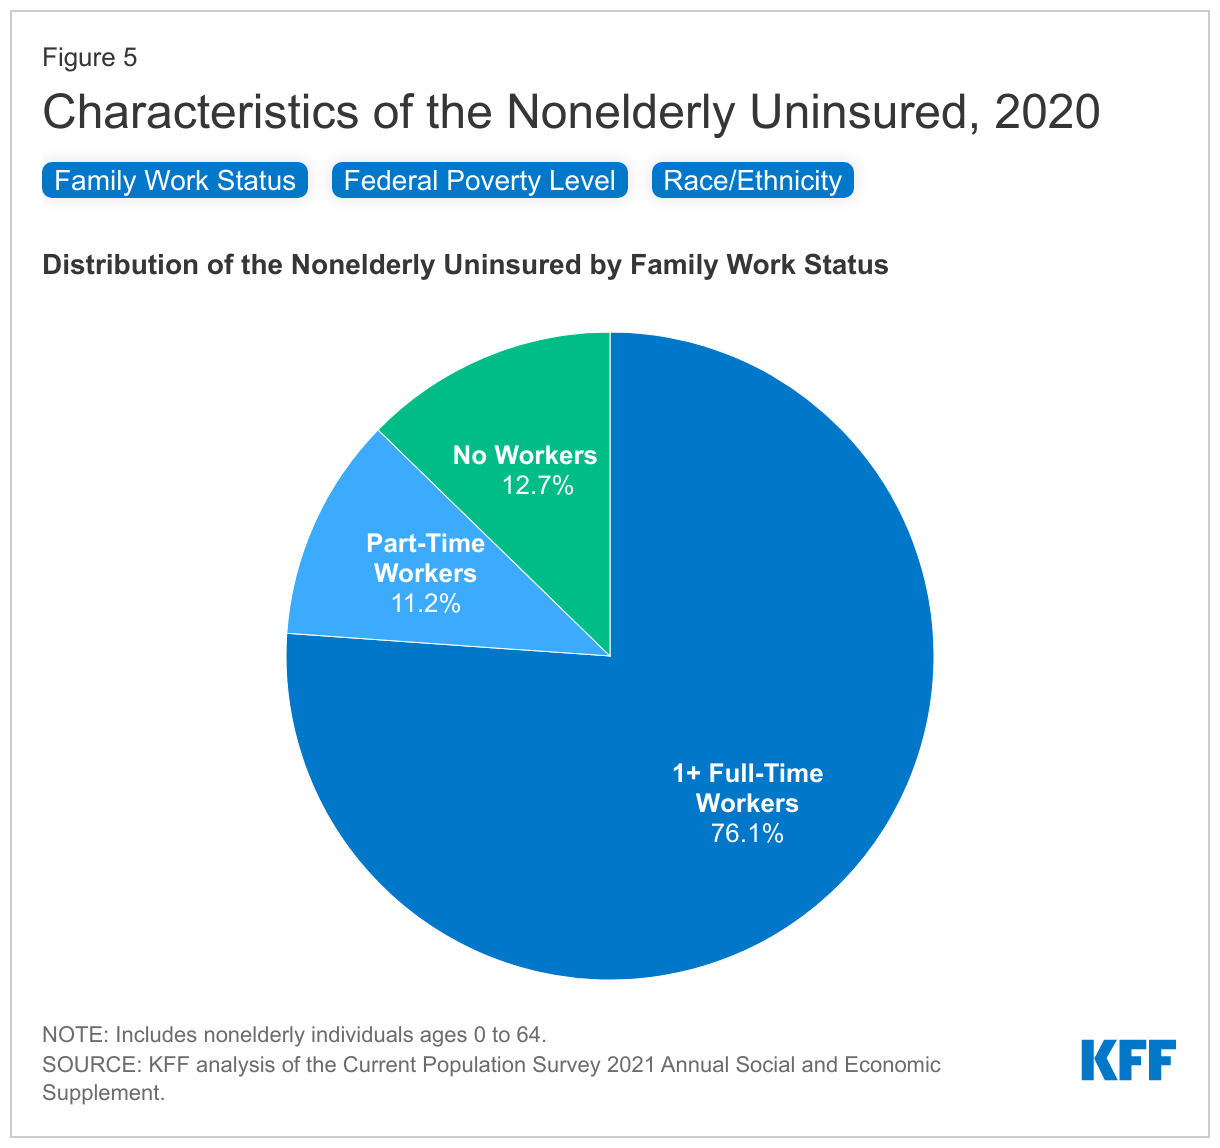
- In 2020, over three quarters of uninsured individuals (76.1%) had at least one full-time worker in their family and an additional 11.2% had a part-time worker in their family (Figure 5).
- Individuals with income below 200% of the Federal Poverty Level (FPL; the federal poverty level was $20,852 for a family of two adults and a child in 2020) are at the highest risk of being uninsured. In total, more than eight in ten (82.6%) uninsured people were in families with incomes below 400% of poverty in 2020 (Figure 5).
- People of color make up 43.6% of the nonelderly population, but account for over six in ten (62.8%) of the uninsured population in 2020. Hispanic people comprised the largest share of the uninsured (40.1%) while 37.2% of the uninsured are non-Hispanic White people (Figure 5). In general, people of color are at higher risk of being uninsured than White people. Hispanic, Black, and American Indian/Alaska Native people all have significantly higher uninsured rates than White people (6.7%) (Figure 3).
Discussion
Despite a public health crisis that caused significant economic turmoil, the CPS data indicate that health coverage during 2020 was relatively stable compared to before the pandemic. According to the data, the uninsured rate did not increase, and the share of people with private coverage through an employer and purchased directly in the individual market as well as those with Medicaid coverage did not change compared to 2018. While coverage overall was steady, certain groups experienced a greater risk of becoming uninsured in 2020, including nonelderly Black individuals and nonelderly adults who worked less than full-time.
The survey findings are consistent with other analyses of health coverage changes during 2020 that suggest job losses were higher than declines in employer-sponsored coverage. These analyses conclude that job losses occurred primarily among lower income workers who were less likely to obtain health coverage through their employer. Consequently, these individuals did not lose employment-based coverage when they lost their jobs. They may have already been uninsured or had coverage through another source, such as Medicaid or the ACA Marketplace. Also, some people who lost their jobs were placed on temporary furlough, and employers may have continued their health benefits. Additionally recent increases in Marketplace coverage, driven in part by more generous subsidies made available by the American Rescue Plan Act, occurred during 2021 and would not be captured in the 2020 data. However, administrative data suggests declines in employer coverage were somewhat larger than suggested by the CPS.
However, the survey findings are somewhat less consistent with administrative data showing large increases in Medicaid enrollment during the pandemic. Following implementation of the ACA’s Medicaid expansion, enrollment in Medicaid increased as many low-income working adults who did not have coverage through their jobs became eligible for Medicaid. While enrollment dropped in 2019, administrative data indicate Medicaid enrollment has grown by nearly 15% since the start of the pandemic. From 2018 to 2020, average monthly Medicaid enrollment increased by 4% according to administrative data, an increase not mirrored in the CPS. Provisions in the Families First Coronavirus Response Act (FFCRA) that require states to ensure continuous coverage for those enrolled in Medicaid as of March 18, 2020 to be eligible for enhanced federal Medicaid matching funds during the COVID-19 public health emergency (PHE) contributed to the enrollment growth.
Some of the discrepancies noted above may be related to the way in which the survey counts uninsured people or to ongoing challenges with response rates. The CPS counts people as uninsured if they lack coverage for the full year and thus does not capture those who may have lost insurance during the year. Other analyses of monthly data on health coverage from the CPS ASEC shows that a higher share of adults were uninsured for part of the year in 2020 compared to 2018, indicating that adults may have been more likely to lose coverage in 2020 than in 2018 (rates of part-year coverage for children were the same in 2018 and 2020). Also, KFF analysis of the March 2021 point-in-time coverage estimates shows a higher uninsured rate (10.8% as March 2021 versus 10.2% for full-year 2020), further indicating some loss of coverage due to the pandemic. In addition, though the Census Bureau made adjustments in the 2020 data collection to account for ongoing issues with response rates, there is evidence suggesting that the nonresponse bias persists with the 2020 data, especially among lower income individuals. The CPS also relies on respondents self-reporting their health coverage, which may not match administrative data.
As the US moves forward from the pandemic, continuing economic challenges and the unwinding of the PHE could lead to coverage disruptions in the coming year. Although the economy is rebounding, not all of the new jobs provide health coverage. Additionally, when the continuous coverage requirements in Medicaid end, states will need to redetermine eligibility for current enrollees, a process that can lead to loss of coverage even among those who remain eligible. Continued efforts will be important to ensure people who may be at risk of losing coverage are aware of and connected to potential alternative coverage options.
Appendix