Medicaid Administrative Data: Challenges with Race, Ethnicity, and Other Demographic Variables
There are persistent disparities in health and health care for people of color, which reflect structural and systemic inequities rooted in racism and discrimination. Inadequate, incomplete, and inconsistent race/ethnicity data is a longstanding challenge across many areas of health care. High-quality comprehensive data are key to enabling policymakers, community leaders, and other key stakeholders to identify and address these inequities and measure progress over time.
Medicaid and the Children’s Health Insurance Program (CHIP) provide health care coverage to low-income adults and children, and play a disproportionately large role in covering people of color, people experiencing poverty, individuals with limited English proficiency, and those who live at intersections of these characteristics. Medicaid/CHIP administrative data, also known as Transformed Medicaid Statistical Information System (T-MSIS) or TAF (T-MSIS Analytic File), hold the potential to inform disparities research through detailed demographic, service utilization, and spending data of Medicaid and CHIP beneficiaries —but there are current limitations. Key demographic variables, particularly race and ethnicity, vary in completeness and quality, raising questions about data usability and reliability. These quality issues may impede T-MSIS analytic file users’ abilities to understand racial and ethnic disparities and advance health equity among Medicaid and CHIP beneficiaries. In this issue brief, we use the Medicaid DQ Atlas and T-MSIS analytic files to examine the data quality of race/ethnicity and other demographic variables in calendar year (CY) 2019 T-MSIS data.
What is T-MSIS?
T-MSIS Analytic Files (TAF) provide beneficiary-level data including health care use, demographics, and enrollment data for Medicaid and CHIP enrollees in all 50 states, District of Columbia, Puerto Rico, Guam, and Virgin Islands. T-MSIS replaced the Medicaid Statistical Information System (MSIS) by 2016 and analytic files became available to researchers in Fall 2019. T-MSIS builds on data collected in MSIS to include: enhanced information about beneficiary eligibility; beneficiary demographics; provider data; fee-for-service and managed care service utilization; expenditure data for Medicaid and CHIP; and more. However, quality issues limit its full potential.
Variation of state data collection, naming, and categorization procedures, as well as state-specific data challenges contribute to T-MSIS quality issues. While federal requirements mandate some aspects of coverage and operation of Medicaid and CHIP programs, states have a great deal of flexibility in implementation and administration of their state’s program. This variation is reflected in state data systems, with each state collecting, categorizing, and storing data somewhat differently. For example, states vary in the number of categories they use to collect race/ethnicity data, as well as how these variables are named and combined to create aggregated race/ethnicity categories that conform to federal Office of Management and Budget (OMB) racial and ethnic data reporting standards. Furthermore, each state may individually have its own data quality problems, which, if left unnoticed or unresolved, may affect T-MSIS data quality unless they are caught by CMS’s efforts to improve data quality.
How do states collect race/ethnicity and how are these data presented in T-MSIS analytic files?
All Medicaid/CHIP agencies ask applicants to self-report their race and ethnicity, but it is not mandatory for applicants to do so. During Medicaid or CHIP eligibility determinations, race and ethnicity are not considered, and data not being used in Medicaid determinations must remain optional for applicants to report. States must indicate that submitting race/ethnicity data is optional, but this can lead to missing data, particularly if the instructions and rationale for providing race/ethnicity data are unclear, if the applicant has concerns or questions about how the data may be used, or if they do not feel they fit into one of the options provided.
The categories of race and ethnicity variables on Medicaid applications vary considerably across states. At a minimum, states are required to comply with 1997 OMB guidelines for race (5 categories) and ethnicity (2 categories) reporting standards, but can opt to collect more detailed data if it can be consolidated into the minimum reporting categories. An audit of state Medicaid enrollment applications conducted by State Health Access Data Assistance Center (SHADAC) revealed substantial variation in the number and type of race/ethnicity categories used by states, ranging from 5 to 37 race categories and 2 to 8 ethnicity categories. Since some states presented one set of categories in the online version of the application and a different set in the paper applications, the audit identified 62 unique race categories across the 50 states included in the analysis.
States also vary in the instructions and rationale provided to beneficiaries for reporting race/ethnicity data. Below, we highlight select examples of these instructions from SHADAC’s review of Medicaid applications:
You don’t have to answer this question. In most cases, your answer won’t be used to make a decision. But, if this person is American Indian or Alaska Native, telling us here may help this person get the most help possible.” – Florida’s Medicaid application instructions
“Providing your race and ethnicity can be helpful since it can speed up the application process. It may be used to automatically create your case.” – Delaware’s Medicaid application instructions
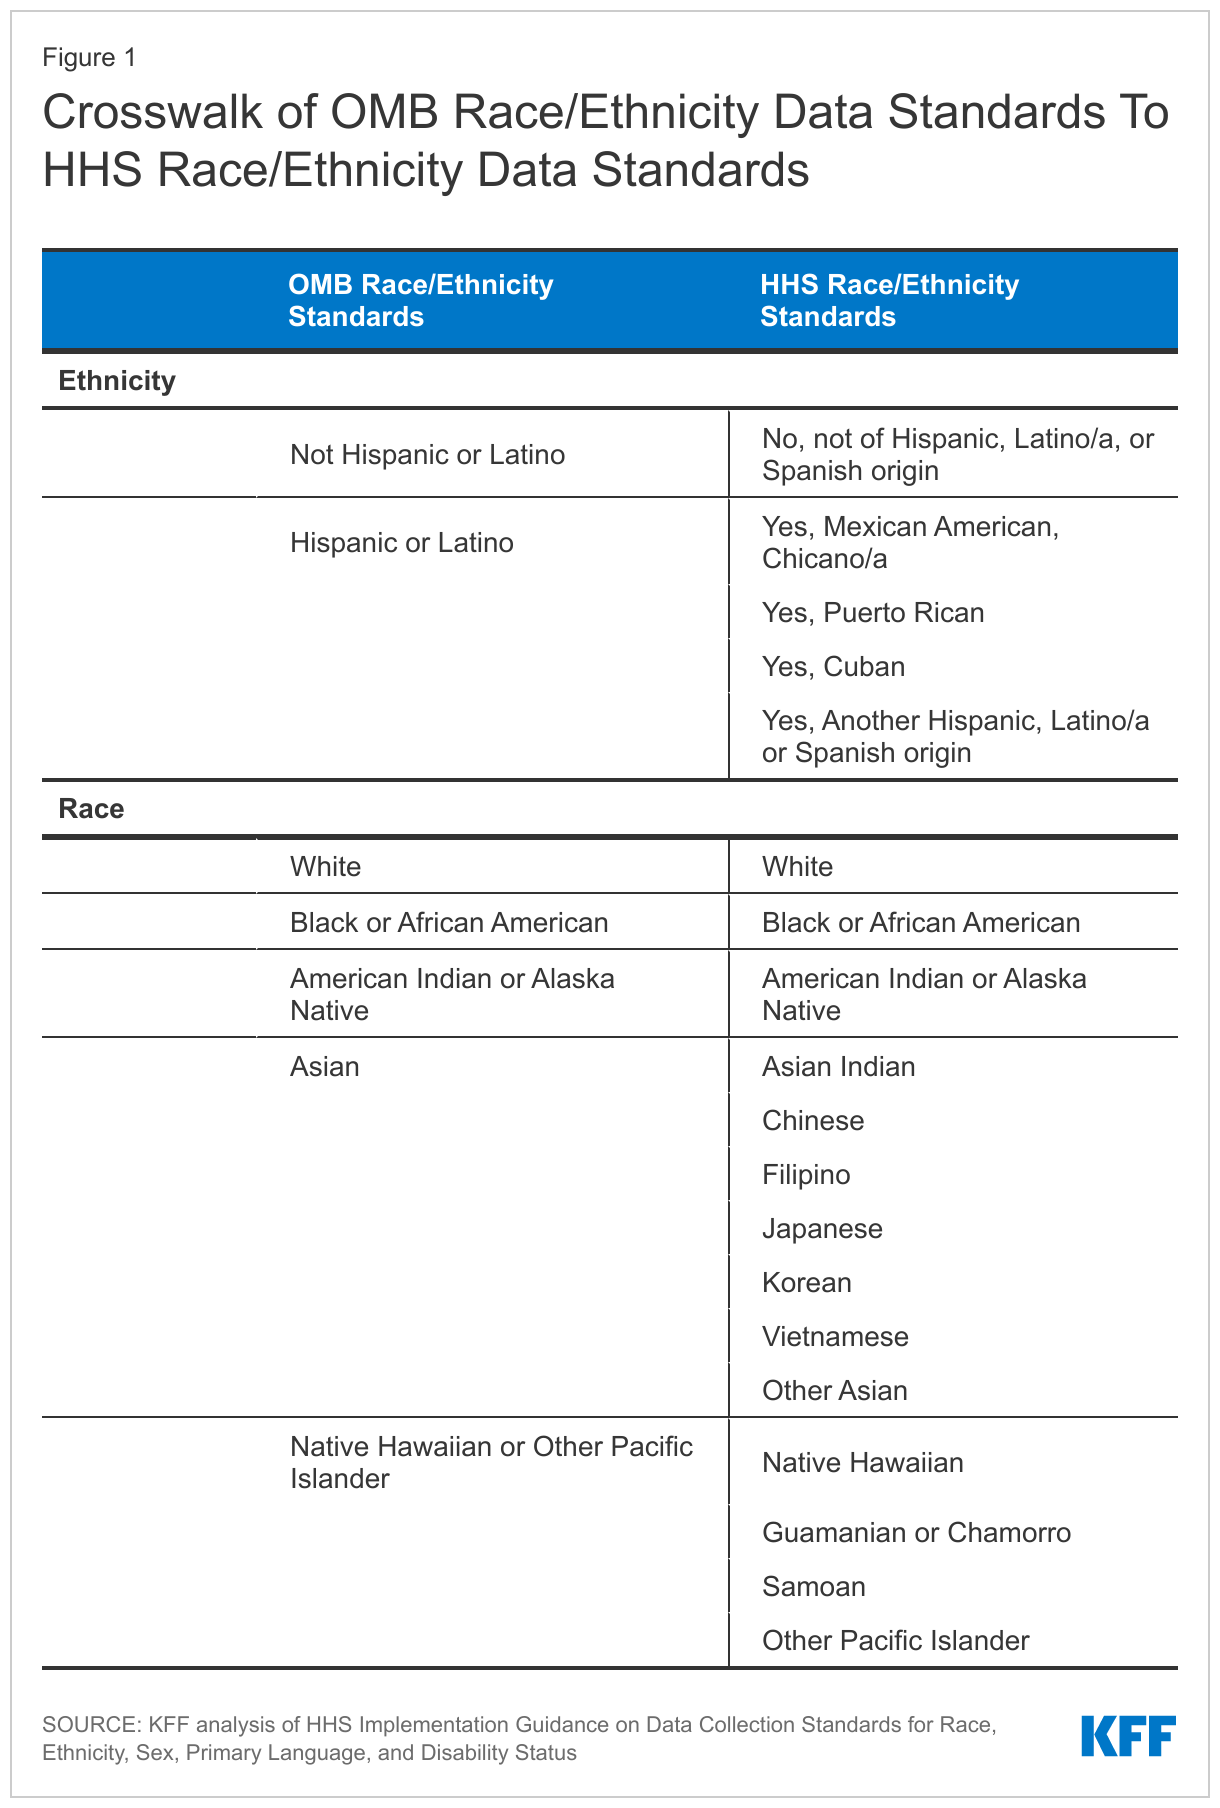
Given the substantial differences in how states collect data on race and ethnicity, CMS provides technical instructions to states about reporting race and ethnicity when submitting T-MSIS data. T-MSIS race and ethnicity data elements align with the 2011 HHS data standards. These categories may be more granular than some states’ Medicaid applications since states are only required to collect the less granular OMB standard values, though that is not always the case. Current OMB guidelines define ethnicity in two categories and race in five categories. The more detailed HHS standards reports race in 14 categories and ethnicity in five categories (Table 1).
The race and ethnicity data that states submit to T-MSIS are then converted into several key race and/or ethnicity variables available to researchers in the T-MSIS analytic files (TAF). Variables available to TAF users include: 1) a constructed seven-category combined race and Hispanic ethnicity variable (White, non-Hispanic; Black, non-Hispanic; Asian, non-Hispanic; American Indian and Alaska Native (AIAN), non-Hispanic; Hawaiian/Pacific Islander; Multiracial, non-Hispanic; Hispanic, all races); 2) a six-category Hispanic ethnicity variable; and 3) a disaggregated, constructed 20-category combined race and ethnicity variable, which includes seven ethnic categories for people of Asian descent, and four ethnic categories for Native Hawaiian and Pacific Islander people, in addition to the broader race and Hispanic ethnicity categories. The TAF does not include a variable that reports race solely.
How reliable are the T-MSIS race/ethnicity data?
To help TAF users evaluate the data quality of various measures, the Data Quality Atlas (DQ Atlas) was developed as a companion to T-MSIS data. The DQ Atlas, which is available for each year and release of data, provides data quality information about some, but not all, of the variables available in T-MSIS analytic files. One key data element the DQ Atlas provides is usability measures on race/ethnicity data. The DQ Atlas evaluates the completeness of race and ethnicity information in the T-MSIS analytic files and compares the T-MSIS estimates to the U.S. Census Bureau’s American Community Survey (ACS). Substantial missing data and/or data that do not line up with ACS estimates raise red flags about data quality. The DQ Atlas combines these two indicators of data quality to generate an overall rating system to alert researchers about the level of data concern. States are grouped into the following categories: low concern, medium concern, high concern, unusable, and unclassified. While many data elements in the DQ Atlas are evaluated using external benchmarks, some are only evaluated on the basis of missingness since not all measures have an external benchmark.
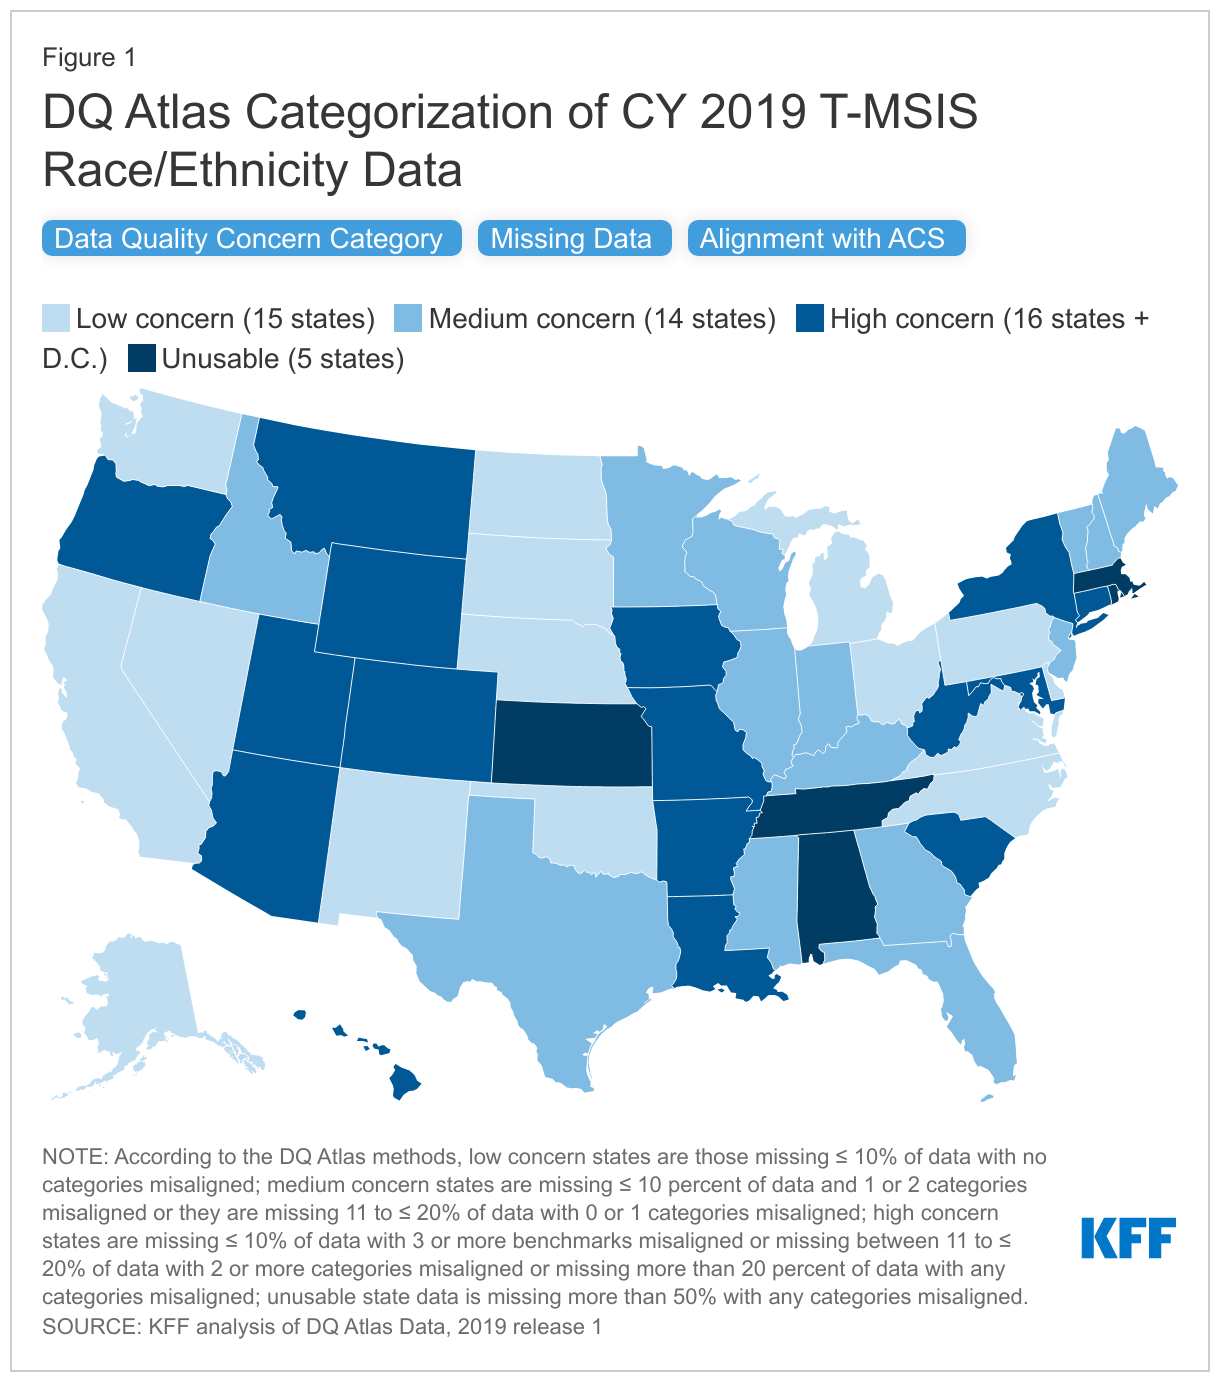
In the 2019 T-MSIS analytic file, over 70% of states (36 of 50 states plus D.C.) had race/ethnicity data categorized as medium concern, high concern, or unusable in the DQ Atlas (Figure 1). Only 15 states’ race/ethnicity data in T-MSIS analytic files were categorized as “low concern” in 2019. The DQ Atlas combines two measures to categorize states into concern categories: 1) missingness of the race/ethnicity variable and 2) alignment with ACS race/ethnicity estimates.
- When examining missingness separately, the DQ Atlas finds that missing race/ethnicity data varies widely by state, ranging from 0% to 100% missing, with a national average of 22% missing. Over half of all states, including D.C., (63%) are missing more than 10% of race and ethnicity data (Figure 1).
- When comparing separately to the ACS race/ethnicity benchmarks, the DQ Atlas finds that over half of states (55%) have one or more categories of race/ethnicity that are not aligned with race/ethnicity estimates from the American Community Survey (Figure 1). When T-MSIS race/ethnicity differs more than 10 percentage points from ACS race/ethnicity data, it is considered not aligned.
Similar analyses have been conducted by Medicaid and CHIP Payment and Access Commission (MACPAC), one of which identified race and ethnicity data as an area with “ongoing analytical challenges.”
CMS technical instructions note that there may be additional challenges when individuals select multiple races or ethnicity categories. Growing numbers of people are reporting they are “some other race” or “multiracial,” but some states only allow beneficiaries to report a single “multiracial” or “other” category instead of selecting multiple races. People who report more than one race are often grouped into a “multiracial” or “other’ category in reporting, limiting the ability to meaningfully interpret the data. States may also have technical challenges with reporting data to T-MSIS in cases when applicants select multiple races or ethnicities.
Are there other options for evaluating quality of T-MSIS race/ethnicity data?
Researchers can use the DQ Atlas’ categorizations to identify states with low data quality. In some cases, however, this may restrict sample sizes. For example, 15 states, representing approximately 37 million Medicaid beneficiaries, reported race/ethnicity data that were considered of low concern in CY 2019, according to the DQ Atlas (Figure 1). There are several other options to evaluate the quality of T-MSIS race/ethnicity and, in some cases, increase the analytic sample.
- Increasing the threshold for missingness for states where T-MSIS data match ACS benchmarks. It may be possible to include states where missing data is slightly above 10% but all race/ethnicity estimates align with ACS reporting. There are eight states with an average of 12% of data missing whose race/ethnicity estimates are considered aligned with the ACS benchmarks (i.e., estimates within 10 percentage points). These states are currently categorized as “medium concern” because their missingness is just above the 10% threshold. However, including data from these states would add 8 additional states, and 17.4 million additional beneficiaries.
- Adjusting alignment thresholds for ACS and T-MSIS race and ethnicity estimates. Although some states’ race and ethnicity data are closely aligned with ACS data, they are just above DQ Atlas’ threshold for allowable percentage point difference between estimates (i.e. estimates within 10 percentage points). State-level percent differences in estimate between ACS and T-MSIS vary from 0% to 61.8%, with an average misalignment of 5.6% overall. Slight increases to the allowable thresholds may result in increases to the usable sample. For example, increasing the allowable percentage point difference to 11.0 (from 10 percentage points) would result in four additional states where all race/ethnicity data match ACS benchmarks.
- Broadening the definition of usable data. MACPAC, for example, cites that the DQ Atlas data quality categorizations of ‘low concern’ or ‘medium concern’ meet MACPAC’s minimum data standards for analysis. By adopting this approach to include states with low and medium concern data, the number of states that can be included in analyses using disaggregated race/ethnicity data increases to 29 and represents about 63.8 million Medicaid beneficiaries, when using 2019 Release 1 TAF data (users with access to more recent T-MSIS data may show a higher number of states categorized as low or medium concern). For researchers who adopt MACPAC’s approach, it may be helpful to consider the level of misalignment on a state-by-state basis. Specifically, DQ Atlas categorizes states with less than 10% of missing data and two or less misaligned race/ethnicity groups as medium concern. Aside from the definition of misalignment (that is, estimates that differ by at least 10 percentage points), the DQ Atlas does not account for the level of race/ethnicity group misalignment, which varies by up to 61 percentage points.
- Other researchers have explored methods for imputing missing race/ethnicity data, but these methods can require identified data and are subject to their own set of drawbacks and considerations.
What information is available for other variables important for disparities and equity research?
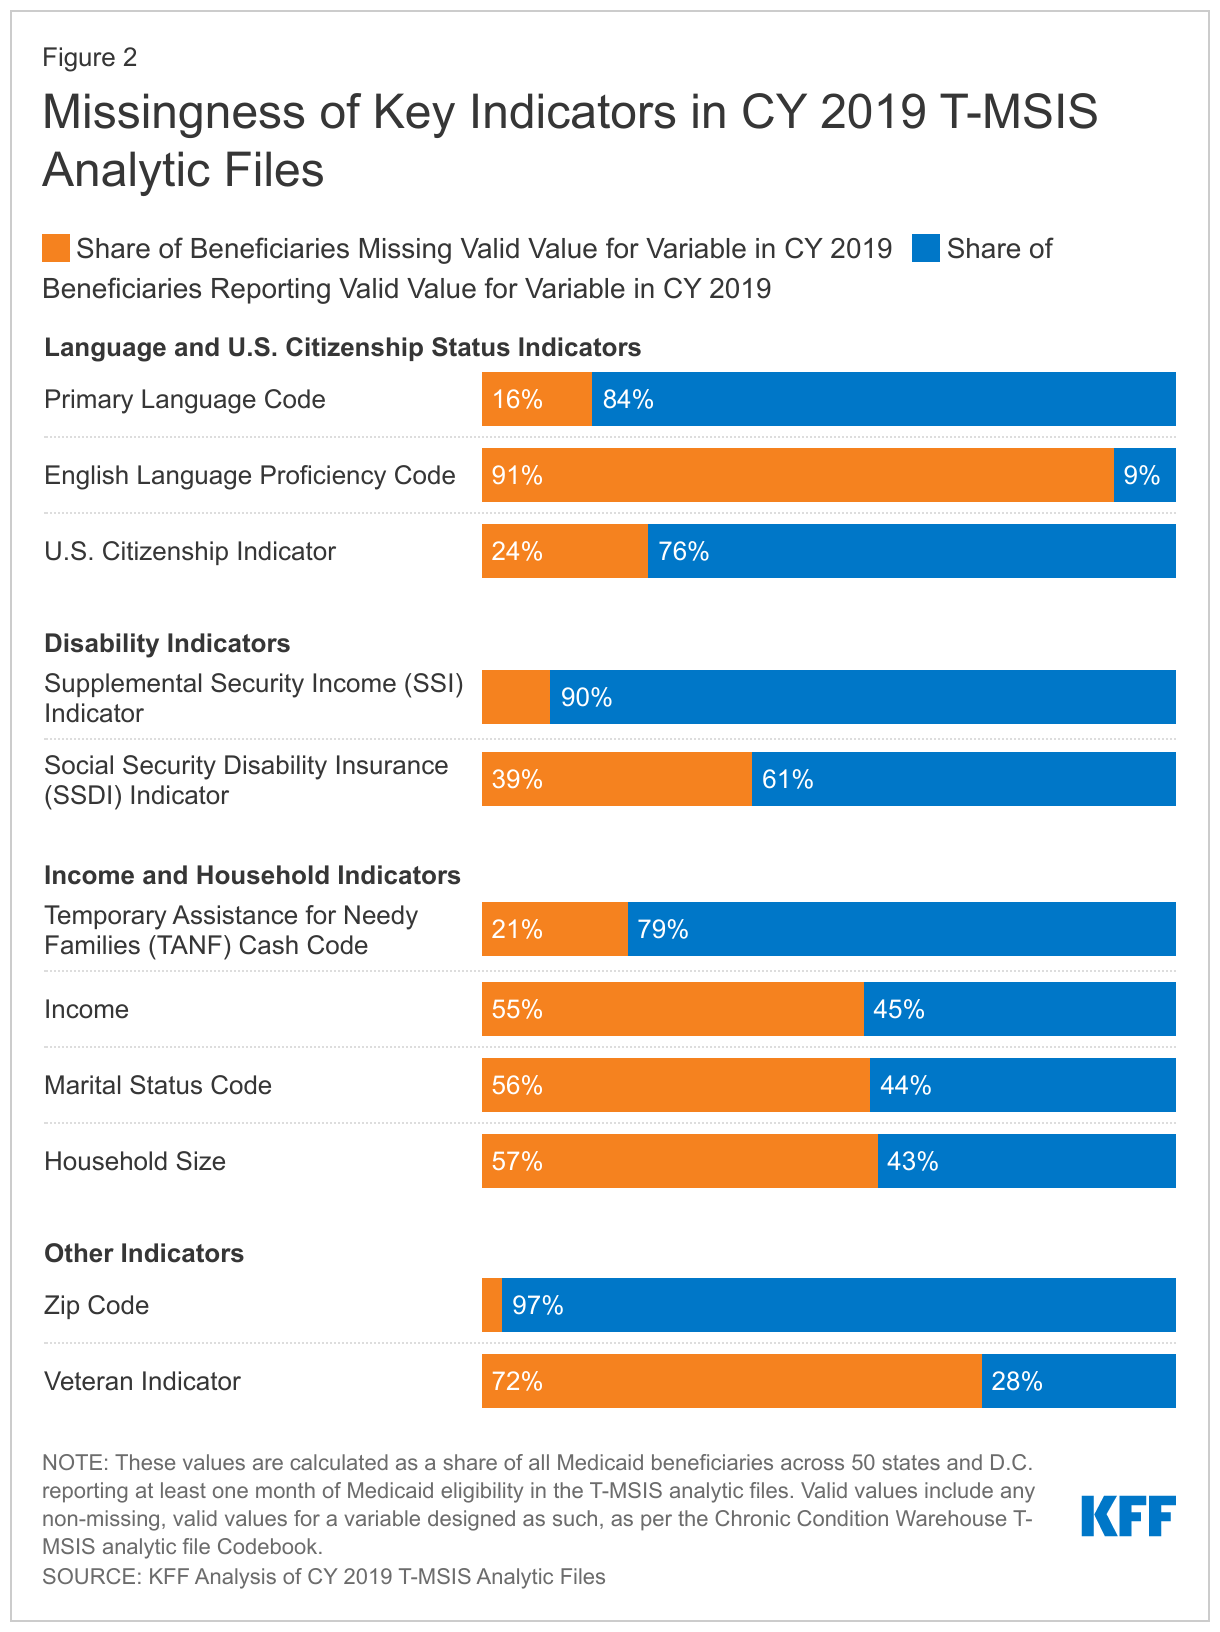
T-MSIS analytic files include additional variables that are important for disparities and equity research, though less information is available about state data collection methods. In addition to race and ethnicity, T-MSIS includes beneficiary-level metrics on income, gender, age, primary language, English language proficiency, citizenship, receipt of Supplemental Security Income or Temporary Assistance for Needy Families, zip code, veteran status, and indicators of disability. While information on state data collection procedures for these other variables is more limited, a recent audit of state applications found most states collect primary language information on their applications, and some states also inquire separately about written language.
KFF analysis of CY 2019 T-MSIS analytic files finds wide variation in the magnitude of missing data across key indicators that are also important for equity research (Figure 2). Across all 50 states and D.C., zip code and SSI indicator have relatively low levels of missing data (3% and 10% missing, respectively), whereas other variables, such as English language proficiency and veteran status have very high levels of missing data (91% and 72% complete, respectively).
Looking Ahead
As a major source of health coverage for people of color, Medicaid can play a significant role in helping to address racial and ethnic health disparities. Prioritizing comprehensive and high-quality data on race and ethnicity is important to these efforts. Inadequate data can result in the failure to identify disparities or the implementation of policies that may exacerbate disparities and reinforce structural racism and inequities across the health care system. Most states are engaged in Medicaid initiatives to address racial and ethnic disparities, with some states focusing on racial and ethnic disparities in specific outcomes, like maternal/infant health and behavioral health. High quality and complete data, including measures of health equity, will be key for implementing and assessing the impacts of these efforts.
CMS has identified T-MSIS priority items to guide data quality improvement efforts, some of which include race/ethnicity and other variables. Other federal agencies, such as the Office of Inspector General, are taking notice and launching their own inquiries into data quality issues. States can also take action to improve data quality. An NORC analysis highlighted state efforts that resulted in better data quality and completeness, including expanding race, ethnicity, and language categories; making applications available in various languages and formats (online, phone, paper); using the Medicaid application instructions as an opportunity to explain how the state will use race, ethnicity, and language data to advance health equity to encourage completion of these sections; and linking race, ethnicity, and language data collection to equity-based performance measures. Some states, like California, require that managed care plans participate in filling gaps in race/ethnicity data by requiring health plans to obtain a minimum of 80 percent of enrollee race/ethnicity data. California’s enhanced reporting requirements are tied to financial incentives and penalties, which have resulted in improved race/ethnicity data.
Improvements to the quality of race/ethnicity data and other variables will take time. In the interim, researchers can explore other potential options to increase the usable sample of enrollees in the currently available T-MSIS analytic files. However, each analysis will require thoughtful discussions around data quality, limitations, and whether the data is sufficient for presentation at the state or national level.