Long-standing workforce challenges in Medicaid home care (also known as home- and community-based services or HCBS) impact care for the over 4.5 million people who use these services and addressing them is a top priority for most states. Shortages and high turnover rates among the direct care workforce reflect demanding work and low wages, particularly among home care workers (who are direct care workers that provide HCBS). This issue brief describes states’ ongoing efforts to respond to shortages of home care workers and how they pay these workers, finding that increased payment rates are a key component of states’ efforts to address workforce shortages. However, those higher payment rates may be curtailed under House Republicans’ proposals to cut federal Medicaid spending by $2.3 trillion over 10 years. Cuts of that magnitude—a nearly one-third reduction in Medicaid spending—would force states to raise new revenues or reduce Medicaid spending, which would place downward pressure on payment rates. Efforts to reduce funding for Medicaid could have significant impacts on the direct care workforce, in particular, as nearly 70% of home care is paid for by Medicaid.
This issue brief is one of several reporting the data from the 22nd KFF survey of officials administering Medicaid home care programs in all 50 states and the District of Columbia (hereafter referred to as a state), which states completed between April and October 2024. The survey was sent to each state official responsible for overseeing home care benefits (including home health, personal care, and waiver services for specific populations such as people with physical disabilities). All states except Florida, Indiana, and Utah responded to the 2024 survey, but response rates for certain questions were lower. Key takeaways include:
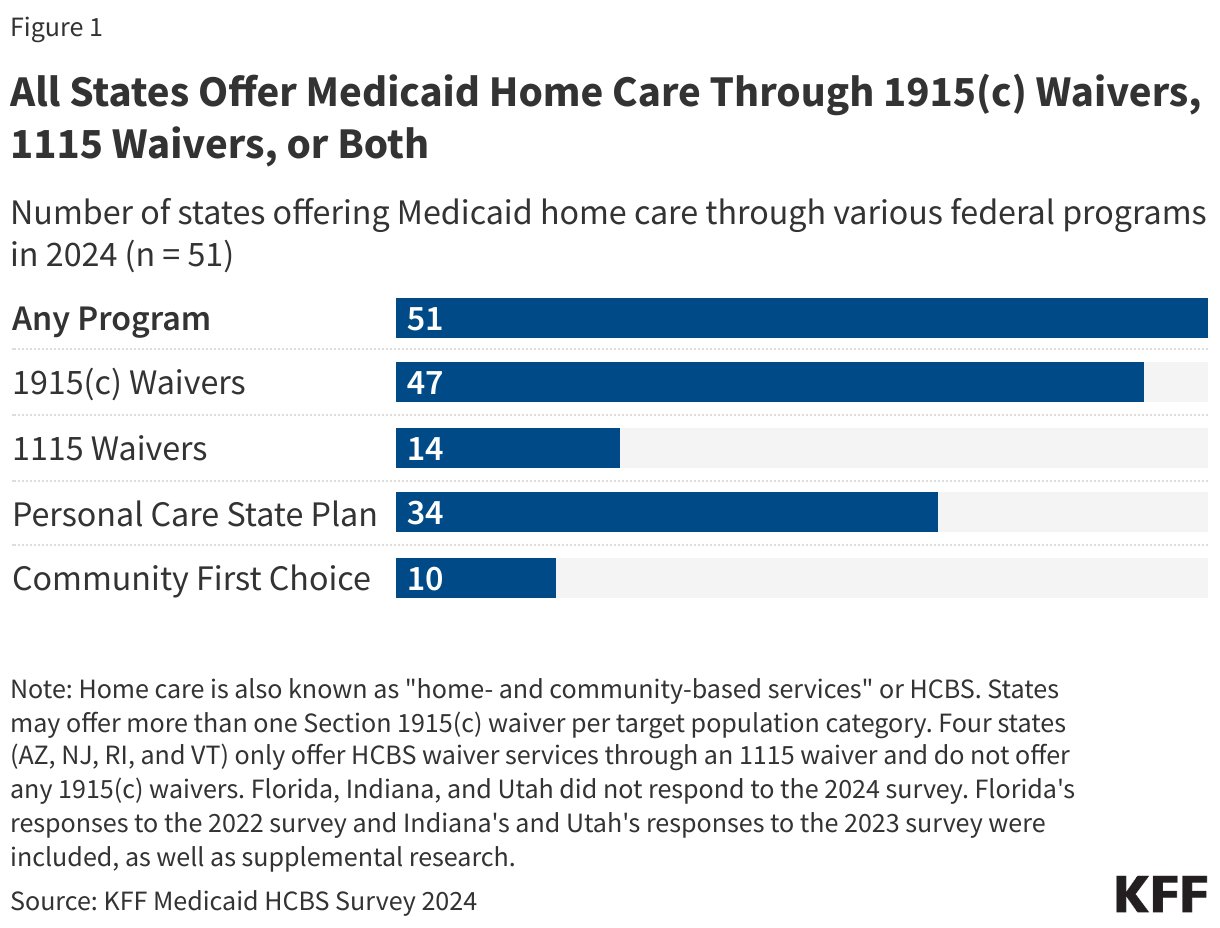
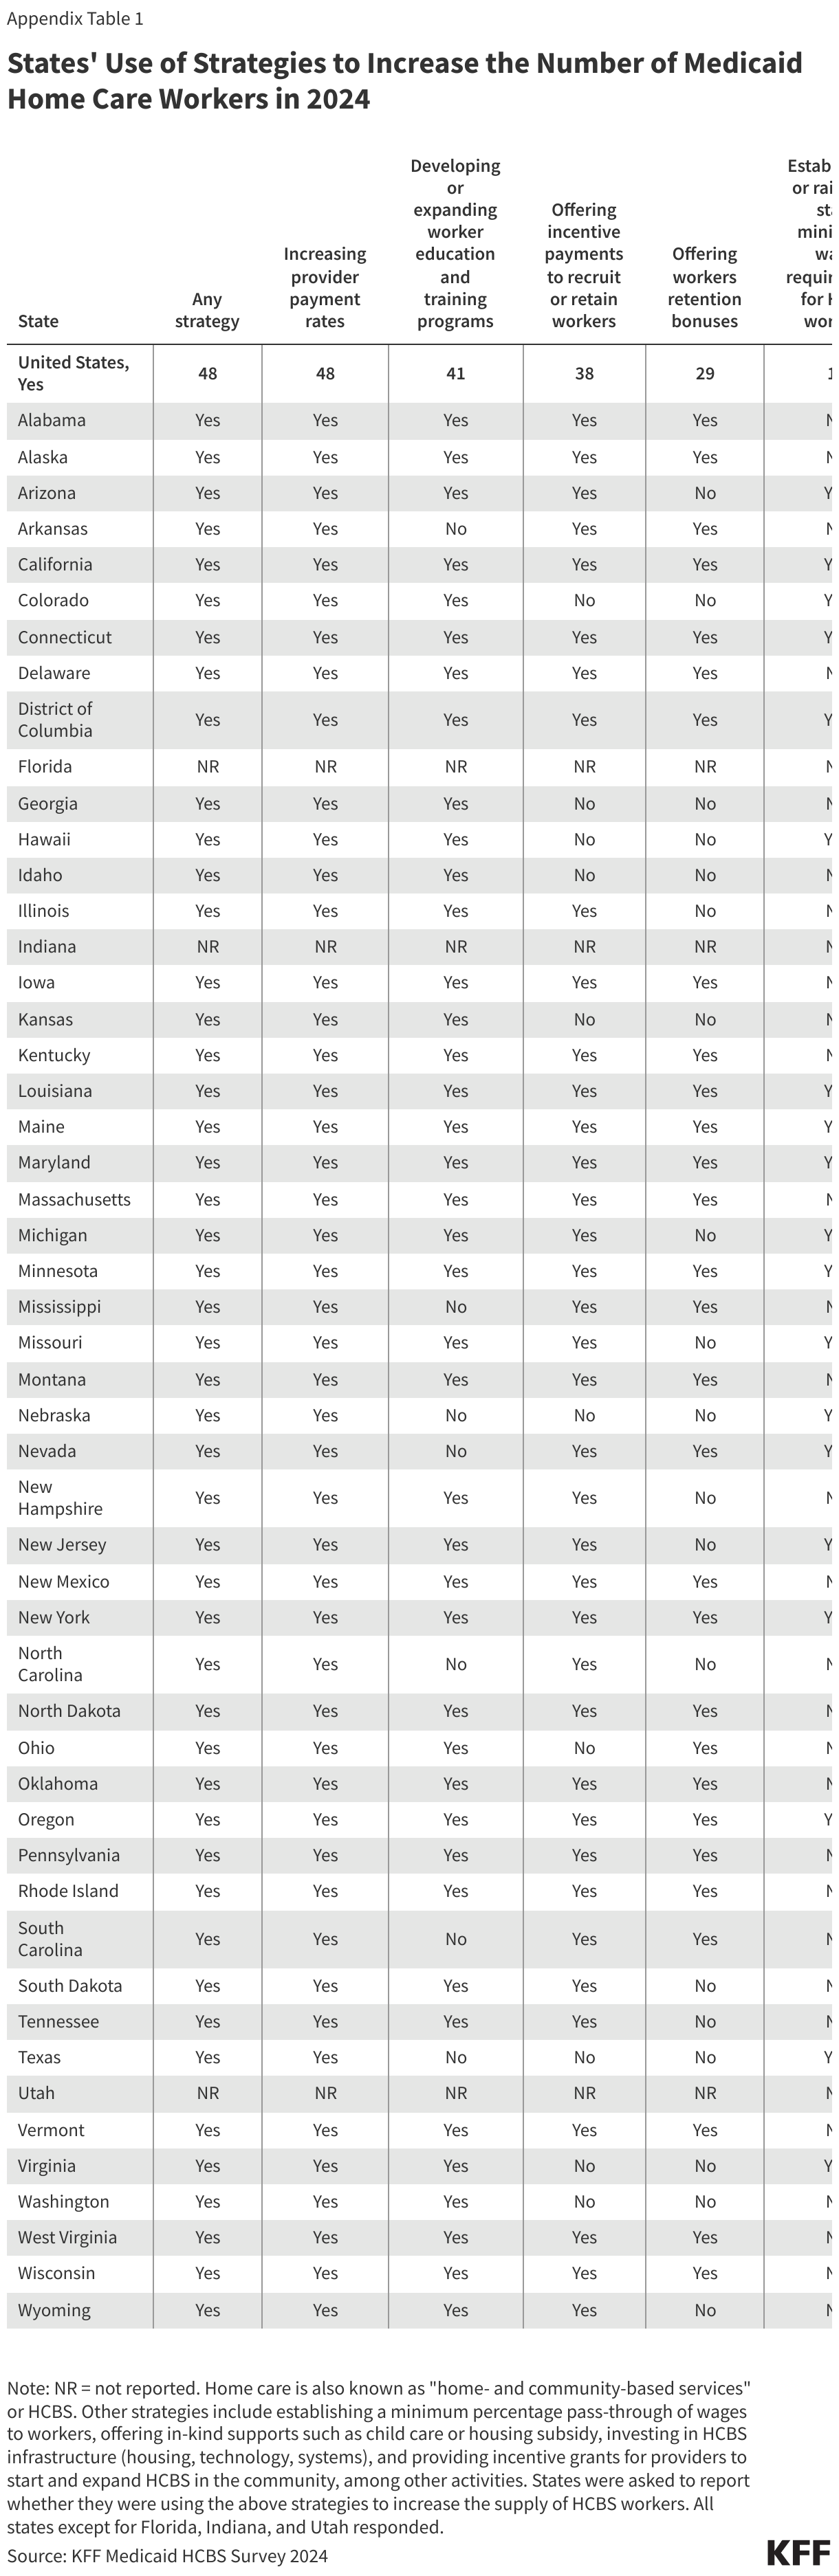
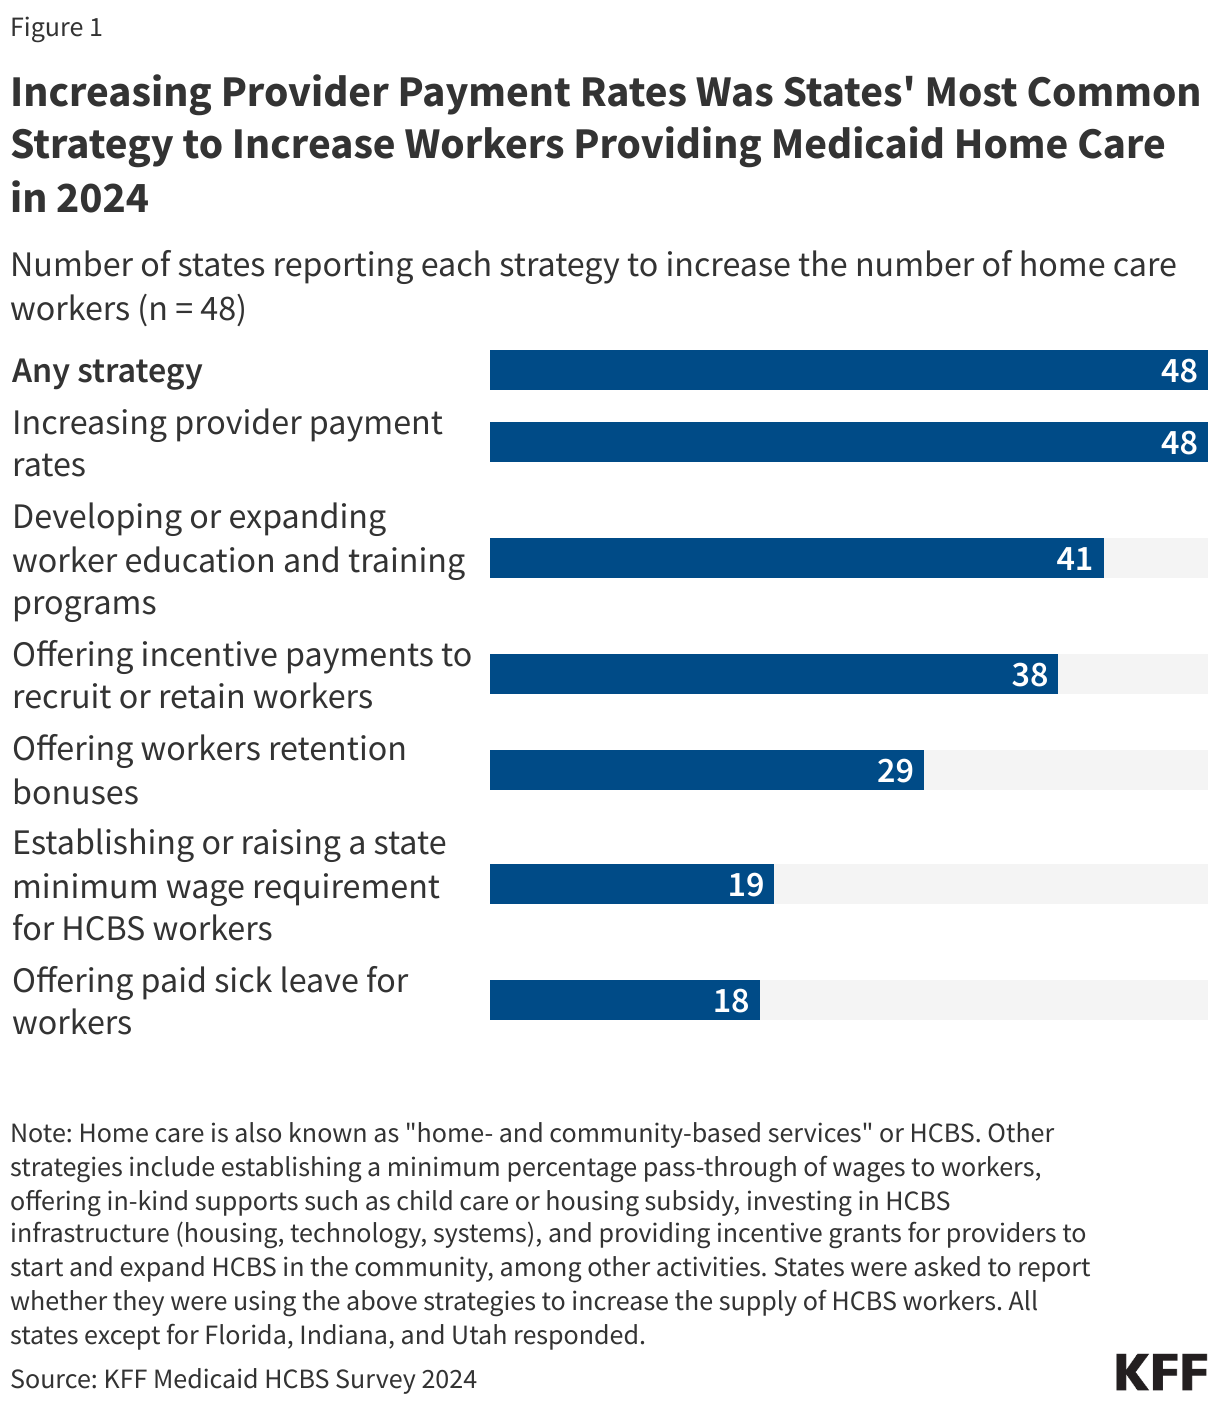
- All responding states reported taking actions to address workforce shortages, with most states raising payment rates (Figure 1).
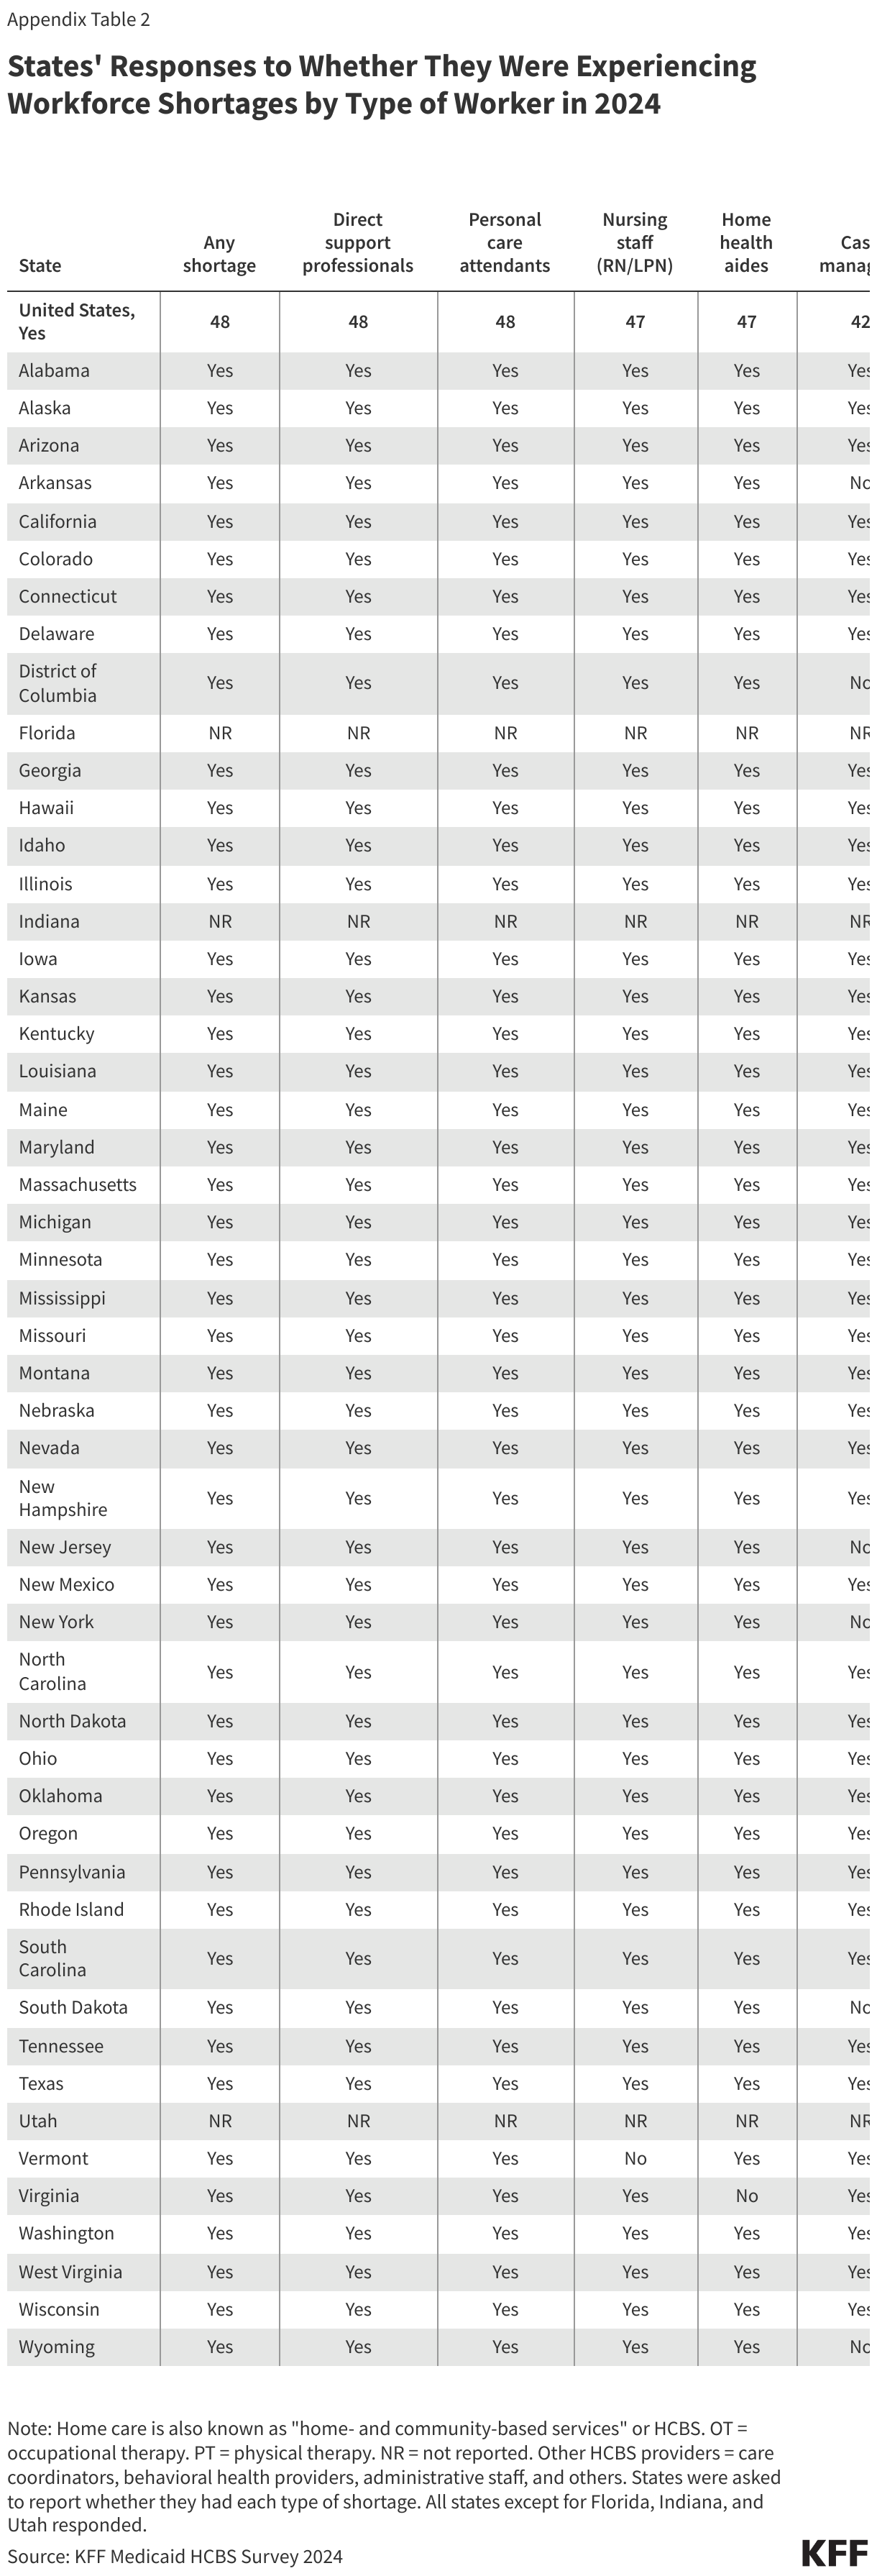
- All states reported shortages of home care workers, most frequently among direct support professionals, personal care attendants, nursing staff, and case managers.
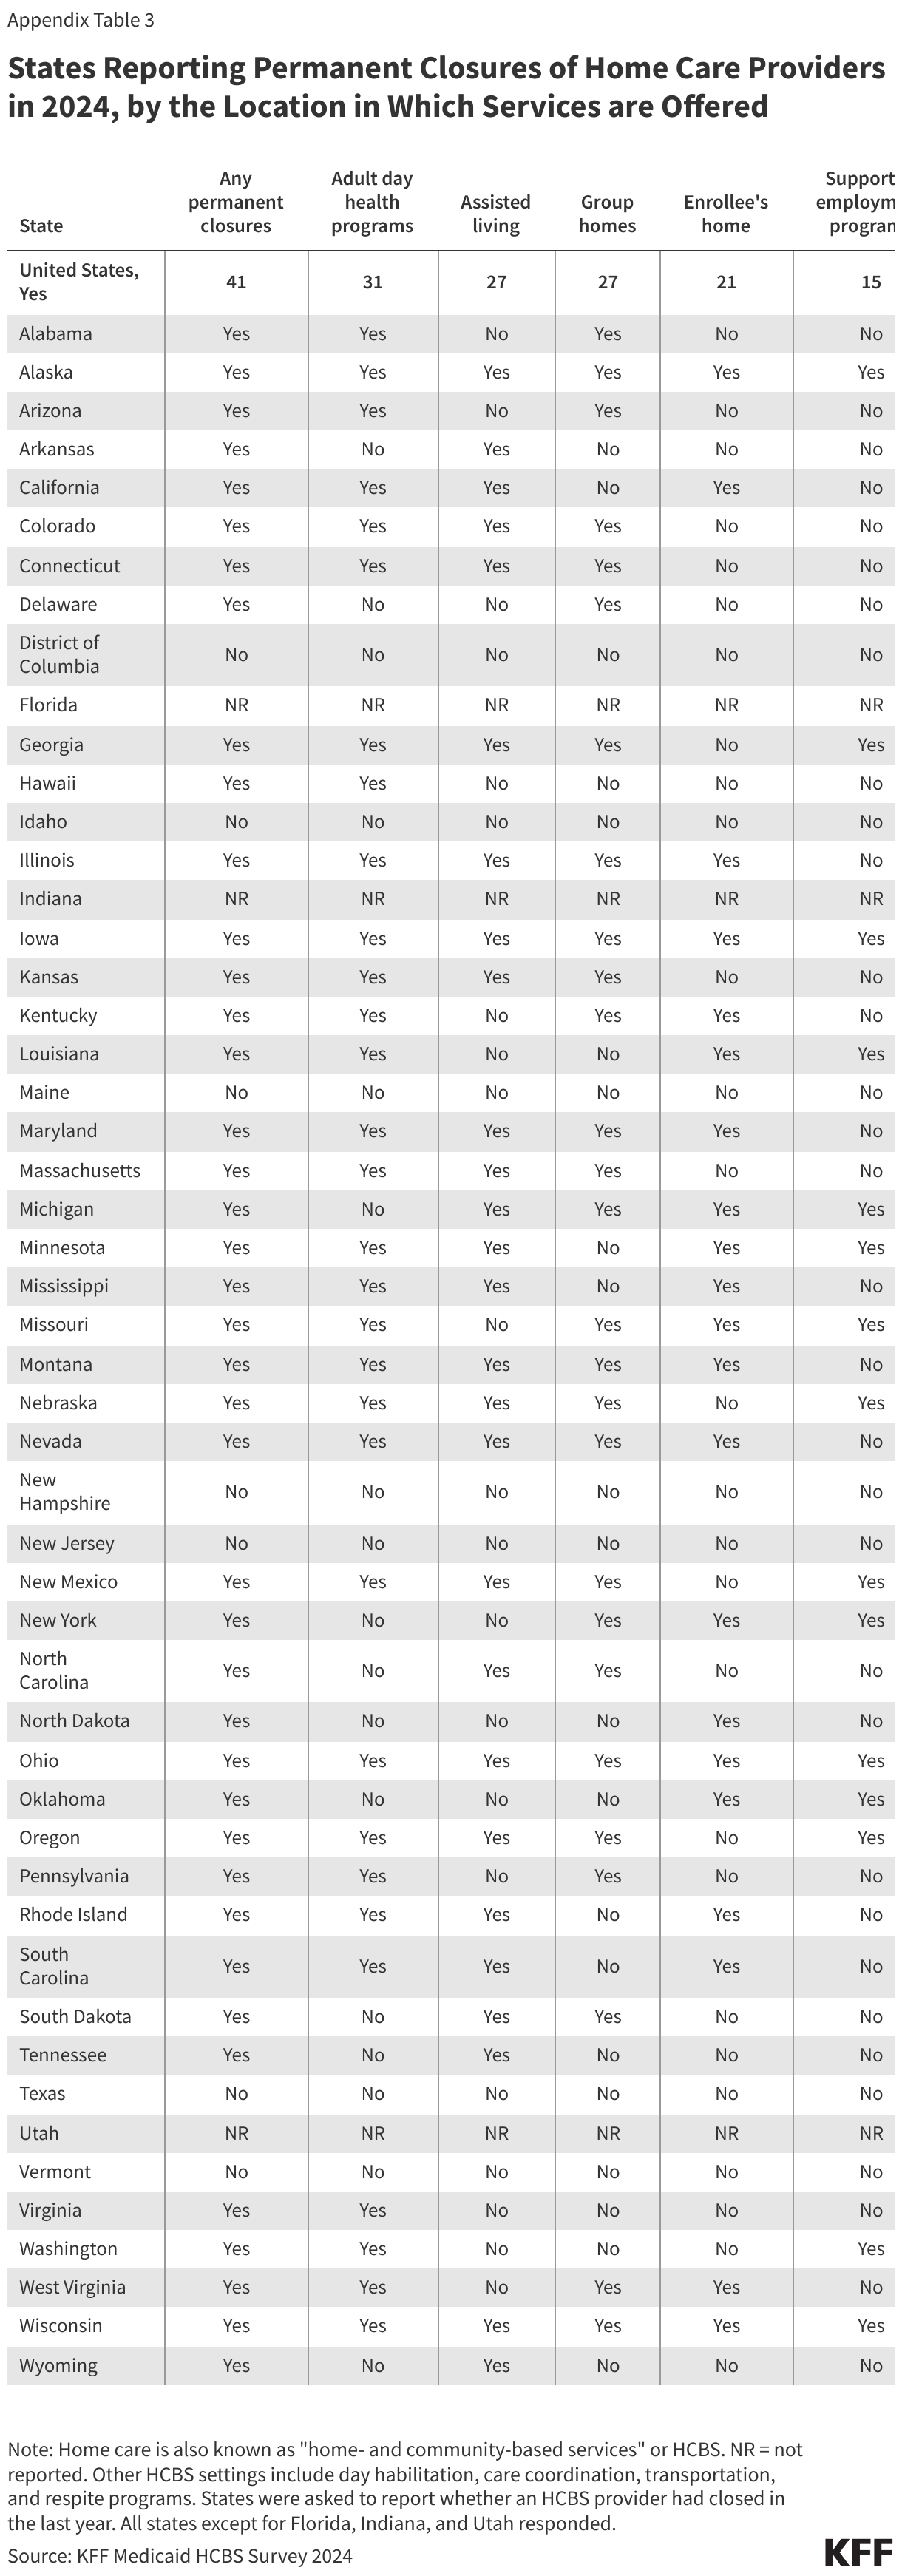
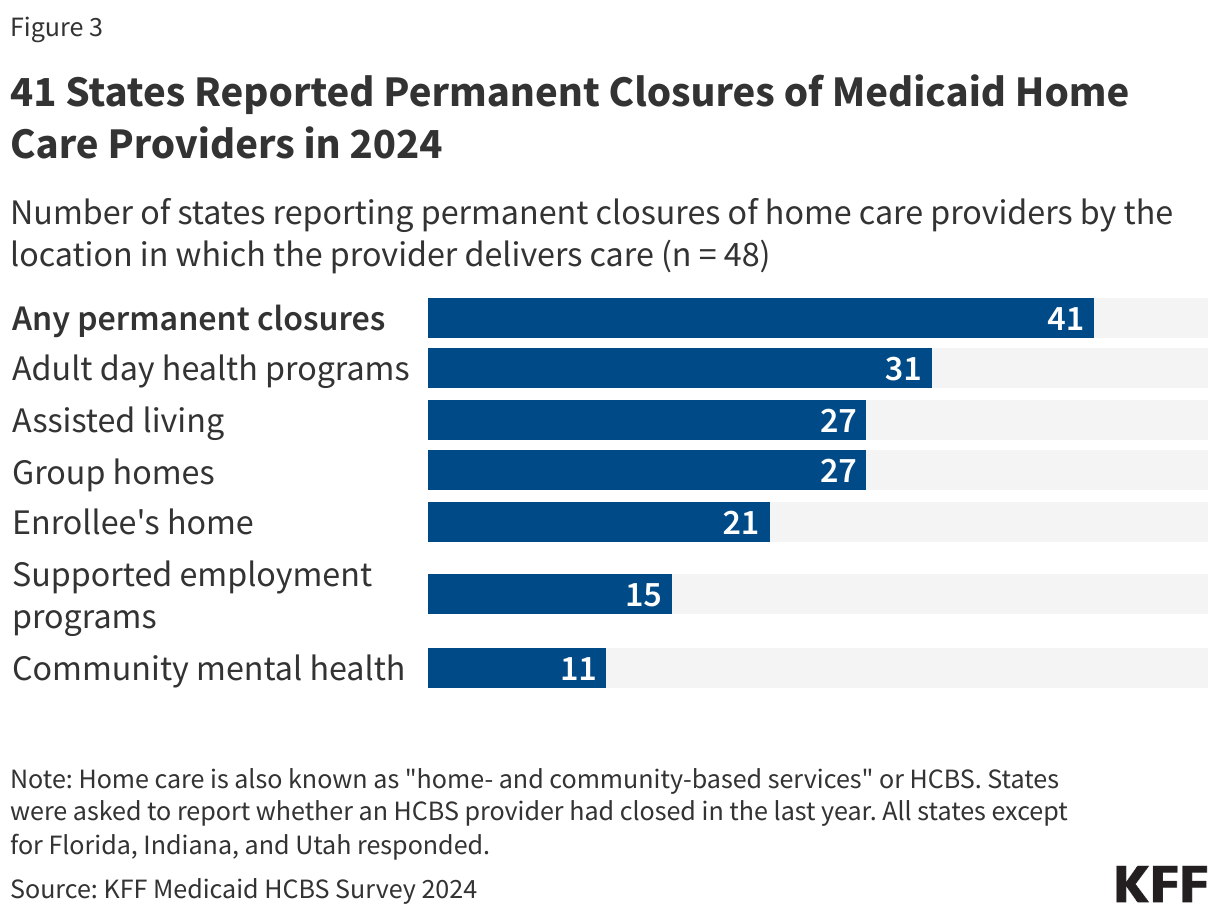
- Most (41) states reported permanent closures of home care providers within the last year.
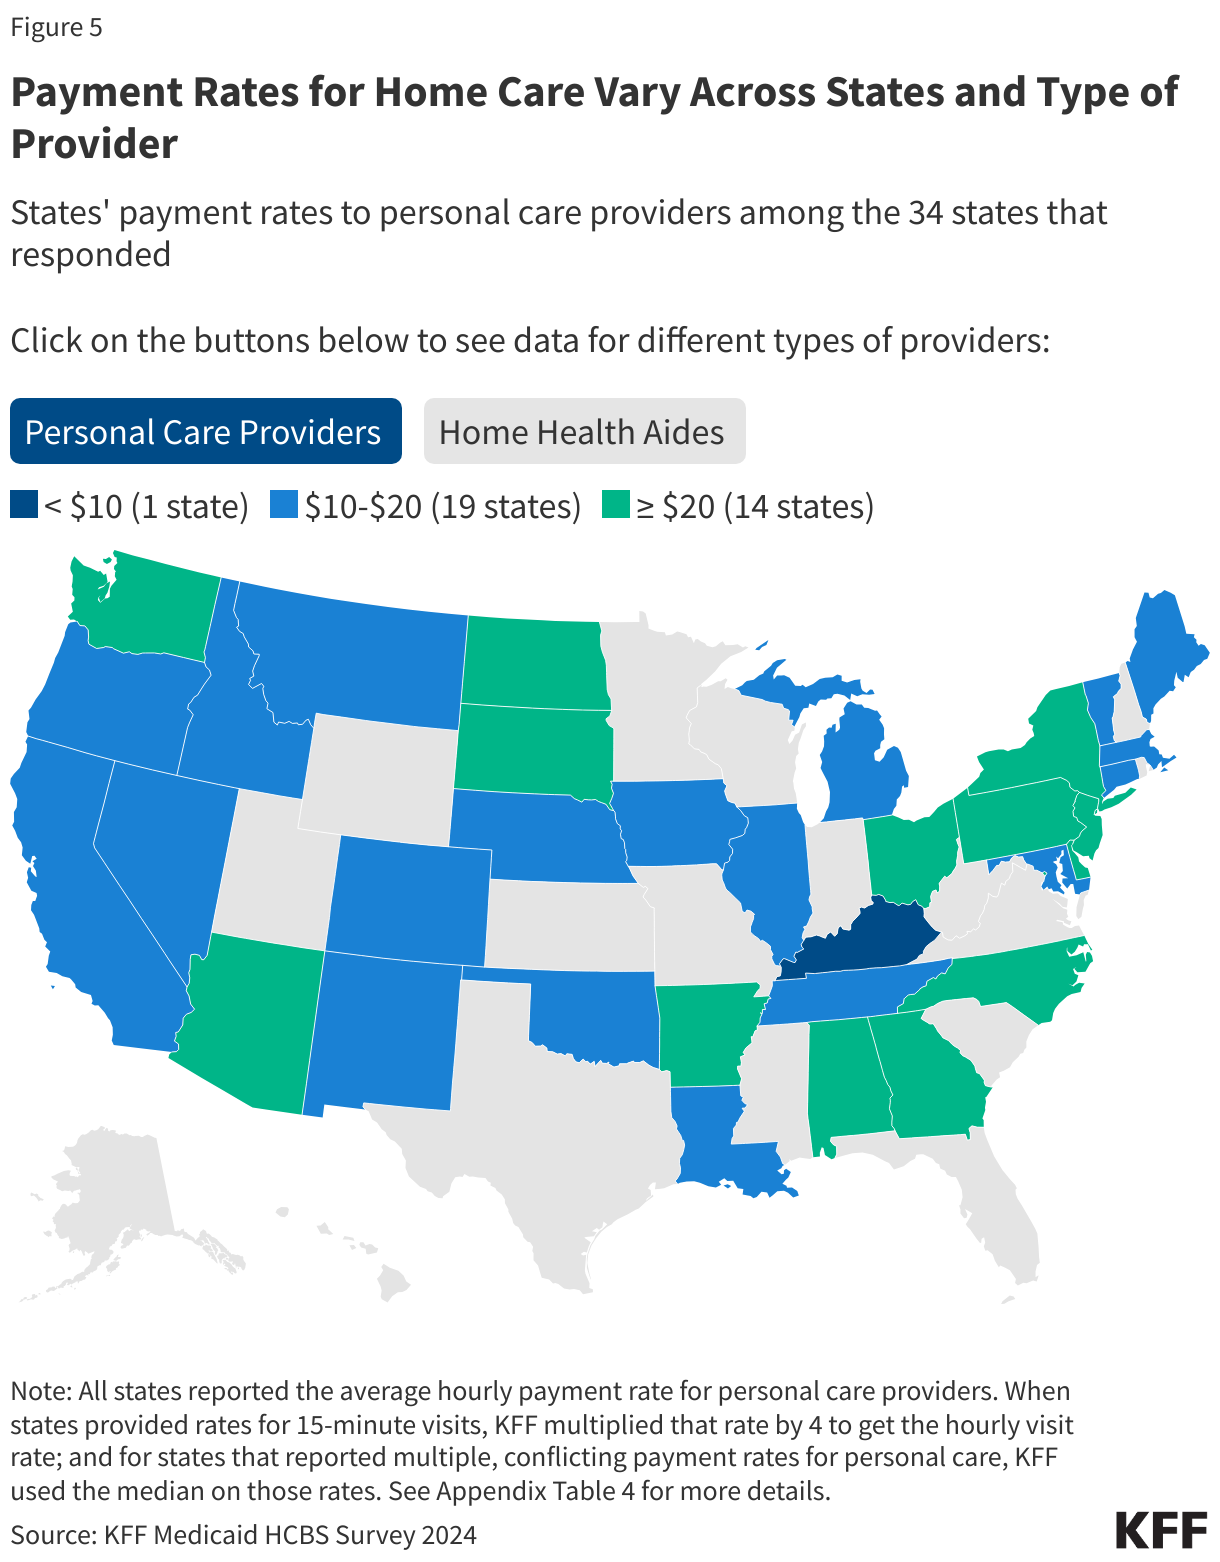
- Among the 34 states that reported time-based payment rates for personal care providers, more than half pay less than $20 per hour.
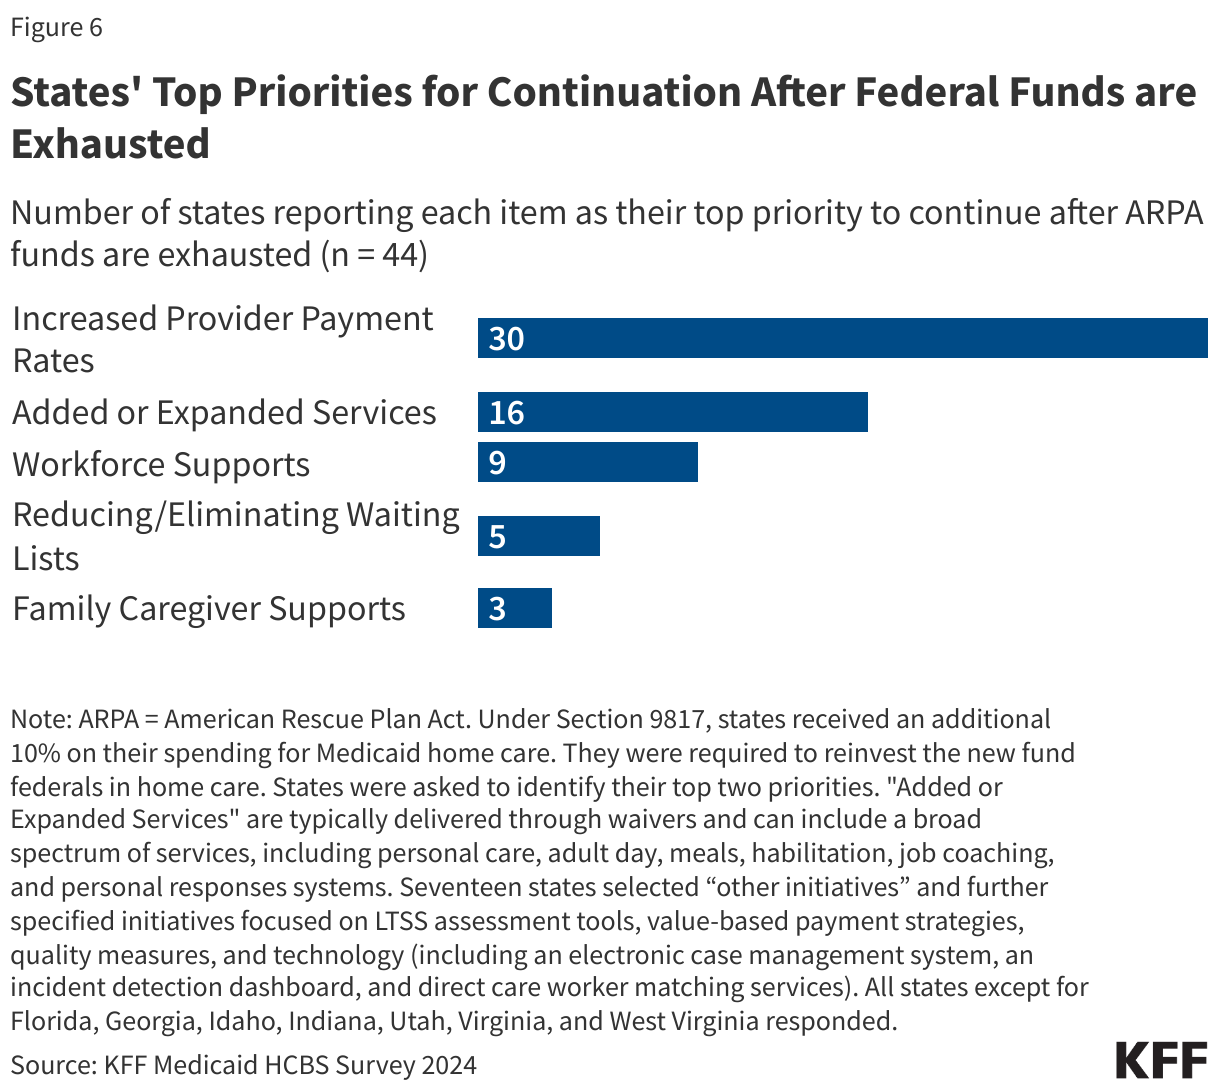
- As enhanced federal funding through the American Rescue Plan Act (ARPA) for home care comes to an end, most states (30) are hoping to keep their increased payment rates for home care providers.
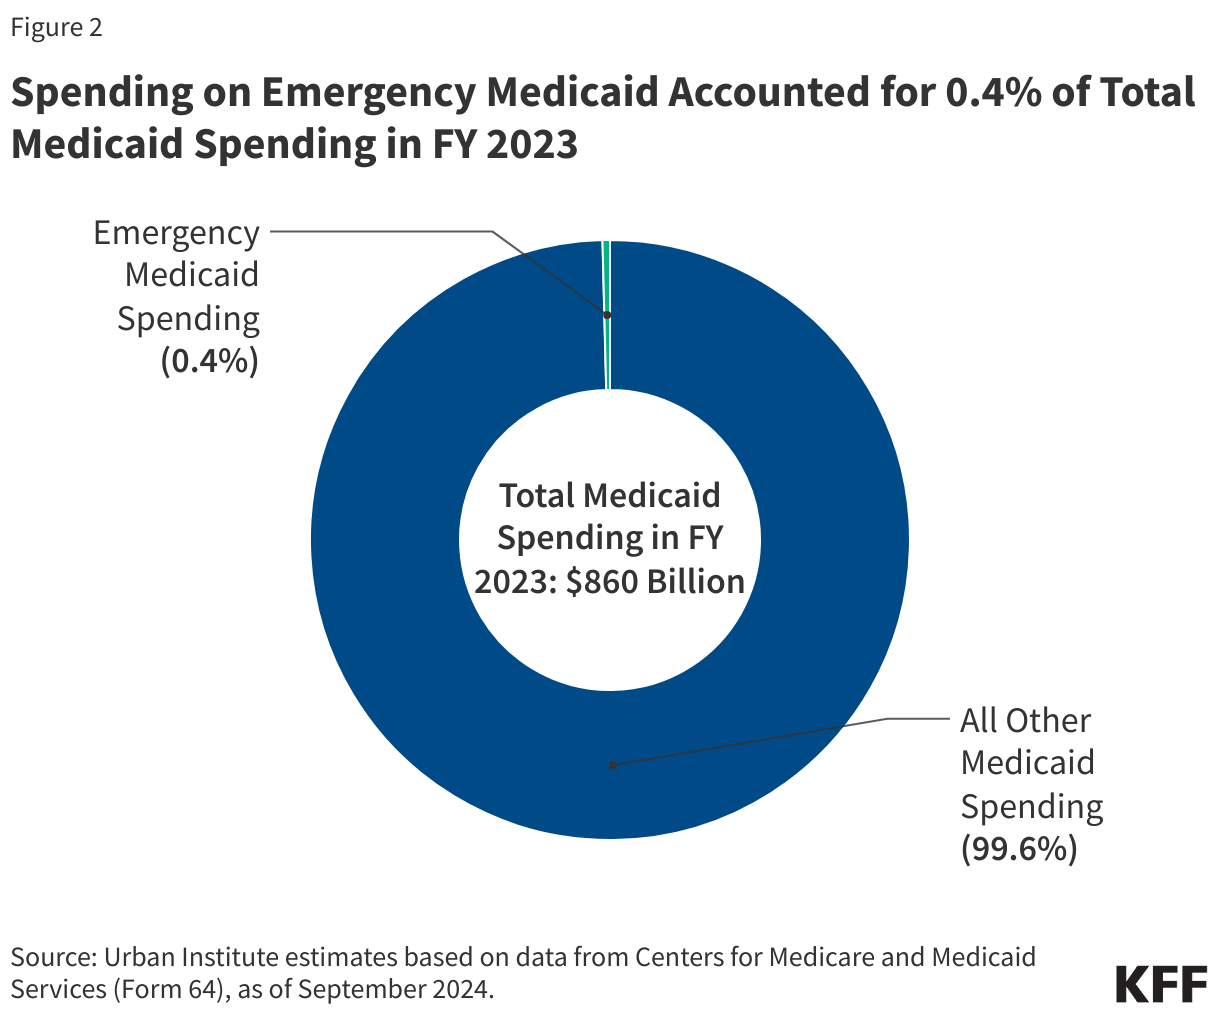
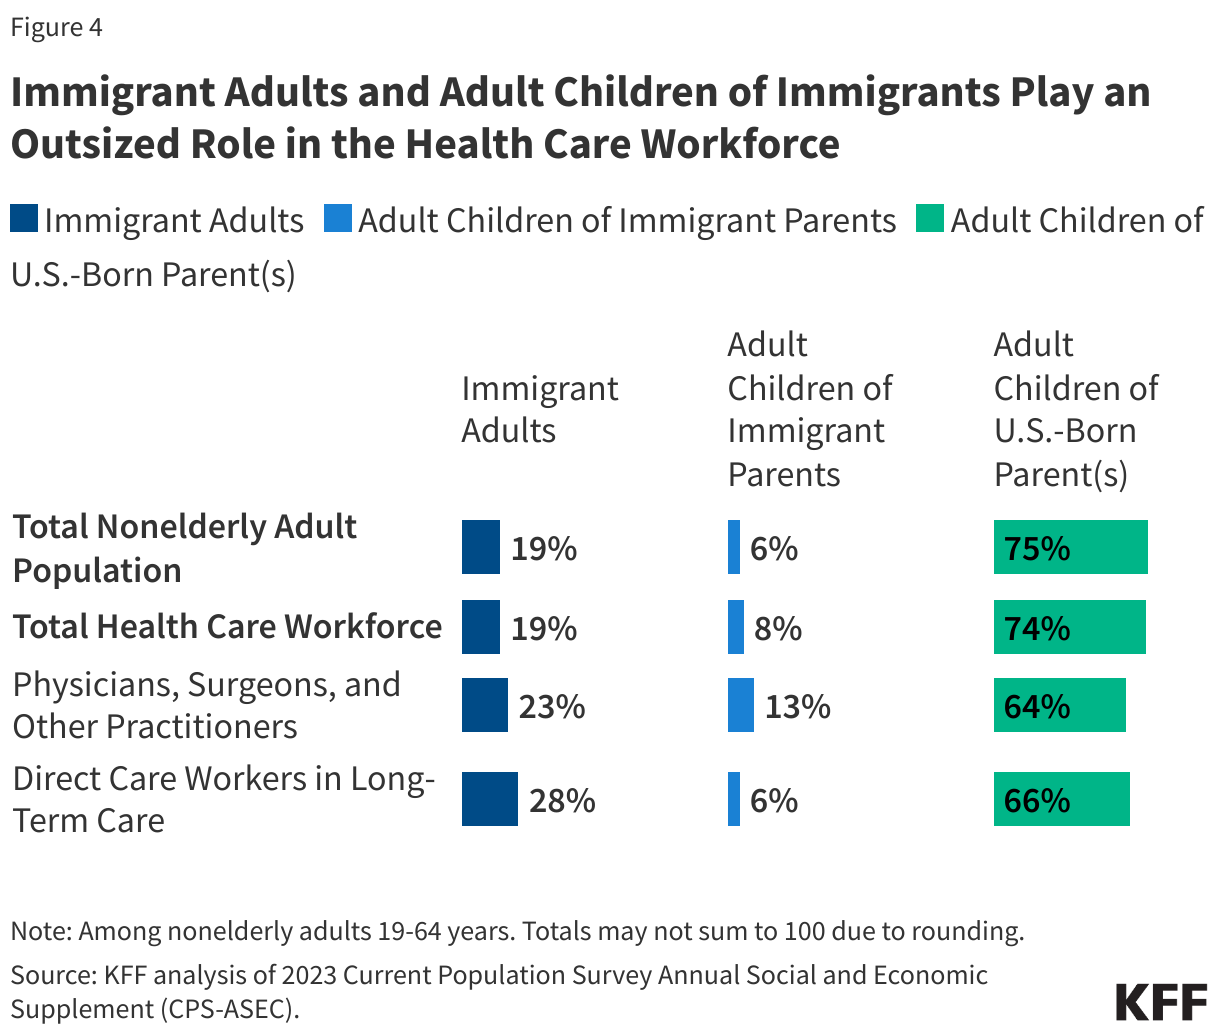
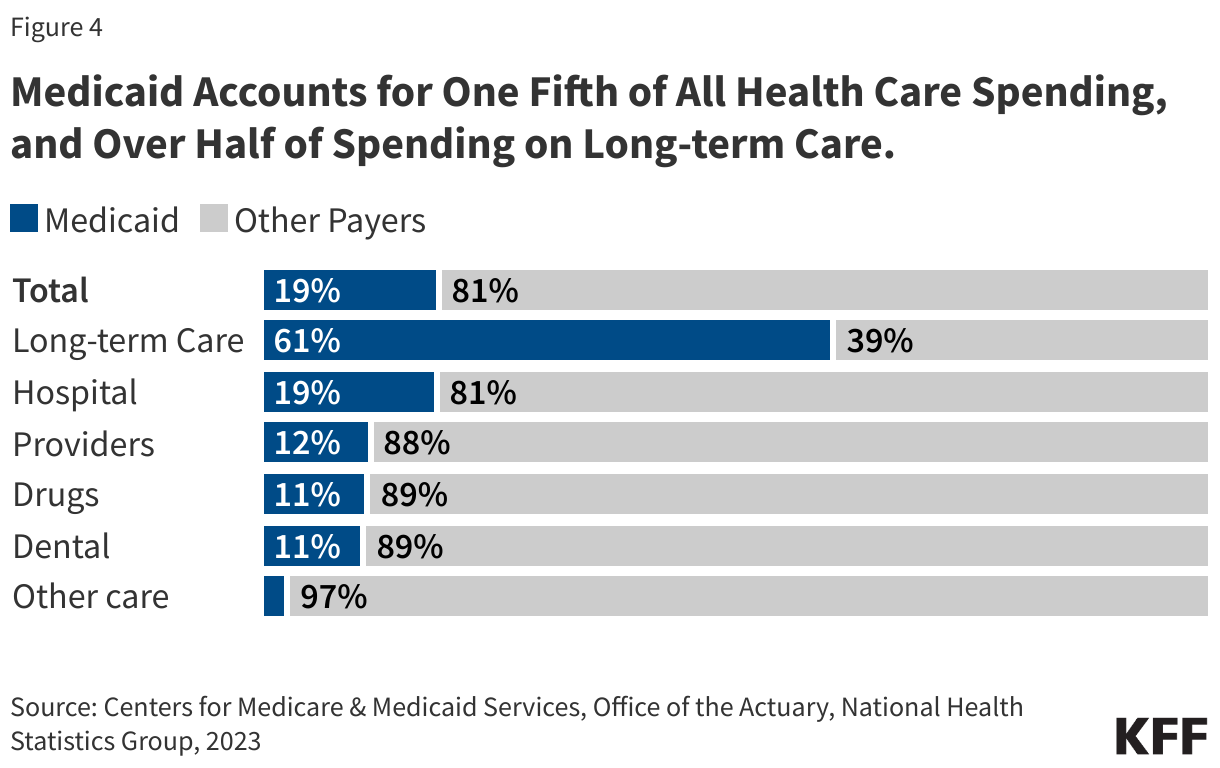
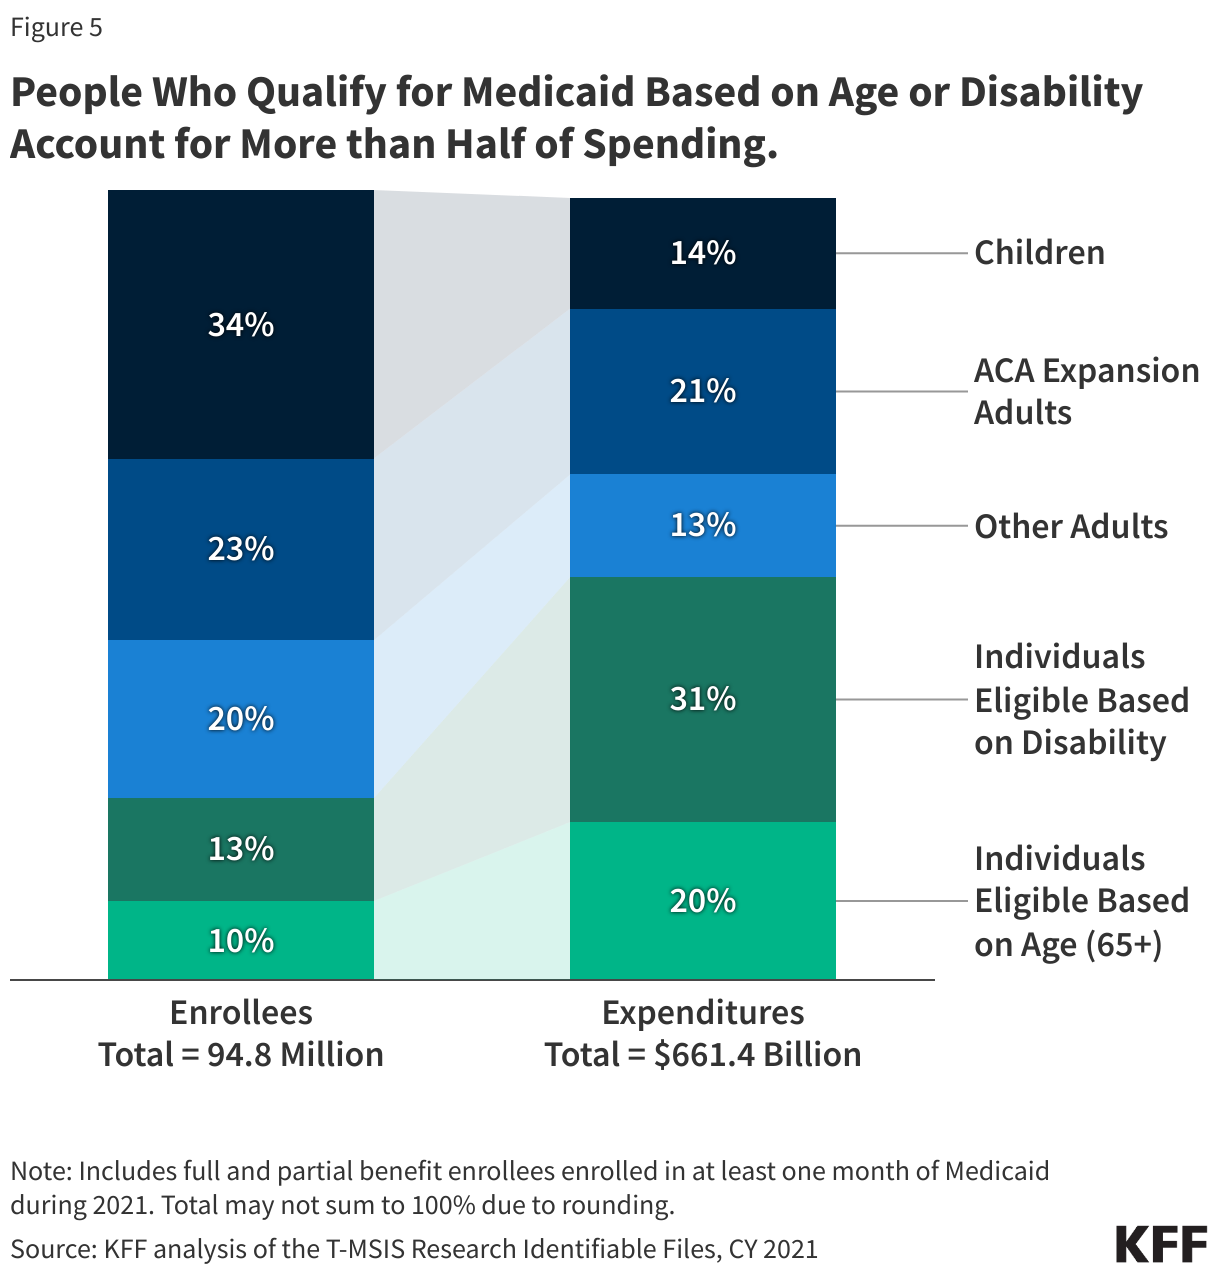
Despite states’ efforts to address workforce challenges, cuts to Medicaid and changes in immigration policy under the new Trump Administration may exacerbate provider shortages and reduce payment rates for home care workers. All responding states (48) reported increasing provider payment rates to address staffing shortages, but with House Republicans proposing $2.3 trillion in cuts to Medicaid spending over 10 years, states may need to reduce provider payment rates. Additionally, over half of Medicaid spending is for Medicaid enrollees most likely to use home care and related services, so cuts will have implications on enrollees’ care. Proposed legislation by House Republicans could also delay or overturn the Biden Administration’s final rule on ensuring access to Medicaid services (see Box 1). Beyond reducing Medicaid resources, President Trump’s immigration policy changes, such as restricting and eliminating legal immigration pathways and deporting millions of immigrants, may further strain the long-term care workforce, which relies heavily on foreign-born workers.
How are States Addressing the Workforce Challenges in Home Care?
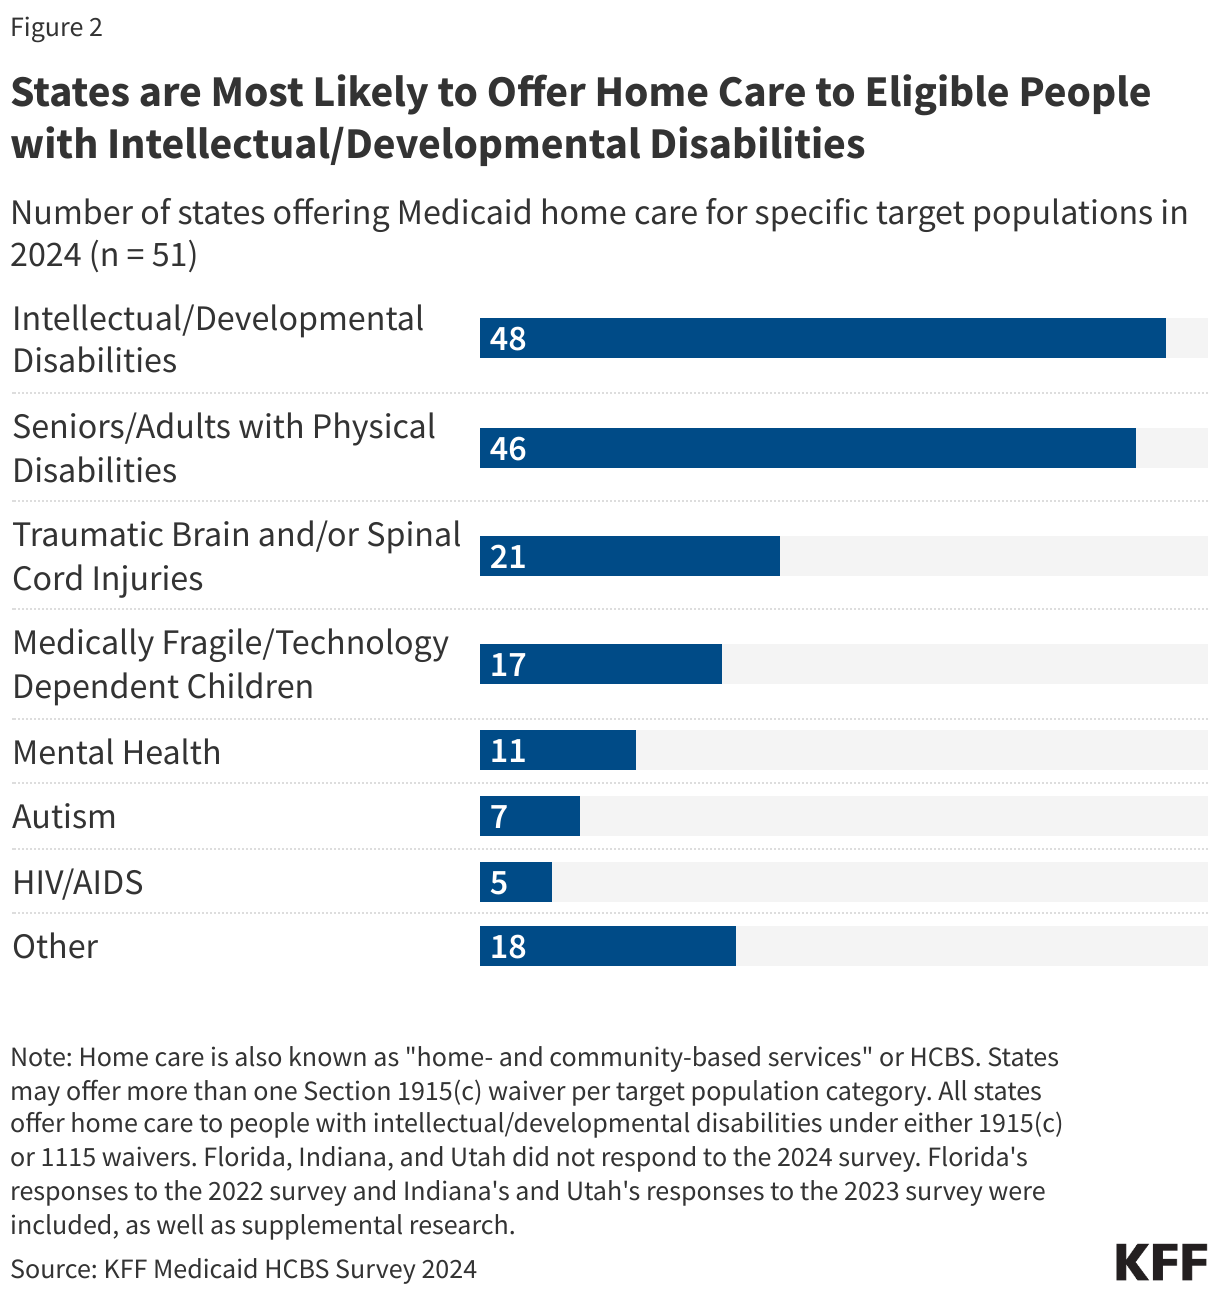
All responding states reported workforce shortages in 2024, with the most common shortages being among direct support professionals and personal care attendants (48 states each), followed by nursing staff and home health aides (47 states each) (Figure 2, Appendix Table 2). States were asked if they had shortages of each type of provider but were not provided with a definition of “shortage.” Most states also reported shortages in case managers (42 states), certified nurse aides (41 states), community-based mental health providers (37 states), and occupational, physical, and speech therapy providers (32 states). In some cases, states may not have reported a shortage of a particular type of provider because that type of service is not offered through their home care program.
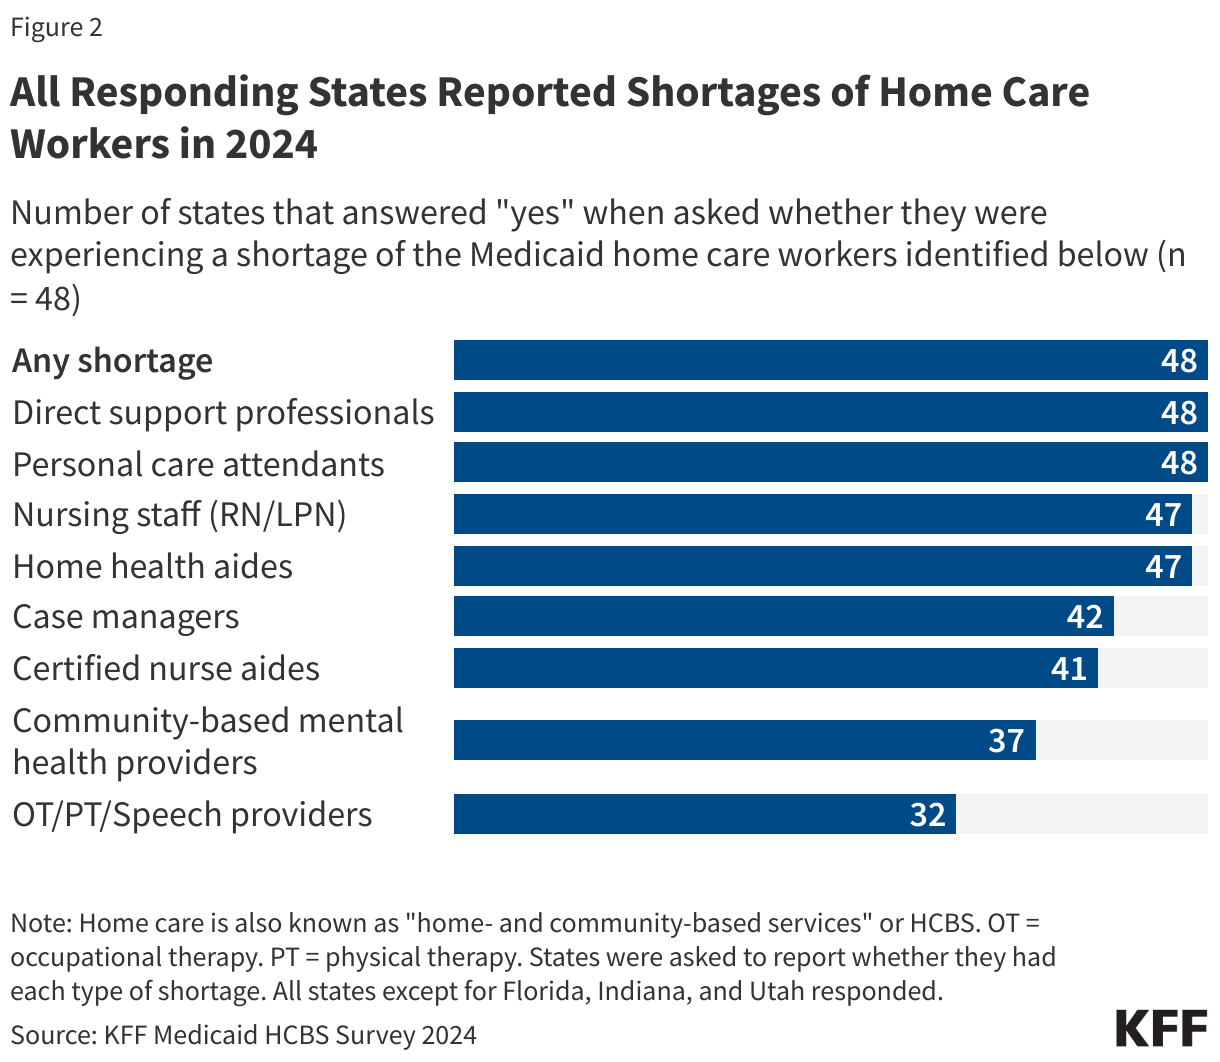
All states reported shortages for more than one type of provider and 46 states reported shortages among five or more provider types. Such shortages may reflect low compensation coupled with demanding working conditions. In the spring of 2024, home care providers participating in KFF focus groups reported that their jobs had high physical and mental demands that were often “overwhelming.” The groups described their wages as low, particularly given the demands of their jobs; and how staffing shortages made their jobs harder because they may not know if they would be able to leave work at the end of their shift. In survey responses, states attributed shortages to low reimbursement rates, lack of qualified providers, and high turnover rates.
Within the last year, 41 states reported permanent closures of home care providers, which were most common among adult day health programs (31 states), followed by assisted living facilities and group homes (27 states each) (Figure 3, Appendix Table 3). States were asked if there were any permanent closures of providers that offer services for Medicaid enrollees based on the location in which the providers deliver care. For a setting such as an assisted living facility or group home, a closure could reflect either the closure of an assisted living facility or the closure of a home care agency that sent workers into facilities and group homes. States were not asked to provide a reason for the closures. Some states reported closures of providers who work in enrollees’ homes (21 states), supported employment providers (15 states), and community mental health providers (11 states).
Most states reported closures among more than one type of provider: 37 states reported closures among two or more provider types, and 28 states reported closures among three or more provider types. Some closures reflect provider shortages, while others reflect the fact that many companies have not recovered from the effects of the COVID-19 pandemic or have closed as a result of the home care settings rule. The settings rule, finalized in 2014 but first taking effect in 2023, established new requirements for home care settings, including full integration of individuals into the community and rights to privacy, dignity, respect, and freedom from coercion or restraint.
All responding states reported taking actions to address provider shortages, with 48 states increasing payment rates, 41 states developing or expanding worker education and training programs, and 38 states offering incentive payments to recruit or retain workers (Figure 1, Appendix Table 1). Less common initiatives included establishing or raising the state minimum wage (19 states) and offering paid sick leave for workers (18 states). States also reported other types of initiatives to strengthen the workforce, including initiatives allowing people to receive paid care from family members. For example, Illinois newly sought approval to allow legally responsible individuals to provide paid care for seniors participating in the home care waiver program.
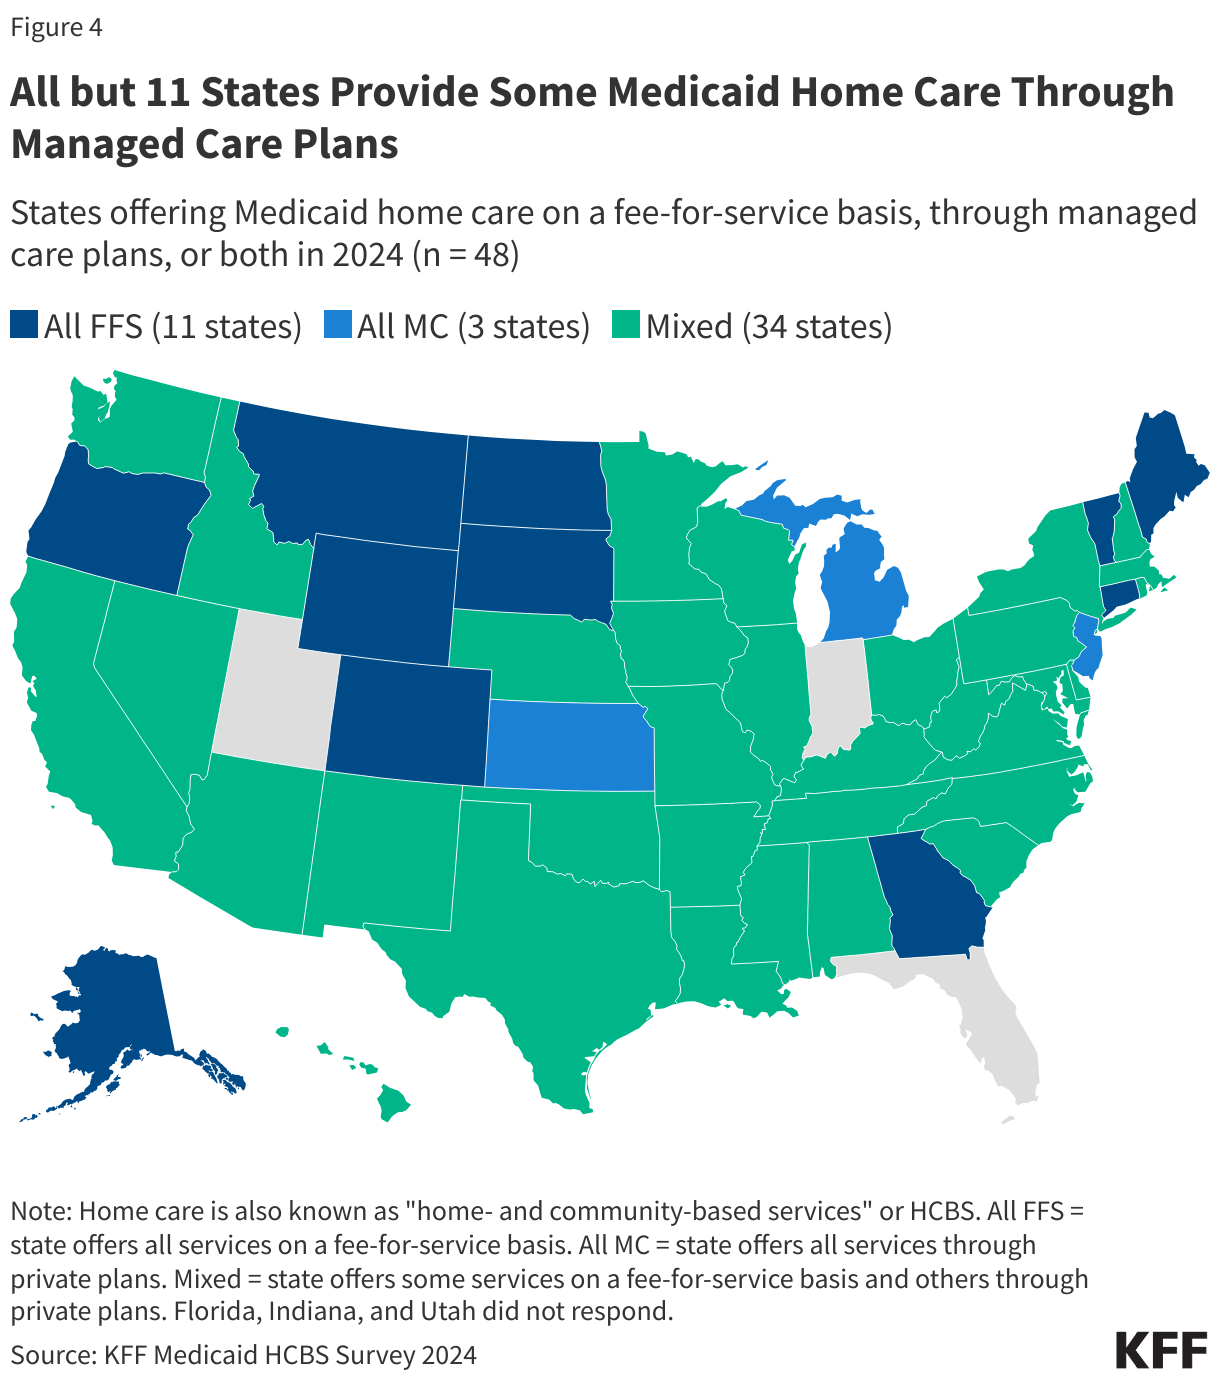
All but 11 states use managed care to provide at least some home care, and in over half of the states with managed care, fee-for-service payment rates impact the payment rates that managed care plans pay home care providers. Out of the 37 states that use managed care to provide at least some home care, 22 states reported that the fee-for-service payment rates represent the minimum amount that plans must pay providers, one state, New Mexico, reported that the rate represents the maximum payment rate for managed care plans, 12 states reported that the fee-for-service rates do not affect payments by private plans, and 2 states responded that the answer was unknown or did not respond to the question.
How Much do States Pay for Medicaid Home Care?
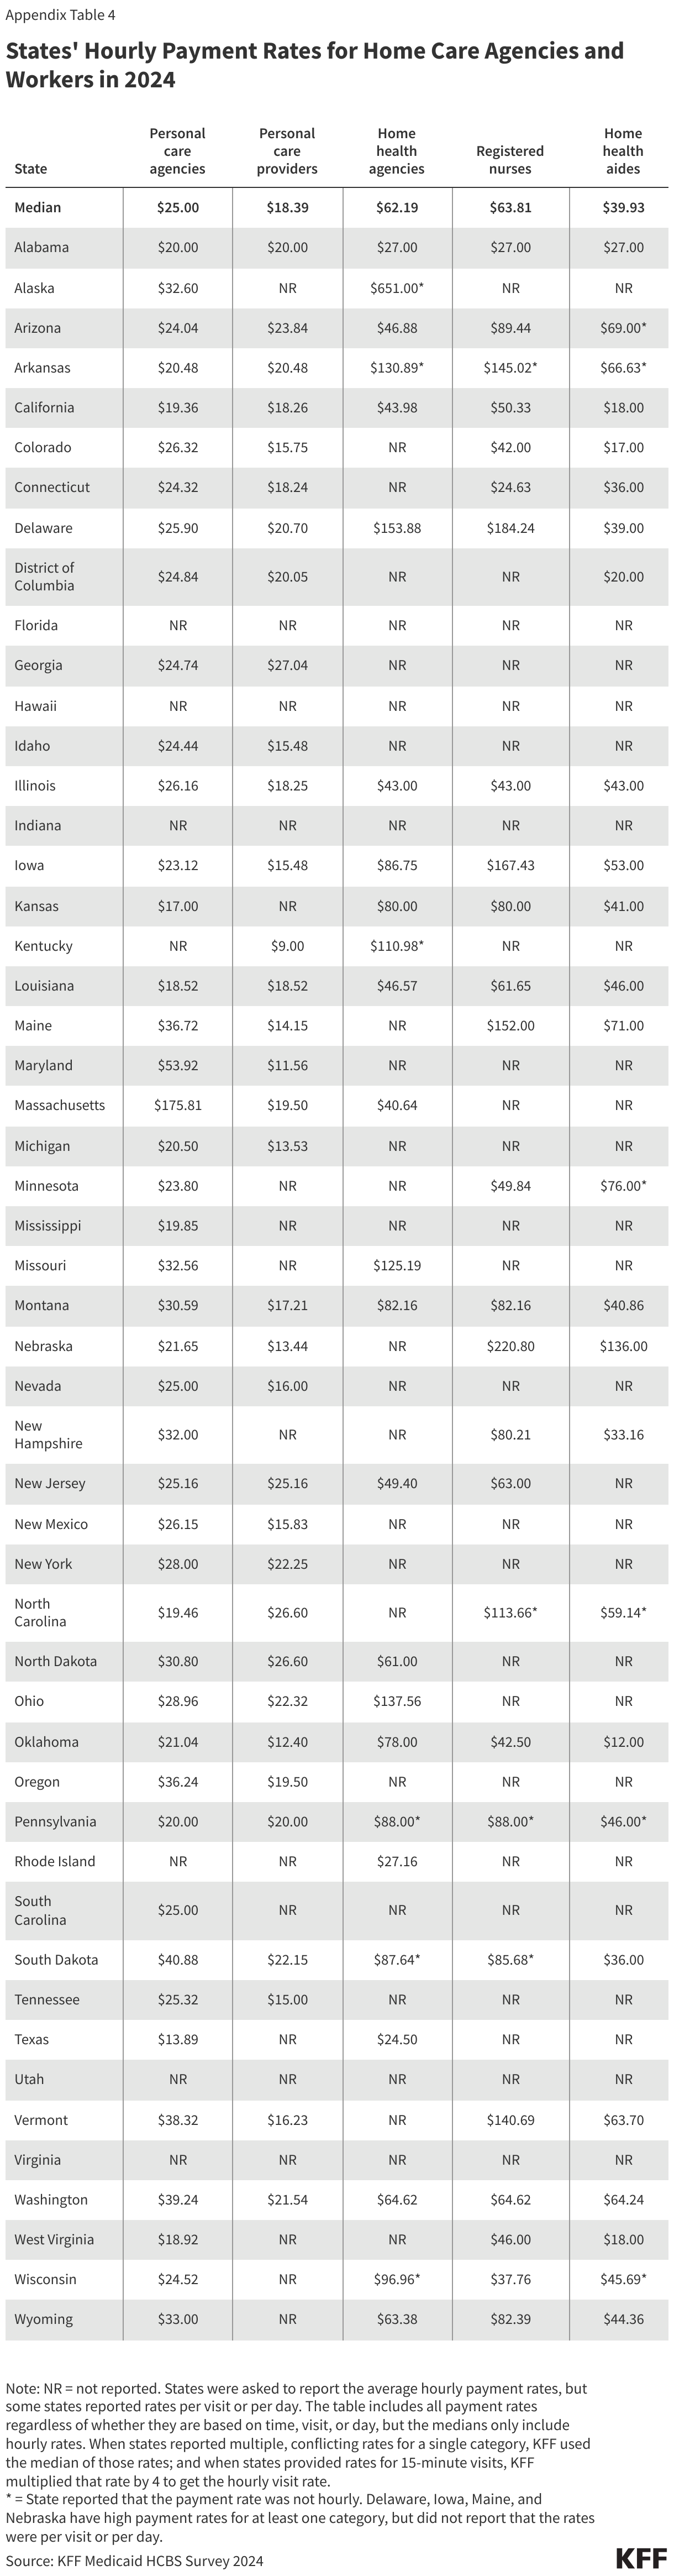
KFF asked states to report their average hourly rate paid to two types of home care provider agencies (personal care agencies and home health agencies) and three types of specific home care providers (personal care providers, home health aides, and registered nurses), but many states were unable to report all rates (Appendix Table 4). The number of states that responded to the survey but did not provide payment rates or reported that payment rates were unknown was 4 for personal care agencies and 23 for home health agencies. Even more states did not provide payment rates for specific provider types: For registered nurses and home health aides, nearly half of states did not provide payment rate information or reported that payment rates were unknown.
Starting July 2026, states are required to report detailed payment rates for personal care, home health, and other services, per the provisions of the Biden Administration final Access rule (see Box 1). In addition to reporting payment rates for certain home care services, starting in 2030, states must demonstrate that at least 80% of the payments went to compensation for providers, also described as “direct care workers.” Meeting that requirement will require states to know both agency and provider payment rates. Among the states that were able to report payment rates, 38 could report payment rates for personal care agencies, home health agencies, personal care providers, and home health aides, all of which would be required under the rule. Those 38 states include states that reported a mix of hourly and non-hourly rates, which makes comparisons between provider and agency rates more complicated. These challenges highlight the difficulties states face as they implement the requirements in the new rule.
Box 1: Final Access Rule’s Provisions on Home Care
On May 10, 2024, the Biden Administration released a final rule aimed at helping to ensure access to Medicaid services, which has several notable provisions aimed at increasing transparency and improving access to Medicaid home care, increasing home care payment rates, and addressing home care workforce challenges. The rule cites workforce shortages as a major contributor to home care access barriers among Medicaid enrollees. To address those access barriers, the rule requires states to do the following.
- Starting July 2026, states must report state hourly payment rates for personal care, homemaker services, home health aide services, and habilitation and publish that information on the state website. If state rates vary across provider types, geographies, or other factors, the states must report each of those rates.
- For each type of payment rate, the disclosures must also include the number of Medicaid paid claims and the number of Medicaid enrollees who received the service within the calendar year.
- States must establish an interested parties advisory group (IPAG) comprised of direct care workers, Medicaid enrollees and their representatives, and other interested parties. The IPAG will meet at least every two years to advise and consult on the sufficiency of current and proposed payment rates for personal care, homemaker services, home health aide services, and habilitation.
- Starting July 2030, states must ensure that at least 80% of payments to Medicaid providers for designated home care go directly to compensation for direct care workers. Designated home care include personal care, homemaker services, home health aide services, and habilitation. States may adopt separate standards for small providers or exempt small providers that meet reasonable criteria.
Beyond payment rates, the Access rule includes other requirements aimed at increasing access to home care. Starting July 2027, states will be required to report the number of people on waiting lists for services and the average amount of time from when homemaker services, home health aide services, or personal care services are initially approved to when services begin and the percentage of authorized hours that are provided. The proposed rule also includes provisions that would strengthen requirements around person-centered planning and needs assessment, create new requirements around incident management, establish requirements for people to file grievances if they are receiving home care from the state Medicaid program, and require states to report on nationally-standardized quality measures.
The home care payment-related requirements are one component of a broader emphasis on addressing Medicaid payment rates. The Access rule also requires states to report all fee-for-service Medicaid payment rates on state websites, and to compare various service-specific rates to those of Medicare. A companion rule on Medicaid managed care requires states to submit an annual payment analysis comparing managed care plans’ payment rates to Medicare payment rates for selected services.
States reported many reasons why it was difficult to report payment rates, including the following.
Some states reported that services were bundled together in various ways and therefore, the payment rates were not distinguishable.
Among states with managed care, some states responded that they did not know the payment rates for agencies because the services were paid for by managed care plans and they did not have access to those payment rates.
Other states responded that they knew the payment rates for agencies but not what the agencies paid their home care workers. Multiple states reported that they do not “dictate” what agencies pay to providers or that individual providers negotiate their own payment rates with the agencies.
In addition to having difficulty reporting payment rates, many states reported different payment rates for personal care across different waivers and the waiver payment rates often differ from the payment rates for personal care provided through the state plan. When states reported multiple payment rates for personal care, KFF used the median of those payment rates in the analysis.
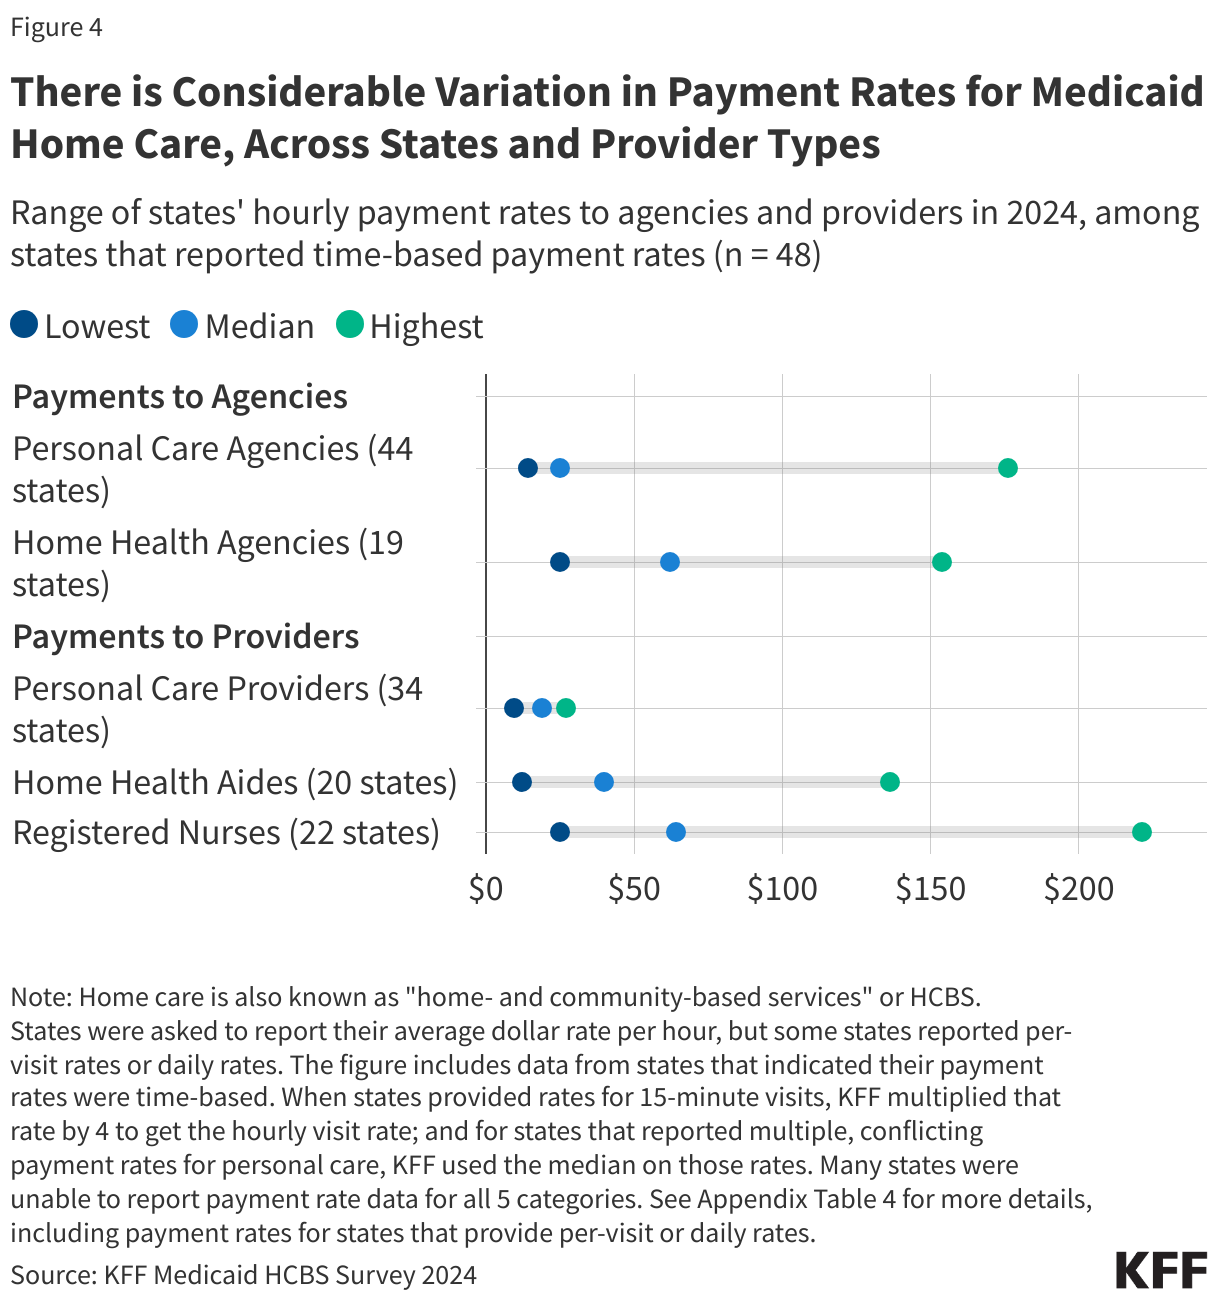
The payment rates to home care providers show considerable variation and are somewhat higher than those reported by other organizations on account of differences in reporting and provider categorization (Figure 4). KFF’s survey estimates that median payment rates to providers are $18 per hour for personal care providers, $40 for home health aides, and $64 for registered nurses. It is difficult to compare those numbers to other sources of data for the following reasons.
Other organizations group classes of providers together differently. PHI reports that in 2023, the median rate for home care workers was $16.13 per hour and $17.15 per hour for residential care aides. The Bureau of Labor Statistics reports $16.12 per hour for home health and personal care aides in 2023.
Other organizations include payment rates for workers regardless of the source of payment whereas KFF rates only reflect the Medicaid rates. Medicaid often covers more intensive personal care services than other payers, which may contribute to the higher rates.
Payment rates to home health agencies are generally larger than those to personal care agencies, but there is considerable variation in both (Figure 4). Among states reporting hourly rates, the rates for home health agencies range from $25 to $154 whereas those for personal care agencies range from $14 to $176. Those states reported that the median hourly payment to home health agencies was $62 and $25 for personal care agencies.
Among states able to report any payment rate data, payments for personal care workers range from below $10 to over $20 per hour (Figure 5, Appendix Table 4). Rates for home health aides are somewhat higher than those of personal care workers, reflecting the additional training requirements for such workers. Among the states with payment rates for home health aides in the highest category, some states reported that the rates were per visit or per day (which is noted in Appendix Table 4). There were other states with particularly high payment rates that did not report providing rates per visit or per day, but the rates may still reflect a non-hourly payment basis.
How Might the End of Enhanced Federal Funding Affect Payment Rates for Medicaid Home Care?
States received $37 billion in additional federal funding to expand Medicaid home care during COVID-19 though Section 9817 of the American Rescue Plan Act (ARPA). This provision increased the percentage of expenditures that the federal government paid by ten percentage points for spending on Medicaid home care between April 1, 2021 and March 31, 2022. States were required to use the new funding to enhance, expand, or strengthen their home care program. Most states will exhaust these funds by March 31, 2025, though some states have received extensions through September 2026. The number one use of the ARPA funds—accounting for more than $30 billion in new funding—was for workforce recruitment, retention, and training.
As enhanced federal funding comes to an end, most states are hoping to keep their increased payment rates for home care providers (Figure 6). The clear top priority for states is preserving provider payment rates (30 states). In comparison, far fewer states reported prioritizing other enhancements with 16 states reporting that a top priority was added or expanded services and 5 states (California, New Mexico, North Carolina, Oklahoma, and Texas) reporting that reducing or eliminating waiting lists for home care was a top priority. (Those five states account for 55% of people on waiting lists.) Arkansas, Delaware, and Washington reported providing family caregiver supports to be a priority to continue once funding depletes.
While many states would like to maintain enhancements made using additional federal funds, five states reported plans to eliminate provider payment increases after federal funds are exhausted. Connecticut, Maryland, New Jersey, Washington, and Wyoming reported such plans, and Arizona, Maine, and Nebraska also noted that they would be eliminating some type of additional payments to providers, but did not categorize the payments as provider payments in the KFF survey.
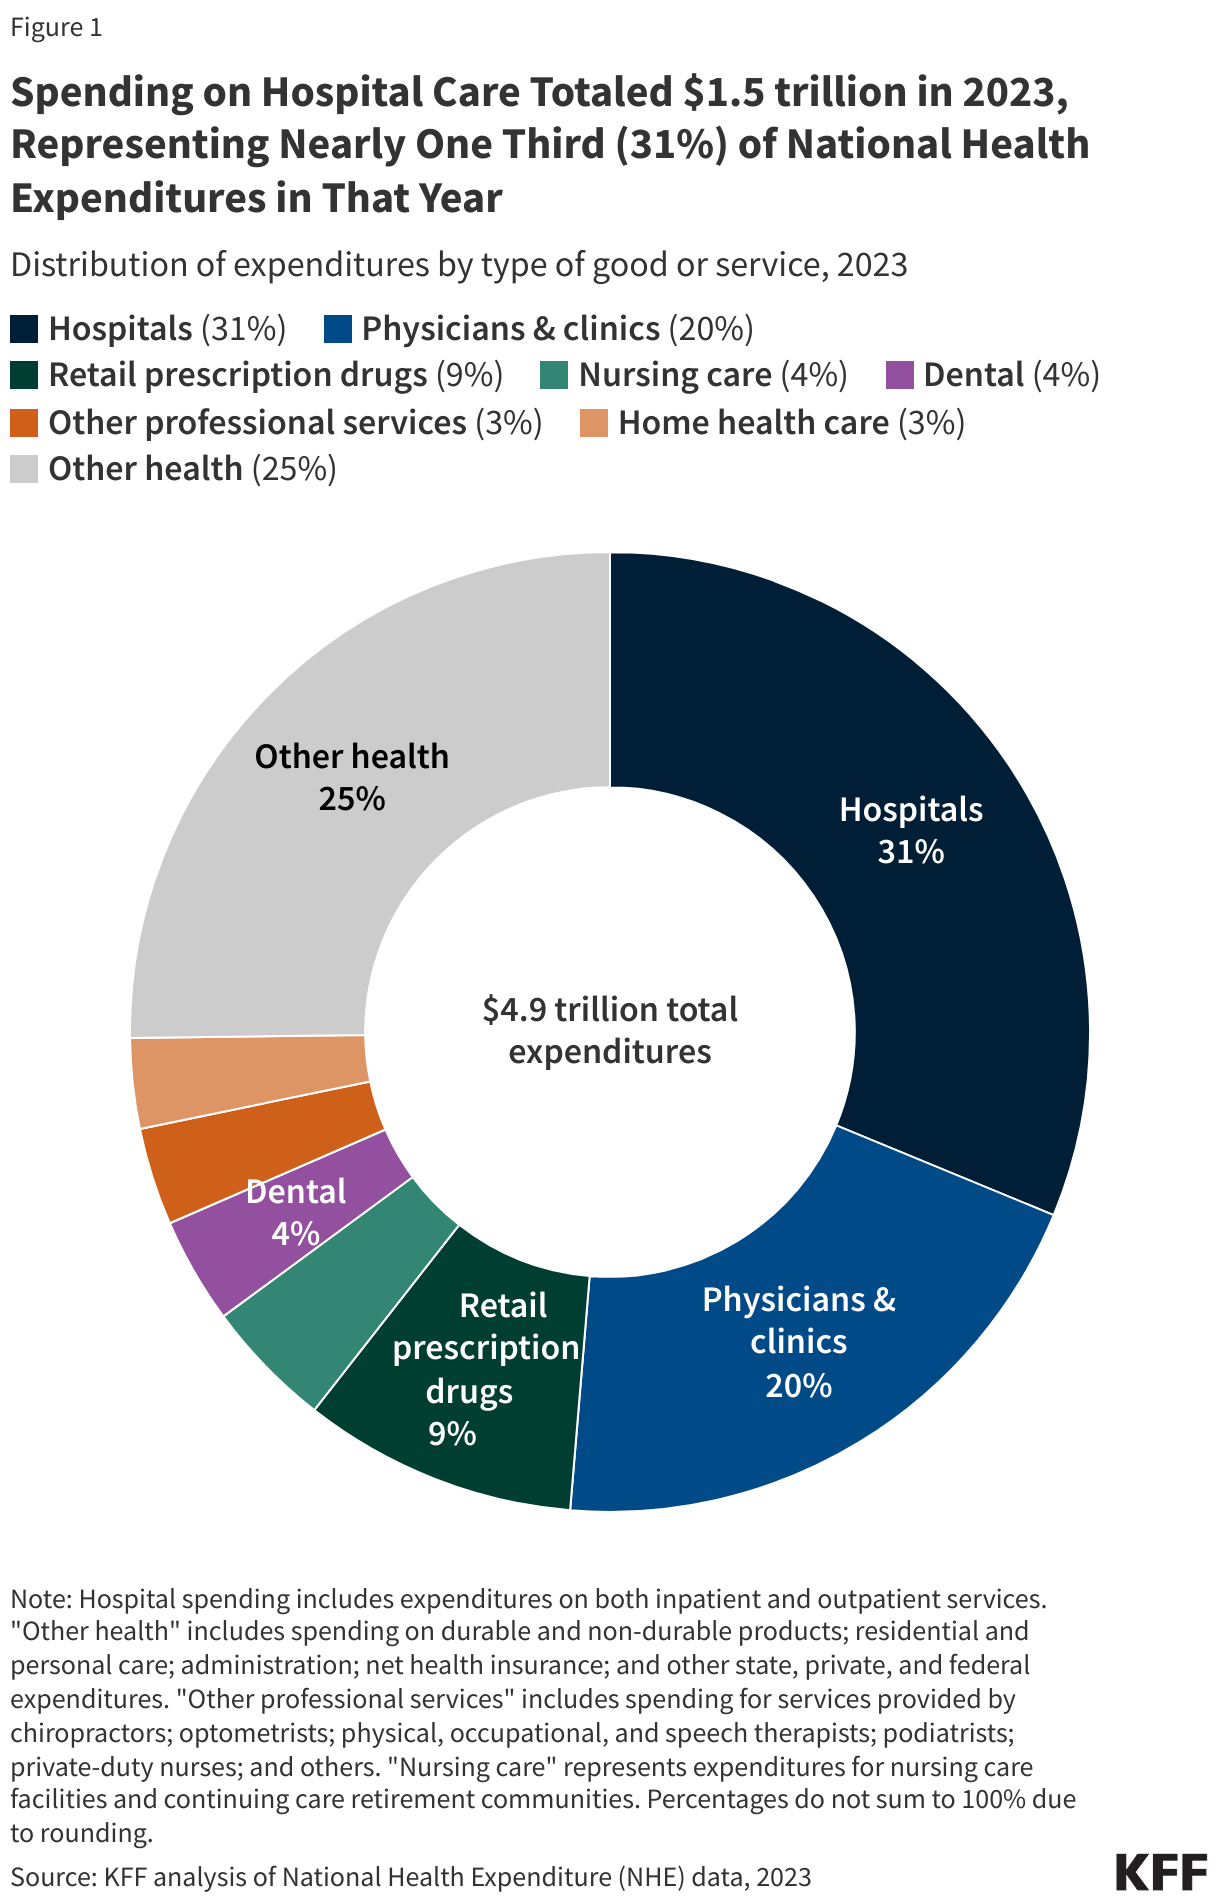
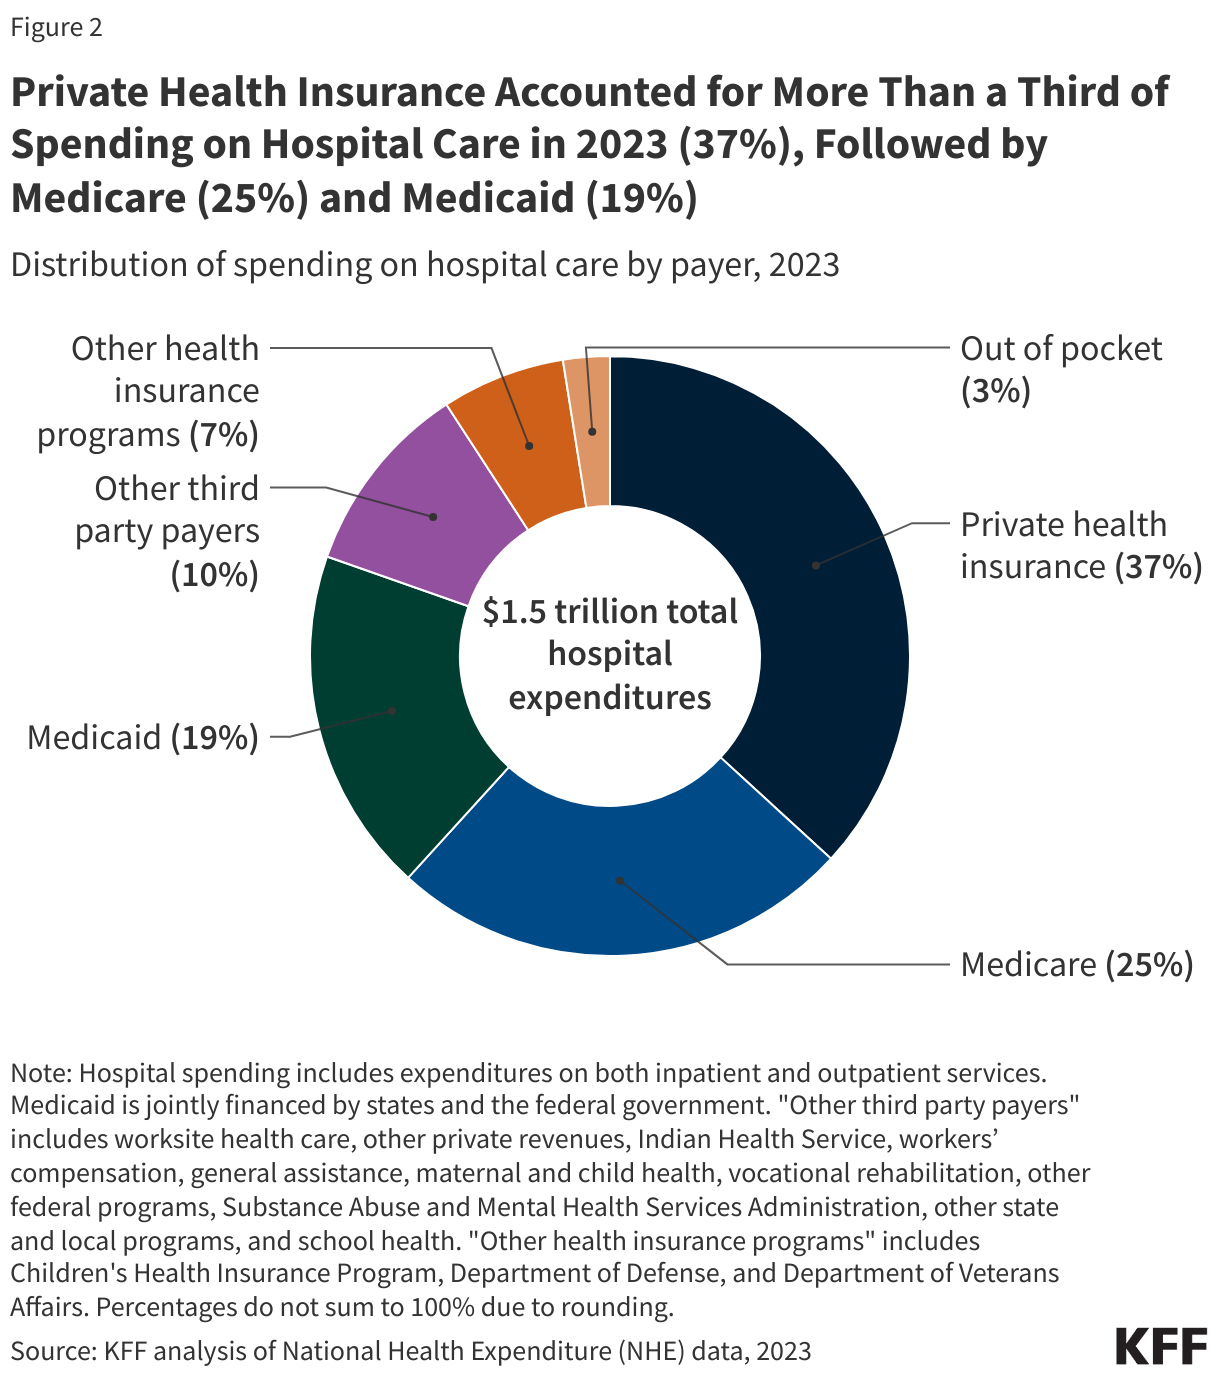
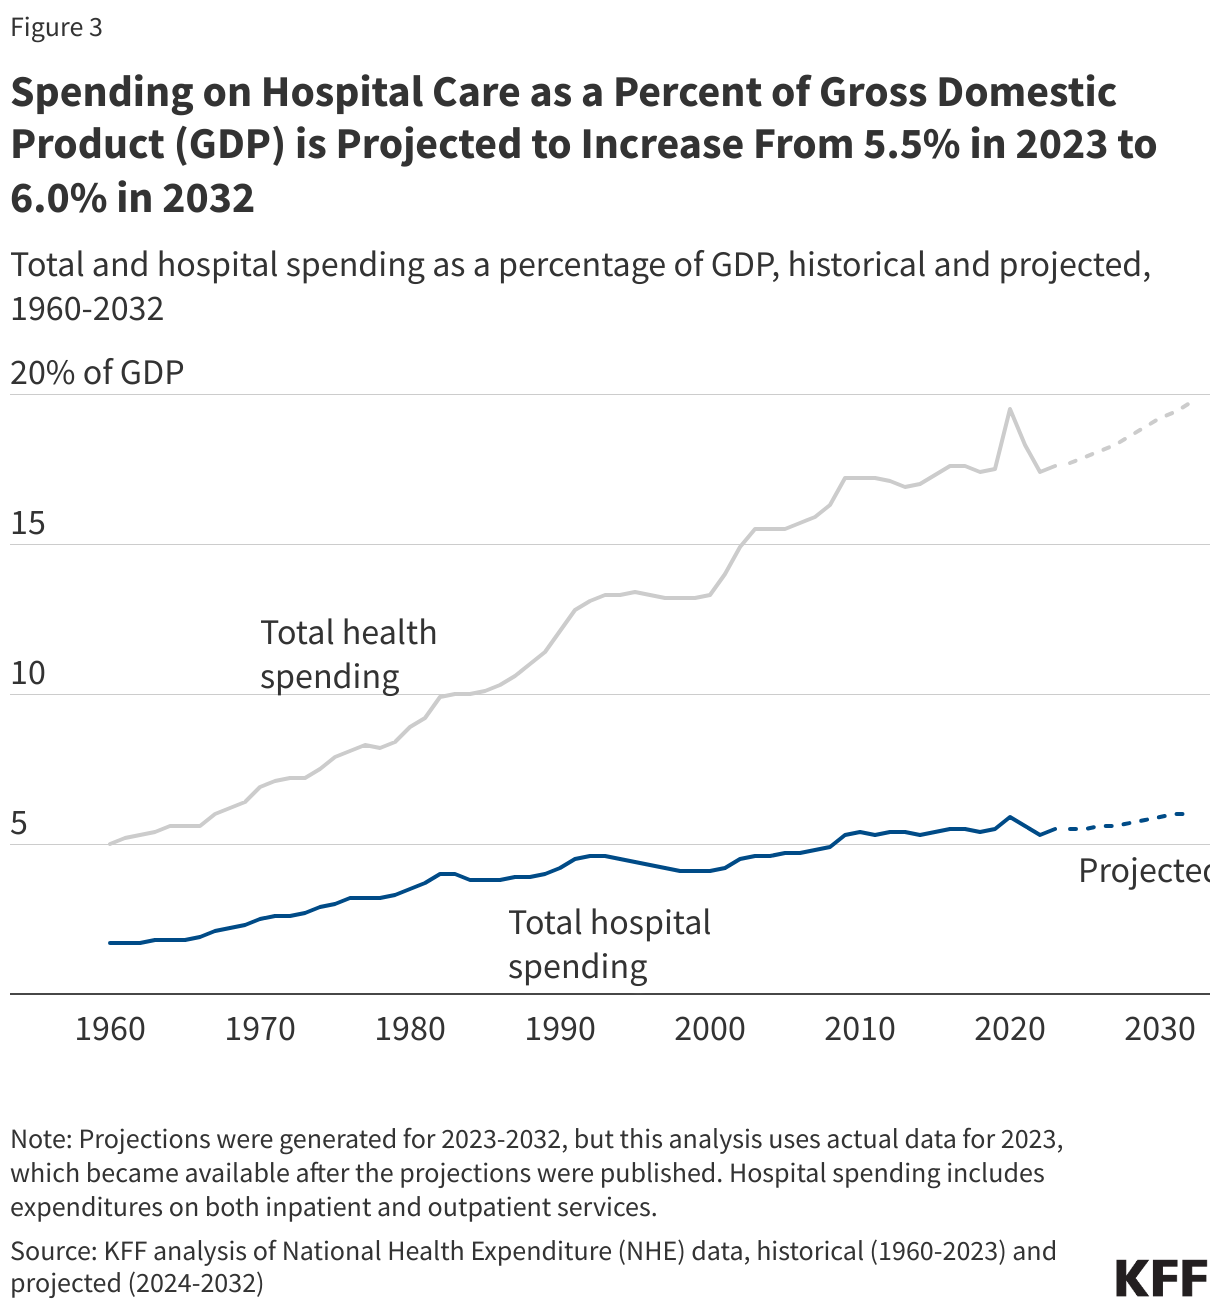
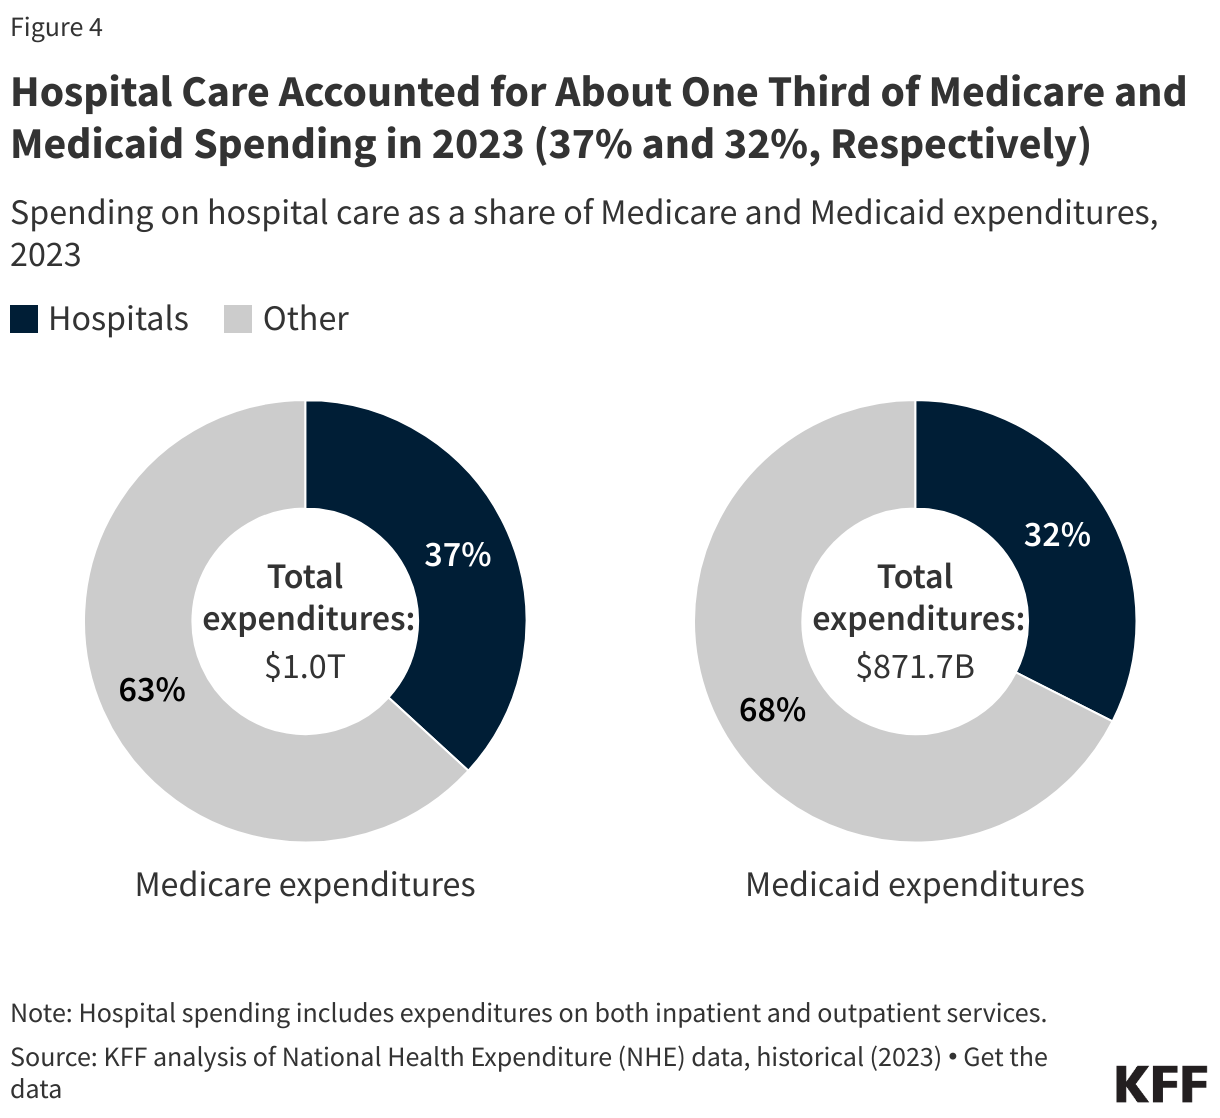
 National Hospital Spending
 The Hospital Industry
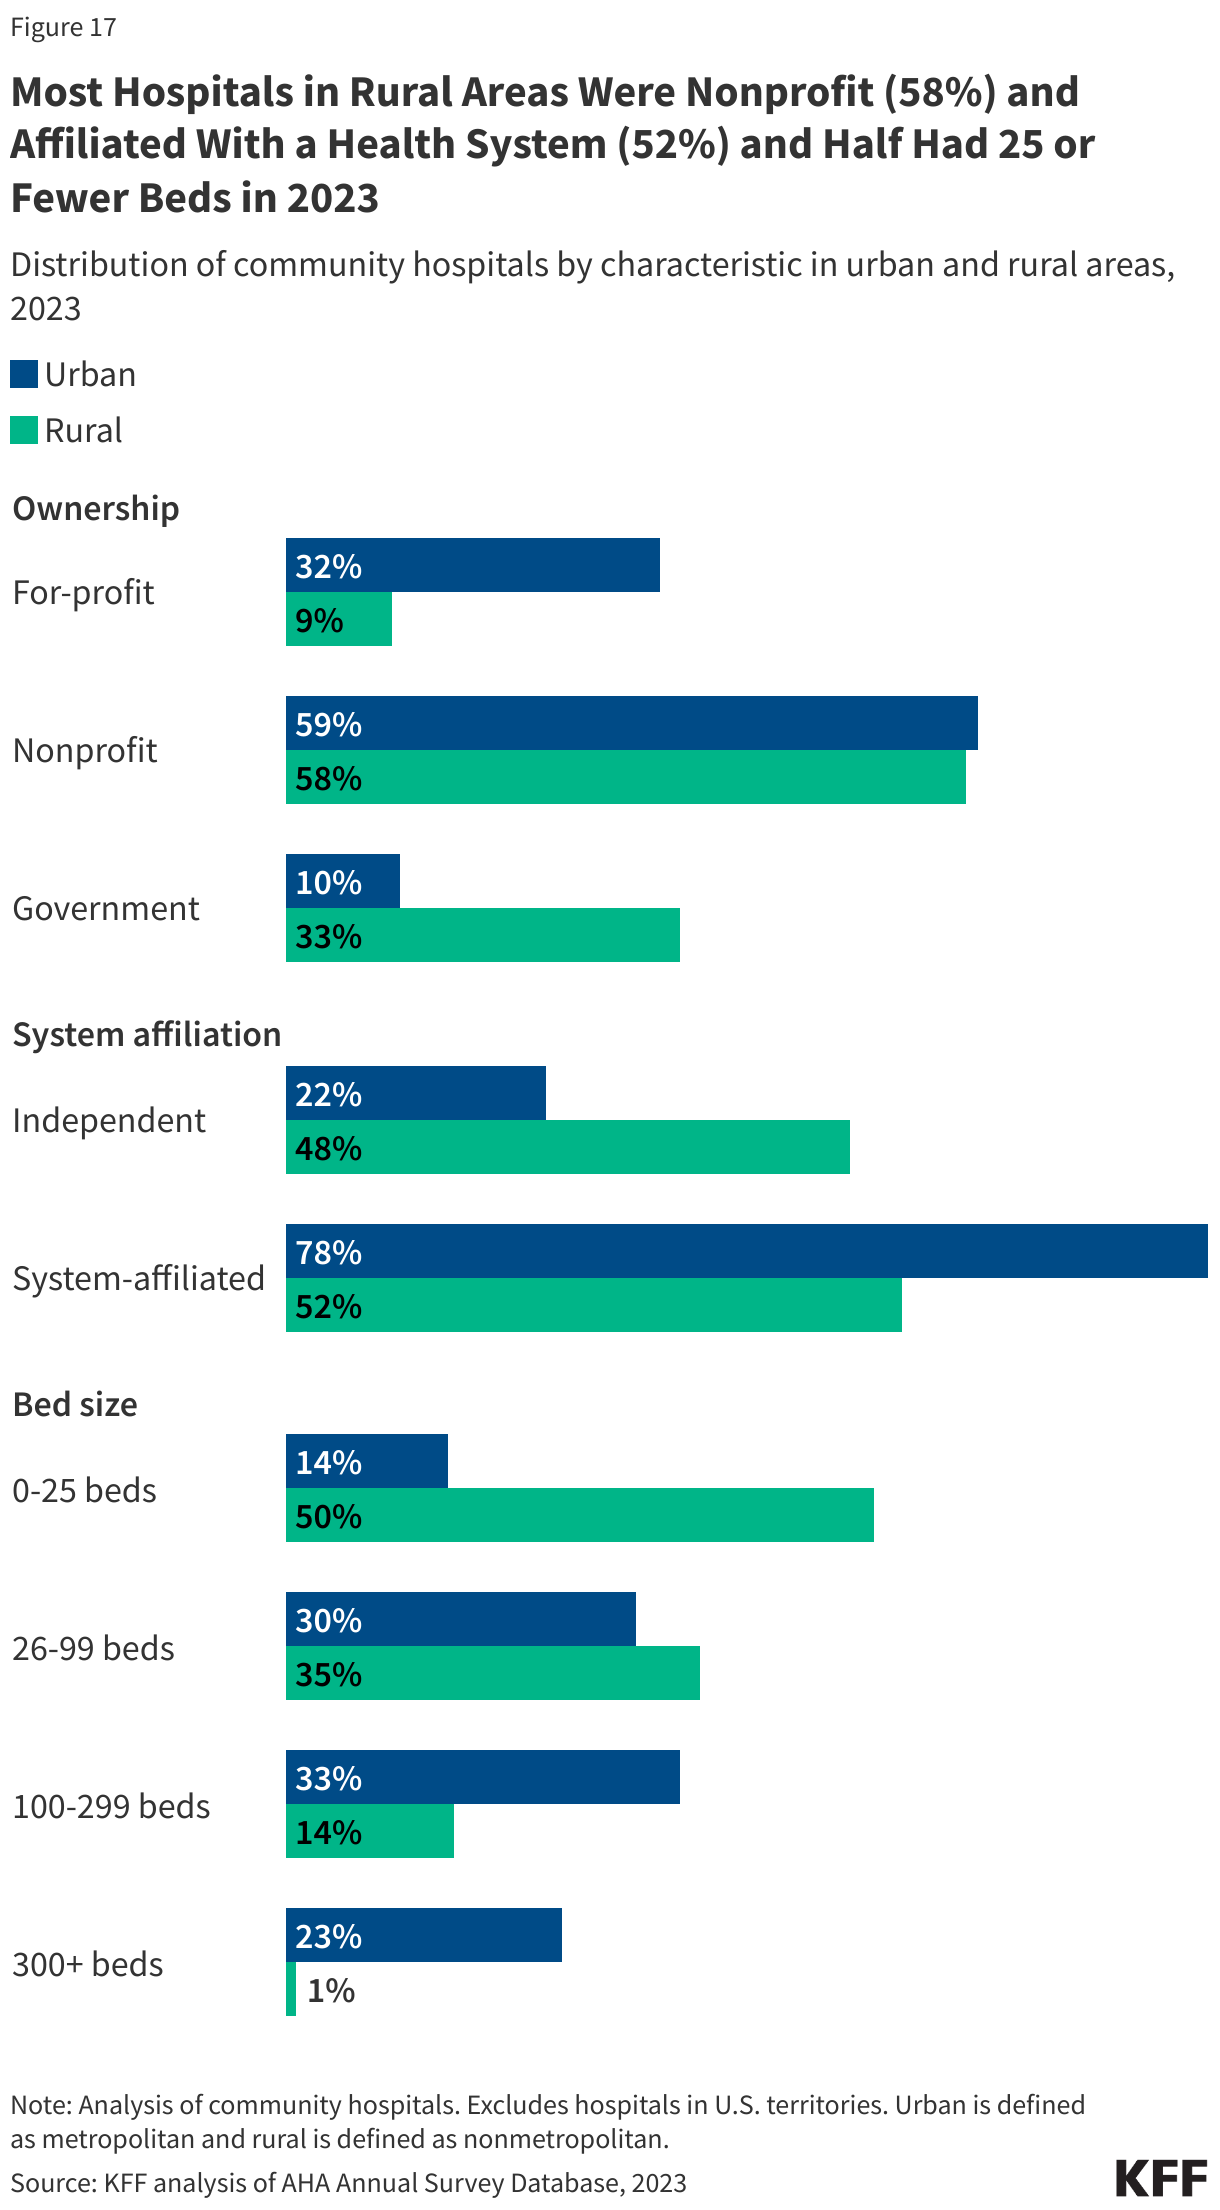
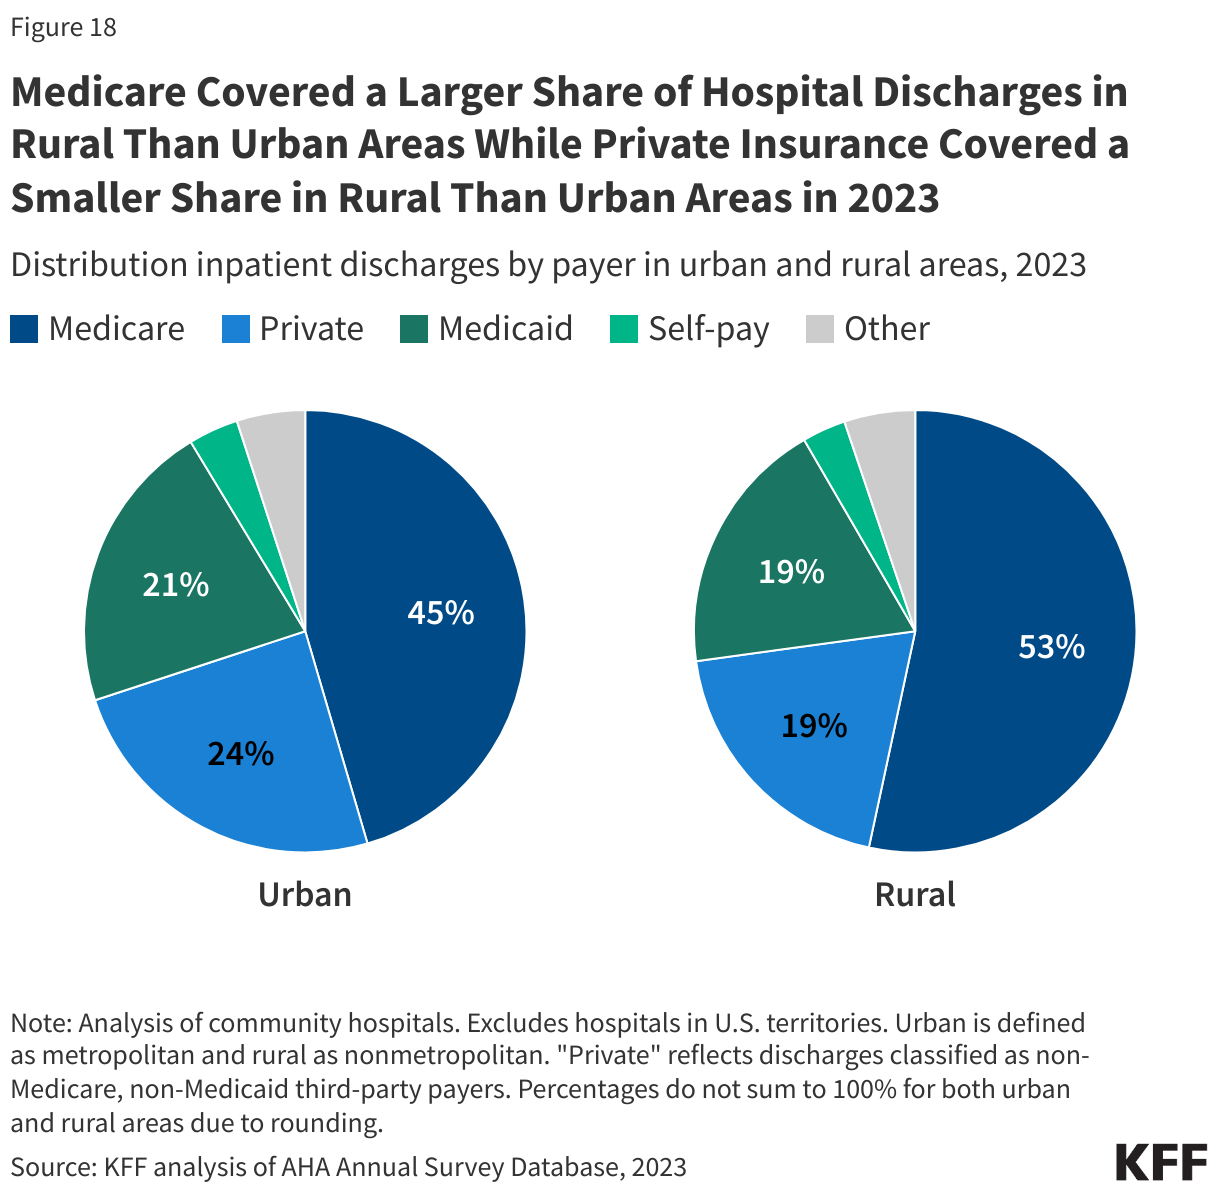
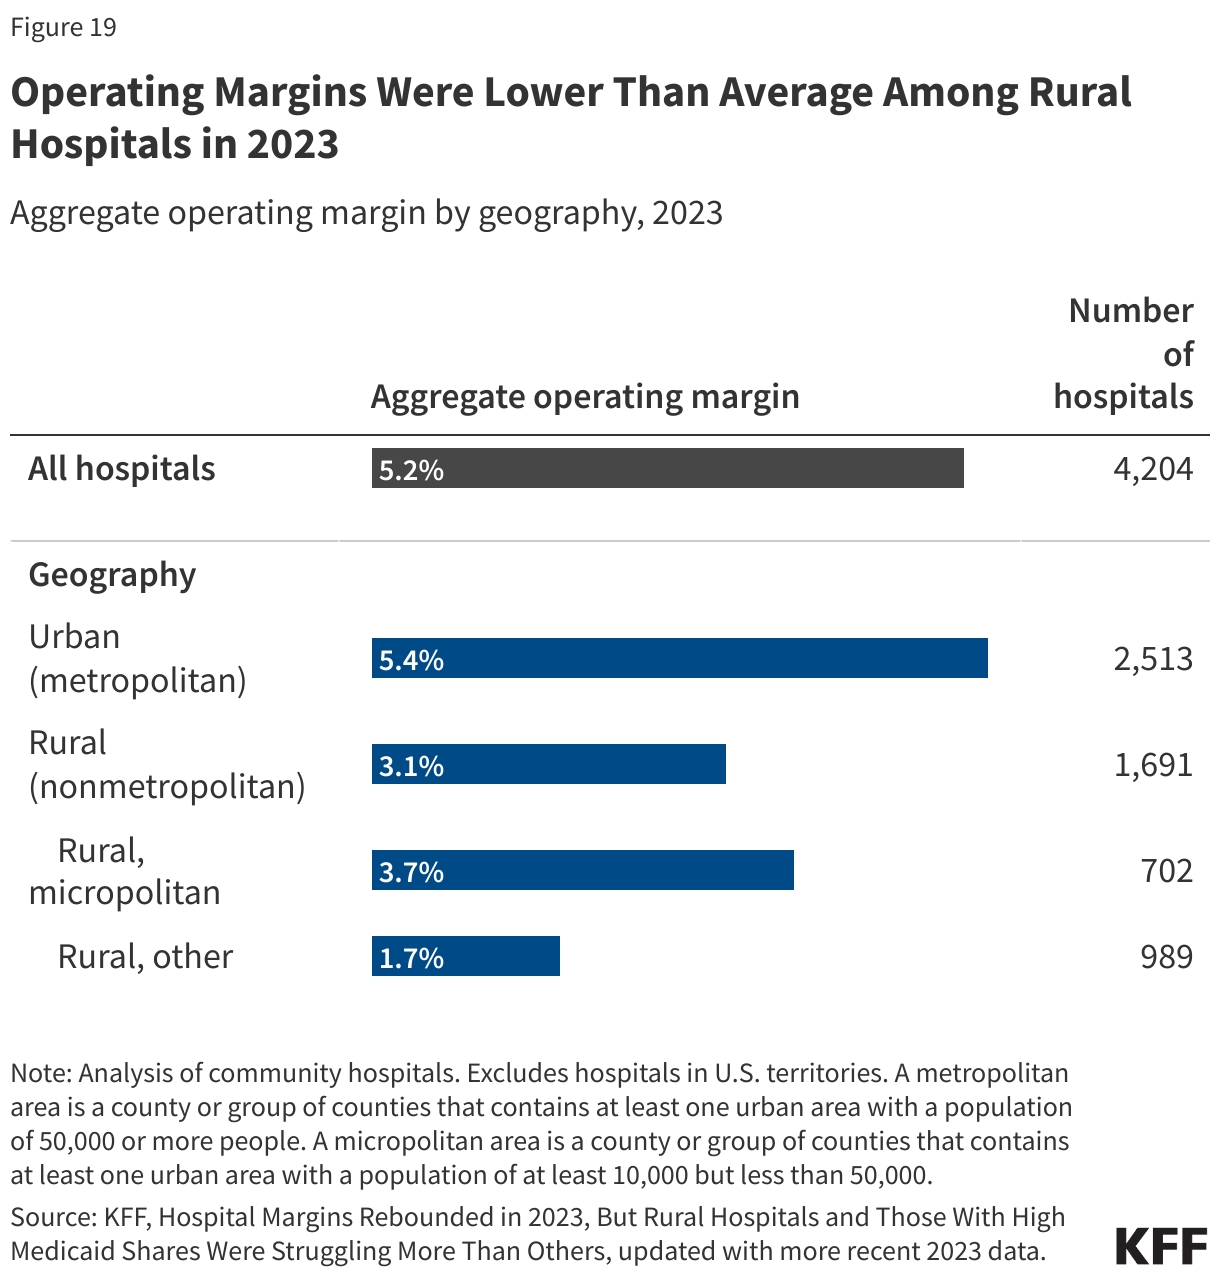
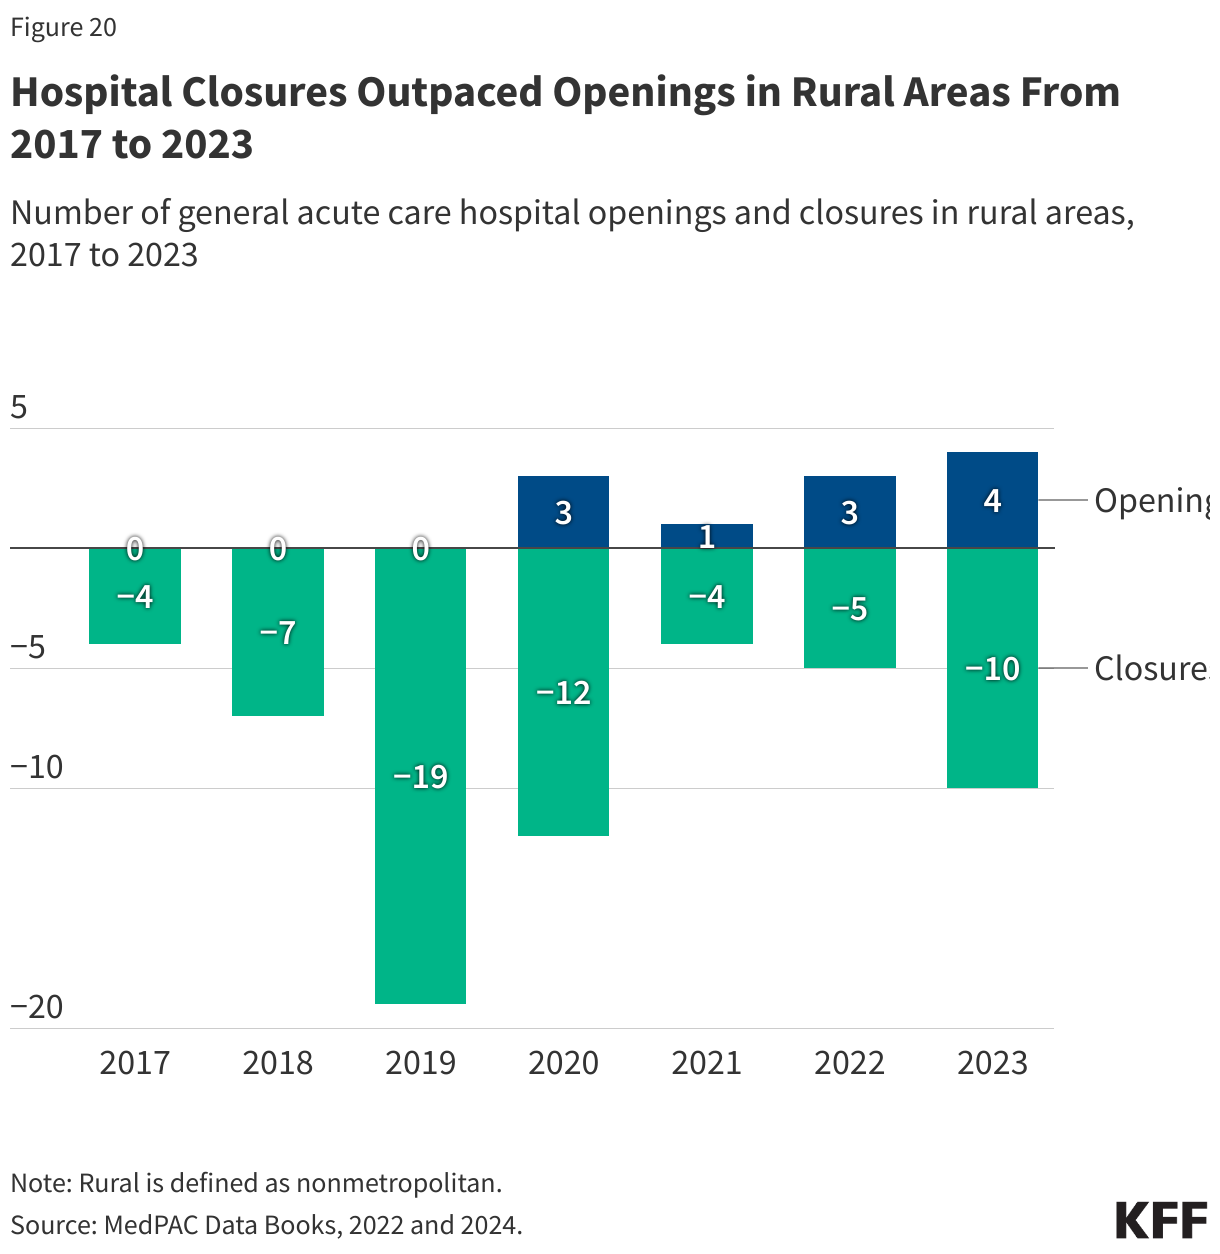
 Rural Hospitals
 Use of Hospital Care
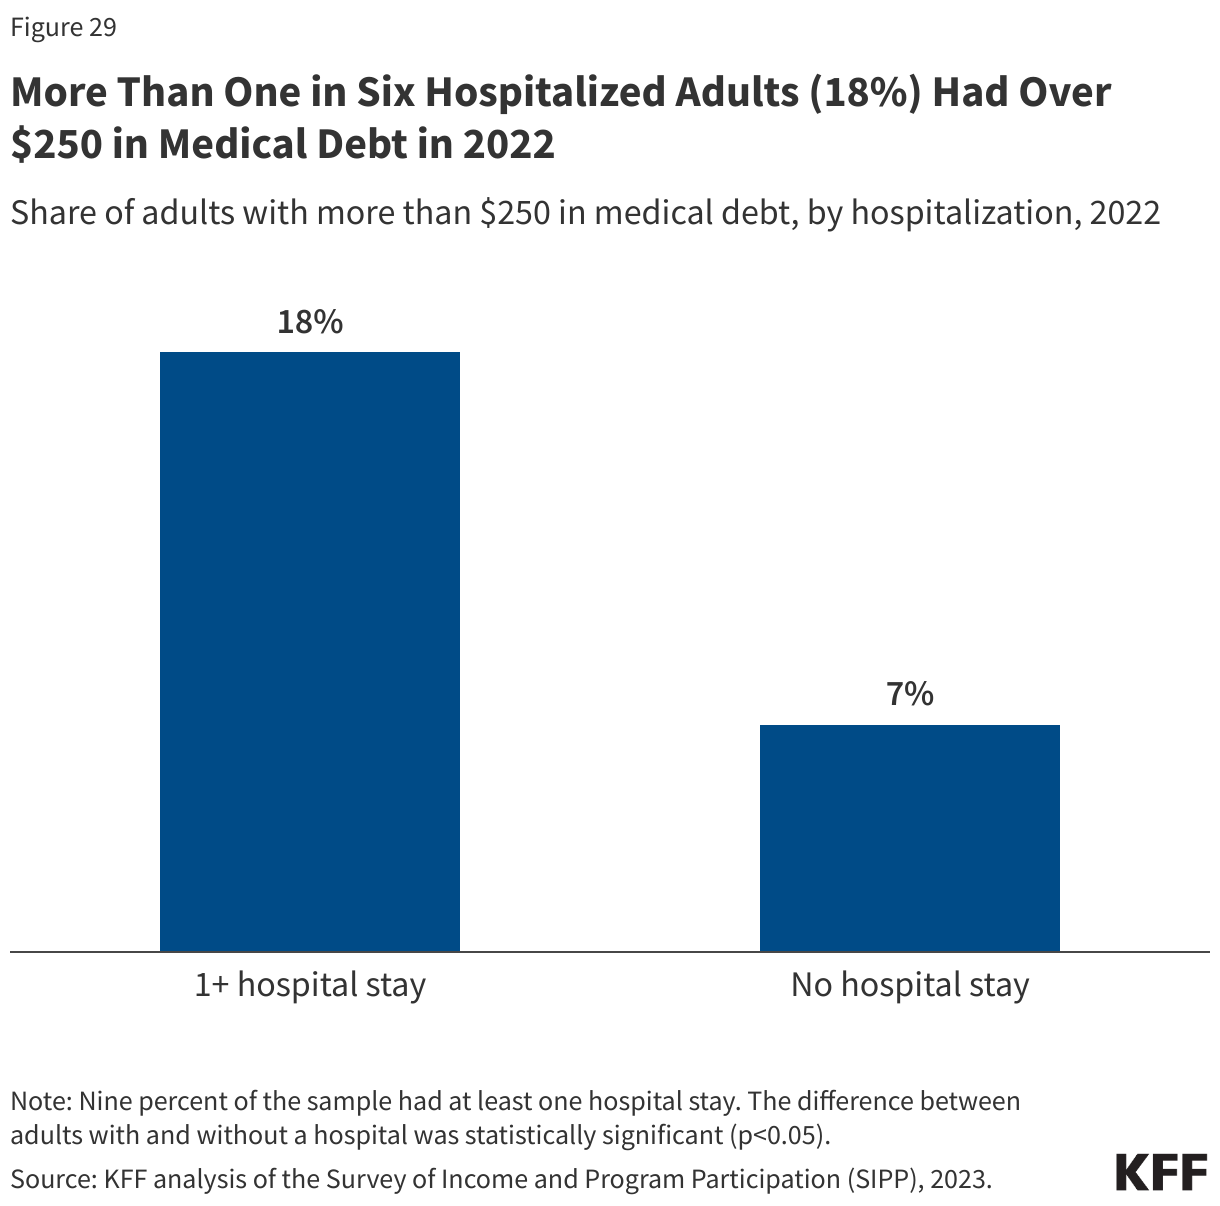
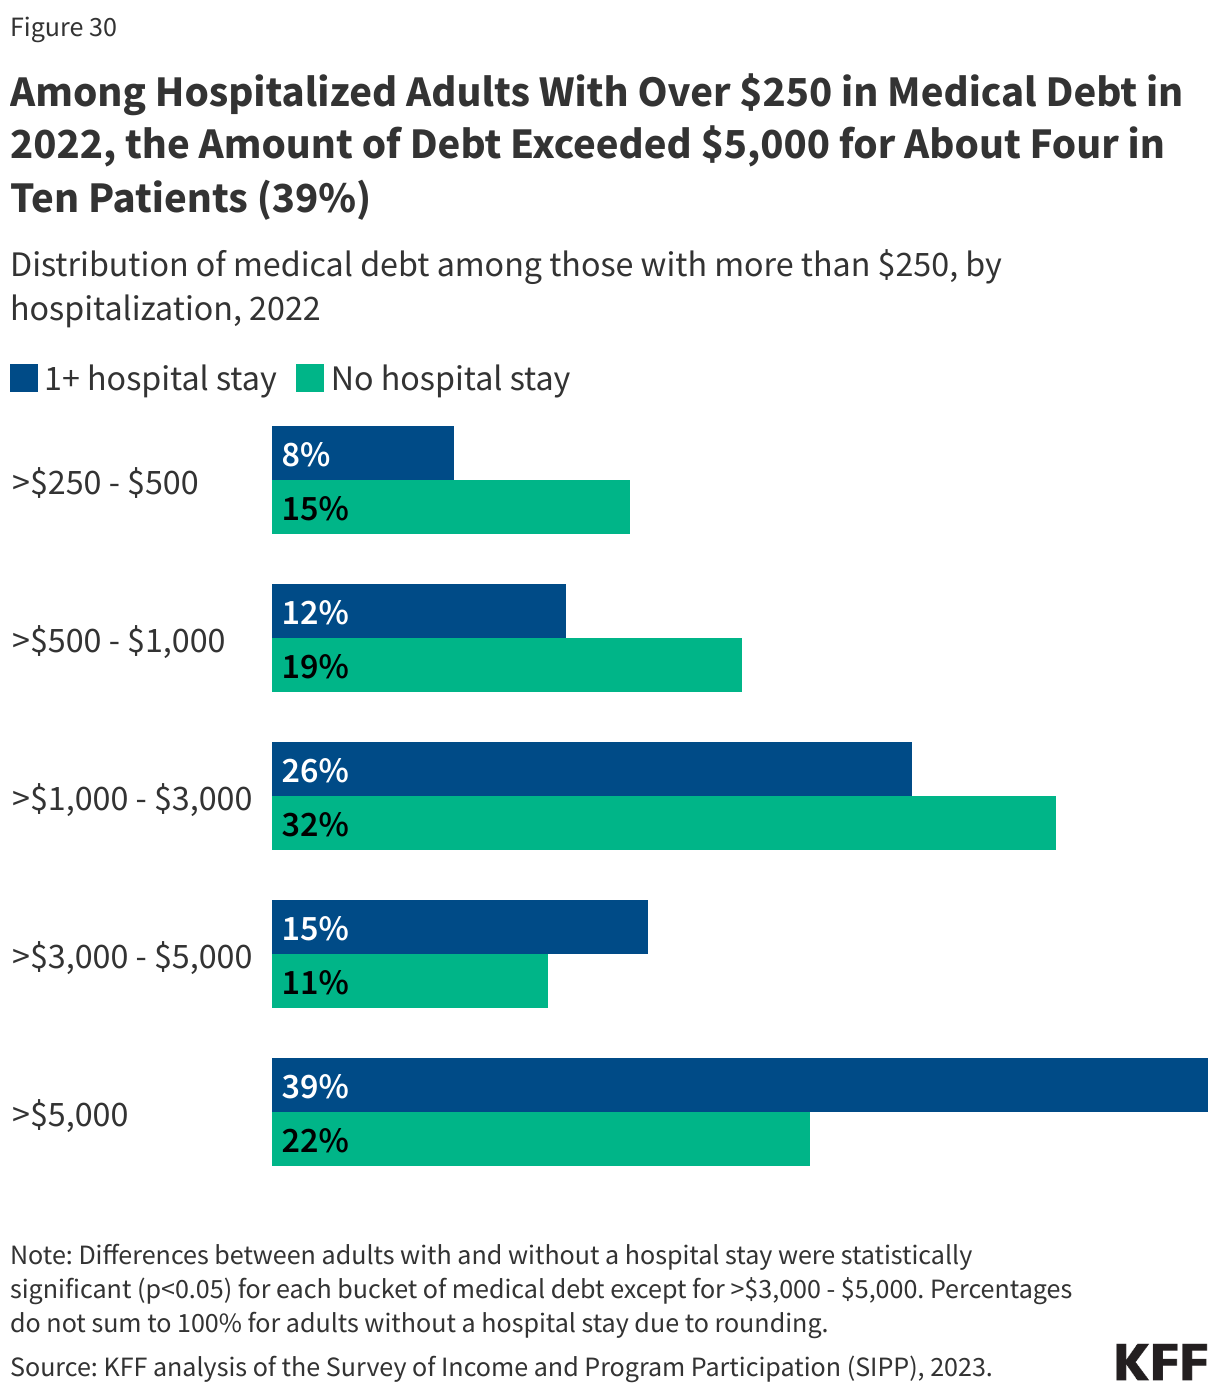
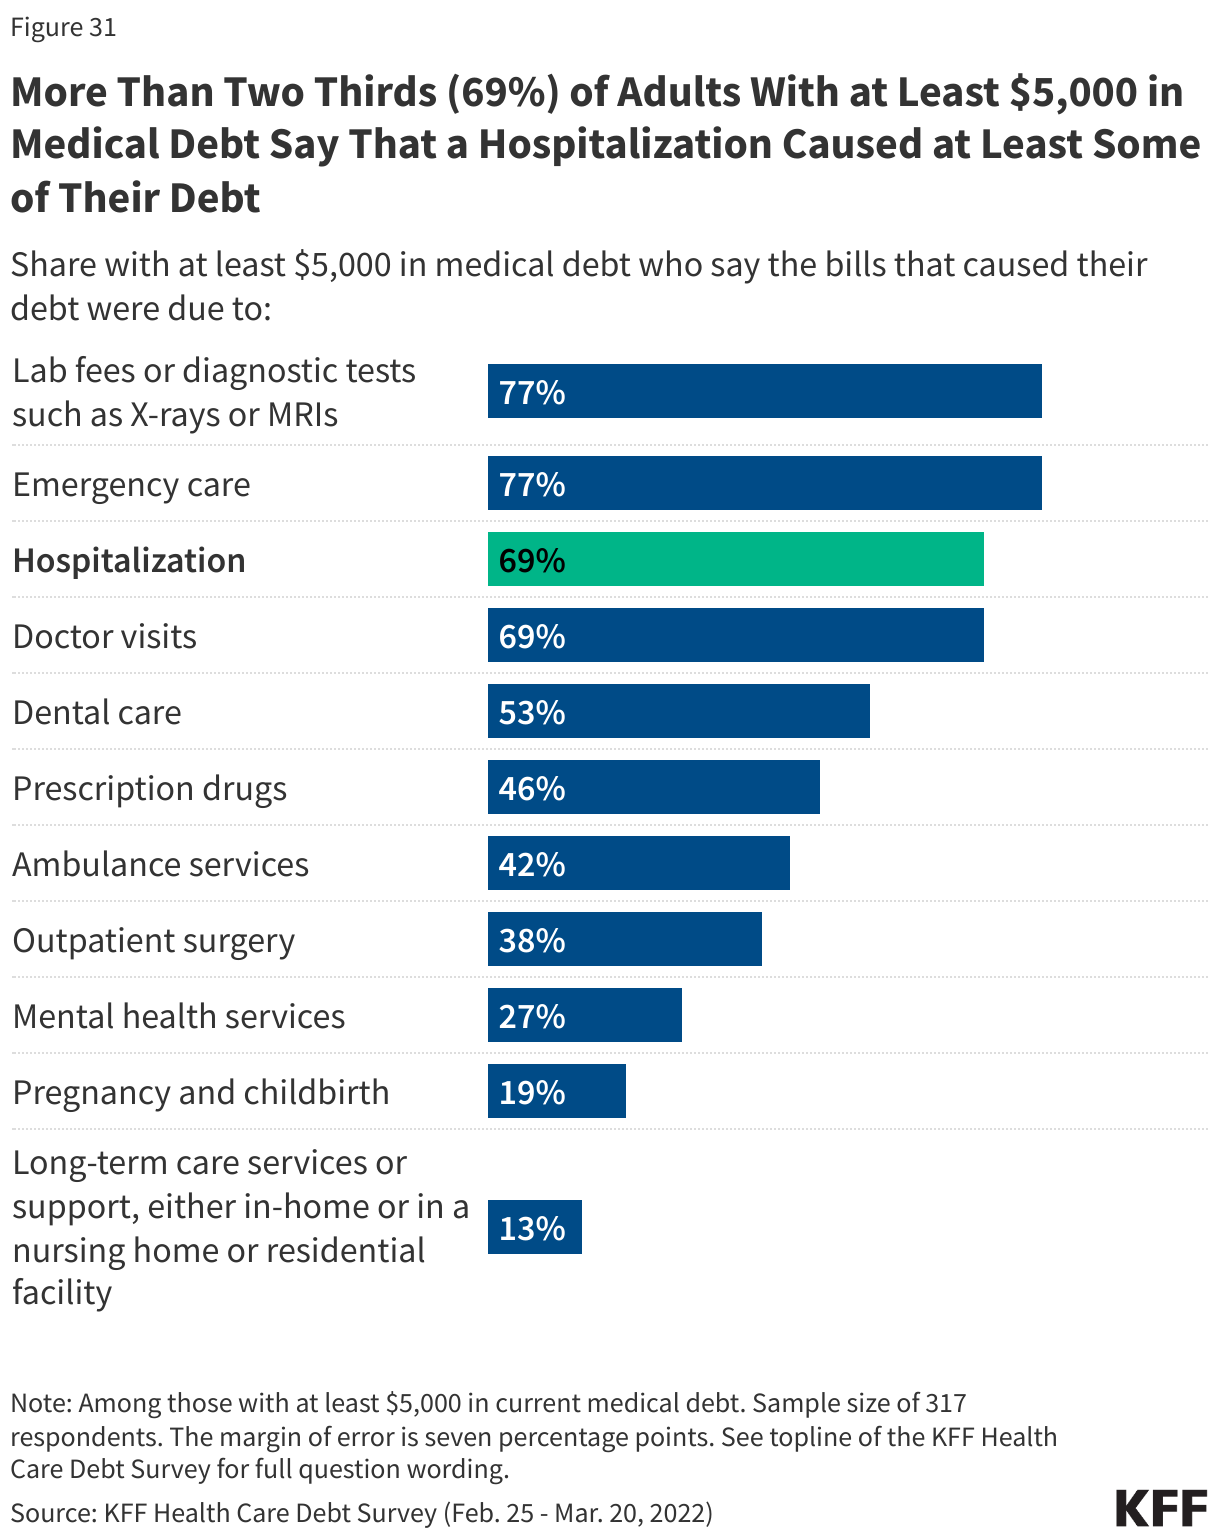
 Out-of-Pocket Spending and Medical Debt
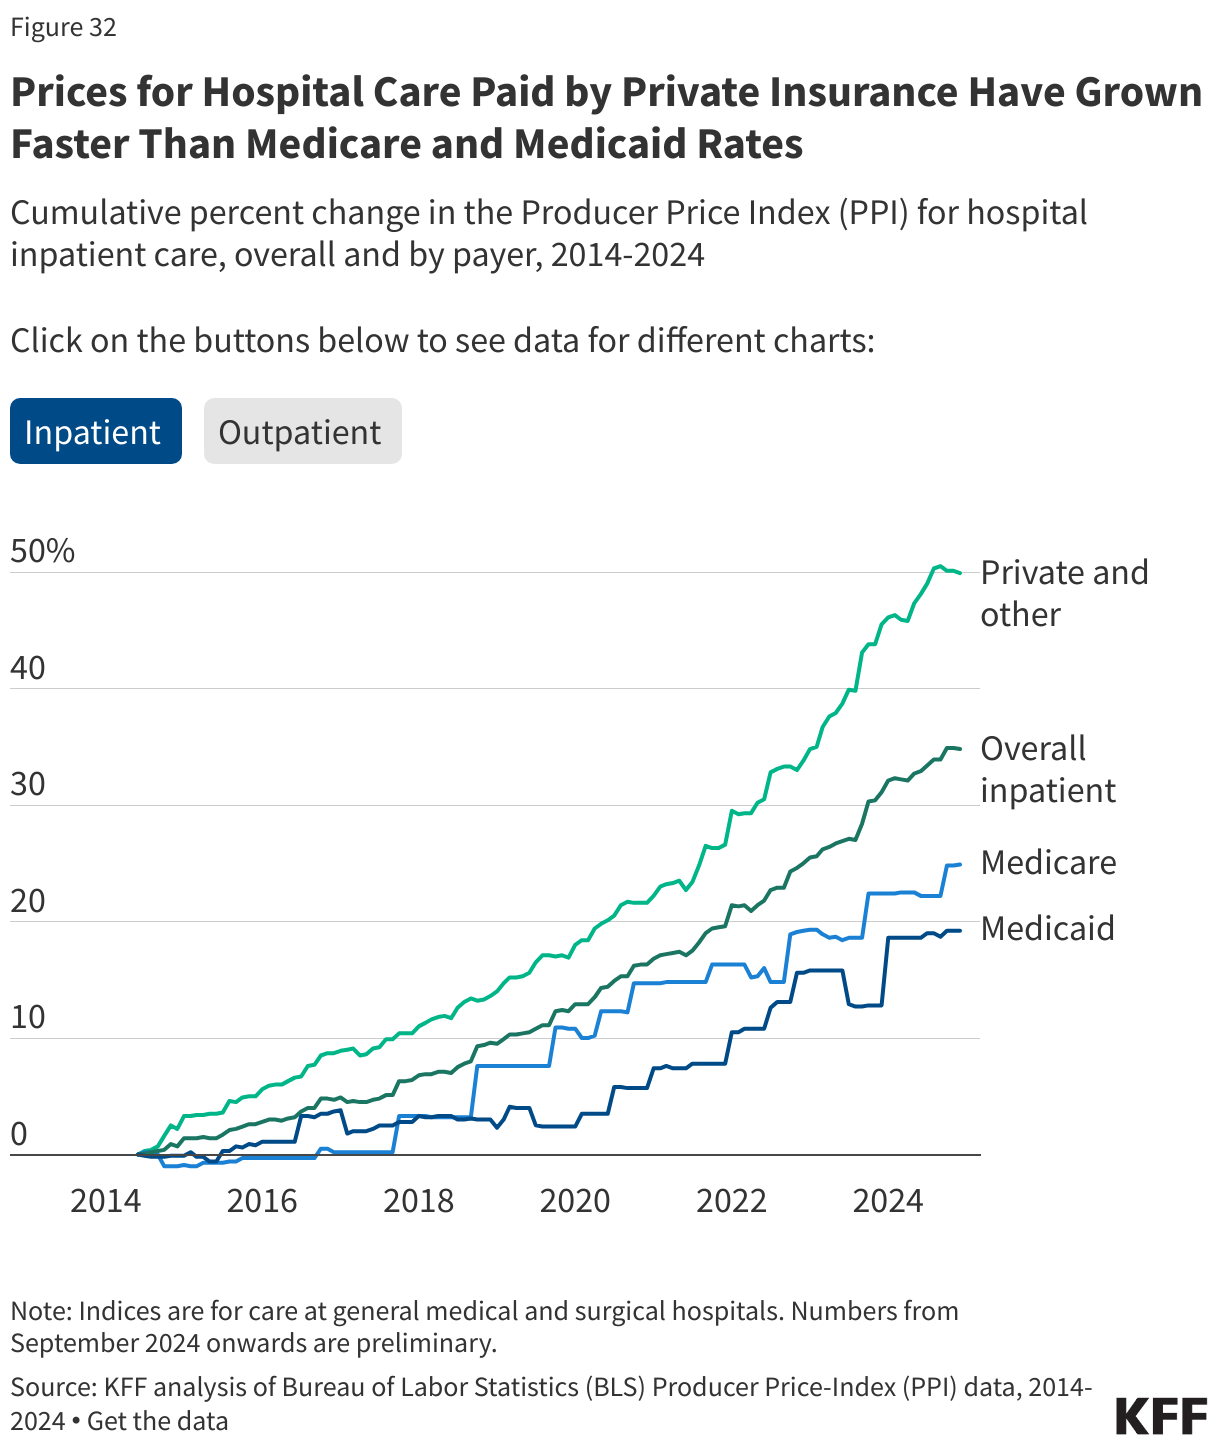
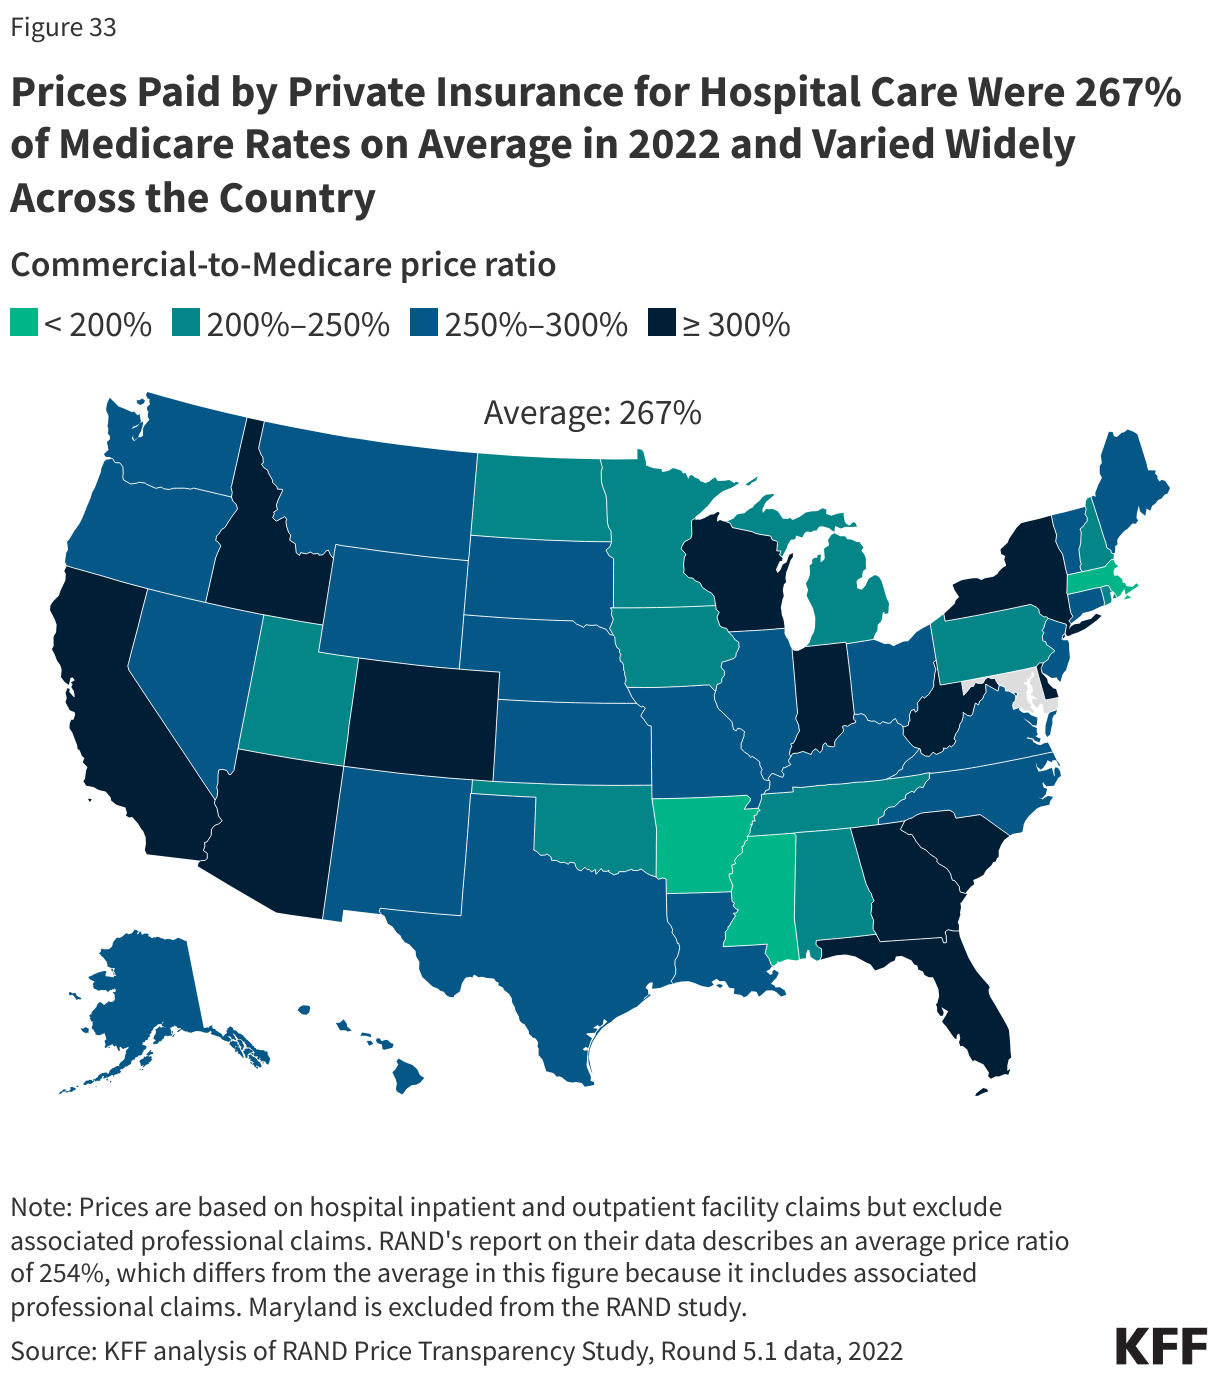
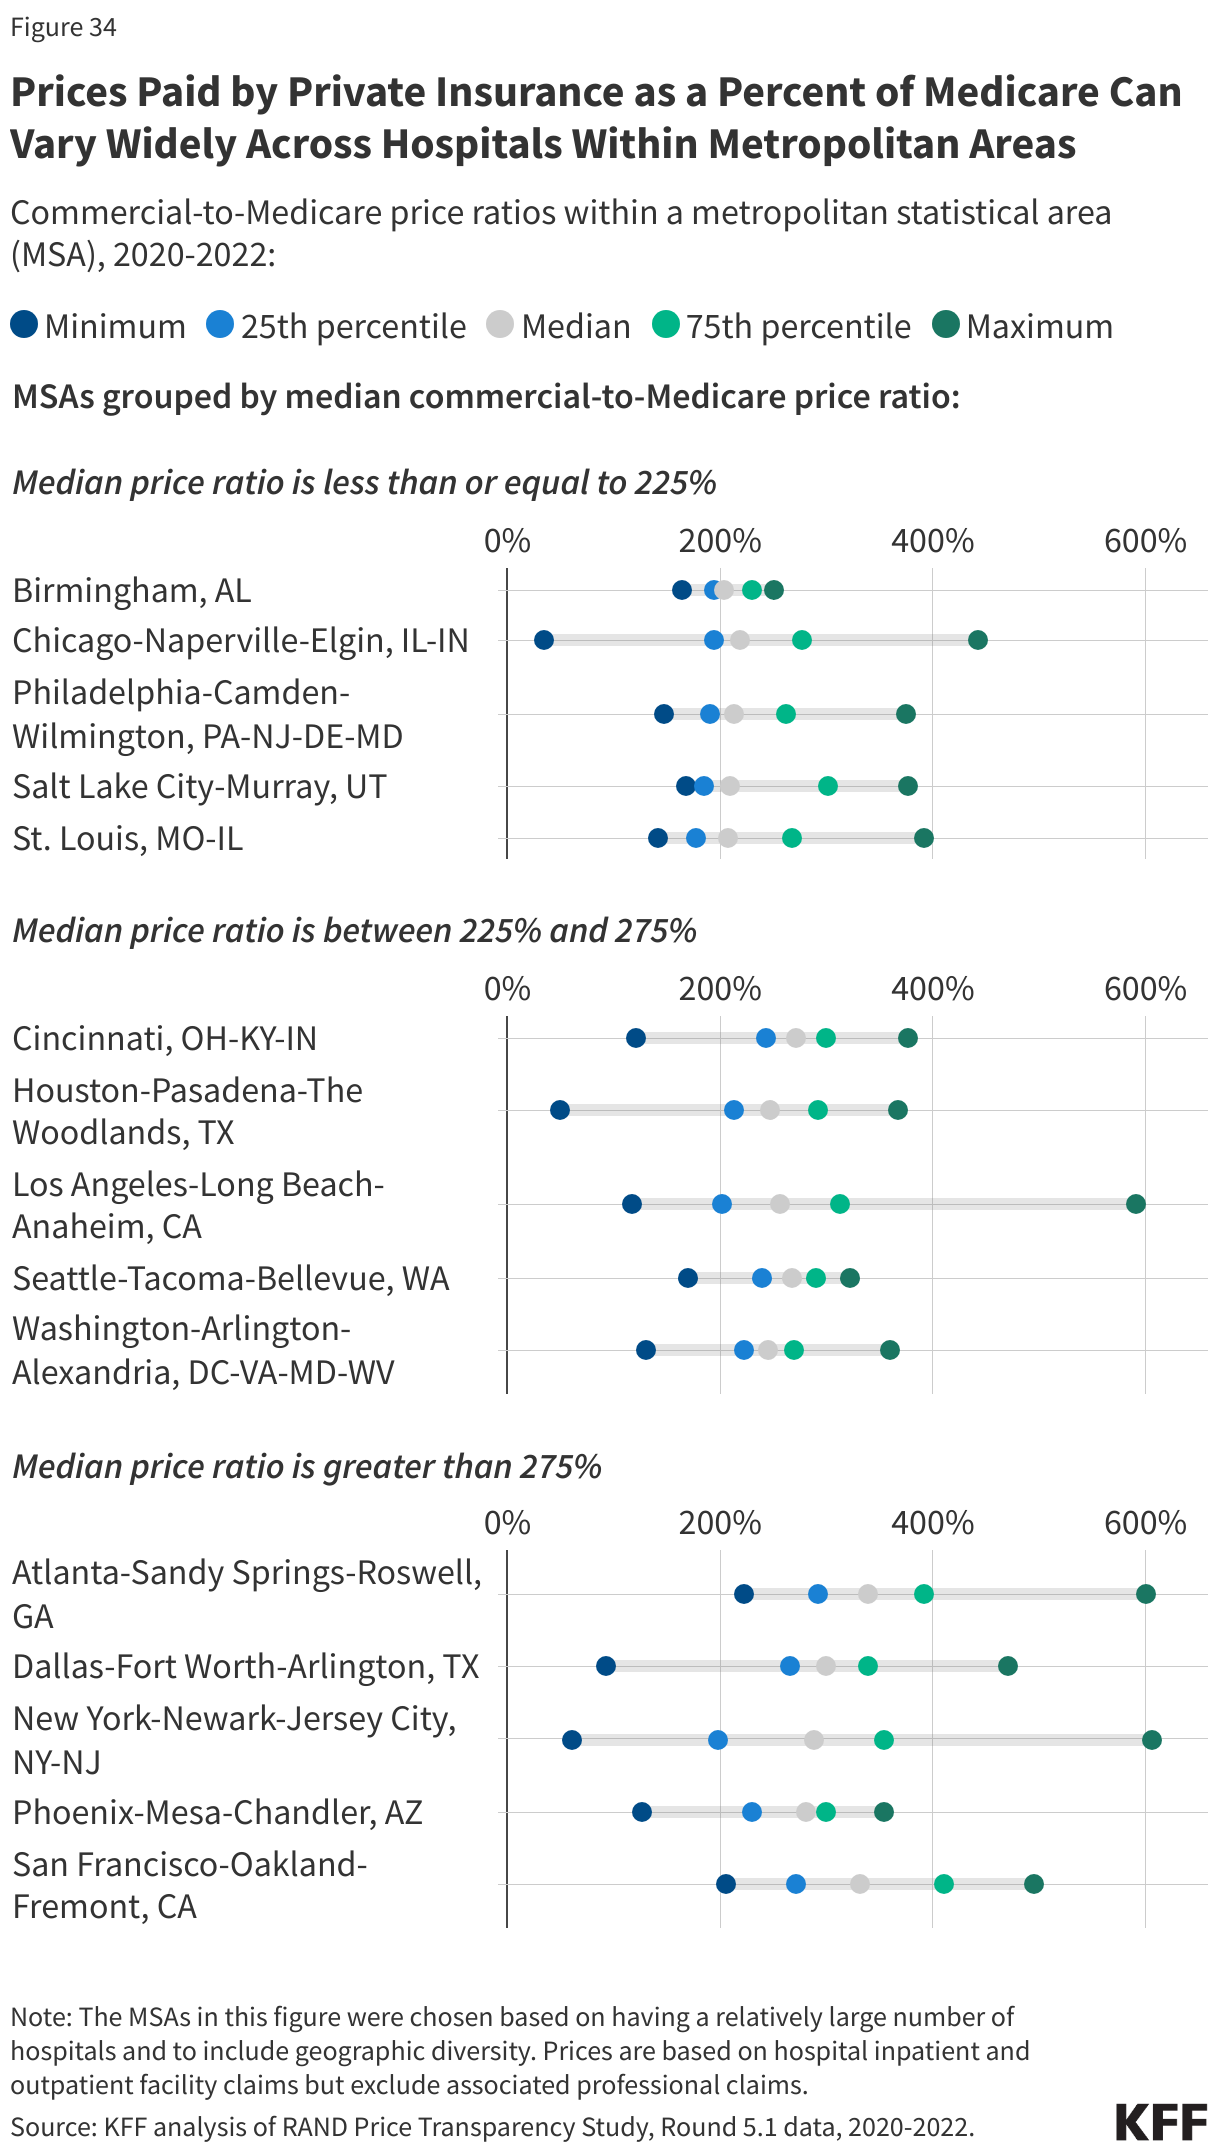
 Hospital Prices
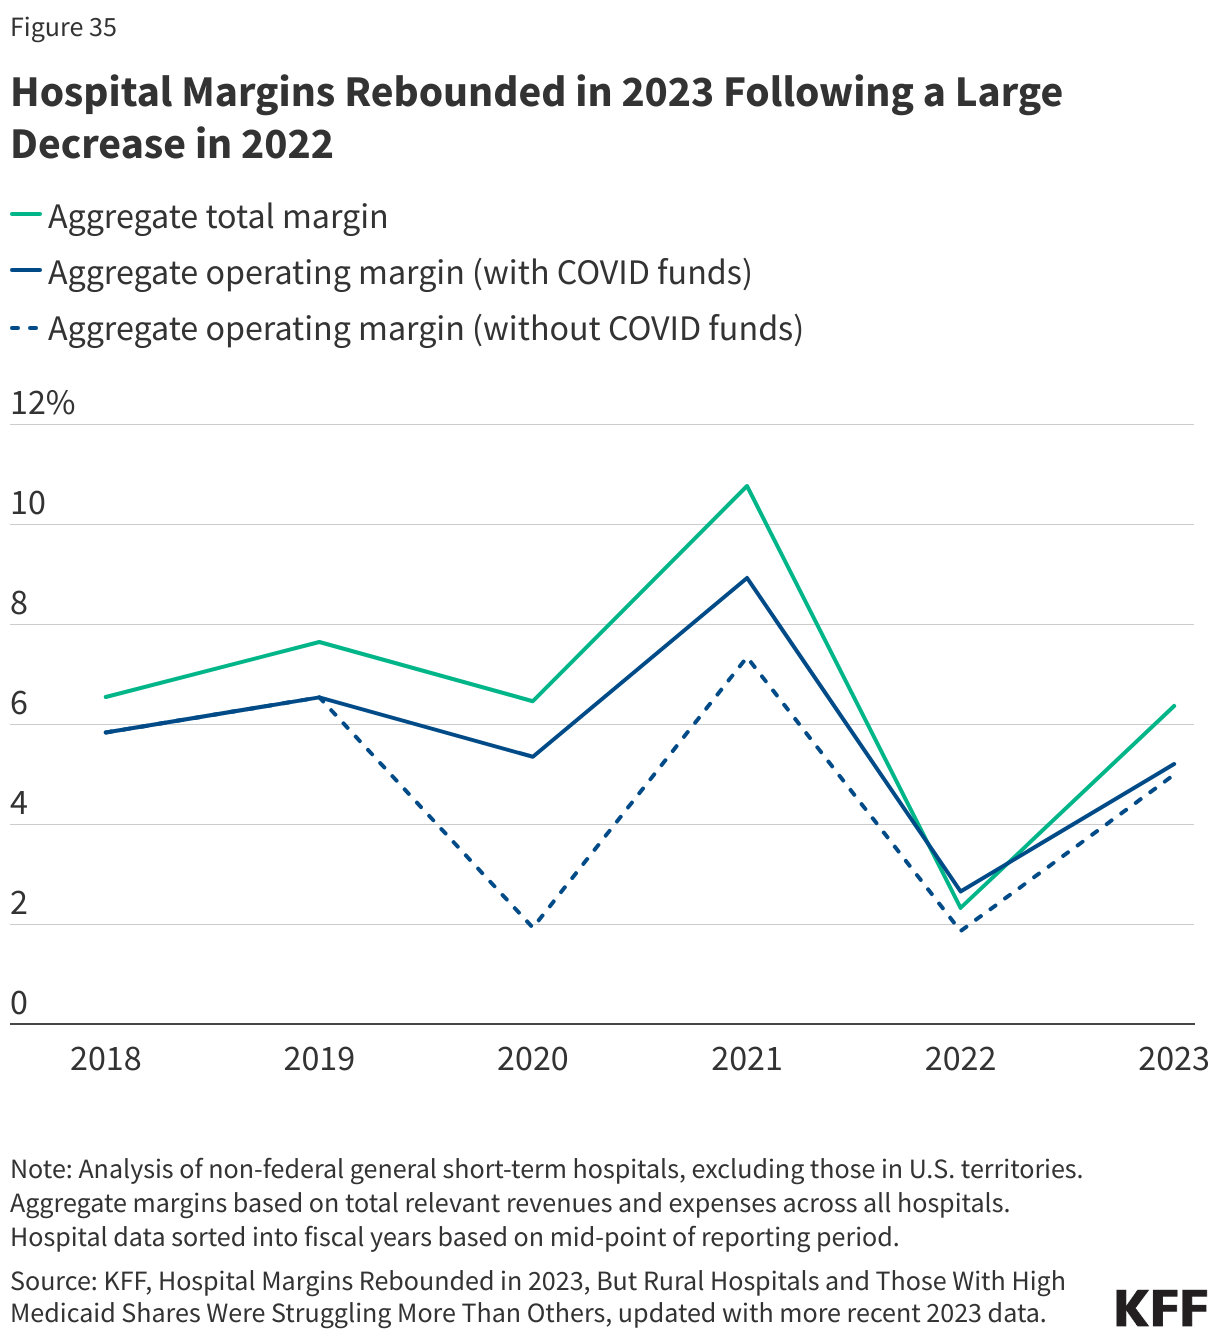
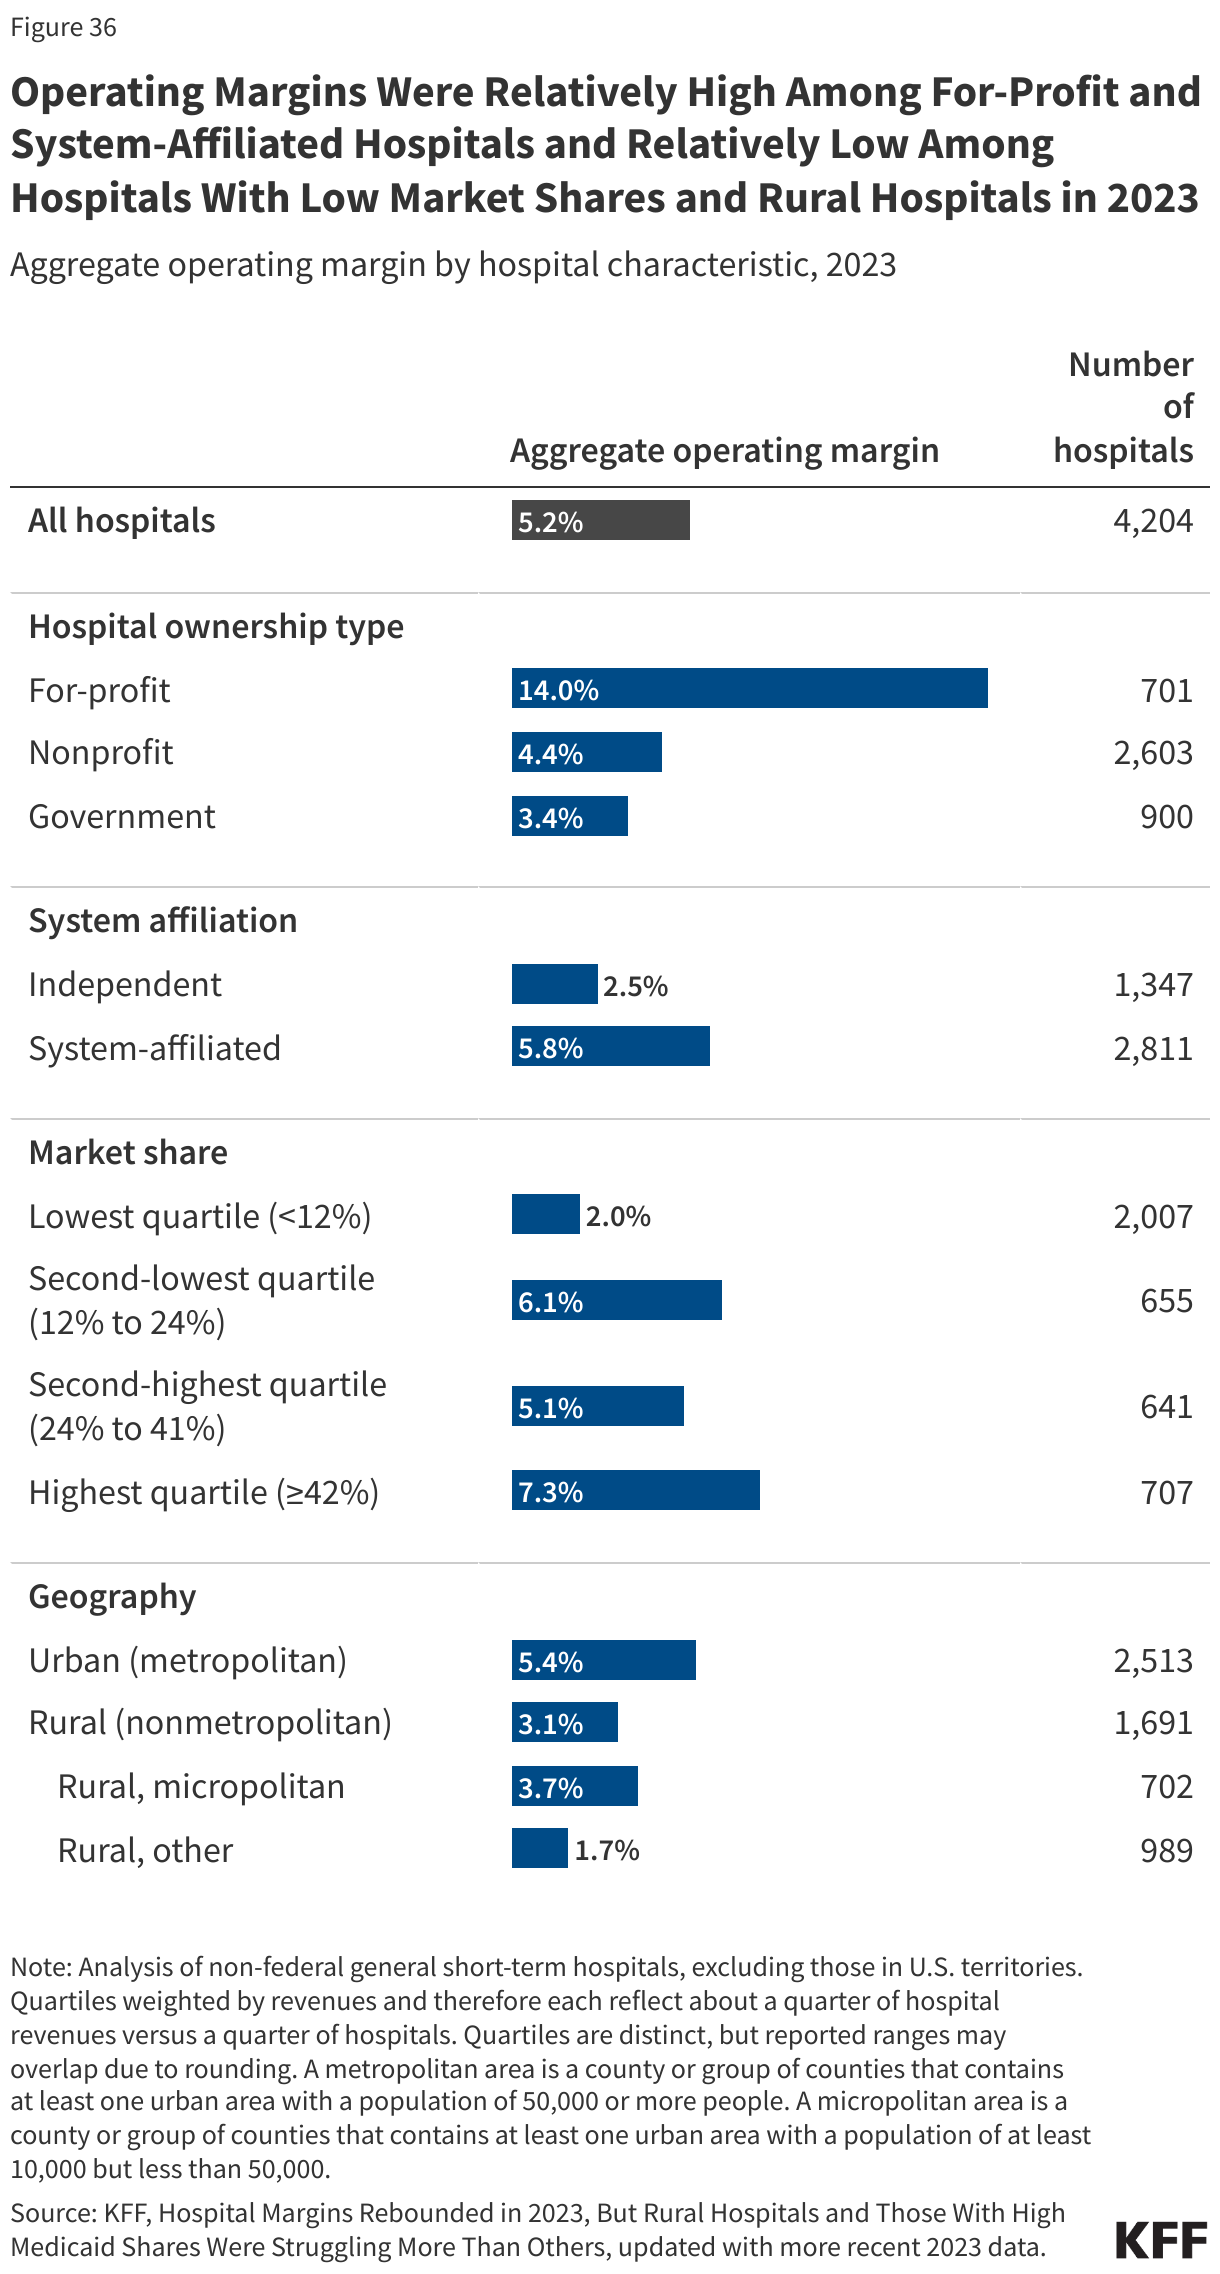
 Hospital Finances
 Charity Care
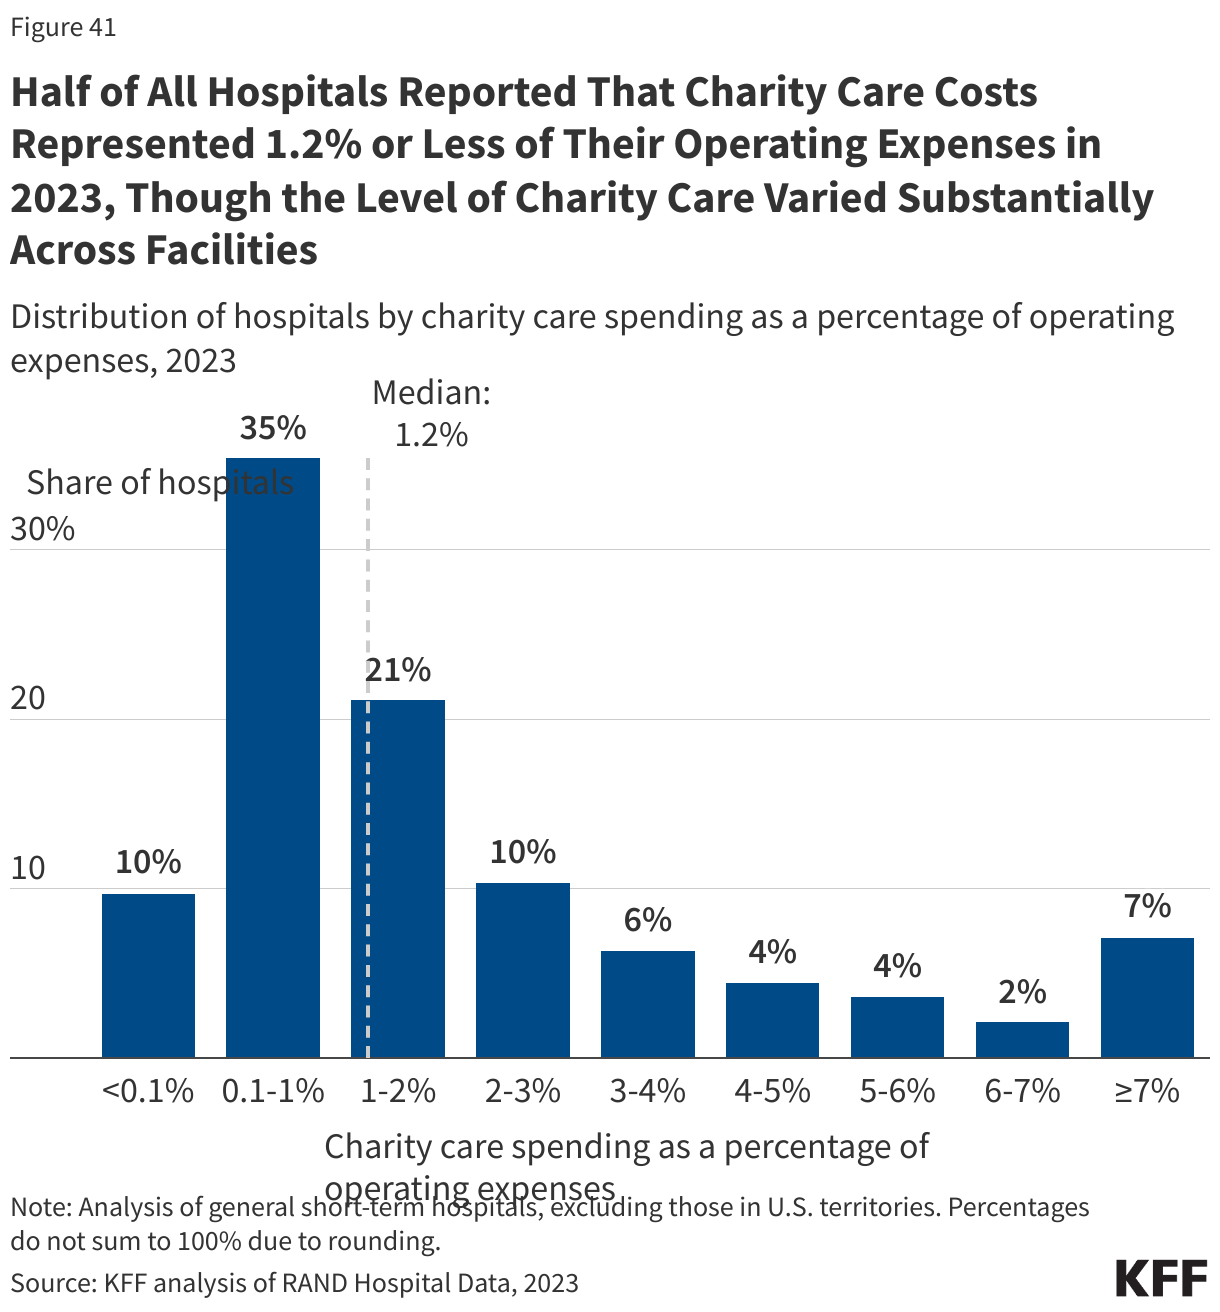
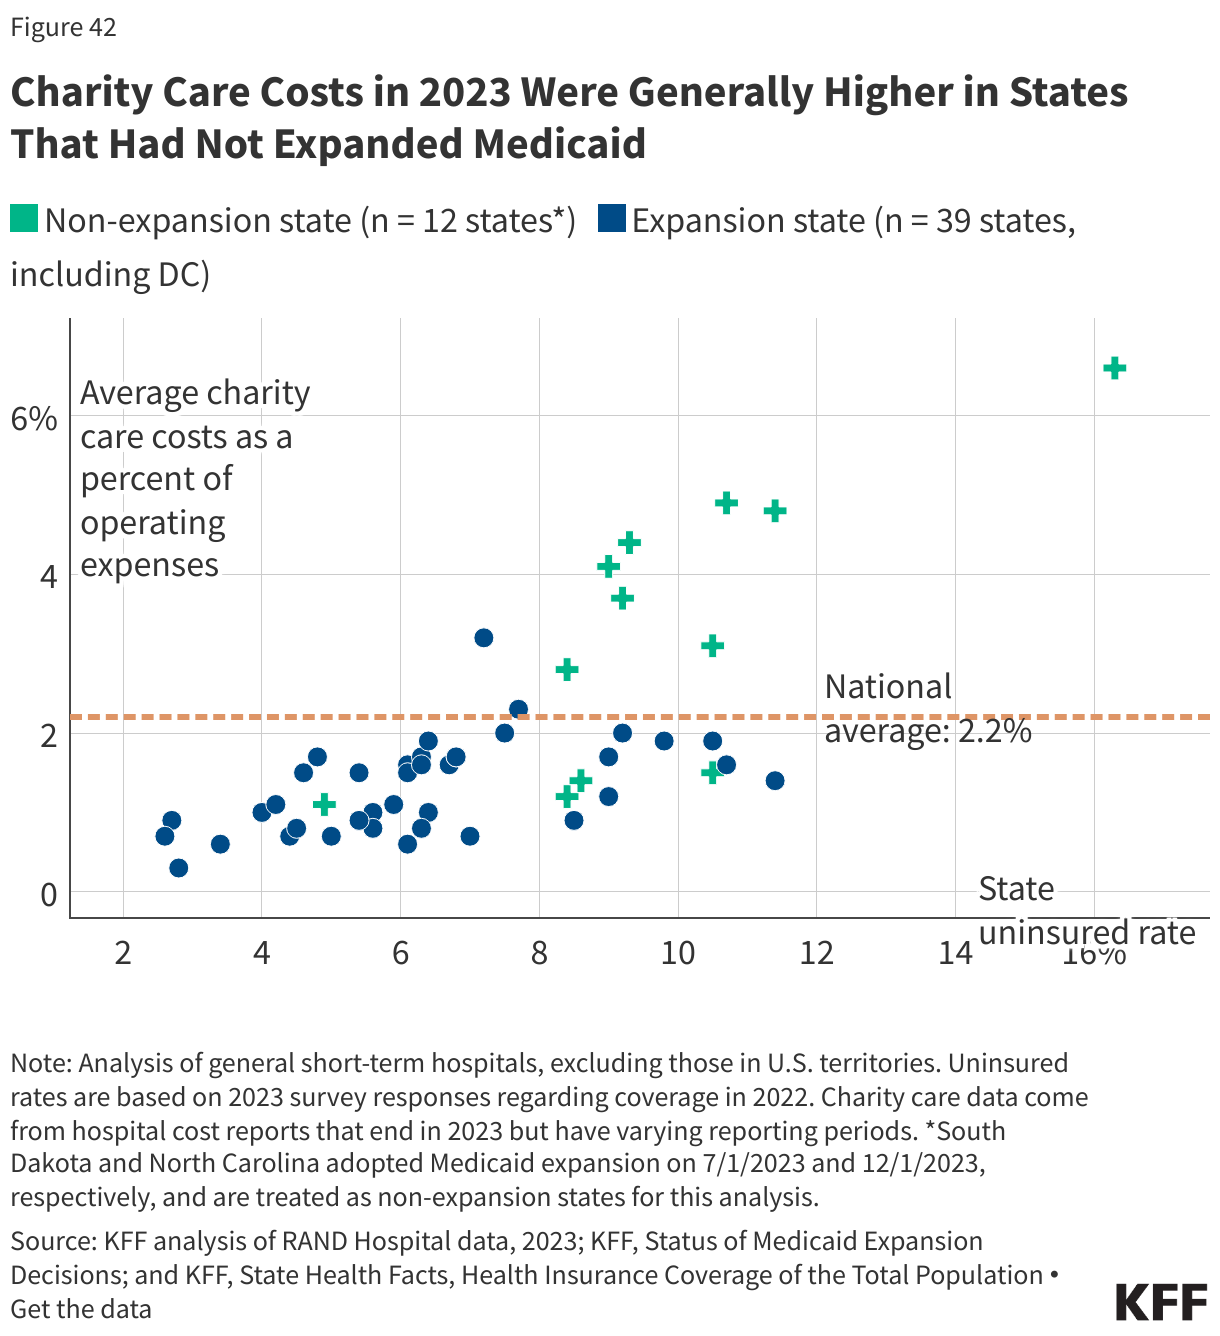