Gaps in Data About Hospital and Health System Finances Limit Transparency for Policymakers and Patients
Hospitals account for 30% of total health care spending—$1.4 trillion in 2022—with expenditures projected to rise rapidly through 2031, contributing to higher costs for families, employers, Medicare, Medicaid, and other public payers. As policymakers consider a variety of strategies to make health care more affordable, there is growing interest in understanding the factors that drive hospital and health system spending. Some policymakers at the federal and state level are pursuing strategies to reduce the burden of hospital costs, including efforts to establish site-neutral payments, limit the prices that hospitals may charge commercial insurers relative to Medicare rates, promote greater competition in hospital markets, and introduce standards for hospital debt collection practices and charity care programs.
This issue brief describes gaps in data about hospital and health system finances and business practices that limit transparency for policymakers, researchers, and consumers. Each section discusses the main sources of data that are available, reviews the strengths and weaknesses of each, and identifies gaps in these data. The following list includes examples of basic questions about hospitals that cannot be fully answered, either because the data do not exist; are not collected in a single, comprehensive source; or have important limitations:
- Which hospitals and health systems are in the greatest need of government support based on profitability, days cash on hand, payer mix, and other factors? A number of existing sources provide some level of information about these indicators, but each has its own limitations. For example, it can be difficult to accurately calculate measures of profitability from Medicare cost report data and compare them across hospitals due to missing or unstandardized details (see Table 1 for specifics). Medicare cost reports also do not include data about the health system that owns a given hospital—so may be missing information necessary to calculate days cash on hand—and they cannot be used to identify the extent to which a hospital treats commercial or uninsured patients. Finally, as a result of lags in reporting, most data may not be timely enough to address urgent policy questions, such as which hospitals need an infusion of funds following unexpected crises (e.g., following a cyberattack on billing systems or a public health crisis).
- Which hospitals and health systems engage in aggressive debt collection practices (such as suing patients), how often do they do so, and what are the characteristics of the patients who are targeted by these actions (such as their race and ethnicity and whether they reside in urban or rural areas)? Neither Medicare cost reports nor IRS Form 990s—the main public sources of data on hospital and health system finances—provide data to answer these questions, nor does any other known source.
- What are the characteristics of hospitals and health systems that deny a large share of charity care applications or take a long time to approve eligible patients for assistance? What are the characteristics of patients who received or were denied charity care? Neither Medicare cost reports nor IRS Form 990s provide data to answer these questions, nor does any other known source. Medicare cost reports now collect data about the number of patients who receive charity care but not about their characteristics, the number of application denials, the reasons for denials, or review times.
- Which hospitals and health systems charge the most or least for a defined set of services in a given region? Recent federal rules require hospitals and payers to disclose the prices negotiated with commercial plans, among other things, but researchers have documented a number of limitations to these data, making it difficult to make apples to apples comparisons across providers. Researchers also use claims data to compare provider prices, but there is no source that includes claims from all payers (such as a federal all-payer claims database).
- Which health systems have acquired the most physician practices in recent years? A number of data sources provide some level of information about ownership and consolidation, but none provide a comprehensive record of ownership and consolidation across the health system. For example, merging providers must report their plans in advance to the FTC and DOJ in certain cases where the transaction exceeds a specified value ($119.5 million in 2024), but most acquisitions of physician practices or groups fall below this threshold.
- What are the characteristics of 340B hospitals that benefit the most and least from the 340B program? We are unaware of any comprehensive, publicly-available dataset that documents how much each 340B hospital benefits from the program, such as the estimated savings relative to what the provider would have otherwise paid for 340B drugs.
Each of the sections below provides examples of options that could be considered to fill data gaps and improve transparency, such as by adding new reporting requirements to Medicare cost reports. Requiring hospitals and health systems to provide additional information would help strengthen the capacity of policymakers to target funds more efficiently and conduct oversight, but would also create new administrative burdens for providers, some of which are facing financial challenges. Whether or not to beef up data reporting related to hospital and health system finances, charity care, and other policy issues will depend on how policymakers weigh the value of greater transparency against the potential costs imposed on providers, as well as on the government and other payers, as applicable.
Data Gaps
There is no comprehensive, accurate, and readily accessible source of information that can be used to address basic questions about the financial health or distress of hospitals and health systems
Accurate, timely, and comprehensive information about the finances of hospitals and health systems—such as whether they are profitable, the extent to which they have the capacity to cover losses with existing financial reserves in an emergency, and how burdened they are with debt—is lacking. Such information would give policymakers additional tools to modify payment policy and conduct regulatory oversight. For instance, these data could help policymakers better determine the adequacy of Medicare and Medicaid reimbursements, identify hospitals that are financially vulnerable that may require additional government support to maintain services needed in their communities, assess the extent to which nonprofit hospitals reinvest earnings into their communities, and predict how payment reforms are likely to impact hospitals’ financial standing. One recent example is that better and more current financial data could have helped policymakers target COVID-19 dollars to, say, hospitals and health systems with limited liquidity heading into the pandemic that may have been especially strained during that period.
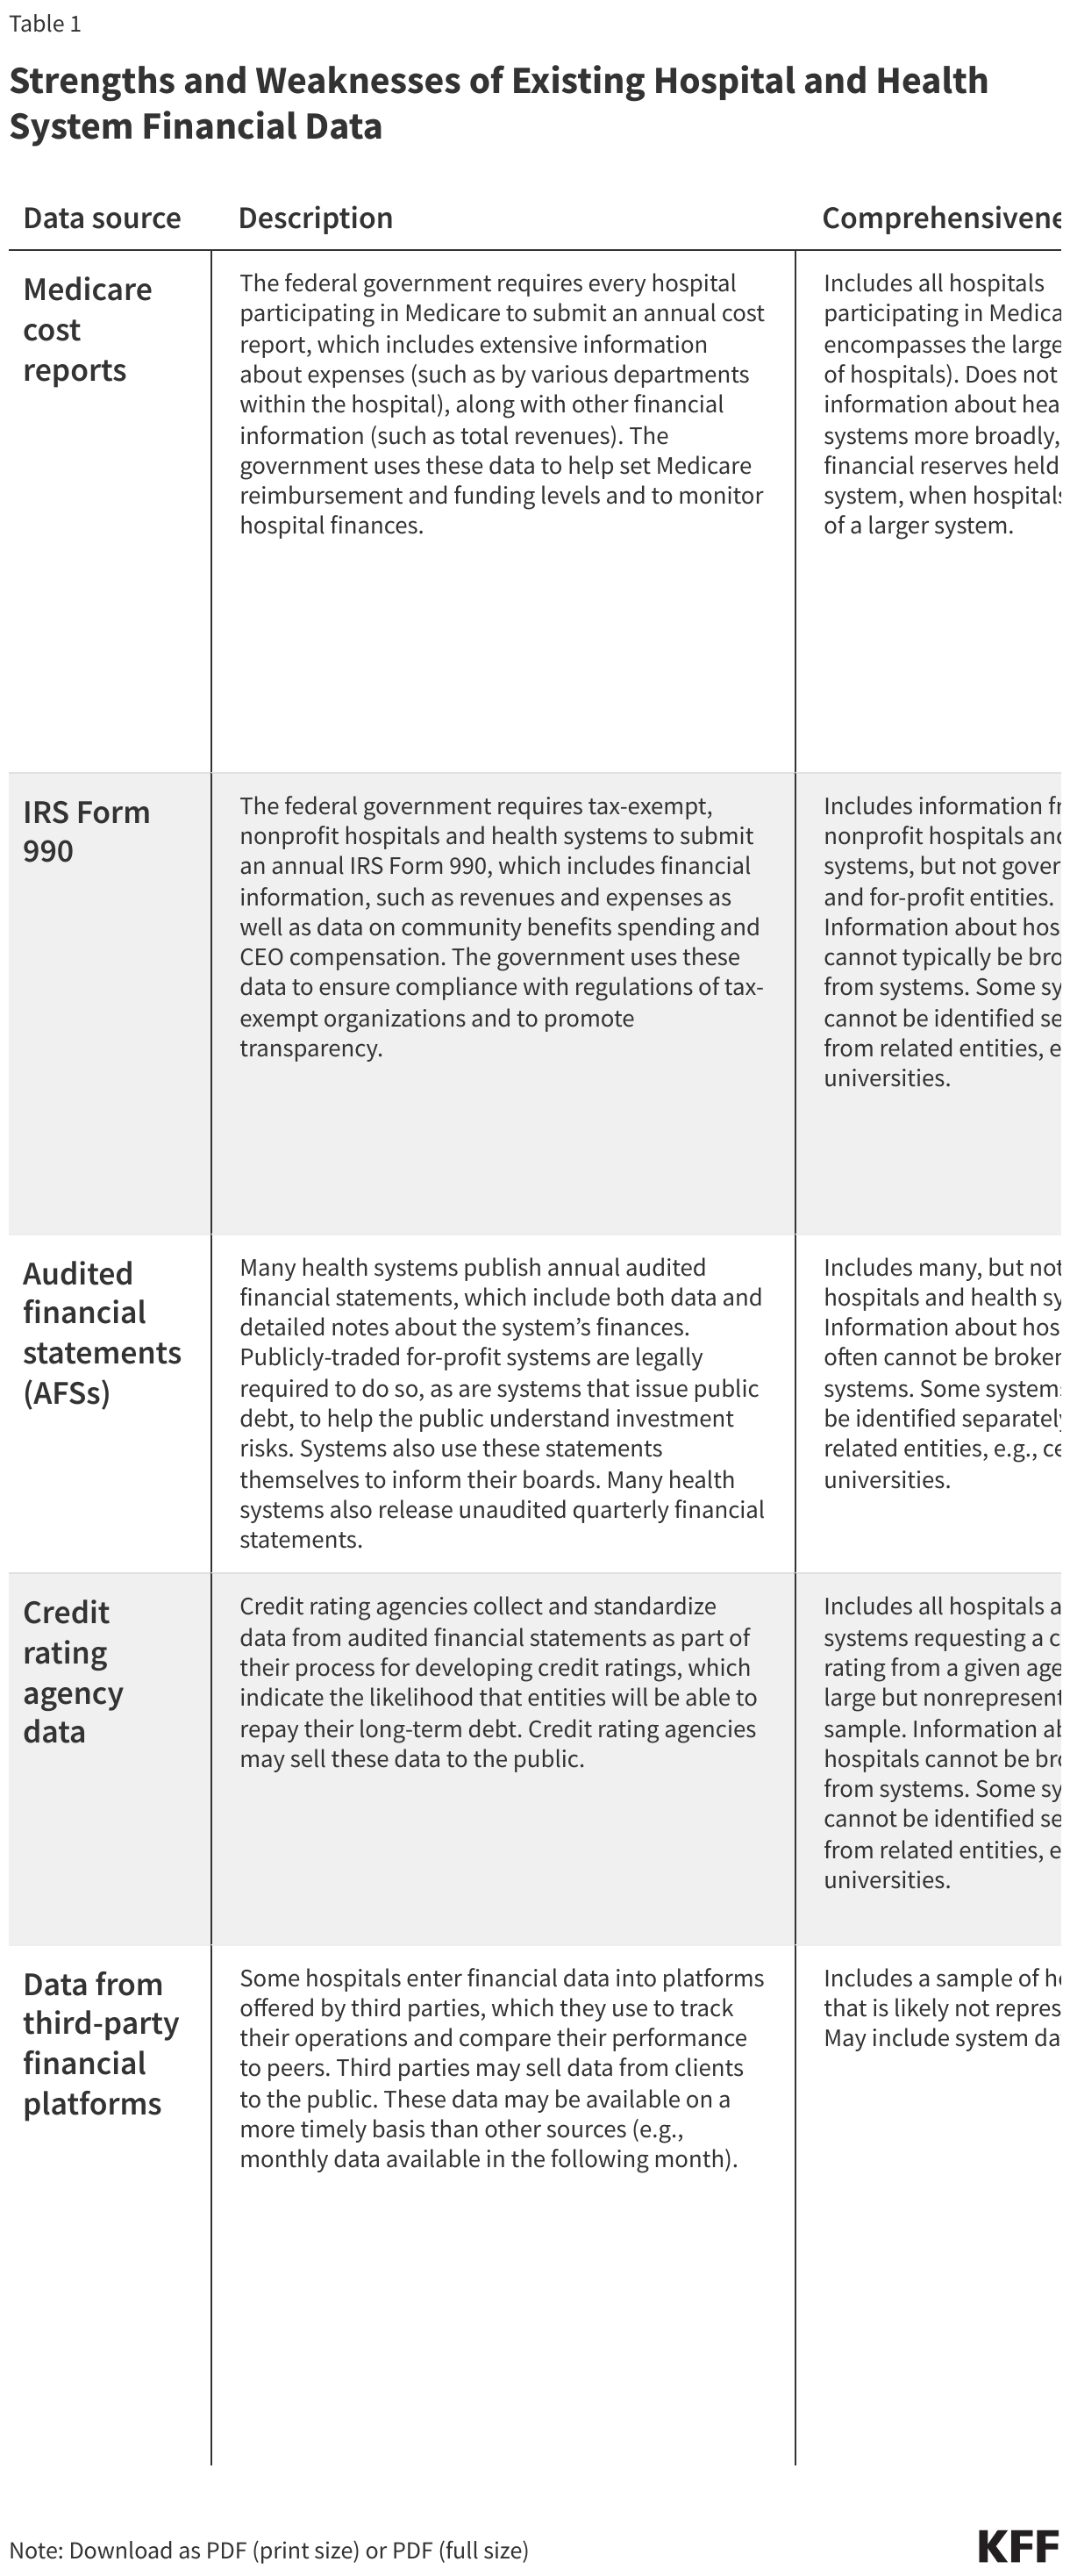
A number of existing sources provide some level of information about the finances of hospitals and health systems across the country, including their revenues, expenses, assets, and liabilities (see Table 1 for additional details about the benefits and limitations of each dataset; the following discussion excludes state-specific datasets).
- Medicare cost reports. Hospitals participating in Medicare are required to submit an annual cost report with information about their costs and other key financial information. The Medicare cost reports include data for virtually all (98%) of community hospitals in 2022 based on KFF estimates1 and provide useful and relatively standardized information about hospital expenses. However, other financial information is less detailed or standardized, which can make it difficult to accurately calculate key measures, like profit margins, and compare them across hospitals (see Table 1). Medicare cost reports are also not subject to the same rigorous auditing process as are audited financial statements (see below). Further, because the data are submitted by individual hospitals, they do not reflect the finances of the health systems that own them (such as their financial reserves, days cash on hand, the amount of debt held by the system, or the financial impact of owning non-hospital entities such as insurance companies and physician practices). Cost report data are generally lagged: as of early March 2024, data were available online for all or nearly all reporting entities through fiscal year 2022 but were usually not available for fiscal year 2023. This means that the most recent year of complete or nearly complete data was typically 14 to 20 months old as of early March 2024 (the range of time reflects the difference in fiscal year reporting periods).
- IRS Form 990. Tax-exempt, nonprofit hospitals and health systems are required to file a Form 990 return annually with the Internal Revenue Service (IRS), which includes financial information—such as measures relating to profitability and financial reserves—along with other information, including CEO compensation and community benefits spending. However, among other limitations, financial information from IRS Form 990s are also not subject to the same rigorous auditing process as audited financial statements and do not include government and for-profit hospitals and health systems. Nonprofit health systems do not typically break out information for individual hospitals, and they may provide information through multiple reports that would need to be combined to evaluate the overall health system. As of early March 2024, IRS Form 990 data were available online in a machine-readable form for all or nearly reporting entities for fiscal year 2021 but were unavailable for most entities for fiscal year 2022.
- Audited financial statements. Many hospitals and health systems publicly release annual audited financial statements, which is a requirement for publicly-traded, for-profit health systems and systems which issue publicly-traded debt. Audited financial statements are considered the gold standard of financial data and can be used to calculate standardized versions of several common financial measures, such as profitability, days cash on hand, and debt burden. However, these data are not easily accessible (e.g., in a machine-readable file), and they typically require laborious, specialized expertise to standardize financial information across systems. Further, audited financial statements often do not break out information about individual hospitals in the common scenario where facilities are part of a broader health system. Although hospital-level data is currently captured for almost all hospitals in the cost reports, there is no data source that contains all system-level data. Based on our experience, audited financial statements tend to be released from two to six months after the end of a given fiscal year, meaning that, as of early March 2024, data were likely available for all or nearly all entities that publish these statements through fiscal year 2022 and were available for many, but not all, through fiscal year 2023.
- Credit rating agency data. Credit rating agencies collect and standardize information from audited financial statements for hospitals and health systems that apply for a credit rating. These data might be available for purchase. However, they cover only a subset of entities and are unlikely to be representative of all hospitals and health systems. These data are available after the release of the underlying audited financial statements.
- Data from third-party financial platforms. Data entered by hospitals into financial management platforms might be purchased from firms that sell this software. These data tend to be the timeliest of all sources, e.g., with monthly data available in the following month. However, the timeliness of these data comes with a tradeoff, as monthly data incorporate estimates that are corrected over time and are therefore less accurate than annual data. Further, these data are generated from a subset of hospitals which may not be representative. These data are likely shared at an aggregated level to protect the identity of individual hospitals.
Financial data entail tradeoffs between accuracy and timeliness. For example, audited financial statements are the most accurate data but they are often lagged by several months and reflect annual data, while data from third-party financial platforms are typically quite timely and reflect monthly financial data, but may be less accurate because they rely in part on estimates and are not audited. As a result, it can be challenging to address urgent policy questions, such as which hospitals need an infusion of funds following unexpected crises (e.g., following a cyberattack on billing systems or a public health crisis) with available data, since each source has problems with either timeliness or accuracy.
Among other data gaps, we are unaware of any public data with comprehensive and consistently-defined information on payer mix—i.e., the share of business that comes from different payers, including Medicare, Medicaid, commercial insurers, the uninsured, and others—that covers all hospitals and health systems in the country. For example, while cost report data include information about Medicare and Medicaid charges, revenues (actual payments), and inpatient days and discharges, they do not identify these amounts for commercial patients and the uninsured.
Further, although more than half of eligible Medicare beneficiaries were enrolled in Medicare Advantage in 2023, cost reports do not separately identify Medicare Advantage revenues and charges, though they do so for Medicare Advantage inpatient days and discharges. Payer mix, including all major payer categories, would help to assess the financial position of a hospital or health system, given that commercial plans tend to reimburse at higher rates than Medicare and Medicaid. Payer mix data could also help to identify and target support to safety-net hospitals.
Key Questions That Cannot Be Fully Answered:
- Which hospitals and health systems are in the greatest need of government support based on profitability, days cash on hand, payer mix, and other factors?
- How profitable were hospitals in the past year and why?
- Which hospitals or health systems are well-positioned to weather unforeseeable fiscal challenges, such as a pandemic?
- How much revenue do hospitals receive from Medicare Advantage patients, and how does the share of revenue attributable to Medicare Advantage patients vary across hospitals?
Options to Fill Gaps in Data and Improve Transparency
Federal policymakers could create a national database with information from all hospitals and health systems that receive any payments from the federal government, with standardized, system-level financial data. To do so, the government could provide hospitals and health systems with financial reports to complete, with detailed templates and instructions describing how to pull information from audited financial statements and other sources. Hospitals and health systems could be required to submit these reports on a timely basis and to provide similar reports based on unaudited quarterly financial statements to provide preliminary information about recent trends. Policymakers could also decide whether to require health systems to report facility-level information for member hospitals.
Alternatively, policymakers could implement narrower changes, such as by modifying Medicare cost reports to collect additional or more precise information about common financial measures. For example:
- Total margins. Hospitals could be required to separate out changes in the value of stock portfolios and other investments (also known as “unrealized investment gains and losses”) from reported revenues, if they are not doing so already, which can have a large effect on reported profits. Hospitals could also be required to separately report nonrecurring income, such as from the sale of assets, which could provide a deeper understanding of changes in profitability.
- Operating margins. Hospitals could be required to directly report total operating revenues, which include both patient-related and other sources of revenue, such as from gift shops, parking, and cafeterias. Currently, operating margins must be approximated by subtracting out nonoperating revenues, such as investment income, from total revenues. This calculation is not straightforward because nonoperating sources of income are not fully separated from broader revenue categories.
- Payer mix. Policymakers could require hospitals to report charges, revenues, and inpatient days and discharges for each major payer—including for commercial, uninsured, and Medicare Advantage patients—to better assess the financial status of hospitals and targets policies and funds efficiently. Given that outpatient services account for a large share of hospital revenues, the charge and revenue amounts could be broken out by inpatient and outpatient services.
Other changes to Medicare cost reports could include collecting quarterly data for a set of key financial measures (such as those needed to calculate profitability and payer mix), as California does, or collecting a subset of system-level measures (such as days of cash on hand) that might alternatively be reported through the national database mentioned above.
Little is known about hospital and health system debt collection practices
About four in ten adults (41%)—and about six in ten (57%) of those with household incomes below $40,000—reported some level of health care debt in a KFF 2022 survey, and a large share of those who reported health care debt cited costs associated with hospitalizations (35%) and emergency care (50%) as sources of unpaid bills. According to KFF Health News, many hospitals engage in aggressive collection practices that can have significant financial consequences for patients, such as suing patients to garnish their wages, placing a lien on their home, reporting a patient’s debt to consumer credit bureaus, and selling their debt to a collection agency (which may in turn take aggressive steps to obtain payment). Hospitals may also encourage patients to enroll in payment plans with high interest rates and deny care to patients with unpaid bills, according to press reports.
However, very little systematic information is available to document the debt collection practices of hospitals and health systems across the country. As part of their annual IRS Form 990 returns, nonprofit hospitals and health systems are required to disclose if they ever engage in certain extraordinary debt collection practices before trying to determine whether a given patient is eligible for charity care, but they do not report whether they engage in these activities more generally or how often they do so. In April 2022, the Biden administration announced that it would gather information from more than 2,000 providers about their “medical bill collection practices, lawsuits against patients, financial assistance, financial product offerings, and 3rd party contracting [and] debt buying practices.” However, it is not clear which providers will be included or when the findings will be published.
Consumer credit bureaus are another source of information about patient debt, but they only include medical debt that has been reported to these firms, and it may be difficult or impossible to comprehensively trace these data back to specific hospitals or health systems. Finally, some private firms offer software to help providers track billing and collections and, in the process, they may collect data from many hospitals. However, these data only include a subset of facilities, and it is also unlikely that firms would disclose information about any specific client.
Ultimately, little is known about the debt collection practices of hospitals and the medical debt carried by their patients. For example, we are unaware of any comprehensive dataset that identifies, for a given hospital, the number of bills and amount being collected, how much it collects from patients with medical debt, whether it engages in aggressive debt collection practices (such as suing patients), how often it does so, the characteristics of patients who incur medical debt or are affected by aggressive debt collection practices, which collection agency it has a relationship with, how much medical debt it sells to collection agencies, or the amount paid for this debt.
Key Questions That Cannot Be Fully Answered:
- Which hospitals and health systems engage in aggressive debt collection practices (such as suing patients), how often do they do so, and what are the characteristics of the patients who are targeted by these actions (such as their race and ethnicity and whether they reside in urban or rural areas)?
- How much medical debt have patients incurred from specific hospitals and health systems and what are the characteristics of these patients?
- How much medical debt do hospitals report to credit bureaus?
- How much do hospitals collect when using extraordinary debt collection actions, like litigation?
Options to Fill Gaps in Data and Improve Transparency
Policymakers could require hospitals to report and publish additional information about debt collection practices, such as the number of large, unpaid medical bills a hospital is actively trying to collect; the number and type of lawsuits brought against patients; and the number of patients referred to collection agencies (as Colorado requires). Policymakers could also require hospitals to report the characteristics of patients with debt and who are subject to aggressive collection efforts, to the extent such data are available.
It’s unclear how much help hospital charity care programs provide to patients who have difficulty affording their care
Hospital charity care programs—also known as “financial assistance programs”—provide free or discounted services to eligible patients who are unable to afford their care. These programs may be available to uninsured patients, as well as insured patients, whose plans may have large cost-sharing requirements. Hospital charity care programs vary in their eligibility criteria and application procedures. Reporting from KFF Health News indicates that some patients have fallen through the cracks, i.e., were likely eligible for assistance but did not receive it. Improved data collection would allow policymakers and regulators to monitor how charity care programs are working overall and among nonprofit hospitals and health systems, which are expected to provide benefits to the communities they serve in exchange for their tax-exempt status.
Existing data provide some information about eligibility criteria for charity care programs operated by hospitals and health systems and the amount of assistance provided. Nonprofit hospitals and health systems are required to report some eligibility criteria for charity care programs (such as income eligibility thresholds) and aggregate charity care costs as part of their annual IRS Form 990 filings. In addition, all hospitals participating in Medicare—nonprofit, for-profit, and government hospitals—must report charity care charges as part of their annual Medicare cost reports (and convert those charges to costs).
Further, based on recent changes to the cost reports, hospitals must also report information about charity care by patient, such as the patient’s insurance coverage, the amounts paid by the patient and their insurer, and the amounts written off as charity care, uninsured discounts, and bad debt. These data are required beginning with cost report periods starting in October 2022, and all or nearly all hospitals will be reporting these data for the first time in 2024 or 2025, although it’s unclear how much of this data will become public. Finally, as noted in the section above, some private firms may have provider data on billing and collections, including charity care amounts, but only for a subset of hospitals, and it is also unlikely that firms would disclose information about any specific client.
Nevertheless, gaps in data limit the ability of policymakers and researchers to assess how charity care programs work. First, little is known about the eligibility criteria or application procedures for charity care programs operated by for-profit and government hospitals, which account for 42% of all community hospitals but are not required to file the IRS Form 990. Second, while the IRS Form 990 collects information about eligibility criteria from nonprofit entities, they do not collect information that describes if and how hospitals screen patients for eligibility, what documents patients must submit to apply, and which services are covered, among other things. Third, the federal government does not collect data on the number of applications received by a given hospital or their outcomes, such as processing times, the share approved, reasons for denials, and the share of denials that are appealed. Fourth, while hospital cost reports must now include the number of patients that receive charity care and the level of assistance they receive, it is unclear how much of this information will be disclosed to the public. Fifth, the federal government does not collect information about charity care by patient characteristics to assess, for example, whether patients in urban areas are more or less likely than patients in rural areas to receive charity care. Finally, while data are available on the cost of charity care programs, it is ultimately unclear what share of low-income patients are eligible, let alone what share of eligible patients end up benefiting from these programs.
Key Questions That Cannot Be Fully Answered:
- What are the characteristics of hospitals and health systems that deny a large share of charity care applications or take a long time to approve eligible patients for assistance?
- What are the characteristics of patients who received or were denied charity care?
- Which hospitals have more or less generous charity care programs?
- What share of patients from low-income areas receive charity care?
Options to Fill Gaps in Data and Improve Transparency
The federal government or states could collect additional information about how charity care programs work, such as eligibility criteria and application procedures from for-profit and government hospitals and health systems, additional information about eligibility criteria and application procedures from nonprofit hospitals and health systems, data about the number of applications and their outcomes (such as the share denied or appealed), and specific information about how charity care application outcomes and costs vary by patient characteristics (as implemented by Oregon). Policymakers could also disclose new cost report data on charity care, such as the amount billed to patients after charity care discounts.
Information about hospital and other health care prices remains elusive, despite recent federal transparency rules
Policymakers continue to express interest in increasing transparency into the cost of health care services provided by hospitals and other health care providers. While the extent to which this could lead to lower costs is debated, greater price transparency could in principle do so, for example, by helping patients with commercial insurance select more affordable providers, allowing self-insured employers to design plan benefits that encourage the use of less expensive providers, facilitating government oversight, and informing policy interventions.
Recent federal rules have required hospitals and payers to disclose the prices charged for health care services, including commercially negotiated prices. Under the Hospital Price Transparency rule, as of 2021, hospitals must generally: (1) disclose certain price data—including payer-specific rates—for each item and service and (2) provide similar information for 300 shoppable services in a consumer-friendly format. Under the Transparency in Coverage rule, which gradually introduced new requirements beginning in 2022, all individual and group health plans that were not grandfathered under the Affordable Care Act (and issuers that offer these plans) must: (1) disclose rates for every covered item and service for every in-network provider (including hospitals and others entities), (2) report plan allowed amounts and provider charges for out-of-network providers, and (3) create a price comparison tool that provides estimated cost-sharing requirements for a given provider and item or service.
The federal rules have led to the publication of a large volume of information about prices, but there are obstacles to using data on prices alone to compare the cost of care across different providers. First, health care is often delivered as a bundle of services for an episode of care, and these services are frequently billed separately. The price for a particular item, such as a blood test, does not necessarily reveal the expected cost of the entire episode. Second, in contrast to Medicare, billing codes for commercial payers cannot typically be applied in consistent ways to describe the cost of care for comparable services for comparable patients across different providers. Some commercial contracts might use common billing codes, such as MS-DRGs, but the payment structure for a given code may vary substantially across payers and providers. For example, a commercial payer may reimburse a hospital for a given MS-DRG based on a fixed rate, the length of a hospitalization, or a discount on the hospital’s charge, and they may adjust these amounts based on patient characteristics (e.g., health status) or for various value-based initiatives. Other commercial contracts may include unique codes (e.g., describing a bundle of care that is only used by a given payer or provider).
Additional issues have emerged now that the data are available. One is that hospitals and health plans sometimes report prices that are implausibly high or low for a given service, such as rates that are under a few hundred dollars for a hip and knee replacement in some instances and over $1,000,000 in others according to a KFF analysis of the hospital data. In other cases, there are multiple prices for the same provider, procedure, and plan, with no way to easily distinguish which would be applicable for a patient covered by the plan. Another issue is that health plans often report prices for services that would likely never be offered by a given provider, such as the rate for a dermatologist to provide cardiology services. This can occur, for example, when a physician agrees to a broad plan fee schedule that details reimbursement for many other types of providers and services. There are also concerns that the rules do not require certain information that is important for interpreting or comparing prices, such as how often a given price is charged or standardized details necessary to understand the payment structure for a given payer and provider. Revisions to the federal rules taking effect in mid-2024 and in 2025 will require disclosure of more information about different factors affecting negotiated rates, but it is likely that some gaps will remain. Finally, the massive size of the data files, particularly the health plan files, make them very difficult and costly to analyze.
Claims data from commercial insurers may address some of the issues with the price transparency files but have their own set of limitations. Claims data include information about prices, as well as volume and the actual amount spent. The latter would facilitate comparisons of costs for, say, a given MS-DRG, irrespective of differences in payment structure across payers and providers. Claims data are available from a variety of sources, such as private vendors, health plans and self-funded employers themselves, and state all-payer claims databases (APCDs). However, each of these datasets includes only a subset of payers, and the owners of some of these datasets prohibit the disclosure of prices for a given provider. State APCDs have received interest as a tool for increasing transparency around prices and other aspects of health care, but less than half of states currently have ACPDs and states are not allowed to require participation of self-funded employers, which are a significant portion of the commercial market. Some design decisions, such as the omission of health plan identifiers, have limited the usefulness of APCDs for provider price comparisons. Finally, claims data in general are subject to privacy protections for individual patients, which requires masking identifiable information, and they may include data errors. For example, some billing codes, such as MS-DRGs, may be applied after the fact to facilitate comparisons across plans and providers, but this process can be subject to error.
Key Questions That Cannot Be Fully Answered:
- Which hospitals charge the most or least for a defined set of services in a given region?
- Which health plans are paying the highest and lowest prices for a given service in a given region?
- How much should a patient expect to pay for a given service or episode of care from a given provider, and how does that vary across plans?
Options to Fill Gaps in Data and Improve Transparency
Since the initial rollout of the price transparency regulations, policymakers at the state and federal levels have been acting and exploring additional ways to increase standardization and strengthen enforcement. However, without greater standardization in rules pertaining to payment structures themselves (e.g., requiring payments based on MS-DRGs), there may always be some amount of variability in how payments work in the real world that is not captured in standardized reporting forms. Differences in payment structures across commercial contracts are likely to limit the extent to which costs can be compared using price data alone.
Another option to increase transparency would be to create a national database of claims collected from all payers (i.e., a federal APCD)—which could be a large and complex undertaking—or take more incremental steps towards increasing the accessibility of claims data. However, an APCD would have its own set of benefits and limitations, as discussed above. For example, these data may facilitate comparisons across plans and providers based on the actual amount spent, but some data may need to be masked due to privacy protections, and APCDs may contain errors.
There is no single, complete source of information about provider ownership or consolidation, which can have implications for the cost and quality of health care
Identifying who owns which providers is important for monitoring and regulating health care markets, scrutinizing provider incentives, and establishing policies to protect consumers and other payers from excessive price hikes or quality concerns. A substantial body of evidence shows that consolidation has led to higher prices without clear evidence of improvements in quality, which has garnered the attention of policymakers at the federal and state level. Tracking consolidation and market concentration requires timely and comprehensive information about changes in ownership over time. Some policymakers are also eager to track the role of private equity in health care markets which, according to one literature review, has often been associated with higher costs and mixed or negative quality outcomes.
A number of existing sources provide some level of information about ownership and consolidation for providers across the country.
- Provider Enrollment, Chain, and Ownership System (PECOS) data. The federal government requires all Medicare providers to identify ownership through PECOS, the administrative database used to manage provider enrollment in Medicare. The government recently began to release PECOS data on the ownership of hospitals, skilled nursing facilities, home health agencies, hospices, federally qualified health centers, and rural health clinics and changes in ownership among hospitals and skilled nursing facilities. PECOS includes a large amount of information and is relatively timely, as providers are required to report changes in ownership within 30 days. Researchers consider PECOS to be a key source for identifying ownership relationships among providers. However, it was not intended to serve as a national database for ownership and consolidation, and there are some potential issues with these data. For example, reports from the Health and Human Services Office of Inspector General in 2013 and 2016 identified inaccurate information or information that was inconsistent with other sources in the majority of PECOS records evaluated. MedPAC and others have also found more specifically that relying on PECOS was not effective for identifying private equity ownership.CMS recently began to require that all institutional providers, such as hospitals, flag whether an owner or managing entity reported through PECOS is a private equity company or real estate investment trust. It also required nursing facilities participating in either Medicare or Medicaid to provide more complete information about their ownership and management—such as by disclosing entities that provide administrative or clinical consulting services or that exercise financial control—which will provide further transparency around private equity.
- IRS Form 990. Tax-exempt, nonprofit entities are required to list the hospitals that they operate and to identify and report information about related entities, such as parent or subsidiary organizations, as part of their Form 990 returns. Researchers have used these data to fill in some of the gaps in PECOS data, though they are not available for government or for-profit entities.
- Data from private vendors. Data on mergers and acquisitions, ownership of physician practices, and system affiliation of hospitals can be purchased from private data vendors such as IQVIA, PitchBook, Levin Associates, and the American Hospital Association. Vendors typically pull these data from surveys, corporate directories, news reports and press releases, and/or primary research. It is likely that these data are incomplete—e.g., given that they rely on public information and whatever information providers are willing to share—though it is difficult to determine how much of the market they are missing.
- Hart-Scott-Rodino filings. Merging providers must report their plans in advance to the FTC and DOJ in certain cases where the transaction exceeds a specified value ($119.5 million in 2024). The government does not appear to generally disclose individual mergers to the public. Further, many provider mergers fall below reporting thresholds, including most acquisitions of physician practices or groups and, according to one preliminary analysis, more than 30% of hospital mergers.
Researchers have attempted to create a more complete picture of ownership relationships and merger activity by cobbling together information from a variety of sources, such as from PECOS, private vendors, and manual web searches. Combining data on providers across datasets can be difficult, as these sources sometimes contain different provider identifiers, in which case they must be combined using inexact matching approaches. Given the limitations of each of these sources and the challenges in combining them, even an exhaustive effort constructed from these various sources is unlikely to produce a comprehensive record of provider ownership and consolidation across the US health system.
Finally, most existing data, including PECOS, focus on ownership and management relationships. As a result, they are not able to track other provider relationships, such as the growth of “clinically integrated networks,” which entail contractual relationships between independent provider entities (like hospitals and physician groups) and may also have important implications for health care.
Key Questions That Cannot Be Fully Answered:
- Which health systems have acquired the most physician practices in recent years?
- Which types of physician specialties appear to be most attractive to hospitals and health systems based on acquisitions over the past few years?
- Which regions and types of providers have private equity groups invested in most heavily in recent years?
Options to Fill Gaps in Data and Improve Transparency
To improve transparency and facilitate greater oversight, policymakers could collect and report additional and more standardized information about ownership relationships and consolidation. For example, this could entail requiring providers to report additional information to PECOS, such as if a practice was purchased by a private equity firm (as CMS has begun to do for nursing homes and, to a more limited extent, other institutional providers). PECOS could also collect additional data on provider relationships and forms of consolidation that do not entail formal ownership, such as accountable care organizations and other clinically integrated networks. Implementing a single, unique provider identifier that could be used to link providers across PECOS and other government databases could also facilitate improved transparency. Finally, policymakers could expand Hart-Scott-Rodino merger reporting requirements to encompass a broader set of mergers and acquisitions.
There is no comprehensive source of data on use of the 340B Drug Pricing Program by hospitals
The 340B Drug Pricing Program requires manufacturers participating in Medicaid to sell outpatient drugs to eligible nonprofit and government providers at a substantial discount, with the intent of supporting entities caring for low-income and other underserved populations, such as certain disproportionate share hospitals. The program has grown substantially over time, with total drug purchases more than quadrupling from $12 billion in 2015 to $54 billion in 2022. Hospitals account for the large majority of these drug purchases, and more than 2,600 hospitals participated in the program as of January 2023 (compared to all 6,120 hospitals in the US as of 2022, as reported by the American Hospital Association). Given the growth of the 340B program over time, some have questioned how well its benefits are targeted towards hospitals that serve a disproportionate share of low-income and other underserved populations.
Some information about how the 340B program operates is currently available. For example, the Health Resources and Services Administration (HRSA), which administers the 340B program, publicly discloses a list of participating entities and total 340B drug purchases by entity type. The latter is based on data from the HRSA Prime Vendor Program which, among other things, negotiates discounted 340B prices and facilitates distribution for participating 340B entities, though not all 340B drugs are purchased through this program. HRSA has access to other data that do not appear to be publicly disclosed, including ceiling prices it calculates for 340B drugs, and HRSA may be able to access the rates negotiated and volume of drugs purchased through the Prime Vendor Program.
Claims data from commercial and public payers can currently be used to approximate 340B revenues and volumes by identifying reimbursement for outpatient drugs provided by 340B entities. However, claims data do not consistently flag the specific subset of these drugs that are purchased through the 340B program, although the government requires providers to do so when submitting Medicare claims. Further, there is no comprehensive source of claims data at the national level that covers all payers and drugs where information about 340B drugs could be added.
We are not aware of data that evaluates the extent to which specific participating entities are benefiting from the 340B program, let alone whether providers that focus more on underserved patients are benefiting the most. Calculating how much money they are earning on 340B drugs net of costs would require knowing acquisition costs, reimbursement rates, and which drugs are acquired through the 340B program. It is likely that only 340B providers themselves have comprehensive data on all of these components. Identifying the benefit of the 340B program would also require estimating how much participating entities would have profited in the absence of the program (i.e., based on what they would have otherwise paid for these drugs).
Key Questions That Cannot Be Fully Answered:
- What is the total amount that participating hospitals are earning on 340B drugs net of costs?
- How much of a markup do participating providers charge for 340B drugs by payer?
- How much do participating hospitals save on 340B drugs relative to what they would have otherwise paid?
- What are the characteristics of 340B hospitals that benefit the most and least from the 340B program?
- Are 340B hospitals providing free or greatly discounted drugs to uninsured patients and others who may have difficulty affording treatments?
Options to Fill Gaps in Data and Improve Transparency
Policymakers could require providers to report the value of 340B purchases and revenues or estimated savings relative to what the provider would have otherwise paid. Some proposals have also been floated that would require providers to report how they spend profits earned on 340B drugs (such as whether they use these profits to expand financial assistance programs) and the number and type of patients that receive 340B drugs. Tracking the former may be difficult given the fungible nature of money. Policymakers could also require 340B hospitals to report whether they are providing free or greatly discounted drugs to uninsured patients and others who may have difficulty affording medications.
This work was supported in part by Arnold Ventures. KFF maintains full editorial control over all of its policy analysis, polling, and journalism activities.
Nancy M. Kane, DBA, Professor Emerita, Harvard T.H. Chan School of Public Health, provided input about the gaps in financial data described in this issue brief.
- This number reflects the share of community hospitals identified in 2022 data from the AHA Annual Survey Database that could be matched to CMS hospital cost reports for periods ending in 2022. ↩︎