SUD Treatment in Medicaid: Variation by Service Type, Demographics, States and Spending
Substance use disorders (SUDs), including opioid and alcohol use disorders (OUDs and AUDs), are a major public health issue affecting millions of Americans. SUDs contribute to a growing number of deaths, with alcohol-induced and opioid overdose fatalities rising sharply in recent years, especially during the pandemic. Opioid overdose deaths grew by 63% during the pandemic, to 81,051 in 2022, and alcohol-induced deaths increased by 31%, to 51,244 in the same year. Despite this, SUDs often go undiagnosed, unrecorded and untreated in healthcare settings.
As a dominant payer of behavioral health services, Medicaid can be a lever to expand access to a range of behavioral health services, including treatment for SUD. This analysis examines Medicaid claims data from 2020 to understand clinically-identified rates of SUD (referred to as diagnoses throughout the brief) as well as treatment patterns across SUD services, how treatment rates vary across groups of Medicaid enrollees and states and spending among Medicaid enrollees aged 12-64 who have a diagnosed SUD. Although claims data provide the clearest picture of the use of Medicaid-covered services among enrollees, they may exclude treatment for enrollees in some circumstances, such as when services are provided by Indian Health Services, schools or as part of bundled payment rates (see Methods for more details).
Key takeaways include:
- Claims data show that 7.2% of Medicaid enrollees aged 12-64 have a diagnosed SUD. This may underestimate prevalence of SUDs because screening/referral practices vary and SUD diagnoses often go unrecorded without treatment. For example, data from the 2020 National Survey on Drug Use and Health, shows that 18% of Medicaid enrollees 12-64 have a SUD as NSDUH may capture undiagnosed SUDs. As a result of lower diagnosis rates in claims data, estimates of treatment rates using claims data might appear higher than they really are since they do not account for the total number of enrollees with SUD.
- Nearly three-quarters of those with a diagnosed SUD in claims data used substance use treatment or supportive services in 2020, but there are wide variations across service type. For example, treatment rates for counseling/therapy and medication treatment were higher than other service types. Medication treatments rates are much higher for those diagnosed with OUD (63%) than those with AUD (10%), although medication treatment is recommended for both (see Box 1).
- Enrollees who are Black, Hispanic and Asian as well as youth and young adults have lower overall SUD treatment rates than other groups. Only 4 in 10 Black enrollees with diagnosed OUDs received medication—a treatment rate substantially lower than their White counterparts (nearly 7 in 10). Youth and young adults have lower SUD treatment rates across most SUD services compared to people aged 27 to 44, particularly for medication. About 12% of youth with diagnosed OUD receive medication treatment, compared to 63% overall.
- Substantial state-level variation exists in SUD treatment overall and by specific service. Treatment rates across states show wide variation, with up to 50 percentage point differences in treatment rates for some services.
- Spending for enrollees with an SUD diagnosis is twice as much as those without a SUD (about $1,200 vs. $550 per month on average).
Treatment is key to addressing SUDs and reducing overdoses, deaths and other health or social complications. However, the rates at which Medicaid enrollees receive treatment can vary due to a wide range of factors including the availability and capacity of the behavioral health workforce and treatment facilities, provider participation in Medicaid and Medicaid coverage policies for SUD treatment services. In addition, treatment rates may be affected by the shortage of a diverse and culturally competent workforce as well as personal beliefs and societal stigmas. Understanding variations in treatment rates, particularly in areas or populations with lower rates, can help inform policy options to address SUD.
What are the rates and characteristics of Medicaid enrollees with a diagnosed SUD?
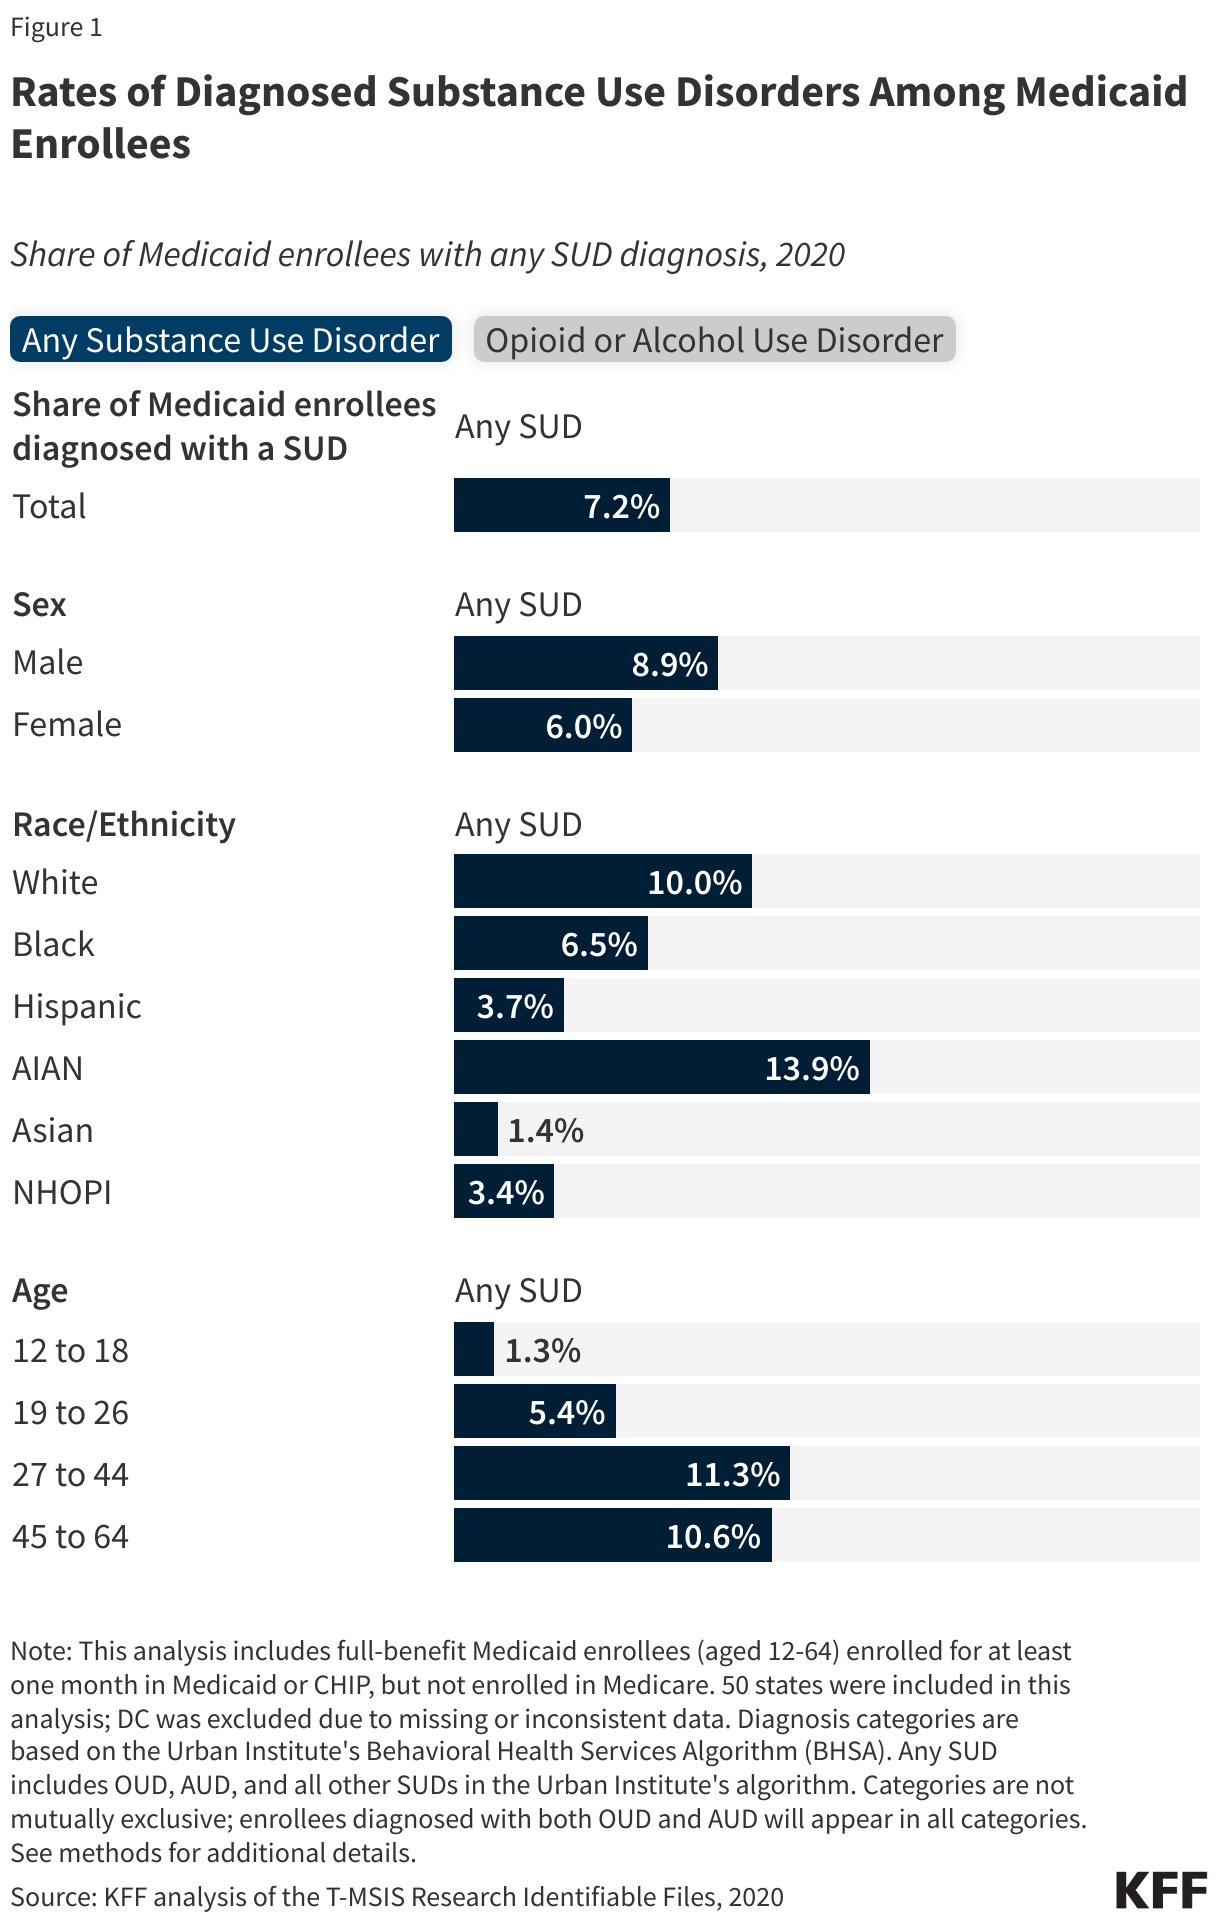
Overall, 7.2% of Medicaid enrollees have a diagnosed SUD in 2020 Medicaid claims data. SUDs can include alcohol or opioid use disorders, but can also include many others such as marijuana, stimulant and hallucinogen use disorders. Because OUD and AUD are the most commonly diagnosed SUDs in Medicaid claims data, and they account for over 80% of all alcohol and drug deaths, this analysis focuses on those conditions specifically as well as SUD overall (which includes all types). Medicaid claims data may underestimate the prevalence of SUDs because screening/referral practices vary and SUD diagnoses often go unrecorded without treatment. For example, data from the 2020 National Survey on Drug Use and Health shows that 18% of Medicaid enrollees 12-64 have a SUD as NSDUH may capture undiagnosed SUDs.
Medicaid enrollees who are White, American Indian and Alaska Native (AIAN), male or older than age 26 have higher rates of diagnosed SUD. These patterns are also generally consistent across OUD and AUD, with one exception. For AUD, diagnosis rates are highest among the oldest age group (45 to 64), whereas diagnosis rates for OUD are highest for people aged 27 to 44 (Figure 1).
What SUD services do Medicaid enrollees diagnosed with SUD receive?
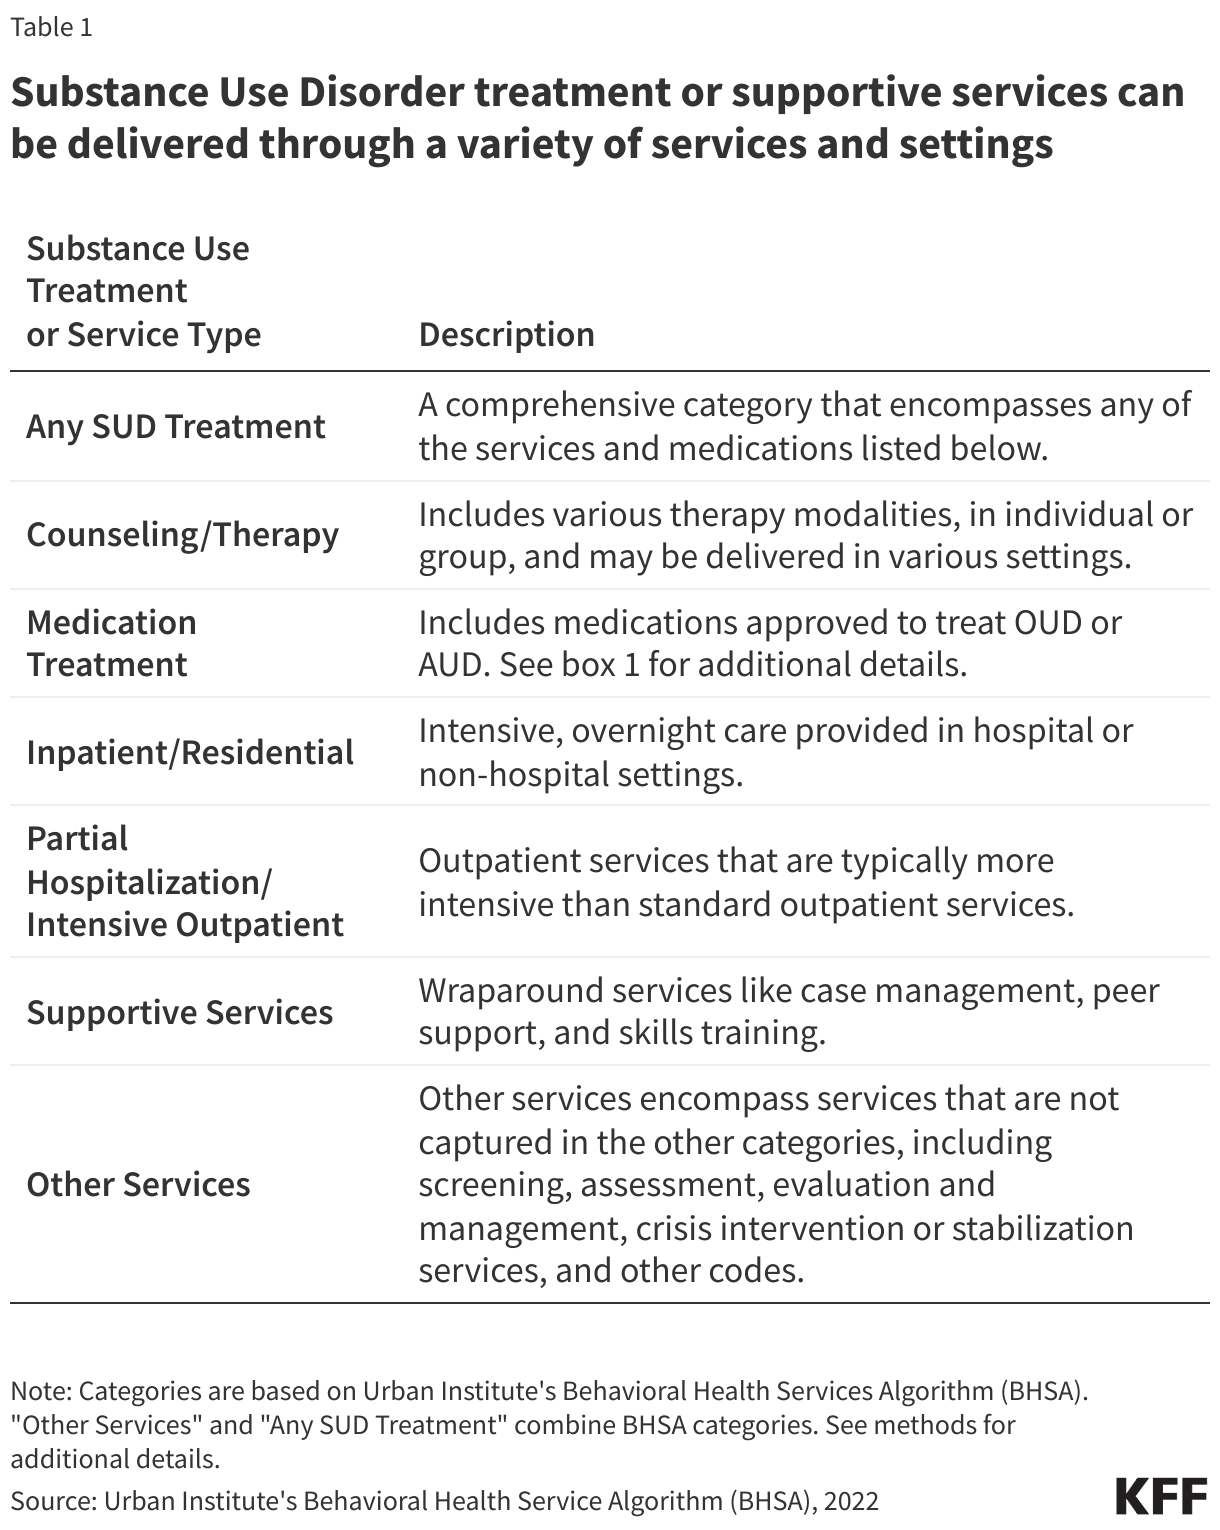
Substance use treatment can be provided in a variety of settings and may include different treatment modalities, medication, and supportive services. For descriptions of these treatments and service types, see Table 1 below. Self-help treatments, such as Alcoholics Anonymous (AA) and Narcotics Anonymous (NA), may also play a role in treatment but are not included in this analysis.
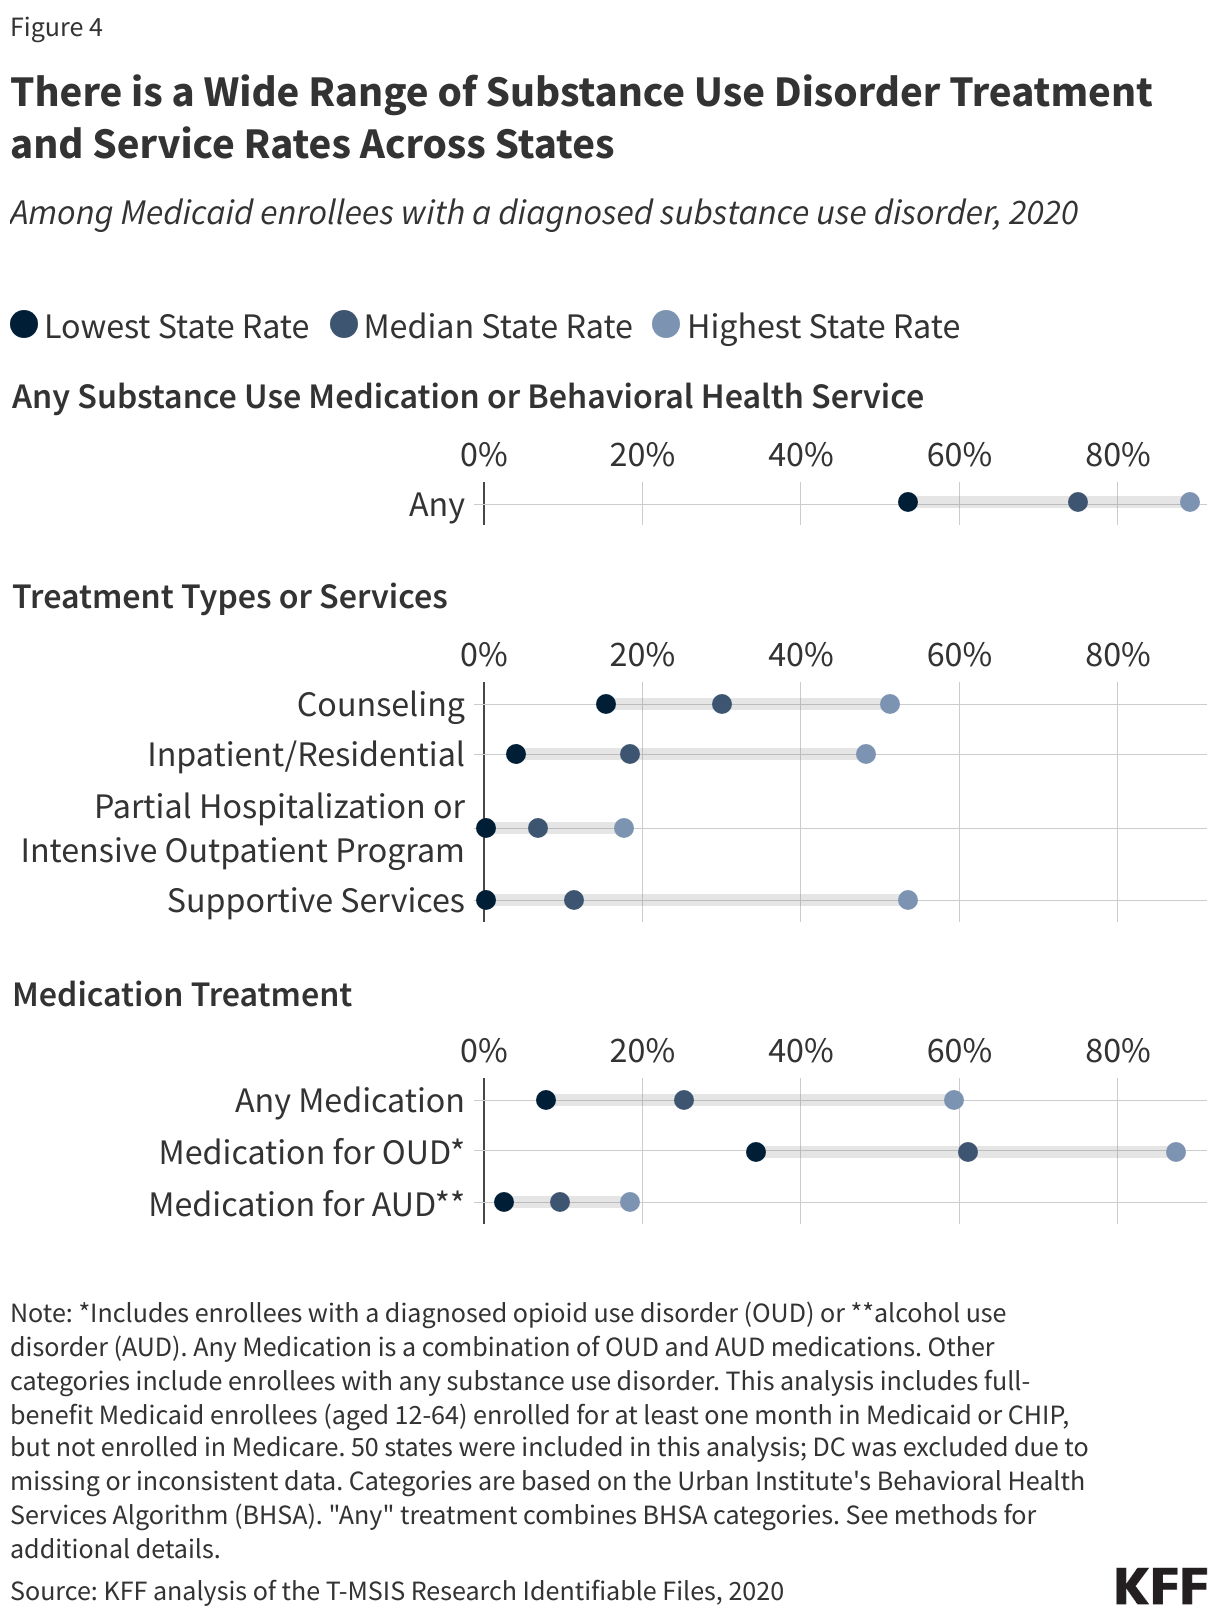
Nationally, approximately three-quarters (74%) of Medicaid enrollees with diagnosed SUDs received treatment or supportive services in 2020. Counseling/therapy, medication and other services (including screening/assessment) have the highest utilization rates. A smaller share (19%) of enrollees diagnosed with SUD receive inpatient or residential services, with the lowest share receiving partial hospitalization or intensive outpatient services (8%). Supportive services are used by about one in seven enrollees (Figure 2). These estimates exclude the use of some services in states where certain providers have the option to bundle services or use a single code to bill for multiple services. They also exclude services for which providers did not directly bill Medicaid, such as those provided through Indian Health Services, free clinics, schools or through self-help groups such as AA and NA.
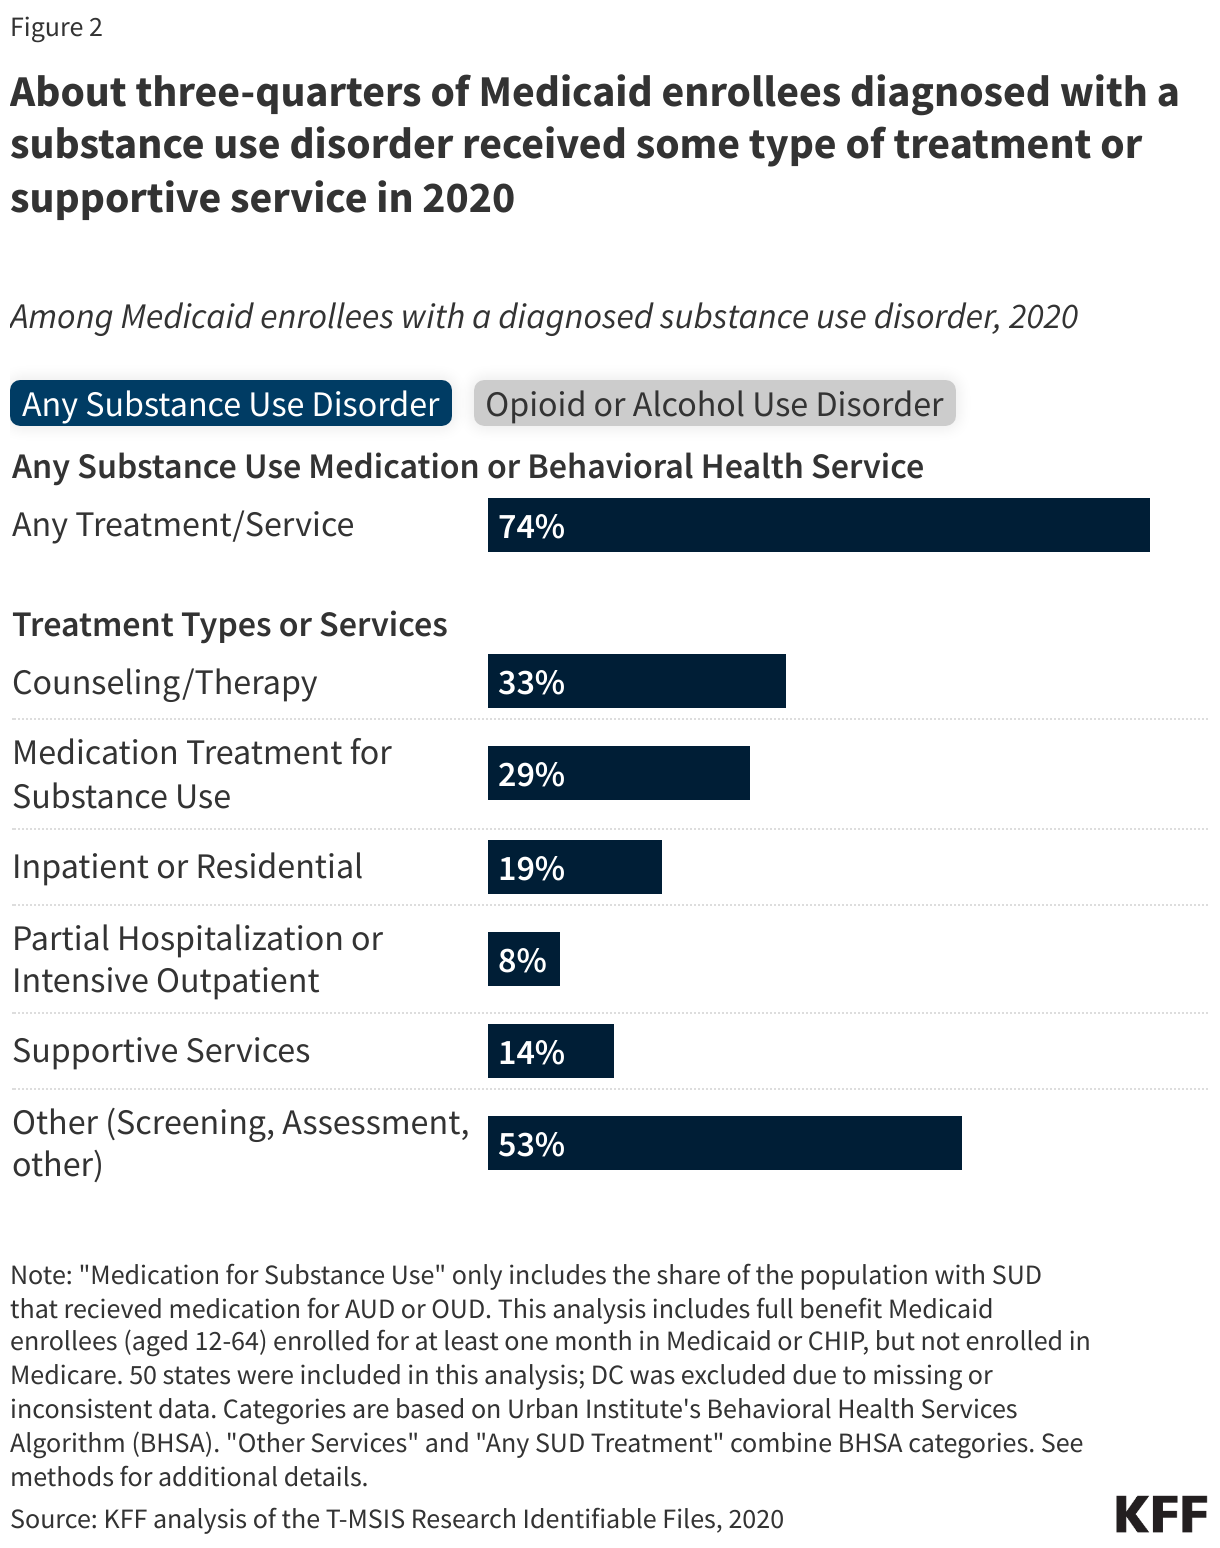
Medicaid enrollees diagnosed with an OUD generally have higher treatment rates than those with AUD, with the widest variation for medication treatment. Approximately 2.9% of enrollees have a diagnosed OUD and/or 2.6% have a diagnosed AUD (Figure 1). Enrollees diagnosed with OUD tend to have higher treatment rates than those diagnosed with AUD. Variation is most pronounced in medication treatment—with 63% of those with diagnosed OUD receiving medication treatment compared to 10% for AUD (Figure 2). This wide difference in treatment rates exists even though medications for both OUD and AUD are effective and recommended (Box 1). While rates of medication use for AUD are low across payers, progress has been made in increasing OUD medication rates within Medicaid. However, a substantial gap remains—with about one-third of Medicaid enrollees diagnosed with OUD not receiving medication treatment. Several factors may contribute to the OUD medication treatment gap, including difficulty filling buprenorphine prescriptions at pharmacies, low provider prescribing, state and federal policies as well as a number of other factors.
Box 1: Medication Treatment for SUD
Understanding Medication Treatments for Opioid Use Disorder (OUD): Medication treatment is recognized as a core component of OUD treatment.
- Approved Medications: Three medications are FDA approved to treat OUD: methadone, buprenorphine and naltrexone. Methadone and buprenorphine are controlled substances. Methadone was introduced in the 1960s and is only distributed through federally registered opioid treatment programs (OTP). Buprenorphine—a controlled substance—has been approved for OUD treatment since 2002. Other medication treatments are also sometimes used.
- Clinical Guidelines: Pharmacotherapy is recommended for most individuals with OUD, including some adolescents and pregnant women, with some modifications. Both methadone and buprenorphine are acknowledged for their high efficacy in treating OUD.
Understanding Medication Treatments for Alcohol Use Disorder (AUD): Medication treatment is recognized as a core component of treatment for many people with AUD.
- Approved Medications: Three medications are FDA approved to treat AUD: disulfiram, acamprosate and naltrexone. Disulfiram has been around the longest, since the 1950s and other AUD medications were not approved until the 1990s or later. Other medication treatments are also sometimes used.
- Clinical Guidelines: Pharmacotherapy is recommended for many people with moderate or severe AUD and treatment recommendations have strengthened in recent years. Current research is considered insufficient to recommend medication treatment for adolescents and pregnant women. Naltrexone and acamprosate are acknowledged for their high efficacy in treating AUD.
How does use of SUD services vary by demographics and geography?
Among those with a diagnosed SUD, Black, Hispanic and Asian Medicaid enrollees generally receive SUD treatment at lower rates than White enrollees. White enrollees tend to have the highest treatment rates across categories of treatment. Black enrollees with OUD are far less likely to receive recommended medication treatment (4 in 10 compared to nearly 7 in 10 of their White counterparts). Asian enrollees have lower rates of counseling/therapy than White enrollees. While AIAN enrollees have higher medication treatment rates for OUD (relative to many other groups), their rates for other categories, such as counseling/therapy and supportive care, tend to be more variable. Various factors, including low provider cultural competency and fewer treatment options in diverse communities, as well as perceived need for treatment and personal beliefs related to seeking help, may all play a role in the variation of treatment rates across racial and ethnic groups. In addition, limitations in claims data, such as differences in the data quality of race and ethnicity variables, differences in how often SUDs are diagnosed and recorded and potential exclusion of treatment services provided by Indian Health Services can affect observed treatment rates across racial and ethnic groups (see Methods).
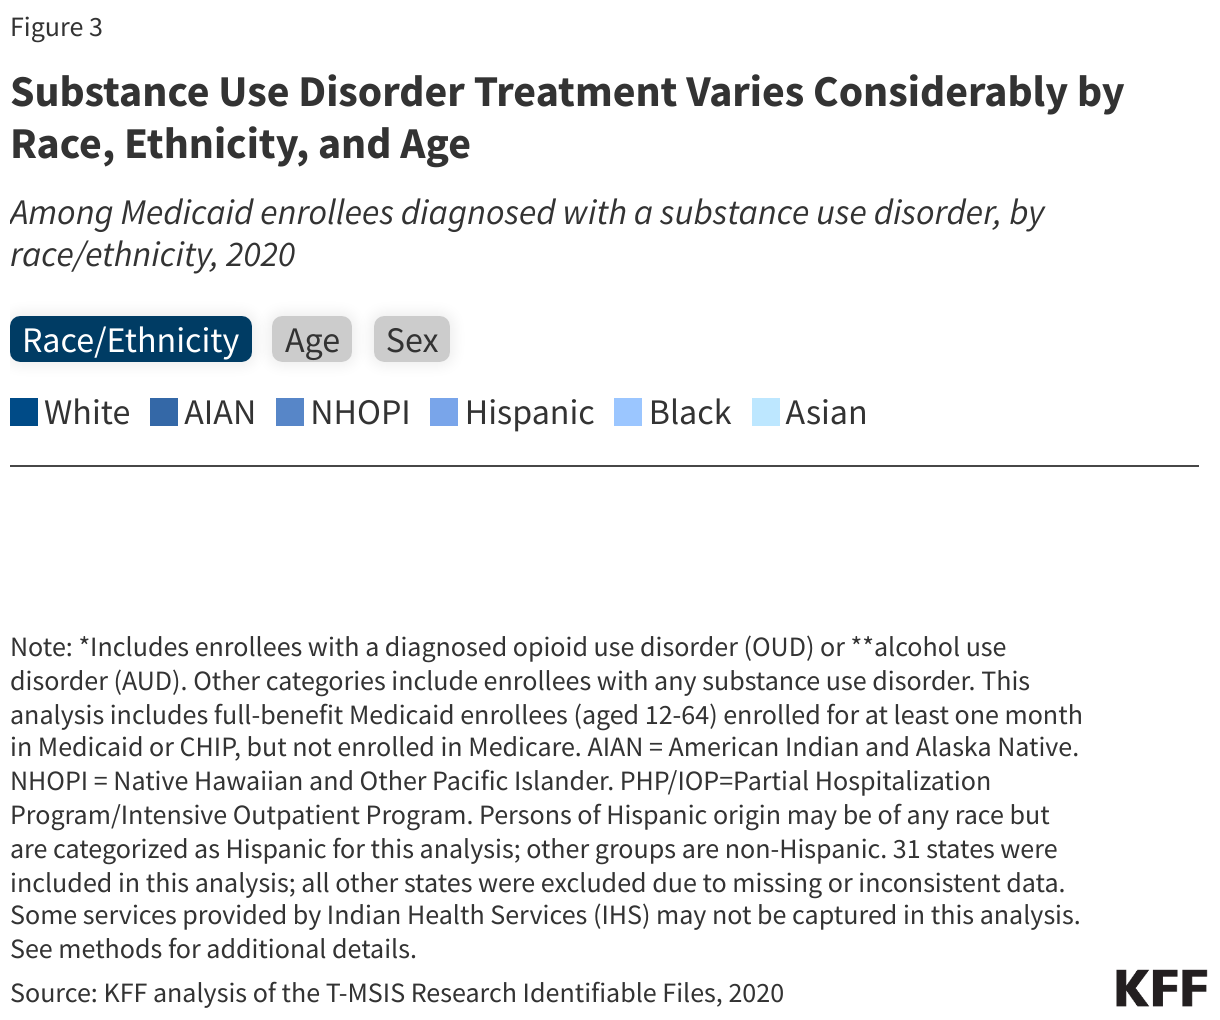
Youth and young adults have lower overall SUD treatment rates than older age groups—with treatment rates particularly low for OUD medication treatment among youth. Overall, about 65% of youth and young adult Medicaid enrollees use some type of treatment or service for SUD, compared to 78% for the 27 to 44 age group (Figure 3). Diagnosed SUD is far lower among youth (1.3%) and young adults (5.4%) compared to those aged 27 to 44 (11.2%) (Figure 1). The most notable age-related variation is for medication treatment, with 69% of enrollees aged 27 to 44 receiving medication for OUD, compared to 12% of youth (Figure 3). Medication treatment is currently recommended for some adolescents with OUD. Medication treatment rates for adolescents with AUD are also very low, but medication treatment is not part of current recommendations due to insufficient evidence (Box 1). Males and females use SUD care at similar rates across all types of treatment.
Average utilization of SUD treatment services varies substantially across states. Supportive services, medications for OUD, and inpatient/residential services show particularly wide ranges in treatment rates. Rates for any substance use treatment among diagnosed enrollees range from 53% for the lowest state up to 89% for the highest state. The range across states is particularly pronounced for supportive services and medications for OUD (from 0.1% to 53% for supportive services and 34% to 87% for medication for OUD). Variation is also quite wide for inpatient and counseling services (Figure 4).
Although 74% of enrollees are getting some type of treatment or service, 26% of those diagnosed are not getting any services and there is wide variation across states. In the lowest treatment states, 33% to 47% of diagnosed enrollees do not receive any SUD treatment or support services (Figure 5).
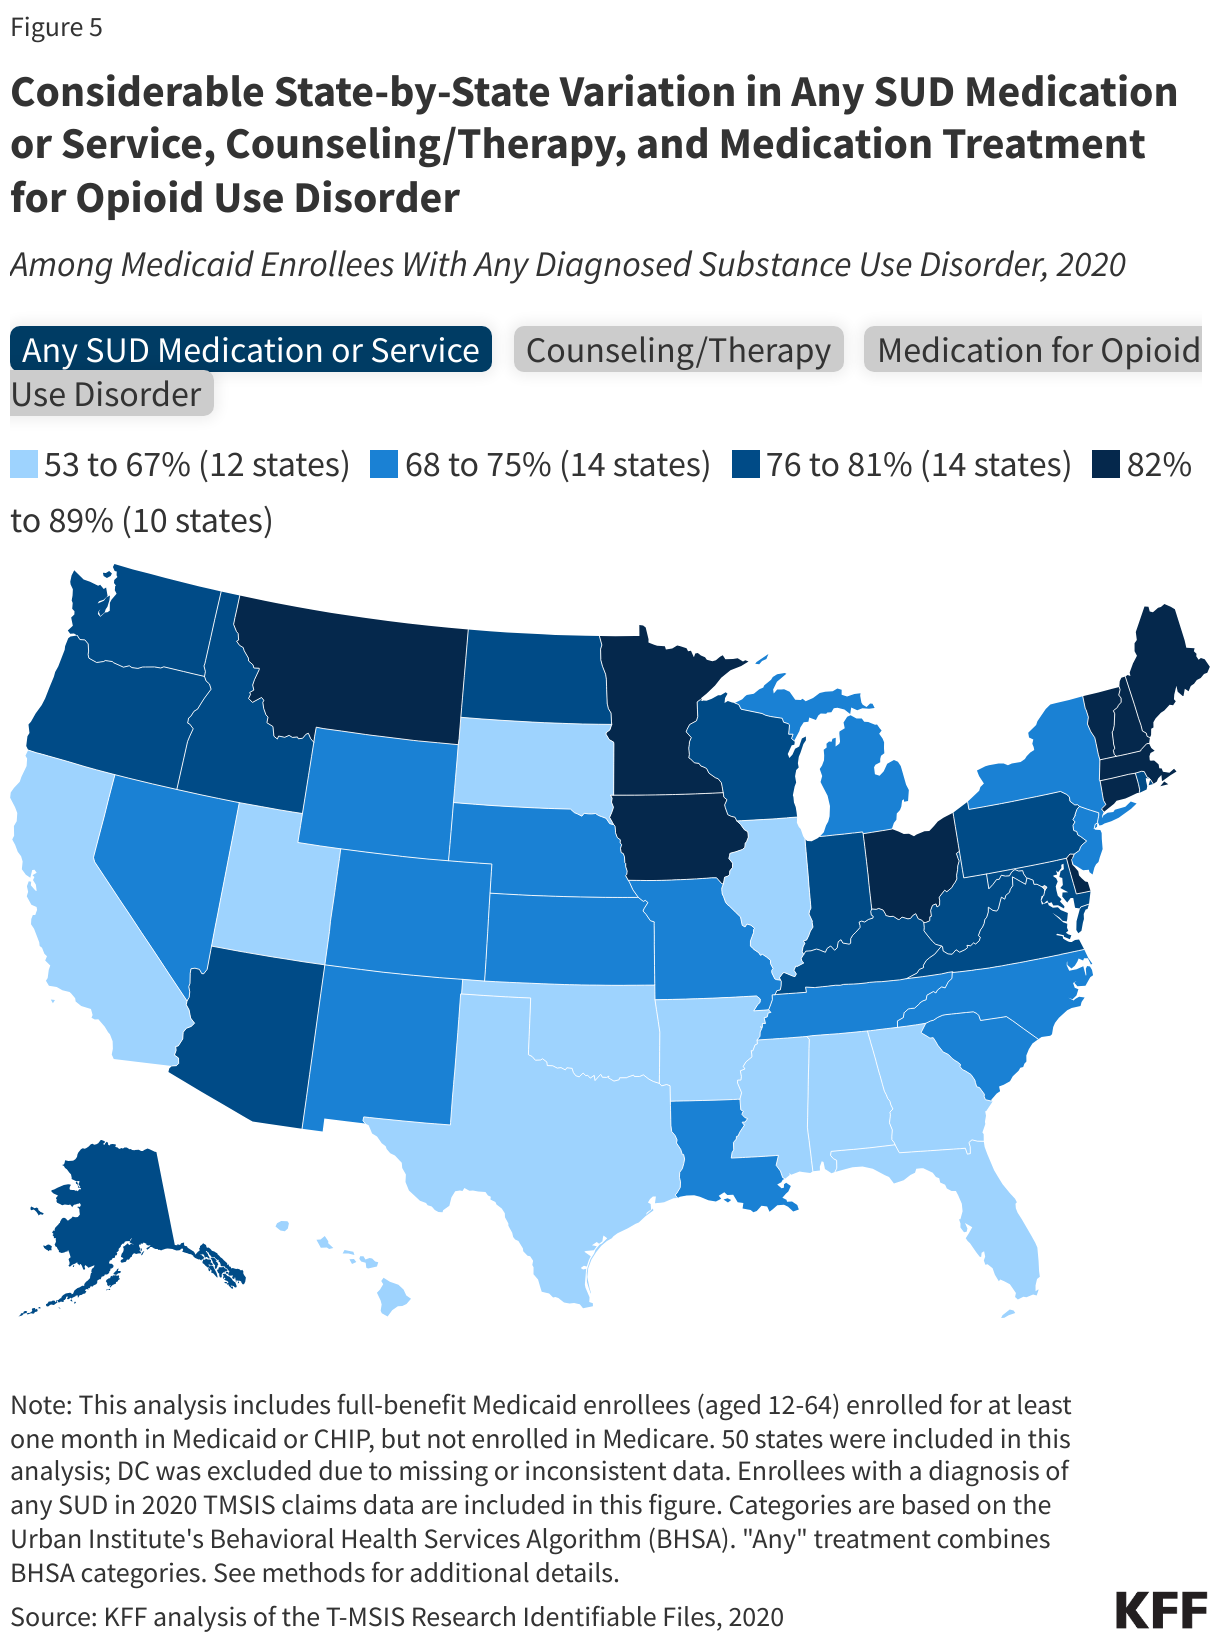
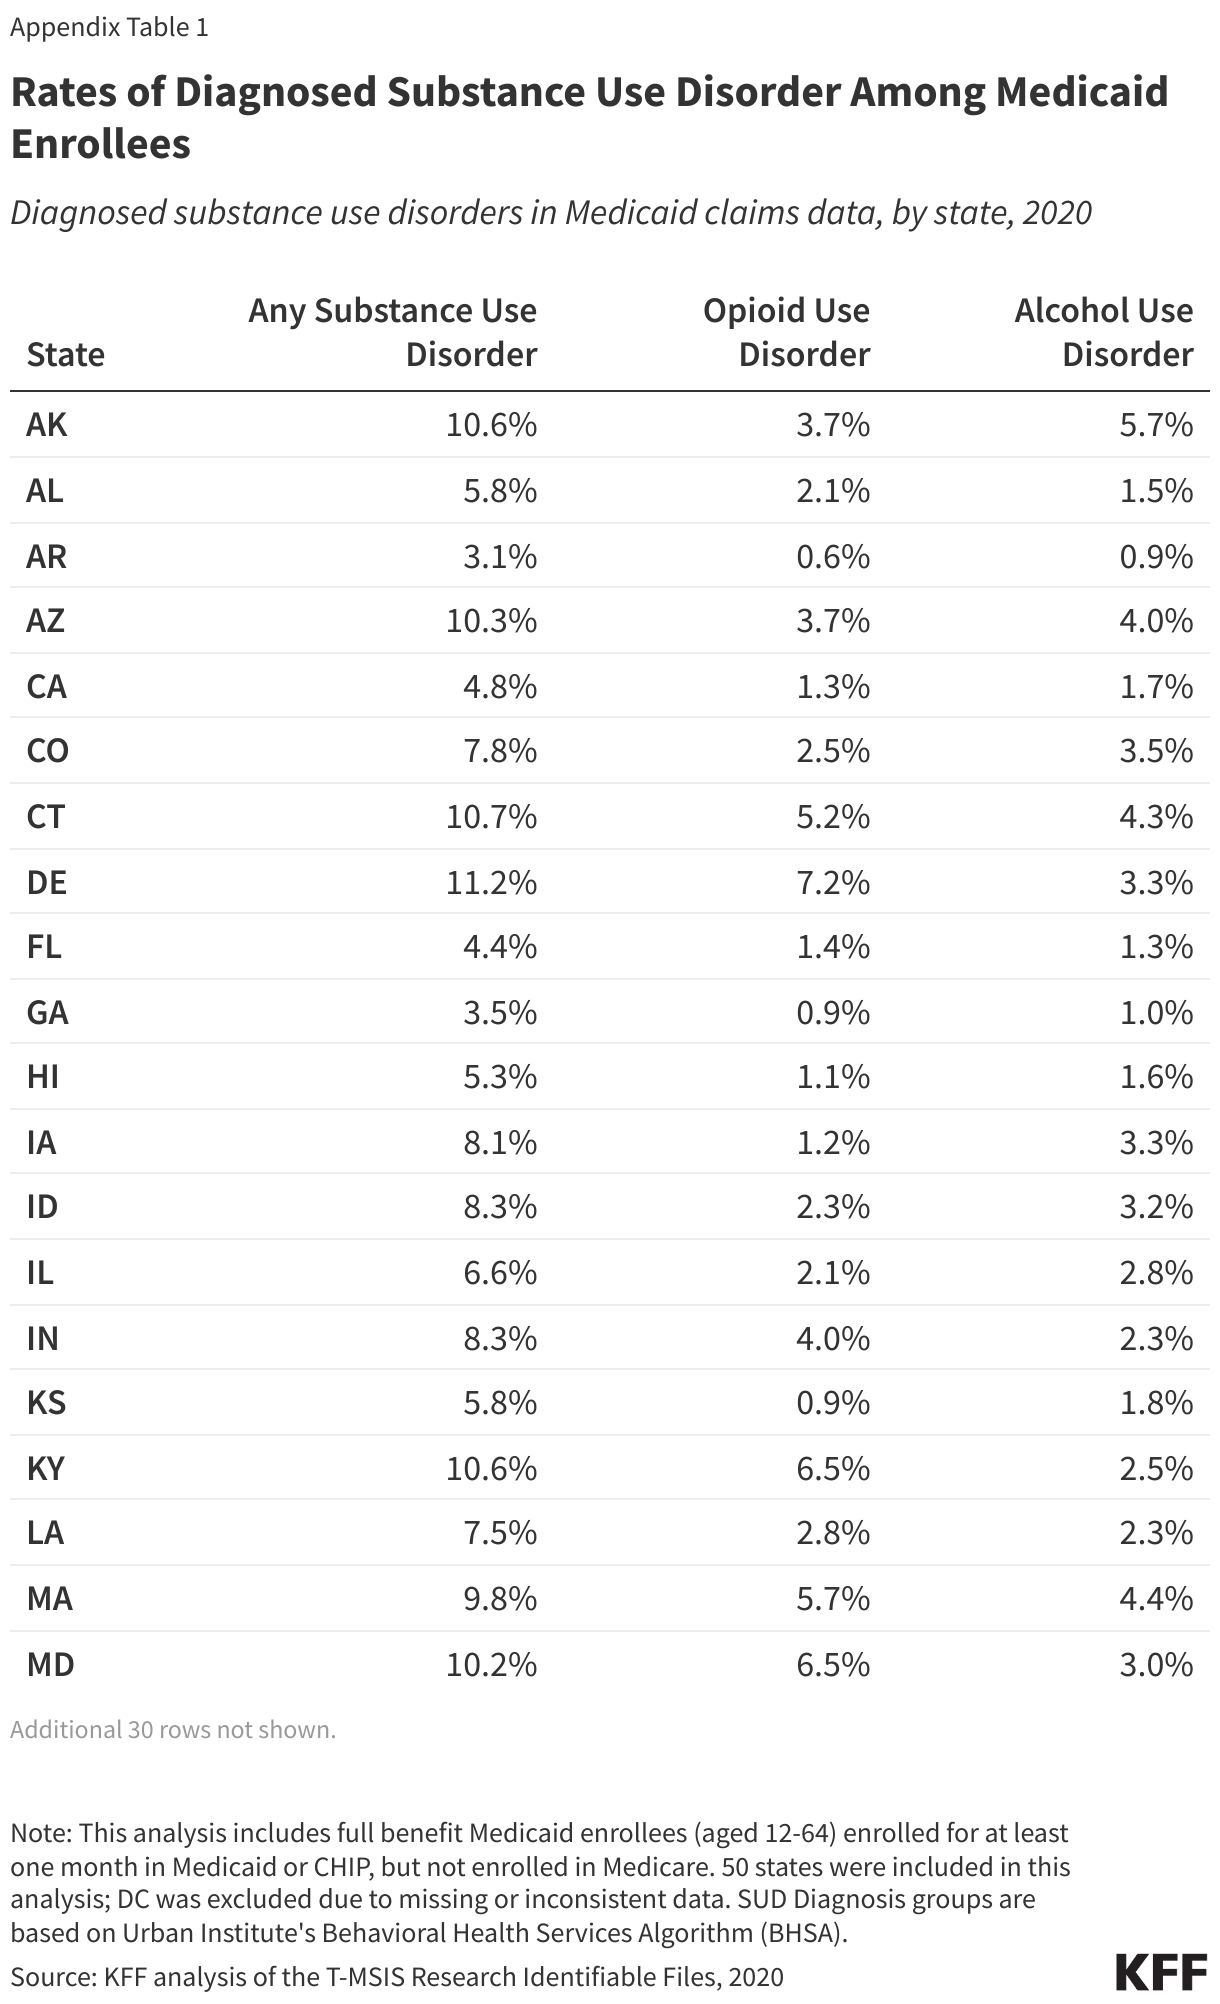
Several states have consistently higher SUD treatment rates across multiple categories. Connecticut, Delaware and Vermont stand out for higher treatment rates across various treatment services. Conversely, there are states with consistently lower treatment rates across categories, including Arkansas, Georgia, Mississippi and Texas (Figure 5). Variation in treatment rates reflects a combination of factors, including differences in states’ coverage policies, state or community efforts to expand access to treatment, treatment infrastructure and workforce, provider participation with Medicaid, and differences in states’ data and the extent to which SUD diagnoses and treatments are captured in the claims data (see Methods).
How does spending for people with SUD compare to overall spending?
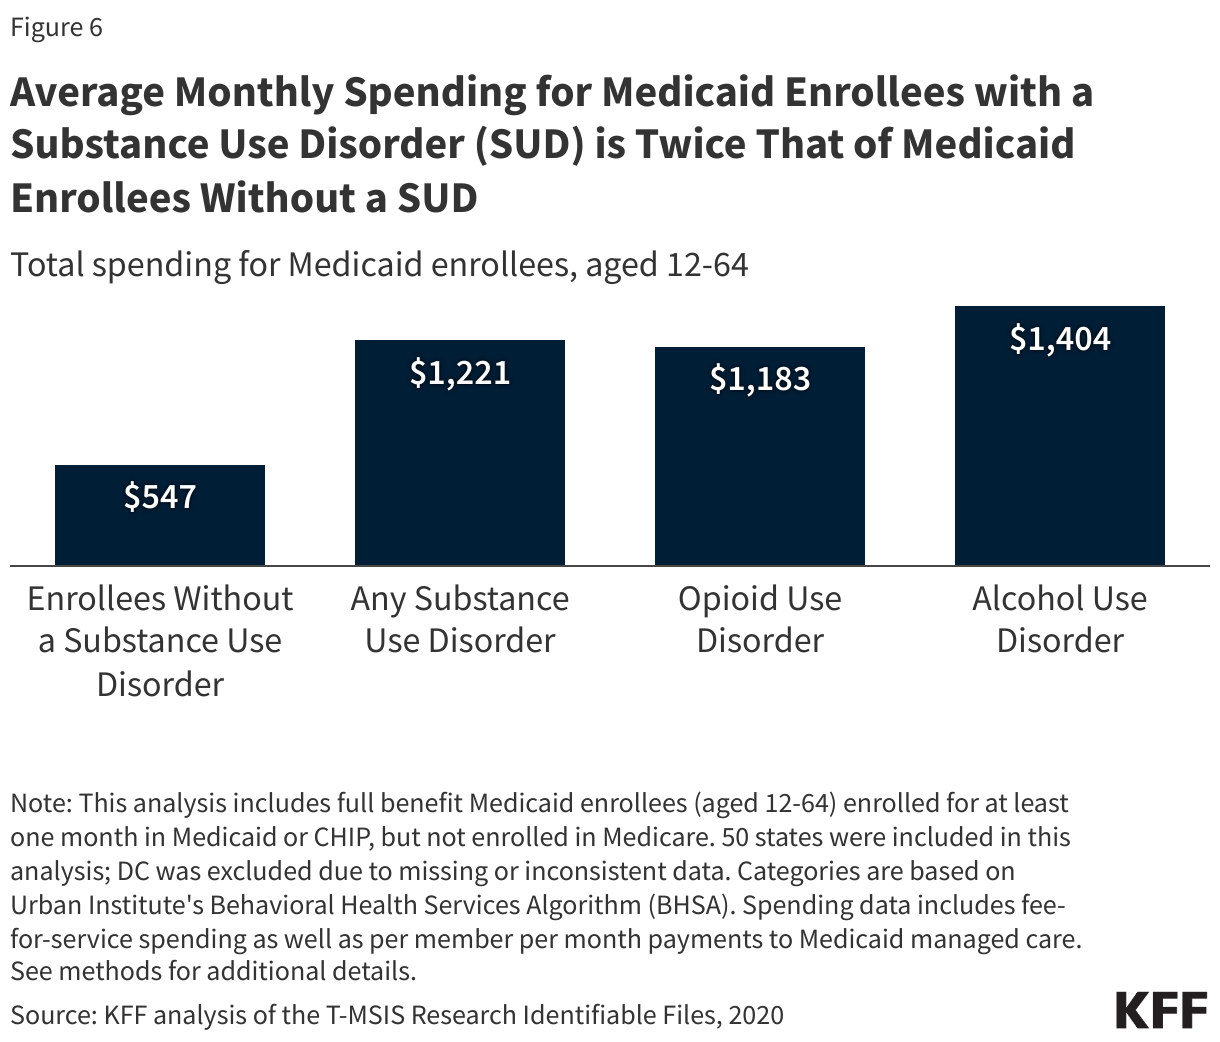
Average Medicaid spending is twice as high for enrollees with a SUD diagnosis compared with other enrollees: Over $1,200 per month and less than $550 per month respectively. Notably, spending is highest for those diagnosed with AUD, at approximately $1,400 per month per enrollee. This pattern of higher spending for individuals with a SUD diagnosis is consistent across all age groups (Figure 6).
Why is there variation in SUD treatment rates?
This analysis may overestimate SUD treatment rates and may underestimate certain types of treatment. As a result of lower diagnosis rates in claims data, estimates of treatment rates using claims data might appear higher than they really are, as they don’t account for the total number of enrollees with SUD. Several factors may contribute to underdiagnosis, including limited provider screening/referral practices, insufficient provider training for SUD, reduced healthcare use for some populations, and stigma. Expanding screening beyond traditional settings or increasing care integration could improve identification of those in need of SUD services. Although the data may overstate treatment rates as a whole, some specific treatments may be missing in cases where states allow bundled payments that roll several types of SUD treatment and supportive services into a single code. This may result in lower recorded utilization for some services, particularly supportive services and may also impact counseling/therapy rates.
Among enrollees diagnosed with an SUD, there is notable variation in treatment rates for opioid use disorder compared to alcohol use disorder. Overall OUD treatment rates generally exceed those for AUD, likely reflecting a greater policy focus on addressing the opioid crisis. Differences are most acute for medication, where treatment rates for OUD medication exceed AUD medication rates by more than 6-fold. A few factors may help explain why medications for AUD may be less utilized, relative to OUD, including lower awareness and understanding of medication treatment options for AUD among clinicians and patients, uncertainties about medication effectiveness, and challenges finding psychosocial support. While excessive alcohol use can lead to a number of health issues, it typically lacks the acute mortality risks associated with opioid/fentanyl use, which may reduce the urgency to initiate AUD medication treatment. Treatment patterns may differ for other specific types of SUD.
Availability of substance use treatment infrastructure and workforce may play a role in variation in treatment rates for certain populations. For example, youth and young adults receive SUD treatment at lower rates, potentially due to a shortage of specialized facilities for this population. Some states are addressing treatment needs by adding coverage for services in non-traditional settings, such as schools, though it isn’t clear whether these services will appear in Medicaid claims data. Lower treatment rates for some racial and ethnic groups may contribute to higher overdose death rates. Factors such as low provider cultural competency in care, lack of diversity in the behavioral health workforce, personal beliefs and societal stigmas, perceived need for treatment and limited treatment infrastructure or fewer treatment options in diverse communities may all play a role.
Substantial state-level variation in treatment rates exist and may reflect differences in covered services, workforce, infrastructure, state characteristics and the nature of their Medicaid payment systems and data. States expanded coverage for SUD services in recent years. Access to services not only depends on Medicaid coverage of services and the availability of facilities and beds, but also on the presence of a behavioral health workforce to keep facilities operational and to provide treatment services. Other state Medicaid efforts that have focused on addressing the opioid epidemic and other SUDs include reducing prior authorization barriers for buprenorphine, expanding telehealth access, adding OTC Narcan to formularies and exploring pre-release Medicaid coverage for incarcerated populations. There have been federal efforts to expand access to SUD treatment and the President’s budget includes a number of provisions to further strengthen behavioral health, some of which include expanding funding for the State Opioid Response grant program, expanding behavioral health services in schools and strengthening the behavioral health workforce.
Medicaid unwinding may lead to loss or interruptions in coverage for people who depend on Medicaid for SUD treatment. Coverage interruptions could disrupt enrollee access to necessary treatment and increase the risk of overdose or complications. The recent resumption of Medicaid renewals following a three-year pandemic halt, known as the ‘Medicaid unwinding’, has led to millions of individuals losing Medicaid coverage. Many people who lose Medicaid have alternative insurance options. However, for those who rely on Medicaid to cover SUD treatment, the loss of Medicaid coverage could disrupt their access to ongoing SUD treatment. Such a loss may disrupt treatment and increase overdose or complication risks.
This work was supported in part by Well Being Trust. KFF maintains full editorial control over all of its policy analysis, polling, and journalism activities.
Methods
Medicaid Claims Data: This analysis used the 2020 T-MSIS Research Identifiable Files including the inpatient (IP), long-term care (LT), other services (OT), and pharmacy (RX) claims files merged with the demographic-eligibility (DE) files from the Chronic Condition Warehouse (CCW).
Identifying SUD Diagnoses: This analysis identified SUD diagnoses using the Behavioral Health Service Algorithm (BHSA) reference codes provided by The Urban Institute. The BHSA identifies SUD with ICD-9 and ICD-10 diagnosis codes, procedure codes, service codes, and National Drug Codes (NDCs). "Any SUD" is a comprehensive category that includes SUDs that involve alcohol, opioids, marijuana, inhalants, sedatives, hallucinogens, psychostimulants, and/or substances labeled as "other" or "unspecified" in claims data. This analysis also separately examined alcohol and opioid use disorders.
See: Victoria Lynch, Lisa Clemans-Cope, Paul Johnson, Marni Epstein, Doug Wissoker, and Emma Winiski. Behavioral Health Services Algorithm. Version 3. Washington, DC: Urban Institute, 2022.
Identifying SUD Utilization and Medicaid Treatment Services Categories of Care: The Urban Institute’s BHSA also identified use of the following SUD treatment service categories:
- Medication Treatment (OUD/AUD) which includes medications that the FDA has approved for OUD/AUD treatment, other replacement medications, and some psychiatric medications used to treat SUD;.
- Inpatient or Residential Care;
- Intensive Outpatient Program (IOP) or Partial Hospitalization Program (PHP);
- Therapy/Counseling;
- Supportive Services (includes case management/care coordination, peer supports, vocational training, and other supportive services); and
- Other Treatment (includes SBRIT screening, assessment, management and evaluation codes, crisis intervention, and services not categorized elsewhere)People who receive one or more type of treatment are considered to have received “any treatment.”
Spending: Spending data includes fee-for-service spending as well as per member per month payments to Medicaid managed care.
Enrollee Inclusion Criteria: This analysis includes enrollees ages 12 to 64 who had full Medicaid or CHIP coverage for at least one month. Treatment rates were similar if the sample was limited to enrollees with at least six months of full coverage.
State Inclusion Criteria: To assess the usability of states’ data, the analysis examined quality assessments from the DQ Atlas for claims volume and managed care encounters and compared the percentage of people with SUD to estimates from the 2021 National Survey on Drug Use and Health (NSDUH) state estimates (due to the unavailability of 2020 NSDUH data).The analysis excluded any states that had both a “High Concern/ Unusable” DQ Atlas assessment and a difference between the NSDUH and claims-based estimates greater than 10.9 percentage points (which corresponded to the 75th percentile of the distribution of differences). Washington D.C. was excluded based on these criteria, leaving 50 states in the analysis.
For reporting by race/ethnicity, the analysis excluded states with “High Concern/Unusable” DQ Atlas assessments. Among the states in the main analysis, 19 were excluded (AL, AZ, AR, CO, CT, HI, IA, KS, LA, MD, MA, MO, NY, OR, RI, SC, TN, UT, and WY). This left 31 states for reporting by race/ethnicity (Figure 3).
Limitations of Claims Data:
- Claims data not capture everyone with SUD because screening/referral practices vary and diagnoses may not be recorded if treatment isn’t received. As a result, the treatment rates calculated from claims data may represent an upper bound of treatment rates since they don’t reflect the full pool of people will SUD.
- Some states allow bundled payments that rolls several types of SUD treatment and supportive services into a single code, which may result in lower utilization rates for some services and in some states. Services not reimbursed by Medicaid will not appear in claims data.
- Due to the continuous enrollment provision enacted at the start of the pandemic, Medicaid enrollment increased. Higher enrollment may have implications for service utilization rates in 2020. However, sensitivity tests show similar service utilization in 2019 and 2020 among those diagnosed an SUD.
National Survey on Drug Use and Health. The National Survey of Drug Use and Health (NSDUH) asks nationally representation sample of respondents 12 and older about substance use and symptoms of substance use disorders. Those who exceed certain thresholds are classified as having a SUD. This analysis uses the 2020 NSDUH public use file and includes Medicaid enrollees between the ages of 12 and 64 who met DSM-V criteria for a SUD involving alcohol or illicit drugs. Illicit drugs include marijuana, cocaine, heroin, hallucinogens, inhalants, methamphetamine and the misuse of prescription psychotherapeutic drugs (i.e., pain relievers, tranquilizers, stimulants, and sedatives). Urban Institute’s BHSA includes the same substances as well as codes for “other” or “unspecified” substances. NSDUH captures people who may not have a clinically identified or diagnosed case, so rates of SUD are higher than claims data across demographic groups; however, NSDUH may still underestimate SUD prevalence. NSDUH only collects data from people with an address–excluding those who are unhoused, institutionalized, or incarcerated–which is relevant because these populations may have higher rates of substance use disorders.
Appendix