KFF designs, conducts and analyzes original public opinion and survey research on Americans’ attitudes, knowledge, and experiences with the health care system to help amplify the public’s voice in major national debates.
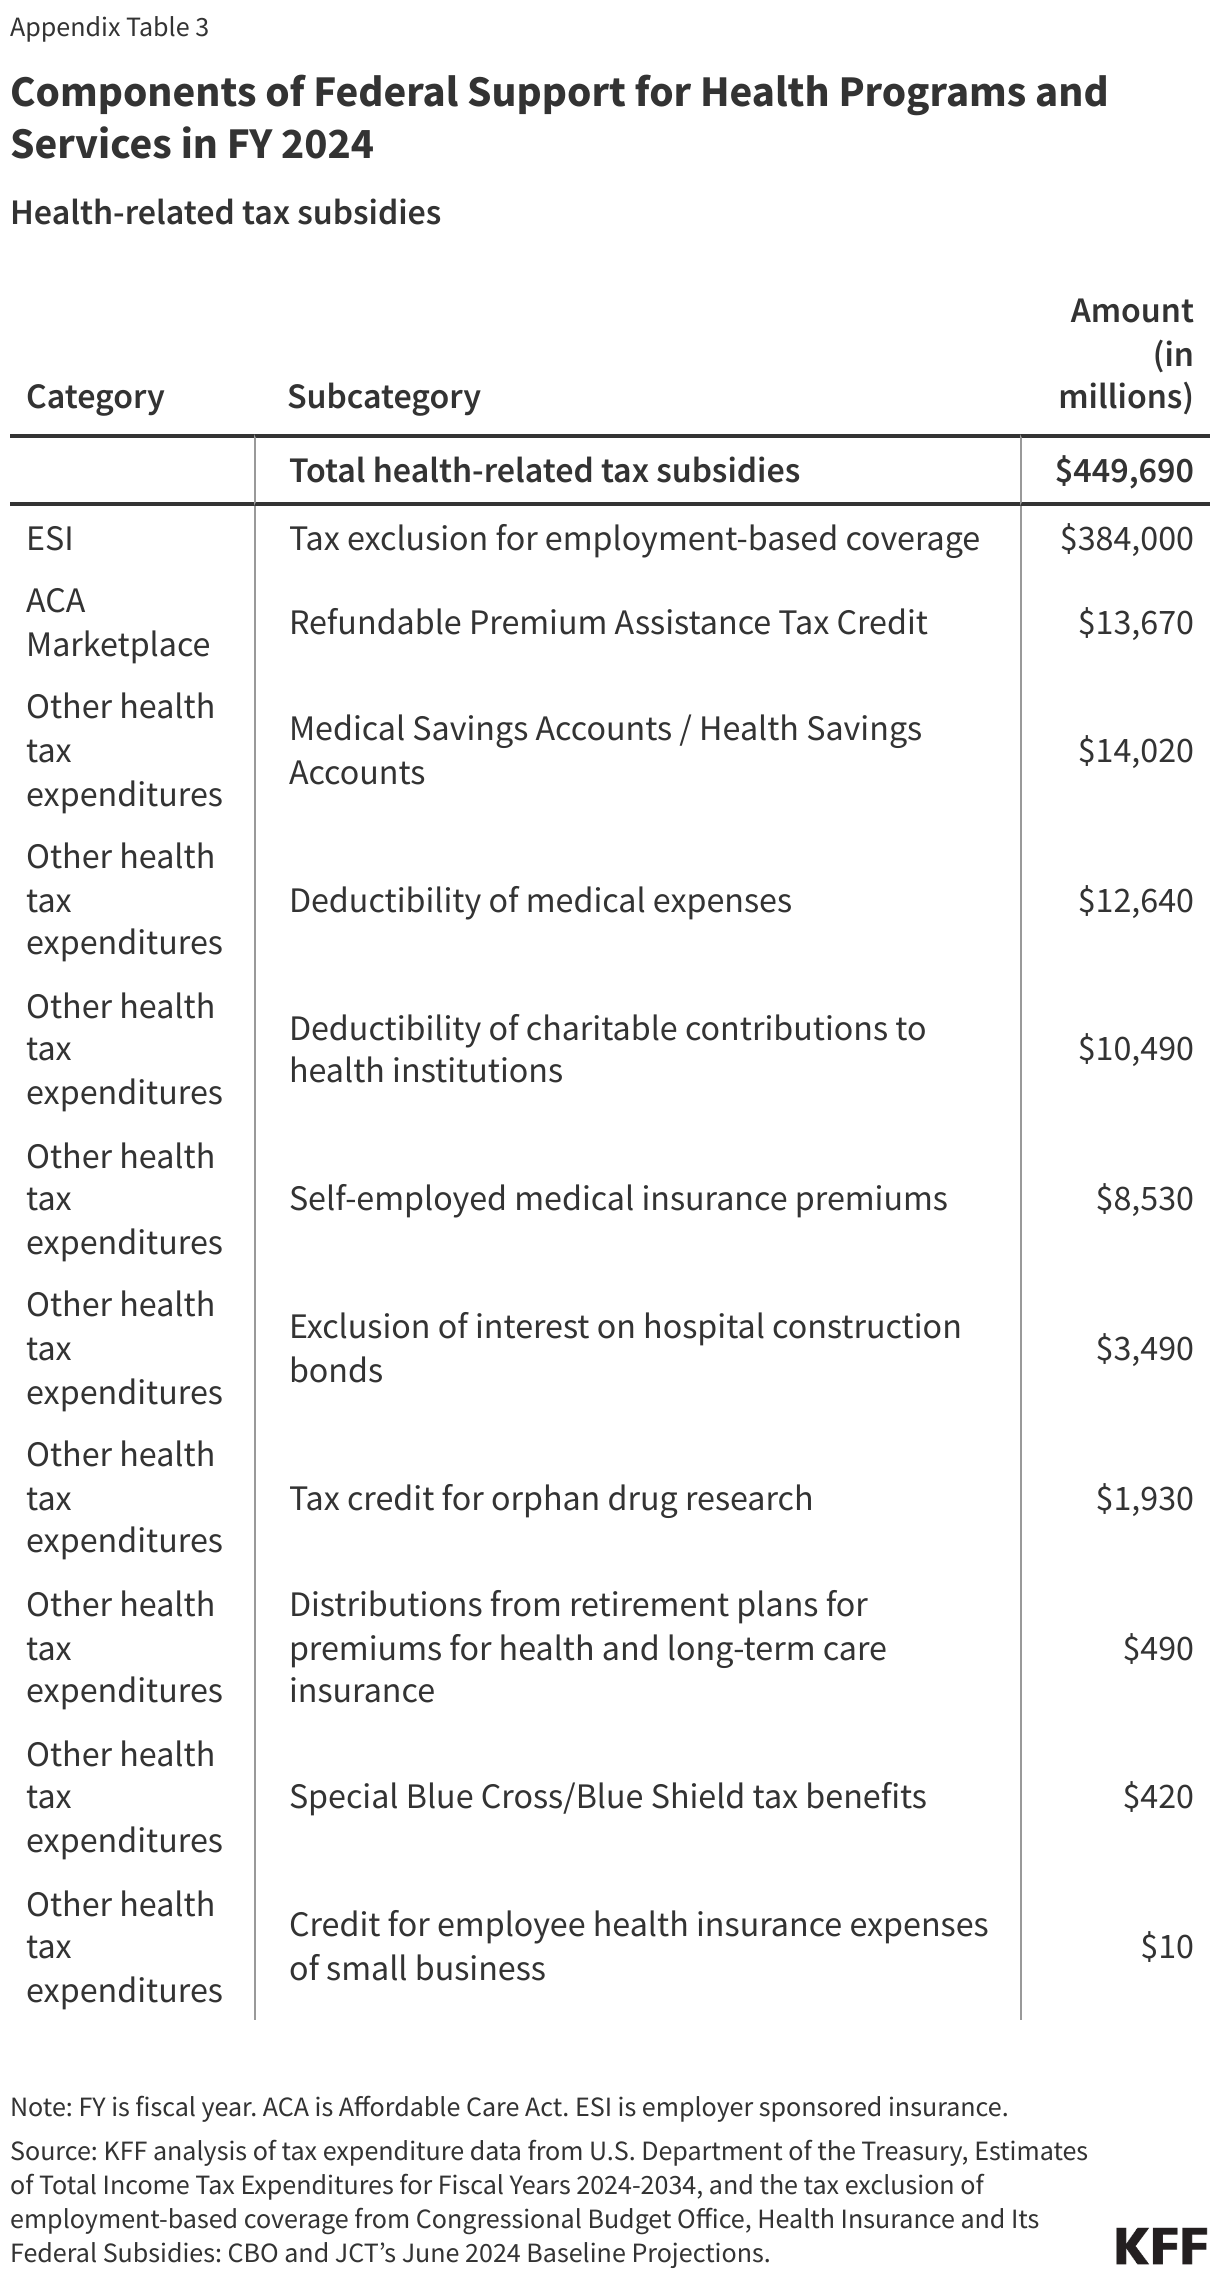
Enhanced subsidies for Affordable Care Act (ACA) Marketplace plans are set to expire at the end of 2025, unless they are renewed by Congress. Since 2021, these enhanced subsidies have lowered monthly premium payments for the vast majority of Marketplace enrollees, across incomes. For example, instead of a lower-income person paying 2% of their income on their premium, they pay nothing. Higher income people currently pay no more than 8.5% of their income on their premium, whereas they were originally ineligible for financial assistance.
While virtually all subsidized ACA enrollees can expect to see their premium payments rise substantially without extension of these subsidies, most will still be eligible for some financial assistance (with the original ACA subsidies). However, those who earn more than four times the federal poverty level ($62,600 for an individual or $128,600 for a family of four with 2026 coverage) would lose eligibility for subsidies altogether and would therefore have to pay full price for their health plans. Based on 2025 premiums, for example, a 60-year-old couple earning $85,000 annually (416% of the federal poverty level in the contiguous 48 states), would see their monthly premium payment increase by $1,507 per month (an increase in payments of over $18,000 for the year), on average.
Relative to other Americans, subsidy-eligible individual market enrollees with incomes over four times poverty (who would lose subsidy eligibility if enhanced tax credits expire) are disproportionately:
Early and pre-retirees: About half (51%) of enrollees with incomes over four times poverty who would lose subsidy eligibility are between the ages of 50 and 64, compared to 23% of the non-elderly U.S. population.
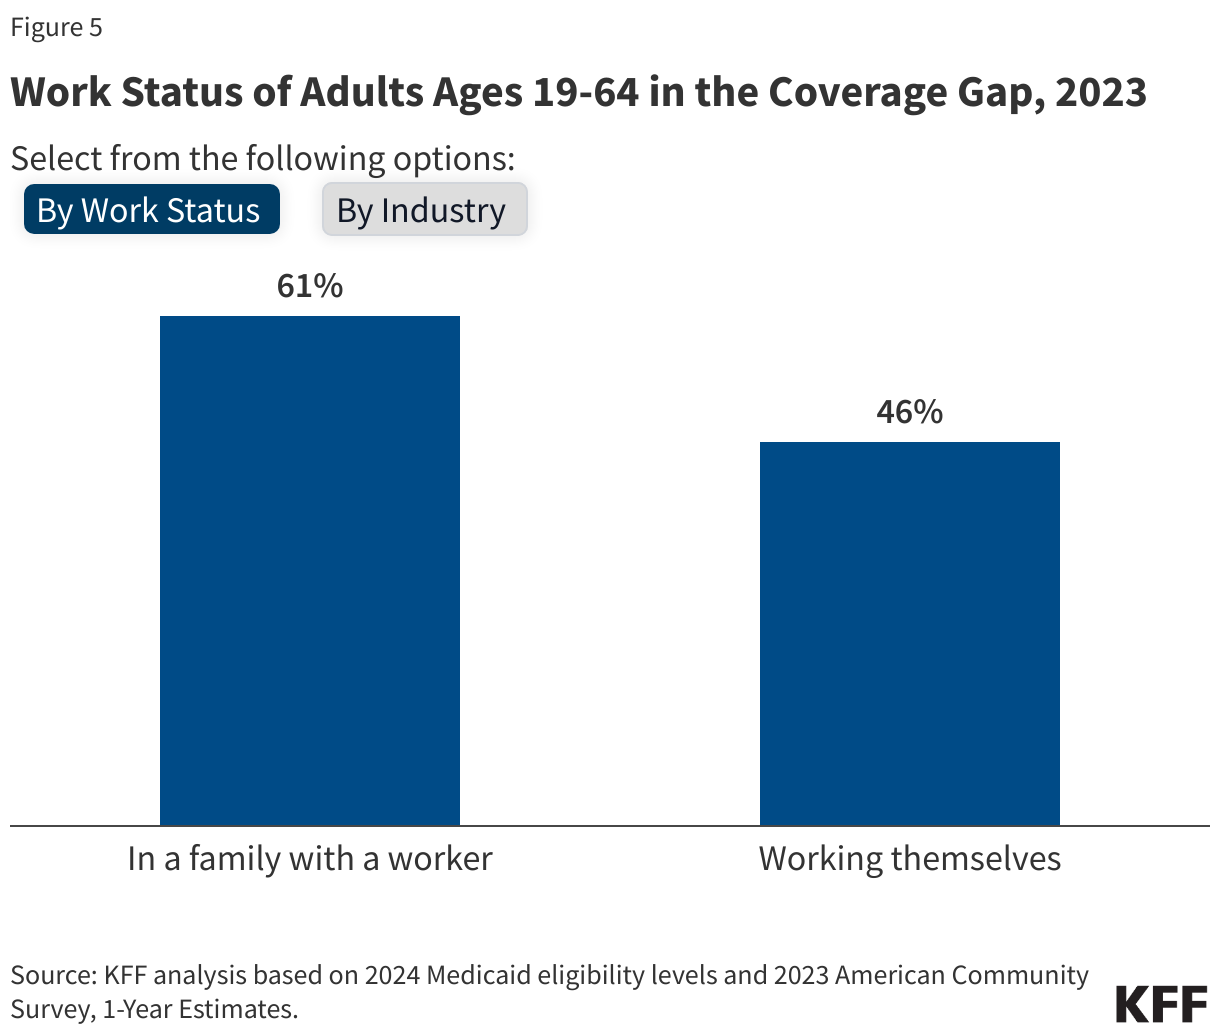
Self-employed: Among non-elderly adults (ages 19 to 64) with incomes over four times poverty who would lose ACA subsidy eligibility, 38% are self-employed, compared to 7% of non-elderly adults (19-64) nationally. Small business owners often rely on the ACA Marketplaces because they do not have employer-sponsored insurance.
Living in rural areas: 15% of people with individual market insurance who would lose subsidy eligibility live outside metropolitan areas, compared to 9% of Americans with incomes over four times poverty. (12% of all Americans live in rural area; this is not statistically different from the share of people who would lose subsidy eligibility living in rural areas.)
Relatively few Marketplace enrollees have incomes above four times poverty. According to administrative data, in 2024, 7% of Marketplace enrollees reported an income over four times poverty, with 3% having an income between four and five times poverty and another 4% with incomes over five times poverty (another 4% did not have a known income and may have also exceeded four times the poverty level, but most likely are not receiving an advanced premium tax credit). However, before the enhanced subsidies were introduced – and particularly in 2017 when there were large premium increases and debates about repealing the ACA – this group of people with incomes over four times poverty were the focus of a great deal of media attention because they were fully exposed to the underlying premiums. For those who were priced out of coverage before the enhanced subsidies, they often faced a choice of being uninsured, or – if they were healthy enough to qualify – buying a short-term (non-ACA-compliant) plan off of the Marketplace.
Note: The data above is based on KFF analysis of the 2024 Current Population Survey Annual Social and Economic Supplement. The analysis includes people under age 65 who buy individual market insurance, are subsidy eligible, and would receive a subsidy based on household income. Household offer units were imputed as described previously; enrollees were considered not subsidy eligible if a member of the unit reported being offered employer-sponsored insurance.
The U.S. health insurance system has become a “complex labyrinth” for consumers to understand and navigate. Whether public or private coverage, the information needed and the hoops the average health care consumer must go through to use their health coverage effectively is itself a public policy concern, exacerbating continued access and affordability challenges. The KFF 2023 Survey of Consumer Experiences with Health Insurance found that half of insured adults have some difficulty understanding at least some aspects of their insurance. This is the first of two Issue Briefs exploring specific survey findings about gaps in understanding health coverage, highlighting problems and federal consumer protections in place today designed to bridge the gap.
This brief discusses how consumers understand what their insurance covers, what to do when coverage for care is denied, and what protections exist to ensure that information is available and coverage determinations are fair, accurate, and timely. The second brief will discuss survey findings of consumer understanding of the cost of their coverage, existing consumer protections designed to assist with understanding how much they will have to pay for a covered service, and balanced billing and other federal consumer health insurance protections.
The Labyrinth
What does a consumer need to know in order to use their health coverage effectively? The U.S. insurance system of managed care networks, utilization review, and changing coverage options can result in a complicated maze for a patient to navigate on their own. Federal and state policymakers have developed a series of incremental reforms to address understanding and transparency for consumers, but these can differ considerably based on the type of coverage, the plan the consumer chooses (if they have a choice), and sometimes, the state where they live. For private coverage in particular, the current regulatory framework is a complicated system of overlapping state and federal standards, sometimes leaving consumers to sort through a barrage of questions in order to get the care they thought was covered by their insurance.
KFF Consumer Survey Findings
The KFF 2023 Survey of Consumer Experiences with Health Insurance (“Consumer Survey”) included a nationally representative sample of 3,605 U.S. adults ages 18 and older with health insurance. The survey asked consumers about their experiences with their health insurance, including questions regarding how well enrollees understood what was covered, insurance problems that arose when enrollees tried to use their insurance, and where they sought help when they experienced insurance problems.
Understanding What is Covered
According to the 2023 KFF Consumer Survey, more than one-third (36%) of all insured adults said it was somewhat or very difficult for them to understand what their insurance will and will not cover. These shares vary by insurance type, with larger shares of those with Affordable Care Act (ACA) Marketplace plans (46%) and employer-sponsored plans (40%) reporting greater difficulty than those with Medicaid (28%) or Medicare (24%) (Figure 1). There were also differences in understanding certain aspects of insurance by demographic characteristics. Hispanic (36%) and White (36%) insured adults were more likely than insured Black adults (26%) to say it is somewhat or very difficult to understand what their insurance will and will not cover. Among insured adults, Hispanic adults (37%) were more likely than their Black (24%) and White (29%) counterparts to say it is at least somewhat difficult to understand their Explanation of Benefits (EOB). (An EOB is a written statement from a health insurance plan explaining what costs it will cover for medical care an enrollee has received and what the enrollee must pay, though it is not a bill). While the precise explanation for these demographic differences is not clear from the survey data, these trends are similar to those found in otherresearch that noted health insurance literacy challenges across consumers generally, but found racial and ethnic disparities. Additionally, about three in ten insured adults ages 18-29 (30%) and 30-49 (28%) found it somewhat or very difficult to understand how to find information about which doctors, hospitals, and other providers are covered in their plan’s network, compared to 13% of insured adults ages 65 and older. (For the full list of consumer items asked about in this question, see the survey toplines.)
Educational attainment does not necessarily explain lack of understanding. The KFF Consumer Survey found that a slightly higher share of college graduates (58%) had difficulty understanding some aspect of their health insurance coverage than those without a college degree (46%). College graduates (43%) were more likely to report that it was somewhat or very difficult to understand what their health insurance will or will not cover compared to those without a college degree (31%). It is not entirely clear why education does not seem to increase understanding of insurance, though one possible explanation is that those with higher educational attainment are more likely to have private insurance (employer-sponsored insurance or Marketplace), with variable and changing insurance designs that may be more difficult to understand generally.
Areas where consumers note trouble with understanding insurance are often consistent with the top problems that consumers face with insurance. About six in ten (58%) insured adults reported experiencing a problem with their health insurance in the past year. This share is even higher (78%) among high utilizers of health care – those who had more than ten visits with a health care provider in the past year. While having a problem with health insurance does not necessarily indicate that a consumer had trouble understanding their insurance, determining what services are covered and what providers are in-network are items that cut across both topics. Several survey respondents reported problems related to using insurance that involved services or providers not covered by their plan. For example, 18% of insured adults indicated that their health insurance did not pay for a service that they thought was covered. Those with employer-sponsored (21%) and Marketplace (20%) coverage were more likely to report having this problem than those with Medicaid (12%) or Medicare (10%) (Figure 2). A somewhat larger share of insured Black (17%) and Hispanic (16%) adults reported that a doctor or hospital they needed was not covered by their insurance in the past 12 months compared to White adults (12%). Marketplace (20%) and Medicaid (19%) enrollees were more likely to encounter this problem than those with Medicare (9%) or employer-sponsored insurance (ESI) (13%). One in five (20%) insured adults ages 30-64 reported their health insurance denied or delayed a prior approval request in the past 12 months, relative to 11% of those ages 18-29 (11%) and 9% of those age 65 and older. (For the full list of consumer problems asked about in this question, see the survey toplines.)
Knowing Where To Go For Help
What actions, if any, consumers take when they encounter a problem with their health insurance might be instructive in addressing barriers to understanding coverage or best practices to assist consumers in navigating coverage questions.
Among the nearly six in ten insured adults who reported experiencing problems with their health insurance in the past 12 months, more than half (53%) said they contacted their health insurance company to resolve the problem(s) (Figure 3). A similar share (49%) said that they referred to their health insurance website or documents. Fewer said they asked a Navigator or broker for help (11%) or contacted their state Consumer Assistance Program or Ombudsman (3%).
Nearly three in five (57%) of all insured adults reported contacting their insurance at least once in the past 12 months, either by phone, online, in-person, or in writing(Figure 4). Forty-two percent of insured adults did not contact their insurance company at all. Among those who did reach out to their insurance at least once, half (50%) inquired whether a health care expense (such as a prescription, procedure, treatment, or visit with a health care provider) was covered by their health insurance, making it the most common reason for contacting their insurance. Receiving a medical bill (42%) was another reason insured adults contacted their insurance, followed closely by finding out what steps needed to be taken for their insurance to cover a prescription, procedure, or medical visit (39%). Fewer (31%) contacted their insurance at least once in the past year to find out how much a medical procedure would cost out-of-pocket.
Most insured adults are unaware that they have the legal right to appeal to a government agency or independent medical expert if their health insurance refuses to cover needed medical services(Figure 5). Those with public insurance are more likely than those with private insurance to be aware of this right. Just one-third (34%) of those with ESI or Marketplace coverage know they have this right, compared to 58% of Medicare beneficiaries and 45% of those with Medicaid. Further, just one in ten (10%) insured adults who experienced a problem with their health insurance in the past year filed a complaint with their health insurance company (data not shown). This share is similar across all four coverage types.
Three-quarters (76%) of adults with insurance reported not knowing what government agency they would call for help if they wanted to. Adults with ESI (83%) or Marketplace (81%) coverage were more likely to report that they did not know which government agency to contact compared to Medicare (61%) and Medicaid (70%) enrollees. Among insured adults with ESI or Marketplace coverage who reported that they did know which government agency they would contact, 15% of those with ESI and 6% of those with Marketplace coverage reported that they would reach out to their state insurance department/commission(er), the lead agency that is responsible for regulating non-group health coverage and insured group coverage. No one reported that they would contact the Department of Labor (DOL), the government agency that regulates health plans sponsored by private employers, including self-insured employer health plans.
Federal Consumer Protections Seek to Address Barriers to Understanding Coverage
Many federal reforms have focused on providing consumers with better information about their plan, standardizing and simplifying information, and making sure notice is provided of key design features and reforms. While public programs such as Medicare and Medicaid also provide consumer protections, this section focuses primarily on federal protections for those with private health insurance coverage (individual and employer-sponsored).
Understanding What is Covered
The ability to access accurate and easy-to-understand written information has long been a core consumer protection. Below is the landscape of written materials a consumer can access to get information to understand their coverage. Figure 6 is a snapshot of some key consumer protections for those with private insurance.
Coverage documents and summaries: All forms of coverage, whether Medicare, Medicaid, or private insurance available through an employer or a health insurance Marketplace, are required as a form of consumer protection to provide information about benefits and coverage, with varying content requirements, formats, and frequency of updates. Although there are fewer required standardized information formats across private coverage than in public programs such as Medicare, the ACA ushered in a standardized template across most private insurance through the Summary of Benefits and Coverage (SBC), with information on key coverage items and exclusions, cost-sharing, and rules for accessing care. All ACA-compliant plans in the individual and group insurance market and all employer-sponsored plans must provide consumers with an SBC.
More detailed coverage documents can extend to one hundred written pages or more; however, electronic formats and machine-readable files may make it easier to access information for those with the technology and ability to research this information. Examples in the private insurance market include state-regulated insurance documents (including Marketplace plans) sometimes called Certificates of Coverage, or plan documents and Summary Plan Descriptions that set out benefits for those in employer group health plans covered by ERISA.
Provider directories and formularies: Provider directories and formularies allow consumers to see what providers and medications are covered by their insurance. While these items might be easy to access online, severalresearchstudies have found that provider directories are often inaccurate. Federal consumer protections across public and private coverage include various features designed to ensure that plans maintain more accurate and up-to-date information. In some cases, these protections also require plans to meet minimum network adequacy standards and test that accuracy through “secret shopper” compliance programs.
Private coverage protections include the No Surprises Act (NSA) requirements, which apply to all private insurance (including employer coverage) and set standards for both plans and in-network providers to ensure accurate provider directory information. Consumers must be reimbursed for cost sharing in excess of in-network amounts when they rely on inaccurate directory information indicating that a provider was in-network. Plans must also continue to cover care from certain providers for a limited period of time after they leave an insurance network.
There is little research on prescription drug formulary accuracy and how consumers determine what medications are covered, but some public programs have model formulary templates to make it easier for consumers to review. There are no federal standards for private employer plans for formulary format, accuracy, and usability.
Consumer notice of rights, disclaimers, and marketing restrictions: Nearly every new consumer protection includes a requirement on an employer or insurance plan and/or provider to notify patients that the protection exists. For example, the NSA requires providers and facilities, as well as plans, to provide patients with information about the NSA’s balanced billing protections. Other federal reforms are meant to alert consumers about aspects of their coverage that might easily be misunderstood with a clear warning or disclaimer. For instance, federal rules for short-term limited duration coverage require a prominent statement that this coverage is “NOT COMPREHENSIVE COVERAGE.” This federally required warning on plan materials, as well as one for fixed indemnity plans, has been the subject of recent litigation questioning the need for and validity of these disclaimers. Another federal agency, the Federal Trade Commission, enforces protections against unfair or deceptive marketing or advertising to consumers that, for example, misrepresents certain limited coverage arrangements as comprehensive health insurance. Several recent investigations have been in collaboration with the federal health insurance agency Centers for Medicare and Medicaid Services (CMS).
Information about coverage determinations and appeals: Even if a consumer has located written information that an item, service, or provider visit is covered by their insurance, they could still face a denial of coverage (e.g., because the plan does not deem the care “medically necessary”), which can create frustrating hurdles for consumers. Medicare and Medicaid have longstanding processes for claims review and appeals. Private coverage also includes certain protections including:
Processes for reviewing claims: All private insurers and employer plans must ensure a “full and fair” review of enrollee claims. In addition, the ACA includes a “transparency in coverage” provision that requires all non-grandfathered private health plans to provide information and statistics about plan practices to the public and to federal and state agencies, including data on claims payment policies and procedures and the number of claims denied.
Prior authorization: The longstanding practice of health plans requiring patients to obtain approval for a health care service or medication before the care is provided has received renewed scrutiny in recent years. New federal protections issued in 2024 and effective in 2027 streamline the process and require aggregate reporting of the number of claims denials for federal Marketplace plans as well as Medicare Advantage and Medicaid managed care organizations.
Information about why a claim was denied: Health insurers and employer plans must clearly disclose to consumers the reason(s) their claim was denied, provide information on their right to appeal the decision, and include the name of any Consumer Assistance Program (CAP) in their state. Consumers can also request more specific information from their plan about the decision (e.g., policy provisions related to the denied claim, names of experts consulted for decision).
Internal appeal to the plan: If a consumer disagrees with a denied claim from their health plan, they can file an internal appeal with their plan. Plans are required to inform consumers of their appeal decision within 30 days for a service not yet received, within 60 days for a service that was already administered, and within 72 hours in urgent medical cases (sometimes less depending on the situation).
External independent review: Consumers whose claims denial is upheld at internal appeal may have the right to an external review by an entity independent of the plan for certain types of claims.
Language assistance and information in alternative formats: Requirements to provide some form of language assistance and auxiliary aids to help with understanding coverage exist across most forms of coverage. Private employer plans have long been required to offer assistance in a non-English language where the plan covers a specific percentage of participants in the plan who are “only literate” in the same non-English language. The ACA requires that the SBC and certain claims and appeal notices be provided in a “culturally and linguistically appropriate manner” by individual and group insurers and self-insured employer plans. This could include items such as oral language services and a notice in a certain non-English language provided to enrollees upon request if they live in a county where 10% or more of the population is literate only in the same non-English language.
Separate language access standards apply to recipients of federal financial assistance, programs that HHS administers, and entities established under the ACA, such as health insurance Marketplaces. As a result, most private insurers participating in public and private insurance programs (including some who also provide insurance or administrative services to employer-sponsored coverage) must comply.
Effective communication for individuals with disabilities is also required under the ACA. Current regulations likely extend to information about health insurance coverage through the use of “auxiliary aids” for individuals with disabilities, such as sign language interpreters onsite or by video. Electronic information technology used to provide information about health coverage to enrollees must also be accessible for individuals with disabilities unless doing so creates an undue burden or fundamentally alters the program. Similar access standards for persons with disabilities might also apply to those who sponsor coverage and are also subject to the Americans with Disabilities Act or the Rehabilitation Act.
Direct Assistance
Some consumers may seek one-on-one communication to understand technical details in an insurance coverage document, to get more information about plan or provider policies and procedures, or to navigate the claims appeal process. The 2023 KFF Consumer Survey indicates that more insured adults reach out to their insurance company when encountering a problem than look to written plan material for resolution. Ensuring that consumers have access to effective and impartial one-on-one help has been the subject of federal consumer protection requirements. Figure 7 is a snapshot of key channels for direct consumer assistance.
Customer service options: Private insurers generally make certain customer services available to enrollees. Customer service provided by health plans is commonly offered via call centers, electronic messaging platforms, and increasingly, virtual chatbots. States may have specific customer service requirements for insurers selling state-regulated plans, such as call center wait time standards or staffing a minimum number of customer service representatives.
Health insurance marketplaces are required to provide consumer tools. Healthcare.gov operates a toll-free call center 24 hours a day, 7 days a week, for consumers with questions related to the federal health insurance Marketplace. The ACA also requires all state-based marketplaces to provide a live call center during their hours of operation. Call center representatives must assist consumers with inquiries related to qualified health plans, enrollment, cost-sharing reductions, and advanced premium tax credits (APTCs). Beyond relying just on insurers to provide this information, Congress also created the Navigator grant program to give enrollees access to an additional source of information from organizations other than health insurers to help navigate Marketplace coverage.
For those with private employer-sponsored coverage, there is no specific requirement under federal law to provide direct assistance to help covered employees and their families. Human resources staff sometimes perform this role if a consumer is unable to get answers from customer service personnel available from their insurer or third-party administrator. Some firms contract with third-party vendors to provide patient navigation or “concierge” services that help enrollees navigate plan services and advocate for enrollees as patients, among other services. According to the KFF Employer Health Benefits Survey, in 2024, 29% of firms with 200 or more employees that offered health benefits contracted with a vendor to provide “concierge” services to their enrollees. Separately, the DOL’s Employee Benefits Security Administration (EBSA) operates a toll-free phone number and an online message platform for consumers with questions or concerns related to federal legal requirements, obtaining health plan documents, and assistance getting claims paid.
Funding to state and other entities providing direct assistance: Before the ACA, some states had already established their own Consumer Assistance Programs (CAPs) or health insurance ombudsman programs to help all consumers explore coverage options or assist in resolving problems with their health insurance. Federal CAP grants as part of the ACA allowed for the improvement of existing programs and the creation of new CAPs in other states. In addition to assisting with consumer education and enrollment, the ACA listed one of the duties of CAPs as “assisting with the filing of complaints and appeals… of group health plans…and providing information about the external appeal process.” However, CAPs still operating today have not been supported by federal grant funding since 2012, effectively eliminating the only federally-funded assistance program available to consumers with employer coverage. Several have ceased operations due to lack of funding.
As referenced above, in addition to CAPs, Navigators were established under the ACA as a program to provide direct assistance to consumers in both HealthCare.gov states and in states that operate their own marketplace. Navigators offer support by conducting public education and outreach, helping consumers apply for financial assistance, assisting with enrollment and post-enrollment issues, and providing fair and impartial information about health plan options. Navigators cannot be insurers, nor can they receive any direct or indirect payment from an insurer. These programs in HealthCare.gov states are funded by federal grants, the amounts of which have fluctuated over the years depending on which political party is in power. In February 2025, the Trump administration announced it would cut funding for the Navigator program from its current $100 million to $10 million for 2026.
Standards for health insurance agents and brokers: Agents and (web)brokers play a large role in selling coverage in the individual and group insurance markets and can assist consumers in understanding their health insurance options and costs. While most agents and brokers are certified and regulated at the state level, federal requirements for those agents and brokers involved with Marketplace plans are meant to protect consumers from fraudulent activity and misleading information from agents and brokers, and to make sure consumers are aware of how they are paid and the possibility of conflicts of interest in steering consumers to certain products that financially benefit the agent/broker/web broker. Federal law also requires agents, brokers, and other service providers that work with private employer plans to disclose to employers how they are paid.
Looking forward
KFF 2023 Consumer Survey findings about how consumers understand and navigate the health insurance system reveal frustrating hurdles to determine what items and services and what providers are covered by their insurance. It presents the question of whether we have a system that is impossible for a consumer to navigate alone, leaving consumers vulnerable to exploitation and confusion as they are caught in the middle of health plan and provider interests and arbitrary boundaries of authority between state and federal agencies. Coming out of an election widely viewed to have turned on concerns about the economy, including health care costs, and following public outrage against insurers following the killing of the United Healthcare CEO at the end of 2024, expect that health care consumer issues will not go away, but perhaps will shift focus to include:
Use of digital technology such as artificial intelligence (AI) to assist consumers: Though imperfect and with some pitfalls, digital technology, including AI, can help consumers navigate the complexities of health insurance. These tools are increasingly being promoted to both companies and individuals and in 2024, nearly two-thirds (64%) of adults say they have used or interacted with AI. AI tools can be appealing to consumers looking for answers to health insurance-related questions without the need to make a phone call, wait on hold, or read through plan documents, and are often available 24/7. From guiding consumers through the insurance claims process, including filing appeals, to helping determine whether a plan that applies coinsurance or copayments for their prescription drugs will meet their needs, and identifying in-network doctors near a patient’s home, these tools have the potential to transform the ways in which people seek health information.
However, AI has also been in the spotlight following investigations and litigation in recent years related to health plans’ use of these tools in making coverage determinations, such as for prior authorization requests and in the claims review process. Much of the existing research and criticisms related to the use of AI in health care more broadly, such as clinical decision-making and claims processing, feature overarching concerns related to their accuracy, reliability, confidentiality, and accessibility that could also apply to consumers using AI and other digital technology to navigate their health insurance.
Patient input in coverage practices: Broader and different mechanisms to gather information about consumer experiences in real time could assist in determining the most pressing concerns for patients and engage more consumers in policy discussions about what structural changes and protections are most needed and impactful for them. One of the largest health insurers recently announced changes aimed at improving the patient experience in using their coverage, expanding consumer support, and improving transparency. Employers are making changes to better oversee and understand their benefit programs and provide consumer input and navigation services as plan sponsors face real scrutiny for the first time under longstanding federal fiduciary requirements.
For the federal government, while deregulation across health care, as well as federal agency upheaval, is likely to be the focus in the coming years, the Trump administration will be tasked with implementing key provisions of the No Surprises Act, which he signed into law, that requires upfront information about what services cost and more accurate provider directories. The Trump administration has already issued an Executive Order for agencies to “rapidly implement” price transparency regulations.
Promoting other forms of coverage: A reaction to the health insurance labyrinth has some promoting mechanisms to move away from traditional insurance to direct payment alternatives such as direct primary care arrangements and account-based arrangements where consumers use dollars available in a health savings account or other type of account to purchase care. The pros and cons of these arrangements will be up for debate, as well as whether consumers—especially those with lower incomes and/or chronic illnesses—are well served by the financial and coverage limitations that may be part of these arrangements, including existing problems with the price transparency data available to them and the rising cost of care due to provider consolidation. Patients might be faced with a different set of understanding challenges under these arrangements.
Understanding how health coverage works, what services are covered and by whom, and what rights consumers have is one piece of the health insurance labyrinth. The second brief in this series on consumer understanding will focus on the cost-related aspects and challenges of health insurance and health care.
This work was supported in part by a grant from the Robert Wood Johnson Foundation. The views and analysis contained here do not necessarily reflect the views of the Foundation. KFF maintains full editorial control over all of its policy analysis, polling, and journalism.
This is Irving Washington and Hagere Yilma. We direct KFF’s Health Information and Trust Initiative and on behalf of all our colleagues at KFF, we’re pleased to bring you this edition of our bi-weekly Monitor.
This volume discusses the spread of race-based vaccine myths amid measles outbreaks, along with shifts in health communication from fact-checking to fostering open dialogue. It also explains common misconceptions about heart attack treatment and prevention, a new scientific journal that questions established science, and gaps in research standards for AI chatbots used in healthcare.
As a measles outbreak in Texas worsens and other cases are reported in the country, misinformation about vaccines continues to spread, influencing public perception and fueling hesitancy. One recurring narrative falsely claims that Black children should follow a different vaccine schedule than children of other races because of alleged differences in immune systems. Some research has shown that people of African descent may demonstrate, on average, a stronger immune response to the rubella vaccine. However, the study’s authors state that the data does not support that there is a need for different vaccine schedules based on race. The claim spread in news and social media after it was brought up during Robert F. Kennedy Jr.’s Senate confirmation hearings, with social media posts both debunking and supporting this narrative.
One of the most popular social media posts on the topic came from Senator Angela Alsobrooks, who shared a video clip on X of her asking Kennedy about these claims during the confirmation hearing and expressing her concern about the dangers of this narrative. The post received approximately 164,000 likes and 30,000 reposts, and 15,000 comments as of February 19. While many commenters shared Alsobrooks’ concern, some perpetuated the misconception that biological differences in vaccine safety are supported by evidence. In some instances, commenters cited cases in which race-based medicine is used in other domains as justification for biological differences in medication effectiveness. But scientists have emphasized that race is a social construct, not a biological category, and using it as a proxy for genetics has led to harmful medical practices.
Despite decades of credible research showing that vaccines are not associated with autism, narratives linking vaccines to autism in Black children have also gained traction, sometimes citing a retracted study of 2004 CDC data. The study, which claimed that Black boys who received the MMR vaccine on schedule were diagnosed with autism at higher rates than other children who did not receive the vaccine on time, was retracted due to flawed methods and the lead author’s undisclosed ties to the anti-vaccine group, Children’s Health Defense. Other claims that vaccines cause autism cite a debunked study, commonly referred to as the “Mawson Study”, which is not about race-related risk but reports an alleged connection between vaccines and autism. However, the study was not published in a peer-reviewed journal, was funded by an anti-vaccine group, and authored by researchers with a history of publishing vaccine-related research that was later retracted. This belief, alongside other unfounded concerns about vaccine safety, may be fueling the decline in childhood vaccination rates, which has led to outbreaks of vaccine-preventable diseases like measles.
Polling Insights:
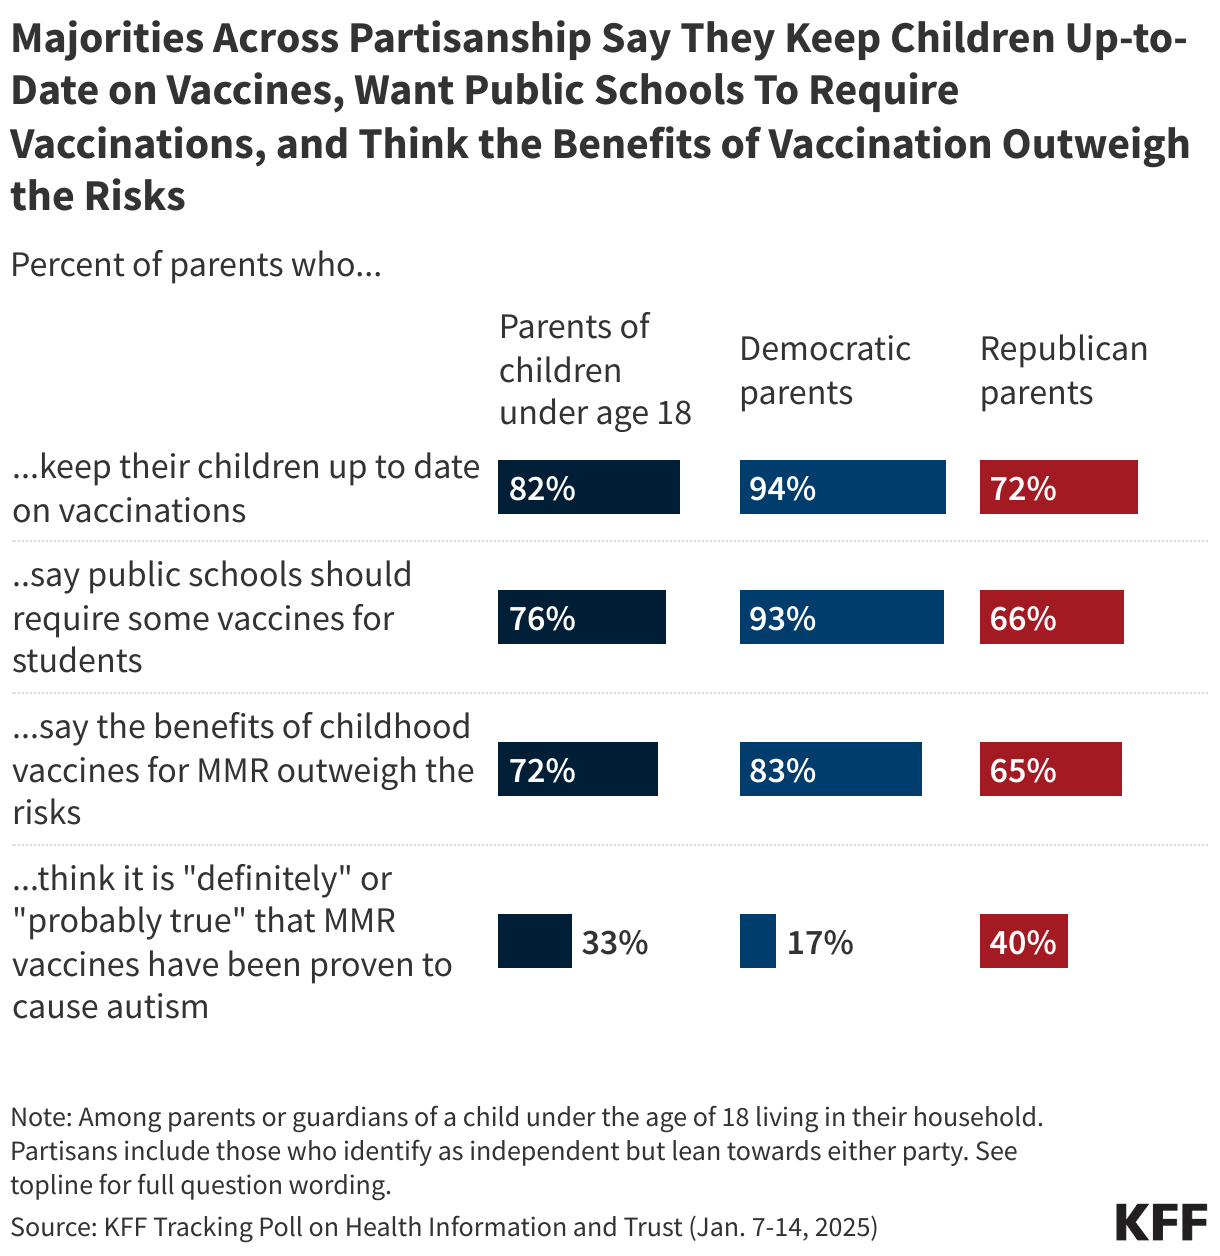
KFF’s January 2025 Tracking Poll on Health Information and Trust found that majorities of parents say they keep their children up to date on vaccinations (82%), support public schools requiring vaccines for students (76%), and believe the benefits of childhood MMR vaccines outweigh the risks (72%). While majorities of parents across partisanship express each of these views, the shares answering in the pro-vaccine direction are notably larger among parents who identify as Democrats or lean that way, compared to their Republican and Republican-leaning counterparts.
The Field of Health Communication Explores Moving Beyond Fact-Checking to Foster Dialogue
Blue Images / Getty Images
Some health communication professionals are shifting their approach to promoting accurate health beliefs, moving beyond reactive fact-checking to open conversations that help people weigh benefits and risks more accurately. One emerging strategy, known as bypassing, focuses on presenting relevant facts rather than directly debunking misinformation. For example, instead of stating that “aluminum in vaccines causes bone problems” is false, bypassing highlights that “the aluminum in vaccines enhances their effectiveness in preventing disease.” Research suggests this approach may be more effective at changing personal attitudes, though its impact on policy views is less clear. Fostering open conversations may also allow health professionals to share nuances of scientific information in an accessible manner. For topics like vaccines, simply emphasizing their safety and effectiveness may not be enough as it fails to address public concerns and skepticism. Members of the Council for Quality Health Communication argue that the phrase “safe and effective” should be replaced with a more nuanced, empathetic approach that explains vaccine benefits in relatable terms, acknowledges uncertainties, and engages with people in ways that resonate with their real-world experiences and values.
New Public Health Journal Co-Founded by Nominee for NIH Director Questions Widely Accepted Science
Mordolff / Getty Images
A new scientific journal, the Journal of the Academy of Public Health, has drawn attention for its potential bias and questioning of scientific consensus. The journal has ties to the news site RealClearPolitics and was co-founded by Dr. Jay Bhattacharya, President Trump’s nominee for NIH director. Another Trump nominee, Dr. Marty Makary, nominee for FDA commissioner serves on the editorial board, although both Makary and Bhattacharya are currently listed as “on leave” from the journal. Its first edition included articles that questioned COVID-19 vaccine trials, suggested a link between DTaP vaccines and childhood asthma, and argued school mask mandates were ineffective. Co-founder Dr. Martin Kulldorff, known for opposing COVID-19 lockdowns and child vaccination, also published a paper claiming that established journals suppress dissenting viewpoints and fail to address public health biases. While the journal’s critiques may appeal to those questioning the prevailing public health consensus, some question its objectivity. The journal is open-access and peer reviewed, but it operates on a membership model where only invited members of the Academy of Public Health can submit articles, which may raise additional questions about how this exclusivity may impact credibility. However, the journal’s divergence from scientific consensus may increase its credibility among Republicans who are less likely than Democrats to list scientific research studies among their top trusted sources for public health information, according to the Rollins-Gallup Public Health Priorities Survey.
False Beliefs About Heart Attack Treatment and Prevention Persist as Heart Disease Remains Leading Cause of Death
Peter Dazeley / Getty Images
Heart disease is the leading cause of death in the U.S. and ongoing research continues to examine new factors like COVID-19 that influence cardiovascular risk. However, misinformation about heart attack treatment and prevention persists. One misconception that has re-emerged is that coughing during a heart attack, sometimes called ‘cough CPR,’ can help maintain blood flow to the heart. Health experts have debunked this, explaining that CPR is used for cardiac arrest, not heart attacks, and that by the time CPR is necessary, a person is typically unable to cough. Additionally, coughing cannot restart a heart that has stopped beating. The confusion likely stems from the use of coughing as a temporary measure during certain arrhythmias in monitored medical settings, leading to the misconception that it can improve heart function during a heart attack and potentially delaying care.
Outdated guidelines may also contribute to misconceptions about heart attack prevention. Daily aspirin use was once widely recommended for healthy adults to reduce heart attack and stroke risk, however, guidelines from the American College of Cardiology and the American Heart Association (AHA) issued in 2019 only recommend aspirin as an option among adults ages 40-70 who have elevated risk of cardiovascular disease. The guidelines also advise against routine aspirin use for healthy adults over 70 due to the risk of gastrointestinal bleeding. Despite this, a survey by the Annenberg Public Policy Center found that this misconception persists, particularly among older adults. The survey found that 18% of people without a personal or family history of heart attack or stroke reported regularly taking low-dose aspirin, and nearly 43% believed its benefits outweigh the risks. Those ages 60 and over were especially likely to take aspirin daily for prevention and to believe in its benefits, despite updated guidance.
AI & Emerging Technology
Gaps in Research Standards for AI Chatbots in Healthcare
Laurence Dutton / Getty Images
As artificial intelligence (AI) continues to shape healthcare, large language models (LLMs) are increasingly consulted for medical advice. However, concerns persist regarding their accuracy, transparency, and safety. A systematic review of 137 studies evaluated the reporting quality of research assessing LLMs’ ability to offer health guidance. Findings revealed that nearly all studies examined closed-source models without disclosing sufficient details about the LLM version or parameters. Most studies relied on subjective measures to assess chatbot performance, and fewer than a third considered ethical, regulatory, or patient safety implications. The variability in study design and reporting highlights a gap in standardized assessment frameworks which may be useful for conducting reliable evaluations of LLMs used in healthcare.
About The Health Information and Trust Initiative: the Health Information and Trust Initiative is a KFF program aimed at tracking health misinformation in the U.S., analyzing its impact on the American people, and mobilizing media to address the problem. Our goal is to be of service to everyone working on health misinformation, strengthen efforts to counter misinformation, and build trust.
The Monitor is a report from KFF’s Health Information and Trust initiative that focuses on recent developments in health information. It’s free and published twice a month.
Support for the Health Information and Trust initiative is provided by the Robert Wood Johnson Foundation (RWJF). The views expressed do not necessarily reflect the views of RWJF and KFF maintains full editorial control over all of its policy analysis, polling, and journalism activities. The Public Good Projects (PGP) provides media monitoring data KFF uses in producing the Monitor.
Managed care is the dominant delivery system for people enrolled in Medicaid. The latest national Medicaid managed care enrollment data (from 2022) show 75% of Medicaid beneficiaries were enrolled in comprehensive managed care organizations (MCOs). While managed care is the dominant Medicaid delivery system, states decide which populations and services to include in managed care arrangements, which leads to considerable variation across states. Additionally, while state requirements for Medicaid managed care plans can be tracked, plans have flexibility in certain areas, including in setting provider payment rates, and plans may choose to offer additional benefits beyond those required by the state.
Early in 2025, there are many factors at play that could have implications for Medicaid managed care plans and the people they serve. At the state level, states and plans have faced considerable rate setting uncertainty after millions of people were disenrolled during the unwinding of the pandemic-era Medicaid continuous enrollment provision. Some firms report that current capitation rates do not align with higher member risk and utilization patterns. Many states have sought federal approval to adjust rates to address these changes amid shifts and uncertainty in state fiscal conditions. At the federal level, talks in Congress about cutting federal Medicaid spending could have implications for coverage as well as plans and providers. Finally, major Medicaid regulations designed to promote quality of care and advance access to care for Medicaid enrollees finalized under the Biden administration could be repealed by Congress or delayed or rewritten by the Trump administration. In this context, this brief describes 10 themes related to the use of comprehensive, risk-based managed care in the Medicaid program.
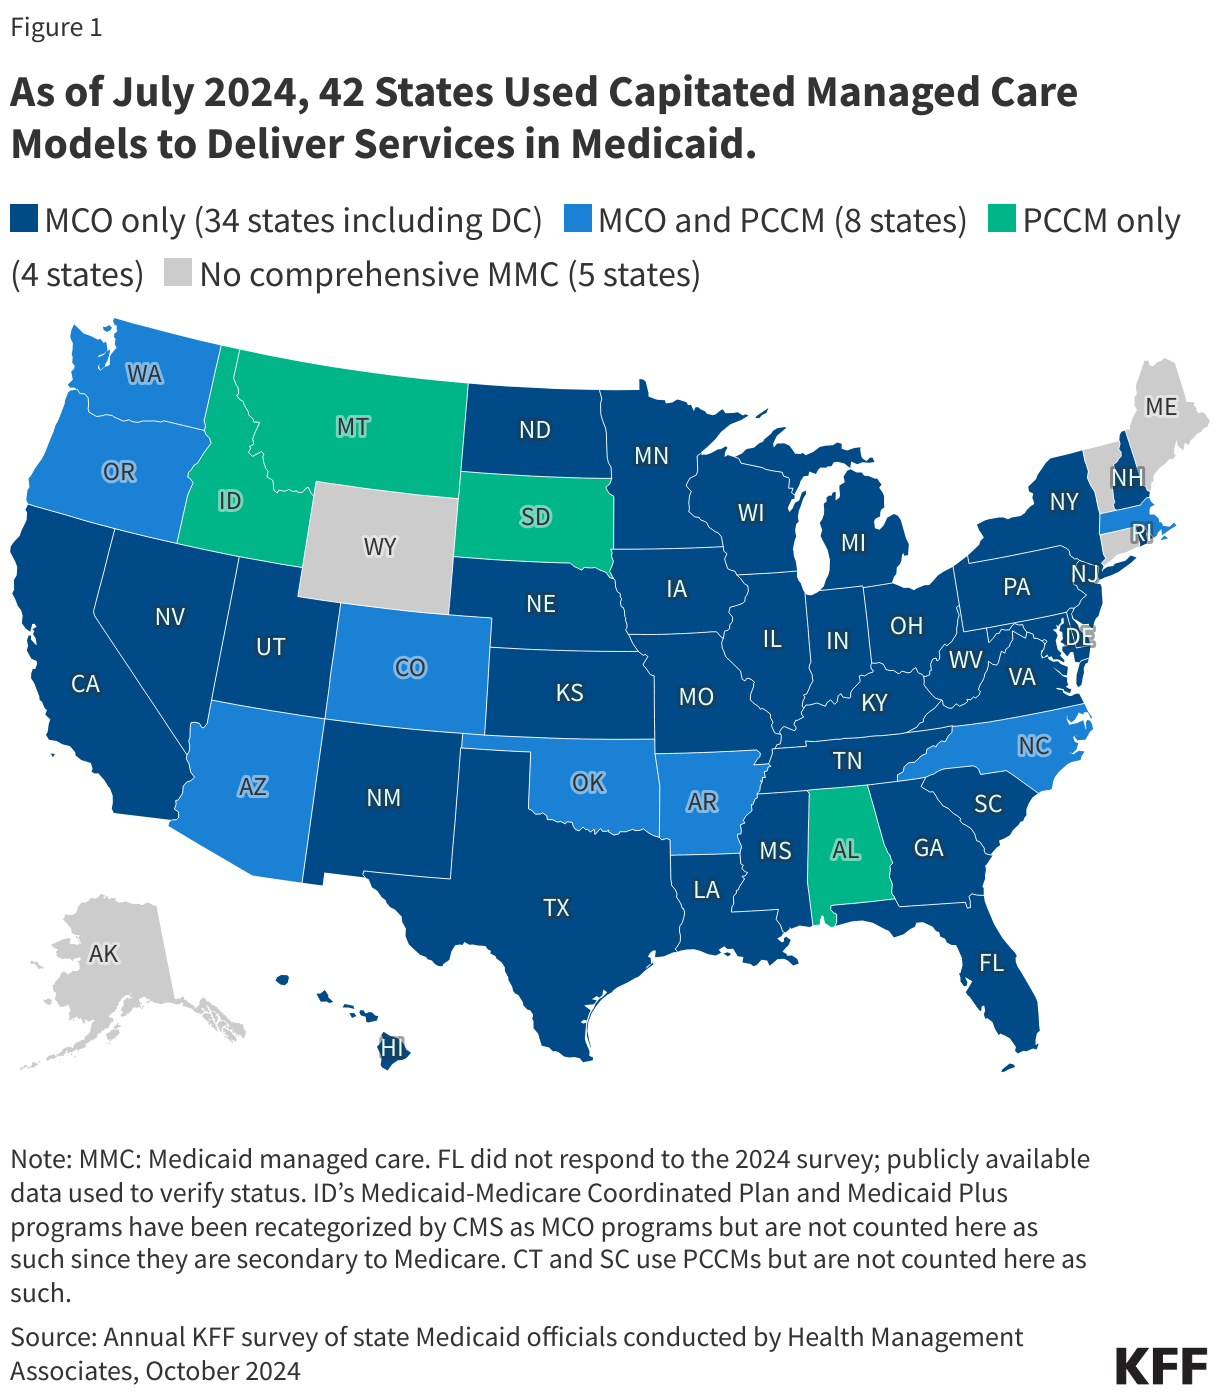
1. Today, capitated managed care is the dominant way in which states deliver services to Medicaid enrollees.
States design and administer their own Medicaid programs within federal rules. States determine how they will deliver and pay for care for Medicaid beneficiaries. Nearly all states have some form of managed care in place – comprehensive risk-based managed care and/or primary care case management (PCCM) programs.1,2 As of July 2024, 42 states (including DC) contract with comprehensive, risk-based managed care plans to provide care to at least some of their Medicaid beneficiaries (Figure 1). Oklahoma is the latest state to be included in this count, having implemented capitated, comprehensive Medicaid managed care (for most children and adults) on April 1, 2024. Medicaid MCOs provide comprehensive acute care (i.e., most physician and hospital services) and, in some cases, long-term care to Medicaid beneficiaries and are paid a set per member per month payment for these services. For more than three decades, states have increased their reliance on managed care delivery systems with the aim of improving access to certain services, enhancing care coordination and management, and making future costs more predictable. While the shift to MCOs has increased budget predictability for states, the evidence about the impact of managed care on access to care and costs is both limited and mixed.3,4,5
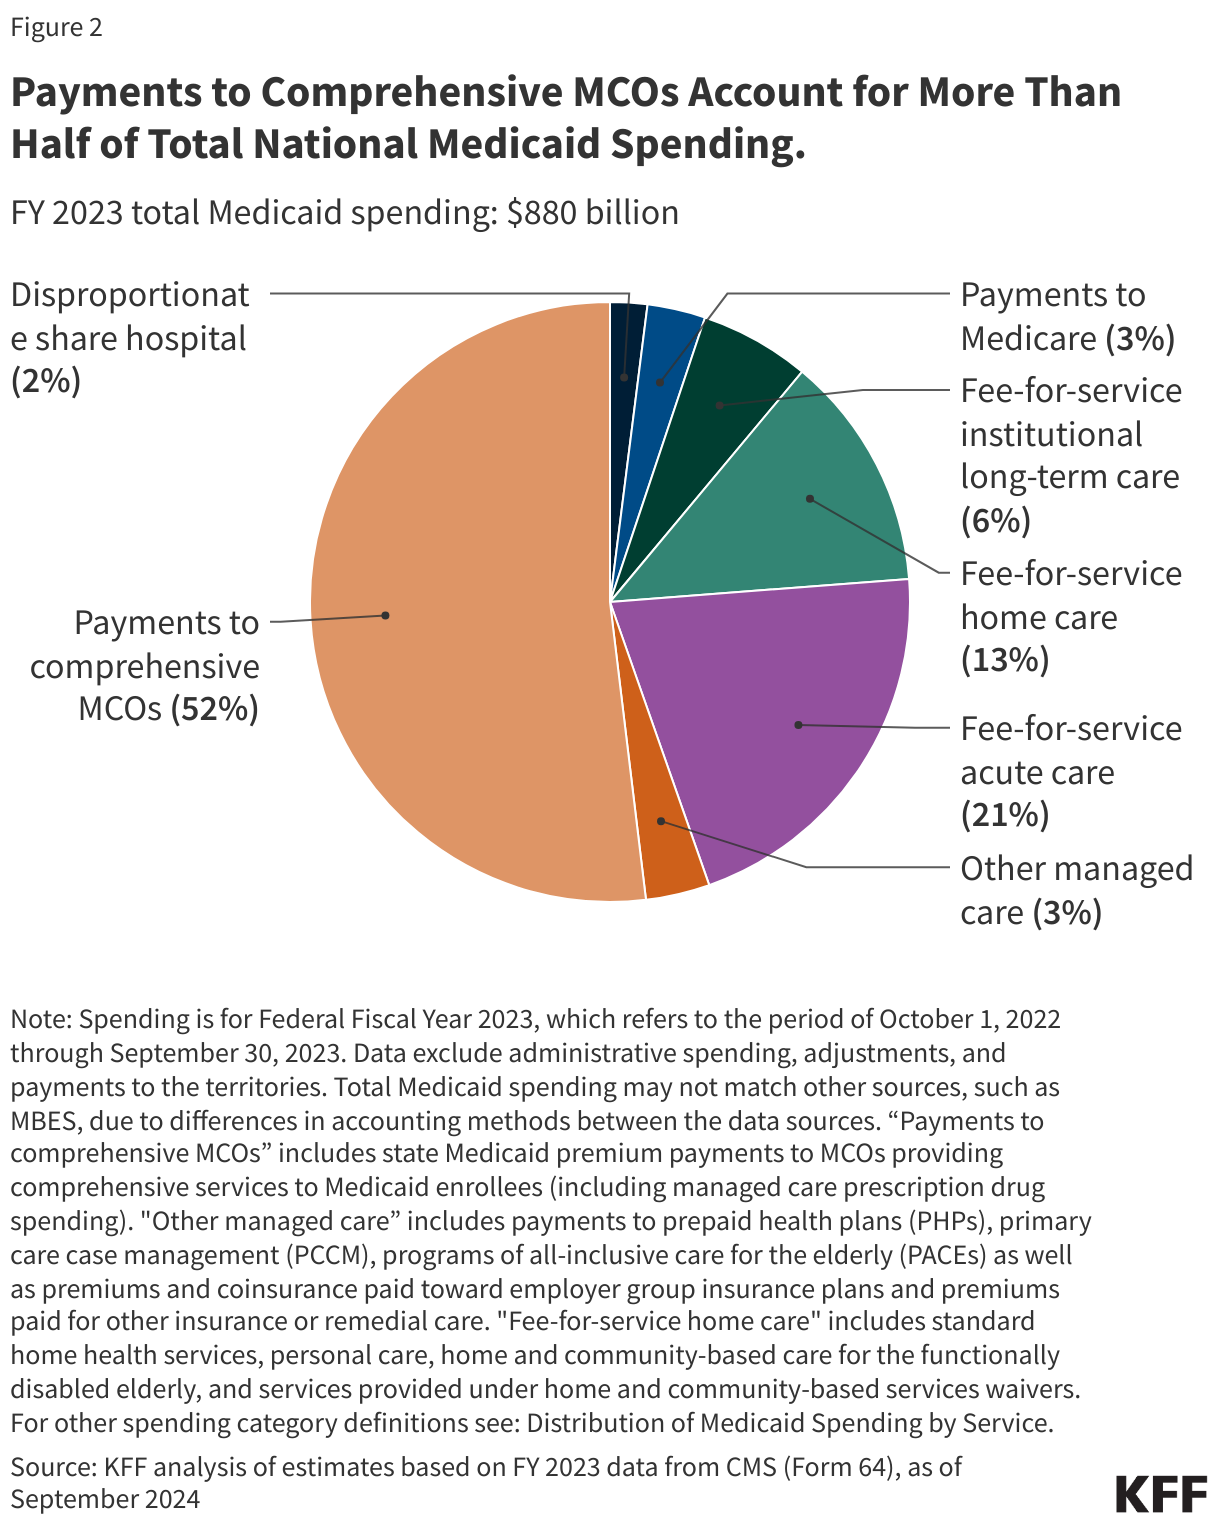
2. In FY 2023, payments to comprehensive risk-based MCOs accounted for over half of Medicaid spending.
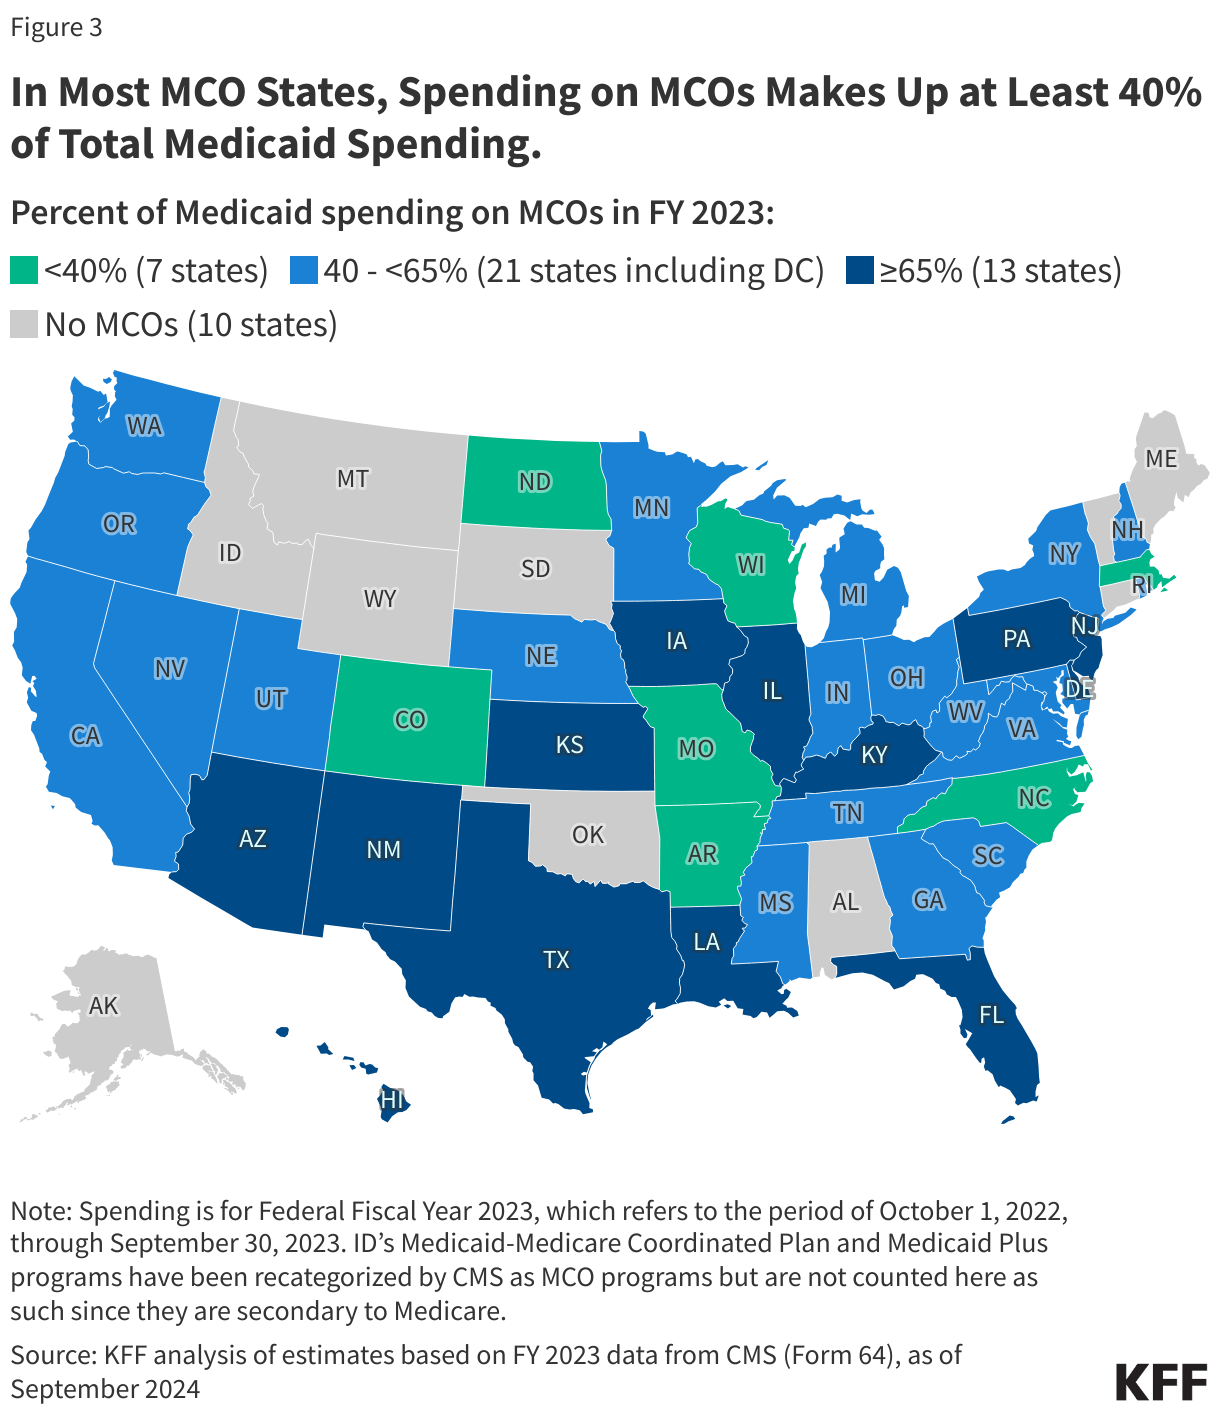
In FY 2023, state and federal spending on Medicaid services totaled over $880 billion. Payments made to MCOs accounted for about 52% of total Medicaid spending (Figure 2), unchanged from the previous fiscal year. The share of Medicaid spending on MCOs varies by state, but over three-quarters of MCO states directed at least 40% of total Medicaid dollars to payments to MCOs (Figure 3). State-to-state variation reflects many factors, including the proportion of the state Medicaid population enrolled in MCOs, the health profile of the Medicaid population, whether high-risk/high-cost beneficiaries (e.g., people with disabilities, dual eligible beneficiaries) are included in or excluded from MCO enrollment, and whether long-term care services are included in MCO contracts. As states expand Medicaid managed care to include higher-need, higher-cost beneficiaries, expensive long-term care, and adults newly eligible for Medicaid under the ACA, the share of Medicaid dollars going to MCOs could continue to increase.
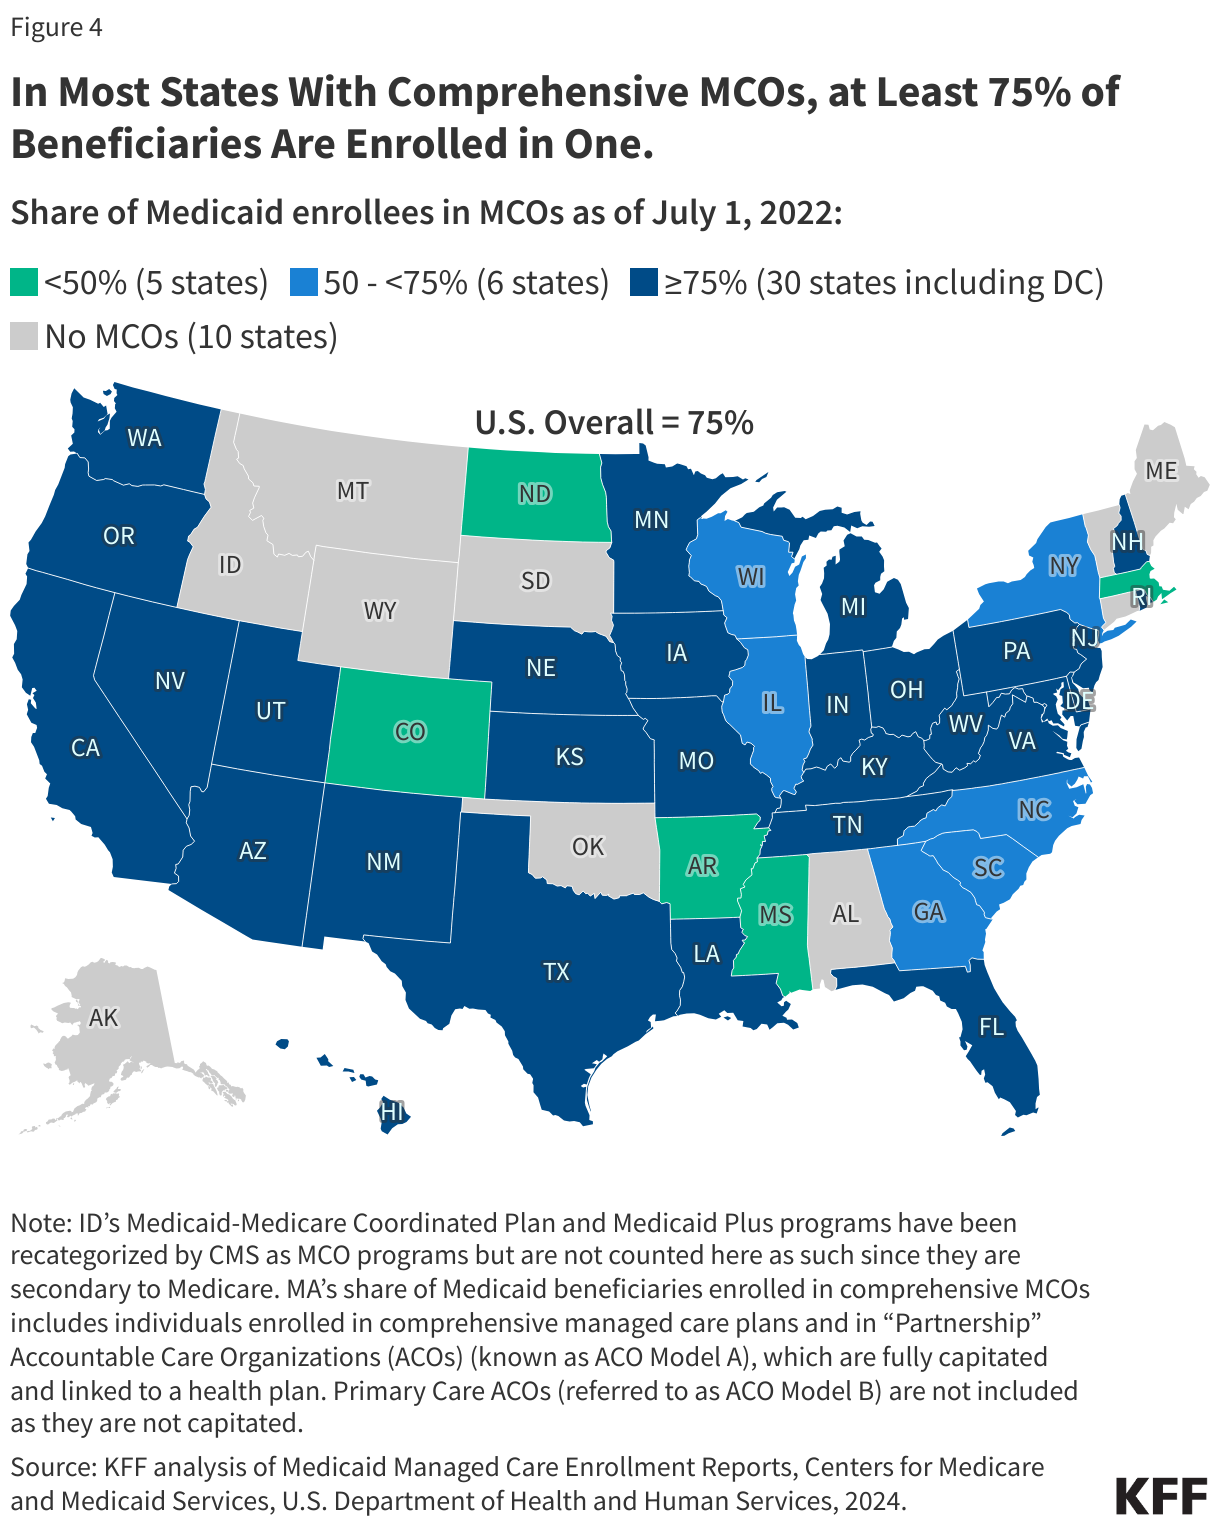
3. Three-quarters (75%) of all Medicaid beneficiaries received their care through comprehensive risk-based MCOs.
As of July 2022, nearly 72 million Medicaid enrollees received their care through risk-based MCOs. Thirty MCO states covered at least 75% of Medicaid beneficiaries in MCOs (Figure 4).
Although 2022 data are the most current national data available, enrollment in Medicaid overall grew substantially during the COVID public health emergency when states paused disenrollments, resulting in growth in MCO enrollment as well. At the start of the “unwinding” period, in April 2023, Medicaid enrollment (overall) peaked at 94.5 million, an increase of 23 million or 32% from before the pandemic. Despite millions of disenrollments during the unwinding, nationally, nearly 8 million more people were enrolled in Medicaid/CHIP in October 2024 than in February 2020 (pre-pandemic).
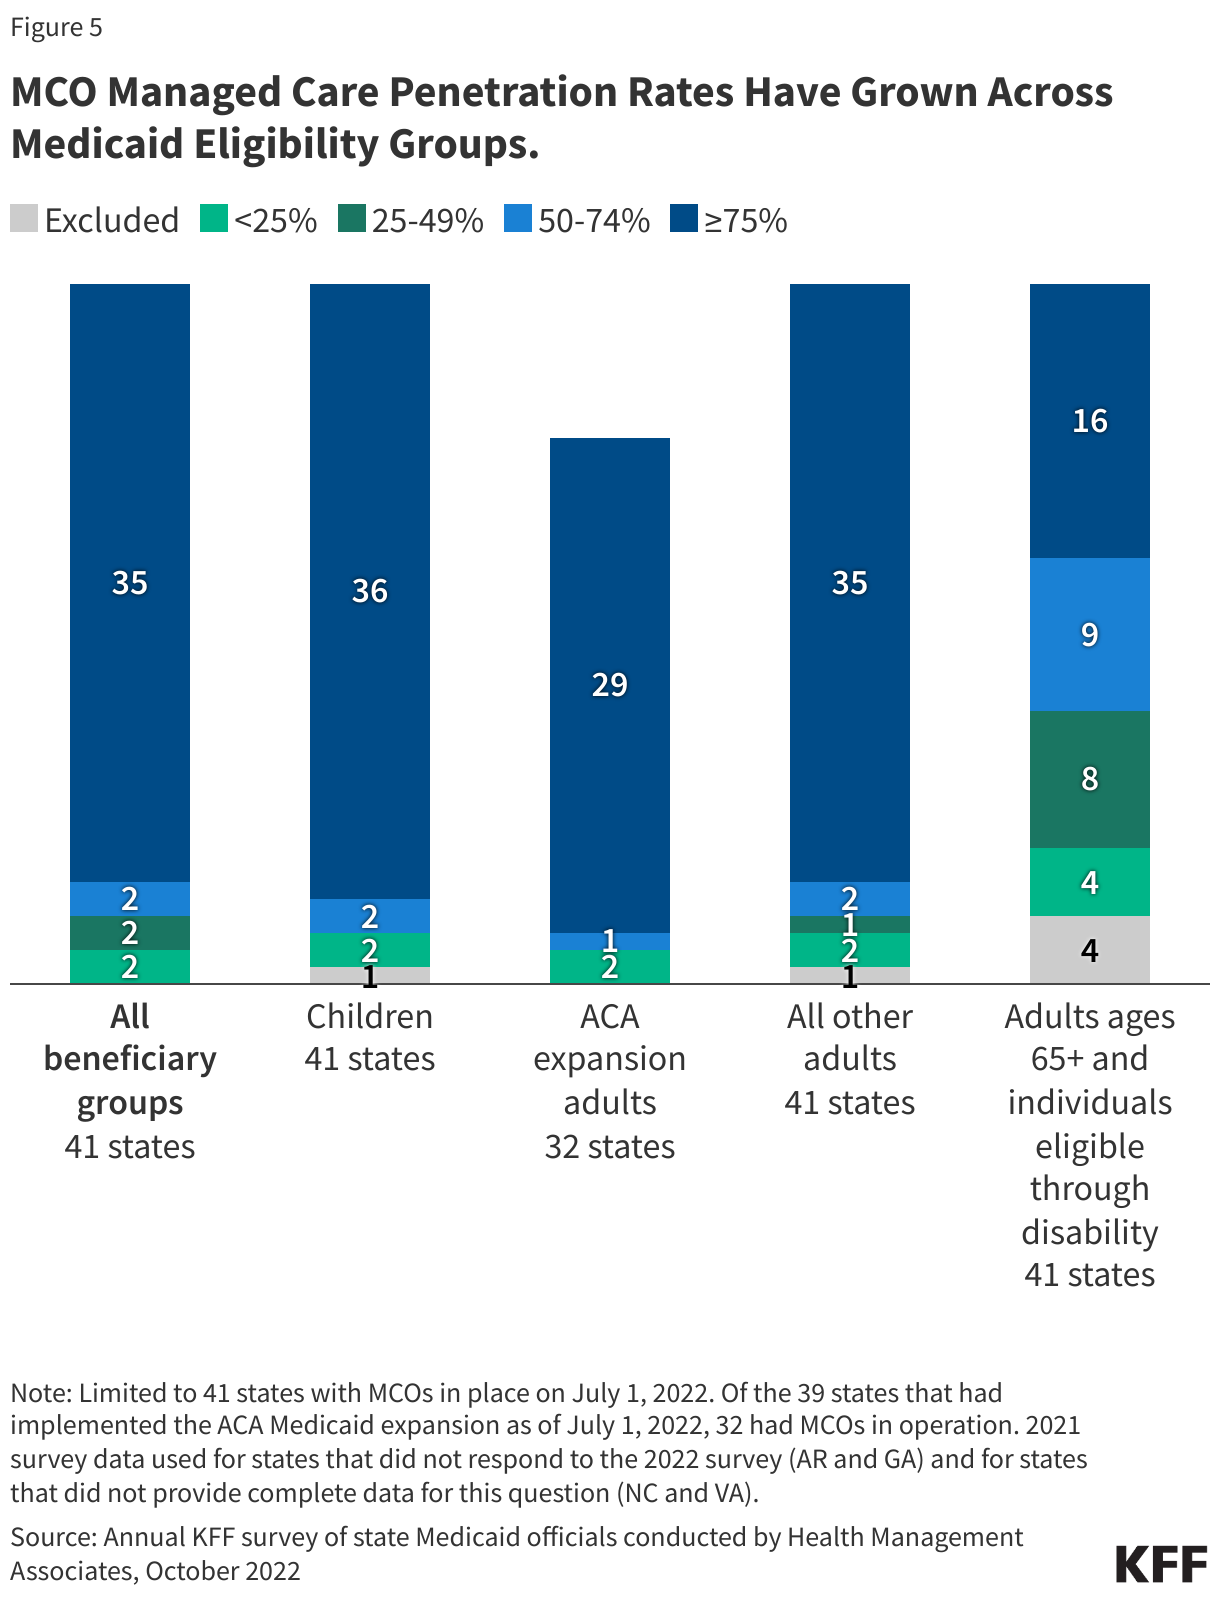
4. Children and adults are groups most likely to be enrolled in MCOs; however, states are increasingly including enrollees with complex needs in MCOs.
As of July 2022, 36 MCO states reported covering 75% or more of all children through MCOs (Figure 5). Of the 39 states that had implemented the ACA Medicaid expansion as of July 2022, 32 states were using MCOs to cover newly eligible adults and most covered more than 75% of beneficiaries in this group through MCOs. Thirty-five MCO states reported covering 75% or more of low-income adults in pre-ACA expansion groups (e.g., parents, pregnant women) through MCOs. Fewer MCO states reported covering 75% or more adults ages 65+ and people eligible through disability. Although this group is still less likely to be enrolled in MCOs than children and adults, over time, states have been moving to include adults ages 65+ and people eligible through disability in MCOs.
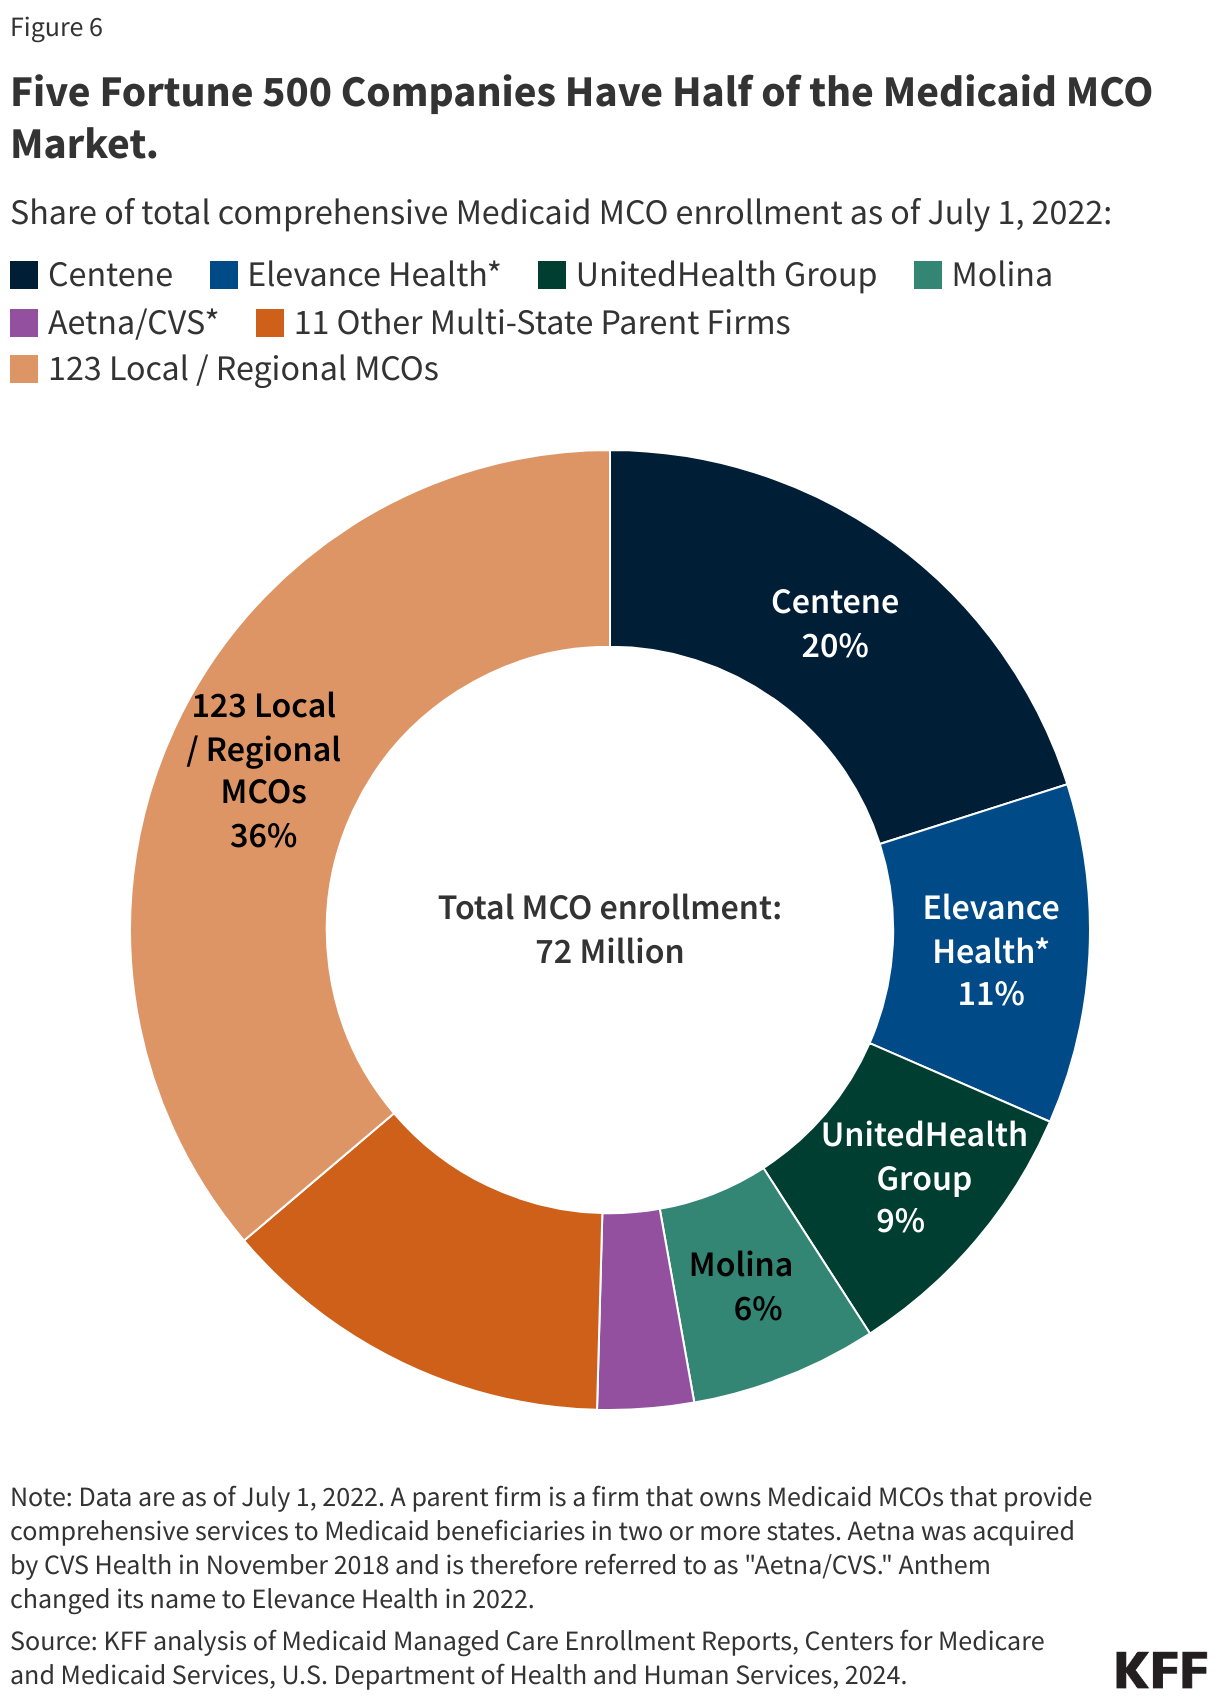
5. Five publicly traded firms account for half of MCO enrollment.
States contracted with a total of 282 Medicaid MCOs as of July 2022. MCOs represent a mix of private for-profit, private non-profit, and government plans. As of July 2022, a total of 16 firms operated Medicaid MCOs in two or more states (called “parent” firms), and these firms accounted for over 63% of enrollment in 2022 (Figure 6). Of the 16 parent firms, six are publicly traded, for-profit firms while the remaining ten are non-profit companies. Five firms – Centene, UnitedHealth Group, Elevance (formerly Anthem), Molina, and Aetna/CVS – account for 50% of all Medicaid MCO enrollment (Figure 6). All five are publicly traded companies ranked in the Fortune 500, and four are ranked in the top 100.
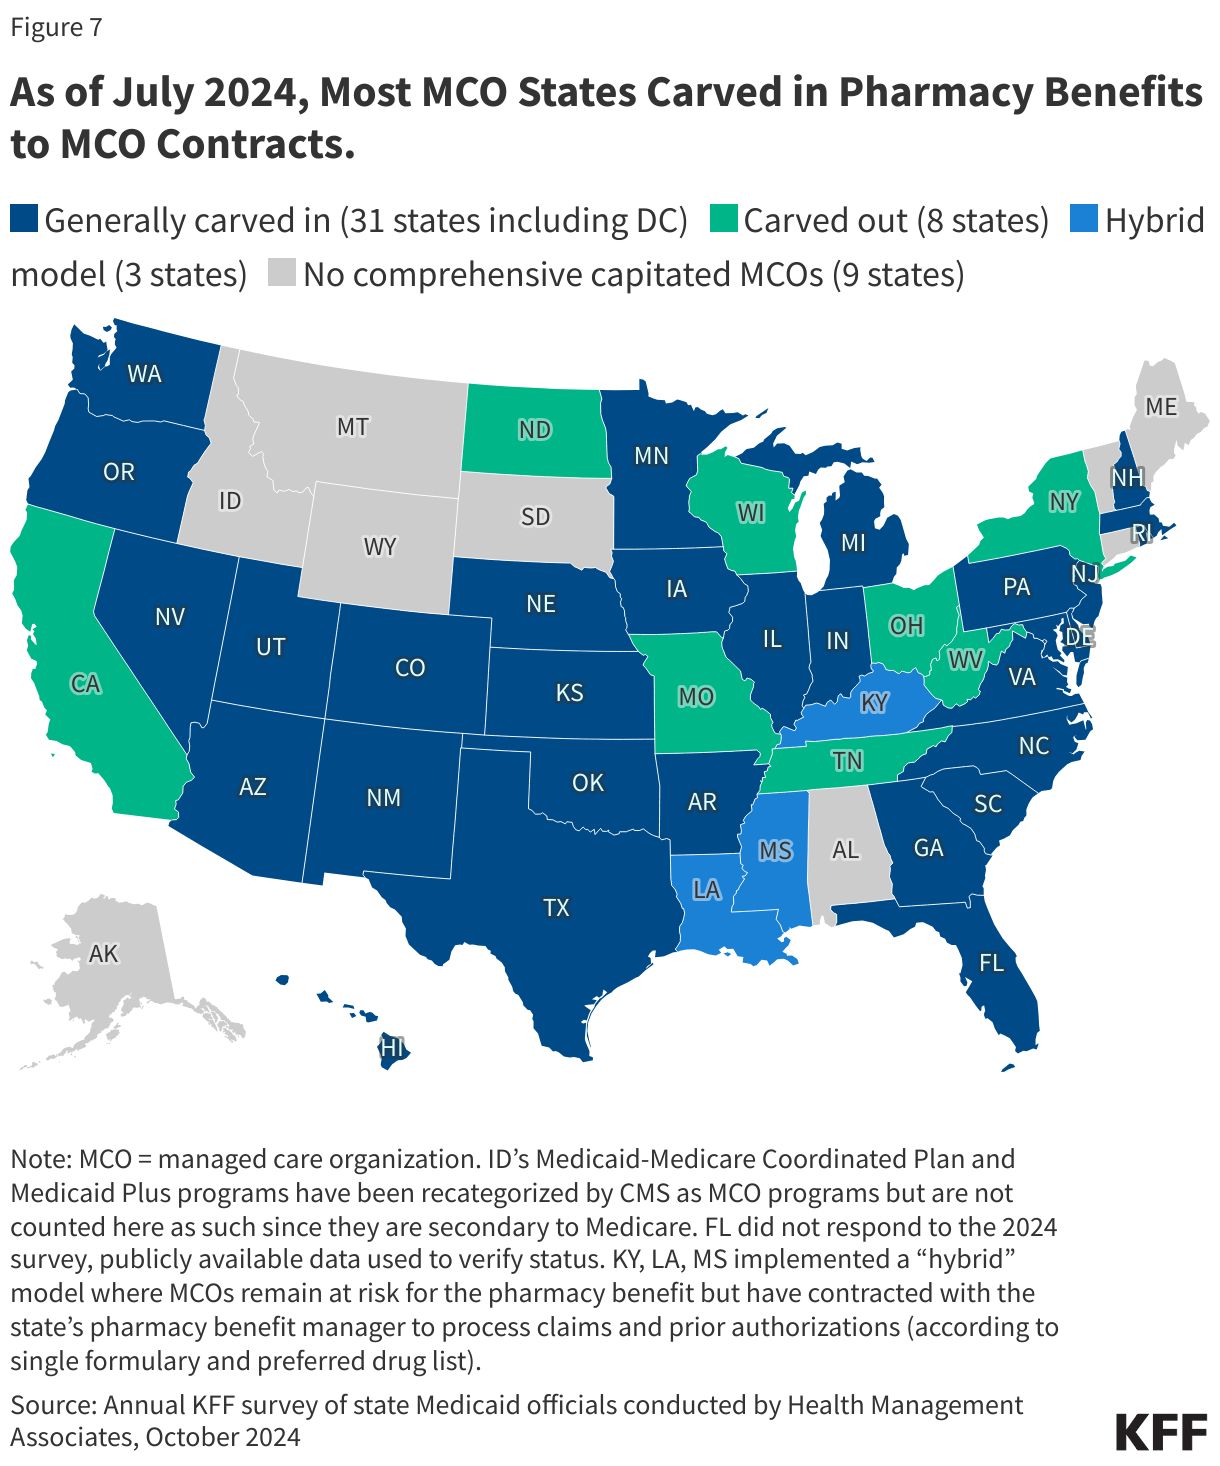
6. States make decisions about which services to carve in and out of MCO contracts.
Although MCOs provide comprehensive services to beneficiaries, states may carve specific services out of MCO contracts to fee-for-service systems or limited benefit plans. Services frequently carved out include behavioral health, pharmacy, dental, and long-term care services. However, there has been significant movement across states to carve these services into MCO contracts. While the vast majority of states that contract with MCOs report that the pharmacy benefit is carved into managed care (31 of 42), eight states report that pharmacy benefits are carved out of MCO contracts as of July 2024 (Figure 7). An additional three states (Kentucky, Louisiana, and Mississippi) now contract with a single PBM for the managed care population instead of implementing a traditional carve-out of pharmacy from managed care. (Under this “hybrid” model, MCOs remain at risk for the pharmacy benefit but must contract with the state’s pharmacy benefit manager to process pharmacy claims and pharmacy prior authorizations according to a single formulary and preferred drug list.)
7. Each year, states develop MCO capitation rates that must be actuarially sound and may include risk mitigation strategies.
States pay Medicaid managed care organizations a set per member per month payment for the Medicaid services specified in their contracts. While plans set rates in the commercial and Medicare Advantage markets, Medicaid managed care rates are developed by states and their actuaries and reviewed and approved by CMS. Under federal law, payments to Medicaid MCOs must be actuarially sound.Actuarial soundness means that “the capitation rates are projected to provide for all reasonable, appropriate, and attainable costs that are required under the terms of the contract and for the operation of the managed care plan for the time period and the population covered under the terms of the contract.” Unlike fee-for-service (FFS), capitation provides upfront fixed payments to plans for expected utilization of covered services, administrative costs, and profit. Plan rates are usually set for a 12-month rating period. States may use a variety of mechanisms to adjust plan risk, incentivize plan performance, and ensure payments are not too high or too low, including risk sharing arrangements, risk and acuity adjustments, medical loss ratios (MLRs, which reflect the proportion of total capitation payments received by an MCO spent on clinical services and quality improvement), or incentive and withhold arrangements.
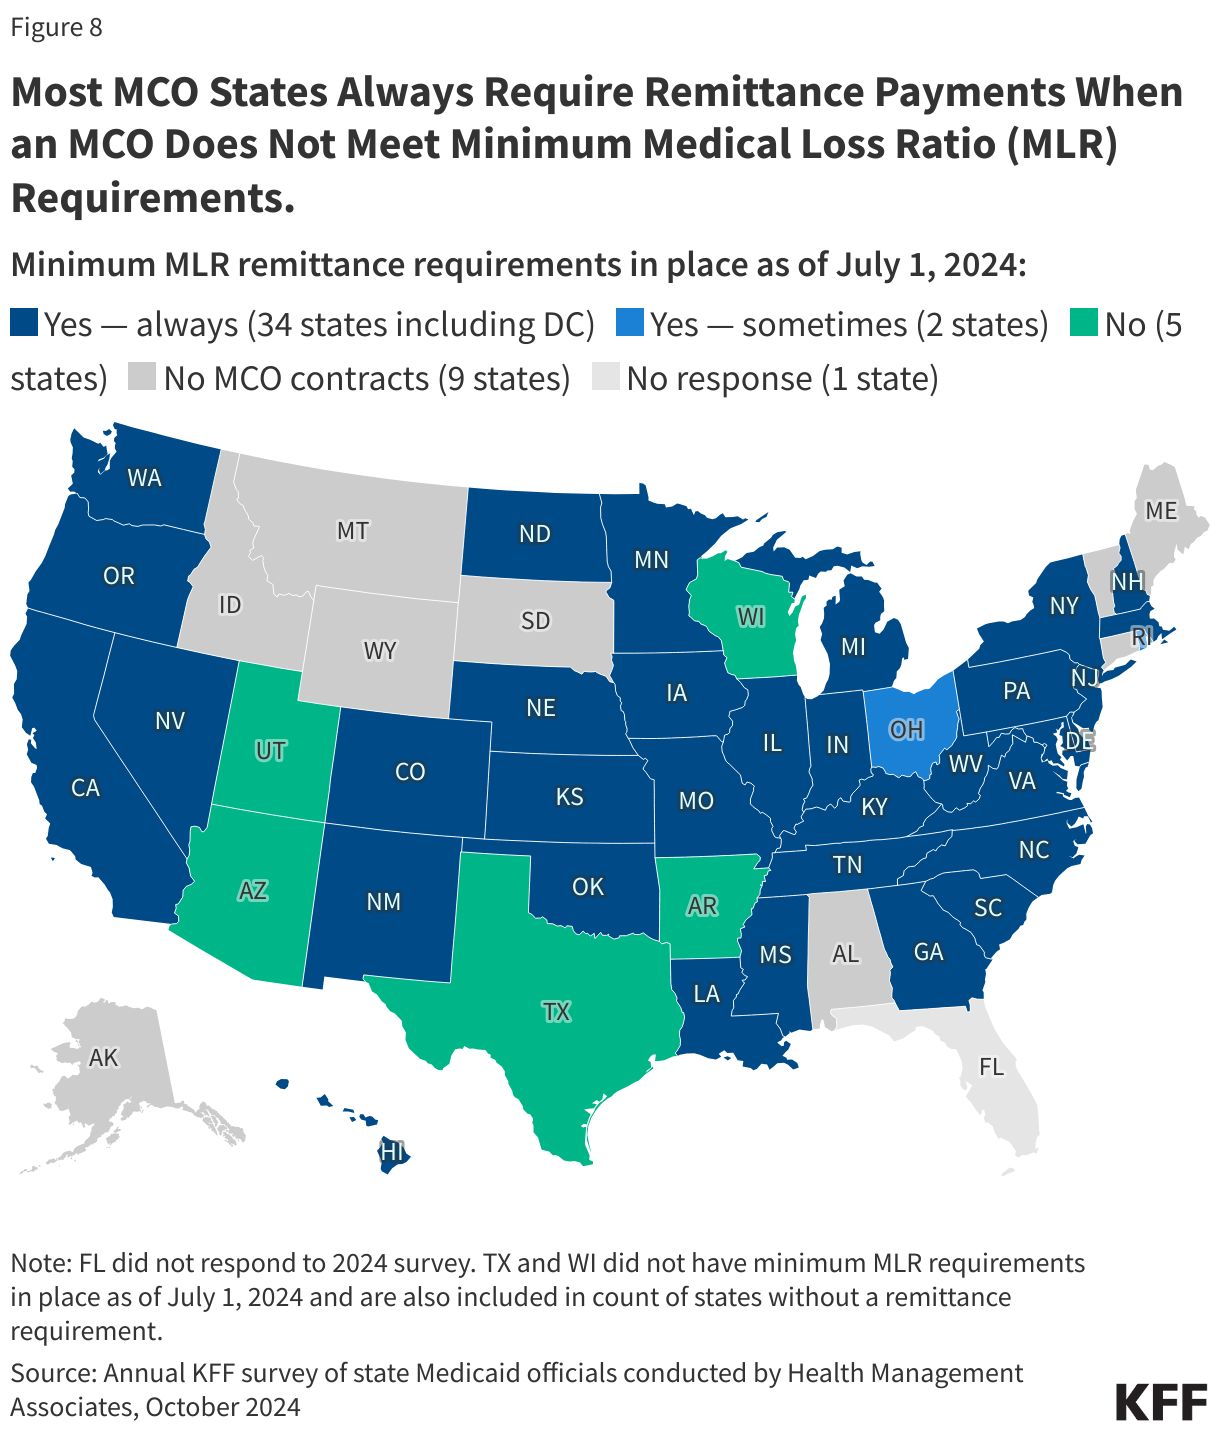
To limit the amount that plans can spend on administration and keep as profit, states are required to develop capitation rates for Medicaid to achieve an MLR of at least 85% in the rate year; 6 however, there is no federal requirement for Medicaid plans to pay remittances to the state if they fail to meet the MLR standard.7 As of July 2024, 34 MCO states reported they always require remittance payments when an MCO does not meet state minimum MLR requirements, while two states indicated they sometimes require MCOs to pay remittances (Figure 8).
8. In 2024, CMS finalized rules to strengthen access standards, but the future of the rules is uncertain.
The Biden administration finalized major Medicaid regulations designed to promote quality of care and advance access to care for Medicaid enrollees. The 2024 Managed Care rule addresses Medicaid managed care access, financing, and quality, including strengthening standards for timely access to care (e.g., through the establishment of national maximum wait time standards for certain “routine” appointments) and states’ monitoring and enforcement efforts. These rules are complex and are set to be implemented over several years. However, Congress may seek to overturn these rules, or the Trump administration could delay implementation or issue new regulations that would undo them. During the first Trump administration, CMS took action to change Medicaid managed care rules, including relaxing rules around network adequacy and beneficiary protections.
States are generally prohibited from contractually directing how a managed care plan pays its providers.8 Subject to CMS approval, however, states may implement certain “state directed payments” (SDPs) that require managed care plans to adopt minimum or maximum provider payment fee schedules, provide uniform dollar or percentage increases to providers (above base payment rates), or implement value-based provider (VBP) payment arrangements.9 In creating state directed payments (in 2016), CMS aimed to help states ensure access to adequate provider networks and to increase use of VBP arrangements. Many states that contract with MCOs use SDPs to make uniform rate increases that are like FFS supplemental payments. State directed payments must meet federal requirements (e.g., must be tied to utilization and delivery of services, be distributed equally to specified providers, and not be conditioned on participation in intergovernmental transfer (IGT) agreements).10 The managed care rules finalized in 2024 permit states to pay hospitals and nursing facilities at the average commercial payment rate (ACR) when using directed payments (higher than the Medicare payment ceiling used for other Medicaid FFS supplemental payments). The 2024 rules also tightened SDP requirements to improve oversight, evaluation, and transparency (e.g., states will be required to report provider level directed payment data) and to ensure state directed payments are tied to actual utilization. Recent reports indicate state directed payments have been a major driver of Medicaid expenditure growth in recent years, and CBO Medicaid projections for 2025-2034 attribute further increases in SDPs (partially tied to the changes in rule) as a factor increasing spending.
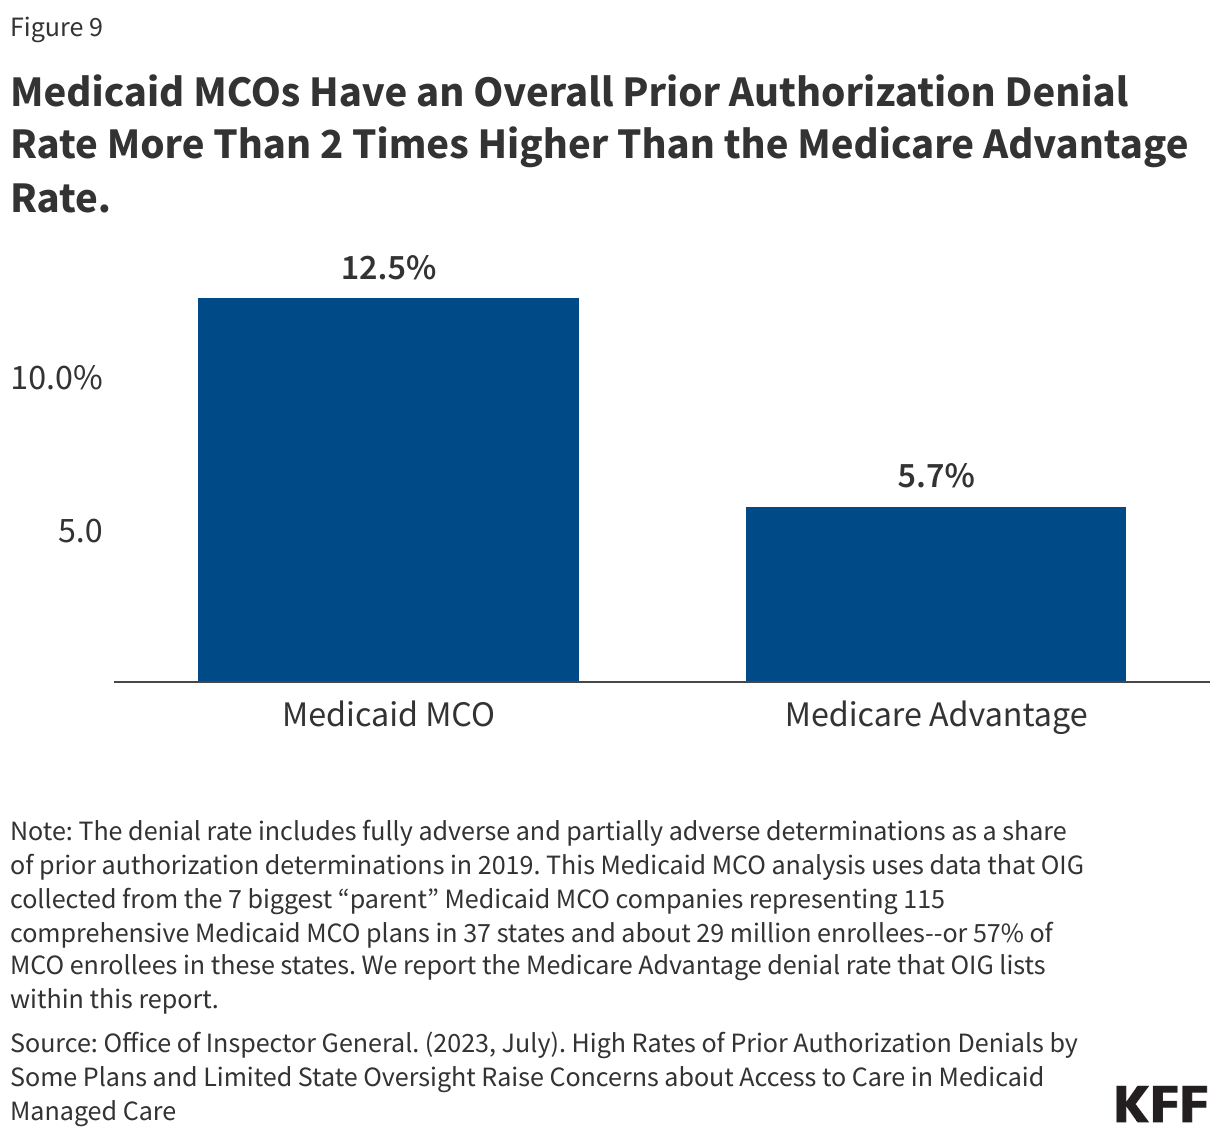
In 2024, CMS also finalized a rule focused on improving the prior authorization process including reducing approval wait times and improving transparency. A 2023 KFF survey of consumer experiences with health insurance found that about one in five Medicaid enrollees say they’ve had issues with prior authorization—higher than for most other types of insurance. A July 2023 OIG report found that Medicaid MCOs had an overall prior authorization denial rate of 12.5%–more than 2 times higher than the Medicare Advantage rate (Figure 9), raising concerns about prior authorization and access in Medicaid managed care. OIG recommendations (to CMS) include strengthening state monitoring of denials. Recent MACPAC analysis of denials and appeals in Medicaid managed care resulted in the inclusion of seven recommendations in the March 2024 Report to Congress focused on improving the appeals process and enhancing monitoring and oversight of MCOs.
9. States link financial incentives to quality measures and use contract requirements to advance priorities, including addressing social determinants of health.
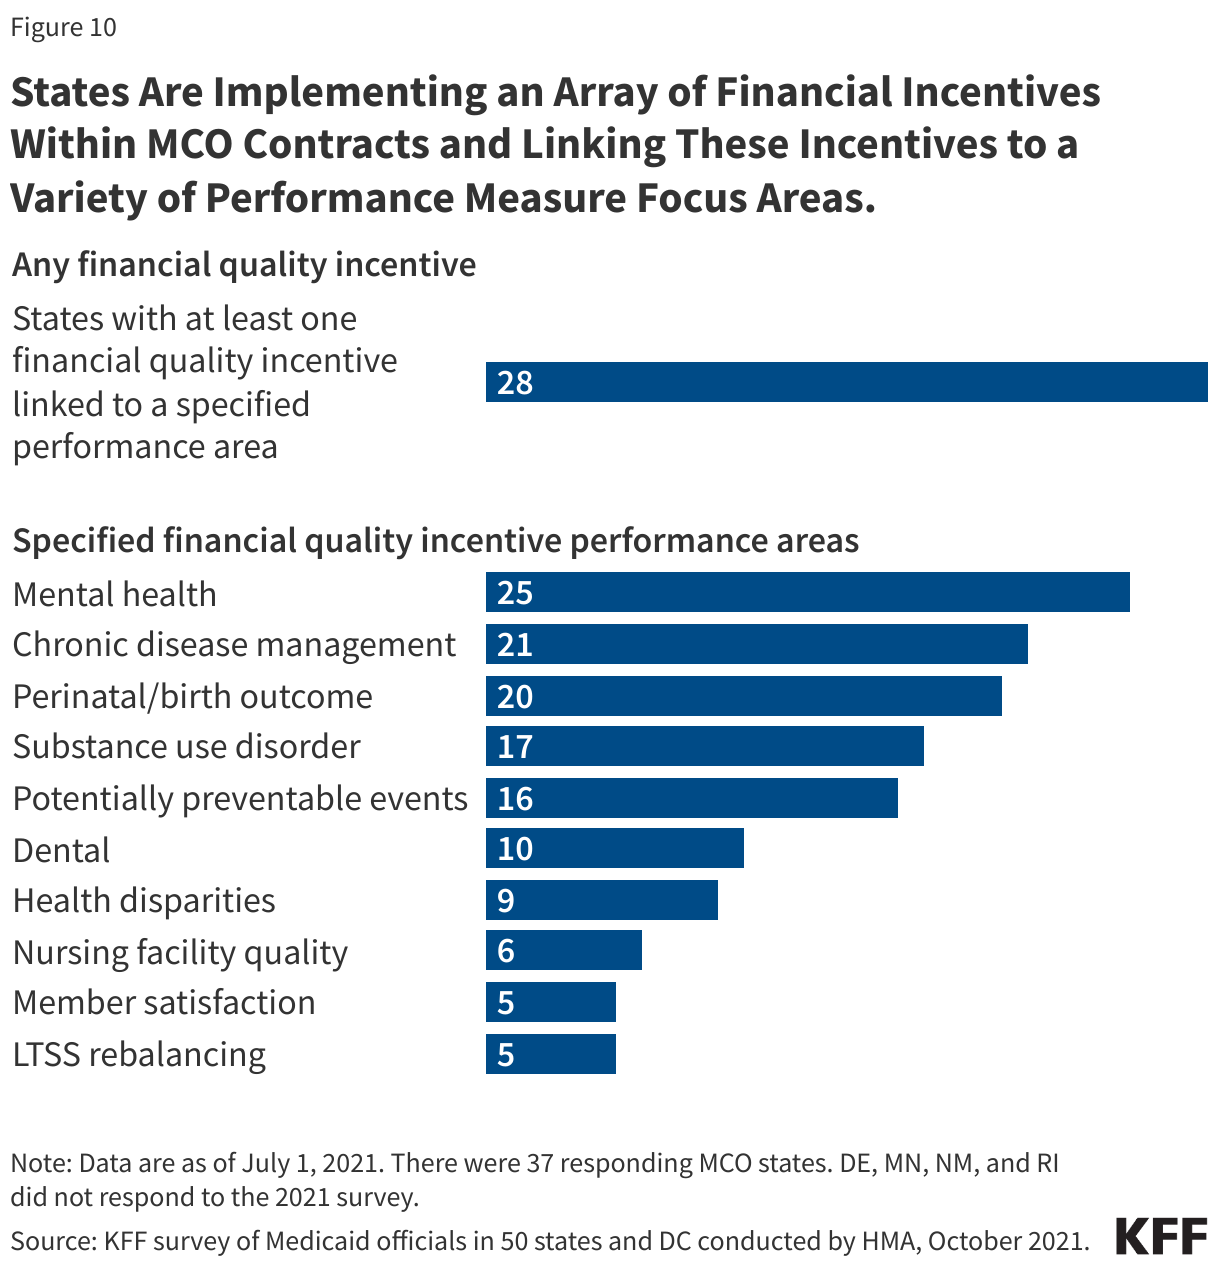
States incorporate quality metrics into the ongoing monitoring of their programs, including linking financial incentives like performance bonuses or penalties, capitation withholds, or value-based state directed payments to quality measures. Over three quarters of MCO states reported using at least one financial incentive to promote quality of care as of July 2021 (Figure 10). Financial incentive performance areas most frequently targeted by MCO states include behavioral health, chronic disease management, and perinatal/birth outcomes. Despite activity in this area, detailed performance information at the plan-level frequently has not been made publicly available by state Medicaid agencies, limiting transparency and the ability of Medicaid beneficiaries (and other stakeholders) to assess how plans are performing on key indicators related to access, quality, etc.
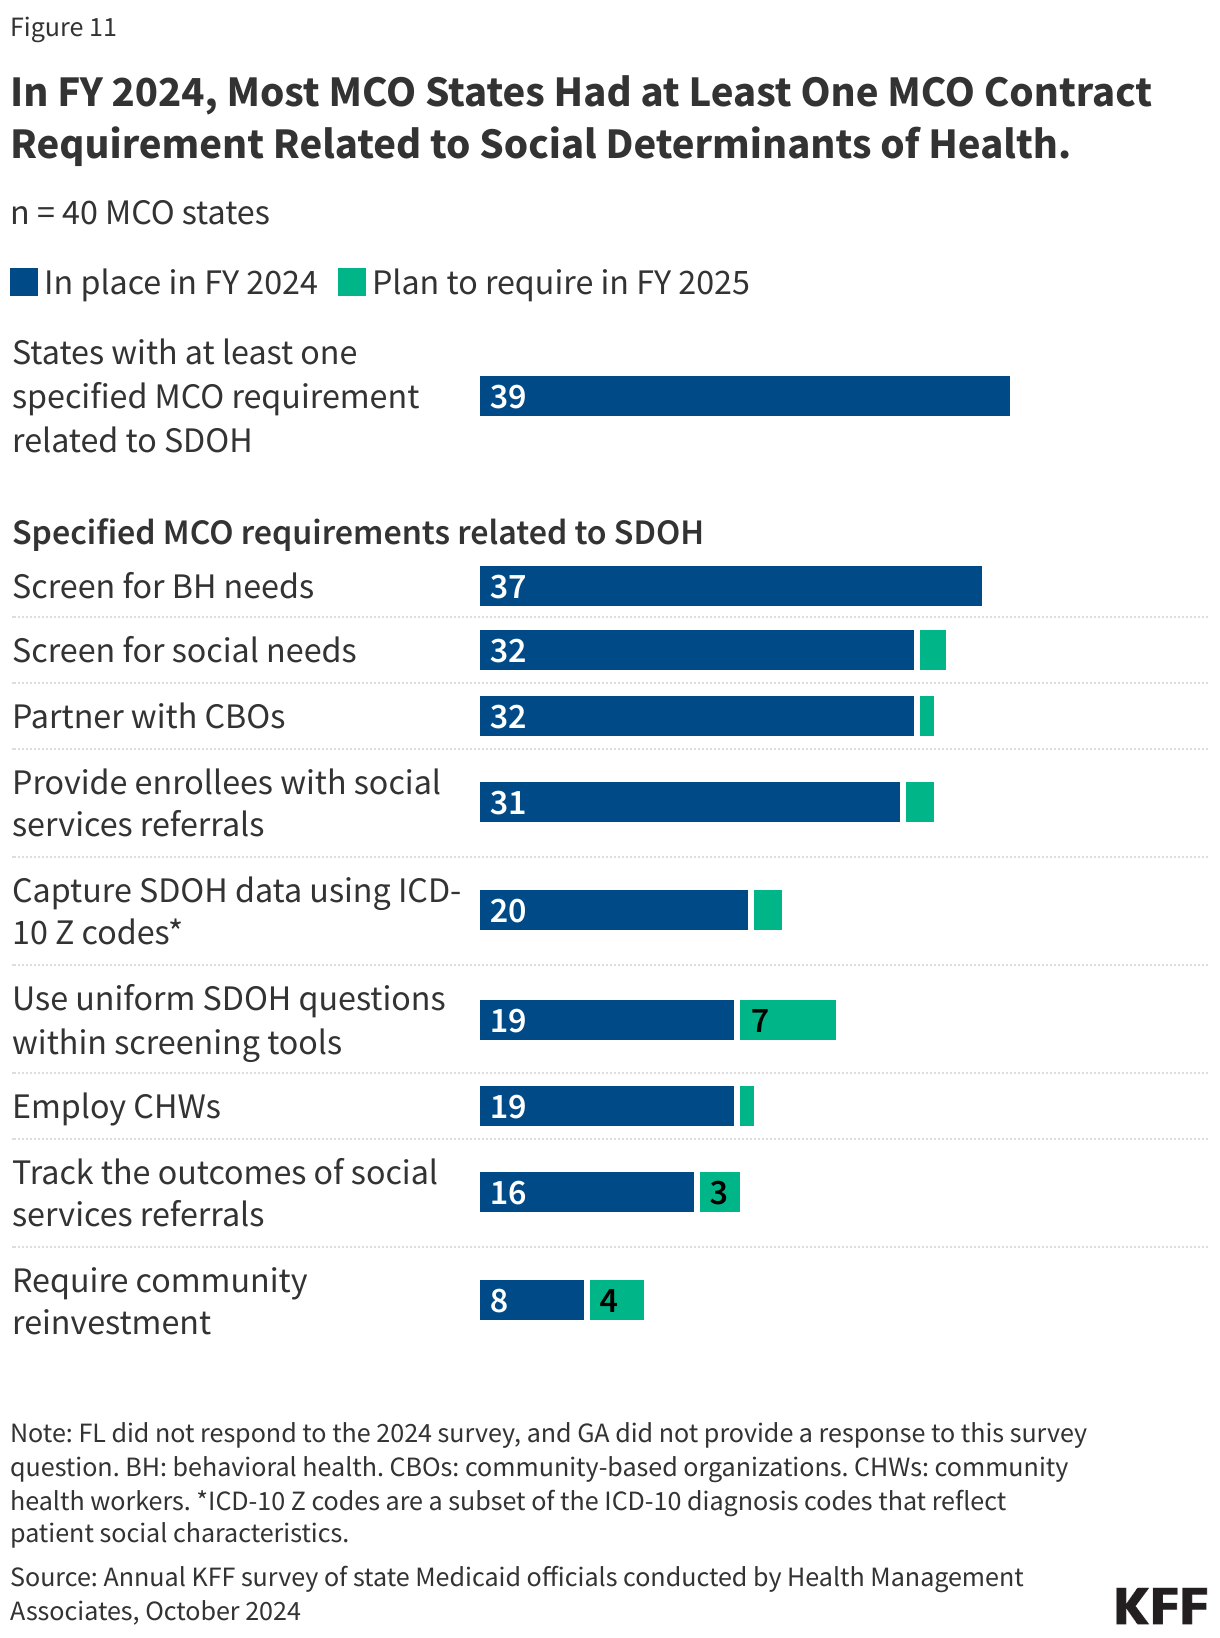
In FY 2024, most MCO states reported leveraging Medicaid MCO contracts to promote at least one specified strategy to address social determinants of health (Figure 11). States can also leverage managed care contracts to help reduce health disparities.
10. CMS has taken steps to improve managed care program monitoring and transparency.
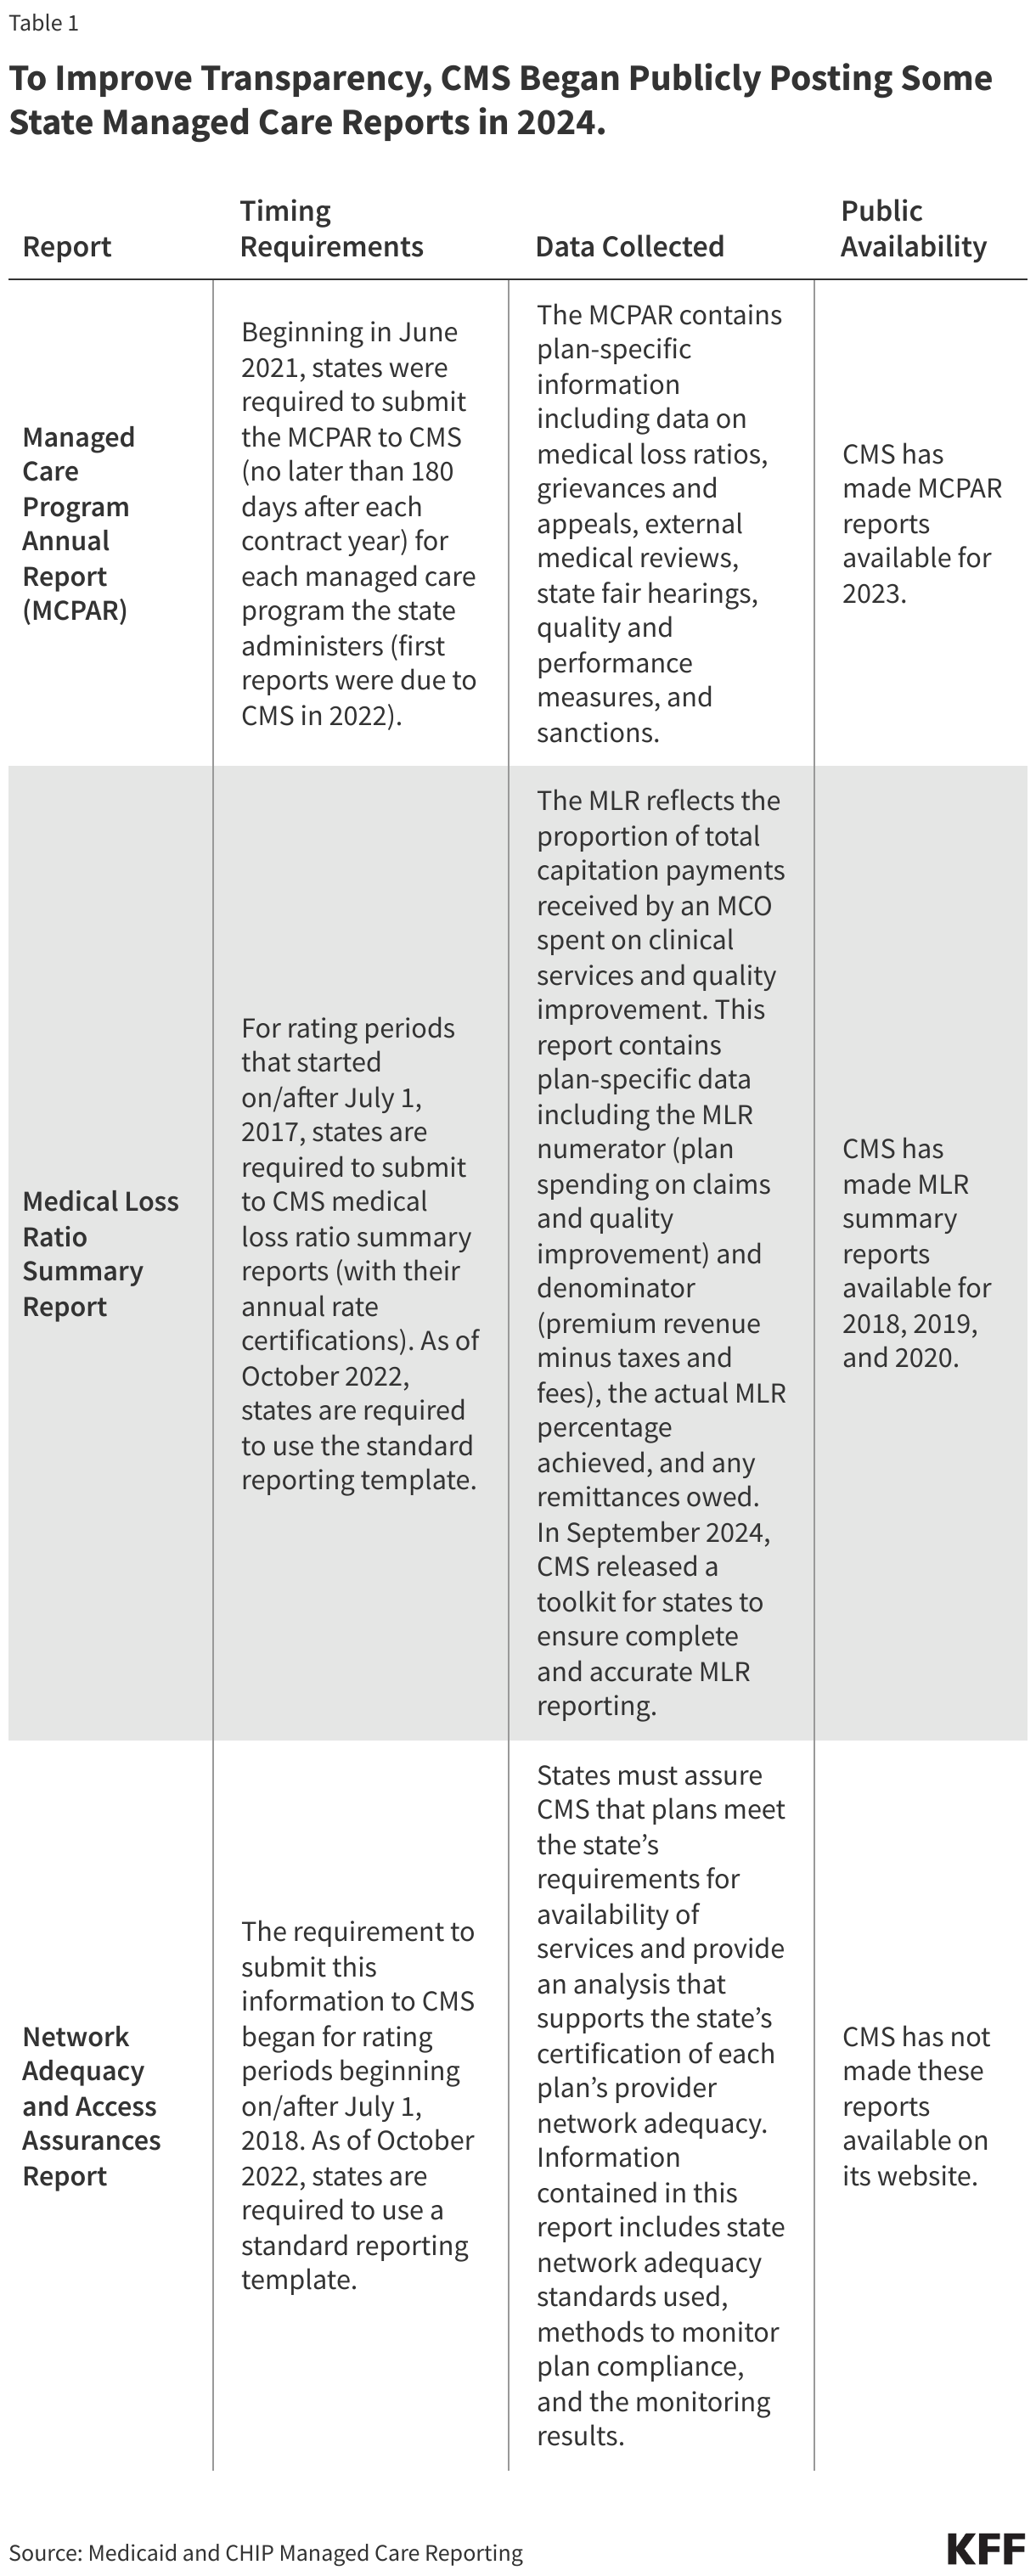
The 2016 Medicaid managed care final rule created new managed care reporting requirements for states. CMS, under the Biden administration, developed standard reporting templates (Table 1) and a variety of toolkits and released a series of informational bulletins (2021, 2022, 2023, 2024) to help states improve their monitoring and oversight of managed care programs. Transparency has the potential to promote accountability. To improve transparency, CMS began publicly posting the Managed Care Program Annual Report (MCPAR) and the MLR Summary Reports on Medicaid.gov in 2024. Managed care rules finalized in 2024 include provisions aimed at further strengthening managed care transparency and monitoring, though the fate of these rules remains uncertain.
Posting data relating to the performance of individual MCOs may allow for comparison within and across states. However, limitations and challenges may exist including posting lags and incomplete data (e.g., GAO found 6 states had not submitted required MCPARs for 2022, OIG found MLR reports prepared by plans were missing required data). (States are required to post the MCPAR and Network Adequacy and Access Assurances Report on their websites but some states may not yet be in compliance with these requirements.) It is unclear whether the Trump administration will continue efforts to strengthen managed care oversight and transparency.
PCCM is a managed fee-for-service (FFS) based system in which beneficiaries are enrolled with a primary care provider who is paid a small monthly fee to provide case management services in addition to primary care. ↩︎
While MCOs are the predominant form of Medicaid managed care, millions of other beneficiaries receive at least some Medicaid services, such as behavioral health or dental care, through limited-benefit risk-based plans, known as prepaid inpatient health plans (PIHPs) and prepaid ambulatory health plans (PAHPs). ↩︎
Sparer M. 2012. Medicaid managed care: costs, access, and quality of care. Res. Synth. Rep. 23, Robert Wood Johnson Found., Princeton, NJ ↩︎
Daniel Franco Montoya, Puneet Kaur Chehal, and E. Kathleen Adams, “Medicaid Managed Care’s Effects on Costs, Access, and Quality: An Update,” Annual Review of Public Health 41:1 (2020):537-549 ↩︎
Capping Per Enrollee Spending Could Reduce Federal Medicaid Expenditures by $532 billion to Nearly $1 Trillion Over 10 Years Depending on How States Respond and Result in as Many as 15 Million People Losing Medicaid Coverage by 2034
Eliminating the Medicaid Expansion Match Rate at the Same Time Could Push Federal Medicaid Spending Declines to as Much as $2.1 Trillion and Cause 30 Million to Lose Medicaid Coverage
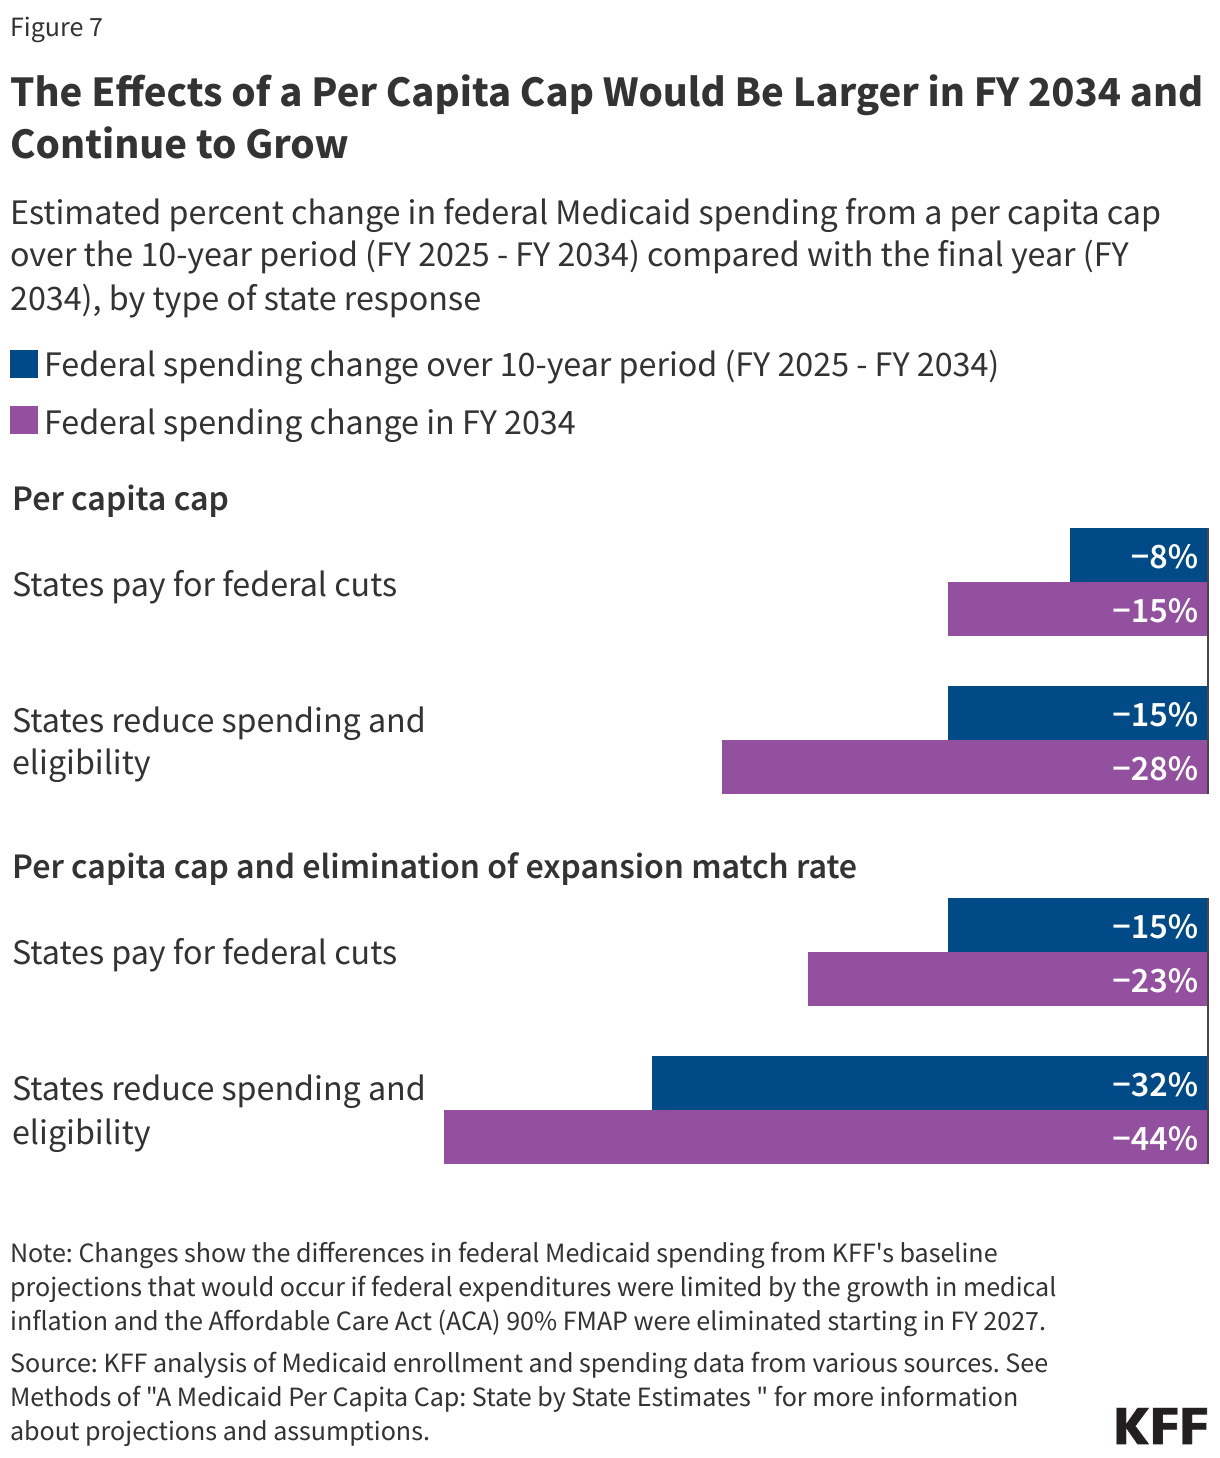
As Congress considers ways to cut Medicaid spending to help finance the extension of federal tax cuts, a new KFF analysis finds that imposing a cap on federal spending per Medicaid enrollee—known as a “per capita cap”—could trigger a decrease in federal Medicaid spending over a 10-year period of $532 billion to almost $1 trillion, depending on how states respond to the cuts. An estimated 15 million people could lose Medicaid coverage by 2034, if states were to respond to the change by reducing their own Medicaid spending and curtailing eligibility.
The size of the cuts and which states would be hit hardest would depend on how states respond, and also whether the policy is combined with other changes, such as ending the 90% federal match for the Affordable Care Act’s Medicaid expansion.
The analysis shows that if states choose to increase their own Medicaid spending to offset federal reductions and maintain coverage and benefits, federal Medicaid spending would fall by $532 billion and state costs would increase by the same amount. State responses to federal cuts may vary.
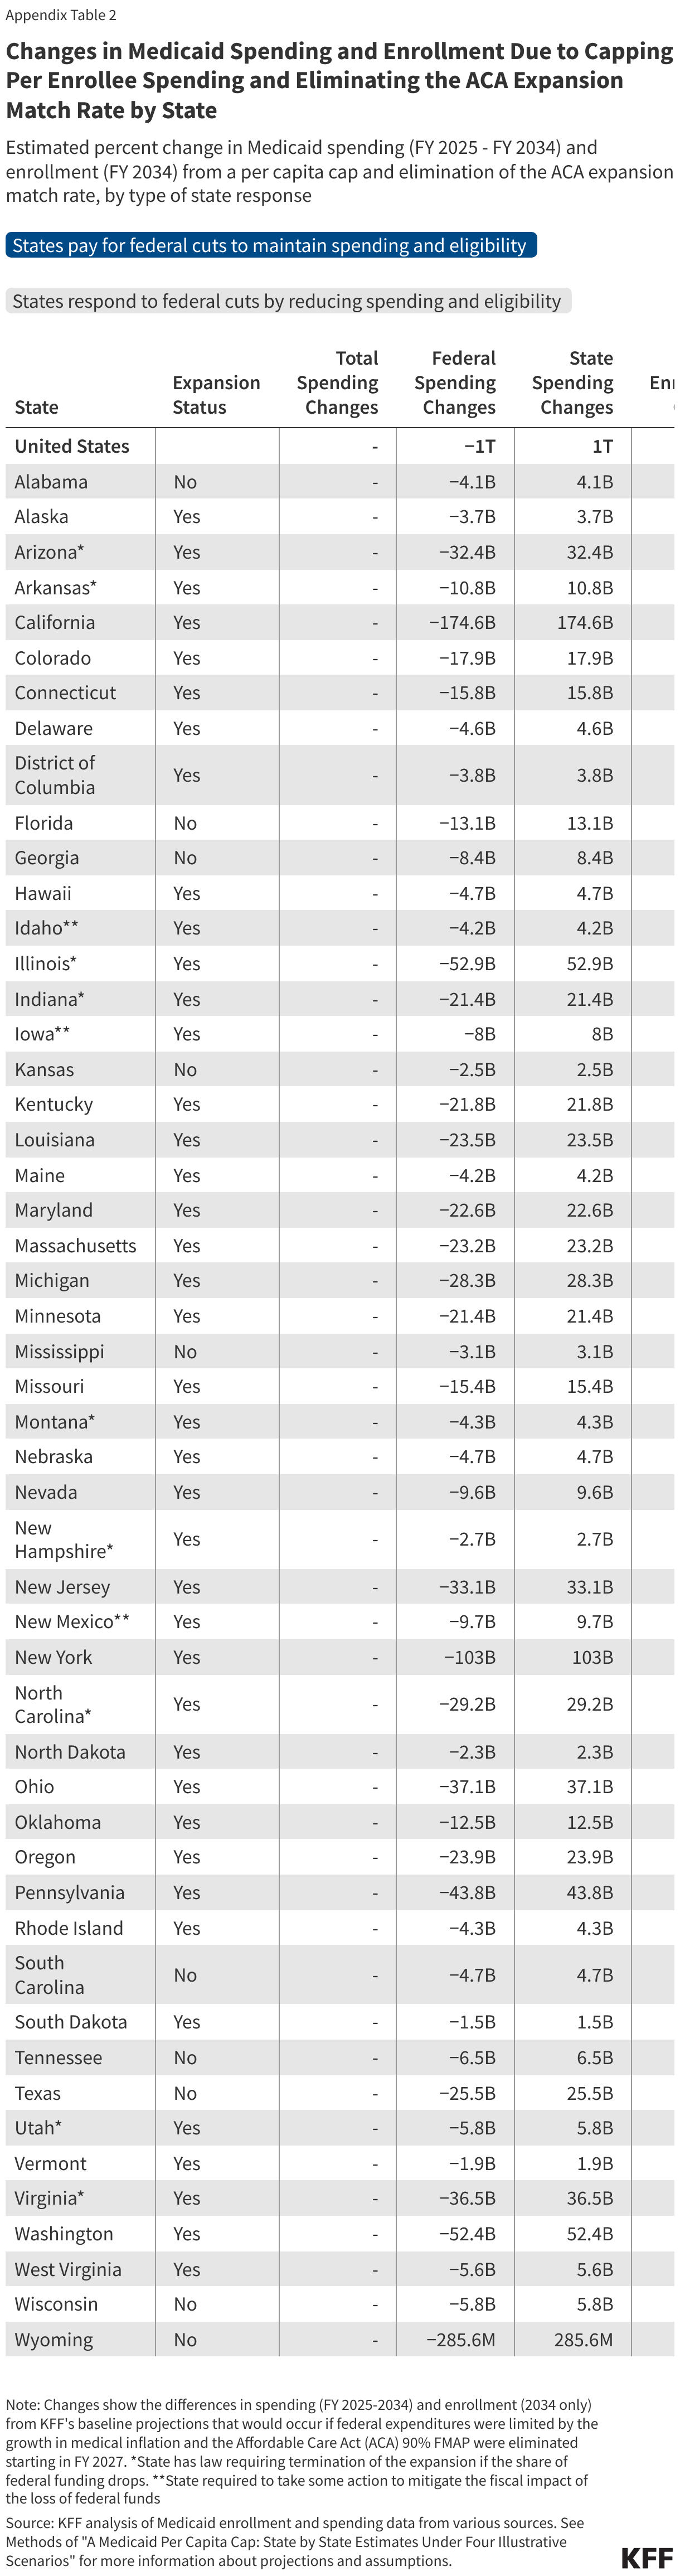
However, if Congress at the same time eliminates the enhanced federal matching rate for the Medicaid expansion (another significant policy being discussed, and which was examined by a previous KFF analysis), the impact would be bigger. Federal Medicaid spending cuts could range from $1 trillion–if states offset costs–to $2.1 trillion–if states respond by cutting state spending and eligibility over 10 years, with 30 million people losing Medicaid coverage by the end of the period.
In a party-line vote, the Republican-controlled House last night passed a budget resolution that would target cuts to Medicaid of up to $880 billion or more over a decade to help pay for tax cuts.
“The current proposals being discussed by Congress would lead to the largest Medicaid spending cuts and enrollment declines in the program’s history with an unprecedented cut in federal Medicaid funding to states,” said KFF President and CEO Drew Altman. “As our polling and focus groups with voters show, Americans, including many Trump voters, are not expecting, nor would they want, cuts to Medicaid, which would be felt across the country.”
The analysis examines the potential impacts of two of the Medicaid proposals being discussed that would generate significant federal savings. It looks at the combination of them because lawmakers may pursue multiple, simultaneous changes to the program that would have interacting effects. Other proposals being discussed reportedly include imposing Medicaid work requirements, reducing the minimum federal matching rate, restricting states’ use of provider taxes to finance their share of Medicaid spending, and repealing certain Medicaid regulations. Future KFF analyses will examine these proposals as well.
Under the current system, the federal government reimburses states for a share of Medicaid enrollees’ costs, with no upper limit on expenditures, and states pick up the rest. Capping the federal contribution would force states to choose how to offset the funding reductions and could lead to increases in the uninsured rate and reduced revenue for health plans, hospitals and nursing homes.
Other key takeaways of the analysis include:
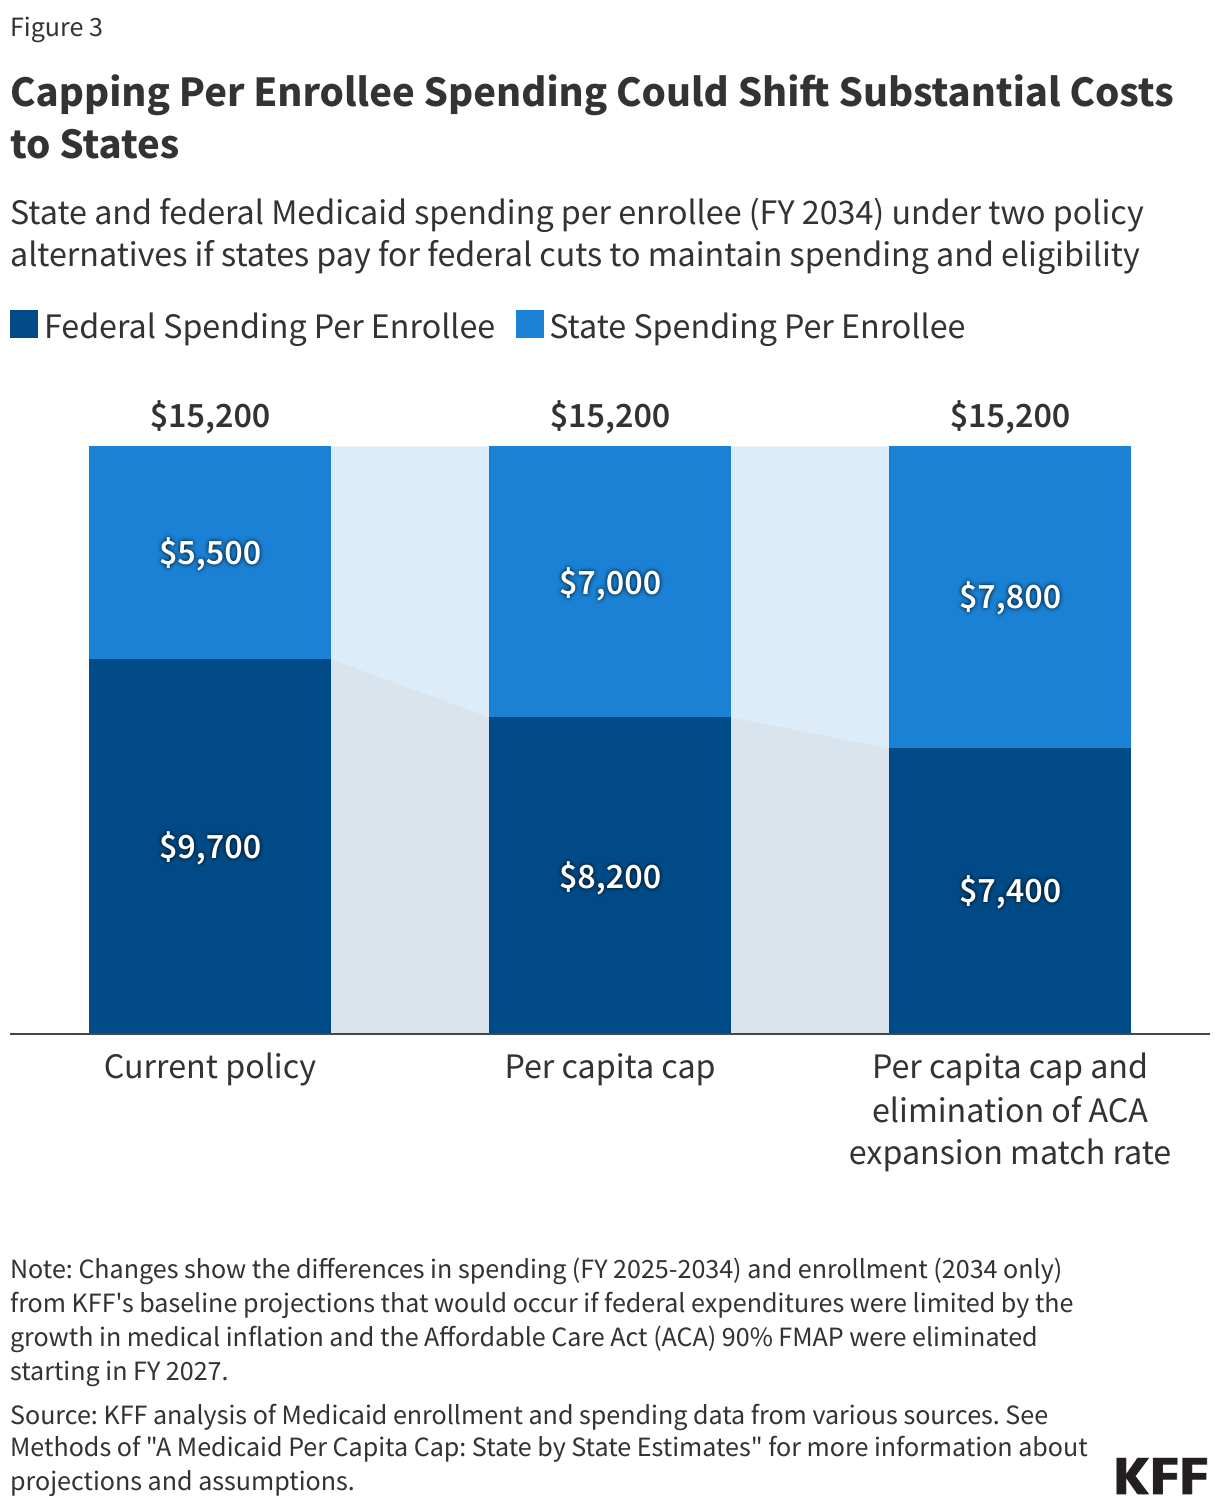
Maintaining current Medicaid benefit levels and enrollment would require states to pay $1,500 more per enrollee under a per capita cap, or up to $2,300 more per enrollee under a per capita cap that is combined with the elimination of the enhanced Medicaid expansion match rate, by FY 2034.
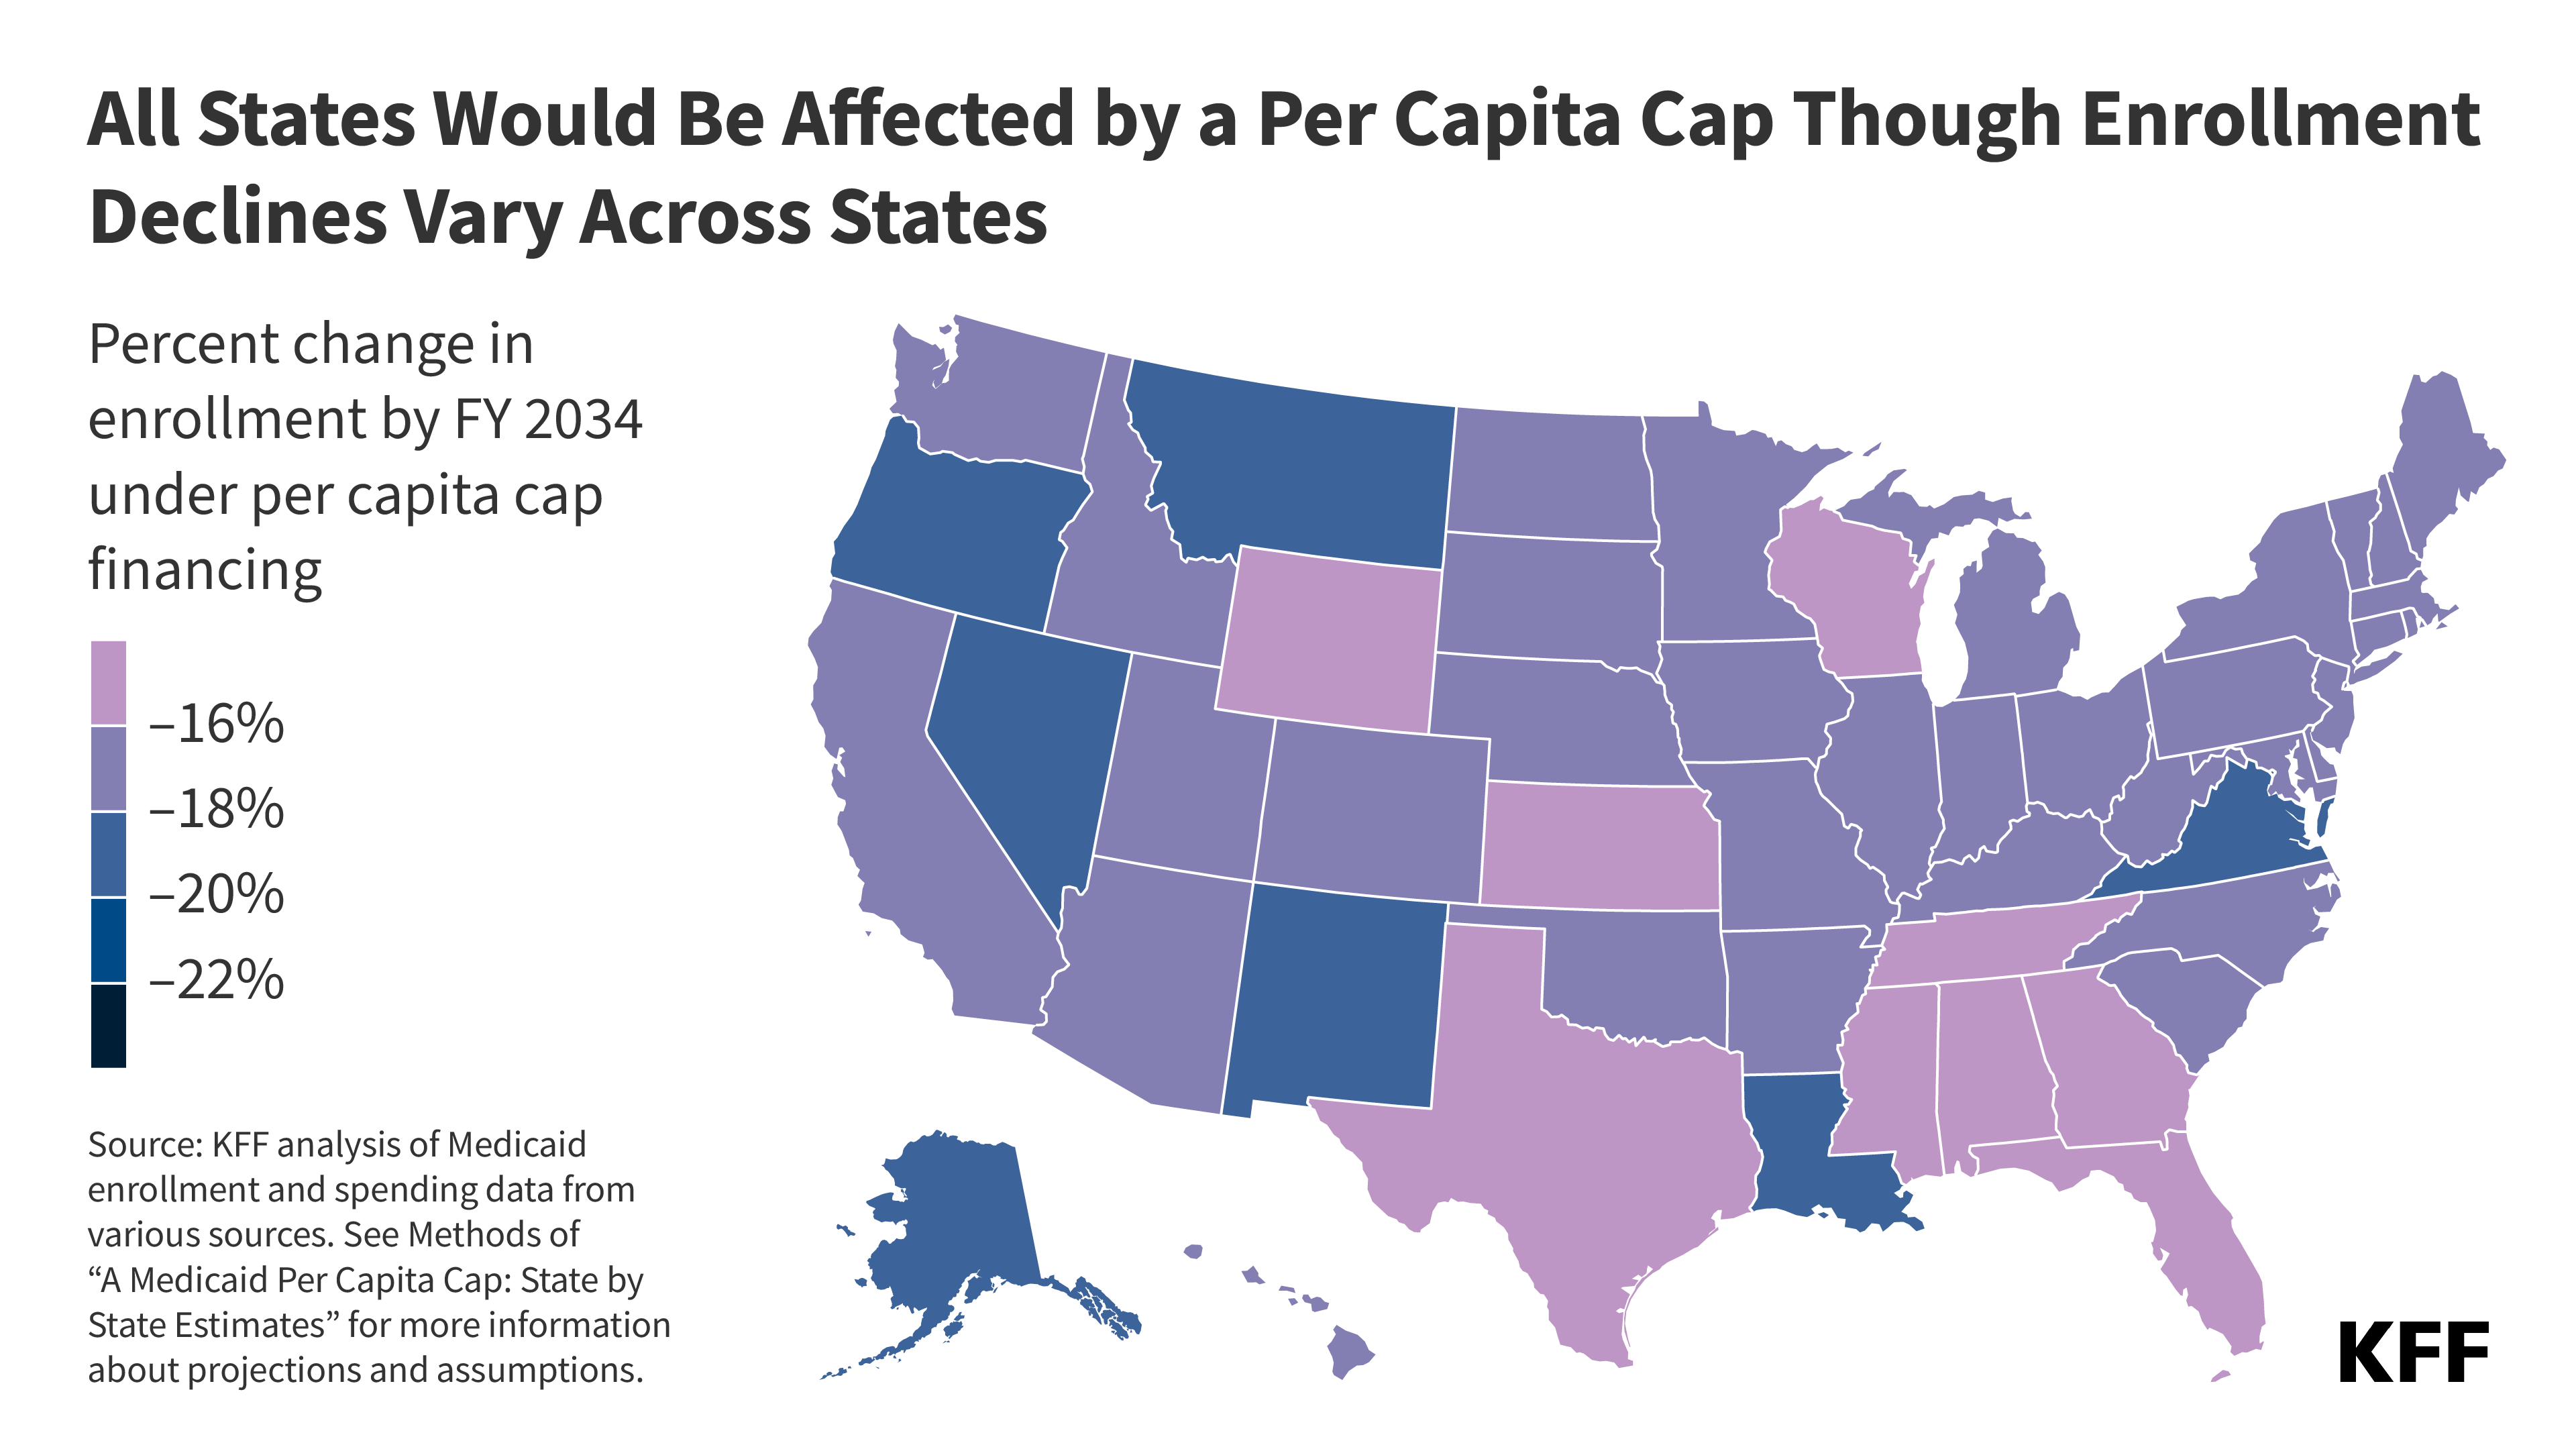
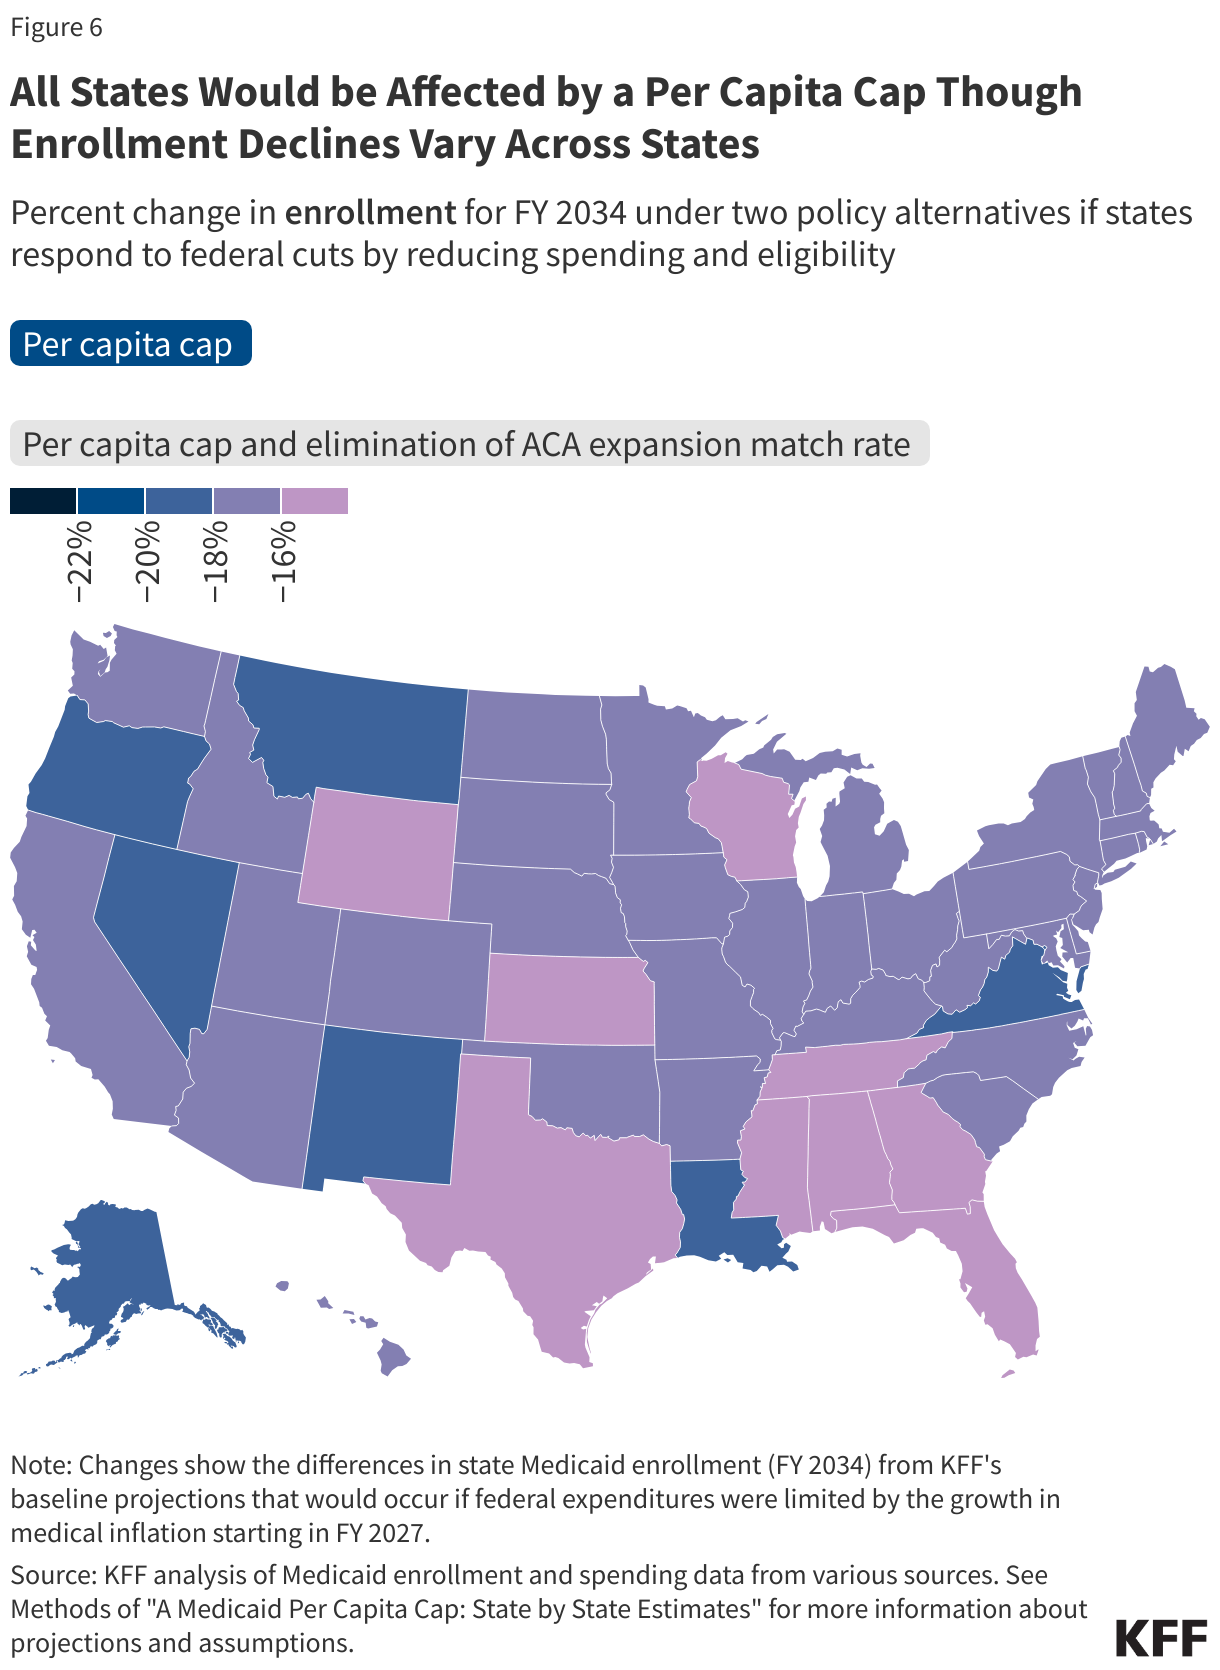
Decreases in Medicaid enrollment would vary by state and could be as high as 57% in some states if Congress implements both per capita cap financing and the elimination of the Medicaid expansion match.
Spending reductions under a per capita cap would compound in future years as the per enrollee cap levels diverge further from spending levels expected without the cap, limiting states’ ability to meet changing program needs.
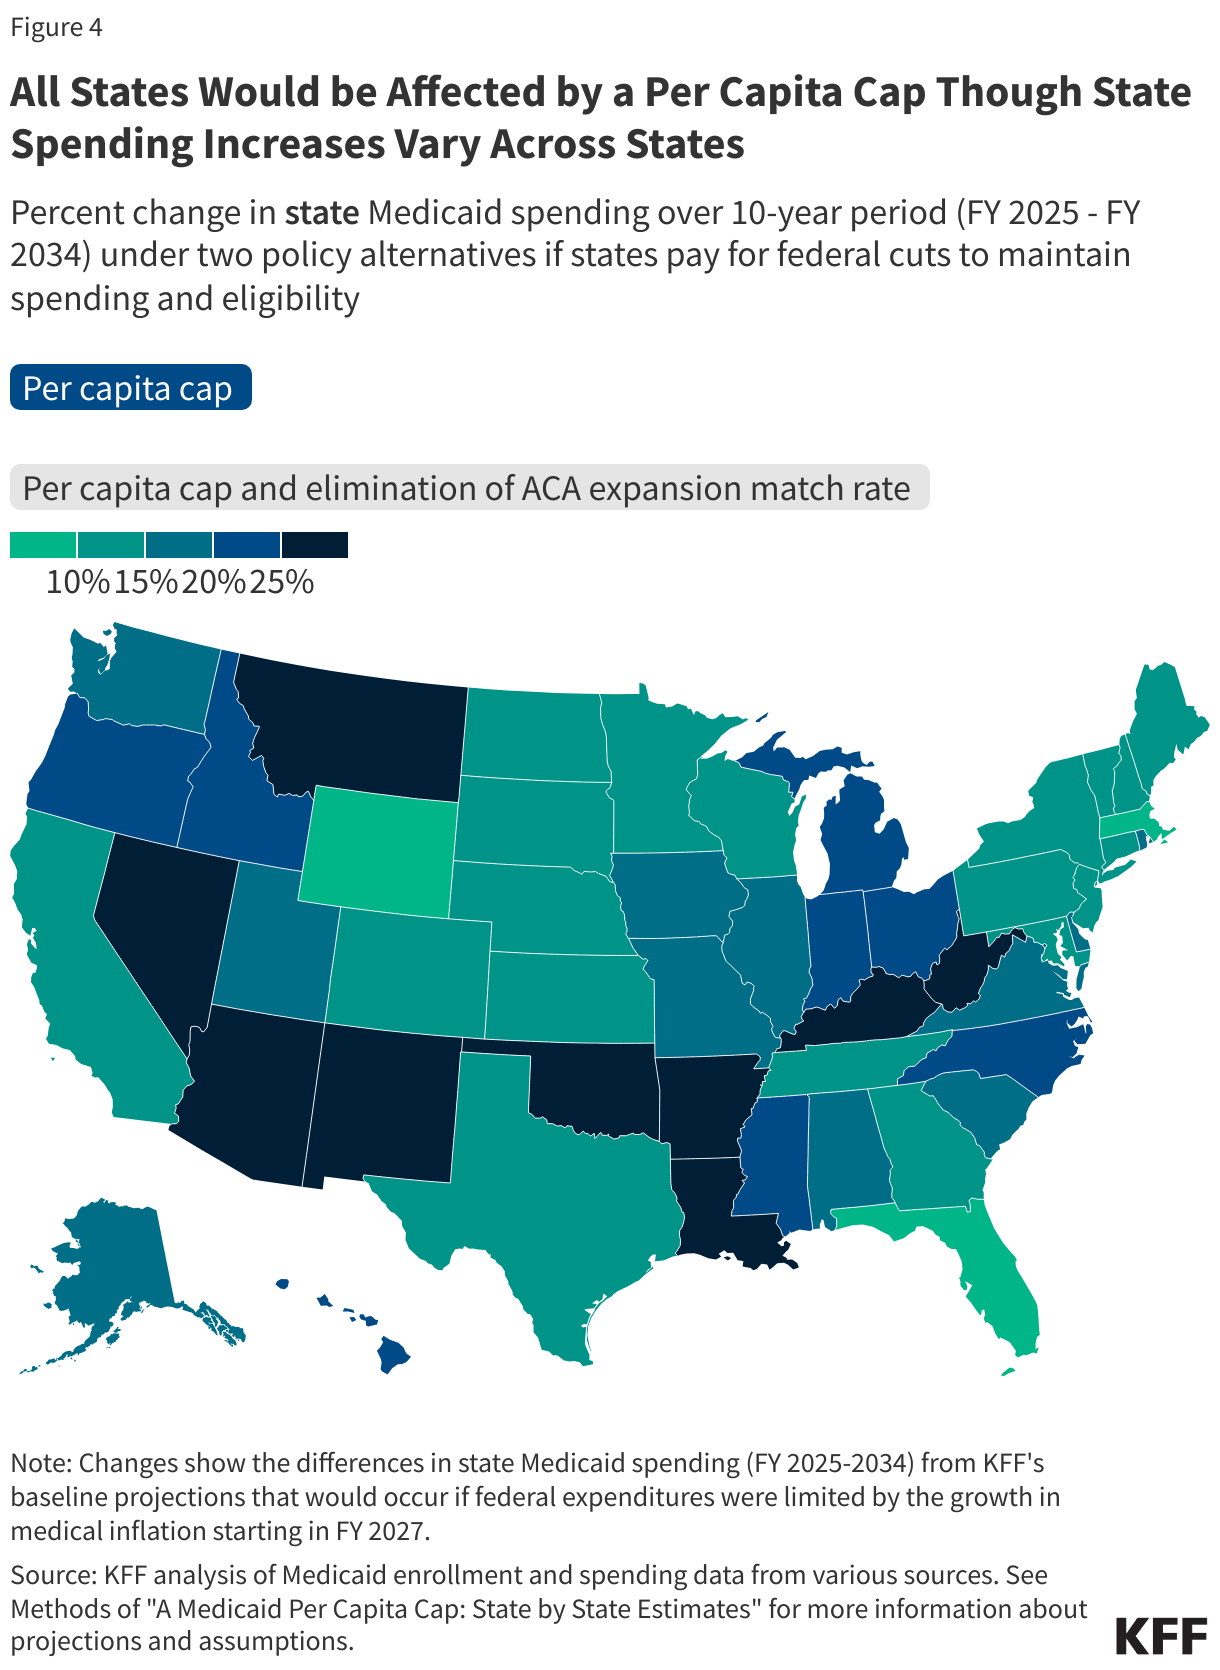
All states would be affected by a per capita cap, but the magnitude would vary due to differences in the mix of the types of Medicaid enrollees in each state. The effects would vary across eligibility groups because spending for different groups is expected to grow at different rates over time. Also, the elimination of the enhanced Medicaid expansion match rate would only affect the 40 states and the District of Columbia that have adopted the expansion.
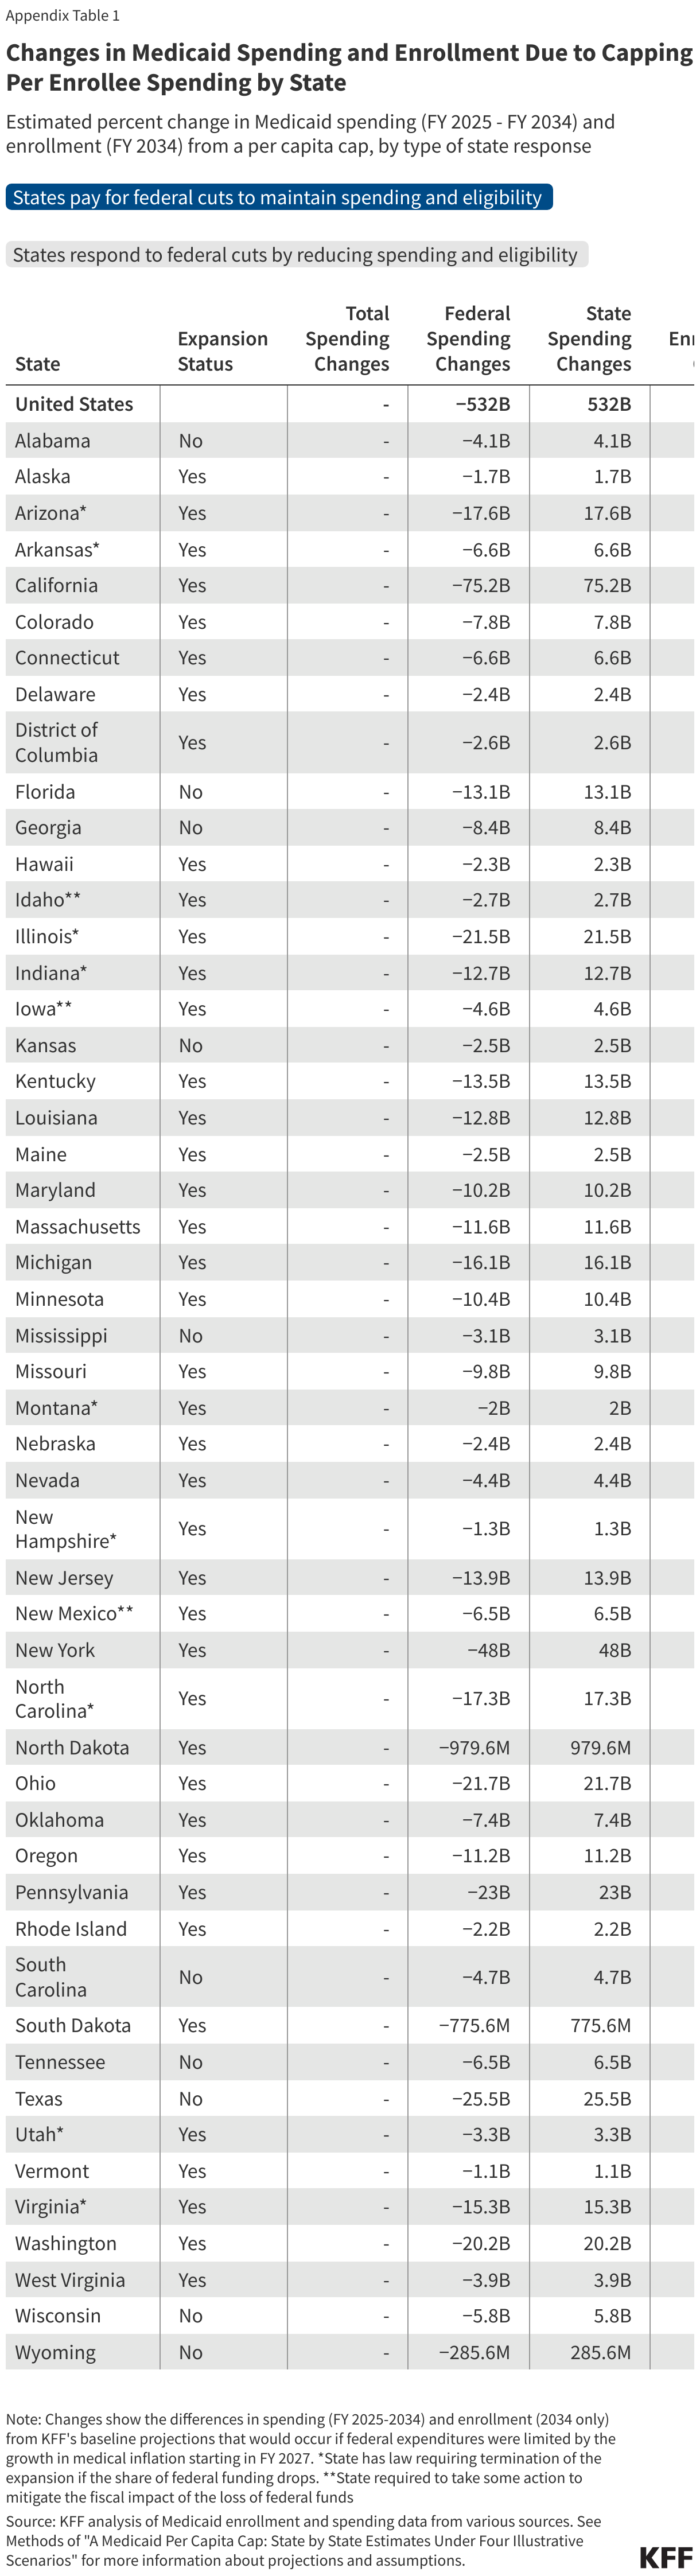
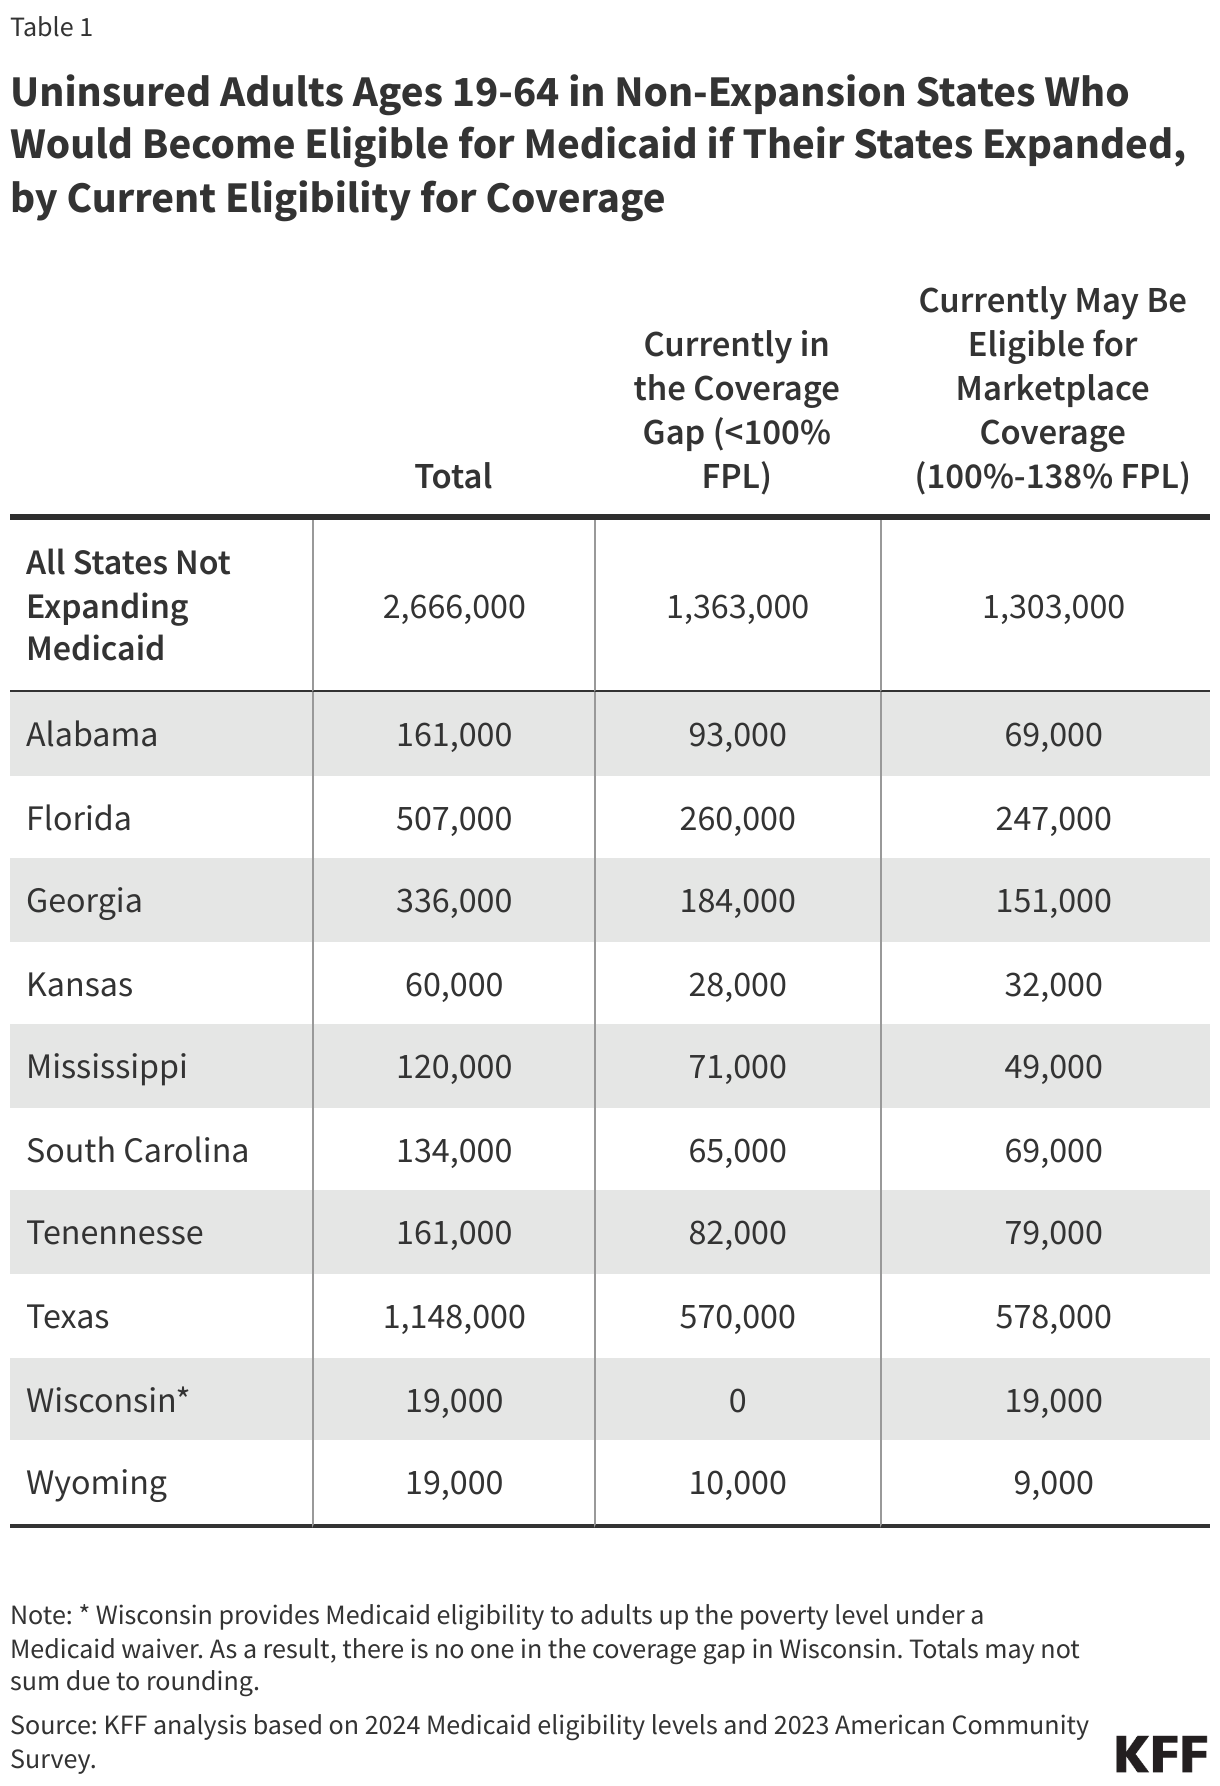
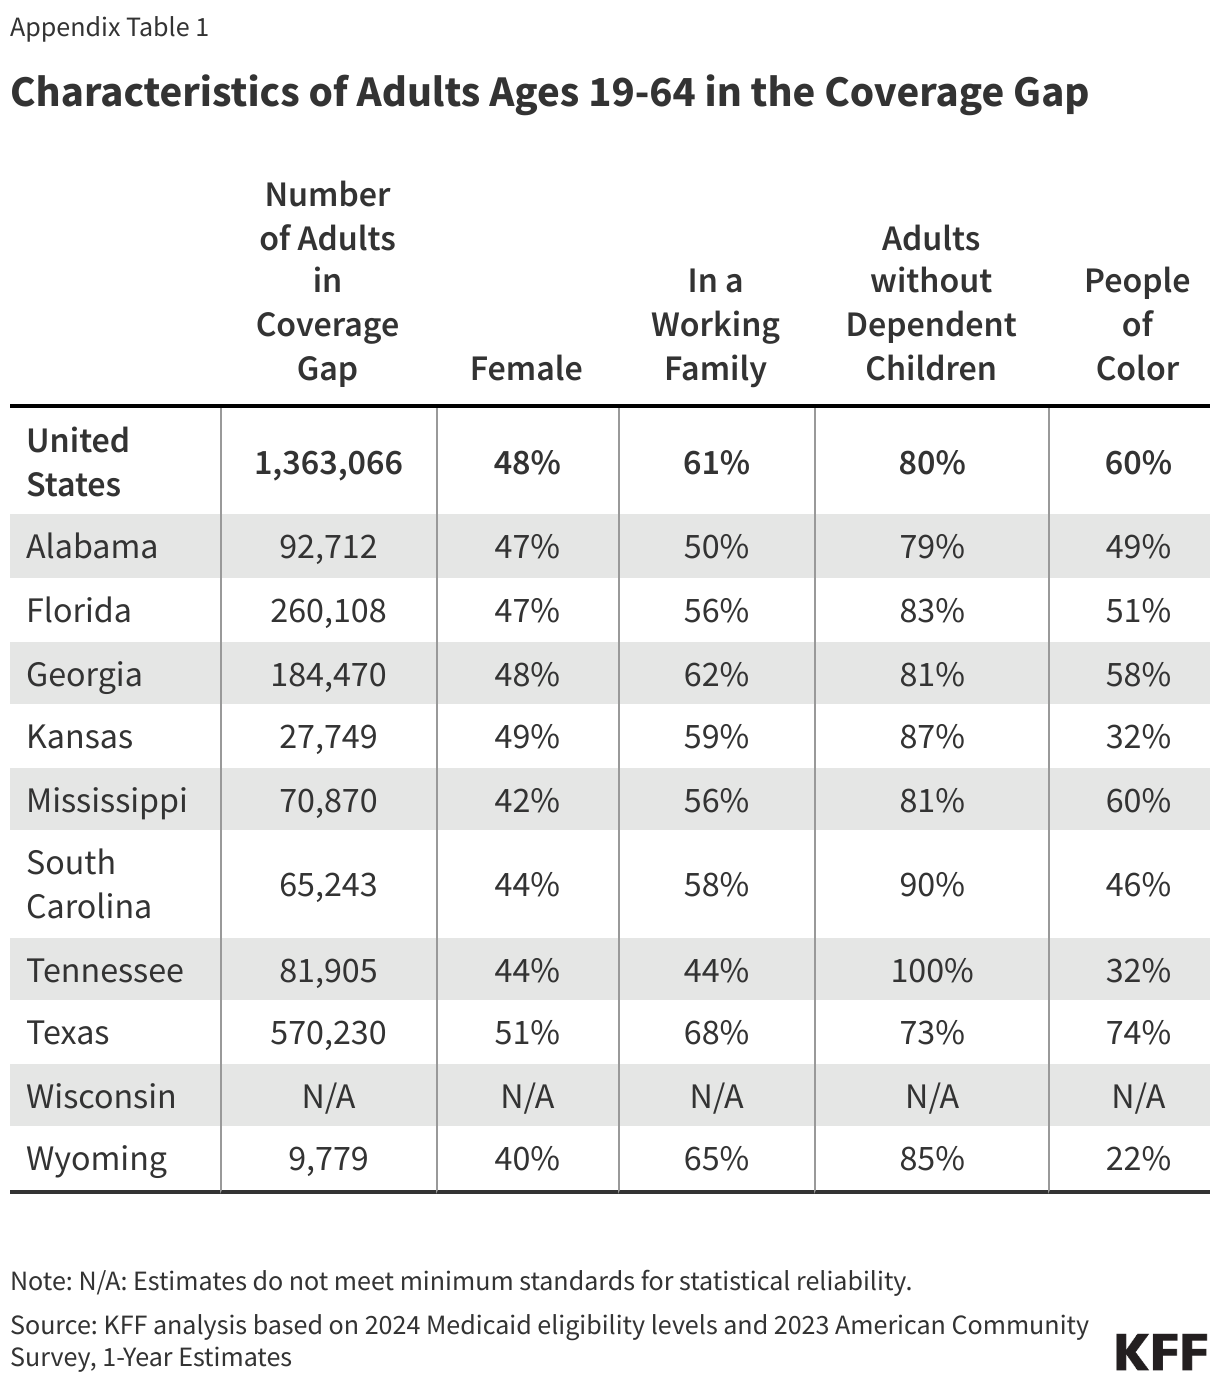
For detailed state-by-state impacts of the proposed Medicaid financing changes on spending and enrollment, see Appendix Tables 1 and 2.
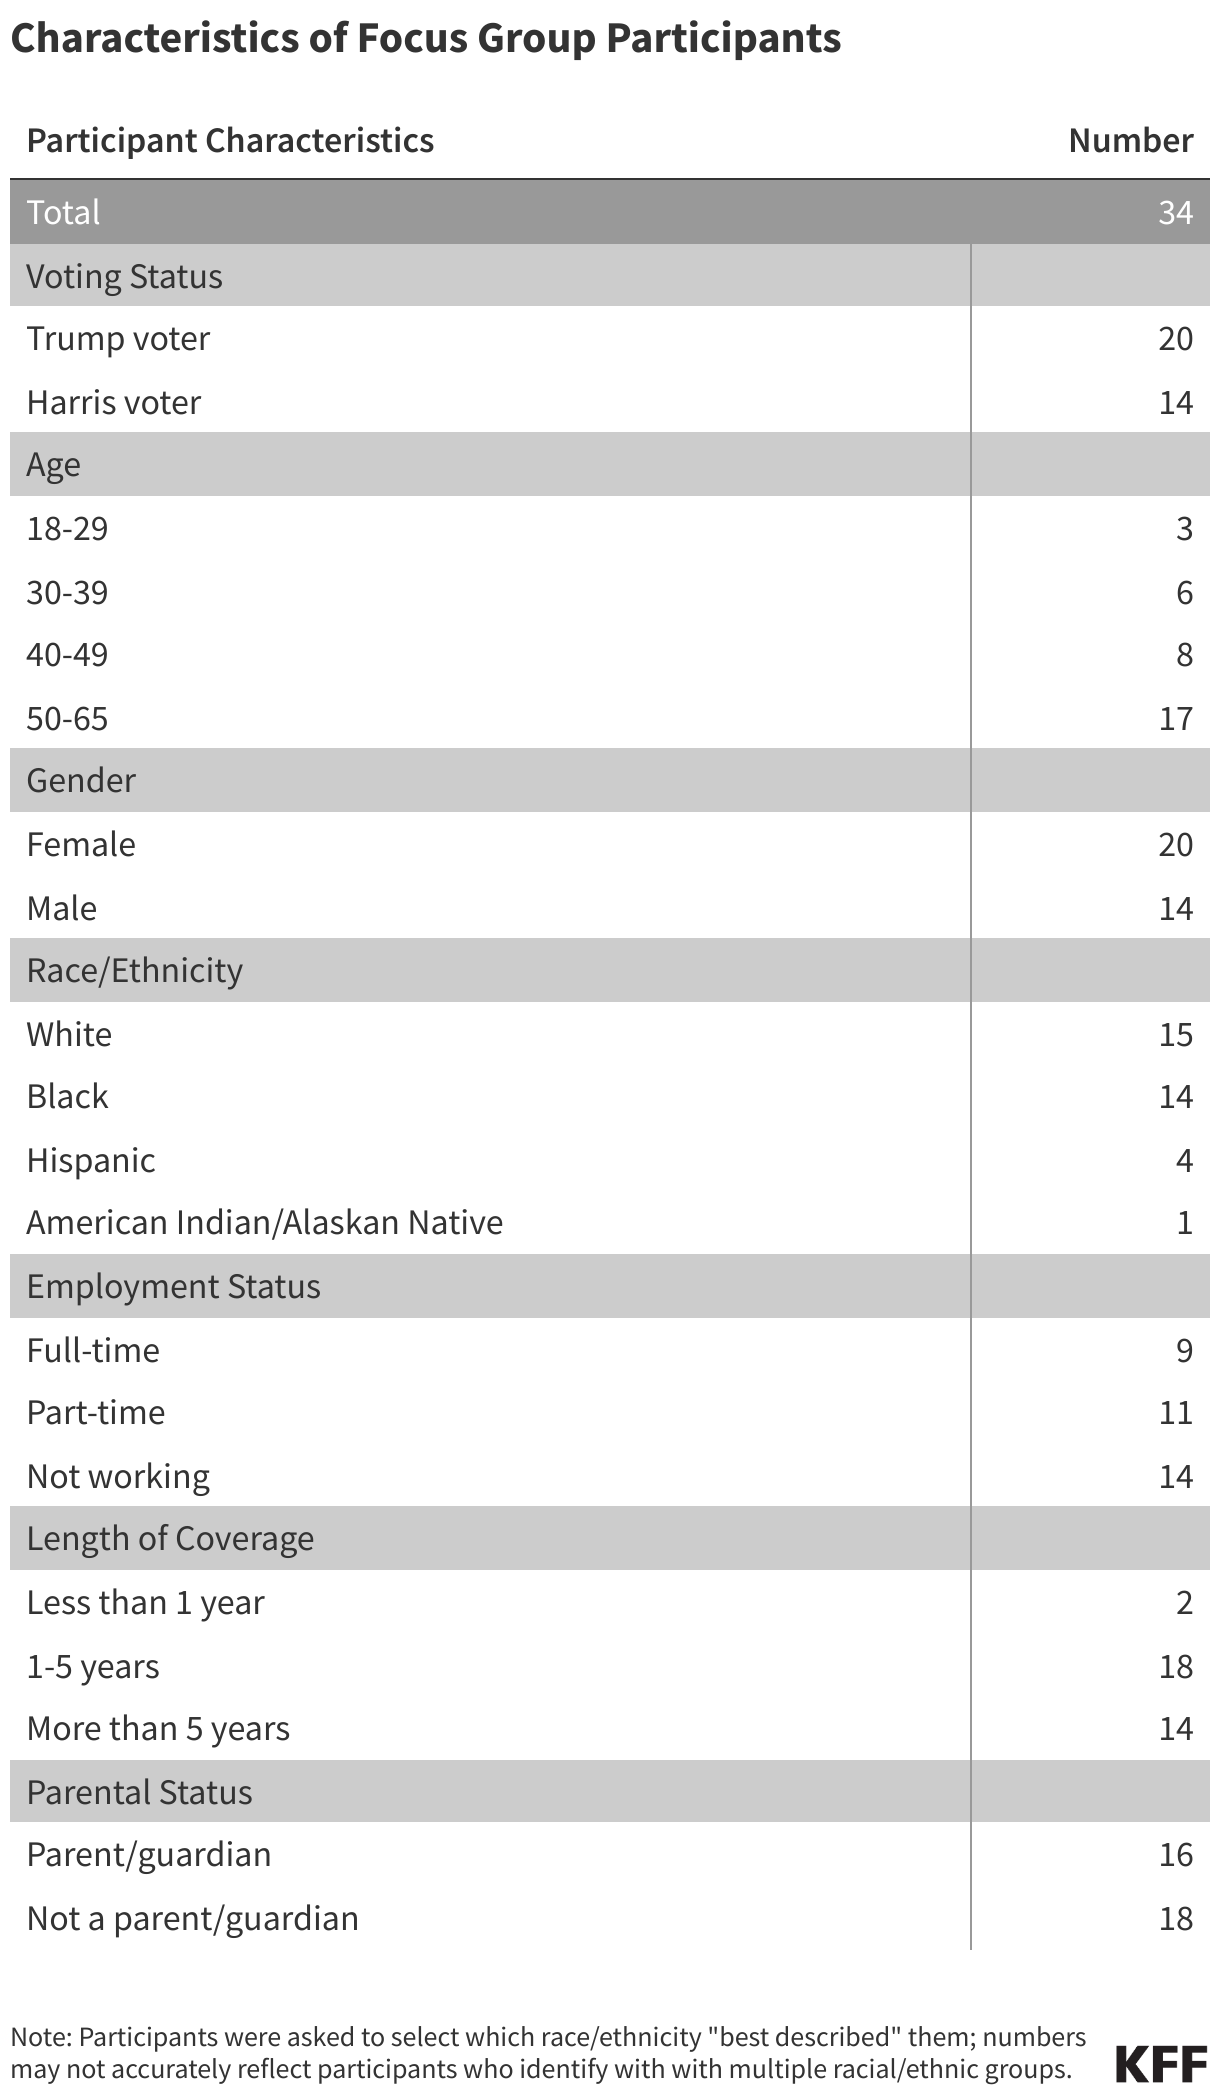
A related report released this week highlights the experiences and opinions of Medicaid enrollees who participated in five virtual focus groups that KFF conducted in January with enrollees who voted for President Trump or for Vice President Harris. Despite differences in political leanings, participants reported having favorable experiences with Medicaid and concerns about potential cuts to the program. While some Trump voters enrolled in Medicaid believed there is fraud in the program and were open to work requirements, they also didn’t think that President Trump would follow through on cuts to Medicaid because they believed he understood their financial struggles.
Medicaid covers one in five people in the U.S., and accounts for nearly $1 out of every $5 spent on health care. It covers 41% of all births, nearly half of children with special health care needs, and five in eight nursing home residents.
There are several options under consideration in Congress to significantly reduce Medicaid spending to help pay for tax cuts, with the recently passed House budget resolution targeting cuts to Medicaid of up to $880 billion or more over a decade. Medicaid is the primary program providing comprehensive health and long-term care to one in five people living in the U.S and accounts for nearly $1 out of every $5 spent on health care. Medicaid is administered by states within broad federal rules and jointly funded by states and the federal government, meaning restrictions in federal Medicaid spending could leave states with tough choices about how to offset reductions through cuts to Medicaid, cuts to other programs, or tax increases.
This analysis examines the potential impacts on states, Medicaid enrollees, and providers of implementing a per capita cap on federal Medicaid spending, which is one proposal that has been discussed in Congress. The analysis assumes, based on proposals floated in Congress, that the plan would cap federal Medicaid spending growth per enrollee for each of the five major eligibility groups at medical inflation. Given the likelihood of multiple, simultaneous changes to Medicaid and the interactive nature of those changes, the analysis also illustrates the effects of a per capita cap on Medicaid if implemented jointly with the elimination of the 90% federal match rate for the Affordable Care Act (ACA) expansion, another significant policy change that has been discussed in Congress and which was examined by a previous KFF analysis. Other proposals to reduce federal Medicaid spending have also been reportedly raised, including work requirements, a reduced federal matching rate, limits on provider taxes to finance the state share of Medicaid spending, and repeal of certain Medicaid regulations issued by the Biden administration. Future KFF analyses will examine these proposals as well.
Key takeaways
The estimated effects of a per capita cap depend highly on what assumptions are made about policy specifications, future growth in Medicaid spending, and states’ responses to federal cuts.
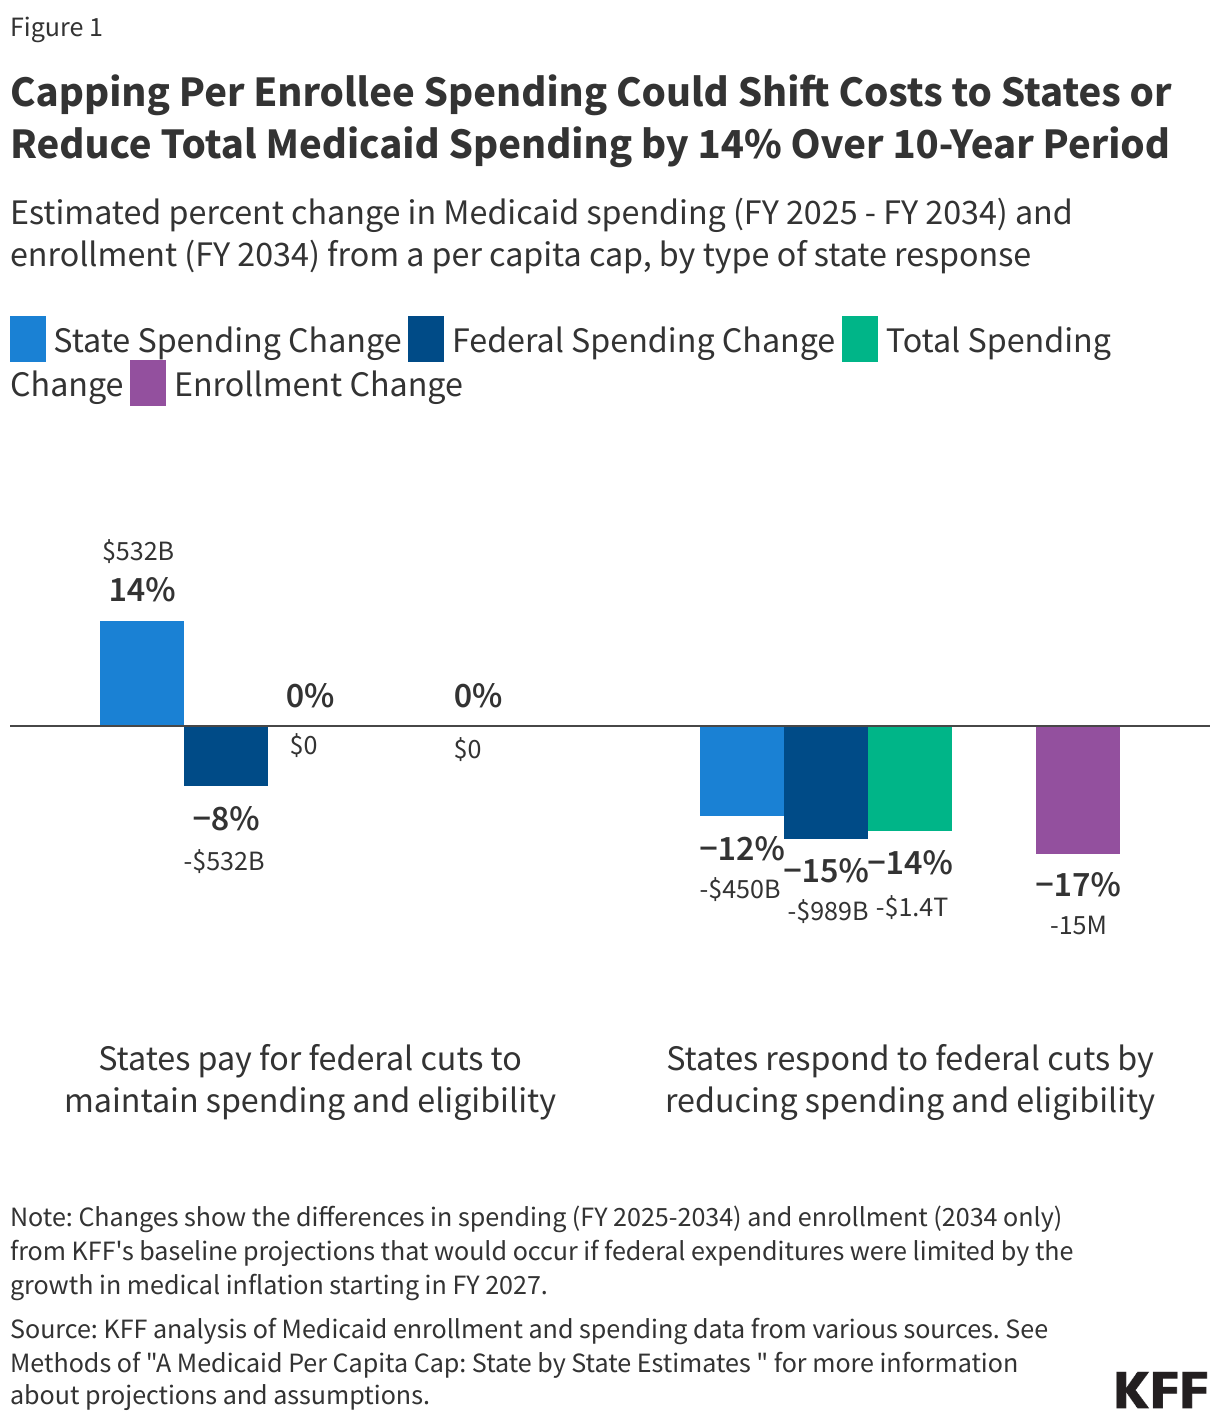
Capping per enrollee spending could reduce federal spending by $532 billion to nearly $1 trillion dollars between FY 2025 and FY 2034. Depending on how states respond, the policy could shift costs to states by $532 billion and leave total Medicaid spending unchanged or total Medicaid spending could decline by 14% (or $1.4 trillion).
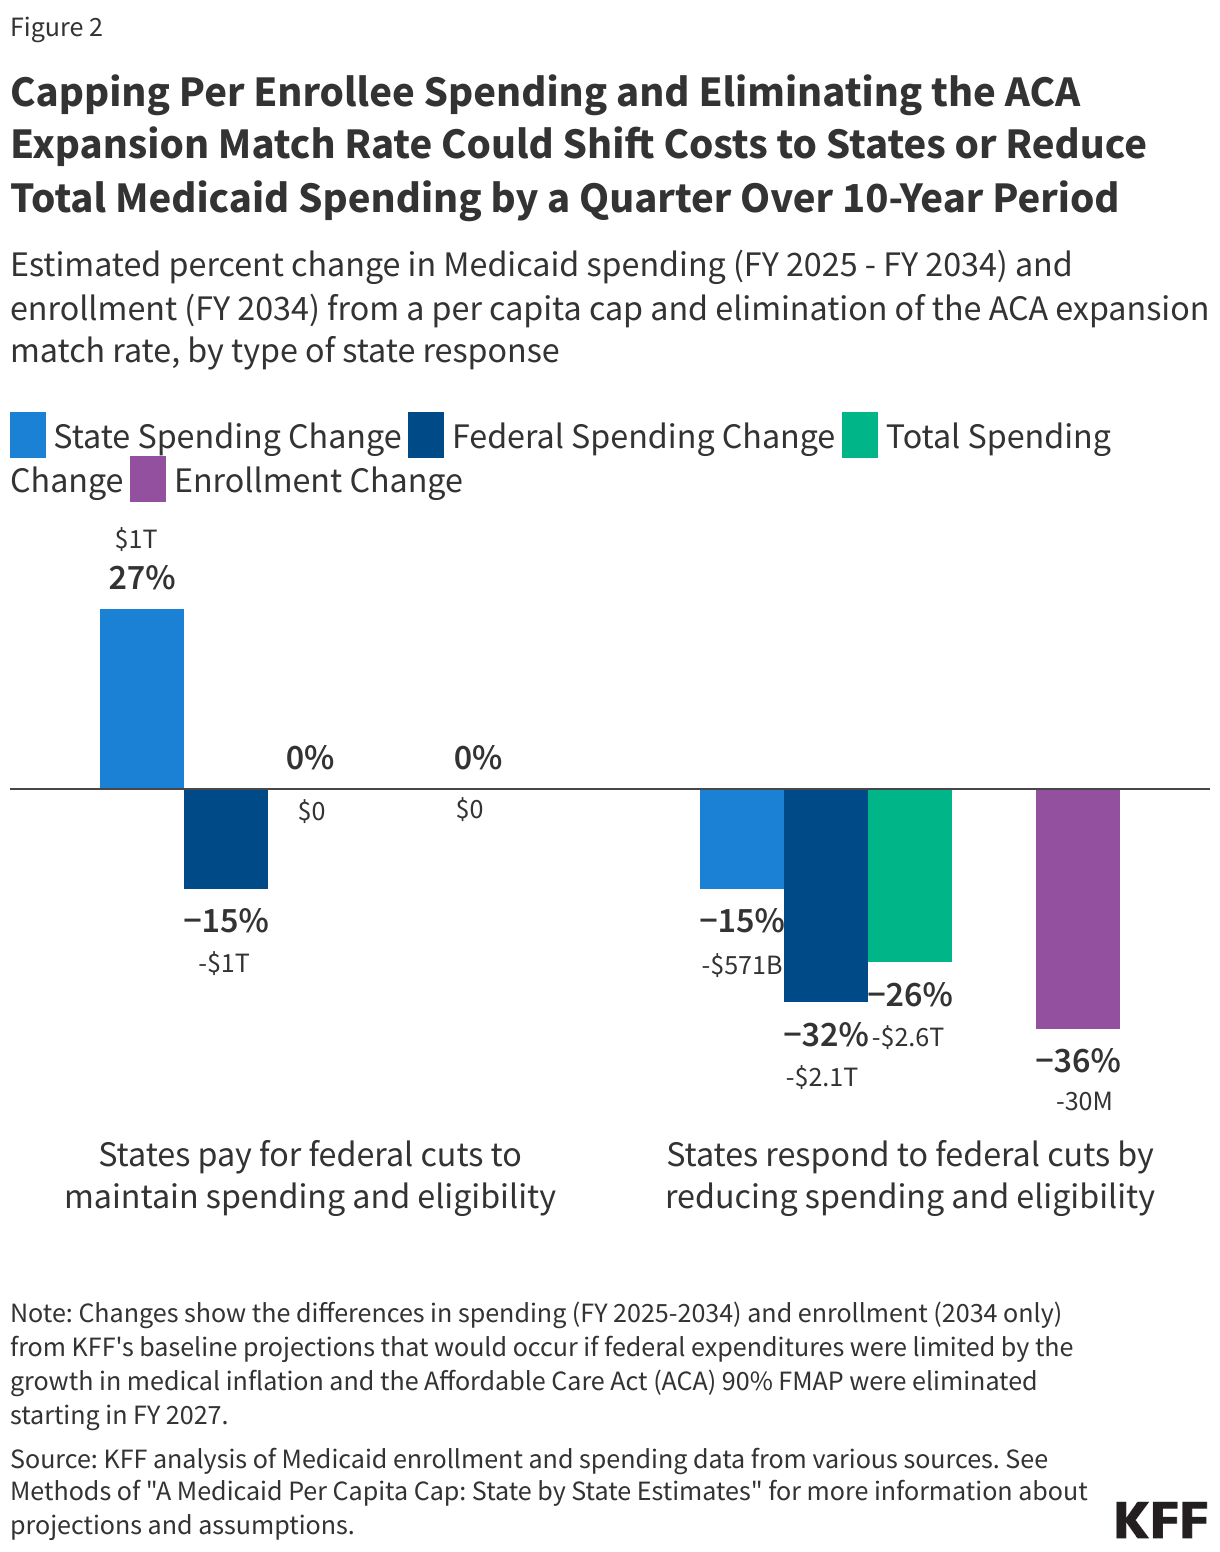
If per capita caps were implemented jointly with the elimination of the enhanced ACA expansion match rate, federal Medicaid spending could decline by $1 trillion to $2.1 trillion dollars between FY 2025 and FY 2034. Depending on how states respond, this combination of policies could shift costs to states by $1 trillion and leave total Medicaid spending unchanged or total Medicaid spending could decline by a quarter (or $2.6 trillion).
If states reduced Medicaid eligibility proportionally to the cuts in federal spending, 15 million enrollees could lose Medicaid coverage under a per capita cap by the final year of the analysis, with that figure doubling to 30 million when combined with elimination of the ACA expansion match rate.
States would face tough choices about Medicaid’s future under a per capita cap: maintaining current Medicaid benefit levels and enrollment would require states to pay $1,500 to $2,300 more per enrollee in the final year of the analysis.
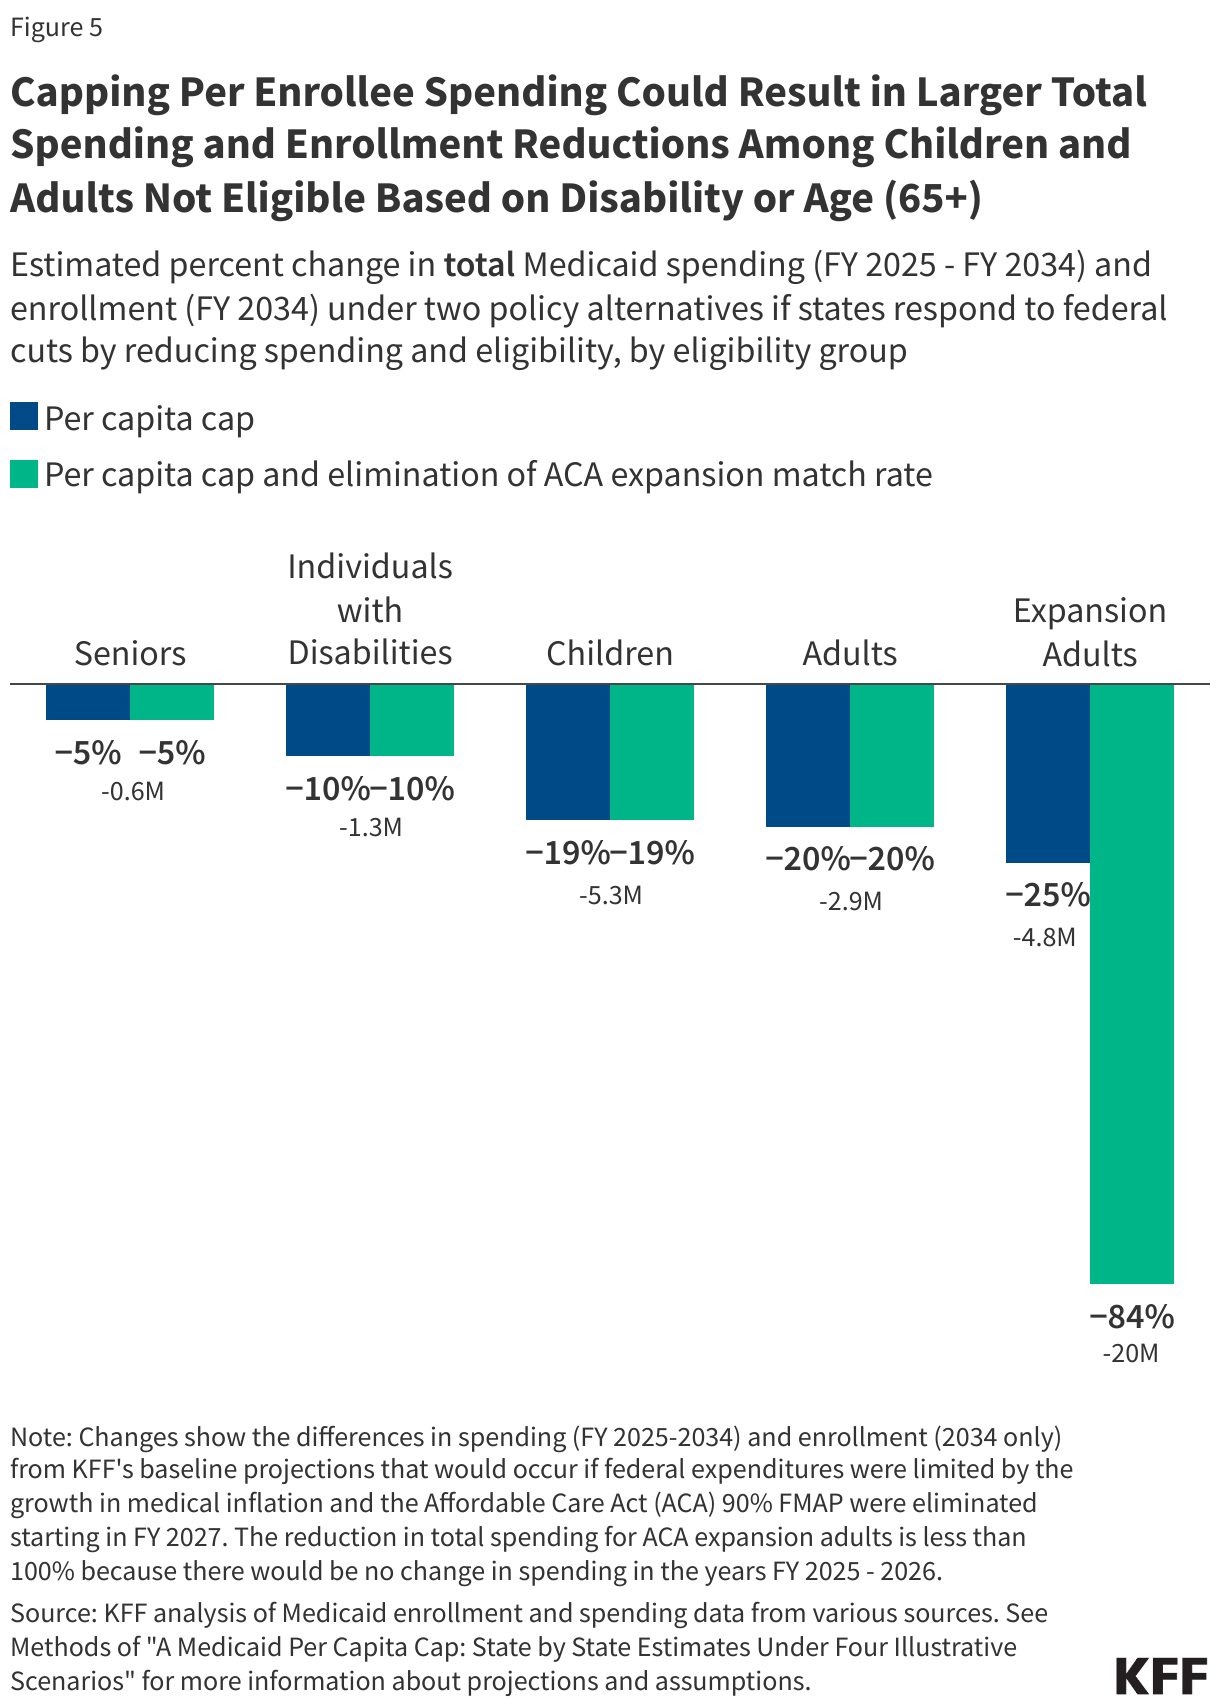
The effects of a per capita cap differ across eligibility groups because spending for different eligibility groups is expected to grow at different rates, with larger estimated effects among children and adults who are not eligible because they have a disability or are ages 65 and older.
All states would be affected by a per capita cap, but the size of the effects vary due to differences in the mix of enrollees. Depending on state responses, state spending could increase up to 57% in some states if they chose to pay for the cuts. Enrollment could decrease by similar levels if states chose to restrict eligibility in response to the federal funding cuts.
Spending reductions under a per capita cap would compound over time as expected increases in Medicaid spending diverge from the caps. The effects would be smaller immediately following implementation, larger in FY 2034, the final year of this analysis, and continue to grow in the years after 2034. A per capita cap can provide lower and more predictable federal costs over time, but it would also fundamentally change the Medicaid federal-state partnership by eliminating the federal guaranteed match and transferring new financial risk to states. States would face significant challenges in efforts to pay for federal cuts and there would be pressure to reduce benefits and eligibility, with even larger effects if a per capita cap were paired with other Medicaid cuts. Beyond reduced Medicaid spending and enrollment, there could be increases in the number of people who are uninsured, fewer covered benefits for future Medicaid enrollees, and reduced revenues available for health plans and providers such as hospitals and nursing facilities.
What is the proposed policy change?
Medicaid spending is currently shared by states and the federal government with a guarantee to states for federal matching payments without a cap on federal expenditures. The percentage of costs paid by the federal government (known as the federal medical assistance percentage or “FMAP”) for most Medicaid enrollees is determined by a formula set in law designed to provide a higher federal match rate for states with lower per capita incomes. There are also higher match rates for certain services and populations like the ACA expansion group (90%). This leads to variation in the federal share of Medicaid spending across states. There is also considerable variation in per enrollee spending across states, due to state flexibility to determine eligibility levels, benefits, and provider payment, and across eligibility groups,reflecting differences in health care needs and utilization.
This analysis estimates the impact of implementing a per capita cap on the federal share of Medicaid spending. One proposal under consideration would “establish a per capita cap [on federal Medicaid expenditures] for each of the different enrollment populations set to grow at medical inflation.” While specifics on the implementation of this policy would be included in a legislative proposal, further details have yet to be released, and assumptions made here may differ from details included in proposed legislation. To estimate a per capita (i.e., per enrollee) cap policy, this analysis first establishes FY 2025 per enrollee spending as the base year estimate; then, starting in FY 2027, the analysis limits federal spending growth for the five major eligibility groups (children, adults, expansion adults, people with disabilities and aged 65+) to the consumer price index (CPI-U) plus 0.4 percentage points, which is KFF’s estimate of the difference between CPI-U and medical inflation (CPI-M) over the past 20 years (see Methods).
The analysis also estimates the combined impact of implementing a per capita cap and eliminating the ACA expansion federal match rate. The combined policy would include the same per capita caps on federal spending and also assumes that, starting in FY 2027, expenditures for people eligible through Medicaid expansion would be matched at each state’s traditional FY 2026 FMAP rate. This part of the analysis accounts for the interactive effects of these two policy changes; therefore, savings are lower than if each policy was modeled separately and the totals were added together (see Methods). There are a number of other Medicaid policy changes that have been suggested, and policy estimates would likely differ depending on the combination of policies and their interactive effects.
What is the potential impact on Medicaid spending?
This analysis does not make assumptions about specific state behavioral responses and instead examines how the impacts of the two policy alternatives vary based on two types of state responses to the cuts. The state responses are designed to illustrate the spectrum of potential policy change effects. However, in practice, each state is likely to respond to the policy change differently and spending impacts overall would likely fall within the range. While some states may choose to increase state spending to maintain current programs with substantially reduced federal funding, many would likely need to make programmatic cuts, making both the lower end and higher end estimates unlikely. The analysis does not explore people’s insurance coverage after losing Medicaid; some may enroll in another source of coverage, but many others would likely become uninsured. The estimates presented here are not directly comparable to the estimates of federal savings from the Congressional Budget Office (CBO) because CBO’s estimates account for people enrolling in other coverage and make assumptions about how states would respond in the aggregate. While the estimates assume that spending per enrollee by eligibility group would grow uniformly across states based on CBO’s national projections, it is likely that growth rates would vary by state, and that a cap would therefore have varying effects
Per Capita Cap
In analyzing the effects of a per capita cap on Medicaid spending, KFF considered the following two types of state responses.
Pay for Federal Cuts: States maintain per enrollee spending and eligibility at current levels, picking up new costs due to the federal cap on per enrollee spending. Enrollment and total spending would remain constant while costs would shift from the federal government to the states. States would have to make offsetting cuts in programs other than Medicaid or raise revenues.
Reduce Spending and Eligibility: States cap their share of per enrollee spending at medical inflation – e.g., by reducing payment rates to health care providers — and also reduce eligibility by the same percentage that federal spending is cut for each eligibility group to reflect the fact that the federal government is contributing less towards the cost. As a result, there would be decreases in enrollment and total, federal, and state spending.
Capping per enrollee spending could shift costs to states or reduce total Medicaid spending by 14% ($1.4 trillion) over a 10-year period (Figure 1). If states offset the federal cuts, federal Medicaid spending could decrease by 8% or $532 billion over the 10-year period, and states would pay those costs, increasing the state share by 14% across all states. If instead, states cap their share of per enrollee spending and reduce Medicaid eligibility, federal Medicaid spending could decline by 15% or $989 billion, reflecting the fact that per enrollee spending is capped and enrollment goes down. State spending could decline by 12% or $450 billion. Combined, Medicaid spending could decrease by 14% or $1.4 trillion over the 10-year period. The analysis assumes states would reduce Medicaid eligibility proportionally to the cuts in federal spending, and the effects compound over time, meaning spending and enrollment effects are smaller in years just following implementation but grow over time. By the end of the 10-year period, enrollment could be 17% lower than current policy, meaning 15 million people could lose Medicaid coverage. Some who lose Medicaid may enroll in another source of coverage, but many others would become uninsured.
Per Capita Cap and Elimination of the ACA Expansion Match Rate
In analyzing the effects of a per capita cap on Medicaid spending if it were combined with the elimination of the ACA expansion match rate, KFF considered the following two types of state responses.
Pay for Federal Cuts: States maintain per enrollee spending and eligibility at current levels, picking up new costs due to the federal cap on per enrollee spending and the loss of the higher match rate for expansion enrollees. Enrollment and total spending would remain constant while costs would shift from the federal government to the states.
Reduce Spending and Eligibility: States cap their share of per enrollee spending at medical inflation, drop the ACA Medicaid expansion, and reduce eligibility by the same percentage that federal spending per enrollee is cut for each eligibility group, resulting in changes to enrollment and to total, federal, and state spending as well as per enrollee spending.
Capping per enrollee spending and eliminating the ACA expansion match rate could shift costs to states or reduce total Medicaid spending by a quarter ($2.6 trillion) over a 10-year period (Figure 2). If states pay for the cuts, federal Medicaid spending could decrease by 15% or $1 trillion over the 10-year period, and states would pay those costs, increasing the state share by 27% across all states. If instead, states cap their share of per enrollee spending and reduce Medicaid eligibility, federal Medicaid spending could decrease by 32% or $2.1 trillion, and state spending could decrease by 15% or $571 billion. Combined, Medicaid spending could decrease by 26% or $2.6 trillion over the 10-year period. Enrollment losses could increase each year proportionally with the increase in federal spending cuts, resulting in 30 million (or 36%) fewer people with Medicaid coverage by the end of the 10-year period.
Impacts on State Spending if States Pay for Federal Cuts to Medicaid
Under both policy alternatives, costs would shift significantly from the federal government to the states if states chose to maintain current benefits and eligibility, causing state Medicaid spending per enrollee to increase by $1,500 to $2,300 in FY 2034 (Figure 3). With federal Medicaid spending per enrollee capped, state spending per enrollee could increase from $5,500 under current policy to $7,000 with a per capita cap and $7,800 if the per capita cap were paired with the elimination of the ACA expansion match rate. By FY 2034, the federal share of Medicaid spending on average across states could fall from 64% to 54% with a per capita cap and 49% if the per capita cap were paired with elimination of the ACA expansion match rate.
All states would be affected by a per capita cap, but the specific effects vary depending on the mix of enrollees in a state, with state spending increasing by as much as 57% in some states if paired with the elimination of the ACA expansion match rate (Figure 4). If states opted to pay for the federal Medicaid cuts, state spending on Medicaid could increase anywhere from 6% to 57% over 10 years. Expansion states could experience much larger state cost increases, ranging from 18% to 57% if the per capita cap were paired with the elimination of the ACA expansion match rate, whereas state cost increases for all non-expansion states could remain at or below 21%. While this analysis assumes that growth rates for each eligibility group are uniform across states under current policy, it’s likely that growth rates would vary by state in any given period based on policy choices and underlying factors related to their economies and health systems.
Impacts on Medicaid Spending and Enrollment if States Respond to Federal by Cutting Spending and Eligibility
The effects of per capita caps differ across eligibility groups because spending for different eligibility groups grows at different rates, with larger effects among children and adults who are not eligible because they have a disability or are ages 65 and older. The effects vary by eligibility group because spending estimates under current policy assume that per enrollee spending for each group grows at different rates (aligning with CBO per enrollee spending growth assumptions), but the per capita cap policy would limit the growth for all groups using the same inflation rate. Spending grows at different rates largely based on the percentage of spending that comes from use of long-term care for each eligibility group. Although Medicaid enrollees who use long-term care have much higher per enrollee costs, CBO expects those costs to grow more slowly in future years. By FY 2034, the decline in per enrollee spending under a per capita cap could be: 24% for expansion adults, 20% for other adults, 19% for children, 11% for people eligible because of a disability, and 6% for adults ages 65 and older.
This analysis assumes that states would reduce eligibility in proportion with the cuts to federal spending, resulting in larger total spending and eligibility cuts among children and adults who are not eligible because they have a disability or are ages 65 and older (Figure 5). Under a per capita cap, total spending would drop to reflect the lower per person costs and the reductions in eligibility, which would be proportional to the cuts in federal spending. In FY 2034, an estimated 15 million fewer people could be covered by Medicaid including:
5.3 million children,
4.8 million adults eligible through the ACA expansion,
2.9 million parents and other adults under age 65,
1.3 million people with disabilities, and
0.6 million people ages 65 and older.
An additional 15 million expansion enrollees could lose Medicaid coverage (totaling about 20 million expansion enrollees by FY 2034) if the ACA expansion match rate is also eliminated. Some people losing Medicaid would be eligible for ACA marketplace coverage (those with incomes 100-138% of the poverty level) and others would be able to obtain employer-sponsored health insurance. But, others would become uninsured. Most people over age 65 and some who qualify for Medicaid based on a disability would generally be able to maintain Medicare coverage but could lose access to wrap-around services not covered by Medicare.
All states would be affected by a per capita cap, but the specific effects vary, with enrollment decreasing by as much as 57% in some states if paired with the elimination of the ACA expansion match rate in 2034 (Figure 6). If states respond to federal cuts by reducing eligibility, Medicaid enrollment could decrease anywhere from 12% to 57% in 2034. Expansion states could experience much larger enrollment declines if paired with the elimination of the ACA expansion match rate, ranging from 31% to 57%, whereas enrollment declines for all non-expansion states could remain at or below 17%.
What are other implications to consider?
Medicaid per capita caps lock in historical spending patterns, and the effects would compound overtime so the full implications would not be visible until after FY 2034. Per capita caps are initially set to reflect historical spending patterns that vary by state and eligibility group. Spending per enrollee will grow at the same rate for all states and eligibility groups, meaning that the low-spending states today will continue to be low-spending states indefinitely, and the same is true for spending across the eligibility groups. Moreover, the caps are typically designed to constrain federal Medicaid spending growth to a rate slower than is expected under current law, which is how they achieve federal savings. As time passes, the effects compound, limiting states’ ability to meet changing needs and demands. Federal spending reductions in FY 2034, the final year of the analysis, are larger than reductions over the full 10-year period (Figure 7), and the effects on enrollment and spending in future years would continue to grow.
The effects of a per capita cap on Medicaid spending and enrollment are also highly sensitive to policy design, inflation rates, and how states respond to the cuts; and estimates are highly sensitive to assumptions about those factors. Decisions about how to calculate the per enrollee allotments for the base year and how to grow the allotments over time would determine the magnitude of costs shifted to states. The effects also depend on how much Medicaid costs grow over time and how they compare with changes in the inflator used to calculate the caps. States’ responses to the cuts would determine how much total spending and enrollment changed. If per capita caps are paired with other cuts to Medicaid, effects would be larger, and there would be more pressure on states to respond with programmatic cuts. Estimates of the effects of different per capita cap proposals may find a wide range of outcomes depending on what assumptions are made to complete the analysis.
A per capita cap would fundamentally change the Medicaid federal-state partnership by eliminating the federal guaranteed match and transferring new financial risk to states. Per capita caps allow federal spending to rise with enrollment; however, spending would not rise to account for: increasing costs due to the emergence of new technology such as cell and gene therapies, changes in population health status that increase per enrollee spending, or increased provider payment rates enacted to address workforce shortages. Medicaid is currently a partnership between the federal and state governments with both entities sharing the financial risk. Under a per capita cap scenario, federal spending would be lower and more predictable. The federal government would only bear risk associated with enrollment changes and the states would assume 100% of the risks associated with other factors that affect health care spending.
Under any per capita cap policy, states would face challenges and there would be pressure to reduce benefits and eligibility, but the effects would be larger if a per capita cap were paired with other Medicaid cuts. To maintain current policy, states would have to increase state tax revenues or decrease spending on non-Medicaid services such as education, which is the largest source of expenditures from state funds. Given the size of the federal funding cuts, states would face significant challenges in efforts to replace the loss of federal funds, which would be exacerbated if paired with other reductions in federal funding for areas beyond Medicaid. The loss of federal revenues would create significant pressure to eliminate the Medicaid expansion and restrain the growth in per enrollee spending for other enrollees. Medicaid spending per enrollee already grows at a slower rate compared with private insurance and Medicare, leaving fewer options for cutting per enrollee costs. States would all respond differently but could reduce spending by cutting optional benefits (which includes prescription drugs and nearly all home care, also known as home and community-based services or HCBS), reducing provider payment rates, or cutting eligibility for the specific eligibility groups with higher per person spending, such as those linked to the use of long-term care.
If states are unable to maintain Medicaid eligibility, benefits, and payment rates, there could be increases in the number of people who are uninsured, reduced access to care, and significant reductions in payment rates to providers. Reduced Medicaid eligibility would mean an increase in the number of uninsured people, with the most notable increases likely among people eligible for coverage through the ACA expansion, though people with disabilities may be particularly vulnerable on account of their more extensive health needs. Enrollees with incomes between 100% and 138% of poverty could be eligible for coverage through the ACA marketplaces, but ACA coverage could soon become more costly for enrollees if the enhanced subsidies expire at the end of 2025, and few low-income people have access to insurance through their employer. An increase in the number of uninsured people could reverse gains in financial security, access to care, and health outcomes as well as lead to loss of revenues and increased uncompensated care costs for providers. Providers could also face revenue losses from lower Medicaid payment rates or coverage of fewer services, which could exacerbate issues with access to care for Medicaid enrollees and within the health care system more broadly.
Appendix
Methods
Data: To project Medicaid enrollment, spending, and spending per enrollee by state and eligibility group, this analysis uses the Medicaid CMS-64 new adult group expenditure data collected through MBES for FY 2023 (downloaded in December 2024), Medicaid new adult group enrollment data collected through MBES for June 2024 (downloaded in December 2024), the 2019-2021 T-MSIS Research Identifiable Demographic-Eligibility and Claims Files, and the June 2024 Congressional Budget Office (CBO) baseline.
Overview of Approach:
Develop baseline projections of Medicaid enrollment, spending, and spending per enrollee by state and eligibility group from FY 2025 through FY 2034 (a 10-year period). This model estimates Medicaid enrollment and spending under the status quo with no policy changes.
Estimate Medicaid enrollment, spending, and spending per enrollee by state and eligibility group over the same 10-year period after accounting for the effects of proposed policy changes.
Calculate differences in Medicaid enrollment, spending (including federal, state, and total spending), and spending per enrollee in the policy change scenario relative to the baseline projections.
The estimates do not predict states’ responses to federal policy changes, but we examine differences in Medicaid enrollment, spending, and spending per enrollee under different scenarios to reflect the range of outcomes depending on state responses.
Definitions and Limitations:
At the time of publishing, CBO had released their January 2025 baseline. However, this analysis uses CBO’s June 2024 baseline because it was the most recent baseline with spending projections by Medicaid eligibility group.
The estimates assume that all states experience the same growth rates for Medicaid enrollment and spending; and that total spending grows at the same rate as federal spending.
FMAP calculations do not account for the other services that are matched at a higher rate, which include family planning, services received through an Indian Health Services facility, expenditures for Medicare beneficiaries enrolled in the “Qualifying Individuals” program, and health home services that are matched at a 90% rate. For this reason, the model may underestimate the federal share of spending in some states.
Estimates of total spending include all spending that is matched as medical assistance but exclude states’ administrative costs which are matched at a separate rate. Federal payments for administrative costs are less than 4% of total federal spending, according to the CBO June 2024 baseline.
The analysis does not account for secondary effects or people’s behavioral responses.
The analysis does not include policy effects for states that had not expanded Medicaid under the ACA as of February 2025 but would have done so in the absence of the policy change.
We implement the elimination of the expansion FMAP in FY 2026 and the per capita cap in FY 2027; we assume they take effect immediately.
To implement a per capita cap, this analysis uses CPI-U + 0.4% instead of CPI-M because projections of CPI-M are not available. Studies and data show that in any given year, either measure may be higher so it’s unclear whether savings would be larger or smaller using a different measure. We chose to add 0.4% to CPI-U because over the past 20 years, CPI-M was 0.4% higher than CPI-U.
We provide more details about the baseline model below.
1. Estimate initial Medicaid spending and enrollment by eligibility group using the most recent years’ data available (FY 2023 for spending data and FY 2024 for enrollment data).
First, we pull the quarterly Medicaid CMS-64 new adult group expenditure data collected through MBES for FY 2023 and aggregate total spending by state for enrollees in the ACA expansion group and for all other Medicaid enrollees. Spending reflects an accrual basis of accounting.
We exclude spending on DSH by calculating the share of spending on DSH from the FY 2023 CMS-64 Financial Management Report and reducing medical assistance among non-expansion enrollees by that share.
Separately, we pull the Medicaid new adult group enrollment data collected through MBES for June 2024. This data includes enrollment by state and is broken into ACA expansion group enrollees and all other Medicaid enrollees. MBES enrollment includes individuals enrolled in limited benefit plans and only includes individuals whose coverage is funded through Medicaid (not CHIP).
To obtain spending and enrollment estimates across the remaining eligibility groups (seniors, individuals with disabilities, children, and other adults), we apply the distribution of spending and enrollment across the groups and by state from T-MSIS to the FY 2023 spending data and June 2024 enrollment data. We use the average distribution from 2019 to 2021 to mitigate the impact of the continuous enrollment provision (data in states denoted as “unusable” for a given year by the DQ atlas were excluded from the averages).
2. Calculate initial spending per enrollee in FY 2024.
We grow Medicaid spending in FY 2023 by CBO’s growth rates for federal benefit payments by eligibility group to get Medicaid spending in FY 2024. The June 2024 enrollment data is used as our FY 2024 enrollment.
We divide Medicaid spending in FY 2024 by Medicaid enrollment in FY 2024 (for each state and eligibility group) to get Medicaid spending per enrollee in FY 2024.
3. Project total spending and spending per enrollee for fiscal years 2025 through 2034 using CBO growth rates and use those estimates to calculate future years’ enrollment.
Starting with spending data for FY 2024, we apply the CBO growth rates to estimate Medicaid spending in FY 2025 through FY 2034.
Starting with per enrollee spending in FY 2024, we apply the CBO growth rates for average federal spending on benefit payments per enrollee to estimate Medicaid spending in FY 2025 through FY 2034.
We calculate enrollment growth in FY 2025 through FY 2034 by dividing estimated Medicaid spending by estimated spending per enrollee.
4. Split total Medicaid spending over the 10-year period into federal and state spending.
We calculate federal and state spending by using a 90% match rate for the ACA expansion group and the traditional state FMAPs for the remaining eligibility groups. We use the FY 2025 FMAPs for FY 2025 and FY 2026 FMAPs for FY 2026 and beyond.
We provide more details about the policy change scenarios below.
1. Calculate spending and spending per enrollee under a per capita cap if states pay for federal cuts to maintain spending and eligibility by state.
Assume expansion enrollment and total spending remain the same as the baseline model over the 10-year period.
Establish the base year of per capita spending as the lessor of FY 2025 or FY 2027. We chose FY 2025 because most per capita cap proposals use spending from the period prior to enactment of the law to prevent states from inflating their base estimates of per capita spending in response to the law. We assume the per capita cap takes effect in FY 2027, so FY 2025 and FY 2026 per enrollee spending are the same as baseline and FY 2027 per enrollee spending is the same as the base year. We also assume that if states’ per enrollee spending for an eligibility group dropped between FY 2025 and FY 2027, the per capita cap would start at the lower baseline level to avoid giving states a higher match rate than they would have received under current policy.
After FY 2027, growth in per enrollee spending is capped at estimated medical inflation levels. To estimate medical inflation, we use CPI-U (Consumer Price Index for All Urban Consumers) + 0.4%, which is the difference in CPI-U and CPI-M (CPI Medical Care) over the past two decades.
Calculate new federal spending levels based on the capped per enrollee amounts by first multiplying enrollment and new per enrollee levels and then calculating the federal share using the FMAP.
For the combined per capita cap and elimination of the ACA expansion match rate, we assume the elimination of the expansion FMAP takes effect in FY 2027, so FY 2025 and FY 2026 federal and state spending are the same as baseline. Starting in FY 2027, we apply the 2026 traditional state FMAPs to the expansion group spending instead of the 90% rate to split total spending into the federal share.
State spending is calculated as the difference between baseline total spending (held constant) and new reduced federal spending levels.
2. Calculate spending and enrollment if states respond to federal cuts by reducing spending and eligibility by state.
Per enrollee spending is capped and grown at CPI-U + 0.4% starting in FY 2027 (same as above).
Enrollment for each eligibility group is reduced by the same percentage that federal spending has been cut each year. This increases each year, but reaches 24% for expansion adults, 20% for other adults, 19% for children, 11% for people eligible because of a disability, and 6% for adults ages 65 and older by FY 2034. The total federal spending reduction and resulting total enrollment reduction are not equivalent due to differences in the distribution of spending and enrollment across groups.
For the combined per capita cap and elimination of the ACA expansion match rate, starting in FY 2027, expansion enrollment is reduced to zero, leading to zero total spending for expansion enrollees for FY 2027 – FY 2034.
Calculate total spending for other eligibility groups by multiplying new enrollment by capped per enrollee levels.
Split total Medicaid spending for other eligibility groups into federal and state spending using traditional state FMAPs.
3. Calculate differences in Medicaid enrollment, spending (including federal, state, and total spending), and spending per enrollee relative to the baseline projections.
The Republican-led Congress is considering plans to cut Medicaid to help pay for tax cuts, with the House budget resolution targeting $880 billion or more in potential reductions to federal Medicaid spending. Medicaid is the primary program providing comprehensive health and long-term care to one in five people living in the U.S and accounts for nearly $1 out of every $5 spent on health care. Reductions in Medicaid could have implications for enrollees as well as plans, providers, and state budgets. While there are several policy options under consideration in Congress to achieve savings, it is not clear how much support there is from Republicans (including President Trump) about these specific policies. The discussions in Congress come at a time when support for the Medicaid program continues to be strong. According to KFF polling, Medicaid is viewed favorably by a large majority (77%) of the public and an even larger share of those on the program (84%). As Congress considers reducing Medicaid spending, nearly half (46%) of all people and nearly two-thirds (62%) of Medicaid enrollees believe the federal government is currently not spending enough on the program.
To better understand the experiences of Medicaid enrollees and their perceptions of potential changes to the program, KFF conducted five virtual focus groups in January, including three groups with participants who had voted for President Trump in the 2024 election and two groups with participants who had voted for Vice President Harris. Focus group participants were asked about their experiences with their Medicaid coverage, views on government’s role in health care, and perceptions of the recent election. Participants were also asked for their reaction to current proposals to reduce federal spending on Medicaid and impose work requirements. Despite differences in who they voted for in November 2024, participants had consistently favorable experiences with Medicaid and concerns with potential cuts to the program. Key findings from our groups include the following:
Many Trump and Harris voters said that their top voting issue in the 2024 election was the economy, though some Trump voters cited immigration, and some Harris voters cited women’s rights as their top issues, and most participants said they did not recall hearing about changes to health care programs (including Medicaid) during the campaign. Most participants said the government has a role to play in making health care more affordable and accessible, but some Trump voters argued the private sector does a better job of controlling costs. When asked about fraud in the Medicaid program, many participants said they thought fraud exists, but views differed on whether it is a major issue and what was the primary cause. Several Trump voters believed the problem was due to people enrolled who were not eligible; however, other participants, including both Trump and Harris voters countered that state verification procedures prevent individuals from defrauding the program on a large scale and that providers and insurance companies were more likely the main source of program fraud.
At the time of the focus groups, most participants had not heard about proposals to reduce federal spending on Medicaid, and while most did not know why the reductions were proposed, some Trump voters suggested they were part of the crackdown on illegal immigration and aimed at removing undocumented immigrants from the program (undocumented immigrants are not eligible for federally-funded Medicaid). Participants opposed cutting Medicaid funding to pay for tax cuts that they did not believe would benefit them. Both Trump and Harris voters expressed fears that these changes would jeopardize the program, take away access to health care, result in worse health outcomes, and increase out-of-pocket costs. A few Trump voters did not believe Trump would follow through on the cuts to Medicaid because they believed he understood their financial struggles.
Both Trump and Harris voters valued their Medicaid coverage and the access to health care services, mental health services, and medications for themselves and their children it provides. Participants also valued Medicaid because it helps to protect them from financial disaster, alleviates stress, improves health outcomes and often supports their ability to work. Participants said losing Medicaid would “be devastating” and lead to serious consequences for their physical and mental health and exacerbate pre-existing financial challenges.
If work requirements were introduced to Medicaid, participants who were working generally felt confident in their ability to meet the requirements; however, they worried about the burden of monthly reporting requirements when those were described to them. Many participants across parties noted that access to treatment for chronic conditions, including prescription medications and mental health treatment, were key in helping to support their ability to work. More Trump voters supported a work requirement but some who were not working were convinced they would qualify for an exemption. Other participants, including both Trump and Harris voters, who were not currently working felt they would face challenges in meeting the requirements. Those who were not working said they wanted to work (and many had been previously working for many years) but were generally unable to because of disability or because they were caring for young children or a sick parent.
Both Trump and Harris voters wanted policymakers to focus on improving Medicaid instead of cutting it. For example, some participants said they would like to see enhanced dental benefits, increased doctor availability, and fewer prior authorization requests. Focus group participants wanted policymakers to consider the implications of federal cuts to Medicaid for people, their health, financial stability, and ability to be productive members of society.
General Situation
Most focus group participants were experiencing financial challenges and were managing an array of physical and/or mental health conditions. Medicaid eligibility requirements mean those on the program, by definition, have low incomes. Most participants described struggling with high food prices and noted the past few years have been financially difficult. Some focus group participants reported difficulties with the current job market or described injuries or disabilities that made it difficult to find employment. Focus group participants were managing an array of health conditions including high blood pressure, diabetes, physical disabilities, chronic pain, asthma, and anxiety and depression. Some were managing more complex and potentially disabling conditions, such as cystic fibrosis and hidradenitis suppurativa (HS). Along with managing their own conditions, some participants were also caring for parents or other family members in nursing care.
“Times are tough right now. You know, everything’s overpriced and no one’s working and can’t afford anything and my health is terrible, so it’s kind of tough times.”
50-year-old, White female(Trump voter, Nevada)
Experiences with Medicaid
Participants valued their Medicaid coverage and the access to health care services, mental health services, and medications for themselves and their children it provides. Along with regular physical exams for themselves and their children, focus group participants reported using Medicaid to see specialists, access mental health and substance use disorder treatment, receive necessary surgeries, and get prescription medications. Some participants with health conditions requiring frequent visits with specialists or multiple daily medications said they could not imagine day-to-day life without Medicaid.
“Doctor’s visits, I take 30 pills a day, so it covers all that, which is nice. I see the ENT like every other week.”
35-year-old, White female (Trump voter, North Carolina)
“I’m really grateful for it. When I first got on it, it covered for 90 days for me to go to a rehab and then it has covered my prescriptions with no questions asked.”
33-year-old, White female(Trump voter, Arizona)
Participants described Medicaid coverage as affordable, noting that it protects them from financial disaster and alleviates stress. Participants expressed gratitude that they could access necessary medications with little to no cost sharing, and in general were appreciative that they had no premiums and low out-of-pocket costs. Participants said that having Medicaid reduces stress related to unexpected medical costs. Prior to enrolling in Medicaid, many participants had been uninsured and had gone long periods of time without seeing a doctor. These participants were grateful that they were now able to access regular care. Those who had previously looked into or been enrolled in private insurance described Medicaid as a more affordable source of coverage.
“I never took insurance from where I was employed at because it was always so expensive. By the time they would take out the money, there wasn’t much of a check. So I was basically gonna be paying for insurance, which I know a lot of people have to do. Went a while without anything so Medicaid’s been really great as far as helping me out with doctor appointments, used to help me out with dental. I used it a little bit for mental therapy when I lost my daughter unexpectedly. So it’s been good.”
61-year-old, White female(Trump voter, Kentucky)
While participants said Medicaid was generally working well for them, some would like to see improvements, including enhanced dental benefits, increased doctor availability, and fewer prior authorization requests. Participants noted that it can be difficult to find doctors accepting Medicaid and frustrating to navigate prior authorizations for needed care. Other complaints included high turnover rates among providers at clinics that accept Medicaid and certain prescriptions not being covered by the program. Many focus group participants also wished that their state either covered dental benefits or had more generous dental benefits.
“There’s not like every doctor available, thankfully the doc I had before, I still am on the same doctor ’cause he is under my Medicaid, which is good. But there’s not coverage everywhere and certain things, so that’s kind of, you know, slight disadvantage there.”
59-year-old, White male (Harris voter, Pennsylvania)
Views on Government’s Role in Health Care
Participants felt that being able to easily access affordable health care services is essential to ensuring they can work and lead productive lives. Across voting parties, most participants felt that everyone deserved access to affordable health coverage, with many saying that people should not have to pay for what they described as “life or death” care. Some participants noted that being able to access health care services helps them to work, be more productive, and contribute to society. However, a few Trump voters talked about the need for people to take responsibility for their health suggesting that they did not believe health care was a right for everyone.
“Healthcare is a right because you want the American people to work. So in order for the American people to work, they need to be healthy to work.”
52-year-old, Black female (Trump voter, Pennsylvania)
“If we’re healthier, it makes our country healthier and we produce. If you got a bunch of sick people that have no insurance, all you’re gonna do is cause debt, death, and god knows what else.”
56-year-old, White male(Harris voter, Ohio)
Most participants said the government has a role to play in making health care more affordable and accessible; however, some Trump voters opposed government playing too large a role in running the health care system. Both Trump and Harris voters said the government has a role in making coverage more affordable, but some Trump voters noted that they felt private businesses may be more effective at keeping health care costs affordable than the federal government. More Harris voters (and some Trump voters) felt that the government should play a role in helping everyone access health care and in making the system work better. Both Trump and Harris voters compared the U.S. to other countries with nationalized health care systems, though takeaways from these comparisons differed. Some Trump voters referenced long wait times for care in other countries as evidence for why they did not think the U.S. should move to a socialized medicine model. Others (including both Trump and Harris voters) noted that the government should offer free care for all citizens, similar to other countries.
“It should be available for everybody. And it should be affordable. Because not everybody can afford the same thing… it’s usually the private sector does a better job with lowering costs and making things affordable and having options for people, not the government. I pay enough already in taxes that I don’t need to control anymore what I have to pay taxes for.”
45-year-old, Black male (Trump voter, Kentucky)
“It shouldn’t be an issue in a country this rich that people are going without it. I mean, it shouldn’t even be a question. It should be cut and dry. And we look at other countries, you know, it’s something they already have that the citizens have. And for a country that’s rich as America, it shouldn’t be your money or your life. You shouldn’t have to choose between medicine or buying food, or medicine and paying your life bill. It’s a right of an American citizen.”
61-year-old, Black female (Harris voter, Kentucky)
Election Experiences
Many Trump and Harris voters said that their top voting issue in the 2024 election was the economy. Most Trump and Harris voters cast their ballot based on economic concerns and which candidate they thought would address their pocketbook issues, including housing costs and grocery prices. Some Trump voters noted that their standard of living was better under the first Trump administration while some Harris voters were worried that Trump would cut benefits. Immigration was a top voting issue for some Trump voters, especially for those living in border states. A few Harris voters cited women’s issues and preserving democracy as the motivations for their votes.
“When Trump was in office from ‘16 to ‘20, you know, my standard of living was better than it is now.”
43-year-old, White male (Trump voter, Pennsylvania)
“Someone who’s not about to cut food stamps, cut housing, cut WIC, cut many stuff that we everyday people need.”
45-year-old, Black female (Harris voter, Ohio)
Most participants said they did not recall hearing either candidate mention changes to health care programs (including Medicaid) during the campaign. Because other issues, including immigration and the economy, dominated the campaign, most participants were unaware of either candidate’s health care priorities and any policy changes they planned to make. Some Harris voters recalled Harris discussing women’s health care and abortion access, and a couple of participants said they heard that Trump would either try to get rid of Obamacare (the Affordable Care Act) or would fix it. However, for the most part, health care issues were not a dominant factor in the election for these voters.
“I didn’t hear a peep about healthcare. Nope. It’s immigration for me.”
56-year-old, White male(Trump voter, Arizona)
“I think Kamala talked about healthcare like for women’s rights a lot. I feel like that was kind of one of her main points… I had never really heard Donald Trump talk about it. I heard about it in like Project 2025.”
25-year-old Black female (Harris voter, Pennsylvania)
Proposals to Reduce Federal Medicaid Spending
At the time of the focus groups, most participants had not heard about proposals to reduce federal spending on Medicaid, but Trump and Harris voters had different opinions on why the cuts were being proposed. No Trump voters and only a very few Harris voters said they were aware of proposals in Congress to reduce federal spending on Medicaid, and many were surprised to hear of the proposed cuts. Although most participants were not sure why the spending reductions had been proposed, some Trump voters theorized that it was part of the administration’s crackdown on illegal immigration and an effort to remove undocumented immigrants from the program (undocumented immigrants are not eligible for federally-funded Medicaid). A few Trump voters did not think Trump would follow through on the cuts because they believed he understood their financial struggles. Some Harris voters felt the proposals reflected a pattern by Republican lawmakers to reduce benefits for poor Americans.
“I’m a border state, so we’ve had so many illegals coming through and the previous administration they got all free social services. So I imagine that’s part of the thing that we were giving Medicaid to people who have been here hours and stuff. And so it’s one way to prevent or to get some cost cutting.”
“Their goal is to make sure that we don’t have anything. So why they’re taking everything outta everything because the rich wanna get richer.”
58-year-old, Black female (Harris voter, Ohio)
“I think Trump knows that people are struggling right now, and I don’t think he’s gonna do, at least not right now, cut anything Medicaid because he just knows people’s financial problems right now.”
45-year-old, Hispanic male (Trump voter, Arizona)
When asked specifically about fraud and abuse in Medicaid, some participants across both groups believed there is fraud and abuse in the Medicaid program, but opinions were mixed on whether the source of the fraud is people enrolled who should not be or providers and insurance companies taking advantage of the system. The Trump administration has tied current actions to reduce federal spending to eradicating fraud, waste, and abuse within government programs. Many focus group participants agreed there was fraud in the Medicaid program; however, some described fraud as a major problem in the program and others reasoned there is fraud in Medicaid because there is fraud everywhere. When identifying the source of fraud in Medicaid, several Trump voters believed fraud was primarily due to people enrolled who were not eligible. Other participants, including both Trump and Harris voters countered that it would be too difficult for individuals to defraud the program on a large scale, describing how their states verify their income and other information at application and renewal. Some participants believed that providers and insurance companies overcharging the program or billing for services they did not provide were to blame rather than individuals. These participants offered examples of providers in their states who were convicted of fraud.
“Fraud is probably pretty prevalent, just like it was in everything else… People can abuse anything, so. If they have access to that, I’m sure there’s been some fraud over the years with Medicaid.”
56-year-old, White male(Trump voter, Arizona)
“I think it’s organizations more than people. I think it’s kind of hard to defraud with Medicaid. I mean, what are you doing going and asking for prescriptions and then selling them on the side? I mean, I don’t know how you would or having a high paying job and pretending you don’t work. I mean everything is available now on the internet. Everything’s tied in. Like me, our local Medicaid in Arizona was able to access my paychecks even before I saw what I was going to get one time they had it already on their screen.”
“Most of the fraud that I’ve heard about comes from the actual provider billing for things they didn’t do.”
45-year-old, Black female(Harris voter, North Carolina)
Both Trump and Harris voters opposed cuts to the program fearing that Medicaid spending reductions would jeopardize the program and take away access to health care for poor people. Likely because of their reliance on the Medicaid program, participants opposed reducing spending on Medicaid, and many used strong language to describe the dire consequences of making major cuts to the program. Some participants predicted people would lose coverage if cuts were made to the program, and one participant suggested the economy would suffer because many of the people currently on the program would no longer be able to get the care they need. Others anticipated that states would cut benefits, particularly for prescription medications and mental health care, and that providers would stop participating in the program.
“We shouldn’t have to suffer because of somebody wanting to propose cuts to it, you know, because we, we didn’t do anything. So, you know, let it, it can come from somewhere else. I just, I would oppose it.”
60-year-old, Black male (Trump voter, Missouri)
“People would be unable to take care of themselves and be healthy and get mental health issues taken care of, to get vision and dental; people would suffer. They wouldn’t be able to work. And the economy would suffer.”
55-year-old, White female (Trump voter, Oklahoma)
“I would oppose [cutting Medicaid] just because there’s a lot of people who need it, who would be affected by it negatively.”
29-year-old, White male(Trump voter, Pennsylvania)
Participants opposed cutting Medicaid funding to pay for tax cuts that they did not believe would benefit them. Participants explained that because they had low incomes and were already in a low tax bracket, they did not expect their taxes would change much under any tax cut proposal. Both Trump and Harris voters said they would prefer Medicaid coverage to continue unchanged, arguing that the negative consequences of any changes to Medicaid would outweigh any small benefits they would experience from tax cuts. They said other government spending should be targeted to finance tax cuts.
“I don’t make much money to get my taxes affected by that. It would hurt my Medicaid, my medical more.”
50-year-old, White female (Trump voter, Nevada)
“They need to start taxing the right people properly first and then we can discuss that matter. Because we’re the only ones that are paying the taxes… They could put more into the programs if they tax the proper people properly.”
56-year-old, White male(Harris voter, Ohio)
Participants expected significant changes to the Medicaid program if federal funding were reduced and they worried they would lose coverage or face higher costs. Possible Medicaid spending cuts felt very personal to participants who expected they would be negatively affected by the proposed changes. Participants expressed anxiety over how reduced federal spending may affect out-of-pocket expenses, doctor availability, and covered benefits. Some described life and death consequences of not being able to access mental health care and prescription medications to manage their chronic conditions. Others focused on the financial implications of losing coverage and the impact that would have on their ability to work as well as on out-of-pocket costs for needed care. For participants with family members in nursing homes, the challenge of caring for them at home seemed daunting.
“I would be very worried. It would [mean] not being able to get my antidepressants [and] see a psychiatrist. Yeah, it would, it might crush me.”
45-year-old, Hispanic male (Trump voter, Arizona)
“States are gonna have to start dropping people off the rolls. People like us who are probably single and childless.”
45-year-old, Hispanic male(Harris voter, Arizona)
“It’s gonna be higher out of pocket costs for sure. You know, and that’s something I can’t afford. It’s not just me, it’s me and five other people, you know. So I can’t afford that for me, nonetheless them.”
45-year-old, Black female(Harris voter, Ohio)
Work Requirements
While some participants were working full-time, many who were working part-time or not working said they wanted to work or work more hours but were unable to because of disability or because they were caring for young children or a sick parent. Participants were working a variety of jobs, including home health aide, dental assistant, tax preparer and gig and contract work, but they needed Medicaid because they were not offered insurance through their work. Several said they were working part-time or not working because of illness or disability or because they were caring for young children or aging parents. Others said that they wanted to be working but have been unable to find employment. For those who were not working for a reason other than disability or illness, several said that to be able to work, they would need supports like affordable childcare, transportation, internet access, or better opportunities in their communities.
“I do self work with Instacart because …I get to pick and choose the days I’m able to work and dealing with my dad, getting in that nursing home and also dealing with my mom now because she’s getting into that phase where she’s needing more doctor appointments.”
52-year-old, Black male(Trump voter, Missouri)
“I can’t work right now because of my back. And I mean, I believe that my back got as bad as it did because I couldn’t go to the doctor when I didn’t have insurance.”
41-year-old, White female(Trump voter, North Carolina)
“Ever since I haven’t been working, I haven’t been able to find a job that’s legal or decent enough for working from home…They all want somebody in the office to stand up or sit down for long periods of time. I can’t even walk to my vehicle without being in pain. Or get into a vehicle and drive that vehicle because of the stress all behind that.”
51-year-old, Black female(Harris voter, Oklahoma)
Participants who were working said having Medicaid meant they could get the care they needed, especially medications, and provided financial peace of mind that enabled them to work. With high rates of chronic disease among focus group participants, the ability to manage their conditions was described as critical to their ability to work. This was especially true for participants who said their work sometimes exacerbated their health conditions, such as asthma or chronic pain. Keeping Medicaid was important to participants who were working, and several participants noted the challenge of managing work hours to maintain eligibility. One participant described how she lost coverage for one month because she worked too many hours. The income volatility that many workers on Medicaid experience can put them at risk of losing coverage and access to needed prescriptions and health care for a month or longer.
“I can say that even doing the part-time work, if I did not have Medicaid or wasn’t able to do pain management, I wouldn’t even be able to do those, those small amount of hours.”
45-year-old, Black female (Harris voter, North Carolina)
“It would be really hard for me to work a full-time, 9-5 job with all my doctor’s appointments as well as I’m immunocompromised. It’s definitely positive that I can do something I like, something I wanna do and not work as much and still be able to get insurance.”
35-year-old, White female(Trump voter, North Carolina)
“I found out with Medicaid that there’s a cap on how much I can earn. I wasn’t aware of that. And so actually in the fall I was kicked off for about a month because I apparently had earned too much.”
Some participants who were not currently working expressed concerns about imposing work requirements in Medicaid, saying they would face challenges meeting the requirements, while others who supported the policy were convinced they would qualify for an exemption. While most participants had not heard about proposals to introduce work requirements for Medicaid, many Trump and Harris voters who were not working said they did not think they would be able to meet the requirements because of chronic pain or other disabilities. Although not currently working, several of these participants described the high demands of jobs they previously held, noting they had to leave those positions because of injuries or other health conditions. More Trump voters than Harris voters supported a work requirement policy, but several Trump voters who were not working and supported the idea of work requirements strongly believed they would qualify for an exemption because they have a disability or caregiving responsibilities. However, most participants with a disability were not receiving disability income and, therefore, may not meet disability exemptions, which in past proposals have been based on receiving Supplemental Security Income (SSI).
“I can’t because I have chronic pain and I just can’t. I worked until I couldn’t work no more.”
57-year-old, White female(Trump voter, Missouri)
“There’s nothing out here from miles and miles. I live in between two towns and it’s still nothing, you know, so people don’t always have the resources or availability to do what they ask.”
39-year-old, Black female (Harris voter, North Carolina)
“I mean, if you’re able bodied then, then you should still be working and trying and proving to them that you’re able to, ’cause like I said earlier, I want to work, but because of daycare costs, financially I can’t.”
34-year-old, White female(Trump voter, Kentucky)
“I already know I am exempt because I’ve seen this proposal and I already know I was exempt from it. But no, I wouldn’t be able to meet it if I wasn’t exempt.”
57-year-old, White male(Harris voter, Pennsylvania)
Participants who were working generally felt confident in their ability to meet the requirements; however, some worried about the burden of monthly reporting requirements. Given the number of hours they were working, most participants who were working felt that they would be able to meet any new requirements. But on the issue of reporting on work status monthly, participant opinions diverged. Some said that they were already submitting this information regularly to programs such as SNAP, so they were not worried about this requirement also being required in Medicaid. Others, however, expressed concern about having to report to the state each month, noting that they are human and prone to forget and that reporting requirements can be onerous. They also worried about the consequences of losing coverage for a month if they forget to report their work information in a month. As an alternative to submitting additional paperwork, some suggested an automated system, similar to how income is verified at renewal, would be more efficient.
“Required? Oh yeah. Easy. Oh yeah, absolutely. Mind you, I can’t do certain jobs. I can’t drive, if you will, but yeah, I can, I could do it. I can make it work.”
45-year-old, Hispanic male(Harris voter, Arizona)
“It’s gonna be devastating and upsetting to, you know, if you lose your health insurance if I forget as we tend to, we are only humans, sometimes we forget things. So if I don’t do this [report work hours], it affects the rest of my household and I don’t like that.”
45-year-old, Black female(Harris voter, Ohio)
“I would be very worried about them making mistakes. There’s been many times I’ve sent in paperwork and they didn’t get it and coverage was stopped. You know, a lot of room for clerical error and things like that.”
50-year-old, White female(Trump voter, Nevada)
Consequences of Losing Medicaid Coverage
Both Trump and Harris voters said that losing Medicaid coverage would be “devastating” and would lead to serious consequences for their physical and mental health. Participants emphasized that the health care services and prescriptions they and their children receive through Medicaid helps them “survive.” Across groups, participants said that losing their Medicaid coverage would create financial challenges and expressed anxiety at the thought of being unable to afford prescriptions, doctor visits, or higher premiums on top of pre-existing financial challenges if there were major changes to Medicaid. Although focus group participants were not aware of the nuances of congressional proposals, all participants were residing in Medicaid expansion states and those who were eligible due to Medicaid expansion could be especially vulnerable to proposed changes in the program.
“I think obviously, not having access to healthcare, or having to have the financial ability to pay for your medical needs, your basic medical needs, is something that we shouldn’t have to worry about because we worry about how we’re going to eat. We worry about how we’re gonna pay our bills… Not having Medicaid would be, not distressful, it would be detrimental because I need to see a primary care doctor, I need to see my specialist.”
58-year-old, Black female(Harris voter, Ohio)
“For me it would, it would probably lead to death, and that’s kinda harshly speaking, but it’s the way that it would be. I’ve relied upon Medicaid for myself in order to survive. For my son, it would be survivable, but it would be difficult. He has real bad allergies, he wouldn’t be able to hear.”
55-year-old, White female (Trump voter, Oklahoma)
When asked to respond to proposals to reduce federal Medicaid spending, participants appealed to policymakers to consider how these changes would negatively impact people. Participants felt that reducing federal funding for Medicaid would have serious consequences and hurt many people on the program. Some participants pointed out that many people enrolled in Medicaid could not afford any other alternatives and would have no way to access care if they were to lose coverage. The message of several Trump voters to policymakers was to focus on improving Medicaid instead of cutting it. Across groups, participants asked policymakers to remember the human impact of potential changes to the program.
“If you take money from Medicaid, you’re just creating another problem elsewhere. It’s gonna be a group of people that are being hurt over here to help the people over there so it doesn’t add up. It doesn’t make sense.”
45-year-old, Hispanic male(Trump voter, Arizona)
“Leave it alone and make it better.”
57-year-old, White female (Trump voter, Missouri)
“I would just beg them please to do their best to keep medical coverage for people that need it. And I mean, I live every day, day to day taking my meds and I need it. I don’t know what I would do without it.”
39-year-old, Black male (Trump voter, Ohio)
“Well, I think they should step back and look at it and realize that we’re not just a number on a spreadsheet or something that. We’re actually people and what they decide to do has consequences.”
39-year-old, White male(Harris voter, Kentucky)
“Ask yourself, if you’re the person to make the decision to cut [Medicaid], if it was you and someone in your family [who would be affected], what would you do if it was you?”
59-year-old, White male(Harris voter, Pennsylvania)
Methodology
For this project, five focus groups were conducted in January 2025 virtually among a total of 34 adults who self-identified as having Medicaid coverage. Participants all resided in Medicaid-expansion states that went to Trump in the 2024 election (including Arizona, Kentucky, Nevada, North Carolina, Missouri, Ohio, Oklahoma, and Pennsylvania). Groups were stratified by voting history, with three groups being conducted among those who had voted for President Trump in the 2024 election and two groups being conducted among those who had voted for Vice President Harris.
For each group, participants were chosen based on the following criteria: must be between 18 and 65 years of age, must self-identify as currently being enrolled in Medicaid, and must have voted in the most previous election for Trump or Harris. All participants had used their Medicaid coverage in some way in the past 12-months (e.g., doctor visit, filling a prescription). Participants included a mix of adults by gender, race/ethnicity, age, length of time enrolled on Medicaid, health status, disability status, and work and family status.
KFF worked with PerryUndem Research/Communication to conduct the focus groups. The screener questionnaire and discussion guides were developed by researchers at KFF in consultation with PerryUndem. Groups lasted between 90 minutes and two hours and were conducted in English with 6-8 participants each. Groups were audio and video recorded with participants’ permission. Each participant was given an incentive of $150 after participating. Individuals who were able to participate in our groups needed to have two hours of time, a quiet space, a computer, and internet. These characteristics alone may not fully represent many Medicaid enrollees, so findings may not be generalizable to the entire Medicaid population.
Since implementation of the Affordable Care Act’s (ACA) Medicaid expansion in 2014, all but ten states have adopted the expansion to cover adults on Medicaid with income up to 138% of the federal poverty level (FPL) helping to drive the uninsured rate among the population under age 65 to record low levels. While the number of people who fall into the coverage gap has declined as more states implemented the expansion, 1.4 million uninsured individuals remain in the coverage gap in the ten states that have not expanded Medicaid.
Limited Medicaid eligibility in non-expansion states leaves many adults without children, people of color, and those with disabilities without coverage. Most adults in the coverage gap are in working families, though about one in six have a disability that requires ongoing health care and may limit their ability to work. Using data from 2023, this brief estimates the number and characteristics of uninsured individuals in these ten non-expansion states who could gain coverage if Medicaid expansion were adopted.
The future of the Affordable Care Act’s (ACA) Medicaid expansion is uncertain as Congress considers significant changes to Medicaid financing. Some proposals under consideration would eliminate the enhanced 90 percent federal matching rate for the expansion population or make other changes to federal payments to states for this group. Any cuts in federal funding for expansion enrollees would likely lead a number of states to rollback coverage for this population and would increase the number of people who fall into the coverage gap and become uninsured.
How many people are in the coverage gap?
The coverage gap exists in states that have not adopted the ACA’s Medicaid expansion. Under the ACA, Medicaid was expanded to cover adults ages 19 to 64 with incomes up to 138% FPL (or $21,597 for an individual in 2025). This income threshold applied to parents and to adults without dependent children who were previously not eligible for Medicaid. While the ACA intended to require all states to implement the Medicaid expansion, a 2012 Supreme Court ruling made expansion optional for states. As of February 2025, 41 states, including the District of Columbia, have adopted Medicaid expansion (Figure 1).
In the ten states that have not adopted Medicaid expansion, an estimated 1.4 million individuals remain in the coverage gap. These adults have incomes above their state’s Medicaid eligibility threshold but below the poverty level, making them ineligible for ACA Marketplace subsidies (Figure 2). Because the Medicaid expansion was expected to be mandatory for states, the ACA did not provide eligibility for subsidies in the Marketplaces for people below poverty.
Medicaid eligibility remains limited in states that have not expanded their programs. All non-expansion states, except Wisconsin (which provides coverage through a waiver), do not offer Medicaid to adults without children, regardless of their income (Figure 3). As a result, 80% of the individuals in the coverage group are adults without dependent children.
Uninsured rates in states without Medicaid expansion are nearly twice as high as those in expansion states (14.1% vs. 7.6%). People without insurance have more difficulty accessing care, with almost one in four uninsured adults in 2023 not receiving needed medical treatment due to cost. Uninsured individuals are also less likely than those with insurance to receive preventive care and treatment for major health conditions and chronic diseases.
What are the characteristics of people in the coverage gap?
Nearly three-quarters of adults in the coverage gap live in just three Southern states. Texas accounts for 42% of individuals in the coverage gap, the highest share of any state, while Florida and Georgia account for an additional 19% and 14%, respectively (Figure 4). Overall, 97% of those in the coverage gap live in the South. Of the 16 states in the region, seven have not adopted Medicaid expansion.
Nearly six in ten people in the coverage gap are in a family with a worker and over four in ten are working themselves. (Figure 5). However, these individuals work in low-wage jobs that leave them below the poverty level and often work for employers that do not offer affordable job-based insurance. Over half (53%) of workers in the coverage gap are in the service, retail, and construction industries, with common jobs including cashiers, cooks, servers, construction laborers, housekeepers, retail salespeople, and janitors. In non-expansion states, even part-time work can make parents ineligible for Medicaid.
About one in six (16%) people in the coverage gap have a functional disability. The share of people in the coverage gap with disabilities increases with age (Figure 6). Over a quarter (26%) of adults ages 55 to 64 in the coverage gap have a disability compared to one in ten adults under age 25. Adults ages 55 to 64, who often face increased health care needs, account for 17% of all people in the coverage gap. Despite these challenges, many of these individuals do not qualify for Medicaid through a disability pathway, leaving them uninsured. Research shows that uninsured people in this age group may delay necessary care until they become eligible for Medicare at 65.
People of color make up a disproportionate share of individuals in the coverage gap. Six in ten people in the coverage gap are people of color, a higher share than among adults in non-expansion states (49%) and nationwide (44%) (Figure 7). These differences in part explain persisting disparities in health insurance coverage across racial and ethnic groups.
How many uninsured could gain coverage if all states adopted the Medicaid expansion?
Approximately 2.7 million uninsured adults would gain coverage if all states adopted Medicaid expansion. This includes 1.4 million people in the coverage gap and 1.3 million uninsured adults with incomes between 100% and 138% of the FPL, most of whom are eligible for Marketplace coverage but not enrolled (Figure 7 and Table 1). While many of these adults above poverty qualify for zero-premium Marketplace plans, Medicaid generally provides more comprehensive benefits with lower out-of-pocket costs. The potential number of people who could gain coverage through expansion varies by state.
Sammy Cervantes, Clea Bell, and Jennifer Tolbert are with KFF. Anthony Damico is an independent consultant.
Appendix Tables
Data And Methods
This analysis uses data from the 2023 American Community Survey (ACS). The ACS provides socioeconomic and demographic information for the United States population and specific subpopulations. Importantly, the ACS provides detailed data on families and households, which we use to determine income and household composition for ACA eligibility purposes.
Medicaid and Marketplaces have different rules about household composition and income for eligibility. The ACS questionnaire captures the relationship between each household resident and one household reference person, but not necessarily each individual to all others. Therefore, prior to estimating eligibility, we implement a series of logical rules based on each person’s relationship to that household reference person in order to estimate the person-to-person relationships of all individuals within a respondent household to one another. We then assess income eligibility for both Medicaid and Marketplace subsidies by grouping individuals into household insurance units (HIUs) and calculate HIU income using the rules for each program. For more detail on how we construct person-to-person relationships, aggregate Medicaid and Marketplace households, and then count income, see the detailed Technical Appendix A.
Undocumented immigrants are ineligible for federally-funded Medicaid and Marketplace coverage. Since ACS data do not directly indicate whether an immigrant is lawfully present, we draw on the methods underlying the 2013 analysis by the State Health Access Data Assistance Center (SHADAC) and the recommendations made by Van Hook et. Al.1,2 This approach uses the 2023 KFF/LA Times Survey of Immigrants to develop a model that predicts immigration status for each person in the sample. We apply the model to ACS, controlling to state-level estimates of total undocumented population as well as the undocumented population in the labor force from the Pew Research Center. For more detail on the immigration imputation used in this analysis, see the Technical Appendix B.
Individuals in tax-filing units with access to an affordable offer of Employer-Sponsored Insurance (ESI) are still potentially MAGI-eligible for Medicaid coverage, but they are ineligible for advance premium tax credits in the Health Insurance Exchanges. Since ACS data do not designate policyholders of employment-based coverage nor indicate whether workers hold an offer of ESI, we developed a model that predicts both the policyholder and the offer of ESI based on the Current Population Survey (CPS). Additionally, for families with a Marketplace eligibility level below 250% FPL, we assume any reported worker offer does not meet affordability requirements and therefore does not disqualify the family from Tax Credit eligibility on the Exchanges. For more detail on the offer imputation used in this analysis, see the Technical Appendix C.
As of January 2014, Medicaid financial eligibility for most adults ages 19-64 is based on modified adjusted gross income (MAGI). To determine whether each individual is eligible for Medicaid, we use each state’s reported eligibility levels as of May 2024, updated to reflect 2025 Federal Poverty Levels. Some adults ages 19-64 with incomes above MAGI levels may be eligible for Medicaid through other pathways; however, we only assess eligibility through the MAGI pathway.3
An individual’s income is likely to fluctuate throughout the year, impacting his or her eligibility for Medicaid. Our estimates are based on annual income and thus represent a snapshot of the number of people in the coverage gap at a given point in time. Over the course of the year, a larger number of people are likely to move in and out of the coverage gap as their income fluctuates.
Starting with our estimates of ACA eligibility in 2017, we transferred our core modeling approach from relying on the Current Population Survey (CPS) Annual Social and Economic Supplement (ASEC) to the American Community Survey (ACS). ACS includes a 1% sample of the US population and allows for precise state-level estimates as well as longer trend analyses. Since our methodology excludes a small number of individuals whose poverty status could not be determined, our ACS-based population totals appear slightly below CPS-based totals and some ACS population totals published by the Census Bureau. This difference is in large part attributable to students who reside in college dormitories. Comparing the two survey designs, CPS counts more of these individuals in the household of their parent(s) than ACS does.
Technical Appendix A: Household Construction
In KFF’s estimates of eligibility for ACA coverage, income eligibility for both Medicaid and Marketplace subsidies is assessed by grouping people into “health insurance units” (HIUs) and calculating HIU income according to Medicaid and Marketplace program rules. HIUs group people according to how they are counted for eligibility for health insurance, versus grouping people according to who they live with (e.g., “households”) or are related to (e.g., “families”). HIU construction is an important step in assessing income as a share of the federal poverty line (FPL) because it impacts whose income is counted (and thus the total income for the unit) and how many people share that income (and thus the corresponding FPL to use for comparison, since FPL varies by family size). Our HIUs are designed to match ACA eligibility rules for both Medicaid and Marketplaces. Below we describe how we construct HIUs for this analysis. The programming code, written using the statistical computing package R v.4.4.1, is available upon request for people interested in replicating this approach for their own analysis.
Person to Person Relationships
We construct spousal and parent-to-child person-to-person linkage variables within each household of the microdata. The American Community Survey (ACS) includes only the relationship of each person in a household to one central reference person. Using the household reference person’s known relationships to all other individuals within each household, we iterate through every pair of individuals present in each household to determine probable person to person links for possible mother, father, and spousal pairs. Our approach to determining probable family interrelationship linkages closely follows the construction documented by IPUMS-USA with the notable exception of unmarried partner relationships.4 We intentionally diverge from IPUMS-USA because the presence of an unmarried partner relationship does not impact federal program eligibility. Among individuals designated as married with a spouse present in the household, our constructed spousal pointer matches the IPUMS SPLOC variable 99% of the time in the 2013 microdata. Our construction of mother and father pointers match the IPUMS MOMLOC, POPLOC, MOMLOC2, and POPLOC2 variables for more than 99% of all person-records.
Family Aggregation
Separate from person-to-person linkage variables, we assemble individual records into family units reproducing the Census Bureau’s Family Poverty Ratio (POVPIP) variable. Although the Census Bureau does not include a unique family identifier on the ACS microdata, we approximate the groupings used to generate the ACS income-to-poverty ratio variable with the following steps:
Both non-relatives of the household reference person (RELP of 11-17) and all individuals in non-family households (HHT of 4-7) are categorized as single-person families.
Married couples and other family households without subfamilies (PSF of 0) are categorized into single-family households.
Married couples and other family households with subfamilies (PSF of 1) are categorized based on their subfamily number (SFN).
This family identifier is used in estimating family-wide statistics, such as the percent of the uninsured Americans in a family below poverty or the count of Medicaid-enrollees with one or more workers in their family. This family aggregation matches the groupings used to determine the income-to-poverty ratio variable, and estimates of health insurance presented by family poverty categories align with Census Bureau publications based on the ACS.5 Since many family members obtain health coverage separately from one another (for example, an elderly parent cohabiting with their working-age child might hold Medicare coverage and Employer Sponsored Insurance, respectively), descriptive statistics focused on family attributes rely on this family identifier but Medicaid and Marketplace eligibility determinations do not.
Overview of KFF-HIUS
We construct two different HIUs for everyone in the sample: a Medicaid HIU and a Marketplace HIU. We use two HIUs because the rules for counting families and income differ between the two programs. For example, in Medicaid, children with unmarried parents have both parents’ income counted toward their income, whereas under Marketplace rules, only the income of the parent who claims the child on his/her taxes counts. In another example, certain tax dependents (e.g., a parent) are treated differently for Medicaid eligibility than they are for Marketplace eligibility. To account for these rules, we developed an algorithm for sorting people into HIUs. We construct HIUs and HIU incomes separately for each person in a household and take into account the family relationships and income of the other people in the person’s household. People in the same household or in the same family may not have the same HIU composition or income for determining either Medicaid eligibility or eligibility for tax credits.
In simplest terms, the HIU algorithm sorts people into tax filing units. For all people in the data set, the algorithm assesses whether they are likely to be a tax filer themselves and, if so, who they are likely to claim or, if not, who is likely to claim them. It also captures whether someone is neither a tax filer nor claimed as a dependent by someone else. Importantly, the HIU construction considers all relationships for each person within the household. This step is particularly important in correctly classifying people in non-nuclear families (e.g., households with more than one generation, with unmarried partners, or with relatives outside the nuclear family such as an aunt or uncle), which may contain either one or multiple tax filing units.
In counting income for both Medicaid and Marketplace HIUs, we use modified adjusted gross income (MAGI), corresponding to the ACA rules. MAGI differs from total income in that some sources of income (e.g., cash assistance payments from TANF or SSI) do not count toward MAGI. We calculate HIU income as a share of poverty using the Health and Human Services Poverty Guidelines.6
For a small number of people, Medicaid HIU income as a share of poverty does not match Marketplace HIU income as a share of poverty due to the different rules between the programs. This analysis first calculates Medicaid HIU and classifies anyone who meets Medicaid eligibility into that category (including most individuals below 138% FPL in the Medicaid expansion states). We then calculate Marketplace HIU; anyone meeting subsidy eligibility is grouped into that category (above Medicaid and also above 100% FPL up to 400% FPL for most individuals). This approach follows the eligibility rules in the ACA, which specify that people are eligible for tax credits only if they are ineligible for Medicaid.
Steps in Calculating KFF-HIUS
Before we group people into HIUs, we first calculate annual MAGI for each respondent. We compare each person’s income to IRS filing requirements for being a tax filer7 and for being a qualifying relative claimed by someone else.8
We then group people into HIUs. We begin this process by grouping everyone within a household who is related into “cohabitating families.” Cohabitating families include all family relations; they also include unmarried cohabitating partners and relatives of each cohabitating partner.
Within each cohabitating family, we assess whether any individual is eligible to claim any other individual as a tax dependent. People are eligible to claim others as tax dependents if their income is above the IRS filing threshold for a head of household or, if married, for a married couple. People are eligible to be claimed by others if (a) they are a child (under age 19 or, for tax credits, 23 if a full-time student), and someone else in the cohabitating family has at least twice their income, or (b) they are below the limit to be a tax filer, have income below the qualifying relative limit, and someone else in the cohabitating family has at least twice their income. Within each cohabitating family, we assess who is likely to claim whom, using the assumptions that:
People who are claimed by others are more likely to be claimed by close relatives (e.g., a parent) than by others (e.g., a grandparent).
Married couples (who file) file jointly
If more than one person in a cohabitating family is eligible to claim others within that cohabitating family, the wealthiest person claims the eligible dependents.
Once we determine who within the cohabitating family is likely to claim each other, we know the HIU size and are able to apply income rules for the HIU. We apply Medicaid and Marketplace rules for whose income counts in calculating Medicaid HIUs and Marketplace HIUs, respectively.9 People who are filers but are not eligible to claim someone else or to be claimed by someone else are an HIU of 1. People who are not filers and are not claimed by filers have their HIU size and income counted according to Medicaid non-filer rules.10
Inflation Factors
In order to determine ACA eligibility during calendar year 2023, we compared tax filing unit income against the most current premiums available, for open enrollment 2025.11 We relied on the Bureau of Labor Statistics Employment Cost Index (ECI), Private Wages and Salaries to inflate the income of each HIU by approximately 8.0% to align 2023 incomes to 2025 premiums.12 Since most state Medicaid eligibility determinations through the MAGI pathway are calculated as a percent of HHS Poverty Guidelines for that year and not a fixed dollar amount, inflation was not necessary to assess the Medicaid eligibility of individuals.
After inflating 2023 tax filing unit incomes to match 2025 premiums, we similarly inflated 2023 IRS thresholds for both filing requirements13 and for qualifying relative tests14 by the same factor so that these thresholds aligned with the inflated income amounts.
Limitations
As with any analysis, there are some limitations to our approach due to the level of detail that we can obtain from available survey data. Key limitations to bear in mind include:
We currently are not able to appropriately group anyone who lives outside the household with a household that claims them as a tax dependent. For example, we are not able to connect students living away from home or children with a non-custodial parent with the people who may be claiming them (and whose income should count to their HIU). We are also not able to determine married people who file separately.
To group people into tax filing units, we have to make assumptions about how people are likely to file their taxes. We assume that tax filers claim qualifying relatives they are able to claim. We make this assumption based on the fact that Medicaid and Marketplace eligibility rules are determined not by who is actually claimed on the tax return but by who is allowed to be claimed. However, people may sort themselves into different tax filing units than we estimate.
Technical Appendix B: Immigration Status Imputation
To impute documentation status, we draw on the methods underlying the 2013 analysis by the State Health Access Data Assistance Center (SHADAC) and the recommendations made by Van Hook et. al..15,16 This approach uses the 2023 KFF/LA Times Survey of Immigrants to develop a model that predicts immigration status for each person in the sample.17 We apply the model to a second data source, controlling to state-level estimates of total undocumented population as well as the undocumented population in the labor force from the Pew Research Center.18 Below we describe how we developed the regression model and applied it to the American Community Survey (ACS). We also describe how the model may be applied to other data sets. The programming code, written using the statistical computing package R v.4.4.1, is available upon request for people interested in replicating this approach for their own analysis.
Data Sources
We used the 2023 KFF/LA Times Survey of Immigrants l data to build the regression model. The 2023 Survey of Immigrants dataset contains questions on citizenship and legal status at the person level. The KFF/LA Time Survey of Immigrants19 is a probability-based survey exploring the immigrant experience in the U.S. and draws on three different sampling frames including an address-based sample (ABS), a random digit dial (RDD) sample of pre-paid cell phone numbers, and callbacks to an RDD sample in which the individual did not speak English or Spanish. The survey includes interviews with 3,358 immigrant adults and was offered in ten different languages.
The regression model is designed to be applied to other datasets in order to impute legal immigration status in surveys that do not ask about migration status. The code mentioned above includes programming to apply the model to either the Survey of Income and Program Participation (SIPP) Core files, ACS, or the Current Population Survey (CPS). Because the SIPP Core file contains different survey questions and variable specifications from the ACS and CPS, we create unique regression models to apply the model to each dataset. For the analysis underlying this brief and other KFF estimates of eligibility for ACA coverage, we apply the regression model to the 2013 ACS and then each subsequent year of the ACS.
Due to underreporting of legal immigration status in survey datasets, in imputing immigration status we control to state and national-level estimates of the total undocumented population and also the undocumented population in the labor force from the Pew Research Center. Pew reports these estimates for all states and the District of Columbia.20
Construction of Regression Model
We use the 2023 Survey of Immigrants to create a binomial, dependent variable that identifies a respondent as a potential unauthorized immigrant. The dependent variable is constructed based on the following factors:
Respondent was not a United States (US) citizen,
Respondent did not have permanent resident status or a valid work or student visa, , and
Respondent does not have other indicators that imply legal status.21
We use the following independent variables to predict unauthorized immigrant status:
Year of US entry,
Job industry classification,
State of residence,
Household Income,
Ownership or rental of residence,
Number of occupants in the household (< or >= six occupants),
Whether all household occupants are related,
Health insurance coverage status,
Sex, and
Ethnicity.
The regression model was sub-populated to remove respondents who could not be considered unauthorized. People who could not be considered unauthorized include people who are US citizens or have other indicators that imply legal status.
Imputing Unauthorized Immigrants in Other Datasets
We use the Pew estimates as targets for the total number of unauthorized immigrants that the imputation generates. We first apply this strategy to the 2013 ACS, which contains health insurance information prior to the ACA’s coverage expansions. We stratify the targets by state and the District of Columbia and by participation in the labor force. We impute immigration status within each of these 102 strata.22
To generate the imputed immigration status variable, we first calculated the probability that each person in the dataset was unauthorized based on the 2023 Survey of Immigrants regression model. Next, we isolated the dataset to each individual stratum described above. Within each stratum, we sampled the data using the probability of being unauthorized for each person. After sampling, we summed the person weights until reaching the Pew population estimate for each stratum. The records that fell within the Pew population estimate were considered to be unauthorized immigrants. We repeated the process of sampling using the probability of being unauthorized and subsequently summing the person weights to reach Pew targets five times, creating five different unauthorized variables per record. These five imputed authorization status variables were then incorporated into a standard multiple imputation algorithm, closely matching the imputed variable analysis techniques used by the Centers for Disease Control and Prevention for the National Health Interview Survey.23
We used this first pass on the ACS 2013 to inform our sampling targets for the latest available microdata (ACS 2023). Looking at the results of our undocumented imputation on the ACS 2013, we calculated the share of undocumented immigrants lacking health insurance within each of those 102 strata prior to the ACA’s coverage expansions and transferred that information into a new dimension of sampling strata for the ACS 2023. We split each of the 102 sampling strata used on the pre-ACA ACS 2013 into uninsured versus insured categories, resulting in 204 sampling strata for subsequent years. We then repeated our imputation on the ACS 2023 with the newly-divided strata, allowing for a small decline in the undocumented uninsured rate based off of the percent drop in the uninsured rate among citizens.24
To easily apply the regression model to other data sets, we created a function that applies this approach to a chosen data set. The function first loads the dataset of choice, then standardizes the data to match the independent variables from the 2023 Survey of Immigrants regression model, and finally applies the multiple imputation to generate a variable for legal immigration status.
Technical Appendix C: Imputation Of Offer Of Employer-sponsored Insurance
An integral part of determining ACA eligibility is assessing whether workers without employer-sponsored insurance (ESI) hold an offer through their workplace that they decline to take up. In most cases, an affordable offer of ESI disqualifies members of the tax filing unit of the worker from receiving subsidized coverage on the ACA Health Insurance Marketplace. The American Community Survey (ACS) does not ask about employer offers of ESI; however, the Current Population Survey Annual Social and Economic Supplement (CPS-ASEC) includes questions about whether each worker received an offer of ESI from his or her employer at the time of interview. We use the CPS-ASEC offer of ESI variable to inform a regression-based multiple imputation of whether each tax filing unit constructed in the ACS had at least one offer at work, and also assess affordability for the employee and, separately, for any potential dependents within the unit. Since the health insurance coverage variables available in the CPS-ASEC 2024 capture sources of coverage at any point during calendar year 2023 (versus at the time of survey, as with the offer rate variable), a subset of sampled individuals had a change in their employer-based coverage status across the two distinct time periods.25 Therefore, among workers who potentially experienced a shift in offer status across the two time periods, we recoded or imputed offer rates in 2023 using the offer status in 2024. After constructing this revised offer variable for workers in CPS, we aggregated the results at the tax filing unit level to create a prediction model to apply to the ACS. Below we describe these recodes and imputation. The programming code, written using the statistical computing package R v.4.4.1, is available upon request for people interested in replicating this approach for their own analysis.
Recoding and Imputing Offer Rate Data in the CPS
As a first step in our analysis, we divided CPS-ASEC survey respondents into five distinct groups:
All individuals who did not work during 2023 and also did not hold an offer of ESI in 2024 were assumed not to have an offer in 2023.
All individuals who reported being an ESI policyholder (that is, anyone reporting having taken-up their offer of ESI) during 2023 and also reported holding an offer of ESI during early 2024 were assumed to have an offer in 2023.
All workers in 2023 who held their own ESI policies during 2023 but then reported not holding an offer during 2024 were re-coded as holding an offer of ESI in 2023.
All non-workers during 2023 who reported holding an offer during 2024 were re-coded as not holding an offer of ESI in 2023.
Some workers during 2023 who did not report being ESI policyholders but did report holding an offer of ESI during early 2024 were imputed to not have an offer of ESI during 2023.
For many groups, including those in groups (1) and (2) listed above, the offer status did not change across the two time periods. In contrast, we recoded offer status for people in groups (3) and (4): every non-offered worker in group (3), which includes people who held ESI policies in their own name in 2023, were considered to have an offer of ESI in 2023, and offered workers in group (4), which includes people who did not work themselves in 2023, were considered to not have their offer of ESI in 2023. Last, we implemented a probability-based random sample imputation of offers of ESI for people in group (5), described in more detail below. Only a subset of the group was re-coded from holding an offer in 2024 to not holding an offer in 2023.The number of workers selected from this population was equal to the population size of (3) subtracted by the population size of (4), thereby assuming an unchanging offer rate for the total worker population across the period.
Imputing Offer Rates for CPS Respondents with Ambiguous Offer Rate Status
The CPS-ASEC worker-level regression model was designed to be applied to a single dataset where ESI offer status is known at one point in time but not another. The code mentioned above includes programming to apply the model to the Current Population Survey (CPS-ASEC) (for years 2014 on). For the analysis underlying KFF’s current estimates of ACA eligibility, we apply the regression model to workers in the 2024 CPS-ASEC.
We use the 2024 point-in-time worker offer variable provided by the US Census Bureau26 to create a binomial, dependent variable that identifies a respondent as a recipient of an offer of employer-sponsored insurance at his or her workplace in early 2024. The dependent variable was constructed at the worker-level based on individuals not holding their own ESI policy at time of interview and also reporting an ESI offer or eligibility to be covered that was then voluntarily declined.
We use the following independent variables to predict offer status in 2023 among workers not covered by their own ESI during both 2023 and early 2024 but potentially holding an offer of ESI in 2023:
Any public coverage,
Any nongroup coverage,
Worker earnings among all jobs,
Full-time versus part-time status,
Age of worker,
Work within the construction industry.
The regression model was sub-populated to remove respondents already covered by their own ESI and also to remove non-workers. Since this imputation does not account for the affordability of the offer or whether it meets the minimum value test, we included an assumption that workers in tax filing units with a MAGI below 250% FPL do not hold affordable offers of ESI and therefore might be eligible to purchase subsidized coverage on the Exchanges.27
As mentioned above, we assume an unchanging offer rate for the total worker population across the two time periods. We determined the needed size of the population to impute by subtracting the population of (4) from the population of (3) to ensure an equivalent number of offers were gained and lost. This left only workers who reported holding an offer of ESI during early 2024, since (3) represented a larger count of workers than (4). We then calculated the probability that each worker in the dataset was offered ESI during calendar year 2023 based on our 2024 CPS-ASEC regression model. Next, we selected workers within the potential population (5) using the sampling probabilities resultant from our model.
Construction and Application of ACS Regression Model
For the analysis underlying KFF estimates of ACA eligibility, we construct a prediction model of having an offer of ESI using the 2024 CPS-ASEC and then apply this regression to tax filing units in the 2023 ACS to estimate who has an ESI offer in ACS.
We aggregate the worker offer variables constructed the 2024 CPS-ASEC as described above to create a binomial, dependent variable that identifies each tax filing unit as either holding or not holding an affordable offer of employer-sponsored insurance.
We use the following independent variables to predict offer status among tax filing units:
Any senior citizen in the household,
Oldest member of the tax-filing unit,
Any member of the tax-filing unit has employer-sponsored insurance coverage,
Any member of the tax-filing unit has nongroup coverage,
Any uninsured individuals in the tax filing unit,
Share of adults working full-time and part-time, and
Highest worker earnings.
Since the imputation of documentation status (discussed in Technical Appendix B) required a multiply-imputed approach, this secondary imputation and subsequent worker sampling was only conducted once per implicate, keeping the number of ACS implicates to five.
Van Hook, J., Bachmeier, J., Coffman, D., and Harel, O. 2015. “Can We Spin Straw into Gold? An Evaluation of Immigrant Legal Status Imputation Approaches” Demography. 52(1):329-54. ↩︎
Non-MAGI pathways for nonelderly adults include disability-related pathways, such as SSI beneficiary; Qualified Severely Impaired Individuals; Working Disabled; and Medically Needy. We are unable to assess disability status in the ACS sufficiently to model eligibility under these pathways. However, previous research indicates high current participation rates among individuals with disabilities (largely due to the automatic link between SSI and Medicaid in most states, see Kenney GM, V Lynch, J Haley, and M Huntress. “Variation in Medicaid Eligibility and Participation among Adults: Implications for the Affordable Care Act.” Inquiry. 49:231-53 (Fall 2012)), indicating that there may be a small number of eligible uninsured individuals in this group. Further, many of these pathways (with the exception of SSI, which automatically links an individual to Medicaid in most states) are optional for states, and eligibility in states not implementing the ACA expansion is limited. ↩︎
Steven Ruggles, Sarah Flood, Ronald Goeken, Josiah Grover, Erin Meyer, Jose Pacas, and Matthew Sobek. IPUMS USA: Version 8.0 [dataset]. Minneapolis, MN: IPUMS, 2018. https://doi.org/10.18128/D010.V8.0
For a detailed description of how IPUMS constructs family interrelationships variables, see https://usa.ipums.org/usa/chapter5/chapter5.shtml↩︎
According to the Public Use Microdata Sample (PUMS) documentation, “Estimates generated with PUMS microdata will be slightly different from the pretabulated estimates for the same characteristics published on data.census.gov. These differences are due to the fact that the PUMS files include only about two-thirds of the cases that were used to produce estimates on data.census.gov, as well as additional PUMS edits.” ↩︎
Van Hook, J., Bachmeier, J., Coffman, D., and Harel, O. 2015. “Can We Spin Straw into Gold? An Evaluation of Immigrant Legal Status Imputation Approaches” Demography. 52(1):329-54. ↩︎
This data source is a change from previous KFF analyses, which used microdata from the 2008 Panel of the Survey of Income and Program Participation (SIPP) ↩︎
This data source is a change from previous KFF analyses, which used estimates from the Department of Homeland Security. ↩︎
Pew updates these estimates periodically. We use the most recent estimates available at the time of our analysis, and in some cases incorporate estimates received from correspondence with researchers at Pew prior to their publication – however we do not release these numbers ourselves. We draw on Pew directly for all published data and interpolate years missing from their trend. Our analysis uses the year applicable to the year for the data sets to which we apply the regression model. The most recent estimates as of the time of our analysis were: J Passel, J Krogstad. What we know about unauthorized immigrants living in the U.S.. (Pew Research Center), July 2024. Available at: https://www.pewresearch.org/short-reads/2024/07/22/what-we-know-about-unauthorized-immigrants-living-in-the-us/. ↩︎
Indicators that imply legal status include: (i) respondent entered the US prior to 2000, (ii) respondent is enrolled in Medicare or military health insurance, or (iii) respondent reports Medicaid coverage but resides in a state that does not offer coverage to the undocumented population beyond CHIP’s From-Conception-to-End-of-Pregnancy (FCEP) option. ↩︎
For more information, see SHADAC 2013, footnote 1. The table created for this function contains estimates of the undocumented across 2013-2023. ↩︎
As an example of this calculation, we found that approximately 66% of undocumented uninsured individuals did not have health coverage in 2013. We allow the undocumented rate to drop slightly after 2013. We base the percent drop in the uninsured rate among the undocumented on the drop for citizens (half the scale of the drop for citizens) each year until 2023, resulting in the final undocumented uninsured rate of 51% in calendar year 2023. Prior to implementing this new sampling dimension, we found unrealistic drops in the uninsured rate of the undocumented population that we largely attributed to our prediction model’s inability to discern this group from legally-present non-citizens, many of whom are eligible for assistance under the ACA’s coverage expansions. Although a few states have implemented programs that allow for coverage of the undocumented population, these programs are state-funded and relatively small in scale compared to the nationwide coverage expansions accompanying the ACA. ↩︎
For example, anyone who did not work during 2023 who then held an offer of ESI in early 2024 would appear incongruous in our CPS-based eligibility model. In the other direction, workers covered by health insurance through their own employer in 2023 who lost their offer of ESI during the early months of 2024 (perhaps due to a job change) would also appear incongruous due to the discrepancy across the two time periods. ↩︎
Promoting price transparency in health care is a policy approach with bi-partisan support in Congress and the public at large, and the first Trump administration finalized regulations that require group health plans and insurers to make detailed data with all their in-network payment rates available with the objective that such transparency would increase price competition and ultimately drive down health care costs.
This report documents how the vast troves of data reported in pursuit of those goals include misleading and unlikely prices, inconsistencies, and other oddities that pose significant challenges for researchers, industry and others seeking to make sense of the data.
The transparency regulations set out in significant detail the methods that payers should follow in reporting their rates, generating huge amounts of publicly available data since reporting began in 2022. The analysis, which relies on the extensive collection of this data downloaded and maintained by Turquoise Health, includes examples about each of the challenges identified and how they complicate efforts to use the data for its intended purposes.
The analysis is available through the Peterson-KFF Health System Tracker, an information hub dedicated to monitoring and assessing the performance of the U.S. health system.
Congressional Republicans and President Trump are in search of trillions of dollars in cuts to mandatory federal spending that could help offset the cost of extending expiring tax cuts. With spending on health programs accounting for a substantial share of federal spending, those programs are an obvious target to achieve overall spending goals in current budget reconciliation discussions. Medicaid has been the primary focus for federal spending cuts, but cuts to Medicare and the Affordable Care Act have also been floated. Cuts to discretionary spending, which includes funding for several federal health agencies, veterans health care, and global health, are not part of the reconciliation process, but the Trump Administration has taken unilateral actions to reduce this spending. Proposed cuts to federal spending on health programs and services have trade-offs and could increase the number of people without insurance; reduce access to health care; increase consumer costs for health care; and reduce payments for hospitals, nursing homes, and other providers. The effects would be felt by people of all incomes but would likely be concentrated among people with low incomes.
To provide context for ongoing discussions about federal spending, this brief analyzes current support from the federal government for health programs and services, including both spending and tax subsidies (that is, forgone tax revenues from provisions that reduce tax liability for people and businesses with qualifying health-related spending). The data come from the Office of Management and Budget, U.S. Treasury Department, and the Congressional Budget Office (see Methods).
Key takeaways
The federal government spent $1.9 trillion on health care programs and services in fiscal year (FY) 2024, 27% of all federal outlays in that year, and collectively the largest category of federal spending.
Forgone tax revenues to the federal government resulting from tax subsidies for employer sponsored insurance coverage (ESI) and a portion of the Affordable Care Act (ACA) premium tax credits together totaled $398 billion in FY 2024.
Over 80% of all federal support for health programs and services, including spending and tax subsidies, goes to programs that provide or subsidize health insurance coverage, with 36% going to Medicare, 25% going to Medicaid and CHIP, 17% going to employment-based health coverage, and 5% going to subsidies for Affordable Care Act (ACA) coverage.
Discretionary spending is a relatively small component of overall federal support for health programs and services. Over half (52% or $128 billion) of discretionary health spending paid for hospital and medical care for veterans. Discretionary health spending also provides funding for agencies such as the National Institutes of Health (NIH) (19% of discretionary health spending) and the Centers for Disease Control and Prevention (CDC) (4%), as well as global health (4%).
How does the federal budget support health programs and services?
Over one out of every four dollars in federal spending was used to pay for health programs and services in FY 2024 (Figure 1). The next largest categories are Social Security (21%), national defense (13%), and interest payments on the federal debt (13%). Combined, these four categories account for nearly three quarters of all federal spending.
Seventy percent of government support for health programs and services comes from mandatory spending, with tax subsidies accounting for 19% and discretionary spending accounting for 11%(Figure 2). There are three ways that the federal government provides support for health programs and services: mandatory spending (outlays), discretionary spending (outlays), and tax subsidies (forgone tax revenue, also called tax expenditures or tax preferences).
Mandatory spending, also known as “direct spending,” is governed by regular legislative action in Congress and not determined through the annual appropriations or “spending” bills. Mandatory health spending includes nearly all Medicare spending ($839 billion), federal spending on Medicaid and CHIP ($584 billion in federal funding), and the refundable portion of the health insurance premium tax credit for coverage through the ACA Marketplaces ($111 billion in federal funding) (Appendix Table 1). (This does not include ACA premium tax credits that offset income taxes individuals owe to the federal government.)
Tax subsidies allow businesses and individuals to reduce the amount of taxes they must pay based on the amount of money they spend on qualifying health programs and services. Most of the foregone revenue to the federal government from health-related tax subsidies (85%) comes from the exclusion of employer contributions for health insurance, which totaled $384 billion in 2024. Other notable tax subsidies that support health care include the non-refundable portion of the tax credit for coverage through the ACA Marketplaces ($14 billion), contributions to medical and health savings accounts ($14 billion), deductions for medical expenses ($13 billion), and deductions for charitable contributions to health institutions ($10 billion) (Appendix Table 3).
What is the budget reconciliation process?
Congress will likely use reconciliation to make reductions in mandatory spending to help offset some of the cost of extending the expiring tax cuts. Budget reconciliation is a special legislative process used to make changes to taxes and mandatory spending that allows the Senate to pass legislation with only 50 votes rather than the customary 60 votes. There are limits to what kinds of legislation can be passed through budget reconciliation, and it can only be used for policies that make non-incidental changes to mandatory spending or revenues. Congress initially enacted the 2017 Tax Cuts and Jobs Act through reconciliation, and it is expected that the reconciliation process will be used again for an extension. That law made a set of broad but temporary tax cuts, which expire at varying years starting in 2025. The cost of extending these tax cuts has been estimated at $4.0 trillion between FY 2025 and FY 2034.
Reconciliation was originally intended to reduce budget deficits, and there are several unique rules governing the reconciliation process. The budget reconciliation process begins with the adoption of a budget resolution that is passed in both houses of Congress but not signed by the President. The budget resolution provides each Congressional committee with the dollar amount of budgetary changes that must be achieved over a specified budget “window,” which is usually either a five-year or ten-year period. These budget changes can either increase the deficit or decrease it. Budget resolutions often suggest specific policies to achieve budgetary changes, but those suggestions are not binding or enforceable. Committees of jurisdiction must meet the dollar targets in the budget resolution but have discretion as to how to meet the targets. A bill with all the details developed by committees would have to pass both houses of Congress and be signed by the president to become law.
Increase the deficit in years after the budget period (though it can increase the deficit during the budget period),
Change Social Security spending or revenues,
Be “extraneous” to the budget, meaning the reconciliation bill cannot include policies that have “merely incidental” fiscal impacts, or
Make changes to discretionary spending.
How might a budget reconciliation package affect health insurance coverage?
There are four primary sources of health insurance coverage in the U.S.: Medicare, Medicaid, ACA Marketplaces, and employer sponsored coverage. Each of these sources of coverage could be subject to changes in a reconciliation bill. Of these four programs, Medicare accounts for the largest share (36%) of total federal support for health programs and services (including both spending and tax expenditures), followed by Medicaid and CHIP (25%), employer coverage (17%), and ACA Marketplaces (5%). Reconciliation could be used to reduce federal financial support for each of these programs because they are all funded through mandatory spending and/or financed with tax subsidies.
Existing discussions surrounding a reconciliation package have focused on reductions in mandatory federal health spending, the largest components of which are Medicare (52% of mandatory health spending) and Medicaid (36%) (Figure 3, Appendix Table 1). A 50-page menu of options for policies that could be included in a reconciliation package is largely focused on reducing federal spending to finance an extension of the 2017 tax cuts. Medicaid is the largest source of proposed cuts, but there are also options to reduce spending on Medicare and the ACA subsidies.
Medicaid: Medicaid covers 83 million low-income people, accounts for one fifth of health care spending in the U.S., and covers 61% of long-term care costs. Despite most adults having favorable views of Medicaid and only 13% thinking Medicaid cuts are a top priority, federal Medicaid funding ($584 billion in 2024, see Appendix Table 1) is at significant risk under Republican proposals to reduce federal spending by nearly one third over ten years. Changes to Medicaid under consideration include imposing a per capita cap on federal spending, reducing the federal government’s share of costs for the ACA expansion group, limiting provider taxes states use to help pay for their share of Medicaid costs, and imposing work requirements. Such policy changes would fundamentally alter how Medicaid financing works and large federal spending reductions would force states to make tough choices whether to raise new revenue, restrict the number of people covered, cover fewer benefits, or cut payment rates for physicians, hospitals, nursing homes, and other providers. Millions or even tens of millions of people could lose Medicaid coverage depending on how the policy was structured.
Medicare: Medicare provides health insurance coverage to nearly 68 million older adults and younger people with long-term disabilities and accounted for just over half (52% or $839 billion) of mandatory spending on federal health programs and services in FY 2024. Despite President Trump’s campaign promises not to cut Medicare, Republican lawmakers have put several Medicare savings proposals on the table in recent budget reconciliation talks, including implementing site-neutral payment policies, making changes to Medicare payment of uncompensated care, bad debt, and other hospital payments, and reforming Medicare payment for graduate medical education, among other changes. Altogether, these specific proposals could yield around $500 billion in 10-year savings, and would have the greatest impact on hospitals, with indirect effects on patients, depending on how hospitals responded to payment reductions.
ACA Marketplaces: Healthcare.gov and State-Based Marketplaces cover over 24 million people in 2025 (about 7% of the US population), most of whom are low-income. Federal support totaled $125 billion, including direct spending and tax subsidies in FY 2024, when about 19 million people received a subsidy.
ACA Marketplace subsidies are provided through the tax system, with most subsidized enrollees receiving an advanced payment of the premium tax credit, which they reconcile when they file their taxes the following year. Because incomes can be very volatile for ACA Marketplace enrollees (many of whom work shifts, are self-employed, or gig workers), predicting one’s income a year in advance can be difficult. The ACA currently limits how much an enrollee must pay back in the tax credit if their income is below four times the poverty level. However, a Ways and Means Committee document proposes to remove repayment limits for people who receive excess tax credits.
Since 2021, enhanced premium tax credits have lowered premium payments across all subsidized enrollees and made middle income people (over four times poverty) newly eligible for subsidies. These enhanced tax credits were originally passed as COVID relief and extended by the Inflation Reduction Act of 2022, but they are set to expire at the end of 2025. If the enhanced tax credits are not renewed by Congress, out-of-pocket premium payments for enrollees are expected to increase by over 75%, though this amount will vary by income and location. The cost to renew the subsidies would be $335 billion over ten years, according to CBO projections.
What health programs and services are discretionary, and subject to the annual appropriations process?
Only 11% of federal support for health care programs and services is discretionary spending, and over half of that amount (52%) pays for veterans’ health care (Figure 4, Appendix Table 2). In FY 2024, $128 billion in federal funding supported care for more than 7 million veterans. The next largest source of discretionary spending is the National Institutes of Health, which received $46 billion in 2024 (19% of discretionary spending). Smaller sources of federal discretionary spending include public health and social services emergency funding ($11 billion; 4%), global health ($10 billion; 4%), and the Centers for Disease Control and Prevention ($9 billion; 4%). (Global health totals presented here are outlays, which represent actual cash flows, and therefore do not match those presented in other KFF resources, such as the U.S. Global Health Budget Tracker, which highlight the budget authority totals as provided by Congress in annual appropriations and include some other funding components that are counted elsewhere in this analysis.)
Making changes to discretionary health spending through the appropriations process requires 60 votes in the Senate, meaning changes would require Democratic support, unless President Trump takes unilateral actions to reduce federal spending. Congress is supposed to pass appropriations bills by June 30 each year that provide funding for discretionary programs from October 1 through September 31 of the following year (the federal fiscal year). However, in most years, Congress does not pass the appropriations bills on time, and instead uses continuing resolutions to prevent lapses in federal funding for discretionary programs. The current continuing resolution funds the federal government through March 14, 2025. Extending funding for discretionary programs beyond that date will require a majority vote in the House and 60 votes in the Senate.
In the early weeks of President Trump’s second term in office, the administration has taken unilateral action to reduce federal funding, such as by laying off federal employees and issuing executive orders to freeze federal funding in various programs. Declining to spend appropriated funds is also known as “impoundment.” In 1974, Congress enacted the Impoundment Control Act in response to President Nixon’s attempts to refuse to spend Congressionally-appropriated funds. During the campaign, President Trump promised to “restore Impoundment Power,” and the administration characterizes the Impoundment Control Act as unconstitutional. The Trump administration also indicates that the current funding freezes are “programmatic delays” rather than deferrals. It is currently unclear the extent to which President Trump will be able to significantly reduce federal spending through these and other unilateral actions.
This work was supported in part by Arnold Ventures. KFF maintains full editorial control over all of its policy analysis, polling, and journalism activities.
The federal budget groups spending into roughly 20 categories called ‘budget functions,’ which are groups of activities or programs that fulfill specific purposes, such as defense, transportation, and health. This analysis focuses on non-defense health spending, which is defined to include spending in the following categories within four budget functions:
150: International Affairs:
151: International development and humanitarian assistance: Global health
550: Health:
551: Health care services
552: Health research and training
554: Consumer and occupational health and safety
570: Medicare
700: Veterans Benefits and Services
703: Hospital and medical care for veterans
Each category includes both mandatory and discretionary spending, where applicable.
Spending totals in this analysis are outlays, which represent actual cash flows, rather than budget authority, which represents the amounts authorized by Congress for new obligations by federal agencies. Global health outlay totals presented here do not match those presented in other KFF resources, such as the U.S. Global Health Budget Tracker, which highlight the budget authority totals as provided by Congress in annual appropriations and include some other funding components that are counted elsewhere in this analysis. As noted above, in this analysis ‘global health’ is a category of spending within budget function 151: International development and assistance, which accounts for the majority of global health funding. Additional global health funding at NIH and CDC is included under budget function 550: Health.
This analysis does not include spending by the Department of Health and Human Services that falls outside of the ‘Health’ or ‘Medicare’ budget functions, which consists mainly of spending on social services and income security for children and families through the Administration for Community Living (ACL) and Administration for Children and Families (ACF), which falls within budget functions 500 (Education, Training, Employment, and Social Services) and 600 (Income Security). A separate KFF brief, How Does the Department of Health and Human Services (HHS) Impact Health and Health Care?, has a more complete description of these operating divisions within HHS.
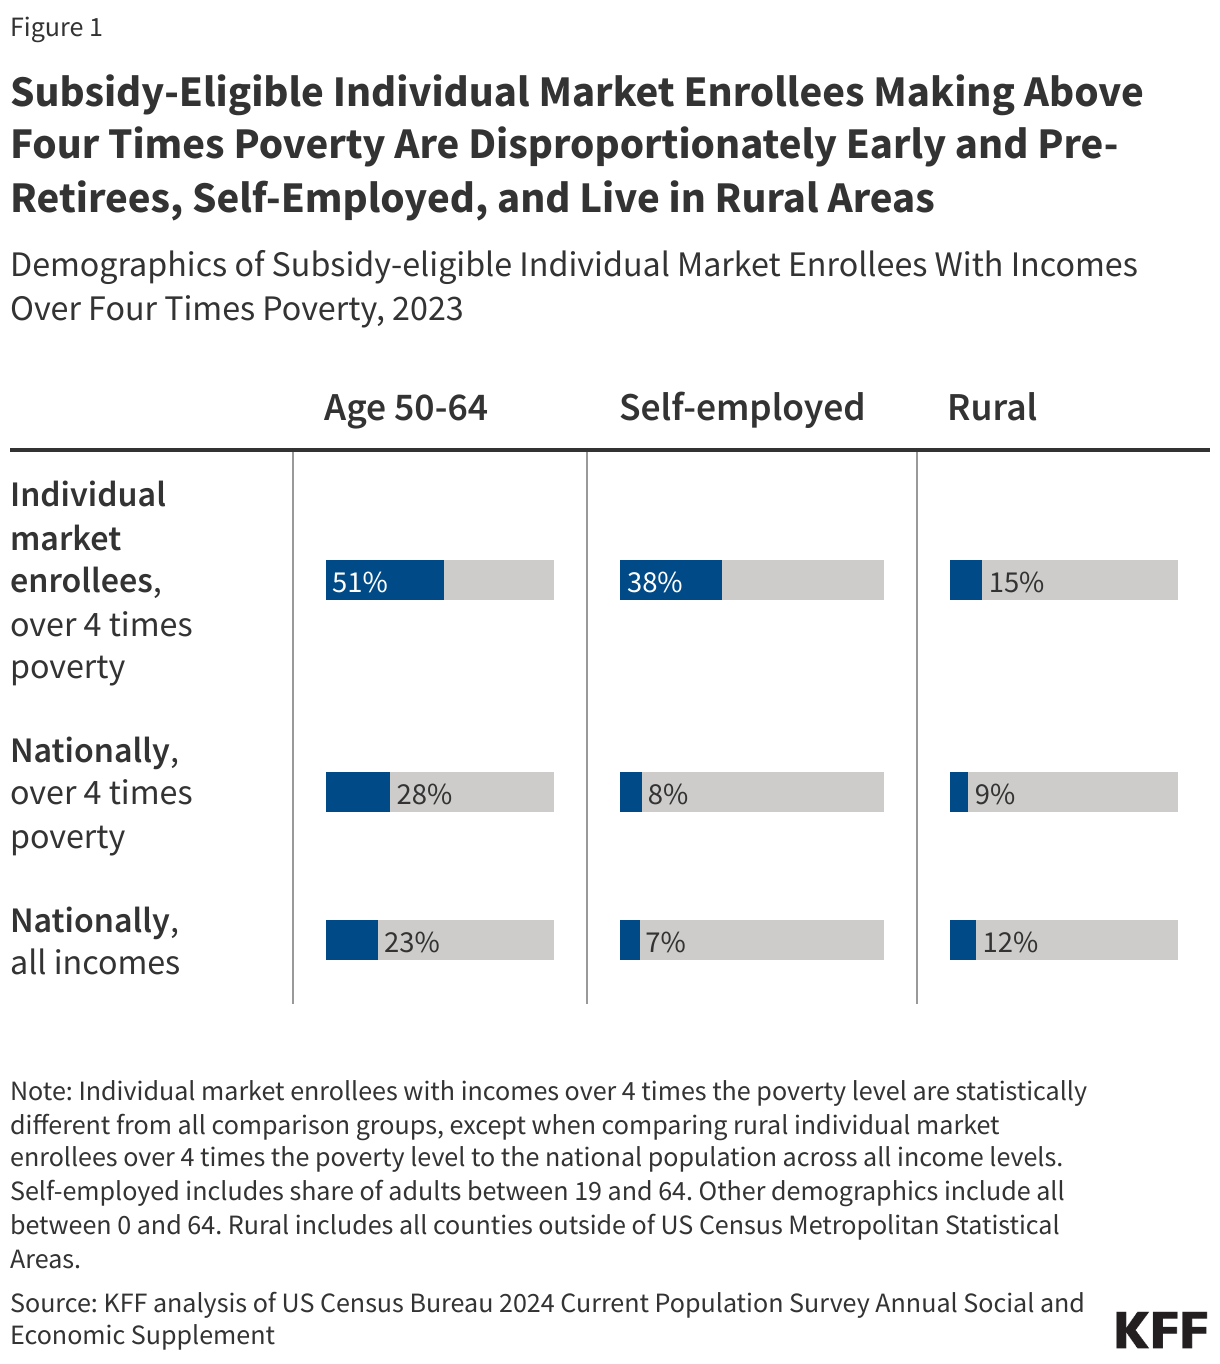
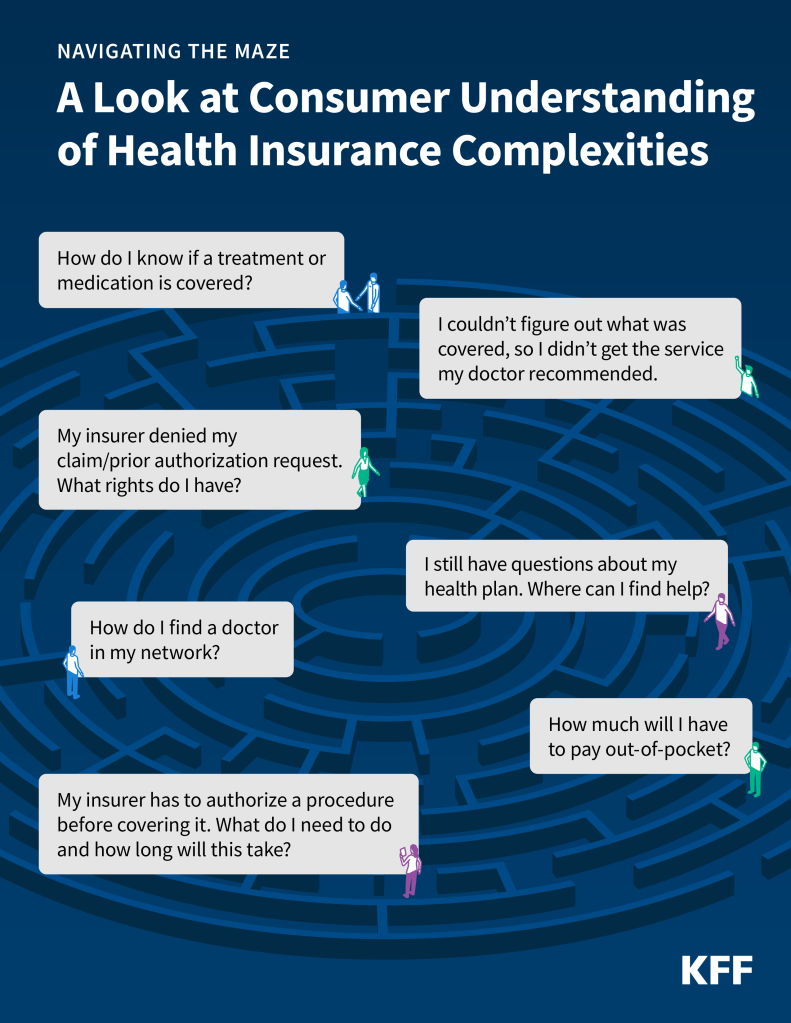
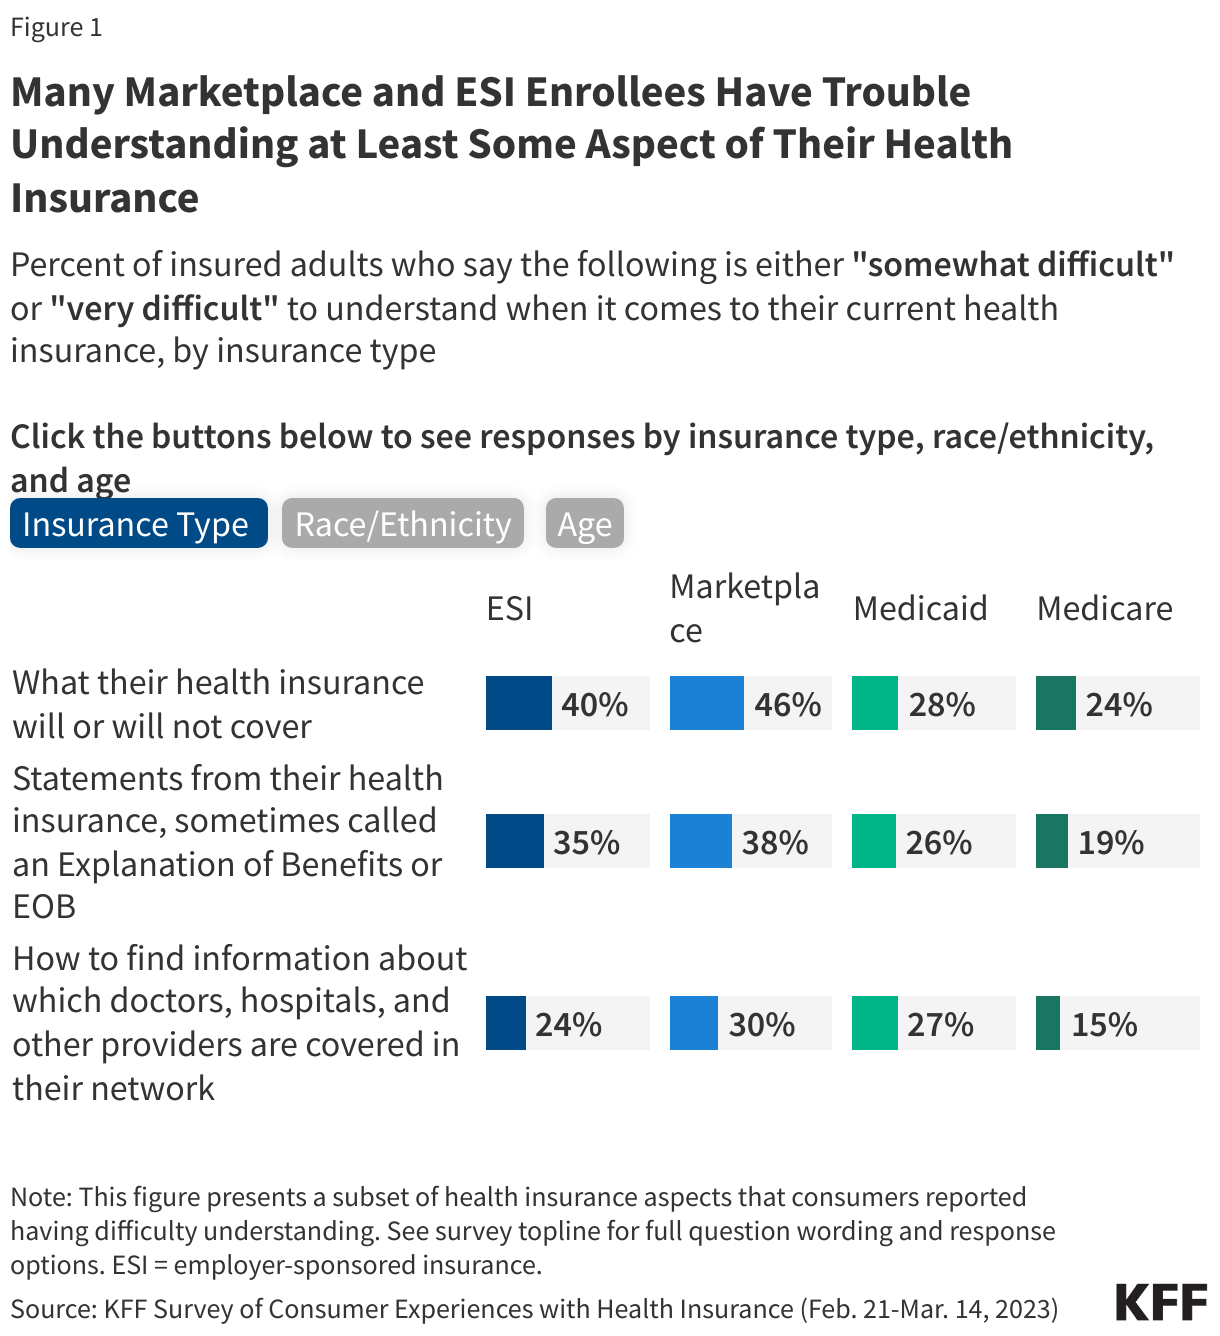
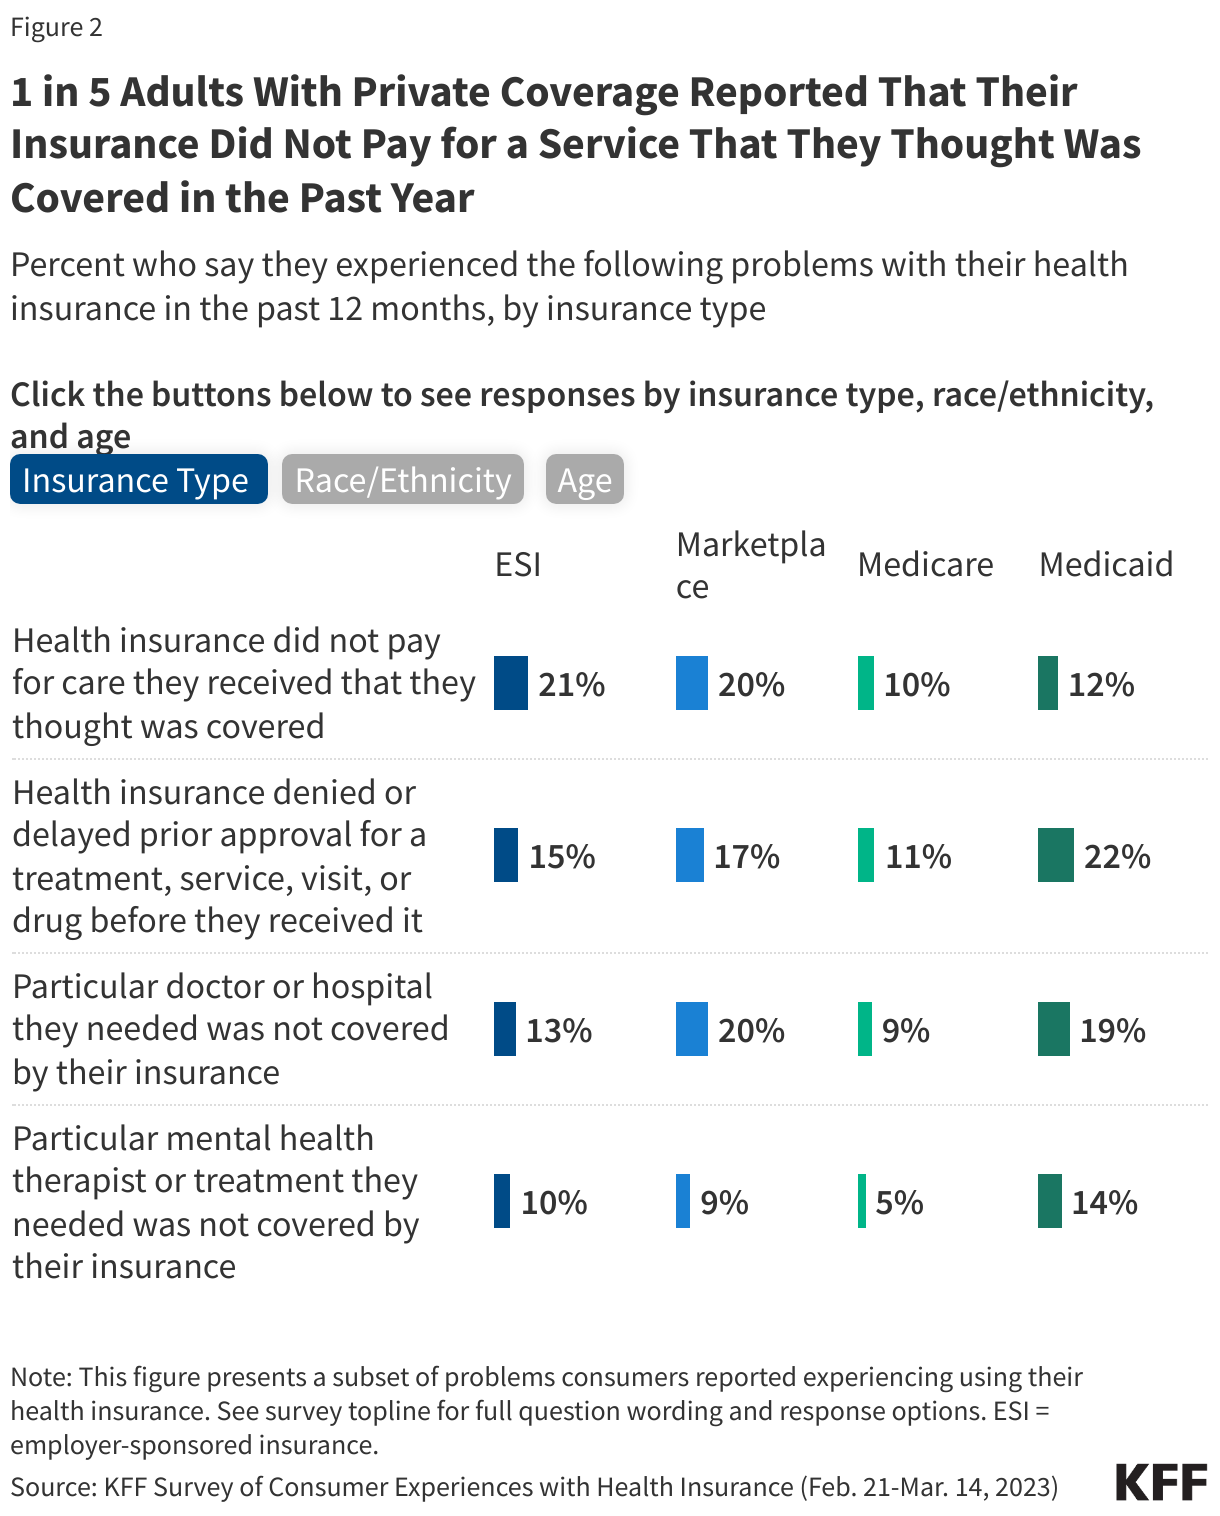
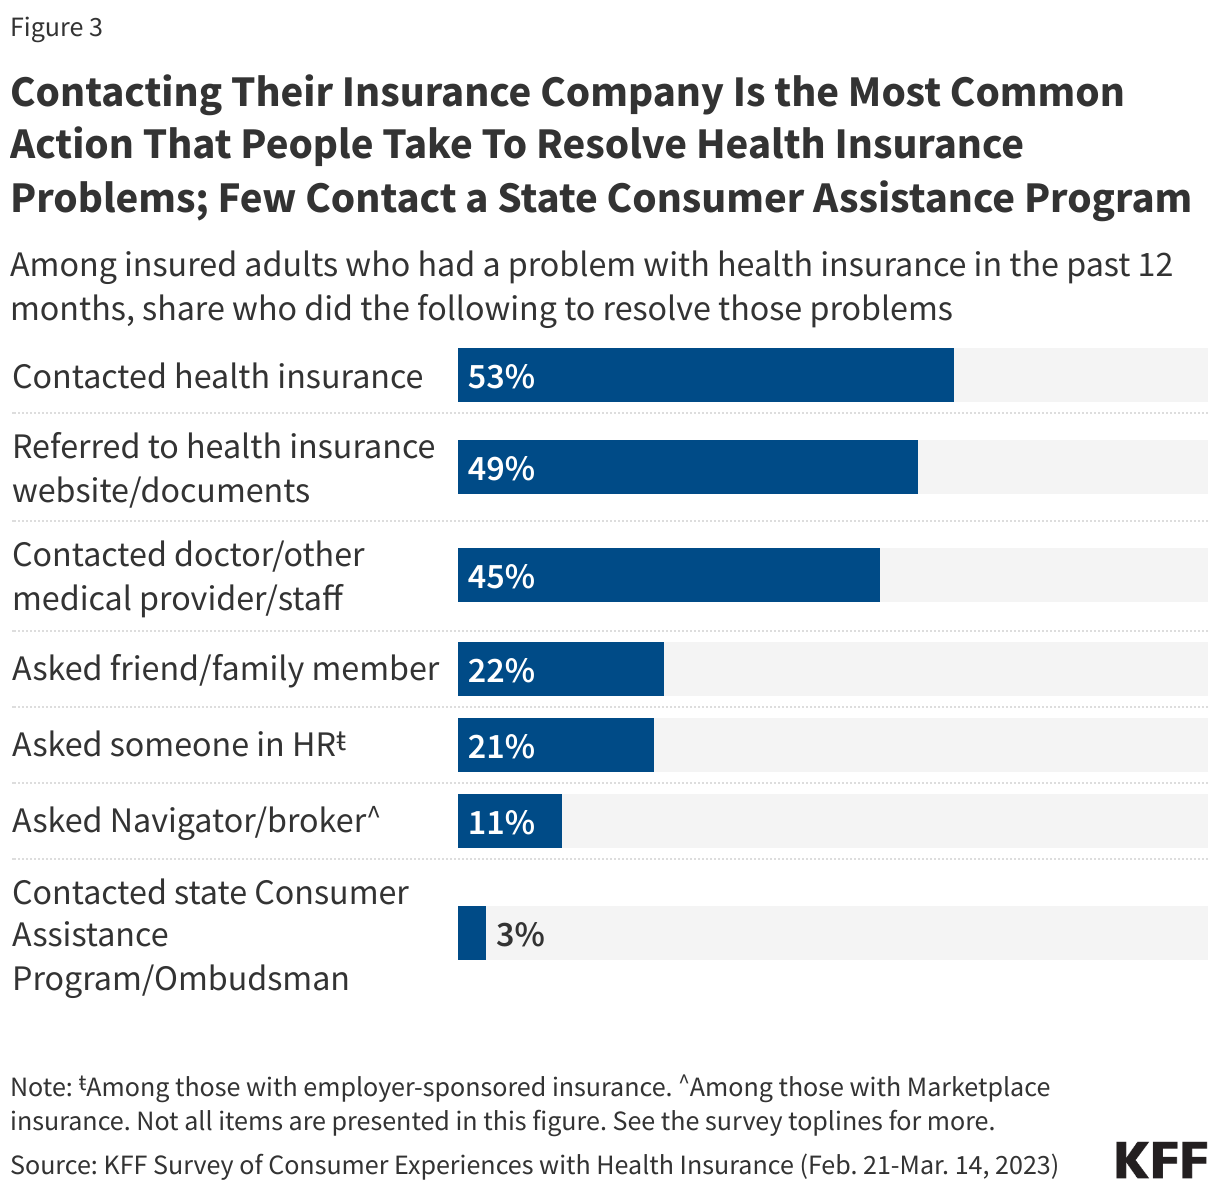
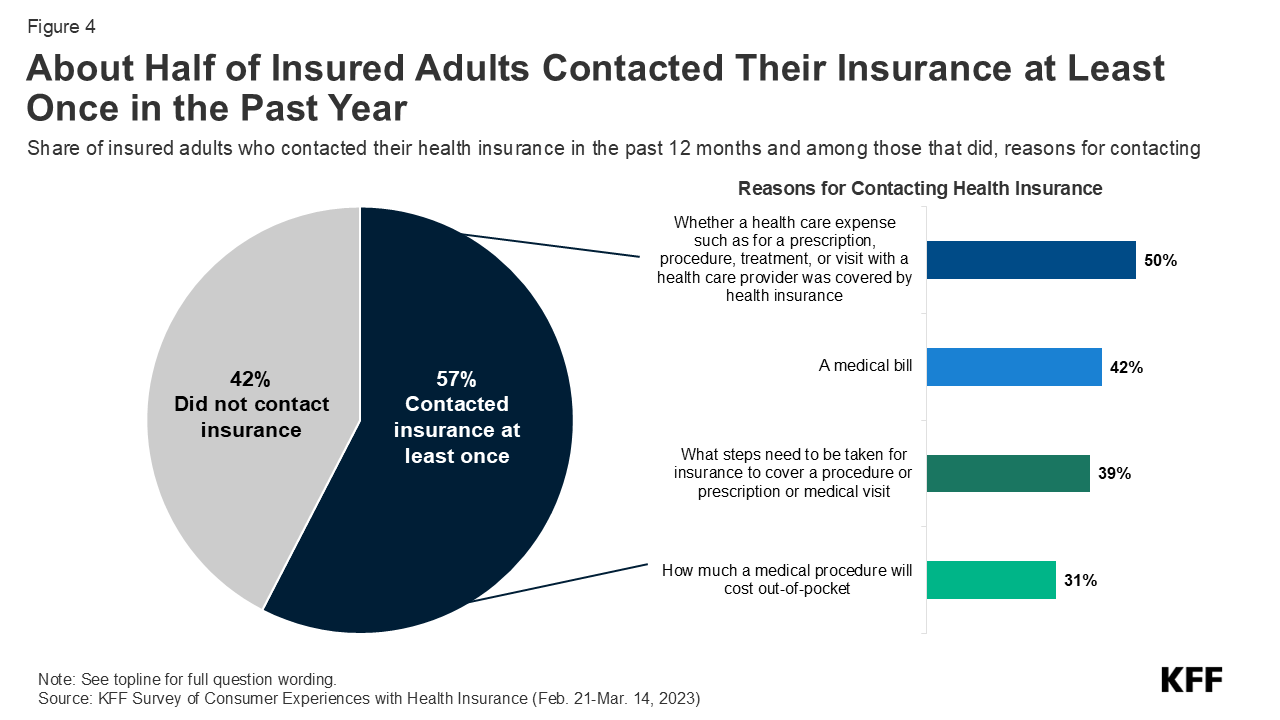
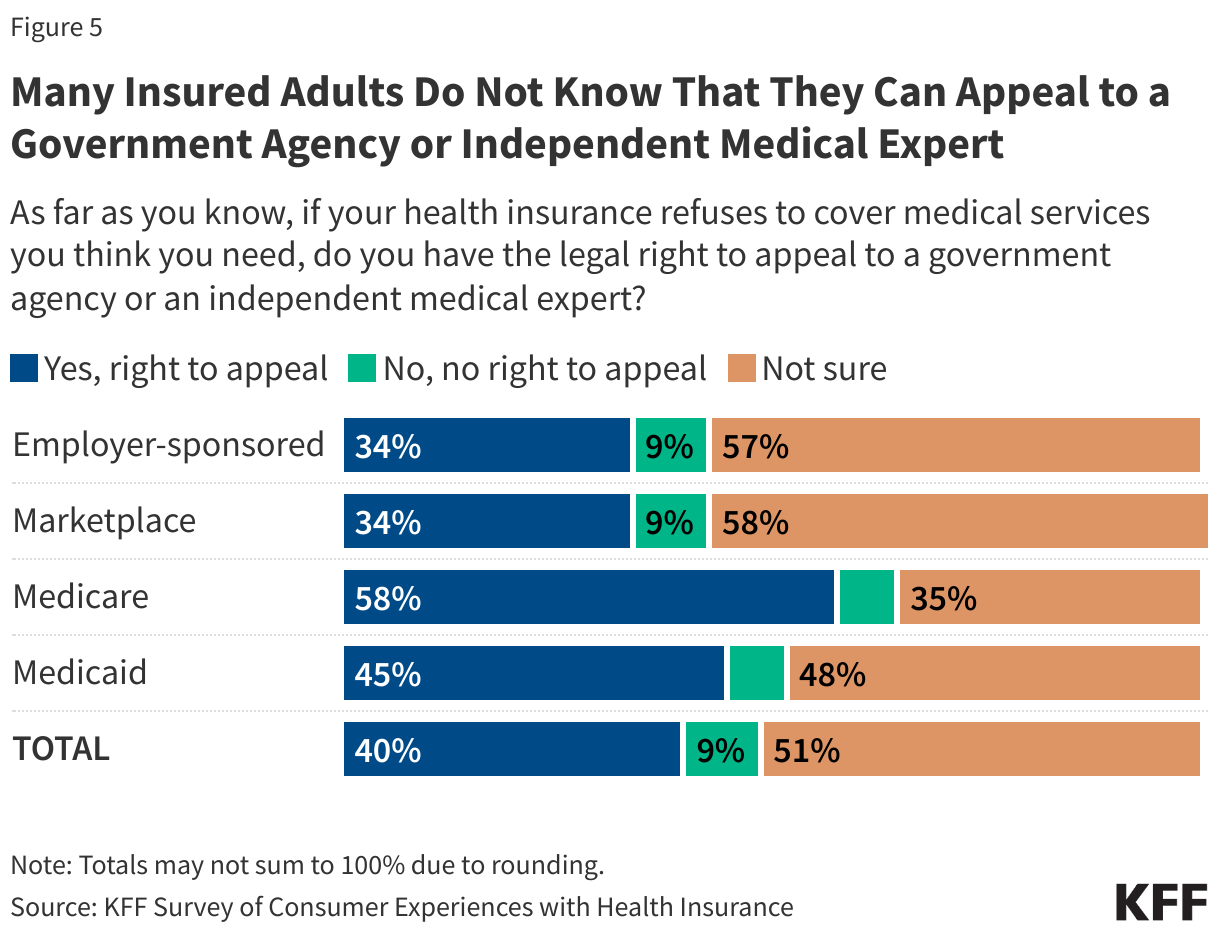
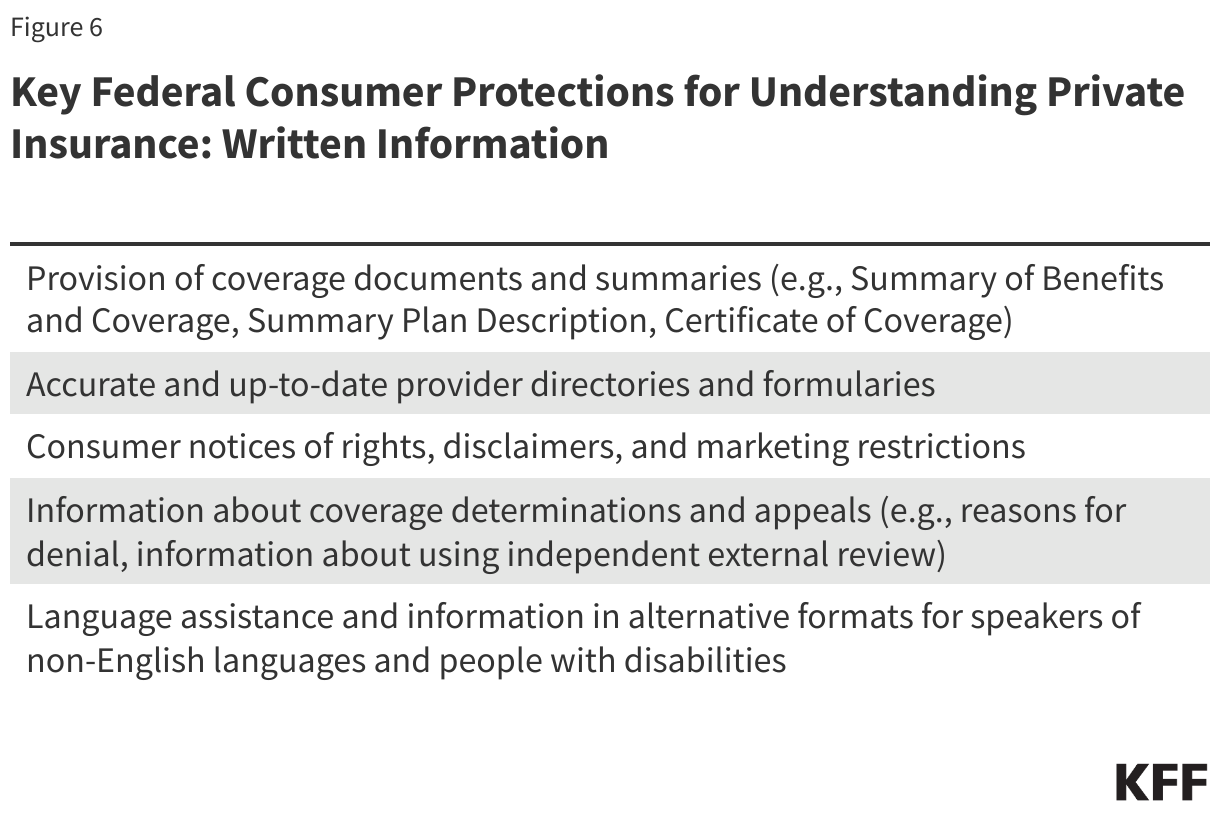
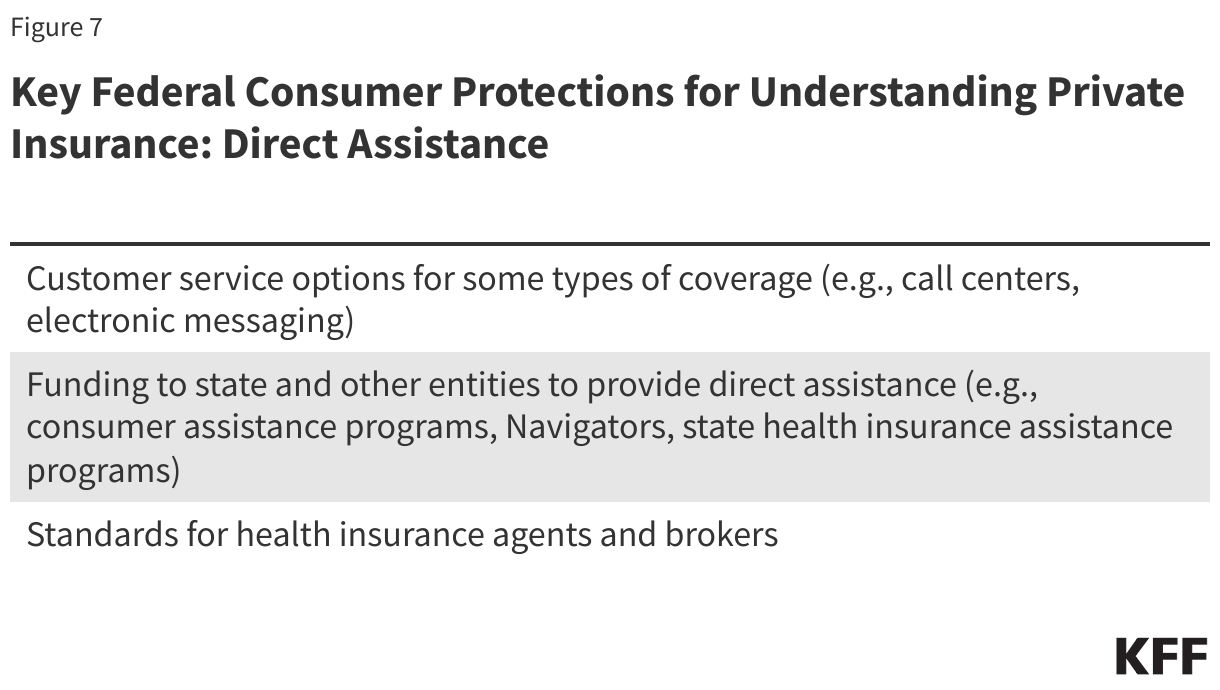


 Irving Washington
  Hagere Yilma