The U.S. Government and Global Health

Table of Contents

Introduction

Copy link to Introduction

U.S. government (U.S.) global health efforts aim to help improve the health of people in low- and middle-income countries while also contributing to broader U.S. global development goals, foreign policy priorities, and national security concerns, including helping safeguard the health of Americans. While there is currently no standard, agreed-upon definition of global health, the National Academy of Medicine (formerly Institute of Medicine) defines global health as having “the goal of improving health for all people in all nations by promoting wellness and eliminating avoidable diseases, disabilities, and deaths.” A key dimension of global health is an emphasis on addressing inequities in health status between rich and poor countries and also for those who are most marginalized within countries, as well as a recognition that the health of people around the world is highly interconnected, with domestic and foreign health inextricably linked.

What Is the U.S. Role in Global Health?

Copy link to What Is the U.S. Role in Global Health?

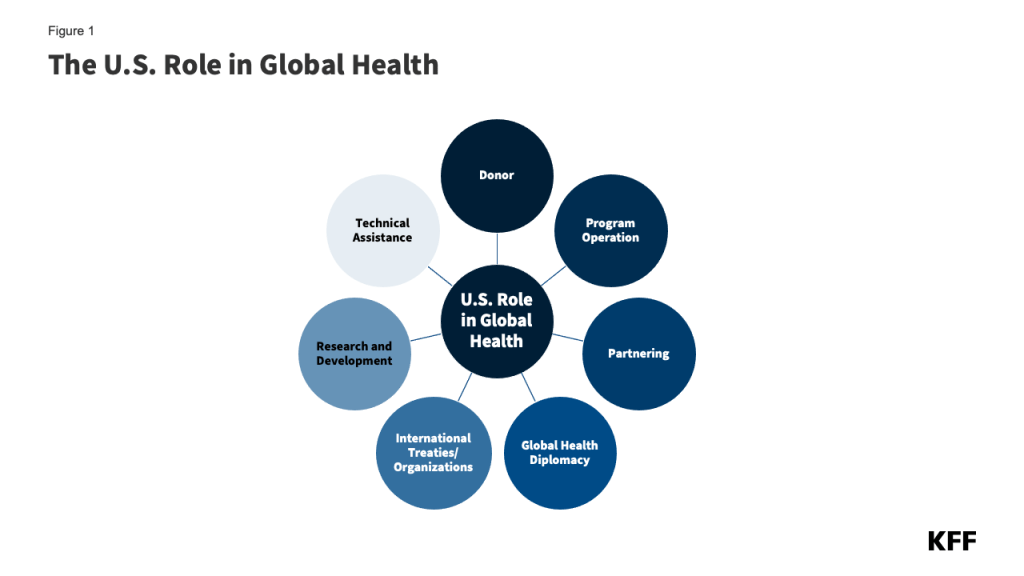
The U.S. role in global health is multifaceted and includes a broad range of activities. Its primary roles are as a supporter of bilateral (i.e., country-to-country) efforts, directly funding implementation of global health efforts in partner countries, and as a donor to multilateral health institutions (i.e., international organizations that pool support from multiple countries for one or more areas of global health). The U.S. also engages in global health diplomacy through its relationships with other governments, multilateral institutions, non-governmental organizations, and the private sector. Specifically, the U.S. government:

  • acts as a donor by providing financial and other health-related development assistance (e.g. commodities, like contraceptives or bed nets for protection from disease-carrying mosquitoes) to low- and middle-income countries;
  • operates programs and delivers health services;
  • provides technical assistance and other capacity-building support;
  • participates in major international health organizations and coordinates health efforts with other stakeholders through global health diplomacy;
  • conducts research;
  • supports international responses to disasters and other emergencies; and
  • partners with governments, non-governmental groups, and the private sector (Figure 1).

U.S. global health activities target a variety of issues and use different intervention approaches such as:

  • Health services and systems: improving basic and essential health services, systems, and infrastructure;
  • Disease detection and response: supporting surveillance, prevention, and treatment of diseases, including both infectious (e.g. HIV, TB, malaria) and non-communicable diseases (e.g. cardiovascular disease, cancer);
  • Population and maternal/child health: promoting maternal health; reproductive health and family planning; child nutrition, immunization, and other child survival interventions;
  • Nutrition, water, and environmental health: providing non-emergency food aid and supporting dietary supplementation and food security; clean/safe water and sanitation; mitigation of environmental hazards; and
  • Research and development: investigating and developing new technologies, interventions, and strategies, including vaccines, medicines, and diagnostics.

What Are the Major Global Health Program Areas the U.S. Supports?

Copy link to What Are the Major Global Health Program Areas the U.S. Supports?

The U.S. government (U.S.) supports global health through a wide array of bilateral and multilateral global health programs in countries around the world. Its major program areas include:

HIV/PEPFAR

While the U.S. first provided funding to address the emerging global HIV epidemic in 1986, U.S. funding and attention for these efforts has grown significantly in the last two decades, particularly following President George W. Bush’s 2003 announcement of the President’s Emergency Plan for AIDS Relief (PEPFAR), the coordinated U.S. government response to global HIV. Now the largest commitment by any nation devoted to a single disease, the launch of PEPFAR led to substantially increased U.S. support for HIV prevention, treatment, and care efforts, as well as U.S. contributions to multilateral entities, including the Global Fund to Fight AIDS, Tuberculosis and Malaria (Global Fund), the Joint United Nations Programme on HIV/AIDS (UNAIDS), and the International AIDS Vaccine Initiative (IAVI). Today, PEPFAR’s efforts aim to ensure that populations with the highest HIV burden – particularly children, young women and adolescents, young men, and key populations— know their HIV status, receive prevention and treatment services, and become virally suppressed.

Tuberculosis (TB)

Since the 1998 launch of USAID’s global TB control program, the U.S. response to global TB has expanded, particularly after 2003 when PEPFAR highlighted the U.S. government’s commitment to addressing TB. Today, these efforts focus on diagnosis, treatment, and control of TB (including multi-drug-resistant and extensively drug-resistant TB, or MDR/XDR TB) as well as on research. The U.S. is also a donor to the Global Drug Facility of the Stop TB Partnership.

Malaria/PMI

Engaged in malaria work since the 1950s, today the U.S. supports expanded malaria efforts in low- and middle-income countries through the President’s Malaria Initiative (PMI), launched in 2005, as well as through research and other activities. PMI programs center on expanding coverage of six key high-impact interventions to control or eliminate malaria, which include: diagnosis of malaria and treatment with artemisinin-based combination therapies (ACTs), entomological monitoring, intermittent preventive treatment in pregnancy (IPTp), indoor residual spraying (IRS) with insecticides, insecticide-treated mosquito nets (ITNs), and seasonal malaria chemoprevention (SMC). The U.S. is also engaged in the RBM Partnership to End Malaria.

Maternal and Child Health (MCH)

Involved in efforts to improve MCH since the 1960s, today U.S. global MCH activities aim to bring to scale a range of high-impact interventions that mitigate maternal, newborn, and under-five deaths; prevent and address the indirect causes of such deaths (such as HIV, TB, and malaria); strengthen integration of maternal health services with family planning; improve equity of access to and use of services by vulnerable populations; and strengthen health systems. The U.S. is also a donor to global organizations and initiatives addressing MCH, such as Gavi, the Vaccine Alliance, the United Nations Children’s Fund (UNICEF), and the Global Polio Eradication Initiative (GPEI).

Nutrition

For more than 40 years, the U.S. has been involved in nutrition efforts in low- and middle-income countries that aim to prevent undernutrition through support for effective interventions, such as nutrition education, nutrition during pregnancy, exclusive breastfeeding, and micronutrient supplementation. U.S. global nutrition efforts are coordinated with the U.S. Feed the Future Initiative (FtF, launched in 2009), which aims to address global hunger and food security.

Family Planning and Reproductive Health (FP/RH)

Engaged since the 1960s in international research on family planning and population issues as well as other FP/RH efforts (including the purchase and distribution of contraceptives in developing countries),  U.S. global FP/RH activities are currently designed to decrease the risk of unintended pregnancies and maternal and child mortality through effective interventions, including contraception, counseling, and post-abortion care. The U.S. also provides funding to global organizations addressing FP/RH, such as the United Nations Population Fund (UNFPA).

Neglected Tropical Diseases (NTDs)

Having historically worked on addressing NTDs through research and surveillance, attention to and funding for U.S. global NTD efforts increased markedly in 2006 with the launch of the USAID NTD Program and the subsequent announcement of expanded efforts across the U.S. government in 2008. Today these efforts focus on seven NTDs (ascariasis or roundworm, hookworm, trichuriasis or whipworm, lymphatic filariasis or elephantiasis, onchocerciasis or river blindness, schistosomiasis or snail fever, and trachoma) that are responsible for the overwhelming majority of the NTD burden but can be controlled and even eliminated with low-cost and effective interventions, such as an integrated control approach targeting multiple NTDs simultaneously through mass drug administration (MDA).

Global Health Security (GHS)

While the U.S. has supported global health security work for more than two decades, its involvement has expanded over time, with attention to these efforts growing significantly due to the COVID-19 pandemic. U.S. global GHS efforts aim to reduce the threat of emerging and re-emerging diseases by supporting preparedness, detection, and response capabilities worldwide. The U.S. has also played a key role in the development and 2014 launch of the “Global Health Security Agenda (GHSA).” Through this international partnership that now involves more than 70 countries and international organizations, the U.S. works to help countries make measurable improvements in their GHS capabilities. The U.S. is also a donor to the new Pandemic Fund, which seeks to provide sustained financing to help countries build their capacity to prevent, prepare for, and respond to epidemics and pandemics.

How Much Funding Does the U.S. Provide for Global Health?

Copy link to How Much Funding Does the U.S. Provide for Global Health?

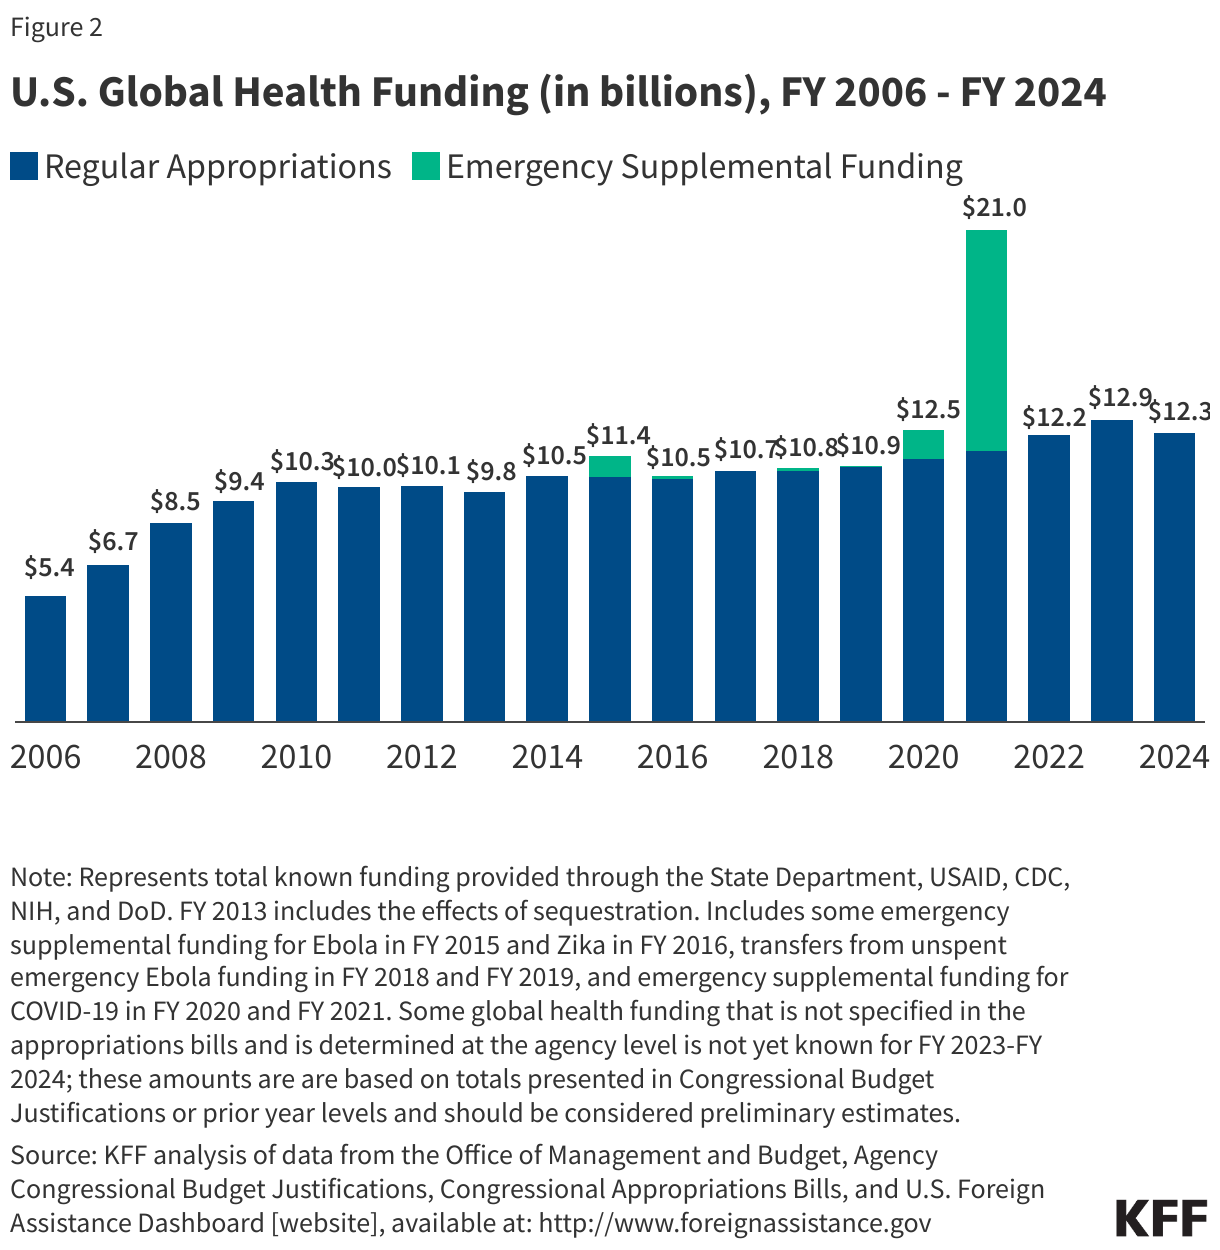
In FY 2024, U.S. funding for global health totaled $12.3 billion. As Figure 2 shows, the U.S. investment in global health has grown significantly since the early 2000s, in large part due to funding for initiatives such as PEPFAR and PMI but with spikes in some years due to emergency or supplemental funding for disease outbreaks such as Ebola, Zika, and COVID-19. Funding reached its highest level to date in FY 2021, largely due to the U.S. global response to the COVID-19 pandemic.

Although a large majority of the American public overestimates the share of the federal budget that is spent on foreign aid (with nearly half believing that the share is greater than 20%), U.S. foreign aid actually accounts for 1% or less of the federal budget, with U.S. funding for global health—which is part of the foreign affairs budget—accounting for an even smaller share.

U.S. Global Health Funding (in billions), FY 2006 - FY 2024

U.S. Global Health Funding by Program Area

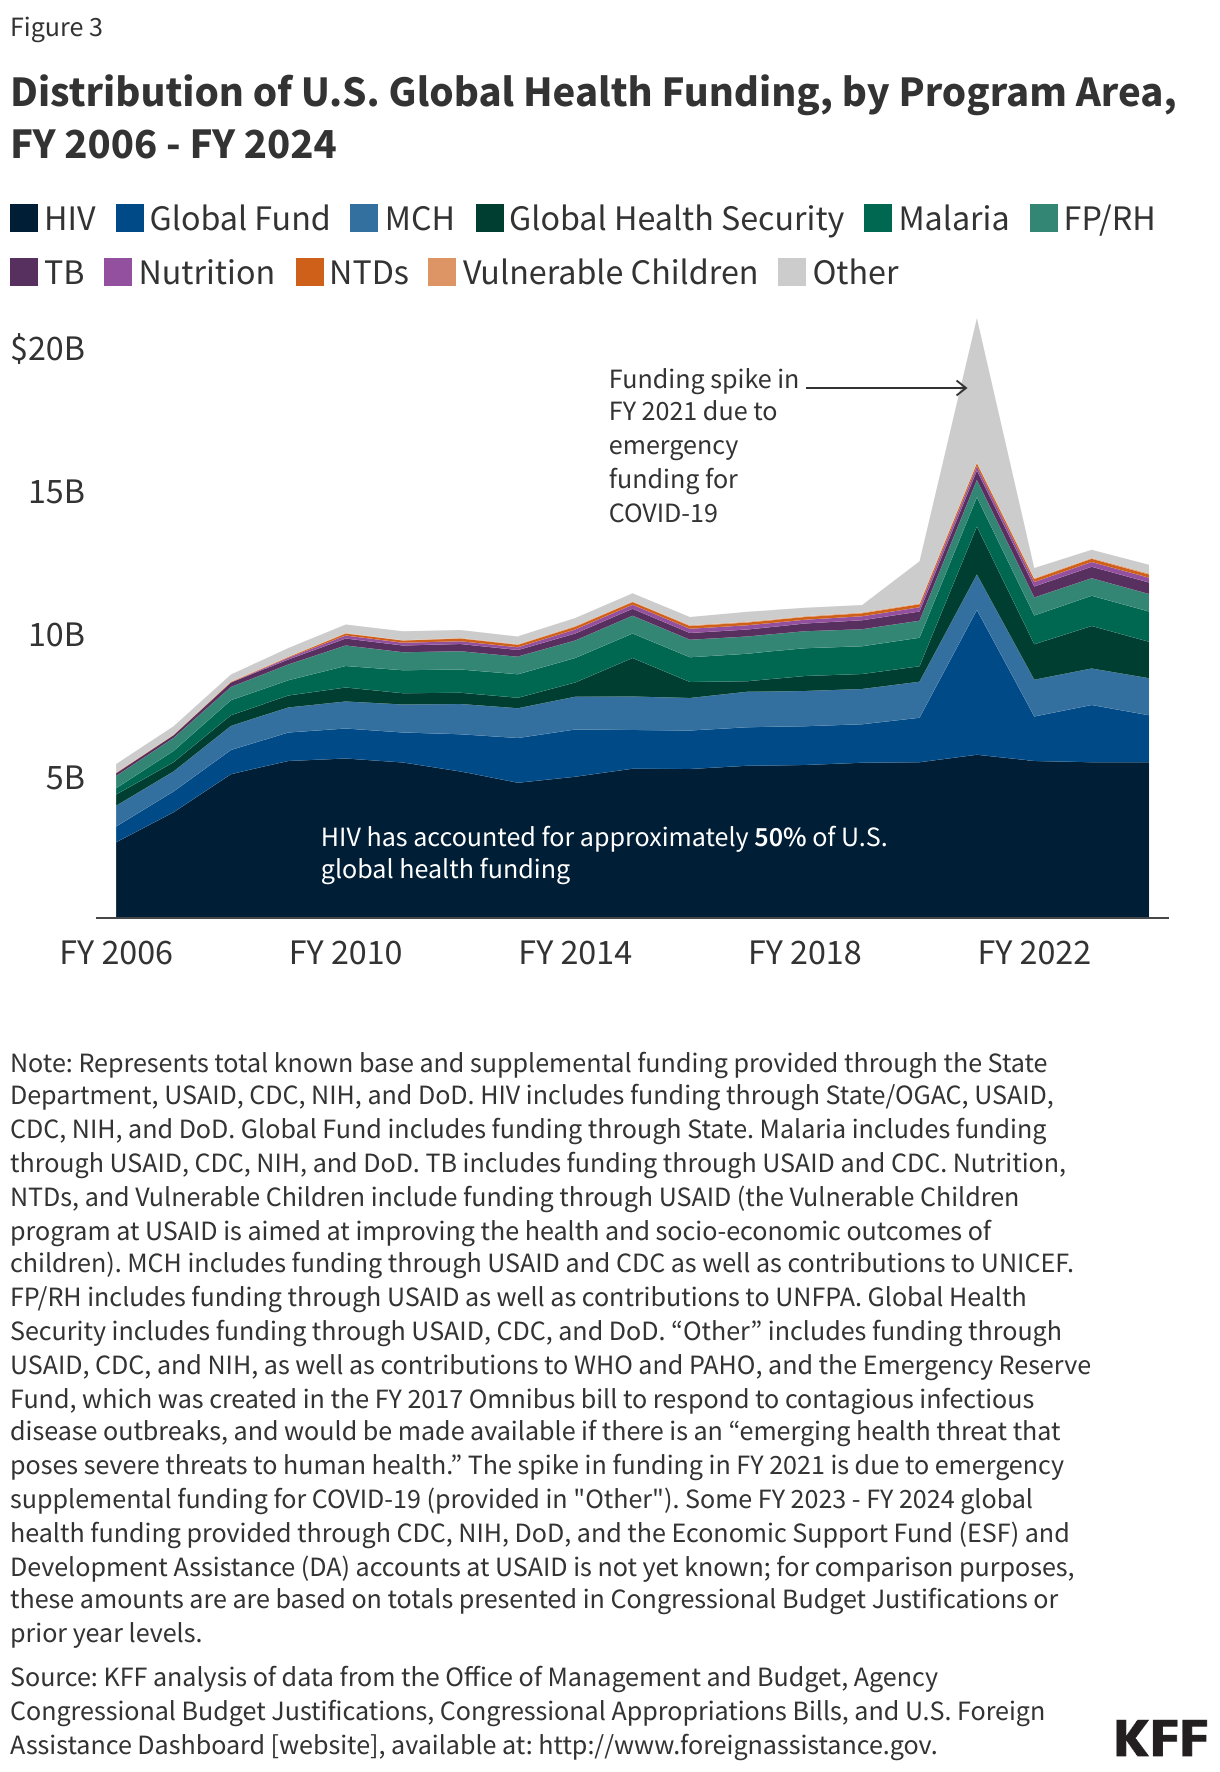
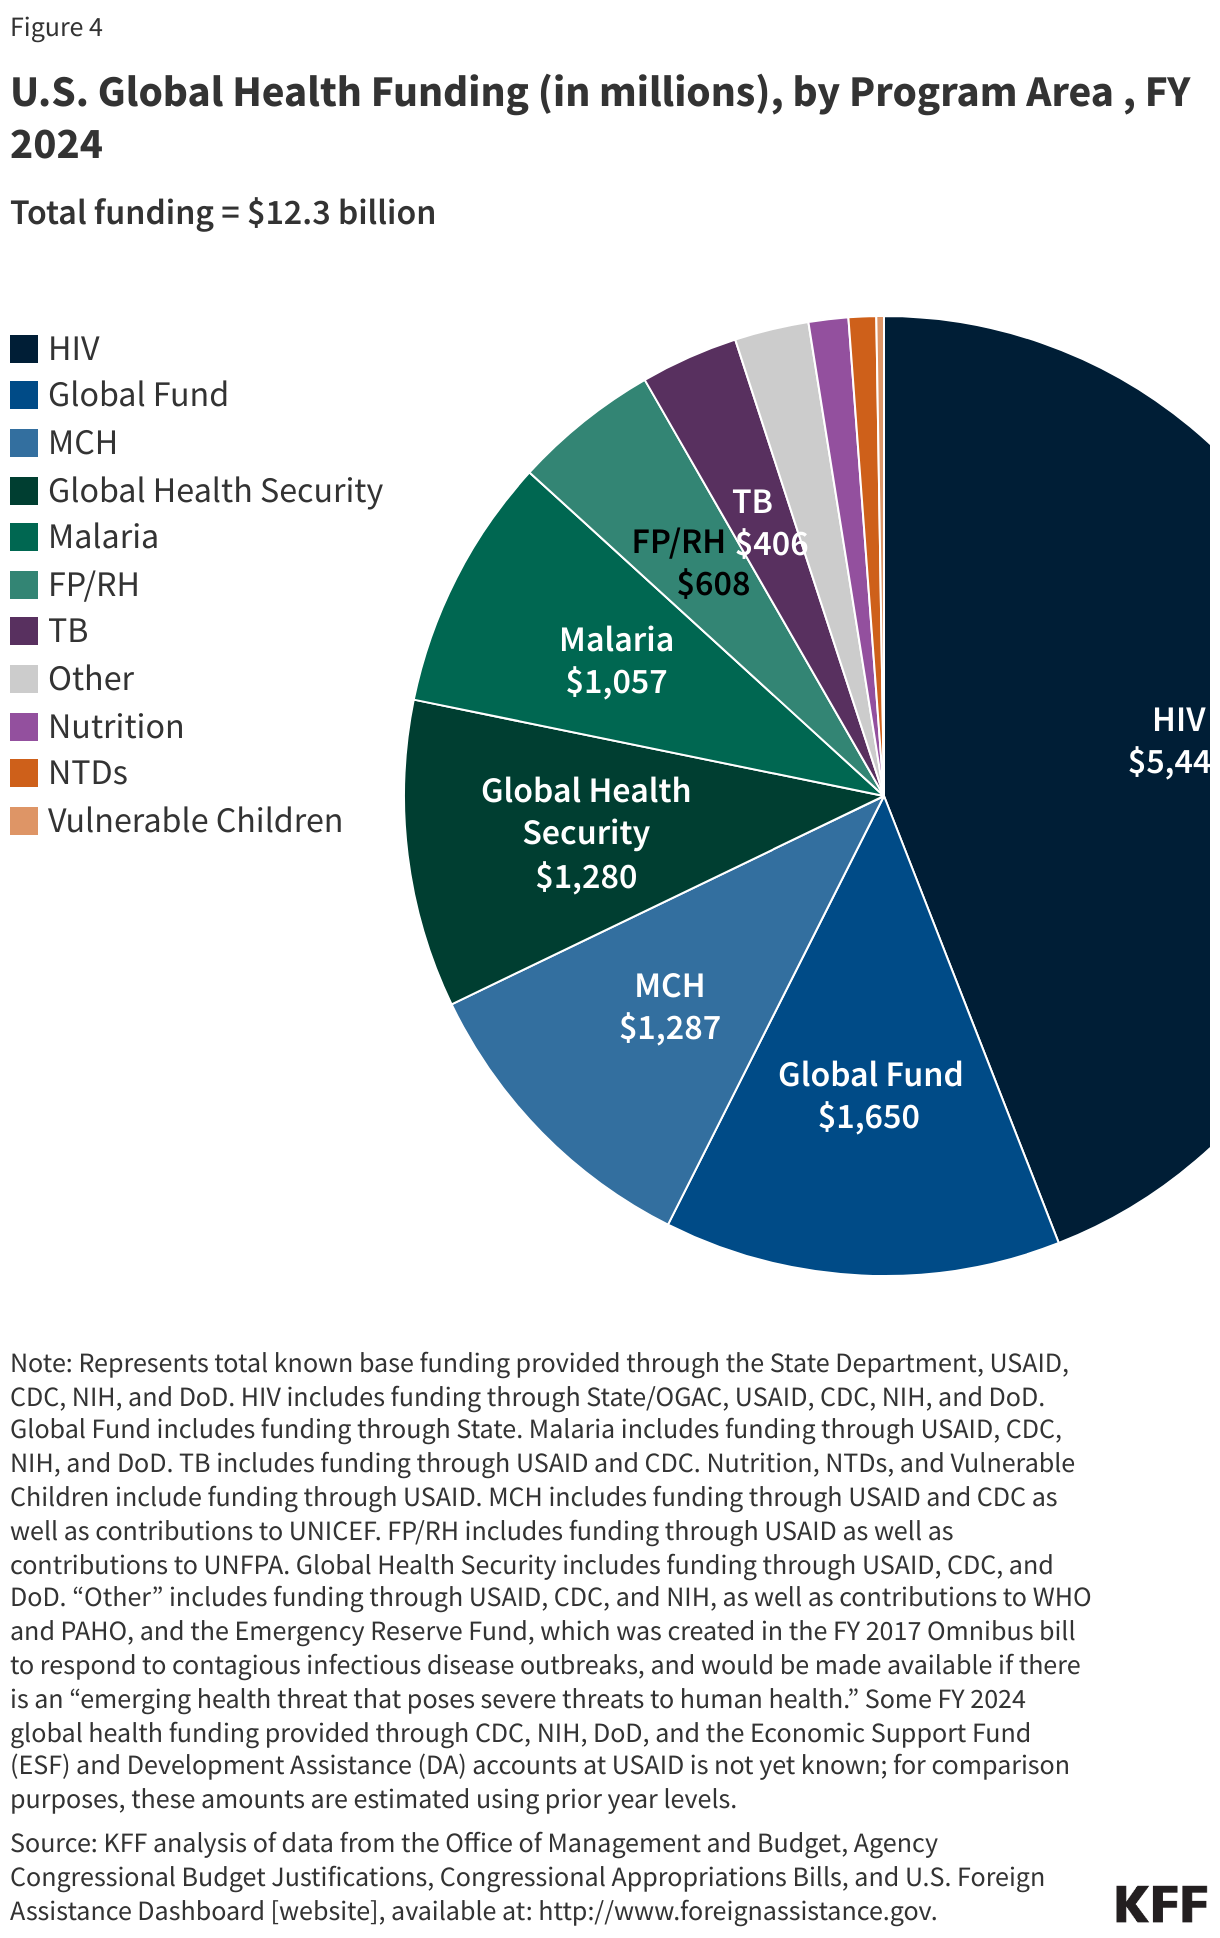
Looking across funding for the major global health program areas since FY 2006, most U.S. global health funding over time has been directed to HIV programs, accounting for approximately 50% of U.S. global health funding in most years (Figure 3). The Global Fund accounted for the next largest share over the period, followed by MCH and malaria. More recently, the U.S. has emphasized global health security more, with funding for these efforts increasing considerably during the COVID-19 pandemic and afterward. Consistent with this trend, most funding was provided to HIV efforts ($5.4 billion or 44%), followed by the Global Fund ($1.7 billion or 13%) and maternal and child health and global health security (both $1.3 billion or 10%) in FY 2024 (Figure 4).

Distribution of U.S. Global Health Funding, by Program Area, FY 2006 - FY 2024
U.S. Global Health Funding (in millions), by Program Area , FY 2024

Bilateral vs. Multilateral Aid

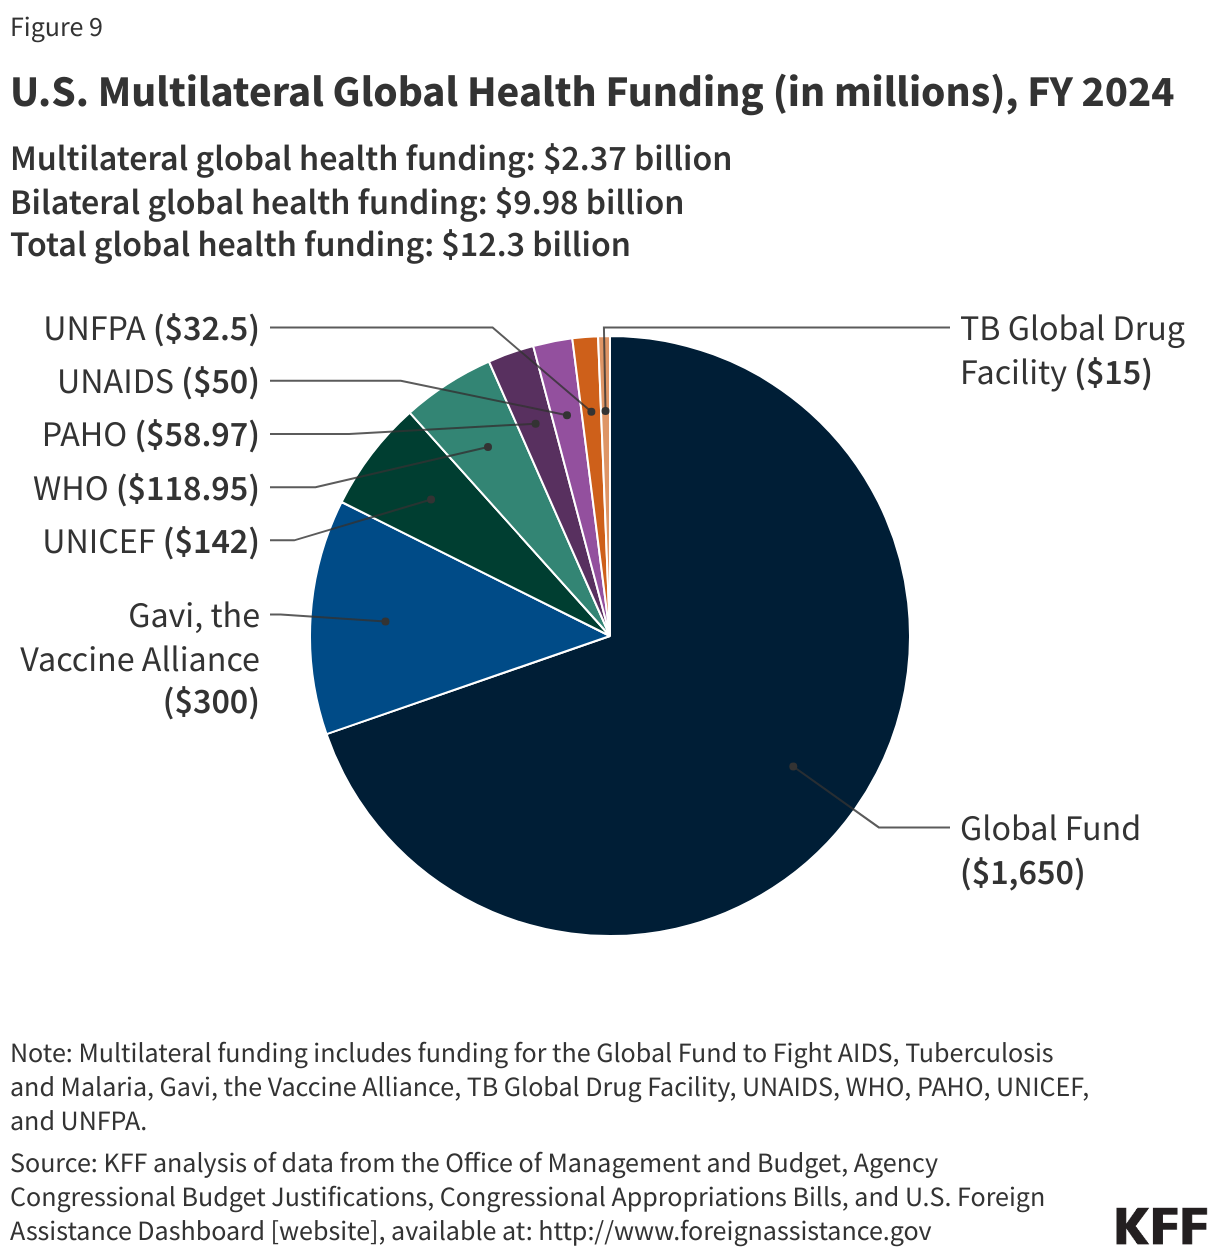
Most U.S. global health funding is provided bilaterally – that is, funding provided by the U.S. directly to or on behalf of a recipient country or region. In FY 2024, about 80% of the U.S. global health budget was provided through bilateral programs. The remainder (about 20%) is provided multilaterally through U.S. contributions to international institutions and organizations (see [“What Multilateral Health Organizations Are Supported by the U.S.?”]).

Which U.S. Agencies Are Involved in Carrying Out Efforts in These Program Areas?

Copy link to Which U.S. Agencies Are Involved in Carrying Out Efforts in These Program Areas?

The U.S. government’s engagement in global health is carried out and overseen by multiple executive branch departments and agencies and the legislative branch, including several congressional committees (Figure 5).
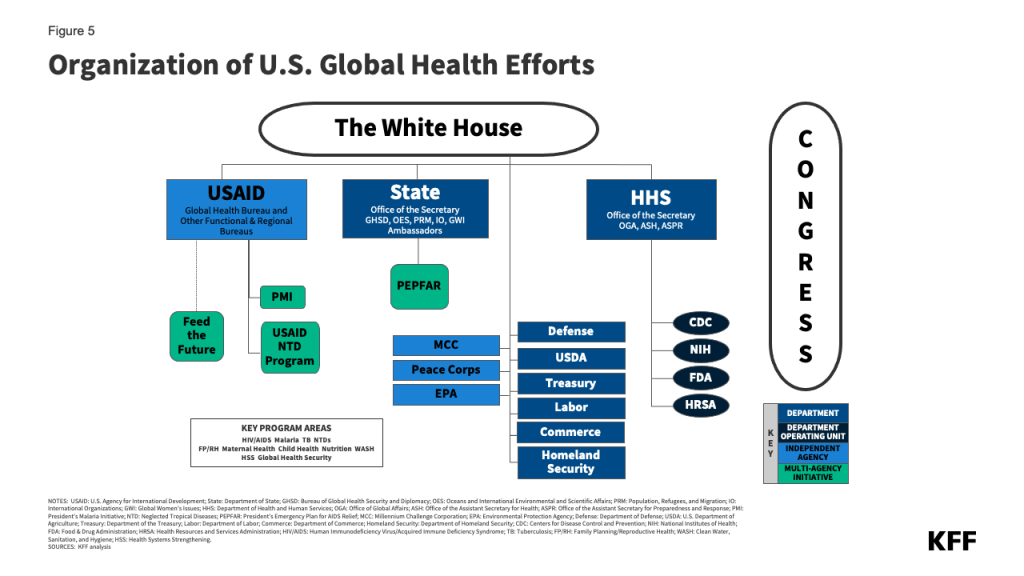
Executive Branch

In general, U.S. global health engagement has developed within two main structures of the Executive Branch of government: the foreign assistance structure, which is predominantly global development-oriented and has close links to foreign policy; and the public health structure, which has its roots in disease prevention, control, and surveillance efforts.

Most funding for and oversight of U.S. global health resides within the foreign assistance structure, including:

  • Department of State (State): Established in 1789, the Department of State is the Cabinet-level foreign affairs agency of the United States. It advances U.S. objectives and interests worldwide through its primary role in developing and implementing the President’s foreign policy. It also provides policy direction to USAID, the lead federal agency for development assistance. The Department of State’s new Bureau for Global Health Security and Diplomacy (GHSD) coordinates the Department’s work on global health security, including HIV, and houses PEPFAR.
  • U.S. Agency for International Development (USAID): Established in 1961, USAID is an independent U.S. federal government agency that receives overall foreign policy guidance from the Secretary of State. Its role is to support long-term and broad-based economic growth in countries and advance U.S. foreign policy objectives by supporting activities through each of its programmatic functional bureaus (e.g. Bureau for Global Health) and regional bureaus. Most USAID global health programs are coordinated through the Bureau for Global Health, including HIV and other infectious diseases, MCH, nutrition, FP/RH, NTDs, and global health security.
  • Millennium Challenge Corporation (MCC): Established in 2004, MCC administers the Millennium Challenge Account (MCA), a U.S. government initiative providing development assistance to eligible countries to promote economic growth and reduce poverty in low- and middle-income countries. Although MCC supports several health-related programs, health is not the main focus or purpose of its work; its design is intended to link MCC contributions for development assistance (to reduce poverty through support for economic growth) to greater responsibility by low- and middle-income countries for successfully attaining certain governance and development benchmarks.

Agencies within the public health structure operate global health programs directly or in conjunction with foreign assistance agencies. They are represented most prominently by several agencies within the Department of Health and Human Services (HHS), including:

  • Office of Global Affairs (OGA): OGA’s primary function is global health diplomacy – particularly coordinating and maintaining engagement across HHS and the U.S. government with foreign governments and ministries of health, multilateral organizations, civil society groups, and the private sector – exchanging best practices and sharing technical knowledge to advance U.S. global health priorities and research.
  • Centers for Disease Control and Prevention (CDC): With a long history of working on international health issues, CDC focuses on disease control and prevention and health promotion through operations, development assistance, basic and field research, technical assistance, training/exchanges, and capacity building.
  • National Institutes of Health (NIH): One of the world’s leading research entities on global health, NIH conducts biomedical and behavioral science research on diseases and disorders to enhance diagnosis, prevention, and treatment and provides technical assistance and training. All 27 of the agency’s institutes and centers engage in global health activities.
  • Food & Drug Administration (FDA): The FDA screens pharmaceutical and biological products for safety and efficacy and helps oversee the safety of the U.S. food supply.
  • Health Resources and Services Administration (HRSA): HRSA builds human and organizational capacity and promotes health systems strengthening to deliver care in PEPFAR countries.

In addition to the foreign assistance and public health service agencies, other departments and agencies involved in global health include the Department of Defense (DoD), the Department of Agriculture (USDA), the Peace Corps, the Environmental Protection Agency (EPA), the Department of Homeland Security (DHS), the Department of Labor (DoL), the Department of Commerce (Commerce), the Office of the U.S. Trade Representative (USTR), and the National Security Council (NSC). The NSC, which sits within the White House, plays a significant role across the U.S. government, as it is responsible for coordinating and reviewing the U.S. strategy and activities related to global health security, including its international response. In addition, on matters of global health security, it works closely with the White House Office of Pandemic Preparedness and Response (OPPR), which is responsible for domestic policy coordination related to health security.

The daily operations of U.S. global health activities are administered chiefly through the Department of State’s Bureau of Global Health Security and Diplomacy (GHSD), which oversees U.S. global HIV efforts that fall under the PEPFAR program and also provides diplomatic support (through U.S. ambassadors and others) in implementing U.S. global health efforts; USAID; and HHS operating divisions, particularly the CDC. This is also reflected in the way U.S. global health funding is channeled, with most funding provided (appropriated by Congress) to the Department of State (52%), followed by USAID (33%), HHS via NIH (7%) and CDC (5%), and the Department of Defense (DoD) (2%); departments and agencies may then transfer some or all of this funding to other departments and agencies carrying out global health activities.

Legislative Branch

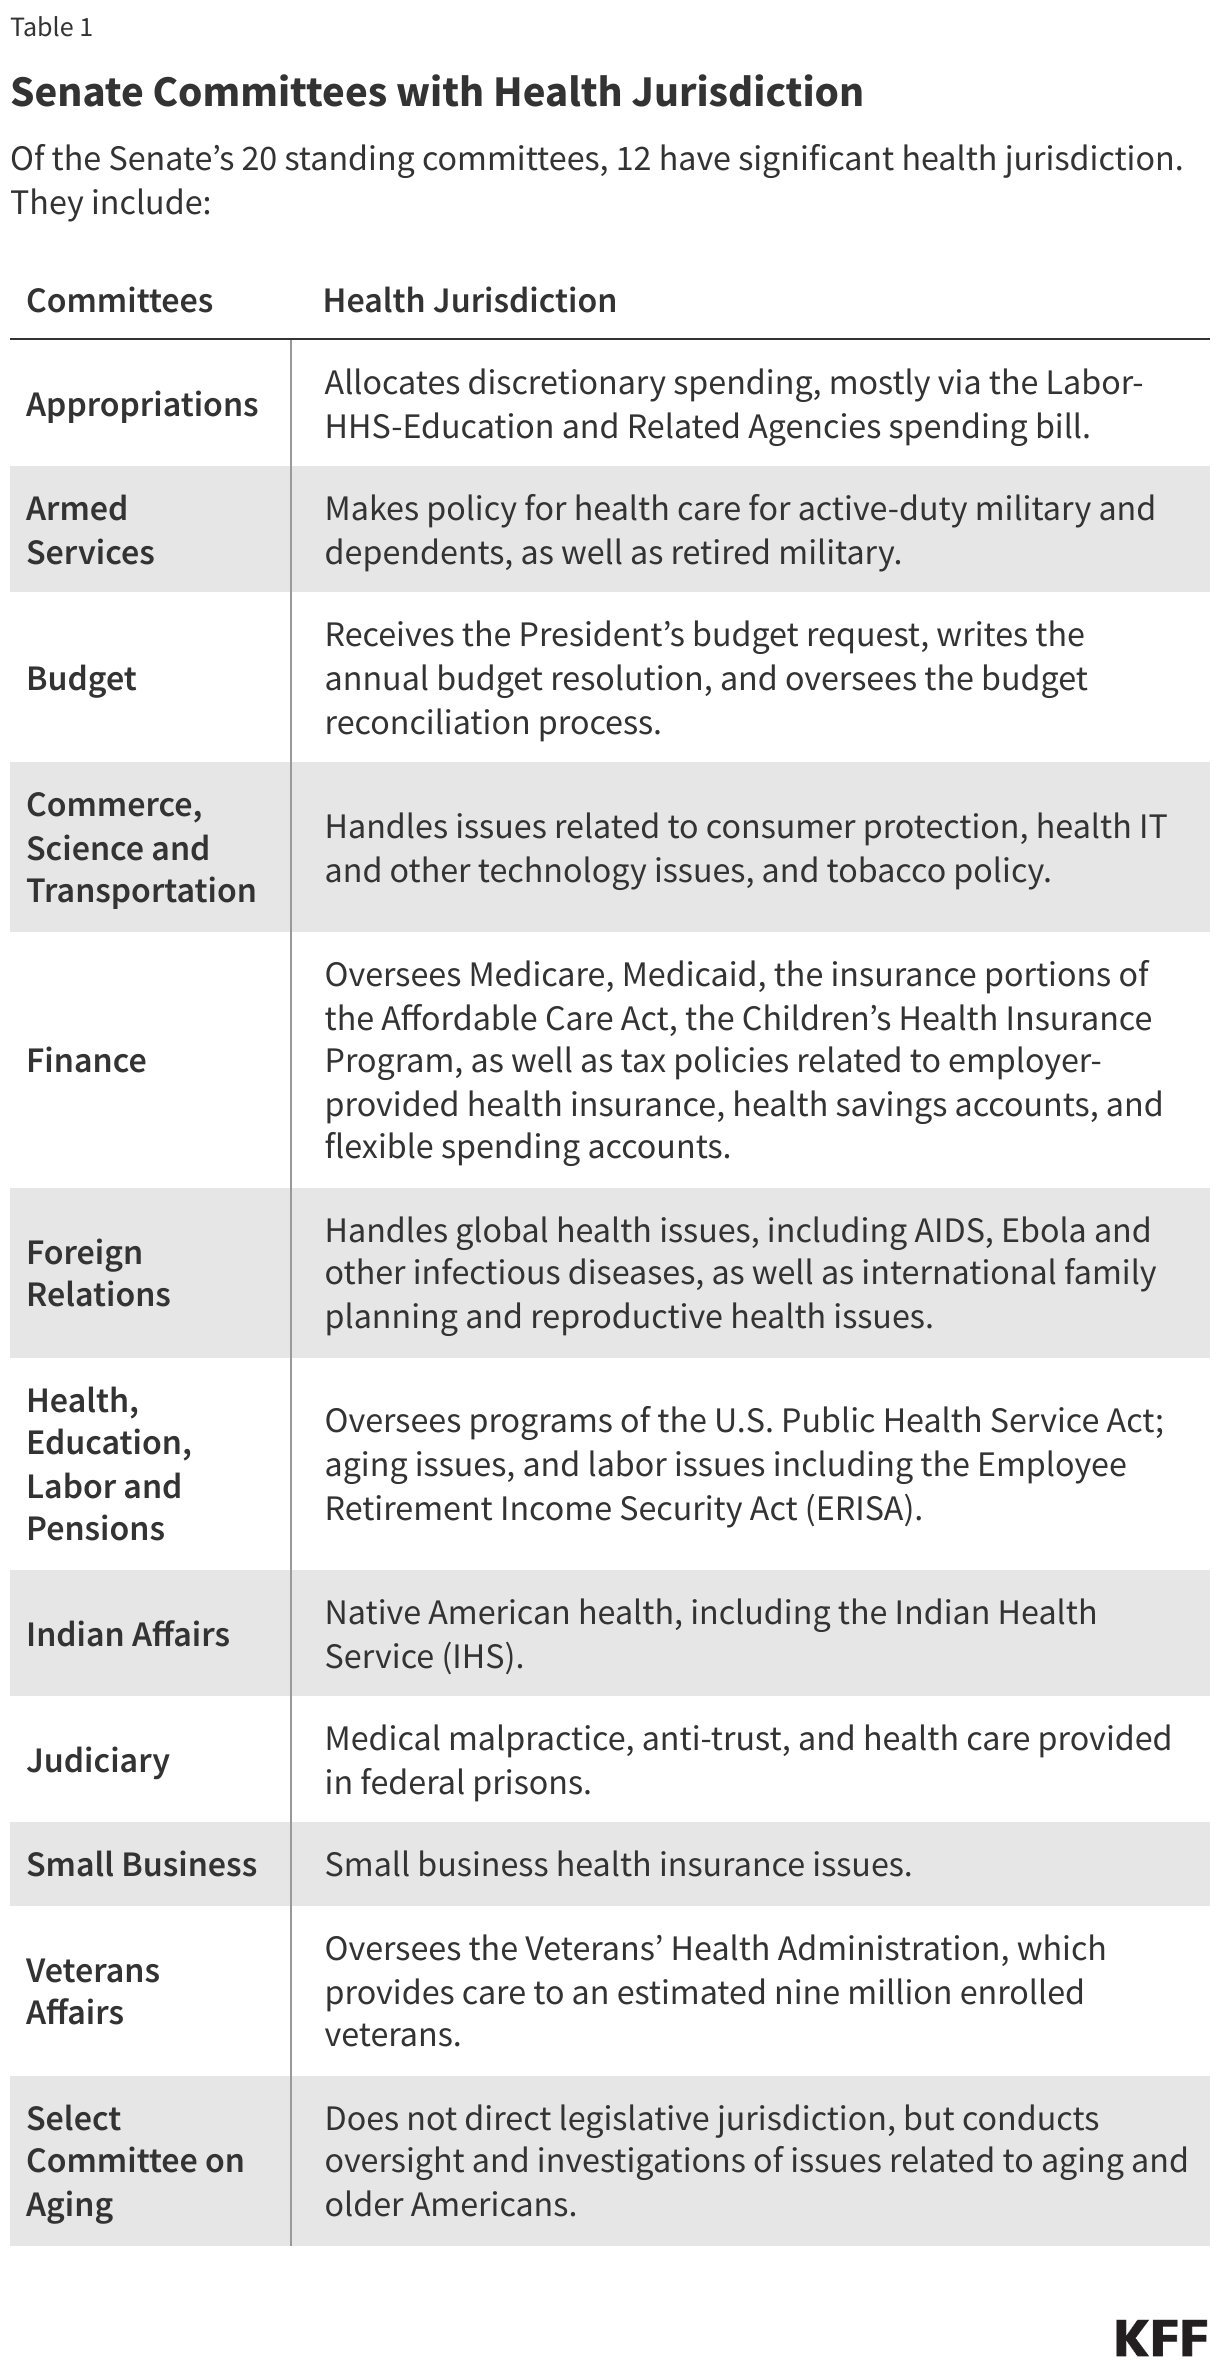
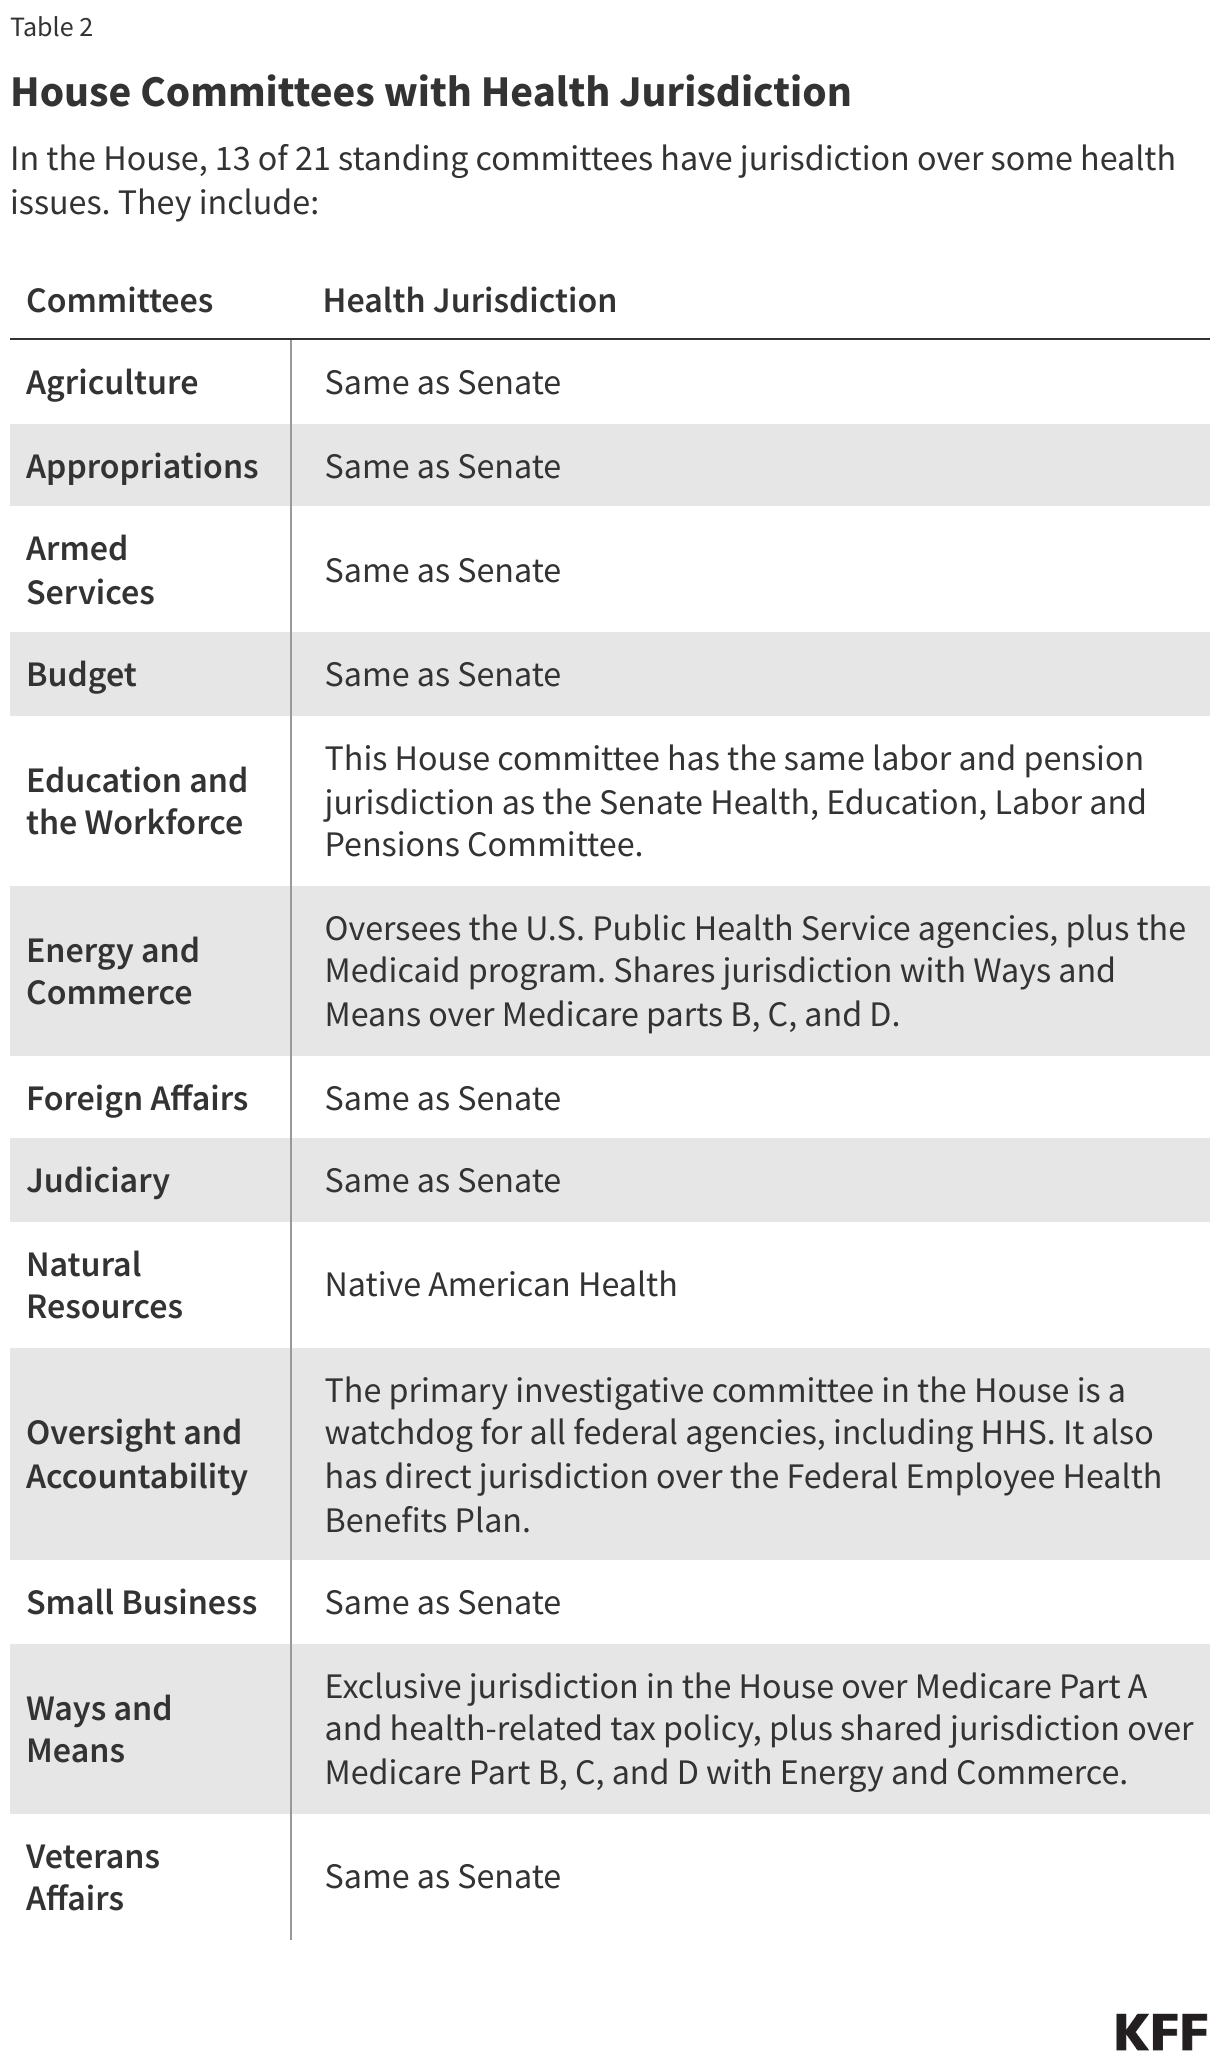
The U.S. Congress introduces, considers, and passes global health-related legislation; oversees global health efforts, specifying how funds for these programs are to be (and not to be) spent; authorizes and appropriates funding; and confirms presidential appointees to key U.S. global health positions. Major committees of the House of Representatives (House) and Senate with jurisdiction over global health efforts include: the House Committee on Foreign Affairs, Senate Committee on Foreign Relations, House Committee on Energy and Commerce, Senate Committee on Health, Education, Labor, and Pensions, and the Senate and House Appropriations Committees.

The U.S. global health response has been defined by numerous governing statutes, authorities, and policy decisions. For instance, the legislation that created PEPFAR in 2003 and its subsequent reauthorizations in 2008, 2013, and 2018 are key statutes of U.S. global health policy, as they govern its bilateral HIV response, bilateral assistance for TB and malaria, and participation in the Global Fund. Other statutory requirements that shape the implementation and scope of U.S. global health activities are those governing U.S. global FP/RH efforts, such as those directing how U.S. funds may not be spent. For instance, the Helms Amendment (1973) prohibits the use of foreign assistance to pay for the performance of abortion as a method of family planning or to motivate or coerce any person to practice abortion. The Kemp-Kasten Amendment (1985) prohibits funding any organization or program, as determined by the President, that supports or participates in the management of a program of coercive abortion or involuntary sterilization (it has been invoked at times to restrict funding to UNFPA).

Where Do U.S. Bilateral Global Health Programs Operate?

Copy link to Where Do U.S. Bilateral Global Health Programs Operate?

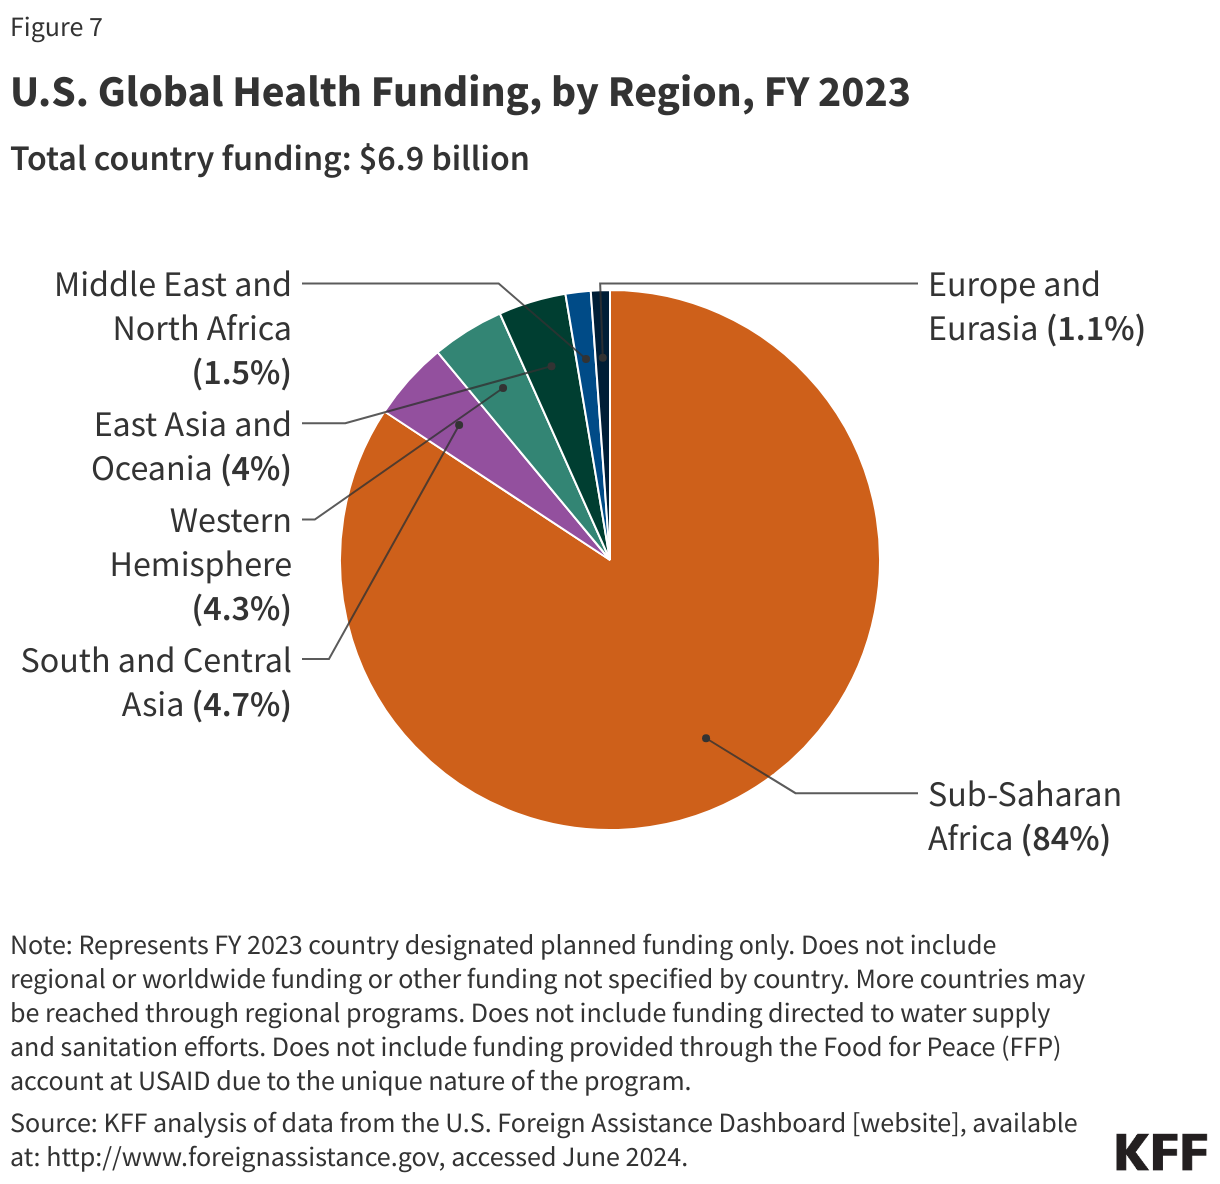
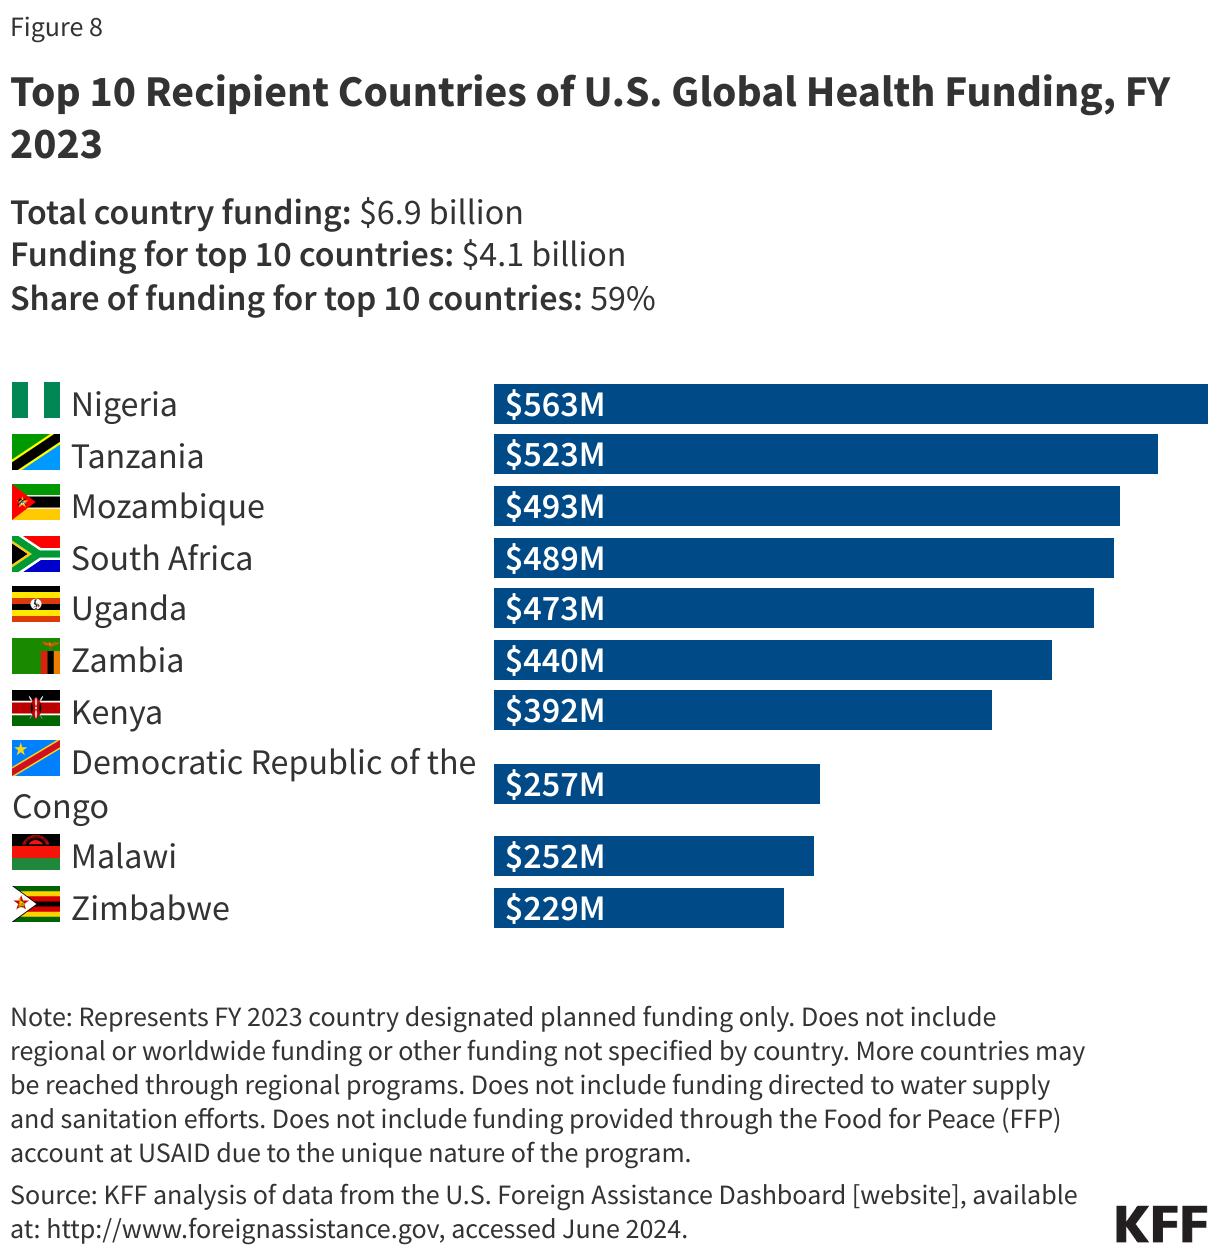
The U.S. provides bilateral support for U.S. global health programs in more than 70 countries, with additional countries reached through U.S. regional global health programs and U.S. contributions to multilateral organizations. Multiple factors determine where the U.S. channels its global health support. While more U.S. support is generally directed to countries facing a higher burden of disease, it is also influenced by factors such as the presence of willing and able partner governments, a history of positive relations and goodwill with host countries, strategic and national security priorities, and funding and personnel availability. The majority of countries receiving U.S. bilateral support for global health (“partner countries”) are located in sub-Saharan Africa (35 countries), followed by the Western Hemisphere (16 countries), East Asia and Oceania (11 countries), South and Central Asia (9 countries), Europe and Eurasia (4 countries), and Middle East and North Africa (4 countries) (Figure 6). Most U.S. bilateral support for global health programs is provided in sub-Saharan Africa (84%) (Figure 7). Furthermore, the top 10 country recipients of U.S. global health funding, representing about 60% of U.S. bilateral support for global health, are all in this region (Figure 8).

Countries Where the U.S. Operates Global Health Programs, by Region, FY 2023
U.S. Global Health Funding, by Region, FY 2023
Top 10 Recipient Countries of U.S. Global Health Funding, FY 2023

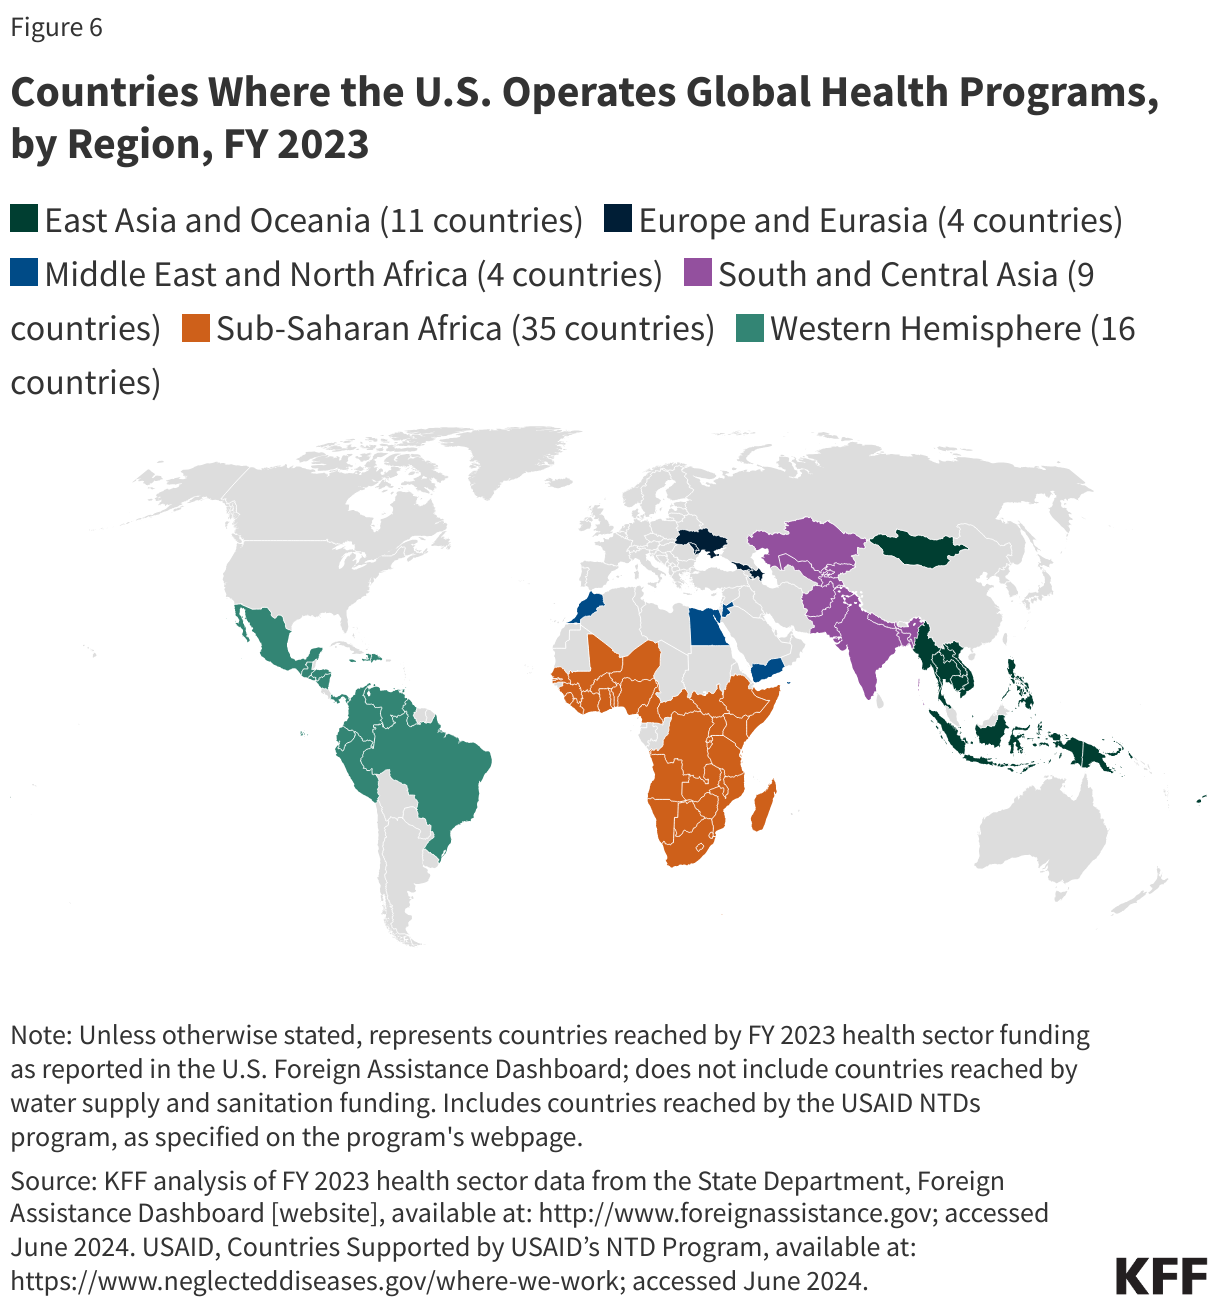
The U.S. typically operates more than one health program (HIV, TB, malaria, etc.) in each partner country. While in most countries, the U.S. operates programs in four or fewer global health areas, this number is generally higher in countries in sub-Saharan Africa (five or more).

What Multilateral Health Organizations Are Supported by the U.S.?

Copy link to What Multilateral Health Organizations Are Supported by the U.S.?

In addition to its bilateral programs, the U.S. has a long history of engagement with multilateral health organizations and international institutions, beginning with its role in the development of the first such organizations, including the Pan-American Health Organization (PAHO) in the early 1900s and the World Health Organization (WHO) a few decades later. This involvement continues with, for example, the Global Fund (which the U.S. helped to launch in 2001), Gavi (launched in 2000), the GHSA (which the U.S. played a key role in developing and launching in 2014), and the Pandemic Fund (launched in 2022). U.S. support for multilateral global health efforts takes various forms, including:

  • Funding. The U.S. is often the largest or one of the largest donors to multilateral health efforts, funding core (generally used to support essential functions and operations) and voluntary (used for specific projects or initiatives the U.S. seeks to support) contributions. About a fifth (19%) of U.S. global health funding supports U.S. contributions to multilateral health organizations (Figure 9).
  • Governance. The U.S. is active in the governance structures that oversee multilateral global health organizations and initiatives, including holding permanent or rotating seats on many of their boards.
  • Technical assistance. The U.S. offers technical assistance in support of grants to partner countries, providing additional staff capacity to international organizations (by detailing U.S. government employees to these organizations for periods of time).
  • Standard setting. The U.S. also engages in standard-setting, weighing in on global plans, treaties, and agreements to respond to a range of health issues as they are developed and considered for approval by the larger body.
U.S. Multilateral Global Health Funding (in millions), FY 2024

Today the U.S. engages with a number of multilateral global health organizations, including health-focused specialty agencies of the United Nations (U.N.) and international financing mechanisms for global health. Key among these are eight to which Congress specifically directs funding (though the U.S. also reaches other multilateral health institutions without direct Congressional appropriations but rather through general support), of which the U.S. is the top contributor to five (the Global Fund, PAHO, UNAIDS, UNICEF, and WHO):

U.N. Agencies

  • World Health Organization (WHO): WHO, created in 1948, is the directing and coordinating authority for health within the U.N. system. WHO provides international leadership on global health matters, shaping the health research agenda, setting norms and standards, providing technical support to countries, and monitoring and assessing health trends. The U.S. has been involved in WHO since its creation, providing financial and technical support as well as participating in its governance structure.
  • Pan American Health Organization (PAHO): PAHO is the oldest international health agency, founded originally as the International Sanitary Bureau in 1902. The U.S. joined PAHO as a member state in 1925. PAHO, the specialized international health agency for the Americas, “works with countries throughout the region to improve and protect people’s health” and serves as the WHO Regional Office for the Americas and as the health organization of the inter-American System.
  • Joint United Nations Programme on HIV/AIDS (UNAIDS): UNAIDS, created in 1996 as the successor organization to the WHO Global Programme on AIDS (GPA), is the leading global organization for addressing HIV/AIDS. Coordinating efforts across the U.N. system, it is made up of 11 U.N. co-sponsors and guided by a Programme Coordinating Board (PCB), which is a subset of its co-sponsors and government representatives. The U.S. currently serves on the PCB.
  • United Nations Children’s Fund (UNICEF): UNICEF, created in 1946, aims to improve the lives of children, particularly the most disadvantaged children and adolescents, and is one of the largest purchasers of vaccines worldwide. The U.S. was a founding member that same year.
  • United Nations Population Fund (UNFPA): UNFPA, created in 1969, is the largest purchaser and distributor of contraceptives worldwide. While the U.S. helped to found UNFPA and was a leading supporter for many years, its support has fluctuated significantly over the years, due to ongoing U.S. political debates about abortion.

Non-U.N. Financing Mechanisms

  • Gavi, the Vaccine Alliance (Gavi): Gavi, created in 2000, is a public-private partnership that aims to increase access to immunization in poor countries. The U.S. has been involved in Gavi since its creation through contributions, participation in Gavi’s governance, and technical assistance. The U.S. is the second largest donor to Gavi’s core programs and the top donor to Gavi’s COVAX Advance Market Commitment (COVAX AMC), a financial mechanism within COVAX that supports low- and middle-income countries through procurement and distribution of COVID-19 vaccines.
  • Global Fund to Fight AIDS, Tuberculosis and Malaria (Global Fund): The Global Fund, created in 2001, is an independent multilateral financing entity that supports HIV, TB, and malaria programs in low- and middle-income countries. The U.S. was involved in creating the Global Fund and maintains a permanent seat on its Board. U.S. contributions and those of other donors are pooled and then provided by the Global Fund to country-driven projects based on technical merit and need.
  • TB Global Drug Facility: The Global Drug Facility, created in 2001, is a financing mechanism of the Stop TB Partnership; it provides grants to countries for TB drugs.

U.S. support for multilateral institutions overall has fluctuated over time, reflecting, in part, changing U.S. leadership views on the relative value of bilateralism versus multilateralism. As a result, U.S. engagement in and contributions to specific multilateral health organizations and institutions may change over time. For example, the U.S. under the Trump administration did not participate in the partnership to create  COVAX (an international partnership led by the Coalition for Epidemic Preparedness Innovations [CEPI], Gavi, and WHO) to facilitate greater global access to the COVID-19 vaccine, although Congress did provide $4 billion in emergency funding to Gavi in support of COVID-19 vaccine access. Under the Biden administration, the U.S. joined the COVAX partnership.

Multilateral initiatives complement U.S. bilateral global health efforts, helping make progress toward U.S. goals in various program areas. In some cases, U.S. multilateral global health support allows the U.S. to reach a larger number of countries; it also may help to leverage additional funding and provide opportunities for improved coordination and technical consultations. Additionally, U.S. policies related to funding can greatly influence other financial support for multilaterals. For instance, since U.S. law requires that the U.S. contribution to the Global Fund cannot exceed 33% of total contributions from all donors, the U.S. contribution leverages other donor contributions; in effect, this requirement encourages increased support from other donors and prevents the U.S. from becoming the predominant donor to the Global Fund.

How Does the U.S. Compare to Other Donors of International Health Assistance?

Copy link to How Does the U.S. Compare to Other Donors of International Health Assistance?

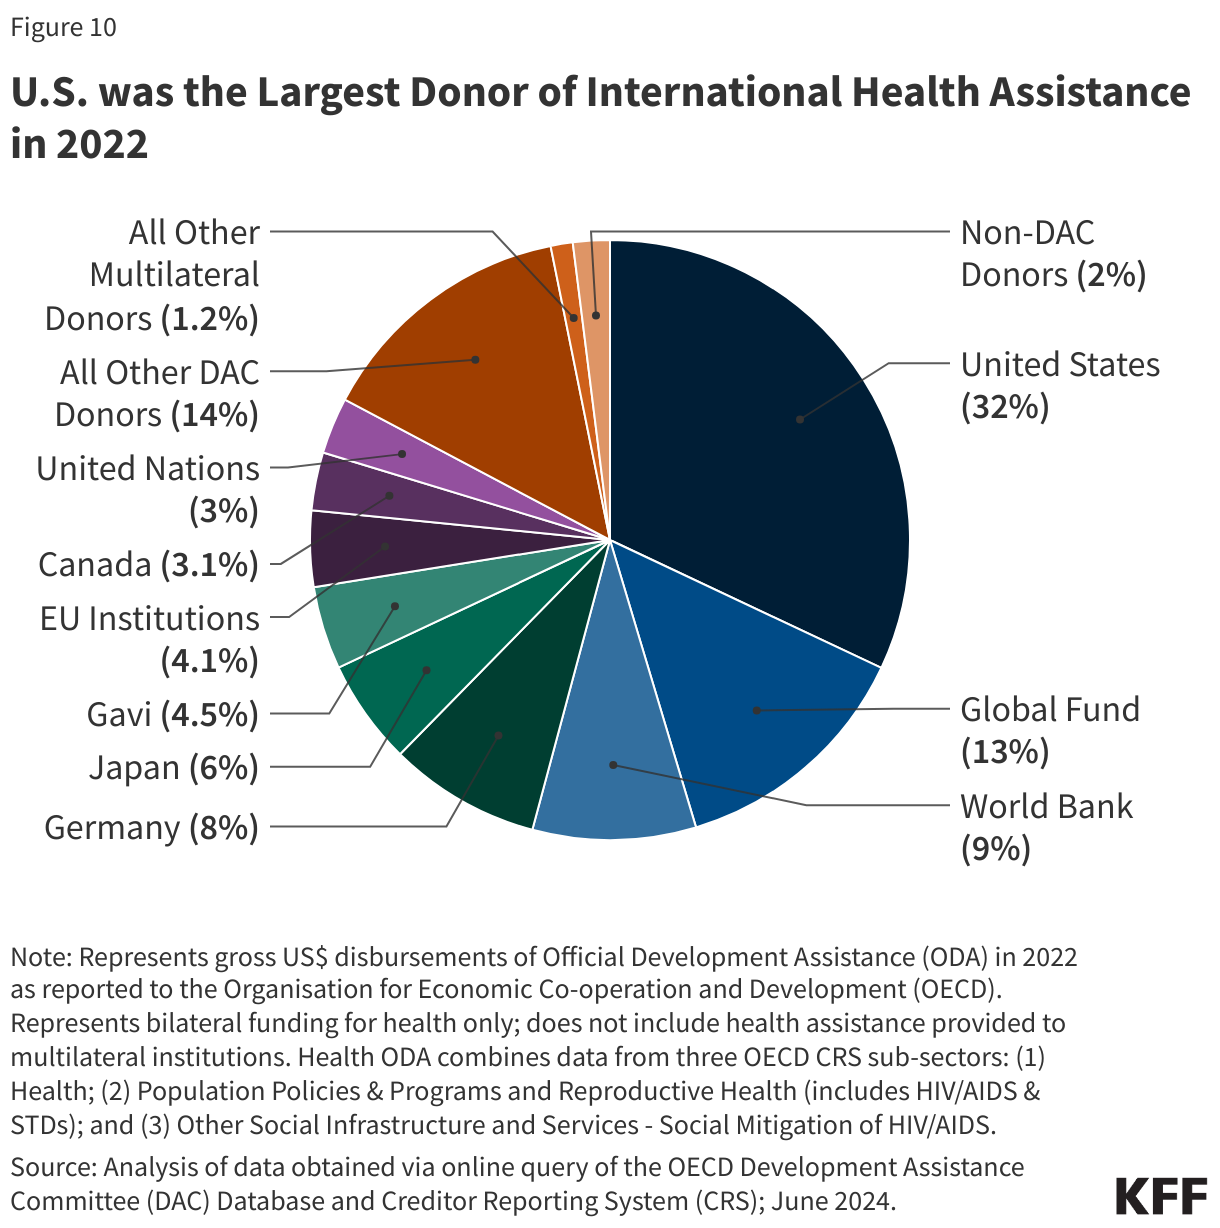
The U.S. is the largest donor to global health, providing almost a third (32%) of all international health assistance among major donors and institutions (Figure 10). The Global Fund – whose top contributor is the U.S. – is the second largest donor to global health.

U.S. is the Largest Donor of International Health Assistance in 2022

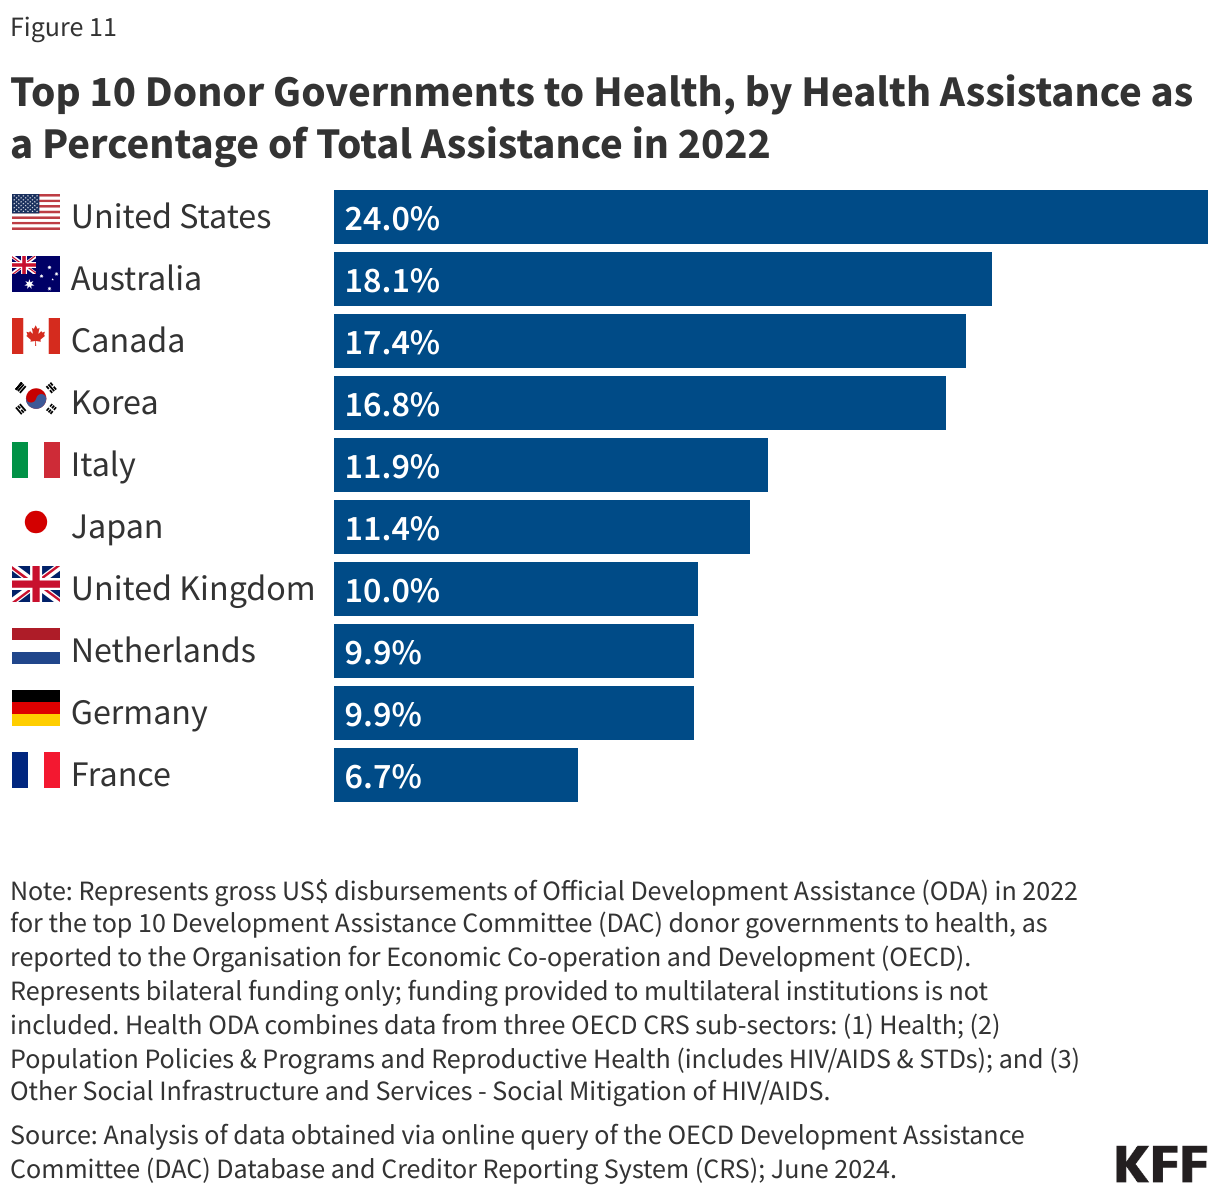
In addition, the U.S. has historically devoted more of its foreign assistance to health than any other donor government, contributing nearly a quarter of its foreign assistance to global health in 2022 (Figure 11). The U.S. is also the largest government donor to several specific global health areas including HIV and family planning.

Top 10 Donor Governments to Health, by Health Assistance as a Percentage of Total Assistance in 2022

Future Outlook

Copy link to Future Outlook

The U.S. has been engaged in international health activities for over a century, and today is the largest funder and implementer of global health programs worldwide. In many respects, the U.S. approach to global health will influence and impact how other countries and global entities engage in global health. Among the key issues to watch are:

  • The future direction of U.S. leadership in and commitment to global health as well as its ever-evolving strategy toward global health, particularly as U.S. domestic politics increasingly impact decisions about the future of major U.S. global health initiatives (such as the short-term reauthorization of PEPFAR, which was caught up in the larger national debate related to abortion).
  • Continued discussion of what U.S. global health funding levels may be going forward, particularly in a challenging U.S. political and budget environment, and whether, given likely funding constraints, U.S. global health efforts will be able to preserve or expand their reach and impact.
  • Ongoing efforts to address short- and long-term impacts of COVID-19 on U.S. global health programs in partner countries while better preparing them to meet the next unexpected health challenge through heightened emphasis on building global health security capabilities.
  • The appropriate balance between U.S. support for bilateral and multilateral efforts and continuing to coordinate with other donors and multilateral and international organizations, particularly in areas of renewed global concern such as updating the International Health Regulations (IHR), drafting and ratifying a Pandemic Treaty, and contributing to the Pandemic Fund.
  • Ways the U.S. aims to accelerate progress across U.S. global health programs sustainably in the context of weak health systems, varied barriers to access, and challenges such as equity and legal and policy hurdles for vulnerable populations and essential health services.
  • Attempts to further integrate and better coordinate across disease and program areas of U.S. global health efforts across the U.S. government.

Resources

Copy link to Resources

Citation

Copy link to Citation

Oum, S., Moss, K., & Kates, J., The U.S. Government and Global Health. In Altman, Drew (Editor), Health Policy 101, (KFF, July 2024) https://www.kff.org/health-policy-101-the-u-s-government-and-global-health/ (date accessed).

The Politics of Health Care and the 2024 Election

KFF Authors:

Table of Contents

Introduction

Copy link to Introduction

Health policy and politics are inextricably linked. Policy is about what the government can do to shift the financing, delivery, and quality of health care, so who controls the government has the power to shape those policies. 

Elections, therefore, always have consequences for the direction of health policy – who is the president and in control of the executive branch, which party has the majority in the House and the Senate with the ability to steer legislation, and who has control in state houses. When political power in Washington is divided, legislating on health care often comes to a standstill, though the president still has significant discretion over health policy through administrative actions. And, stalemates at the federal level often spur greater action by states. 

Health care issues often, but not always, play a dominant role in political campaigns. Health care is a personal issue, so it often resonates with voters. The affordability of health care, in particular, is typically a top concern for voters, along with other pocketbook issues, And, at 17% of the economy, health care has many industry stakeholders who seek influence through lobbying and campaign contributions. At the same time, individual policy issues are rarely decisive in elections. 

Health Reform in Elections

Copy link to Health Reform in Elections

Health “reform” – a somewhat squishy term generally understood to mean proposals that significantly transform the financing, coverage, and delivery of health care – has a long history of playing a major role in elections. 

Harry Truman campaigned on universal health insurance in 1948, but his plan went nowhere in the face of opposition from the American Medical Association and other groups. While falling short of universal coverage, the creation of Medicare and Medicaid in 1965 under Lyndon Johnson dramatically reduced the number of uninsured people. President Johnson signed the Medicare and Medicaid legislation at the Truman Library in Missouri, with Truman himself looking on. 

Later, Bill Clinton campaigned on health reform in 1992, and proposed the sweeping Health Security Act in the first year of his presidency. That plan went down to defeat in Congress amidst opposition from nearly all segments of the health care industry, and the controversy over it has been cited by many as a factor in Democrats losing control of both the House and the Senate in the 1994 midterm elections. 

For many years after the defeat of the Clinton health plan, Democrats were hesitant to push major health reforms. Then, in the 2008 campaign, Barack Obama campaigned once again on health reform, and proposed a plan that eventually became the Affordable Care Act (ACA). The ACA ultimately passed Congress in 2010 with only Democratic votes, after many twists and turns in the legislative process. The major provisions of the ACA were not slated to take effect until 2014, and opposition quickly galvanized against the requirement to have insurance or pay a tax penalty (the “individual mandate”) and in response to criticism that the legislation contained so-called “death panels” (which it did not). Republicans took control of the House and gained a substantial number of seats in the Senate during the 2010 midterm elections, fueled partly by opposition to the ACA. 

The ACA took full effect in 2014, with millions gaining coverage, but more people viewed the law unfavorably than favorably, and repeal became a rallying cry for Republicans in the 2016 campaign. Following the election of Donald Trump, there was a high profile effort to repeal the law, which was ultimately defeated following a public backlash. The ACA repeal debate was a good example of the trade-offs inherent in all health policies. Republicans sought to reduce federal spending and regulation, but the result would have been fewer people covered and weakened protections for people with pre-existing conditions. KFF polling showed that the ACA repeal effort led to increased public support for the law, which persists today. 

KFF Health Tracking Poll: The Public's Views on the ACA

In the 2020 campaign, health reform was a major issue in the Democratic primaries, with a number of prominent candidates supporting a Medicare for All plan. Joe Biden’s platform was centered instead on building upon the ACA. 

Health Care and the 2024 Election

Copy link to Health Care and the 2024 Election

The 2024 election presents the unusual occurrence of two candidates – current vice president Kamala Harris and former president Donald Trump – who have already served in the White House and have detailed records for comparison, as explained in this JAMA column.  With President Joe Biden dropping out of the campaign, Harris inherits the record of the current administration, but has also begun to lay out an agenda of her own.

The Affordable Care Act (Obamacare)

Copy link to The Affordable Care Act (Obamacare)

While Trump failed as president to repeal the ACA, his administration did make significant changes to it, including repealing the individual mandate penalty, reducing federal funding for consumer assistance (navigators) by 84% and outreach by 90%, and expanding short-term insurance plans that can exclude coverage of preexisting conditions. 

In a strange policy twist, the Trump administration ended payments to ACA insurers to compensate them for a requirement to provide reduced cost sharing for low-income patients, with Trump saying it would cause Obamacare to be “dead” and “gone.” But, insurers responded by increasing premiums, which in turn increased federal premium subsidies and federal spending, likely strengthening the ACA. 

In the 2024 campaign, Trump has vowed several times to try again to repeal and replace the ACA, though not necessarily using those words, saying instead he would create a plan with “much better health care.” 

Although the Trump administration never issued a detailed plan to replace the ACA, Trump’s budget proposals as president included plans to convert the ACA into a block grant to states, cap federal funding for Medicaid, and allow states to relax the ACA’s rules protecting people with preexisting conditions. Those plans, if enacted, would have reduced federal funding for health care by about $1 trillion over a decade. 

In contrast, the Biden-Harris administration has reinvigorated the ACA by restoring funding for consumer assistance and outreach and by increasing premium subsidies to make coverage more affordable, resulting in record enrollment in ACA Marketplace plans and historically low uninsured rates. The increased premium subsidies are currently slated to expire at the end of 2025, so the next president will be instrumental in determining whether they get extended. Harris has vowed to extend the subsidies, while Trump has been silent on the issue.

Abortion and Reproductive Health

Copy link to Abortion and Reproductive Health

The health care issue most likely to figure prominently in the general election is abortion rights, with sharp contrasts between the presidential candidates and the potential to affect voter turnout. In all the states where voters have been asked to weigh in directly on abortion so far (California, Kansas, Kentucky, Michigan, Montana, Ohio, and Vermont), abortion rights have been upheld

Trump paved the way for the US Supreme Court to overturn Roe v Wade by appointing judges and justices opposed to abortion rights. Trump recently said, “for 54 years they were trying to get Roe v Wade terminated, and I did it and I’m proud to have done it.” During the current campaign, Trump has said that abortion policy should now be left to the states. 

As president, Trump had also cut off family planning funding to Planned Parenthood and other clinics that provide or refer for abortion services, but this policy was reversed by the Biden-Harris administration. 

Harris supports codifying into federal the abortion access protections in Roe v Wade.

Addressing the High Price of Prescription Drugs and Health Care Services

Copy link to Addressing the High Price of Prescription Drugs and Health Care Services

Trump has often spotlighted the high price of prescription drugs, criticizing both the pharmaceutical industry and pharmacy benefit managers. Although he kept the issue of drug prices on the political agenda as president, in the end, his administration accomplished little to contain them. 

The Trump administration created a demonstration program, capping monthly co-pays for insulin for some Medicare beneficiaries at $35. Late in his presidency, his administration issued a rule to tie Medicare reimbursement of certain physician-administered drugs to the prices paid in other countries, but it was blocked by the courts and never implemented. The Trump administration also issued regulations paving the way for states to import lower-priced drugs from Canada. The Biden-Harris administration has followed through on that idea and recently approved Florida’s plan to buy drugs from Canada, though barriers still remain to making it work in practice. 

With Harris casting the tie-breaking vote in the Senate, President Biden signed the Inflation Reduction Act, far-reaching legislation that requires the federal government to negotiate the prices of certain drugs in Medicare, which was previously banned. The law also guarantees a $35 co-pay cap for insulin for all Medicare beneficiaries, and caps out-of-pocket retail drug costs for the first time in Medicare. Harris supports accelerating drug price negotiation to apply to more drugs, as well as extending the $35 cap on insulin copays and the cap on out-of-pocket drug costs to everyone outside of Medicare.

How Trump would approach drug price negotiations if elected is unclear. Trump supported federal negotiation of drug prices during his 2016 campaign, but he did not pursue the idea as president and opposed a Democratic price negotiation plan. During the current campaign, Trump said he “will tell big pharma that we will only pay the best price they offer to foreign nations,” claiming that he was the “only president in modern times who ever took on big pharma.” 

Beyond drug prices, the Trump administration issued regulations requiring hospitals and health insurers to be transparent about prices, a policy that is still in place and attracts bipartisan support. 

Future Outlook

Copy link to Future Outlook

Ultimately, irrespective of the issues that get debated during the campaign, the outcome of the 2024 election – who controls the White House and Congress – will have significant implications for the future direction of health care, as is almost always the case. 

However, even with changes in party control of the federal government, only incremental movement to the left or the right is the norm. Sweeping changes in health policy, such as the creation of Medicare and Medicaid or passage of the ACA, are rare in the U.S. political system. Similarly, Medicare for All, which would even more fundamentally transform the financing and coverage of health care, faces long odds, particularly in the current political environment. This is the case even though most of the public favors Medicare for All, though attitudes shift significantly after hearing messages about its potential impacts. 

Importantly, it’s politically difficult to take benefits away from people once they have them. That, and the fact that seniors are a strong voting bloc, has been why Social Security and Medicare have been considered political “third rails.” The ACA and Medicaid do not have quite the same sacrosanct status, but they may be close

Resources

Copy link to Resources

Citation

Copy link to Citation

Levitt, L., The Politics of Health Care and the 2024 Election. In Altman, Drew (Editor), Health Policy 101, (KFF, September 2024) https://www.kff.org/health-policy-101-the-politics-of-health-care-and-the-2024-election/ (date accessed).

Congress and the Executive Branch and Health Policy

KFF Authors:

Table of Contents

Introduction

Copy link to Introduction

The federal government is not the only place health policy is made in the U.S., but it is by far the most influential. Of the $4.5 trillion the U.S. spent on health in 2022, the federal government was responsible for roughly a third of all health services. The payment and coverage policies set for the Medicare program, in particular, often serve as a model for the private sector. Many health programs at the state and local levels are also impacted by federal health policy, either through direct spending or rules and requirements. Federal health policy is primarily guided by Congress, but carried out by the executive branch, predominantly by the Department of Health and Human Services.  

The Federal Role in Health Policy 

Copy link to The Federal Role in Health Policy 

No one is “in charge” of the fragmented U.S. health system, but the federal government probably has the most influence, a role that has grown over the last 75 years. Today the federal government pays for care, provides it, regulates it, and sponsors biomedical research and medical training.   

The federal government pays for health coverage for well over 100 million Americans through Medicare, Medicaid, the Children’s Health Insurance Program (CHIP), the Veterans’ Health Administration, the Indian Health Service, and the Affordable Care Act (ACA).  It also pays to help provide insurance coverage for tens of millions who are active-duty and retired military and for civilian federal workers. 

Federal taxpayers also underwrite billions of dollars in health research, mainly through the National Institutes of Health (NIH) and the Agency for Healthcare Research and Quality (AHRQ).   

Federal public health policy is spearheaded by the Centers for Disease Control and Prevention. Its portfolio includes tracking not just infectious disease outbreaks in the U.S. and worldwide, but also conducting and sponsoring public health research and tracking national health statistics.  

The Health Resources and Services Administration (HRSA) funds critical health programs for underserved Americans (including Community Health Centers) and runs workforce education programs to bring more health services to places without enough health care providers.  

Meanwhile, in addition to overseeing the nation’s largest health programs, the Centers for Medicare and Medicaid Services (CMS) also operates the federal insurance Marketplaces created by the ACA and enforces rules made by the law for private insurance policies.  

While the federal government exercises significant authority over medical care and its practice and distribution, state and local governments still have key roles to play.   

States oversee the licensing of health care professionals, distribution of health care resources, and regulation of health insurance plans that are not underwritten by employers themselves. State and local governments share responsibility for most public health activities and often operate safety-net facilities in areas with shortages of medical resources.  

The Three Branches of Government and How They Impact Health Policy 

Copy link to The Three Branches of Government and How They Impact Health Policy 

All three branches of the federal government – Congress, the executive branch, and the judiciary – play important roles in health policy.  

Congress makes laws that create new programs or modify existing ones. It also conducts “oversight” of how the executive branch implements the laws Congress has passed. Congress also sets the budget for “discretionary” and “mandatory” health programs (see below) and provides those dollar amounts.  

The executive branch carries out the laws made by Congress and operates the federal health programs, often filling in details Congress has left out through rules and regulations. Federal workers in the health arena may provide direct patient care, regulate how others provide care, set payment rates and policies, conduct medical or health systems research, regulate products sold by the private sector, and manage the billions of dollars the federal government spends on the health-industrial complex.   

Historically, the judiciary has had the smallest role in health policy but has played a pivotal role in recent cases. It passes judgment on how or whether certain laws or policies can be carried out and settles disputes between the federal government, individuals, states, and private companies over how health care is regulated and delivered.  Recent significant decisions from the Supreme Court have affected the legality and availability of abortion and other reproductive health services and the constitutionality of major portions of the ACA. 

The Executive Branch – The White House 

Although most of the executive branch’s health policies are implemented by the Department of Health and Human Services (and to a smaller extent, the Departments of Labor and Justice), over the past several decades the White House itself has taken on a more prominent role in policy formation. The White House Office of Management and Budget not only coordinates the annual funding requests for the entire executive branch, but it also reviews and approves proposed regulations, Congressional testimony, and policy recommendations from the various departments. The White House also has its own policy support agencies – including the National Security Council, the National Economic Council, the Domestic Policy Council, and the Council of Economic Advisors, that augment what the President receives from other portions of the executive branch. 

How the Department of Health and Human Services is Structured

Copy link to How the Department of Health and Human Services is Structured

Most federal health policy is made through the Department of Health and Human Services. Exceptions include the Veterans Health Administration, run by the Department of Veterans Affairs; TRICARE, the health insurance program for active-duty military members and dependents, run by the Defense Department; and the Federal Employees Health Benefits Program (FEHB), which provides health insurance for civilian federal workers and families and is run by the independent agency the Office of Personnel Management.   

The health-related agencies within HHS are roughly divided into the resource delivery, research, regulatory, and training agencies that comprise the U.S. Public Health Service and the health insurance programs run by the Centers for Medicare and Medicaid Services (CMS).  

Ten of the 13 operating divisions of HHS are part of the U.S. Public Health Service, which also plays a role in U.S. global health programs. They are:  

  • The Administration for Strategic Preparedness and Response (ASPR)
  • The Advanced Research Projects Agency for Health  (ARPA-H)
  • The Agency for Healthcare Research and Quality (AHRQ)  
  • The Agency for Toxic Substances and Disease Registry (ATSDR)  
  • The Centers for Disease Control and Prevention (CDC)  
  • The Food and Drug Administration (FDA)  
  • The Health Resources and Services Administration (HRSA)  
  • The Indian Health Service (IHS)  
  • The National Institutes of Health (NIH)  
  • The Substance Abuse and Mental Health Services Administration (SAMHSA)  

The Centers for Medicare and Medicaid Services (CMS) is by far the largest operating division of HHS. It oversees not just the Medicare and Medicaid programs, but also the federal Children’s Health Insurance Program (CHIP) and the health insurance portions of the Affordable Care Act. Together, the programs under the auspices of CMS account for nearly a quarter of all federal spending in fiscal 2023, cost an estimated $1.5 Trillion in fiscal 2023, and served more than 170 million Americans – more than half the population.  

Who Makes Health Policy in Congress?

Copy link to Who Makes Health Policy in Congress?

How Congress oversees the federal health care-industrial complex is almost as byzantine as the U.S. health system itself. Jurisdiction and responsibility for various health agencies and policies is divided among more than two dozen committees in the House and Senate (see Table 1 and Table 2 below).  

In each chamber, however, three major committees deal with most health issues.   

In the House, the Ways and Means Committee, which sets tax policy, oversees Part A of Medicare (because it is funded by the Social Security payroll tax) and shares jurisdiction over other parts of the Medicare program with the Energy and Commerce Committee. Ways and Means also oversees tax subsidies and credits for the Affordable Care Act and tax policy for most employer-provided insurance.   

The Energy and Commerce Committee has sole jurisdiction over the Medicaid program in the House and shares jurisdiction over Medicare Parts B, C, and D with Ways and Means. Energy and Commerce also oversees the U.S. Public Health Service, whose agencies include the Food and Drug Administration, the National Institutes of Health, and the Centers for Disease Control and Prevention.   

While Ways and Means and Energy and Commerce are in charge of the policymaking for most of the federal government’s health programs, the actual amounts allocated for many of those programs are determined by the House Appropriations Committee through the annual Labor-Health and Human Services-Education and Related Agencies spending bill.   

In the Senate, responsibility for health programs is divided somewhat differently. The Senate Finance Committee, which, like House Ways and Means, is in charge of tax policy, oversees all of Medicare and Medicaid and most of the ACA.   

The Senate counterpart to the House Energy and Commerce Committee is the Senate Health, Education, Labor and Pensions Committee, which has jurisdiction over the Public Health Service (but not Medicare or Medicaid).   

The Senate Appropriations Committee, like the one in the House, sets actual spending for discretionary programs as part of its annual Labor-HHS-Education spending bill.  

Senate Committees with Health Jurisdiction

House Committees with Health Jurisdiction

The Federal Budget Process

Copy link to The Federal Budget Process

Under Article 1 of the U.S. Constitution, Congress is granted the exclusive power to “lay and collect Taxes, Duties, Imposts and Excises, and to pay the Debts and provide for the common Defence and General Welfare of the United States.”   

In 1974, lawmakers passed the Congressional Budget and Impoundment Control Act in an effort to standardize the annual process for deciding tax and spending policy for each federal fiscal year and to prevent the executive branch from making spending policy reserved to Congress. Among other things, it created the House and Senate Budget Committees and set timetables for each step of the budget process.   

Perhaps most significantly, the 1974 Budget Act also created the Congressional Budget Office (CBO). This non-partisan agency has come to play a pivotal role in not just the budget process, but in the lawmaking process in general. The CBO issues economic forecasts, policy options, and other analytical reports, but it most significantly produces estimates of how much individual legislation would cost or save the federal government. Those estimates can and do often determine if legislation passes or fails.  

The annual budget process is supposed to begin the first Monday in February, when the President is to present his proposed budget for the fiscal year that begins the following Oct. 1. This is one of the few deadlines in the Budget Act that is usually met.  

After that, the action moves to Congress. The House and Senate Budget Committees each write their own “Budget Resolution,” a spending blueprint for the year that includes annual totals for mandatory and discretionary spending. Because mandatory spending (roughly two-thirds of the budget) is automatic unless changed by Congress, the budget resolution may also include “reconciliation instructions” to the committees that oversee those programs (also known as “authorizing” committees) to make changes to bring the cost of the mandatory programs in line with the terms of the budget resolution. The discretionary total will eventually be divided by the House and Senate Appropriations Committees between the 12 subcommittees, each responsible for a single annual spending (appropriations) bill. Most of those bills cover multiple agencies – the appropriations bill for the Department of Health and Human Services, for example, also includes funding for the Departments of Labor and Education.   

After the budget resolution is approved by each chamber’s Budget Committee, it goes to the House and Senate floor, respectively, for debate. Assuming the resolutions are approved, a “conference committee” comprised of members from each chamber is tasked with working out the differences between the respective versions. A final compromise budget resolution is supposed to be approved by both chambers by April 15 of each year. (This rarely happens.) Because the final product is a resolution rather than a bill, the budget does not go to the President to sign or veto.   

The annual appropriations process kicks off May 15, when the House may start considering the 12 annual spending bills for the fiscal year that begins Oct. 1. By tradition, spending bills originate in the House, although sometimes, if the House is delayed in acting, the Senate will take up its own version of an appropriation first. The House is supposed to complete action on all 12 spending bills by June 30, in order to provide enough time to let the Senate act, and for a conference committee to negotiate a final version that each chamber can approve by October 1.  

That October 1 deadline is the only one with consequences if it is not met. Unless an appropriations bill for each federal agency is passed by Congress and signed by the President by the start of the fiscal year, that agency must shut down all “non-essential” activities funded by discretionary spending until funding is approved. Because Congress rarely passes all 12 of the appropriations bills by the start of the fiscal year (the last time was in 1996, for fiscal year 1997), it can buy extra time by passing a “continuing resolution” (CR) that keeps money flowing, usually at the previous fiscal year’s level. CRs can last as little as a day and as much as the full fiscal year and may cover all of the federal government (if none of the regular appropriations are done) or just the departments for the unfinished bills. Congress may, and frequently does, pass multiple CRs while it works to complete the appropriations process.  

While each appropriations bill is supposed to be considered individually, to save time (and sometimes to win needed votes), a few, several, or all the bills may be packaged into a single “omnibus” measure. Bills that package only a handful of appropriations bills are cheekily known as “minibuses.”   

Meanwhile, if the budget resolution includes reconciliation instructions, that process proceeds on a separate track. The committees in charge of the programs requiring alterations each vote on and report their proposals to the respective budget committees, which assemble all of the changes into a single bill. At this point, the budget committees’ role is purely ministerial; it may not change any of the provisions approved by the authorizing committees.   

Reconciliation legislation is frequently the vehicle for significant health policy changes, partly because Medicare and Medicaid are mandatory programs. Reconciliation bills are subject to special rules, notably on the Senate floor, which include debate time limitations (no filibusters) and restrictions on amendments. Reconciliation bills also may not contain provisions that do not pertain directly to taxing or spending.  

Unlike the appropriations bills, nothing happens if Congress does not meet the Budget Act’s deadline to finish the reconciliation process, June 15. In fact, in more than a few cases, Congress has not completed work on reconciliation bills until the calendar year AFTER they were begun.    

A (Very Brief) Explanation of the Regulatory Process

Copy link to A (Very Brief) Explanation of the Regulatory Process

Congress writes the nation’s laws, but it cannot account for every detail in legislation. So, it often leaves key decisions about how to interpret and enforce those laws to the various executive departments. Those departments write (and often rewrite) rules and regulations according to a very stringent process laid out by the 1946 Administrative Procedure Act (APA). The APA is intended to keep the executive branch’s decision-making transparent and to allow public input into how laws are interpreted and enforced. 

Most federal regulations use the APA’s “informal rulemaking” process, also known as “notice and comment rulemaking,” which consists of four main parts:  

  • Publication of a “Notice of Proposed Rulemaking (NPRM)” in the Federal Register, a daily publication of executive branch activities.  
  • Solicitation to the public to submit written comments for a specific period of time (usually from 30 to 90 days).  
  • Agency consideration of public reaction to the proposed rule; and, finally  
  • Publication of a final rule, with an explanation including how the agency took the public comments into account and what changes, if any, were made from the proposed rule. Final rules also include an effective date, which can be no less than 30 days but may be more than a year in the future.  

In situations where time is of the essence, federal agencies may truncate that process by issuing “interim final rules,” which can take effect even before the public is given a chance to comment. Such rules may or may not be revised later.   

Not all federal interpretation of laws uses the APA’s specified regulatory process. Federal officials also distribute guidance, agency opinions, or “statements of policy.”  

Future Outlook

Copy link to Future Outlook

Given how fragmented health policy is in both Congress and the executive branch, it should not be a surprise that major changes are difficult and rare.  

Add to that an electorate divided over whether the federal government should be more involved or less involved in the health sector, and huge lobbying clout from various interest groups whose members make a lot of money from the current operation of the system, and you have a prescription for inertia. 

One potential wildcard—in June of 2024, the Supreme Court overturned a 40-year-old precedent, known as “Chevron deference,” that gave the benefit of the doubt in interpreting ambiguous laws passed by Congress to federal agencies rather than judges. Overturning Chevron will likely make it easier for outsiders to challenge federal agency actions, but it will be some time before the full ramifications become clear.  

Another problem is that when a new health policy can dodge the minefield of obstacles to become law, it almost by definition represents a compromise that may help it win enough votes for passage, but is more likely to complicate an already byzantine system further. 

Unless the health system completely breaks down, it seems unlikely that federal policymakers will be able to move the needle very far in either a conservative or a liberal direction. 

Resources

Copy link to Resources

Citation

Copy link to Citation

Rovner, J., Congress, the Executive Branch, and Health Policy. In Altman, Drew (Editor), Health Policy 101, (KFF, January 2025) https://www.kff.org/health-policy-101-congress-and-the-executive-branch-and-health-policy/ (date accessed).

News Release

Black and Hispanic Adults with Fair or Poor Mental Health Are Less Likely Than White Adults to Say They Received Mental Health Services, Reflecting Cost Concerns and Other Barriers to Care

Published: May 23, 2024

A new KFF analysis of our 2023 Survey of Racism, Discrimination, and Health finds that Black (39%) and Hispanic (36%) adults who report fair or poor mental health are less likely than White (50%) adults to say they received mental health services in the past three years.

Such disparities reflect several barriers to mental health care identified by these adults. In addition to cost concerns and being too busy or not being able to get time off to seek care, Hispanic and Black adults also disproportionately report other challenges such as being afraid or embarrassed to seek care, not knowing how to find a provider, or thinking they would be unable to find a provider with a shared background.

The findings come against a backdrop of what other KFF polling and analysis indicates is a national mental health crisis in the wake of the COVID-19 pandemic. People of color have been disproportionately affected by the rises in drug overdose and suicide deaths across the U.S. in recent years. They also are more likely to report experiences of racism and discrimination, which are associated with worse mental health and well-being.

Other key takeaways from the survey include:

  • Among adults who received or tried to receive mental health care, Asian (55%), and Black (46%) adults are more likely to report difficulty finding a provider who could understand their background and experiences compared to their White counterparts (38%). Among those who thought they needed mental health care but did not try to find a provider, Hispanic adults are more likely than White adults to say the primary reason was they didn’t know how to find a provider (24% vs. 11%) or that they were afraid or embarrassed to seek care (30% vs. 18%).
  • Awareness of the 988 mental health hotline remains low, particularly among Black, Hispanic, and Asian adults. As of Summer 2023, nearly one in five (18%) adults say they have heard a lot or some about 988, with Black (16%), Hispanic (11%), and Asian (13%) adults less likely to say they have heard about 988 than White adults (21%).
  • Adults who report unfair treatment or negative experiences with a provider are twice as likely as those without these experiences to say they went without needed mental health care. Four in ten (41%) adults who report they were treated unfairly or with disrespect by a health care provider and about one-third (35%) of adults who say they’ve had at least one negative experience with a health care provider say they did not get mental health services they thought they needed compared to smaller shares of those who do not report these experiences (18% and 15%, respectively).

For more data and analyses based on KFF’s Racism, Discrimination and Health Survey, visit kff.org.

Racial and Ethnic Disparities in Mental Health Care: Findings from the KFF Survey of Racism, Discrimination and Health

Published: May 23, 2024

Key Takeaways

In the wake of the COVID-19 pandemic, 90% of U.S. adults say the country is facing a mental health crisis and many reported major impacts of severe mental health problems on their families, according to a KFF/CNN survey. Additionally, drug overdose deaths sharply increased amid the pandemic and suicide deaths rose. People of color have been disproportionately affected by the rises in drug overdose and suicide deaths. People of color also are more likely to report experiences of racism and discrimination, which are associated with worse mental health and well-being. Reports of any mental illness in the past year remain lower among Hispanic, Black, and Asian adults compared to White adults. However, mental illness among people of color may be underdiagnosed due to the lack of culturally sensitive screening tools, coupled with structural barriers to care, with previous research pointing to racial disparities in receipt of mental health services.

This brief examines disparities in mental health care by race and ethnicity and other factors based on data from the 2023 KFF Racism, Discrimination and Health Survey, a large, nationally representative survey based on responses from over 6,000 adults. The survey provides unique data on access to the health care system and how factors such as racism and discrimination impact these experiences and overall health and well-being. Key findings include:

Among adults who report fair or poor mental health, White adults (50%) are more likely to say they received mental health services in the past three years compared with Black (39%) and Hispanic adults (36%). Across racial and ethnic groups, about half of all adults (53%) who report that they received mental health services said they were very or extremely helpful.

Adults identify cost concerns and scheduling difficulties as primary barriers to mental health care, and Hispanic, Black, and Asian adults disproportionately report additional challenges, such as finding a provider who can understand their background and experiences, lack of information, or stigma or embarrassment. Among adults who received or tried to receive mental health care, Asian (55%), and Black (46%) adults are more likely to report difficulty finding a provider who could understand their background and experiences compared to their White counterparts (38%). Among those who thought they needed mental health care but did not try to find a provider, Hispanic adults are more likely than White adults to say the main reason was they didn’t know how to find a provider (24% vs. 11%) and/or that they were afraid or embarrassed to seek care (30% vs. 18%).

Adults who report unfair treatment or negative experiences with a provider are twice as likely as those without these experiences to say they went without needed mental health care. Four in ten (41%) adults who report they were treated unfairly or with disrespect by a health care provider and about one-third (35%) of adults who say they’ve had at least one negative experience with a health care provider say they did not get mental health services they thought they needed compared to smaller shares of those who do not report these experiences (18% and 15%, respectively).

Reported awareness of the 9-8-8 mental health hotline remains low overall, particularly among Black, Hispanic, and Asian adults. As of Summer 2023, about one in five (18%) adults say they have heard a lot or some about 9-8-8, with Black (16%), Hispanic (11%), and Asian (13%) adults less likely to say they have heard about 9-8-8 than White adults (21%). At the same time, about one in five (21%) adults say they or a family member has ever experienced a severe mental health crisis that resulted in serious consequences such as homelessness, hospitalization, incarceration, self-harm, or suicide, with this share rising to 39% among young (ages 18-29) White adults.

Findings from the 2023 KFF Racism, Discrimination and Health Survey highlight barriers to mental health care, including costs and difficulties finding providers, with people of color citing additional challenges such as difficulty finding providers with shared background and experiences, lack of information, and stigma and embarrassment. These findings also point to areas of focus that may help address barriers to mental health care, such as diversifying the mental health care workforce and enhancing knowledge of culturally competent care among mental health care providers. Additionally, focused outreach and education efforts among specific communities may address awareness of mental health resources and stigma associated with mental health care. Findings from the 2023 KFF survey offer insight into the interactions of people of color with the mental health care system at a time when they are experiencing disproportionate increases in deaths by drug overdose and suicide and ongoing impacts of racism and discrimination.

Use of Mental Health Services

Receipt of mental health services varied across demographics and by insurance status leading up to the pandemic. As reported in KFF analyses, prior to the pandemic Black adults with moderate to severe symptoms of anxiety and/or depression were less likely than their White peers to receive mental health services. Similarly, among adults with moderate to severe symptoms of anxiety and/or depression, young adults, men, uninsured individuals, and individuals without a usual source of care were less likely than their respective counterparts to receive mental health services.

The 2023 KFF survey data show that about one quarter (23%) of adults say they have received mental health services from a doctor, counselor, or other mental health professional in the past three years. This share rises to 45% among those who report fair or poor mental health status, compared with about one in five (19%) of those who say they have good to excellent health.

Among adults who report fair or poor mental health, White adults (50%) are more likely to say they received mental health services in the past three years compared with Black (39%) and Hispanic adults (36%) (Figure 1). Additionally, among those who report fair or poor mental health status, U.S.-born adults (48%) are more likely than their immigrant counterparts (26%) to report receiving mental health services, and insured adults with fair or poor mental health status are more likely than those who are uninsured to say they received mental health services (48% vs. 27%).

Among Adults Reporting Fair or Poor Mental Health Status, White Adults Are More Likely Than Hispanic and Black Adults To Say They Received Mental Health Care in the Past Three Years

About half of adults (53%) who report that they received mental health services said they were very or extremely helpful (Figure 2). The remaining 47% said they were somewhat, not too, or not at all helpful. Adults with self-reported fair or poor mental health status were less likely than those with better reported mental health status to say that the services they received were very or extremely helpful (41% vs. 59%), although this could reflect improved self-reported mental health status among those who found the services helpful.

Half of Adults Who Received Mental Health Services Say They Were Very or Extremely Helpful

Barriers to Accessing Mental Health Services

Prior research shows that many adults report unmet mental health needs and face barriers to accessing mental health services. Common barriers to accessing mental health care include costs, not knowing where to obtain care, limited provider options, and limited acceptance of insurance among providers. People of color face increased access barriers due to a range of factors, such as the lack of a diverse mental health care workforce, the absence of culturally informed treatment options, and stereotypes and discrimination associated with poor mental health.

Across racial and ethnic groups, about one in five adults say there was a time in the past three years when they thought they might need mental health services or medication but did not receive them. This share rises to about half (48%) among those with self-reported fair or poor mental health status, with about four in ten or more White (53%), Black (47%), and Hispanic (39%) adults who report fair or poor mental health saying they went without mental health services or medication that they thought they needed in the past three years (Figure 3).

At Least Four in Ten White, Hispanic, and Black Adults Who Report Fair or Poor Mental Health Say They Went Without Needed Mental Health Services

Adults who report unfair treatment by or negative experiences with a health care provider are more likely to say they went without needed mental health care. As previously reported, Black, Hispanic, AIAN, and Asian adults report higher levels of unfair treatment when seeking health care than their White counterparts. Adults who say they were treated unfairly or with disrespect by a health care provider are more likely to report not getting mental health services they thought they needed compared to those who do not report unfair treatment (41% vs. 18%) (Figure 4), and this difference persists among those with self-reported fair or poor mental health status (67% vs. 40%). Similarly, adults who say they’ve had at least one negative experience with a health care provider, such as a provider assuming something about them without asking, suggesting they were personally to blame for a health problem, ignoring a direct request or question, or refusing to prescribe pain medication they thought they needed are more likely to report not getting mental health services they thought they needed compared to adults who did not report a negative experience (35%. vs 15%). This difference also persists among those with self-reported fair or poor mental health status (56% vs. 37%).

Adults Who Report Unfair Treatment or Negative Experiences With a Health Care Provider Are More Likely To Report Not Getting Needed Mental Health Care

Among adults who say they needed but went without mental health services, about half (48%) say they tried to find a mental health care provider, while the remaining half (52%) say they did not. Additionally, seven in ten parents with children who they thought might need mental health services or medication but went without them in the past three years (or 14% of all parents) say they tried to find a provider for their child.

Adults who received or tried to find a mental health care provider for themselves or their children identified scheduling delays, difficulty finding a provider who could understand their background and experiences, and concerns about affordability or coverage as challenges. Overall, 32% of adults received mental health services or tried to find a mental health care provider for themselves or their children in the past three years. Among these adults, about four in ten say that it was very or somewhat difficult to find a mental health care provider who could treat them in a timely manner (44%), understand and relate to their background and experiences (41%), or who they could afford (41%), and 36% say it was very or somewhat difficult to find one who would take their insurance. Compared to their White counterparts (38%), Asian (55%), and Black (46%) adults are more likely to report difficulty finding a provider who could understand their background and experiences (Figure 5).

Black and Asian Adults Are More Likely Than White Adults To Report Difficulty Finding a Mental Health Provider Who Understands Their Experiences

Concerns about costs and scheduling difficulties are primary reasons cited for not trying to find a mental health care provider among those who say they needed mental health care. A total of 12% of adults thought they or their children needed mental health services in the past three years but report they did not try to find a provider. Among these adults, the main reasons they say they did not try to find a provider were because they thought it would be too expensive (37%), they were too busy or could not take the time off (31%), or they didn’t think it would help (29%). Somewhat smaller shares say they were afraid or embarrassed to seek care (21%), did not know how to find a provider (15%), or did not think they could find a provider with a shared background or experiences (14%) (Figure 6). Hispanic adults who thought they or their children needed mental health services but did not try to find a provider are more likely than their White peers to say the main reason was because they didn’t know how to find a provider (24% vs. 11%) or that they were afraid or embarrassed to seek care (30% vs. 18%). Black adults who thought they or their children needed mental health services but did not try to find a provider are more likely than their White peers to say the main reason was because they didn’t think they would find one who shared their background and experiences (21% vs. 10%).

Cost and Scheduling Concerns Are Among the Top Reasons Adults Cite for Why They Didn’t Try To Find a Mental Health Provider

Mental Health Crises and Awareness of 9-8-8 Mental Health Hotline

Since the launch of the federally mandated crisis number, 9-8-8, awareness remains low overall, particularly among Black, Hispanic, and Asian adults. In July 2022, 9-8-8 became available to all landline and cell phone users, providing a single three-digit number to access a network of over 200 local and state funded crisis centers where those in need may receive crisis counseling, resources and referrals. While national answer rates increased alongside increases in call volume after the implementation of 9-8-8, awareness of the hotline remains low overall. As of Summer 2023, about one in five (18%) adults say they have heard a lot or some about 9-8-8, with Black (16%), Hispanic (11%), and Asian (13%) adults less likely to say they have heard about 9-8-8 than White adults (21%) (Figure 7). Immigrant adults and adults with limited English proficiency also are less likely to say they have heard about 9-8-8 compared to those who are U.S.-born and English proficient.

About One in Six Adults Say They Have Heard a Lot or Some About the 9-8-8 Mental Health Hotline

Low awareness of the 9-8-8 hotline comes at a time when about one in five adults (21%) say they or a family member ever experienced a severe mental health crisis that resulted in serious consequences such as homelessness, hospitalization, incarceration, self-harm, or suicide (Figure 8). White adults (24%) are more likely to report having had or having a family member who has had a severe mental health crisis compared to Asian (9%), Hispanic (16%), and Black adults (18%), a difference that is largely driven by higher rates among White adults who are younger and have lower incomes. Younger adults (ages 18-29) are more likely to say they or a family member who experienced a severe mental crisis resulted in one of these consequences across racial and ethnic groups, with this share rising to about four in ten young White adults (39%). Similarly, among lower income adults ($40,000 annually or less), about a third (34%) of White adults report this experience compared with lower shares of Hispanic (18%), Black (19%), and Asian (11%) adults.

Younger and Lower Income Adults Are More Likely To Report They or a Family Member Ever Experienced a Severe Mental Health Crisis, Including Larger Shares Among White Adults

A Look at the Latest Alcohol Death Data and Change Over the Last Decade

Published: May 23, 2024

Alcohol use disorder (AUD) is often an underrecognized substance use disorder (SUD) despite its substantial consequences. Over half of US adults (54%) say that someone in their family has struggled with an alcohol use disorder, making it the most prevalent non-tobacco substance use disorder. Yet, only one-third of adults view alcohol addiction as a crisis, compared to over half who see opioids as such. Federal data show that 1 in 10 people had an alcohol use disorder in the past year, over 4 in 10 alcohol users report binge drinking in the past month, and per capita alcohol consumption is higher than the decade prior. Treatment rates for alcohol use disorders are notably low, especially for the use of medication, a recommended AUD treatment component. Although the opioid crisis has been declared a public health emergency by the U.S. Department of Health and Human Services since 2017, no similar declaration exists regarding alcohol deaths. However, HHS has set a priority goal of reducing emergency department visits for acute alcohol use, mental health conditions, suicide attempts, and drug overdoses by 10% by 2025.

This analysis focuses on the narrowest definition of alcohol deaths known as “alcohol-induced deaths” (referred to as “alcohol deaths” throughout the brief). These alcohol deaths are caused by conditions directly attributable to alcohol consumption, such as alcohol-associated liver diseases. Broader definitions of alcohol deaths extend this definition to also encompass cases where an alcohol-induced condition was a contributing factor, but not the underlying cause of death. Key takeaways from this analysis of CDC WONDER data from 2012 to 2022 include the following:

  • Alcohol deaths increased steadily over the past decade with sharp rises during the pandemic years. Overall, the national alcohol death rate has risen 70% in the past decade, accounting for 51,191 deaths in 2022, up from 27,762 deaths in 2012.
  • Alcohol deaths in 2022 were highest among people aged 45 to 64, American Indian and Alaska Native (AIAN) people, and males. Alcohol death rates for AIAN people are the highest–5 times higher than death rates for White people, the racial group with the next highest prevalence. Deaths are rising fastest among adults aged 26 to 44, AIAN people, and females–with these groups experiencing nearly or more than a 100% rise in alcohol mortality rates in the last decade.
  • Rates of alcohol deaths varied considerably across states in 2022. While all states and D.C. experienced increases in deaths rates over the past decade and during the pandemic, the rate of change varied by state and year, with some states’ death rates rising most sharply during the pandemic and other state experiencing rises more evenly before and during the pandemic. Rural areas have a higher rate of alcohol deaths and experienced greater growth in death rates both over the past decade.
  • The number of alcohol-related deaths rises to 105,308 under a broader definition that counts deaths where alcohol-induced conditions are either the underlying cause or a contributing factor. This exceeds the numbers for opioid and suicide deaths, which also use this broader definition, totaling 83,437 and 49,594, respectively. 

What are the trends in alcohol deaths?

Alcohol deaths have steadily climbed over the past decade, a trend that accelerated during the pandemic (Figure 1). When adjusted for population growth and age, the alcohol death rate has risen by 70% from 2012 to 2022, moving from 7.97 to 13.53 deaths per 100,000 people. Although deaths fell somewhat in 2022, they remain far higher than a decade ago. From 2012 to 2019, the year over year rise in deaths rates averaged about 4% per year, and then jumped during early pandemic years, with the biggest rise from 2019 to 2020. Other data mirror this trend – emergency department (ED) visits for SUD are on the rise and account for twice the number of ED visits compared to opioids. Alcohol related ED visits account for nearly half of all SUD related visits (45%), far higher than the next highest group, opioids, accounting for 13% of ED visits.

Alcohol-induced deaths rose steadily before the pandemic and sharply during the initial pandemic years

How do alcohol death rates vary and how have they changed across demographics groups?

Alcohol deaths in 2022 were highest among people aged 45 to 64, males, people living in rural areas, and AIAN people. Alcohol death rates for AIAN people are by far the highest–5 times higher than death rates for White people, the racial group with the next highest prevalence. Across age groups, people aged 45 to 64 have the highest alcohol death rate, followed by 65+. Death rates in males are more than double that of females and people who reside in rural areas have death rates higher than those who live in urban areas (Figure 2).

Alcohol-induced death rates are the highest among American Indian or Alaska Native people, those aged 45 to 64, males, and people living in rural areas

Over the past decade (2012-2022), alcohol death rates grew fastest among people 26 to 44, AIAN people, and females (Figure 3). Overall alcohol consumption has risen somewhat in recent years, but increases may have been concentrated among certain populations as well as other risk factors.

  • People aged 26 to 44. Individuals aged 26 to 44 experienced the fastest increase in alcohol death rates, with a rise of 144% over the past decade and over 50% during the pandemic. While this younger age group showed the steepest rate of increase, the largest overall growth in the number of deaths occurred among those aged 45 to 64. This somewhat older group already had the highest death rates and experienced the largest increase in death rates (12 additional deaths/100,000) in the past decade, more than any other group.
  • AIAN people. Alcohol deaths for AIAN people have nearly doubled in the last 10 years. During the pandemic years, alcohol death rates increased by almost 25 deaths per 100,000 AIAN people. Increases in alcohol deaths among AIAN people follows worsening trends in other areas related to behavioral health, where AIAN have both the highest rate and fastest growing suicide and overall drug overdose death rates.
  • Females. Although males die of alcohol causes more often than females, the relative growth was faster for females over the past 10 years, increasing by 86% for females compared to 61% for males. Heavier drinking may impact women more quickly than men, which may result in the faster development of serious health consequences that contribute to death.
Alcohol-induced deaths increased fastest for people aged 26 to 44, American Indian and Alaska Native (AIAN) people, and females

How do alcohol death rates vary and how have they changed across geography?

In 2022 there was wide variation in alcohol death rates. In 2022, New Mexico’s death rate was the highest at 42.7 per 100,000 people, which was more than six times higher than Hawaii, the state with the lowest rate at 7.1 per 100,000 people (Figure 4).

While all states experienced an increase in alcohol deaths, those rates varied widely.  Nationally, alcohol death rates increased by 70% over the past decade, including a 30% rise during the pandemic years alone (2019-2022). However, the extent of these increases varied substantially across states. For instance, the District of Columbia saw a relatively low increase of 24% over the decade, whereas Connecticut experienced a much larger rise of 167%. During the pandemic, increases ranged from 9% in Wyoming and New Jersey to 86% in Mississippi. Some states, like Vermont, had most of their rises in alcohol death rates before the pandemic, with only 12% of the growth occurring during pandemic years. In contrast, Mississippi’s rates more than doubled over the past decade, and over half of that increase happened during pandemic years. Many factors may contribute to the differences in alcohol mortality rates across states, some of which may include differences in alcohol consumption and cultural attitudes, state-specific alcohol policies, and treatment rates (Figure 4).

Alcohol-induced death rates varied widely by state in 2022; states show different levels of increase over the past decade and during the pandemic

Rural areas experienced faster growth in alcohol deaths than urban areas, driven by sharp rises during the pandemic. Deaths grew across both rural and urban areas in the past decade; however growth was fastest in rural areas–nearly doubling in the past decade and increasing by 35% during pandemic years. Existing shortages of mental health and substance use treatment professionals may make it particularly difficult to access care in rural areas, where the supply of behavioral health workforce is even more scarce. During the pandemic, telehealth services for behavioral health and other care may have been more accessible to those living in urban areas, where an internet connection is more likely to be available or reliable (Figure 5).

Alcohol-induced deaths grew fastest in rural areas

What factors may contribute to the increases in alcohol deaths in the past 10 years?

Alcohol contributes to more deaths than opioids and suicides when the alcohol conditions that contribute to death are included. Defining alcohol deaths can be complex due to the gradual onset of many conditions caused by or linked to alcohol and its ability to exacerbate or increase the risk of developing other health conditions. This analysis adopts the strictest definition of alcohol deaths, focusing on deaths that were directly caused by conditions directly due to alcohol, such as alcohol-related liver diseases. However, if deaths where alcohol conditions are a contributing factor listed on the death certificate —termed ‘alcohol-related deaths’—are included, the number of deaths increases to 105,308 in 2022, though some cases may overlap. This exceeds the numbers for opioid and suicide deaths, which also use this broader definition, totaling 83,437 and 49,594, respectively. Unlike the immediate effects of opioid overdoses or suicides, alcohol-related conditions often develop slowly over many years. These conditions can directly cause death or worsen other illness. For instance, it may take many years of heavy drinking before alcohol-associated liver diseases, the most common cause of alcohol deaths, to develop. This slower disease progression as well as the role of alcohol in exacerbating other conditions may contribute to the higher number of deaths counted under the expanded definition. The number of alcohol deaths rise even more when the criteria are broadened to include alcohol’s role in increasing the risk of death by other conditions or events, such as cancer or car accidents involving alcohol (Figure 6).

Alcohol deaths surpass those from opioids and suicide when contributing causes are considered

Rises in alcohol deaths may be attributed to a variety of factors including, in part, increases in drinking and low treatment rates. Alcohol consumption and some indicators of binge drinking have been on the rise in recent years, particularly among some demographic groups. Excessive alcohol consumption is tied to the development of alcohol-related diseases, which can be fatal. A variety of factors may have contributed to increases in drinking including a growing social acceptability of alcohol and loosening of alcohol policies at a state level. Other factors, such as increased stressors due to the pandemic and other issues may have increased drinking behaviors.

Treatment rates for alcohol use disorder are very low. Federal survey data show that in 2022, only 7.6% of people (12+) with a past year alcohol use disorder received any treatment. Although medications for alcohol use disorder have been shown to reduce or stop drinking, uptake of these medications is extremely low; with only 2.1% of people who meet criteria for an alcohol use disorder (diagnosed or not) receive medication treatment. Treatment rates are slightly higher among those who do receive a diagnosis–for instance, 10% of Medicaid enrollees diagnosed with an alcohol use disorder received medication, 34% received counseling services, and 74% received some type of interaction with a treatment, such as therapy, medication, assessment, or supportive service.

Barriers to alcohol use disorder treatment include a combination of provider, patient, financial, and infrastructure factors. Providers often lack confidence or knowledge in treating alcohol use disorder and are uncomfortable with medication and other treatment options, which may decrease the likelihood that they will manage treatment or make referrals. To address this, recent initiatives are enhancing education for both practicing and training providers through mandatory training programs and curriculum enhancements in medical schools. Further, recent changes to SUD confidentiality regulations are expected to simplify the diagnosis and coordination of care for individuals with substance use disorders (SUD). Insufficient treatment infrastructure or a shortage of a skilled workforce to staff facilities and deliver care can also play a role in treatment rates.

From the patient perspective, limited understanding of what constitutes problematic drinking and attitudes towards seeking treatment can hinder recognition of the need for help. For example, among those who meet the criteria for SUD—which may include symptoms like increased tolerance, repeated attempts to quit or control use, or social problems related to use–95% of adults did not seek treatment and didn’t think they needed it. Initiatives aimed at early screening in non-traditional settings, such as schools may help early detection and lead to more timely linkages of individuals to treatment resources. When people think they might need treatment, practical issues such as insurer coverage of services, locating a provider that will accept the patient’s insurance, availability of time off from work, childcare, and the affordability of treatment/out of pocket costs can also influence decisions about seeking or staying in treatment.

This work was supported in part by Well Being Trust. KFF maintains full editorial control over all of its policy analysis, polling, and journalism activities.

Utilization of the 988 Suicide & Crisis Lifeline’s LGBTQ Service

Published: May 23, 2024

988, the federally-mandated suicide and crisis line, supported by the Substance Abuse and Mental Health Services Administration (SAMHSA), includes specific services to meet the needs of LGBTQ youth and young adults. Given that LGBTQ people face substantial experiences of stigma and discrimination, more pervasive mental health challenges, and greater unmet need for mental health services, a dedicated 988 service provides a targeted intervention for this community.

LGBT adults are more likely than non-LGBT adults to describe their mental health and emotional well-being as either “fair” or “poor” (39% v. 16%) and more likely to report being always or often anxious, depressed, or lonely over the past 12 months. Especially concerning is that, in 2021, 45% of LGBTQ high school students reported having seriously considered suicide during the past year. However, despite greater need, LGBT people are more likely to report going without a needed mental health services than non-LGBT people. Further, about two-thirds (65%) of LGBT adults say they have experienced at least one form of discrimination in their daily life at least a few times in the past year compared 40% of non-LGBT adults and experiences of stigma and discrimination contribute to mental health challenges. In addition, it has been well documented that anti-LGBTQ policy environments can negatively impact the community’s well-being and debates over LGBTQ rights are currently playing out in the courts as well as on the political stage.

This analysis examines performance metrics to assess utilization of 988’s LGBTQ service (which SAMHSA refers to as the LGBTQI+ subnetwork), compared to 988’s general service usage, from December 2023 to March 2024 (the most current and comprehensive data available). The LGBTQ pilot first launched in September 2022, but LGBTQ specific metrics did not become available to the public until December 2023.

Key takeaways include:

  • During the four-month period, 10% of all 988 contacts, including 19% of all texts, were made via 988’s LGBTQ service. Users can contact 988 via call, chat, or text.
  • A plurality of contacts to 988 came via calls for both the LGBTQ service and the general 988 service, but those using the LGBTQ service were about twice as likely to use text.
  • Those using the LGBTQ service were more likely to encounter certain challenges with the service compared to those using the general 988 service. These include double the call abandonment rate (21% v. 11%) and substantially longer call wait times (with monthly averages about double that of the general line).

What is the LGBTQ 988 service and how does it work?

A pilot for a 988 service to address the specific needs of LGBTQ young people was launched shortly after the main 988 line and later expanded to a full-time service. Recognizing the growing need for mental health crisis services in the U.S., the federal government made the mandated Suicide & Crisis Lifeline 988, supported by the Substance Abuse and Mental Health Services Administration (SAMHSA), available to all landline and cell phone users in July 2022, providing for the first time, a single three-digit number to access a network of over 200 local and state-funded crisis centers. In addition, in September 2022, 988 launched a pilot to specially address the needs of LGBTQ young people (those under 25) by offering text, phone and chat services “with a counselor trained explicitly to support LGBTQ+ youth and young adults,” but the service had limited hours. In March 2023, that pilot was expanded to run 24/7 across all modalities. (KFF provided additional history of the 988 line in an earlier brief.)

Operation of the LGBTQ line differs from the main 988 line in that services are provided through specific centers with specialty LGBTQ training rather than local crisis centers located across the country. Originally, the pilot started with one contractor (Trevor Project), but has since evolved to include seven centers (prior to the expansion, there were media reports of capacity issues and other challenges). When contacts cannot be answered by LGBTQ specific operators, they are diverted to the main 988 lines, though data on how often this occurs are not available.

What do we know about awareness and utilization of the LGBTQ 988 service?

As a relatively new service, lack of awareness of the availability of the 988 hotline may be a barrier. Recent survey data from KFF indicate that most (8 in 10) LGBT adults have heard little to nothing about the resource, similar to the share among non-LGBT adults. This low awareness is similar among young LGBTQ adults (18-29), with about 8 in 10 (78%) reporting limited or no knowledge of the 988 hotline, despite there being a service focused on supporting LGBTQ individuals under 25.

Awareness of the 988 Hotline is Low with About 8 in 10 LGBT and Non-LGBT Adults Reporting They Have Heard Little or Nothing About the Resource

Additionally, LGBT adults report more difficulty with the standard police response to a mental health crisis call. LGBT adults are more likely than non-LGBT adults (54% v 26%) to think that that calling 911 in a mental health crisis would do more to hurt the situation than help. Given this backdrop, access to culturally competent mental health services for LGBTQ people may be particularly impactful and targeted efforts may help to increase awareness and use.

Over a recent four-month period, 10% of all 988 contacts, including 19% of texts, were made via 988’s LGBTQ service (Figure 2). This is higher than the distribution of LGBT people in the population as a whole (7%). Since younger people are more likely to identify as LGBTQ, including 20% of Generation-Z, it could help to explain the relatively high rates of LGBTQ service use, especially given the service’s focus on younger people. Greater prevalence of mental health conditions and experiences of stigma and discrimination among LGBTQ people, may also, help explain high use of the 988’s specialty service.

Traffic to the LGBTQ service averaged 46,998 contacts per month over the period and increased from 45,703 contacts in December 2023 to 51,535 contacts in March 2024 (13%). Traffic increased for the service overall as well, albeit at a slightly slower pace (an 8% increase). Across the four-month period,187,991 individual contacts were made to 988’s LGBTQ service via calls, chat, and text. 1.8 million general service contacts were made to 988.

Contacts Through the 988 LGBTQ Service as a Share of All 988 Contacts, By Modality

A plurality of contacts to 988 came via calls, for both the LGBTQ and the 988 service overall, but those using the LGBTQ service were about twice as likely to use text and less likely to use calls (Figure 3). Nearly one-third (31%) of LGBTQ service users contacted 988 via text, compared to fewer than one-in-five service users overall (17%). While it was the most common contact modality for both groups, LGBTQ users were less likely to connect to 988 via call (58% v 70%) than general service users. The use of chat was similar for both groups (11% v 12%). In addition to promoting the service overall to improve awareness, given LGBTQ youth and young adult’s wider preference for text, promoting this modality, along with the call line, may be especially useful in servicing the needs of this population.

Users of the LGBTQ Service Were About Twice as Likely to Choose Text as Contact Modality Than Those Not Using This Service

Callers to the LGBTQ phone line, however, faced higher call abandonment rates than callers to non-LGBTQ lines (Figure 4). The average abandonment rates for LGBTQ line callers were nearly double the rate of general line callers (21% v. 11%) (Figure 4). SAMHSA uses the term “abandoned” to describe when the person seeking 988 services hears/sees the initial 988 greeting, but is disconnected before engaging with a counselor. Per SAMHSA, this may occur due a technical reason (e.g. internet or mobile connection strength or service interruptions, etc.) or because the person seeking assistance ends the contact before a counselor answer which could also happen for a range of reasons, such as they had to wait too long or decided they were not comfortable discussing their experience. Since LGBTQ people in a mental health crisis may also fear discussing their sexual orientation or gender identity, they may be quicker to change their minds about seeking help and a prompt pick-up may improve call completion. Regardless of the reason for call abandonment, there may be opportunities to improve call experiences for users of the LGTBQ line which are nearly double the wait time of general 988 line. LGBTQ service users had lower abandonment rates for chat and the same abandonment rates for text compared to general line users.

988 LGBTQ Line Callers Faced Higher Abandonment Rates than General Line Callers

In addition, wait time for the LGBTQ phone line was substantially longer than for 988 calls overall—with monthly averages about double that for the general line (Table 1)—which may contribute to the higher abandonment rates. The average monthly wait time for calls to the LGBTQ line were close to a minute whereas they were about 30 seconds for the general 988 service. In contrast, for other contact methods, average text and chat, wait times were shorter for LGBTQ users compared to general 988 users. While, higher than general line users, the wait times for LGBTQ callers face today may actually represent an improvement from the initial launch period of the service when media reports suggested significant challenges with wait times.

Those Who Called Using the LGBTQ Phone Line Faced Longer Wait Times Compared to Overall 988 Contact Metrics but Shorter Waits for Text and Chat

The Right to Contraception: State and Federal Actions, Misinformation, and the Courts

Authors: Mabel Felix, Laurie Sobel, and Alina Salganicoff
Published: May 23, 2024

Introduction

The Supreme Court’s Dobbs ruling has heightened interest in affirming the right to contraception. While the Court’s majority opinion stated that the Dobbs decision does not “cast doubt on precedents that do not concern abortion,” Justice Thomas argued in his concurring opinion that in future cases, the Court should reconsider precedent that relied on the same principles as Roe – including Griswold v. Connecticut, the Court’s 1965 landmark decision that recognized the right of married people to obtain contraceptives – and overturn those decisions. The prospect of the Court overturning Griswold moved some in Congress to introduce federal legislation that would protect the right to contraception, though that legislation is unlikely to advance in the current divided Congress. Similarly, some state legislators have recently introduced measures to protect the right to obtain contraceptives.

However, even with the current constitutional protections of Griswold in place, uncertainty has emerged around people’s ability to access certain contraceptive methods, such as IUDs and emergency contraceptive pills (often confused with medication abortion), which are erroneously believed by many to be abortifacients. If, as the Supreme Court’s majority indicated, the basis for their reasoning hinges on whether “potential life” is involved in a law, the conflation of contraception with abortifacients could be the reasoning in a future case or in the application of certain laws. Since the Dobbs decision in 2022, a growing number of states have passed laws or constitutional amendments to secure the right to contraception for their residents. Recently, former president Donald Trump said that he believes the right to contraception should be up to the states, a statement he followed up with a social media posting saying that he would not limit contraception. With several state ballot initiatives on the path to be facing the voters November 2024 and the former president’s statement on contraception, this issue is likely to emerge as an election issue this fall. Senate Majority Leader Schumer also recently stated his intention to take a vote to the Senate floor on a bill that would protect contraceptive access nationally. This issue brief explains how misinformation about contraceptives and how pregnancy is defined in state abortion bans may impact contraceptive access, and outlines the legal protections some states have established to affirm the right to obtain contraceptives.

Background

Supreme Court Decisions Recognizing the Right to Contraception

Currently, the right to contraception is protected by two landmark Supreme Court decisions, Griswold v. Connecticut (1965) and Eisenstadt v. Baird (1972). In Griswold, the Court recognized that the constitutional right to privacy encompasses the right of married people to obtain contraceptives. Prior to the Griswold decision, many states outlawed contraceptives, prohibiting clinicians from prescribing, or even discussing, contraceptive methods with their patients. After the Griswold decision, some states continued to have these prohibitions for single people, only allowing married women to obtain contraceptives. These laws spurred the litigation that resulted in the High Court’s decision in Eisenstadt, where the Court extended the constitutional protections of Griswold to unmarried people.

Misconceptions about Emergency Contraceptives (EC) and IUDs

Although intrauterine devices (IUDs) and emergency contraceptives (EC) – such as Plan B, Ella, and the emergency application of IUDs – work by preventing pregnancy, many people mistakenly believe they are abortifacients and can end a pregnancy. Polls indicate that as many as 73% of people incorrectly think emergency contraceptive pills can end a pregnancy in its early stages. Additionally, some people wrongly believe that IUDs work primarily by preventing implantation of a fertilized egg on the uterine lining.  However, research has shown that these contraceptive methods work by inhibiting ovulation or by making it harder for sperm to reach an egg. Despite some common misconceptions, emergency contraceptive methods and regular use of the IUD do not terminate a pregnancy, stop the implantation of a fertilized egg, or affect a developing embryo.

Exclusion of Emergency Contraceptives in State Programs

Although Medicaid programs are required to cover family planning services, some states have attempted to exclude certain contraceptive methods from their state Medicaid programs. In 2020, Texas received permission from the Trump Administration to exclude emergency contraceptives from its Medicaid-funded family planning program, after requesting to exclude coverage in 2017. This waiver will remain in effect until December 2024. Similarly, in 2021 the Missouri senate voted on a bill that would have barred coverage of emergency contraceptives from the state’s Medicaid program. This measure failed, and it is unclear whether Missouri had the authority to enforce this restriction without receiving authorization from the federal government. And in 2023, Iowa stopped paying for Plan B for survivors of sexual assault through its Crime Victim Compensation Program. Although these measures affect coverage of emergency contraceptives – not their legality – they still constitute attempts to restrict access to certain contraceptive methods.  Additionally, in 2021, the Idaho legislature enacted a law that bars “abortion-related activities” in school-based clinics, which prohibits health clinics at public schools, including higher education institutions, from dispensing emergency contraceptives, except in cases of rape.

Some Abortion Bans May be Interpreted to Limit Contraceptive Access

The definitions that abortion bans in some states employ, coupled with the misunderstanding that certain contraceptives are abortifacients, may be used to limit access to contraceptives. While leading medical organizations define pregnancy to begin at the implantation of a fertilized egg, a number of abortion bans define pregnancy to begin at fertilization and “fetus” and “unborn children” as living humans from fertilization until birth. The total abortion ban in Tennessee, for instance, defines pregnancy as the “reproductive condition of having a living unborn child within [the pregnant person’s] body throughout the entire embryonic and fetal stages of the unborn child from fertilization until birth.” If abortion bans establish that a pregnancy exists from the moment of fertilization, preventing the implantation of a fertilized egg could be construed as terminating a pregnancy. This kind of definition could potentially be used to ban or restrict contraceptive methods that people incorrectly believe to end a pregnancy.

For example, Missouri defines abortion to outlaw “[the] termination of the pregnancy of a mother by using or prescribing any instrument, device, medicine, drug, or other means or substance with an intention other than to increase the probability of a live birth or to remove a dead unborn child”. The ban additionally defines “unborn child” as “the offspring of human beings from the moment of conception” — which they define as fertilization — “until birth.”  The ban does not provide a definition for pregnancy, but instead establishes personhood for fertilized eggs, which could be interpreted as banning anything that prevents the implantation of a fertilized egg on the uterine lining, a possibility the state’s governor did not firmly deny in the immediate aftermath of the Dobbs decision. As a result, when the state’s abortion ban went into effect, a major hospital system in Missouri immediately stopped providing Plan B – an emergency contraceptive – out of fear of charges that could have resulted from a prosecutor’s misunderstanding of how Plan B works. The hospital system resumed providing the emergency contraceptive after the Attorney General’s office and the governor clarified that the ban did not affect Plan B. However, this situation demonstrates how the definitions included in abortion bans, which imply pregnancy starts at fertilization, coupled with misunderstandings of how contraceptives work, could limit access to the full range of contraceptive methods.

Currently, most other abortion bans that define pregnancy to begin at fertilization also limit the definition of abortion to providing procedures or medication to people “known to be pregnant” or with “clinically diagnosable pregnancies”. This definition of abortion would preclude these bans from being used to limit contraceptives. This is because contraceptives – emergency or otherwise – do not end an existing pregnancy and emergency contraceptives are only effective up to 5 days after intercourse, while the earliest a pregnancy can be clinically confirmed is approximately 10 to 11 days after fertilization. Even with a misunderstanding of how contraceptives work, these bans do not affect conduct prior to the time when a pregnancy can be confirmed. Additionally, the abortion bans in a few states explicitly clarify that they do not prevent the prescription, sale, or transfer of birth control devices and oral contraceptives.

Notably this issue came up in the 2023 race for Kentucky Governor. In a questionnaire from a state anti-abortion organization, one Republican contender indicated his support for fetal personhood, and prohibiting public funds for abortion with a definition that included contraceptive methods such as the “morning after pill,” Norplant, Depo Provera and the so-called “standard birth control pill.”  While the definition was provided by the anti-abortion organization, not the candidate, it illustrates the lack of understanding of contraceptive mechanisms of action and fails to distinguish between a drug or device that prevents pregnancy and those that are used to terminate a pregnancy.

Definitions of Abortion, Pregnancy and Fetal Personhood in State Abortion Bans

Other Fetal Personhood Laws May Also Interfere with Access to Contraceptives

Laws and policies that define personhood to start at fertilization may similarly be used to limit access to contraceptives. For instance, the 2024 Alabama Supreme Court ruling holding that the state’s wrongful death law for minors applies from the moment of fertilization – including in vitro fertilization (IVF) – set precedent that could be used to limit access to certain contraceptives. Such an application of the law could result in the criminalization of actions perceived to threaten fertilized eggs, including the use of contraceptive methods people wrongly believe prevent the implantation of a fertilized egg, such as oral emergency contraceptives and the IUD.

State Protections for the Right to Contraception

Fourteen states – California, Colorado, Florida, Illinois, Massachusetts, Michigan, Minnesota, New Jersey, New Mexico, Ohio, Oregon, Rhode Island, Vermont, and Washington – and D.C. currently have legal or constitutional protections for the right to contraception. In six states and D.C., these protections were enacted since the Supreme Court’s decision in Dobbs in June 2022 as a legislative and citizen response to the fall of Roe.  In California, Michigan, and Vermont, voters passed constitutional amendments through ballot measures in the November 2022 election recognizing a broad right to reproductive autonomy, which includes the right to use or refuse contraceptives. In these states, the right to reproductive autonomy also includes the right to abortion and sterilization. In addition to the three states that had constitutional amendments in the November 2022 ballot, the legislatures in D.C., Minnesota, and New Mexico have enacted laws protecting contraception since June 2022. And in 2023, Ohio voters approved Proposition 1, amending their state constitution to protect reproductive decisions, including those regarding contraception and abortion.

13 States Have Legal Protections for the Right to Contraception

Although a number of the protections for contraception were enacted post-Dobbs, more than half of the states that have such protections instituted them before June 2022. Most of these laws – including those in Colorado, Illinois, Massachusetts, New Jersey, Rhode Island, and Vermont – were passed in the years leading up to the fall of Roe. Of the states that currently protect the right to contraception, all but three enacted these protections after 2019. The states of Oregon, Washington, and Florida had enacted their laws protecting contraceptives in 2007, 1991, and 1972, respectively.

Most laws protecting the right to contraception also protect a broader set of reproductive health care decisions, such as miscarriage management, maternity care, and assisted reproduction. Some states, such as Florida and Oregon, however, have more specific laws protecting the right to contraception. Oregon has separate protections for emergency contraception, voluntary sterilization, and termination of pregnancy. In fact, Florida is the only state with a statutory right to contraception that also has passed abortion bans, with a 6-week LMP ban in effect.

Much like any other legal protection, enshrining these rights in the state constitution creates stronger and more stable protection than simply enacting laws, which can be repealed with a change in party control of the state legislature or Governor. In contrast, a constitutional amendment that explicitly protects the right to contraception, or reproductive autonomy more broadly, is harder to change or repeal.

Proposed State Bills and Constitutional Amendments

Legislators in several states have introduced bills and proposed constitutional amendment ballot measures to protect the right to contraception since the Dobbs decision. Legislators in Hawai’i, Maryland, Nevada, and Washington, among other states, have proposed constitutional amendments to create protections for contraception. Most of these measures are in committee or awaiting a vote with the legislature, but the Maryland and Nevada measures have passed. Maryland’s proposed constitutional amendment will be on the November 2024 ballot. In Nevada, constitutional measures must pass twice in the legislature before they are placed on a ballot and the earliest it may be listed on the ballot is November 2026. Further, lawmakers in several states, including Arizona, Iowa, and Virginia, have introduced bills protecting the right to contraception during the 2023 and 2024 legislative session. None of these bills passed during the 2023 legislative session. The Virginia bill introduced during the 2024 session has passed both chambers, but it was vetoed by the governor.

Federal Response

At the federal level, the Right to Contraception Act – a bill that would have protected the right to obtain and use contraceptives – and the Access to Safe Contraception Act – which would prevent states from banning the prescription, provision, or use of FDA-approved contraceptives – were introduced in the House and the Senate in the weeks after the Supreme Court issued the Dobbs decision. Shortly after the bill was introduced, the then Democrat-led House passed the Right to Contraception Act, but it did not receive a vote in the Senate due to a lack of the necessary votes needed to end a filibuster. The Right to Contraception Act was reintroduced in the current Congressional session in June 2023, but it does not have sufficient support to pass in the House or end the filibuster in the Senate at this time. Senate Majority Leader Charles Schumer has announced his intention to fast-track a Senate floor vote that would codify the right to contraception that was granted in the Griswold case assuring that this will be raised by Democrats as an election issue.

In the months following the Dobbs decision, President Biden issued two executive orders aiming to protect access to reproductive health care services, including contraceptives.  While the executive orders do not specifically address the “right” to contraception, they call on federal agencies and regulators to assure that access to contraceptive services and supplies is broad and unimpeded by barriers related to costs, coverage, availability, and other factors. For example, in July 2022, under the directive of one of these executive orders, the U.S. Department of Health and Human Services issued guidance reminding retail pharmacies of their obligations under federal civil rights law. Specifically, the guidance pointed out that “if [a] pharmacy otherwise provides contraceptives (e.g., external and internal condoms) but refuses to fill a certain type of contraceptive because it may prevent pregnancy, the pharmacy may be discriminating on the basis of sex.”

Recent KFF polling suggests that 21% of adults consider the right to contraception to be a threatened right, rising to over one-third of Democrats. One in four Democratic women feel that the right to contraception is under threat, but concern is lower among Republican women (8%). Notably, many are not sure whether it is a secure right, but that may change as the issue gets additional attention in the upcoming election.

One in Five Adults Consider the Right to Use Contraception to Be Under Threat; Larger Shares of Democrats—Including Democratic Women—Say the Same

This brief updates and expands upon a brief with the same title published in March 2023.

How Many Older Adults Live in Poverty?

Authors: Nancy Ochieng, Juliette Cubanski, Tricia Neuman, and Anthony Damico
Published: May 21, 2024

Issue Brief

Social Security payments and Supplemental Security Income have been instrumental in providing economic security for older adults in the US. Additionally, Medicare, which provides health insurance to 66 million people age 65 or older and younger adults with long-term disabilities, offers financial protection by helping to cover the cost of medical care, while Medicaid provides additional benefits and cost-sharing assistance to many Medicare beneficiaries with low incomes. Despite these economic and health supports, many older adults live on relatively low incomes. The average Social Security benefit is around $1,900 per month, but millions of retired workers and their spouses receive much less than that, because of lower wages earned during their working years or because they claimed benefits before their full retirement age. (A small share of older adults in the U.S. are not eligible to receive Social Security benefits at all.) And though the peak of high inflation from 2022 has subsided, prices on many consumer goods and services have not declined to previous levels, posing a threat to the financial security of many individuals ages 65 and older who live on fixed incomes.

To provide context for understanding the financial needs and well-being of older adults, this brief analyzes the latest data on poverty rates among the 58 million non-institutionalized adults ages 65 and older in the U.S overall, based on both the official poverty measure and the Supplemental Poverty Measure, as reported by the Census Bureau. To measure poverty under the official measure, the Census Bureau uses specific dollar thresholds, which vary by family size and age of family members but do not vary geographically. In 2022, the poverty threshold was $14,040 for a single person age 65 or older and $17,710 for a household of two people 65 or older. In contrast to the official poverty measure, the Supplemental Poverty Measure accounts for geographic area and homeownership status and also reflects financial resources and liabilities, including out-of-pocket medical spending, taxes, and the value of in-kind benefits (e.g., food stamps). For 2020 and 2021, the Supplemental Poverty Measure also incorporated temporary COVID-19-related financial resources provided to individuals, such as stimulus payments. (See Appendix for more details on both measures). (The Census Bureau poverty thresholds analyzed in this brief are different from the Health and Human Services (HHS) poverty guidelines that are used to determine income eligibility for certain programs).

The analysis examines poverty rates among older adults at the national level in 2022, the most recent year available. It uses three-year averages (2020-2022) for poverty estimates by demographic characteristics (age, gender, race/ethnicity, health status) and at the state level. Because the Supplemental Poverty Measure accounted for temporary COVID-19-related payments in 2020 and 2021, the estimates for demographic groups and states based on the three-year averages are lower relative to the national Supplemental Poverty Measure poverty rate for 2022. This brief also assesses trends in poverty rates among older adults over the 10-year period between 2013 and 2022.

Key Takeaways

  • About 6 to 8 million adults ages 65 and older were living in poverty in 2022, depending on the measure used to assess poverty. Under the official poverty measure, one in 10 (10.2%), or 5.9 million adults ages 65 and older, had incomes below the official poverty threshold of $14,040 in 2022. The poverty rate was higher based on the Supplemental Poverty Measure, 14.2% or 8.2 million older adults, primarily because the Supplemental Poverty Measure takes into account out-of-pocket medical expenses that are not incorporated in the official poverty measure.
  • Among adults ages 65 and older, the poverty rate was higher among people ages 80 and older, women, people of color, and people in relatively poor health under both the official and supplemental poverty measures. For example, based on the official poverty measure, the share of older Black (17.3%), Hispanic (17.4%) and American Indian or Alaska Native (17.4%) adults with incomes below poverty was more than double the share of older White adults (7.7%).
  • The share of people ages 65 and older with incomes below the official poverty measure varied by state, ranging from 4.5% in Wisconsin to 20.3% in the District of Columbia (and from 4.2% in Iowa to 22.0% in the District of Columbia based on the Supplemental Poverty Measure). The share of older adults living below twice the poverty level ranged from 18.4% in Maryland to 41.7% in West Virginia based on the official poverty measure, and from 28.3% in Iowa to 49.3% in the District of Columbia based on the Supplemental Poverty Measure.
  • Between 2013 and 2022, the poverty rate among older adults remained relatively stable based on the official poverty measure, around 10%. Based on the Supplemental Poverty Measure, the poverty rate among older adults was also fairly stable from 2013 to 2019 – and higher than under the official poverty measure – but dropped from 12.8% in 2019 to 9.5% in 2020 and 10.7% in 2021 due to COVID-19 related payments, before increasing to 14.2% in 2022 with the expiration of many of these pandemic-related relief funds.

What Share of Older Adults Lived in Poverty in 2022?

In 2022, a larger share of people ages 65 and older were living in poverty based on the Supplemental Poverty Measure (14.2%) than the official poverty measure (10.2%), a difference largely due to the fact that the Supplemental Poverty Measure accounts for additional financial resources and expenses—such as out-of-pocket medical expenses—that are not included in official poverty measure does not. Because older adults typically have higher medical out-of-pocket costs than younger people, this translates to higher poverty rates under the Supplemental Poverty Measure than the official poverty measure.

  • 100% of poverty: Under the official poverty measure, one in 10 (10.2%) or 5.9 million people ages 65 and older had incomes below the poverty threshold of $14,040 in 2022. The share and number of people living in poverty are higher, 14.2% or 8.2 million older adults, based on the Supplemental Poverty Measure (Figure 1, Appendix Table 1).
  • 200% of poverty: In 2022, nearly three in 10 (29.4%, or 17.0 million) adults ages 65 and older had incomes below 200% of poverty under the official measure ($28,080 in 2022). The share is higher – more than four in 10 (42.2%) older adults, or 24.4 million people – based on the Supplemental Poverty Measure.
One in 10 (10.2%) Adults Ages 65 and Older Had Incomes Below Poverty in 2022, Based on the Official Measure, But the Rate Was Higher (14.2%) Under the Supplemental Poverty Measure

How Do Poverty Rates Among People Ages 65 and Older Vary by Demographic Characteristics?

Under both the official poverty measure and the Supplemental Poverty Measure, the poverty rate among people ages 65 and older was higher among adults ages 80 and older, women, and people self-reporting fair or poor health, based on three-year averages for 2020-2022. Additionally, larger shares of older Black, Hispanic, American Indian or Alaska Native, Asian, and people identifying as multiple races had incomes below poverty compared to White adults ages 65 and older, based on both measures. The rate of poverty and the number of people living in poverty was higher for most demographic subgroups under the Supplemental Poverty Measure than under the official poverty measure, except for older Black and American Indian or Alaska Native adults, and adults reporting fair or poor health, where rates between both measures were similar. These three-year average estimates include two years (2020 and 2021) when the Supplemental Poverty Measure accounted for temporary COVID-19-related payments to individuals.

Poverty Rates Among Older Adults Increase With Age

Among people ages 65 and older, the poverty rate was higher among people ages 80 and older than younger people ages 70-79 years and 65-69 years, based on both the official poverty measure (12.1% vs. 9.1 and 9.3%, respectively) and the Supplemental Poverty Measure (14.3% vs. 10.6% and 10.4% respectively) (Figure 2, Appendix Table 1).

Overall, 1.5 million adults ages 80 and older lived in poverty under the official measure, compared with 2.3 million adults ages 70-79 years and 1.7 million adults ages 65-69 (the numbers living in poverty based on the Supplemental Poverty Measure were 1.8 million, 2.7 million, and 1.9 million, respectively).

Notably, nearly half of adults ages 80 and older, or 6.0 million, had incomes below 200% of poverty under the Supplemental Poverty Measure, compared to 34.2% of those ages 65-69.  Similar to the official poverty measure, a larger share of adults ages 80 and older than those ages 65-69 and 70-79 had incomes below 200% of poverty.

Among Adults Ages 65+, the Poverty Rate Was Higher Among People Ages 80 and Older Than Those Ages 65-79

Poverty Is Higher Among Older Women Than Older Men

The poverty rate was higher among women than men ages 65 and older, based on both the official measure (11.0% vs. 8.5%) and the Supplemental Poverty Measure (12.4% vs.10.2%) (Figure 3, Appendix Table 1). In absolute numbers, more older women than older men (3.2 million vs 2.2 million) lived in poverty under the official measure, and under the Supplemental Poverty Measure (3.8 million vs 2.6 million). Similarly, a larger share of women ages 65 and older than older men had incomes below 200% of poverty under both measures.

Additionally, among people ages 80 and older, a higher share of women lived in poverty compared with men based on both the official poverty measure (14.0% vs. 9.2%) and the Supplemental Poverty Measure (16.2% vs 11.7%).

Larger Shares of Women Ages 65 and Older Had Incomes Below Poverty Than Older Men, Based on Both Measures of Poverty

Among Older Adults, Poverty Rates Are Higher Among People of Color Than Among White Adults

Among people ages 65 and older, the poverty rate was higher among Black, Hispanic, American Indian or Alaska Native, Asian, and people identifying as multiple races compared with White adults based on both measures. Based on the official poverty measure, the share of older Black (17.3%), Hispanic (17.4%) and American Indian or Alaska Native (17.4%) adults with incomes below poverty was more than double the share of older White adults (7.7%) (Figure 4, Appendix Table 1). The pattern was consistent under the supplemental poverty measure (for example,17.3% of older Black and 20.0% of older Hispanic adults lived in poverty vs. 9.2% of older White adults).

Similarly, larger shares of older Black, Hispanic, American Indian or Alaska Native, Asian, and people identifying as multiple races had incomes below 200% of poverty than older White adults, based on both measures.

Poverty rates by both race and ethnicity and gender mirrored the overall pattern. For example, poverty rates among older Black, Hispanic, and American Indian or Alaska Native women were twice as high as those among older White women, based on the official measure (Appendix Tables 1 and 2).

The Poverty Rate Was Higher Among People of Color Ages 65 and Older, Particularly Black, Hispanic, and American Indian and Alaska Native Adults, Than White Older Adults

Poverty Is Higher Among Older Adults Reporting Fair or Poor Health Than Those in Excellent or Very Good Health

The poverty rate was substantially higher among adults ages 65 and older in fair or poor self-reported health than older adults in excellent or very good health, based on both the official measure (16.0% vs. 5.9%) and the supplemental poverty measure (16.8% vs. 7.7%) (Figure 5, Appendix Table 1).

Similarly, larger shares of older adults in fair or poor health had incomes below 200% of poverty compared with older adults in excellent or very good health, based on both measures.

The Poverty Rate Among Adults Ages 65 and Older Increased as Self-Reported Health Status Worsened and Was Highest for those in Fair or Poor Health

How Do Poverty Rates Among People Ages 65 and Older Vary by State?

The poverty rate among people ages 65 and older varied by state, based on three-year averages for 2020-2022.

  • 100% of poverty: Under the official poverty measure, the poverty rate ranged from 4.5% in Wisconsin to 20.3% in the District of Columbia and was 10% or higher in 17 states and the District of Columbia (Figure 6, Appendix Table 3). Under the Supplemental Poverty Measure, the poverty rate ranged from 4.2% in Iowa to 22.0% in the District of Columbia and was 10% or higher in 25 states and the District of Columbia.
  • 200% of poverty: Under the official poverty measure, the share of older adults with incomes under 200% of poverty ranged from 18.4% in Maryland to 41.7% in West Virginia; a third (33%) or more of older adults had incomes below 200% of poverty in 11 states and the District of Columbia (Appendix Table 4). Under the Supplemental Poverty Measures, the share of older adults under 200% of poverty ranged from 28.3% in Iowa to 49.3% in the District of Columbia; a third or more of older adults had incomes below 200% of poverty in 34 states and the District of Columbia.
  • Comparing poverty rates under both measures: The poverty rate for adults ages 65 and older was similar under both the official poverty measure and the Supplemental Poverty Measure in all but six states, likely due to the COVID-19 stimulus payments and one-time state income tax rebates factored in the supplemental poverty measure in 2020 and 2021. But in California, Florida, Hawaii, Maryland, New Jersey, and Texas, the poverty rate was higher under the Supplemental Poverty Measure than under the official poverty measure. For example, in California, 16.0% of older adults were living in poverty under the Supplemental Poverty Measure versus 10.8% under the official measure; in Texas, the rates were 13.3% versus 11.4%. Higher Supplemental Poverty Measure rates in these six states could be influenced by specific state-level factors such as housing costs, which are also factored into how poverty is determined under the Supplemental Poverty Measure.
The Poverty Rate Among Adults Ages 65 and Older Varies by State and Poverty Measure

Between 2013 and 2022, the official poverty rate among older adults was mostly unchanged but dipped in 2020 and 2021 under the Supplemental Poverty Measure due to the availability of COVID-19-related economic stimulus payments and then increased in 2022 when these payments ended. Over the 10-year period between 2013 and 2022, the official poverty rate was relatively stable, increasing modestly from 9.5% in 2013 to 10.2% in 2022 (Figure 7). The poverty rate under the Supplemental Poverty Measure was also fairly stable from 2013 to 2019—and higher than under the official measure—before dropping in 2020 and 2021, years when the Supplemental Poverty Measure accounted for resources that were aimed at mitigating the financial impact of the COVID-19 pandemic. According to the Census Bureau, in 2020, 2.0 million adults ages 65 and older were lifted out of poverty due to COVID relief funds, and 1.9 million in 2021. The Supplemental Poverty Measure poverty rate among older adults decreased from 12.8% in 2019 to 9.2% in 2020 and 10.7% in 2021, and then increasing to 14.2% in 2022, reflecting the expiration of many of these pandemic-related relief funds.

While the poverty rate remained similar under both the official measure and the Supplemental Poverty Measure in 2022 compared to 2013, the number of older adults living in poverty increased over this 10-year period – by 1.7 million under the official measure and 1.6 million under the Supplemental Poverty Measure. This was driven by an overall increase in the number of older adults in the U.S.

Under the Supplemental Poverty Measure, the Poverty Rate Among Older Adults Increased in 2022 After a Two-Year Decline Due to Expiration of Temporary COVID-19 Relief Funds

This work was supported in part by AARP. KFF maintains full editorial control over all of its policy analysis, polling, and journalism activities.

Nancy Ochieng, Juliette Cubanski, and Tricia Neuman are with KFF. Anthony Damico is an independent consultant.

Methods

This analysis reports poverty data for 2020-2022 using the 2021-2023 Current Population Survey March Annual Social and Economic Supplement (CPS ASEC) for the estimates of poverty under the official measure, and the Supplemental Poverty Measures Public Use Research Files, which are derived from the CPS ASEC, for poverty estimates under the Supplemental Poverty Measure. The 2023 CPS ASEC was used for national estimates (data for 2022); the 2021-2023 CPS ASEC was used for state-level and subgroup estimates (averaged across the three years, 2020-2022). Standard errors were calculated using the replicate weights and a Fay’s adjustment. All reported estimates have a relative standard error below 30%. Any estimate with a relative standard error greater than 30% is considered unreliable and not reported.

The poverty rates presented in this brief apply to non-institutionalized people ages 65 and older, and not the total Medicare population, which includes both people ages 65 and older and younger people with permanent disabilities, and both facility residents and people living in the community. The CPS ASEC does not include older adults residing in institutions, such as nursing homes and other long-term care facilities. Rates of poverty among the total Medicare population would be larger than the estimates presented here because income levels are lower among both Medicare beneficiaries under age 65 with disabilities and those living in long-term care facilities.

This analysis compares the incomes of family units to poverty thresholds, consistent with the approach defined by the official measure and the Supplemental Poverty Measure (although each measure defines families somewhat differently). Relying on a unit of measurement other than family units could produce different poverty rates. For example, health insurance units tend to be smaller than family units, and poverty rates may be much higher when based on the former. Further, the Census Bureau poverty thresholds analyzed in this brief are different from the Health and Human Services (HHS) poverty guidelines (sometimes referred to as the “federal poverty level”) that are used to determine income eligibility for certain programs.

Finally, estimates in this brief from the Public Use Research Files may not precisely align with those published by the Census Bureau due to disclosure protections such as topcoding. Additionally, the use of pooled three-year estimates for demographic and state-level data yields slightly different results compared to single-year estimates published elsewhere.

Differences in methodology between the official measure and the Supplemental Poverty Measure: The official measure and SPM produce different estimates of poverty because their methodology varies in several ways. Both measures determine poverty estimates by comparing the financial resources of families against poverty thresholds, which are minimum dollar amounts needed to meet basic needs. These thresholds vary by family size and composition. While the official measure defines resources as cash income, the Supplemental Poverty Measure accounts for resources other than cash (e.g., in-kind government benefits) and expenses (e.g., out-of-pocket medical expenses). The differences in methodology between both measures are summarized below (Table 1):

Differences in Methodology Between the Official Poverty Measure and the Supplemental Poverty Measure

Changes to the methodology of the Supplemental Poverty Measure beginning in 2019: In 2021, the Supplemental Poverty Measure methodology of estimating both resources and thresholds was revised, and these changes were implemented starting in the 2019 thresholds. A summary of the changes is below (Table 2):

Summary of Changes to the Methodology of the Supplemental Poverty Measure

Appendix

Adults Ages 65 and Older With Incomes Below 100% of Poverty Under Official and Supplemental Poverty Measures, by Selected Characteristics
Adults Ages 65 and Older With Incomes Below 200% of Poverty Under Official and Supplemental Poverty Measures, by Selected Characteristics
Adults Ages 65 and Older With Incomes Below 100% of Poverty Based on the Official and Supplemental Poverty Measures, by State
Adults Ages 65 and Older With Incomes Below 200% of Poverty Based on the Official and Supplemental Poverty Measures, by State
News Release

In 45 States, Fewer Than Half of Nursing Facilities Have Enough Staff to Meet New Federal Requirements

Current staffing levels are similar in rural and urban nursing facilities, but urban facilities will have less time to comply with the new requirements

Published: May 21, 2024

In 45 states, fewer than half of nursing facilities currently meet all three staffing minimums required in the final federal rule that the Centers for Medicare and Medicaid Services (CMS) released in April, and in 28 states, less than a quarter do, according to a new KFF analysis. The share of facilities that meet these requirements ranges from 5% or lower in four states (AR, TN, TX and LA) to 50% or higher in five states (AK, ND, ME, HI and OR) and DC.In rural areas, 20% of nursing facilities currently meet these standards, compared to 18% in urban areas. Despite having similar starting points, nursing facilities in urban areas have two fewer years to comply with all provisions of the rule, facing a deadline of May 2027 compared to May 2029 in rural areas. Though they face different challenges, urban and rural facilities currently have similar staffing patterns and both face potential staffing shortages. Rural facilities may struggle to find staff because there are fewer available workers, while urban facilities may struggle because available workers have more job options.  

Across the U.S., only 1 in 5 (19%) nursing facilities currently meet all three staffing minimums. The share that comply is even lower among for-profit facilities (only 11%), compared to 41% of non-profit facilities and 39% of government facilities. When the new federal requirements are fully implemented, nursing facilities will be required to maintain at least 0.55 registered nurse and 2.45 nurse aide hours per resident day (HPRD) in addition to the overall 3.48 HPRD requirement. Nursing facilities may apply for exemptions from these minimum staffing requirements if they are located in an area with workforce shortages. The nursing home industry has identified the cost of hiring and retaining sufficient staff as a major concern, while resident and family advocates have long said new requirements are necessary to address well-documented issues with the quality of patient care.

Forthcoming decisions about how CMS will enforce the new staffing requirements and the ease by which facilities can acquire hardship exemptions may impact the effectiveness of the federal rule as well as how much costs could rise.