Survey on Racism, Discrimination and Health: Experiences and Impacts Across Racial and Ethnic Groups
Overview
There have been increased attention and calls to address racism in the U.S. in recent years, particularly in the wake of the initial wave of the COVID-19 pandemic and the growth in recognition of the harms caused by systemic racism following the police killings of George Floyd and Breonna Taylor. As a result of historic and ongoing policies often rooted in discriminatory practices, there are stark differences in access to resources, opportunities, and power by race and ethnicity in the U.S., including access to safe housing and neighborhoods, economic and educational opportunities, and health care. Racism and discrimination at multiple levels, intentional or not, result in differences in experiences across many aspects of everyday life as well as in health care settings, which can negatively impact individuals’ health and well-being. Moreover, reflecting the intersectional nature of people’s identities, some individuals experience the combined impacts of racism and discrimination based on other factors such as gender or sexual orientation.
KFF’s 2023 Racism, Discrimination, and Health Survey is a major effort to document the extent and implications of racism and discrimination, particularly with respect to people’s interactions with the health care system. This large, nationally representative survey based on responses from over 6,000 adults provides new data on individuals’ experiences with racism and discrimination and the impacts of these experiences, both broadly and within racial and ethnic groups. It documents racial and ethnic differences in social and economic circumstances, interactions with the police, experiences with unfair treatment in daily life and while seeking health care, and the impacts of such experiences on health and well-being. Moreover, it examines how these inequities and experiences vary within racial and ethnic groups by factors such as income, gender, skin tone, age and LGBT identity where data allow. Future publications will delve deeper into results for specific populations and additional topics. This survey is part of a broader body of work that builds on KFF’s commitment to amplifying the voices of marginalized populations, including the recently released 2023 KFF/LA Times Survey of Immigrants, which provides insight into experiences of immigrants by different factors including immigration status. Having comprehensive and nuanced data to understand individuals’ experiences may inform and direct efforts to address disparities and advance equity.
This report is broadly divided into three sections. The first examines how social and economic circumstances and feelings of safety for Hispanic, Black, Asian, and American Indian and Alaska Native (AIAN) people in the U.S. differ from White individuals in ways that reflect underlying structural inequities. The second section examines experiences with interpersonal racism and discrimination in daily activities and impacts of these experiences on well-being and stress. The third section delves deeper into experiences with racism and discrimination in health care settings.
Acknowledgements:
KFF would like to thank the following individuals and organizations for their invaluable inputs, insights, and suggestions throughout the planning and dissemination of this survey project:
Mayra Alvarez, MHA, The Children’s PartnershipUché Blackstock, MD, Advancing Health EquityKimberly Chang, MD, MPH, Asian Health ServicesJuliet Choi, JD and Mary Smith, JD, Asian and Pacific Islander Health ForumGail Christopher, DN, National Collaborative for Health EquityCarmen Green, MPH, Reproductive Health ImpactDaniel Dawes, JD, Institute of Global Health Equity, Meharry Medical CollegeAdolph P. Falcón, MPP, National Alliance for Hispanic HealthSharlene Kemler, The Loveland FoundationPedro Martinez, MPH, UnidosUSAletha Maybank, MD, MPH, and Fernando De Maio, PhD, American Medical AssociationMeredith Raimondi, National Council of Urban Indian HealthA.C. Locklear, JD, National Indian Health Board
This work was supported in part by a grant from Yield Giving. KFF maintains full editorial control over all of its policy analysis, polling, and journalism activities.
Findings
Key Takeaways
Reflecting ongoing residential segregation patterns rooted in contemporary and historic policies, Hispanic, Black, Asian, and AIAN adults feel less safe in their homes and neighborhoods and experience higher rates of police mistreatment compared to White adults. Hispanic, Black, Asian, and American Indian and Alaska Native (AIAN) adults are significantly less likely than White adults to say they feel “very safe” in their neighborhoods and in their homes, and about one in ten in each of these groups say they or a family member was a victim of violence in the past year, about twice the share of White adults who say so. About one in six AIAN adults and one in ten Black and Hispanic adults say they or a family member living with them have been threatened or mistreated by the police in the past year compared with 4% of White adults. Black and Hispanic adults who have self-reported darker skin tones report even higher rates of police mistreatment. Hispanic, Black, and AIAN adults also report disproportionate challenges with finances and employment due to underlying structural inequities, which are reflected in their daily worries and concerns. Among adults overall and across most racial and ethnic groups, having a strong network of local support is associated with increased feelings of safety in their homes and neighborhoods and reduced frequency of worries and concerns about meeting their family’s basic needs and health.
At least half of AIAN, Black, and Hispanic adults and about four in ten Asian adults say they have experienced at least one type of discrimination in daily life at least a few times in the past year, and they are more likely to say these experiences were due to their race or ethnicity compared to their White counterparts. These experiences include receiving poorer service than others at restaurants or stores, people acting as if they are afraid of them, people acting as if they are not smart, being threatened or harassed, or being criticized for speaking a language other than English. Overall, four in ten Black adults and about three in ten Hispanic, Asian, and AIAN adults say they have experienced at least one of these acts of discrimination in the past year and that their race or ethnicity was a reason for these experiences compared with just 6% of White adults.
Highlighting the impacts of racism and discrimination on well-being and health, people who report experiences with discrimination in daily life are more likely than those who rarely or never experience discrimination to report adverse effects from worry or stress as well as regular feelings of loneliness, anxiety and depression. For example, those who experienced discrimination in their everyday lives are at least twice as likely as those who report rarely or never experiencing discrimination to say that in the past 30 days worry or stress has led to sleep problems (65% vs. 35%); poor appetite or overeating (52% vs. 20%) frequent headaches or stomachaches (41% vs. 15%); difficulty controlling their temper (34% vs. 11%); worsening of chronic conditions (19% vs. 9%); or an increase in their alcohol or drug use (19% vs. 6%). Similarly, those who have experienced discrimination are more likely than those who haven’t had these experiences to say they always or often felt anxious, lonely, or depressed in the past year. These patterns are similar across racial and ethnic groups and persist even when controlling for other factors like age, income, gender, and LGBT identity.
Black and AIAN adults report facing particularly high rates of discrimination, and among Black adults, those with self-reported darker skin tones are more likely to report discrimination experiences than those with lighter skin tones. AIAN and Black adults are the most likely to report an experience with discrimination in daily life asked about in the survey, with over half of both groups saying they experienced at least one of these types of discrimination at least a few times a year and about three in ten reporting experiencing two or more of these types of discrimination at least a few times a year. Among Black adults, those who say their skin color is “very dark,” “dark,” (62%) or “medium” (55%) are more likely to report an experience with discrimination compared with 42% of Black adults who say their skin color is “very light” or “light.”
Specific discrimination experiences also vary by gender, with Black men being the most likely to say people act as if they are afraid of them and Hispanic women most likely to say they are treated as if they are not smart. About a quarter (27%) of Black men say people acted afraid of them in the past year, as do 17% of Hispanic men and 17% of Black women, compared with about one in ten among Hispanic women and White and Asian adults of either gender. Conversely, the share who say they were treated as if they are not smart is higher among Hispanic women (37%) than Hispanic men (27%). Hispanic women are also more likely than Hispanic men to say they received poorer service than others in stores or restaurants at least a few times in the past year (29% vs. 21%). Discrimination experiences also vary by LGBT identity and age. About two-thirds (65%) of LGBT adults say they experienced at least one form of discrimination measured in the survey in the past year compared to four in ten (40%) non-LGBT adults, although there are no significant differences by race and ethnicity among LGBT adults. Similarly, over half (54%) of adults ages 18-49 report these experiences compared to three in ten (29%) of those ages 50 and over.
Experiences with unfair treatment extend into health care, with Black, Hispanic, AIAN, and Asian adults reporting higher levels of unfair treatment when seeking health care than their White counterparts, and Black women report even higher rates of unfair treatment. About one in five Black adults (18%) and about one in ten Hispanic (11%), Asian (10%) and AIAN (12%) adults say they have been treated unfairly or with disrespect by a health care provider in the past three years because of their race or ethnic background compared with 3% of White adults. Among Black adults, women are more likely than men to say they were treated unfairly by a health care provider because of their racial or ethnic background (21% vs. 13%).
Reflecting experiences with unfair treatment, large shares of Black, AIAN, Hispanic, and Asian adults say they prepare for possible insults or feel they must be very careful about their appearance to be treated fairly during health care visits. Six in ten (60%) Black adults, about half of AIAN (52%) and Hispanic (51%) adults, and four in ten (42%) Asian adults say they prepare for possible insults from providers or staff and/or feel they must be very careful about their appearance to be treated fairly during health care visits at least some of the time compared with one in three (33%) White adults.
Having providers with a shared background matters, as Black, Hispanic, and Asian adults who have more health care visits with providers who share their racial and ethnic background report more frequent positive and respectful interactions. Reflecting limited racial and ethnic diversity of the health care workforce, most Hispanic, Black, Asian, and AIAN adults say that fewer than half of their health care visits in the past three years were with a provider who shared their racial or ethnic background. However, the survey shows how provider racial and ethnic concordance can make a difference in patient interactions. For example, Black adults who had at least half of recent visits with a provider who shares their background are more likely than those who have fewer of these visits to say that their doctor explained things in a way they could understand (90% vs. 85%), involved them in decision-making about their care (84% vs. 73%), understood and respected their cultural values or beliefs (84% vs. 76%), or asked them about social and economic factors (39% vs. 24%) during recent visits.
A third of adults overall report at least one of several negative experiences with a health care provider in the past three years, and many Black, Hispanic, Asian, and AIAN adults say they were treated this way because of their race or ethnicity. These negative experiences include a provider assuming something about them without asking, suggesting they were personally to blame for a health problem, ignoring a direct request or question, or refusing to prescribe pain medication they thought they needed. About a quarter (24%) of Black adults and one in five (19%) AIAN adults say they experienced at least one of these negative experiences and that their race or ethnicity was a reason why they were treated this way, as do 15% of Hispanic and 11% of Asian adults, compared with just 4% of White adults. Notably, 22% of Black adults who were pregnant or gave birth in the past ten years say they were refused pain medication they thought they needed, roughly twice the share of White adults with a pregnancy or birth experience (10%).
Negative experiences with health care providers as well as language access challenges have consequences for health and health care use. Among adults who used health care in the past three years, one in four (25%) say they had a negative experience (including being treated unfairly or with disrespect, a negative provider interaction, or difficulty with language access), and it led to worse health, being less likely to seek care, and/or switching providers. AIAN and Black adults are more likely than White adults to say they had a negative experience and it contributed to at least one of these consequences.
Implications
The survey reveals that, in wake of the initial COVID-19 pandemic and amid ongoing economic challenges and political division within the U.S., people’s experiences in their everyday lives and in health care settings often vary starkly by race and ethnicity, highlighting the ongoing impacts of racism and discrimination within the health care system and more broadly. The survey shows that many challenges are shared across all adults, including White adults, but that Hispanic, Black, Asian, and AIAN adults face disproportionate challenges and higher rates of unfair treatment due to their race and ethnicity, which have implications for health and well-being. The survey data identify areas for increased attention, resources, and initiatives to address these challenges and disparities, such as mechanisms to improve social and economic circumstances and provide safer communities as well as to address ongoing bias and discrimination, particularly in health care. The survey results also highlight factors that mitigate some of these challenges, including having strong local support networks and more health care visits with providers who have a shared racial and ethnic background. They also illustrate opportunities to increase respectful and positive provider interactions that can support high-quality and culturally competent care. Addressing the challenges identified in the survey is important not only from an equity standpoint but also for improving the nation’s overall health and economic prosperity.
Notes on Racial and Ethnic Groups Included in This Report
Many surveys and data analyses classify individuals into non-overlapping racial and ethnic categories using single-race and Hispanic ethnicity categories and grouping those who identify as more than one race into a “multiracial” or “other” category. To allow for better representation of experiences of the growing shares of people who identify as multiracial, this report uses an “alone or in combination” approach for classifying individuals so that they are represented within each racial and ethnic group with which they identify, resulting in overlapping racial and ethnic categories. For example, responses from someone who identifies as both Black and Asian are included in the results for both Black adults and Asian adults, and responses from someone who identifies as American Indian and Hispanic are included in the results for both AIAN adults and Hispanic adults. The exception is reporting on White adults, who in this report are defined as those who identify as non-Hispanic and select White as their only race. See Appendix 1 for more details.
The sample sizes for Hispanic adults and Black adults (more than 1,750 each) allow for detailed subgroup reporting, including by age, gender, income, LGBT identity, and urbanicity. The sample of Asian adults (693) allows for a narrower set of demographic breaks within this group. Because of the smaller sample of AIAN adults (267), results are shown for this population as a whole and demographic breaks are not provided.
In addition, the sample of AIAN adults has some limitations and caution should be exercised when interpreting these results (see Appendix 2 for a description of these limitations, adjustments made to make the sample more representative, and considerations for data interpretation). Given ongoing concerns about data erasure and invisibility of smaller populations, including Indigenous people, KFF has decided to include results for the AIAN population in this report despite these limitations.
Section 1: Racial and Ethnic Differences in Social and Economic Factors, Safety, and Police Interactions
Historic and contemporary policies contribute to ongoing structural inequities in access to opportunities and resources, shaping where people live, their education and employment, and other factors that influence their daily lives, experiences, and interactions with systems and institutions. For example, historic housing policies, including discriminatory practices such as redlining, have ongoing impacts today, including residential segregation of Black people into urban areas with fewer resources and educational opportunities and higher rates of poverty, violence and crime. The survey shows racial and ethnic differences in finances and employment, feelings of safety and exposure to violence, and interactions with the police that reflect these types of underlying inequities.
Finances and Employment
Black, AIAN, Hispanic, and Asian adults face increased challenges across an array of social and economic factors relative to White adults, which reflect underlying structural inequities, including access to employment and educational opportunities. About three in ten AIAN (29%) and Black (28%) adults, one quarter (24%) of Hispanic adults, and one in five (20%) Asian adults say they or a family member experienced problems getting or keeping a job in the past year compared with 15% of White adults (Figure 1). Just under half of AIAN (48%) and Black (45%) adults say they or a family member had a problem paying for food, housing, transportation, or other necessities in the past year, nearly twice the share of White adults (27%) who report these issues. Similarly, about one in five Black (22%) and AIAN (22%) adults and one in seven Hispanic adults (15%) say they have difficulty affording their bills each month, larger than the share of White adults who say this (11%). In contrast, paying for health care is a common challenge across racial and ethnic groups. At least one in five adults across racial and ethnic groups say they or a family member living with them had a problem paying for health care in the past 12 months. Hispanic adults are more likely than White adults to report problems affording health care in the past year (27% vs. 23%), reflecting that they have a higher rate of being uninsured.

Differences in finances and employment may also reflect bias and discrimination, with Black and AIAN adults more likely than White adults to report unfair treatment in the workplace and in housing. About four in ten Black (42%) and AIAN (42%) adults say they have ever been paid less than other people doing the same job compared with a third (33%) of White adults (Figure 2). Black adults are also more likely than White adults to say they have ever been fired, denied a job, or denied a promotion for unfair reasons (27% vs. 20%), and Black and AIAN adults are more likely than White adults to say they have ever been evicted or denied housing (14% and 13% vs. 5%).

Safety, Exposure to Violence, and Police Interactions
Reflecting ongoing residential segregation patterns rooted in historic and contemporary policies, Black, Hispanic, Asian, and AIAN adults say they feel less safe in their homes and neighborhoods compared to White adults. Large majorities of adults across racial and ethnic groups report feeling at least somewhat safe in their neighborhoods. However, Black, Hispanic, Asian, and AIAN adults are less likely than White adults to say they feel “very safe.” Roughly half of each group say they feel very safe in their neighborhood compared to about two-thirds of White adults (Figure 3). Similarly, vast majorities of adults across racial and ethnic groups say they feel at least somewhat safe in their homes, but the shares of Black, Hispanic, and AIAN adults (61% each) and Asian adults (55%) who report feeling very safe in their home are lower than the share of White adults who say this (73%).

Having a strong network of local support is associated with increased feelings of safety. Specifically, adults who say they have “a lot” or a “fair amount” of family members or friends living near them who they can ask for help or support are more likely to say they feel “very safe” in their home or neighborhood than those who have “just a few” or no family members or friends nearby that they can ask for support. For example, among Asian adults, about six in ten (62%) of those with “a lot” or a “fair amount” of family and friends nearby say they feel very safe in their home compared with about half (47%) of those with “just a few” or no close by family and friends available for support (Figure 4). Among adults overall and across most racial and ethnic groups, this relationship between having a local support network and feelings of safety remains significant even after controlling for other demographic characteristics including education, income, gender, LGBT identity, and age.1

While few adults overall say they or a family member have been a victim of violence, the shares are higher among Hispanic, AIAN, Black, and Asian adults as well as those living in urban areas. About one in ten Hispanic (12%), AIAN (11%), Black (9%), and Asian adults (9%) say they or a family member in their household was a victim of an act of violence such as a robbery, carjacking, or shooting in the past year, about twice the share of White adults (5%) who report the same (Figure 5). Among all adults, those living in urban areas are more likely than those who live in suburban and rural communities to say they or a family member have been a victim of violence in the past year, with about one in ten Hispanic (13%), Black (12%), and White (9%) adults living in urban areas reporting this. Among those living in rural communities, however, Black adults are significantly more likely than White adults to say they or someone in their family have been a victim of violence in the past year (9% vs. 2%).

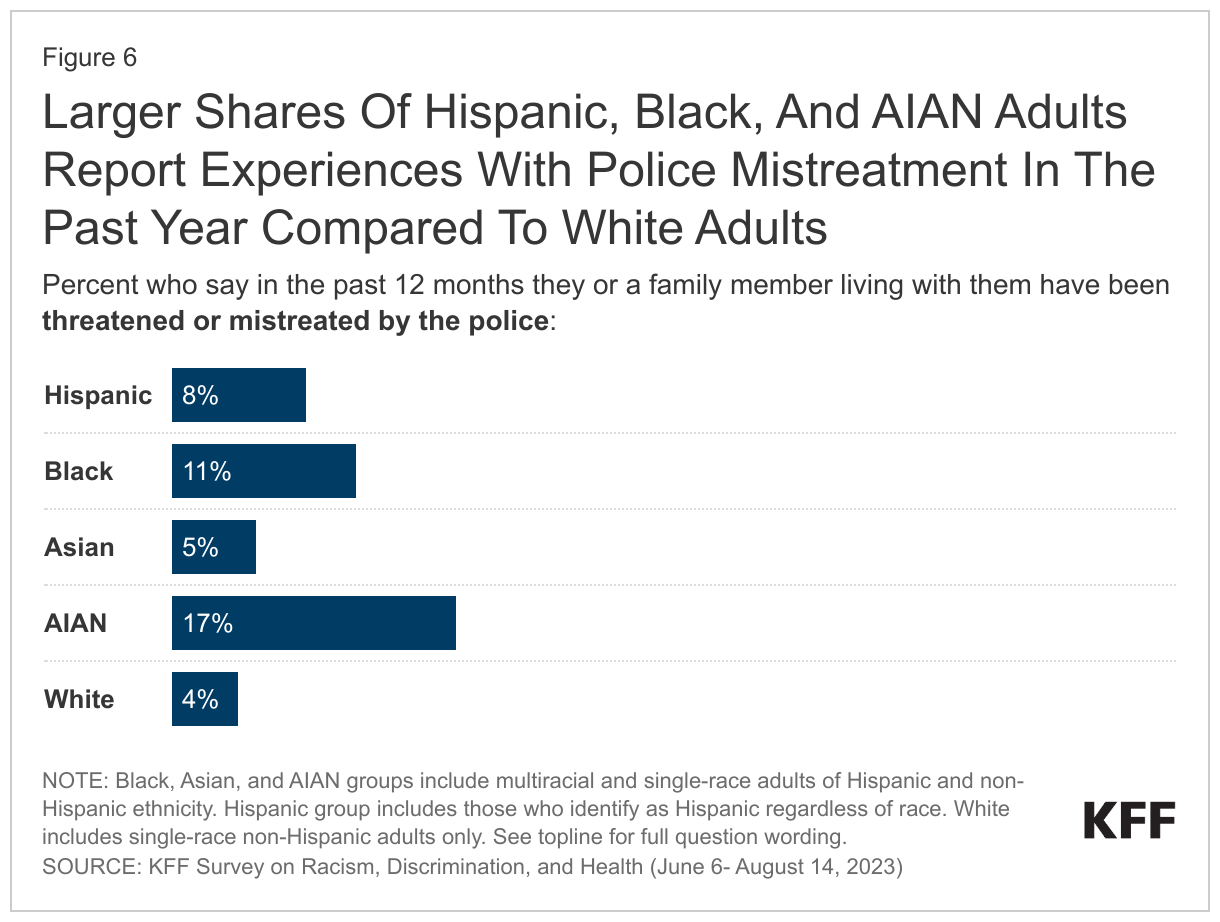
Beyond differences in safety and experiences with violence, Black, AIAN, and Hispanic adults are more likely than White adults to say they or a family member experienced recent mistreatment by the police, particularly Black and Hispanic adults with self-reported darker skin tones. About one in six AIAN adults (17%) and about one in ten Black (11%) and Hispanic (8%) adults say they or a family member living with them have been threatened or mistreated by the police in the past year compared with 4% of White adults (Figure 6). For Black and Hispanic adults, the shares reporting recent police mistreatment are larger among those with self-described darker skin tones compared to those with lighter skin tones. For example, 12% of Black adults with self-described “very dark,” “dark,” or “medium” skin tones say they or a family member living with them have been threatened or mistreated by police compared to 7% of those with lighter skin tones. Similar differences occur among Hispanic adults between those with darker vs. lighter skin tones (10% vs. 5%).
Daily Worries and Concerns
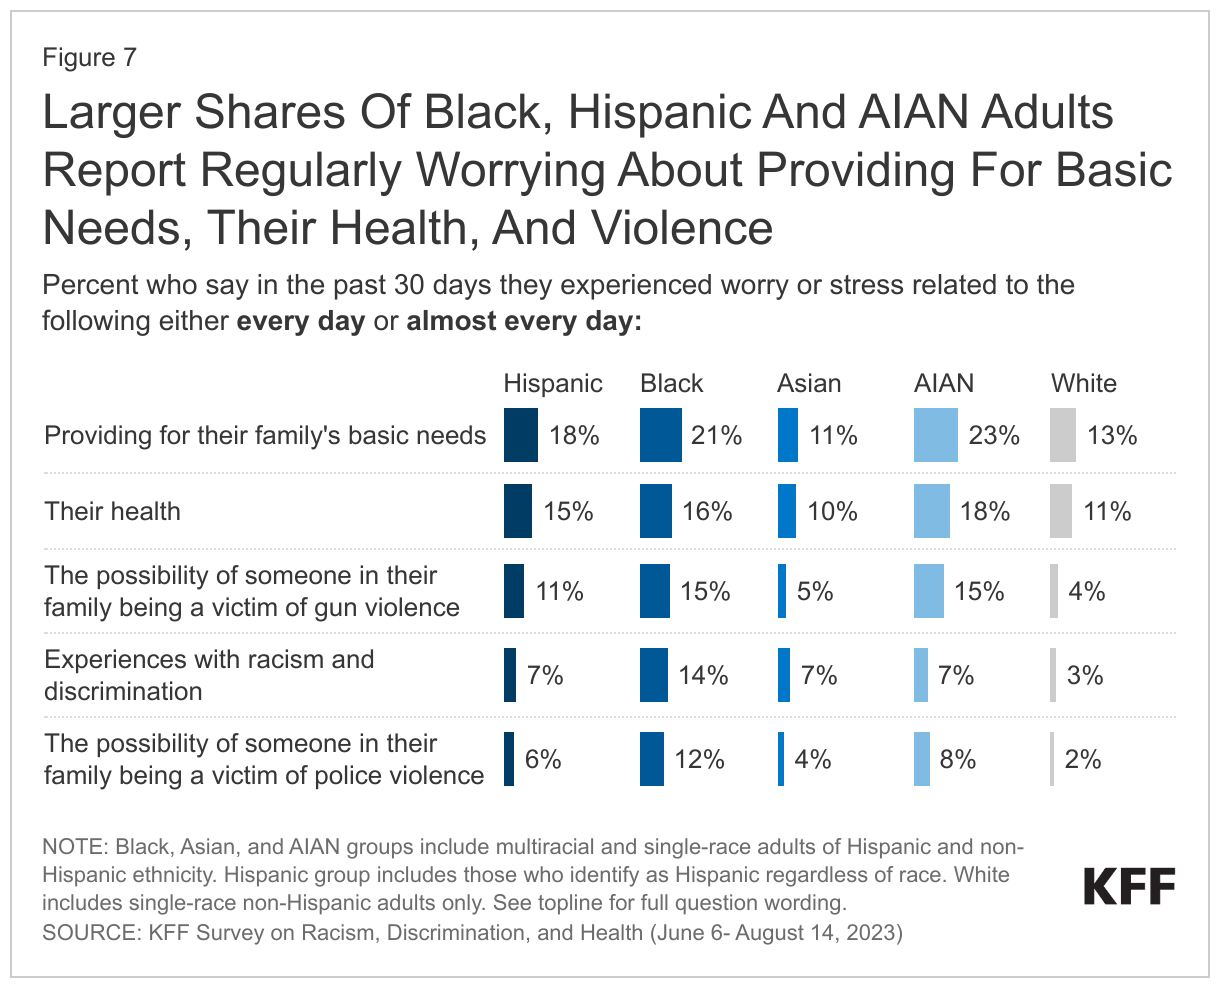
People’s frequent daily worries and concerns reflect these racial and ethnic differences in finances and employment, safety, and police interactions. About one in five AIAN (23%), Black (21%), and Hispanic (18%) adults say that in the past 30 days they experienced worry or stress related to providing for their family’s basic needs either “every day” or “almost every day” compared to fewer White adults (13%) (Figure 7). Similarly, larger shares of AIAN, Black, and Hispanic adults compared to White adults say they experienced daily or near-daily worry about experiences with racism and discrimination and the possibility of someone in their family being a victim of gun or police violence. AIAN, Black, and Hispanic adults are also more likely to say they frequently experienced worry or stress related to their health in the past 30 days compared to their White counterparts. Having a strong local support network, as measured by having at least a “fair amount” of friends and family living nearby who you can ask for help or support, mitigates the frequency of worries and concerns about providing for basic needs and health among adults overall and across most racial and ethnic groups.2
Section 2: Experiences with Discrimination in Daily Life and Their Impacts on Wellbeing and Stress
Black, AIAN, Hispanic, and Asian adults are more likely to report certain experiences with discrimination in daily life compared with their White counterparts, with the greatest frequency reported among Black and AIAN adults. For example, about one-third of Black adults (35%) and about a quarter of AIAN (28%), Hispanic (25%), and Asian adults (25%) say that they received poorer service than other people at restaurants or stores at least a few times in the past year, all higher than the share of White adults who say the same (16%) (Figure 8). Similarly, about four in ten AIAN adults (42%) and one-third (33%) of both Black and Hispanic adults say that people have acted as if they think they are not smart at least a few times in the past year, higher than the one-quarter (26%) of White adults who say so. In addition, Asian (17%) and Black adults (16%) are somewhat more likely than White adults (13%) to say they were threatened or harassed at least a few times in the past year. Further, about one in five Black (21%) and AIAN adults (19%) as well as 13% of Hispanic adults say people acted as if they were afraid of them at least a few times in the past year, compared to 9% of White adults. Among those who completed the survey in a language other than English, one-quarter (24%) say they were criticized for speaking another language in public in the past year, including 28% of Hispanic adults who responded in Spanish. Cumulatively, at least half of AIAN (58%), Black (54%), and Hispanic adults (50%) say they have experienced one of these forms of discrimination at least a few times in the past year, as do four in ten Asian adults (42%). About four in ten (38%) White adults also say they have experienced at least one of these types of discrimination in the past year.3

Black, AIAN, Hispanic, and Asian adults are more likely than White adults to report experiencing more than one of these types of discrimination. Three in ten Black (31%) and AIAN adults (28%) and about one in four Hispanic (26%) and Asian adults (25%) say they experienced at least two of these types of discrimination at least a few times in the past year, all higher than the share of White adults who say so (18%) (Figure 9).

When discrimination in daily life occurs, Black, Hispanic, AIAN, and Asian adults are far more likely than White adults to say their race or ethnicity was a factor in these experiences. Among those who say they experienced at least one form of discrimination measured in the survey, most Black, Hispanic, AIAN, and Asian adults say their race or ethnicity was a major or minor reason they were treated this way, compared to a much smaller share of White adults. Overall, four in ten Black adults (40%) and about three in ten Hispanic (30%), AIAN (30%), and Asian adults (28%) say they experienced at least one of these acts of discrimination in the past year and say their race or ethnicity was at least a minor reason for these experiences. By contrast, only 6% of White adults report this (Figure 10).

Across racial and ethnic groups, reports of experiences with discrimination in daily life are particularly high among younger adults and LGBT adults. There is a strong relationship between age and reports of discrimination in daily life, with a majority of adults ages 18-29 (62%) and about half of 30-49 year-olds (49%) reporting such experiences compared to smaller shares of those ages 50-64 (36%) and 65 and over (22%) (Figure 11). This pattern is consistent across racial and ethnic groups. Similarly, about two-thirds (65%) of LGBT adults say they experienced at least one form of discrimination measured in the survey at least a few times in the past year compared to four in ten non-LGBT adults (40%). Among LGBT adults, there are no differences by race and ethnicity, with about two-thirds of Hispanic (69%), Black (64%), and White (64%) LGBT adults reporting discrimination experiences in the past year.

A somewhat larger share of women compared to men report at least one of these discrimination experiences, but this overall pattern masks some differences in individual measures. For example, a larger share of women compared to men say they were treated as if they were not smart in the past year (33% vs. 23%), while men are more likely than women to say people acted as if they were afraid of them (14% vs. 9%).
The combination of race, ethnicity, and gender also highlights disproportionate discrimination for certain groups. For example, 27% of Black men say people acted afraid of them in the past year, as do 17% of Hispanic men and 17% of Black women. For Hispanic women and White and Asian adults of either gender, these shares are about one in ten. Conversely, the share who say they were treated as if they are not smart is higher among Hispanic women (37%) than Hispanic men (27%). Hispanic women are also more likely than Hispanic men to say they received poorer services than others in stores or restaurants at least a few times in the past year (29% vs. 21%) (Figure 12).

Black adults who self-describe as having darker skin color report more experiences of discrimination in their everyday lives compared to those with lighter skin color. Most Black adults who say their skin color is “very dark” or “dark” (62%) or “medium” (55%) report at least one of these experiences of discrimination, compared with 42% of Black adults who say their skin color is “very light” or “light.” For example, four in ten Black adults who say their skin color is “very dark” or “dark” (42%) say they have received poorer service at restaurants or stores in the past year, compared with about a quarter of those who say their skin color is “very light” or “light” (27%). Black adults with self-reported darker skin color are also more likely to say people acted as if they were afraid of them in the past year compared with those with lighter skin color (25% vs. 18%) (Figure 13).

Among Black adults, those with higher educational attainment report more experiences with discrimination compared to their counterparts with lower educational attainment. Black adults with a four-year college degree are more likely to report experiences of discrimination in their everyday lives compared to those without college education (59% vs. 52% respectively) (Figure 14). Specifically, about four in ten Black adults with a college degree (42%) say they received poorer service at restaurants or stores at least a few times in the past year compared with one-third of Black adults without a college degree (33%). Black adults with a college degree are also more likely to report people acting as if they are afraid of them compared to those without a four-year degree (28% vs. 19%). These findings are consistent with previous research, and may reflect increased exposure to perceived discrimination among those with higher incomes and education levels as well as having greater awareness of racism and therefore greater ability to identify it in different aspects of life.

Relationship Between Discrimination Experiences and Well-being
Racism is an underlying driver of health disparities and repeated and ongoing exposure to perceived experiences of racism and discrimination can increase risks for poor health outcomes. Research has shown that the exposure to racism and discrimination can lead to negative mental health outcomes and certain negative impacts on physical health, including depression, anxiety, and hypertension. Studies also show that perceived discrimination can negatively impact healthy behaviors by increasing smoking and alcohol use and lowering adherence to medical guidance and preventative screenings.
Among all U.S. adults and across racial and ethnic groups, those who report experiences with discrimination in daily life are more likely than others to report adverse effects from worry or stress such as appetite and sleep issues, increased substance use, and worsening of chronic health conditions. Adults who report experiences with at least one type of discrimination in daily life as measured in the survey are more likely than adults who “rarely” or “never” experienced such discrimination to report certain adverse effects of worry or stress. For example, those who experienced discrimination in their everyday lives are more likely than others to say that in the past 30 days worry or stress has led to sleep problems (65% vs. 35%); poor appetite or overeating (52% vs. 20%) frequent headaches or stomachaches (41% vs. 15%); difficulty controlling their temper (34% vs. 11%); worsening of chronic conditions (19% vs. 9%); or an increase in their alcohol or drug use (19% vs. 6%) (Figure 15). Overall, eight in ten (79%) adults who experienced discrimination in the past year say they have had at least one of these adverse effects of worry and stress, compared to about half (47%) of adults who say they rarely or never had these experiences in the past year. These patterns are similar across racial and ethnic groups. While other underlying factors beyond discrimination may contribute to these differences, the relationship between adverse effects of stress and experiences with discrimination remains significant even after controlling for other demographic characteristics including education, income, gender, LGBT identity, and age.4

Adults who report discrimination experiences in daily life are more likely than those who say they rarely or never experience discrimination to report always or often feeling lonely, depressed, or anxious in the past 12 months. Among those with discrimination experiences, four in ten (40%) say they “always” or “often” felt anxious in the past year, compared to 14% of adults who rarely or never experience such discrimination. Those with discrimination experiences in their daily life are more than three times as likely as others to say they always or often felt lonely (26% vs. 7%) or depressed (25% vs. 7%) in the past year (Figure 16). These patterns are similar across racial and ethnic groups and persist even after controlling for other demographic characteristics including education, income, gender and age.5

Section 3: Experiences in Health Care Settings
Reflecting underlying structural inequities in the U.S., there are ongoing racial and ethnic disparities in health and health care. AIAN, Hispanic, and Black people have higher uninsured rates compared to their White counterparts and face other increased barriers to accessing care. Among adults in the survey, Hispanic (20%), AIAN (14%), and Black (10%) adults are more likely to report being uninsured compared to White (6%) adults. However, beyond differences in the ability to access care, the survey highlights differences in experiences within the health care system, including interactions with providers, experiences with unfair treatment, and the consequences of these experiences.
Provider Interactions
Among those who used health care within the past three years, most adults across racial and ethnic groups report having positive and respectful interactions with their health care providers most of the time. Health care that is respectful and responsive to individual preferences, needs, and values is an important component of health care quality and equitable health care. Among those who used health care in the past three years, large shares say that their health care providers explained things in a way they could understand (89%), respected their cultural values and beliefs (84%), involved them in decision-making about their care (81%), and spent enough time with them (76%) most of the time or every time during visits. Across racial and ethnic groups, at least two-thirds say their provider did each of these things at least most of the time.
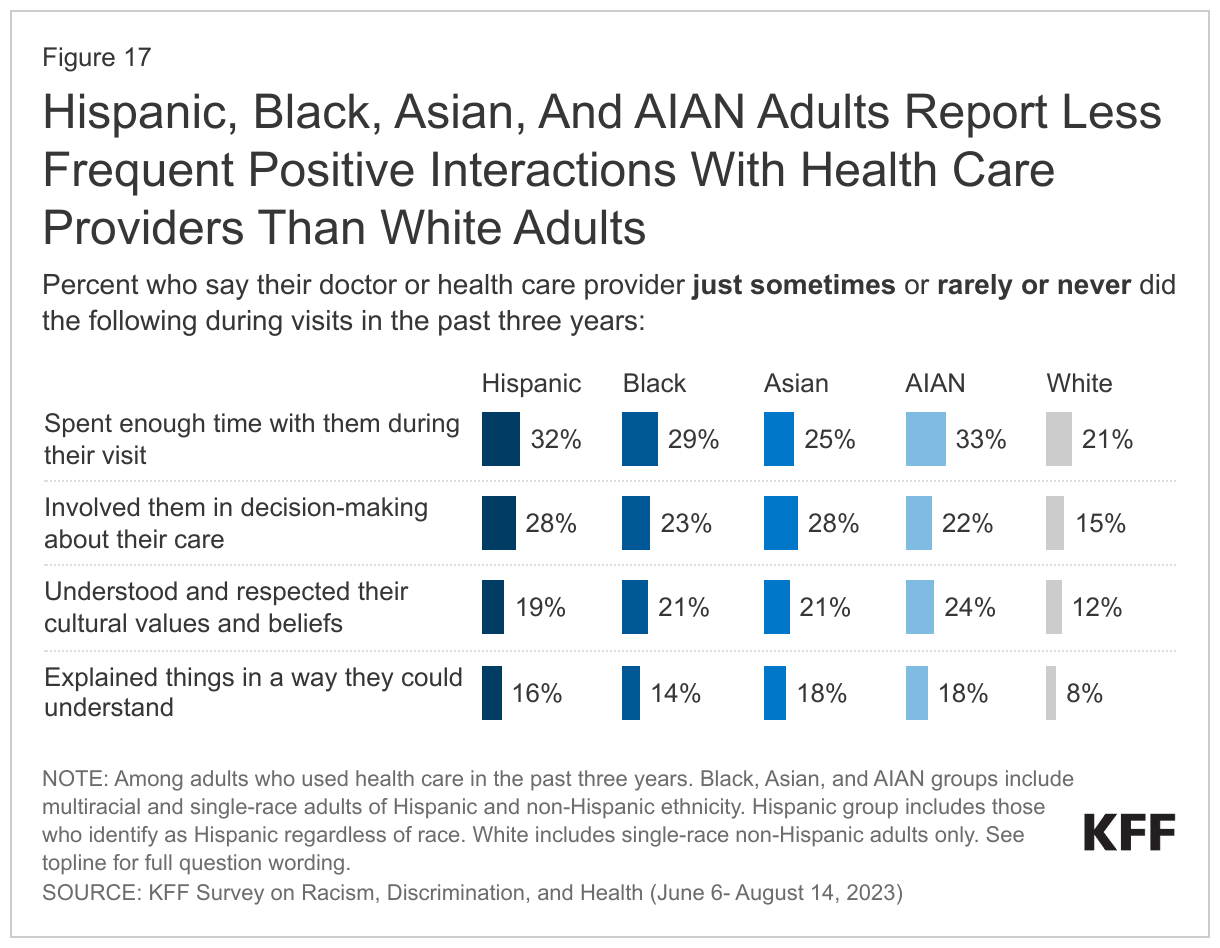
However, Hispanic, Black, Asian, and AIAN adults report having these positive and respectful interactions with health care providers less often than White adults. For example, AIAN (18%), Asian (18%), and Hispanic (16%) adults are about twice as likely as White adults (8%) to say their health care providers explained things in a way they could understand just some of the time, rarely, or never in the past three years (Figure 17). Similarly, about one in four AIAN adults (24%) and about one in five Black (21%), Asian (21%) and Hispanic (19%) adults say their health care providers understood and respected their cultural beliefs just some of the time, rarely, or never compared with about one in ten White adults (12%). These groups also are more likely than their White counterparts to say their providers did not frequently involve them in decision-making about their care during their visits in the past three years. Many of these racial and ethnic differences persist among adults with higher incomes and those with health coverage. Among Hispanic adults there also are some differences by English proficiency. For example, Hispanic adults who have limited English proficiency are about twice as likely as those who are English proficient to say they their providers rarely or never involved them in decision-making about their care in the past three years (16% vs. 9%).
Few adults across racial and ethnic groups say a health care provider frequently asked them about their work, housing situation, or access to food or transportation in the last three years. While health coverage and access to health care shape health, social and economic factors, such as employment, housing, food access, and transportation also play a major role. Research indicates that screening for social and economic risks can positively impact health, and there are growing efforts among some providers focused on serving low-income populations to screen for social risks and needs. However, just over one in four (27%) adults who used health care in the last three years say a health care provider asked about their work, housing situation, or access to food or transportation at least most of the time during visits (Figure 18). Overall, and among Hispanic and Asian adults, lower income adults are more likely than higher income adults to say a provider asked about these factors most of the time or every time, but majorities of lower income adults still say this happens just some of the time, rarely, or never.

Reflecting limited racial and ethnic diversity of the health care workforce, Black, Hispanic, AIAN, and Asian adults are less likely than White adults to say most of their recent health care visits were with a provider who shares their racial and ethnic background. At least half of Black (62%), Hispanic (56%), AIAN (56%) and Asian (53%) adults who used health care in the past three years say that fewer than half of their visits were with a provider who shared their racial and ethnic background (Figure 19). In contrast, about three-quarters (73%) of White adults say that half or more of their visits were with a provider who shares their racial and ethnic background.

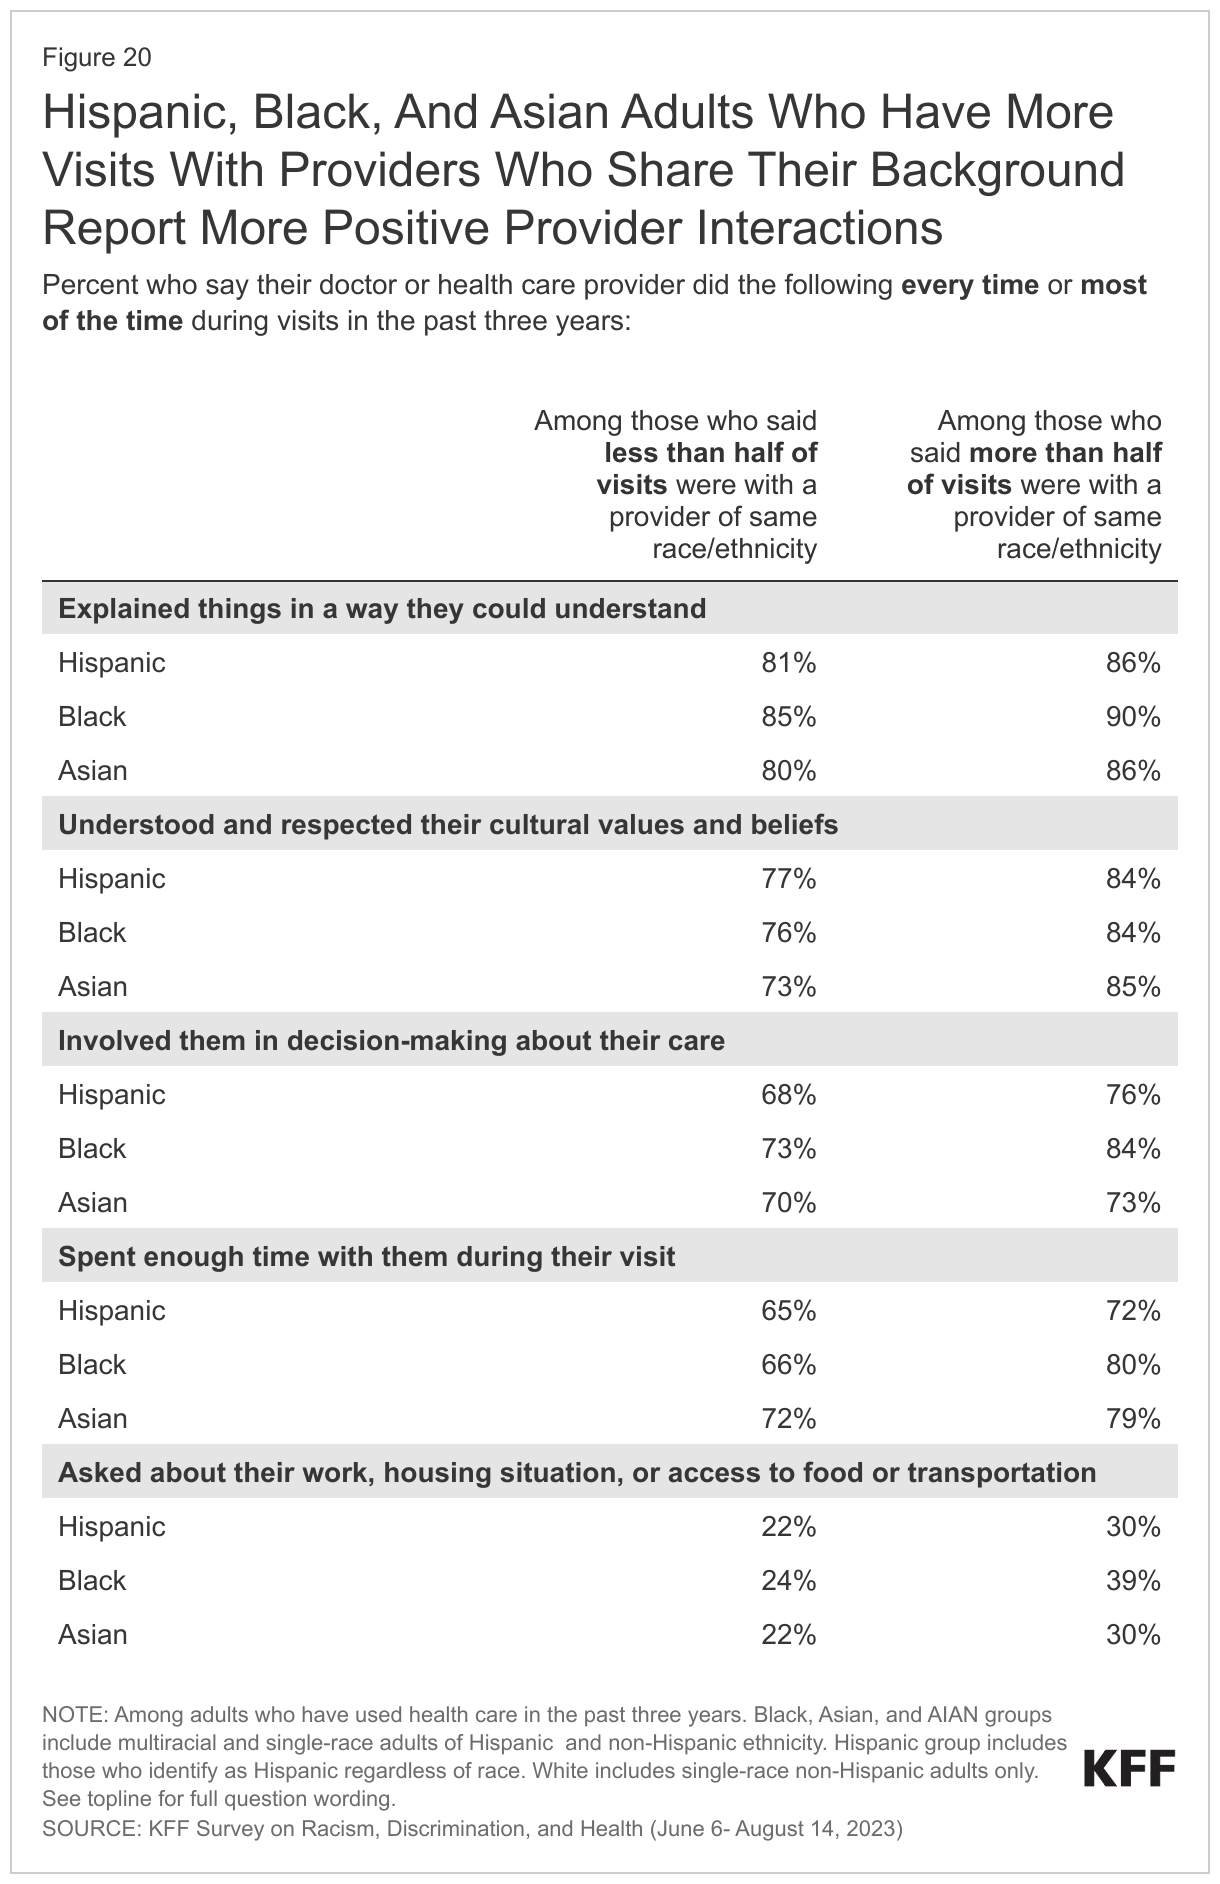
Black, Hispanic and Asian adults who have at least half of their visits with providers who share their racial or ethnic background report having more frequent positive and respectful interactions with providers. For example, among those who used health care in the past three years, Black adults who had at least half of recent visits with a provider who shares their background are more likely than those who have fewer of these visits to say that their doctor explained things in a way they could understand (90% vs. 85%), involved them in decision making about their care (84% vs. 73%), understood or respected their cultural values or beliefs (84% vs. 76%), or asked them about social and economic factors (39% vs. 24%) at least most the time (Figure 20). Patterns are similar for Hispanic adults. Asian adults who had half or more visits with a provider who shared their racial or ethnic background are more likely than those who had fewer such visits to say their provider understood and respected their cultural values and beliefs every time or most of the time.
Despite these differences, few Black, Hispanic, Asian, and AIAN adults say they think they either would or do receive better care from health care providers who share their racial and ethnic background. About a quarter of Black (27%), Hispanic (26%), and Asian adults (24%) and about one in five AIAN adults (19%) say they think they would receive better care from doctors who share their racial or ethnic background, while majorities in each of these groups say they don’t think the race or ethnicity of their provider makes much difference in the quality of care they receive. Other research has shown an association between patients and providers having shared racial and ethnic backgrounds and improved communication but mixed impacts of this patient-provider concordance on patient experiences and health outcomes. However, other recent research suggests racial concordance may contribute to improved health care use and health outcomes including lower emergency department use, reductions in racial disparities in mortality for Black infants, and increased visits for preventative care and treatment.
Experiences with Unfair Treatment by Health Care Providers
About one in five (18%) Black adults and roughly one in ten AIAN (12%), Hispanic (11%), and Asian (10%) adults who received health care in the past three years report being treated unfairly or with disrespect by a health care provider because of their racial or ethnic background. These shares are higher than the 3% of White adults who report this. Among Black adults, women are more likely than men to say they were treated unfairly by a health care provider because of their racial or ethnic background (21% vs. 13%). AIAN (26%) and Black (18%) adults also are more likely than White adults (13%) to say they have been treated unfairly or with disrespect by a health care provider in the past three years due to some other factor, such as their gender, health insurance status, or ability to pay for care (Figure 21). Overall, roughly three in ten (29%) AIAN adults and one in four (24%) Black adults say they were treated unfairly or with disrespect by a health care provider in the past three years for any reason compared with 14% of White adults. Additionally, LGBT adults are about twice as likely as non-LGBT adults to say they experienced unfair treatment by health care provider for any reason in the past three years (33% vs. 15%). Among LGBT adults, similar shares of Black (33%), White (33%), and Hispanic adults (26%) report these experiences.

Reports of unfair treatment by health care providers due to race and ethnicity persist among Black, Hispanic, and Asian adults with higher incomes, who have health coverage, or who have a usual source of care. Overall and among Hispanic adults, those with lower incomes are more likely than those with higher incomes to report unfair or disrespectful treatment by a provider in the past three years. However, even among those with higher incomes (annual household incomes of $90,000 or more), 15% of Black adults report being treated unfairly or with disrespect by a health care provider because of their race or ethnic background, as do higher shares of Asian (8%) and Hispanic (5%) adults compared with White adults (1%) (Figure 22). Among adults with health coverage, 18% of Black adults and one in ten Asian (11%) and Hispanic (10%) adults say they have been treated unfairly by a health care provider in the past three years because of their race or ethnicity compared with 3% of White adults. Similarly, among adults with a usual source of care, one in five Black adults (18%) and about one in ten Hispanic (9%), and Asian (9%) adults report being treated unfairly or with disrespect by a health care provider due to their race or ethnic background compared with just 3% of White adults.

In Their Own Words: Descriptions of Being Treated Unfairly or Disrespectfully by Health Care Providers
In open-ended responses describing instances of unfair treatment, individuals describe experiences such as not being taken seriously or not being believed about pain, rude or harassing behavior, assumptions being made about them, and being blamed for health conditions or problems they were experiencing:
“I went to the hospital with a 104 temperature and a UTI. While I understand the nurses and doctors wanted to run all tests possible, I was given more than three tests to check for STDs. I have had UTIs before and expressed that STDs were not a concern (due to sexual inactivity), and each nurse told me that ‘typically, people from my background have unprotected sex, so it is the hospitals policy to check us multiple times (even if the test results come back negative)’” – 30-year-old multiracial (Black and White) woman from Tennessee
“I am overweight and Latino with a doctorate degree. Most times when the nurse staff does intake, they often assume I work an hourly job and are surprised I am a professor. I often have to dress up for appointments or wear my university's logo to signal where I work. I often notice I am listened to more and involved in care decisions when I do this change.” – 30-year-old Hispanic man from Illinois
“After having surgeries within a year of each other, I had questions about aftercare and issues that I was experiencing but the doctors did not take my concerns seriously and shunned me off. Unfortunately, both times there were serious complications that resulted in further health issues and irreparable health conditions.” – 63-year-old Black woman from Mississippi
“White male doctors tend to give me the worst care. I once saw a doctor about breathing issues, and he told me I was probably just thinking too hard about breathing which was probably causing the issues. Turns out I have asthma.” – 44-year-old Asian woman from California
“After having a c-section nurse would not listen to my complaints about the pain that I was experiencing. My White husband had to explain that I was worried it might have to do with the preeclampsia that I had.” – 35-year-old Black woman from Florida
“The doctor scolded me for not maintaining healthy lifestyle just by looking at my diabetes counts and not trying to understand my situation where I was between jobs and insurance, so wasn't not able to take medications on time which caused the fluctuations that caused the counts in my blood sugar levels.” – 41-year-old Asian man from California
Reflecting these experiences with unfair treatment, large shares of Black, AIAN, Hispanic and Asian adults say that they prepare for possible insults from a provider or staff or feel they need to be very careful about their appearance to be treated fairly during health care visits. Vigilant behaviors, such as preparing for insults or considering one’s appearance, are sometimes adopted by people who experience discrimination as a means of protection from the threat of possible discrimination and to reduce exposure. Research has shown that heightened vigilance is associated with poor physical and mental health outcomes, including hypertension, sleep difficulties, and depression. Over half (55%) of Black adults, about half of AIAN (49%) and Hispanic (47%) adults, and about four in ten (39%) Asian adults say they feel they must be very careful about their appearance at least some of the time to be treated fairly when receiving health care (Figure 23), including one in five (21%) Black adults who say they feel they have to be careful “every time.” Each of these groups is more likely than White adults to report being vigilant about their appearance during health care visits at least some of the time, although notably about three in ten (29%) White adults say they take these actions. About three in ten (29%) Black adults and roughly a quarter of AIAN (26%) and Hispanic (23%) adults say they try to prepare for possible insults during health care visits, all higher than the share of White adults who say this (16%). About one in five Asian adults (19%) also report preparing for insults. Together, six in ten (60%) Black adults, about half of AIAN (52%) and Hispanic (51%) adults, and about four in ten (42%) Asian adults say they engage in at least one of these practices at least some of the time during health care visits compared with one in three (33%) White adults. These shares are also particularly high among LGBT adults across racial and ethnic groups, with at least six in ten Black (63%), Hispanic (61%), and White (60%), LGBT adults saying they take either of these steps.

Among higher income adults and those with health coverage, Black, Hispanic, and Asian adults remain more likely than White adults to say they prepare for insults during health care visits or feel they need to be very careful about their appearance to be treated fairly at least some of the time. While higher income adults generally are less likely than those with lower incomes to say they take these steps, among those with higher incomes ($90,000 or more annually), about half of Black adults (51%) and about four in ten Hispanic (41%) and Asian (38%) adults say they take either of these steps at least some of the time during health care visits, higher than the share of White adults (22%) who say this. Similarly, among adults with coverage, Black (59%), Hispanic (51%), and Asian (42%) adults are more likely than their White (34%) counterparts to say they take either of these steps at least some of the time, including 47% of insured Black adults who say they feel they have to be very careful about their appearance (Figure 24).

Negative Experiences When Receiving Health Care
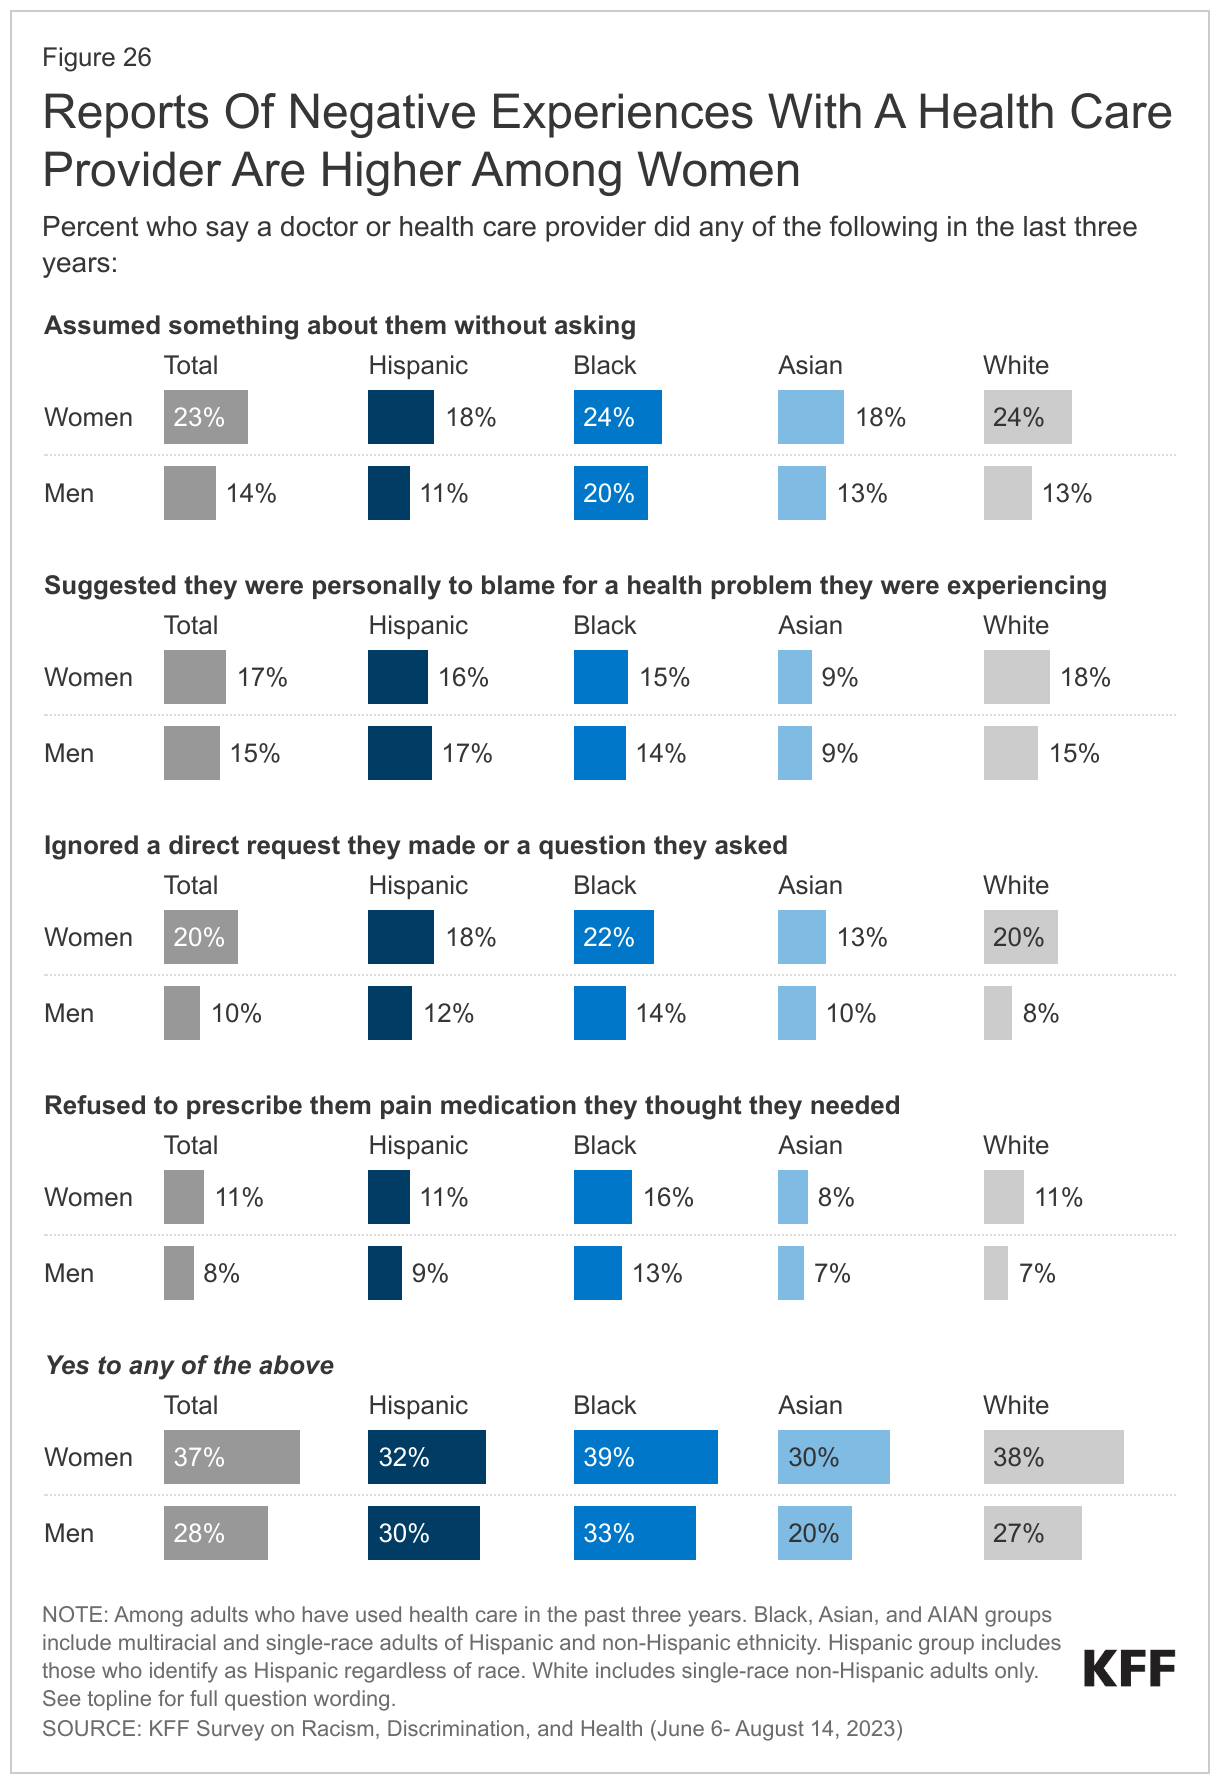
A third of adults who received health care in the past three years report at least one of several negative experiences with a health care provider, including a provider assuming something about them without asking, suggesting they were personally to blame for a health problem, ignoring a direct request or question, or refusing to prescribe pain medication they thought they needed. While many of these negative experiences are shared across racial and ethnic groups, including White adults, AIAN adults are more likely than their White counterparts to say a provider assumed something without asking (29% vs. 19%), ignored a direct request or question (29% vs. 15%), and refused to prescribe pain medication they thought they needed (19% vs. 9%) (Figure 25). In addition, Black adults are more likely than White adults to say a provider ignored a direct request or question (19% vs. 15%) or refused them pain medication they thought they needed (15% vs. 9%). These differences persist among Black adults with health coverage but are not significant after controlling for income.
AIAN, Black, Hispanic, and Asian adults are more likely than White adults to say they had at least one of these negative experiences with a health care provider due to their race and ethnicity. Among adults who received health care in the past three years, about a quarter (24%) of Black adults and one in five (19%) AIAN adults say they experienced at least one of these negative experiences and that their race or ethnicity was a major or minor reason why they were treated this way, as do 15% of Hispanic and 11% of Asian adults. Just 4% of White adults who received care report a negative experience due to their race or ethnicity.

White and Asian women are more likely than their male counterparts to report at least one of these negative experiences with health care providers, but there are no significant differences between Hispanic and Black women and men. Among adults overall, the largest differences by gender include women being more likely than men to say a provider assumed something without asking and a provider ignoring a direct request or question (Figure 26). Additionally, 22% of Black adults who were pregnant or gave birth in the past ten years say they were refused pain medication they thought they needed, roughly twice the share of White adults with a pregnancy or birth experience (10%).
Among adults with limited English proficiency, about half (48%) say that difficulty speaking or reading English made it difficult to complete at least one of several activities related to using health care in the past three years. These activities include filling out forms at a doctor’s office (34%), communicating with staff at a doctor’s office (33%), understanding instructions from a health care provider (30%), filling a prescription or knowing how to use it (27%), or scheduling a medical appointment (25%).
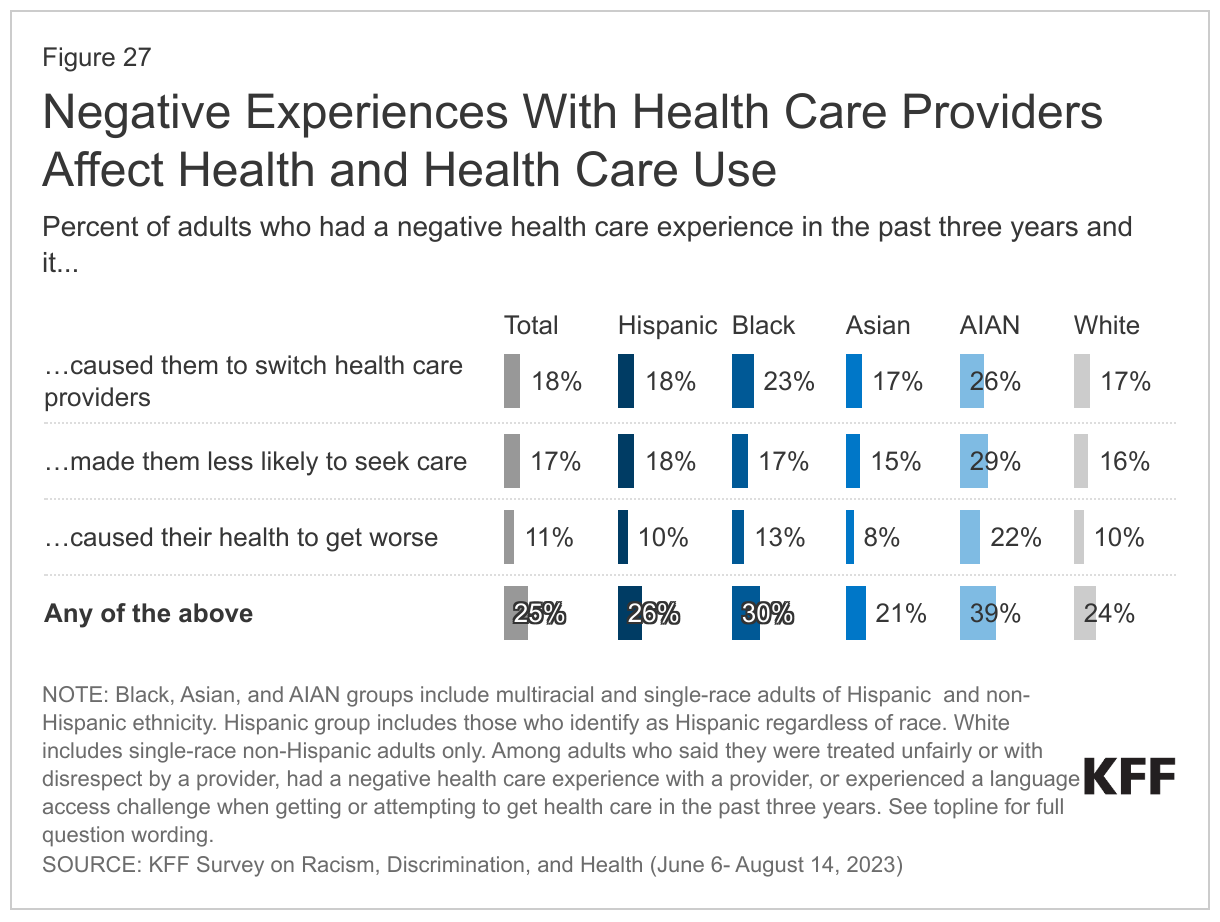
One in four adults who used health care in the past three years report that they had one or more of these negative experiences with a health care provider and/or a language access challenge and that it resulted in worse health, them being less likely to seek care, and/or them switching providers. About four in ten (39%) AIAN adults and three in ten (30%) Black adults say they had a negative experience with one of these consequences compared with about one in four (24%) White adults (Figure 27). The shares of Hispanic and Asian adults reporting a negative experience with at least one of these consequences are similar to that of White adults.
Implications
The survey reveals that, in wake of the initial COVID-19 pandemic and amid ongoing economic challenges and political division within the U.S., people’s experiences in their everyday lives and in health care settings often vary starkly by race and ethnicity, highlighting the ongoing impacts of racism and discrimination within the health care system and more broadly. The survey shows that many challenges are shared across all adults, including White adults, but that Hispanic, Black, Asian, and AIAN adults face disproportionate challenges and higher rates of unfair treatment due to their race and ethnicity, which have implications for health and well-being. The survey data identify areas for increased attention, resources, and initiatives to address these challenges and disparities, such as mechanisms to improve social and economic circumstances and provide safer communities as well as to address ongoing bias and discrimination, particularly in health care. The survey results also highlight factors that mitigate some of these challenges, including having strong local support networks and more health care visits with providers who have a shared racial and ethnic background. They also illustrate opportunities to increase respectful and positive provider interactions that can support high-quality and culturally competent care. Addressing the challenges identified in the survey is important not only from an equity standpoint but also for improving the nation’s overall health and economic prosperity.
Methodology
The Survey on Racism, Discrimination, and Health was designed and analyzed by researchers at KFF. The survey was conducted June 6 – August 14, 2023, online and by telephone among a nationally representative sample of 6,292 U.S. adults in English (5,706), Spanish (520), Chinese (37), Korean (16), and Vietnamese (13).
The sample includes 5,073 adults who were reached through an address-based sample (ABS) and completed the survey online (4,529) or over the phone (544). An additional 1,219 adults were reached through a random digit dial telephone (RDD) sample of prepaid (pay-as-you-go) cell phone numbers. Marketing Systems Groups (MSG) provided both the ABS and RDD sample. All fieldwork was managed by SSRS of Glen Mills, PA; sampling design and weighting was done in collaboration with KFF.
Sampling strategy:
The project was designed to reach a large sample of Black adults, Hispanic adults, and Asian adults. To accomplish this, the sampling strategy included increased efforts to reach geographic areas with larger shares of the population having less than a college education and larger shares of households with a Hispanic, Black, and/or Asian resident within the ABS sample, and geographic areas with larger shares of Hispanic and non-Hispanic Black adults within the RDD sample.
The ABS was divided into areas (strata) based on the share of households with a Hispanic, Black, and/or Asian resident, as well as the share of the population with a college degree within each Census block group. To increase the likelihood of reaching the populations of interest, strata with higher incidence of Hispanic, Black, and Asian households, and with lower educational attainment, were oversampled in the ABS design. The RDD sample of prepaid (pay-as-you-go) cell phone numbers was disproportionately stratified to reach Hispanic and non-Hispanic Black respondents based on incidence of these populations at the county level.
Incentives:
Respondents received a $10 incentive for their participation, with interviews completed by phone receiving a mailed check and web respondents receiving a $10 electronic gift card incentive to their choice of six companies, a Visa gift card, or a CharityChoice donation.
Community and expert input:
Input from organizations and individuals that directly serve or have expertise in issues facing historically underserved or marginalized populations helped shape the questionnaire and reporting. These community representatives were offered a modest honorarium for their time and effort to provide input, attend meetings, and offer their expertise on dissemination of findings.
Translation:
After the content of the questionnaire was largely finalized, SSRS conducted a telephone pretest in English and adjustments were made to the questionnaire. Following the English pretest, Cetra Language Solutions translated the survey instrument from English into the four languages outlined above and checked the CATI and web programming to ensure translations were properly overlayed. Additionally, phone interviewing supervisors fluent in each language reviewed the final programmed survey to ensure all translations were accurate and reflected the same meaning as the English version of the survey.
Data quality check:
A series of data quality checks were run on the final data. The online questionnaire included two questions designed to establish that respondents were paying attention and cases were monitored for data quality including item non-response, mean length, and straight lining. Cases were removed from the data if they failed two or more of these quality checks. Based on this criterion, 4 cases were removed.
Weighting:
The combined cell phone and ABS samples were weighted to match the sample’s demographics to the national U.S. adult population using data from the Census Bureau’s 2021 Current Population Survey (CPS). The combined sample was divided into five groups based on race or ethnicity (White alone, non-Hispanic; Hispanic; Black alone, non-Hispanic; Asian alone, non-Hispanic; and other race or multi-racial, non-Hispanic) and each group was weighted separately. Within each group, the weighting parameters included sex, age, education, nativity, citizenship, census region, urbanicity, and household tenure. For the Hispanic and Asian groups, English language proficiency and country of origin were also included in the weighting adjustment. The general population weight combines the five groups and weights them proportionally to their population size.
A separate weight was created for the American Indian and Alaska Native (AIAN) sample using data from the Census Bureau’s 2022 American Community Survey (ACS). The weighting parameters for this group included sex, education, race and ethnicity, region, nativity, and citizenship. For more information on the AIAN sample including some limitations, adjustments made to make the sample more representative, and considerations for data interpretation, see Appendix 2.
All weights also take into account differences in the probability of selection for each sample type (ABS and prepaid cell phone). This includes adjustment for the sample design and geographic stratification of the samples, and within household probability of selection.
The margin of sampling error including the design effect for the full sample is plus or minus 2 percentage points. Numbers of respondents and margins of sampling error for key subgroups are shown in the table below. Appendix 1 provides more detail on how race and ethnicity was measured in this survey and the coding of the analysis groups. For results based on other subgroups, the margin of sampling error may be higher. All tests of statistical significance account for the design effect due to weighting. Dependent t-tests were used to test for statistical significance across the overlapping groups.
Sample sizes and margins of sampling error for other subgroups are available by request. Sampling error is only one of many potential sources of error and there may be other unmeasured error in this or any other public opinion poll. KFF public opinion and survey research is a charter member of the Transparency Initiative of the American Association for Public Opinion Research.
| Group | N (unweighted) | M.O.S.E. |
| Total | 6,292 | ± 2 percentage points |
| Race/Ethnicity | ||
| White, non-Hispanic (alone) | 1,725 | ± 3 percentage points |
| Black (alone or in combination) | 1,991 | ± 3 percentage points |
| Hispanic | 1,775 | ± 3 percentage points |
| Asian (alone or in combination) | 693 | ± 5 percentage points |
| American Indian and Alaska Native (alone or in combination) | 267 | ± 8 percentage points |
Appendix
Appendix 1
Racial and ethnic groups included in this report are defined using a two-question format. The initial question asks respondents if they are of Latino or Hispanic origin or descent. The second question asks respondents to select as many racial identity groups as apply from a list that includes eight response options: White, Black or African-American, Asian, American Indian, Alaska Native, Native Hawaiian, Pacific Islander, and “some other race” (with a text box for respondents to provide details). The wording for these questions is similar to the standard two-question measure used by the U.S. Census Bureau, other government organizations, and some survey research organizations. Using the two-question format and “select all that apply” for racial identity allows respondents to self-identify into multiple categories that better reflect their racial and/or ethnic identity or identities.
The table below provides some breakdown on the racial and ethnic identities for the Hispanic, Black, Asian, and American Indian and Alaska Native (AIAN) groups. It includes both the unweighted number of interviews and the weighted proportion within each group, including the share who selected only one race (single race), the share who selected more than one race (multiracial), and the share who selected Hispanic ethnicity within each of these groups. About nine in ten Hispanic adults identify as Hispanic and a single race, and at least eight in ten Black and Asian adults identify as a single race and non-Hispanic. By contrast, most AIAN adults identify as multiracial and about one-third identify as Hispanic.

Appendix 2: Reporting on the Experiences of American Indian and Alaska Native Adults
Sample and Population Represented: The KFF Survey on Racism, Discrimination, and Health was designed to include large samples of adults identifying as Black or African American, Latino or Hispanic, and Asian, with the goal of reporting results specifically for these populations. More details on the sampling strategy are available in the project Methodology.
In addition to these planned larger samples, the sample design also yielded 267 interviews with individuals identifying as American Indian (n=263) and/or Alaska Native (n=6). The American Indian and Alaska Native (AIAN) sample includes individuals who identified AIAN as their only racial identity as well as those who selected AIAN and at least one other race, as well as those who identified as having Hispanic and non-Hispanic ethnicity (see Appendix 1 for more details on how racial and ethnic groups were categorized in this analysis).
Limitations and Data Quality Considerations: Given ongoing concerns about data erasure and invisibility of smaller populations, including Indigenous people, KFF has decided to include results for the AIAN population in this report despite some limitations. The following describes the limitations of the sample, adjustments made to make the sample more representative, and considerations for data interpretation.
Because the survey was not explicitly designed to include a representative sample of AIAN people, the research falls short of some recommended best practices for surveying this population. These include advance outreach to Tribal organizations, face-to-face interviews for some groups, and geographic oversampling of federally recognized Indian reservations and other Tribal lands. The small size of the AIAN sample also does not allow for reporting on more detailed groups (such as within the AIAN population by age, geography, and other demographics).
To increase representativeness of the results, the AIAN sample was weighted to the most current demographic data available for this population: the U.S. Census Bureau’s 2022 American Community Survey (ACS). The weighting parameters include education, age by gender, region, nativity (U.S.-born vs. foreign-born), race and ethnicity, and U.S. citizenship.
Researchers also took other steps to assess the representativeness of the AIAN sample. While Tribal lands were not explicitly included in the sampling strategy, the sample was analyzed to assess whether individuals living on federally recognized Indian reservations and other Tribal lands could have responded to the survey using the Census tracts and zip codes of survey respondents. Overall, 19% of respondents in the AIAN sample live in geographic areas where Tribal lands are located, including 25% of those who identify as AIAN alone. In addition, researchers compared this AIAN sample to other federally available data across a series of benchmarks not included in the weighting such as insurance status, insurance type, income, and the use of English in the household.
Despite these efforts, we suggest using caution when interpreting the results of the AIAN sample in the report. The data included may not be reflective of the entirety of experiences of the AIAN adult population. It may particularly fall short of capturing the experiences of those living on federally recognized Indian reservations and other Tribal lands. In addition, the Census data used for weighting is imperfect and may overrepresent the experiences of multiracial AIAN individuals, which may lead to a similar imbalance in the survey results.
KFF is committed to improving our future efforts and working to more fully represent and reflect the diversity of experiences among Indigenous people in our survey and other work.
Endnotes
- To examine the relationship between variables of interest throughout the report, a series of logistic regression models were conducted to test whether these relationships hold after controlling for demographics. The demographic variables used across models include educational attainment, income, age, gender, LGBT identity, and region. Race and ethnicity were also included as control variables in the overall model. To test the same relationships within racial and ethnic groups, separate logistic regressions were conducted among Hispanic adults, Black adults, Asian adults, and White adults, controlling for the same demographics listed. ↩︎
- Based on regression analysis as described above. ↩︎
- The survey questionnaire was designed by KFF researchers, drawing on previous research. Several items measuring discrimination in everyday life were informed by the Everyday Discrimination Scale. For more information see: https://scholar.harvard.edu/davidrwilliams/node/32397 ↩︎
- Based on regression analysis as described above. ↩︎
- Based on regression analysis as described above. ↩︎
