2012 Employer Health Benefits Survey
Section 6: Worker and Employer Contributions for Premiums
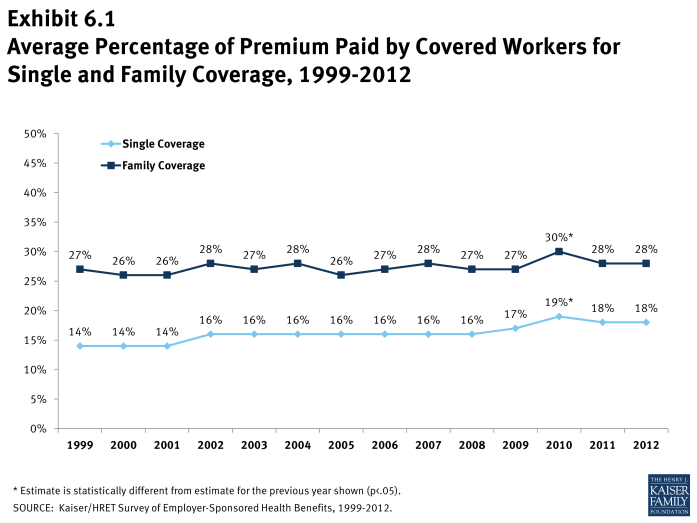
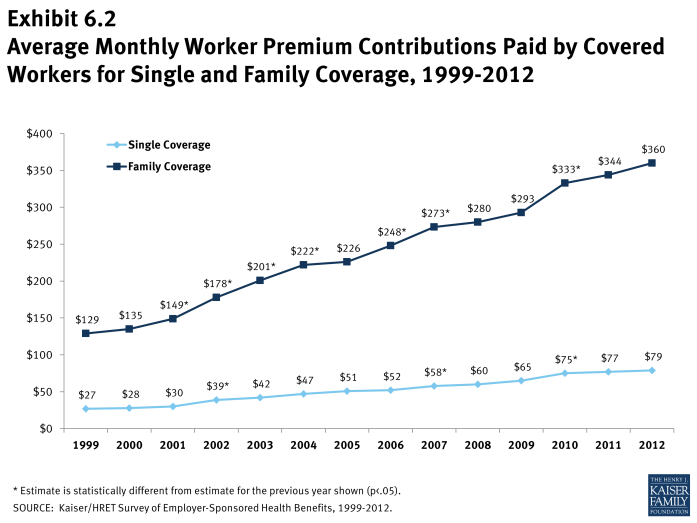
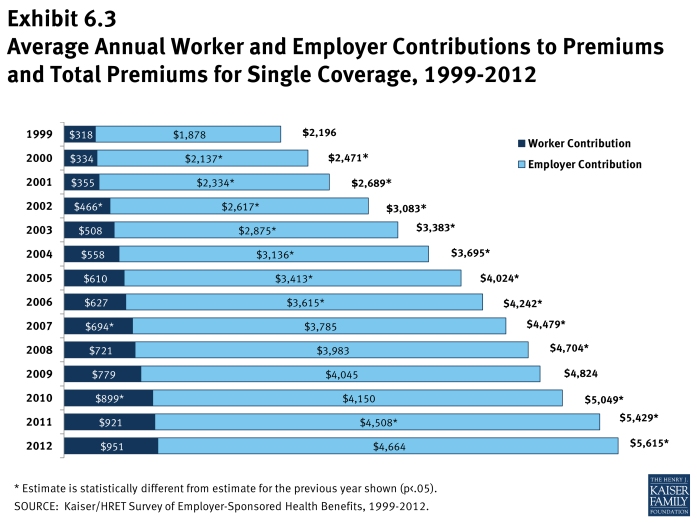
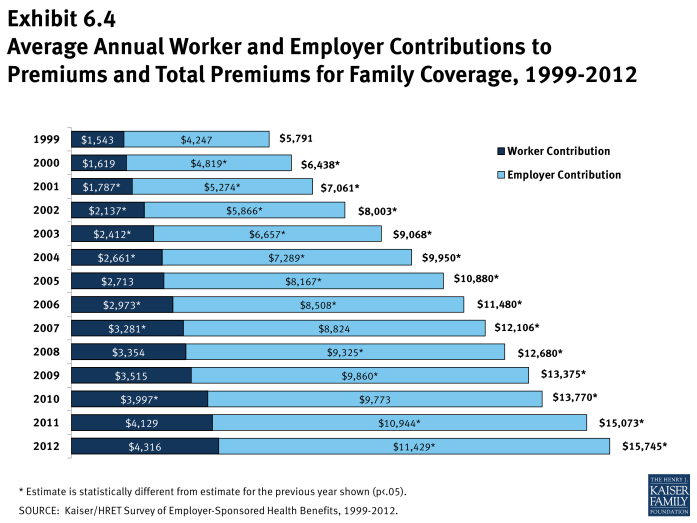
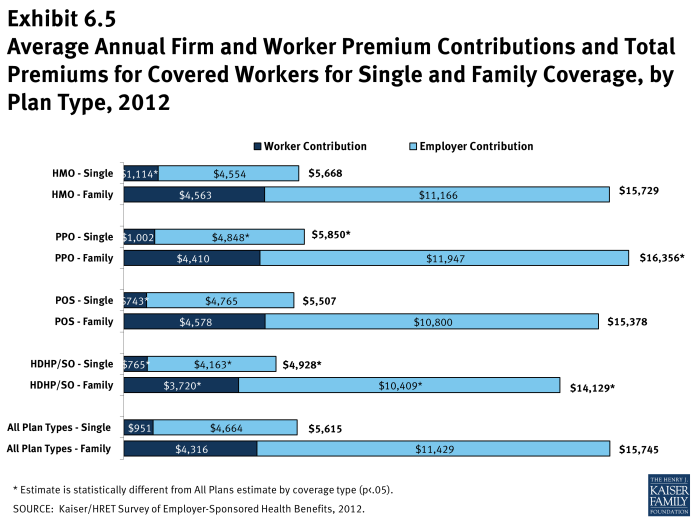
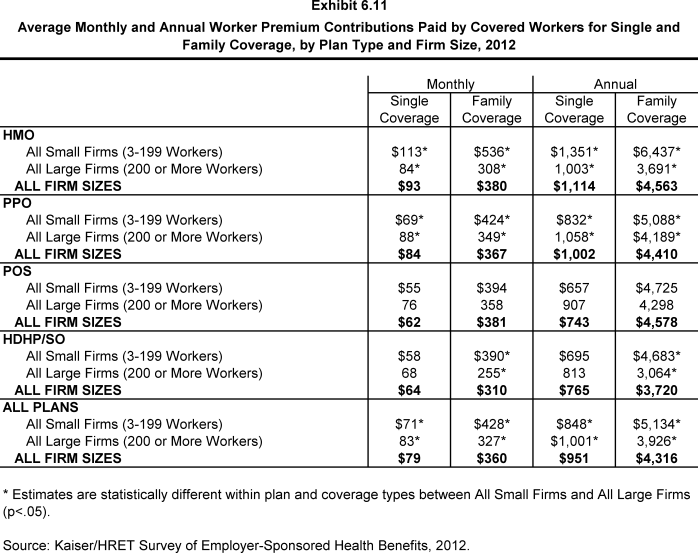
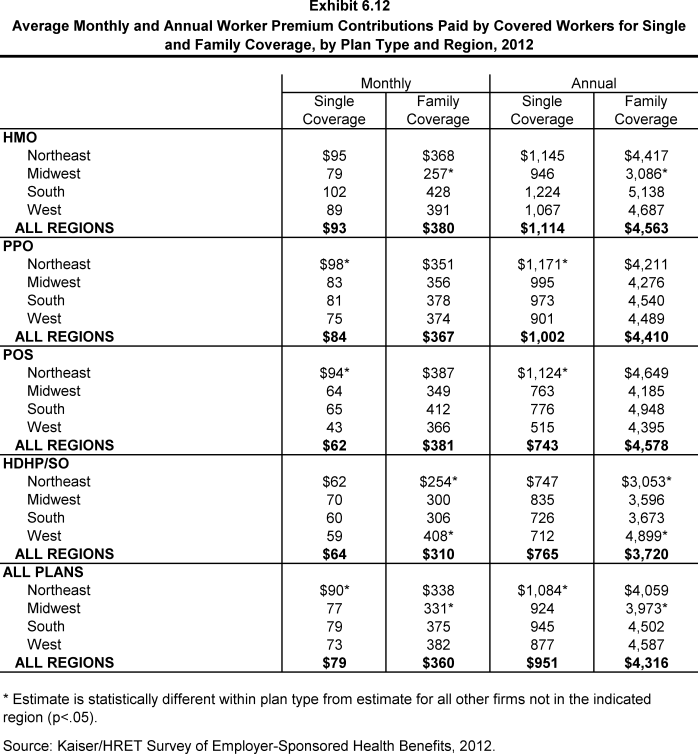
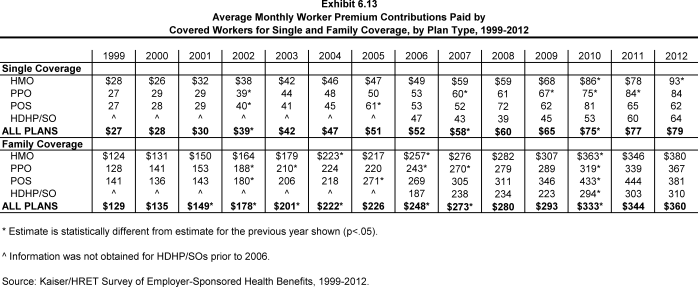
Premium contributions by covered workers average 18% for single coverage and 28% for family coverage. 1 The average monthly worker contributions are $79 for single coverage ($951 annually) and $360 for family coverage ($4,316 annually). These percentage and dollar values are similar to the values reported in 2011.
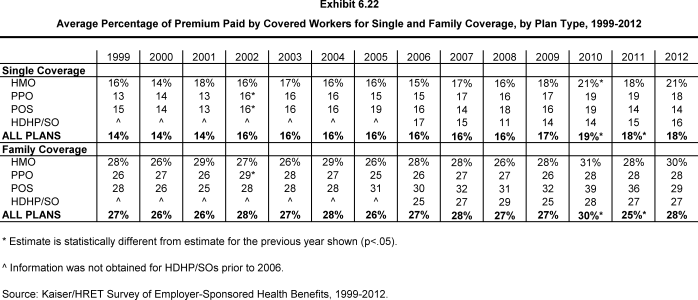
- In 2012, covered workers on average contribute 18% of the premium for single coverage and 28% of the premium for family coverage, the same contribution percentages reported for 2011 (Exhibit 6.1).
- On average, workers with single coverage contribute $79 per month ($951 annually), and workers with family coverage contribute $360 per month ($4,316 annually), towards their health insurance premiums, similar to the amounts reported in 2011 (Exhibit 6.2), (Exhibit 6.3), and (Exhibit 6.4).
- Worker contributions in HDHP/SOs are lower than the overall average worker contributions for both single and family coverage ($765 and $3,720) (Exhibit 6.5).
- Worker contributions in POS plans are lower for single coverage ($743) compared to the overall average worker contribution for single coverage. Worker contributions in HMO plans are higher for single coverage ($1,114) than the overall average worker contribution amounts (Exhibit 6.5).
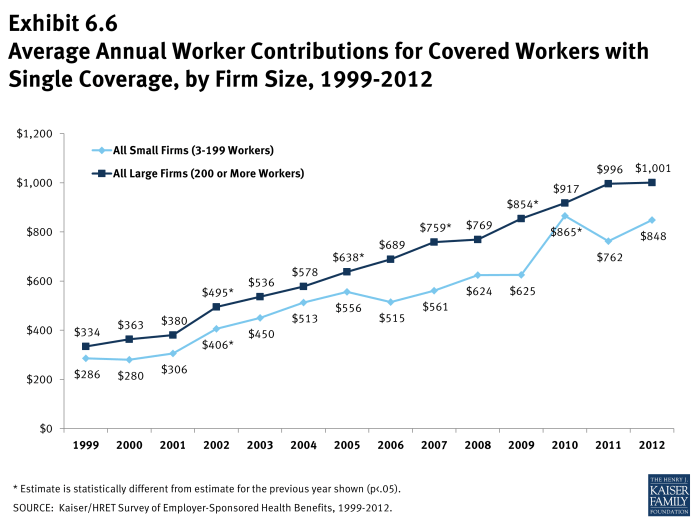
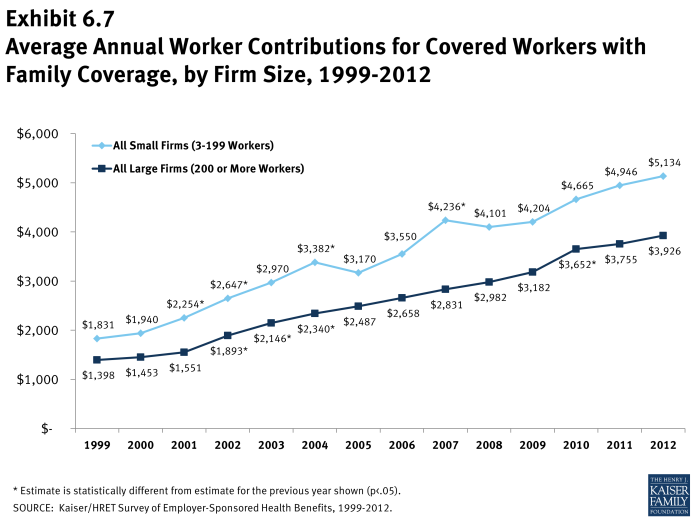
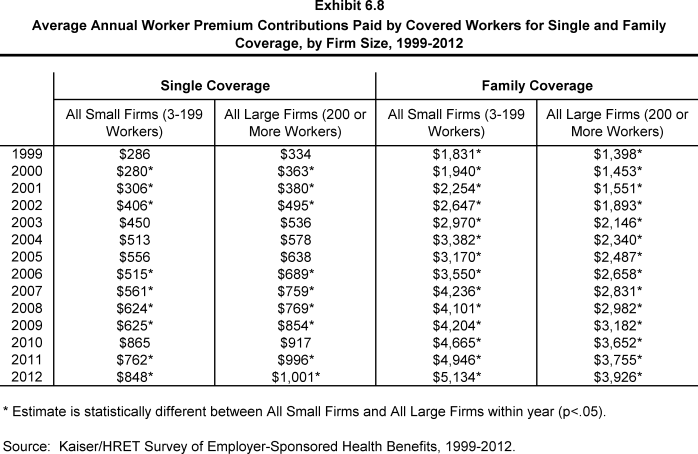
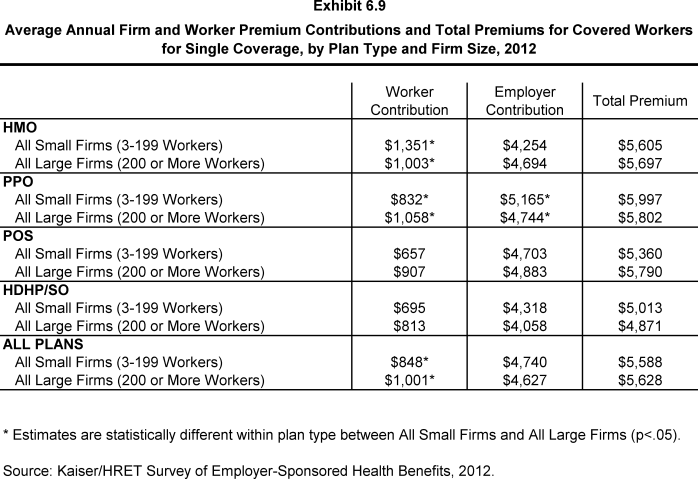
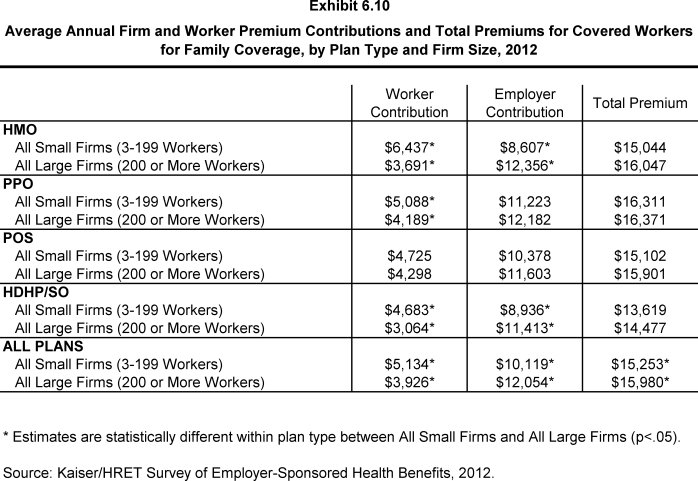
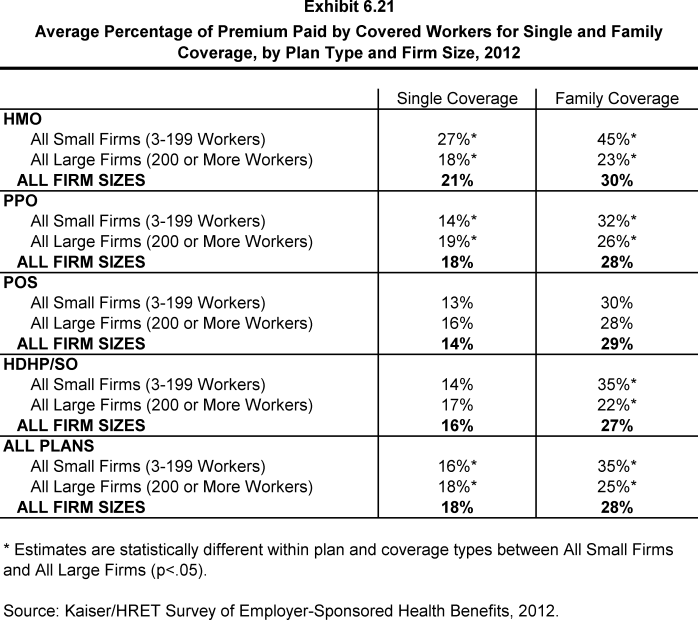
- Workers in small firms (3-199 workers) contribute a lower amount annually for single coverage than workers in large firms (200 or more workers), $848 vs. $1,001. In contrast, workers in small firms with family coverage contribute significantly more annually than workers with family coverage in large firms, ($5,134 vs. $3,926) (Exhibit 6.8).
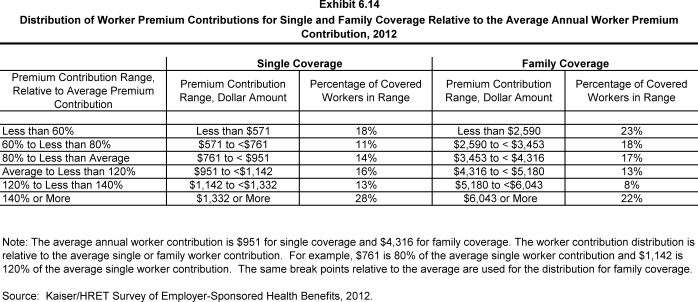
- There is a great deal of variation in worker contributions to premiums.
- Twenty-eight percent of covered workers contribute $1,332 or more annually (140% or more of the average worker contribution) for single coverage, while 18% of covered workers have an annual worker contribution of less than $571 less than (60% of the average worker contribution) (Exhibit 6.14).
- For family coverage, 22% of covered workers contribute $6,043 or more annually (140% or more of the average worker contribution), while 23% of covered workers have an annual worker contribution of less than $2,590 (less than 60% of the average worker contribution) (Exhibit 6.14).
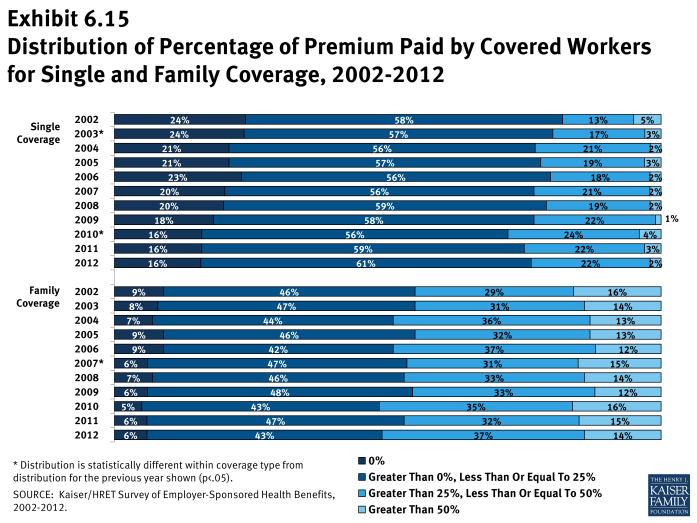
- The majority of covered workers are employed by a firm that contributes at least half of the premium.
- Sixteen percent of covered workers with single coverage and 6% of covered workers with family coverage work for a firm that pays 100% of the premium (Exhibit 6.15).
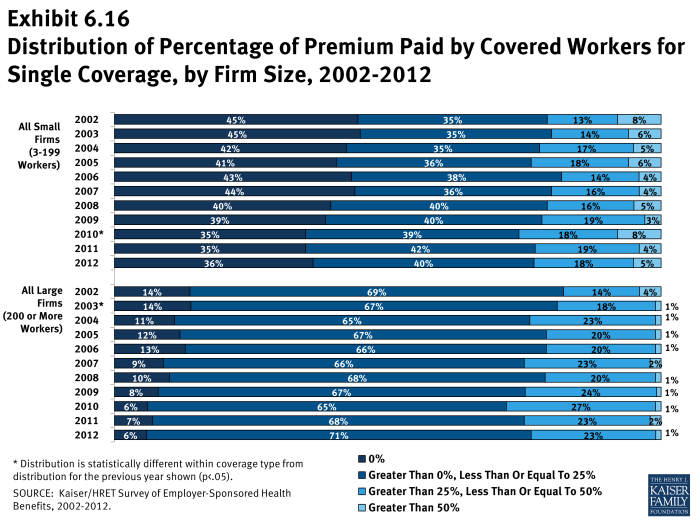
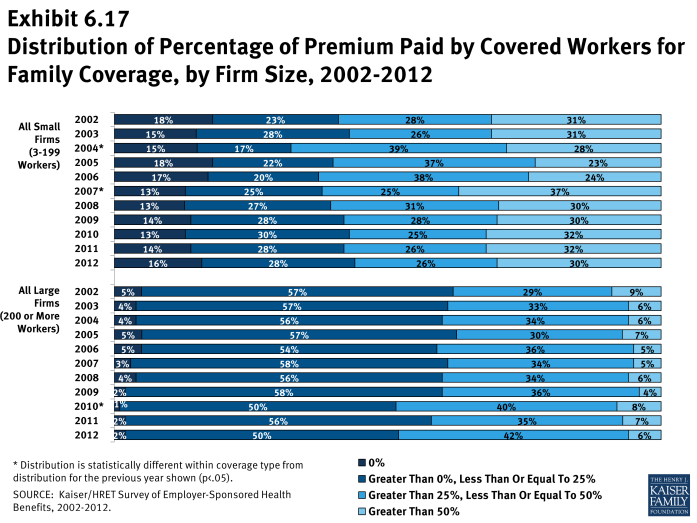
- Covered workers in small firms (3-199 workers) are more likely to work for a firm that pays 100% of the premium than workers in large firms (200 or more workers). Thirty-six percent of covered workers in small firms have an employer that pays the full premium for single coverage, compared to 6% of covered workers in large firms (Exhibit 6.16). For family coverage, 16% percent of covered workers in small firms have an employer that pays the full premium, compared to 2% of covered workers in large firms (Exhibit 6.17).
- Five percent of covered workers in small firms (3-199 workers) contribute more than 50% of the premium for single coverage, compared to 1% of covered workers in large firms (200 or more workers) (Exhibit 6.16). For family coverage, 30% of covered workers in small firms work in a firm where they must contribute more than 50% of the premium, compared to 6% of covered workers in large firms (Exhibit 6.17).
- The percentage of the premium paid by covered workers varies by several firm characteristics.
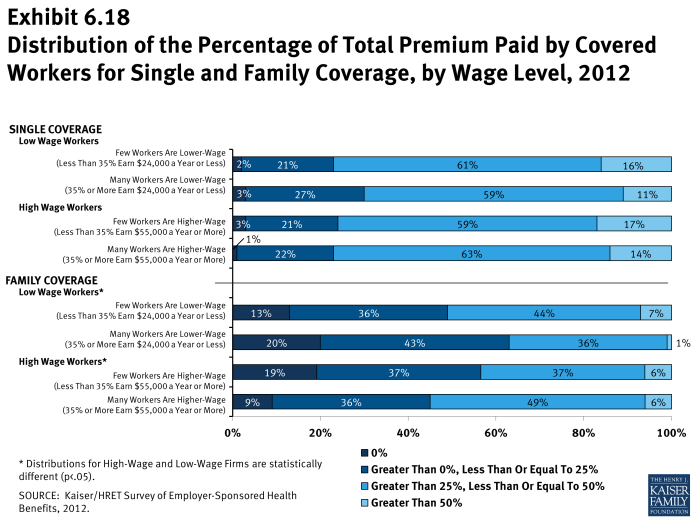
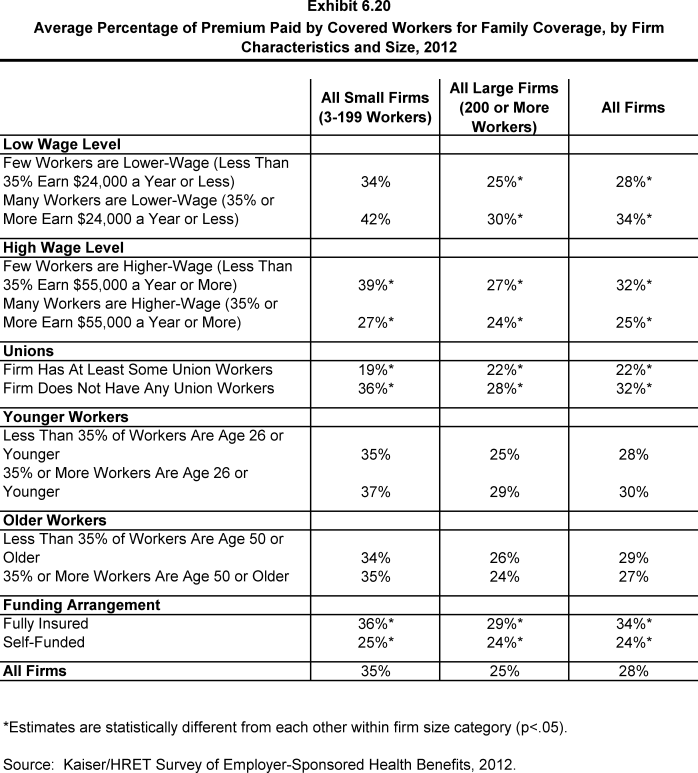
- For family coverage, workers in firms with many lower-wage workers (35% or more earn $24,000 or less annually) contribute a greater percentage of the premium than those in firms with fewer lower-wage workers (less than 35% earn $24,000 or less annually) (34% vs. 28%) (Exhibit 6.20).
- Workers with family coverage in firms that have at least some union workers contribute a significantly lower percentage of the premium than those in firms without any union workers (22% vs. 32%) (Exhibit 6.20).
- For workers with family coverage in large firms (200 or more workers), the average percentage contribution for workers in firms that are partially or completely self-funded is lower than the average percentage contributions for workers in firms that are fully insured (24% vs. 29%) 2 (Exhibit 6.20).
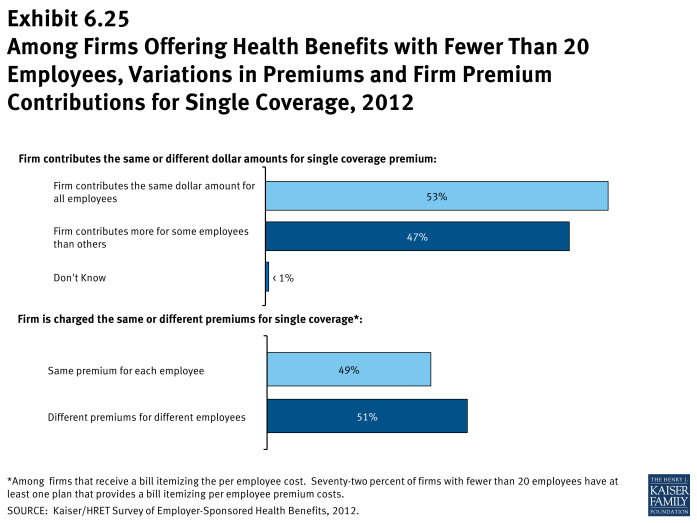
- Among firms offering health benefits with fewer than 20 employees nearly half (47%) contribute different dollar amounts toward premiums for different employees (Exhibit 6.25).
- Among firms offering health benefits with fewer than 20 employees, 72% have at least one plan that provides a bill itemizing per employee premium costs. Of these firms, 51% report being charged a different premium amount for different employees (Exhibit 6.25).
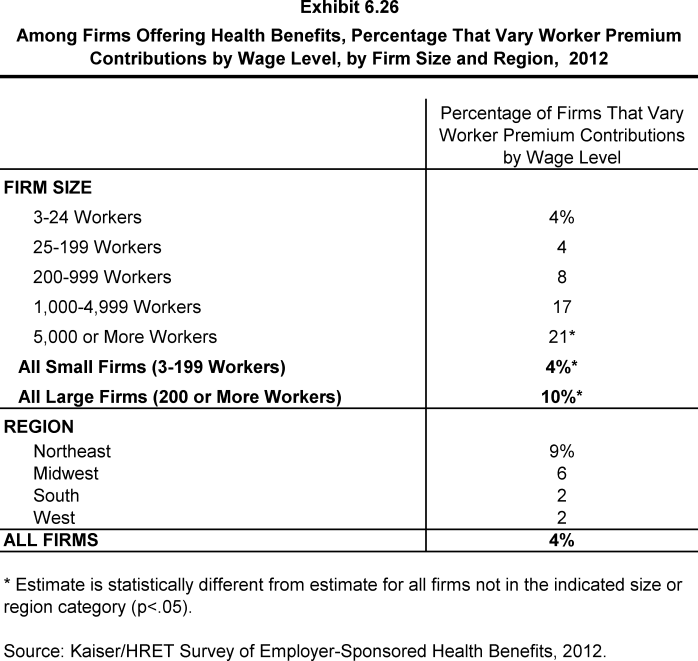
- Among firms offering health benefits, 4% vary worker premium contributions by wage level. Large firms (200 or more workers) are more likely to vary contributions by wage level than small firms (10% vs. 4%) (Exhibit 6.26).
x
Exhibit 6.1
x
Exhibit 6.2
x
Exhibit 6.3
x
Exhibit 6.4
x
Exhibit 6.5
x
Exhibit 6.8
x
Exhibit 6.14
x
Exhibit 6.15
x
Exhibit 6.17
x
Exhibit 6.16
x
Exhibit 6.20
x
Exhibit 6.25
x

