2012 Employer Health Benefits Survey
Section 1: Cost of Health Insurance
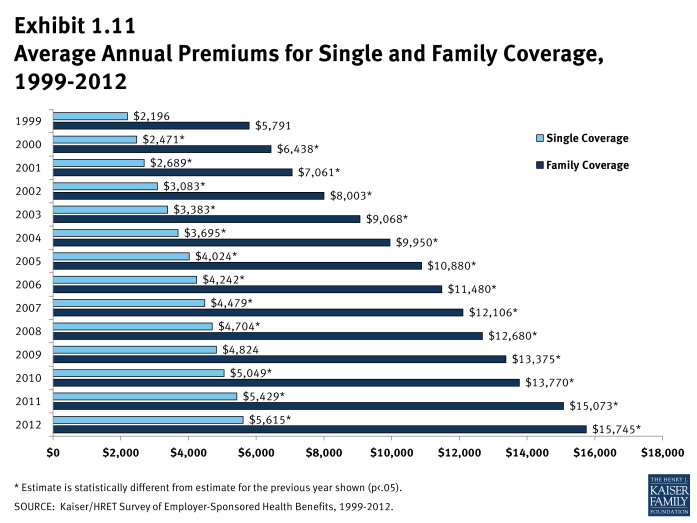
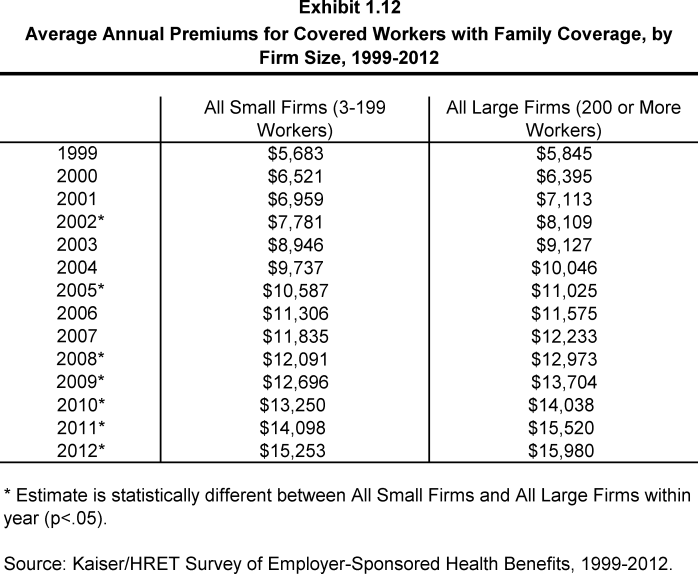
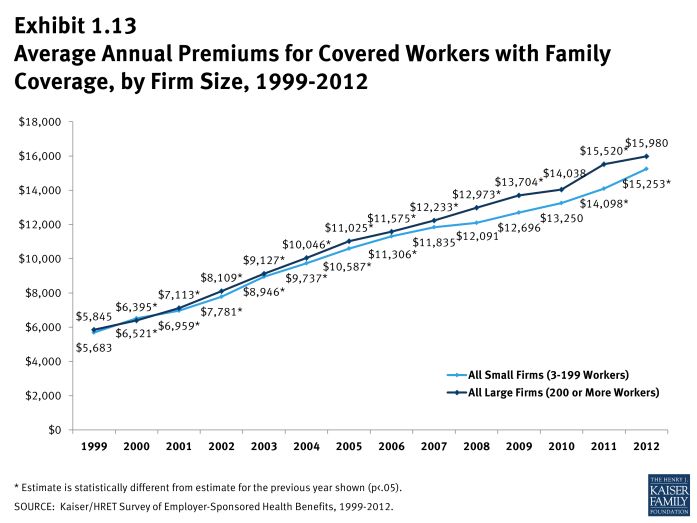
The average annual premiums in 2012 are $5,615 for single coverage and $15,745 for family coverage. Average premiums increased 3% for single coverage and 4% for family coverage in the last year. Consistent with recent years, average family premiums for small firms (3-199 workers) ($15,253) are significantly lower than average family premiums for larger firms (200 or more workers) ($15,980).
Premium Costs for Single and Family Coverage
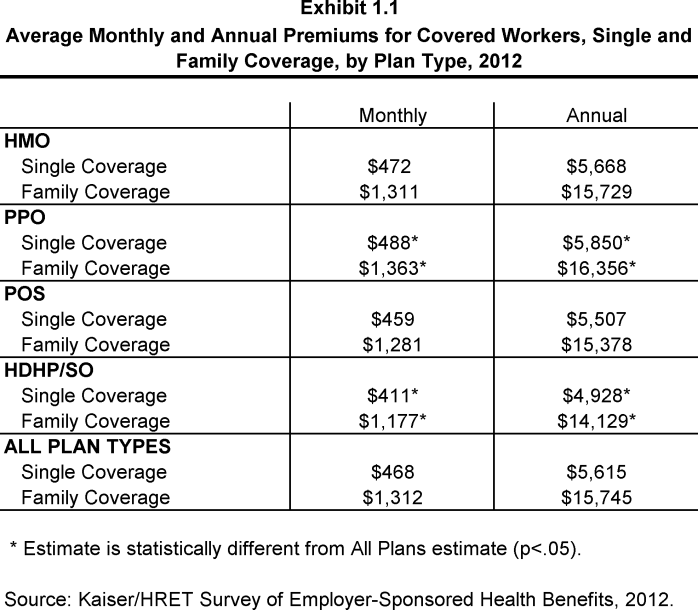
- The average premium for single coverage in 2012 is $468 per month or $5,615 per year (Exhibit 1.1). The average premium for family coverage is $1,312 per month or $15,745 per year (Exhibit 1.1).
- The average annual premiums for covered workers in HDHP/SOs are lower for single ($4,928) and family coverage ($14,129) than the overall average premiums for covered workers. Average annual premiums for PPO plans are higher for single coverage ($5,850) and family coverage ($16,356) than the overall average premiums for covered workers (Exhibit 1.1).
- The average premium for family coverage for covered workers in small firms (3-199 workers) ($15,253) is lower than the average premium for covered workers in large firms (200 or more workers) ($15,980) (Exhibit 1.2). The average single premiums in small firms (3-199 workers) and larger firms do not differ significantly.
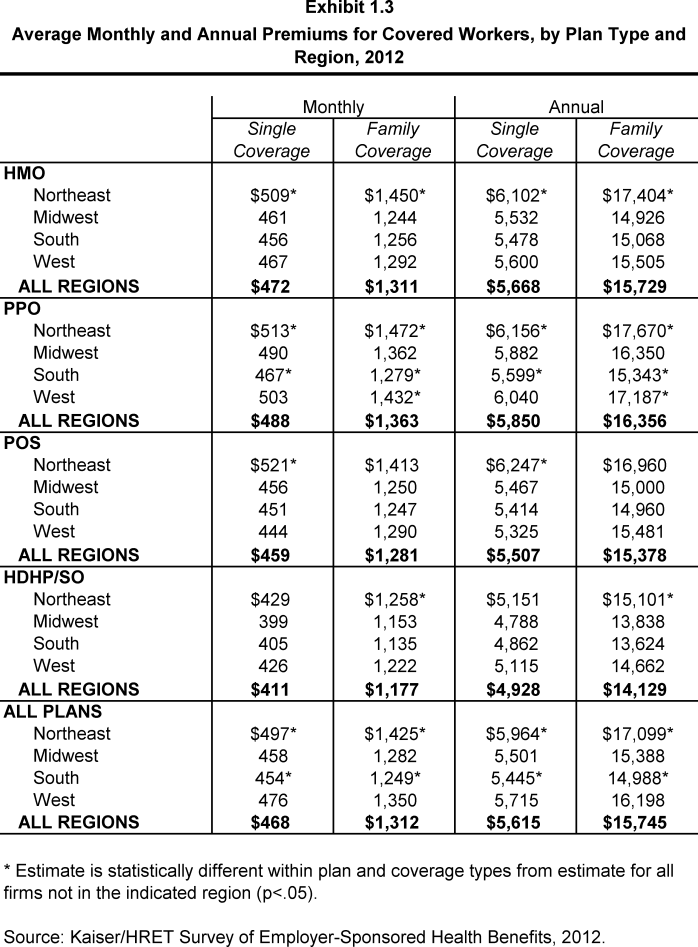
- Average single and family premiums for covered workers are higher in the Northeast ($5,964 and $17,099) and lower in the South ($5,445 and $14,988) than the average premiums for covered workers in all other regions (Exhibit 1.3).
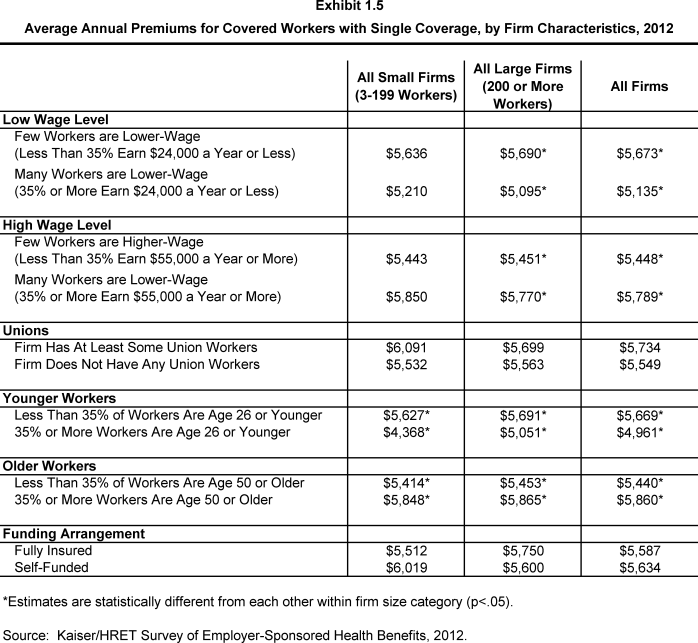
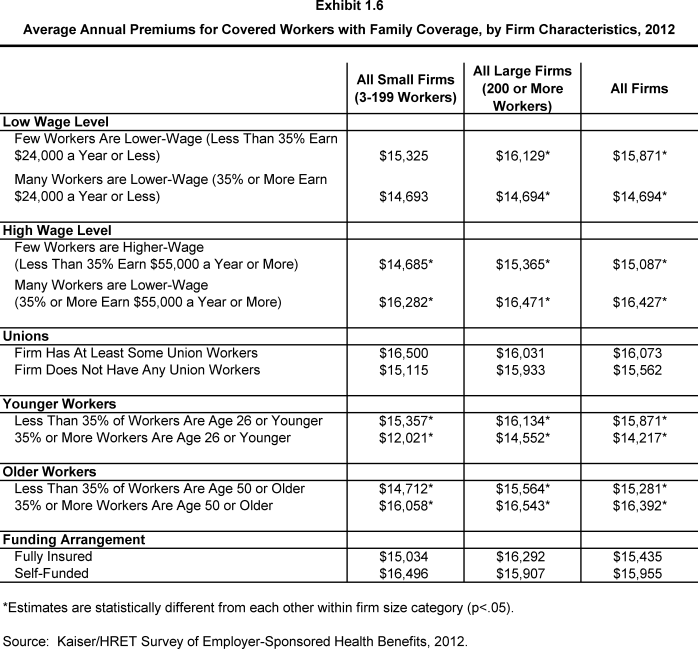
- Covered workers in firms where 35% or more of the workers are age 26 or younger have lower average single and family premiums ($4,961 and $14,217) than covered workers in firms where a lower percentage of workers are age 26 or younger ($5,669 and $15,871). Covered workers in firms where 35% or more of the workers are age 50 or older have higher average single and family premiums ($5,860 and $16,392) than covered workers in firms where a lower percentage of workers are age 50 or older ($5,440 and $15,281) (Exhibit 1.5) and (Exhibit 1.6).
- Covered workers in firms with a large percentage of lower-wage workers (at least 35% of workers earn $24,000 per year or less) have lower average single and family premiums ($5,135 and $14,694) than covered workers in firms with a smaller percentage of lower-wage workers ($5,673 and $15,871). Covered worker in firms with a large percentage of higher-wage workers (at least 35% of workers earn $55,000 per year or more) have higher average single and family premiums ($5,789 and $16,427) than covered workers in firms with a smaller percentage of higher-wage workers ($5,448 and $15,087) (Exhibit 1.5) and (Exhibit 1.6).
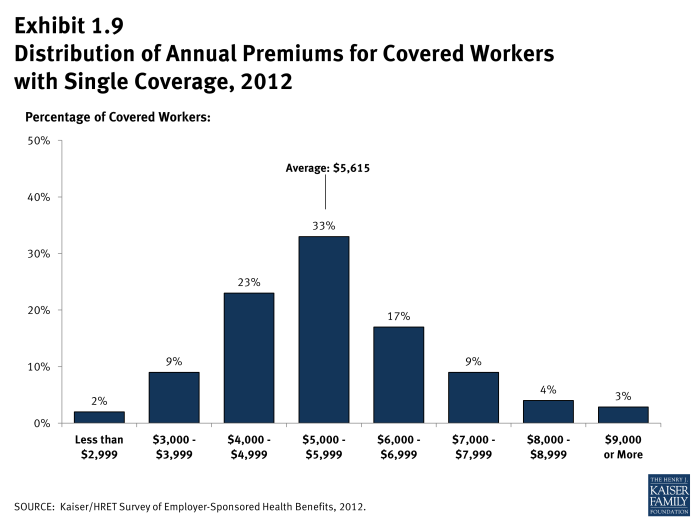
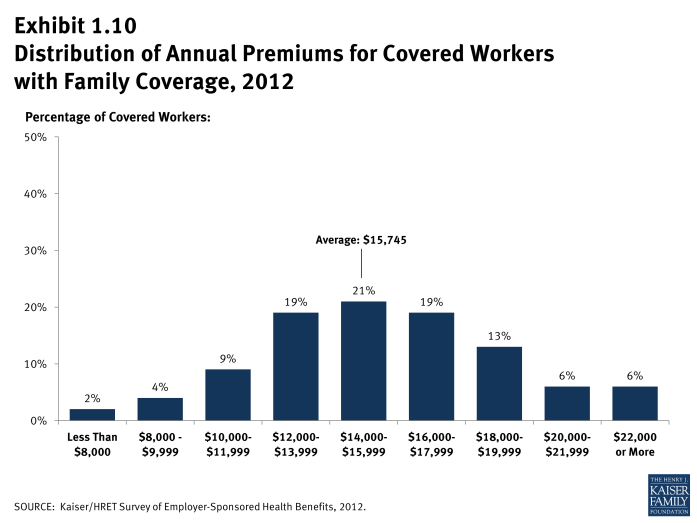
- There is considerable variation in premiums for both single and family coverage.
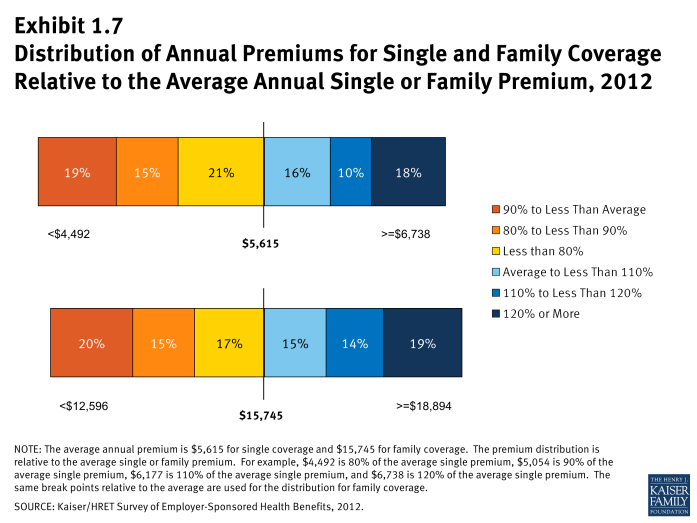
- Eighteen percent of covered workers are employed by firms that have a single premium at least 20% higher than the average single premium, while 19% of covered workers are in firms that have a single premium less than 80% of the average single premium (Exhibit 1.7) and (Exhibit 1.8).
- For family coverage, 19% of covered workers are employed in a firm that has a family premium at least 20% higher than the average family premium, while 20% of covered workers are in firms that have a family premium less than 80% of the average family premium (Exhibit 1.7) and (Exhibit 1.8).
Premium Changes Over Time
- The average annual single premium ($5,615) in 2012 is 3% higher than the average annual single premium in 2011 ($5,429), and the average annual family premium ($15,745) is 4% higher than the average annual family premium last year ($15,073) (Exhibit 1.11).
- The $15,745 average annual family premium in 2012 is 30% higher than the average family premium in 2007 and 97% higher than the average family premium in 2002 (Exhibit 1.11).
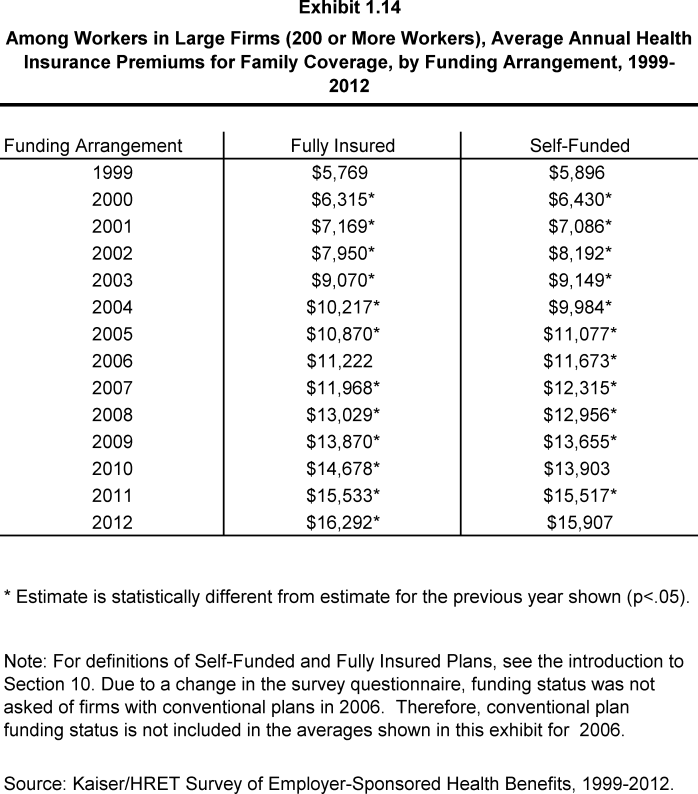
- For large firms (200 or more workers), the average family premium for covered workers in firms that are fully insured has grown at a similar rate to premiums for workers in fully or partially self-funded firms from 2007 to 2012 (36% in fully insured firms vs. 29% in self-funded firms) and from 2002 to 2012 (105% in fully insured firms vs. 94% in self-funded firms) (Exhibit 1.14).
x
Exhibit 1.1
x
Exhibit 1.2
x
Exhibit 1.3
x
Exhibit 1.5
x
Exhibit 1.6
x
Exhibit 1.7
x
Exhibit 1.8
x
Exhibit 1.11
x

