Oral health is key to overall health and well-being, and the use of dental services helps prevent and treat dental disease and improves oral health. While sometimes overlooked as a cosmetic issue, oral health encompasses the health of the entire mouth, which in turn supports the health of the rest of the body. Despite the importance of dental services, oral health conditions such as tooth decay, gum disease, tooth loss, and oral cancer, are common, with data showing that over a quarter of adults and more than one in ten children have untreated dental caries (or tooth decay). Untreated oral health conditions can have adverse effects on overall quality of life, impacting a person’s ability to eat, speak, sleep, socialize and participate in everyday activities such as school or work, and are associated with other chronic conditions such as heart disease and diabetes. Without access to regular, appropriate dental services, untreated oral health conditions can lead to less effective and more expensive emergency care and cost the U.S. about $45 billion each year in lost productivity.
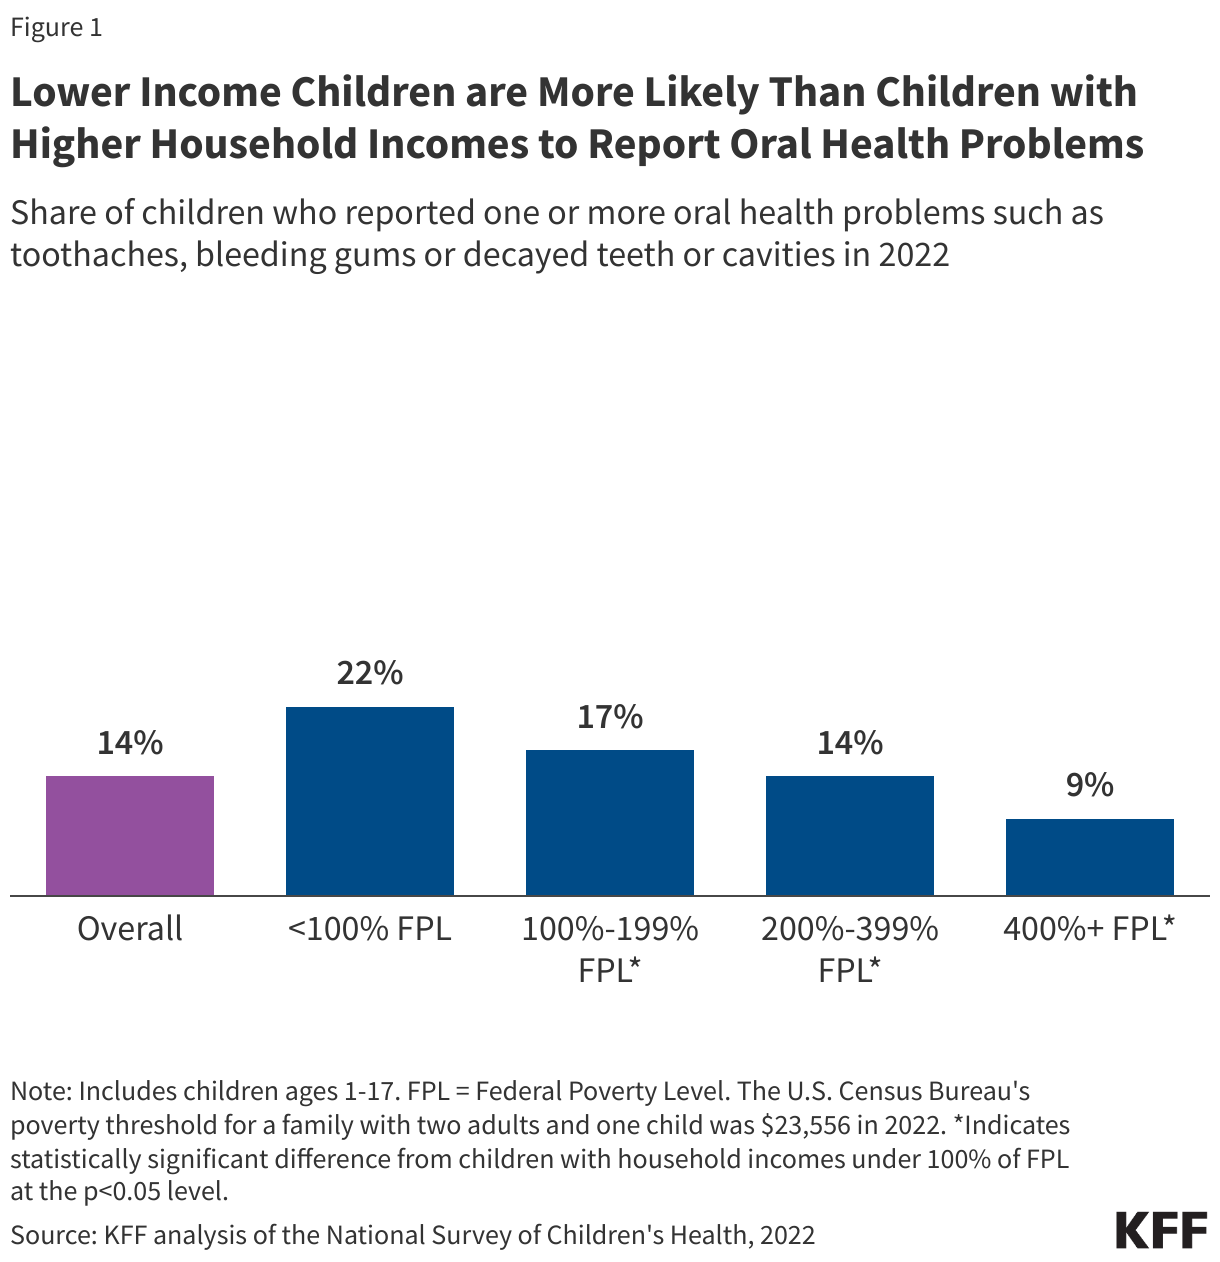
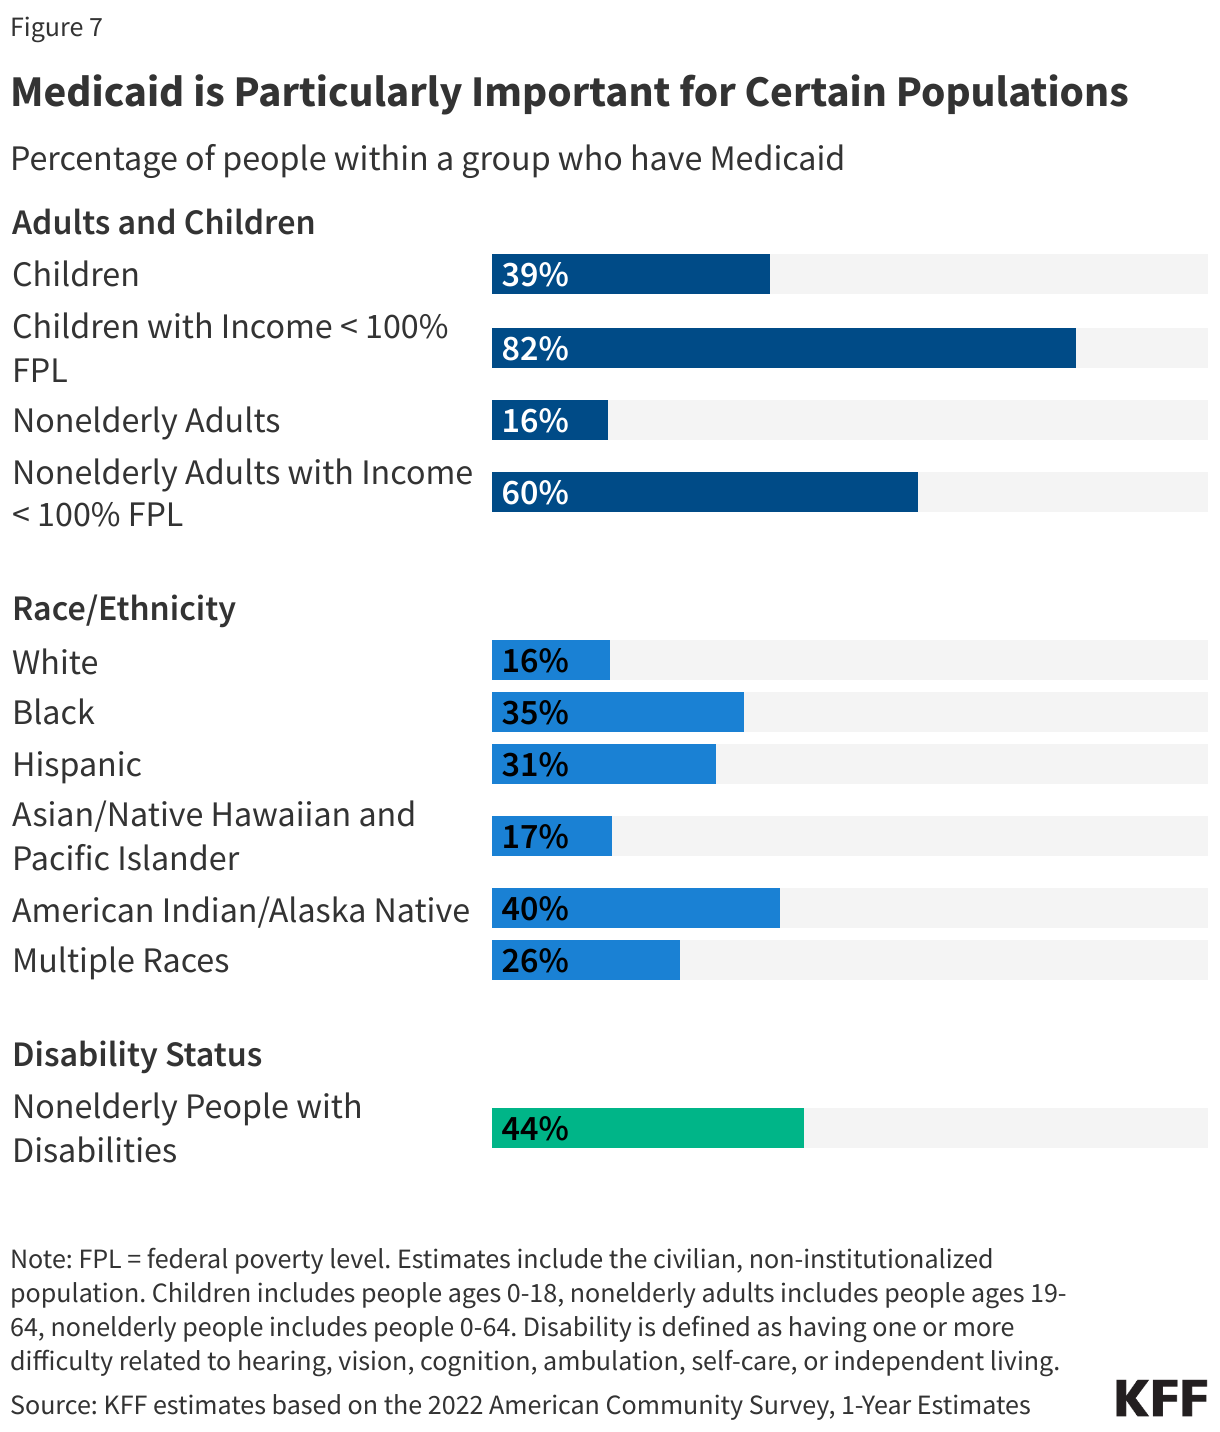
The prevalence of unmet oral health needs is higher among people with low incomes, including those with Medicaid. Almost one-fourth of children with household incomes below 100% of the federal poverty level (FPL) have one or more oral health problems, and low-income children are more likely to report problems than children in higher income households (Figure 1). Low-income adults also have more unmet dental health care needs when compared with higher income adults. In part, reflecting these income differences, people of color are more likely to experience oral health problems and are less likely to receive dental care compared with White individuals. People living in rural areas also experience worse oral health outcomes and have more difficulty accessing care than those living in urban areas. Medicaid covers a majority of nonelderly people living in poverty and over half of Black, Hispanic, and American Indian and Alaska Native (AIAN) children, making Medicaid an important tool for improving oral health and addressing oral health disparities.
This issue brief describes Medicaid dental coverage, examines the use of dental services for children and adults in Medicaid, and discusses current challenges and policy changes that impact access to oral health care for Medicaid enrollees. The analysis uses Medicaid claims data which track the services enrollees use and may differ from survey data (see Methods and Appendix Table 1). Key takeaways include:
- Dental services must be covered for all children in Medicaid under Medicaid’s Early and Periodic Screening, Diagnostic and Treatment (EPSDT) benefit, but dental services for adults are an optional Medicaid benefit that states can elect to cover.
- Nearly half of children covered by Medicaid or CHIP receive at least one dental service within the year compared with only one-fifth of adult Medicaid enrollees, reflecting differences in coverage policies for children and adults.
- While similar shares of adult Medicaid enrollees receive at least one dental service within the year across racial and ethnic groups, Hispanic and Asian children enrolled in Medicaid or CHIP have the higher rates of dental service use compared to other groups. In addition, the share of children and adults enrolled in Medicaid or CHIP receiving at least one dental service within the year is slightly lower in rural areas compared with urban areas.
- Rates of dental service use among Medicaid adults are higher in states with more extensive Medicaid dental coverage policies and range from under 5% in Alabama and Tennessee to over 30% in Montana, Minnesota, Connecticut, Massachusetts, and New Jersey. Rates of dental service use among children, which are generally higher, also vary substantially by state, ranging from under 40% in Illinois, Ohio, North Dakota, and Wisconsin to over 60% in Montana, Connecticut, and Texas.
- Rates of dental service use among both children and adults with Medicaid or CHIP declined during the pandemic and had not rebounded to pre-pandemic levels as of 2021.
- Enrollees likely face a number of barriers to accessing dental care, including dental workforce shortages in general or a lack of dental providers accepting Medicaid in their community. Focused initiatives could address barriers and disparities in access to dental care. For adults specifically, lack of state Medicaid coverage of dental benefits also impacts rates of dental service use, and expanded coverage could increase access to dental care. Lastly, loss of Medicaid coverage altogether also has implications for access to care, and millions of people have been disenrolled from Medicaid during the unwinding of the continuous enrollment provision.
Does Medicaid cover dental benefits?
State Medicaid programs are required to cover dental services for children under Medicaid’s Early and Periodic Screening, Diagnostic and Treatment (EPSDT) benefit. The EPSDT benefit provides a comprehensive set of health care services, including screening, vision, hearing, and dental services, for children under age 21. States are required to cover all these services as well as any services “necessary… to correct or ameliorate” a child’s physical or mental health condition. These services must be provided for children regardless of whether a state chooses to cover them for adults and on a periodic basis that meets reasonable standards of medical practice. Most states use the American Academy of Pediatric Dentistry (AAPD) periodicity schedule, which recommends a child’s first oral examination at the eruption of their first tooth (no later than 12 months of age) and every six months after.
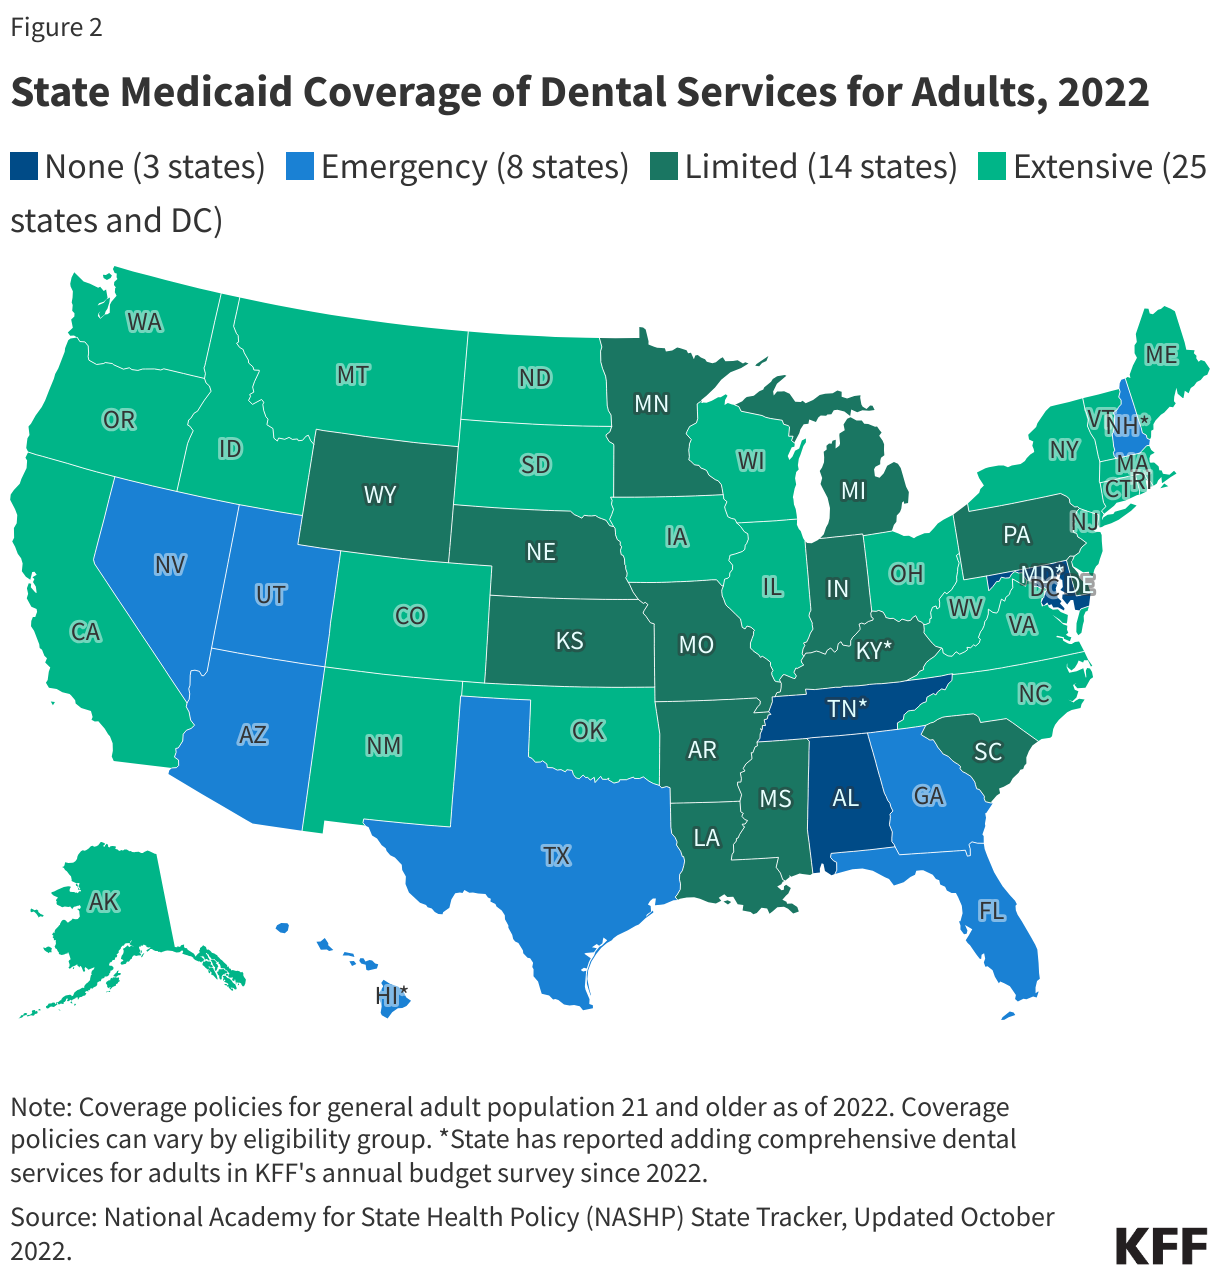
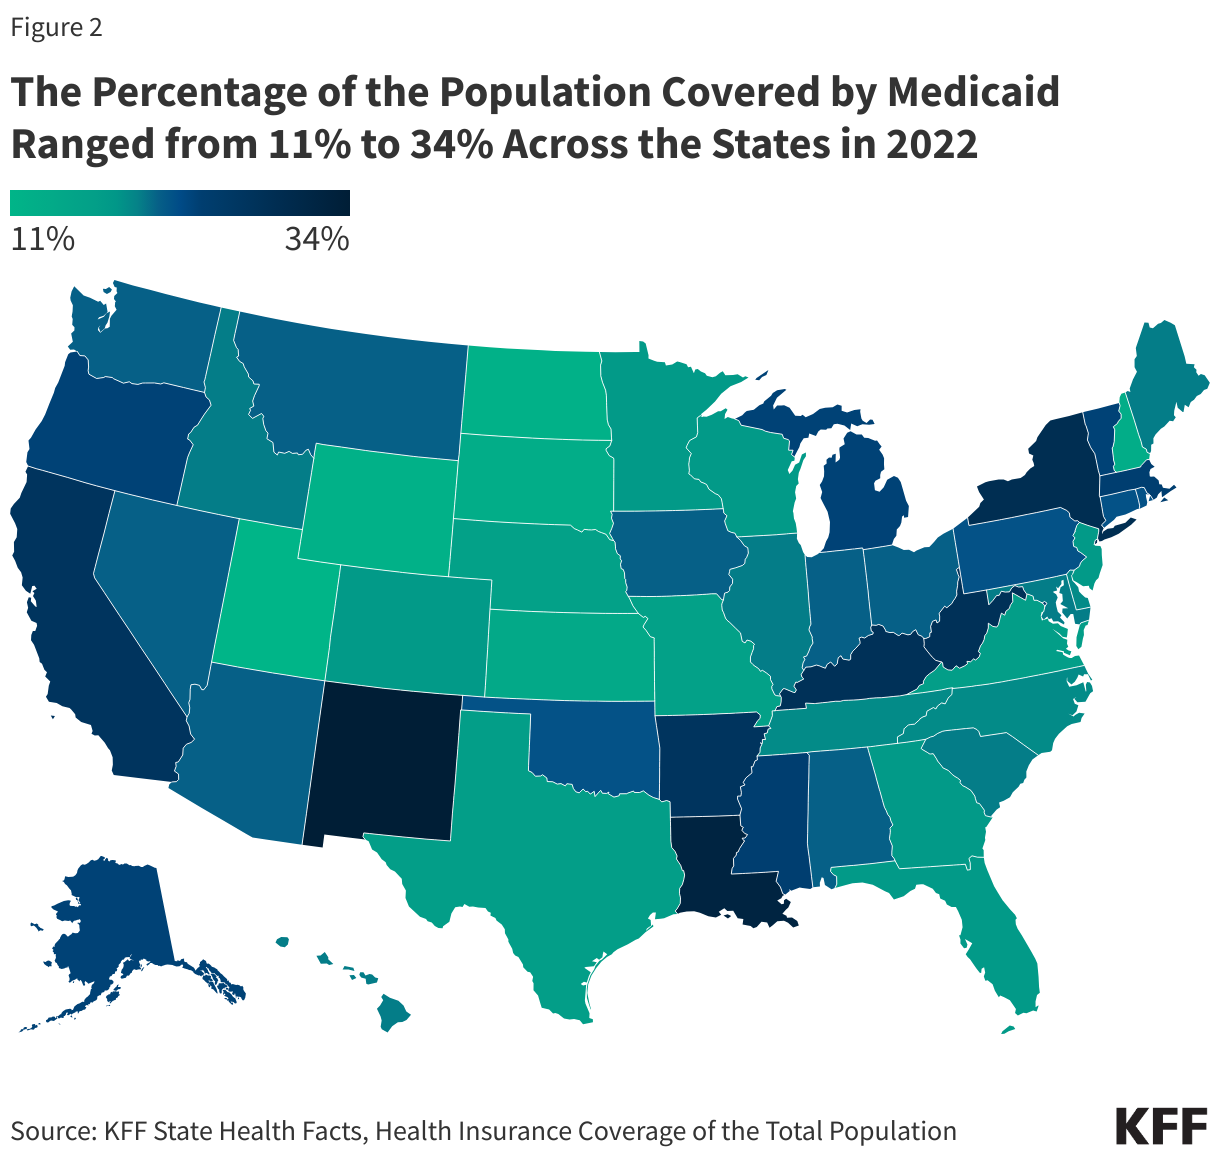
Dental services for adults 21 and older are an optional benefit in Medicaid, leading to state variation in coverage policies. As of 2022, thirty-nine states and DC covered dental services beyond emergency services for the general adult population (Figure 2). Even more states offer dental benefits beyond emergency services for pregnant enrollees, and some states also have unique dental coverage policies in place for adults eligible based on age (65+) and those eligible based on disability. While most states cover dental services beyond emergency services for adults, the specific services covered and the amount, duration, and scope of services can vary, and managed care plans may provide additional dental benefits beyond state requirements. As the economy changes, state coverage of dental benefits in Medicaid may also change. States have historically added or expanded dental benefits when state fiscal conditions are strong, as a number of state Medicaid programs have done in recent years, but states have also cut dental services when facing budgetary pressures.
How does use of dental services vary by the type of service and other selected characteristics?
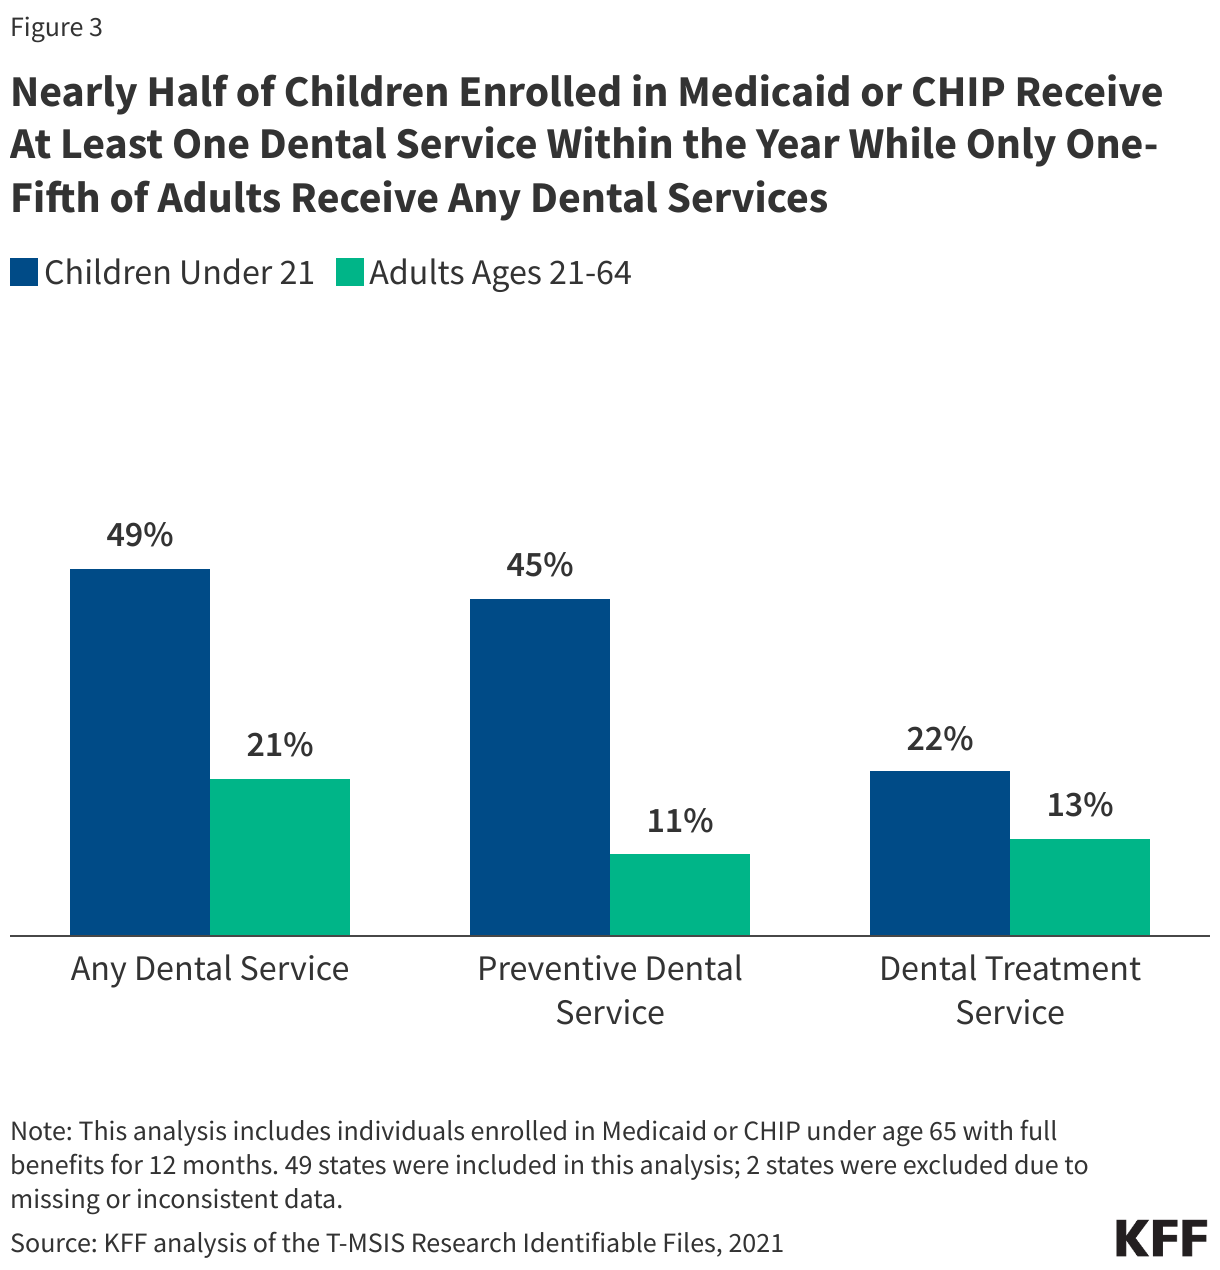
Nearly half of children covered by Medicaid or CHIP receive at least one dental service within the year compared with only one-fifth of adults, reflecting differences in coverage policies for children and adults (Figure 3). This means, despite broad coverage of dental benefits, about half of children enrolled in Medicaid or CHIP are not receiving any dental care. The FY 2022 Child Core Set reports also flagged that median state performance on all three dental indicators for oral evaluation, dental sealants, and topical fluoride treatment fell below 50%. Further, rates for preventive dental care are lower than rates for any dental services for both children and adults, with slightly less than half of children receiving preventive dental care (45% in 2021) and about one in ten adults receiving preventive dental care (11% in 2021). Adults are also more likely to receive dental treatment services than preventive services, reflecting the wider availability of emergency or limited dental services than comprehensive dental services for adults.
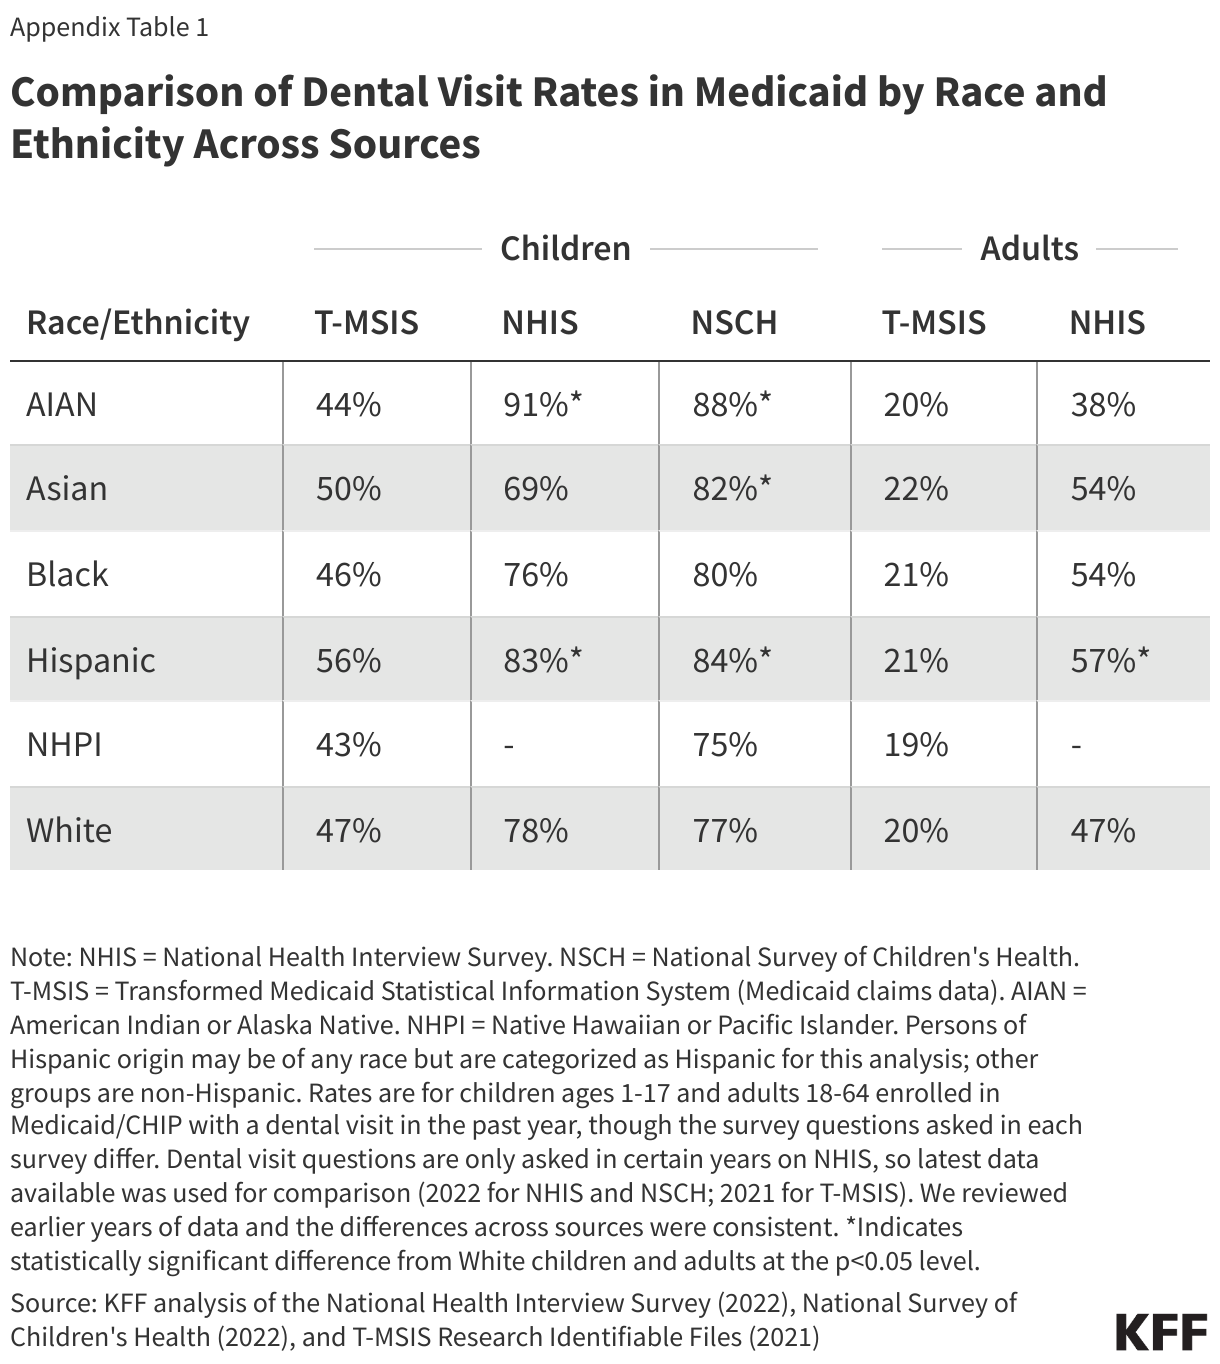
While similar shares of adults in Medicaid receive at least one dental service within the year across racial and ethnic groups, Hispanic and Asian children enrolled in Medicaid or CHIP have the highest rates of dental service use (56% and 50%, respectively) compared to other racial and ethnic groups (Figure 4). Native Hawaiian and Pacific Islander (NHPI) and AIAN children enrolled in Medicaid or CHIP have the lowest rates of dental service use (43% and 44%, respectively). This is similar to findings for well-child visits found in a prior KFF analysis. For adults, about one-fifth of enrollees in each racial and ethnic group used at least one dental service within the year. These findings, which are based on claims data from 35 states, may differ from those based on survey data (Appendix Table 1) and may reflect that some services received from Indian Health Service providers are not captured in the analysis (see Methods). Sixteen states were excluded from the race and ethnicity analysis due to data quality issues.
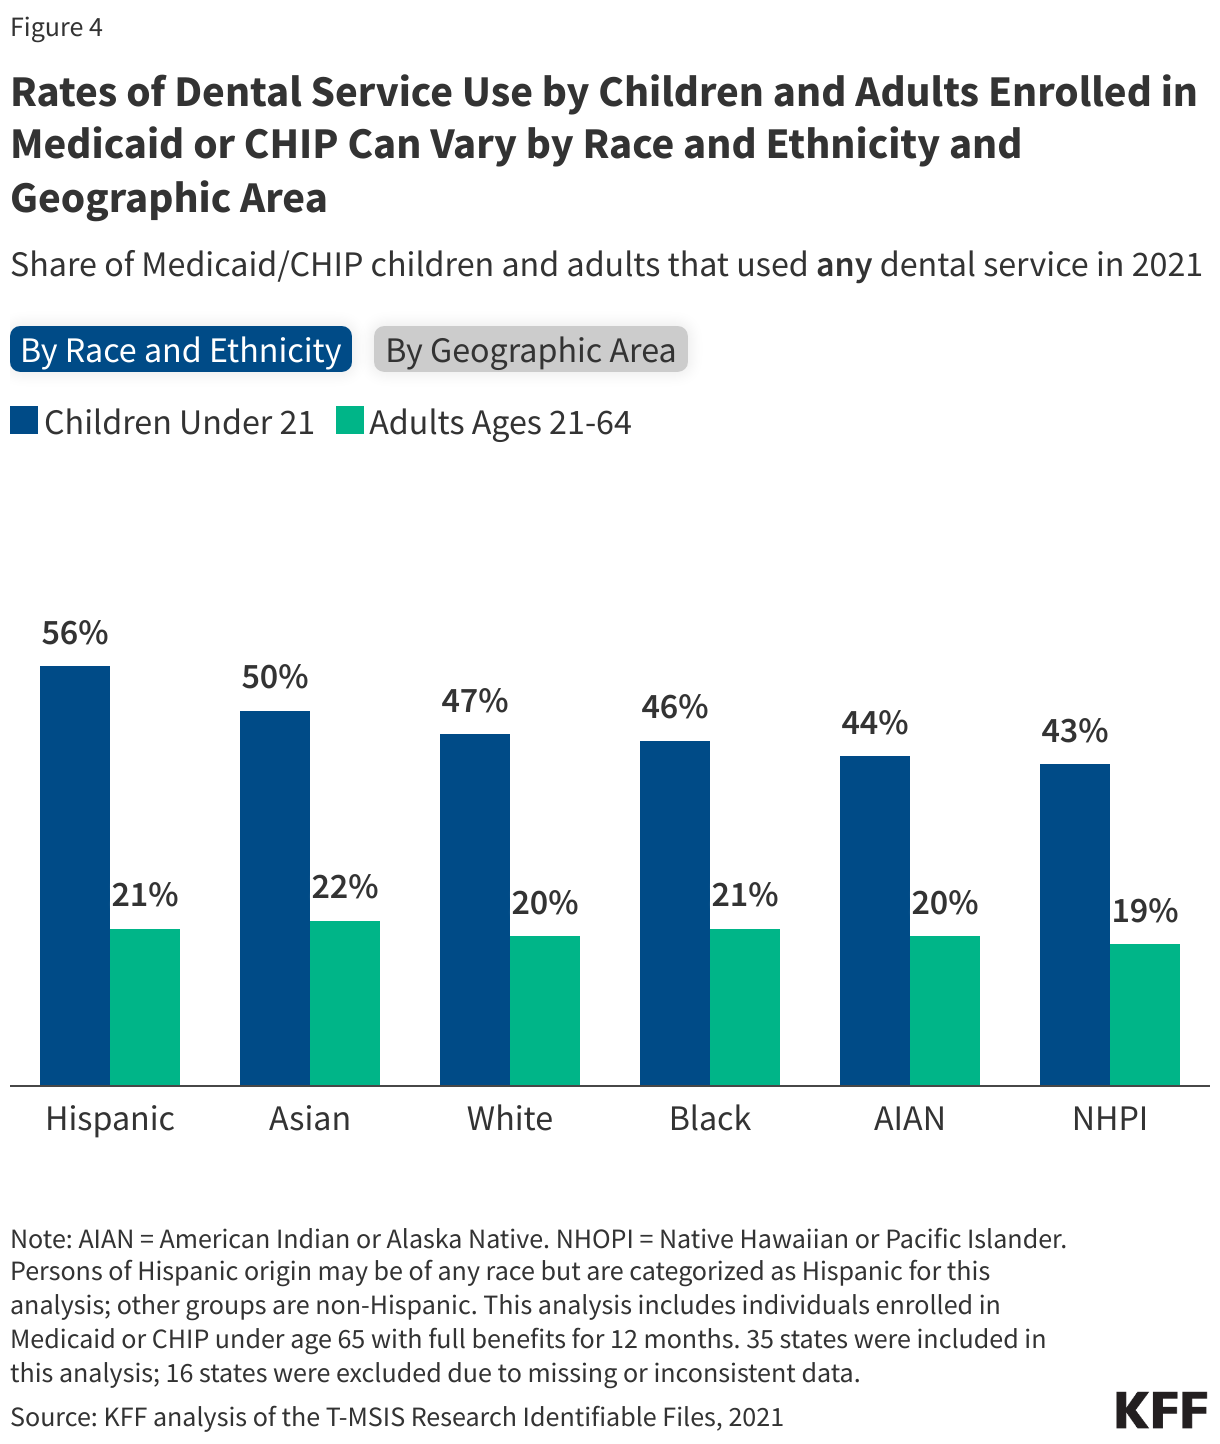
The share of children and adults enrolled in Medicaid or CHIP receiving at least one dental service within the year is slightly lower in rural areas compared with urban areas (Figure 4). Dental service use rates in rural areas in 2021 were 3 percentage points less in than urban areas for both children and adults. Note that only 18% of children and 17% of adults in the analysis lived in a rural area, and three states were excluded from the geographic area analysis due to data quality issues (see Methods).
How does dental service use vary across states?
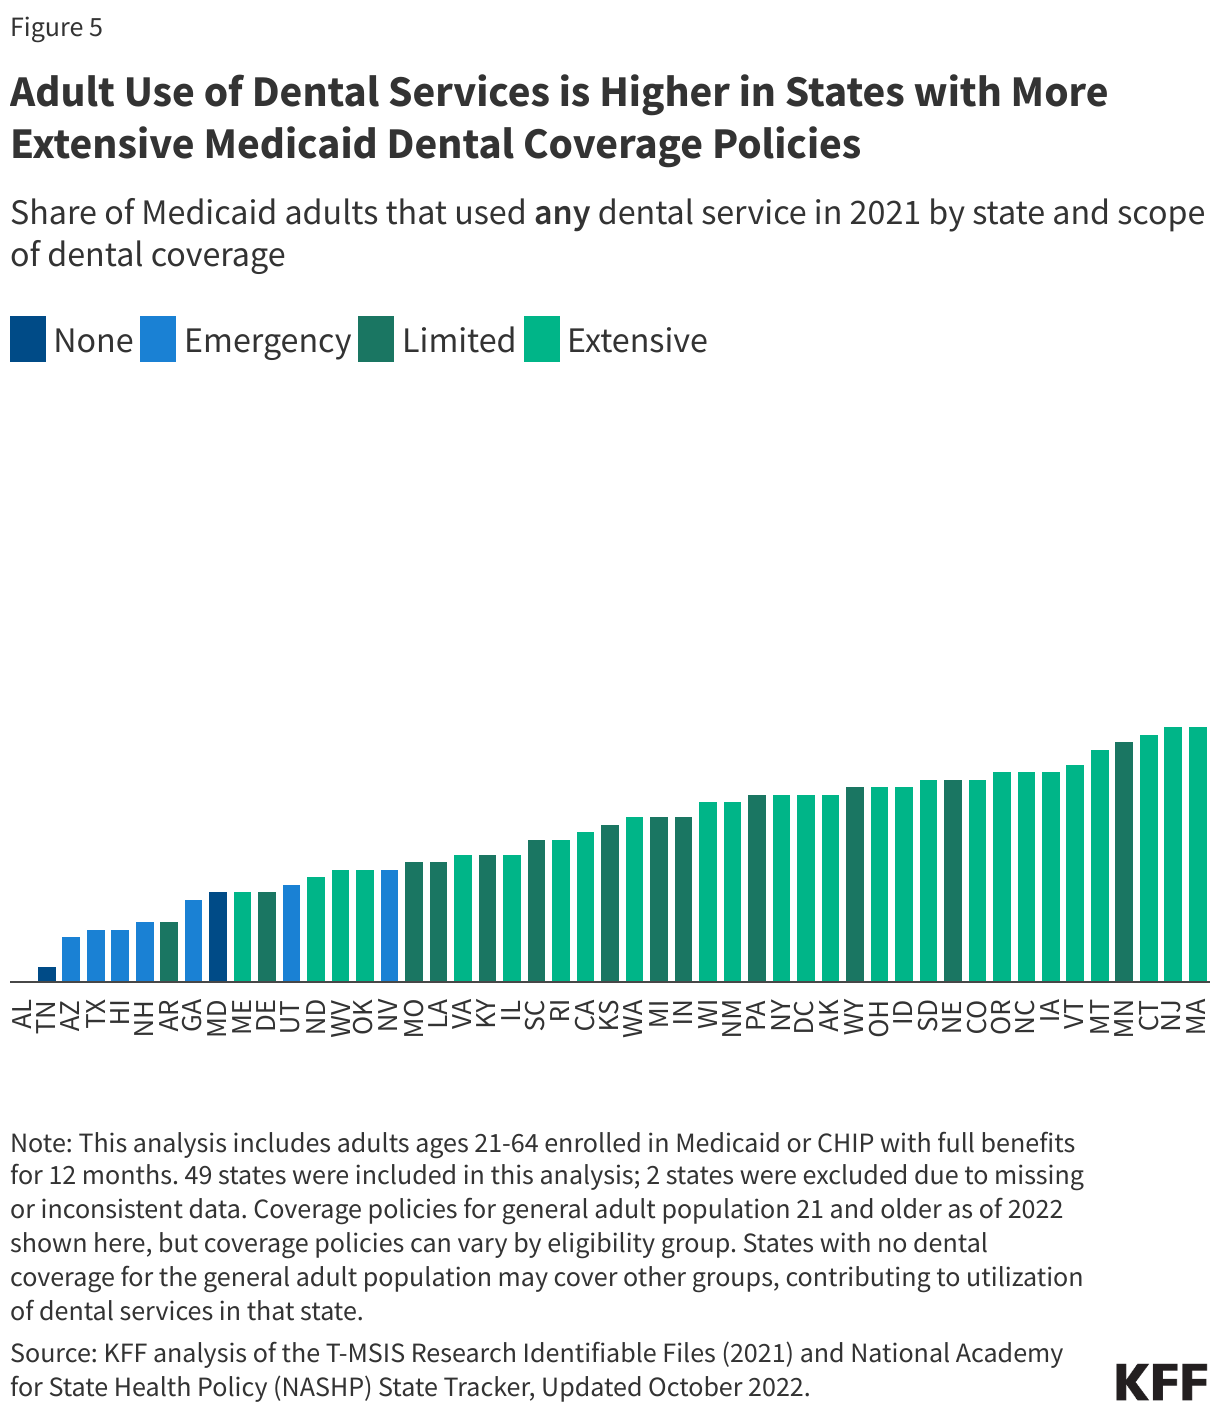
While rates of dental service use among adults are relatively low across all states, rates are higher in states with more extensive Medicaid dental coverage policies (Figure 5). The share of adults using any dental services ranges from under 5% in Alabama and Tennessee to over 30% in Montana, Minnesota, Connecticut, Massachusetts, and New Jersey. This means that, even in the state with the highest rate, almost two-thirds of adults are not receiving any dental care within the year. In addition, a number of states with extensive dental benefits for Medicaid adults have rates below the median (21%), signaling that even with expansive coverage there may still be issues related to access to dental care in those states.
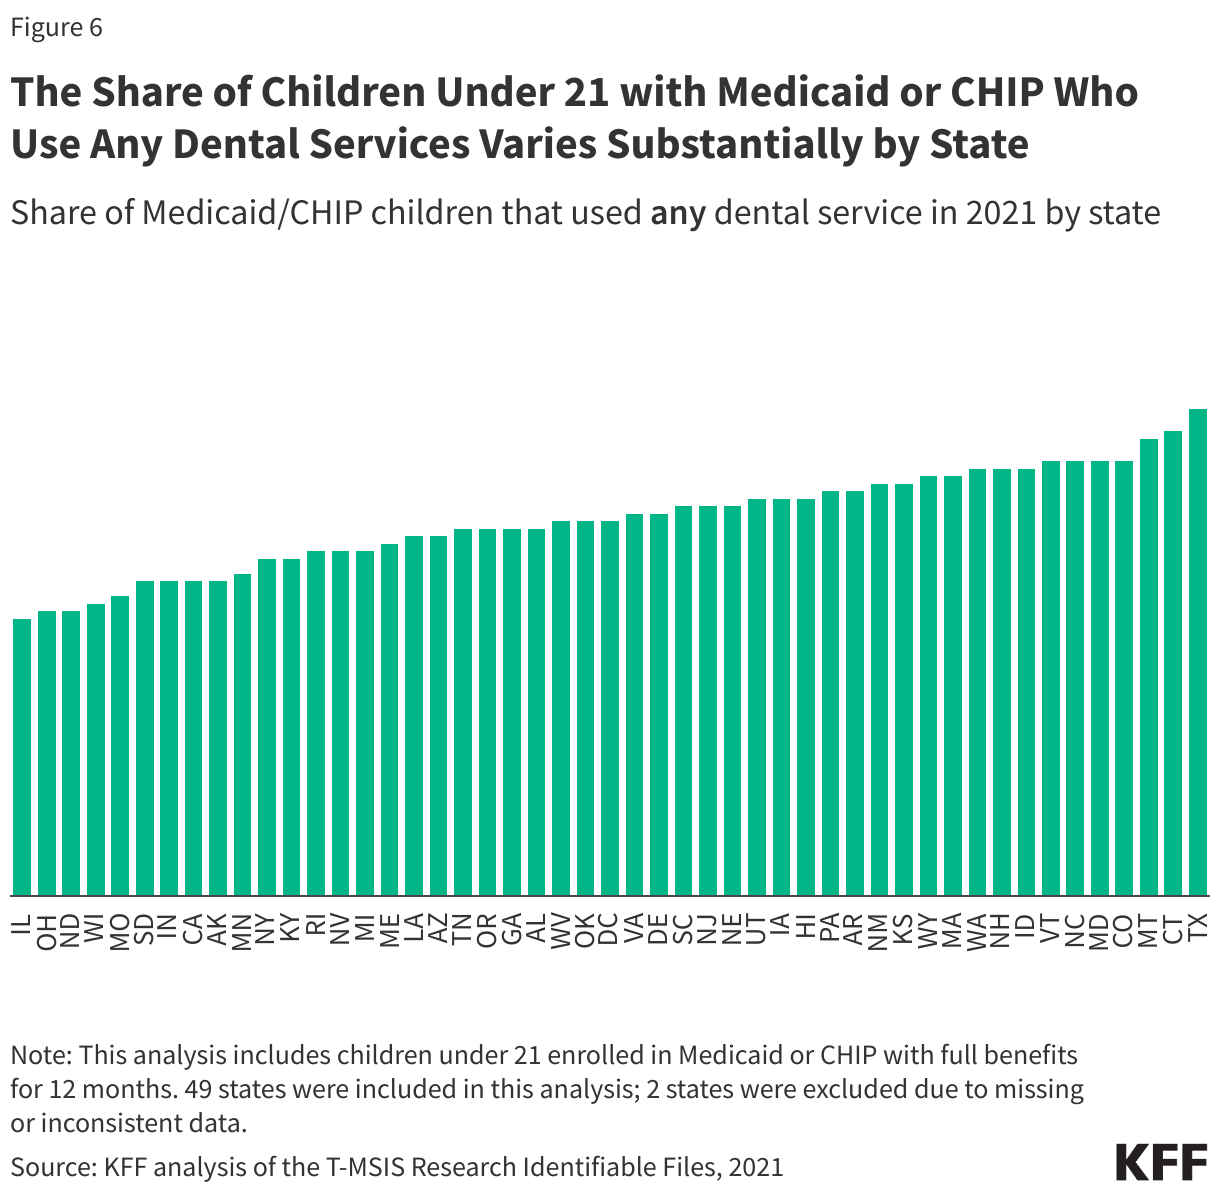
The share of Medicaid children using any dental services within the year varies substantially by state despite broad coverage of dental benefits under Medicaid’s EPSDT benefit (Figure 6). The share of children using any dental services ranges from under 40% in Illinois, Ohio, North Dakota, and Wisconsin to over 60% in Montana, Connecticut, and Texas. Almost a third of states (14 states) had dental service use rates below the median for both children and adults, which could point to access related issues in those states such as limited provider availability, other access barriers, as well as limited coverage policies for adults.
How did dental service use change during the pandemic?
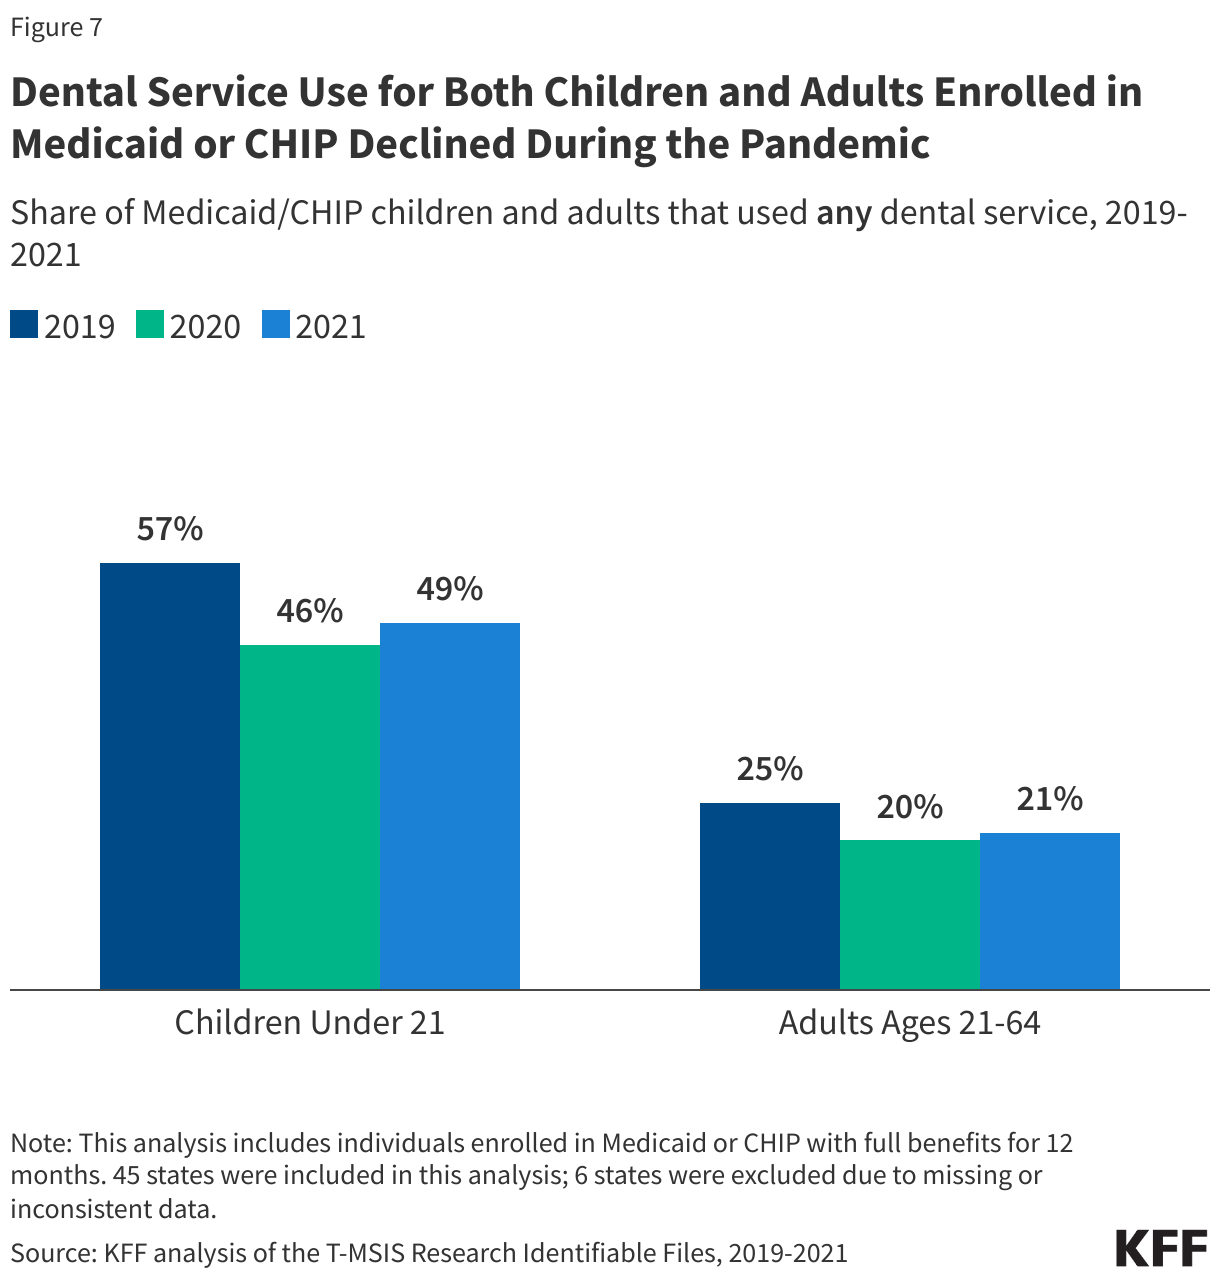
Rates of dental service use among both children and adults with Medicaid or CHIP declined during the pandemic (Figure 7). The share of children using any dental service declined 8 percentage points from 2019 to 2020 (from 52% to 44%), and the share of adults using any dental services declined by 5 percentage points (from 24% to 19%). For both age groups, dental service use rates began to rebound in 2021, but remained below 2019 levels. The pandemic broadly impacted service utilization, and it remains unclear the extent to which dental service use rates will continue to rebound or where gaps will remain.
What are current challenges and strategies to expand access to dental care?
Rates of dental service use for both children and adults in Medicaid or CHIP are low, indicating enrollees likely face barriers to accessing dental care, including a lack of available dental providers in their community. Almost 60 million people in the U.S. live in a dental health workforce shortage area, and there is substantial variation in dental provider availability by state. Though dentist participation measures vary, one study found over half of dentists also do not accept Medicaid, and some who do may only treat a small number of Medicaid patients or may not be accepting new Medicaid patients. Low Medicaid reimbursement rates for dental services contribute to this issue, limiting the number of providers that are willing to take Medicaid. Medicaid/CHIP enrollees can experience other barriers when accessing health care that can also impact utilization rates such as lack of transportation, language barriers, disabilities, and difficulty finding childcare or taking time off for an appointment. These barriers, in addition dental provider participation in Medicaid and reimbursement rates, all have implications for access to dental care. Recent state efforts to address dental workforce issues could help expand access to dental care and increase use of dental services.
Recent federal actions could also help promote access to quality dental care for children. A Government Accountability Office (GAO) report found that many Medicaid-covered children do not receive recommended EPSDT screenings and services, including dental services, and recommended increased CMS oversight of EPSDT. In response, the Bipartisan Safer Communities Act included a number of Medicaid/CHIP provisions to ensure access to comprehensive health services and strengthen the EPSDT benefit, including updated guidance on state EPSDT implementation (expected by June 2024). In 2024, it also became mandatory for states to report the Child Core Set, a set of physical and mental health quality measures, with the goal of improving health outcomes for children. Lastly, all states as of January 2024 are now required to provide 12-month continuous eligibility for children enrolled in Medicaid and CHIP, which could help children remain connected to care, including dental care. Some states are also extending continuous eligibility for children in Medicaid for multiple years, which could help children maintain coverage beyond one year.
NHPI and AIAN children, enrollees in rural areas, and enrollees in certain states have the lower rates of dental service use, indicating focused initiatives may be needed to address disparities in access to dental care. Tackling access challenges including dental workforce issues, addressing the social determinants of health such as food insecurity, strengthening community outreach programs, and expanding dental services provided through Federally Qualified Health Centers (FQHCs) and school-based dental services are all tools that can be used to address oral health disparities. CMS recently released an updated school-based services claiming guide, and states have taken action to expand Medicaid coverage of school-based care in recent years. Public health approaches to improving oral health and preventing cavities are also important for addressing disparities and include school sealant programs for children and community water fluoridation. Despite a robust body of research showing the safety and effectiveness, some localities and states are now reconsidering water fluoridation in their communities amid backlash.
For adults, lack of state Medicaid coverage of dental benefits also impacts rates of dental service use, and expanded coverage could increase access to dental care. As of 2022, only 25 states and DC offer extensive dental benefits in their Medicaid programs to the general adult population (Figure 2). However, several states in KFF’s annual Medicaid budget survey have reported adding comprehensive dental services for adults or other groups, including pregnant individuals or people with disabilities, since then. CMS also recently finalized a rule that allows states to include dental benefits for adults in ACA marketplace plans. Research has shown that expanding dental coverage for adults increases access and use of dental services and is also associated with improved oral health for children. However, even with a robust dental benefits package, securing access to dental providers who accept Medicaid and have availability can still be a challenge, as has been recently seen in North Carolina and Virginia following benefit expansions. Further, when states have faced budget pressures, adult dental services in Medicaid have typically been among some of the first services limited or cut.
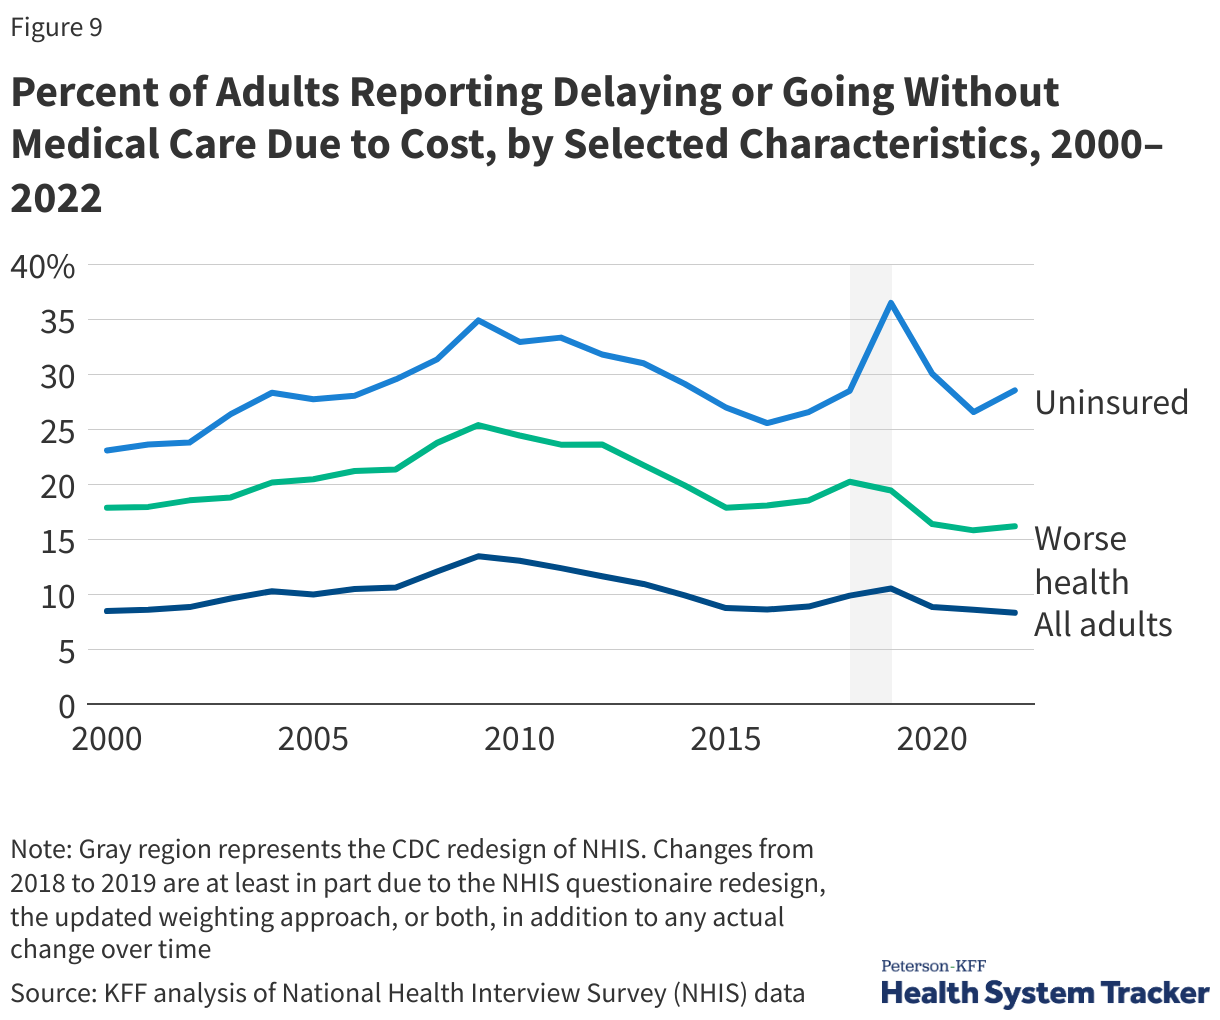
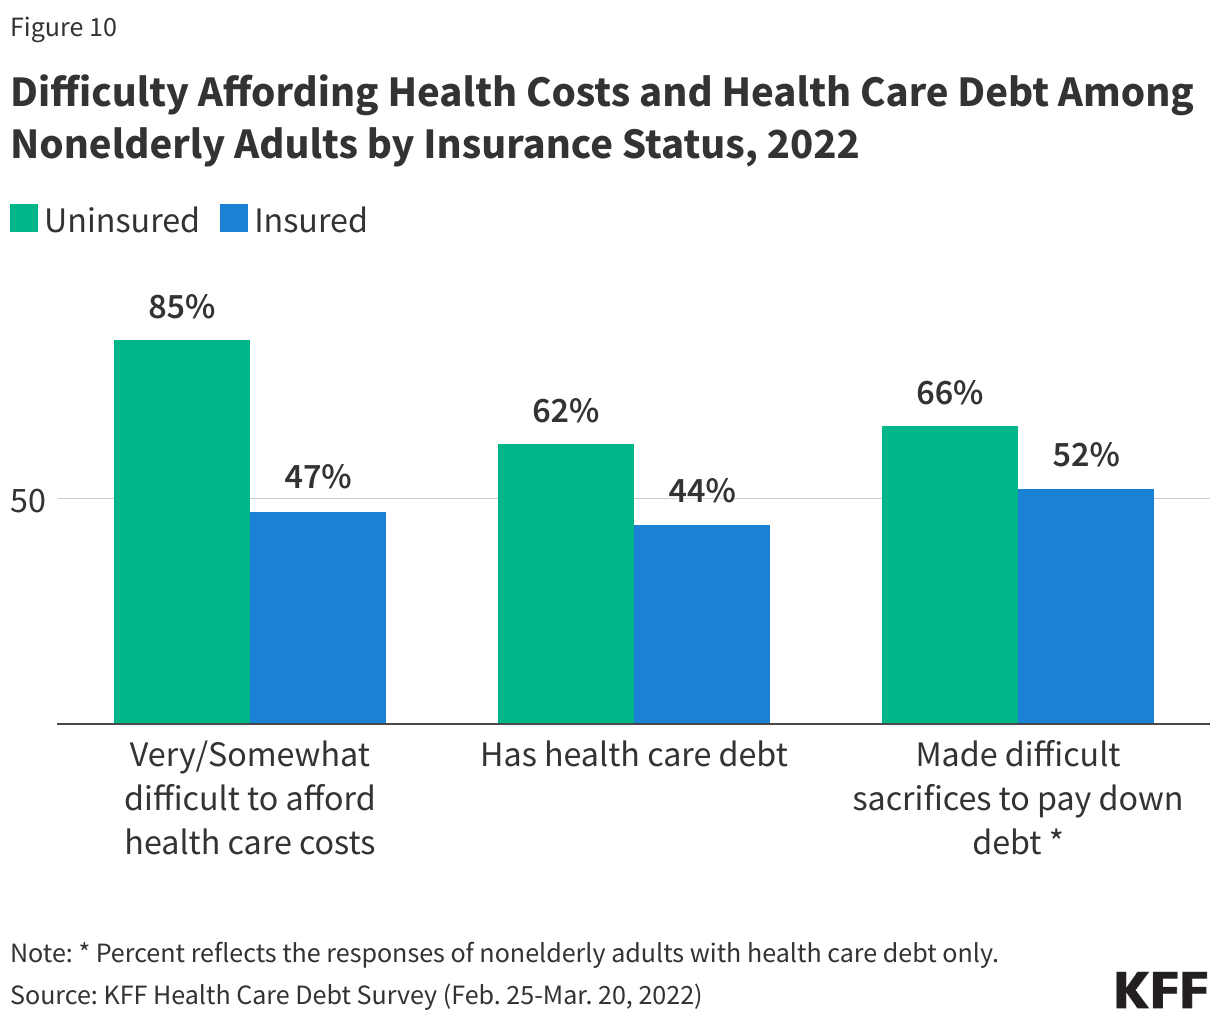
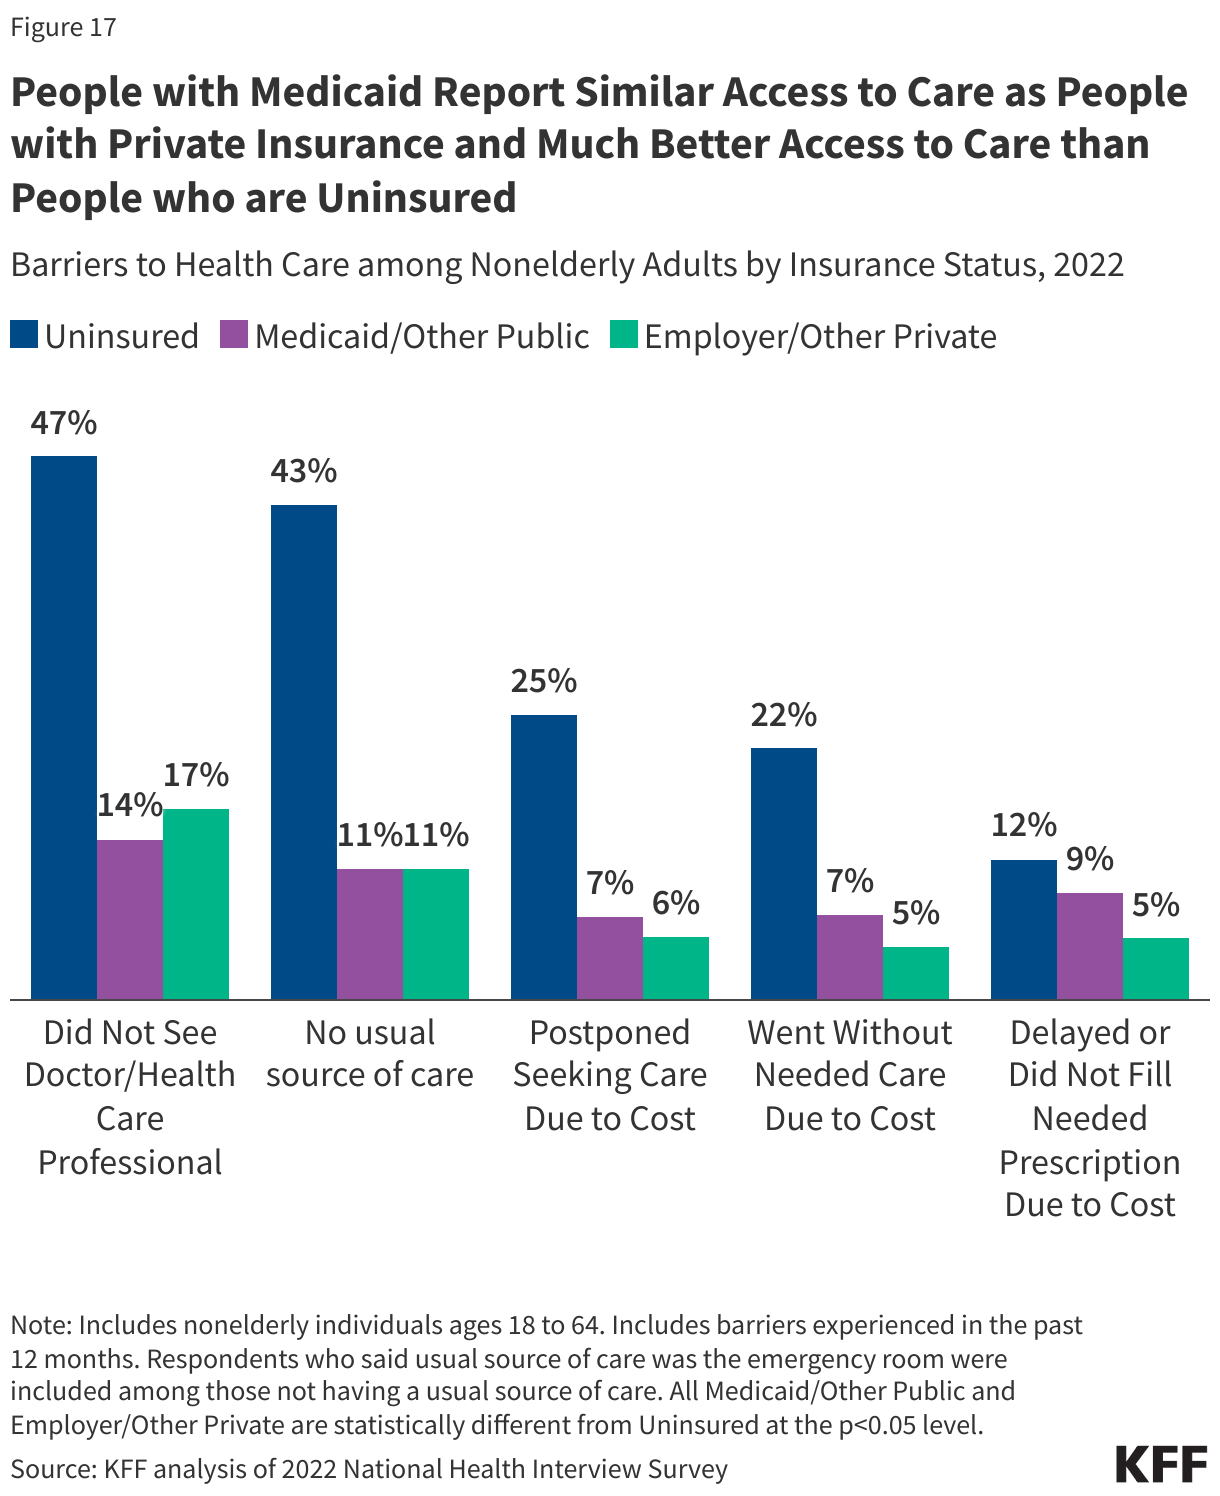
Loss of Medicaid coverage altogether also has implications for access to care, and at least 22 million people, including children and adults, have been disenrolled from Medicaid in the past year due to the unwinding of the Medicaid continuous enrollment provision. In some cases, individuals disenrolled from Medicaid may transition to other coverage, but they may also experience a gap in coverage or become uninsured. KFF analysis shows individuals without insurance coverage have lower access to care and are more likely to delay or forgo care due to costs, and research has found dental care to be more unaffordable than other types of health care.
Appendix
Methods
Data: This analysis used the 2019-2021 T-MSIS Research Identifiable Files, specifically the other services (OT) claims files merged with the demographic-eligibility (DE) files from the Chronic Condition Warehouse (CCW).
Identifying Dental Visits: To identify when an enrollee received a dental service, this analysis used the procedure code sets listed in the Annual Early and Periodic Screening, Diagnostic, and Treatment (EPSDT) Participation Report (CMS-416) instructions (see line 12a-12g) as well as other literature and prior KFF analysis. The following procedure codes were used –
- Preventive dental services only: D1000 – D1999
- Treatment dental services (includes restorative, endodontics, periodontics, implant services and prosthodontics, oral and maxillofacial surgery, orthodontics and adjustive general service): D2000 – D9999
- Any dental service (includes diagnostic, preventive, restorative, endodontics, periodontics, implant services and prosthodontics, oral and maxillofacial surgery, orthodontics and adjustive general service): D0100 – D9999
Defining Rural and Urban Areas: This analysis uses enrollee zip code information and the US Department of Agriculture (USDA) Rural-Urban Commuting Areas (RUCA) codes (based on 2010 census data) to designate rural and urban areas. Zip codes with a RUCA value greater than or equal to 4 are designated as rural.
Enrollee Inclusion Criteria: This analysis includes individuals ages 0 through 64 who were enrolled in Medicaid or CHIP with full benefits for 12 months. The 12-month enrollment period is consistent with prior KFF analysis and recent CMS analysis looking at service utilization among Medicaid/CHIP children.
State Inclusion Criteria: To assess the usability of states’ data, the analysis examined quality assessments from the DQ Atlas for restricted benefits code, claims volume, and managed care encounters and compared the share of children under 21 who used any dental service within the year to the share of children receiving any dental services in the annual EPSDT reporting data files. The analysis excluded states with more than 20-percentage point differences between the share of children receiving any dental services in T-MSIS and the share reported in the state’s annual EPSDT report. Two states (FL and MS) were excluded based on these criteria in 2021, leaving 49 states (including DC) in the main analysis.
For reporting across years (2019-2021) to assess the impact of the pandemic, the analysis also compared dental service use rates in T-MSIS to those reported in the state’s annual EPSDT report, excluding those states with more than a 20-percentage point difference in rates. No states were excluded in 2020 while four additional states (IN, ME, VA, KS) were excluded for 2019. Overall, 6 states were excluded in the analysis of changes over time (FL, IN, ME, MS, VA, KS), leaving 45 states (including DC).
For reporting by race/ethnicity, we excluded states with “High Concern/Unusable” DQ Atlas assessments in 2021. Among states in the main analysis, 14 states were excluded (AZ, CT, DC, HI, IA, LA, MA, NY, OR, RI, SC, TN, UT, and WY). This left 35 states for reporting by race/ethnicity.
For reporting by geographic area, we excluded states with “High Concern/Unusable” DQ Atlas assessments for zip code in 2021. Among states in the main analysis, one state was excluded (VT). This left 48 states (including DC) for reporting by geographic region.
Limitations:
- At the start of the pandemic, Congress enacted the Families First Coronavirus Response Act (FFCRA), which included a requirement that Medicaid programs keep people continuously enrolled in exchange for enhanced federal funding. The continuous enrollment provision increased Medicaid enrollment (and increased the number of individuals with 12 months of enrollment), which could have had implications for service utilization rates in 2020 and 2021.
- Survey data finds a higher share of children receiving dental care (Appendix Table 1), which may be due in part to the following:
- The claims data only capture dental services that were billed to Medicaid and some settings such as community clinics, schools, or Indian Health Service facilities may not always bill Medicaid.
- Research has shown that the accuracy of self-reported utilization in survey data declines over long recall periods and/or for more routine services.
- For a more robust discussion of the variation in utilization rates across data sources, see Box 2 in this prior KFF analysis. This analysis uses claims data (T-MSIS), not self-reported survey data, to examine trends in dental service use because of the increasing use of T-MSIS in EPSDT and Child Core Set reporting.

 Juliette Cubanski
  Meredith Freed
  Nancy Ochieng
  Alex Cottrill
  Jeannie Fuglesten Biniek
  Tricia Neuman
 Robin Rudowitz
  Jennifer Tolbert
  Alice Burns
  Elizabeth Hinton
  Anna Mudumala
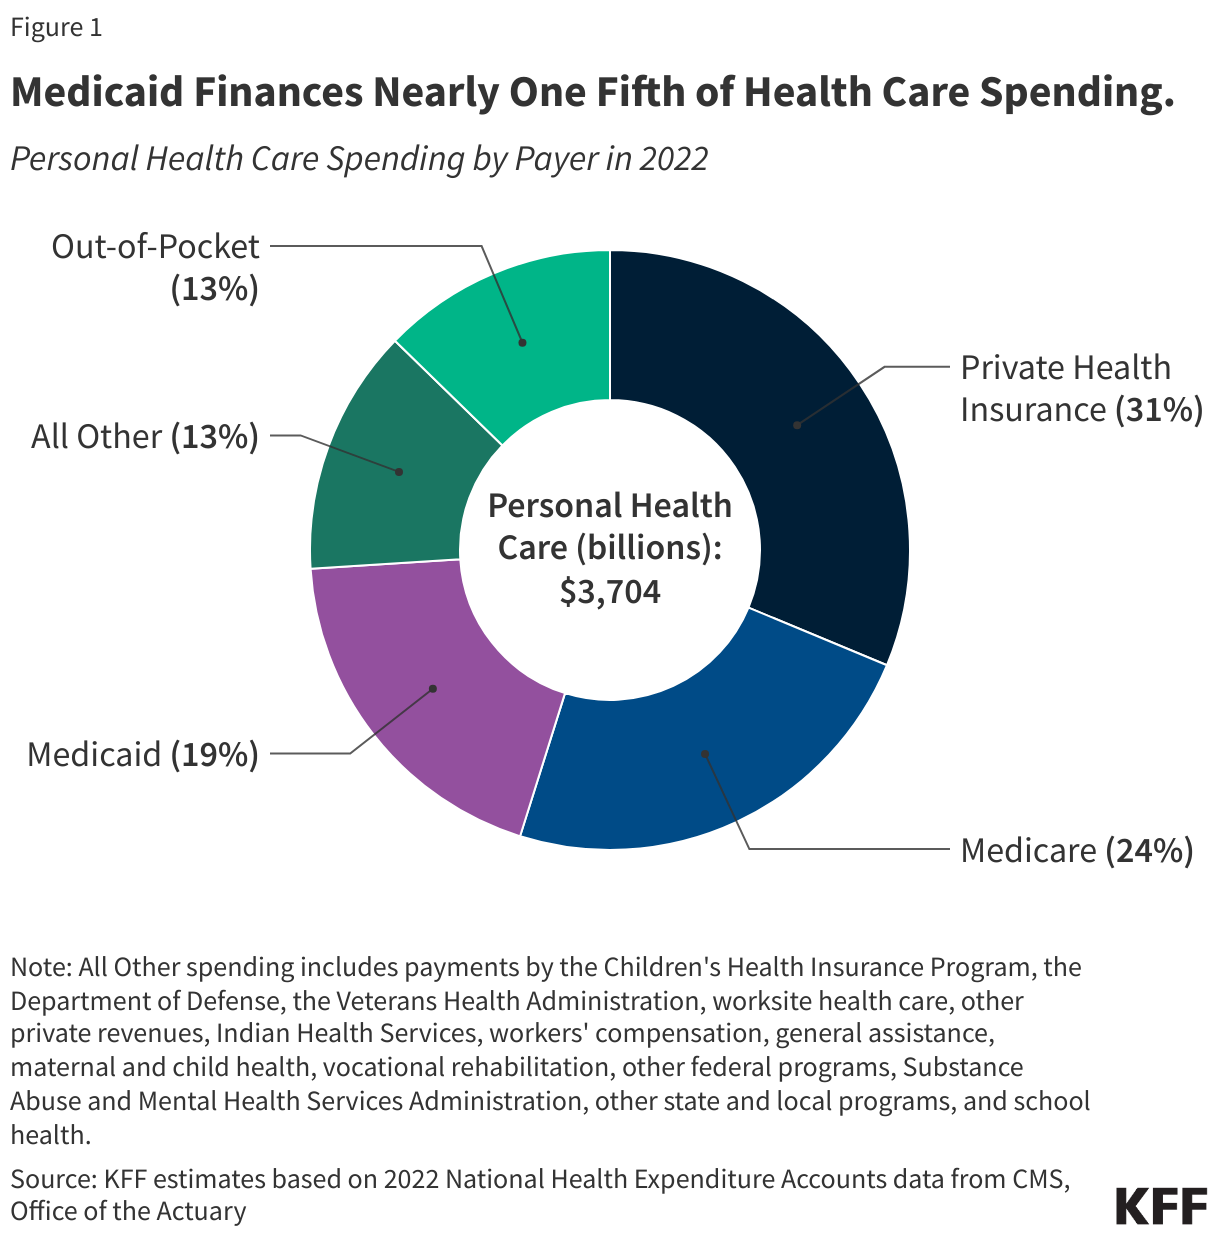
 Jared Ortaliza
  Cynthia Cox
 Gary Claxton
  Matthew Rae
  Aubrey Winger
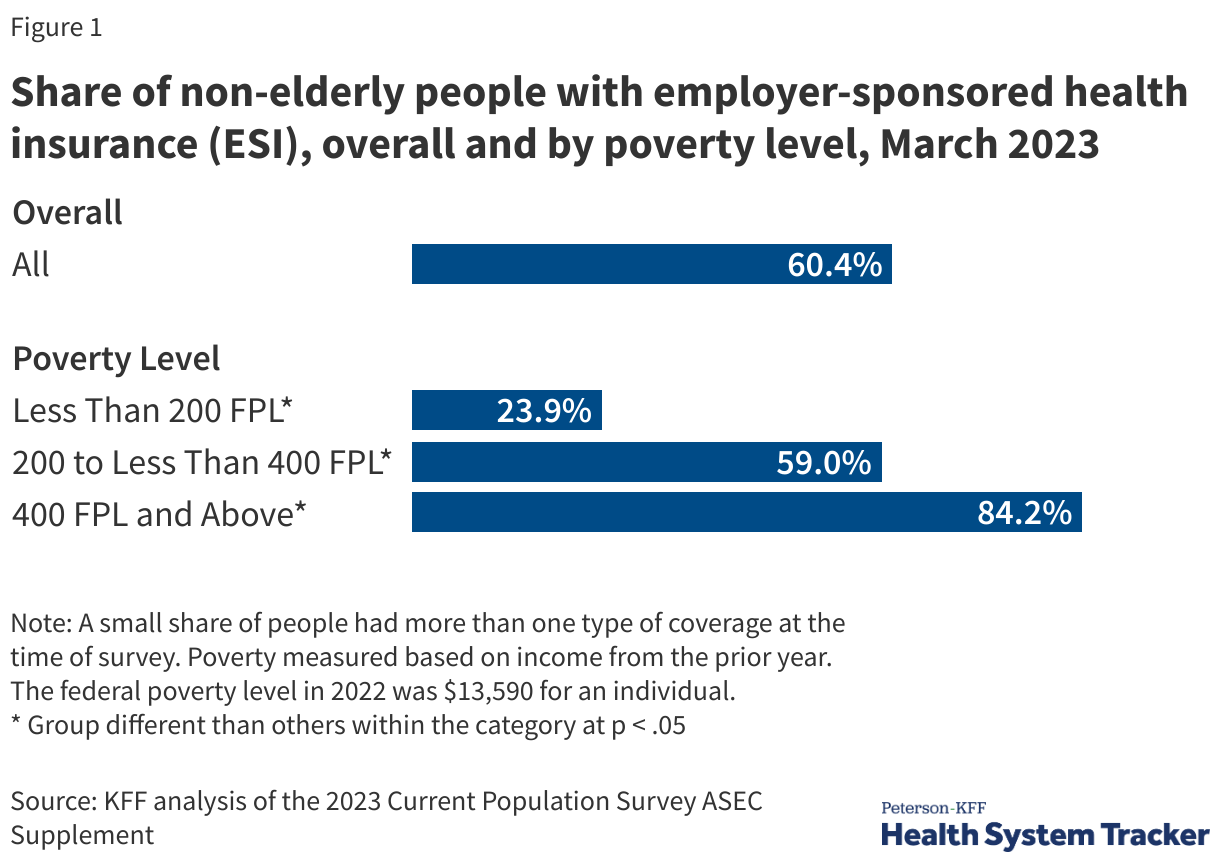
 Rakesh Singh
  Patrick Drake