2023 Employer Health Benefits Survey
Section 2: Health Benefits Offer Rates
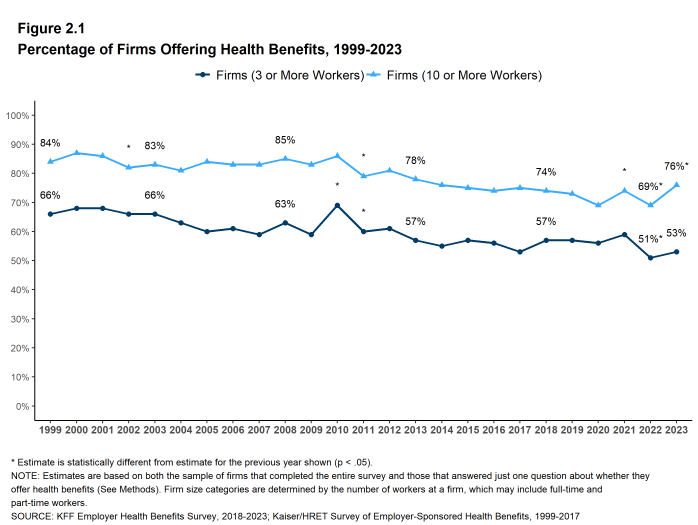
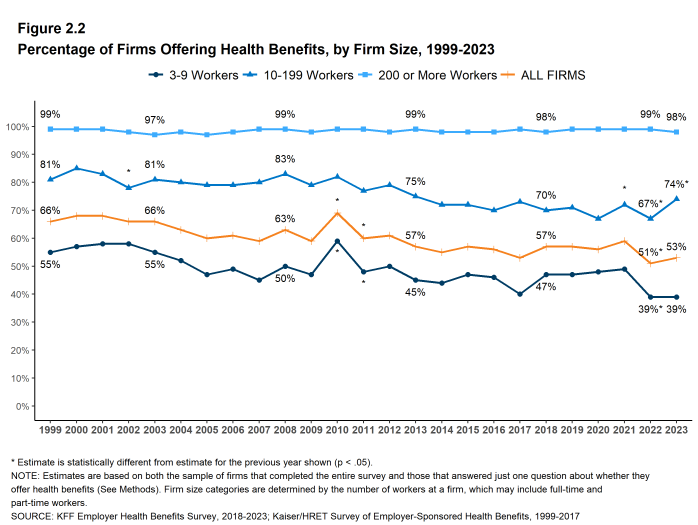
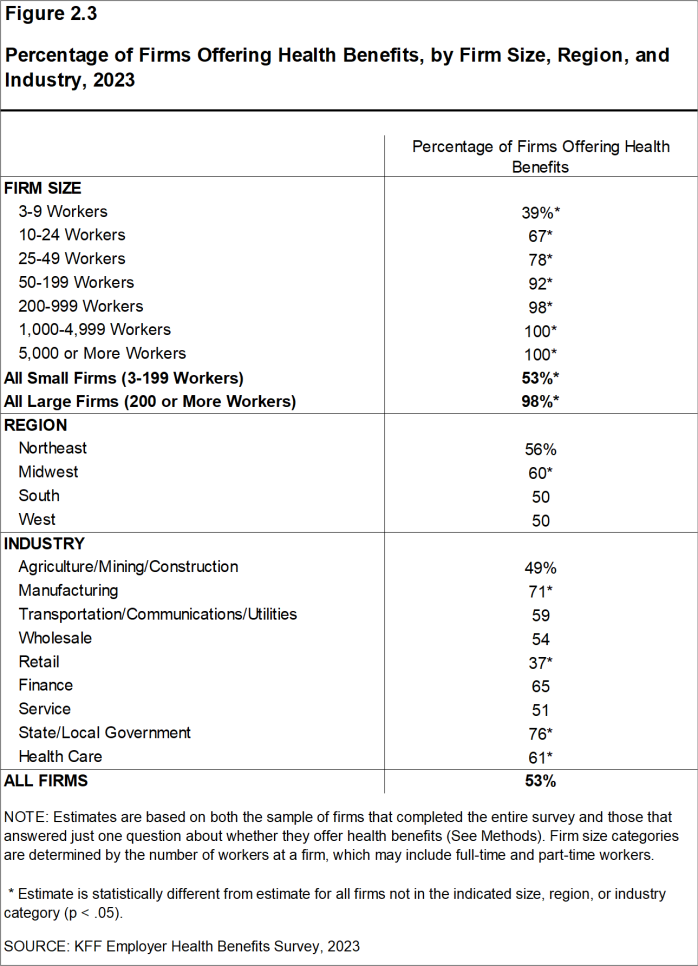
While nearly all large firms (98% of firms 200 or more workers) offer health benefits to at least some workers, smaller firms with 3-199 workers are significantly less likely to do so (53%). The percentage of all firms offering health benefits in 2023 (53%) is similar to both the percentage of firms offering health benefits last year (51%), and five years ago (57%).
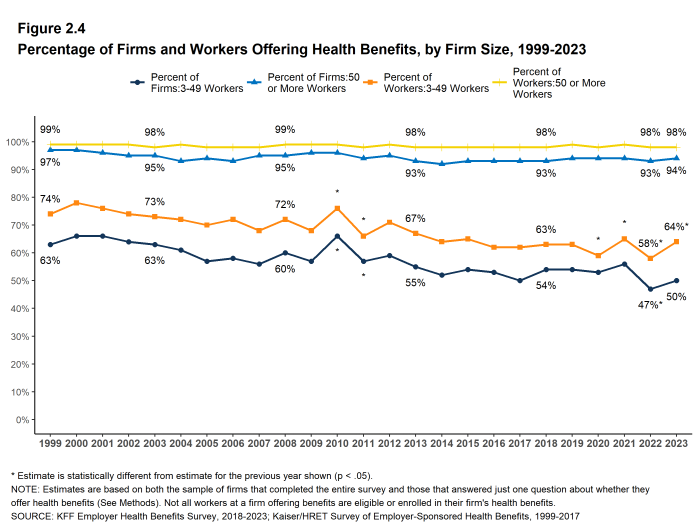
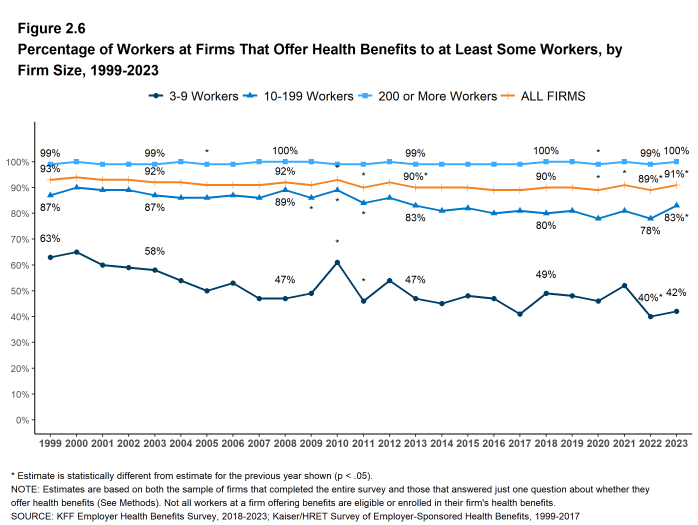
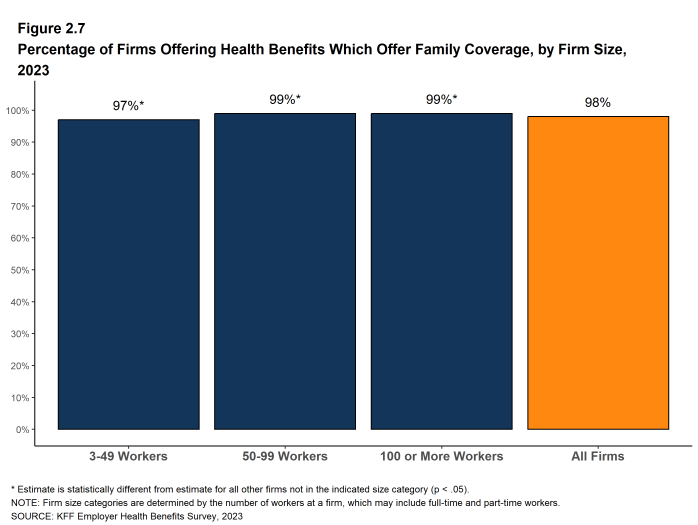
Most firms are very small, so the considerable fluctuation we see across years in the small firm offer rate drives fluctuations in the overall offer rate. However, most workers work for larger firms, where offer rates are high and much more stable. Over ninety percent (94%) of firms with 50 or more workers offer health benefits in 2023; this percentage has remained consistent over the last 10 years. Overall, 91% of workers at firms with 3 or more workers are employed at a firm that offers health benefits to at least some of its workers. Almost all (98%) firms that offer health benefits offer both single and family coverage.
Small firms not offering health benefits say the most important reasons they do not offer coverage are that “the cost of insurance is too high” and that “the firm is too small.”
FIRM OFFER RATES
- In 2023, 53% of firms offer health benefits, similar to the percentage last year (51%) [Figure 2.1].
- The smallest-sized firms are least likely to offer health insurance: 39% of firms with 3-9 workers offer coverage, compared to 67% of firms with 10-24 workers, 78% of firms with 25-49 workers, and 92% of firms with 50-199 workers [Figure 2.3].
- Since most firms in the country are small, variation in the overall offer rate is driven largely by changes in the offer rates of the smallest firms (3-9 workers) offering health benefits [Figure 2.2]. For more information on the distribution of firms in the country, see the Survey Design and Methods Section and [Figure M.5].
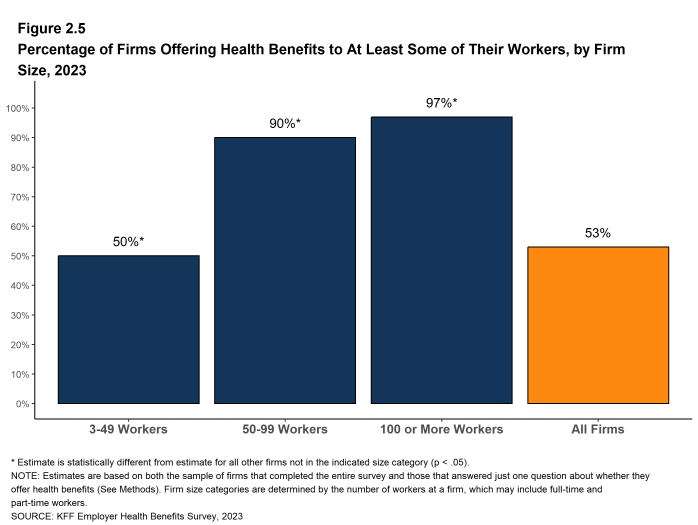
- Only 50% of firms with 3-49 workers offer health benefits to at least some of their workers, compared to 94% of firms with 50 or more workers [Figure 2.5].
- Because most workers are employed by larger firms, most workers work at a firm that offers health benefits to at least some of its employees. Ninety-one percent of all workers are employed by a firm that offers health benefits to at least some of its workers [Figure 2.6].
Figure 2.5: Percentage of Firms Offering Health Benefits to at Least Some of Their Workers, by Firm Size, 2023
SPOUSES, DEPENDENTS, AND DOMESTIC PARTNER BENEFITS
- The vast majority of firms offering health benefits offer to spouses and dependents, such as children.
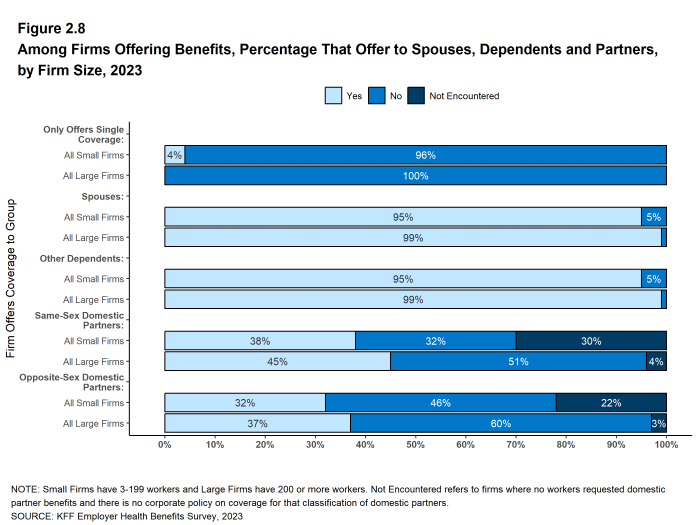
- Ninety-five percent of small firms and 99% of large firms offering health benefits offer coverage to spouses, the same as the percentage of larger firms offering spousal coverage in 2020 (99%) [Figure 2.8].
- Ninety-five percent of small firms and 99% of large firms offering health benefits cover dependents other than spouses, such as children, similar to the percentage of large firms offering dependent coverage in 2020 (100%) [Figure 2.8].
- Four percent of small firms offering health benefits offer only single coverage to their workers, similar to the percentage in 2020 (4%) [Figure 2.8].
- Firms were also asked whether they offer health benefits to same-sex or opposite-sex domestic partners. While definitions may vary, employers often define domestic partners as an unmarried couple who has lived together for a specified period of time. Firms may define domestic partners separately from any legal requirements a state may have.
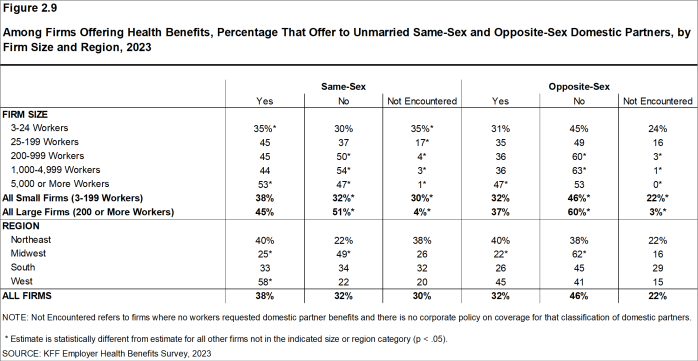
- Thirty-two percent of firms offering health benefits offer coverage to opposite-sex domestic partners, similar to the 34% that did so in 2019 [Figure 2.9].
- Thirty-eight percent of firms offering health benefits offer coverage to same-sex domestic partners, similar to the 43% that did so in 2019 [Figure 2.9].
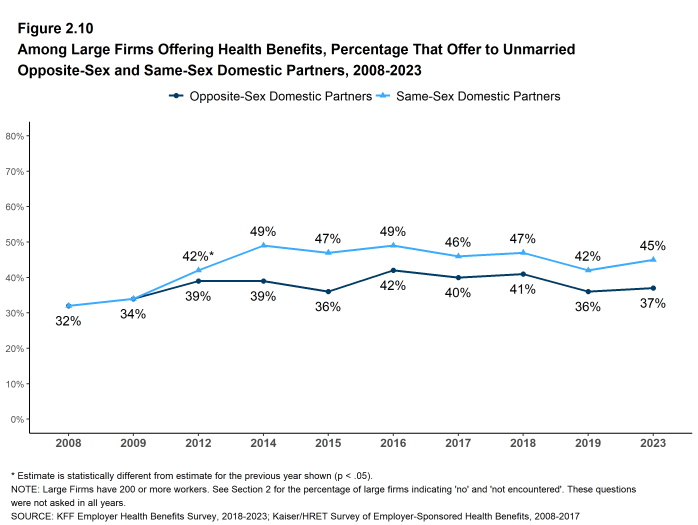
- Thirty-seven percent of large firms offering health benefits offer coverage to opposite-sex domestic partners, similar to the 36% that did so in 2019 [Figure 2.10].
- Forty-five percent of large firms offering health benefits offer coverage to same-sex domestic partners, similar to the 42% that did so in 2019 [Figure 2.10].
- When firms are asked if they offer health benefits to opposite or same-sex domestic partners, many small firms report that they have not encountered this issue. These firms may not have formal human resource policies on domestic partners simply because none of the firm’s workers have asked to cover a domestic partner.
- Regarding health benefits for opposite-sex domestic partners, 22% of small firms report that they have not encountered this request or that the question was not applicable [Figure 2.9].
- Similarly, for health benefits for same-sex domestic partners, 30% of small firms report that they have not encountered the request or that the question was not applicable [Figure 2.9].
Figure 2.7: Percentage of Firms Offering Health Benefits Which Offer Family Coverage, by Firm Size, 2023
Figure 2.8: Among Firms Offering Benefits, Percentage That Offer to Spouses, Dependents and Partners, by Firm Size, 2023
Figure 2.9: Among Firms Offering Health Benefits, Percentage That Offer to Unmarried Same-Sex and Opposite-Sex Domestic Partners, by Firm Size and Region, 2023
PART-TIME WORKERS
Among firms offering health benefits, relatively few offer benefits to their part-time workers.
The Affordable Care Act (ACA) defines “full-time” workers as those who work an average of at least 30 hours per week, and “part-time” workers as those who work fewer than 30 hours. The employer shared responsibility provision of the ACA requires that firms with at least 50 full-time equivalent employees offer most of their full-time employees coverage that meets minimum standards or be assessed a penalty.10
Beginning in 2015, we modified the survey to explicitly ask employers whether they offered benefits to employees working fewer than 30 hours per week. The question did not previously include a definition of “part-time.” For this reason, historical data on part-time offer rates are shown, but we did not test whether the differences between 2014 and 2015 were significant. Many employers use multiple definitions of “part-time” – one for compliance with legal requirements, and another for internal policies and programs.
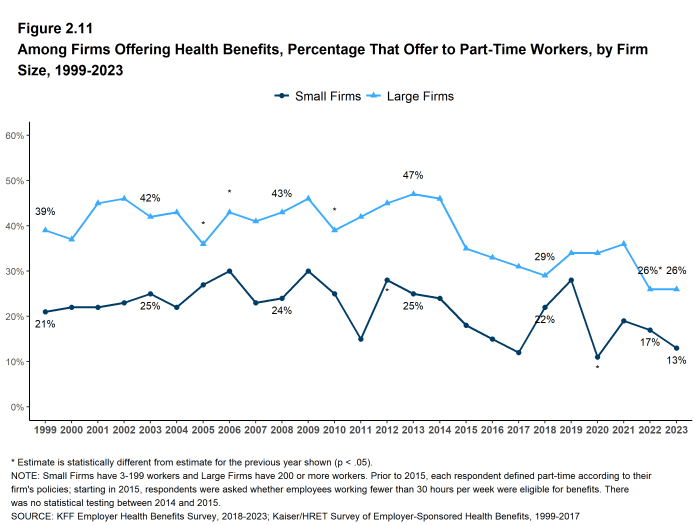
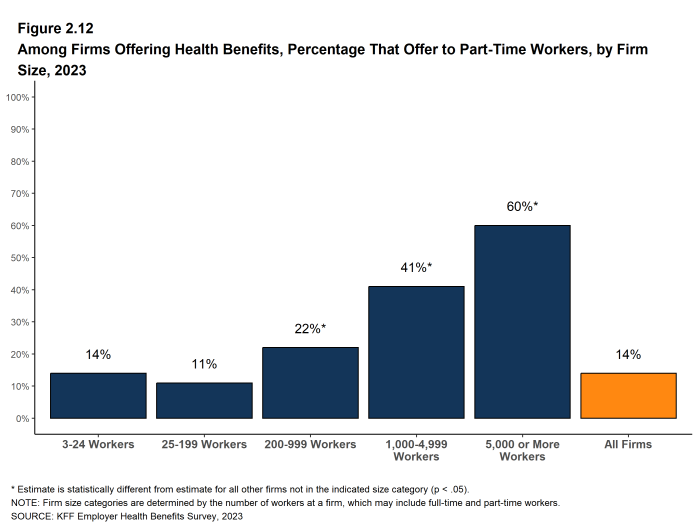
- Twenty-six percent of large firms that offer health benefits in 2023 offer health benefits to part-time workers, the same percentage that did so in 2022 [Figure 2.11]. The share of large firms offering health benefits to part-time workers increases with firm size [Figure 2.12].
Figure 2.11: Among Firms Offering Health Benefits, Percentage That Offer to Part-Time Workers, by Firm Size, 1999-2023
VOLUNTARY INSURANCE BENEFITS
Many firms offer voluntary benefits to their workers, separate from coverage provided through their health plans. These plans can help with costs that are not covered by the health plan, or provide additional financial assistance if an enrollee is hospitalized or develops a serious health condition. Employers might contribute toward the cost of these benefits, or employees might pay the entire cost.
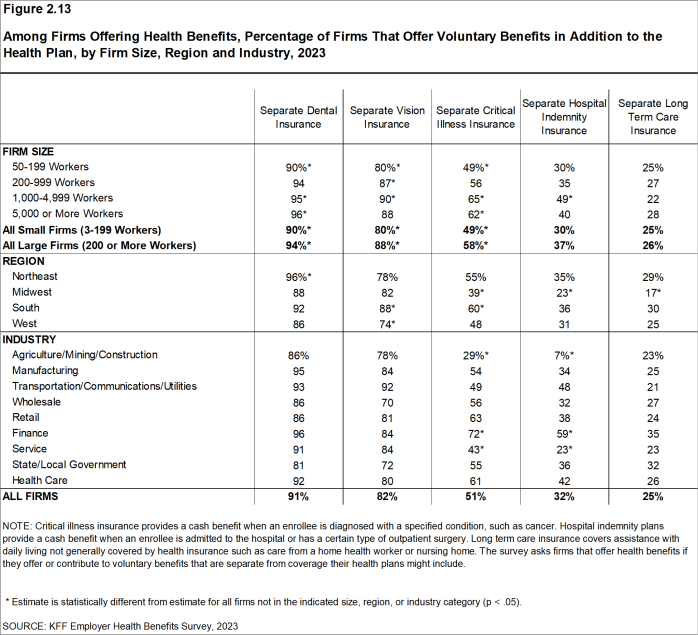
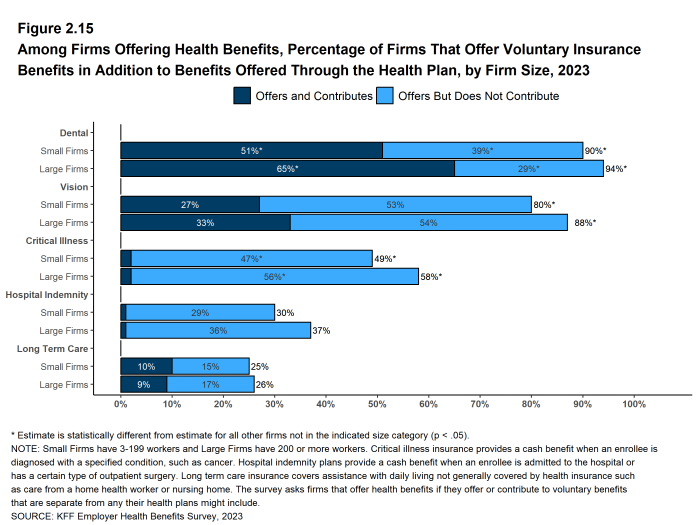
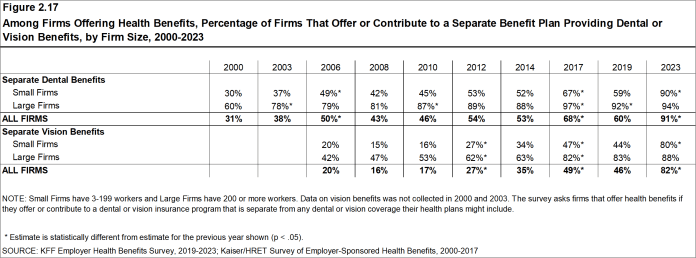
- Among firms offering health benefits in 2023, 90% of small firms and 94% of large firms offer a dental insurance program to their workers, separate from any plan included in their health benefits plan [Figure 2.13].
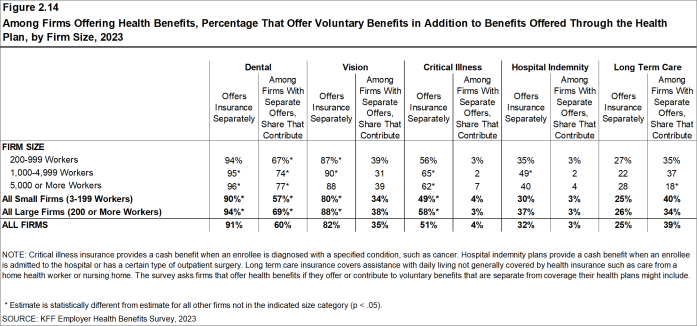
- Sixty percent of firms offering a dental program to their workers make a contribution toward the cost of coverage [Figure 2.14].
- Among firms offering health benefits in 2023, 80% of small firms and 88% of large firms offer a vision insurance program to their workers, separate from any plan included in their health benefits plan [Figure 2.13].
- Thirty-five percent of firms offering a vision program to their workers make a contribution toward the cost of coverage [Figure 2.14].
- Among firms offering health benefits in 2023, 49% of small firms and 58% of large firms offer critical illness insurance to their workers [Figure 2.13].
- Four percent of firms offering critical illness insurance to their workers make a contribution toward the cost of coverage [Figure 2.14].
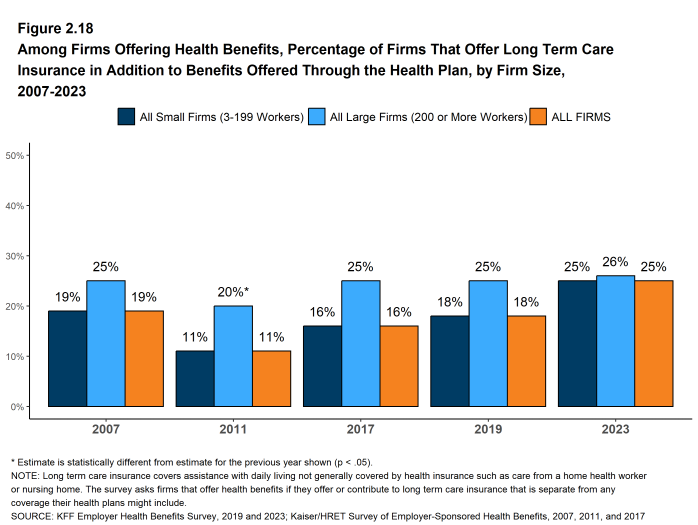
- Among firms offering health benefits in 2023, 25% offer long-term care insurance to their workers [Figure 2.13].
- Thirty-nine percent of firms offering long-term care insurance to their workers make a contribution toward the cost of coverage [Figure 2.14].
Figure 2.13: Among Firms Offering Health Benefits, Percentage of Firms That Offer Voluntary Benefits in Addition to the Health Plan, by Firm Size, Region and Industry, 2023
Figure 2.14: Among Firms Offering Health Benefits, Percentage That Offer Voluntary Benefits in Addition to Benefits Offered Through the Health Plan, by Firm Size, 2023
Figure 2.15: Among Firms Offering Health Benefits, Percentage of Firms That Offer Voluntary Insurance Benefits in Addition to Benefits Offered Through the Health Plan, by Firm Size, 2023
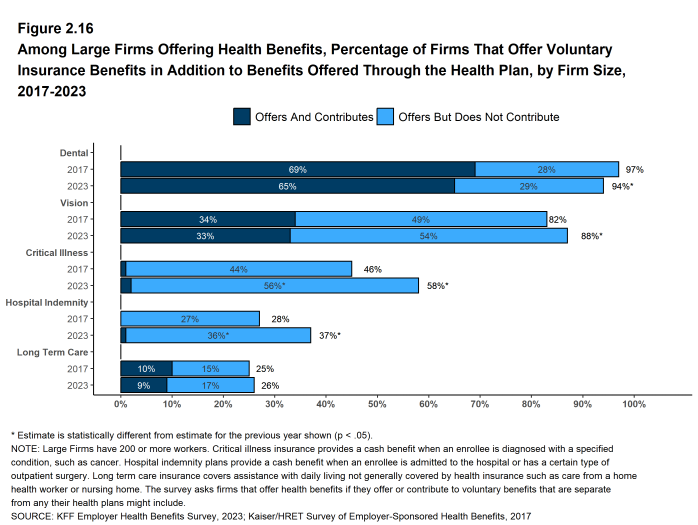
Figure 2.16: Among Large Firms Offering Health Benefits, Percentage of Firms That Offer Voluntary Insurance Benefits in Addition to Benefits Offered Through the Health Plan, by Firm Size, 2017-2023
Figure 2.17: Among Firms Offering Health Benefits, Percentage of Firms That Offer or Contribute to a Separate Benefit Plan Providing Dental or Vision Benefits, by Firm Size, 2000-2023
ICHRA AND ASSISTING EMPLOYEES WITH PURCHASING COVERAGE IN THE NON-GROUP MARKET
Some employers provide funds to some or all of their employees to help them purchase coverage in the individual (“non-group”) market. Employers that do not otherwise offer health benefits may offer these funds as an alternative to offering a group plan. Additionally, employers that offer a group plan to some employees may use this approach for other types or classes of workers, such as part-time employees. One way an employer can provide tax-preferred assistance for employees to purchase non-group coverage is through an Individual Coverage Health Reimbursement Arrangement, or ICHRA. Both employers that offer and those that do not offer health benefits were asked if they provide funds to any employee to purchase non-group coverage.
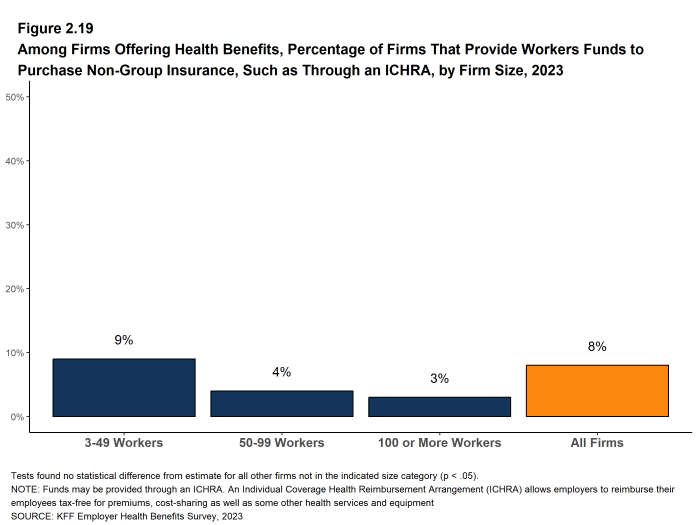
- Eight percent of firms offering health benefits, and 12% of firms not offering health benefits, offered funds to one or more of their employees to purchase non-group coverage in 2023 [Figure 2.19].
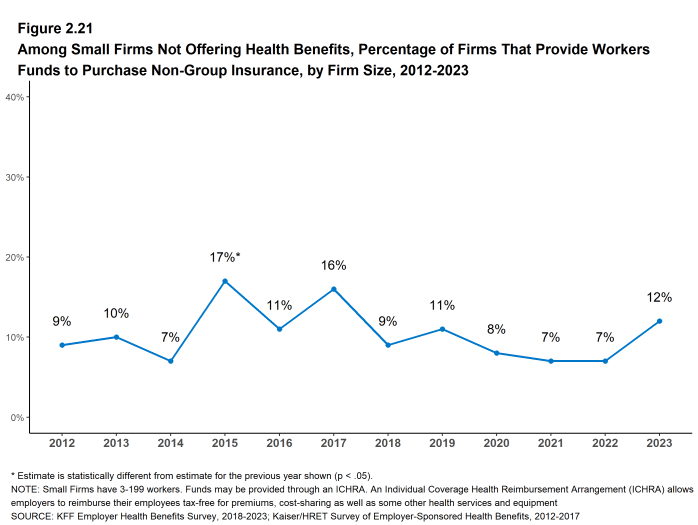
- Among small firms not offering health benefits, 12% offered funds to one or more of their employees to purchase non-group coverage, a similar percentage (7%) as last year [Figure 2.21].
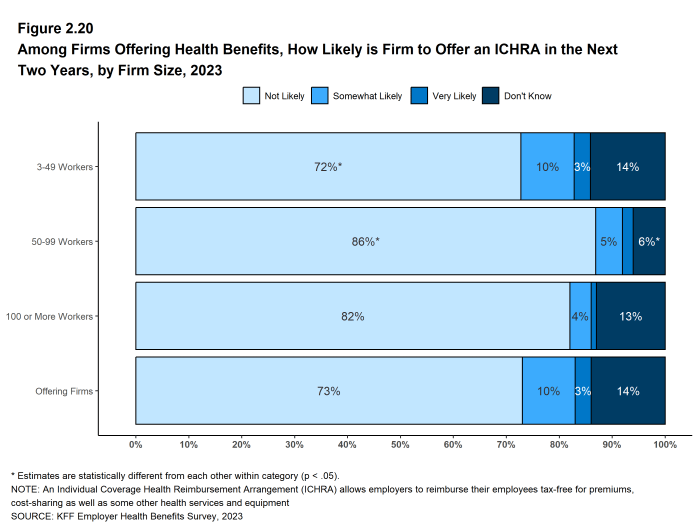
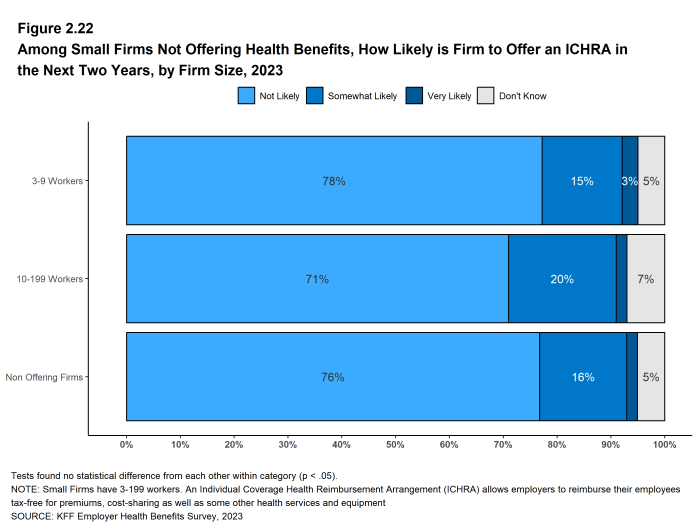
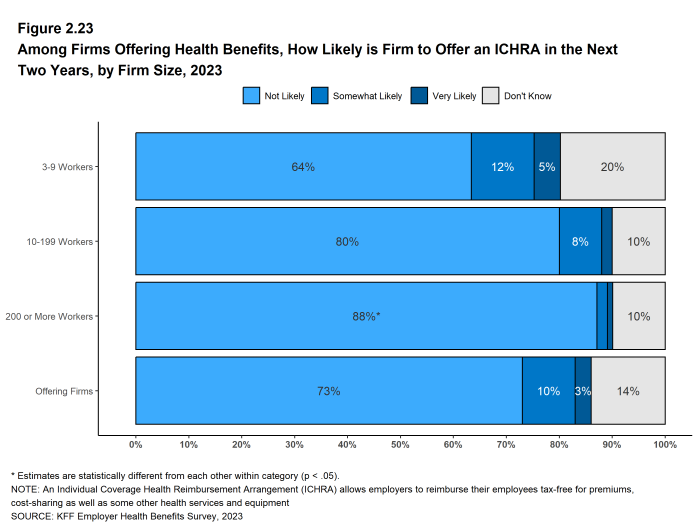
- Among firms offering health benefits that do not offer funds to any employees to purchase non-group coverage in 2023, 3% say they are “very likely” and an additional 10% are “somewhat likely” to offer an ICHRA to at least some employees in the next two years [Figure 2.20]. Among small firms not offering health benefits that do not offer funds to any employees to purchase non-group coverage in 2023, only 2% say they are “very likely” and an additional 16% say they are “somewhat likely” to offer an ICHRA to at least some employees in the next two years [Figure 2.22].
Figure 2.19: Among Firms Offering Health Benefits, Percentage of Firms That Provide Workers Funds to Purchase Non-Group Insurance, Such As Through an ICHRA, by Firm Size, 2023
Figure 2.20: Among Firms Offering Health Benefits, How Likely Is Firm to Offer an ICHRA in the Next Two Years, by Firm Size, 2023
Figure 2.21: Among Small Firms Not Offering Health Benefits, Percentage of Firms That Provide Workers Funds to Purchase Non-Group Insurance, by Firm Size, 2012-2023
Figure 2.22: Among Small Firms Not Offering Health Benefits, How Likely Is Firm to Offer an ICHRA in the Next Two Years, by Firm Size, 2023
FIRMS NOT OFFERING HEALTH BENEFITS
- The survey asks firms that do not offer health benefits several questions, including whether they have offered insurance or shopped for insurance in the recent past, what their most important reasons for not offering coverage are, and their opinion on whether their employees would prefer an increase in wages or health insurance if additional funds were available to increase their compensation. Because such a small percentage of large firms report not offering health benefits, we present responses for small non-offering firms only.
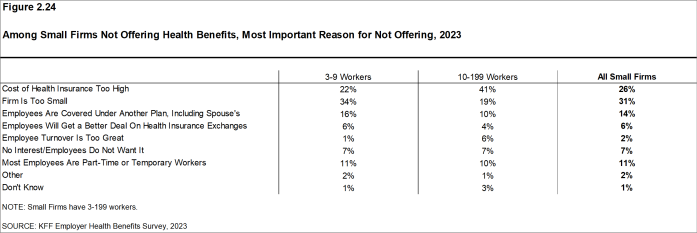
- The “firm is too small” and the “cost of insurance is too high” are the most common reasons small firms cite for not offering health benefits. Among small firms asked about the most important reason for not offering health benefits, 31% say the “firm is too small,” 26% say the cost of insurance is too high, 14% say their “employees are covered under another plan, including coverage on a spouse’s plan” and 7% say their “employees are not interested.” A few small firms indicate that they do not offer health benefits because they believe employees will get a better deal on the health insurance exchanges (6%) [Figure 2.24].
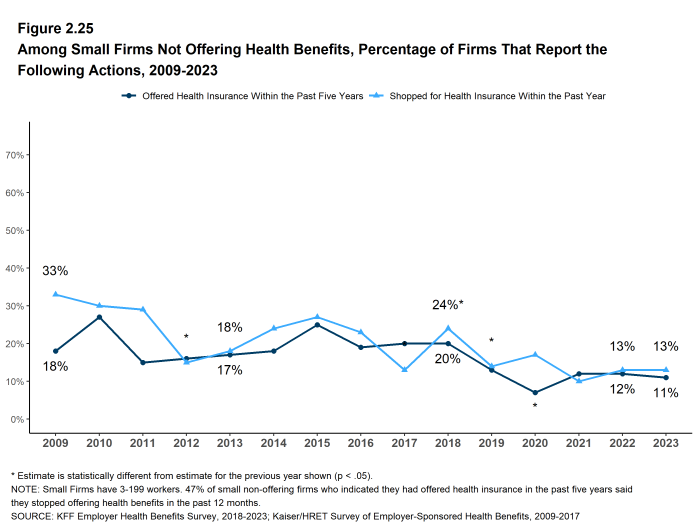
- Some small non-offering firms have either offered health insurance in the past five years or shopped for health insurance in the past year.
- Eleven percent of small non-offering firms have offered health benefits in the past five years, similar to the percentage reported last year [Figure 2.25]. Among these small non-offering firms, 47% stopped offering coverage within the past year.
- Thirteen percent of small non-offering firms have shopped for coverage in the past year, the same as the percentage last year (13%) [Figure 2.25].
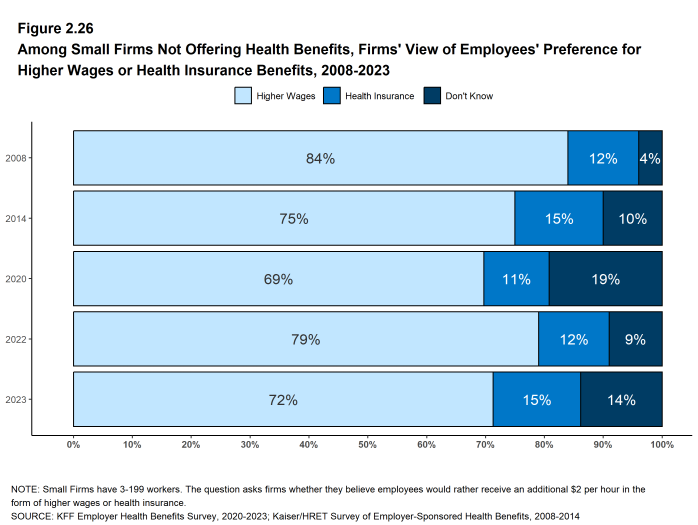
- Seventy-two percent of small firms not offering health benefits agreed with the statement that their employees would prefer a two dollar per hour increase in wages rather than health insurance. [Figure 2.26].
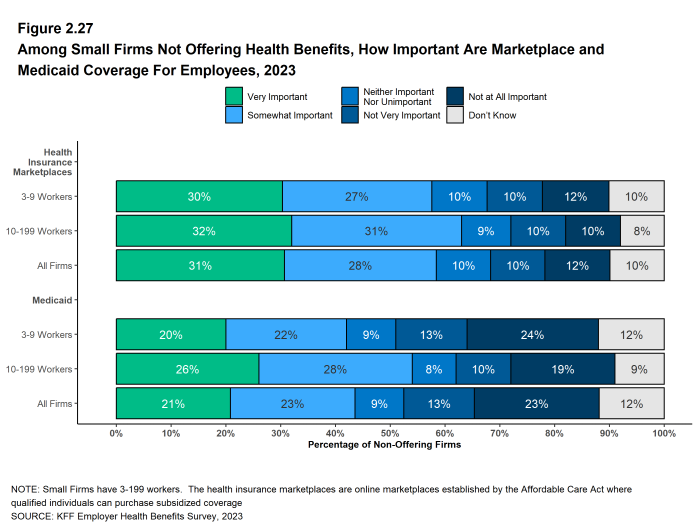
- Non-offering firms were asked about the importance of health insurance marketplaces and Medicaid in providing coverage options for their employees.
- Fifty-nine percent of small non-offering firms indicated that health insurance marketplaces are “very important” or “somewhat important” in providing coverage options for their employees [Figure 2.27].
- Forty-four percent of small non-offering firms indicated that Medicaid is “very important” or “somewhat important” in providing coverage to one or more of their employees [Figure 2.27].
Figure 2.24: Among Small Firms Not Offering Health Benefits, Most Important Reason for Not Offering, 2023
Figure 2.25: Among Small Firms Not Offering Health Benefits, Percentage of Firms That Report the Following Actions, 2009-2023
Figure 2.26: Among Small Firms Not Offering Health Benefits, Firms’ View of Employees’ Preference for Higher Wages or Health Insurance Benefits, 2008-2023
- Internal Revenue Code. 26 U.S. Code § 4980H – Shared responsibility for employers regarding health coverage. 2011. https://www.gpo.gov/fdsys/pkg/USCODE-2011-title26/pdf/USCODE-2011-title26-subtitleD-chap43-sec4980H.pdf↩︎

