Ending the HIV Epidemic (EHE) Funding Tracker
The “Ending the HIV Epidemic Initiative” (EHE), is a federal effort to reduce new HIV infections in the United States, launched by the first Trump administration in 2019, with the goal of a 75% reduction in five years and 90% reduction in ten years. The EHE built on earlier efforts made by the Obama administration and was continued throughout the Biden administration.
The initiative has focused on a subset of “Priority Jurisdictions”, comprised of the 48 counties in the U.S. that had the largest number of HIV diagnoses (in 2018), as well as San Juan, Puerto Rico, Washington D.C., and 7 states with a substantial share of rural HIV cases (see Figure 1). It also has been accompanied by additional federal funding, including reprogrammed funding in FY 2019 and new Congressional appropriations in FY 2020 through FY 2025. Still, this additional funding accounts for a relatively small share of overall federal HIV funding provided to state and local jurisdictions.
While the second Trump administration has continued the EHE. However, there were some questions as to whether it would when a leaked document suggested the administration may not support EHE early on. The administration has proposed cutting HIV prevention funding at the Centers for Disease Control and Prevention (CDC) and moving that EHE funding to the proposed Adminstration for Healthy America (AHA). More recently, the CDC’s HIV Prevention branch and the Office at Health and Human Services (HHS) tasked with coordinating the EHE were eliminated as were key HIV officials at NIH as was the Office of Infectious Disease Policy at HHS, which coordinated EHE.
This tracker provides up-to-date data on federal EHE funding, including an overview of funding mechanisms by year, agency, grant mechanism, and jurisdiction. It will be updated over time.
Funding by Year, Agency, and Grant Mechanism
While FY 2020 is considered the first year of EHE funding, in FY 2019, some funds were reprogrammed from existing accounts to help start the initiative. From FY 2019-2024, funding totaled $2.33 billion. Funding for the EHE increased each year from FY 2020-2023 but has since been flat funded. (See Table 1.)
Prior to the Congressional appropriations process, the administration makes a presidential budget request for Congress to consider. A budget request lays out presidential priorities both in terms of the policy issues identified and the level of funding requested. Table 2 provides the history of EHE presidential budget requests showing that EHE funding requests increased each year from FY 2020 to FY 2023. In FY 2024 the request was flat compared to the prior year. The FY 2025 budget request represents a $256.75 million decrease compared to the FY 2024 request. Since then, funding has been similar except for the Indian Health Services (IHS), which has seen declining request levels. (seen in Table 1).
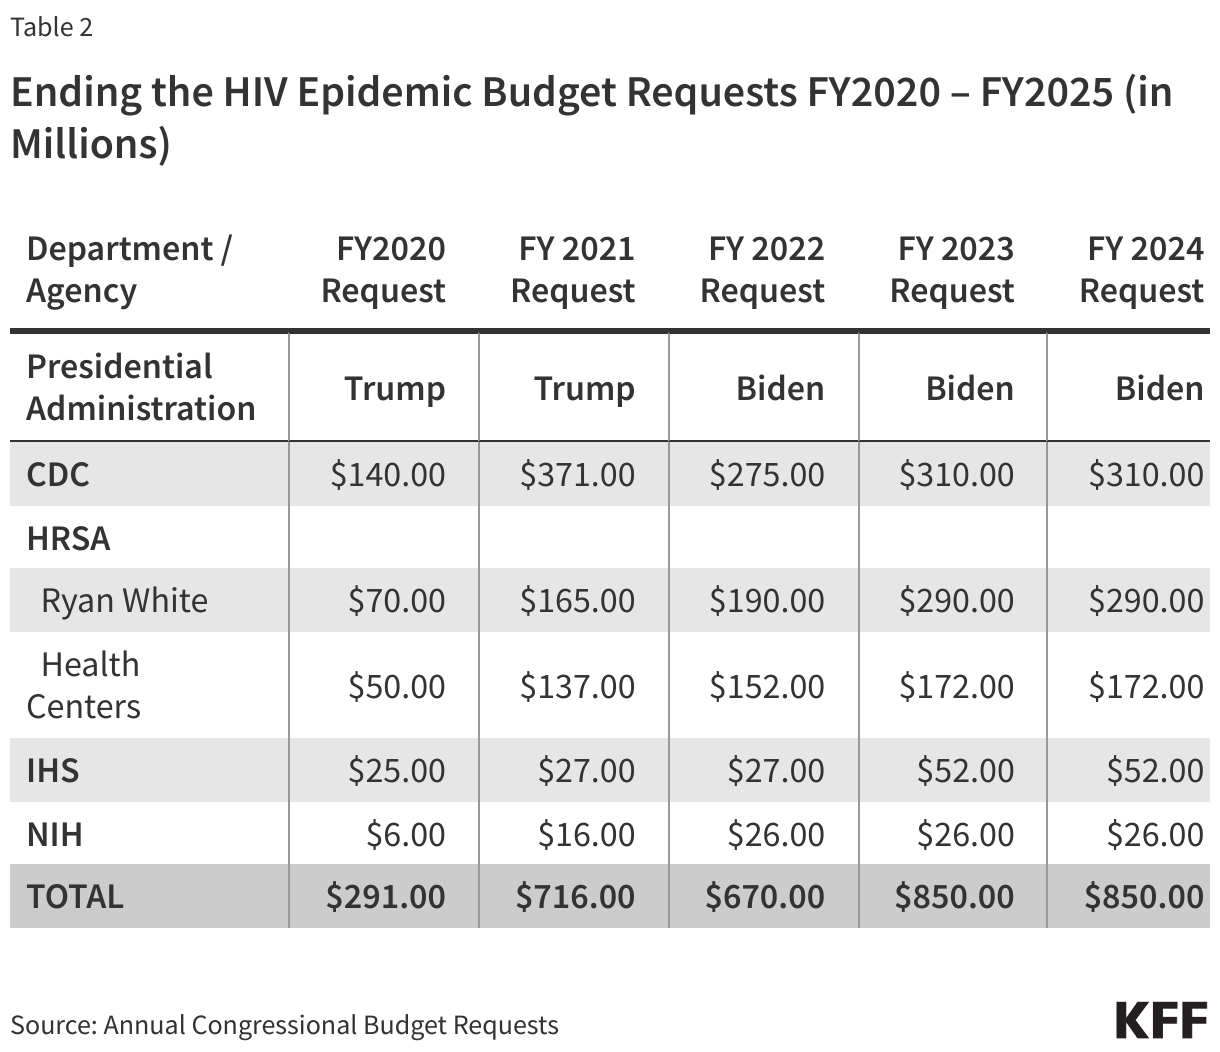
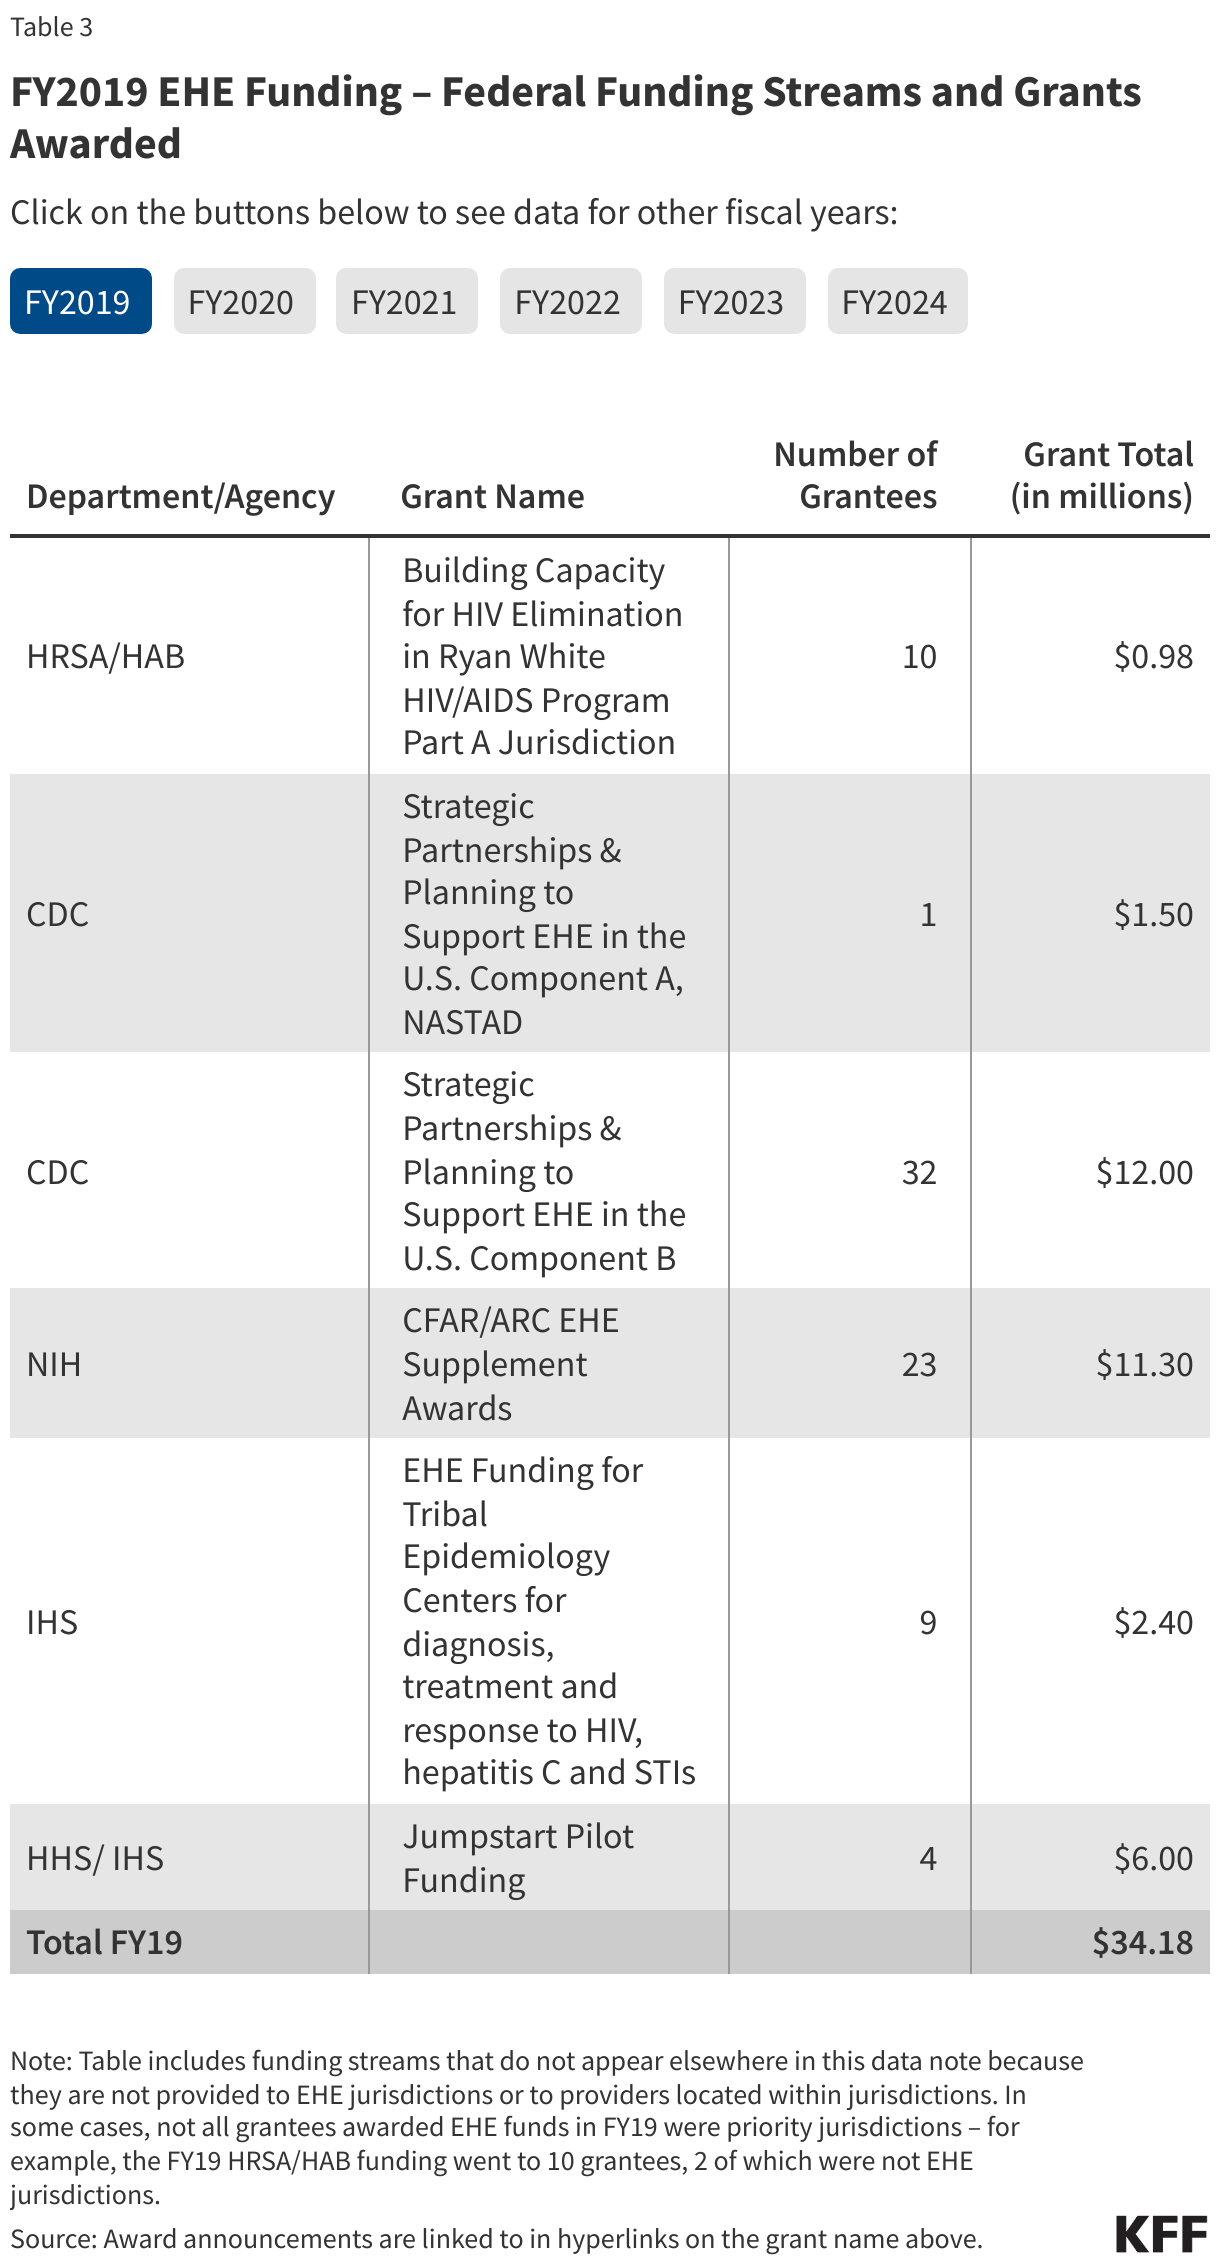
Table 3 provides detail on each federal EHE grant mechanism by agency. Most EHE funding is allocated directly to EHE jurisdictions to assist with local efforts. A subset of EHE funding is provided to other grantees to carry out related efforts, such as to support capacity building and technical assistance and for science implementation hubs through NIH-funded Centers for AIDS Research (CFAR) and the NIMH AIDS Research Centers (ARC) programs.
Funding by Year and Jurisdictions
Tables 4 and 5 detail funding from FY 2019 to FY 2024 directed to EHE priority jurisdictions (data for FY 2025 are not yet available). Table 4 includes funding directed to EHE Counties and other local jurisdictions. Table 5 includes funding directed to the seven EHE states. See notes in these tables for details on how funding was allocated in this analysis.