Note: Originally published in May 2023, this brief has been updated and expanded to address ongoing litigation in many states that is underway to challenge exceptions laws.
Key Takeaways
Abortion is currently banned in 14 states and many other states have attempted to ban or severely restrict access to abortion. All of these bans have an exception to prevent the death of the pregnant person and some bans include other exceptions that fall into three categories: when there is risk to the health of the pregnant person, when the pregnancy is the result of rape or incest, and when there is a lethal fetal anomaly.
- In practice, health and life exceptions to bans have often proven to be unworkable, except in the most extreme circumstances, and have sometimes prevented physicians from practicing evidence-based medicine.
- Abortion bans and restrictions have led physicians to delay providing miscarriage management care. Many states allow for the removal of a dead fetus or embryo, but pregnant people who are actively miscarrying may be denied care if there is still detectable fetal cardiac activity or until the miscarriage puts the life of the pregnant person in jeopardy.
- Mental health exceptions are rare despite the fact that 20% of pregnancy-related deaths are attributable to mental health conditions.
- Law enforcement involvement is often required to document rape and incest, which often prevents survivors from accessing abortion care. Furthermore, survivors in states where abortion care is restricted can have difficulty finding an abortion provider.
- In many states there is more than one abortion ban in the books, and in some of those states, the exception provisions in the bans are often at odds with each other. These multiple bans and varying exceptions create confusion among patients and providers.
Introduction
Since the Supreme Court’s Dobbs decision overturned Roe v. Wade, state abortion bans and the exceptions they contain – or lack – have garnered significant attention. The Supreme Court is considering a case this term about whether the Emergency Medical Treatment and Active Labor Act (EMTALA), a federal law requiring hospitals to provide stabilizing treatment to patients who present to their emergency rooms, preempts state abortion laws and requires hospitals to provide abortion care when it is necessary to stabilize a patient, even when the abortion does not qualify foris not including in an exception to the state’s abortion ban. Discussions about exceptions to state abortion bans often obscure the reality that many of these exceptions can be unworkable in practice. There are reports of people being unable to obtain abortions, despite the fact that their pregnancies fall into these broad exception categories. While there is no accurate estimate of the number of people seeking abortion care in circumstances that qualify for an exception in states than ban abortion, the number of people who have received abortion care post-Dobbs in states that have banned abortion is very low. Many of the exceptions included in these bans use definitions that are vague, narrow, and non-clinical, and effectively remove the ability of health care providers to best manage the care of pregnant people, instead leaving that decision to the state or the clinician’s home institution. Further complicating matters, several states have multiple bans in effect, often with contradicting definitions, requirements, exceptions, and standards, creating ambiguity for clinicians and their patients. This brief analyzes the exceptions to abortion bans and discusses how their purported aims to provide life-saving care may not be achieved in practice.
What kinds of exceptions do abortion bans contain?
Exceptions to state abortion bans generally fall into four general categories: to prevent the death of the pregnant person, to preserve the health of the pregnant person, when the pregnancy is the result of rape or incest, and when the embryo or fetus has lethal anomalies incompatible with life.
To prevent the death of the pregnant person
All state abortion bans currently in effect contain exceptions to “prevent the death” or “preserve the life” of the pregnant person. As explained in further detail in the section below, these exceptions may create difficulties for physicians, as it is unclear how much risk of death or how close to death a pregnant patient may need to be for the exception to apply and the determination is not up to the physician treating the pregnant patient.
When there is risk to the health of the pregnant person
Many state bans currently in effect – with the exception of bans in Arkansas, Idaho, Mississippi, Oklahoma, South Dakotan, and Texas – contain some form of health exception. Exceptions to preserve the health of the pregnant person can vary (sometimes significantly) from state to state (Table 1).
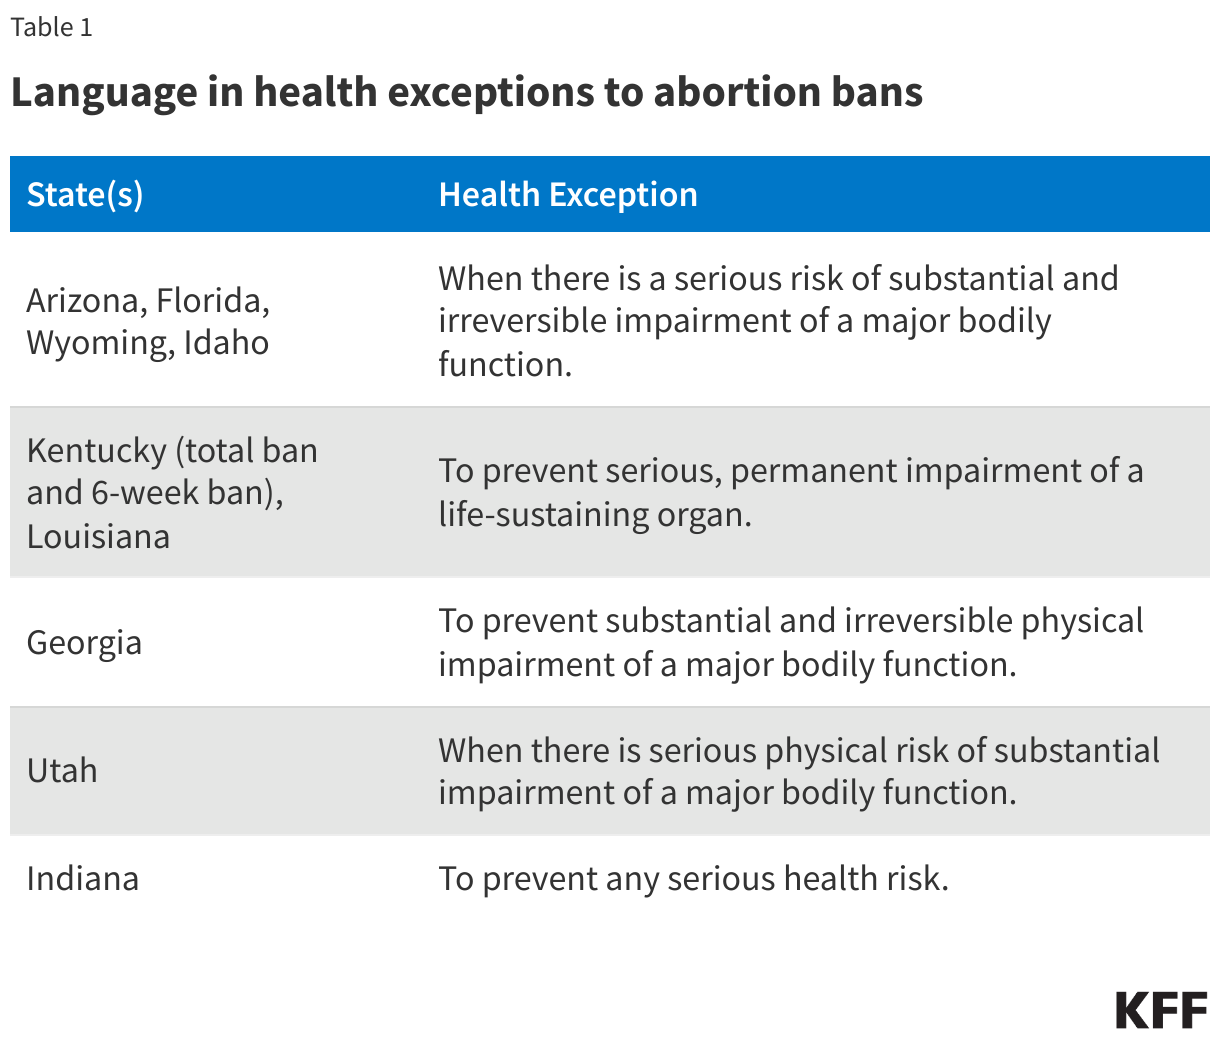
Most states with bans that contain a health exception permit abortion care when there is a serious risk of substantial and irreversible impairment of a major bodily function. These exceptions are limited by the lack of specific clinical definitions of the conditions qualifying for the exception. Only the Arizona 15-week LMP (last menstrual period) limit explicitly defines the bodily functions that may be considered “major.” The other states that use this language in their bans do not define what constitutes a “major bodily function,” nor what constitutes a “substantial impairment” to a major bodily function. This vague language puts physicians providing care to pregnant people in a difficult situation should their patients need an abortion to treat a condition jeopardizing their health and can leave the determination of whether an abortion can be legally provided to lawyers for the institution in which the clinician practices. For instance, in South Carolina where the 6-week LMP abortion limit has a health exception, the law lists a couple of conditions that may fall under this exception, such as severe pre-eclampsia and uterine rupture, but with no further detail. Using this language as guidance, it would be difficult for physicians to know if a significant health issue would fall under the exception. The difficulties presented by the simultaneous vagueness and narrowness of the exceptions are exacerbated by the lack of deference given to clinicians’ medical judgment under these bans.
However, even if the terms in the exceptions were defined more clearly, they would still exclude many health conditions pregnant people face. In Georgia, for example, providers challenging the ban note that the exceptions do not permit abortion care when it is needed to prevent: “(1) substantial but reversible physical impairment of a major bodily function, (2) less than ‘substantial’ but irreversible physical impairment of a major bodily function, or (3) substantial and irreversible physical impairment of a bodily function that is not ‘major.’” A medical condition may still be a significant health event, yet not qualify under the exceptions, even if their limits were more clearly defined.
MENTAL HEALTH
Mental health conditions account for over 20% of pregnancy-related deaths in the US, yet almost all states with health exceptions limit them to conditions affecting physical health, with some going further and explicitly precluding emotional or psychological health conditions. Alabama, the only state that includes mental health concerns in its health exception, requires a psychiatrist to diagnose the pregnant person with a “serious mental illness” and document it is likely the person will engage in behavior that could result in their death or the death of the fetus that due to their mental health condition. The law does not define “serious mental illness” and does not allow physicians to determine what serious mental illnesses qualify for the exception. In addition, abortion bans and restrictions in Georgia, Florida, Idaho, Iowa, Kentucky, Louisiana, Nebraska, North Carolina, North Dakota, South Carolina, Tennessee, West Virginia, and Wyoming explicitly exclude mental/emotional health. Several other states (Texas, Oklahoma, Mississippi, the remaining Kentucky ban, and one of Arkansas’ total bans) limit their life and/or health exceptions to physical conditions, without explicitly calling out mental/emotional health exceptions.
ECTOPIC PREGNANCIES AND MISCARRIAGES
Some states’ abortion laws specify that care for ectopic pregnancies and pregnancy loss is not criminalized in its statutes. Most states with these provisions in their bans allow for the removal of a dead fetus or embryo, but not for miscarriage care, generally. This means that pregnant people who are actively miscarrying may be denied care if there is still detectable fetal cardiac activity. There have already been reports of such situations in Texas and Louisiana. In Louisiana, for example, a pregnant woman went to the hospital after experiencing sharp pain and bleeding. She was informed her fetus had likely stopped growing a few weeks prior, as its size did not correspond to the length of her pregnancy, and that it had very faint cardiac activity. Despite the pain and the blood loss she was experiencing, she could not receive the regimen of mifepristone and misoprostol commonly prescribed to pregnant patients who are miscarrying to ensure that the pregnancy is safely expelled from the body completely in a timely manner, thereby decreasing the risk of sepsis and infection. Instead, she had to wait for the miscarriage to progress without medical intervention, which would have expedited the process and reduced her medical risk. In states where the abortion bans do not clarify that miscarriage care is not criminalized – even when there is still detectable cardiac activity – pregnant people may not be able to receive care to manage their pregnancy loss unless and until it becomes a medical emergency.
GREATER RISK TO THE HEALTH OF PREGNANT PEOPLE
In deciding whether or not to provide abortion care to preserve the health of a pregnant patient, physicians now face the risk of a jury or the state disagreeing with their judgment about the gravity of the health risk the pregnant person was experiencing, and as a result, face prison time, monetary fines, and loss of professional license. Before the Supreme Court’s decision in Dobbs, the decision to have an abortion pre-viability when facing a health risk was made by the pregnant person in consultation with medical professionals in consideration of the needs and overall health history of the pregnant patient. In states with abortion bans, when deciding whether or not to provide abortion care to preserve the health of a pregnant patient, physicians now face the risk of prosecution, prison time, monetary fines, and loss of professional license.
In state court challenges against the bans, providers have argued that the vagueness of the bans is unconstitutional, since it places them in a situation where it is unclear how they might follow the law. As a result, physicians may be more reluctant to provide abortion care when pregnant patients present with serious medical conditions and may deny abortion care to pregnant people with conditions that threaten their health until their condition deteriorates and the narrow exceptions inarguably apply. This delay in care, however, creates greater and avoidable risks to the health of the pregnant person. Additionally, many conditions that threaten the health of pregnant people are not included in all or most health exceptions.
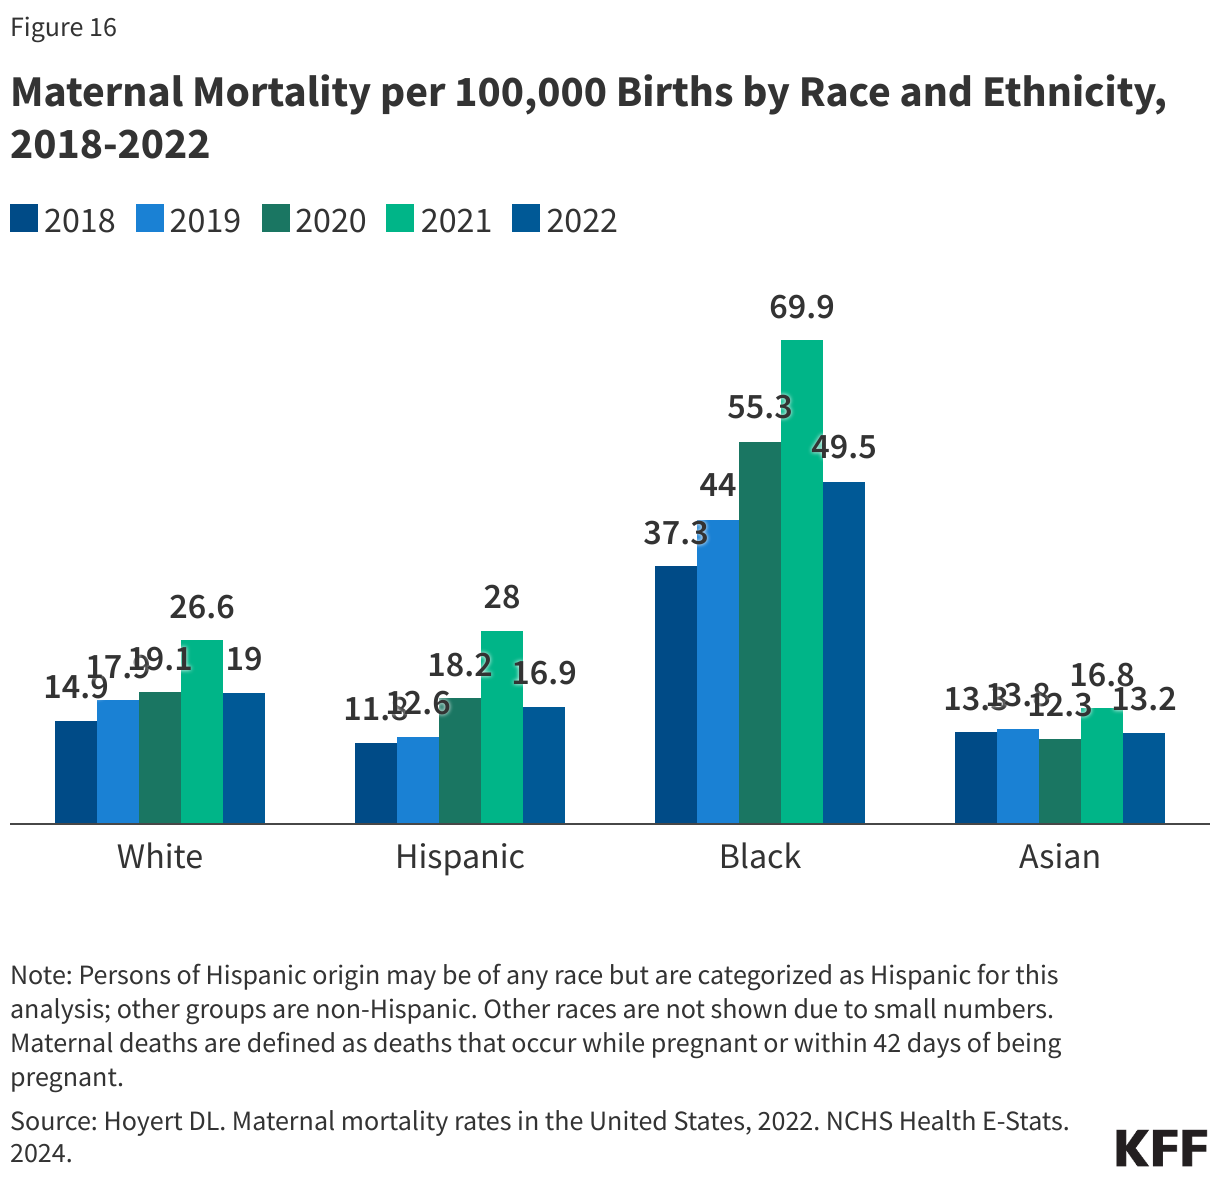
The difficulties these bans and their unclear exceptions create may additionally deter physicians from practicing medicine in states that ban abortion. There have already been reports of physicians expressing reluctance or refusing to relocate to these states, as well as physicians leaving these states due to their restrictive laws and fewer medical school graduates applying for residencies in these states. A substantial portion of these states’ residents already live in maternity deserts – areas where there are no obstetric providers or birth centers – and studies have shown that maternal mortality rates are higher in states that restrict abortion. Physicians being deterred from practicing in states with restrictive abortion laws may exacerbate these disparities in access to obstetric care and health outcomes.
Zurawski v. State of Texas
Five women who were denied abortion care in Texas - despite facing dangerous pregnancy complications – and two OB-GYNs filed a lawsuit in Texas state court asking the court to clarify the scope of the medical emergency exceptions in the state’s three abortion bans. Plaintiffs specifically asked the court to clarify that:
- Physician judgment should be granted deference in measuring the risk the pregnant person is facing,
- Impairment of a “major bodily function” includes harm to fertility and the reproductive system,
- Acute risk does not have to be already present or imminent for the exceptions to apply, and
- Health exceptions apply in situations where treatment for a condition is unsafe during pregnancy and for fetal conditions and diagnoses that can increase the risk to a pregnant person’s health.
Plaintiffs argued the misapplication of the health exceptions violates state constitutional guarantees to fundamental and equal rights. In August 2023, a County District Court judge issued an order blocking enforcement of Texas’ ban in situations where, in a physician’s good faith judgment, an abortion is needed due to an emergent medical situation. An appeal from the state to the Texas Supreme Court automatically blocked the lower court’s order. On May 31, 2024, the Texas Supreme Court issued its decision in this case, stating that the state’s abortion ban only contains exceptions when, in a physician’s reasonable medical judgment, there is a life-threatening physical condition.
THE EMERGENCY MEDICAL TREATMENT AND ACTIVE LABOR ACT (EMTALA)
Enacted in 1986, the Emergency Medical Treatment and Active Labor Act (EMTALA) requires Medicare-enrolled hospitals to perform an appropriate medical screening examination to any patient who presents to their dedicated emergency department. If a patient is identified as having an emergency medical condition, the hospital must provide stabilizing treatment within the hospital’s capability or transfer the patient to another medical facility.
As states were starting to implement abortion bans after the Dobbs decision, in July 2022, the Department of Health and Human Services (HHS) issued guidance regarding the enforcement of EMTALA that clarifies hospitals and physicians have obligations to provide stabilizing care, including abortion in medically appropriate circumstances, when a patient presenting at an emergency department is experiencing an emergency medical condition.
After HHS issued this guidance, two lawsuits were filed. HHS sued the State of Idaho to block enforcement of Idaho’s abortion ban to the extent it conflicts with EMTALA, and the State of Texas sued to block enforcement of the HHS guidance in Texas. The Supreme Court is considering the case from Idaho and a decision is pending.
At stake in this case is whether EMTALA preempts state abortion laws and requires hospitals to provide abortion care when it is necessary to stabilize a patient’s condition, even when this abortion care violates state law. While all state abortion bans have an exception for pregnancies that jeopardize the life of a pregnant person, some do not have an exception that would allow an abortion to preserve the health of the pregnant person. Even in states with health exceptions, the exception might be very narrow and not well defined, leaving significant gaps in emergency medical care for pregnant people. EMTALA, however, requires hospitals to provide stabilizing care to patients with emergency medical conditions, including conditions that may harm their health. According to the HHS guidance issued in the wake of the Dobbs decision, EMTALA requires hospitals to provide abortion care to pregnant patients with emergency medical conditions when abortion is necessary to stabilize the patient’s condition. However, Idaho contends that EMTALA does not require hospitals to provide treatment that violates state law. The Court’s decision in this case could impact access to abortion in emergency situations across the country and potentially lay the foundation for future challenges involving state laws granting fetal personhood.
Exception vs. Affirmative Defense
Some state abortion bans lack exceptions but identify situations that may be used as an affirmative defense in court – among these are Tennessee’s 6-week LMP ban, Kentucky’s 15-week ban (but not the state’s earlier gestational bans), Texas’ total bans, and all of Missouri’s bans. An “affirmative defense” allows someone charged with a crime to show in court that their conduct was permissible even though the action itself is illegal. An affirmative defense does not make it legal to provide abortion care in the situations delineated in the law and means that a clinician who provided abortion care is open to prosecution – regardless of the reason they provided an abortion – and would bear the burden of proof to demonstrate that they provided care according to the conditions delineated as possible affirmative defenses in the abortion ban. Bans that rely on an affirmative defense leave physicians more vulnerable to criminal prosecution and they make it even riskier for physicians to provide abortion care in situations where the life or health of the pregnant person is at risk.
Sexual Assault Exceptions
A few of the state abortion bans contain exceptions for pregnancies resulting from rape or incest, generally requiring that the sexual assault be reported to law enforcement. Some states allow for a Child Protective Services (CPS) report in lieu of a law enforcement report for minors who are survivors of sexual assault or incest.
It is well documented that survivors are often afraid to report sexual violence to the police due to fear of retaliation and the belief that law enforcement would not or could not do anything to help. It is estimated that only 21% of sexual assaults are reported to law enforcement. Even for survivors who do report to law enforcement, state abortion bans do not make clear exactly what information needs to be given to a provider to make it clear that the abortion would be legal in that state. Reporting requirements place barriers in the way of survivors seeking abortion care in these states.
Among the few sexual assault exceptions, some have specific gestational limits. For instance, the total ban currently in effect in West Virginia contains an exception for cases of rape or incest, but it is limited to 8 weeks from the last menstrual period (LMP) for adults and 14 weeks LMP for minors.
Although sexual assault exceptions are intended to protect survivors, experts agree that they rarely work. There is anecdotal evidence of survivors in states with rape exceptions and who have compiled the necessary documentation, but still not being able to access abortion because they couldn’t find any abortion providers in their state.
Hyde Amendment
The Hyde Amendment is a policy that restricts the use of federal funds to cover abortion, except in cases of rape or incest, or when the life of the pregnant person is endangered (Hyde Exceptions). The policy is not a permanent law, but rather has been attached as a temporary “rider” to the Congressional appropriations bill for the Department of Health and Human Services (HHS) and has been renewed annually by Congress. In the past, federal courts have interpreted the Hyde provisions to require states to pay for abortions that fall into the Hyde Exceptions and have blocked enforcement of state statutes that prohibit coverage for these cases. However, the enforceability of these requirements has been unclear since the Supreme Court’s decision in Dobbs. Although all bans currently in effect contain exceptions to safeguard the life of the pregnant person, most states with abortion bans do not have exceptions for cases of rape or incest, and therefore, would not allow for the provision or coverage of those services to Medicaid recipients, contrary to previous court orders. To date, no court or federal agency has issued orders or guidance on states’ obligation to provide coverage for Hyde Exceptions when their bans prohibit the provision of abortion in cases of rape or incest.
Lethal Fetal Anomaly Exceptions
Bans in several states contain exceptions for lethal fetal anomalies, usually limited to those anomalies that would result in the death of the baby at birth or soon after. As with health exceptions, lethal fetal anomaly exceptions are poorly defined and limited in statutes. The only state with this kind of exception that has a comprehensive list of conditions that fall under this category is Louisiana, but since the state has multiple abortion bans in effect (one of which does not include exceptions for fatal fetal anomalies), the applicability of this exception is still unclear. Other states, like Indiana, provide some general criteria, such as how long after birth the baby can be expected to live for a pregnancy to fall under the fetal anomaly. Any condition that would result in a life expectancy shorter than three months fits under the exception. The religious freedom lawsuit against the state’s ban – Anonymous Plaintiffs v. Medical Licensing Board of Indiana — specifically challenges the narrow limits of the exception, arguing that other common conditions, such as Tay-Sachs disease would result in the death very early in childhood.
What happens in states with more than one abortion ban in effect?
In many states there is more than one abortion ban in the books, and in some of those states, the exception provisions in the bans are at odds with each other. In Louisiana, two bans and a 15-week LMP limit are in effect, but only one of the total bans and the 15-week limit have the same exceptions; the remaining total ban does not. One of the total criminal bans in the state has exceptions to prevent the death or substantial risk of death, of the pregnant person and to prevent “serious, permanent impairment of a life-sustaining organ”. The state’s other total ban and the 15-week limit have exceptions for these same cases and additionally in cases of fatal fetal anomalies, and clarify that the bans’ prohibitions do not apply for ectopic pregnancies and miscarriages. The conflicting exceptions in the bans result in a situation where the only real exceptions in the state are for cases where an abortion is necessary to prevent the death of the pregnant person or to prevent serious, permanent impairment of a life-sustaining organ. Providing abortion care under any other exception in the states’ other total ban or 15-week limit would open physicians to criminal penalties and loss of license.
Mississippi is another state with multiple bans in effect that contain contradicting exceptions. The state’s total ban only has exceptions for cases when an abortion is necessary to preserve the life of the pregnant person or when the pregnancy was caused by rape (there is no exception for incest in the state). However, the state’s 15-week LMP ban contains exceptions for fatal fetal abnormalities and serious risk of substantial and irreversible impairment of a major bodily function, along with a life exception. In situations where there is more than one ban in effect, it might seem that the easiest way to follow the law would be to adhere to the abortion ban with the strictest gestational limit. This would not suffice in Mississippi, however, since the total ban contains an exception for pregnancies caused by rape, but the state’s 15-week LMP ban does not contain such an exception. Therefore, following any one of the state’s abortion bans would not remove the legal risk of providing abortion care in the state. Instead, providers must assess how the abortion bans and their exceptions work in conjunction.
Conclusion
Although a lot of attention has been devoted to debates about exceptions in abortion bans, many of these exceptions are not workable in practice. Outside of testimony from providers, it is difficult to assess how many people who qualify for abortion care under the exceptions are actually able to do so, since states underreport or do not report this information. However, it is apparent these bans create barriers to accessing abortion care, even in situations where the exceptions they outline should apply. Most importantly, these bans place the health and lives of pregnant people at risk by potentially preventing physicians from providing medically appropriate care. The Supreme Court’s decision in Idaho v. United States will determine whether EMTALA preempts state laws and requires hospitals to provide abortion care to stabilize pregnant patients when “necessary to assure that no material deterioration of the condition is likely to occur.” If the Court rules in favor of Idaho, the inability to provide evidence-based care may additionally make physicians reluctant to practice medicine in restrictive states, amplifying already-existing discrepancies in ability to access obstetric care and adverse maternal and fetal outcomes.


Social Determinants of Health
RACIAL DISPARITIES IN SOCIAL AND ECONOMIC FACTORS
Social determinants of health are the conditions in which people are born, grow, live, work, and age. They include factors like socioeconomic status, education, immigration status, language, neighborhood and physical environment, employment, and social support networks, as well as access to health care. There has been extensive research and recognition that addressing social, economic, and environmental factors that influence health is important for advancing health equity. Research also shows how racism and discrimination drive inequities across these factors and impact health and well-being.
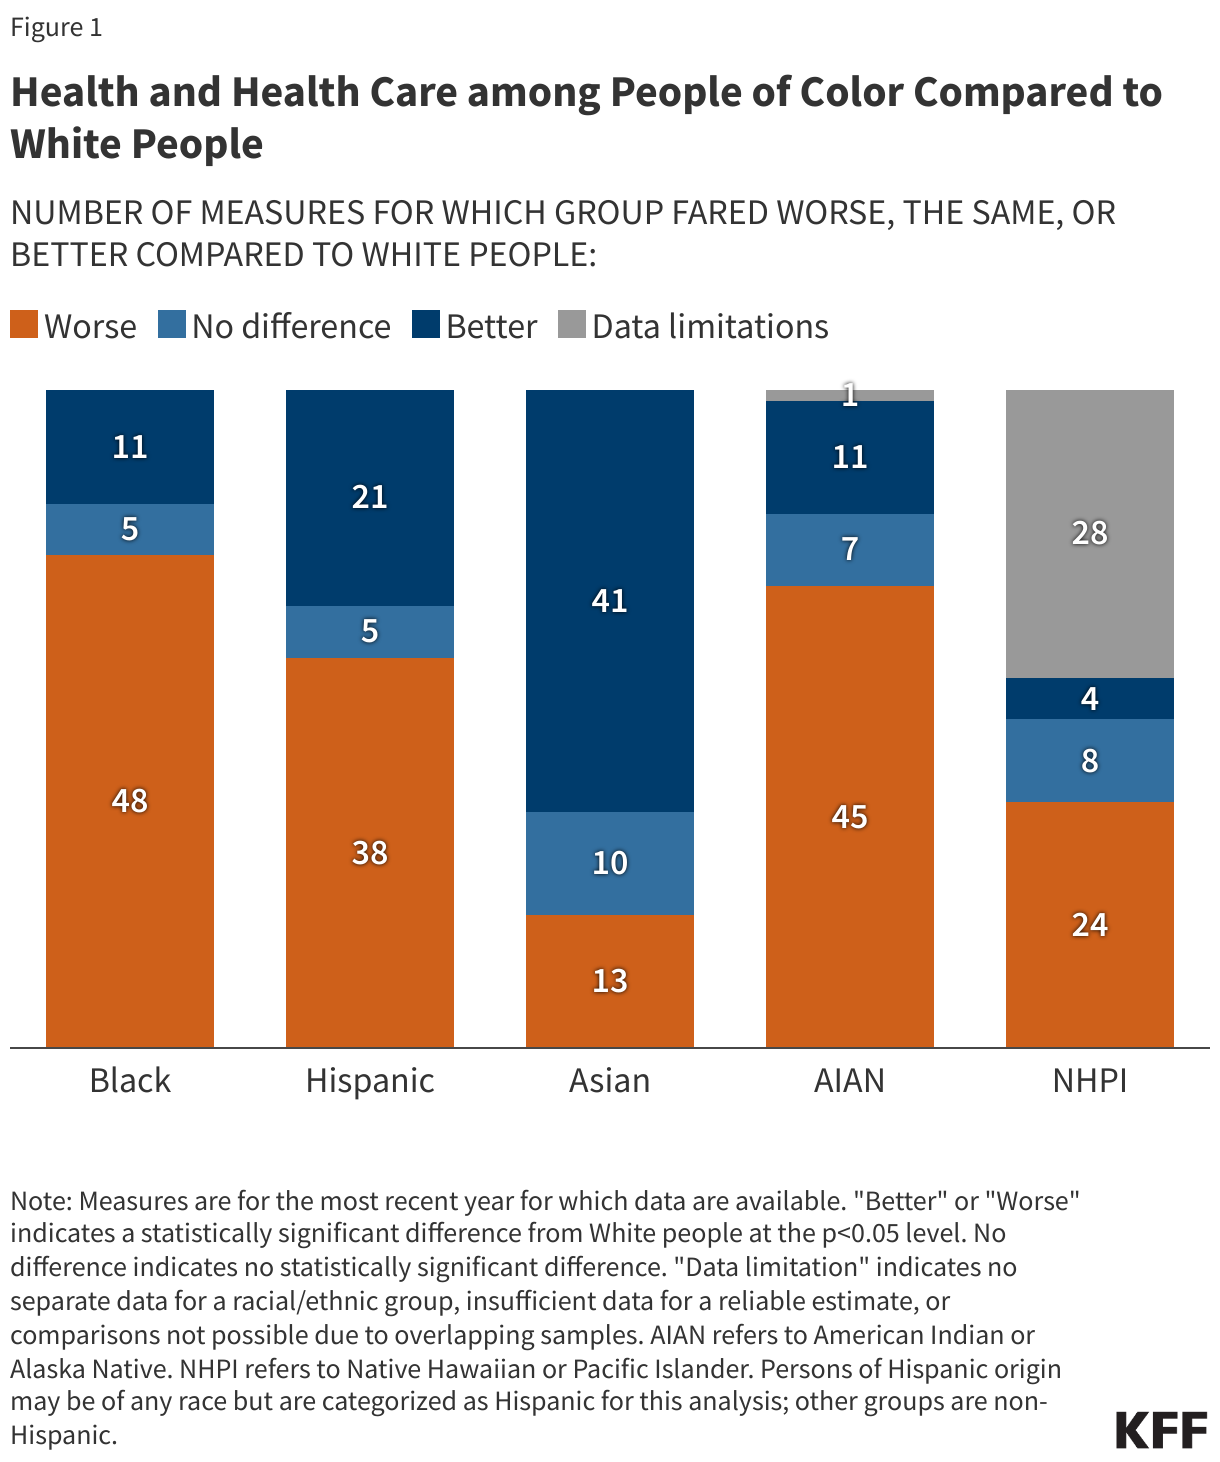
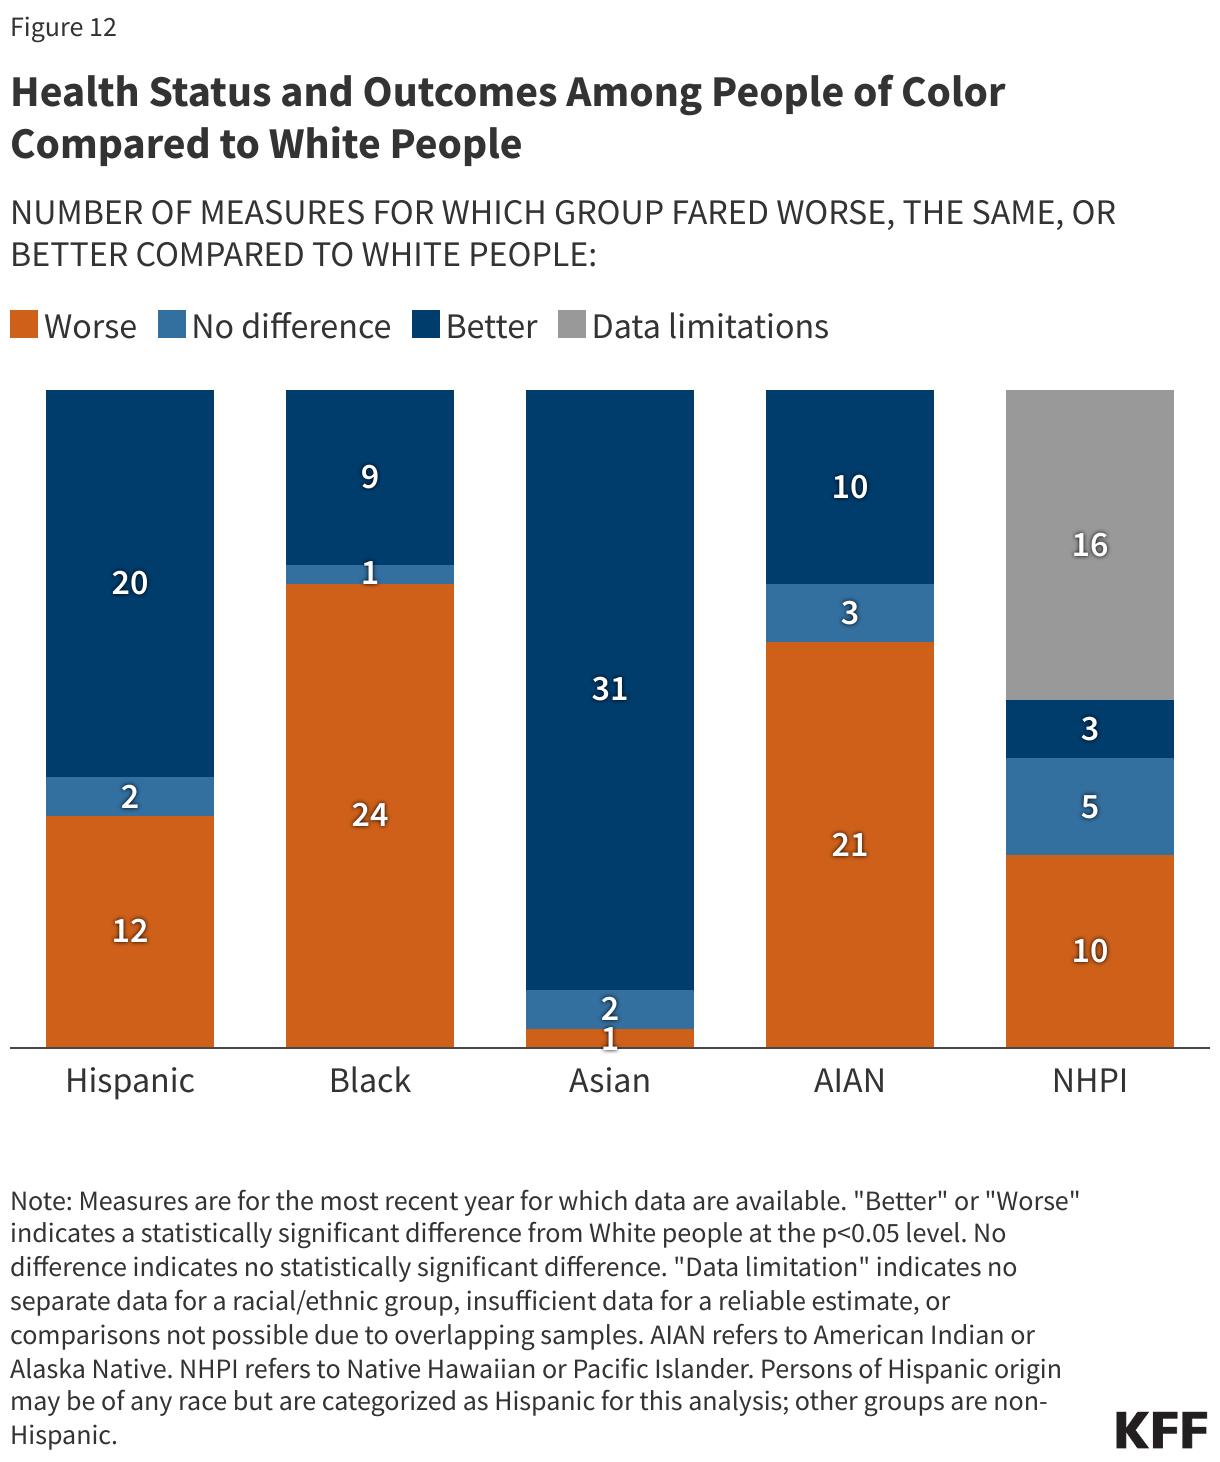
Black, Hispanic, AIAN, and NHPI people fare worse compared to White people across most examined measures of social determinants of health (Figure 31). Experiences for Asian people are more mixed relative to White people across these examined measures. Reliable or disaggregated data for NHPI people are missing for a number of measures.
WORK STATUS, FAMILY INCOME, AND EDUCATION
Across racial and ethnic groups, most nonelderly people live in a family with a full-time worker, but Black, Hispanic, AIAN, and NHPI nonelderly people are more likely than White people to be in a family with income below poverty (Figure 32). While most people across racial and ethnic groups live in a family with a full-time worker, disparities persist. AIAN (68%), Black (73%), NHPI (77%), and Hispanic (81%) people are less likely than White people (83%) to have a full-time worker in the family. In contrast, Asian people (86%) are more likely than their White counterparts (83%) to have a full-time worker in the family. Despite the majority of people living in a family with a full-time worker, over one in five AIAN (25%) and Black (22%) people have family incomes below the federal poverty level, over twice the share as White people (10%), and rates of poverty were also higher among Hispanic (17%) and NHPI (16%) people.
Black, Hispanic, AIAN, and NHPI people have lower levels of educational attainment compared to their White counterparts. Among people ages 25 and older, over two thirds (69%) of White people have completed some post-secondary education, compared to less than half (45%) of Hispanic people, just over half of AIAN and NHPI people (both at 52%), and about six in ten Black people (58%) (Figure 33). Asian people are more likely than White people to have completed at least some post-secondary education, with 74% completing at least some college.
NET WORTH AND HOME OWNERSHIP
Black and Hispanic families have less wealth than White families. Wealth can be defined using net worth, a measure of the difference between a family’s assets and liabilities. The median net worth for White households is $285,000 compared to $44,900 for Black households and $61,600 for Hispanic households (Figure 34). Asian households have the highest median net worth of $536,000. Data are not available for AIAN and NHPI people.
People of color are less likely to own a home than White people (Figure 35). Nearly eight in ten (77%) White people own a home compared to 70% of Asian people, 62% of AIAN people, 55% of Hispanic people, and about half of Black (49%) and NHPI (48%) people.
FOOD SECURITY, HOUSING QUALITY, AND INTERNET ACCESS
Black and Hispanic adults and children are more likely to experience food insecurity compared to their White counterparts. Among adults, AIAN (18%), Black (14%), and Hispanic (12%) adults report low or very low food security compared to White adults (6%) (Figure 36). Among children, AIAN (24%), Black (21%) and Hispanic (15%) children are over twice as likely to be food insecure than White children (6%). Data are not available for NHPI adults and children.
People of color are more likely to live in crowded housing than their White counterparts (Figure 37). Among White people, 3% report living in a crowded housing arrangement, that is having more than one person per room, as defined by the American Community Survey. In contrast, almost three in ten (28%) NHPI people, roughly one in five (18%) Hispanic people, 16% AIAN people, and about one in ten Asian (12%) and Black (8%) people report living in crowded housing.
AIAN, NHPI, and Black people are less likely to have internet access than White people (Figure 38). Higher shares of AIAN (12%), and Black and NHPI people (both at 6%) say they have no internet access compared to their White counterparts (4%). In contrast, Asian people (2%) are less likely to report no internet access than White people (4%).
TRANSPORTATION
People of color are more likely to live in a household without access to a vehicle than White people (Figure 39). About one in eight Black people (12%) and about one in ten AIAN (9%) and Asian (8%) people live in a household without a vehicle available followed by 7% of Hispanic and NHPI people. White people are the least likely to report not having access to a vehicle in the household (4%).
CITIZENSHIP AND ENGLISH PROFICIENCY
Asian, Hispanic, NHPI, and Black people include higher shares of noncitizen immigrants compared to White people. Asian and Hispanic people have the highest shares of noncitizen immigrants at 25% and 19%, respectively (Figure 40). Asian people are projected to become the largest immigrant group in the United States by 2055. Immigrants are more likely to be uninsured than citizens and face increased barriers to accessing health care.
Hispanic and Asian people are more likely to have LEP compared to White people. Almost one in three Asian (31%) and Hispanic (28%) people report speaking English less than very well compared to White people (1%)(Figure 41). Adults with LEP are more likely to report worse health status and increased barriers in accessing health care compared to English proficient adults.
EXPERIENCES WITH RACISM, DISCRIMINATION, AND UNFAIR TREATMENT
Racism is an underlying driver of health disparities, and repeated and ongoing exposure to perceived experiences of racism and discrimination can increase risks for poor health outcomes. Research has shown that exposure to racism and discrimination can lead to negative mental health outcomes and certain negative impacts on physical health, including depression, anxiety, and hypertension.
Black, AIAN, Hispanic, and Asian adults are more likely to report certain experiences with discrimination in daily life compared with their White counterparts, with the greatest frequency reported among Black and AIAN adults. A 2023 KFF survey shows that at least half of AIAN (58%), Black (54%), and Hispanic (50%) adults and about four in ten (42%) Asian adults say they experienced at least one type of discrimination in daily life in the past year (Figure 42). These experiences include receiving poorer service than others at restaurants or stores; people acting as if they are afraid of them or as if they aren’t smart; being threatened or harassed; or being criticized for speaking a language other than English. Data are not available for NHPI adults.
About one in five (18%) Black adults and roughly one in eight AIAN (12%) adults, followed by roughly one in ten Hispanic (11%), and Asian (10%) adults who received health care in the past three years report being treated unfairly or with disrespect by a health care provider because of their racial or ethnic background. These shares are higher than the 3% of White adults who report this (Figure 43). Overall, roughly three in ten (29%) AIAN adults and one in four (24%) Black adults say they were treated unfairly or with disrespect by a health care provider in the past three years for any reason compared with 14% of White adults.