Medicaid and CHIP Eligibility, Enrollment, and Renewal Policies as States Resume Routine Operations

Following the Unwinding of the Pandemic-Era Continuous Enrollment Provision

Authors: Tricia Brooks, Jennifer Tolbert, Anna Mudumala, Amaya Diana, Allexa Gardner, Aubrianna Osorio, and Shoshi Preuss
Published: Apr 1, 2025

Executive Summary

In 2024, almost all states completed renewals for the 94 million individuals who were enrolled in Medicaid following the pandemic-era three-year pause on disenrollments that was lifted on March 31, 2023. By October 2024, based on the most recent Centers for Medicare and Medicaid Services (CMS) enrollment data, the process known as unwinding had resulted in a net decline in Medicaid and CHIP enrollment of 15 million individuals, including about five million children, but enrollment remained above pre-pandemic levels.

The focus on Medicaid renewal processes during the unwinding revealed their complexity. With states facing an unprecedented volume of work and eligibility worker shortages, CMS provided new options to streamline enrollment and renewal processes, emphasizing automation and the use of reliable data sources to increase accuracy and efficiency. States broadly adopted these strategies, and many emerged from the unwinding with more efficient processes by maximizing the use of technology to verify income, reduce returned mail, and improve communications with enrollees. However, some states continue to struggle with older systems that limit the adoption and effectiveness of some of the new strategies.

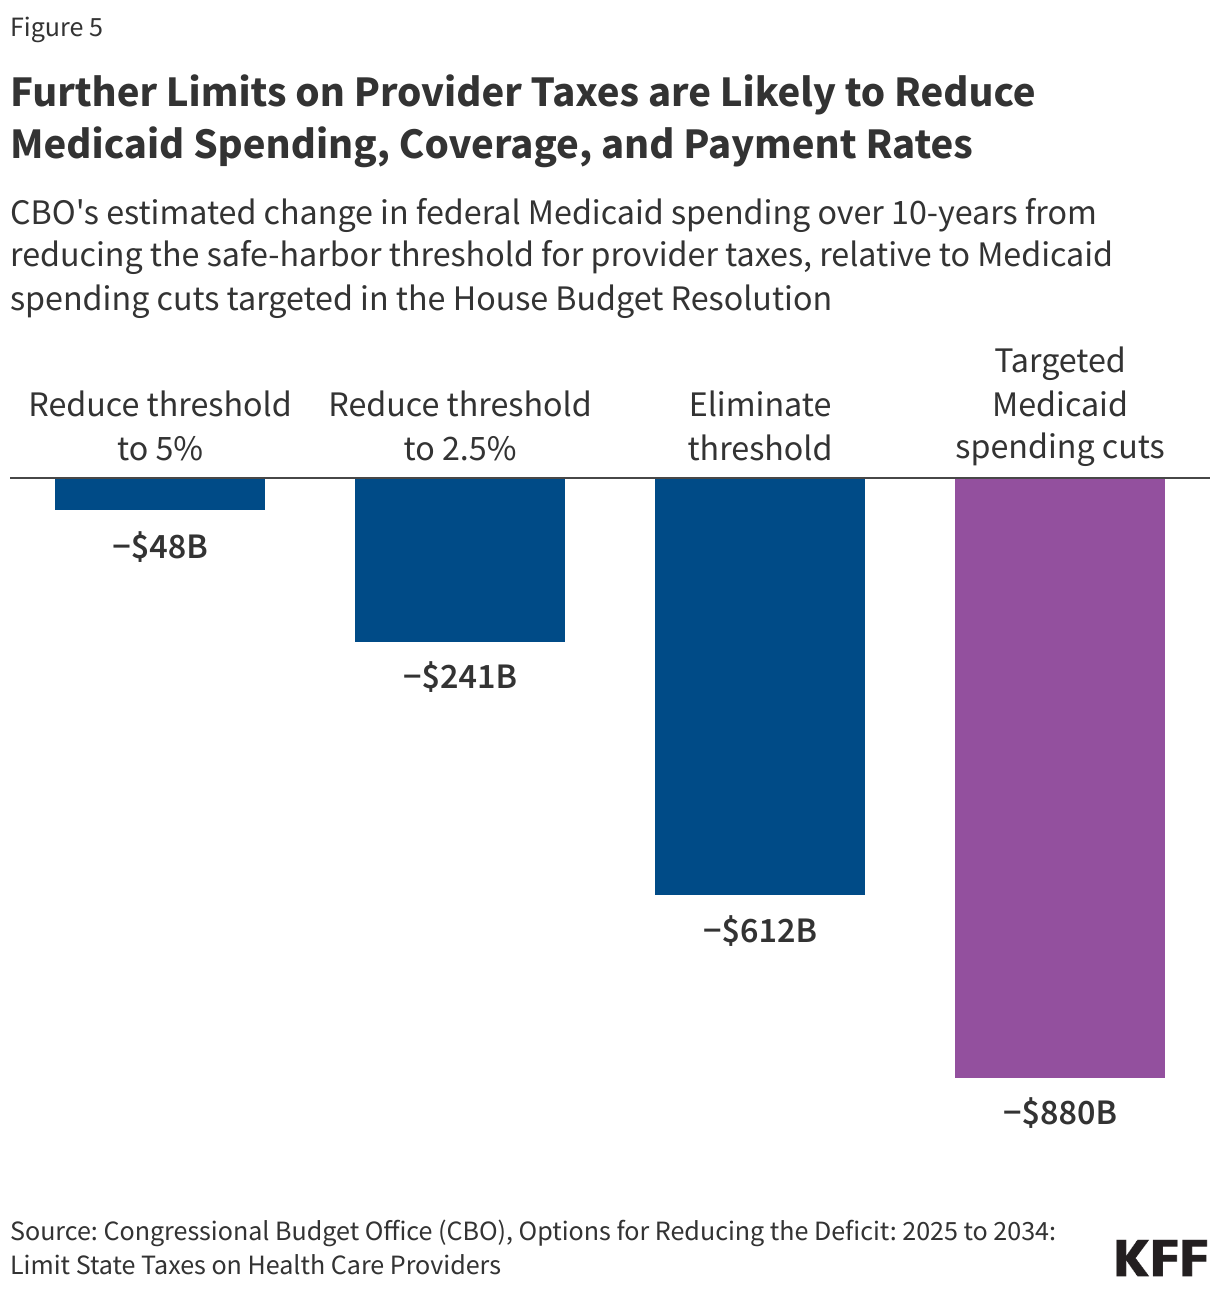
Medicaid agencies are now turning their attention to ensuring that state policy aligns with existing and new federal requirements. At the same time, there is significant uncertainty about how potential changes to federal Medicaid financing and policy under consideration by Congress and the Administration will impact states and Medicaid enrollees in the future. Congress is debating cuts to Medicaid of up to $880 billion or more over ten years, citing a desire to curtail spending to help pay for tax cuts and address “fraud, waste, and abuse”. While several proposals would fundamentally restructure who is covered by the program and how it is financed, repeal of regulations finalized in the last administration, including the Eligibility & Enrollment (E&E) rule finalized in April 2024, are also under consideration. The E&E rule included provisions to streamline and enhance the administrative efficiency of Medicaid eligibility and enrollment processes and to make it easier for eligible individuals to retain coverage. The rule also clarified documentation and recordkeeping requirements, providing the first update to these requirements since 1986, to reduce payment errors based on insufficient documentation. By eliminating some barriers to enrollment and reducing churn among people who are eligible but lose coverage for paperwork reasons, the rule is expected to increase Medicaid and CHIP enrollment (CMS projected enrollment would increase by 1.5 million in 2028.) The Congressional Budget Office estimated that rescinding this rule along with a related rule that reduces barriers to enrollment among people eligible for Medicare Savings Plan (MSP) coverage would reduce federal Medicaid spending by $164 billion over ten years.

The 23rd annual survey of state Medicaid and CHIP program officials conducted by KFF and the Georgetown University Center for Children and Families provides a baseline of state Medicaid and CHIP eligibility, enrollment, and renewal policies in place as of January 2025 as states return to routine operations following the unwinding. The report focuses on policies for children, pregnant individuals, parents, and other non-elderly adults whose eligibility is based on Modified Adjusted Gross Income (MAGI) financial eligibility rules. Overall, 49 states and the District of Columbia responded to the survey, although response rates for specific questions varied (Florida did not respond). For the purposes of this report, the District of Columbia is counted as a state.

Key Takeaways

  • Building on strategies adopted during the unwinding, most states are continuing to implement policies to increase ex parte, or administrative, renewal rates. During the unwinding period, states employed new approaches to using data and automation to streamline processes for verifying eligibility. Over two-thirds of states plan to continue or newly adopt at least one strategy to facilitate ex parte renewals. While 29 states report that over half of ex parte renewal rates are conducted automatically by their systems, the share of eligibility determinations at application that are automated and conducted in real-time (within 24 hours) lag. Close to half of states say they cannot conduct automated real-time eligibility determinations on new applications or report that less than 10% of these eligibility determinations are automated.
  • States increasingly rely on data from trusted sources to automate manual tasks and improve accuracy of Medicaid eligibility, enrollment, and renewal processes. By advancing the use of information from other programs such as SNAP and TANF, states have improved the accuracy of income verification while reducing administrative burden associated with mailing renewal forms and manually processing information submitted by mail or phone. At the same time, periodic checks of income data sources coupled with limited time for enrollees to respond to information requests can increase procedural disenrollments and churn.
  • States have incorporated new strategies for updating contact information and communicating with enrollees into routine operations, and some are using artificial intelligence (AI) to assist with the application and renewal processes. Access to the US Postal Service National Change of Address (NCOA) Database and other program data allows states to routinely update mailing addresses, tackling the longstanding problem of returned mail. Nearly all states proactively check available data sources for updated contact information or accept updated addresses from managed care plans or providers. To increase renewal response rates, states contact enrollees multiple times before and after sending renewal notices using multiple modes including email and text. States have also enhanced online tools–online accounts and mobile apps–to provide additional ways to communicate with enrollees and to give enrollees the ability to more easily manage their coverage. A few states use AI to answer consumer questions at different points during the application or renewal process, and a small number have begun using AI to assist with reviewing applications and renewals.
  • Continuing a trend over the past few years, two states increased income eligibility for pregnancy coverage. Alaska and Washington state expanded income eligibility for pregnancy and Colorado adopted the From Conception to the End of Pregnancy coverage option in CHIP. Since 2023, five states (Alaska, Nevada, North Dakota, Tennessee, and Washington) have increased pregnancy eligibility levels, but one state (Iowa) is seeking approval to reduce pregnancy income eligibility. The median eligibility level for children (255%) is the highest of all MAGI groups. Eligibility levels for all MAGI groups are lower in non-expansion states compared to expansion states.
  • States have taken steps to remove administrative barriers to enrollment and renewal for children and seniors and people with disabilities (non-MAGI groups). Almost all states with separate CHIP programs have eliminated required periods of uninsurance (waiting periods) and lock-out periods following nonpayment of premiums, both of which contribute to gaps in coverage. The E&E rule requires states to phase out waiting and lock-out periods by June 2025. Two states (Utah and Delaware) permanently eliminated CHIP premiums in 2024, and premiums remain temporarily or indefinitely suspended in Arizona and Vermont while Georgia reinstated CHIP premiums after pausing them during the COVID pandemic. All states have taken steps to align non-MAGI renewal rules with those in place for MAGI groups such as conducting annual renewals, eliminating in-person interviews, and giving enrollees more time than 10 days to respond to requests for information. The E&E rule requires states to align non-MAGI renewal policies by June 2027.

Report

Post-Unwinding and Resuming Routine Operations

Renewal Policies

Over half of states report that 50% or more of ex parte renewals are processed automatically by the eligibility system, but only a quarter of states report that 50% or more of eligibility determinations at application are automated. By adopting more efficient processes relying on technology and data from trusted sources, states can automate manual tasks, reduce administrative costs, and improve accuracy. During the unwinding period, ex parte renewal rates increased as states made systems improvements to enhance automation of renewal processes. However, not all ex parte renewals can be processed automatically by the system, and for those ex parte renewals that are not automated, workers manually check data sources to confirm ongoing eligibility. Nearly all states (45) report that 10% or more of ex parte renewals are processed automatically by the eligibility system and over half (29 states) report that processing of more than 50% of ex parte renewals is automated (Figure 1). However, automation of eligibility determinations at application lags automation of ex parte renewals. Thirteen states lack the ability to automatically process eligibility determinations at application in real-time and eight states report that less than 10% of applications are processed by the system without worker intervention. Some states that rely on the FFM to determine eligibility are able to process enrollment in real time since the FFM has already determined eligibility.

Share of Ex Parte Renewals That Are Automated, January 2025

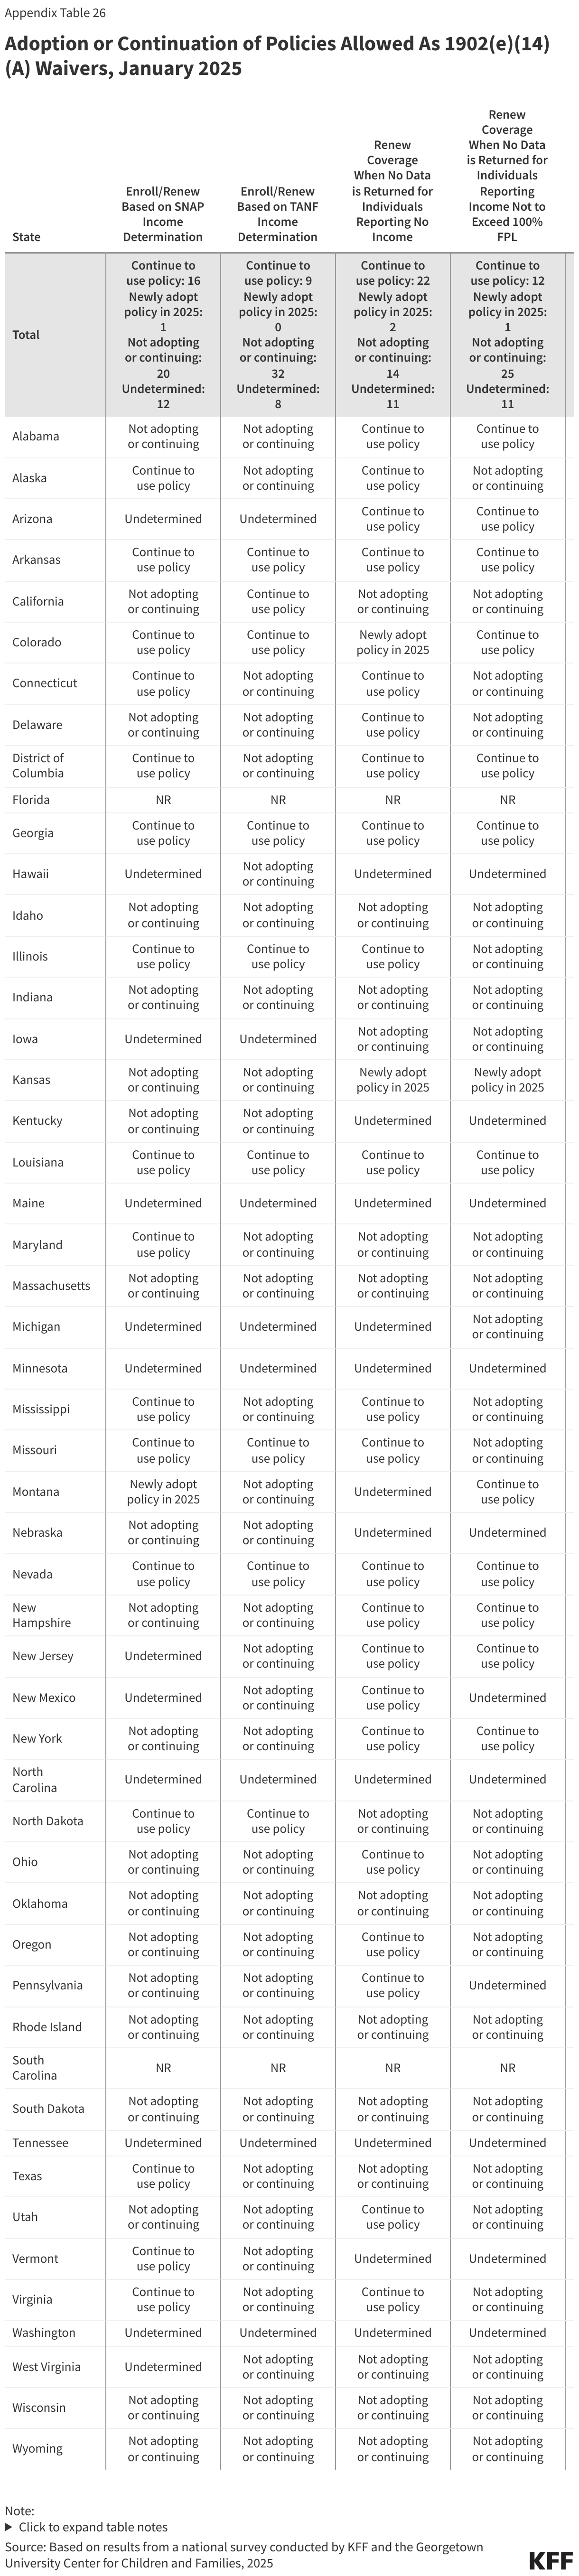
Most states are continuing or newly adopting automated processes for verifying income and taking other steps to increase ex parte renewals. All states must verify income eligibility for Medicaid and CHIP. During the unwinding, states facing system and operational challenges had the option to seek authority under section 1902(e)(14)(A) of the Social Security Act (the Act) to try new approaches to use data to confirm income eligibility. Several of those strategies proved to be effective in increasing state ex parte renewal rates and were made permanently available as state plan options. Over two-thirds of states (34) are continuing or newly adopting one of the new state plan options (Figure 2). In addition, over two-thirds of states are taking other steps to increase ex parte rates; refining system programming (24 states) and expanding data sources (18 states) are the top two strategies.

Adoption or Continuation of Policies Allowed As 1902(e)(14)(A) Waivers, January 2025

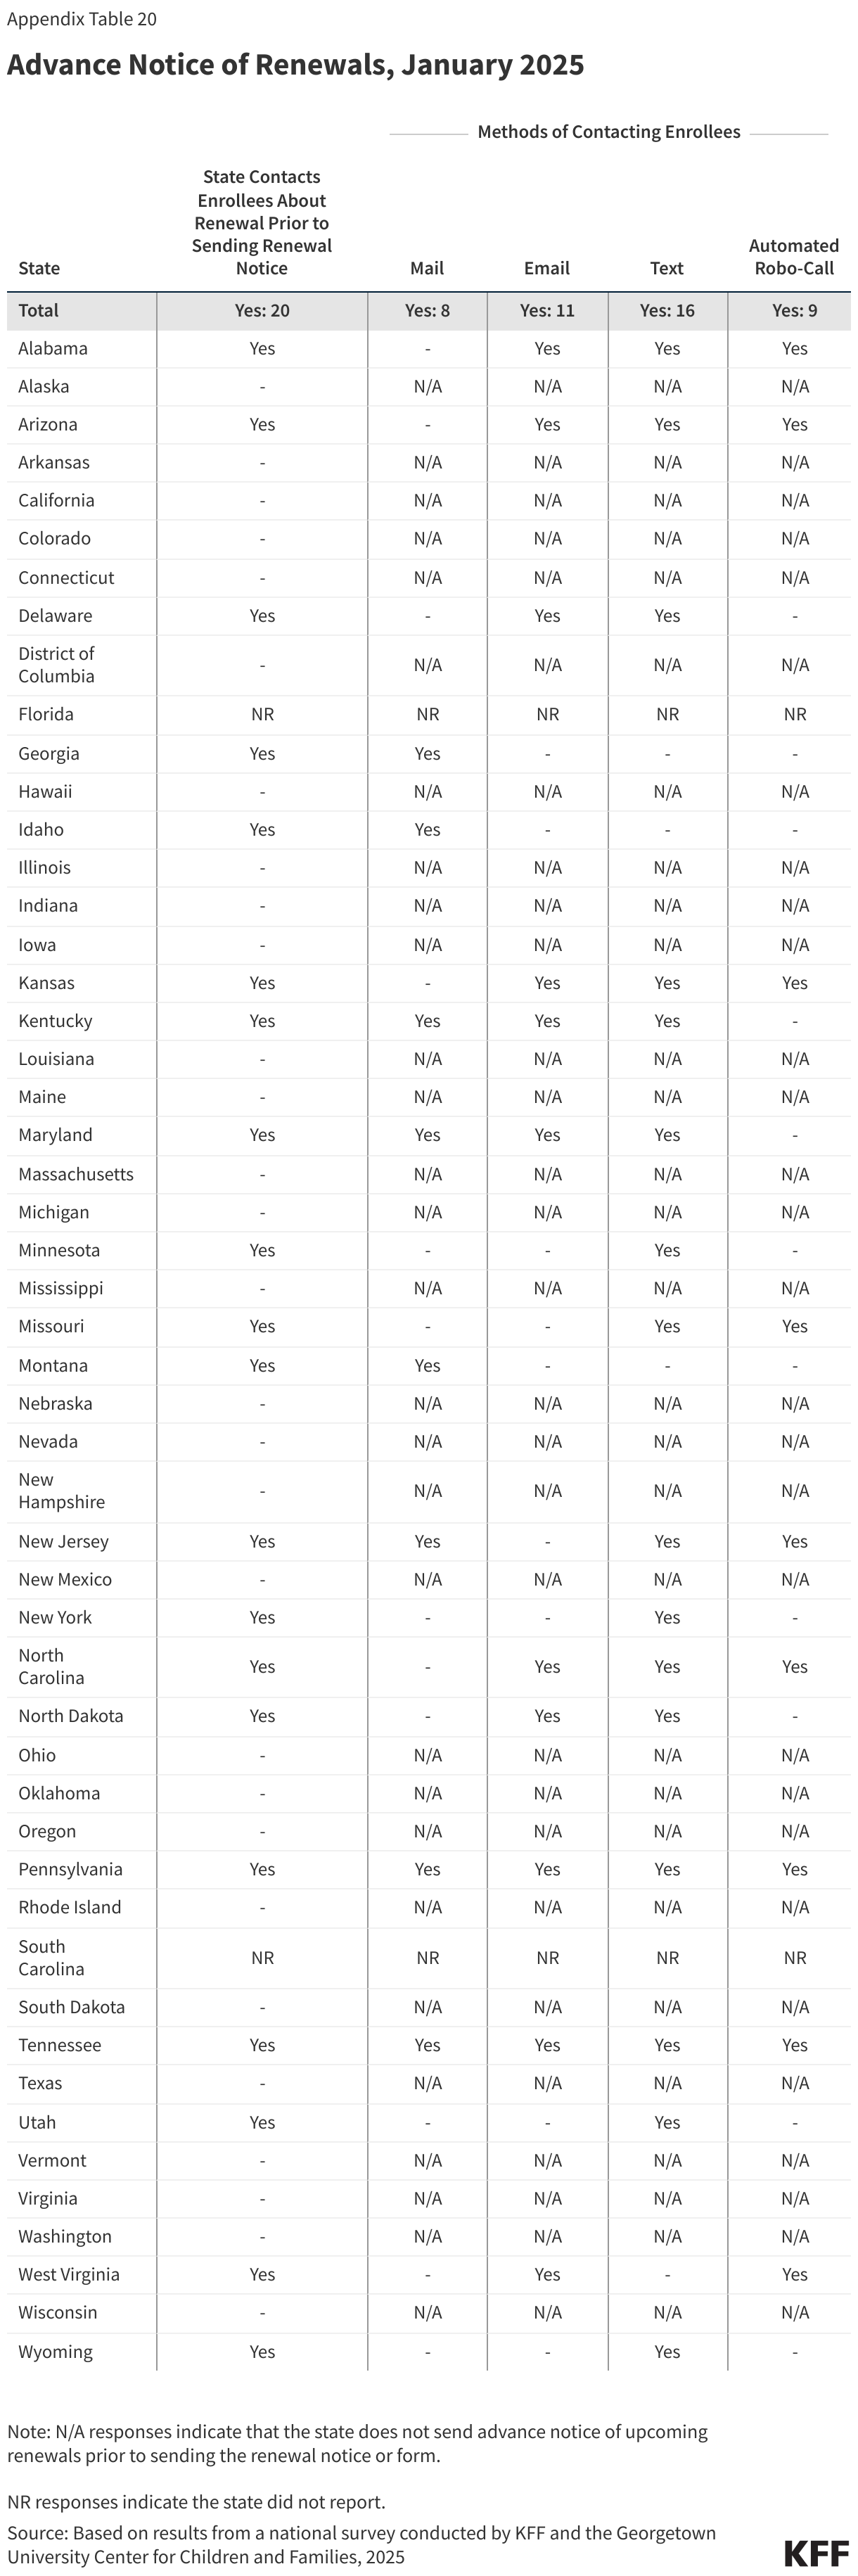
States are doing more to communicate with enrollees during the renewal process. States increased their communication touch points with enrollees during the unwinding period and many have kept that increased communication in place as they return to routine operations. For enrollees whose ongoing eligibility cannot be verified via ex parte processes, 20 states send an advance notice to alert enrollees to an upcoming renewal and 42 states remind enrollees before the end of the renewal period to complete their renewal (Figure 3). They are using multiple ways of reaching enrollees, including relying on cost-effective and timely email and text messages.

States are also taking steps to help eligible individuals regain coverage following procedural disenrollments. States are required to provide a 90-day reconsideration period when an enrollee has been procedurally disenrolled, or disenrolled because they did not complete the renewal process and not because they were determined ineligible. During this reconsideration period, eligible individuals may submit renewal information for redetermination without completing a new application. Half of states (25) include information about the 90-day reconsideration period in termination notices and 12 states provide lists of members who have been procedurally disenrolled to MCOs so they can follow up with those individuals (Figure 3). When an enrollee is determined eligible during the reconsideration period, 31 states reinstate coverage back to the termination date while 12 states reinstate coverage to the first day of the month in which information is received.

States Using Alerts, Reminders, and Strategies to Help Individuals Maintain/Regain Coverage, January 2025

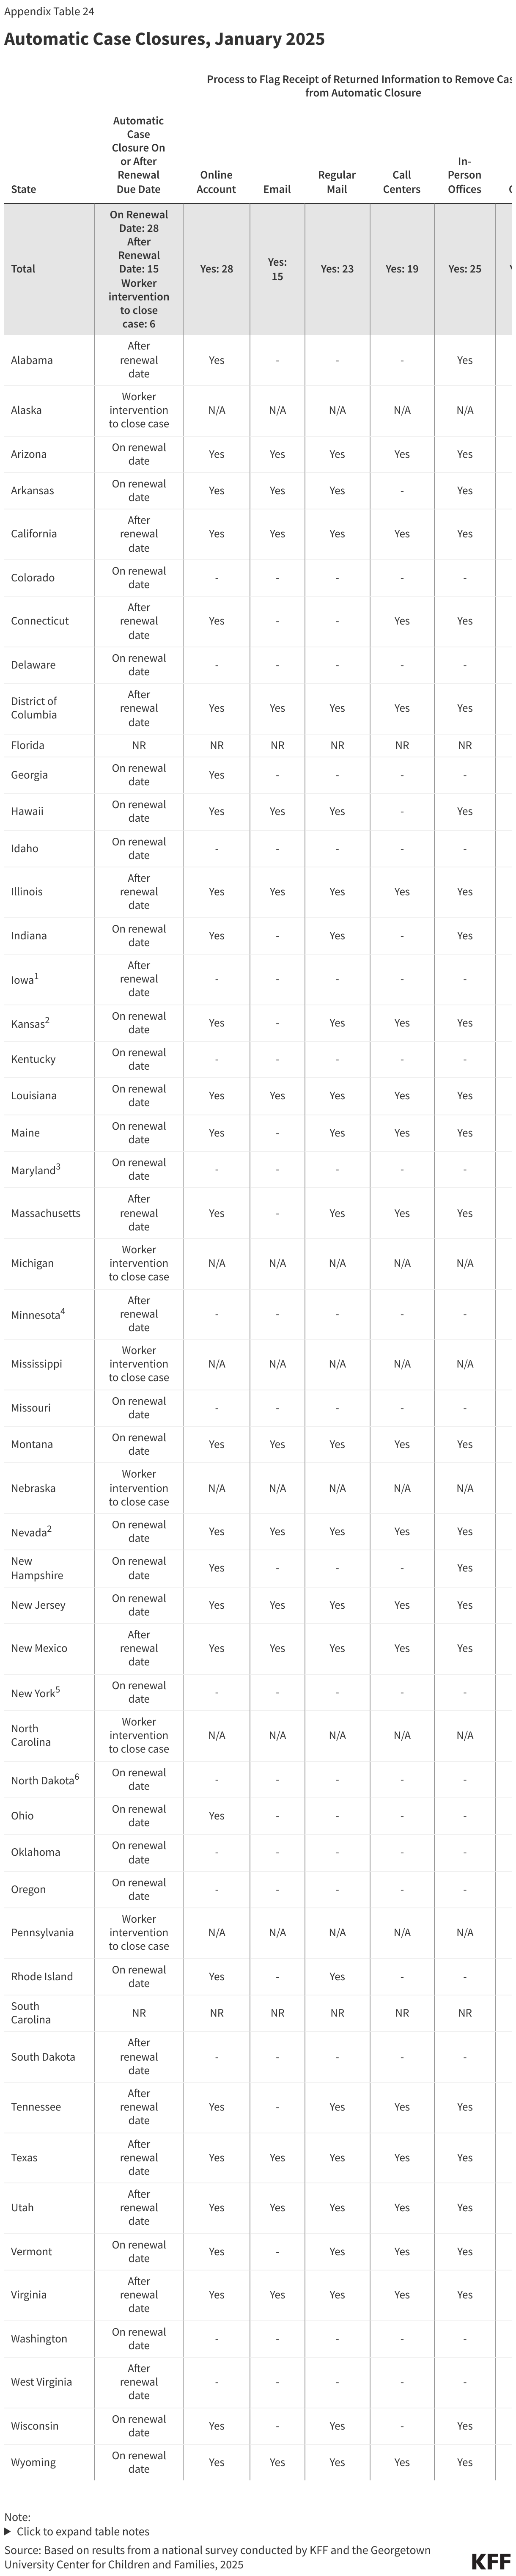
Most state eligibility systems automatically close cases on or shortly after the renewal date. Auto-closures are used by states to automate the disenrollment process for enrollees whose renewal or other missing information has not been received by the end of the renewal period. Over half of states (28) close the case on the eligibility end date, while auto-closures occur shortly after the end date in 15 states (Figure 4). In the remaining six states, workers must manually close cases. Auto-closures avoid keeping a case open past the end of an eligibility period and prevent unnecessary capitation payments in MCO states. However, if states experience delays in processing documents received by mail or fax or uploaded through online accounts and mobile apps, enrollees can be disenrolled despite submitting required documents on time. To avoid unnecessary terminations, 33 of the 43 states that automatically close cases have implemented routine processes to flag the receipt of documents through one or more modes and exclude those cases from an auto-closure.

State Use and Timing of Automatic Case Closures, January 2025

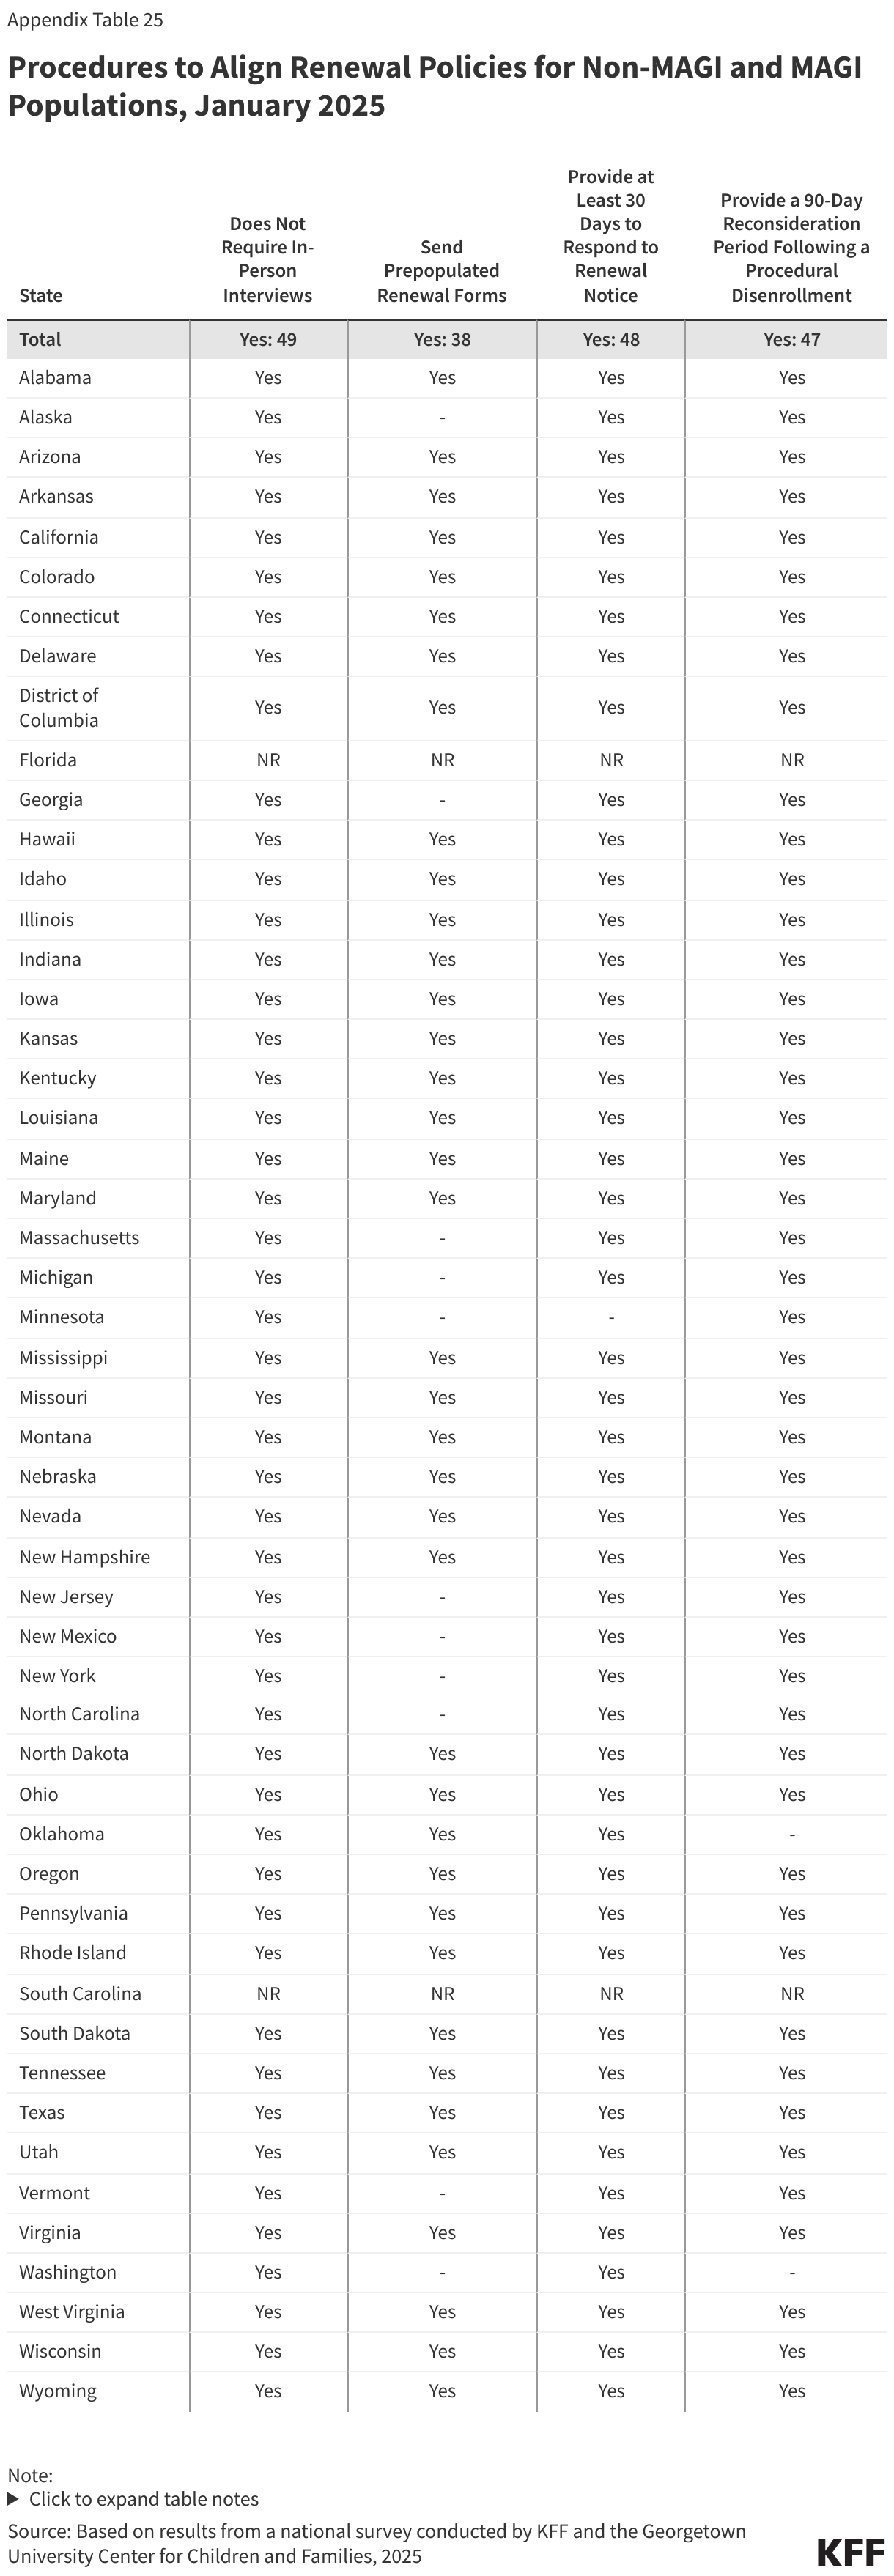
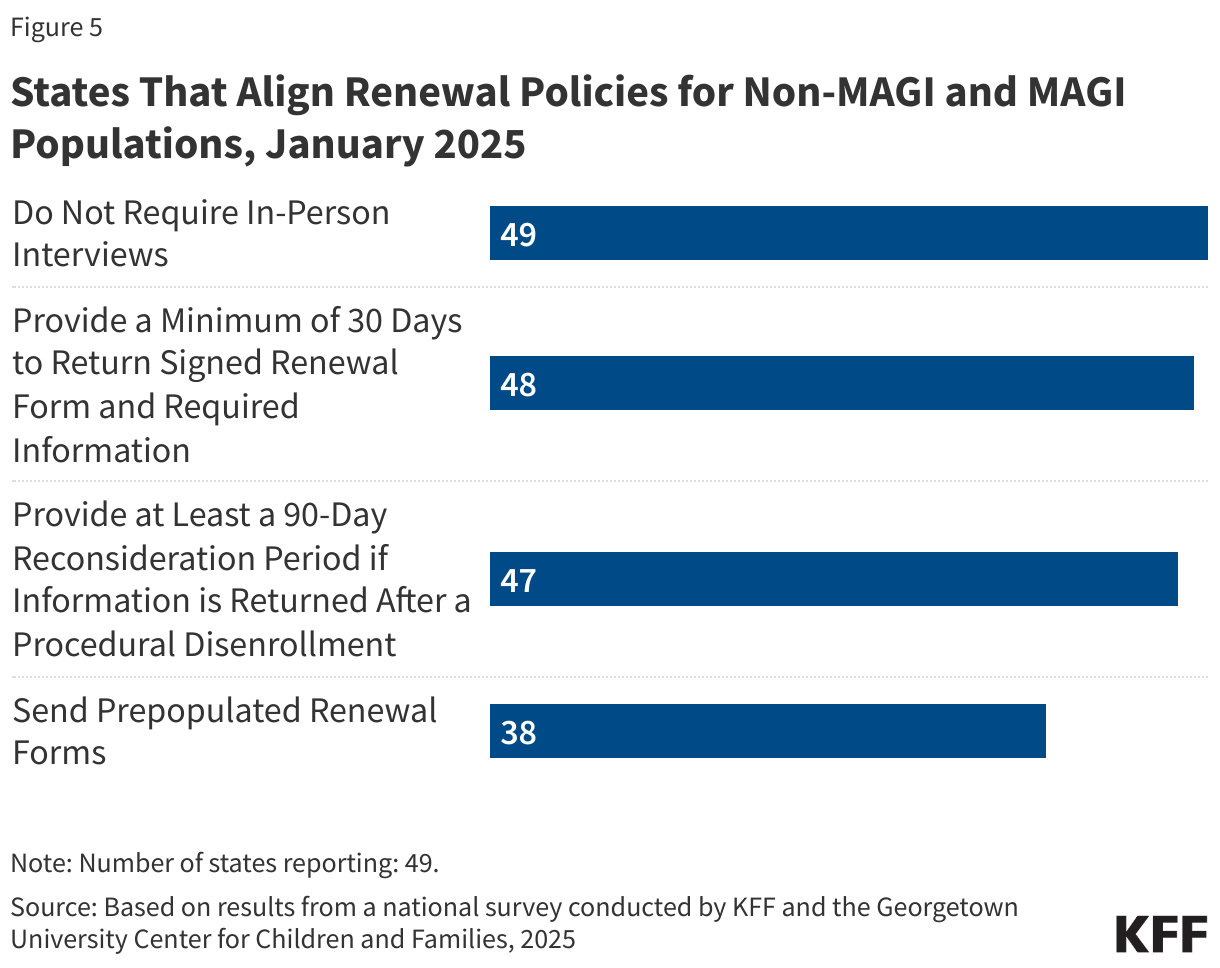
States are expediting alignment of renewal policies for seniors and people with disabilities (non-MAGI groups) with those in place across MAGI groups. No reporting state requires in-person interviews; most states allow at least 30 days for all enrollees to respond to renewal requests (48 states) and provide a 90-day reconsideration period for both MAGI and non-MAGI enrollees (47 states). However, only 38 states send a pre-populated renewal form to non-MAGI enrollees (Figure 5). Aligning processes not only removes barriers to enrollment for seniors and people with disabilities but also makes it easier to program eligibility systems, train workers, and explain the rules to applicants and enrollees. The E&E rule requires states to align these policies by June 2027.

States Aligning Renewal Policies for Non-MAGI and MAGI Populations, January 2025

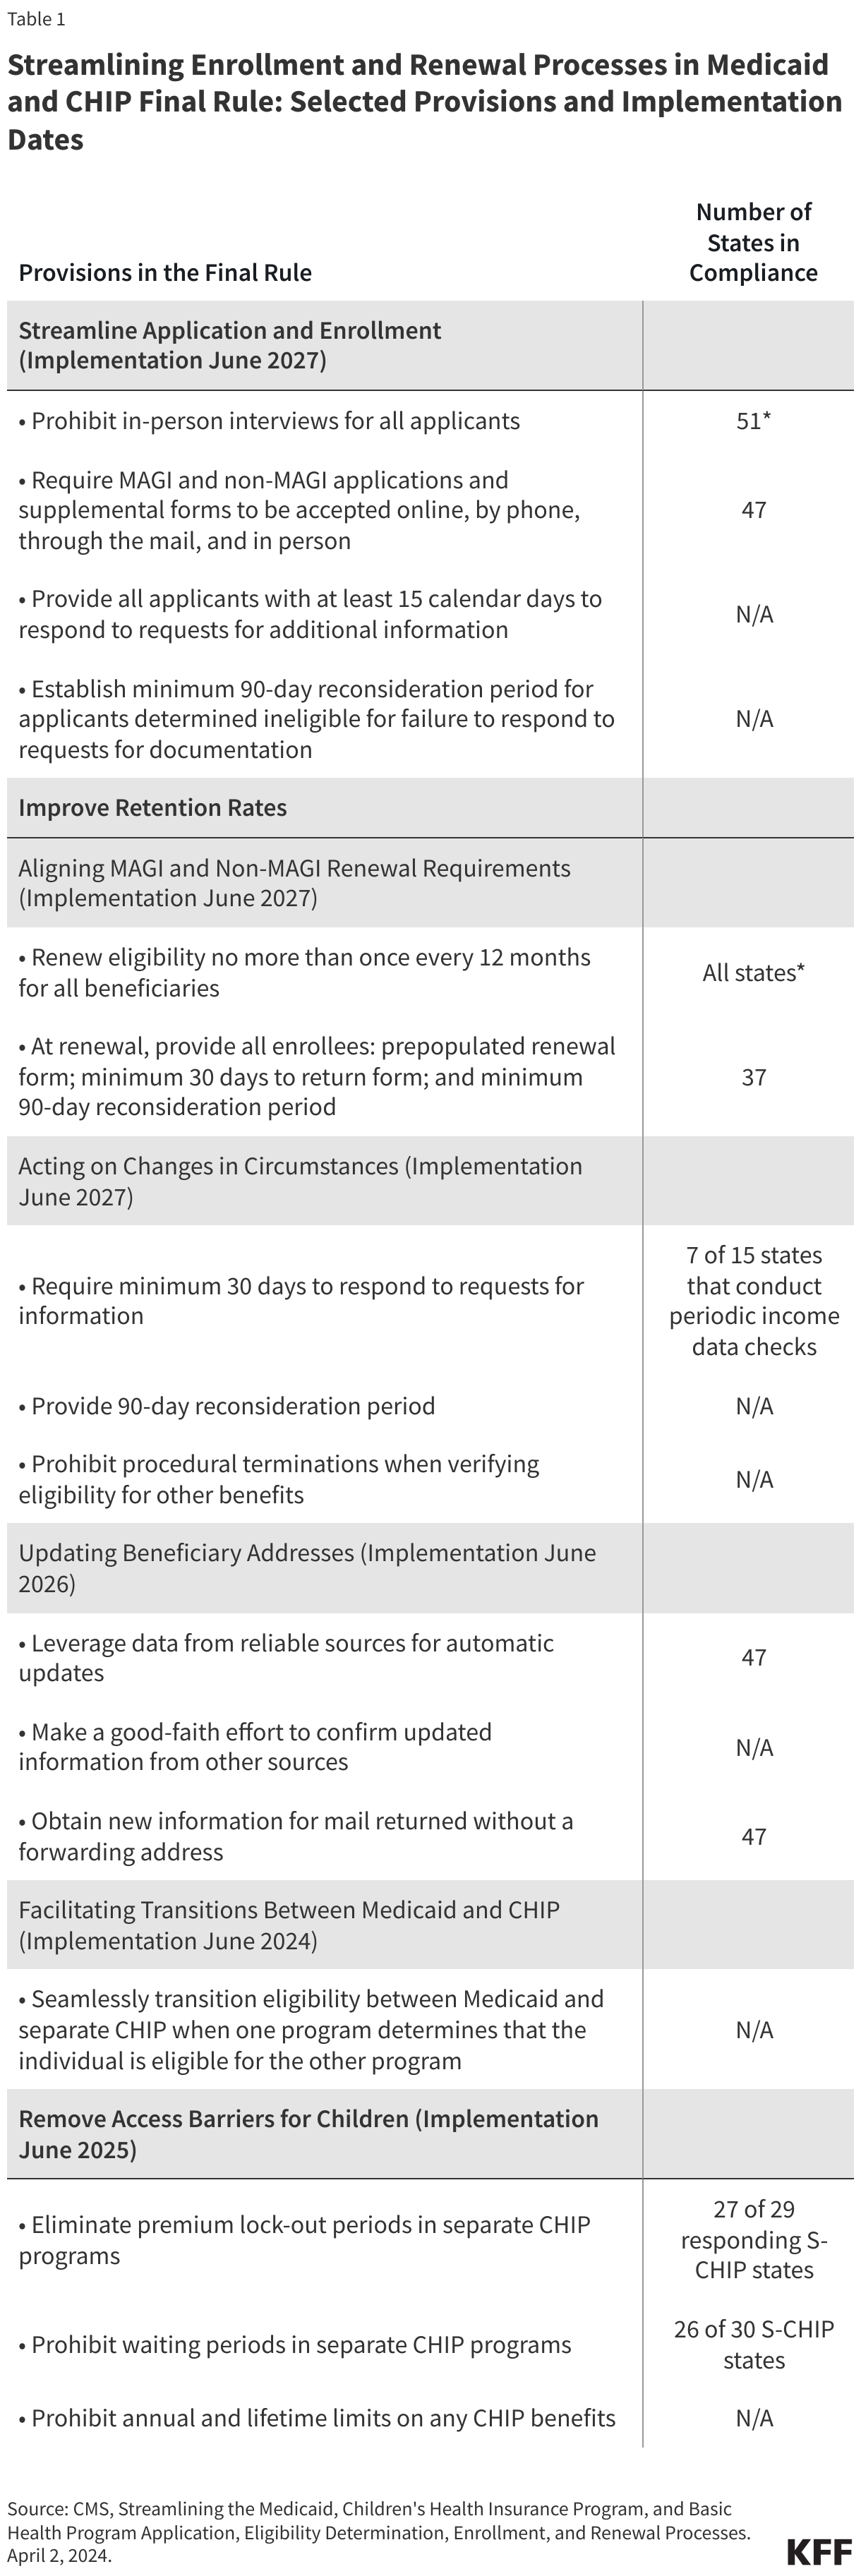
Streamlining Enrollment and Renewal Processes in Medicaid and CHIP Final Rule: Select Provisions, Implementation Dates, and Number of States Already in Compliance

On April 2, 2024, the CMS published the second part of a two-part final E&E rule that simplifies the eligibility and enrollment processes for Medicaid, the Children’s Health Insurance Program (CHIP), and the Basic Health Program (BHP). The rule streamlines application and enrollment processes, aligns renewal policies for all Medicaid enrollees, facilitates transitions between programs, and eliminates certain barriers in CHIP. Deadlines for states to implement vary across provisions, but many states are already in compliance with certain provisions.

In the table below, select provisions in the final rule include those for which there was a question on the survey that provided information on state policies.

Streamlining Enrollment and Renewal Processes
in Medicaid and CHIP Final Rule: Selected Provisions and Implementation Dates

Updating Contact information and handling returned mail

During the unwinding, states implemented new processes to update mailing addresses, reducing the cost and administrative burden of handling returned mail. Returned mail has been a longstanding and costly problem in Medicaid. States offer multiple ways for enrollees to update their contact information, including through their online account (45 states) or mobile app (11 states), through a simple online change of address form (27 states), and/or by calling a dedicated phone number or option on the state’s interactive voice response system (13 states). States also proactively conduct data matches with the USPS National Change of Address (NCOA) database (27 states) and accept updates to mailing addresses from reliable sources (40 states), including managed care organizations and navigators/assisters (Figure 6). The final E&E rule requires states to accept and act on address updates provided by specific reliable sources by December 2025.

States with Actions to Proactively Update Addresses, January 2025

Nearly all states follow up on returned mail by checking available data sources or attempting to contact the enrollee, continuing strategies deployed during the unwinding. One third of states (17) check the USPS NCOA database and 35 states check SNAP/TANF for updated contact information when mail is returned, and all but two reporting states (47) attempt to reach the enrollee by phone, email, or text (Figure 6). The final E&E rule requires states, by December 2025, to make a good faith effort to contact enrollees using different communication modes when mail is returned without an in-state forwarding address. Mail returned with an in-state forwarding order is considered a reliable source that does not require redundant verification and can be automatically updated.

Changes in Circumstances

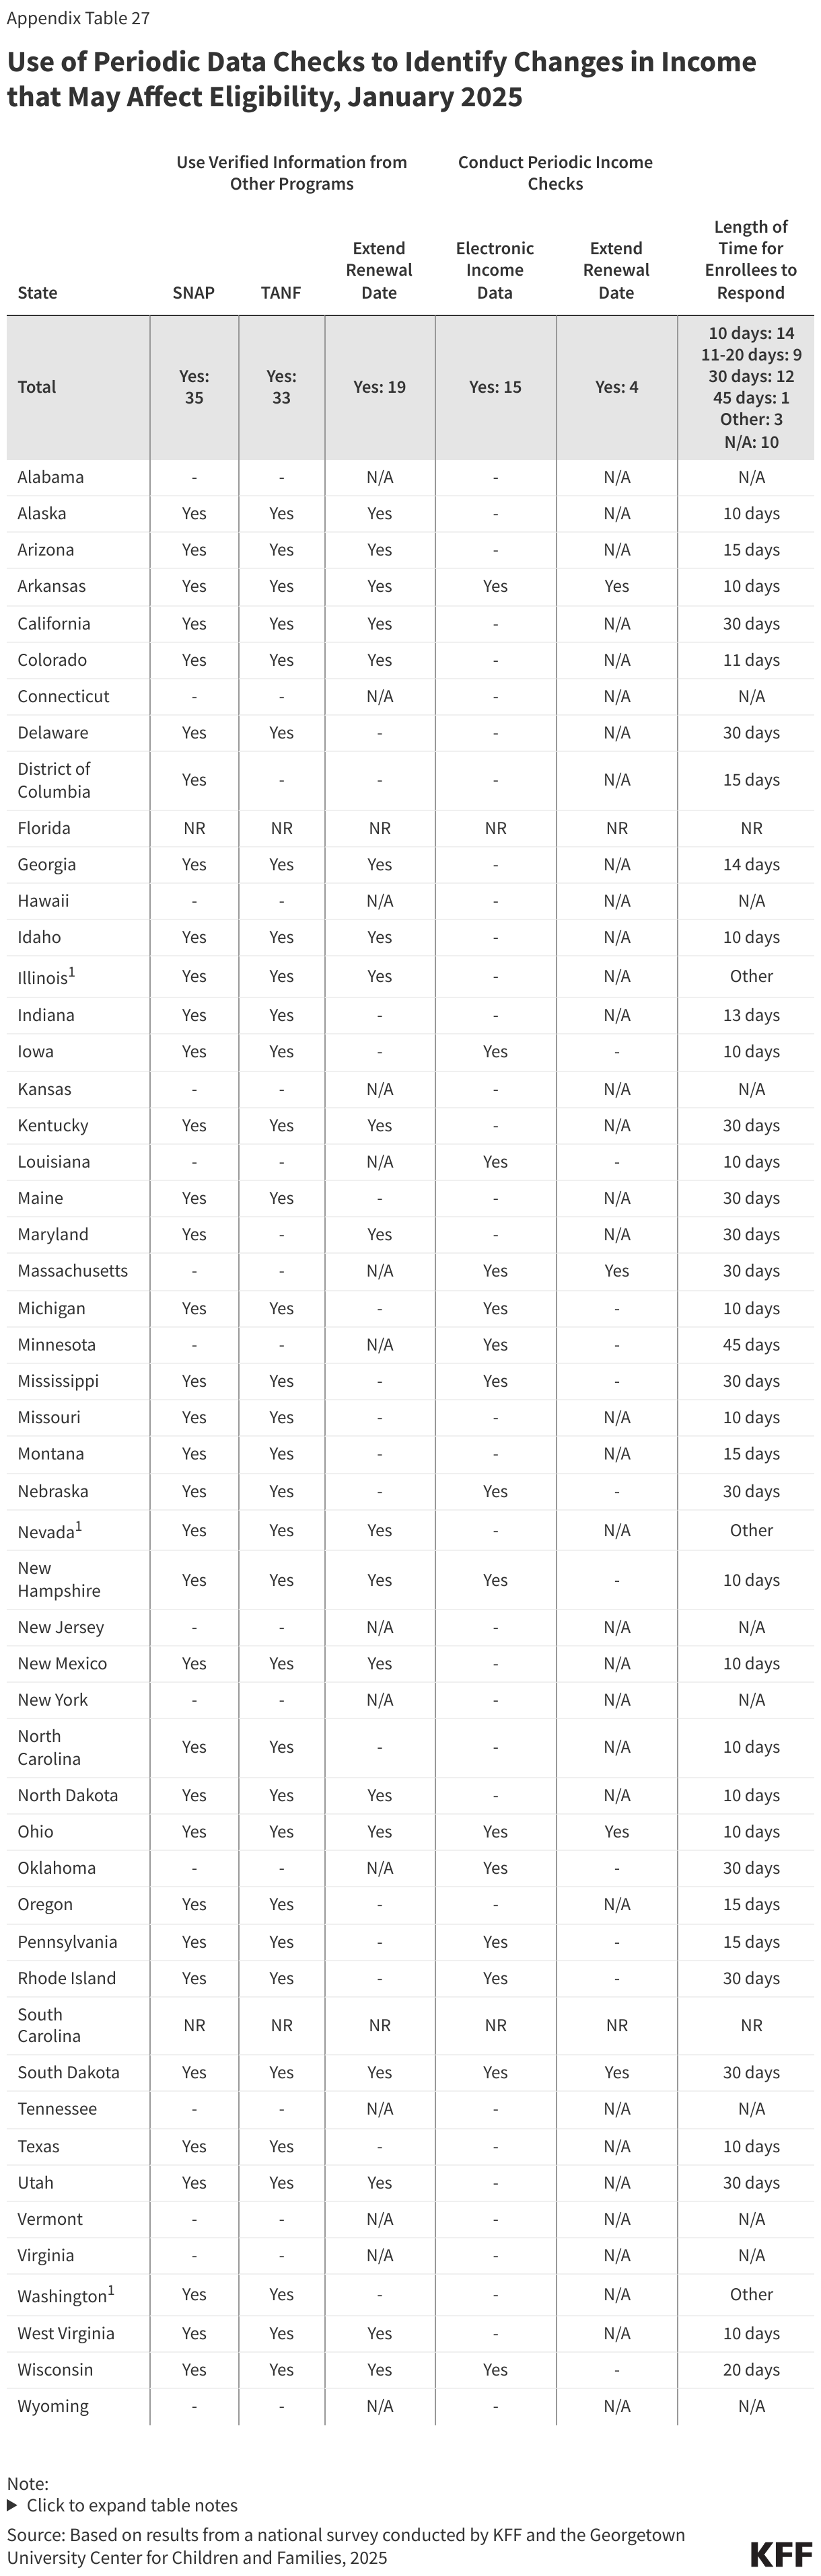
As they return to routine operations, most states use information from SNAP and TANF and/or periodically check other data sources to identify and act on potential changes in eligibility between renewals. States are required to follow up on reported changes that potentially affect eligibility and give individuals an opportunity to respond before taking adverse action. Over two-thirds (35) of states use verified information from SNAP or TANF to identify changes that may affect Medicaid eligibility (Figure 7). Fifteen states periodically check other external data sources, including quarterly wage and unemployment data, and 11 states do both. If information from the other programs confirms ongoing eligibility, 19 states extend the renewal date by 12 months; four states do the same if external income data sources confirm ongoing eligibility. When documentation from the enrollees is required to avoid termination, 14 states give enrollees only 10 days to respond. Periodic data checks and insufficient response times can exacerbate churn particularly given regular mail disruptions and delays.

Use of Verified Data for Routine Income Checks, January 2025

(Back to top)

Systems and Online Tools

The 49 reporting states operate a total of 64 eligibility systems. While 35 states operate a single eligibility system, 13 states operate two systems, and one state operates three systems. Over two-thirds of state systems (44 of 64) are at least ten years old.

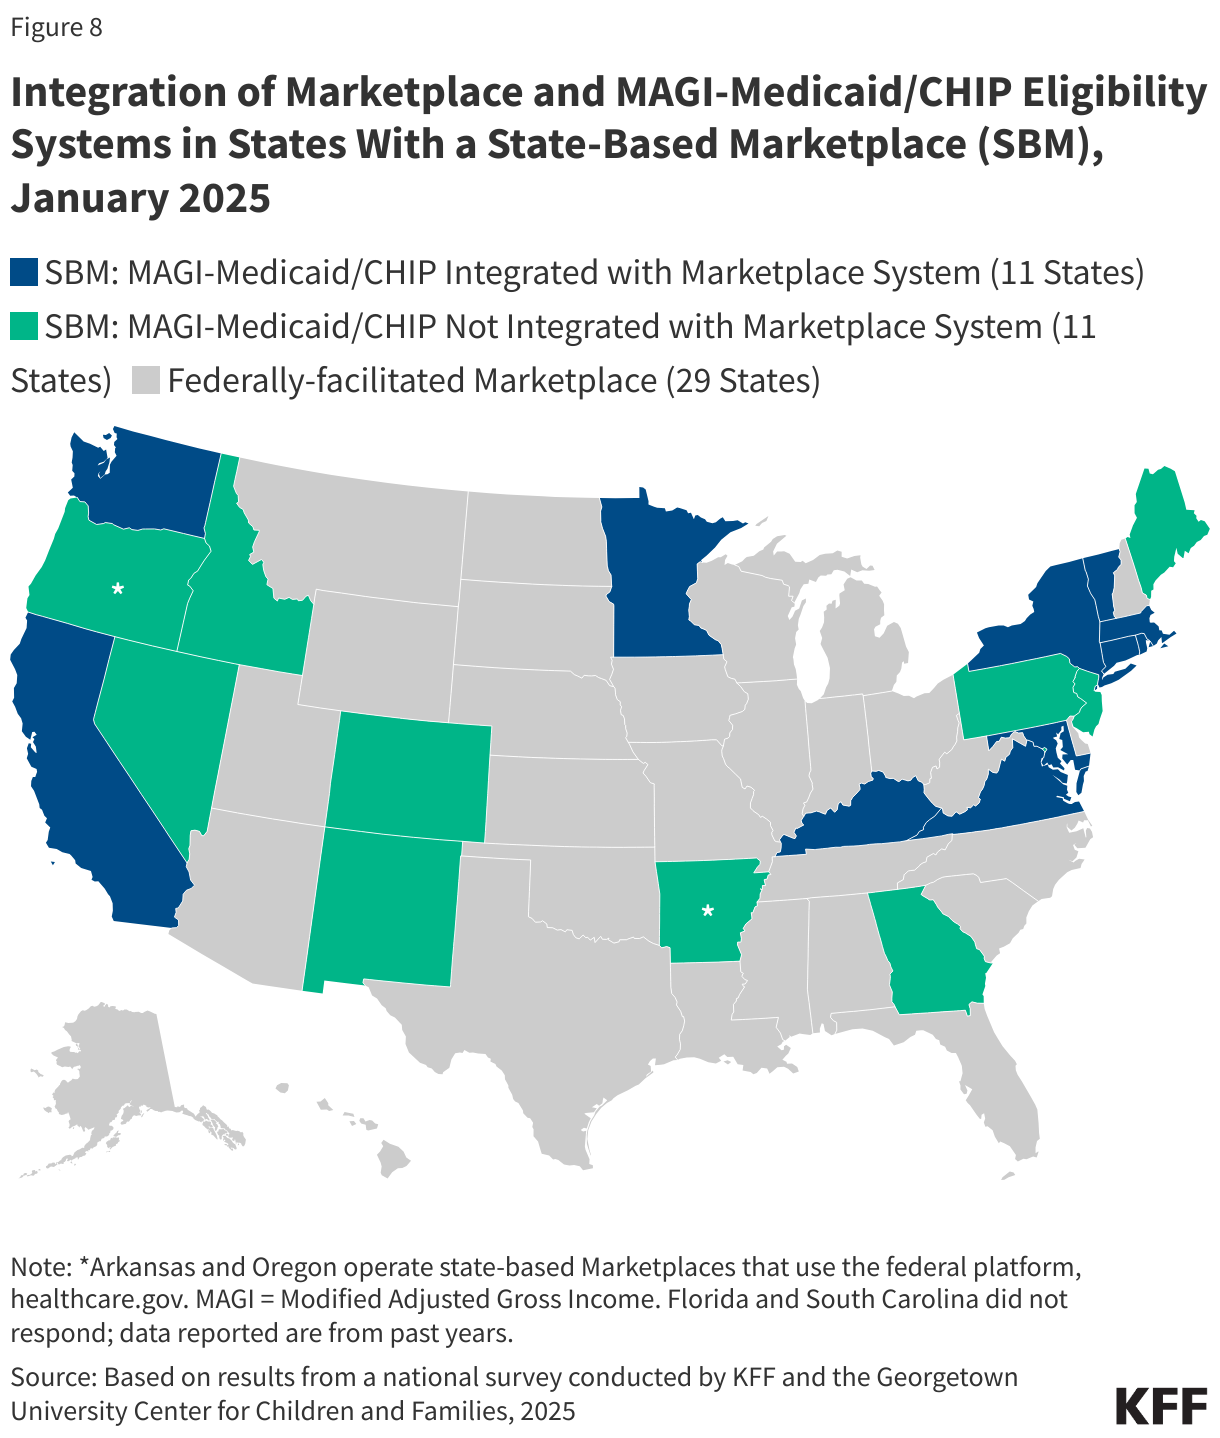
Over half of states that operate their own Marketplace eligibility systems (11 of 20 SBM states) have integrated eligibility for MAGI Medicaid into their SBM systems (Figure 8). The remaining nine SBM states as well as the two SBM states that use the Federally-facilitated Marketplace (FFM) have separate eligibility systems for determining eligibility for MAGI Medicaid and CHIP. Of the 29 reporting states that rely on the Federally-facilitated Marketplace (FFM) for all marketplace functions, 9 allow the FFM to determine Medicaid eligibility while the FFM assesses eligibility in 20 states.

Integration of Marketplace and MAGI-Medicaid/CHIP Eligibility Systems in States With a State-Based Marketplace (SBM), January 2025

Many states have integrated Medicaid systems that determine eligibility for both MAGI Medicaid and CHIP and non-MAGI Medicaid as well as non-health programs including SNAP, TANF and childcare subsidies. Of the 38 reporting states that have Medicaid eligibility systems that are not integrated with the SBM, 34 have systems that also determine eligibility for non-MAGI Medicaid; 24 states have integrated SNAP and TANF eligibility; and 13 states have systems that also determine eligibility for child care subsidies (Figure 9).

Non-Marketplace Integrated States That Have Integrated Non-MAGI Medicaid, CHIP, and Non-Health Programs Into the System That Determines MAGI-Medicaid Eligibility, January 2025

States have developed online tools, including multi-benefit applications, online accounts, and mobile apps to make it easier for people to apply for, renew, and manage their Medicaid coverage. All states have an online application, and most states have multi-benefit applications that incorporate non-MAGI Medicaid (40 states), SNAP (31 states); TANF (29 states); and childcare subsidy (18 states). Medicaid applications in 15 states allow individuals to apply for premium tax credits, all are SBM states. With one exception, all reporting states have an online account that enables people to apply for or renew their coverage, report changes in circumstances, view notices, or upload verification documents. Eight states have also created mobile apps through which people can submit a MAGI-based Medicaid application. These mobile apps also include many of the same features for managing Medicaid coverage as online accounts but are specifically designed to function well on smartphones and tablets. An additional six states report having a mobile app that allows users to manage their coverage but does not include application functionality (Figure 10).

States with Multi-Benefit Online Medicaid Applications, January 2025

States vary in their approaches to online account security and resetting passwords. Over half the states (29) require identity verification to set up an online account while 30 states use multi-factor authentication for one or more actions. Multi-factor authentication is required to set up the account in 26 states, reset passwords in 24 states, and every time the account is accessed in 15 states (Figure 11). Remembering passwords to access accounts can be challenging, especially when the accounts are not accessed frequently. Most states (41) offer at least two ways for online account users to reset passwords. Most often users can request a link be sent via email or text (41 states) or by answering security questions (33 states). Individuals in most states (30 states) may contact the Medicaid call center for a password reset, but it is the only way to reset a password in one state.

States Requiring Identify Verification and Multi-Factor Authentication for Online Accounts, January 2025

About a quarter of states are using artificial intelligence (AI) to support consumer assistance. States use AI to answer consumer questions on the website (12 states), during the application (6 states) and renewal (7 states) processes, and on using online accounts (8 states) (Figure 12). A couple of states also use chatbots to update contact information and collect information on newborns. A smaller number of states (5) report using AI to assist with eligibility and enrollment processes, including by using bots to read information from certain documents submitted by MAGI applicants and to assist with reviewing non-MAGI ex parte renewals and other case renewals.

States That Use Artificial Intelligence (AI) to Support Consumers, January 2025

(Back to top)

Eligibility and Enrollment Policies

Eligibility Policies

While child eligibility remains the highest for all MAGI eligibility groups, the median eligibility limit for pregnancy coverage in Medicaid and CHIP increased from 210% to 213% of the federal poverty level (FPL) with eligibility expansions in two states. In 2025, the median child eligibility remained unchanged at 255% FPL, or $67,957 for a family of three. Alaska and Washington expanded pregnancy eligibility and Colorado adopted the From Conception to End of Pregnancy (FCEP) CHIP option in 2025, becoming the 25th state to adopt this coverage. Since 2023, five states (Alaska, Nevada, North Dakota, Tennessee, and Washington) have increased pregnancy eligibility levels, but one state (Iowa) is seeking approval to reduce pregnancy income eligibility from 380% FPL to 215% FPL.

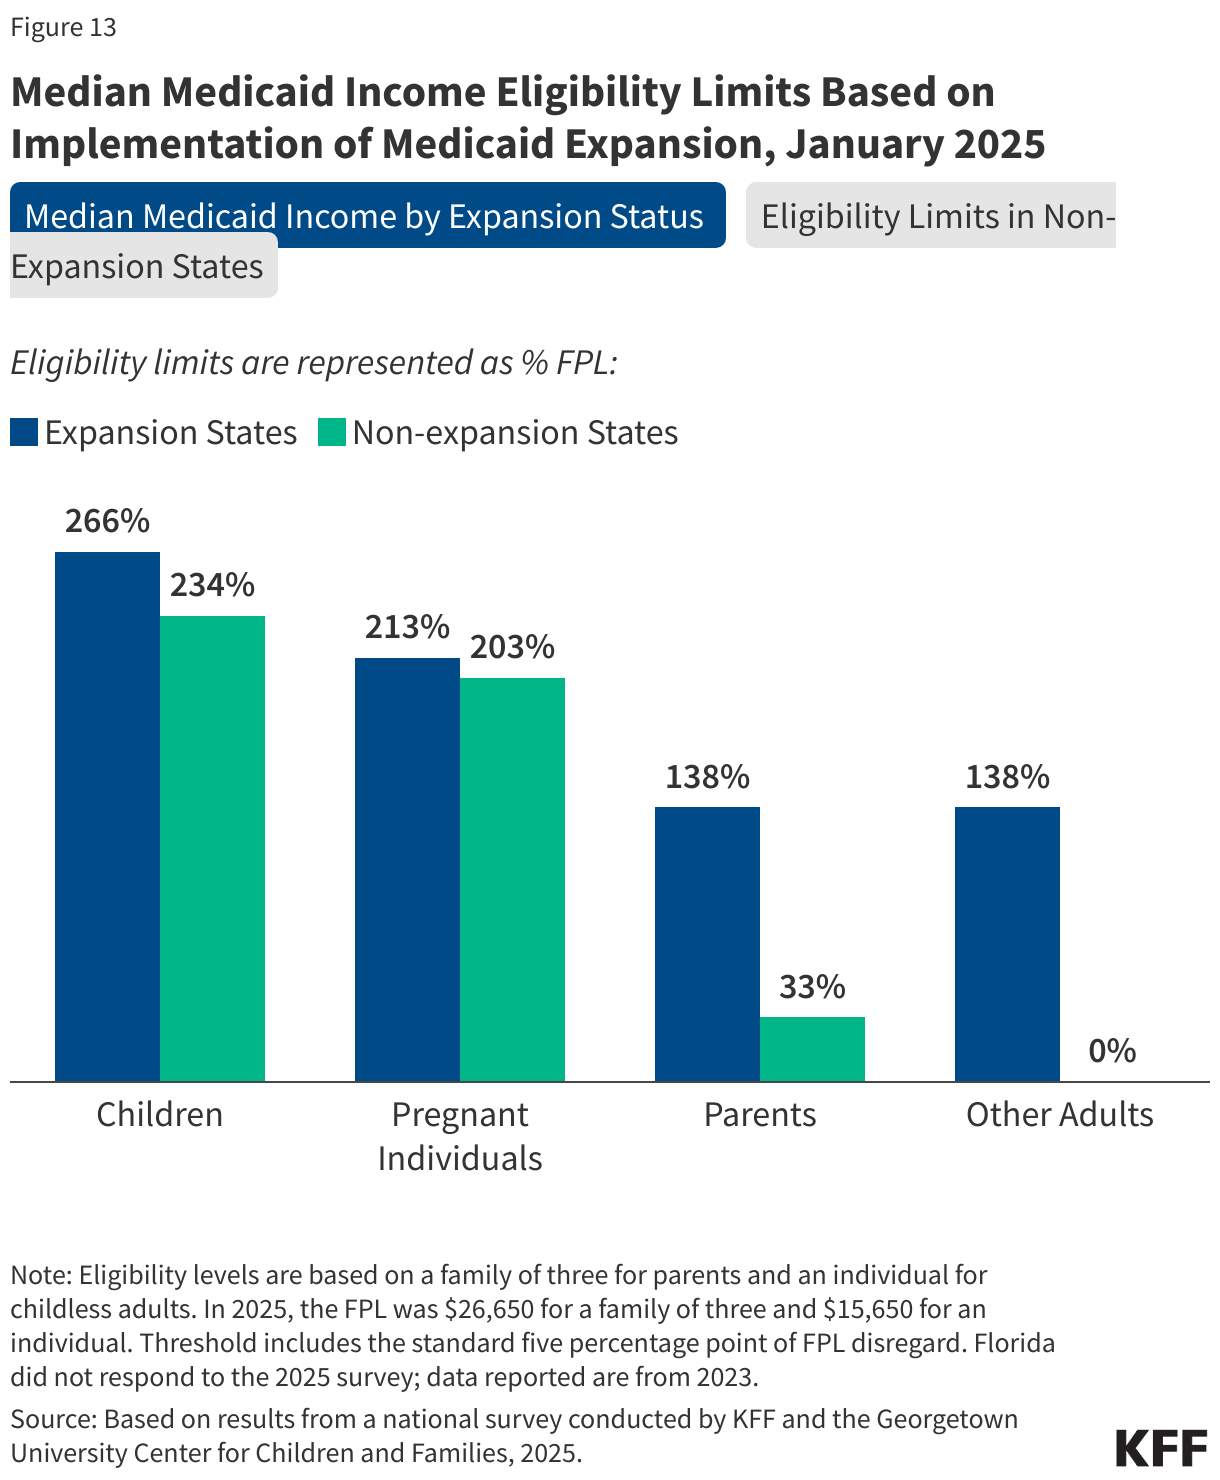
In states that have not implemented Medicaid expansion, median eligibility for parents is 33% FPL (Figure 13). Half of the ten non-expansion states base eligibility for parents on dollar thresholds that are not routinely updated and erode over time with inflation. Among non-expansion states, only Wisconsin covers adults without dependent children. Through a section 1115 waiver, Georgia provides coverage to parents who do not qualify for section 1931 parent eligibility and childless adults with incomes up to 100% FPL with initial and continued enrollment conditioned on meeting work requirements. Non-expansion states have lower median eligibility levels for all MAGI Medicaid groups compared to expansion states, including for children (234% FPL in non-expansion states compared to 266% FPL in expansion states); for pregnancy coverage (203% FPL compared to 213% FPL), and for parents (33% FPL compared to 138% FPL).

Median Medicaid Income Eligibility Limits Based on Implementation of Medicaid Expansion, January 2025

Two-thirds of states cover lawfully-residing immigrant children and pregnant individuals. Thirty-eight states use federal funds authorized under the Immigrant Child Health Insurance Act (ICHIA) to cover lawfully-residing children in both Medicaid and CHIP without requiring the 5-year waiting period. Thirty-two states also provide pregnancy coverage for lawfully-residing immigrant individuals without the 5-year wait.

Enrollment Policies

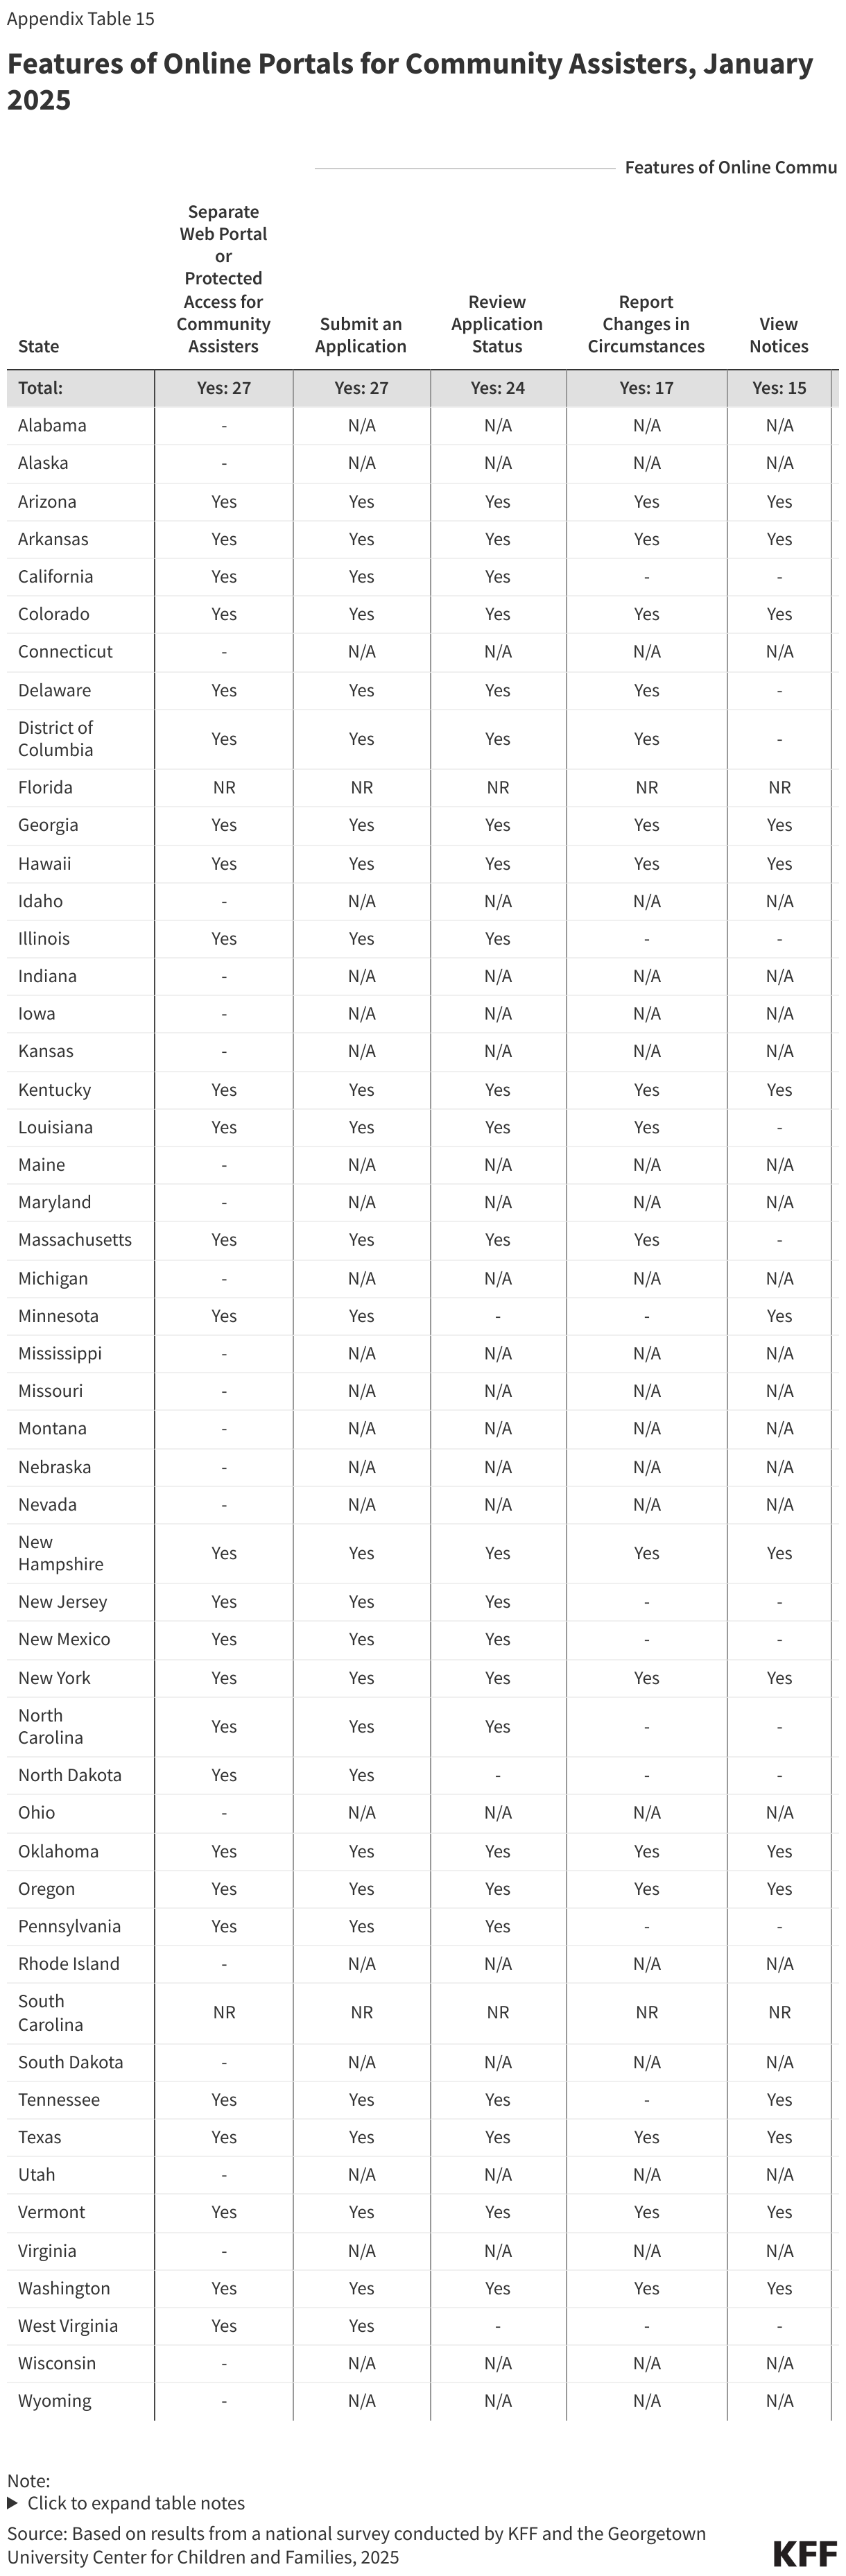
Just over half of states have a separate web portal or protected access to the application portal for certain entities to assist individuals in enrolling and managing their account (Figure 14). The entities authorized to use the portals include health care providers (community health centers, hospitals, and pharmacists), community-based organizations, navigators and application assisters, and MCOs. In all 27 states with portals, authorized assisters can submit facilitated applications; they also have access to many of the features available in online accounts to help individuals report changes and stay enrolled. Seventeen states provide financial support to authorized assisters, primarily through grants and contracts.

States with Online Portals for Community Assisters, January 2025

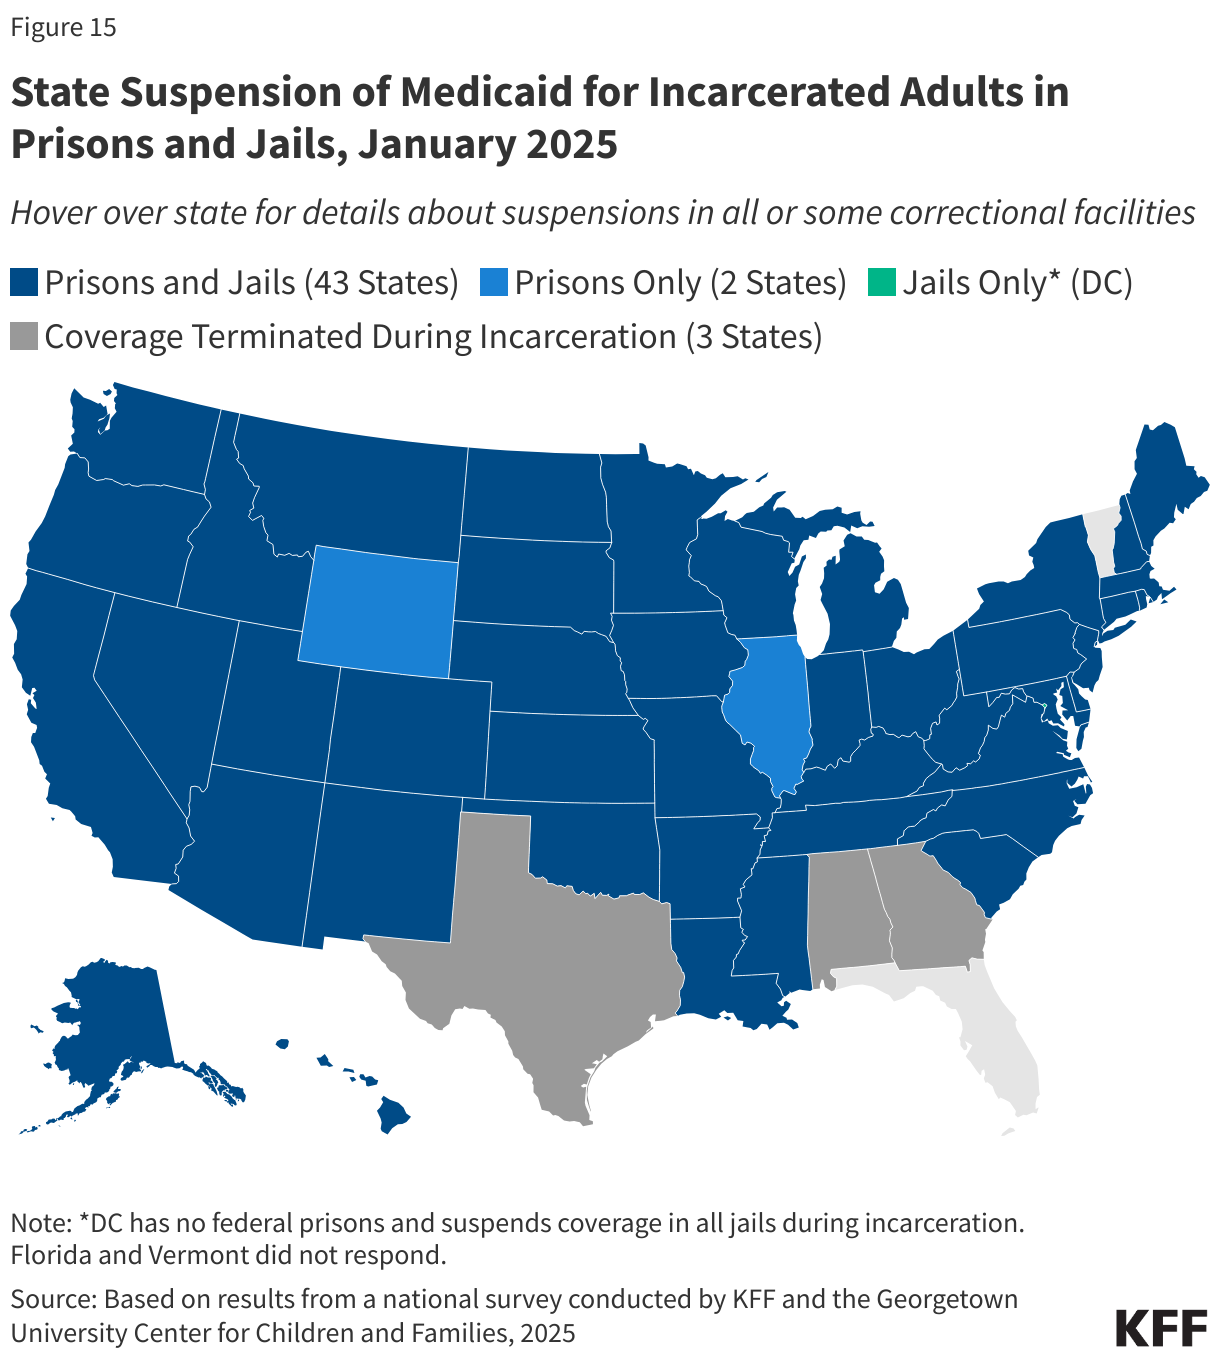
Most states suspend, rather than terminate, Medicaid eligibility for adults during incarceration. Although benefits during incarceration are limited to in-patient hospital stays, 46 states suspend Medicaid coverage when an adult is incarcerated (Figure 15). Nearly all of these states suspend coverage in prisons and jails (43 states) while two states suspend coverage in prisons only, and the District of Columbia, which does not operate any prisons, only suspends coverage in jails. Twelve states employ an automated process for suspending coverage while 5 states use a combination of automated and manual processes. Currently 25 states use only a manual process, and 3 states use some other process, but many states indicated they are working to build automated data interfaces. The Consolidated Appropriations Act, 2023 requires all states to suspend rather than terminate Medicaid coverage when people are incarcerated beginning in 2026. Suspended eligibility makes it easier for states to reactivate reimbursement for inpatient services and take advantage of reentry waiver opportunities. A growing number of states are using reentry waivers to provide access to prescription drugs and mental health and substance use disorder services prior to release to facilitate the transition back into the community and to reduce recidivism.

State Suspension of Medicaid for Incarcerated Adults in Prisons and Jails, January 2025

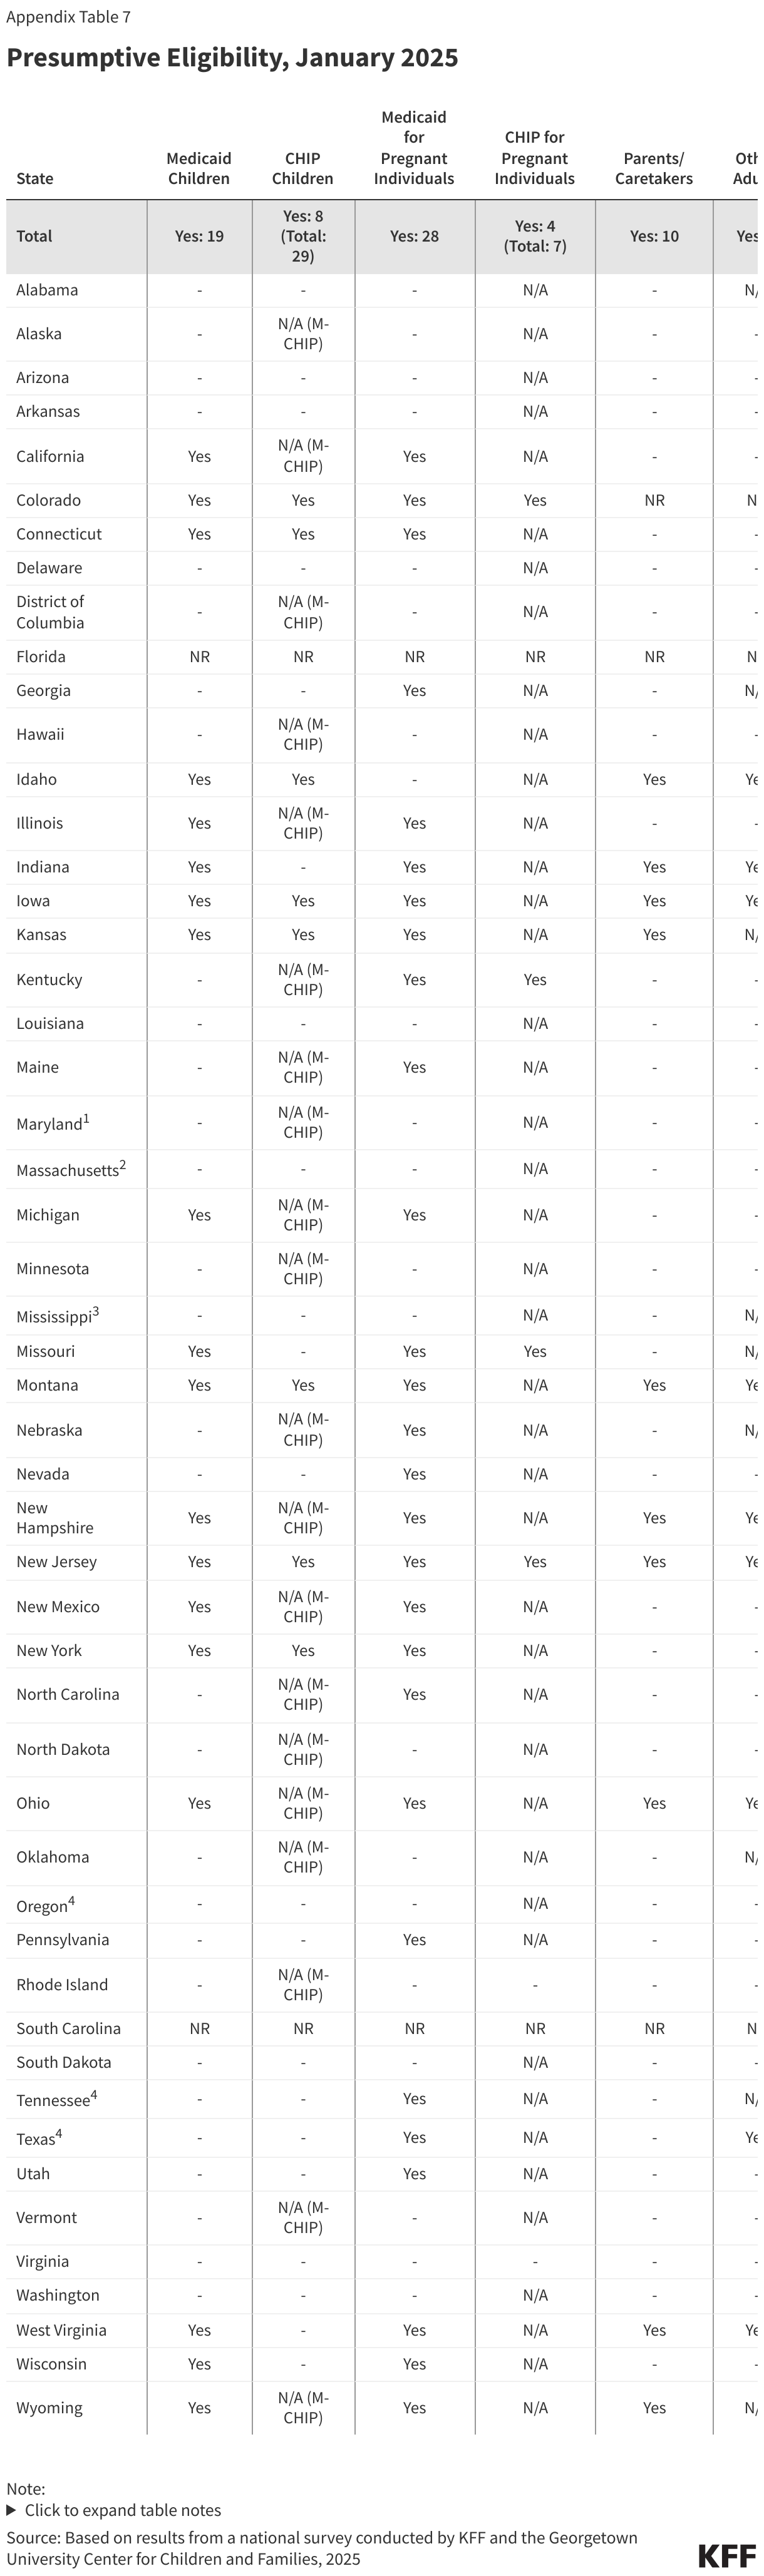
States use presumptive eligibility to expedite enrollment primarily for children and pregnant people. More than half of states authorize qualified entities to screen for eligibility and make a presumptive eligibility (PE) determination to temporarily enroll the individual while the regular application is being processed. PE is a long-standing state policy option designed to expedite immediate access to needed health care services. Twenty-eight states have implemented PE for pregnant people while 19 states have adopted PE for children in Medicaid and 8 use PE for children in their separate CHIP program (Figure 16). PE is used for other adult populations in 17 states and for former foster youth in 9 states. States have flexibility in selecting which types of entities are authorized to make PE determinations. However, all states must also allow hospitals to make presumptive determinations for all populations if the hospital elects to do so.

States With Presumptive Eligibility for Certain Populations, January 2025

Fewer states (8) use Express Lane Eligibility (ELE) to automatically enroll and/or renew Medicaid eligibility based on data and eligibility findings from other public benefit programs. ELE policy is limited to children unless a state receives waiver authority to include parents; two states (Massachusetts and Maryland) use ELE to renew coverage for parents to facilitate renewal for the family (Table 2). Information from SNAP is most commonly used for ELE, but some states use information from other programs, including TANF, WIC, and state tax data. ELE can be particularly useful in states without eligibility systems that are integrated with non-health programs by eliminating duplication of data collection and verification processes used by other programs.

Express Lane Eligibility Policies by State and Program, January 2025

Most states have eliminated waiting periods in separate CHIP programs. Only four states continue to require children to be uninsured for a certain period before they can enroll in CHIP, down from 13 states with waiting periods in 2020. Three states require a waiting period of 90 days and one has a waiting period of 2 months. Two of the states plan to phase out the waiting periods by July 2025. All states are required to phase out waiting periods by June 2025, based on new requirements in the E&E rule.

Eighteen states currently charge premiums for children; two of those states impose a lockout period of up to 90 days if premiums are unpaid (Figure 17). Two states (Utah and Delaware) permanently eliminated CHIP premiums in 2024, while Georgia reinstated CHIP premiums after pausing them during the COVID pandemic. Premiums are suspended temporarily or indefinitely in Arizona and Vermont. States may not charge premiums in Medicaid or M-CHIP programs for children with incomes below 150% FPL, but separate CHIP programs may impose premiums on children with household incomes at or above 133% FPL. Premiums can be charged on a monthly, quarterly, or annual basis (also known as an enrollment fee) and can be family-based or per-child, with or without a family cap. The maximum premium or enrollment fee amount for one child ranges from $15 in Idaho to $192 in Missouri, with some states varying premiums based on income. If premiums are unpaid in Kansas or Louisiana, children are locked out of coverage at the end of their 12-month continuous eligibility period for a period of 90 days or until the premium is paid. States are required to phase out nonpayment lockouts by June 2025, based on new requirements in the E&E rule.

Premiums for Children in Medicaid and CHIP,  January 2025

Appendix Tables

Income Eligibility Limits for Children's Health Coverage as a Percent Of The Federal Poverty Level, January 2025

(Back to top)

Selected Policy Options in CHIP, January 2025

(Back to top)

Medicaid and CHIP Coverage for Pregnant Individuals and Medicaid Family Planning Coverage, January 2025

(Back to top)

State Adoption of Options to Cover Immigrant Populations, January 2025

(Back to top)

Medicaid Income Eligibility Limits for Adults as a Percent of the Federal Poverty Level, January 2025

(Back to top)

Suspension of Medicaid for Incarcerated Adults, January 2025

(Back to top)

Presumptive Eligibility, January 2025

(Back to top)

System Automation of Real-Time Determinations and Ex Parte Renewals, January 2025

(Back to top)

MAGI-Medicaid Eligibility System Integrated with Marketplace Eligibility System, January 2025

(Back to top)

Multi-Benefit Online Medicaid Applications, January 2025

(Back to top)

Online Medicaid Accounts, January 2025

(Back to top)

Multi-Factor Authentication for Online Medicaid Accounts, January 2025

(Back to top)

Options for Resetting Passwords of Online Medicaid Accounts, January 2025

(Back to top)

Viewing Notices and Submitting Renewal Information Through Online Accounts, January 2025

(Back to top)

Features of Online Portals for Community Assisters, January 2025

(Back to top)

State Actions to Update Mailing Addresses, January 2025

(Back to top)

State Strategies for Returned Mail, January 2025

(Back to top)

Modes to Submit Verification Documentation, January 2025

(Back to top)

Recent Actions to Increase Ex Parte Renewal Rates, January 2025

(Back to top)

Advance Notice of  Renewals, January 2025

(Back to top)

Reminders to Respond to Renewal Notice, January 2025

(Back to top)

Access to Enrollee Renewal Dates, January 2025

(Back to top)

State Actions to Help Individuals Maintain or Regain Coverage, January 2025

(Back to top)

Automatic Case Closures, January 2025

(Back to top)

Procedures to Align Renewal Policies for Non-MAGI and MAGI Populations, January 2025

(Back to top)

Adoption or Continuation of Policies Allowed As 1902(e)(14)(A) Waivers, January 2025

(Back to top)

Use of Periodic Data Checks to Identify Changes in Income that May Affect Eligibility, January 2025

(Back to top)

Premiums and Enrollment Fees for Children, January 2025

(Back to top)

What’s at Stake in the Supreme Court Case Medina v. Planned Parenthood South Atlantic?

Published: Apr 1, 2025

On April 2nd, the Supreme Court of the United States will hear oral arguments in Medina v. Planned Parenthood South Atlantic. The case addresses whether Medicaid beneficiaries can seek relief in federal court to enforce Medicaid’s “free-choice of provider provision,” which allows Medicaid beneficiaries to seek care from any provider that is qualified and willing to participate in the program. While the case focuses on this specific question, it has its origins in broader efforts by anti-abortion policymakers to exclude Planned Parenthood clinics from the Medicaid program and, ultimately, eliminate all federal payments to Planned Parenthood centers. In this brief, we describe the case, the Medicaid policies underlying it, and potential implications for Medicaid beneficiaries’ access to reproductive health services.

What is the case in front of the Supreme Court about?

The Supreme Court’s review of this case is limited to one question: Can a Medicaid beneficiary bring a civil action to enforce the Medicaid Act’s free choice of provider? This question is similar to one that the Court decided in 2023 (Health and Hospital Corp of Marion County v. Talevski ) when it ruled (7-2) that patients do have a private right of action to enforce certain conditions that federal Medicaid law imposes on states and health care providers. However, the current case involves a different provision of federal law relating to free choice of provider under the Medicaid Act. Planned Parenthood and the individual beneficiary who has brought this case take the position that Medicaid beneficiaries meet the requirements to sue in order to enforce the free choice of provider provision. The Trump administration has weighed in on the side of South Carolina, contending that Medicaid beneficiaries should not be permitted to bring an action to enforce this provision.

In 2018, South Carolina’s Governor McMaster (R) issued an executive order prohibiting any clinic that provides abortion care from participating in the state’s Medicaid program. The order states that the state funds used to reimburse providers could be used to indirectly subsidize abortion care even though Medicaid only pays for non-abortion family planning services. The executive order had a direct impact on the Planned Parenthood clinics that offer abortion services in the state (South Carolina limits abortion to up to six weeks of pregnancy) but also offer enrollees other Medicaid-covered services including contraceptive care and STI screening and treatment. The state has historically reimbursed these providers for the non-abortion medical care they provide to Medicaid enrollees just like it pays for all other medical care. The federal Hyde Amendment bans the use of federal funds (including Medicaid) from being used to pay for abortions unless the pregnancy is a result of rape or incest or endangers the life of the pregnant person.

States operate Medicaid programs under federal guidance, and one of the federal provisions of the Medicaid law is known as free choice of provider. This provision states that “A State plan for medical assistance must… provide that any individual eligible for medical assistance… may obtain such assistance from any institution, agency, community pharmacy, or person, qualified to perform the service or services required… who undertakes to provide him such services.” Additionally, because many states require Medicaid beneficiaries to enroll in managed care, limiting their care to a defined network of providers, federal law states that beneficiaries may seek care from any Medicaid provider for family planning services specifically, even those outside the plan network.

The larger context for this case involves how a state determines who is a qualified provider, even though the Supreme Court is more narrowly focusing on private right of action. The statute does not define the word “qualified,” but longstanding federal regulations, recognize states’ authority to “set reasonable standards relating to the qualifications of providers.” The final lines of the regulation say that States need not provide payments to providers with certain felony convictions. The regulations and a separate provision contemplate that “[i]n addition to any other authority, a State may exclude” any provider from Medicaid for certain reasons “for which the Secretary could exclude” the provider from participating in Medicaid.

In 2016, in a “Dear Medicaid Director letter” issued during the Obama administration, CMS wrote that states have the authority to set standards that providers must meet, but to disqualify a willing provider, the state must have a legitimate reason such as concerns about the fitness of the provider to meet the standards or evidence of fraud. It went on to say that states cannot target a specific provider and “The failure of a state to apply otherwise reasonable standards in an evenhanded manner may suggest such targeting.” CMS went on to say that “states may not deny qualification to family planning providers…solely because they separately provide…abortion or another service that the state does not approve of.” This letter was rescinded by the Trump administration in 2018. Whether it be through the Courts or through administrative actions, this issue will likely continue to be debated and legally challenged for the foreseeable future.

The Supreme Court, however, is only considering whether Medicaid beneficiaries have the right to bring a case to enforce their right to choose their provider. The Court is not considering whether South Carolina acted properly when it excluded Planned Parenthood from its Medicaid program, deeming them “unqualified” because they provide abortion services as well as other reproductive health care services. If the Supreme Court finds that Medicaid beneficiaries have the right to bring an action to enforce their right to choose any provider, the case will then go back down to the district court to determine whether South Carolina acted within its authority to exclude Planned Parenthood as a nonqualified provider. If the Supreme Court rules that Medicaid beneficiaries do not have a private right of action, then Planned Parenthood itself could appeal South Carolina’s decision that found them to be an unqualified provider.

How have courts ruled about private right of action for Medicaid beneficiaries in other cases?

A civil rights statute, Section 1983, has long provided a mechanism for individuals to enforce the rights provided to them under federal programs, including Medicaid. There is a long history of litigation related to private enforcement of the Medicaid Act. While courts have affirmed the authority for individuals to use Section 1983 to protect Medicaid rights, the Supreme Court has issued decisions that have narrowed this authority. Currently there is a three-pronged test (pursuant to the cases Blessing v Freestone (1997), Gonzaga University v. Doe (2002), and Health & Hosp. Corp of Marion County v. Talevski (2023)) based on legal precedent that courts use to evaluate whether a federal law establishes an enforceable right:

  1. whether the plaintiff is an intended beneficiary of the statute;
  2. whether the plaintiff’s asserted interests are specific enough to be enforced; and
  3. whether the statute imposes a binding obligation on the State.

In Talevski, the most recent Supreme Court case to consider this right, the high court reaffirmed the holdings in Gonzaga that a statutory provision is enforceable under Section 1983 when the provision is “phrased in terms of the persons benefits” and contains “right-creating individual centric language with an unmistakable focus on the benefited class.”

Federal circuit courts have generally upheld private enforcement of rights for Medicaid enrollees. Before the Supreme Court Talevski ruling in 2023, there was a split among circuit court rulings. In 2019 there were four circuit court opinions that all ruled in favor of beneficiaries’ right to enforce Medicaid provisions. However, in 2020, three of four circuit court decisions did not rule in favor of Medicaid enrollees, including one decision from the 5th Circuit Court of Appeals which ruled in favor of Texas’ decision to exclude Planned Parenthood. Until the Medina case, the Supreme Court had previously refused to review multiple cases in which Planned Parenthood patients were found to have an enforceable right. An earlier version of the Medina case, Planned Parenthood South Atlantic v. Baker, went up to the Supreme Court but was denied review. This is the first time the current configuration of the Supreme Court will hear a case involving Planned Parenthood.

While this case is narrowly focused on whether Medicaid beneficiaries have the right to sue to enforce their right to choose any willing, qualified provider, the Supreme Court’s decision will have implications for the many states wishing to exclude providers, such as Planned Parenthood, based on abortion politics and not based on clinical qualifications to provide medical services. If Medicaid beneficiaries cannot bring an action to enforce the free choice of provider provision, then states will have greater latitude to exclude providers, such as Planned Parenthood, based on political objections.

What does this case mean for Medicaid beneficiaries?

This case has the potential to curtail low-income individuals’ access to preventive reproductive health care in South Carolina and potentially in many states in the nation. The Medicaid program covers one in five reproductive age women and is the largest source of coverage for women with low incomes, covering over four in ten (Figure 1). All state Medicaid programs must cover family planning services, which includes contraceptive care plus a range of related services such as physical exams, cancer screenings, pregnancy testing and counseling, and screenings for other conditions. Medicaid is an essential source of financing for safety-net clinics and is widely considered to be the largest single public payer of family planning services. KFF research has found that specialty reproductive health care clinics such as Planned Parenthood centers offer a broader range of services to their patients compared to non-specialized clinics.

Medicaid Covers One in Five Reproductive Age Women Overall and More than Four in Ten Who Have Lower Incomes

Other states are likely to follow suit if the Court rules in South Carolina’s favor. In fact, several other states, such as Texas, Arkansas, Indiana, and Missouri have tried to keep Planned Parenthood clinics out of their Medicaid networks, and while some of these efforts were blocked by CMS and courts because they violate the free choice of provider requirements, there have been exceptions. Federal courts upheld Arkansas and Texas decisions excluding Planned Parenthood from their Medicaid programs. South Carolina filed a waiver application to CMS during the first Trump Administration to exclude Planned Parenthood clinics from their Medicaid program, and Tennessee also has a similar waiver pending. No action has been taken to date on these waivers.

Blocking Planned Parenthood from receiving Medicaid reimbursements or other public funds has been shown to reduce low-income women’s access to contraceptives. In 2013, Texas replaced its Medicaid family planning program with a 100% state funded program that excluded Planned Parenthood as a participating provider. Following the policy change, there was a sizable drop in Medicaid claims for long-acting contraceptives such as IUDs or implants, and injectable contraceptives and an increase in Medicaid-funded births.

What is next?

The federal Solicitor General was granted approval to participate in oral arguments and has taken the position of South Carolina in this case. The Supreme Court will hear oral arguments on April 2nd and is expected to issue a ruling by the end of the term in June 2025.

5 Key Facts About Medicaid Coverage for People with HIV

Published: Apr 1, 2025

Medicaid is the primary source of insurance coverage for people with HIV, playing a key role in financing HIV care and prevention efforts. Despite the importance of Medicaid for people with HIV, they represent a very small share of program enrollees overall (less than one-half of a percent). Most Medicaid enrollees with HIV qualify for the program through the Affordable Care Act (ACA)’s Medicaid expansion and disability-related pathways.

Policy proposals being considered by Congress to reduce federal spending for the Medicaid program could have negative implications for people with HIV and those at risk. It is unclear what specific policies might be implemented to achieve federal reductions and a range of options are being considered, but reductions in federal Medicaid funding would shift costs to states and could result in coverage losses, reduction in benefits, cost-shifting to HIV safety-net programs, and/or reductions in payment rates to providers, if states do not offset federal dollars. Policies imposing Medicaid work requirements, which could happen through the Congressional budget process or via waiver approvals, would impact people with HIV as well, likely leading to coverage losses. Coverage losses among people with HIV would likely increase demand on the nation’s HIV safety-net program, the Ryan White Program (which could also face cuts in Congress though the program’s funding has already not kept pace with inflation or growing need). Loss of Medicaid coverage could result in interruptions in HIV care and treatment, which could lead to increased morbidity and mortality as well as HIV transmission.

1. Medicaid is the primary source of insurance coverage for people with HIV.

Medicaid is the single largest source of coverage for adults with HIV in the U.S., with four in ten estimated to be covered by the program (40%). By comparison, only 15% of adults in the general population have Medicaid coverage (Figure 1). Medicaid has helped to provide HIV care since the HIV epidemic began in the early 1980s. Coverage and benefits have grown over time as people with HIV are living longer, new infections continue to occur, and due to the Medicaid program’s expansion under the Affordable Care Act (ACA). Higher rates of Medicaid coverage reflect the fact that people with HIV have lower-incomes (33% of adults with HIV have incomes below 100% FPL compared to 11% of adults overall). Additionally, a large share of people with HIV have a disability (42%) and one in four (25%) people with HIV on Medicaid are dually eligible for Medicare, compared to 14% of enrollees without HIV.

Medicaid is the primary source of insurance coverage for people with HIV

2. Medicaid is the primary payer for HIV care and treatment

While Medicaid spending on people with HIV is a small share of all Medicaid spending, it accounts for an estimated 45% of all federal spending on HIV care and is the largest source of public financing for HIV care in the U.S, followed by Medicare. Still, in FY 2022, CMS estimates federal Medicaid spending on HIV represented less than 2% of total federal Medicaid spending. In addition, states also contribute to Medicaid spending on HIV (Medicaid is jointly financed by state and federal governments). Medicaid spending on HIV has increased over time, reflecting growing numbers of enrollees with HIV and the rising costs of care and treatment. In this way, it differs from the Ryan White Program, which is dependent on Congressional appropriations and funding levels do not automatically adjust to meet the needs of a growing population and increasing medical costs.

Medicaid is the primary payer for HIV care and treatment

3. Medicaid expansion is the most common pathway to program eligibility for people with HIV.

Over four in ten (42%) Medicaid enrollees with HIV have coverage through the ACA’s Medicaid expansion, making it the primary pathway to Medicaid eligibility for this population. In Medicaid expansion states, over half (51%) of adults with HIV have coverage through the expansion. This pathway was created under the ACA to provide coverage to low-income adults on the basis of income without other categorical requirements like disability or pregnancy. Individuals with HIV who qualify through the expansion pathway may be able to access early treatment that could help stave off disability and significantly improve health outcomes. However, not all states offer the expansion pathway and today over one-third (35%) of people with HIV live in one of ten states that has not opted to expand Medicaid. Medicaid enrollees with HIV continue to enroll through the disability pathway at much higher rates than those without HIV (36% v 15%) and it remains the primary entry point to coverage for adults with HIV in non-expansion states, two-thirds (66%) of whom have disability- related coverage (compared to 30% in expansion states).

Medicaid Expansion is the Most Common Pathway to Program Eligibility for Adults with HIV

4. Medicaid enrollees with HIV are more likely to have substance use disorders, mental health conditions, and other chronic conditions relative to those without HIV.

Medicaid enrollees with HIV experience comorbidities at higher rates than those without HIV, including those related to mental health and substance use disorders. Nearly three-quarters (73%) of Medicaid enrollees with HIV have one of 34 other chronic conditions, compared to 42% of enrollees without HIV (see Figure 4 notes for details). Enrollees with HIV are more than twice as likely to be medically complex than enrollees without HIV, with about one-third (32%) having three or more chronic conditions in addition to HIV, compared to 13% of enrollees without HIV (data not shown). Adult enrollees with HIV are also twice as likely to have either a substance use disorder or mental health condition diagnosis (44% v 23%) compared to those without HIV. Enrollees with HIV are nearly ten times more likely than enrollees without HIV to have a hepatitis diagnosis. However, likely reflecting curative treatments now available, that share has declined from 14% of enrollees in 2013 to 6% in 2021 (data not shown). These differences between enrollees with HIV and without HIV likely reflect a range of both medical and social factors that combine to increase the risk and prevalence of these co-occurring conditions.

Adult Medicaid Enrollees with HIV are More Likely Than Those Without HIV to Have Substance Use Disorder, a Mental Health Condition, and Other Chronic Conditions

5. Spending for Medicaid enrollees with HIV is nearly three times higher than spending for those without HIV.

Spending on people with HIV enrolled in Medicaid is substantially higher than on those without HIV, reflecting higher health needs and costs of care. Average Medicaid spending per adult enrollee with HIV was about $24,000 in 2021, nearly three times that of adult Medicaid enrollees without HIV (about $9,000 per enrollee). While spending on enrollees with HIV was higher across all spending categories, the difference was especially marked in the drug/treatment category reflecting the relatively high cost of HIV medications (though notably, the drug spending data reflects pre-rebate amounts). Still, because people with HIV represent less than one-half of a percent of Medicaid enrollees overall, the net impact on Medicaid spending is small (less than 2%, see point 2 above).

Spending for Adult Medicaid Enrollees with HIV is Over Three Times Higher Than Spending for Those Without HIV

Methods

Medicaid Claims Data: Figures 3-5 in this analysis use the 2021 T-MSIS Research Identifiable Demographic-Eligibility and Claims Files (T-MSIS data) to identify Medicaid enrollees with HIV.

Identifying HIV in Medicaid Claims Data: Enrollees with HIV were flagged if they had a relevant ICD 9 or ICD 10 code, any drug claims for a single tablet regiment (STR), or two or more other non-STR ARVs. A list of diagnosis and drug codes that were used for this analysis are available upon request.

Enrollee Inclusion Criteria: Enrollees were included if they were ages 18 or older and had at least one month of Medicaid coverage. Figure 4, which identifies rates of chronic conditions among those with and without HIV, also excludes those who had at least one month of Medicare coverage. These enrollees were excluded from these calculations since they may not have had sufficient claims in T-MSIS to identify chronic conditions.

State Inclusion Criteria in Medicaid Claims Data: To assess the usability of states’ data, the analysis examined quality assessments from the DQ Atlas for service users in the “Other Services” and Drug files for 2021. 49 states and D.C. were included in this analysis. Mississippi was excluded since it received an “Unusable” rating on these measures.

Defining Chronic Conditions (Figure 4): This analysis used the CCW algorithm for identifying chronic conditions (updated in 2020), excluding its definition for mental illness, which was pulled from a different source. This analysis also included in its definition of chronic conditions substance use disorder, mental illness, obesity, hepatitis C, and intellectual and developmental disabilities (ASPE definition).

Calculating Spending (Figure 5): Average annual per capita spending calculations include fee-for-service spending, payments to managed care plans, and payments to Medicare. Spending was calculated by summing the total spending of all claims per enrollee in the T-MSIS claims files and manually adds Medicare premiums for those who are also enrolled in Medicare. Estimates here do not include prescription drug rebates and most supplemental payments to providers.

Medicare Program Integrity and Efforts to Root Out Improper Payments, Fraud, Waste and Abuse

Published: Mar 31, 2025

Medicare, the federal health insurance program for people ages 65 and older and people under 65 with long-term disabilities, covers 68 million people and represents 15% of all federal spending – nearly $1 trillion dollars in 2024. The Medicare program has more than 1.4 million providers and more than 20 different payment systems. Due to the complexity and size of the program, Medicare faces risk of improper payments and some vulnerability to fraud, waste, and abuse, though many actions have been taken over the years to reduce improper payments in the program and to root out fraud.

President Trump has established a government cost-cutting initiative known as the “Department of Government Efficiency” or DOGE, which has set about to dramatically overhaul the size and scope of federal government spending. The leader of DOGE, Elon Musk, recently claimed that “big money fraud” is happening at the Centers for Medicare & Medicaid Services (CMS) and that “the waste and fraud in entitlement spending, which is most of the federal spending, is entitlements, so that’s the big one to eliminate.”

Strengthening program integrity and tackling fraud, waste, and abuse in Medicare, as well as in other government programs, has been a priority across prior administrations. During President Obama’s administration, President Trump’s first term and during President Biden’s administration, the Department of Health and Human Services (HHS) budgets included proposals to improve program integrity, including for Medicare and Medicaid, reduce improper payments for these and other programs, and provide additional funding to combat fraud, waste, and abuse.

CMS, primarily through the Center for Program Integrity (CPI), plays a key role in efforts to promote program integrity in Medicare. In addition, the HHS Office of Inspector General (HHS OIG), often in collaboration with the Department of Justice (DOJ) and other agencies, monitors and combats fraud, waste, and abuse to improve the efficiency of Medicare by conducting audits, evaluations, and investigations, and carrying out enforcement actions, which in some instances have resulted in criminal or civil penalties. Despite the HHS Inspector General playing a key role in providing oversight of program integrity efforts for Medicare and other HHS programs, President Trump fired the HHS Inspector General and several other Inspectors General just days after taking office for his second term.

This brief explains fraud, waste, abuse, and improper payments in Medicare and describes actions to ensure Medicare program integrity.

Fraud, waste, abuse, and improper payments are often used interchangeably but have distinct meanings in the context of Medicare.

Improper payments. Improper payments are defined in law as “any payment that should not have been made or that was made in an incorrect amount, including an overpayment or underpayment, under a statutory, contractual, administrative, or other legally applicable requirement; and includes: any payment to an ineligible recipient; any payment for an ineligible good or service; any duplicate payment; any payment for a good or service not received, except for those payments where authorized by law; and any payment that does not account for credit for applicable discounts.”

Improper payments in the Medicare program, both overpayments and underpayments, can result from fraud, waste, and abuse as well as errors. For example, improper payments can be due to documentation mistakes or omissions, such as missing signatures, which may occur with otherwise appropriate claims and payments.

Improper payments often get conflated with fraud, and while they may be related, they are not the same. As the Government Accountability Office (GAO) explains on the relationship between fraud and improper payments, all fraudulent payments are considered improper, but not all improper payments are the result of fraud. Therefore, estimates of improper payments should not be considered estimates of fraud.

Fraud. According to CMS, Medicare fraud occurs when a provider knowingly submits false information to the federal government to receive Medicare payments. Medicare fraud can include knowingly billing for a higher level of complexity of services than the level that was actually provided, knowingly billing for services not provided, including falsifying records of providing such services, and knowingly ordering medically unnecessary items or services. Committing Medicare fraud is illegal and may lead to imprisonment, fines, and penalties. There are no estimates of how much Medicare specifically loses to fraud.

One recent example of Medicare fraud involved a $17 million Medicare hospice fraud committed against the federal government, in which an individual plead guilty to health care fraud, aggravated identity theft, and money laundering. In this case, the individual engaged in a scheme to operate a series of sham hospice companies and submitted fraudulent claims to Medicare for services that were not medically necessary and not provided, including for people who were not terminally ill and those who never received care from those sham hospices. Another example is a provider who was found guilty of health care fraud and other charges, who submitted over $24 million in fraudulent claims to Medicare, involving kickbacks and bribes for authorizing medically unnecessary cancer genetic lab tests, lengthy office visits that were never provided to patients, and medically unnecessary orthotic braces.

Abuse. According to CMS, abuse occurs when providers or suppliers perform actions that directly or indirectly result in unnecessary costs to the Medicare program. Abuse includes any practice that does not meet professionally recognized standards. Examples of abuse are billing for unnecessary medical services, charging excessively for services or supplies, or upcoding claims, which is when a provider uses an inaccurate billing code for a medical procedure that increases reimbursement. As CMS explains, “the difference between “fraud” and “abuse” depends on specific facts, circumstances, intent, and knowledge,” but fraudulent activity can be characterized by its intentional nature leading to some “unauthorized benefit.” Ultimately, CMS notes that providers who engage in abusive billing practices, like upcoding, or fraudulent activity, like charging for services that were not delivered, can be subject to civil and criminal penalties.

Waste. CMS defines waste as the overuse or misuse of resources that directly or indirectly result in unnecessary costs to the Medicare program. Examples of waste include conducting excessive office visits, prescribing more medications than necessary, and ordering excessive or duplicative laboratory tests. As one recent example, Medicare spending on expensive “skin substitute” products used for wound care increased from $1.6 billion in 2022 to over $10 billion in 2024, although according to research conducted for CMS, the efficacy of many of these products has not been studied. While the distinction between waste and abuse is not always clear, both result in unnecessary costs to the Medicare program.

CMS’s formal definition of waste differs from other views of waste, which may include value judgements of how the government should or should not be spending taxpayer money. As one example of this, MedPAC, an independent agency that advises Congress about Medicare payment, estimates the federal government pays insurers 20% more for Medicare Advantage enrollees than it pays for similar people in traditional Medicare, which amounts to $84 billion in additional annual spending in 2025 alone. Some might argue that this extra spending is wasteful while others might argue it adds value to the Medicare program by providing extra benefits to Medicare Advantage enrollees.

The vast majority of Medicare payments are made properly, although improper payments are an ongoing concern.

The vast majority of payments under traditional Medicare, Medicare Advantage, and Part D are made properly (Figure 1). CMS identifies, reports, and estimates improper payments for Medicare as well as other government programs, as required by the Payment Integrity Information Act of 2019 (PIIA) and as part of its integrity programs for Medicare. The improper payment rate was first measured in traditional Medicare starting in 1996 and for Medicare Advantage starting in 2008.

In 2024, the Majority of Payments in Medicare Were Made Properly

The Trump administration recently cited an estimate of $140 billion in improper payments made by CMS in 2024, but based on the amounts derived from each part of Medicare (as described below), improper payments for the Medicare program totaled substantially less – $54.3 billion in 2024, according to GAO. Even across all CMS programs – Medicare, Medicaid, CHIP, and the Affordable Care Act Health Insurance Exchange Advance Payments of the Premium Tax Credit (APTC) programs, the total amount of improper payments is less than the total cited by the administration – totaling $87.1 billion in 2024, according to CMS. Government-wide, 16 federal agencies across 68 programs, reported improper payments of $162 billion in 2024, a decrease of $74 billion from 2023, according to GAO. Again, estimates of improper payments described here are not the same as estimates of fraud.

CMS relies on three approaches to measure improper payments for traditional Medicare, Medicare Advantage, and Medicare Part D using different statistical methods for each:

  • The Comprehensive Error Rate Testing (CERT) program measures the improper payment rate in traditional Medicare. To determine if claims were paid properly, the CERT program reviews a random sample of traditional Medicare claims – approximately 37,500 claims in 2024.
    • In 2024, traditional Medicare paid an estimated 92.34% of claims properly, representing $382.02 billion in proper federal payments. The traditional Medicare improper payment rate was 7.66% (or $31.70 billion in federal payments) in 2024.
  • The Medicare Part C Improper Payment Measurement (Part C IPM) measures the improper payment rate in Medicare Advantage. The program verifies that diagnosis codes submitted for payment by a Medicare Advantage organization are supported by medical record documentation based on a random sample of about 1,000 beneficiaries.
    • In 2024, Medicare Advantage paid an estimated 94.39% of claims properly, representing $320.87 billion in proper federal payments. The Medicare Advantage improper payment rate was 5.61% (or $19.07 billion in federal payments) in 2024. (These estimates of improper payments in Medicare Advantage do not include estimates of higher spending in Medicare Advantage compared to traditional Medicare for similar beneficiaries as discussed above, which are often referred to as “overpayments”).
  • The Medicare Part D Improper Payment Measurement (Part D IPM) measures error in payments due to inaccurate prescription drug event (PDE) records. The data is based on a randomly selected five percent sample of the Part D beneficiary population.
    • In 2024, Medicare Part D paid an estimated 96.30% of claims properly, representing $92.95 billion in proper federal payments. The Medicare Part D improper payment rate was 3.70% (or $3.58 billion in federal payments) in 2024.

The rate of improper payments for traditional Medicare has decreased over time from 12.7% in FY2014 to 7.66% in FY2024. (Similar trends are not included for Medicare Advantage and Part D due to methodological changes in the calculation of the estimates over time.) While improper payment rates for traditional Medicare have generally declined, the overall amount of improper payments have increased as Medicare spending has increased over this period. Improper payments both negatively impact beneficiaries and reduce the solvency of the Medicare Hospital Insurance (Part A) Trust Fund, which is projected to be depleted in 2036.

The primary reason for improper payments differs for traditional Medicare, Medicare Part D and Medicare Advantage.

In traditional Medicare, insufficient or no documentation was the most common reason for improper payments, accounting for 68% of improper payments, similar to Medicare Part D (73%), while for Medicare Advantage, medical record discrepancies accounted for 85% of all improper payments (Figure 2).

The Most Common Reason for Improper Payments Differs for Traditional Medicare, Medicare Part D, and Medicare Advantage

In 2024, the most common reason for improper payments in traditional Medicare was insufficient or no documentation (68%), followed by claims being medically unnecessary (16%), incorrect coding (10%),  and other reasons (6%). Similarly, for Medicare Part D, insufficient or no documentation (73%) was the main reason for improper payments, followed by administrative or process errors (15%) and drug or drug pricing discrepancies (12%). The primary reason for Medicare Advantage improper payments is medical record discrepancies, accounting for 85% of all improper payments, followed by administrative or process errors (10%) and insufficient documentation (6%). According to CMS, improper payments due to medical record discrepancies result when medical record documentation submitted by a Medicare Advantage plan does not support payments received by the plan.

The differences in the main drivers of improper payments in traditional Medicare, Medicare Part D and Medicare Advantage reflect in part how improper payments are calculated – for traditional Medicare, CERT evaluates claims submitted by providers, and for Part D, the Part D IPM evaluates errors in payments for prescription drug claims, while for Medicare Advantage, the Part C IPM evaluates whether submitted diagnoses codes for which Medicare Advantage plans received payment are supported by enrollees’ medical records. Improper payments can result in either overpayments (monetary loss) or underpayments (non-monetary loss).

CMS is responsible for many program integrity activities, including conducting audits to identify and recover Medicare improper payments.

The CMS Center for Program Integrity (CPI) primarily implements the Medicare Integrity Program, which is responsible for helping to protect Medicare against fraud, waste, and abuse for various parts of the Medicare program. Program integrity activities within CMS resulted in estimated Medicare savings of $14.9 billion in FY 2023 and produced a substantial return on investment (ROI) – for every $1 spent on program integrity efforts, Medicare saved $8.30.

Among the many program integrity activities conducted by CMS to root out fraud, waste, abuse, and address improper payments in traditional Medicare and Medicare Advantage, audits are an important tool, including the Medicare Fee for Service Recovery Audit Program and the Medicare Advantage Risk Adjustment Data Validation audits.

  • The Medicare Fee for Service Recovery Audit Program. The Medicare Fee for Service (FFS) Recovery Audit Program’s mission is to identify and correct Medicare improper payments made on claims of health care services provided to traditional Medicare beneficiaries and recover those improper payments. In FY 2023, Recovery Audit Contractors (RACs) identified $353 million in overpayments and recovered $273 million. Recovery audits are distinct from CERT audits in that they seek to both identify and recover improper payments, while the CERT audits provide a national estimate of improper payments in traditional Medicare.
  • Medicare Advantage Risk Adjustment Data Validation (RADV) audits. Medicare Advantage RADV audits have similar objectives to the Medicare Fee for Service Recovery Audit Program and are the primary way CMS identifies and collects improper payments in Medicare Advantage. As part of RADV audits, CMS confirms that diagnoses submitted by Medicare Advantage organizations for risk adjustment are supported by enrollees’ medical records. Medicare Advantage organizations are held financially accountable when data submitted for risk adjustment purposes do not align with program rules. If Medicare Advantage organizations do not agree with the audit results, they may appeal these medical record review determinations. RADV audits, conducted by the CPI, seek to both identify and recover improper payments from Medicare Advantage plans, while Part C IPM audits provide a national estimate of improper payments in Medicare Advantage.

In 2023, the Biden Administration finalized a rule, which was proposed in 2018 during the first Trump administration, to make adjustments to the RADV program. One of the major elements of the finalized rule was the decision to extrapolate payments, which is a technique widely used in traditional Medicare and other audits, to estimate values, such as overpayments, based on a statistically random sample that would apply to the entire Medicare Advantage contract. The final rule extrapolates contract-level findings for audits starting in payment year 2018. In September 2023, Humana sued the government over its methodology and a federal judge denied dismissal of the case in June 2024, but the final outcome of the case is still pending.

The HHS OIG, DOJ, and other agencies play a major role in combatting Medicare fraud, waste, abuse and improper payments.

The HHS OIG, established through legislation in 1976, has played a major role in monitoring and combating fraud, waste and abuse to improve the efficiency of Medicare and other HHS programs, with the majority of its resources going to oversight of Medicare and Medicaid. The HHS OIG has a variety of responsibilities including conducting and supervising audits, investigations, and evaluations relating to HHS programs; identifying systemic weaknesses that give rise to opportunities for fraud and abuse and making recommendations to prevent them from reoccurring; leading and coordinating activities to prevent and detect fraud and abuse; and imposing administrative sanctions against providers of health care under Medicare and Medicaid who commit certain prohibited acts. The HHS OIG also operates a fraud hotline where it accepts tips and complaints related to potential fraud, waste, and abuse in HHS programs.

As the number of beneficiaries enrolled in Medicare Advantage has increased, the HHS OIG has focused more of its efforts on addressing the risks of fraud, waste, and abuse in Medicare Advantage and has developed a strategic plan for its oversight. One of its main priorities is ensuring that payments to Medicare Advantage plans are accurate. Similar to the RADV audits mentioned above that are conducted by CMS, the HHS OIG regularly audits Medicare Advantage organizations to review the accuracy of diagnosis codes since some diagnoses are at higher risk of being miscoded, resulting in overpayments to these organizations. For example, two of OIG’s recent audits released in December 2024, found that Medicare Advantage plans had submitted diagnosis codes that did not comply with federal requirements, resulting in millions of dollars in estimated overpayments, though both plans disputed OIG’s findings and recommendations. HHS OIG audits do not represent final determinations and CMS officials ultimately determine whether the agency will seek to recoup overpayments in these instances.

The HHS OIG has also examined the use of health risk assessments (HRAs) and chart reviews in Medicare Advantage, producing multiple reports on how these activities can increase risk scores and drive billions of dollars in additional payments to Medicare Advantage plans. As mentioned above, MedPAC estimates the federal government pays more for Medicare Advantage enrollees than it pays for similar people in traditional Medicare, at a cost of $84 billion in 2025 – $40 billion of which can be attributed to coding differences that increase payments to Medicare Advantage plans.

The HHS OIG often collaborates with the DOJ to fulfill its duties. OIG works with DOJ, under the joint direction of the Attorney General and the Secretary of Health and Human Services (HHS), to operate the Health Care Fraud and Abuse Control (HCFAC) Program, which was established in 1996 as part of the Health Insurance Portability and Accountability Act of 1996 (HIPAA) by the Clinton administration. The Program is tasked with coordinating federal, state, and local law enforcement efforts relating to health care fraud for Medicare, Medicaid, and other health care programs, conducting investigations and audits relating to the delivery of and payment for health care, and enforcing remedies for fraud.

The DOJ and U.S. Attorneys carry out enforcement actions against those suspected of engaging in Medicare fraud, including bringing criminal and civil cases to stop ongoing fraud, deter future fraud, and recover funds wrongfully taken through fraud and false claims. In FY 2023, 476 defendants were convicted of health care fraud-related crimes, which includes but is not limited to Medicare. In its annual report on the Health Care Fraud and Abuse Control Program, the OIG highlighted significant criminal and civil investigations for Medicare and other federal health care programs including in the areas of ambulances, diagnostic testing, durable medical equipment, home health providers, hospice, and medical devices, among others.

The DOJ has also been involved in civil cases regarding Medicare Advantage insurers, often in relation to allegations of false diagnosis codes submitted to inflate Medicare payments to plans through the risk adjustment system. For example, the Justice Department is litigating actions against UnitedHealth Group, Elevance Health, and KaiserPermanente regarding the accuracy of their diagnosis data used for risk adjustment. In September 2023, Cigna paid $172 million dollars to the federal government in order to resolve False Claims Act allegations that it provided inaccurate data on patients’ diagnoses to inflate payments, though there was no determination of liability.

During FY 2023, efforts by the Health Care Fraud and Abuse Control Program for Medicare, Medicaid, and other government programs resulted in recoveries of $3.4 billion, of which the Medicare Trust Funds received close to $1 billion. The ROI for the HCFAC program from 2021 to 2023 is $2.80 returned for every $1.00 expended toward addressing fraud and abuse.

The GAO, which examines how taxpayer dollars are spent and provides Congress and federal agencies with information to help the government save money and work more efficiently, has undertaken a series of studies looking at these issues in the Medicare and Medicaid programs. A recent report from GAO found that while CMS has implemented numerous GAO recommendations to reduce improper payments in Medicare (as well as Medicaid), there are additional opportunities to improve program integrity in these programs and save billions of dollars. GAO also annually publishes a high-risk series that identifies government operations vulnerable to fraud, waste, and abuse, and Medicare has been on this list since 1990 due to the size and complexity of the program. In addition, in 2015, GAO established a framework to manage fraud frisk in federal programs, which CMS uses for implementing its Medicare integrity programs.

This work was supported in part by Arnold Ventures. KFF maintains full editorial control over all of its policy analysis, polling, and journalism activities.

Navigating the Maze: A Look at Patient Cost-Sharing Complexities and Consumer Protections

Authors: Rayna Wallace, Meghan Salaga, Michelle Long, and Kaye Pestaina
Published: Mar 28, 2025

From understanding health insurance terminology like “deductibles” and “copays” to deciphering the contents of a bill, consumers can face various barriers when trying to understand the costs associated with their health insurance coverage. This lack of understanding may contribute to frustration and cost-related problems and can have far-reaching effects on consumer health and finances. The KFF 2023 Survey of Consumer Experiences with Health Insurance (“KFF Consumer Survey”) found that 27% of insured adults reported that their health insurance paid less than they expected for a bill they received from a doctor, hospital, or lab in the past twelve months, the biggest cost-related problem consumers reported experiencing. Efforts to make cost information more readily available and easy to understand could help reduce some of these problems.

The first brief of this two-part series on navigating health insurance complexities and consumer protections focused on how consumers understand what their health insurance covers, what they do when coverage is denied, and what federal protections exist to ensure that the information available to them and coverage determinations are fair, accurate, and timely. This second brief focuses on KFF Consumer Survey findings about consumers’ understanding of health insurance costs and examines existing federal protections that seek to address barriers to understanding the cost of coverage and care, such as price transparency, self-service price estimator tools, and simplifying cost-sharing designs.

KFF Consumer Survey Findings: Consumer Understanding of Costs Associated With Health Coverage

The KFF Consumer Survey included a nationally representative sample of 3,605 U.S. adults ages 18 and older with health insurance. The survey asked consumers how well they understand costs associated with their health coverage, cost-related health insurance terminology, and the difficulty level of comparing cost-related insurance options such as premiums and deductibles.

Three out of ten adults (30%) said that it was somewhat or very difficult to understand how much they would have to pay out-of-pocket when they use their health insurance. Marketplace (41%) and ESI (34%) enrollees were more likely to report this difficulty compared to Medicaid (16%) and Medicare (20%) enrollees (Figure 1). Insured White (30%) and Hispanic (32%) adults were more likely to report that it was somewhat or very difficult to understand how much they will have to pay out of pocket when they use health insurance compared to Black adults (23%). Additionally, insured adults ages 18-29 (35%), 30-49 (35%) and 50-64 (30%) were all more likely to report that it was somewhat or very difficult to know how much they will have to pay out of pocket when they use health insurance compared to those ages 65 and older (18%).

One-quarter (25%) of insured adults said that it was somewhat or very difficult to understand specific terms that their health insurance uses such as “deductible,” “copay,” “coinsurance,” “prior authorization,” or “allowed amount.” Those with Marketplace coverage (32%) and ESI (27%) were more likely to report that it was somewhat or very difficult to understand these terms compared to those with Medicaid (22%) and Medicare (19%) (Figure 1). Furthermore, Hispanic adults (31%) were also more likely to report difficulty in understanding these terms compared to White (23%) or Black (22%) adults. Insured adults between the ages of 18-29 (29%), 30-49 (30%), and 50-64 (25%) were all more likely to report difficulty in understanding these insurance terms compared to those ages 65 and older (17%).

Many Consumers With Private Insurance Reported Difficulty Understanding What They Have To Pay Out Of Pocket And Specific Insurance Terms

One in four (25%) insured adults reported that it was somewhat or very difficult to compare the copays and deductibles for each plan option. Those with ESI (27%) and Marketplace (31%) coverage were more likely to report having this problem compared to those with Medicaid (13%) or Medicare (22%) (Figure 2). A larger share of insured White (24%) and Hispanic (27%) adults reported difficulty comparing the copays and deductibles for each option than Black (19%) adults. Additionally, insured adults ages 18-29 (28%) and those ages 30-49 (27%) were more likely to report that it was somewhat or very difficult to compare the copays and deductibles for each option compared to those ages 65 and older (21%).

About one in five (19%) insured adults reported that it was somewhat or very difficult to compare the monthly premiums for each coverage option. Those with Marketplace coverage (25%) were more likely to report having this issue compared to those with ESI (19%), Medicaid (12%), or Medicare (17%) (Figure 2). Insured Hispanic adults (22%) were more likely to report difficulty comparing the plan premiums than White (17%) adults. Insured adults ages 18-29 (24%), 30-49 (20%), and 50-64 (19%) were all more likely to report that it was somewhat or very difficult to compare the monthly premium for each option compared to those ages 65 and older (13%).

Three in Ten Adults With Marketplace Coverage Reported Difficulty Comparing Copays And Deductibles For Different Insurance Options

Federal Consumer Protections that Seek to Address Barriers to Understanding the Cost of Coverage and Care

The KFF Consumer Survey indicates that many consumers have gaps in understanding what they will have to pay for the services they need before they receive care. Federal reforms related to health insurance costs aim to simplify and standardize cost sharing, set guidelines for the coverage of certain health benefits, and promote price transparency. Some of these changes may enable consumers with private coverage to better understand their coverage options and out-of-pocket obligations for covered benefits. This section focuses primarily on federal protections for individuals with private health insurance (individual and employer-sponsored), though public programs like Medicare and Medicaid have established many consumer protections as well.

Key Federal Consumer Protections for Understanding the Cost of Coverage and Care

Providing Consumers with Cost Specific Information: Price Transparency

Federal reforms to private insurance aim to increase price transparency and promote competition among hospitals and among insurers, reduce health care costs, encourage patients to price-shop at different facilities by providing an estimate of patient out-of-pocket costs for a health care service or prescription drug, and help consumers make better plan selections. Reforms would allow consumers to look for price information about a service in at least three ways:

Search listed pricing information available on hospital and plan websites: Most hospitals in the U.S. are required to establish, update annually, and make public on the internet a comprehensive machine-readable file containing a list of their “standard charges” for all items and services that they provide. Standard charges are the regular rates established by hospitals for items and services. Standard charges alone are generally of less value to insured consumers when determining their out-of-pocket costs than the “allowed amount,” which is the maximum amount a specific health plan will pay for a covered benefit. This hospital price transparency requirement was included in the Affordable Care Act (ACA), with more extensive federal regulations (incorporating additional forms of pricing, including allowed amounts) issued in 2019 and effective in 2021. Separate federal price transparency standards require employer-sponsored plans and insurers to post on a publicly accessible internet site three machine-readable files disclosing different forms of pricing information specific to each plan: in-network provider-negotiated rates, historical out-of-network allowed amounts (the maximum amount a plan will pay for a covered health service received from an out-of-network provider), and prescription drug rates. Health plans and insurers must update these machine-readable files at least monthly and clearly state when it was last updated. This “Transparency in Coverage” requirement was created by 2020 regulations interpreting a provision in the ACA related to consumer transparency. These postings have been required since 2022, although full implementation of the prescription drug reporting was delayed.

The information posted to date under these two requirements is anything but consumer-friendly, as experts have noted their own problems evaluating the data. Data scientists and other researchers have reported finding this information overwhelming and sometimes inaccurate and difficult to decipher. As third-party entities aggregate this data to assist employer plans to make purchasing decisions and public policy researchers to evaluate costs, consumers themselves likely have limited ability to use the raw data on their own. There are few studies of the consumer experience with this machine-readable data, especially whether they know it is available, and their ability to understand and use it.

Use a self-service or price estimator tool: In an effort to alleviate the complexity and possible confusion that was perhaps anticipated by policymakers when requiring the posting of large amounts of data in digital files, federal rules also require that more “consumer-friendly” tools be available so that consumers can obtain information about out-of-pocket costs before they get a service or drug. Under the hospital transparency regulation, hospitals must also compile and display online a “consumer-friendly” list of at least 300 “shoppable” services (e.g., having a baby, getting a hip replacement), including 70 services specified by the Centers for Medicare & Medicaid Services (CMS) and any additional procedures chosen by the hospital. The list must include a plain language description of each procedure, discounted cash prices, payer-specific (i.e., private insurers, Medicare, Medicaid) negotiated prices, and de-identified minimum and maximum negotiated prices for all third-party payers for an item or service. As an alternative to this “consumer-friendly” list, a hospital can instead create and maintain an online price estimator tool that:

  • Provides estimates for at least 300 shoppable services (including the 70 CMS-required services).
  • Is displayed on the hospital website for easy access (i.e., does not require payment or the creation of an account to use the estimator tool); and
  • Allows consumers to obtain an estimate of the amount they will be expected to pay the hospital for the shoppable service before they receive it.

The Transparency in Coverage regulation requires plans and insurers to provide cost-sharing information via an internet self-service tool that consumers can use to obtain personalized out-of-pocket estimates for in- and out-of-network health care items and services (including prescription drugs and medical equipment). Plans and insurers must make other information—such as the negotiated rate for a service, and whether the service is subject to prior authorization—available through a billing code or service description search. This rule was fully effective in 2024.

In addition, in 2020 Congress passed and President Trump signed the Consolidated Appropriations Act (CAA), which required plans and insurers to make a “price comparison tool” available on the internet, in paper form, and by telephone. Since this tool is similar to the Transparency in Coverage self-service tool, federal agencies state in guidance that they have deferred enforcement of this CAA price comparison tool requirement.

Review an Explanation of Benefits before care is received (Advanced Explanation of Benefits (AEOB)): In addition to the transparency initiatives above, Congress also included in the CAA another transparency-related protection—the Advanced Explanation of Benefits—to help consumers better understand their expected out-of-pocket cost for a service before they receive it so they can budget and/or compare cost to other providers. This was part of the No Surprises Act, a group of consumer protections included as part of the CAA.

When scheduling care or upon request health care providers and facilities must provide a personalized good faith estimate of the provider’s expected charges to the consumer’s employer plan or insurer. The plan or insurer must then use this information to create an Advanced Explanation of Benefits for the consumer that includes standard Explanation of Benefits information such as the provider’s expected charge, what the plan expects to pay, and the amount the consumer is expected to pay.

Implementation of this provision of the law has been challenging, according to CMS, as it will require coordination between providers and plans, and likely the development and testing of a single industry-wide electronic interchange standard. The agencies involved had convened an industry working group as well as consumer testing with prototype Advanced Explanation of Benefits. The rule’s 2022 effective date has been delayed.

Although the Advanced Explanation of Benefits has not yet been implemented, providers and facilities must provide a good faith estimate to uninsured and self-pay patients upon request or in advance of a scheduled service, within a specified timeframe. If the final bill is $400 or more above the good faith estimate, consumers may be able to dispute the bill through a patient-provider dispute resolution process. Eligible consumers may submit a complaint to CMS if the provider did not give the patient a good faith estimate or if the provider does not honor a dispute resolution in the patient’s favor.

Simplifying Cost Sharing and Other Consumer Out-of-Pocket Payments to Limit Cost and Address Complexity

The ACA ushered in new federal requirements to limit out-of-pocket spending for consumers with private insurance, with protections that set parameters for the design of certain health plan options and limited cost sharing so that it is the same whether the consumer has employer coverage or other private coverage on- or off- Marketplace. Marketplace plans have gone further through standardized plan options. The No Surprises Act’s reforms address balanced billing, eliminating it for certain services. All look to make costs more understandable and predictable for patients. These protections include:

Maximum out-of-pocket limit: All non-grandfathered private plans are required to set an annual cap on cost sharing for essential health benefits received in-network. These dollar limits are adjusted each year. For the 2025 plan year, the maximum out-of-pocket limit is $9,200 for self-only coverage and $18,400 for family coverage. Once a consumer reaches the maximum out-of-pocket limit, the insurer is required to cover 100% of the cost of essential health benefit services received in-network for the remainder of the plan year.

Ban on annual and lifetime dollar limits: All private plans, including grandfathered plans, are prohibited from imposing annual or lifetime dollar limits on coverage for essential health benefits, whether for in-network or out-of-network services. An annual dollar limit refers to the maximum amount an insurer would pay for covered benefits within a given year, whereas a lifetime dollar limit is the total dollar amount that a health plan would pay for as long as a consumer was enrolled in the plan. Prior to the passage of the ACA, an estimated 70 million people in large employer plans, 25 million in small employer plans, and 10 million with individual coverage had lifetime limits on their health coverage.

Zero-dollar cost sharing for certainpreventive services: Under the ACA, all private, non-grandfathered plans must cover a range of preventive services and not apply cost sharing, including:

  • Evidence-based screenings and counseling for adults recommended by the U.S. Preventive Services Task Force (USPSTF) with an “A” or “B” rating such as cancer screenings, prenatal care, and medications that help prevent heart disease
  • Routine immunizations for adults and children recommended by the Centers for Disease Control and Prevention’s Advisory Committee on Immunization Practices such as influenza, measles, and COVID-19
  • Preventive care for infants, children, and adolescents recommended by Health Resources and Services Administration’s (HRSA) Bright Futures Program such as well-child visits, autism screening, and fluoride supplements
  • Additional preventive services for women as recommended by HRSA’s Women’s Preventive Services Initiative such as contraception, breast cancer screening, and breastfeeding supplies and support

Marketplace standardized plan options: Plans in the Marketplace are separated into categories — Bronze, Silver, Gold, or Platinum — based on the amount of cost sharing they require. In general, plans with lower cost sharing have higher premiums, and vice versa. For example, Bronze plans have the highest cost sharing but lower premiums, and Platinum plans have the lowest cost sharing but higher premiums. There can be substantial variation in plan details, even within the same insurer (e.g., premiums, provider networks, covered benefits, plan network types).

Standardized plan designs (also known as “easy pricing”) were created to simplify and streamline plan comparison and selection offered on the federally facilitated Marketplace (FFM), state-based exchanges using the federal platform (SBE-FPs), and some state-based Marketplaces (SBMs) by applying the same deductibles, copays, coinsurance, and out-of-pocket maximums to each category of essential health benefits across all Easy Price plans in the same metal level. For example, in 2025, the annual deductible for covered services under all Gold level Easy Price plans is $1,500, regardless of insurer. By contrast, other non-standardized Gold level plans might have different deductible and copay amounts.

Standardized plan design options were also designed to improve affordability by covering certain services before the deductible is met. All Easy Price plans must waive the deductible and instead apply a fixed dollar copay (e.g., $30 for a Gold Easy Price plan) for the following items and services: primary care and specialist office visits, urgent care visits, outpatient visits for mental health and substance use disorder treatment, physical therapy visits, and generic and preferred-brand drugs.

Not all Marketplace plans are standardized, though Marketplace plans must offer a standardized plan option at every product network type, metal level, and throughout each service area where they offer non-standardized plan options. Insurers can still choose to offer non-standardized plan options in the individual market but are limited to two plan options per product network type (i.e., HMO, PPO, EPO, POS) for plan year 2025.

Research has shown that having too many choices can confuse consumers and lead to them choosing suboptimal coverage. As implemented to date, HealthCare.gov’s requirement to offer standardized plan options may have increased, not decreased, the number of plan choices consumers face. Though consumers in most areas will continue to have a large number of plan choices for the foreseeable future, over time, that number may become more manageable.

Prohibition on balance billing for certain out-of-network care: Also known assurprise medical bills,” balance billing can occur in medical emergencies, when insured patients are not necessarily able to choose an in-network hospital or provider as well as in non-emergencies when patients inadvertently receive care from an out-of-network provider at an in-network facility. In these cases, patients can be liable for the balance bill from the provider plus any cost sharing under their health plan. As of 2022, many of these types of balance bills are now prohibited under the No Surprises Act. The No Surprises Act generally protects patients with individual and employer-sponsored insurance by:

  • Requiring private health plans to cover these out-of-network claims and apply in-network cost sharing for certain covered benefits.
  • Prohibiting out-of-network providers, facilities, and providers of air ambulance services from billing patients more than in-network cost sharing for certain out-of-network care.
  • Requiring providers and facilities to provide patients with written notice explaining surprise billing protections, who to contact for concerns about potential violations, and how they can waive billing protections if they choose to do so.

Looking Forward

Consumer understanding of their coverage costs can play a significant role in seeking needed health care. One study found that lower health literacy scores were associated with consumers delaying or forgoing preventive care due to perceived health care costs. While better consumer education and outreach can help, the inherently complicated and profit-driven insurance and health care system includes few incentives to provide consumers with individualized and impartial assistance. However, several existing consumer protections, if implemented and enforced, as well as a broader health policy focus on how to improve the consumer experience, could make a difference.

Focus on price transparency: Despite a deregulatory agenda and recent cuts to agency staff, the Trump administration has directed the agencies to better enforce price transparency regulations. However, these machine-readable files with lists of prices and procedure codes currently have limited value to help consumers directly without an impartial analysis of the data and user-friendly vehicles to describe the information. Price estimators, also required as part of the Transparency in Coverage rule, have the potential to have more value to patients. However, while consumers may want an estimate of their expected out-of-pocket costs for a covered benefit, their awareness of the existence of these estimator tools and the likelihood of using them will influence how effective the regulation is at achieving its aims. Research conducted before and after its implementation showed mixed results on the consumer experience using these tools and their effectiveness in lowering out-of-pocket costs and health care costs overall. There is also concern that consumers will conflate high-cost with high-value care when price estimator tools do not incorporate quality metrics, potentially leading to higher health care spending. In an era of rapid developments in digital technology and artificial intelligence, ways to improve, consumer test, and standardize these tools and encourage their use may be one area of future focus.

Spotlight on cost-sharing protections: Getting renewed attention in the coming months and years are standardized cost-sharing designs that have or have the potential to provide more transparency and predictability about out-of-pocket costs for consumers. The U.S. Supreme Court will decide a case that could end free coverage of certain preventive care services recommended by the U.S. Preventive Services Task Force. A decision in that case is expected later this year. Consumers also await implementation of the Advanced Explanation of Benefits, as a key tool for patients to get cost information upfront. The coordination between plans and providers required for this initiative could go a long way to help patients often caught in the middle between plans and providers not working with each other in the best interest of consumers.

Finally, look for more attention to prescription drug costs and a cost-sharing protection that has been in place across all private insurance for over a decade, the maximum out-of-pocket limit, or cost-sharing limit. Many people who take certain high-cost medications receive financial assistance from drug manufacturers to offset their out-of-pocket costs. In recent years, private plans (excluding those offered to federal workers) have increasingly applied copay accumulators and copay maximizers when an enrollee receives this manufacturer assistance. Under these types of adjustment programs, the amount of financial assistance an enrollee receives does not count toward an enrollee’s out-of-pocket obligations, including the maximum out-of-pocket limit. Research has found that there is little transparency in how these programs operate and research has demonstrated that consumers are not always aware that their health plan contains these features. After a court challenge and a recent change in essential health benefit regulations, the federal government might be poised to confirm and clarify that cost sharing includes amounts received from pharmacy financial assistance programs and that plans must count those amounts toward the maximum out-of-pocket limit.

Continuing state-level initiatives to improve cost transparency: State-level initiatives that aim to improve cost transparency and help prevent medical debt could play a larger role if federal enforcement and regulations concerning consumer protections are stalled. New York, for example, enacted a bill in 2024 that bans a common provider practice, requiring patients to agree to cover the costs of a bill that their insurer does not cover before services are rendered (referred to as a “consent-to-bill” form) and requiring providers have a discussion with their patients about costs of services before signing this form. Although the state has indefinitely delayed full implementation of this law, the requirement for providers to discuss costs with the patient before asking them to sign the consent-to-bill form would still apply.

States continue wide-ranging activity to address high prescription drug costs in private insurance as public concern about high prescription drug costs continues to mount. For example, pharmacy benefit manager (PBM) practices have been criticized for driving up prices and for being shrouded in secrecy. In response, many states have passed laws that aim to improve PBM transparency and reporting requirements, prohibit PBM policies that prevent pharmacists from telling patients when a lower-cost option might be available, and prohibit PBMs from steering enrollees to PBM-owned pharmacies, among others. Whether these laws apply to all private insurance, including self-insured private employer plans, is an open question.

This work was supported in part by a grant from the Robert Wood Johnson Foundation. The views and analysis contained here do not necessarily reflect the views of the Foundation. KFF maintains full editorial control over all of its policy analysis, polling, and journalism.

VOLUME 19

Bird Flu Knowledge, Misleading Claims About Measles Prevention, and Health Content Restrictions


Summary

This volume features findings on beliefs about bird flu from KFF’s latest Tracking Poll on Health Information and Trust, as well as the false promotion of vitamin A as a preventative for measles. The Monitor also shares developments in content moderation on social media and how a study about mental health after gender-affirming care is misrepresented to make false claims about health care for transgender and non-binary people. Additionally, this volume explores when people prefer to use an AI chatbot, instead of a person, for health information.


Featured: Latest KFF Poll Finds Many Are Unaware of Current Public Health Recommendations on Bird Flu

Large Shares of the Public Are Unsure About Recommendations for Preventing Bird Flu

KFF’s latest Tracking Poll on Health Information and Trust finds that large shares of the public are unaware or unsure of what precautions are currently recommended by the CDC to protect individuals from bird flu. Fewer than half of adults are aware that public health officials recommend avoiding close contact with sick animals (45%) and avoiding unpasteurized or raw milk products (39%), with most adults saying they are either unsure or incorrectly saying these actions are not currently recommended. Half of the public is aware that public health agencies are not recommending avoiding eggs from a grocery store for bird flu prevention, while about one-third (35%) are aware that wearing a mask in crowded spaces is not currently recommended for bird flu prevention.

The survey also found notable partisan gaps when it comes to trust in the CDC for bird flu information. Fewer than half of Republicans (42%) say they trust the CDC at least a “fair amount” to provide reliable information about bird flu, compared to larger shares of independents (61%) and Democrats (72%) who expressed trust. This partisan divide on trust in the CDC is consistent with KFF’s past polling showing divisions in trust in the agency on health issues in recent years, but represents a shift from the start of the COVID-19 pandemic when at least eight in ten adults across partisans expressed trust in the CDC to provide information on coronavirus.


Recent Developments

False Claims about Vitamin A for Measles Prevention as Outbreak Grows

Natalya Maisheva / Getty Images

A measles outbreak in Texas and other states continues to grow, with cases quickly rising and multiple deaths reported. According to the Centers for Disease Control (CDC), two doses of the measles, mumps, and rubella (MMR) vaccine are 97% effective in preventing measles. However, growing concerns about vaccine safety have contributed to declining vaccination rates, exacerbating the outbreak. According to the Texas Department of State Health Services, only five patients diagnosed with measles in the current outbreak are known to have received at least one dose of the vaccine, although the department notes that some patients may have been vaccinated after exposure to reduce the risk of severe illness.

Alongside growing vaccine hesitancy, some are turning to nutrition as an alternative prevention method. One emerging narrative promotes vitamin A and other nutritional supplements as an effective way to prevent and treat measles. On March 4, a prominent organization that spreads false claims about vaccine safety shared a post on X stating that the CDC’s website now recommends vitamin A treatment for children who are hospitalized with severe measles. While the CDC has updated its measles guidance, it recommends vitamin A treatment only in a hospital setting and under a doctor’s supervision. Some comments advocated for the MMR vaccine and correctly warned that too much vitamin A without medical supervision may cause both short-term and long-term health complications, others falsely suggested that giving children high doses of vitamin A is a safe and effective way to prevent measles.

Vaccine opponents who promote this claim often cite research showing that vitamin A deficiency—which is rare in the U.S.—can increase the risk of death from measles and other infections to falsely suggest that vitamin A prevents measles. The World Health Organization recommends vitamin A along with vaccination for children at risk of vitamin A deficiency in countries where vitamin A deficiency is common, but it cannot prevent measles infection and long-term, repeated use can carry risks, including liver damage. Even a single large dose of vitamin A can cause nausea, vomiting, blurred vision, and dizziness.

The claims gained traction when Department of Health and Human Services (HHS) Secretary Robert F. Kennedy Jr. published an op-ed for Fox News where he acknowledged that vaccines prevent measles, but also wrote that “good nutrition remains a best defense against most chronic and infectious illnesses.” In an interview with Fox News, Kennedy said that doctors in Texas were giving cod liver oil, which is high in vitamin A, to their patients and “getting very, very good results.” He has since falsely claimed that the MMR vaccine causes the measles-like illnesses, including encephalitis, and leads to deaths every year.  However, there are only three published reports of encephalitis among those who are vaccinated, and a study from the CDC’s Immunization Safety Office found no causal link between the MMR vaccine and death.

Social Media Health Content Moderation Under Scrutiny While FTC Launches Investigation

KFF / Unsplash

Meta is facing renewed criticism for restricting posts about abortion pills on Instagram and Facebook, with some accounts becoming undiscoverable in search results (“shadow banned”) or suspended entirely. Meta told The New York Times that it may have removed these posts or accounts if they violate the company’s policies on pharmaceutical sales, but reproductive health groups argue that these actions limit access to health information following the Supreme Court’s decision to overturn Roe v. Wade. Meta has recently pledged to scale back its fact-checking in an effort to uphold free speech, but these recent actions have led some, including U.S. Senator Ruben Gallego, to question whether Meta’s commitment to free speech applies equally to all issues.

Recent policy actions may further shape how health information is moderated online. In February, the Federal Trade Commission (FTC) launched an investigation into potential censorship by technology platforms, inviting public comments from users who have been “banned, shadow banned, demonetized, or otherwise censored.” As of March 11, more than 1,200 comments had been submitted, with some users reporting past removals of COVID-19 posts. In 2024, the Supreme Court reviewed the Biden administration’s role in moderating social media content on topics like COVID-19 and vaccines, but ruled that the plaintiffs did not have standing to bring the case. The FTC investigation follows an executive order from the Trump administration aimed at ending federal involvement in content moderation, while examining past efforts to curb health misinformation. While the executive order opposes censorship, other actions by the Trump administration have been accused of promoting it, including efforts to restrict information on gender equity.

Study on Transgender Mental Health Misrepresented to Discredit Gender-Affirming Care

Most Trans Adults Who Physically Present As A Gender Different From Their Sex At Birth Say They Are More Satisfied With Life

A new study on the mental health of transgender people after gender-affirming surgery is being misrepresented to claim that gender-affirming care causes poor health outcomes. The retrospective study, published in the Journal of Sexual Medicine, found that transgender adults who had gender-affirming surgery were more likely to report negative mental health outcomes than transgender adults who did not have surgery. However, the authors do not attribute this effect to the surgery, stating instead that these findings may reflect: that individuals receiving gender-affirming surgery experience higher levels of baseline psychological distress compared to those who do not, provider charting practices that are more likely to record gender dysphoria prior to surgery and other mental health diagnoses after surgery, or that those individuals receiving surgery interact with the health care system more often and therefore have more opportunities for mental health diagnoses to be charted.

Transgender people often experience depression and anxiety due to minority stress, including enduring ongoing experiences of stigma and discrimination, even after transitioning. Discrimination in health care settings can further limit access to mental health care and contribute to systemic distrust. A 2023 KFF-Washington Post poll found that a majority of transgender adults (64%) have been verbally attacked because of their gender or sexual identity, while about three in ten trans adults said they had to teach a doctor about trans people to get appropriate care or had a doctor refuse to acknowledge their preferred gender identity. However, the poll also found that eight in ten (78%) trans adults say that living as a gender different from the one assigned to them at birth has made them “more satisfied” with their lives.

On X, a podcast host and author with approximately 4.8 million followers shared a screenshot of an article about the study and misinterpreted it to allege that gender-affirming surgery worsens mental health. As of March 11, the post received about 45,000 likes, 17,000 reposts, and 2,400 comments. Other X users, including commenters on the post, correctly noted that stigma may contribute to trans people experiencing ongoing mental health symptoms before and after surgery and that the study did not account for undiagnosed mental health outcomes before surgery. Some cited previous research showing that gender-affirming surgery is associated with improved mental health and noted that regret rates for gender-affirming procedures are significantly lower than those for other types of surgeries. More broadly, studies have found positive associations between gender-affirming care and mental health.


AI & Emerging Technology

Study Finds People Prefer Chatbots When Embarrassed, But Humans When Angry

d3sign / Getty Images

Researchers from the University of Kansas published the results of a study investigating differences in how people perceive health information provided by generative AI chatbots and information provided by humans. The study recruited 100 participants who were either angry or embarrassed when talking about COVID-19 vaccines and boosters, then randomly assigned them to discuss vaccine information with either an AI chatbot or a lab researcher. Afterwards, participants who were embarrassed reported that they preferred chatbots, while those who were angry reported a preference for humans. According to the researchers, this may be because chatbots can be perceived to be nonjudgmental, suggesting that AI chatbots could play a role in reaching certain audiences who may hesitate to seek health information from human sources. KFF polling from 2024 explored trust in AI chatbots for different types of information, highlighting potential limitations of using chatbots for health communication. While about half of adults said they trust AI chatbots at least a fair amount to give accurate information about practical tasks and technology, fewer trusted their reliability for information on health (29%) or politics (19%). Though certain hesitant audiences may be more comfortable getting health information from chatbots, their effectiveness may be limited by broader concerns about AI’s credibility.

About The Health Information and Trust Initiative: the Health Information and Trust Initiative is a KFF program aimed at tracking health misinformation in the U.S., analyzing its impact on the American people, and mobilizing media to address the problem. Our goal is to be of service to everyone working on health misinformation, strengthen efforts to counter misinformation, and build trust. 


View all KFF Monitors

The Monitor is a report from KFF’s Health Information and Trust initiative that focuses on recent developments in health information. It’s free and published twice a month.

Sign up to receive KFF Monitor
email updates


Support for the Health Information and Trust initiative is provided by the Robert Wood Johnson Foundation (RWJF). The views expressed do not necessarily reflect the views of RWJF and KFF maintains full editorial control over all of its policy analysis, polling, and journalism activities. The Public Good Projects (PGP) provides media monitoring data KFF uses in producing the Monitor.

5 Key Facts About Medicaid and Provider Taxes

Published: Mar 26, 2025

To meet House budget resolution requirements, Congress will need to make major cuts to federal spending on Medicaid. An option under consideration is to limit the use of state taxes on providers, which could save hundreds of billions of dollars according to the Congressional Budget Office (CBO). Medicaid is jointly financed by the federal government and the states, with the federal government paying close to 70% of total costs in fiscal year (FY) 2023. States are permitted to finance the non-federal share of Medicaid spending through multiple sources, including state general funds, health-care related taxes (referred to as “provider taxes” throughout this brief), and local government funds. All states except for Alaska finance some of the state costs with taxes on health care providers, which may be imposed as a percentage of provider revenues or using an alternative formula such as a flat tax on the number of facility beds or inpatient days. The most common provider taxes are levied on nursing facilities (46 states) and hospitals (45 states).

Proponents of restricting provider tax authority say that providers and states receive federal matching funds without expending their own money, which can “inflate a state’s Medicaid match.” As the debate about broader Medicaid spending reductions continues, Republicans may try to recast restrictions on provider taxes as addressing fraud, waste, and abuse. Opponents of such restrictions note that provider taxes are permissible under current law and help fund Medicaid; and restricting provider taxes will create financing gaps for states that could result in higher state taxes, reductions in Medicaid eligibility, lower provider payment rates, and fewer covered benefits. Both proponents and opponents of new restrictions agree that the limited data about provider taxes makes it difficult to assess states’ reliance on them as a funding source and to understand how they affect net payments to providers. The Medicaid and CHIP Payment and Access Commission has submitted recommendations to Congress that states start reporting new data on Medicaid taxes and that those data be publicly available for analysis.

In light of the current debate, this issue brief uses data from KFF’s 2024-2025 survey of Medicaid directors, to describe states’ current provider taxes and the federal rules governing them.

1. All states except for Alaska use provider taxes to help finance the state share of Medicaid spending.

The federal government and states share responsibility for financing Medicaid, with the federal government guaranteeing states federal matching payments with no pre-set limit. States have considerable flexibility in determining how to finance the non-federal share of state Medicaid payments. In state FY 2024, states reported that about 68% of state Medicaid spending came from general funds, most of which come from income and sales taxes. The remaining 32% was funded by other sources including local government funds and provider taxes.

Medicaid provider taxes are defined as those for which at least 85% of the tax burden falls on health care items or services or entities that provide or pay for health care items or services (see Social Security Act, Section 1903(w)(3)(A)). States use provider tax revenues to fund Medicaid “base” rates and supplemental payments, to avoid Medicaid benefit cuts, and to expand Medicaid benefits. Some states have used revenue from provider taxes to finance the ACA Medicaid expansion. Beyond helping finance the state share of Medicaid, permissible tax arrangements may have potential financial benefits for providers who are subject to the tax and serve a high volume of Medicaid patients.

All states but Alaska finance part of the state share of Medicaid funding through at least one provider tax and 39 states have three or more provider taxes in place (Figure 1). While data are limited, the Government Accountability Office (GAO) estimated that provider taxes as a percent of the non-federal share of Medicaid spending in SFY 2018 ranged from less than 0.5% in New Mexico, South Dakota, Texas, and Virginia to more than 30% in Michigan, New Hampshire, and Ohio. Over time, states have increased their reliance on provider taxes, with expansions often driven by economic downturns. GAO reported that reliance on provider taxes had grown significantly over the preceding decade, increasing from 7% in 2008 to 17% in 2018. There are no more current estimates that are publicly available of provider taxes as a share of Medicaid spending.

All States but Alaska Had at Least One Provider Tax and Many States had Three or More Provider Taxes in SFY 2024

2. Federal rules set limits on how states can use provider taxes.

States first began using provider taxes to finance the state share of Medicaid in the 1980s, when Medicaid providers would donate funds or agree to be taxed and the revenues from those donations and taxes would be used to finance a portion of the state’s share of Medicaid. According to the Congressional Research Service, states were essentially “borrowing funds from Medicaid providers in order to draw down federal funds and increase Medicaid payment rates to the providers that had paid taxes or donated funds.” The particularly aggressive use of those taxes by some states spurred statutory and regulatory limitations on provider taxes starting in the 1990s. Federal rules now specify that provider taxes must be:

  • Broad-based, which means the tax is imposed on all providers within a specified class of providers (e.g., the tax cannot be imposed only on providers that see primarily Medicaid patients);
  • Uniform, which means the tax must apply equally to all providers within the specified class (e.g., the tax rate cannot be higher on Medicaid revenue than non-Medicaid revenue); and
  • Not hold taxpayers (providers) “harmless,” which means states are prohibited from directly or indirectly guaranteeing that providers will receive their tax revenues back (i.e., be “held harmless”).

There are 19 classes of providers that the Centers for Medicare and Medicaid Services (CMS) uses to ensure that the tax programs are broad-based and uniform (see 42 CFR Section 433.56). In assessing whether provider taxes comply with federal laws, current regulations specify that the hold harmless requirement does not apply when the tax revenues comprise 6% or less of net patient revenues from treating patients (see 42 CFR Section 433.68), a level sometimes referred to as a “safe harbor” limit. States may also receive waivers of the requirement that taxes be broad-based and uniform if the state can prove the net effect of the tax is “generally redistributive,” and that the amount of tax is not directly related to Medicaid payments.

Policy proposals that would reduce the “safe harbor” limit below 6% could affect most significantly the 38 states that have one or more provider taxes that exceed 5.5% of provider net patient revenues (Figure 2). However, if the limit were reduced significantly enough, all states with provider taxes could be affected. There are 10 states with at least one provider tax that is between 3.5% and 5.5% of net patient revenues. One state (Georgia) reports that all provider taxes are below 3.5% of net patient revenues.

38 States Have At Least One Provider Tax Over 5.5% of Net Patient Revenues

3. Provider taxes are most common for institutional providers.

Provider taxes fall on a wide range of provider types but are most common for institutional providers including nursing facilities (46 states), hospitals (45 states), and intermediate care facilities for people with intellectual or developmental disabilities (32 states, Figure 3). States often use provider tax revenues to support payment rates for providers, often by financing supplemental payments like disproportionate share hospital (DSH) payments, upper payment limit (UPL) payments, and managed care state directed payments (uniform payment increases through managed care that are similar to supplemental payments). Hospitals’ base fee-for-service rates vary considerably across states and, on average, are below hospitals’ costs of providing services to Medicaid enrollees and below Medicare payment rates for comparable services, causing some states to rely more heavily on supplemental payments than others to help cover hospitals’ costs. It is unknown from available data how much states are paying hospitals after accounting for base payments, supplemental payments, and the costs of provider taxes (e.g., the net payment rate), which is one reason why the Medicaid and CHIP Payment and Access Commission has called for greater transparency around provider taxes.

Although data on the use of revenues from provider taxes are limited, GAO found that in 2018, states financed a higher percentage of the state share of supplemental payments (e.g., DSH and non-DSH supplemental payments) using provider taxes than they did for other types of Medicaid payments (i.e., base payments). The use of provider taxes to fund supplemental payments to providers has raised some questions regarding compliance with hold harmless requirements for provider taxes. In April 2024, CMS released guidance to states about this issue, noting they will work with states to identify impermissible hold-harmless arrangements but will not take enforcement action until January 2028, allowing states time to come into compliance.

Beyond institutional providers, 20 states have provider taxes on managed care organizations (MCOs), 17 on ambulance providers, and 11 on “other” provider types such as ambulatory care facilities and home care providers (Appendix Table 1). The Deficit Reduction Act of 2005 required states that tax Medicaid MCOs to tax all MCOs uniformly, thus limiting the ability of states to only tax Medicaid MCOs. However, CMS has the authority to waive the uniformity requirement, and other federal requirements if the tax is determined to be “generally redistributive.” The formula for determining whether a waiver request is “redistributive” has allowed states to impose Medicaid taxes primarily on Medicaid enrollees, raising CMS concerns. For example, in California the tax is set at a much higher rate for Medicaid enrollees relative to privately-insured enrollees, which means that 99% of the tax burden falls on Medicaid member months. As a result, there may be issues with the hold harmless requirements because the MCOs paying for nearly all the tax payments also receive premium payments from the state to provide Medicaid coverage, and those premium payments reflect the tax expense. In its approval letter of California’s recent provider tax waiver in January 2025, CMS included a companion letter informing the state that CMS was contemplating proposed regulatory changes that could affect the legality of California’s MCO tax in future years.

Provider Taxes are Most Common for Institutional Providers

4. Provider tax revenues are most likely to be near the safe harbor limit for long-term care providers.

Tax revenues are nearest to the safe harbor limit most often for nursing facilities and intermediate care facilities for people with intellectual or developmental disabilities (Figure 4). If provider tax revenues are 6% or less of patient net revenues, they are not subject to hold harmless requirements, meaning the revenues may fund payments back to the providers being taxed. Proposals to reduce the 6% “safe harbor” limit would likely most significantly affect states with taxes already near the upper limit. Provider taxes that exceed 5.5% of net patient revenue are most common for nursing facilities (22 states) and intermediate care facilities (17 states), both of which provide long-term care for people who need help with the activities of daily living. There are also 13 states that have provider taxes exceeding 5.5% of net patient revenues for hospitals.

Provider Tax Revenues Are Most Likely To Be Near the Safe Harbor Limit for Long-Term Care Providers

5. Further limits on provider taxes are likely to reduce Medicaid spending, coverage, and payment rates.

The recently passed House budget resolution targets cuts to federal Medicaid spending of up to $880 billion or more over a decade. To put the size of the spending cuts in perspective, $880 billion represents 6% of state taxes per resident and 19% of states’ spending on education per pupil, so offsetting the loss of federal revenues would be challenging for states, particularly considering that states generally must balance their budgets. Assuming states will be unable to replace cuts of that magnitude, they will face difficult choices about whether to reduce Medicaid spending by covering fewer people, eliminating optional benefits, or reducing provider payment rates.

There are not yet detailed proposals under consideration by Congress to achieve federal Medicaid spending reductions, but the Congressional Budget Office (CBO) estimated that reducing the safe harbor limit for provider taxes could save tens or hundreds of billions of dollars depending on the size of the reduction (Figure 5). If the hold-harmless threshold were reduced to 5%, CBO estimates the federal government would save $48 billion over 10 years. If the hold-harmless threshold were eliminated, savings would be $612 billion.

CBO’s estimates of federal spending reductions are based on the agency’s assessment that states will reduce Medicaid spending, resulting in people losing Medicaid coverage. While CBO provides national estimates, the effects would vary significantly across the states. States with provider taxes near the safe harbor limit would be affected by even modest changes whereas states with lower provider taxes would only be affected by more significant reductions. Effects on total Medicaid spending and enrollment would also vary based on how much states offset lost provider tax revenues with other sources of funding. Because provider taxes often support Medicaid payment rates, there will almost undoubtedly be downward pressure on payment rates if provider taxes are restricted, particularly for institutional providers including nursing facilities, intermediate care facilities, and hospitals.

Further Limits on Provider Taxes are Likely to Reduce Medicaid Spending, Coverage, and Payment Rates

10 Key Facts About the U.S. Global Health Response

Published: Mar 25, 2025

The U.S. has been involved in efforts to improve the health of those living in low- and middle-income countries for decades and has been the largest donor to global health in the world. Starting on January 20, 2025, as part of a larger foreign aid review, the Trump administration began to take several steps to defund and dismantle most of the U.S. global health response, rendering its future uncertain. To better understand the U.S. global health response, as it was before this date, here are key facts to know (also see 10 Things to Know About U.S. Funding for Global Health):

1. What have been the goals of U.S. global health efforts?

U.S. global health efforts aim to help improve the health of people in developing countries while also contributing to broader U.S. global development goals (e.g., advancing a free, peaceful, and prosperous world), foreign policy priorities (e.g., promoting democratic institutions, upholding universal values, and promoting human dignity), and national security concerns (e.g., protecting Americans from external threats, sustaining a stable and open international system).1 

2. How long has the U.S. been involved in global health?

The U.S. government (U.S.) has been engaged in international health activities for more than a century beginning with efforts in the late 1800s to join with other nations to form the first international health organizations, standards, and treaties designed to promote growing international trade and travel while protecting borders from external disease threats. Since then, U.S. engagement in global health has grown considerably, particularly after the launch of USAID in 1961, the U.S. international development agency, but most markedly in the last two decades with the creation of PEPFAR and other signature U.S. global health efforts. Heightened engagement has been driven by factors such as globalization, the growing recognition that infectious disease threats – including the emergence of new infectious diseases such as HIV, SARS, avian influenza, and COVID-19 – are threats to national security in the U.S. as well as abroad, as well as demonstrated success in addressing global health challenges, such as polio.

3. How much global health funding does the U.S. provide?

In FY 2024, the U.S. provided $12.4 billion to global health. Most funding (81%) was provided bilaterally (provided to or on behalf of other countries or regions), reaching almost 80 low- and middle-income countries, primarily in sub-Saharan Africa. The remaining share was provided to multilateral institutions (where it is pooled with funding from other donors and, in turn, disbursed to countries and programs by the multilateral institution). U.S. funding for global health, however, represents a very small share of the federal budget (<1%). See Figure 1.

U.S. Global Health Funding as a Share of the Federal Budget, FY 2024

4. How does the U.S. rank as a global health donor?

The U.S. government has been the largest donor to health in low- and middle-income countries. The U.S. provided 42% of all international health assistance from major donor governments in 2023 (see Figure 2), the largest of any donor. In addition, the U.S. has historically devoted a larger share of its foreign assistance to health than other donor governments; global health accounted for almost 30% of U.S. foreign assistance in 2023 (all other donor governments devoted less than 20% of their foreign aid budget to global health).

U.S. was the Largest Donor Government of International Health Assistance in 2023

5. What are the main U.S. bilateral global health programs and priorities?

The U.S. has focused its global health work on several main areas and programs, including establishing major initiatives such as PEPFAR, its signature global HIV/AIDS program. These programs include (see Figure 3 for funding amounts):

U.S. Global Health Funding (in millions), By Program Area, FY 2024

6. What are the main multilateral health organizations supported by the U.S.?

The U.S. government has been a major donor to several multilateral organizations, including those that are United Nations (U.N.) entities as well as independent, public/private partnerships:

U.N. entities:

Independent entities:

7. How does the U.S. carry out its global health efforts?

The U.S. government’s engagement in global health is carried out and overseen by multiple executive branch departments and agencies and the legislative branch. The main federal agencies include:

  • the National Security Council (NSC), within the White House, which is responsible for coordinating and reviewing the U.S. strategy and activities, particularly for GHS;
  • the Department of State, including the Bureau of Global Health Security and Diplomacy (GHSD);
  • USAID (although its future is uncertain);
  • the Millennium Challenge Corporation (MCC);
  • the Department of Health and Human Services (HHS), including the Office of Global Affairs (OGA), the Centers for Disease Control and Prevention (CDC), the National Institutes of Health (NIH), and the Food & Drug Administration (FDA); and
  • the Department of Defense (DoD).

To implement health programs, the U.S. government partners with many organizations, ranging from non-profit and private sector organizations to foreign governments and international and multilateral organizations. In FY 2022, of the $10.6 billion in U.S. global health funding obligated to non-U.S. government recipients, the largest share (45%) went to U.S. NGOs, followed by multilateral organizations (34%), foreign NGOs (17%), and foreign governments (3%).

8. What do we know about the effectiveness of U.S. global health efforts?

U.S. global health programs have been shown to have significant impact. For example, PEPFAR is estimated to have saved 26 million lives (in addition to positive effects on health outcomes beyond HIV mortality, as well as impacts in the area of maternal and child health, along with significant, positive economic and educational spillover effects). Likewise, MCH efforts have supported a 55% decline in under-five mortality and a 42% drop in maternal deaths since 2000, while malaria efforts under PMI since 2006 have supported a 28.7% decline in malaria case rates and a 48.2% decline in malaria death rates.

9. What does the American public think about the U.S. involvement in global health?

Overall, there is broad support for the U.S. playing a role in improving the health for people in developing countries, although support is split along party lines, with the share of Republicans saying the U.S. should play a major role in this area declining since 2016. Half of the public says the U.S. should take a leading or major role in improving health for people in developing countries, while about one-third (36%) say the U.S. should take a “minor role.” Just over half the public says that before Trump took office this year, the U.S. was spending too little (19%) or about the right amount (37%) on these efforts. The public continues to recognize a benefit of spending money on global health. A large majority say that spending money on improving health in developing countries helps protect the health of Americans by preventing the spread of infectious diseases, although support is split along party lines, with most Democrats (86%) and many independents (67%) but fewer Republicans (49%) saying this spending helps Americans in this way.

10. What has the Trump administration done to affect the U.S. global health response?

Starting on January 20, 2025, the first day of his second term, President Trump began to announce numerous executive actions, several of which directly address or affect U.S. global health efforts. These have included a foreign aid freeze and “stop-work order”, cancelling the vast majority of foreign aid grants and contracts, and moving to dismantle USAID (the main implementing agency of U.S. global health efforts). As a result, many U.S. global health programs have been effectively shuttered. This situation presents considerable risks to the health of millions of people in low- and middle-income countries. Multiple lawsuits have been filed challenging these actions and litigation is ongoing.

KFF Resources

  1. U.S. Code, Foreign Assistance Act of 1961, Title 22, Chapter 32; U.S. Code, U.S. Leadership Against HIV/AIDS Tuberculosis, and Malaria, Title 22, Chapter 83; U.S. Department of State and USAID, Joint Strategic Plan FY2022-FY2026, March 2022. White House, National Security Strategy, updated November 2022; USAID website, “Mission, Vision and Values,” webpage, https://www.usaid.gov/about-us/mission-vision-values [no longer accessible; accessed Oct. 2024]. ↩︎

New Rule Proposes Changes to ACA Coverage of Gender-Affirming Care, Potentially Increasing Costs for Consumers

Published: Mar 24, 2025

Update: This rule was finalized on June 25, 2025 and was virtually the same as proposed rule, allowing the change to go into effect for the 2026 plan year. Differing from the proposed rule, which offered no definition, HHS defines “sex-trait modification” services to inlcude “any pharmaceutical or surgical intervention that is provided for the purpose of attempting to align an individual’s physical appearance or body with an asserted identity that differs from the individual’s sex.”

On March 10th, CMS issued a proposed rule that seeks to change how plans sold on and off the Affordable Care Act’s (ACA) Marketplaces (plans for individuals and small businesses), would cover gender affirming care services, which the rule calls “coverage for sex-trait modification1 .” The rule proposes, beginning plan year 2026, to prohibit insurers from covering gender affirming care as an essential health benefit (EHB), which could lead insurers to drop coverage or shift costs to individuals and states.

Essential Health Benefits

The ACA requires non-grandfathered individual and small group health plans to cover a package of EHBs which must be “equal to the scope of benefits provided under a typical employer plan”, are protected by cost-sharing limits, and count towards a plan’s actuarial value as defined in the law. EHB packages vary by state and must include 10 categories of benefits. To date, there have been very few specific services issuers are prohibited from covering within EHBs (prohibited services have included abortion, non-pediatric dental or eye exam services, long-term nursing care, or nonmedically necessary orthodontia).

States vary in how their EHB-benchmark plans treat gender-affirming care with some explicitly covering or excluding and others not explicitly stating a coverage policy. Additionally, separate from EHB benchmark selection, some states have their own mandated benefits which can include gender affirming services and 24 states and Washington, DC prohibit exclusions for transgender related care.

While the policy aim of the proposed rule aligns with the administration’s Executive Orders on gender and limiting access to gender affirming care, certain provisions of these orders are currently subject to preliminary injunctions and the agency states that the proposal “does not rely on the enjoined sections of the executive orders in making this proposal.” Instead, CMS writes that they are proposing the prohibition “because coverage of sex-trait modification is not typically included in employer-sponsored plans, and EHB must be equal in scope to a typical employer plan…” CMS does not provide support for this assertion, instead stating that they find that “0.11 percent of enrollees in non-grandfathered individual and small group coverage market plans utilized sex-trait modification during PYs 2022 and 2023.” Utilization of gender affirming care services is expectedly low in the population overall because only a small share of the population is transgender and not all transgender people seek gender affirming medical care. Further, utilization of a service may be a poor proxy for how commonly it is covered. There are other cases where a small share of the population uses a service that is generally covered by insurance. For example, there were fewer than 5,000 heart transplants in the US in 2023 (equaling one ten thousandth of a percent of the population) but public and commercial insurance typically covers this service.

Coverage of gender affirming care services in employer plans is fairly common. KFF’s 2024 Employer Health Benefit Survey2  found that about one-quarter (24%) of large employers (200 or more workers) stated they covered gender-affirming hormone therapy, a plurality of respondents did not know if they covered these services (45%), and less than one-third (31%) did not offer coverage.  The largest firms in the country (5,000 or more workers) employ 43% of people with job-based coverage and were significantly more likely to report covering hormone therapy in their largest plan (50% offered coverage, 18% did not know). In 2023, KFF’s Employer Health Benefit Survey found a similar trend relating to gender-affirming surgery. Among large employers (200 or more workers) offering health benefits, 23% provide coverage for gender-affirming surgery in their largest health plan, with 40% indicating they did not know.  More than 60% of the largest firms provide coverage for gender-affirming surgery (and 12% did not know). While for both services, there was uncertainty among employers over the details of coverage, many large employers provided coverage. 2022 data from Mercer and 2025 data on fortune 500 company coverage from HRC found, as KFF did, that coverage rates are particularly high among the largest employers (where most US workers are covered).

If implemented, the proposal would likely have an impact on access and costs for individuals and states. Some plans might drop coverage and while plans could cover gender-affirming services outside of their EHB package, consumers would not be assured the same cost-sharing and benefit design protections as for services included in the EHB package. Costs accrued for gender affirming care would not be required to count towards deductibles or out-of-pocket maximums, and would not be protected from lifetime limits, increasing out-of-pocket liability. Given that transgender people are more likely to be living on lower-incomes than cisgender people, higher costs could pose a particular challenge. Increases in out-of-pocket costs would likely deter enrollees from accessing gender-affirming care services, which are medically necessary and recommended by practically every major US medical association.

States, including about half that prohibit transgender care related exclusions, could also be faced with defraying the cost of covering these services under certain scenarios. The proposal states “if any State separately mandates coverage for sex-trait modification outside of its EHB-benchmark plan, the State would be required to defray the cost of that State mandated benefit as it would be considered in addition to EHB….However, if any such State does not separately mandate coverage of sex-trait modification outside of its EHB-benchmark plan, there would be no defrayal obligation..”

The proposal also raises questions about whether the policy would violate the ACA’s major sex nondiscrimination protections (under Section 1557).  Sec. 1557 protects against sex (and other) discrimination in health care and while the Trump Administration has suggested that it will view these protections based on biological sex assigned at birth only, courts can and have said that those protections extend to sexual orientation and gender identity. This interpretation also differs from the opinion issued by the Supreme Court in the Bostock case which found employment sex-based nondiscrimination protections extend to sexual orientation and gender identity.

  1. The proposed rule does not define “sex-trait modification” but references the definition of “chemical and surgical mutilation” used in the Trump administration’s Executive Order, “Protecting Children From Chemical And Surgical Mutilation”, which includes the use of puberty blockers, sex hormones, and surgical procedures to affirm an individual’s gender identity that differs from their sex assigned at birth. ↩︎
  2. Since 1999, KFF’s Employer Health Benefit Survey has collected nationally representative information on the cost and coverage of employer sponsored plans. ↩︎