Introduction
Women’s use of health care services is shaped by a range of factors, including their health needs, health coverage, access and availability of health providers in their communities, and the social determinants of health. This data note presents findings from the KFF Women’s Health Survey on women’s health status, access to health care services, and use of preventive health services. The data are analyzed across different subgroups of women including by age, race/ethnicity, insurance status, poverty level, disability status, and sexual orientation (LGBT+). The KFF Women’s Health Survey is a nationally representative survey of 5,055 women ages 18 to 64, conducted May 15 – June 18, 2024. See the methodology for details.
Key Findings:
Health Status and Ongoing Health Conditions:
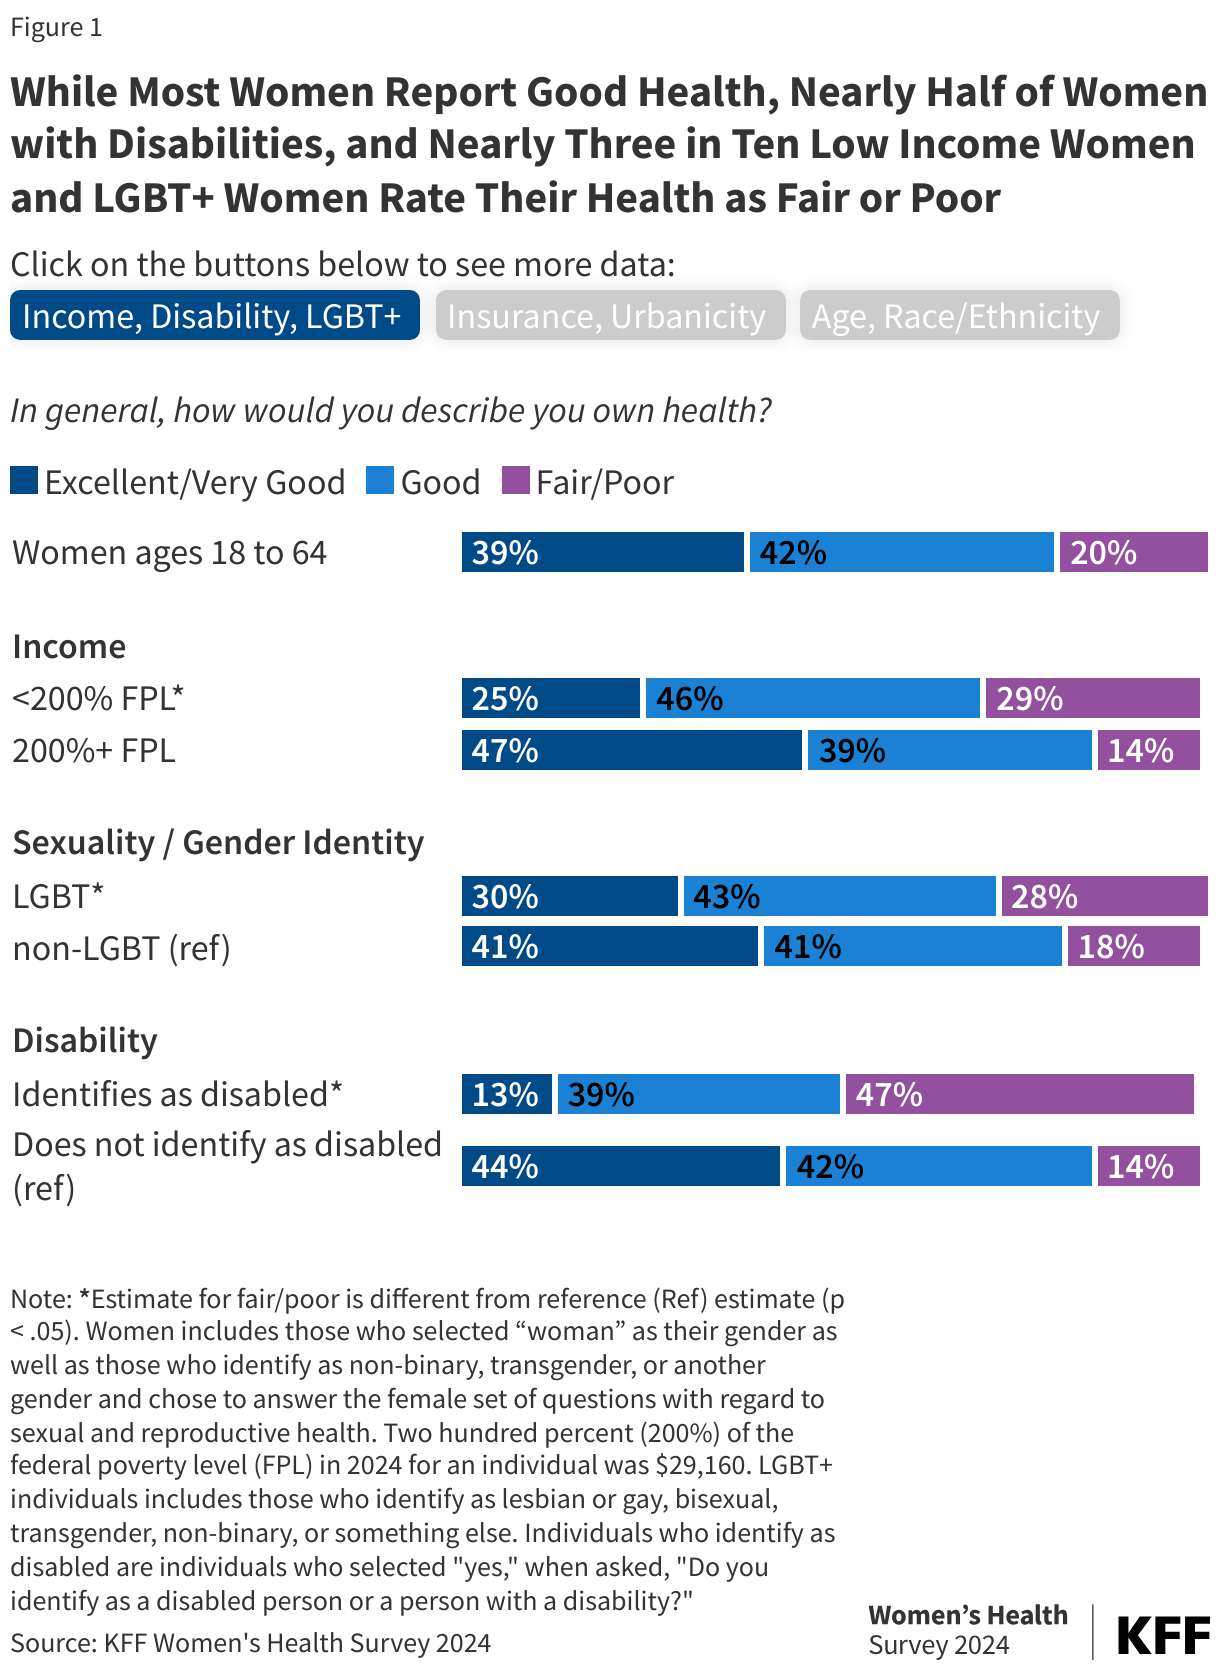
- While most women (81%) ages 18 to 64 report being in excellent, very good, or good health, one in five (20%) report being in fair or poor health, with substantial differences by sociodemographic characteristics.
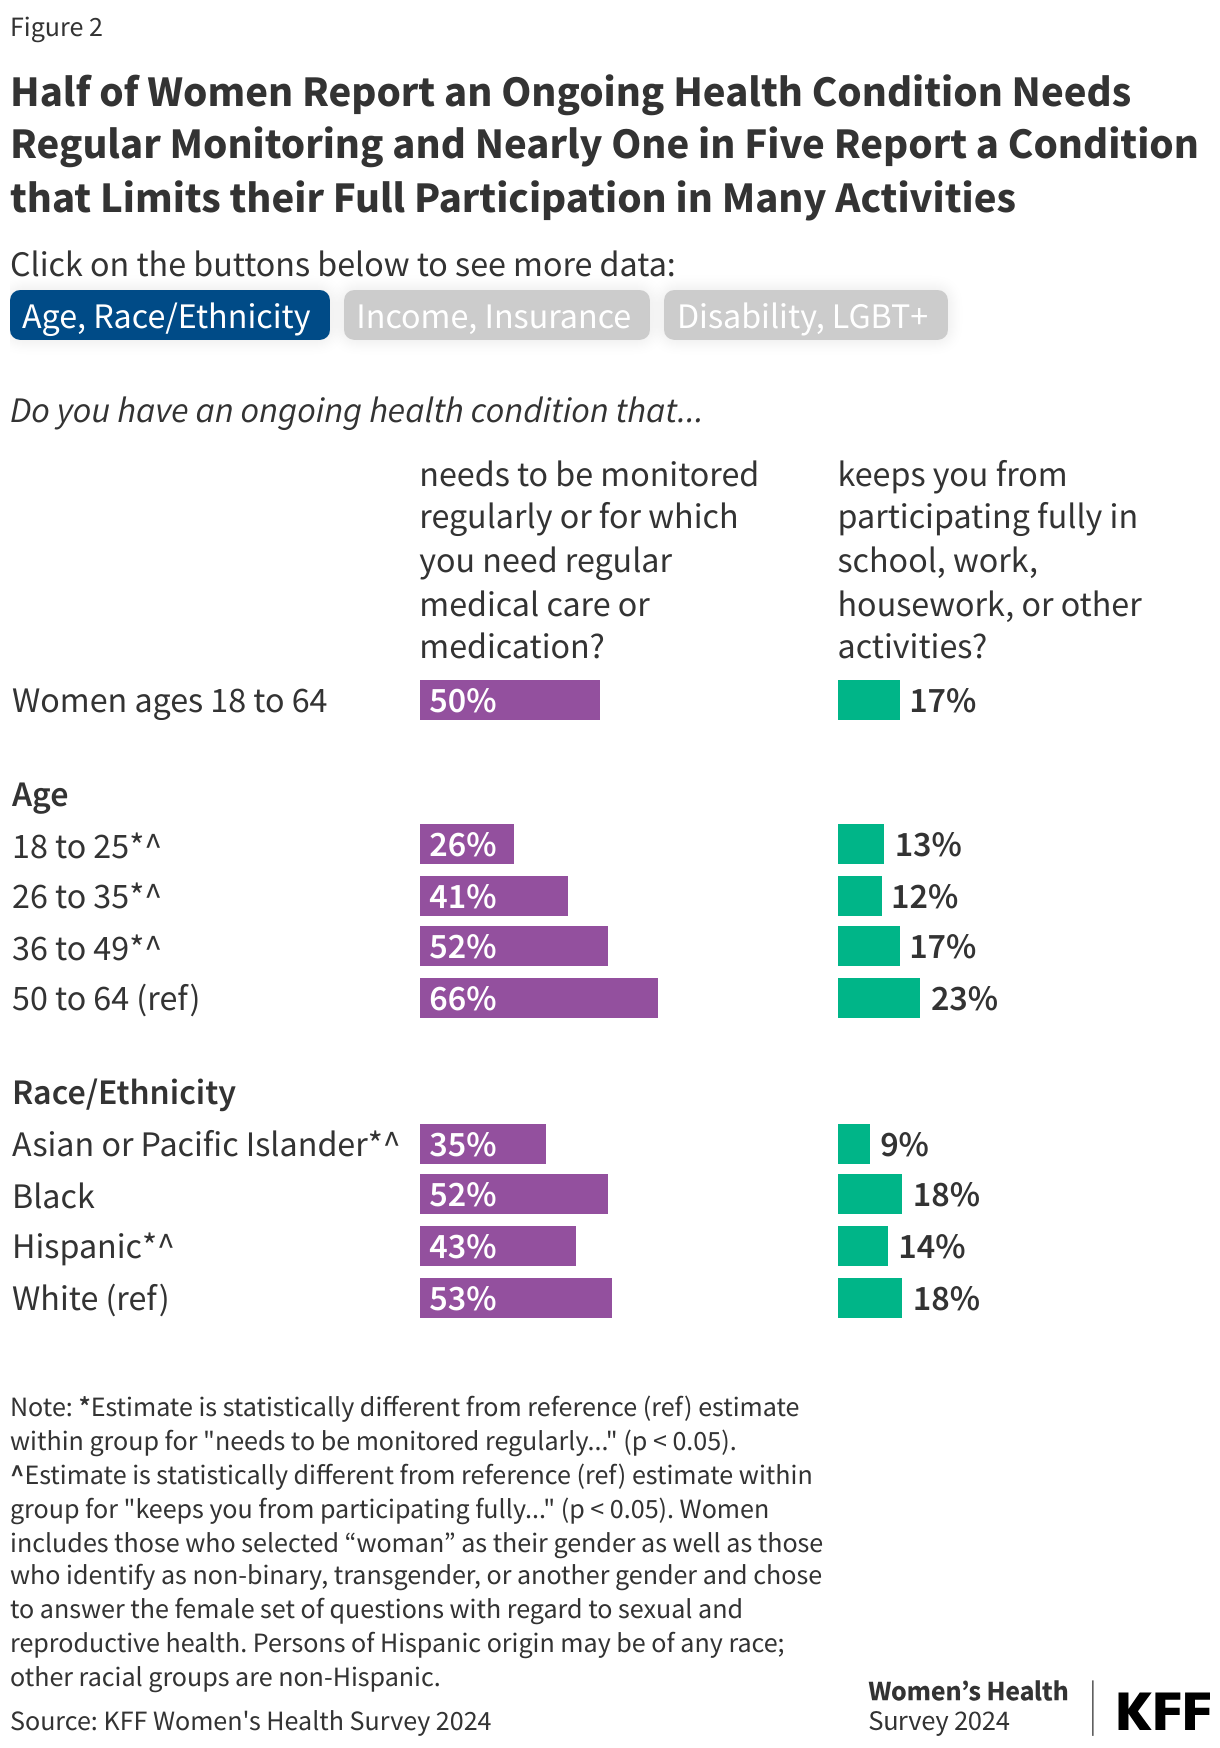
- Half of women report having an ongoing health condition that needs to be monitored regularly or for which they need regular care or medication. Nearly one in five (17%) women say they have an ongoing health condition that keeps them from participating in daily life activities such as school, work or housework.
Site of Care and Access to Services:
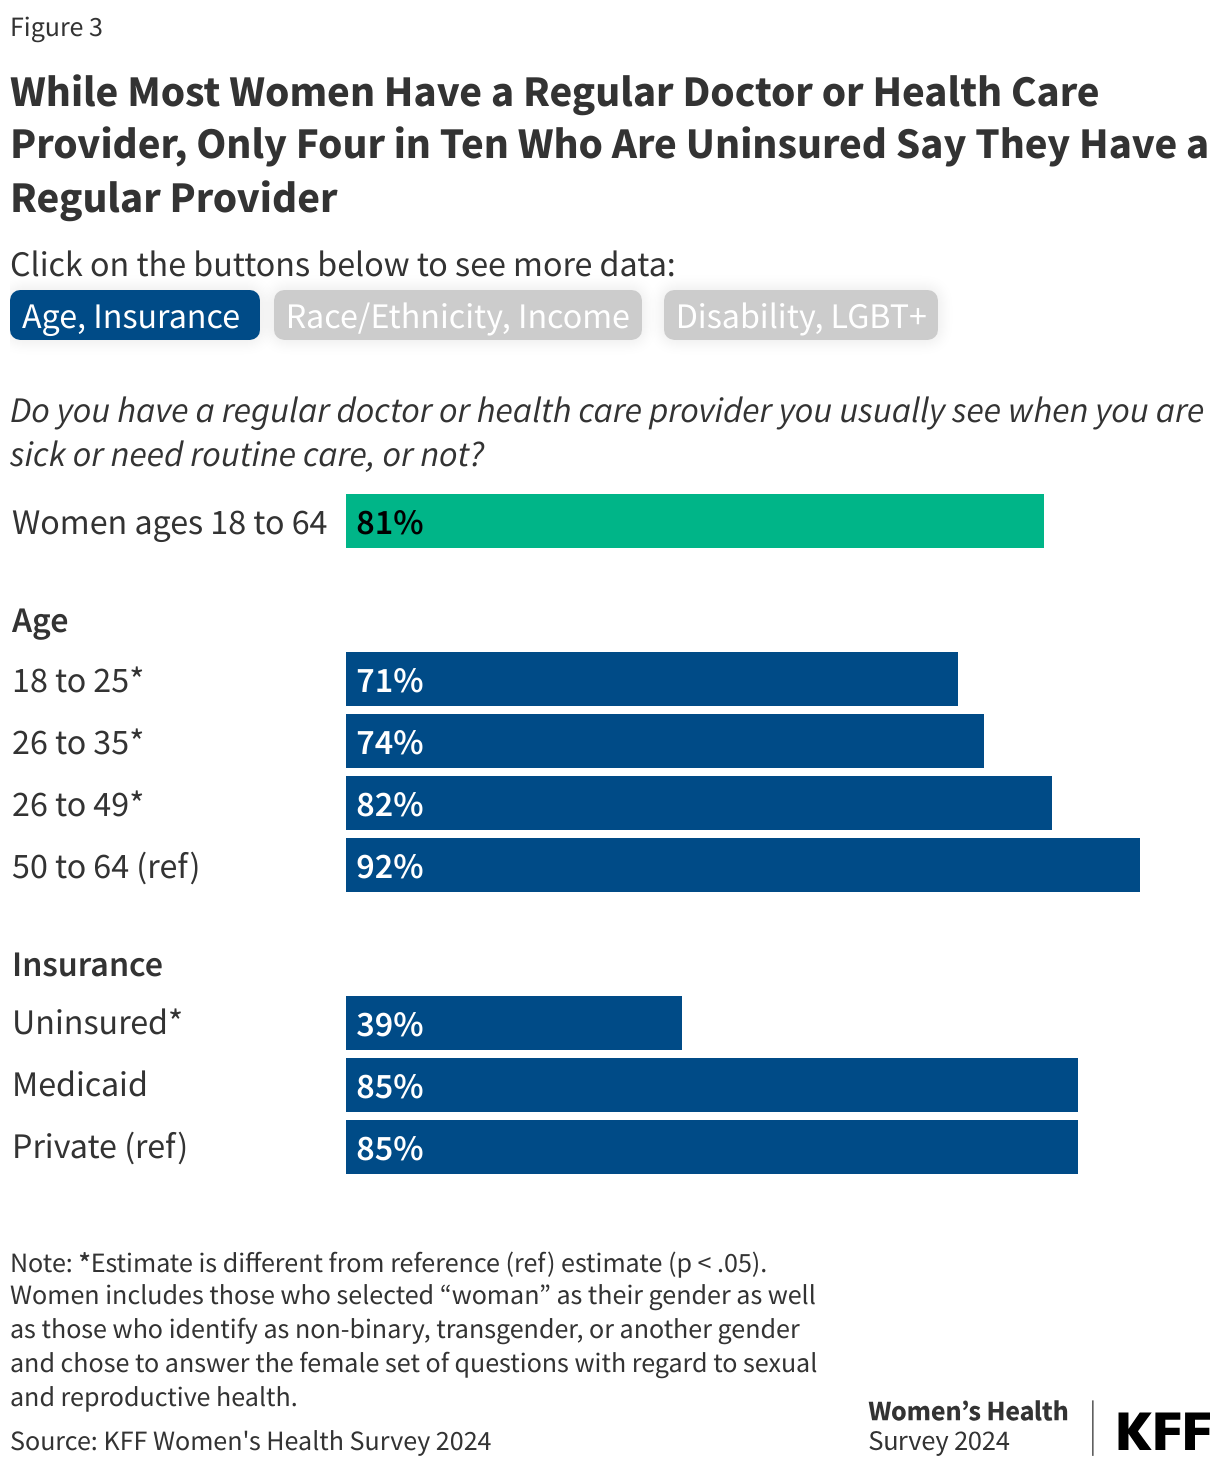
- Eight in ten (81%) women report having a regular doctor or health care provider they see when they are sick or need care, but notably, less than half of those who are uninsured have a usual source of care an important access point for health care.
- While the majority of women (59%) rely on a private doctor’s office or HMO when they are sick or in need of health advice, clinics are a key source of care for about four in ten who have lower incomes, Medicaid coverage, are under the age of 25, or are Hispanic.
- Reproductive health care is not universally obtained by all women. Six in ten women between the age of 18 and 64 report having had a gynecological visit in the past two years, but one in 10 (8%) never had a visit, including almost one in five (19%) uninsured women.
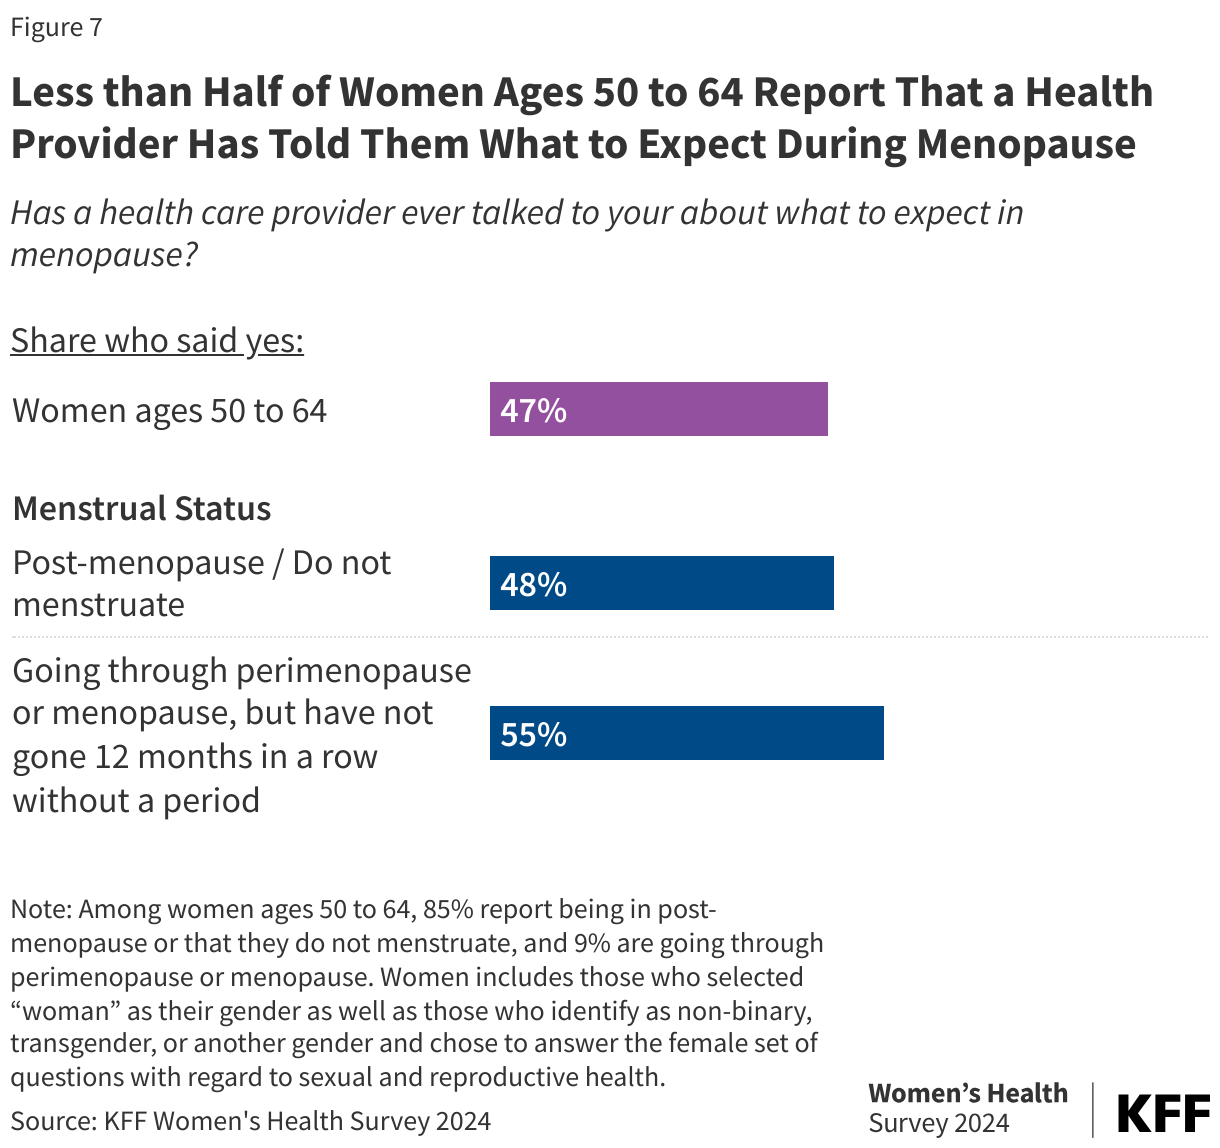
- Less than half (47%) of women ages 50 to 64 report that a health care provider has spoken to them about what to expect in menopause.
Use of Preventive Health Services:
- The majority of women (72%) ages 40 to 64 report that they have had a mammogram in the past two years—among uninsured women, the rates are far lower, with less than four in ten (38%) reporting having had a mammogram in the past two years.
- Most women (62%) ages 21-64 report that they had a Pap smear or Pap test in the past two years for cervical cancer screening, with higher screening rates among Black and Hispanic women as well as those with higher incomes and private insurance.
- Almost half (47%) of women ages 45 to 64 report having had a recent colon cancer screening test in the past two years, including higher shares of Black and Hispanic women and women with private or Medicaid coverage.
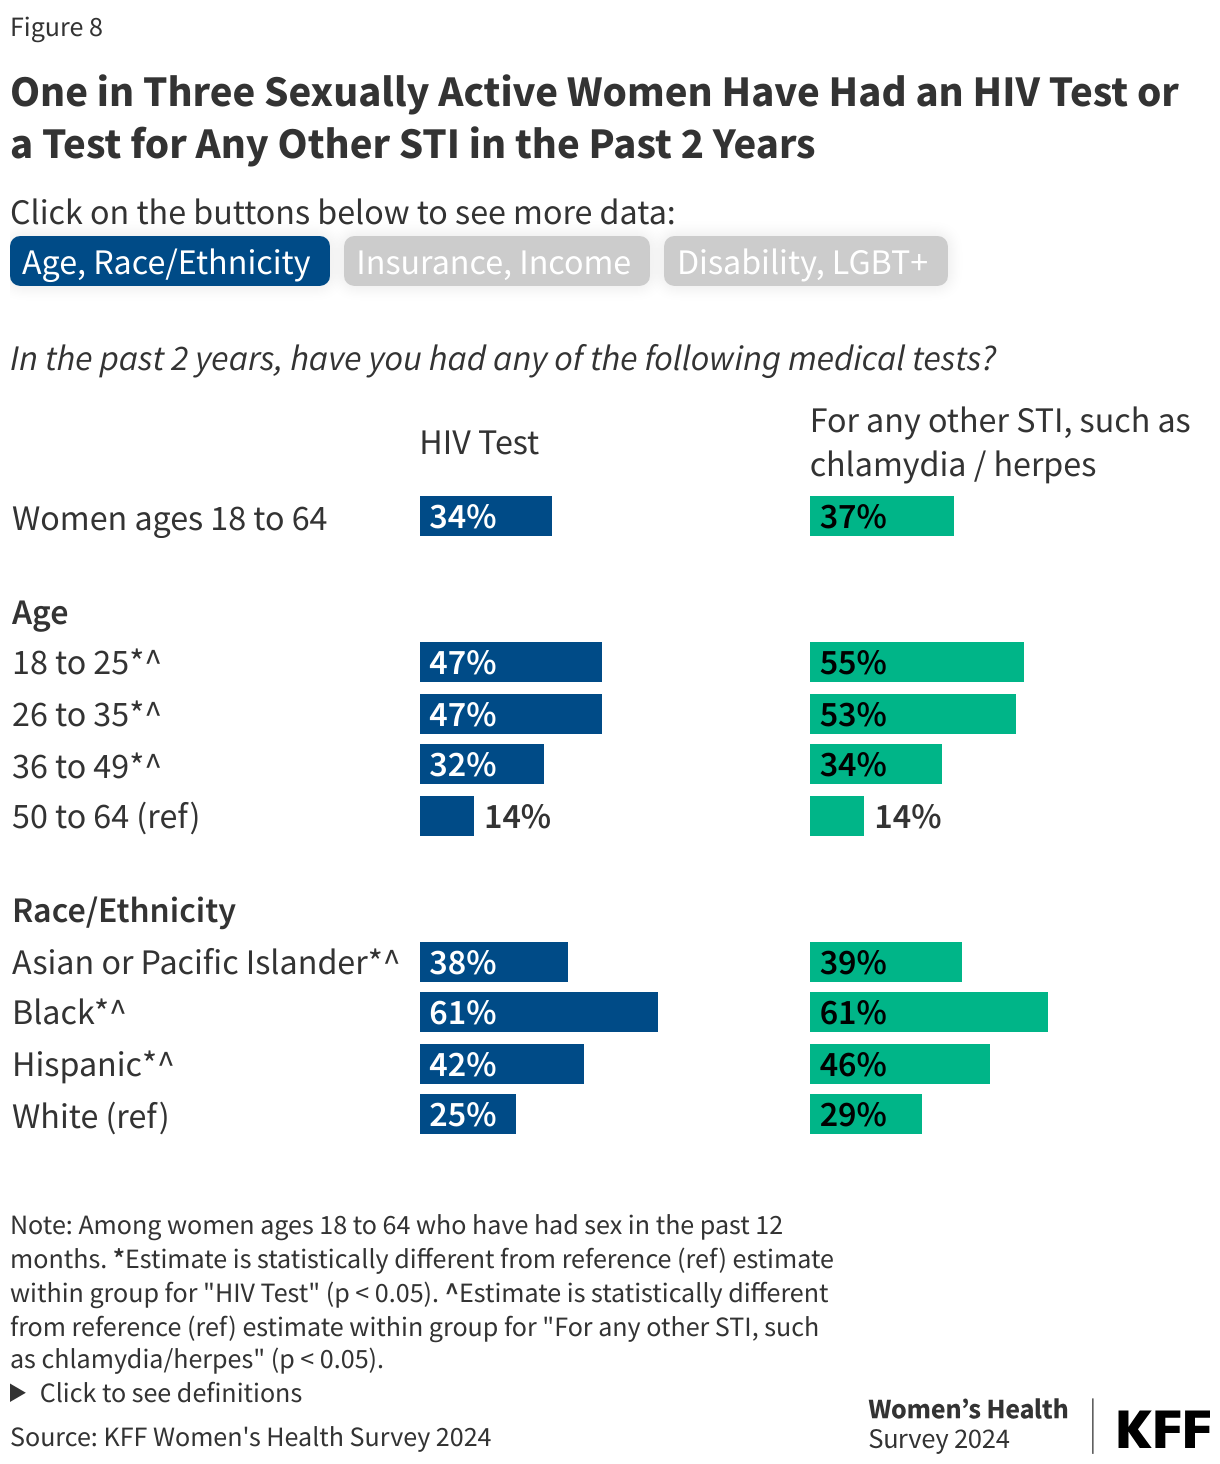
- Among women ages 18 to 64 who report having sex in the past 12 months, one in three report having had an HIV test (34%) or a test for other STIs such as chlamydia or gonorrhea (37%) in the past two years.
Health Status and Ongoing Health Conditions
The majority of women ages 18 to 64 report being in good or excellent health, but one in five report fair or poor health. Substantial shares of LGBT+ women, women who identify as disabled, those with lower incomes, those with Medicaid coverage, and those without insurance describe their health as fair or poor. Eight in ten women ages 18 to 64 (81%) rate their health as excellent, very good, or good; however, one in five (20%) describe their health as fair or poor (Figure 1). Nearly half (47%) of women who identify as disabled, and over one in four LGBT+ women, women with low incomes, as well as those with Medicaid coverage and without insurance describe their health as fair or poor. Nearly a quarter of mid-life aged (50-64) women, those living in rural areas, and Black and Hispanic women describe their health as fair or poor, which was significantly higher than younger women, those living in urban areas, and White women.
Half of women ages 18 to 64 report that they have an ongoing health condition that needs to be monitored regularly or for which they need regular care or medication (Figure 2). Larger shares of women age 50 to 64 and women with Medicaid coverage report an ongoing health condition compared to women ages 18 to 49 and women with private health care coverage. Rates are also higher among women who are White and Black, compared to those who are Hispanic or Asian or Pacific Islander. Among women who identify as disabled, 86% report having an ongoing health condition that requires regular monitoring, care, or medication.
While half of women report having an ongoing health condition, nearly one in five (17%) say that they have an ongoing health condition that keeps them from participating fully in school, work, housework, or other activities. One in four women with lower incomes (26%), women with Medicaid coverage (26%), women 50 to 64 (23%), and women living in rural areas (24%) report having an ongoing health condition that keeps them from participating fully in daily life. Among women who identify as disabled, two-thirds (65%) report they have an ongoing health condition that keeps them from participating in daily life.
(Back to top)
Site of Care and Access to Services
Most women report having a regular doctor or health care provider they see when they are sick or need care, but less than half of those who were uninsured had a usual source of care. Eight in ten (81%) women ages 18 to 64 say they have a regular doctor or health care provider they usually see when they are sick or need routine care (Figure 3). Larger shares of women ages 50 to 64, Black women, and women who identify as disabled report having a regular doctor or health provider. However, among women who are uninsured, only four in ten (39%) say they have a regular health care provider compared to 85% of women with private insurance or Medicaid.
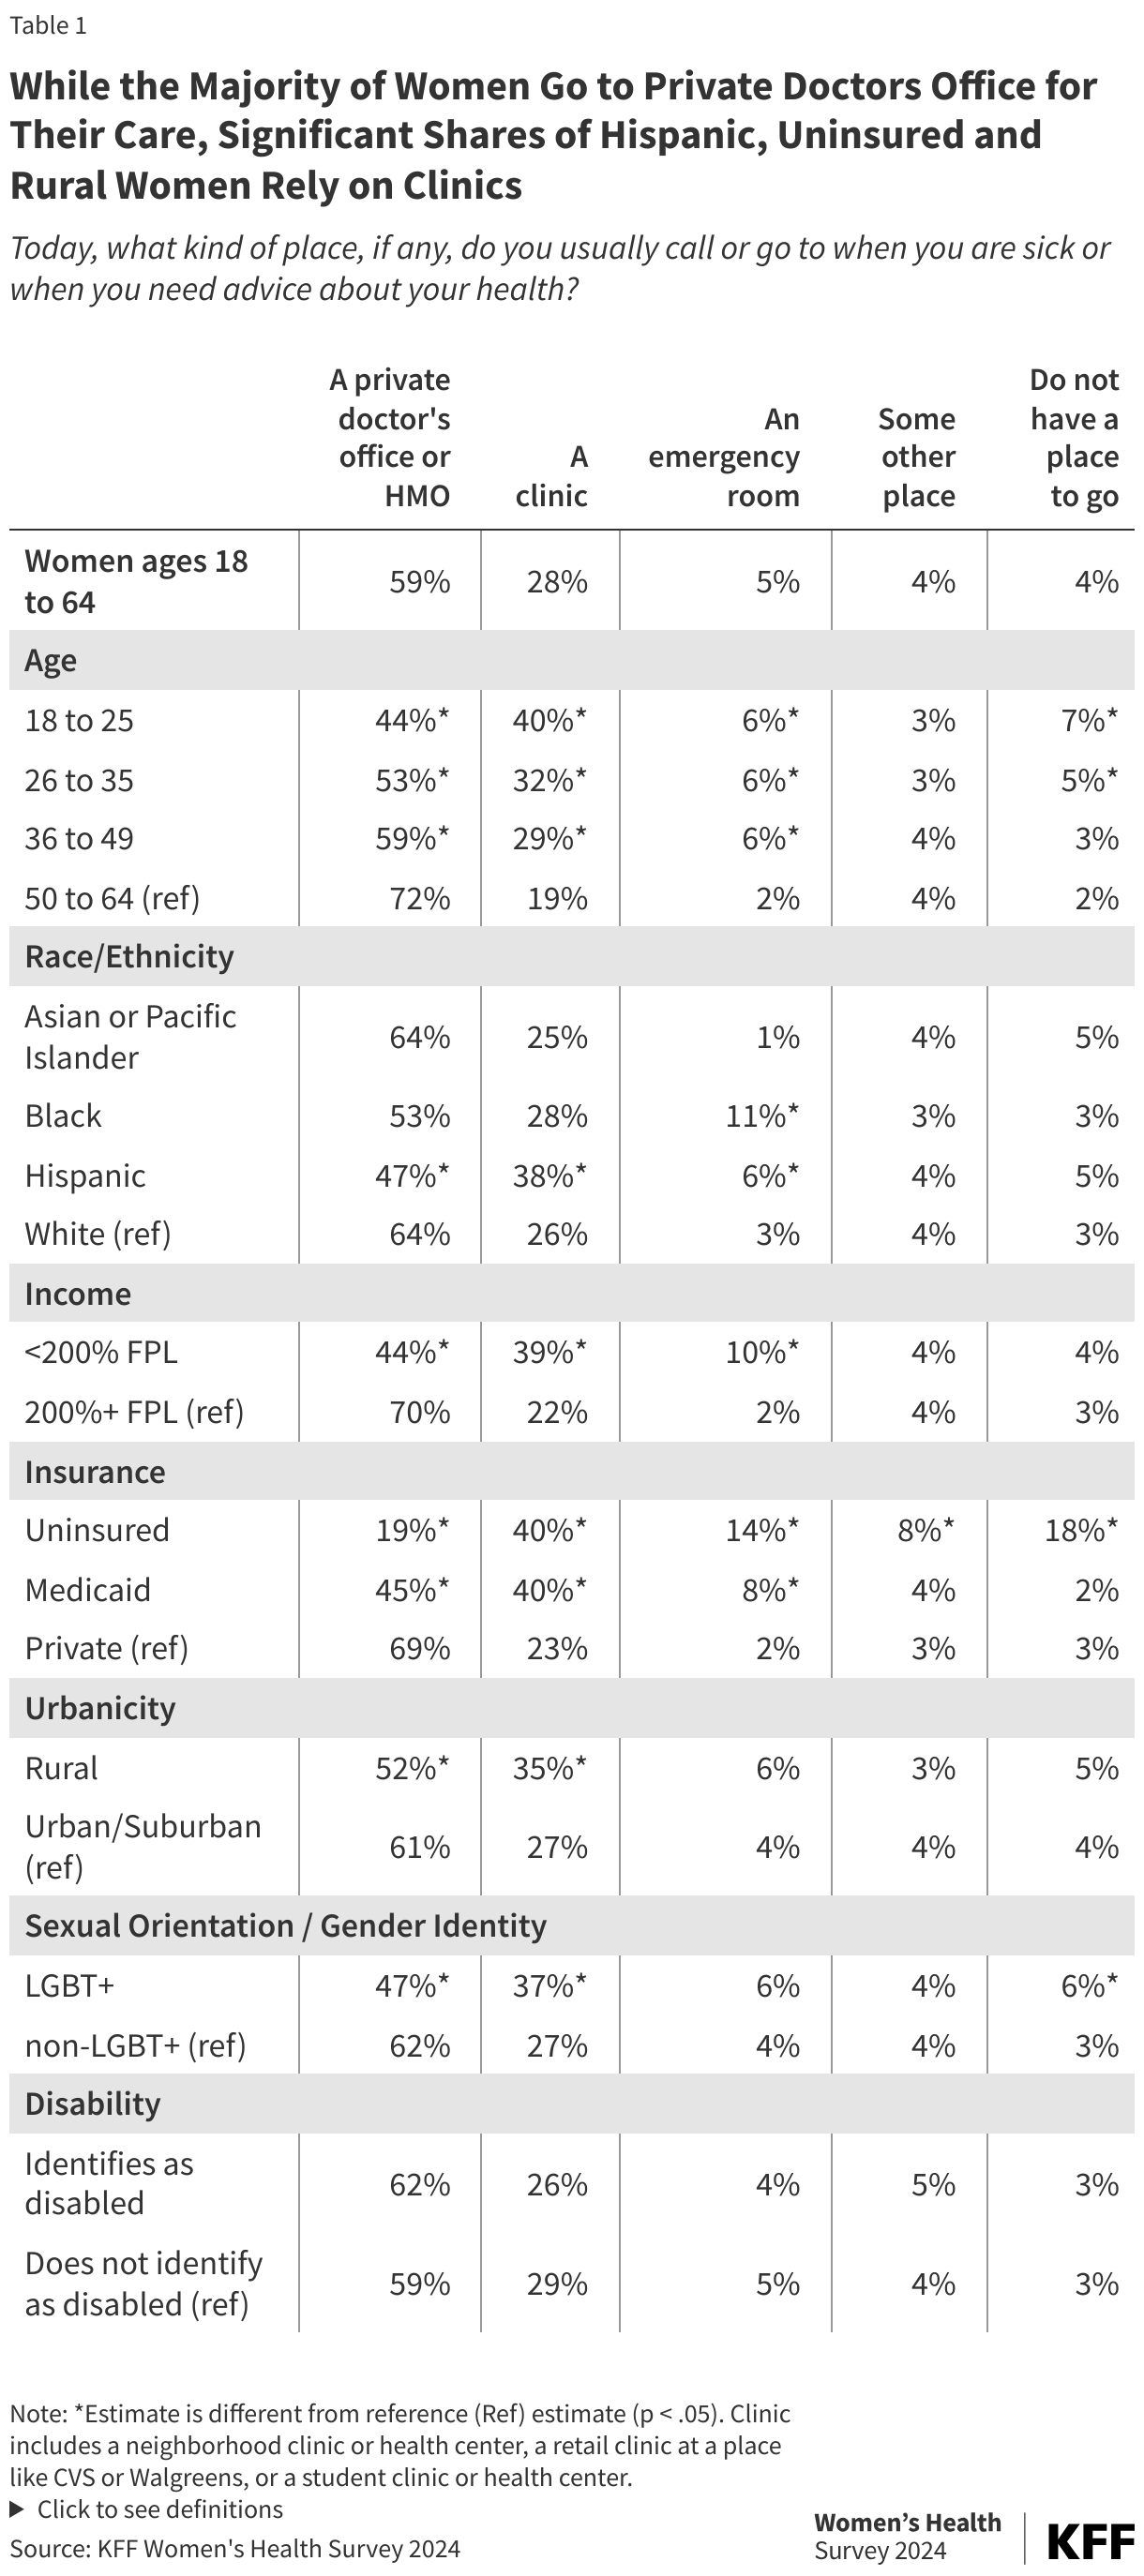
When they get sick or need advice about their health, the majority (59%) of women go to a private doctor’s office or HMO (Table 1). Three in ten (28%) women go to a clinic, 5% go to an emergency room, and 4% go to some other place for their health care. Overall, four percent of women 18 to 64 report that they do not have a place to go when they are sick or need advice about their health.
While the majority of women go to a private doctor’s office or HMO when they are sick or in need of health advice, women with lower incomes, Medicaid coverage, are under the age of 25, or are Hispanic are more likely to report going to clinics for their usual care (Table 1). Lower shares of Hispanic women, those with lower incomes or Medicaid coverage, those living in rural areas, and LGBT+ women report that their usual place of care is a private doctor’s office or HMO. In contrast, among women who are uninsured, only one in five (19%) say they go to a private doctor’s office for care—four in ten (40%) say they go to a clinic, many of which provide free or reduced cost care thanks to federal and state support, and one in five (18%) report that they do not have a place to go to when they are sick or need advice. Women under the age of 25 are also more likely to rely on clinics for their care and about one-third of women living in rural areas usually get care at a clinic. While only 5% of women report an emergency room as their usual place of care, larger shares of Black (11%) and Hispanic women (6%), women with lower incomes (10%), those with Medicaid coverage (8%) and those who are uninsured (14%) say their usual place of care is an ER.
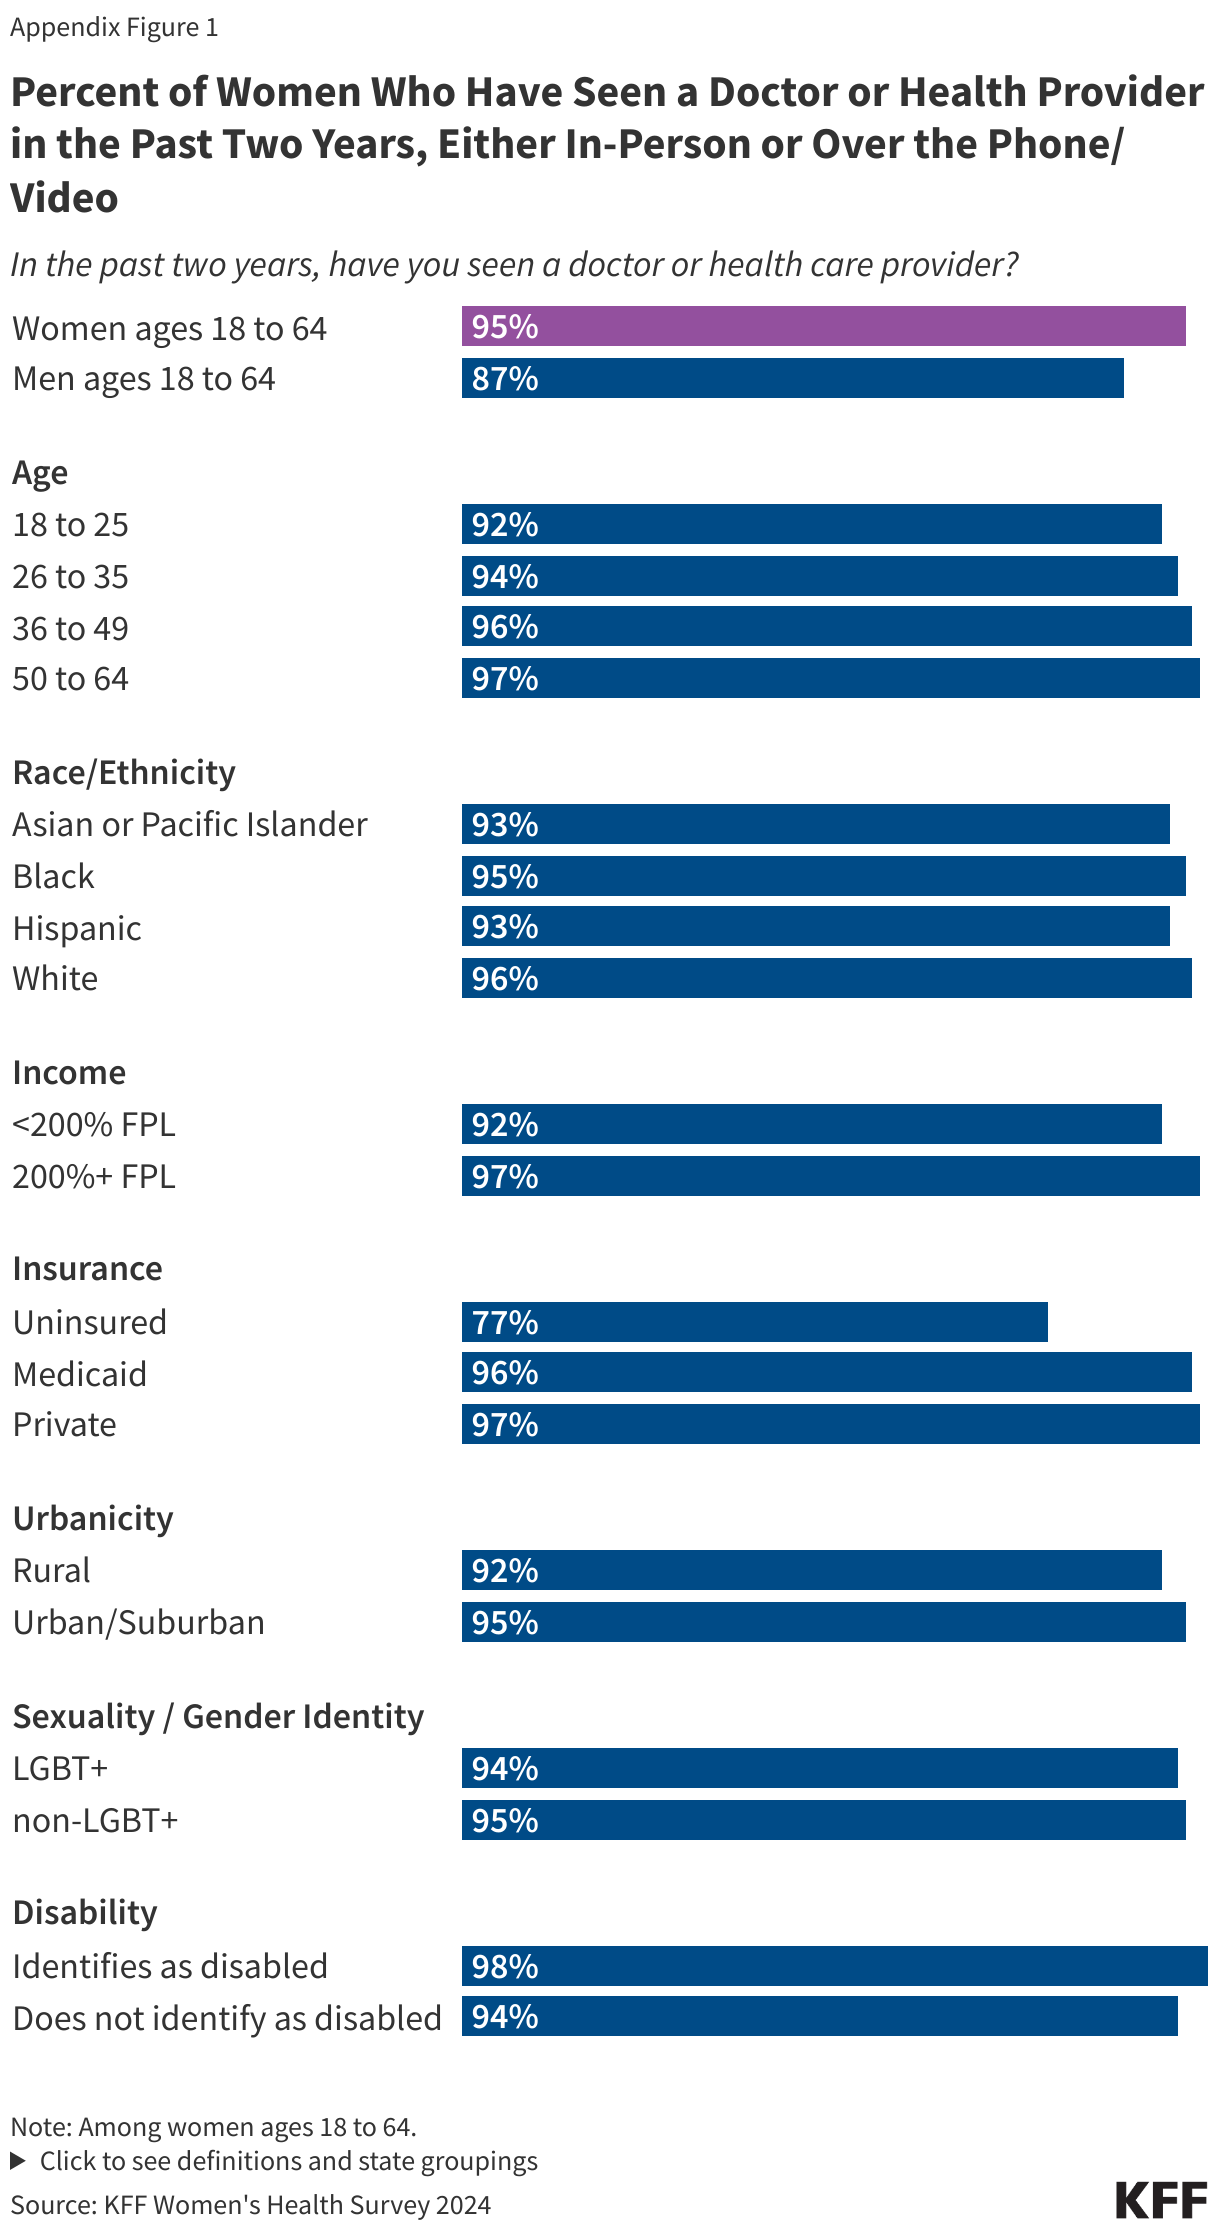
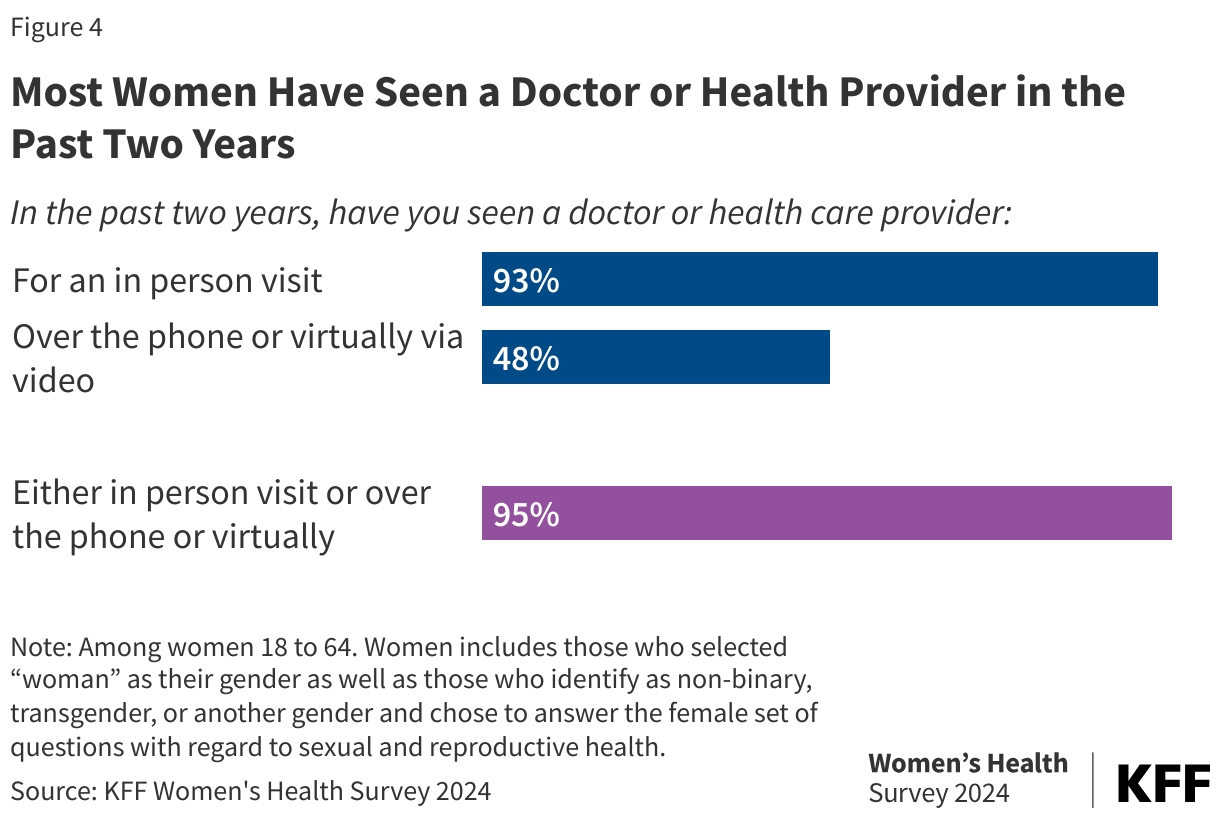
Almost all women report they have seen a doctor or health provider in the past two years, either in person, over the phone, or virtually. The majority of women report that they have seen a doctor for an in-person visit (93%), while half (48%) report they talked to a provider over the phone or had a virtual visit (considered a telehealth visit) (Figure 4). The share of women who have seen a doctor or health care provider in the past two years either in person or through telehealth does not differ statistically across key demographic groups such as race and ethnicity, income, and age.
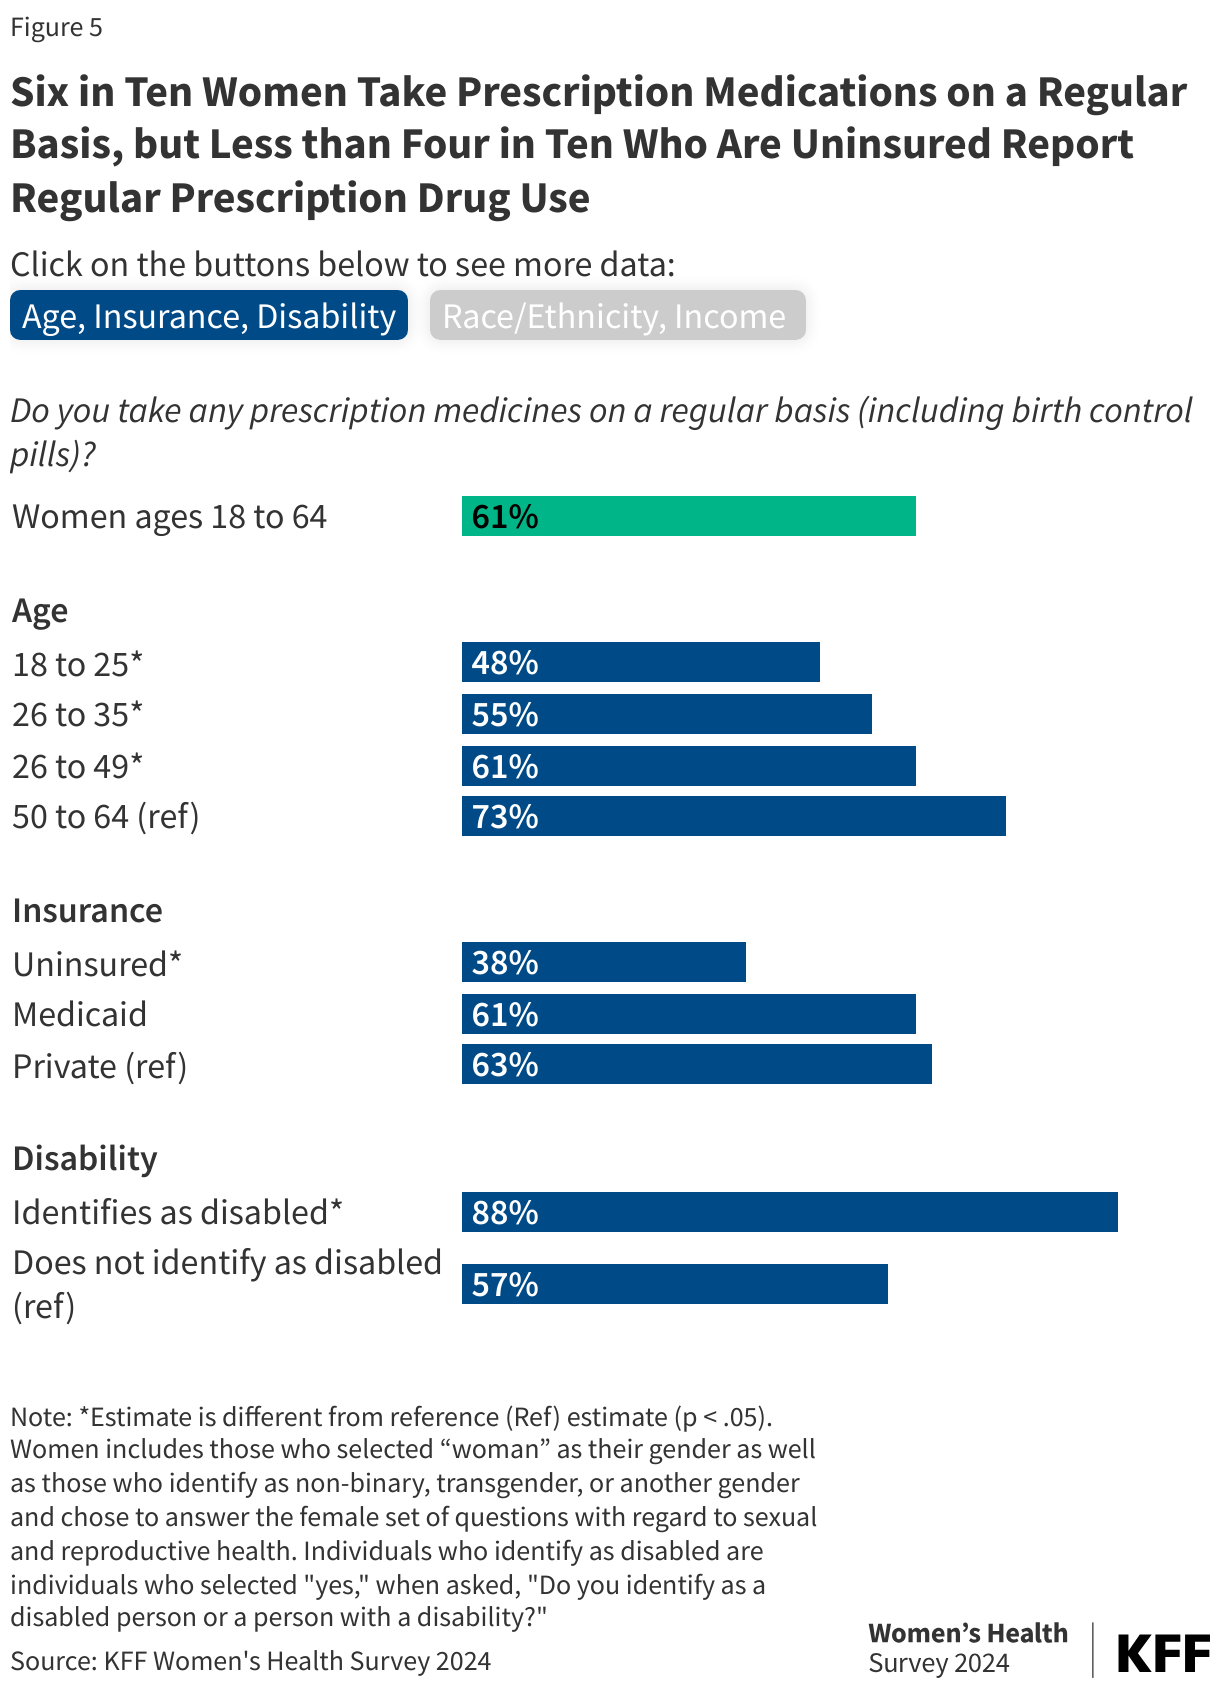
Nationally, six in ten (61%) report that they take prescription medications, including birth control pills, on a regular basis (Figure 5). Larger shares of women ages 50 to 64, women with private coverage, and women with higher incomes take prescription medications compared to reproductive age women, women with lower incomes, and women who are uninsured. Use of prescription medications is predicated on access to clinical care which is poorer among many of these groups. White women are more likely to report that they take prescription medications than Asian or Pacific Islander, Black, and Hispanic women. Nine in 10 (88%) women who identify as disabled report that they take prescription medications compared to 57% who do not identify as disabled.
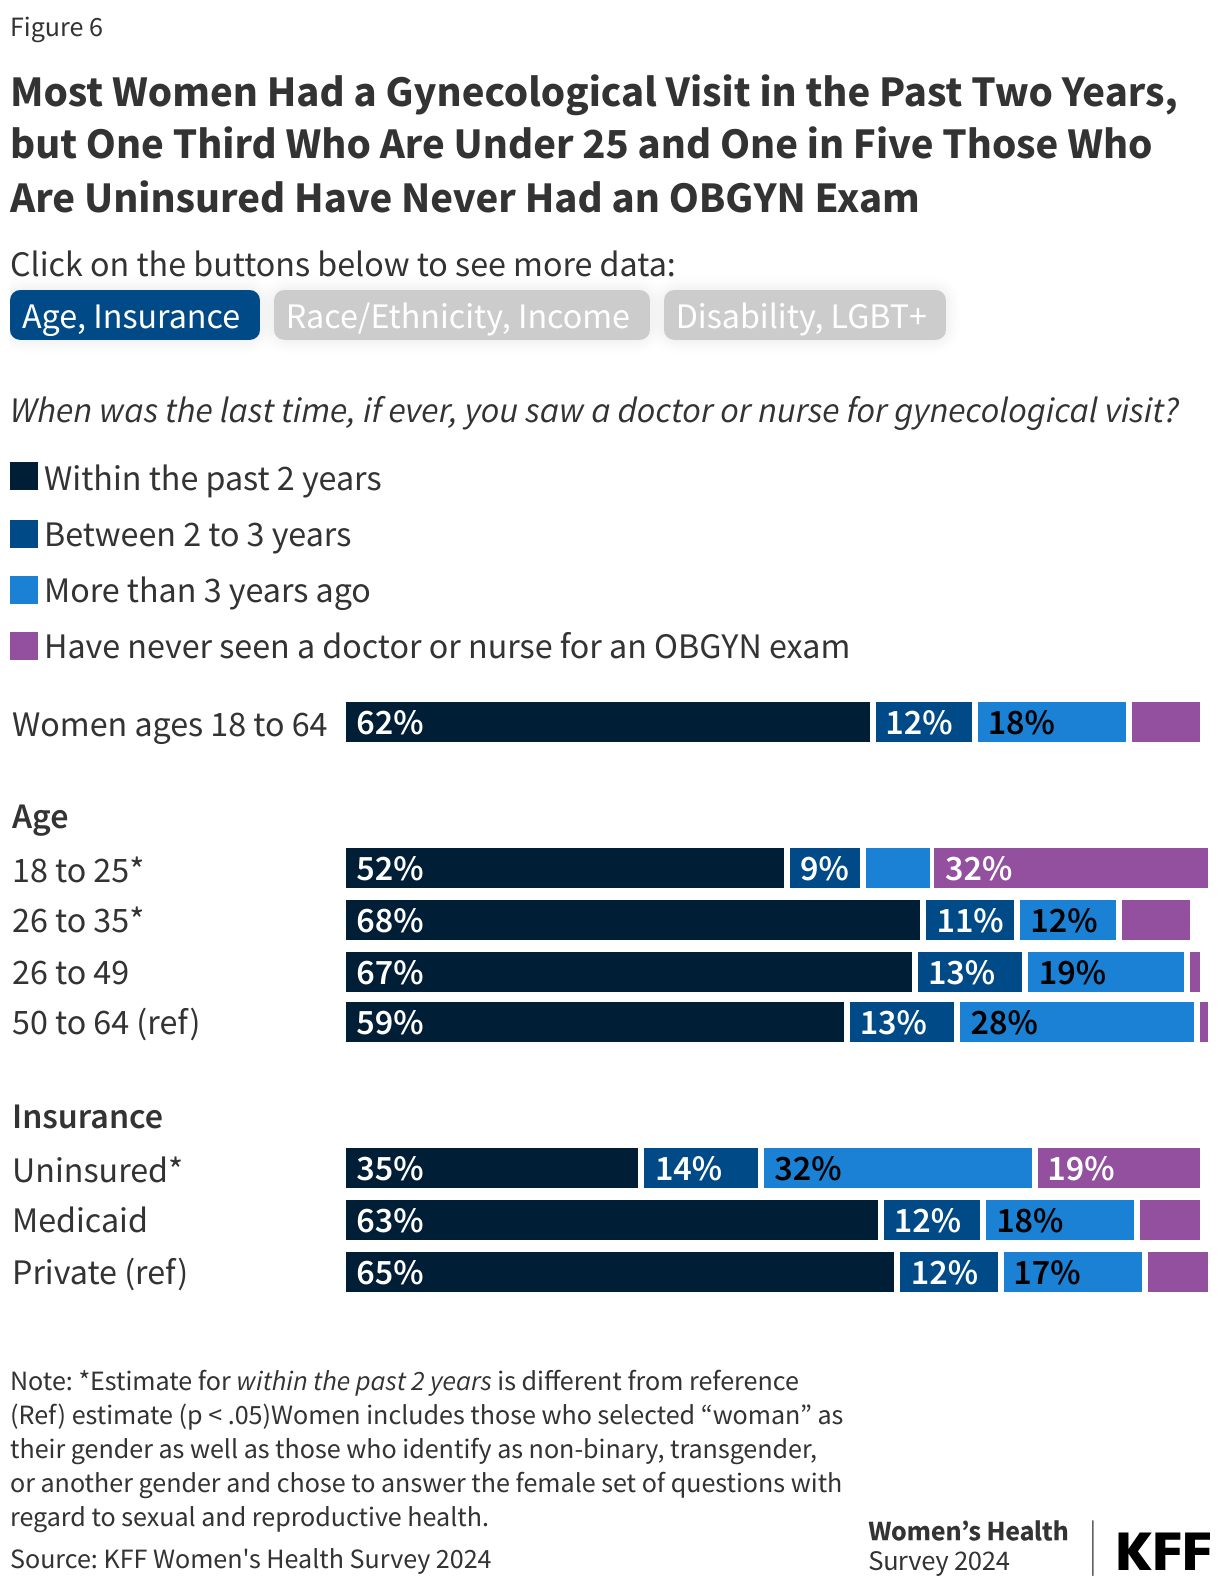
Six in ten (62%) women report having had a gynecological visit in the past two years (Figure 6). Gynecological visits can include pelvic exams, examinations of the female reproductive organs, cervical cancer screenings, discussion and prescriptions of contraceptives, pregnancy planning, and discussions of menopause, among other topics. Twelve percent of women have had a visit in the past two to three years and 18% had a visit more than three years ago. Nearly one in 10 women (8%) have never had a gynecological visit.
Across most subgroups, except for uninsured women, over half of women have had a gynecological visit in the past two years. Among uninsured women, only one in three (35%) have had a gynecological visit in the past two years, and one in five (19%) report that they have never had a gynecological visit. A third of women under the age of 25 report that they have never had a gynecological visit compared to one percent of women ages 50 to 64. One in seven Asian or Pacific Islander women (13%) and LGBT+ women (14%) also report that they have never had a gynecological visit.
Less than half (47%) of women ages 50 to 64 report that a health care provider has spoken to them about what to expect in menopause (Figure 7). A gynecological visit can be an opportune time for providers to discuss menstrual and other changes across the lifespan, but in recent years, there has been an increased recognition that clinicians do not speak often enough about menopause with female patients.
(Back to top)
Use of Preventive Health Services
The Affordable Care Act (ACA) requires most private health insurance plans and ACA Medicaid expansion programs to cover many recommended preventive services for adults without any patient cost-sharing. Some preventive services are specific to women, including annual checkups, prenatal tests, breast and cervical cancer screenings, prescription contraceptive services and supplies, as well as many services recommended for adults regardless of sex or gender identity. Use of preventive services can lead to early identification of conditions when they are more responsive to medical interventions. Despite the policy’s wide reach and popularity with the public, there have been several legal challenges over elements of the preventive services requirement since it initially took effect, including in a pending case, Braidwood Management Inc. v. Becerra.
The majority of women ages 40 to 64 report that they have had a mammogram in the past two years, with higher rates among Black women. Both the United States Preventive Health Services (USPSTF) and the Health Resources and Services Administration (HRSA) recommend that women ages 40 to 74 with average risk for breast cancer get a screening mammogram at least every two years. Seven in ten (72%) women ages 40 to 64 report having had a mammogram in the past two years (Table 2). Larger shares of Black women (81%) compared to White women (71%) report having had a mammogram in the past two years. Prior research has similarly found that higher shares of Black women report having had a screening mammogram compared to White women. Significantly larger shares of women with private coverage (77%) report having had a mammogram compared to those with Medicaid coverage (66%) or who are uninsured (38%). The National Breast and Cervical Cancer Early Detection Program offers free mammograms to those who are uninsured, but many people may not know of it or how to obtain free or low-cost services.
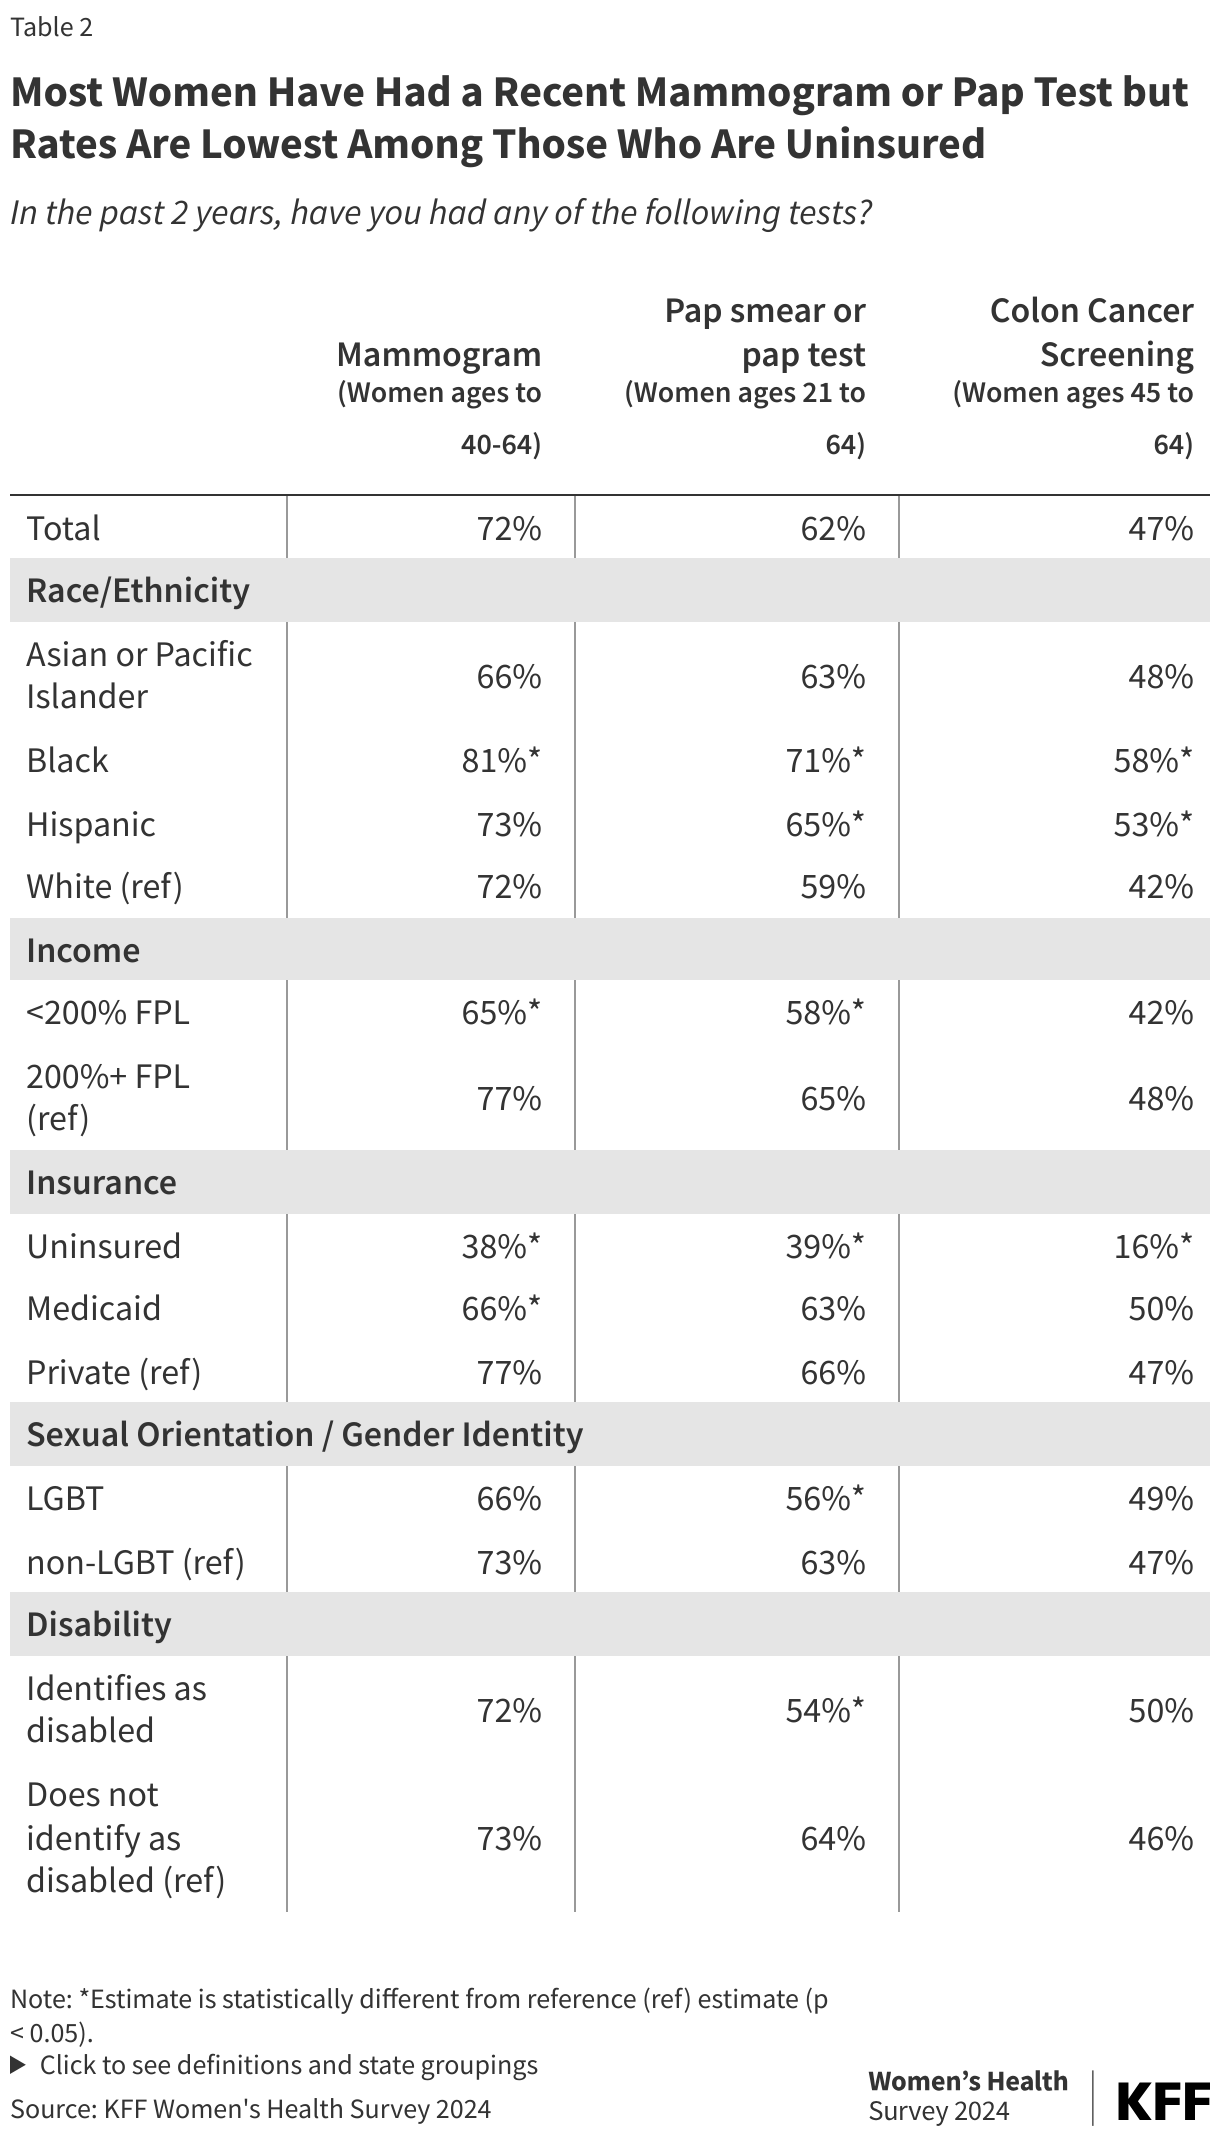
Most women ages 21-64 report that they have had a Pap smear or Pap test in the past two years for cervical cancer screening, with higher rates among Black and Hispanic women and those with higher incomes and private insurance. USPSTF and HRSA both recommend cervical cancer screenings for women ages 21 to 65, either via a pap smear or a high-risk HPV test or a combination of both every 3 to 5 years, depending on the person’s age. Six in ten women (62%) ages 21 to 64 report having had a pap smear or test in the past two years. Higher shares of Black women (71%) and Hispanic women (65%) report having had a cervical cancer screening compared to White women (59%). Women with private insurance are more likely to have had a cervical cancer screening in the past two years than women who are uninsured. Lower shares of LGBT+ women (56%) and women who identify as disabled (54%) report having had a pap smear or pap test in the past two years compared to non-LGBT+ women (63%) and women who do not identify as disabled (64%).
Fewer women ages 45 to 64 have had a recent colon cancer screening/colonoscopy in the past two years, with lower rates among the uninsured. The USPSTF recommends colon cancer screening (which can include colonoscopies, fetal occult testing, Stool DNA-FIT, or sigmoidoscopy) for all adults ages 45 to 75 every one to ten years, depending on the screening test. In 2021 the USPSTF lowered the age recommendation for starting colon cancer screenings from 50 to 45 in part due to the increasing incidence of colon cancer in younger adults. Almost half (47%) of women ages 45 to 64 report having had a recent colon cancer screening test in the past two years. A higher share of Black (58%) and Hispanic (53%) women report having had a colon cancer screening test in the past two years compared to White women (42%). Significantly higher shares of women with private coverage (47%) and women with Medicaid coverage (50%) report having had a colon cancer screening test in the past two years compared to only 16% of women who are uninsured. Because the question in this survey limits the time period to the last two years, it is likely that a larger share of women in this age group have had a colon cancer screening within the recommended timeframe for their screening test.
Despite clinical recommendations and the fact that they are covered without cost-sharing by most private plans and ACA Medicaid expansion pathways, smaller shares of women report having an HIV test or a test for other sexually transmitted infections (STIs) in the past two years (Figure 9). The USPSTF and HRSA recommend HIV testing for adolescents and adults at least once in their lifetimes, with additional screenings for those at increased risk for HIV infections. Pregnant people should also get tested for HIV during their pregnancies. The USPSTF also recommends chlamydia, gonorrhea, and syphilis screenings for sexually active women and those at increased risk of infection. Among women ages 18 to 64 who report having sex in the past 12 months, one in three report having had an HIV test (34%) or a test for other STIs such as chlamydia or gonorrhea (37%) in the past two years. Recent STI and HIV testing rates are higher among women under the age of 50, those who identify as LGBT+, Asian or Pacific Islander, Black and Hispanic women, women with lower incomes, those who identify as disabled, and women with Medicaid.
(Back to top)


 Irving Washington
  Hagere Yilma