2014 Employer Health Benefits Survey
Section Six: Worker and Employer Contributions for Premiums
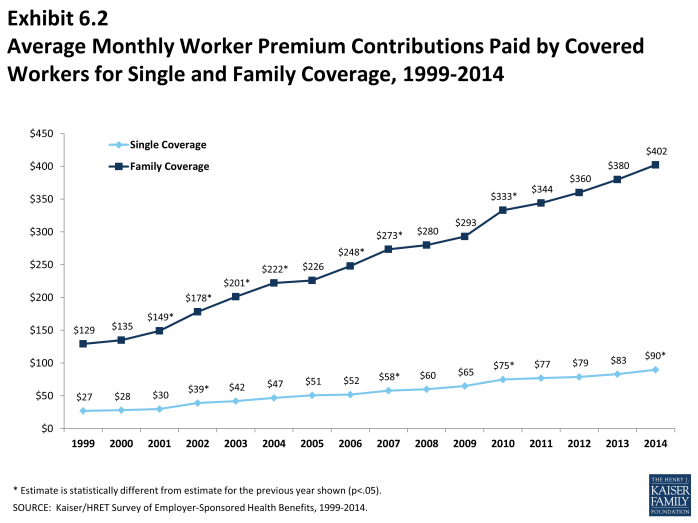
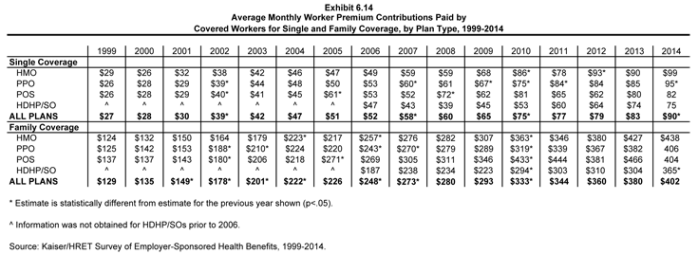
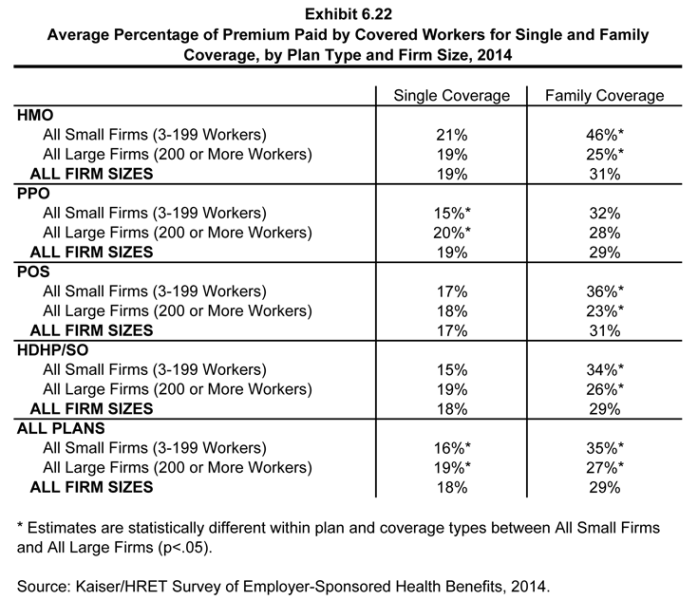
Premium contributions by covered workers average 18% for single coverage and 29% for family coverage.1 The average monthly worker contributions are $90 for single coverage ($1,081 annually) and $402 for family coverage ($4,823 annually). On average covered workers contribute a similar amount for family coverage in 2014 as they did in 2013 but more for single coverage ($90 vs. $83). There continues to be important differences by firm size; covered workers in small firms (3-199 workers) contribute a lower percentage of the premium for single coverage (16 percent versus 19 percent) but a much higher percentage of the premium for family coverage than covered workers in larger firms (35 percent versus 27 percent).
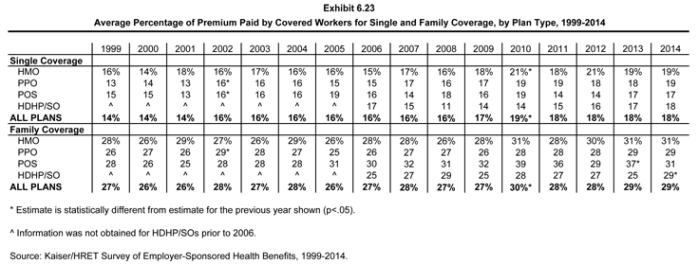
- In 2014, covered workers on average contribute 18% of the premium for single coverage and 29% of the premium for family coverage the same contribution percentages reported in 2013 (Exhibit 6.1). These contributions have remained stable since 2010 for both single and family coverage.
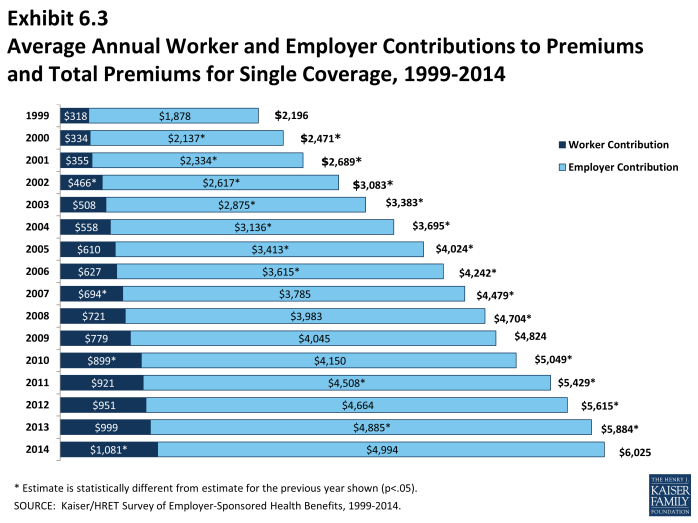
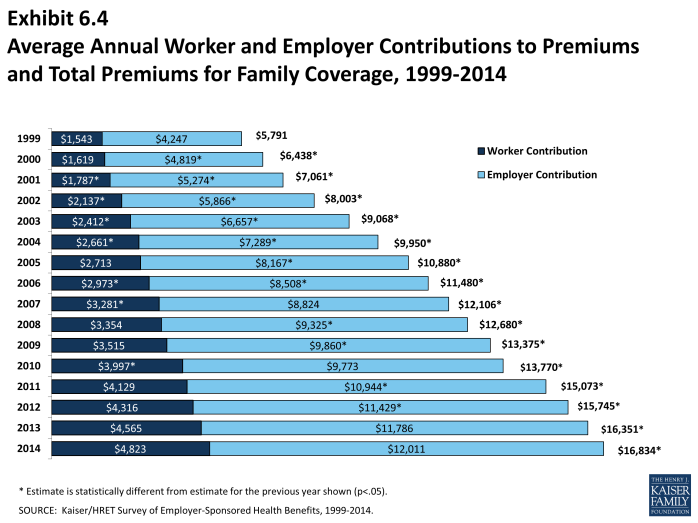
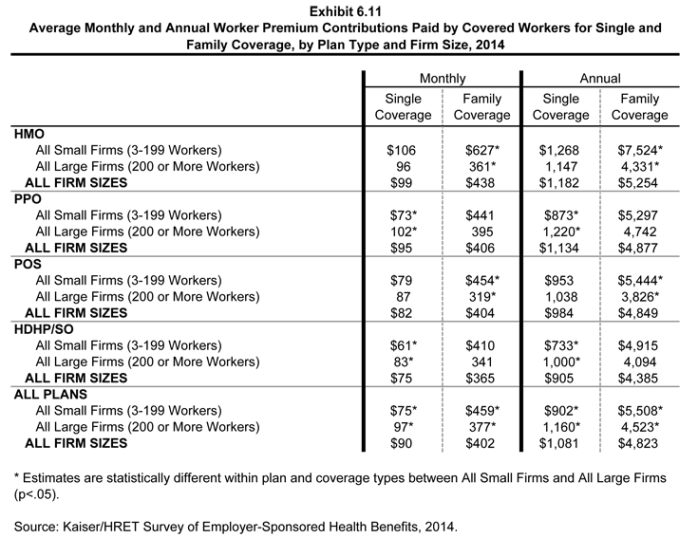
- On average, workers with single coverage contribute $90 per month ($1,081 annually), and workers with family coverage contribute $402 per month ($4,823 annually), towards their health insurance premiums, similar to the amounts reported in 2013 for family coverage, but significantly higher for single coverage (Exhibit 6.2), (Exhibit 6.3), and (Exhibit 6.4).
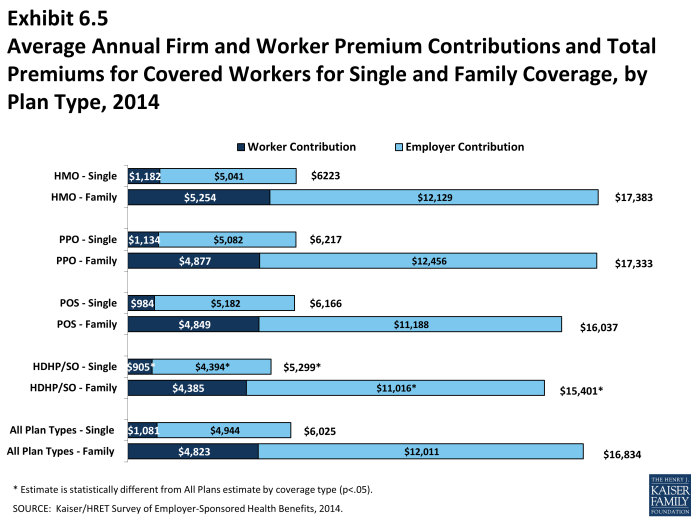
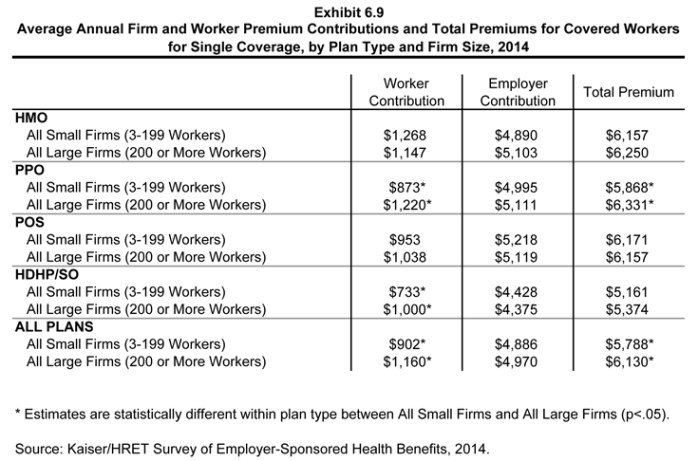
- Worker contributions in HDHP/SOs are lower than the overall average worker contributions for single coverage ($905 vs. $1,081) (Exhibit 6.5). While employers contribute less for family coverage in HDHP/SO plans, the worker contribution is similar to the overall average.
- Worker contributions in other plan types are not statistically different from the overall average for either single or family coverage (Exhibit 6.5).
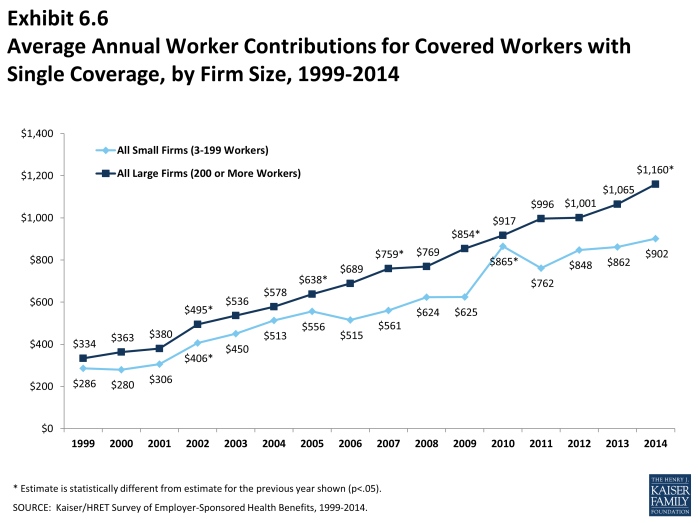
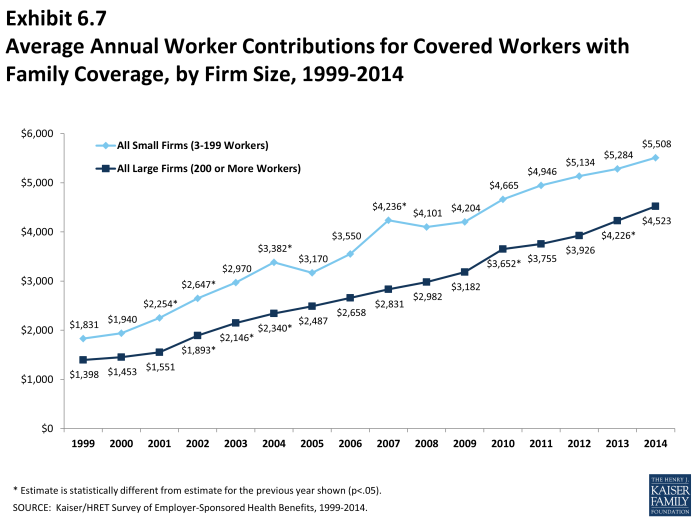
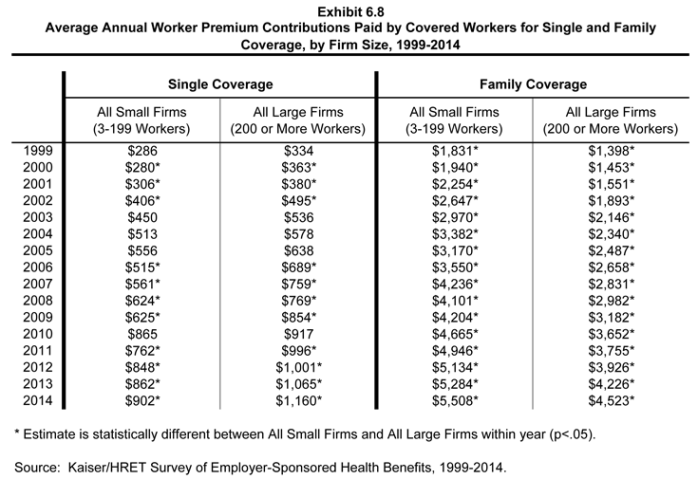
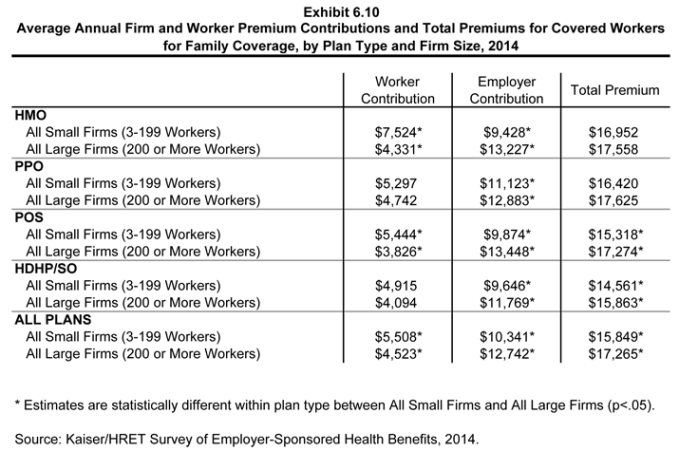
- In addition to differences between plan types, there are differences in worker contributions by type of firm. As in previous years, workers in small firms (3-199 workers) contribute a lower amount annually for single coverage than workers in large firms (200 or more workers), $902 vs. $1,160. In contrast, workers in small firms with family coverage contribute significantly more annually than workers with family coverage in large firms ($5,508 vs. $4,523) (Exhibit 6.8). One reason small firms may contribute a higher percentage for single coverage and a lower percentage for family coverage, compared to large firms, is to incentivize enrollment. Many insurers impose participation requirements on firms purchasing small-group coverage.
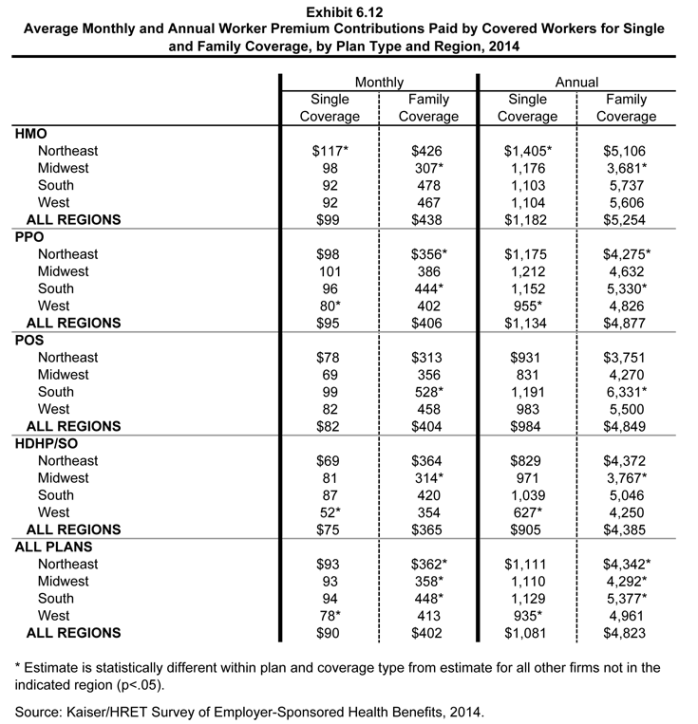
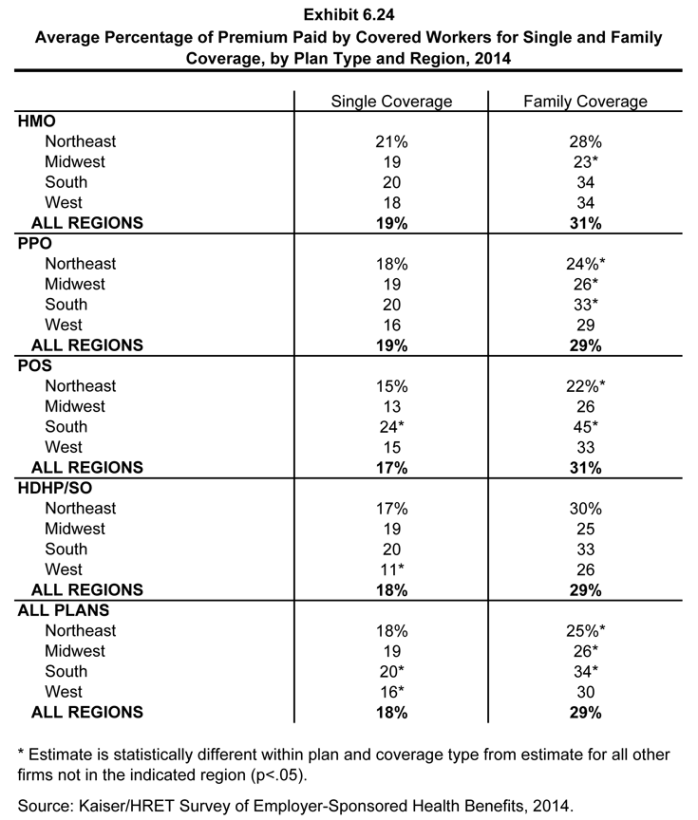
- The average worker contribution for family coverage in the South is higher than the average for covered workers in all other regions (Exhibit 6.12). The average employer contribution is higher for covered workers in large firms ($12,742 vs. $10,341) (Exhibit 6.10).
Variation in Worker Contributions to the Premium
- There is a great deal of variation in worker contributions to premiums.
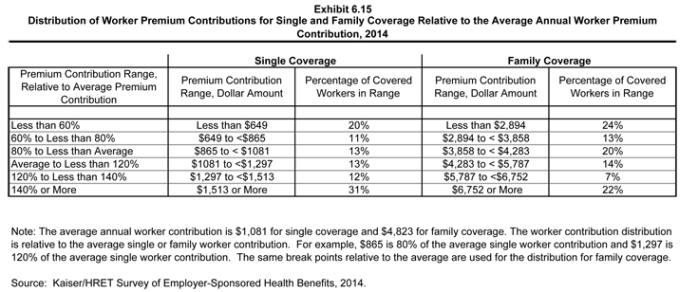
- Thirty-one percent of covered workers contribute $1,513 or more annually (140% or more of the average worker contribution) for single coverage, while 20% of covered workers have an annual worker contribution of less than $649 (less than 60% of the average worker contribution) (Exhibit 6.15).
- For family coverage, 22% of covered workers contribute $6,752 or more annually (140% or more of the average worker contribution), while 24% of covered workers have an annual worker contribution of less than $2,894 (less than 60% of the average worker contribution) (Exhibit 6.15).
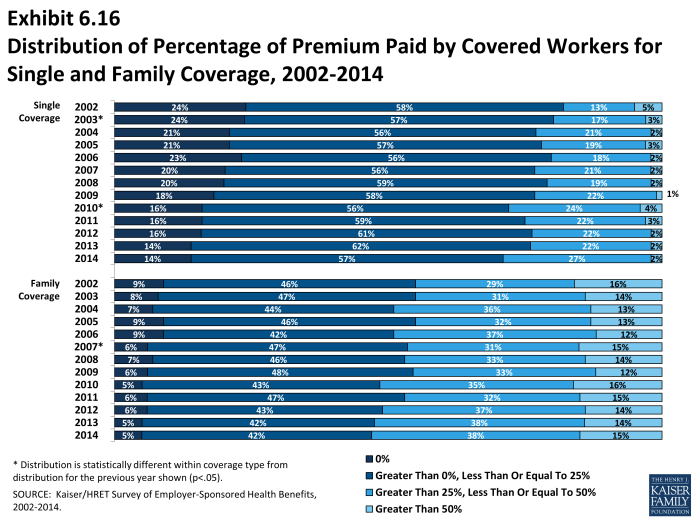
- The majority of covered workers are employed by a firm that contributes at least half of the premium for single and family coverage.
- Fourteen percent of covered workers with single coverage and 5% of covered workers with family coverage work for a firm that pays 100% of the premium (Exhibit 6.16).
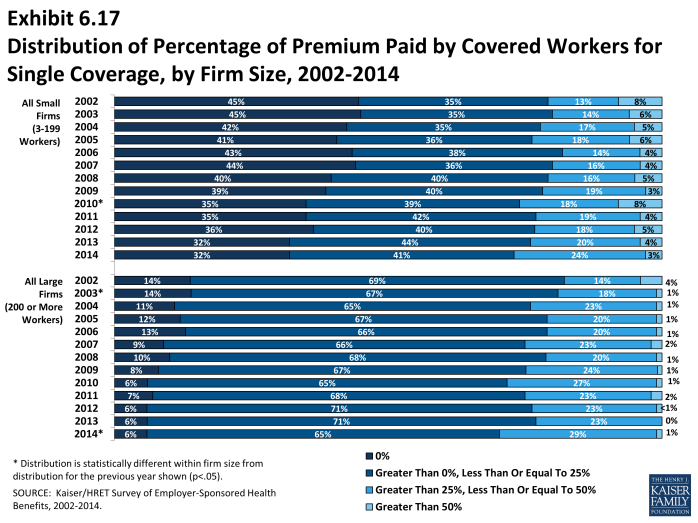
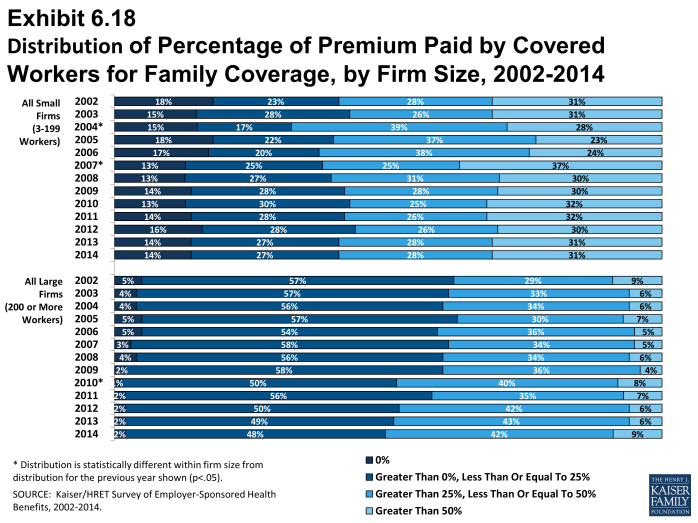
- Covered workers in small firms (3-199 workers) are more likely to work for a firm that pays 100% of the premium for single coverage than workers in large firms (200 or more workers). Thirty-two percent of covered workers in small firms have an employer that pays the full premium for single coverage, compared to 6% of covered workers in large firms (Exhibit 6.17). For family coverage, 14% of covered workers in small firms have an employer that pays the full premium, compared to 2% of covered workers in large firms (Exhibit 6.17) and (Exhibit 6.18).
- Three percent of covered workers in small firms (3-199 workers) contribute more than 50% of the premium for single coverage, compared to one percent of covered workers in large firms (200 or more workers) (Exhibit 6.17). For family coverage, 31% of covered workers in small firms work in a firm where they must contribute more than 50% of the premium, compared to 9% of covered workers in large firms (Exhibit 6.17) and (Exhibit 6.18).
Difference by Firm Characteristics
- The percentage of the premium paid by covered workers varies by several firm characteristics.
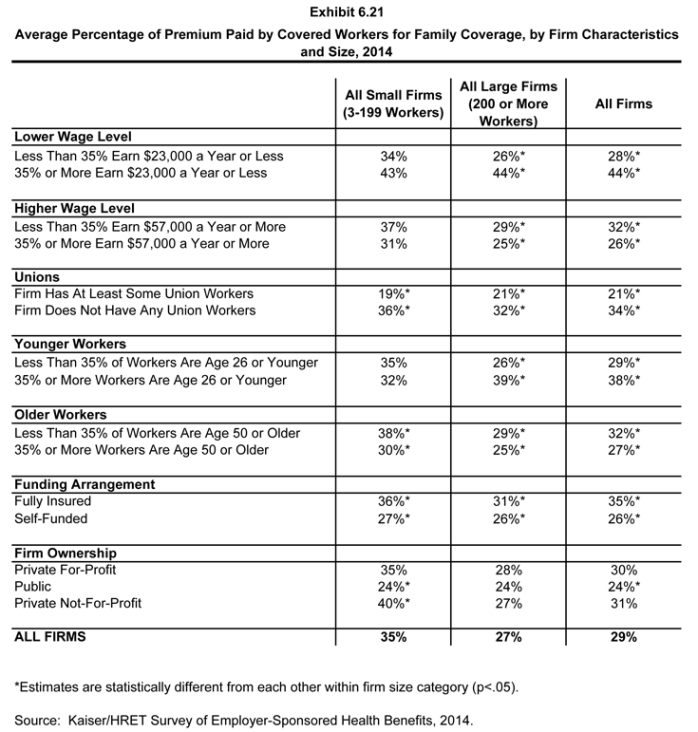
- For family coverage, covered workers in firms with many lower-wage workers (35% or more earn $23,000 or less annually) contribute a greater percentage of the premium than those in firms with fewer lower-wage workers (44% vs. 28%) (Exhibit 6.21).
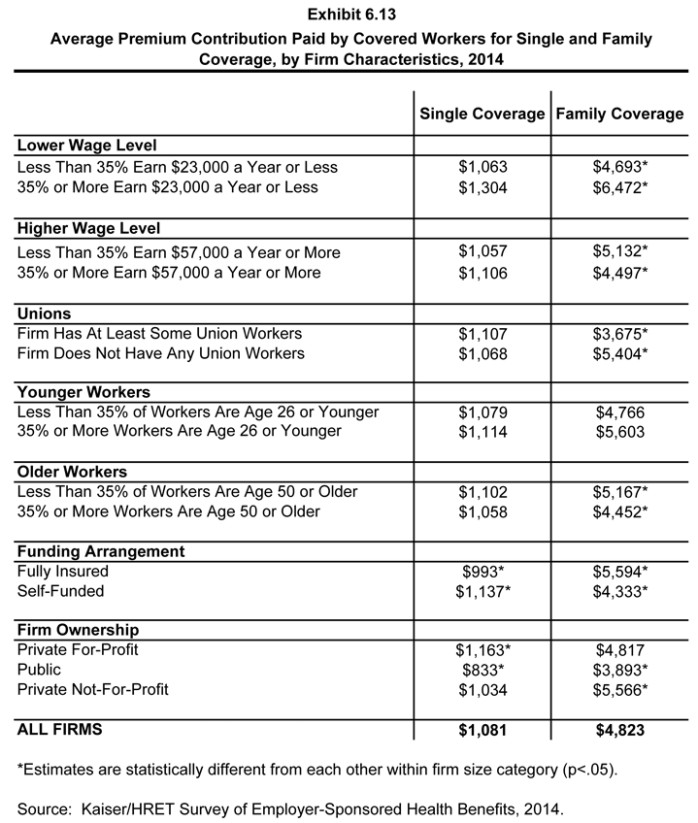
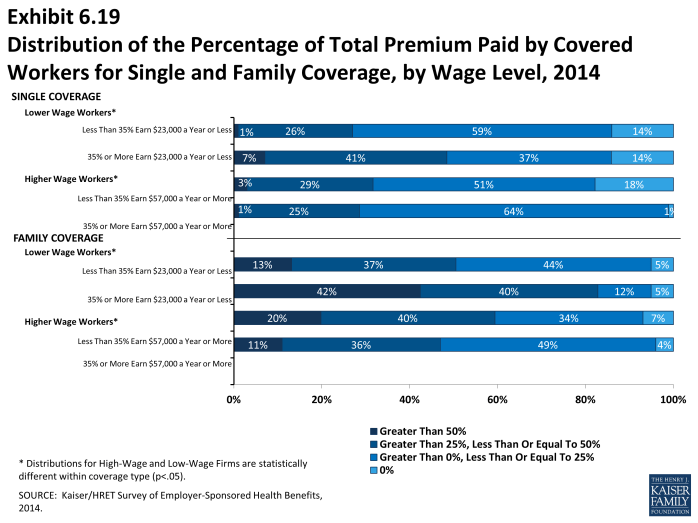
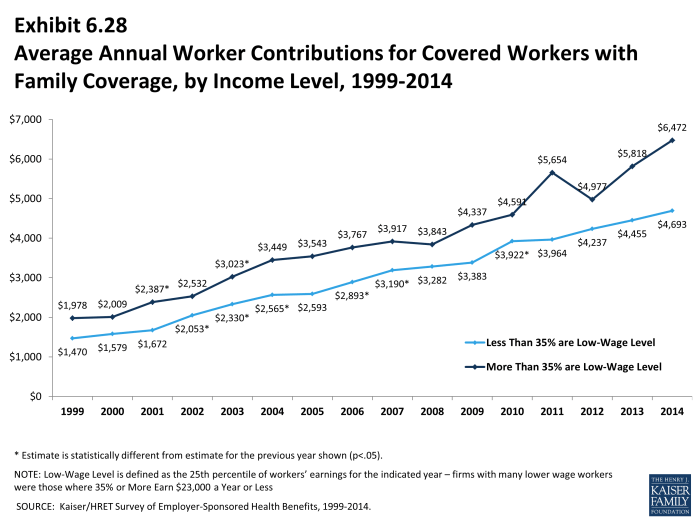
- Looking at dollar amounts, covered workers in firms with many lower-wage workers (35% or more earn $23,000 or less annually) on average contribute $6,472 for family coverage versus $4,693 for covered workers in firms with fewer lower-wage workers (Exhibit 6.13). Forty-two percent of covered workers at firms with many lower wage workers pay more than 50% of the premium for family coverage in contrast to 13% at firms with fewer lower wage workers (Exhibit 6.19).
- Covered workers with family coverage in firms that have at least some union workers contribute a significantly lower percentage of the premium than those in firms without any unionized workers (21% vs. 34%) (Exhibit 6.21).
- For workers with family coverage in large firms (200 or more workers), the average percentage contribution for workers in firms that are partially or completely self-funded is lower than the average percentage contributions for workers in firms that are fully insured (26% vs. 31%)2 (Exhibit 6.21).
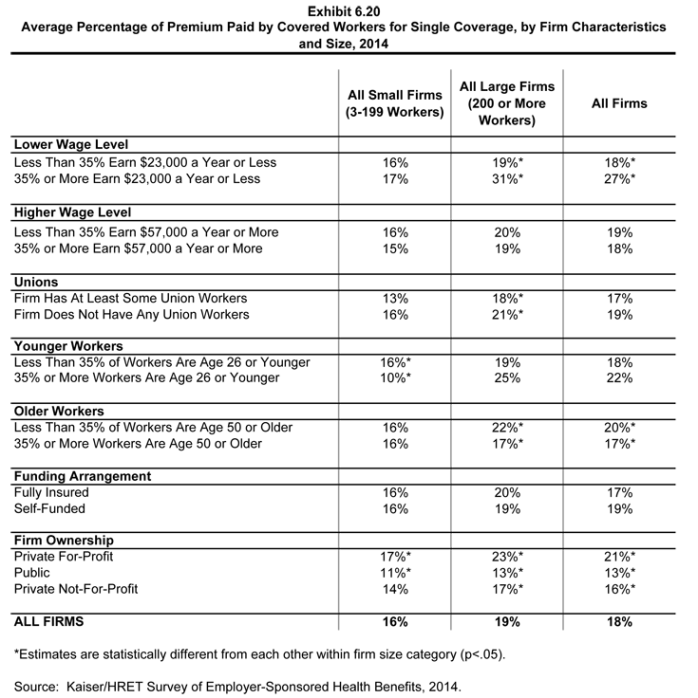
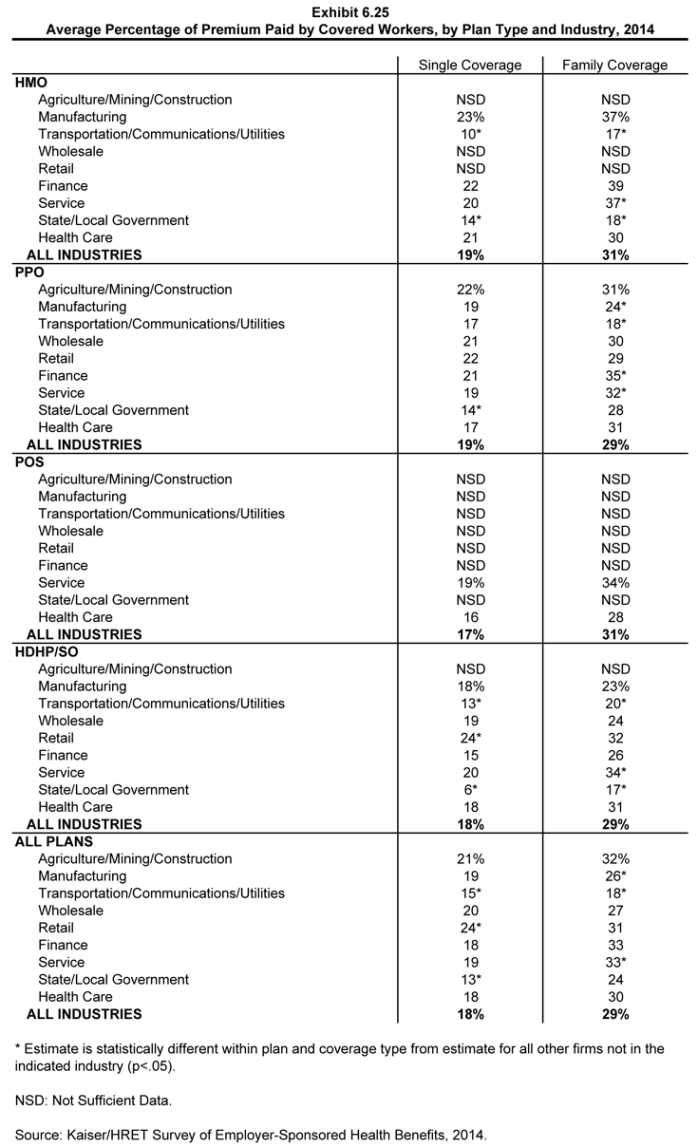
- Covered workers in private, for profit firms contribute a significantly higher percentage of the premium for single coverage (21%) than do workers in private not-for-profit firms (16%) and public organizations such as state or local governments (13%) (Exhibit 6.20).
Other Topics
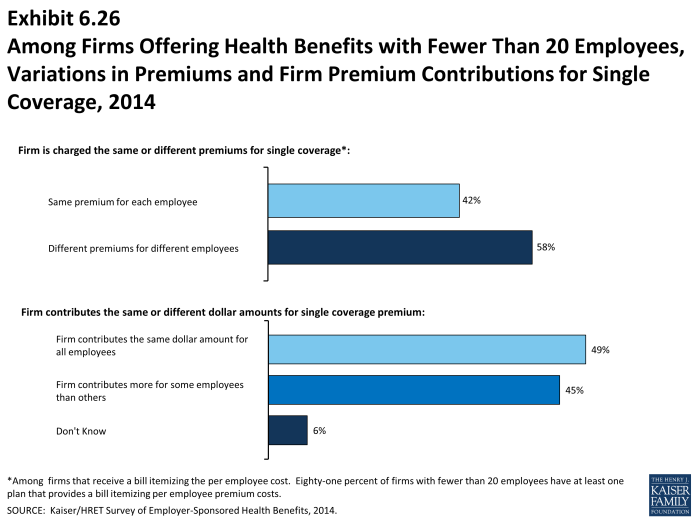
- Among firms offering health benefits with fewer than 20 employees, 45% contribute different dollar amounts toward premiums for different employees (Exhibit 6.26). Employer may contribute different amounts to different employees based for a variety of reasons, including workers’ age, smoking status, seniority, job title or location.
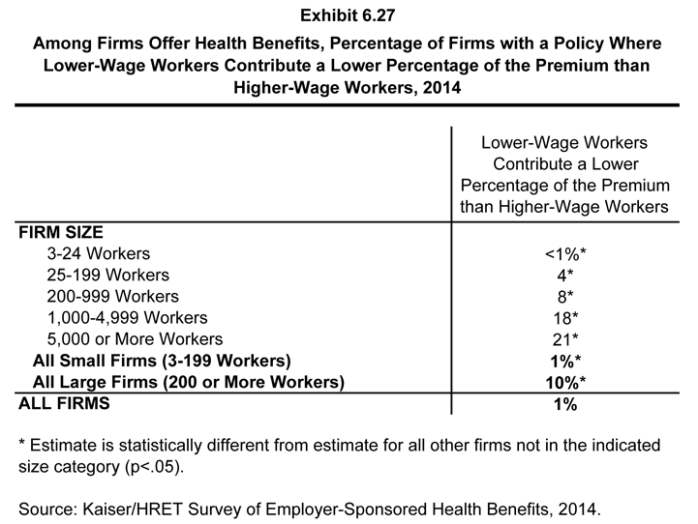
- Among firms offering health benefits, one percent of small firms (3 to 199 workers) and 10% of larger firms have a policy where lower wage workers contribute a lower percentage of the premium than higher wage workers (Exhibit 6.27).
Changes over Time
- The amount which workers contribute to single coverage premiums has increased 94% since 2004 and 39% since 2009. Covered workers’ contributions to family coverage have increased 81% since 2004 and 37% since 2009. Over the last five years the average worker contribution for single and family coverage has risen at a similar rate.
- Over the last ten years the average worker contribution for family coverage has risen faster for large firms (200 or more workers) than smaller firms (63% vs. 93%). The average worker contribution for family coverage has risen at a similar rate for firms with many low income workers (35% or more earn $23,000 or less annually) and those with fewer low income workers over the past ten years.


