The Landscape of School-Based Mental Health Services

Published: Sep 11, 2025

Editorial Note

This analysis, originally published on September 6, 2022, was updated on September 11, 2025 to incorporate the latest developments and data.

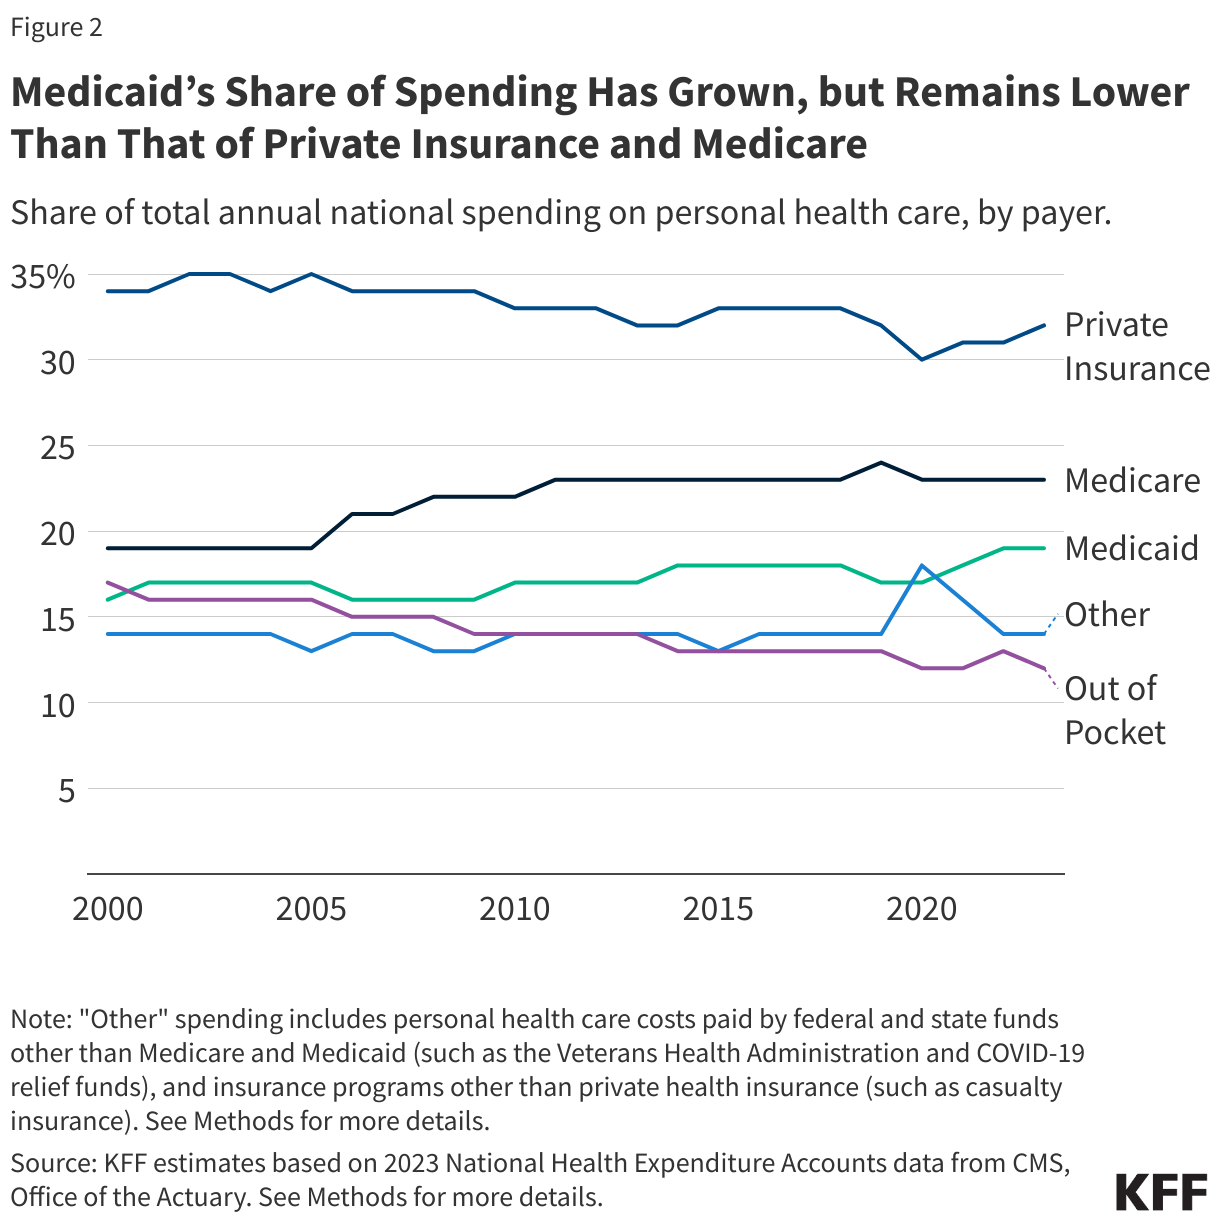
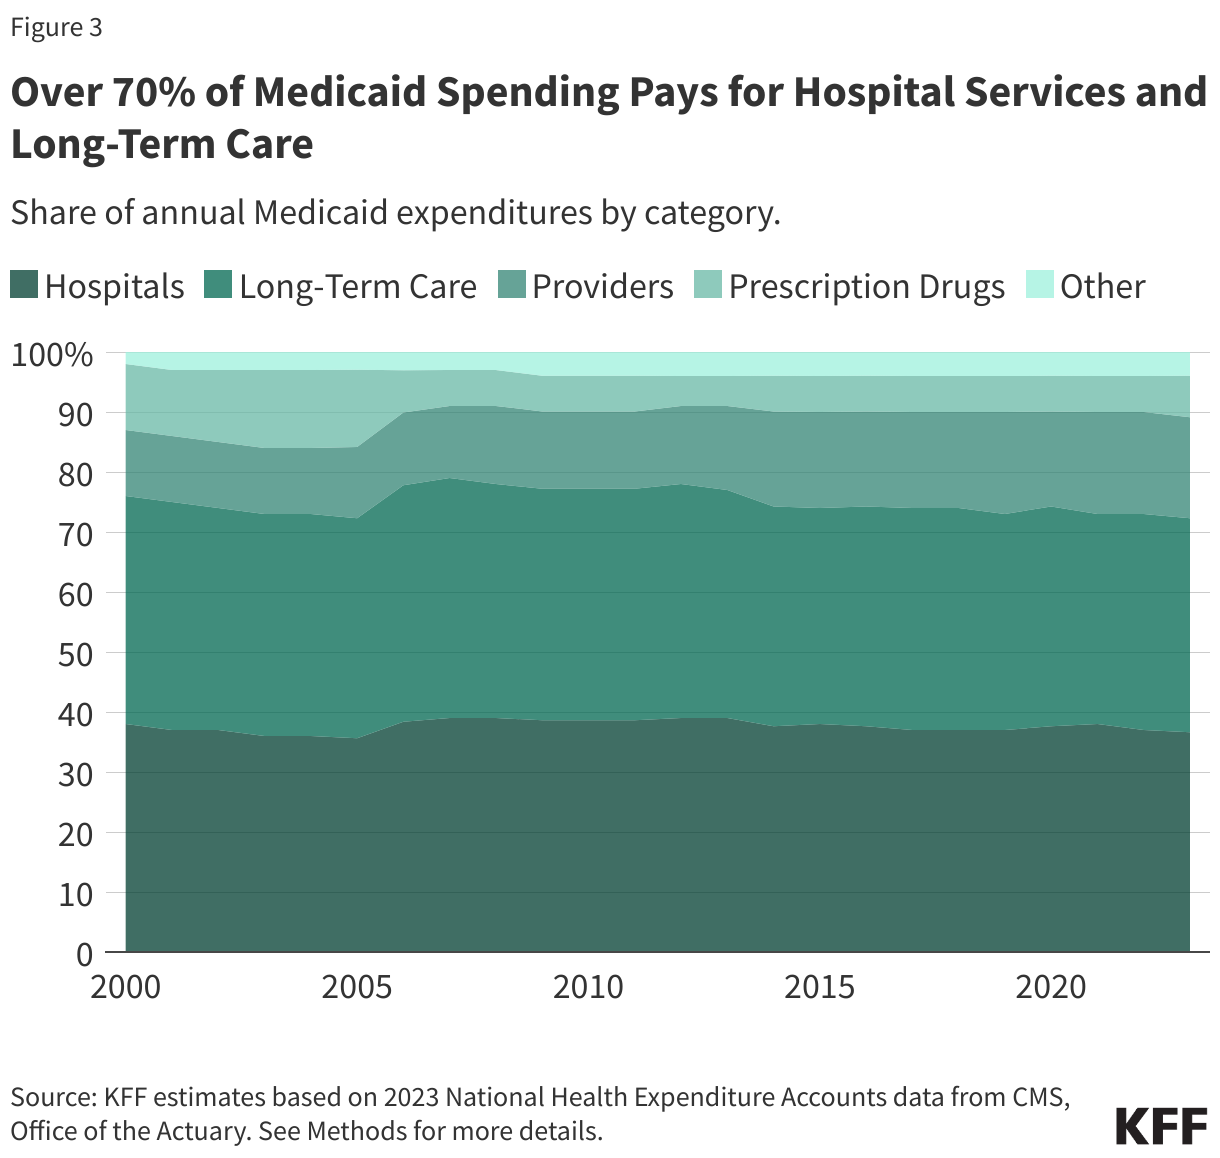
Nearly one in five students attending public schools in the United States utilize school-based mental health services, underscoring how schools can serve as an access point for mental health treatment among youth. Federal policy measures, including the Bipartisan Safer Communities Act, the American Rescue Plan Act, and changes to Medicaid guidance, provided pathways to expanding and improving access to school-based services. However, recent actions – such as cuts to the Department of Education, the freezing of $1 billion allocated for school-based mental health services, and major reductions to Medicaid – may cause disruptions. Some school programs have already reported concerns with providing mental health services in the wake of these recent actions, including programs in New York, North Carolina, and Texas. These disruptions come at a time when approximately 1 in 5 teens are experiencing symptoms of anxiety or depression and many youth have reported bullying and exposure to violence, which can have adverse effects on their mental health. Additionally, a 2024 KFF survey found differences in receipt of mental health care services by race and ethnicity, with a larger share of White parents compared to Black, Hispanic, and Asian parents reporting that their children received these services in the past three years.  

This issue brief explores the landscape of mental health services, including services offered, utilization, barriers, and funding, and how recent federal actions may affect school-based mental health care. This analysis draws upon survey data collected directly from public school administrators via the School Pulse Panel,1 a study by the National Center for Education Statistics and the U.S. Census Bureau that surveys schools monthly on a variety of topics, including school mental health services. Key Findings include:

  • In the 2024-2025 school year, 18% of students utilized school-based mental health services.
  • About one-third of schools reported they strongly (11%) or moderately disagreed (25%) that they could effectively provide mental health services. Barriers to providing mental health care services to students include funding and mental health provider shortages.
  • Ninety-seven percent of schools provide at least one mental health service to students. In recent years, larger shares of these schools provide services via telehealth, and provide group-based and family interventions.
  • Seventy percent of public schools that provide mental health services had a school or district-employed licensed mental health professional on staff and 57% employed an external mental health provider.
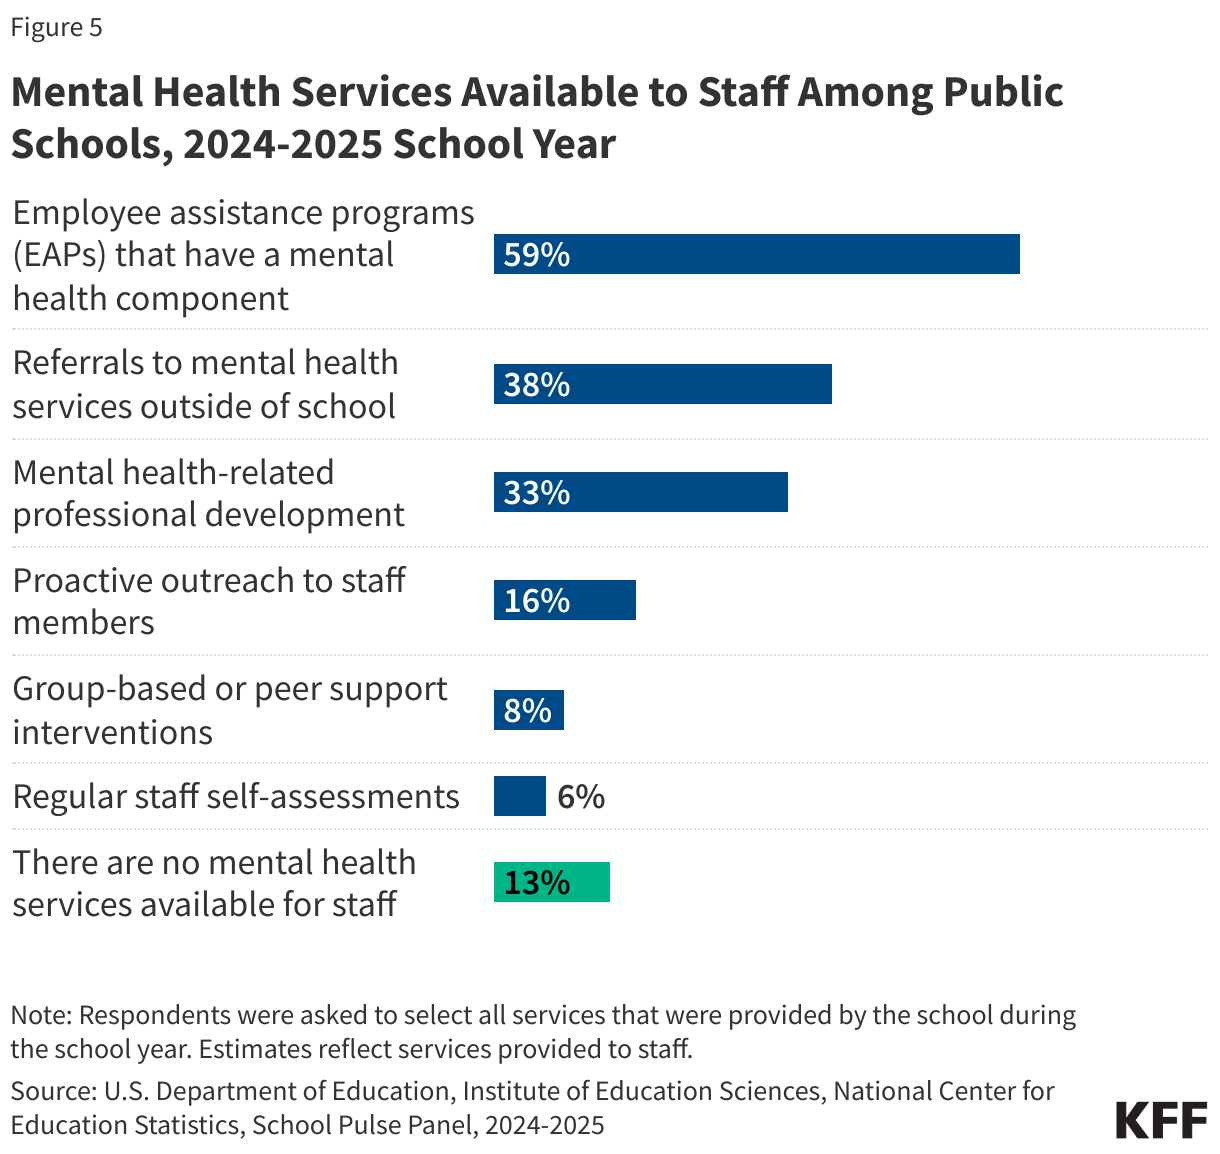
  • Thirteen percent of schools did not have mental health services available for staff in the 2024-2025 school year.

Background

School-based mental health services can improve access to care, allow for early identification and treatment of mental health issues, and may be linked to reduced absenteeism and better mental health and substance use outcomes. School-based services can also reduce access barriers for underserved populations, including children from low-income households and children of color.

The delivery of mental health services in schools has evolved over time and continues to vary across schools. Some students access in-person mental health services at schools or near campus while others access services through telehealth. Service delivery can range from a single provider (who is not necessarily a licensed mental health professional) to a team of providers, including psychologists, social workers, and academic or guidance counselors. A growing number of schools have also integrated social and emotional learning and other mental health literacy programs into their curriculum.

Schools receive support for providing mental health services in several ways. This includes support at the federal level through the Department of Education and the Department of Health and Human Services. A recent federal measure, the Bipartisan Safer Communities Act (BSCA) of 2022, included provisions to support and expand school-based mental health services, such as $1 billion to increase the number of mental health providers in schools and provide training. However, in April 2025, under the Trump Administration, the Department of Education announced the cancellation of these funds. Additionally, President Trump signed an executive order in March 2025 to dismantle the Department of Education, an entity which has developed guidance regarding school-based health services in partnership with Medicaid and provides resources and grants to support mental health, anti-bullying, and trauma-prevention interventions in schools.

Schools can also receive support through Medicaid, including reimbursement for medically necessary services that are part of a student’s Individualized Education Plan (IEP), reimbursement for eligible health services for students with Medicaid coverage and for some administrative services. In 2022 and 2023, CMS issued guidance to increase the accessibility of these services by eliminating some of the practical barriers that schools faced when delivering services through Medicaid. However, significant changes to Medicaid, including budget cuts, in the reconciliation bill passed in July 2025 may impact how Medicaid can support school services in the future. In 2023, nearly four in ten children in the U.S. had Medicaid coverage.

What Share of Students Utilize School-Based Mental Health Services?

In the 2024-2025 school year, public schools reported that on average 18% of students utilized school-based mental health services. Additionally, 58% of schools reported that the number of students who sought school-based mental health services increased since the prior school year. Similarly, there was a 61% increase from the 2023-2024 school year to the 2024-2025 school year in concerns expressed by staff about students exhibiting depression, anxiety, trauma, or emotional dysregulation/disturbance.

What Have Schools Said About Their Ability To Provide Mental Health Services To Students?

In the 2024-2025 school year, approximately half of public schools reported they could effectively provide mental health services to all students in need. This includes 10% of schools that say they strongly agree they could effectively provide mental health service and 42% that moderately agreed. Meanwhile, about one-third of schools reported they strongly (11%) or moderately disagreed (25%) that they could effectively provide mental health services and 11% neither agreed or disagreed. These shares have remained mostly similar since survey data collection began in the 2021-2022 school year.

Among the schools that did not strongly believe they could effectively provide mental health services to students in need, inadequate funding and mental health provider shortages have remained the most frequently reported limitations since the 2021-2022 school year (Figure 1).

Interactive DataWrapper Embed

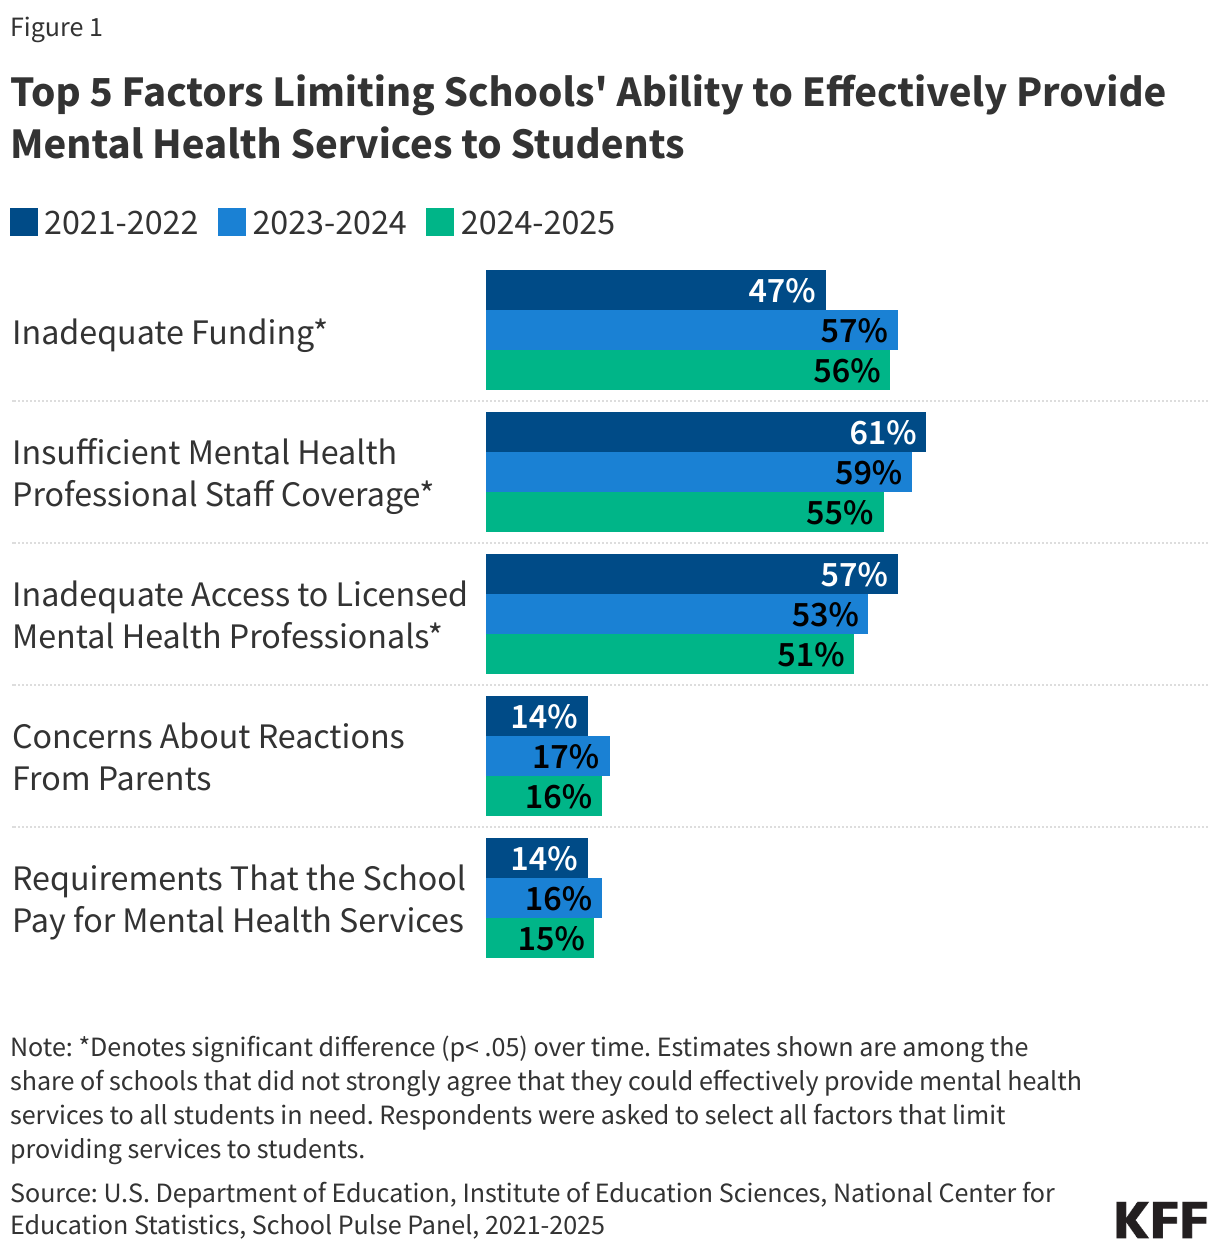
However, the share reporting inadequate funding has increased over time (from 47% in 2021-2022 to 56% in 2024-2025), while the share reporting insufficient mental health staff coverage and access to licensed professionals has slightly decreased over the same period (from 61% to 55% and from 57% to 51%, respectively). These changes may reflect recent federal efforts to increase the number of school mental health professionals but also the end of federal pandemic-era funds. Further, many schools continue to not meet recommended ratios for psychologists to students (500:1) or counselors to students (250:1). Among schools with staffing vacancies in the 2024-2025 school year, 28% of public school administrators feel they are understaffed with mental health providers.

What Mental Health Services Are Offered to Students?

In the 2024-2025 school year, 97% of public schools reported offering at least one type of mental health service to their students. As shown in Figure 2, the most frequently offered services are:

  • Individual-based intervention like one-on-one counseling or therapy (83% of public schools)
  • Case management or coordinating mental health services (70%), and
  • Referrals for care outside of the school (67%).

The use of telehealth to deliver mental health treatment has increased from 17% to 22% between the 2021-2022 and 2024-2025 school years. While telehealth became a more widely used pathway to delivering health care since the pandemic, a growing number of schools were already providing care through telehealth prior to the pandemic.

Group-based interventions increased between the 2021-2022 and 2024-2025 school year (from 56% to 65%), as well as family interventions (from 38% to 43%).

Interactive DataWrapper Embed

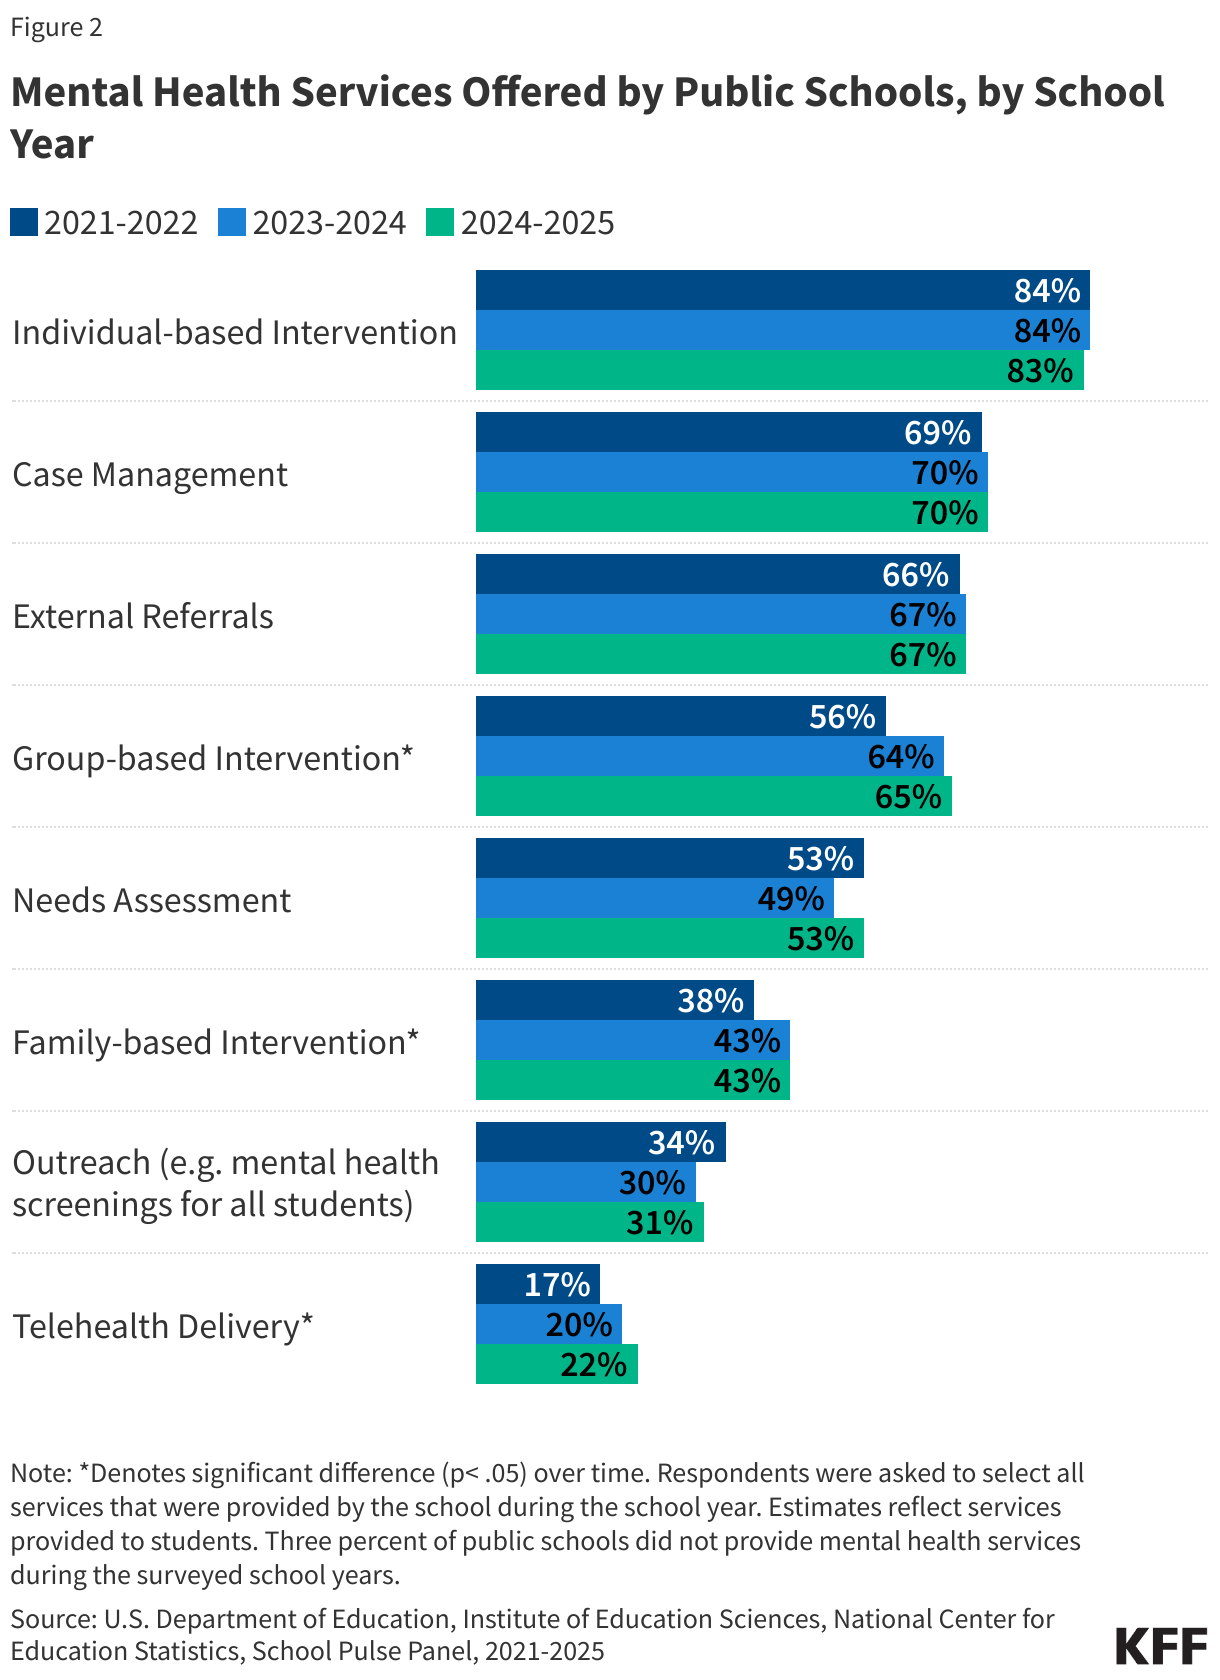
Only about one-third of schools provide outreach services, which includes mental health screenings for all students. These universal behavioral health screenings are considered a best practice and allow for schools to better identify all students with needs and tailor services to their specific student population. However, many schools do not offer these screenings often due to a lack of resources or difficulty accessing providers to conduct screenings, burden of collecting and maintaining data, and/or a lack of buy-in from school administrators.

Who Provides Mental Health Services in Schools?

Staffing models for school-based mental health care can vary across schools. In the 2024-2025 academic year, 76% of public schools that provide mental health services had two or more types of mental health providers while 24% have one type of provider. In the same year, 70% of these public schools had a school or district-employed licensed mental health professional on staff and 57% had an external mental health provider (Figure 3).

Interactive DataWrapper Embed

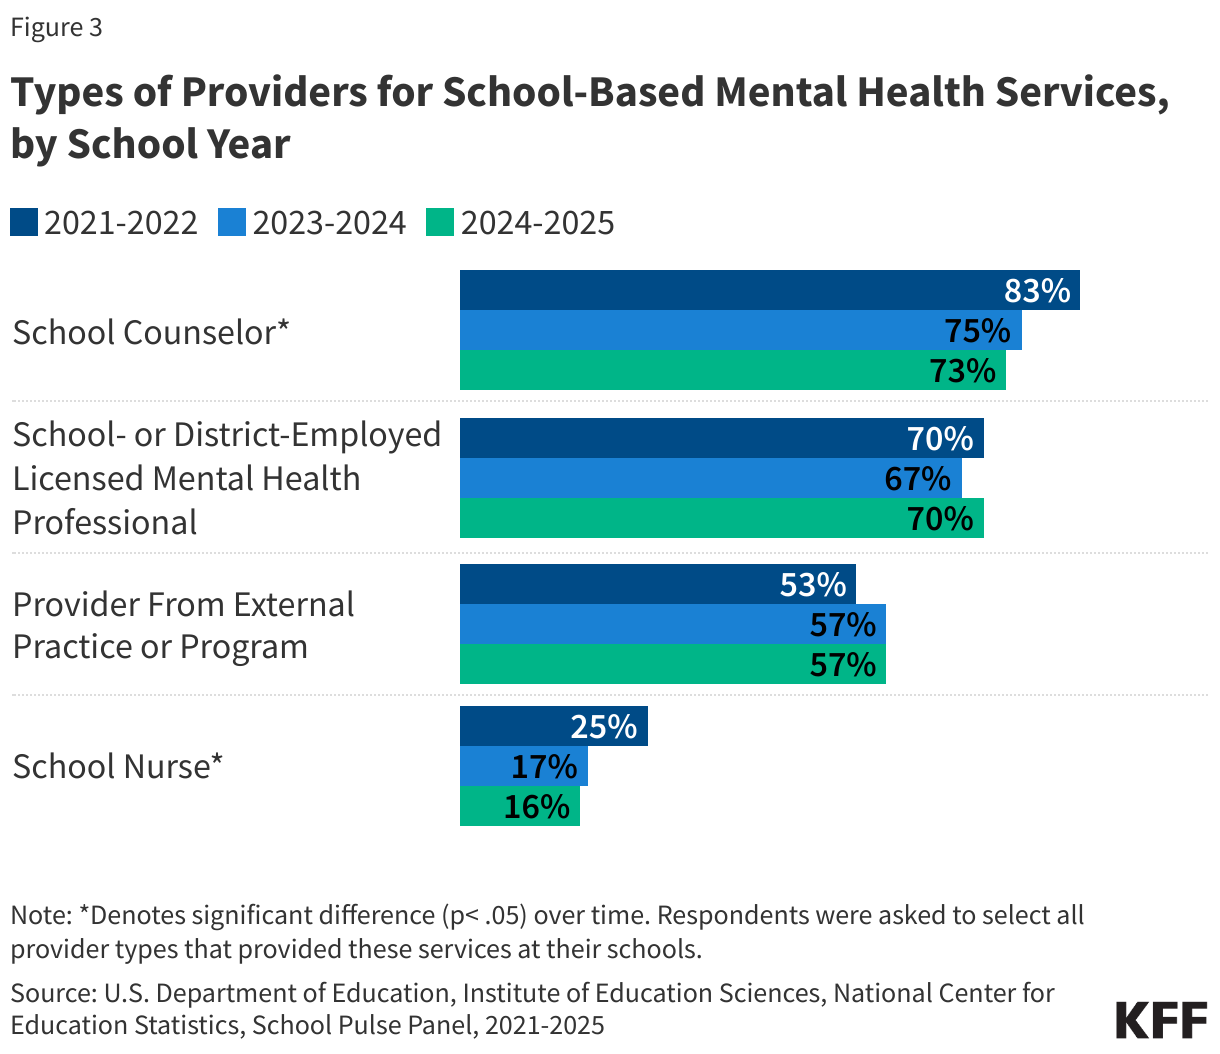
Between the 2021-2022 and 2024-2025 school years, there was a decrease in the share of public schools reporting that school counselors (from 83% to 73%) or school nurses (from 25% to 16%) provided mental health services to students (Figure 3). These decreases may be reflective of schools expanding their mental health teams in recent years so that they are less reliant on general counselors and medical staff. While general or academic school counselors can provide mental health services to students, they are not equipped to offer long-term care.

Teachers often play a role in identifying students with mental health needs and linking them to care, although prior research suggests  that many teachers may not be adequately trained to do so. In the 2024-2025 school year, 61% of schools reported providing trainings and professional development to staff in order to help them support the emotional and mental health of school students. Data on the impact of these trainings is unavailable and it is unclear what share of schools provided trainings in the years prior.

How Do Schools Receive Funding For The Mental Health Services They Provide?

School mental health services are supported through multiple sources of funding at the national, state, and local level. In recent years, a growing share of public schools reported receiving funding for mental health services from district or school funds (from 58% in 2021-2022 to 65% in 2024-2025) or partnerships with organizations (from 38% in 2021-2022 to 44% in 2024-2025) (Figure 4). Note that the School Pulse Panel survey questionnaire does not specify which funds are from Medicaid.

Interactive DataWrapper Embed

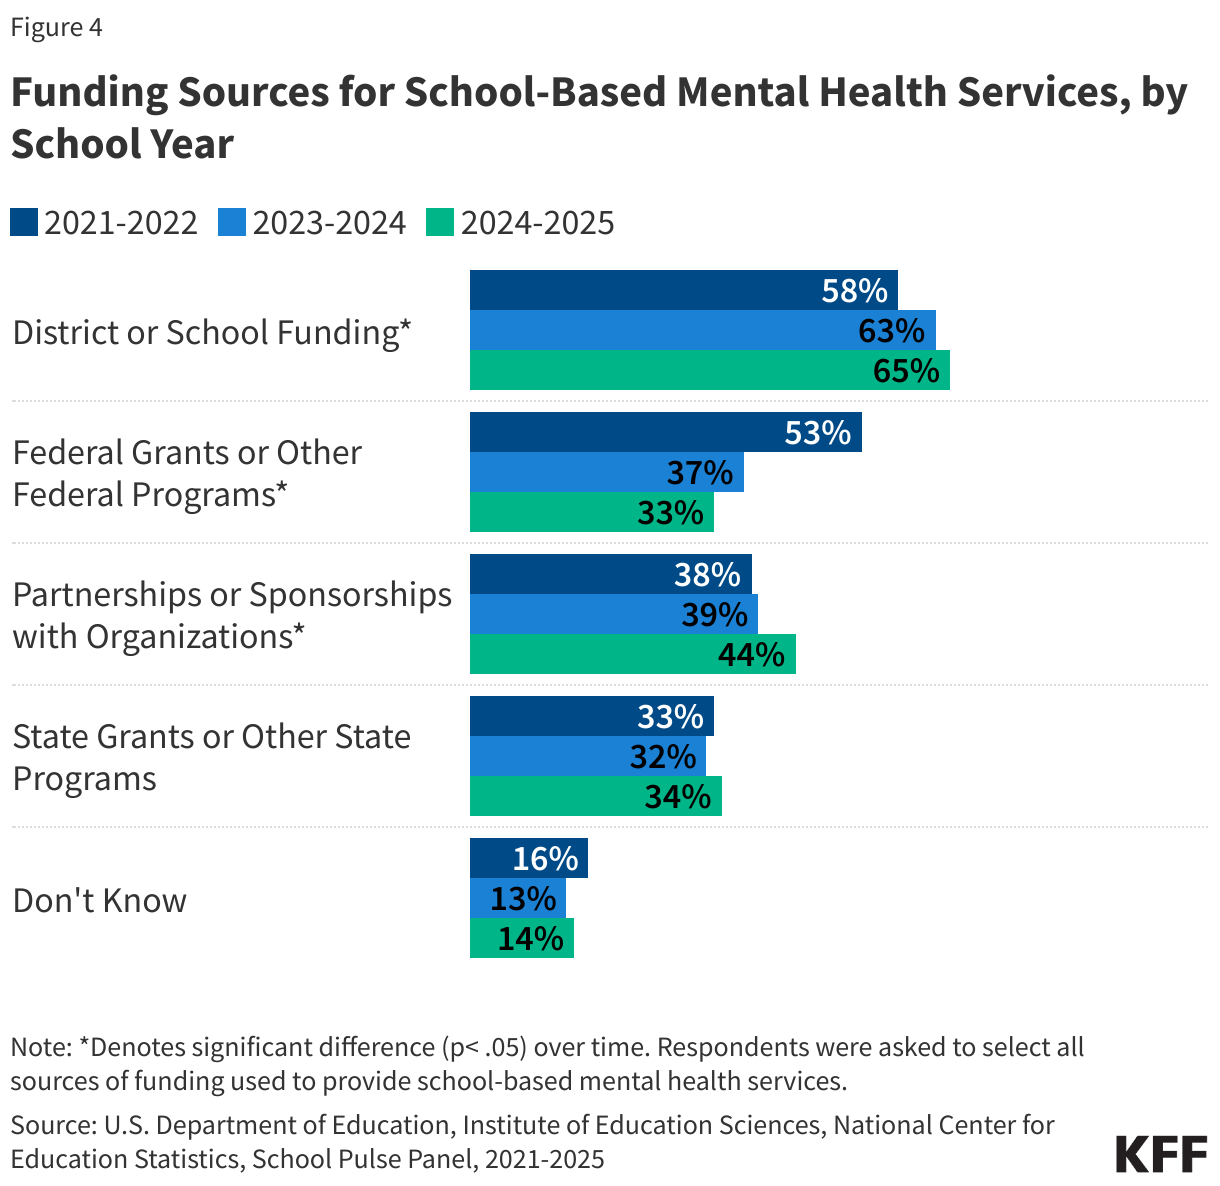
The share of public schools receiving funding from federal grants or programs has decreased from 53% in 2021-2022 to 33% in 2024-2025. This change may be due to the cessation of pandemic-era relief funds, like the Elementary and Secondary School Emergency Relief (ESSER) funds, which provided schools with the financial resources to address increasing concerns about student mental health. In 2022, the Bipartisan Safer Communities Act allowed for new funding sources to support school-based mental health services, however the Trump Administration froze $1 billion in funding in 2025. 

What Mental Health Services Are Available For Staff?

Teachers and other school staff play a multitude of roles, including monitoring students’ mental health and providing support as needed. Burnout, driven by anxiety, depression, and low job satisfaction is prevalent among teachers. In the 2024-2025 academic year, 36% of staff reported that they have seen an increase in staff expressing concerns about themselves or their colleagues showing signs of depression, anxiety, emotional dysregulation or trauma since the prior school year. While many schools offer mental health services for staff, 13% of schools do not (Figure 5).

Interactive DataWrapper Embed

Sasha Zitter, formerly with KFF, contributed to this analysis.

  1. The School Pulse Panel utilizes a random stratified sample of the Common Core of Data, a universe of public schools. This stratified sample includes public and public charter schools, schools with magnet programs, alternative schools, special education schools, and vocational schools. Approximately 4,000 schools were included in the sample for the 2024-2025 school year. Approximately 1,600 schools responded to the March survey – findings from this survey are included in this brief. There has been some variation in the number of schools that respond each month. While school principals are the initial point of contact to complete the survey, they may invite other school and district staff to assist with completion. Published data is weighted and adjusted to account for non-response. ↩︎

KFF Global Health Budget Summaries

Published: Sep 11, 2025

These global health budget summaries highlight key information about global health funding levels throughout the federal budget and appropriations process.

FY 2026

Senate:

August 4, 2025

House:

September 11, 2025

July 23, 2025

Request:

Administration Releases Additional Details of Fiscal Year 2026 Budget Request

June 4, 2025

White House Releases FY26 Budget Request

May 2, 2025

FY 2025

Final:

Congress passes Full-Year Continuing Resolution Bill, maintaining global health funding at prior year levels

March 18, 2025

Senate:

August 5, 2024

August 5, 2024

House:

July 9, 2024

House Appropriations Committee Approves the FY 2025 State and Foreign Operations (SFOPs) Appropriations Bill

June 12, 2024

Request:

Global Health Funding in the FY 2025 President’s Budget Request

March 12, 2024

FY 2024

Omnibus:

Global Health Funding in the FY 2024 Final Appropriations Bill

March 22, 2024

Senate:

July 28, 2023

July 21, 2023

House:

November 3, 2023

House Approves the FY 2024 State and Foreign Operations (SFOPs) Appropriations Bill

September 28, 2023

Request:

Global Health Funding in the FY 2024 President’s Budget Request

March 10, 2023

FY 2023

Omnibus:

Global Health Funding in the FY 2023 Omnibus

December 20, 2022

Senate:

Senate Appropriations Committee Releases FY23 State and Foreign Operations (SFOPs) and Labor, Health and Human Services (Labor HHS) Appropriations Bills

July 29, 2022

House:

June 29, 2022

House Appropriations Committee Releases the FY23 State and Foreign Operations (SFOPs) Appropriations Bill

June 28, 2022

Request:

White House Releases FY 2023 Budget Request

March 29, 2022

FY 2022

Omnibus:

Global Health Funding in the FY 2022 Omnibus

March 9, 2022

Senate:

Senate Appropriations Committee Releases FY 2022 State and Foreign Operations (SFOPs) and Labor Health and Human Services (Labor HHS) Appropriations Bills

October 20, 2021

House:

July 14, 2021

House Appropriations Committee Releases the FY22 State and Foreign Operations (SFOPs) Appropriations Bill

June 30, 2021

Request:

White House Releases Full FY 2022 Budget Request

June 2, 2021

FY 2021

Omnibus:

Global Health Funding in the FY 2021 Omnibus

January 8, 2021

Senate:

Senate Appropriations Committee Releases FY 2021 State and Foreign Operations (SFOPs) and Labor Health and Human Services (Labor HHS) Appropriations Bills

November 11, 2020

House:

House Appropriations Committee Approves FY 2021 Health and Human Services (HHS) Appropriations Bill

July 14, 2020

House Appropriations Committee Approves FY21 State and Foreign Operations (SFOPs) Appropriations Bill

July 9, 2020

Request:

White House Releases FY21 Budget Request

February 11, 2020

FY 2020

Omnibus:

Global Health Funding in the FY 2020 Conference Agreement

December 19, 2019

Senate:

Senate Appropriations Committee Approves FY 2020 State and Foreign Operations (SFOPs) Appropriations Bill

September 27, 2019

Senate Appropriations Committee Releases Draft FY 2020 Health and Human Services (HHS) Appropriations Bill

September 20, 2019

House:

House Passes Minibus That Includes Global Health Funding In FY 2020 State & Foreign Operations (SFOPs) and Health & Human Services (HHS)

June 20, 2019

House Appropriations Committee Approves FY 2020 State & Foreign Operations (SFOPs) Appropriations Bill

May 17, 2019

House Appropriations Committee Approves FY 2020 Health and Human Services (HHS) Appropriations Bill

May 13, 2019

Request:

White House Releases FY20 Budget Request

March 11, 2019

FY 2019

Omnibus:

FY19 Conference Agreement Released, Includes State & Foreign Operations (SFOPs) Funding

February 14, 2019

Senate:

Senate Appropriations Committee approves FY19 State & Foreign Operations (SFOPs) Appropriations Bill

June 22, 2018

House:

House Appropriations Committee approves FY19 State and Foreign Operations (SFOPs) Appropriations Bill

June 20, 2018

Request:

White House Releases FY 2019 Budget Request

February 13, 2018

FY 2018

Omnibus:

President Signs FY18 Omnibus Bill

March 22, 2018

Senate:

Senate Appropriations Committee approves FY 2018 State & Foreign Operations (SFOPs) and Health & Human Services (HHS) Appropriations Bills

September 11, 2017

House:

House Appropriations Subcommittees approve FY 2018 State & Foreign Operations (SFOPs) and Health & Human Services (HHS) Appropriations Bills

July 19, 2017

Request:

White House Releases FY18 Budget Request

May 24, 2017

U.S. Global Health Funding in Draft FY18 Budget Request

April 26, 2017

White House Releases FY18 Budget Blueprint

March 16, 2017

FY 2017

Omnibus:

Congress Releases FY17 Omnibus

May 1, 2017

House:

House Appropriations Committee approves FY 2017 State and Foreign Operations Appropriations Bill

July 13, 2016

Senate:

Senate Appropriations Committee approves FY 2017 State and Foreign Operations Appropriations Bill

June 30, 2016

Request:

White House Submits FY17 Reduction Options to Congress

March 29, 2017

White House Releases FY17 Budget Request

February 9, 2016

FY 2016

Omnibus:

Congress Releases FY16 Omnibus

December 16, 2015

Senate:

Senate Appropriations Subcommittee Approves FY 2016 State and Foreign Operations Appropriations Bill

July 8, 2015

House:

Updated: House Appropriations Committee releases FY16 Health & Human Services Appropriations Bill

June 24, 2015

House Appropriations Committee releases FY 2016 State and Foreign Operations Appropriations Bill

June 11, 2015

Request:

The U.S. Global Health Budget: Analysis of the Fiscal Year 2016 Budget Request

March 11, 2015

White House Releases FY16 Budget Request

February 2, 2015

FY 2015

Omnibus:

Congress Releases FY15 Omnibus

December 10, 2014

House:

FY15 Health & Human Services Appropriations Bill Introduced in House

September 15, 2014

House Appropriations Committee approves FY2015 State and Foreign Operations Appropriations Bill

June 24, 2014

Senate:

Senate Appropriations Committee releases FY15 Health & Human Services Appropriations Bill

July 24, 2014

Senate Appropriations Committee approves FY 2015 State and Foreign Operations Appropriations Bill

June 19, 2014

Request:

White House releases FY15 Budget Request

April 22, 2014

The U.S. Global Health Budget: Analysis of the Fiscal Year 2015 Budget Request

April 7, 2014

FY 2014

Omnibus:

FY14 Omnibus Appropriations Act Released

January 13, 2014

Senate:

Senate Appropriations Committee approves FY 2014 State and Foreign Operations Appropriations Bill

July 25, 2013

Senate Appropriations Committee approves FY14 Health & Human Services Appropriations Bill

July 11, 2013

House:

House Appropriations Committee approves FY 2014 State and Foreign Operations Appropriations Bill

July 24, 2013

Request:

U.S. Funding for Global Health: The President’s FY 2014 Budget Request

May 23, 2013

White House releases FY 2014 Budget Request

April 10, 2013

House Committee on Appropriations Approves FY 2026 Labor, Health and Human Services, Education, and Related Agencies (Labor HHS) Appropriations Bill & Accompanying Report

Published: Sep 11, 2025

The House Committee on Appropriations approved its FY 2026 Labor, Health and Human Services, Education, and Related Agencies (Labor HHS) appropriations bill, accompanying report, and amendments on September 9, 2025. While most U.S. global health funding is provided to the State Department through a separate appropriations bill, the Labor HHS appropriations bill includes funding for global health programs at the Centers for Disease Control and Prevention (CDC) as well as funding for global health research activities at the National Institutes of Health (NIH).

Global health funding amounts specified in the House FY 2026 Labor HHS appropriations bill are as follows (some amounts are not yet known):

  • Centers for Disease Control and Prevention (CDC): The bill eliminates funding for several programs at the CDC’s Center for Global Health including: 1) Global HIV/AIDS; 2) Global Tuberculosis; and 3) some global vaccination activities. [i] The bill maintains CDC’s funding at the prior year (FY 2025) level for global polio vaccination and Global Public Health Protection programs, and transfers funding for Parasitic Diseases and Malaria from the Center for Global Health to the National Center for Emerging and Zoonotic Infectious Diseases, but does not specify an amount.
  • National Institutes of Health (NIH): Funding for global health research activities at the Fogarty International Center (FIC) at NIH matches the prior year (FY 2025) amount. Funding for other global health research activities (i.e., global HIV/AIDS and malaria research) at NIH is not yet known because it is determined at the agency level rather than specified by Congress in annual appropriations bills.[ii]

See the table below for additional details on global health funding (downloadable table here). See other budget summaries and the KFF budget tracker for details on historical annual appropriations for global health programs.

KFF Analysis of Global Health Funding in the FY 2026 House Labor, Health and Human Services, Education, and Related Agencies (Labor HHS) Appropriations Bill

[i] Funding for FY25 was provided in a full-year Continuing Resolution (CR), which maintained FY24 levels. All FY25 amounts and associated notes are based on those specified in relevant FY24 appropriations bills.

[ii] The House FY26 Labor HHS appropriations bill states that “Of the amounts made available in this Act for NIH, the amount for research related to the human immunodeficiency virus, as jointly determined by the Director of NIH and the Director of the Office of AIDS Research, shall be made available to the ‘Office of AIDS Research’ account.”


Potential Story Lines from Trump-Era Health Care Cuts

Author: Larry Levitt
Published: Sep 11, 2025

In his latest column for the JAMA Health Forum, KFF’s Larry Levitt talks about how popular shows like “The Pitt” can make changes to the health care system stemming from this year’s federal tax and budget bill tangible for viewers, and offers five suggested story lines that would illustrate how health care is changing under the Trump administration.

VOLUME 30

Changing COVID-19 Booster Policies and Florida’s Decision to End Vaccine Mandates Create Confusion


Summary

This volume explores confusion around COVID-19 booster eligibility as federal recommendations shift and conflicting guidance from physician organizations creates uncertainty for patients. It also looks at Florida’s decision to end school vaccine mandates, with some social media users confusing it with a statewide vaccine ban. Lastly, it highlights research demonstrating that artificial intelligence chatbots can provide generally sound advice for cardiovascular health, but struggle to make specific and personalized recommendations.


Recent Developments

Online Discussion Reflects Confusion About COVID-19 Booster Eligibility

Thanasis / Getty Images

Conversation about COVID-19 vaccines and boosters on social media in late August and early September reflected confusion about eligibility following an FDA decision to only approve updated booster shots for people age 65 and older, or with underlying health conditions. The limited approval represents a shift from previous recommendations that included healthy children and young adults. The change follows a May announcement by the Centers for Disease Control and Prevention (CDC) that COVID-19 vaccines would no longer be recommended for healthy pregnant people and only after a shared clinical decision-making process for healthy children. Online reaction to the FDA decision combined praise for Secretary of Health and Human Services (HHS) Robert F. Kennedy Jr. with the spread of false vaccine safety claims. Kennedy’s post about the announcement on X received 77,000 likes and 15,000 reposts, including endorsements from influential accounts with follower counts ranging from over 100,000 to more than a million. Some reposts praised the decision and repeated claims that COVID-19 vaccines are unsafe for human use, while others shared anecdotal stories of health decline following mRNA vaccination. Others, though, expressed concern about their ability to receive the updated vaccines, which specifically target the currently circulating variants of the virus.

In contrast with official guidance from government agencies, leading physician organizations, including the American Academy of Pediatrics (AAP) and American College of Obstetricians and Gynecologists (ACOG), have issued broader guidelines for COVID-19 boosters, consistent with their past recommendations. These guidelines cite evidence that vaccines prevent severe illness and death in healthy children and pregnant people. Historically, these organizations’ guidelines have generally aligned with federal agencies, but recent conflicting vaccine recommendations may contribute to confusion and varying levels of trust. KFF’s July Tracking Poll on Health Information and Trust found that personal doctors or health care providers remain the most trusted source for information about vaccines, with 83% of adults saying they trust their doctor “a great deal” or “a fair amount” to provide reliable vaccine information. Only 57% say they have the same level of trust in the CDC.

The conflicting guidance and confusion about eligibility comes after the KFF poll found that most adults do not plan to receive the updated COVID-19 vaccine this fall. Most of the public (59%) said they would “probably not” or “definitely not” get the booster, while one-third (33%) of adults said they were concerned that the vaccine would not be available to them. Black and Hispanic adults, who have been disproportionately affected by COVID-19, were among the most concerned about access to this fall’s vaccine. HHS Secretary Kennedy indicated in a post on X that the boosters would remain available for all patients who wish to receive them after consulting with a doctor. Kennedy later reiterated that claim in testimony before a Senate panel, referring to the practice of off-label prescribing, which occurs when a doctor prescribes a drug for a use not approved by the FDA. Prescriptions have not been required for previous formulations of the booster vaccines, and some doctors and pharmacists have expressed hesitancy to prescribe the updated boosters for off-label use. Insurance coverage may also be affected; insurers are generally required to cover vaccines recommended by the ACIP and adopted by the CDC. The advisory committee is expected to issue its updated vaccination guidelines this month.

Some Social Media Users Conflate Florida’s Move to End School Vaccine Mandates with a Vaccine Ban

10’000 Hours / Getty Images

Confusion about vaccine eligibility also appeared in online reaction to a Florida proposal to end school mandates for routine childhood vaccination, with some posts misrepresenting the policy shift as a statewide ban on vaccines. Florida’s Surgeon General announced in early September that the state planned to end all vaccine mandates, including those required for school entry. KFF’s monitoring of social media indicated that there were more posts on X about vaccines on the day of the announcement than at any other point this year thus far. Some posts observed in KFF’s monitoring of social media mistook the Florida policy for a “ban” of vaccines, but government officials framed the decision as removing requirements while keeping vaccines available to families who choose them. Prior to this decision, all 50 states had required children starting school to be vaccinated against transmissible diseases, including measles, mumps, and rubella (MMR).

The proposed policy change comes as childhood vaccination rates are declining and falling below levels that epidemiologists say are needed to prevent disease outbreaks. An August KFF issue brief detailed that nationwide, the MMR vaccination rate has fallen below the federal target of 95% in every year since 2020. Some states, including Florida, had lower rates of coverage, with just 89% of kindergarteners in Florida vaccinated against MMR in the 2024-2025 school year. Despite the move to eliminate mandates,  findings from a KFF-Washington Post survey show that most Florida parents support public school vaccine mandates. 82% of Florida parents, and 81% of parents nationwide, said they believed public schools should require vaccines for measles and polio, with some religious or medical exemptions.

The Florida announcement comes as officials in some other states have indicated plans to make their own vaccine recommendations, expressing concerns about federal vaccine policy decisions by the Trump administration. Some vaccinologists have warned that diverging state and federal guidance could broadly undermine trust in vaccines and public health institutions and leave parents unsure about which guidance to follow.


AI & Emerging Technology

Chatbots Perform Well for Heart Health Advice, But Struggle with Details

KFF / Unsplash

A recent study published in Cureus evaluated how well four leading artificial intelligence (AI) chatbots perform in providing advice for cardiovascular health, finding that most AI models can generally offer sound guidance but fall short in delivering specific, actionable recommendations. Researchers tested ChatGPT, Claude AI, DeepSeek AI, and Google Gemini using 15 standardized questions drawn from diet and exercise guidelines published by organizations like the American Heart Association (AHA) and European Society of Cardiology (ESC). Medical professionals then rated the appropriateness of the chatbots’ responses, finding that all responses to questions about physical activity met established standards. Of the questions about diet, 90% of responses from ChatGPT, Claude, and DeepSeek met established standards, while Gemini performed slightly worse at 80%.

The study revealed limitations despite the generally positive results. While the chatbots’ recommendations were not dangerous, they sometimes went beyond official guidelines in ways that could be helpful for healthcare providers to understand. For example, the models sometimes suggested activities like yoga, tai chi, and water aerobics that were not included in cardiovascular disease association guidelines but may appeal to patients seeking more holistic or natural approaches to heart health. In response to questions about diet, the models struggled with dietary specifics, failing to provide precise quantitative guidelines on carbohydrate and added sugar intake. Gemini, for example, recommended consuming less added sugar, but did not include the specific recommendation from both the AHA and ESC that added sugars should account for less than 10% of total caloric intake.

The research suggests that as patients increasingly turn to AI for health information, healthcare providers may benefit from being aware of the types of advice patients are receiving from these sources. Increased awareness could help clinicians provide more comprehensive medical guidance that acknowledges patients’ interest in alternative approaches while ensuring they receive evidence-based care. While these AI tools can effectively supplement guidance from medical professionals, they can not replace personalized, quantitative recommendations that may be offered by physicians or other licensed providers like nutritionists or dieticians. Users should verify AI-generated health advice with their healthcare providers before making significant lifestyle changes.

About The Health Information and Trust Initiative: the Health Information and Trust Initiative is a KFF program aimed at tracking health misinformation in the U.S., analyzing its impact on the American people, and mobilizing media to address the problem. Our goal is to be of service to everyone working on health misinformation, strengthen efforts to counter misinformation, and build trust. 


View all KFF Monitors

The Monitor is a report from KFF’s Health Information and Trust initiative that focuses on recent developments in health information. It’s free and published twice a month.

Sign up to receive KFF Monitor
email updates


Support for the Health Information and Trust initiative is provided by the Robert Wood Johnson Foundation (RWJF). The views expressed do not necessarily reflect the views of RWJF and KFF maintains full editorial control over all of its policy analysis, polling, and journalism activities. The data shared in the Monitor is sourced through media monitoring research conducted by KFF.

About Half of Adults with ACA Marketplace Coverage are Small Business Owners, Employees, or Self-Employed

Published: Sep 10, 2025

The enhanced premium tax credits, created under the American Rescue Plan Act (ARPA) and later extended through the Inflation Reduction Act (IRA), have reduced premiums for millions of Marketplace enrollees. They have also contributed substantially to Marketplace enrollment more than doubling to 24.3 million people in 2025.

Currently, over nine in 10 enrollees (92%) receive some amount of premium tax credit. If these enhanced tax credits expire at the end of 2025, out-of-pocket premiums would rise by over 75% on average for the vast majority of individuals and families buying coverage through the Affordable Care Act (ACA) Marketplaces. Additionally, insurers are proposing an increase in gross premiums (before premium tax credits are applied) of 18%, partly due to the impact on the risk pool of the expiration of enhanced premium tax credits. This double-digit increase would affect government costs for tax credits, as well as Marketplace enrollees not receiving premium assistance.

Much of the discussion about the ACA Marketplaces centers on individuals and families buying coverage on their own. However, many enrollees are connected to small businesses or are self-employed. A previous KFF analysis found that 38% of adult individual market enrollees under age 65 making over 400% of the federal poverty line (FPL) are self-employed, compared to 7% of adults (ages 19-64 years) with incomes over four times poverty nationally. If the enhanced premium tax credits expire, individuals and families with household incomes over 400% FPL would no longer be eligible for any premium tax credits, leaving them with the full cost of their health insurance premium.

Using data from the Current Population Survey (CPS) Annual Social and Economic Supplement, we estimate that 48% of adults under age 65 enrolled in individual market (direct purchase) coverage are either employed by a small business with fewer than 25 workers, self-employed entrepreneurs, or small business owners. In other words, about half of adult enrollees in the individual health insurance market – the vast majority of which is purchased through the ACA Marketplaces – is affiliated with a small business. For context, 16% of all adults under age 65 nationwide are employed by a small business or are self-employed.

Nearly Half of Individual Market Enrollees Work for a Small Business or Are Self-Employed

For many employees of small businesses and self-employed individuals, the individual market functions as their main source of comprehensive health insurance outside of traditional employer coverage. Unlike larger firms, small businesses are less likely to offer health benefits to their employees, leaving workers and entrepreneurs dependent on the affordability and stability of the individual market.

The enhanced premium tax credits have lowered premium costs for enrollees across the Marketplaces. If those subsidies expire as scheduled at the end of 2025, individual market enrollees—including many people tied to small businesses—would face higher out-of-pocket premiums.

Methods

The data above is based on KFF analysis of 2024 CPS Annual Social and Economic Supplement. The analysis includes adults under age 65 who directly purchase their health insurance and are not currently students. People were considered to be self-employed or employed by a small business if they self-reported being self-employed or working at a business with between one and 24 employees. Employer size is measured for the primary job in the previous year, and may be different at the time of the survey.

Health Costs Associated with Pregnancy, Childbirth, and Infant Care

Published: Sep 9, 2025

Pregnancy is one of the most common causes of hospitalization among non-elderly people. In addition to the cost of the birth itself, pregnancy also involves costs associated with prenatal visits as well as treatment for psychological and medical conditions that can arise during pregnancy, birth, and the postpartum period.

This analysis examines the health costs associated with pregnancy, childbirth, post-partum care, and infancy using a subset of claims from the Merative MarketScan Encounter Database from 2021 through 2023 for enrollees with employer-sponsored health insurance plans and their young (two years old or less) children. It finds that health costs associated with pregnancy, childbirth, and post-partum care average a total of $20,416, including $2,743 in out-of-pocket expenses, for women enrolled in employer plans. In addition to the cost of pregnancy and birth, newborns, defined as children with fewer than three months of enrollment, had average total health care spending of $5,820, including $475 in out-of-pocket costs.

The analysis can be found on the Peterson-KFF Health System Tracker, an information hub dedicated to monitoring and assessing the performance of the U.S. health system.

Five Key Facts About People Experiencing Homelessness

Published: Sep 9, 2025

Editorial Note: This brief was updated on September 9, 2025 with additional information about people with HIV.

President Trump recently signed an executive order on homelessness, mental health, and substance use that leverages federal funding priorities and other administrative tools to encourage states to ban public drug use, remove unhoused people from public spaces, and broaden civil commitment laws to permit involuntary psychiatric civil commitments in more circumstances. The Trump administration also invoked the Home Rule Act to place D.C.’s police force under federal control and deployed the National Guard to clear homeless encampments in the city and address crime. These actions follow nationwide passage of court-backed state laws making it easier for law enforcement to ticket, fine, or arrest people sleeping on public property.

According to the U.S. Department of Housing and Urban Development (HUD), more than 770,000 people were experiencing homelessness on a single night in January 2024, the highest ever recorded. The links between homelessness and health are complex, and past KFF research found that people with prior experiences of homelessness have disproportionate physical and mental health needs and face greater socioeconomic challenges compared to those who have never experienced homelessness. People experiencing homelessness who are unsheltered also experience higher rates of chronic homelessness, chronic disease, mental illness, and substance abuse than those who are sheltered.

This data note reviews trends in homelessness and characteristics of people who are homeless using data from HUD’s Point-in-Time (PIT) count of sheltered and unsheltered people experiencing homelessness. The PIT count is generally conducted on a single night during the last ten days of January. These estimates may undercount the total number of people experiencing homelessness, particularly among the unsheltered.

1. From 2018-2024, the number of people experiencing homelessness on a single night increased nearly 40% to over 771,000 people, with nearly four in ten (36%) staying in unsheltered locations.

The HUD PIT survey counts people experiencing homelessness in both sheltered and unsheltered settings on a single night. People are counted as unsheltered if they sleep in locations not ordinarily used as a regular sleeping accommodation, such as cars, parks, abandoned buildings, or campgrounds. The remainder of people experiencing homelessness were in sheltered locations, with nearly six in ten (56%) staying in emergency shelters and nearly one in ten (9%) in transitional housing, which is temporary housing with supportive services (Figure 1). Between 2018 and 2024, the number of people experiencing homelessness rose by nearly 40%. This increase was primarily driven by the growth in the number of people staying in emergency shelters and experiencing unsheltered homelessness, while the number of people in transitional housing declined over the same period. Nearly half of the overall increase occurred between 2023 and 2024, during which the total number of people experiencing homelessness increased by 18%. According to HUD, rising housing costs and the end of the COVID-19 public health emergency in May 2023, which ended the eviction moratorium and other income and safety net programs, drove these recent increases.

Beyond shifts in sheltered and unsheltered homelessness, the number of people experiencing “chronic homelessness”—defined by HUD as long-term or repeated homelessness among people with a disability—increased 73% between 2018 and 2024 (from about 97,000 to 168,000). However, the number of adults experiencing homelessness who were veterans fell 13% from 2018 to 2024, making up 5% of the share of all adults experiencing homelessness in 2024, similar to their share of the general adult population (6%). An increase in housing assistance programs from the Department of Veterans Affairs (VA) in recent years likely drove this decrease.

From 2018-2024, The Number of People Experiencing Homelessness Increased Nearly 40%, With Nearly 40% Unsheltered in 2024

2. In 2024, over eight in ten (81%) people experiencing homelessness were adults, but the number of children experiencing homelessness grew at double the rate of adults.

On a single night in January 2024, there were over 623,000 adults and 148,000 children experiencing homelessness, with adults consistently representing about eight in ten of all people experiencing homelessness since 2018 (Figure 2). However, from 2023 to 2024, the number of children experiencing homelessness grew by 33% (from about 112,000 to 148,000), double the percentage increase among adults, which increased by 15% (from about 541,000 to 623,000). Most households with children experiencing homelessness are sheltered, as children made up less than one in ten unsheltered people in 2024. Housing insecurity during childhood is associated with negative health outcomes later in life, including anxiety and depression. Older adults also represented a growing share of the number of people experiencing homelessness, with the share of people experiencing homelessness ages 55 and older increasing by 6% from 2023 to 2024. Research found that this aging population of older adults has comprised a disproportionate share of single adults experiencing homelessness, which may drive future increases in the share of older adults experiencing homelessness.

While Eight in Ten People Experiencing Homelessness Are Adults, the Number of Children Experiencing Homelessness Grew More Rapidly from 2023-2024

3. In 2024, Southern and Western states had higher shares of people who were experiencing homelessness who were unsheltered compared to other parts of the country.

States in the Northeast and West had higher rates of people experiencing homelessness per 10,000 people than elsewhere in the country on a single night in January 2024 (Figure 3). The share of people experiencing homelessness who were unsheltered by state were highest in Southern and Western states, including in California (66%), Oregon (62%), Alabama (59%), and Florida (54%). In contrast, the shares of people who were experiencing homelessness who were unsheltered were lowest in New York (4%) and Vermont (5%), despite these states having relatively high rates of people experiencing homelessness per 10,000 people. These patterns may reflect a combination of local factors, including climate, housing costs, shelter capacity, right to shelter laws, and law enforcement that bring more people into emergency shelters.

In 2024, Shares of People Experiencing Homelessness Who Were Unsheltered Were Highest in Southern and Western States

4. In 2024, about seven in ten (68%) people experiencing homelessness were people of color.

White (32%), Hispanic (31%), and Black (30%) people each accounted for about three in ten of people experiencing homelessness on a single night in January 2024, with other racial and ethnic groups making up smaller shares (less than 5%) (Figure 4). Black, Hispanic, AIAN, and NHPI people made up a disproportionate share of the people experiencing homelessness compared to their share of the total population.

In 2024, About Seven in Ten People Experiencing Homelessness Were People of Color

5. In 2024, adults experiencing homelessness were more likely to have serious mental illness (SMI), substance use disorder (SUD), and HIV/AIDS than the general population.

In 2024, over two in ten (22%, or 140,000) adults experiencing homelessness on a single night in January met HUD’s SMI definition, compared to about 5-6% of adults overall according to the National Survey of Drug Use and Health (NSDUH) (Figure 5). A similar share (18%, or 113,000) of adults were identified as having a chronic substance use disorder (SUD) according to HUD’s definition in the point-in-time count, compared to about 3% of adults in the general population who met NSDUH criteria for severe SUD. These shares are also higher among adults experiencing unsheltered homelessness, with the share of those with chronic SUD increasing in recent years. SMI and SUD often co-occur—about one-quarter of people with SMI also has an SUD—but HUD’s publicly available data do not report the overlap of these conditions. About 2% (11,000) of adults experiencing homelessness had HIV/AIDS, compared to less than 1% of the general population living with HIV. In addition, 15% of people with HIV experienced housing instability in the past 12 months.

In 2024, 22% of Adults Experiencing Homelessness Had a Serious Mental Illness, 18% Had a Substance Use Disorder, and 2% Had HIV/AIDS

How Do Health Care Prices and Utilization in the United States Compare to Peer Nations?

Authors: Delaney Tevis, Matt McGough, Juliette Cubanski, Matthew Rae, and Cynthia Cox
Published: Sep 4, 2025

This updated chart collection compares indicators of health care utilization and prices in the United States and 11 similarly wealthy countries to investigate whether higher prices or higher utilization of healthcare services drives the high health care expenditures in the U.S. relative to peer nations.

The U.S. spends nearly twice as much on health care per person as peer nations ($13,432 vs. $7,393 per person), meanwhile health care utilization in the U.S. — from doctor visits to surgeries — is generally lower than in other wealthy countries. The evidence continues to support the finding that higher prices – as opposed to higher utilization – explain the United States’ high health spending relative to other high-income countries.

The analysis is part of the Peterson-KFF Health System Tracker, an online information hub dedicated to monitoring and assessing the performance of the U.S. health system.

5 Key Facts about Medicaid’s Share of National Health Spending

Published: Sep 3, 2025

Medicaid, as the primary program providing comprehensive coverage of health care and long-term services and supports to about 80 million low-income people in the United States, accounts for one-fifth of all personal health care spending in the United States and a large share of state budgets. During its 60 years since enactment, Medicaid’s share of health insurance coverage and health care spending have incrementally increased; the program has evolved over time through a series of legislative and judicial actions, within the context of broader changes in the health care landscape. Now, landmark changes to Medicaid coverage and enrollment policies are set to roll out over the next several years.

According to the Congressional Budget Office (CBO), the recently enacted reconciliation package is estimated to reduce federal Medicaid spending by $911 billion over 10 years (after accounting for interactions that produce overlapping reductions across different provisions of the law), and to increase the number of uninsured people by 10 million in 2034. The most recent projections for national health spending do not account for the changes in the law; but changes in the law are expected to have big implications for Medicaid coverage and spending that could reverse longstanding incremental trends. Policy changes in the reconciliation package that lead to more uninsured people are likely to increase out-of-pocket spending as a share of national health care spending. Shifts in spending patterns are likely to be more profound over time and beyond the ten year projection period if there are no other changes in federal laws that affect health spending.

To provide historical context for how changes to Medicaid spending may impact national health spending trends, this brief explores how Medicaid spending contributes to national health spending and how different service areas contribute to Medicaid costs. This brief uses National Health Expenditures (NHE) historic data, published annually by the Centers for Medicare & Medicaid Services, which provide estimates of national spending on health care, by payer and by type of service. The analyses in this brief focus on spending for personal health care, which excludes the costs of public health programs and payers’ administrative spending (see Methods).

1. Over time, Medicaid has covered an increasing share of the population and health care costs.

Over the past two decades, the percent of the population enrolled in Medicaid increased by more than 10 percentage points (from 12% in 2000 to 25% in 2023 by NHE enrollment estimates). During the same time, Medicaid’s share of national health spending increased by only 3 percentage points, from 16% to 19%. Medicaid spending is driven by multiple factors, including the number and mix of enrollees, their use of health care and long-term services and supports, the prices of Medicaid services, and state policy choices about benefits, provider payment rates, and other program factors. Some of the faster growth in Medicaid enrollment relative to spending is that enrollment growth over the past two decades was driven by increased enrollment stemming from the Great Recession, implementation of the Affordable Care Act (ACA) Medicaid expansion, and the COVID-19 pandemic. Each of those events spurred increased enrollment of working-age adults and their families, groups that tend to have lower per-enrollee Medicaid costs than older adults and people who come into Medicaid because they need long-term care. CBO estimates predict that changes to Medicaid enacted in the reconciliation package will result in a downward shift in future Medicaid spending and in enrollment. KFF analyses show how these recent changes to Medicaid policy are likely to reduce federal Medicaid spending and impact enrollment, with varying impacts to different states or areas.

Medicaid Covers an Increasing Share of the Population and Health Care Costs

2. Medicaid’s share of spending has grown, but remains lower than that of private insurance and Medicare.

Prior KFF analysis has shown that generally, third party payers cover a greater share of total health spending than in previous decades because more people have gained coverage, especially public coverage, and payers’ spending per enrollee has grown. The total share of national health care spending for each type of coverage reflects the number and mix of enrollees and the amount spent to cover each enrollee. The share of health care spending paid by people out-of-pocket decreased as more spending was paid by Medicare and private insurance. Out-of-pocket spending includes payments for care from people who are not insured, and payments for care from people with health coverage when coverage requires enrollees to pay some of the costs. Common types of out-of-pocket spending among people with coverage include copayments (a flat fee per service), coinsurance (a percentage of the total costs), and deductibles (an amount enrollees pay before coverage kicks in). Historically, one difference between Medicaid and other forms of health coverage was the low out-of-pocket spending. Estimated increases in the uninsured following implementation of the reconciliation package could reverse incremental declines in out-of-pocket costs.

Medicaid’s Share of Spending Has Grown, but Remains Lower Than That of Other Insurance Types

3. Over 70% of Medicaid spending pays for hospital services and long-term care.

Over the last 23 years, the largest share of Medicaid spending paid for hospital services, which accounted for 38% of Medicaid spending on average and varied between 37% and 39% during the 2000-2023 period. Medicaid mirrors broader hospital spending trends; spending on hospitals makes up the largest share of all health care spending, a trend projected to continue. During the same period, long-term care accounted for an average of 37% of Medicaid spending, although it declined somewhat from a high of 40% in 2007 to 36% in 2023. The category with the greatest relative growth was payments to providers such as physicians which increased from 11% in 2000 to 17% in 2023. The percent of spending that paid for prescription drugs decreased from 11% in 2000 to 7% in 2023, which is likely attributable to the enactment of the Medicare prescription drug benefit which took effect in 2006. Prior to that point, Medicaid paid for prescription drugs for low-income Medicare beneficiaries who were also enrolled in Medicaid (e.g., dual-eligible individuals).

Over 70% of Medicaid Spending Pays for Hospital Services and Long-Term Care

4. Medicaid pays for nearly 20% of hospital spending.

Medicaid pays for nearly 20% of hospital spending, a share that has changed little since 2000. During that time, Medicare’s share of national spending on hospital care decreased from 30% in 2000 to 25% in 2023, while the share paid by private health insurance rose from 33% to 37%. People pay a much smaller percentage of hospital spending out-of-pocket compared with other types of health care. Medicaid covered 41% of all U.S. births in 2023; births are the most common reason for a hospital inpatient stay. Medicaid financing for hospitals is complex, but Medicaid studies have shown that Affordable Care Act (ACA) Medicaid expansion is associated with improved hospital financial performance and lower likelihood of hospital closure, particularly in rural areas.

Medicaid Pays for Nearly 20% of Hospital Spending

5. Medicaid is the primary payer of long-term care, most of which is now provided in people’s homes and the community.

Medicaid continues to be the primary payer of long-term care, comprising an increasing share of all spending on long-term care. Medicaid’s share of spending on long-term care rose nine percentage points, growing from 52% in 2000 to 61% in 2023. Since 2000, Medicaid’s spending on care delivered in people’s homes and communities (e.g., home care) increased faster than spending on institutional care such as nursing facilities. In 2000, the 52% of long-care spending that was paid by Medicaid included 29% on home care and 23% on institutional care. In 2023, the 61% that was paid by Medicaid included 47% on home care and only 14% on institutional care. Prior KFF analysis has shown that in 2021, three-quarters of the 5.7 million people who used Medicaid long-term care were receiving home care, although that percentage varies across the states widely. The larger share of people receiving care in the community as opposed to in an institution reflects initiatives to make home care more widely available in recent years and to remove what has been referred to as the “institutional bias” in Medicaid. 

Medicaid is the Primary Payer of Long-Term Care, Most of Which Is Now Provided in People’s Homes and the Community

Methods

This analysis uses National Health Expenditures (NHE) historic data. Unlike other sources of information on health care spending, the NHE data use an accounting structure that captures all expenditures of health care goods and services and investment in the health care sector. Expenditures are classified into high-level service categories and by source of payment. Data sources include federal administrative data, household and individual surveys, surveys of businesses, and economic data from the Bureau of Labor Statistics and the Bureau of Economic Analysis. Medicaid spending estimates are derived from financial reporting through Form CMS-64, except for durable medical equipment estimates which are developed from person-level payment data.

See the NHE Accounts Methodology documentation for additional information including definitions, sources, and methods; CMS publishes both complete documentation and short definitions.

Enrollment: This KFF analysis uses NHE Accounts enrollment data to estimate Medicaid’s share of total health insurance enrollment (Figure 1). NHE Accounts data estimates Medicaid enrollment using the Medicaid Statistical Information System (MSIS) for years 2000-2013, and enrollment projections reported on form CMS-64 for years 2014-2023. The NHE Accounts data estimates for total health insurance enrollment include private health insurance, Medicare, Medicaid, CHIP, and the Departments of Defense and of Veterans Affairs.

Personal Health Care Services: Personal health care services in the NHE Accounts data represent aggregate revenue received by health care providers and retail providers of medical goods and services. Cost estimates for personal health care services expenditures exclude administrative costs, government public health activities, or investments in structures or equipment. KFF analyzes NHE personal health care data using service categories (i.e. “hospitals,” “providers,” or “prescription drugs,”) that align with the classification system used within the NHEA, except for Long-Term Care.

Spending by Payer: NHE Accounts data estimate spending attributable to certain payer categories. KFF uses the payer categories defined by the NHE Accounts data and defines “Other” spending (Figures 2 and 4) below. For personal health care services:

  • Medicaid spending estimates include both state and federal spending on both fee-for-service and managed care enrollees but exclude Children’s Health Insurance Programs (CHIP) spending.
  • Medicare spending estimates include Medicare Parts A, B, and C (Medicare Advantage). Medicare spending estimates also include Medicare Part D and Medicare Advantage Part D. Private supplemental Medicare insurance, i.e. Medigap and employer-sponsored Medicare Part D, is excluded from Medicare spending and included in private insurance spending.
  • Private Insurance spending estimates include premiums and benefits from traditional fully-insured health coverage whether purchased individually or through an employer, self-insured employer health benefit plans, plans purchased through the Affordable Care Act marketplaces, and indemnity plans such as those covering hospital care or long-term care. Private insurance spending estimates also include supplemental Medicare plans (e.g., Medigap).
  • Out-of-Pocket spending estimates include direct consumer spending including coinsurance, deductibles, and any other amounts not covered by insurance. Premiums are included in private insurance spending and excluded from out-of-pocket spending.
  • Other: KFF defines “Other” spendingas personal health care expenditures by the Children’s Health Insurance Program, the Indian Health Services, the Substance Abuse and Mental Health Services Administration, the Veterans Health Administration, federal spending through the Pre-Existing Conditions Insurance Plans (PCIP) or COVID-19 relief funds (e.g. the Provider Relief Fund), direct payments to the needy through general assistance programs (e.g. the State Pharmaceutical Assistance Program), certain state and local programs (e.g. temporary disability insurance or provider subsidies), and property or casualty insurance.

Spending by Service Category: KFF uses the NHE Accounts definitions for hospital care, provider care, and prescription drugs. KFF definitions for “Other” services (Figure 3) and “Long-Term Care (Figures 3 and 5) are included below.

  • Hospital Care includes all services provided by hospitals to patients. These expenditures include the services of resident physicians, inpatient pharmacy, room and board and ancillary costs, hospital-based home health care, and other services billed by hospitals. Services rendered in a hospital by a physician who bills independently are considered Provider Care.
  • Provider Care includes services provided in non-hospital clinics and practices. These include physician-operated practices, outpatient care centers, and certain federally operated clinics and clinics operated by non-physician clinicians (such as private-duty nurses, podiatrists, optometrists, chiropractors, or occupational therapists). Provider care also includes certain medical laboratory services.
  • Prescription Drugs covers “retail” sales of products available only by a prescription, such as drugs, biologics, and diagnostic products.
  • Other: KFF defines Medicaid spending on “Other” services to include personal health care expenditures not attributable to hospitals, providers, prescription drugs, nor long-term care. This includes dental care, durable medical equipment, non-durable medical equipment (e.g. diagnostic tools or wound dressings and other medical supplies), and non-prescription drugs.
  • Long-Term Care: KFF defines long-term care to include spending for nursing care and continuing care retirement communities; home health; and other health, residential, and personal care if it is paid for by Medicaid, individuals who are paying out-of-pocket, the Children’s Health Insurance Program, the Indian Health Services, the Substance Abuse and Mental Health Services Administration, the Veterans Health Administration, general assistance, other federal programs, other state and local programs, school health. See 10 Things about LTSS for more information.